Evaluation and application of dye tracing in a karst terrain
95
Scholars' Mine Scholars' Mine Masters Theses Student Theses and Dissertations 1968 Evaluation and application of dye tracing in a karst terrain Evaluation and application of dye tracing in a karst terrain James William Scanlan Follow this and additional works at: https://scholarsmine.mst.edu/masters_theses Part of the Civil Engineering Commons Department: Department: Recommended Citation Recommended Citation Scanlan, James William, "Evaluation and application of dye tracing in a karst terrain" (1968). Masters Theses. 7025. https://scholarsmine.mst.edu/masters_theses/7025 This thesis is brought to you by Scholars' Mine, a service of the Missouri S&T Library and Learning Resources. This work is protected by U. S. Copyright Law. Unauthorized use including reproduction for redistribution requires the permission of the copyright holder. For more information, please contact [email protected].
-
Upload
khangminh22 -
Category
Documents
-
view
4 -
download
0
Transcript of Evaluation and application of dye tracing in a karst terrain

Scholars' Mine Scholars' Mine
Masters Theses Student Theses and Dissertations
1968
Evaluation and application of dye tracing in a karst terrain Evaluation and application of dye tracing in a karst terrain
James William Scanlan
Follow this and additional works at: https://scholarsmine.mst.edu/masters_theses
Part of the Civil Engineering Commons
Department: Department:
Recommended Citation Recommended Citation Scanlan, James William, "Evaluation and application of dye tracing in a karst terrain" (1968). Masters Theses. 7025. https://scholarsmine.mst.edu/masters_theses/7025
This thesis is brought to you by Scholars' Mine, a service of the Missouri S&T Library and Learning Resources. This work is protected by U. S. Copyright Law. Unauthorized use including reproduction for redistribution requires the permission of the copyright holder. For more information, please contact [email protected].

EVALUATION AND Al?l'J-'ICATION Of DYE TRACING
IN A K .. AR.ST TERRAIN
BY
J AI--U::S WILLii\.1-i SCANIA~
A
TilliS IS
suhmitced to the faculty of
Tl-I.E lJUI\TERSITY Of MISSOl...IRI ·• ROLLA
in partial fulfi..llment of the 1.·equir-ements £or the
Degree of
K'\STER OF SCIENCE I:N CI VIL ENGINS"SRI"t\G
1968
Appro,.~ed by

li
ABSTRACT
The purpose of this investig:Jtion ,.,as to select and evaluat~ in che
laboratory a t:cacing method appropriate for use in karst:ic areas, and to
perform field tracing studies in the south central Hissouri area bounded
by tht; cities of Rolla, St. Jar::es, and Salem in an attempt to e:stab lish
existi-r1g di!'ect flow connections bet• .. ~.:en surface and subscrf.1.ce -waters.
Eluore·:::cein (::>ociium salt) , Rhodamine HT, a.nd Rhodai'1ir~e B v.'E:re evalu-
ated as tracers in tl1e laboratory and the first !:l!.'O dyes \Jere .:::;nployzd in
the fiel2. After cnreful evaluat:tcn of a number of ad~:::>rbent:s, extractL1g
solv,"nts, ai.ld detection techniques, a m2thod consisting of concentration
of th2 d~v-e on po.ckets of nctivated carbon, extracticn ·;,;ith a 5 per cent
alkRli-ethanol solvent, aLd date~tion by means of a fluoro~e~er was se-
lee t2.d Co:r nse in field tracir.g studies. /.::l:r.oni'-.1!11 and pvt:3ss:~'i..cm hyclroxid~
w•::r.e ::,ost np~;ropriate fe-r· the .:::xtraction of Rhod,::;,m1ne HT and £lunt:·2:;c.~::i.n,
ros'?rc tively. Fl•:.orc:Dcent bacl:g:::onnd rNlLcrial present in the st:r2a;ns and
S)CJ~gs of the south central Missouri study ar2a did not intcr~e~2 with
A dir..c:ct o·r pa.rt:i.:::~lly direct 3ubsul.-f:!ce CCi.lnect.:.ion 6 to 10 r.iles long
tions 14 end 23, T.3GK., R.7W., of Phelps County and the section of the
flo\; in thL• ci1<1nnc.l w.'J.s c:.:tirnatt:d to be i.n the range of 1. 2 to 4. 1 feet
pu~ mii~ute at a t:lcpe cf 6. 7 tL> 12.0 fact 1~er :nile.

iii
ACKi~OHLEDGEl1ENT
Being very much a·ware of the value of the education received at the
University of !'1issouri - Rolla, the f'Uthor expresses sinr:ere gratitude to
the people Hho :.1ake this such a fine educational institution.
The cm1•.pletion of this thesis depended upon the assistance and
coopera ticn of marry pe:;:sons. One in par ticul<lr to '\vhom the autlwr v;ishes
to express ~is deep ~ndebtedness is his a~visor, Dr. S. G. Grigoropoulos,
vJho gave "':any hours of his ti;:r,e in preparation of this thE:sis. The author
also -vJishes to expre.ss his appreciation to all his professors and fellow
students "dho in any Hay .:-.ssisted him in the course of this study.
A Sf•::!cial appreciation is afforded to the U!litc-!d States Geological
~urvey, l-iau!r Resources Division, Rolla, Hissouri, for the use of their
fluorometer, Hr. ~i. F. Claphar1 of DuPont for info-rr;:ation rends-red on
djes, and the residents of ~he study area for helpful information End
permission to usa their p~0p~rty fo~ tests.
This invcst:i_gation V.7 GS supported in part by Project No. A-··001-No
~ itled "Avail[{bil:tty, D:l~tribul:ion, Qu.:>.;.1tit~r a.nd Quality of l:ate.r Rcsouj·ces
in a Carbor:.ate I~ars t Tc"rra .. i.r~" c,f the 1Jni•;c-rsity of Uissour i ~·,fc:.ter Resources
Rcsca:.:ch C~c!ni.:er AlL1tr:..:.t1t Prog-ca.m sponsored by the Office c,f Hater Re-
s~Hlrce:.; Res•~'1xch, Dep:1r tm<2nt of the Interior.

TABLe: OF CONTENTS
LIST OF FIGURES •
LIST OF TABLES
I. INTRODUCTION
II. REVIt;\-J OF LITERATURE
A. b. c. D. E.
Desirable ';re..cer P1:ope:rties . • Tracing Methods . . • • • . Application uf TrHcing Methods Evaluation of Tracing MHterials The Meramec Spring Karstic Area . ,
Ill. IABOR.ATOR: STUDIES
A. Evaluatio~ of Detection Methods B. Evc.h:stion c.f Vn!~io•Js Adsorbents C. Evaluation of Various Extractin3 Solvents D. Evaluation of Dye Adso~ption on Natural Materials
-Ln the Field Area •
Iil. FIELD S'I'UDIES •
A. :::<ielfl S t:udy Area B. Field Tracin3 Method C. P~~lini~a~y Field Studies D. ·;.·i.dd Studies ...
1. Stc:J:c:3 in T·::st Site 3 2. Studies in Test Site 4
V. DISCUSSION
VI. CONCL~SIONS .
B IBLIGGR.:\P~~-Y
'.?ITA
Page
v
vi
1
4
4 4 7
12 17
22
2'3 31 33
35
41
1.;1
41.. 47 55 55 63
71
82
34
85
88
iv

LIST OF FIGURES
Figu·res
1. GENERALIZED HATER LEVEL 1-IAP OF MERHt.C SPRING AREA--1'1ERd .. 4C Sf RING QUADR.Al'~GLE, AFTER HAX\.JEI.L, ET ~J:.. (24) .
2. SPECTROPHOTOMETRIC DET2:CTION OF DYE
3. TEST APPARATUS USED IN EVALUATING VARIOUS ADSORBENTS •
4. EQUIPlv[£i~T EHPLOYED IN COLlllYlN STUDIES • • • • • • • • •
5. FIELD STUDY AREA AND LOCA'l'io:t-i OF SPECIFIC TRACING SITES
6. 'l"'RACING TEST SI1ES IN UPPER DRY FORK CRZEK BASIN •
7. LOCATION OF CBECK POINTS IN TEST SITE 3
8. '.i:E ST SIT£ 3
9. CHECK POINTS IN THE FIELD AREA •
10. HOLE IN GROUND IN TEST SITE 3
11. LOt:::!-.'I'ION OF CHECK POINTS IN TEST SITE t._
12. TEST SITE t+ . . . . . . " . . . . . . . .
v
Page
19
28
32
37
42
43
49
51
57
GS

LIST OF TABLES
T.3bles
1. CHARACTERISTICS OF COMHDN FLUORESCENT DYES USED FOR TRACING • • • • . . . . . . . . . . . . . . . . . .
2. C!-IftBACTERIST·ICS OF TRA.CilTG M.:\TERIALS M"TI }1ET1IODS
3. VISUPJ~ DETECTION OF DYE •
4. lt'LUOR011ETR!C DETECTION OI<' FLUORESCEIN •
5. EVALUATION OF VARIOUS ADSORBENTS
6. EVP.LUATION OF VARIOUS EXTRACTING SOLVENTS •
7. EVALUATION OF DYE ADSORPTION ON NATURAL HATERILLS IN THE HIELD AREA • • • • • • • • • • • •
8. BACKGROUND FLUORESCENCE IN THE HATER OF THE CRI!:EKS OF Tim STUDY. AREA
9. BACKGROUND FLUORESCENCE IN SOU'l'H CENTRAL HISSOLRI SURFACE tvATERS
10. FJELD TRACING STUDIES IN TEST SITE 3, Fi.lJOP.ESCEIN IN'IRODUCED lN \~ATER DRAINING INTO A H~J!..E AT THE SOUTHEAST E:::m OF THE BR~·JN SPKING PONDED AREA
11. FJEL!J TRl\GI11G S'l'UDIES IN TBST SITE 3, 'BTUOR.ESSEIN Il~TRODllCED
vi
Page
11
14
25
30
34
36
53
54
58
IK'fO HOL'TH 0::.<' BROHN SPRING • • • • • • • • • • • • • • • • • 60
12. FIELD '1]L\CTiJG STUDIES IN TEST SI'i'E 3, INTRODlJCED INTO i.•~OUTH OF .3ROHN SPRING
REOD,\HINE WT
13. FIEI.D TRACING STUDIES IN TEST SITE 4, }'}_.G()RhSC!HN ADDED TO POND!<:D UA'l'ER UrmER I-LUFFS AND TO TEE SINKING \lATER OF
'') o ....
BELL SPRING • • • • • • • • • • • • • • • • • • • 6 7
lt.-. FIEJ.,D TRACING STUDIES IN TEST SITE 4, f.Ll'ORE::>CEll.~ ADDED TO DRY T.'ORK C~E!.(. 1000 FEE'.L' UPSTREA.."1 FROM ROCK SJ_UFFS • 69
15. R.t.\TE OF FV:M CF sm1E SURFACE AND S1JB~1JRFAC.t<: HATERS IN THE S T'UiJY ."ili.2A • • • • • • • • • • • • • • • • • • • • • • • 7 6

1
I. INTRODUC'fiON
'!.'he pa~3t ten year period has beE.:n one in which ever incr..::asing
inportance h&s been placed on the country's future \!uter den:and. The
growing population ~nd expanding industrialization continually require
more water. According to Secretary of the Interior Udall (1), predic
tions made with regard to the nation's water nee~s at the turn of the
century i:1dicate that approximately three tii::~s as much \-later -;.Jill be
requir<?d then as is nseded novJ. l~ew sources of Hater :.lust be developcod
to l'ler.!t this demand.
Ground water constitutes oue of the major sources of fresh water
in. the United Stat~s. It has been estimar.::od (2) that 95 per cc~nt: of the
f:cc::h \·J2t.er is undergro1.r~1d, -.vhile only 5 per cent lS acc,J~•nteJ for by
s•1rface ··:..rater in rivers, streams, ponds, and lal-: ~s. f,~,,,,:-veL", only ccbout
on<~·· sixth of the tot.1l h·ater ·us~Cl for aU. 1)urposcs ~-'1 t~1e country is
g:::ound ~va::er. Nissou.~i uses abcut 10 per C<:C.r:.t g ro•:;nd 'JC. ter as frc.::.;h Hater
s11pplies (2). Fa.i.lure to exploit more the: ,_nJ.eq~round resc:rves is par
tiaJ.].y due to the lack of kr1m,Tledge of tl1c q1.:aJ.it.y D.:.1G hyd·-anlic p:roper
t:.ies of the c.rulr.=:r:ground ,.;rater. This is csrJecially true .i.n ~~ar~:;t regions.
Kil~o (3) and Huang (4) were the first investigators to study the
eff•::c"C of carbonate ka.rst terrain on su.rfa,;e and s11bStirfac.e \-J.'l.ter quality
iu the south cen.tr<1l Hissouri area bounc1.ed by tlv:: cities of 1:Zolla, St.
James, and Snlen. This &rea contained tl1ree main streams, Dry Pork,
!•hrn:a.n and Ben tun creeks, and many springs, including Herac.,ec Spring,
one of t-~issouri' s largest. Both investigators re!)on:ed that th2 surfDce

2
waters, spring waters, and some of the well waters in this area were
contaminated, as evidenced by the presence of coliforres in significant
numbers. Huang found that iron, chemical oxygen demand, total solids,
turbidity, color, and coliform and fecal streptococcal organisms in
creased follmv-ing rainfall and runoff in both stream a.nd spring Hater.
Kilgo established that phosphate ions were only found in the Dry Fork
Creek, below the entrance of Little Dry Fork which car~ied sorne of Rolla's
treated waste water, and in Meramec Spring. H~ attributed the high ni
trate ion content of soFle of the \·Jell Haters to cont<::tlTlinatLJn by org8nic
pollution 3nd inorganic nitrogen in the form of fertilizers through
direct access routes, such as sinkholes and solution cavities. On the
basis of their water quality studies, both Kilgo and Huans believed that
direct path-vmys existed bet>veen surface <;nd suiJSTJrface water .sPpplies,
and reco::n1:-tendt::;d ·the use of tracers in this area to es~::::.hlish connections
bet•veen surf.:.:.ce and suhsur:Eace waters. Routes of contami.r:.:~;:-Lo'<, and th'3
di:l:'r:::ctio!l and rate of ur.derground water flm.;r couJ_d also be d.:cten;,[ned
by tracing.
The purpose of this iJwestigation was to select and evaluate in tha
lahoratory a tracing method appropriate for use in karstic areas, and
to apply this method in the :Oield area studied by Kilgo (3) :md llua1lg (4)
to establ~_sh existing direct flor . .;r connections bel~td'C!l surface a.nd sub
surface \vaters. Hith the c.stablish::H:;~nt of direct fJ.m.,r conrectinns, the
direction and aJ:>pL"oximate rc>te of groundwater £10\-.r could b~ determined.
Field studies were conducted in the upper Dry Fork Creek ba2in.
Dye was selected as t:l1e tracer and a n:odified form of the Dunn (5)

3
tracing method using c~rbon packets to adsorb and concentrate the dye
'-"as employed. A Turner fluoro;neter v;a3 used to detect the pr?sence of
the d)e. The ability of the tracer to travel through the media ercountered
in the field Hithout being adsorbed or degraded \•ras evaluated by rne.s.ns
of coluam studies :!wde in the laboratory.
'Lhis irLvestigation has ~;hmvn that the ::J.od:;_fied Du11;:1 traci::1g method
\vas suitable for tracing uork in this karsti:::: are<J., fl,.:orss·.:::ein and
B.hudamiT'le HT dyes v1e.re approp:.:ia::e t:cacers, 2.:1d detectJor. of tl-:2 tracers
in the mic:;:-ograrn range \'Jas possible with tho2 aiel of th=, fluormreter.
established.

4
II. REVIEH OF LITERATURE
A literature review was made in order to determine the best method
and tracer to use in <:racing underground \v.s.ter flow in a karstic are:a,
and to ascertein the geological, hydraulic, and water quality c.haracter-
istics of the area whjch was to be studied. Tracing of ground water
through terrains other than karstic was also reviewed because all methods
and tracers could be potentially used in a karstic area.
A. DESIRABLE TP~CER PROPERTIES
The desirable properties of tr.=.cers ha\.re been outlin~d by several
authors (6,7,8,9,10). According to these authors, tracers should be:
&. readily identifiable or separable from naturally occurring
substances,
b. entirely Jbsent from the injected water or present only at
lmv concentrations,
capable cf not being adsorbed by the porous medium,
d. :i.nactive with ions present in t~·1e inj t:"!C ted or displaced water,
e. nontoxic to human and aquatic life,
f. detectable at low concentrations,
g. solubie and readily dispersible in ~1ater,
h. low in cost,
i. easy to handle.
E. TFACING METHODS
The general procedure employed with all traci.ng methods is the
same; the tracer is inject~d into the flow to be traced and ~ts presence
5
~.t possible sites of emerg.~nce (,,,ells, springs) seeFs) is dete~~mined by
an appropriate detection technique. The difference in the various RCthods
is the type of tracer used and U1e method of detection utilized. The
different methods of tracing have been classified bv Haas (H) as cherr5.cal,
bacterial, radioactive, and dye tracing.
The most corc,mon tracer 1.:.scd ~Jith the cbe;nicr-:1 Lracing method (11)
ls cou.1mon salt whic"t"-. can be int!~vduced in the ~va:::er :h1 larse quantiti("S
and ca-..1. bt'-! :-_;},e;;:Zed for at possi .. ble ;:;:;:erger,ce points by t:he presence of
e;,~ccss::..-,e ch lo.cide ions; however, ::my nu;nber of soluble salts may be
• .. 1sed in -.:h:! .. s nethod, such :::> .. s those containing the ions of ni trRte, dichro-
rrcate, ;:namon..Lum, or ltthium. Ion d<~tecti..on :is made by such instru~tcnt:s
as 2.. spr:ctr0photomcter, pH meter., mass ::;vectrograp;1, or a flmne photo-
meter (7,11).
ri.<~<'.'>IHement cf 0le.:tric::~l conductivity can also be employed for
d~3t2ct:Lng t'::~=tccr move,1.2r..t. This r:.et:~·od \Vas de;\'elcped cy Slichter (] 2)
mainly for rr.easuring gromuh,r;~ter veJ..oc:i..ties in perJT1eabl2 stLlta.
srMll test wElls were driven in the expected rach of flow and the move-
tiou well ~as observed. Inter~onnected el~ctrodes pJaced in e~ch well
mP:J2l!red t:.v~ <1.mount of current that Has flm;Jng bE:tueen t.h:..:m, nnd tl1is
in turn i.l·,dicatc~d changes in cond,Jctiv:i..t:y 0f the \,,ell ,,r:..tters canse:d l;)y
Lhe prcsoncP. of the electrolyte. Slich tr..:r fr'und that ammonium chlorirle
was a sa~isfactory tracer for this method.

6
The use of bacteria as a tracing agent h~s been described by Haas (11)
hho stated that little work had been done with this method of tracing.
The 1nethod consists of adding a culture of bacteria in the water whose
flov.- is to he traced and checking at the eor,ergence points for the presence
of the organisms. Care must be exercised in selecting a culture of bacteria
which is not naturally contained in the water being traced.
R:::di::::-8ct.ive tracing has also be;?n described by h2as (11). The
.cadioBct.ive trn.r.er is adcled directly ir-.to the influcmt \-Jater ns a v:ater-
soluble cvr.ipou:1d and it~ presence in sa!'1ples taken at tbe anticipated
emergence locations is detected with a geiger cotu1ter. Radioactive tracers
should ~8 in the anionic form because cations rGact with some types of
The t1l.:CCC 111ain r,~ethods of de.tectior1 used in dye tracing a:ce visitle
dr:::te·::tion, ulU:dv~!olet :Lir:.;ht dr~tl~ction, and dctec~ion by r~C.'.in.s of a.r..
rct·Lva.ted r::tlbon p':l.ckct (11). ln the visible Ci.c.tec.tion l<teL.~-wd, a larg:'~
'~'-·.:trd:ity of dye Js poured into an a:::-ea of sinkin[ i·.'ater or a '·JeJJ .. to be
tt~St·~d :-tnd the presence of thr~ dye at possible ~::i tes of .o·.;:~err;2nce is
checked vi:::a.:.aJ:i.y by tbe color of the dye. 'I'hr;: .:iye 1:1ost C•'ll'·,~ilonly used \,7 ith
this il,ethcc' .. is flucre:,cein an(l the recoi:;,0ended dos2ge is 2 ·t:o 3 p·:J:..mds
for ev<:ry J .. UOO ::,all,~ns Fee :uinate of \·hit.er £J.u:1 at tb.c soul.·cr~. Hhen the
\ilt:r:aviolet liGht detection met;-.c"i is us.:d, lesser c;,u:::nt.ities of: the d:,;e
cnn be e:npJ.oyed hec:1use under ultraviol.2t li;!ht it is po~:;sib]e to Jctcct
the dye in tl 1 c parts per bj llion rr1r:g,;. Durm (5) has devclop>d <1 trncing
~ethod for use with fluorescein vhich consists of concentT~ting the dye
on ac1:iv.lt•.~d ca"Lbon packets; consequently, verv 9n.a ll q l•:int it ics of oye

7
are: rec;.~ired. Activated carbon has the property cf adsox·bing the dye
a~tci retaini:.1g i.t even though water is f::!..o• .. 1j_ng through it. The carbon
packets sre placed in th';;! possibl0 places of dye e...:1e:rgen.ce and are period
ically collected and checke.rl for dye adsorpti·on 1:::r extracting tl:e carbor.
\vith a solution of 5 per cent potassium hycl.ro::.dde in ethyl alcohol.
According to Dunr.., fluorescein, if presen~, v.·ill sho~A" up within one-
half hour on the surface of the carbon granules as a green residue.
Unexposed carbon shocld also be extracted together ~A"ith the se.mples to
serve as a control and help verify the presence of the green residue.
C. APPLICATIO~ OF TRACING ~1ETHODS
There have been several re-vorts ir. the literature of t~1e use of
trac~::.rs to detect: the direction a:1d velocity of undergro1.1nd flmv. In
1882, des Carrieres emplc·yed fluorescein to -..rertfy the origin of con
taminated -vw.ter during a severe typhoid fever epidemic in Anx~·rre,
France (10). A 2.2 pound quantity of fluorescein \v~s placed in a pol
lut~d creek located next to infiltration beds of a1l:.rviurn \vhich v7ere used
for the city 't.•ater supply. A check of the wc:ter throug,hout the city
showed that 0.17 pounds of the dye re.ached the city tvate-r· through the in-
filtration beds.
In 1902, Slichter (13) used a:iL':!Onium chloride to trace the unclerflo·.oT
discharge of intel.1nittent strea;ns in Southc,rn California and detetT:-.ine
the rate of flew of the undergrour;.d vlater. Electrical conductivity
me:::surements \ve.re cnrloyed to detect the tracer. He found that th:i s
n~ethod was applicable with re1 utively permeable n:at•?.rials for distances

8
of 25 to 50 feet and explained that the short distance re~triction in
this ruethod occurred because the addition of the electrolyte to t!1e clay
fraction in the underground formation caused coagulation or dispersion
of soil co}_loi.ds which decreased the penneability of the medium slmving
down or pre\;enting t~:acer movement.
In 1906, Dole (10) discussed the use of dye tr2cing ~lth fluorescein
to check s;mrccs of pollution in the Paris, F.cance, city r,:atcr supply.
He. reported that on the basis of preli.,ninary stud:.es, it was concluded
that fluorescein moved slower than the water in which it ~as suspended
and, on account of its greater density, tended to accumulate in lmv :iJlaces
along the ·;:oute traversed. Fluorescein in contact Hith T,Jater containing
a larse quantity of caJcium carbon::tte for 24 hours \las foend to lose
approximately one-thi~d of its color intensity. The use of a fluoroscope
enabled the detection of fluorescein at concentrations as low as 0.1 ug/1
(0.1 ppb) by observing the green fluorescence in 2 depth of liquid against
a da.rk background. Dole (10) also reported on tracing stnciC's ·~onducted
in a rl!gion vJhich Has the suspected source of '.vater f."Jr. springs furnishing
part of the Paris city water supply. A 2.64 pou~d quantity of fluor2scein
\..ras poured into sinkholes in c:.n aquifer of travertine c:Jt hy fisstn:es Hith
larze ~averns c:c.ea.t.ed by the flov; of water. Th2 dye tr<-'veled underground
at a rate of J.O feet per minute and a 1.6 - 1 * r2te. or s ope
2.ud r,mc~r.:;ed in a spring which -.;.;as loe<.lted at a dist&nce of 3 ':'.iles.
vJhen 1.1 pounds of dye w2.s added to another siilkhole, the dye ~v-.ss observed
*------ ------·-------·-----'l'he me<::n rate of sloi.-1e w.;f; defined by Dole (10) as the elc~vatLon difference bet\veen the two points divided by the str."li['ht-li.ne distance hr::tvreen them.

9
to e:1tf;~·ge in a si:;ring 2 1ailes 2vJay traveling at a rate of 12.3 fe•;t p~r
minute at a 1.01 per cent mean rate of slope. From studies in this re
gion, it was c:oncluded that fluorescein was capable of traveling long
distances underground without being affected by the presence of large
amounts of calcium or destroyed by long contact with the underground
water. StuJ:i.es Here also conducted in another area of france.. In one
test, 0. 6 pounds of fluorescein vlas introduced into a well lGO feet deep
in compact liml:.!stone and in 24 hours the dye "Tas nctj.c.ed to progr-ess 500
feet. T~1.is sl!o>;,red that fluorescaln could penetrate fairly solid rock.
In another test, 1+.4 pounds o£ dye w·as put in a brook which after 650
feet of trav<:l infiltrated through a porous bed; the dye emerged about
8 m::i.les away in a spring "tvhich came out of fissm:ed limestone forrtations.
This test showed that the dye co~ld travel through underground channels
for some distL:.nce without beir~g adsorbed.
More n~cently (195'2), the London 1-!etropolitan Hater toard (14)
studied thP.. nse of pb.o8phate as a tracer of underground Hater. In one
test, a dose equivalent to 2 mg/1 as phosphate ion was applied to water
pun~ped frOl:"l a well and ~·Tast~d to the ground to see if ti.1e tracer \vould
ir..filtra te tl:-r-ough the sro,_md and return to tbe Hell beh'!.g pumped. No
increase in phosphate \·Jas not1ced in the Hell and the test \·ms deemed
In anothC!r test, hmv-evcr, 40 pounds of phosphn.t.e ~..ras added to
a well and Hi !:hin 5 min·.Jtes the pho~phate cor. tent of a susp2cted inter
connected ~.rcll rose. A 73 per cent phosphate recovery was obtained within
8 hours. L.Jboratory column stu<.li.es indicated that no appreciable loss
of phosphate occurred \vhen the vrater perc0lated through :::halk, and that

even if all phosphate had been converted to the calciur.1 salt it '.vould
have Etill rerJa.ined in solution.
10
Carter, ~~ al. (15) studied the use of helium ~s a groundwater tracer
in laboratory and field e.xperiments. A mass spectrometP-r and a pressure
volume <..=>.pparatus were used to detect helium at minute concentrations (as
low as 0.15 mg/1). Tests were run in the laboratory to check the flow
of helium through a send column anci. a sand channel to simulate conditions
occurr:tng in a confined c::nd unconfined aquifer, respectively. It was
concluded from these tests that helium would not be practical as a tracer
in u;.1.confined aquifers but could be employed in confin~d aquifers. The
field study was conducted at a well field consisting of a 12 inch well
penetrating a 4 foot confined aquifer at a depth of 90 feet, and several
o~servation \·Jells. Helium \vas traced to a distance of 188 feat through
the confined aquifer.
Voysey (16) used a bacteriur1., ~~'!:::!atia ~-~<:.f:..?..E_.~ns > .i.n tracing a
stream in Centre County, Pennsylvania. A one lite'L 'J0lume of a culture
of this organism was cddcd ·to the st'Lcam and a sampling poh1.t ";-JaS selected
1000 feet clowns tream. Approximately 35 to 40 minutes \vere required for
the bact.::.ria to travel this C:istance.
Radioactive tracers ha~;e been employed by several iuvP.st1getors.
Radioaetive :rubioitL'll chloride C•)ntaining rubidium-36 i_sotope 'vas used (9)
in Egypt to test the water-tightness of the floor of a desert valley.
Thre<:. 1o~·l volu..rna springs located 7 miJ.2s fro::-.1 the valley were assumed to
cause wet brine-soaked sands in the va.lley floor. 'l.'he tracer was intro
duced at the springs and within 5 days the radioactivity of the 1.Vet val
ley sand ~vas found to increase.

11
T:rit:i.u.-n has also been used as a t.ntc.er. Act::ording to Haas (11),
Pinke.lshtein and his cmvorkers added 100 to 200 ml of tritium Hater \vith
a specific activity of 10 to 20 microcuries per milliliter to a well
dr:tlled in sandstone. Samples taken at near-·by \·Jells shmved the presence
of the tracer by increased beta count over the normal level emitted from
the w::.ll \vater before the experiment. Velocities of flow in sandstone
to three observation wells were found to be 40, 12, and 13 meters per day.
Tri!:ium was also used by Burdon, -~t _al. (17) to t-r-ace ground \~Tater in a
karst area in Greece. This method >·Jas successful in d::i.scovering the inter
connection of two sinkholes on a h.i.gh plateau and oJ: sevc:::-al springs aear
tha <.:cast. The results were employed to de~:ermine transit, flow rates,
and groundwater storage.
Dye tnl c.i:ag using activated carbon to cnncentrate the ci~re has been
e-mployed by Turner (18) who added 4 grams of flu::H"cc~cein to a sinking
st.ceam at Erb Gap near Pine Grove Hills, P::mnsylvania, in order to detect
the path of flo~ and site of emergence. The dye reappeared in the water
of Be3ver Brook) one mile across the strike of the bedding planes, and in
a spring locaV~d 3 ;tliles from the sinking stream. In .:mother test, Turner
added 1. 2 grams of f!.c:or~scein in a creek and V."as able to detect the tra
cer after a flow of 14.4 miles from the site of addition. In a study
conducted by the U. S. Geological Survey (6) in tl·te Ocala area cf Florida,
20 pounds of fluorescein was put into the Ocala Caverns and detected be
t~,,een. 2 and 9 days later in Wolf Sink, 1. 3 miles :?.'·~ay. T~1e averase velo
city of groundwater flow \vas estimated to be 0. 8 feet per r:1inute at a
e;raci.ient: of about one foot per mile.

12
Rhodamine ¢1T has recently bel!n investigat,,d as a :-;urfac.e \vater
t-rac.f•.r by Replogle, et .§_~. (19) who found that there \BS no signific.?.nt
loss of th•2 dye to stream boundaries. A 16 hour test ':·;as run \vith canal
sedincnt mate:;::i als and evaluation of the results obtained indicated that
~vhile 41 per. cent of Rhod.:JminG l3 was adsorbed, only 6 per ccr..t of Rhoda
min2 'VJT \vas lost. In a second test run usiPg bentcnite clay, 96 per cent
of Ehodan:ine B v-•as adsorbed, while only 28 per cent of P.hoda1r-ine HT was
removeli.
KnochcmJus (6) has surnmariz2d the characteristics of the commcn
fluo.cescer!t dyAs used for tracing (Table 1) and has stated that nearly
all nc:tural. ,.,a-::.ers contain minerals and organic compounds ~'llhich are fluo-
resc.::.:::nt and wiil impart a reading on a fluorometer. Ee.:>'1nse the m:rve-
l2ngths of light emit ted from the natura] ly occurring rraterial and the.
dyes used fer tracing are almost identical, detc~ction vf the dye Hith a
fJ.u.orcm2ter must be attained by an 2bnormal incre;:·,se of fluorescence
reading over a predetermined background readit1g of th~ n,'.t:ural ;naterial
in the ,.,;oater. According to Knochen,nus, the badcsround fluorescence can
be expected to increase after rainfall due to runoff.
D. fV,~_LUATlON OF TRACii\G HATEFJ .ALS AND NETEIODS
TL<? characteristics a11d special requi·cc;nents of the various methods
of tr:P.cing and the differe~,t tro.cing <naterials, as 2:cported in the liter-
The main di3advantages of the chemical tracing me~hod are the exten-
s;_ve labor and :.ipparRtus required. Samples at the suspcct(!d e,r.ergcnce

TABLE 1
* CI:LA&\CTERlSTICS OF cma.;ON FLUORESCENT DYES USED FOR TRACING
--.--------r-- -.---·-r ! . I
Photochemical i Adsorption on I Effect of I Effec.t decay l rock material I temperature I of: pH _ _j Dye
I I
high I Fluorescein I
~·-----------------~------------· I
I Rhodamine B
r ! ?ontacyl Pin~ I r I ! RhoG.a.mine HT
1 moderately i low I ,--------1
lmv
~-·------------~~-
noderately J.m-:
i 1 ' I I low i slight I affected 1 I __l 1 l I I ·-·----;i I I I '
high I unaffected I great 1 ,
"' ibetveen 5-llJ --! : --- I
I I un~ffected I 1 great :. 5 ~ 0 1 1 lbetween -.L 1
I -t
t -1
1 unaffectec'i J grea I !between 5-10
some
low
* As reported by KnochP.nmus (6).
. ... w

TABLE 2
CHARACTERISTICS OF TRACING MATERIALS AND METHODS
,----------.--- ·---·-· .-·--
Tracing Method Chemical l!vt·
--- r·-:-:=~----------- Rad::~~-----~-- -------------
i----------i-----------,·---------r---·---------,~~----Am-mo-n-iu_m_ ,s_e>:C.:'.£~3 l~l-'16 1--l--1-Jl_I_._J_I--.l-~1 ------------,------- tl' ·---------Trac<'.r Salt Heli·Jm Phosph.:lte Chloride ~~_rccscens . - - ::Juotl'St'ein RhodJmine ]{)I. \''!
1------·-----------l--------------t----------- ---· r--·------------------·--------"""'"-'-"-~"-'"-'"--·-----t--~==-~------------'------- ·---·---~------ -----,---·----,--------- !---·--------+---"-' ,_,1_n_''..:u.cc''-'__ ~ 1_1 __ , -'-' __ _
Detection Sir('~trcphtltOill('tCr ~li.l.SS ::ipl'rtromt.."ter E1 . 1 Lulturing i Fluurc:nctcr !'I t rl P · cter Pn·sst:rr-Volulile Sprctrophutometcr · ectrlca and Identifi- Ceigcr Counter 1 Vi~ible UV or . uurornP t'r . uurornt·tt r ' 1 1 ' 1
Device Mass Spcctrogt;Jph Circuit L' · \ or or 1 F1arrc PlJotn~r·ter Apr.tratu.s cation Key , Ignt ! clivated t n:Jtcd l ,Jfi10JI . I I
Lowest Detectable
Concer.t rJt ion l.O~g/1 (7,11)
~--------------+----------------~·
11.15 J.g/ l ------+-------- ----~-----------'---------·---·----------. .., • • ~-·· .• _, _~~ __ • . I , ~ ~ _,_,_, --
( 14) I l Bacterium (16) I Ex trcrne ly low - ng/1 (G, ~t-,-c_/_1 ____ (_1_1+-.. ·,-;;-'l _______ (_l_l-1)-,.-,;-' ~----~-6-)-+----------!,---.---.- J_ ----(-1-5) -· +-S-e-.v-e_r_a_l_l_b_s_.----~~~-S-e-ve-,r---a_l_l_h_s_.__ (14) Liter c~ry Small (~-~-0-0_(_u_21._11,\J'·,r"~MI-.-._-I-I_b_s_. ___ (_I_I_)+-L-c-s-s---(~~~;,--~ ----·----··- I
(15) og/1
Amount CseJ Several lbs. (II) ', rnc~ll l !J I [()\ oc~l-roli!l. 1han Vis. :1('t. Srlli.d] I
~,--t---------+-~-~-~-~-~-;-~~ _O_i. v-,-; b-s-. __ (_l_l_)+-L-u_w _________ ( I >I }----- -- H 1gh ( 2 2) fow - --~-;-~,~----~-~) •, 1 0 pc r 1 h . --··-----·--'--------(-]_[_)+-,-,-/-I -b-. -_-40
-z-, ___ (_l_)+-fl_o_r_c_J_. x-p-,-. o-. s_i_v_c ~ ~~~r~-,-1'-' -n ~ 1~ ---,-1 .-, 1
j------ ---------~------ ------~--- ---1-- --- --1--.. - --------------------1---------+1-'l_la_n_G_thrr Dyl'~; Than rrthr·r D">l'~ tLnmlLC~S up (11) I I
~'~-h-ll_"_'a_· _'" __ ---+-L_n_s_ooo rng/J --+--cl_o_n_e ________ C_l_\_)+----·-------·-----·-----------t-----------t-G-'r_c_a_t __ c_zz)Noderatc (22) Slight (Ill :lonr ___________ . ____________ C_l_l_)+--N_''_n_e ______ (_l_)+-~-o_n_c _____ _c(_b.:.j+-:;_,,"_e __ ,_. ____ l_i_" 1
A On Rock Very (14) j ; or Gravel s11ght (l)) Slighl Moderate (12) Praclicully None (8) l,o'i.J ( 6 ) r Great \'ery (6,19)11 .
1 (G) S li ·ht So:rc
01 lln Cl.:~v --t-G-r-r-.a-t- (12) Practically None (8) Gn.>at (
(hi
or Organic 11) Great (19) Slight (lg)
~~~t~:a_t_i_on-----1-------- -·-- -~~:e ________ (l5_l_=-------~--t--_·~~~~~~~~~~~~--~--~~~~~~:~~~~~~~~~~~~~~~~:~~~~~~~~-o_r-~----.-__ -(2_2_)_rlss-JJ_o_w _______ (_8_),_S._l_o_w ___ (_l_l_)+~-.~-~-~·-~-~~-~~-~~n-/-,a-~--~-o-~-~~-g-h-----------(-~-~-;i-~-~-~-~-~-~-~~:-"7-.~-.,-~-!-w--(-6-)+l'-h-o-t-o-ch-e-m-,I-.c-a-l--(-o-)+-1'-h-o-t-n-,·'-,11-.1-::1-·,-.-,J--:-h-ll ~ ~ -- .. - . _L ------------------~----~·~~--F~o~d~er~ot~e~ly~· l~.o~w __ _pL~ow~-------_s_o_l_u_b_i_l_i_t_v __ in_:~-P-~-.--_- - 1:ood -----~~)-+~- ---- 1
t:ood .. ______ (_1_4_) +G_o_od _________ C_20_)-+--------t--c_o_o_u ____________ C_2_2_l+-~·"':-~"~---~~~-co_o_.d ___ . (7) I r:ood (7) Cood 1191 r:ood .. __ '~ Pres e:1 CC' in '.<.1 at l' r ;1 at u rull y
Rt:'lcLion witl1 :.JaturJl1y
llrc1Jrring M.tteri:Jl
D i .'it an c1• Surf .1 {'
r1i TrdVt•l ')ub<;ur!
Soml'
Cull J
( ' I t'IJ'j' ''l 1 (l ') I "r•ne (!')) I :~t'!W- but l.Jturnl h.H·kvn,md ::IJteri.tl Jlfl'~,('nt ·;) 1 ::on, ____ 1 ·•_i_' ___ '' ______ .:__4 .
1
,
1 Slight (4) None (16) ·• -- Soc1o ~6~•-------------------'-----,----------
~~=-------~~t--- 1 ;;'.;;:; '"' :::: "'''I '"" .";"'''~--- ---- ''"'I ··~· I-=-- -~ j-~ = ~ -~"~- -·-. D.'fL'·Lltv (16)+Donxerous j ___ c;~_:'_'I___ ________ .-------~~C~oo_,u~-----4- -+--·---------
"'"!·-~--· --~= "'J"'""' '"''"-- '"'I woo" ""I _1__ ____ -f---------~ ~·.~~~~:~---~---_·-------- ' "I'"' ""'' ~ ~==: _____ , ____ l ___ ,__ . .J____ ____ j _______ l ________ L'hl (6) I Creot (6) ll,fl'.Jt ___ (b) :.r:--._-_-__ ' 11_'_
(h)
(II)
(7)
14

1.5
sites should be c.ollected frequently, at least hourly, and e:lq)eosive
ion detect.ion equipment i.s 1..1stwlly nce.ded. In addition, the ~ 011c .. -:.11 t 1·at:ion
of :=;alt '"hich cc.n be 11sed in tracing is limited to :-..ppro:x:j_mat(~ly SQOO mg/1
to pr•:vt-mt hnrmful eff12cts on plant. and animal life (11).
sodium chloride, is the most frequently used tracer vlith this r:-, 3 thod be:-~
cause it is i.n2~~~•ens:i.vc (7, 11). The disadva:o.tages of using sq t as a
tracer include that it cannot be detected at conccJtralions l~wer than
one mg/1 and csnnot '!:Je '!:'esdily sep::.raten from naturally occ1lt:i.'i!!g sub-
star~c'=s (7). L.:::.rge qua.ntities r::tust .:;lso be used. The us~. of Ct".tio-r1s,
such as lithiem and am:n-:.,niuP1, as tracers is not zdvi::able bec<~u 2 e of e:•:-
change of ions ~.;;lth clay in th~~ soil; incr,:;,ased conc.;:mtr.:o.ti.on, hOH~ver,
can ow=.:-come !:his li.nitat.ion but would. result in incrP.ascJ eo:st (.lJ_),
Til'::: eh~r:'tl.·ical ::.~:Jnduc:t.ivity method of tracing has the reported. adV<lt1t;;~:c
of beh1g more posi-i.:ive. in its d.~tcction th8.n either the che~.1i':'nl al:' dye
me.thods of tn:cing (20) and is applicable to g-::oundu3.ter fJ_o•.v ;ne;.lS'.~T"e·-
m2nts in r2J.:itively pcrm~nble materials over short d:ist:::nc.e:3 (1.2).
ac.lium, llhic.h h::-.s rece;itly been iuvc.stig'}ted as a groundw;-:_t~r tracer.
has the auva•:-:.t.::Jges of safety, lm.r cost, relative ease of anal;>:>iS ~ ckt-~c·-
Lion at lm;r concentration, and chemical inertness. I t.s dis:?.d·•~nta~es
include relatively larga errocs in analysis, difficulties in ~~1ot4iniog
a constant rccb.nrge rate, time required to d:.=:valcp equilibriu11 conc'l:itionG,
£.nd loss to the at:mosphe::::e in unc.on~~ii~e:d :1quifcrs (15).
Tiw phosphate :Lon u.sed as a t,:ucc.i.· has good solt!bi.lity in ~.1 ao~t and
is only slightly adsorbed on rock. 'fJ:,:·v.rever, f:evE:cal poun\is <J!·~ ceq_v:U..::d
~-:hrm tracing and the lowest uetec..ti'm li~it is in the rng/ 1 rDn~e (1.4);

16
ir. eLlt':-L!-iCn 1 phosphateS may be prcse11t in. the \Jate-r due to the; ei'-'charge
of efiluents from Haste water -creatntent plants (3 ,4).
The ba~terial method of tracing requires knowledge of bacterial
culturing proccd11res and considerable time is neEded in. preparing cultures,
sa;11plir,g, and re.:::c.lt.uring (11); the use of this tracer has been found ef-
fe·::tive £01: use in tracii~g a considerable distance :i.n a stream (16).
Radioisotores (6,7,8,11,21,22) used in tracing of underground water
a~e extreoely ac~urate tr~cers and can be detected at very small ccn~en-
tr2tions; ho~ever, dle use of these isotopes presents several disa~vantagcs.
rch~ grc:::-d:s:3t proi..l1em j_s public relations because of their thre.1t to publ5_c
health. Extren-·c: cnfety precanti.Oi.lS must be taken HhE:ll they are used.
Appr0val und licensing must be obtained from the appropriate authorities
befcre their use in water supply sources. The cost of the radioactive
tra~ers is high and detection equipment is very expensive. The chloride
(Ci-36) isotope bas the disrrdvantages of high cost, absence of g3:nm:1 radla-
!:ion, and a lcng half·-1 ife as co111pared to ioditle (I-131) whicl1 hss the ad-
vant:.:13es of low cost) availability·, an·~ rr.inir1al ltealtl:"! h2zonl (22).
I ·,.•t• Tr. (u 3' "sa,... Pvcellcrlt ~.a-·1 ~0C:tCtl."Ve t-rcL!:er Of .._ l lU . n-·. ) l~ · .. -·-· - -·· "-·• - u_ - - -
its properties are nearly the sa~e as common water. rriti3te~ w~ter is
r:~1o. tively h<::n!11Co•ss und lovJ in cost (11, 22).
t ' t"' 1 ~ 1 t t" 1 d fJ]) i·.T1',."'n •.J.·vc ._;.s 'l."_,~=·u:'! .... ,._-;_·l·',,, "'Jlsitle ne 1r.e ·~10• or ( e ·c:c .. len e<·lp ___ oyc: , . . • . - , - .L -
• · - · • t 1 1 ·1· d .., ·d cont.in•.Jous obser,•3tiun llCteC tlCll > _Large qu<JntJ. t "leS :TillS- )e Uc:l lZC oL
at the e>r,ergence si-ces is r:=>quircd; in acldi t.ion, high u::-nc:cnt:_·::t:i.cns of
' 1 1 ff · · l'fe T.rte d, .. e ~~-~sr:ing :n .. ?.thod ~ye may 1ave a(verse e ects on aquac"lc l • . - _ - .

17
employi!:;.g dt~tection with ultraviolet light requires the availability of
the ultraviolet light source and a systematic procedure of sa~pling and
indexing. S:·llHll quantities of dye can be used llith this method. The use
of dye ·,lith a11. a.c.t1vatcd r.arbon a.dsorbent pa~ket is the least expensive
dye tracing method and e!:ip.loys the least labor. Very srr.all quantities
of traeer can be used with this method and the emergence sites can be
ehecked at ~onvenieut intervals.
Fluorescein used as a groundwater tracer has the advantages of low
adsorption on rock material, slight effect by temperature, detection at
lmv concentrations, nontoxicity to animal life, and high solubility in
-.:vater. The disadvantages of fluorescein include high adsorption on org-.,qic
material, i~partation of taate to the water because of its phenol content,
nnd high susceptibility to photochemical decay (6, 7). CfJmpc;;.red to fluo
rescein, Rhodamine B l!as a moderately low rate of photochemical decay,
but is adsorl1ed greatly by all types of materials and is highly affected
by temperatut·e (6, 7). Rhodarr..ine \IT shows little adsorption en different
media, and a lc1,T rate of photochemical decay. Oti1er <i.dv·anta.gcs of tl!is
tr·acer include detection at low concentrations, non toxicity to humnn or
animcll life, and good solubility in \\·ater ~..rhen mixed w·ith the proper sol
vents. Th_i_s dye is a little more expensive then the tHo :previously rnen
tj_oned and is extrernely sensitive to temperature (6,19) ·
E. THE HERA.:.'1EC SPRI~G KARSTIC AREA
Several investigators (3,4,23,24) at the Univ~rsity of Missouri -
Rolla have r~cently studied the knrstic Meramec Spring area located enst
of Rolla) ~H ssourL This area is bounded by the cities of Roll-:1, St. James,

18
anti Salem aml includes the southern portion c£ rhelps C.)'Jnty, the south-
we.st corner of Cra:~;.;rford County~ and the northern portio!"'. of Dent County.*
The area contains three -main streams, D·cy Fork Creek •.Jhich is intenr.ittent
in its upper part and perennial in its 1 ov;rer part, Norrilan Creek Hhich is
intermittent, and Benton Creek which is perennial, and many tributaries
including the Little Dry Fork, Spring Branch, and \·Jest Fork Bsnto-;1 crP..eks.
The area also contains Missouri's seventh largest spring, Merasec Spring,
along with many smaller spri<1gs. Botb Meramcc Spring and the creeks feed
the Heramcc R:Lver \vhich is one of the major -civers i;.1 }iisf.;~ou:r::. (3, /f, 21~).
Crouci1 (23) has reported on piezometric levels and shallmv atiuifers
ir .. this area. He fouud that the three main upper formations in th·is area,
t:he Jefferson City, Roubidoux, and G.:1scor..ad~, 1vcre aquifers <tnd that th?.
Jefferson City formation contained perched ground r.;rater. !le stated that
ground water occt1rred in joints, bedding planes, and solution c.:1vities
and c'hAnnP-Js. Cro·Jch presented a preliminary pj_ezoT:J.r: t ric contour map
1:1h:i.eh indicated the static water level <lild .snti•::ip<itcc clirnction of grvund.-
water flew and concluded that the upper reaches of Dry Fork Creek and
Little Dry Fork Creek ,;rere inflPent, \·lhile their lo•.ver rcoachcs and Nor,tlan
Creek were effluent. He also concluded that the majcr Jtreams in the .:1rea
cont<lineu under.ilcH in the thick alluviur:-. in their channels.
A revised and more complete water Je~cl map cf this area (Figure 1)
has been presented oy Haxwell, !~~ _0.:l· (21~) in a i"<Ocent research report.
On the bas:Ls of this map, Maxivf~:i.l and his cc1vork.:~·cs concluded that g1ound-
Hater ~lev<:!.tions tended to follow topcgr<-lf:·ltic elcvati.ons Hest of. Dry Fork
-------------------* A rnap of this area is included in the Field Studi2s chapter of this
thesis (see p. 42 )

1')

20
and between Norman Creek and the He?::amec R.iv,:c:r ~ a rnaj or topog:-aphic high
between Norman snd Dry Fork creeks had little influence on groundw~ter
levels; and a groundwater depression existed under a ridge east of Norman
Creek.
Kilgo (3) studied the quality of the water in the area in the dry
season. Pe reported the presence of coliform organisms in surface waters,
spring ~.;raters, and some of the \vell waters, and attrib,Jted the presence
of coliform8 in ground "mter to contamination tl1rough sinkholes 2nd solu-
tion cavities. He also stated that a high nitrate content in weJ.l wate~s
was caused by fertilizers reaching underground water by direct access
rotttes. Kilgo, on the basis of his water qu&lity findings, classified
the upper reaches of Dry Fork Creek as influent and the lower reaches ns
effluent; he also concluded that a direct cocnection could exist between
the lower part of Dry Fork Creek and Ner0.mec Spri.r .. g due to the presence
of phosphate ions which were not found in other wate~s. He suggested
the use of t~acers to help verify his findings.
Huang (!~) studied tbe \eater qu<1l:i.ty charactcristi..-~s cf the area in
the wet and dry se~sons in order to ascertain the effect of rainfall 8nd
runoff. lie found that ~£infall affected the quality nf sttYf3ce water and
spring water, but not of the well water. He noted that the changes in
quality of the spring and surface water paralleled each other, indicating
connection bet~·;een the ti!O sources oy direct pathHays. Huang suggested
the use of tracers in the area to verify tha~ surface conta~inatton of
subsurface water is a characteristic of carbo~ate karst terrain. He in
dicated that tracers could also be used to find the di~ection cf flow of
surface and sJ~surface water.

21
The Missouri Water Pcllution Board (25) has also reported on the
water quality of this general area and stated that the waters of Spring
Branch Creek and Meramec Spring were less mineralized than the water of
other streams in the Mera.-uec River basin. The Spring Branch Creek re
ceived effluent from the Salem v1aste water treatment plant ···>'hich disappeared
a few miles after its confluence with the Dry Fork Creek. Conductivity
measurem2nts made in Heramec Spring fluctuated identically \·lith measure
ments made in Spring Branch Creek. The chemical characteristi.cs of the
spring and creek waters were found to be somewhat lov1er than those of
Dry Fork, Huzzah, and Courtois creeks. Evidence ~{as also obtained which
indicated that the Dry Fork Creek basin supplies water to :Herarnec Spring.
22
III. LABORATORY STUDIES
On the basis of the findings of the review of literature, it was
decide.d to use dye as the tracer and a modified form of the Dunn (5)
procedure as the tracing method. The Dunn method involves th€ addition
of fluorescein to the flow of \vater being traced, ccncentration of the
dye on packets containing activated carbon at the suspected sites of
energence, extraction from the carbon with a solution of 5 per cent
potassium hydroxide in ethyl alcohol, and visual detection of the tracer,
if j)resent, as a green residue on the carbon surface. The use of t'I•W
other clyes, Rhodamine B and Rhodamir:e ~·IT, and several adeorbing :naterials
and extracting solvents was investigated in order to develop an appropri-
ate. proeedure for tracing studies in kars tic areas. The rhodamine dyes
were evaluated because they are frequently used as tracers and are capable
of resisting photochemical decomposition. Cotton, wool, and cellophane
uere recommended as adsorbents by a representative of DuPont (26).
Ethyl alcohol was evaluated as an extracting material because of its
known solvent properties, while a solutior. of arnmonium hydY.:oxide in ethyl
alcohol had been recommended (26) 2.s an appropriate extracting material
for rhodamine dyes.
Laboratory studies '1-Jere performed in ordE:r to find a ::nethod which
\vould he c.&pable of detecting a very lm,r concentration of dye \vbile dis
ting11ishing between background material interfer,;:-nce and dye; and to
select the material >vhich would best adso:cb and retain each Jye <ind the
solvent which uould best extract each dye fr.:lm the best adsorbiag ;nat:erial.

23
Column studies \vere also carried out to dcte~7,nir:e ho1..r the dyes 1-;ould he
affected by media encountered in the field area.
A. EVALUATION OF DETECTION HETHODS
Vj_sual and instrumental detection methods were investigated. The
general test procedure employed when activated carbon*, 'Jool, and cot ton
were tested consisted of pouring, within a 30 second period, one liter
of a dye solution of knm..rn concentration through a fiberglass packet
(3 inches by 2 inches) containing the adsorbent. Six grams of carbon
and a quantity of wool or cotton sufficient to fill the pack~t ,.,ere em-
ployed. The packet was ~vashed \dth tap Hater before and after the dye
solution \vas passed through it. The adsorbent 111as ~he"1 ;:emoved from the
packet and was placed in a 100 Nl beaker where it was extracted with
60 ml of a 5 per cent solution of potassium hydroxide in ethyl alcohol.
In all tests, •.)nly part of the dye poured through the adsorbent \vas
::d~orbed. Hhen cctlophane was used, a 2 inch by 3 inch strip ~::1s f:O.?.k~d
for one hour in a beaker containing the dye solution; the cellophane was
tben v.rash<~d with tap 1vater and observed. The fluor~sccEce of natural
background m.:t terial \\ras c!ei.:ermined by placing a carbon p.:1.ckct in a
stream or spr·ing for 24 hours and then E.xtra~t.tng as previously out-
lined.
*Cliffchar, .+ x 10 mesh, a product of tl:e Cli1~fs Do~.- Chco:nLcal CG!:!p;;;ny,
Harquette, ;1ichigan.

Visual dct~ction of * fluoresc.:in , ** *** Rhod<wline 13 , Dr:.J Rhodmnine \.JT
was investi,-:;2ted folloHing extra::::tion uith a 5 per cent solntion of potas-
sium hydroxide in ethyl alcohol for a 30 minute period. Detection by
color was attained by observing the solvent and colored reaidue formed
an the surface of the adsorbent under natural light. D2tection by fluo-
**:'<* rescence was accomplished by observing under ultraviolet light.
Hhen cellophane \vas used visual detection was made by observing its color.
The results of these tests are shm-m in Table 3. Visual dP.tection of the
dye uas classified as very good, the extracted dye cuuld be seen covering
all of the adsorbent and ~v-ell dispersed throu8hout the extr,1cLing solvent;
good, a definite residue of extracted dye could be seen on most of the
adsorbent; slight, the extracted dye ~·;as barely visible on the. adsorbent
but cculd be disting'..Iislled when ccmpa!.·ed to a blank samrle; and none, no
dye was visible. Evaluation of the results shown i~ T~ble 3 indicated
that activated carbon uas the best adsorbent to use with visual detection
of the dye in natural light, and ~vas follm,1 ed by ;vcol, cotton, and cello-
phane; also that fluorescein and Rhodamine WT were the be~t Jyes. The lowest
amount cf fluorescein (the best dye) that needed to be p~ssed through
* Uranine (sodlu~ fluorescein), U.S.P. grndc, purch2sed from the Fisher Scientific Company, St. Louis, Hissouri.
** the Special e;rade for tu:1gsten de'.::er:ninati_ons, purch,::sed from Fisher Sci2ntif-!c r'0111!,),:llly.
*'i~* Twency per cent solution, a product of E. I. du rant de ~emours and Cowr~my, purcha~eu from Kestone P.niliPe, C~L~.:1go, Ill-inois.
,·~-;:** Hiac-raJ ighc, rnod~l No. UVSL-13, a prcduLt o£ UL TI:~L-VIOLET PRODUCTS,
INC., San Gi~~iel, Californi3,

TABLE 3
VISUAL DETEC~ION OF DYE
------r--- Ar::.ount of dye passed through adsorbent (mg)
DEtection under
~!atural -, U.;:;,.aviolct Dye I Adsorbent
----·---
Activated Carbon
light light ------- ... --·- -- -··---
10 5 1
0.1 0.01
* very good good none good
slight none
Fluoresceir.:f-----
, ________ _
r..hodamine B
not Hool ----~~~---·-I--- ~~~: _j t- ~ invcsti-
Cotton I 100 sliP,ht gated __ ____ 1~.0 none
;~1 i~2_l~n~-f--J~~:=-=-~---~~- f Activated 5 1 slisht
Carbon 1 none slight
~- Hool
L~otton
0.1 none
100 ~ood 10 ~one not
-------- .. ----- -::-~ 100 I slight
10 none
invc.:"ti-gated ·-r----------
___ JQQ ____ j ____ non_;L __ ----------
10 ! very good 5 ;;ood 1 none
Ac..:ivated carbon I
I 0.1 I 0.01
good slight
none Rhodc.mine HT --------·-r----- ----· --- --- -----------
~-;::::n--+~;~ -t s;;;;, -i i~~;hi-_______ tce~l£J2lt:l~~-=-- ~~~~- --~lq_~c~ -~-
*For J,~finit.i..on of these characterizaticn terms see p. 24.
?!: -..J

26
activated carbon (the best adsorbent) ~·ms found to be between 1 and 5 mg.
Only activated carbon ~vas used \vhen detection by fluorescence \.;>as studied.
Fluorescein vas again found to be the best dye and could be detected ~vhen
quantities as l5_ttle as 100 J18 had been passed through the ca-::-bon packet.
It was found, however, that the fluorescence of the extracted background
material was the sam~ as that of fluores<::ein txcept for a slight difference
in color shade; background material could not be distinguished from fluo-
rescein ~.Jhen a quantity of the dye less than one mg had been passed through
the carbon packet.
Evaporation of the extracting solution and visual observation of the
residue were also investigated. The supernatant of extracted activated
carbon samples through which fluorescein had been passed wns poured into
a porcslain evaporating dish and heated to dryness on a water bath; fluo-
rescein vms detected by its distinct red pm.·der fonn. 'l'he results of this
test were as follows:
Amount of fluorescein passed -~1r·::!:-_t_G__i~t]::..e.__E~~~:..:-i.va 1.:ed carbon:__ (mg)
10
5
1
Visual detection of residue -----------------
good
none
none
The 10\vest quantity of fluoi.-escein th:lt could be detected 1·ldS between
5 .::md 10 me. Evaporation of the smr,plcs took a considerable ar.wunt of
time and dJ.d not pe~:mit the visual detection of dye at a lN.·er concentra-
tion than the direct methods previously evaluated.

27
Since small enough quantities of dye could not be detected by visual
methods without interference from background material, detection by means
of a spectrophotometer was investigated. A Hitachi Perkin-Elmer spectre
* photometer was used in these studies. The peak absorption wavelengths of
fluorescein and rhodamine have been reported to be 496 and 556 mu, respec-
tively (6). In order to eva.luate the interference by natural background
material, the per cent transmittance over an appropriate range of wave-
lengths 1..;as determinec for several sa~ples of fluorescein and Rhodamine WT
and background maLerial extracted from activated carbon with a S per cent
solution of potassium or amn1onium hydroxide in ethyl alcohol. Samples
obtained by extracting fresh activated carbon with the corresponding sol-
V'=nt were used to set the transmittance at 100 per cent. The l.·esults of
this test are plotted in Figure 2. It was found that fluorescein and
Rhodamine WT could be detected ~vith this instrument at the optimum wave-
lengths of 500 and 545 mu, and that background material did not interfere.
The minimum quantity of dye that had to be passed through t:he carbon for
detection with this instrument \vas estimated to be bet~"een 1 and 5 mg for
fluorescein and 20 and 50 mg for Rhodamine l·rr. Ammoniurr. hydroxide was
found to extract Rhodamine WT better than potassium hydroxide.
Because the spectrophotometer required concentration of relatively
** large quantities of tracer on the activated carbon, a Turner fluorometer
was borrowed from the United States Geological Survey, Hater Resources
* Model 139, U\T-VIS spectrophotometer, a product of the Coleman Instrument Corporation, Haywood, Illinois.
**Hodel III, a product c£ G. K. Turner Associates, Palo Alto, California.

r-j-----, r· ----, i I
l I
G----o-__ /f( / ! r==t---::- o----e
I I I I 1of
i 9C~
I
'j~ / I
lmg / j
5\g. ·'/ 'I
i 20mg ! I ! i I
~1 I
80""'
70': I
I I .--, I
~ . '-" 601
Q./ i
d
I i ----&- :1 ,:_.-Jp-
1
I
u I ~ . \ -·~ I ~ SO~ Background and lOmg I
·1 40 ~ I
! I i
I I
I I I
~ i I i I I 30i- I
.e---~
lOOmg
\ lun:.e.ss othenvis·~ noted, samples extracted l 2 ~ 1~h·or.1 C<:Jl"uO:J. with a 5% solution of KOH in I
0 J ethyl a.lr:ohol. _I
.50mg
I . I : I
10 ~ FlEorescein I j Rhodmnine Fr I I ' I ~ I L___ __, __ _j I ! I I I
0 4;5 485---z+"95 505 515 525 510 520 550 560
~{avelength (mp)
FIGURE 2
SPECTROPHOTOHETRIC DETZCTION OF DYE
I
I
~ I I
l I
(extraction Tl
with 51~ NH401~ in ethyl 1
alcohol) I I
l J
I
~ 570 580
N en

29
Division, in Rolla, l:1issouri. This instrument, made specifically for
fluorescent dye detection, had not been previously available for use in
this investigation. It was equipped with a far-ultraviolet light source
~rhich emitted light through a primary filter; t:he light then passed through
the sample, a sec~ndary filter, and a phototube which imparted a signal
to a calibrated dial on top of the instrument. ln all tests run with the
fluorometer, a rhodamine filter set was used with a primary filter wave
length transrn~ttence of 546 m~ and a aecondary filter wavelength trans
mittence of 590 m~; these were the only filters available. Fluorescein
could be detected at low concentrations tvith these filters, but use of
specific fluorescein filters would have given detection at l•Y>Ver concen
trations. The f lucrometer -,as also equipped tvith a high sensitivity "door
kit" which consisted of a sliding plate with different size holes in it so
that the sensitivity could be increased by factors of 3, 10, and 30 times.
The extracted samples of fluorescein, background material, a~d extracting
solution tvere poured into a cuvet tvhich was placed in the door holder of
the fluorometer, and a reading \-.Tas obtained on the dial after the door
had been closed for one minute. This instrument could be calibrated using
a blaek cuvet ,.;hich did not transr:,it light and adjusting the dial reading
to zero (no fluorescence). The concentration of dye in a sample could
be obtained from the dial reading by means of an appropriate calibration
curve. The results of dye detection tests using the Turner fluorometer
are shovm in Table 4. It was found that the extracting naterial exhibited
little equivalent fluorescence, quantities of fluorescein as small
~s 50 lJ8 passed through a carbon packet could be detected over back-

·nl3:.E 4
FLUOJ\O:~~·:TP,IC DETEC'l'JGN OF FLUORESCEIN
SdmDle
f---··-----i Etl1yl alcohol (C 2H50H)
I 5% KOH j n C1 R:OH : ~ ..1
I 5% KO!'c in Czl1r::OH I J I through carbon. packet
Nat t:l_·a 1 ;Jackgrot;ncl materia 1 fro;,, Dry i:<'ork U~B'M-DF)
N:F1-DT<' + fluorescein
NJ'$[·1-Di<' + fluorescein
Flu0n~scein
-( =r--· ! Dye ;-as sed Equi valent 1 through carbon fluorescence
packet (pg) (pg) i (as fluorescein)
I '
I -- ! 0.1 I 1
I -- I 1.3 0.7
I
4.8
I 50 7.8 ! 100
I 100
21.6
3.5
,---------, I ; ! Recovery I I of
I dye · j - (%) !
I I I I I I I I
6. o~'<'
16.8
3.5 I
I N:3:v1-Dii' + fluorescein I 1000 26.4 I 2.2 l , I
L :~m1-DF + fluoresceir, I
2000 ' - _l__ _ 48.6 __ L2.2 __ J *Computed as:
I (7 .8 - 4 .8) X -:s=o-- X 100 :=r 6 .0/o
w 0

31
ground material, and the per cent recovery of fluoresceil1 Fas not constant
but decreased with increasing quantities (in excess of 100 ~g) passed
through the carbon. The Turner fluorometec was the 1nost sensitive de
tecting device availnble and was, therefore, e...mployed in the renaining
parts of this investigation.
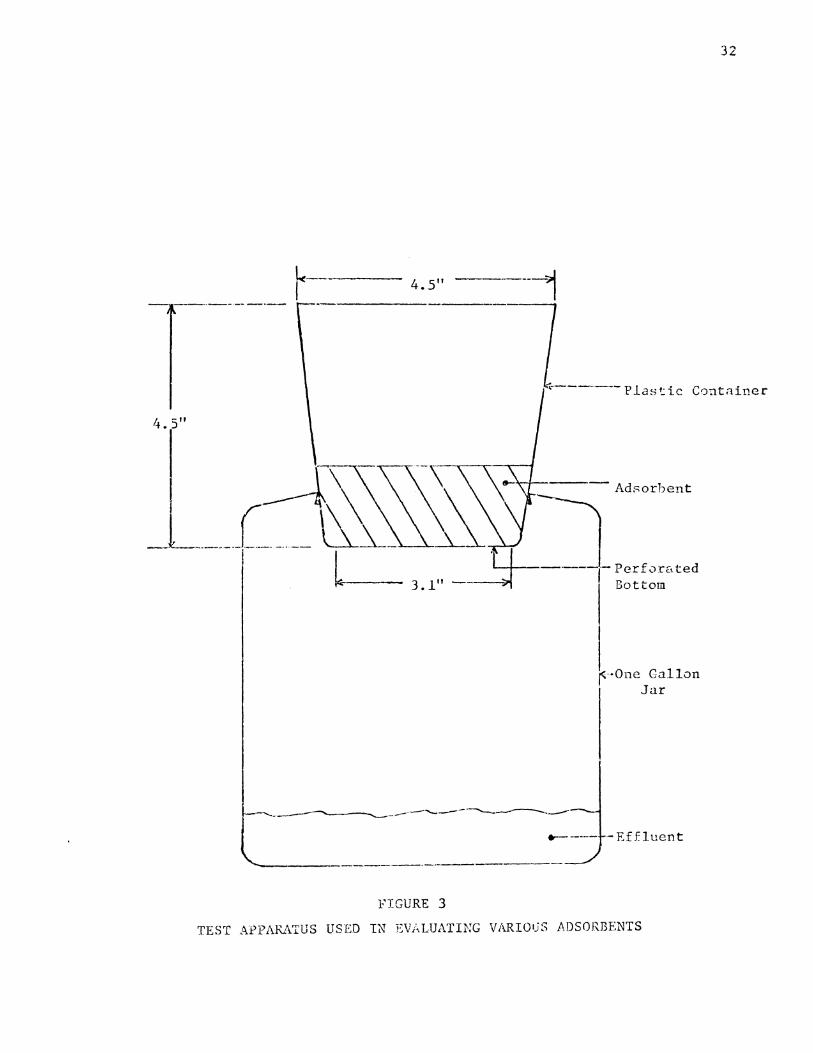
B. EVALUATION OF VARIOUS ADSORBENTS
The ability of activated carbon, ,,mol, a.nd cotton to adsorb each of
the three dyes \vas evaluated in these studies \vhich were co11ducted using
the test apparatus shown in Figure 3. The general procedure employed in
these tests co~sisted of placing the adsorbent in the perforated bottomed
plastic container, pLll:ing the container on top of the one 3allon jar, and
pouring one liter of a dye solution of knov;-n cow::entration through the
adsorbent in a pericd of exactly one minute. The dye solution in the plas
tic container formed an air-·tight seal around the mouth of the gallon jar
which after eqr.Iilization c•f pressure prevented flm1 i1:to the j.:1r; by
br-eaking this seal as needed, the flm1rate could be cor1t:::olled. The ad
sorbent was washed with tap water before and after the adsorption of the
trac:er and the u~.ed \.Ja:::h-;.,rater was discarded. The dye Has extracted from
the adsorbent w:i.th a 5 ?er cent solution of potassium hydroxide in ethyl
alcohol. The concentration of the dye in the initial solution, in the
solution after it h.:1ci passed through tlte adsorbent, and in the extracting
solvent after it had been used to extract the carbon was determined using
the fhwronu2tcr (a 30x sensitivity "'as eoployed). Calib-c·ation curves
were developed for each dye in water solution and in potassium hydroxide
ethyl alcohol solution.
4.5"
32
4.5" ·-----,
·-------Plastic Container
---Adsorbent
"---+-~Perf orated Bottom
f·One Callan Jar
t ----------------~--~-..------
------~-~-
-Effluent
FIGURE 3
TEST APPARATUS USED IN EVi'-LUATU;G VARIOr..TS i\DSORBENTS

33
Sixty grams of activated carbon forming a 3 inch thick layer were
employed and the carbon 'vas extracted wii:h 500 ml of extracting solvent.
Two layers of wool cloth (each 3.4 inches in diameter ;Jnd 0.1 inch thick)
or a layer of cotton (0.5 inch thick) were used and extracted with JOO ml
of extracting solution. The results of these studies are presented in
Table 5. The amount of dye adsorbed on each afsorbent i.:; rep')rted in this
table along with the portion of the adsorbed dye ,.,;rhich could be extracted
from the adsorbe~t. The total dye recovery (per cent adsorbed times per
cent extracted) is also given ln this table in order to facilitate the
evalu;.;.t5_on of the three materials. ActivateJ carbcn \-ras fovnd to be the
bE'st adsorbent to use Hith all dyes, and Rhodamine B '..ras the dye '..rhich
was a2sorbed to the greatest extent; however, significantly greater amounts
of adsorbed fluorescein and Rhodamine liT could be extracted from the carbon.
\.J'hen total dye recovery is considered, the combination of flu.orescein and
activated carbon -.;..rould give the best results :i.n tracing vmrk \-lith the ex
tracting sol·.rent used; the rhodamine dyes were more efficj_en.tly adsorbed
on the activated carbon and could prove better to use if a solvent were
fcund which ~vc\:ld give a more efficient extraction.
C. E'lALUA'L'lON OF VARIOUS EXTRACTING SOLVENTS
These tests were run in order to find the best solvent to use in
extracting each dye from the activated ca~bon. The general procedure and
apparatus used in these studies were the same as those previously de
scTibed for thP. .:tdsorbent ev.:1luation studies. Howeve.r, after passing the
dye through the adsorbent layer (100 gr3.ms of ac:tivated carbon) in the
plastic container, the carbon \vas \vasLed with tr,:.p ,.;ater and placed into

TABLE 5
EVALUATION 0:.' VARIOUS ADSORBENTS
r---·--·
I T
I
t: : ~ Dye Adsorbent
I j·------+~-Ac.t:iv.::tted _J
I Ca . .:-bon
I i I I I I j I Fluorescein! l>ool ; 1,420 1
328o0 I 23o1 i 9o50 1 2o90 I Oo67 I
! [ Cotton 11,840 I 431<o0 l 23o6 I 1UO I 3o30 I Oo7G I I 44o0 I 95o5 i 0.15 I Oo35 I 0033 I
--l Ad~;orbe Dye 1
~---'
.d ! Extracted ~' n d !-------r------' . -· r~.ecovere
().lg) I (/~) I (;.Jg) (%) (%)
.::::..:::._::..:.:..:::.=-=-=-.--.U::J=-4--814 0 0 I 61. 2 I 300.00 I 37 0 90 23 o10 I
i Activated I I Carbon r-
Rhodamine n I Wool ~·----1 I
~----------~'·~c_.o_t_t~~ I 1' Activa-::ed I 11 I . 1 ' Carbon ! ____ _
I Rhodaliline WT L lloo1 I 23 1 • • • I "" ~ i
~ Cotton I 23 I 7 o4 I 32o~
46
39 ~--------~------~-------~~--- ~ I 20.0 I 51.3 I 0.02 i 0,1C 0.05 l
- I . _j
-~0 2 I _:_o o 7 I o o 08 I o o 30 D.2' i ! 10~ 93o:S I Oo60 I 5o80 5o45
-r-------r-------t--------~1 --------~----~ Oo25 I 3o25 1.08
0.01 1 o.14 I o.o4 J w .;:-.

35
a gallon jar c,.:here it was mixed thorough] y to ob tc..in JS uniform a mixture
as possible. Fifteen grams of the wet carbon \-Jere transferred to each of
five 100 ml beakers, and different extractinG solvents Here added to each
beaker to give a t:otal volume of 30 ml. The carbon was extracted for one
hour and then the f:;olvent containing the extracted dye -.;as p0ured thrvugh
a ~iberglass screen into another b2aker vlhere it vras allov;ed tc settle for
one hour. The dye concentration in t11e supernatant was ~etermined using
the fluo~orneter and a series of calibration c•trves prepared for various
dyes in the appropriate solvents.
All three dyes were used in these tests and the extracting solvents
evaluated were ethyl alcohol, a 5 per cent solution of potassicill hydroxide
in ethyl alcohol, and a 5 per cent solution of Aim'lcnium hydroxide in ethyl
alcohol. Th-2 results are presented in Table 6. The 5 per cent solution
of potass:5_urn hydroxide in ethyl alcoh0l 1-1as found to be the> best solvent
for fluorescein, while the 5 per cent solution of ammonium hydruxide in
ethyl alcohol was best for rhodamine.
D. EVALIJATIO!:\ OF DYE ADSORPTION m~ NATURAL Hi\TERIALS IN THE FIELD AREA
Dye adsorption on different materials encountered in the field area
throus;h \vhich the tracer- might have to pass ~oJ;::s determinr::d by means of
labor a tc:ry col1Jmn studi.cs. All three dyes ,,rere ev&.luated in tlE:se tests,
and the fluorometer was used to determine the dye concentration. The
equipment l?mpJ.oyed in th2se studies is sh0~·m in Figure 4. A glass column
(1. 9 inches inside diameter, 2 feet high) equipped with a bottom drain
tube was L1sed and discharred into a vacuum flask connected to an aspirator

TABLE 6
EVALUATION OF VA.'\IOUS !::XTRACTING SOl .. VE~~TS
, Rhcd~~~ne B Rhod~,m;_c~-e_-'!_r __ a Exuacting !?assed :c· t t d I Passed E t d 1 Passed I ,, ~~ . I , h x rae e . , xtrac e
1 h " 1 r<,xtra.ctE:l·
\ So.Lvent ltnroug. tnrougn 1 t rougn ~·----.--i !carbon carbon l carbon 1 I I I (f.lg) (f.lg) I (f.lg) i (%) I (pg) I ().Jg) (%) I I
j Ethyl alcohol (CzHsOH)~ L \ . i 12
~ -· I
5% XH40H ia c2H50H
---1- I I
I I I i . I 0.041 0.~7 I I o.s 0.42 ! O.OL I i
'
I o.oi-0 I 27.6 123. oo 6 I o. 02 0.33 0.7
I I 2.oo I 0.44 7.34 I l 0. 07 11 l____
1.4
5% KOH in c2H50H 5.7
0.0
L·.> o··

37
c
FIGURE 4
EQUIPMENT EHPLOYED IN COLUMN STUDIES

38
setup. A large rubber stopper equipped rdth an air tube T..;ras fitted into
the top of the colum::.1 and 'vas connected to the labora1:ory air supply.
Pressure and vacuum could, therefore, be used to speed up the passage of
the dye solution through the column bed. A circular piece of fiberglass
screen was placed at the bottom of the column to prevent the material in
the column from washing through. In all tests, tha colman ,.;as packed with
one foot of material which consisted of organic and inorganic matter ob-
tained in the field area. The organic matter was a ~ixture of leaves,
t1,rigs, foxtail, <md some clay, while the inorganic rna terial consisted of
sand and grc.vel. Nben organic material wa:s used, 11 inches of inorganic
material 'dere first added to the column followed by one inch of organic
material. The column was fiJ led with approximately 11 inches of inorganic
material, the bed was washed with tap water added to within one inch of
the top of the column, and then drained and allowed to compact. Enough
material was then added to attain the one foot depth and the bed was
rinsed with the same amount of tap water and drained until it 1vas just
dan::p. Two hundred milliliters of a dye solution of an appropriate con-
centration \,ras poured into the column and forced through the bed by air
pressure. When 'tvater began dripping into the collecting flask, suction
~·Jas applied and both pressure and sEction \vere maintained until the dye
solution had passed through the bed. The bed was then ri~seci with 200 ml
,...f .. t d r · r pressure The efflucn·c V.'as filtered through filter ,_._ ~..-ap \va er l!~ e a1 · . •
* paper in order to remove ell of the fi~e material that washed through the
screen and the quantity of dye which passeC: th:cough the column was
deterro1ined.
*Hhatman No. 40, a product of W. & R. Balston, Ltd., England.

39
The results of the column studies are pre0cnted in Table 7. All
three dyes were run through saud, sand and grav2l, ~nd sand, gravel, and
organic material, except Rhodamj_ne B which vas not p.:1ssed through sand,
gravel, and organic matter due t~ ics inahility to pass through sand and
gravel. While Rhodamine B was c:lmost completely adsorbed on sand or sand
and gravel, Rhodamj_ne WT '.vas the least adsorbed on sand and gravel and
fluorescein -was the least adsorbed on sand, grav~l ~ and organic 1naterial.
Rhodamine B was, therefore, considered inappropriate for use in the field
and fluorescein and Rhodamine HT \vere selected as the tracers for the
field studies.

40
TABLE 7
EVALUATION OF DYE ADSORPTION ON NATURAL MATERIALS IN THE FIELD ARFA
·---·---- -------- ---· ---,----··---------·-------------. Dye
Dye Test Material -;~ss~d-.. --[-T.:;~-;-·in ~~~---throu·.,h -------------
~:_~d - ---- colum~ ~g)r~:) -~+-; __ _ Fluorescein 1 Sc:nd and _gravel 1 000 ~ 64 5
~and and gravel and ' --~--67~-0---i organic matter -1
· Rlw~amine~ S~nd-::;;;;::~el=-- 20 - --~:~-: t ::-:: ------------·- ----------------- --------~-------
Rhodamine ~~~;:~_~,:1 ~r~:~=- - 40 -_--;3-
8
4;.--.: :
9----· t' -8~-~~~--.~ ::
1_-·_-_-
j SP.n~-- a~1d ~r:vel ar"d ____________ __j __ ?2'_t><~_l2~~--0~~-ter______ _ ________ _

41
IV. FIELD STUDIES
Field studies were performed in order to evaluate the tracing method
uhic!1. was develo:;:>ed in the laboratory studies and deterv.ine existing direct
flmv connecti0ns bet·ween surface and subsurface waters in the karstic area
studied by Kilgo (3) and Huang (4). This area was selected £or study to
enable correlation of the findings of this investigation with the water
quality characteristics established by Kilgo and Huang.
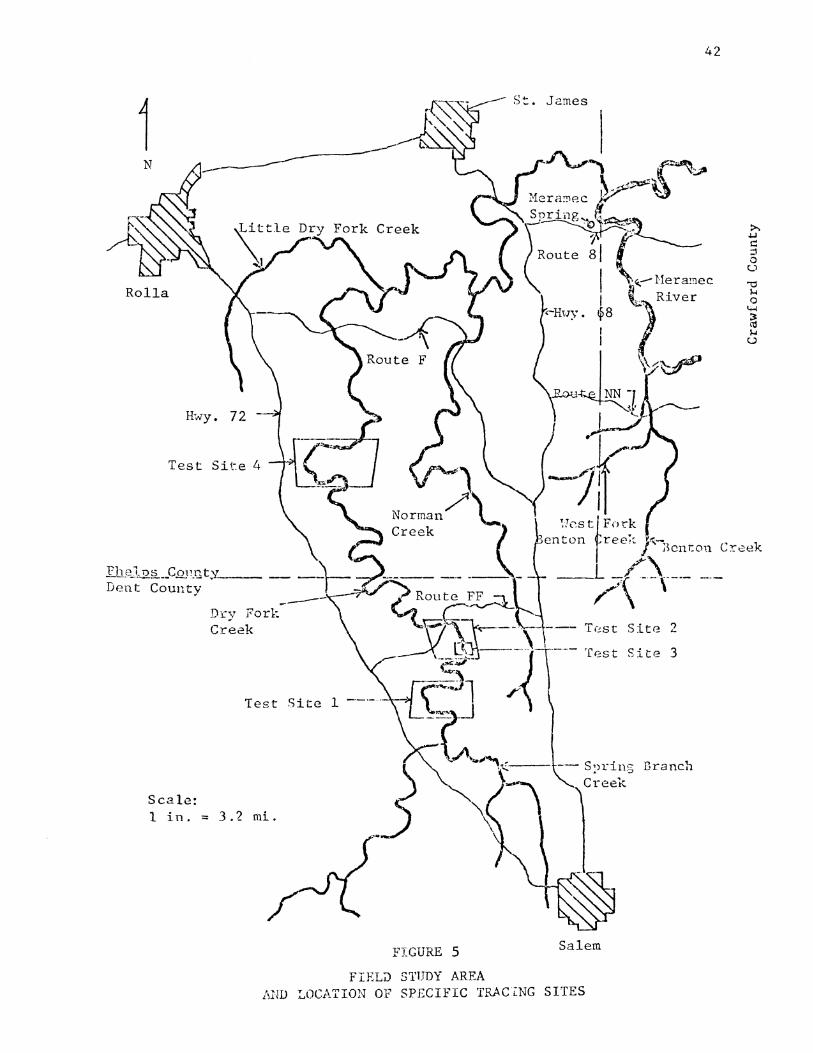
A. FIELD STL~Y AREA
The south central Missouri area employed in field tracing studies
(Figure 5) >vas bounded by the cities of Rolla, St. Jc.:nes, and Salem and
contained three main streams, Dry Fork, Norma::1, and Benton creeks, Meramec
Spring, and other smaller springs. This area is underlain with carbonat:e
rock containing solution channels and cavities. The main area used for
tracing studies was the upper Dry Fork Creek basin and was chosen because
of the :.tntermittent flow of the creek and reports of sinking stream flow
received from local residents (27, 28, 29).
During the sur.nner of 1967, the creeks and springs in the study area
were thorougl1ly scrutinized in conjunction with topographic and ground
water level maps in order to find appropriate sites where tracing tests
could be perfonned. Four specific test sites w·ere selected (Figures 5
and 6) where an abnormally fast rate of sinking ,.;rater was observed.
Sites 1, 2, and 3 were selected at the end of the summer in 1967 and
site 4 was chosen in the following spring. Permission was obtained from
the o-vmers of the property in these areas to perfonn tracing tests.
42
i N
Rolla
Test Si1.~e 4
reei~ 'Iknton Cr~ek
Fh~} . .Q§.. __ Cm!.uty_ ______ _
Dent County /(\-----Dry Fork Creek Test Site 2
Site 3
Test Site 1 ---·-···
:_--1--- S:n·ing Branch Creek
Scale: 1 in. == 3.2 mi.
FIGURE 5 Salem
FIELiJ STUDY AREA AND ~OCATION OF SPECIFIC TRACiNG SITES

1 N
43
----------------------------------,
(-~-=~~ ~ _ -Stc.-.1 :sr·d~ ---- ....... ~..;:,- '"--~ • ,_/ ~ .. 1. .,P: .-.- - --....;~:; - "'-'= .• _., ... ::_- ./"\,---·----
----- 1' ~---~ ) --~~=--) 2 1 - Dry Fork 1
Creek x - Constriction 0- Test Hell
Scale:
~ 1 in. = 0. 33 mi.
.,.- --~ Flow -~--~ ---- _s:::====~J)
~----------- -----------------~
1 N
Scale: ~ in. ~~ 0.67
t:<! -----
Highv..'ay FF
Site 2 ------
1 Scale:
N
~ l in. ~ 0.04 mi.
\:!;·\~.,. ... - BroV..'11 C) d
><- t.O ~
Dry Fork Creek
't~-~ (l) ....., (l) c:
~:.J.I) .:s F1ovl \ 0'1 t}!
-<h~- Small } v Spr:i.ngs
Hole /t.
\
( Site 3
1------------------------------------
N
Scale:
1 in. 0. 5 mi.
__ §.H_g~ ·--------------------------------------------------------FI':;URE 6
TRACING TEST SITES IN UPPER DRY FORK CREEK BASIN

Site l was chosen because it was noticed that water was flowing into the
area but no water was flowing out of it. The water flowing into this
area came from Spring Branch Creek and its flor,; in the Dry Fork Cree'K bed
terminated intermittently either a few hundred feet before or a fe1-1 hun
dred feet after the steel bridge (Figure 6). Two test wells were dug in
order to check umlerflo\v in the creek bed. UnderflovJ was found one foot
belm._r the surface of the creek bed in \vell 1 but ,,·as not found belmv the
creek bed in well 2 even though this well was dug to a 5 foot depth.
Site 2 was selected because of the extremely fast rate of sinking water
noticed east of the lm.;r water bridge after flm.,r had stopped u-;1der the
b:cidge (Figm:e 6). At the time of this obser•/ation, a 20 foot deep exca
V2tlon was being dug in the creek bed by the Missouri Highway Department
fur a br~dge ~ier 150 feet downstream from the bridge; no unJ~rflow was
found in th:i.s ~;xcavation. Site 3 1v-as located \vithin site 2 and \vas cho-
sen because water f~om a ponded area supplied by Brown Spring appeared to
be floving through a sand and gravel deposit and enrerge fro:n c'eeps in the
Dry fork Creek bank; in addition, the water in the ponrled area was noticed
t.o sink to the:. ;;rour:.d at tvo points. Sr~V(oral reasors cont;~i.buted to the
selection of site 4, including the fast rate of sinking water observed in
the Dry Fork Creek bed \·Jherc the cret!k flm·ied. nga.L1st large rock bluffs
(Figure 6) and the fact that Harrison Spring, \vhich \vas located on the
other side of t"he l:ill b::::bind the rock bluffs at ::Jn e.lE:Vation approxi
m2.tely 20 f ect lm,rer, £lo\\'cd pe"t'ennially.
B. FIELD TRACING HETHOD
The tracing method used in the field studies was selected on the
basis of findings of the laboratory stLdies and generally consisted of

45
the addition of the tracer (fluorescein or PJ10damine lvf) at a suspected
locaLion of sinking water, concentration of the dye on activated carbon
packets placed at the anticipated emergence points, extraction from the
carbon with an alkali-alcohol solvent, and determination of its concen
tration by ~eans of the Turner fluorometer. Each carbon packet consisted
of a piece of fiberglass screen, approximately 5 inches long and 3 inches
wide, folded in half lengthwise ~nd stapled together on th~ee sides with
a section of plastic tubing inserted at the fold. The other side of the
pac:,_et ~.;as se-;-1n together ':.;ith a piece of flexible wire lvhich could easily
be rern0ved and replaced. Six grams of activated carbon \-Jere placed in
each packet. The carbon packets were held in place at the various check
points with coat hanger wire bent to an appropriate shape. The wire was
forced into the bottom of the stream bed, except at the Heramec Spring
run v..-here because of the high velocity of the flouing Hater the l.Jire 'vas
attached to a metal rod driven into the bed of the S!_Jring run. The plas
tic tubing part of the packet could easily be slipped on and off the coat
hange.L wiro.?. without removing the wire fror!l the watt.~r.
Before the tracer was added, the natural fluorescenr.c of the ~·Tater
was dr::termined by n~e<ms of eontrol pRckets 'vhich were placed at the various
eheck points and left in the flow for a period of time equal to that em
ployed with the test packets. Fluorescein was added in solution up to
about oue-half pound quantities, ~,Jhile greater quantities \vere added by
sprinkling d1e dye into the water in its powder form because of difficulties
encountert:!d in mixin;; large quanti ties of the dye with ~.;tater. This tracer
was introduced to the water after the sun bad set in order to protect it
against photochemical degradation. A high rate of photochemical decay

46
has been reported for fluorescein in the literature (6). Rl10damine HT
was always added in solution form.
After a carbon packet hac been in the ,.;ater for an appropriate length
of time, it was removed and replaced with a fresh one. The used packet
was brought back to the laboratory ~.rhere it '"2.s Hashed off tl';oroughly
with tap water. The carbon was then transferred into a 100 ml beaker and
60 ml of the extracting solvent was added. After extraction for one hour,
the carbon-solvent mixture was stirred a;1d transferred through a fiber-
glass screen (:1sed to ::emove the coarse c'lrbon l;drtic.les) into a 50 ml
beaker where the solvent containing the extracted ciye was allowed to stand
for an hour in order to enable the remaining carbon particles to settle.
The concentration of the rlye in the solvent was then Jetermined using the
Turner fluorometer. When fluorescein was employed, the extracting pro-
cedure was carried out at room temperature; how2ver, '"hen Rhodamine WT
was used, extraction was performed in a col~ roofl (6°C). This was de-
sirable because the fluorescence of rhodamine decrease.:'<* with increased
ternperature and a much higher fluoroncter reading could be 1Jb tained Hith
a cold silmple.
Carbon pack<=ts were identified by an <lppropriate number consisting
of two parts, the first indicating the test site and the second the exact
location. Control packets were designated by t:,e letter C and long-term
packets (those left in the water for periods longer than normal) by the
l~tter L. A tag bearing the appropriate identification r.itmber Has attached
to each packet.
*Reduction in fluorescence as high as 2 pee cent has be~t reported to occur for every deg;~ee centigrade rise i:1 tempera turc (6) •

47
C. PRELIHINARY FIELD STUDIES
The first field tracing test was performed in test site 3 and its
purpose was to investigate the ability of fluorescein to penetra~e a sand
and gravel deposit through which the water o£ Brot.Jr.. Spring 'I:.Jas thought to
flow, and to evaluate the activated-carbon-packet method of t:racing. This
test was comlucted before the laboratory evaluett:lon of dyes and dye trac
ing methods had been completed. The tt·acing method used in this test dif
fered from the method previously described (see section B) in that no
control packets were used to obtain background fluorescence and the carbon
samples were extracted for 30 minutes in porcelain evaporating djsl;es '..Tith
the dye visu8.lly detected under ultraviolet light.
Before dye Has added to the spring water, da.ms built by Deavers at
each end of the ponded area (Figure 7) were dug out in ord~r to lower the
water level in the pond. The beaver dam at the north end of the pond
was r~;"!built and another dam was constructed further dm.;n the north end
c.hannP.l, A V··notch weir \·Tas inserted in the south end channel and driven
to water leveL The. flow through the weir \·ms allm-;ed to equalize for
a period of one hour and then measured by colle~ting the water in a gallon
jar and noting the time it took to fill the jar; this flow \o:as found to
be apprm:irnat2ly 1-f5 gpm. The floH of water from the main sr;C:j> (Fi;ure 8a)
was also me~~ured bv collecting it in a gallon jar and fou~d to be one
8?U1· Becaus~ the '.rater level in the por-d v.ras l::n.Jer than the eL:.\Tation
of the channel connecting the pond '"ith the hole at the sout~·~ea3t end
(Figure 7), no wat 8 r ap1-1eared to be draining through this hole. :3ecause
of physical obstaclea (Figure 8b), the flow of Brown Spring could not

\
\
\ \
Flow
FIGURE 7
t--1 ~
I ;< I J I
I I I I
I I ~ .-I
I C""l
Beaver Dam
48
1
•f)
0
~ 1:--:3rm.;n Spring
r:.> bO (1j p... (\) (\)
U'l
~ ~ i:A
t::1
rj s f' 1''
0 H0le
~ ~ ~ U'l
s.'lall Springs
\\-Dry Fork Creek
\ \
Scale: 1 in. = 0.017 mi.
LOCATION 0~ CHECK POINTS IN TEST SITE 3

a. Main Seep Area
b. Brown Spring
FIGURE 8
TEST SITE 3
49

50
be measured; hm-1ever, in a publication by the Hissouri G~ol,)gical Survey (30)
the flow of this spring was reported to be 62.8 gpm. Therefore, if the
latter value were still correct, the ponded area must have been losing
water by s1ilisur£Jce discharge as originally was suspected. Carbon packets
were placed at check points 3-1 through 3-11, 3-15, and 3-17 (Figure 7).
A quantity of 0.794 g~arns of fluorescein was added as a solutio~ to the
flmv of th2 spring a;.1d the south end of the ponded area was quickly dar:J-
med up in order to keep all the water and dye iu the pond and hopefully
force the tra.:::er through the sand and grovel deposit and through the seeps
into the cree.:<., Since th2 v:ater level in the pond l1ad been lmvt"~.red be-
fo:!.:'e the dams w·~re rebuilt, the dye Has retained in the pond for a long~:.r
period.
The results obtained in the first i:\vO da)'S follmdng -::he a0di ti on of
dy~ indicated that a high concentration of fluorescent naterial had passed
through the packets at all check points, exee~t 3--17; hm-;ever, the \Hter
':vas not flm·Jing at that point because of the dam. Since J.arsc c:_uantities
of dya appcarecl to be coming through into the Dry Fork Cre2k but only a
sriall amount had beer. Jdded, a packet Has Dlaced a feH miles rjmms tr emP
(ch2ck point 1155, Figure 9) and ah0ther was placed just upstream of the
test area (c"h,;ck point 3-6C, Figure 7). ~Jnrortunate]y, the clam at the
north end of the ponded area brok~ through at the ~nd of the second day
of the test and the \·Jater from Brmm Sp~:i.ng sta-::ted flowing into Dry
For1~ Creek from this end. It ·vas belL2vcd, hc;'.-:ever, th<?.t this ,.,ould not
invalidate the te.st since o.ll of the test packets, e:~ccpt number 1155,
\vere loc~ted upstream frou the point Hller2 the SIJril~g v.·ater \WS runnjng

51
1 St. James
Little Dry Fork Creek
Rolla
I I
)--../ 11105 7115
Wes· ·1 I · 7120
Phelps C -- ounty Dent -c--ounty ___ -- --
Scale: 1 in. ==
Check ,.. 0 · P 1Ut r: b corresucnd lt'rr: ers P
~ • to sampl" o_nt.s crp· 1 lng ; h. .t) .oyed ,·v H ... n , ,_, u J uar:1g
~-· ,,rater s tud:tes. q·,1ality
3. 2 !l1i.
· '- - ork Be.r.to ,. . ..-Benton
·--- --- '+12" Jn~C~eeri'-C - -- ::J reck
155
- 1156
(4)
€.;. --- .... ( opring
l
Branch Creek
Salem
FIGURE 9
CHECK PO INTS IN 'fi-l.E · - FIELD AREA
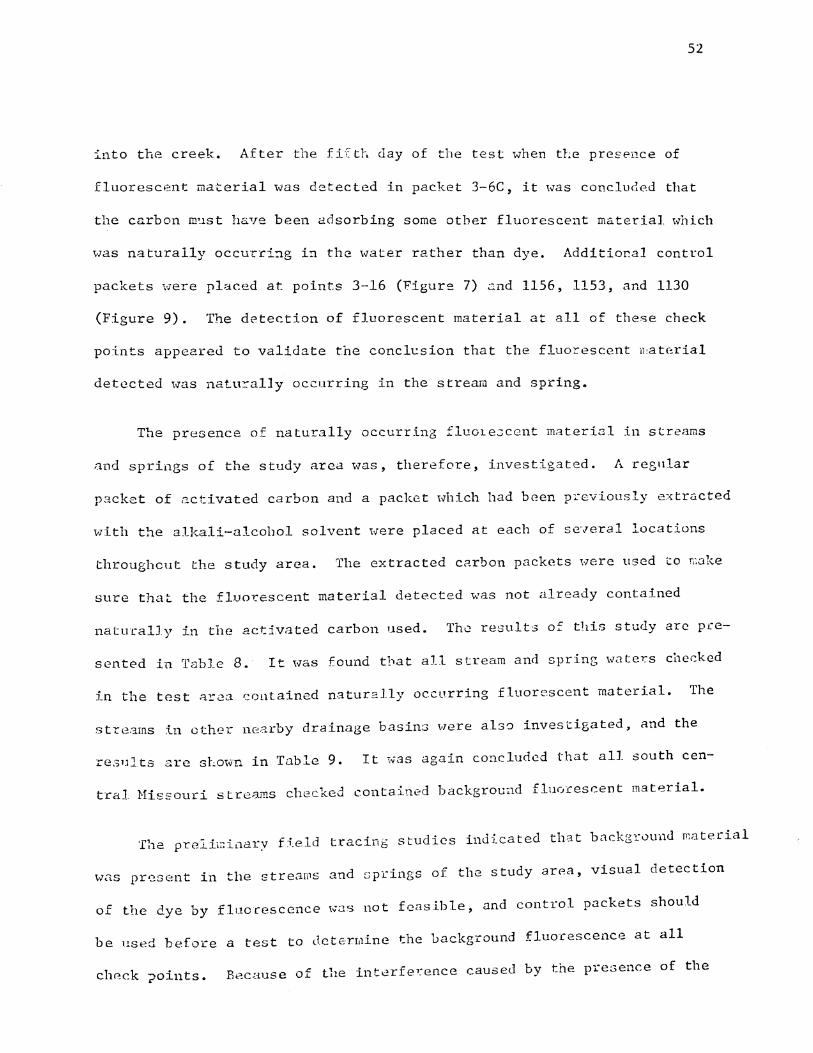
52
into the creek. After the fifth day of the test when the presence of
fluorescent material was detected in packet 3-6C, it was concluded tl1at
the carbon m•1st have been adsorbing some other fluorescent material w·hich
was naturally occurri~g in the water rather than dye. Additional control
packets were placed at points 3-16 (Figure 7) and 1156, 1153, and 1130
(Figure 9). The detection of fluorescent material at all of these check
points appee.retl to validate the conclt.:sion that the fluorescent n,atc:rial
detected was nat:u:cal1y occurring in the stream and spring.
The presence of naturally occurring fluote3cent materiol in streams
and springs of the study area -.;vas, therefore, investigated. A ret;nlar
packet of activated carbon and a packet which had been p~cviously extracted
with the alkali-alcohol solvent were placed at each of se·-reral locations
throughout the study area. The extracted carbon packets were used to ~ake
sure that the fluo~escent material detected was not already contained
naturally in the activated carbon used. The results of ~1is study are pee-
sented in Table 8. It was found that all stream and spring wate~s checked
in the test ara.:1 contained naturally occurring fluorescent material. The
st-rl~a.rns in ot..:hcr nearby drainage basin::; Here als0 investigated, and the
re::;TJlts ~re sLown in Tnble 9. It 1.;-as again concluded that all south cen-
tral HisEouri streams checked contained background fluorescent material.
The preli~inary f~eld tracing studies indicated that background material
- t · ~1 t ~ · ~nd r,p·J.·l·ng·s o.~~-- tl1~ study ar~.a, v1"sual detection V.l<~S pY'.}8 C---!11 1U ""' 1e S r eofPS u. ~ - "---:
of the dye by fluorescence was not feasible, and control packets should
be used before a test to dcte:nline the background fluo·rescence at all
check ?Dints. Because of the interfe,~ence caused by the pre::;ence of the

TABLE 8
BACKGROUND FLUORESCENCE IN THE WATER OF THE CREEKS OF THE STUDY AREA
53
-----·-1··--· -~vi-sua 1 detect i o n-OYTf u o .. res c e n-ce-s t r e am C h e c k * · u n ~_t;;_:t;_ u 1 t r a v ~_?.-~ t 1 i ~~~- _!/_ -----:-----l
point ?\orma1 I Extracted 1------------ _racket packet 116 0 -- + ·-·-- ---'----·--::;::---·-------
Dry Fork Creek
1156 + + 1155 + + 1145 + + 1140 + + 1130 + + 1125 + +
11120 + +
---.--~-------~--Jtm : _____ : ____ _ I L1tt1e Dry Fork 2105 Creek
r-s-p-~ in g -:B-;;;~ c h
I Creek 31.05
+ + --------------- ------- --------i
+ +
-No ~-~~n-------- 412-6 + + 4125 --+----·----+----___ :.!:.._ +
Benton Creek
~.;rest Fork Bsnton Creek ·--·--··-·--·-------------
7120 7115 7110 7105
8105
+ + + + + +
---~=~=-----r-~== : --~---J *Sample points employed by Huang (~) in water quality
studies (see Figure 9). #Detection of background fluorescence: + positive,
·- n.egative.

TABLE 9
BACKGROUND 'FLUORESCENCE IN SOTJTH CENTRAL HISSOURI
r-· Stream I
l 1 Wolff Creek I I Beaver Creek j j Cave
I Little Piney Creek
I Gasconade River I I Bourbeuse River
I Meramec River
I Benton Creek I
I Little Dry Fork Creek I
SURFACE WATERS
1 Visual Detection l Checked at , under uv light* I
Rt. cc I +
Rt. CC l + Rt. CC
I +
Rt. CC + Jerome, Mo. l + Rt. 68 I + Rt. 8 + Rt. NN + Rt. BB +
*Detection of background fluorescence: +positive, -negative.
l,, .4:-
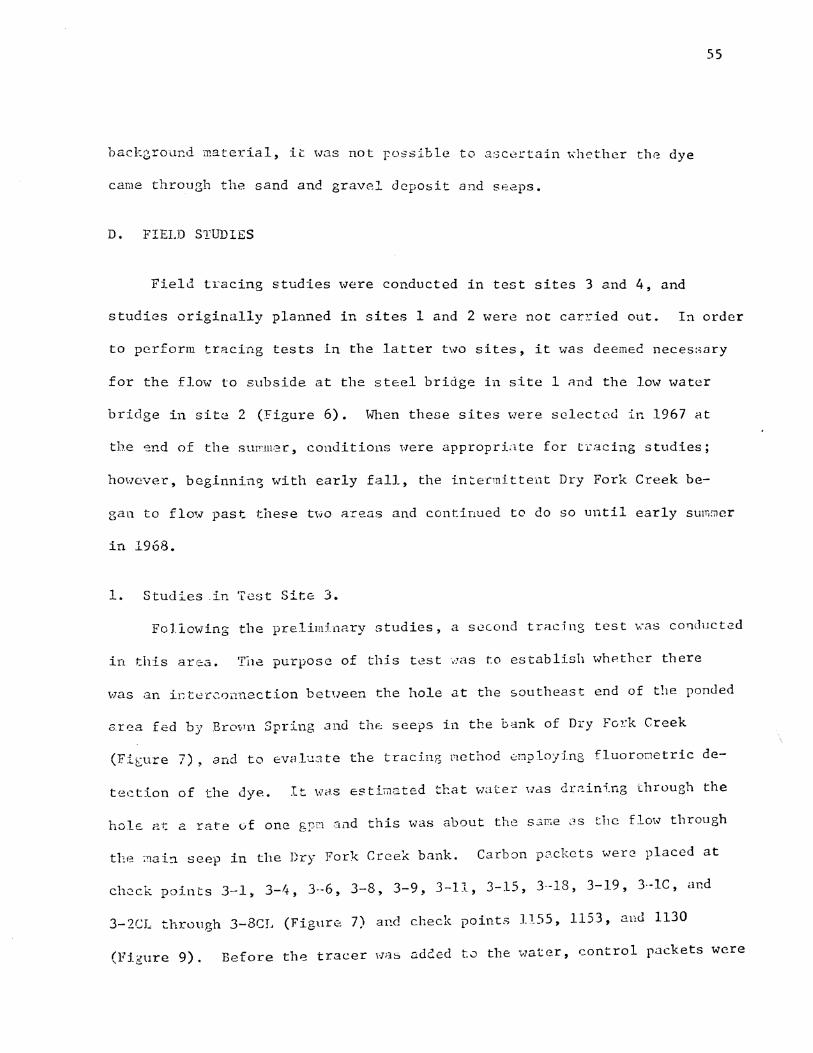
background material, it was not possible to ascertain ~hether the dye
came through the sand and gravel deposit and se~ps.
D. FIELD STUDIES
55
Field tracing studies were conducted in test sites 3 and 4, and
studies originally planned in sites 1 and 2 were not car~ied out. In order
to perform tracing tests in the latter t\..ro sites, it \vas deemed neces:><Jry
for the flow to subside at the steel bridge in site 1 And the low lvater
bridge in site 2 (Figure 6). When these sites \-7ere selected in 1967 at
the end of the surrm.~r, conditions l-rere appropriate for tracing studies;
hmwver, beginning with early fall, the intenni ttent Dry Fork Creek be-
gan to flow past these two areas and continued to do so until early smn!'iler
in 1968.
L Studies in Test Site 3.
Following the preliminary studies, a second tracing test \,·as comlucted
in this area. T'i1e purpose of this test -.. ;as to establish whP.thcr there
\-laS an ir;ter-::onnection betueen the hole at the southeast end of the ponded
a.rca fed by Brov1n Spring and thF..: seeps in the bank of Dry Fo~:k Creek
(Fit::ure 7), a.nd to evaluate the tracing nethod .::mploying fluoronetric de-
tection of the dye. It was estil;1ated tP.at water UdS dr~ini.ng through the
hole. at a rate vf one gpn and this lvas about the saffie as the flm..r through
the ;naict seep in the Dry Fork Creek bank. Carbon p<:1.ckets were placed at
ch;;ck points 3--1, 3-4, 3--6, 3-8, 3-9, 3-11, 3-15, 3--18, 3-19, 3·-lC, and
3-2CL through 3-8CL (Figure 7) and check point;:; 1155, 1153, and 1130
( \:;" · r 9) Before the tracer ,.,a,::; added t.J the -;.1ater, control packets were r J.gu e • _

56
placed at all check points, except 1153 and 1130. Packets at points 3-1,
3-4, 3-6, 3-8, 3-9, 3-11, 3-15, 3-18, and 3-19 were employed to obtain
background fluorescent values for two consecutive pQriods of 16 and 24
hours, respectively. Packets at point 3-lC were used as a control through
out the study, v;hile packets 3-2CL through 3-8CL were used to obtain cum
ulative background fluorescence data for a period of one week. A channel
was excavate.d to pennit the flow of the ponded water to the hole and a
solution containing 5 grams of fluorescein was added to the water flowing
in this channel at a point located 2 feet before the hole (Figure 10).
In addition to the carbon packets used to rletect the emergence of the
tracer, se'J2ral "grab" \·rater samples Here taken during this test ::a de':er
mine whether the dye eoulrl b2 detected withoct prior concentration on
the activated carbon. The results of this test are shown in TaLle 10.
It w&s foun~ that the tracer did not ccme through the various check points,
as e'ridenced by the fairly constar•.t backgrom;d fluorescence values. In
addition~ it was demonstrated that control packets should be placed in
as nea~ly the same flow as the packets being checked because the amount
of ~):::.ckgrounc material adsorbed Has proportioo.al to the floH of 1mter
thro,1gJ: tlv2 p3cket; and that backg1.ound fluorescent material was adsorbed
on the carbon at a fairly consistent rate for periods of up to 4 days.
It was not possible to evaluate the fluorometric detection of the dye in
thiP test since the tracer ciid not ap:;,Jedr to have et.wrged at the check
points employed.
A th_i_rd te.st \vOS also performed in this area i:ind v:as a repeat of the
preliminary test, except thnt a greater quantity of fluorescein was ueed

57
FIGURE 10
HOLE IN GROUND IN TEST SITE 3

58
TABLE 10
FIELD TRACING STUDIES IN TEST SITE 3 FLUORESCEIN INTRODUCED IN WATER DRAINING INTO A HOLE AT THE SOUTHEAST END OF THE BROWN SPRING PONDED AREA
Background Studies Tracing Studies Date
Check 2-27-68 2-28-68 2-29-68 3-1-68 3-2-68 3-3-68 3-4-68 3-5-68 Check paint # TIF* DEC"" TIF DEC TIF DEC TIF DEC TIF DEC TIF DEC TIF DEC TIF DEC point#
(days) ( ].1 g) (days) (J.l g) (days) (].1 g) (days) (J.l g) (days) (J.l g) (days) (J.l g) (days) ( ].1 g) (days) (].1 g)
Blank -- 0.4 -- 0.7 -- 0.4 -- 0. 3 -- 0.4 -- 0.4 -- 0.4 -- 0.3 Blank 1155 0 . 7 4. 1 1 6.0 1 4.2 1 4.8 1 5. 8 1 6. 0 1 5.1 1 3.9 1155 3-19 0. 7 1.5 1 2.1 1 2 . 7 PM/111 1 5 .1 1 2. 7 1 6.0 1 4.2 3-19 3-18 0. 7 0. 9 1 1.5 1 3.4 1 2 . 7 1 2. 3 1 5. 1 1 2.2 1 2.1 3-18 3-15 0. 7 4. 1 1 7.2 FS** --3-11 0. 7 2. 1 1 3. 7 1 2. 8 1 3. 3 1 2. 3 1 3. 3 1 3.3 1 2. 3 3-11 3-9 0. 7 4. 1 1 4. 8 1 4.6 1 4.1 1 3. 7 1 4.4 1 4.4 1 3.9 3-9 3-8 0. 7 3. 3 1 3.9 1 3. 7 1 4.1 1 3.4 1 4. 2 1 4.1 1 3.4 3-8 3-6 0. 7 4.1 1 4.6 1 4.1 1 4.1 1 4.4 1 4.6 1 4.6 1 4.2 3-6 3-4 0. 7 3. 3 1 4. 2 1 3. 7 1 3. 7 1 3.0 1 3.0 1 3.3 1 2.8 3-4
3-1 0. 7 3. 7 1 4.1 1 4.2 1 4.1 1 4.1 1 4.2 1 4.6 1 3.0 3-1 3-lC 21.0 54.0 1 4.4 1 4.4 1 3. 3 1 3.4 1 4.1 1 1 3.3 3-lc 3-2CL 2 4.8 3-2CL 3-3CL 3 9. 6 3-3CL 3-4CL 4 14.4 3-4CL
3-5CL 5 14.3 3-5CL 3-6CL 6 15.6 3-6CL 3-7CL 7 10.2 3-7CL 3-8CL 3-8CL 1153 0.8 3.0 1 2. 7 4 6.0 1153
1130 0.8 3.4 1 3. 7 4 9.0 1130 3-16G+ -- 0.4 3-16G+ 3-lCG -- 0.4 -- 0.6 -- 0.4 3-lCG 3-6G -- 0.3 -- 0.6 -- 0.4 3-6G
#For location of the various check points see Figures 7 and 9. k · fl DEC· Dye equ1"valent concentration recovered from packet. *TIF: Time activated carbon pac et was 1n ow; ·
1111PM: Packet missing. **FS: Flow of water had stopped. +(Packet number)G: Grab sample taken at corresponding check point.

59
and fluorometric rat~er than visual detection cf the dye w~s e~ploycd.
The purpose of this test, as in the. first tf;st, 1-:as to find out if fluo-
rescein V.1Culd travel through the sand a11d g1:avel de:;)Osi t rud e:':•?rge from
the se2ps in che baD.k of Dry Fork Cr,.ek·. C::...-bon p.,rk'·r"' '"'er 1 d t - v .. . L>- ""' ""- e p .. ac~ a
check points 3-lL through 3--SL, 3-1, 3-!+, 3-6, 3-8 through 3·-15, 3-18,
3-lC, and 3-2CL thro:..rgh 3-6CL (Figure 7) ;_!ad points 1155, 1153, :1r:d 1130
(Figure 9). No control rackets ~.,;rere used in t!lis test because backgro:ll"!d
fluorescence had already been obtained for tl1e various check points.
A 100 gram qua~tity of fluorescein was added in solution to the flow of
B:ro':.J"n Spring ;.'tt ii:s uoath and both cn:ls of the ponded ar.sa •:;cce d;,;r.med
11p in o=der to hopefully force th2 dye through the sanJ and gr&~el deposit.
Ti1e \Jhole pon,led area tur:1ed bright green ~lithin 12 !lOurs follul·.'ing th~
addition of the dye. The results of th~s test are given in Tn~le 11.
pond at a point where seepaga iu~o the channel was observed (Fi;urc 7).
A carbon packet was placed at this point to ascertnin if the seeving water
came from th8 me .. in p;::nded area; hm-7 CVP.r, n(' dye: p'lssed through this pac-
ket in the first day after the tracer had been int::-vduced. At the end
of. the first day of tracing the d:!m nean,st point 3-15 ~-:as pdrtially
washed out, and in .'!nother day the 1-:ater frorr, the pone 'loJ<Js flm-!1,-,g over
the dam and into the channel showr. by the r2ashed lines in Figure 7; it
Has tr;en observed to flow into an adj.::cent Jraina;;c basin <l.nd from this
basin i.ntc> Dry Fork Creek about one-fourth o£ a 1nile dm-mstr•2am from the
test site. Packet 3-13 was placed in the channel to the adjacent basin.
As c<> b ,-r tl·"' d;lta p-rec:.e-11ted in Table ll, dut·in::r the first -'"\. •. n e s c. en ..:: om .~:. . - - - o
three d;~ys of the test no dye cc::me th;.:ougb the p.::c:kets, except 3-11 and

I
'
•
Check point//
Blank 3-11 3-10 3-9 3-8
3-6 3-4 3-1 3-11 3-21
3-31 3-41 3-51 3-12 3-14
3-13 3-15 3-18 1155a 1155b
1130 1153 3-1C 3-2CL 3-3C1
3-4CL 3-5CL 3-6CL
TABLE 11
FIELD TRACING STUDIES IN TEST SITE 3 FLUORESCEIN INTRODUCED INTO MOUTH OF BROWN SPRING
Date 4-9-68 4-10-68 4-11-68 4-17-68
TIF* DEC* TIF DEC TIF DEC TIF DEC (days) ( IJ g) (days) ( IJ g) (days) ( IJ g) (days) ( IJ g)
-- 0.4 -- 0.4 -- 0.0 -- 0.3 0.8 0. 7 1 2. 8 1 4. 4 6 8.4 0.8 1.8 1 7.8 1 9. 6 6 26.0 0.8 1.4 1 9.0 1 10.2 6 28.0 0. 8 1.4 1 8.4 1 8.4 6 26.0
0.8 2. 3 1 8.4 1 13.2 6 31.2 0.8 1.5 1 12.0 1 13.1 6 36.0 0.8 3.4 1 9. 6 1 9. 7 6 25.8
2 13.2 3 28.0
PM+ --9 48.0 9 42.0 PM --
0.8 0.6
1 21.0 6 25.6 1 45.0 1 7. 7 PM --
0.8 1.1 1 2 .1 1 3.0 6 10.2 0.7 1.3 1 10.8 1 15.6 PH --0.7 1.3 1 6. 2 1 8.4 6 30.0
0.7 0.9 1 9. 7 1 9. 7 6 30.0 0.6 1.3 1 8.4 1 9.0 6 16.2 0.8 2 .1 1 9. 7 1 3. 0 6 28.2
2 13.2 7 28.2 3 36.0 9 31.2
9 37.2 9 40.8 9 36.0
#For location of various check points see Figures 7 and 9 .
4-18-68 TIF DEC (days) ( ]J g)
-- 0.6 1 3.0 1 7.2
1 7.2
1 10.8
1 5.8 1 2.8 1 7. 8 1 8.4
1 6. 6 1 5 .1
1 9.0
---- -----·-
*TIF: Time activated carbon packet was in flow; DEC: Dye equivalent concentration recovered from packet.
+PM: Packet missing.
I I
0\ 0

61
3-15 which ~.;ere located in the overflo'.v channel. Fre:"h packets 11112:re
then left in place for 6 continuous days in order to concent.:-<1tc a signi
ficant amount of the material passing through the:n, and again the presence
of dye was not detected. After one additional rlay of checking "ithout
any indication of tracer presence, this test was terminated.
The final study performed in test site 3 had the. same objectives as
the pre-vious test, but Rhodamine WT rather than fluorescein was e.mployed
as the tracer. Carbon packets were placed at points 3-11 through 3-5L,
3-2, 3-5, 3-8, 3-9, 3-11 through 3-13, 3-15, 3-18, 3-lC, and 3-2CL through
3-6CL (Figure 7) and 1155 (Figure 9). Control packets were collected for
two days before the dye was injected in order to obtain background fluo
rescence for each check point; unfortunately, on the second day dye ac
cidentally leaked into the box carrying the collected packets and high,
invalid dye equivalent concentration values were obtained. One-fourth of
a pound of Rhodamine WT solation (20 per cent) vas introduced into the
flow at the reouth of Brown Spring and the ponded area was quickly dammed
~p. This test was proceeding well until the second day after the injection
of the dye ~.;hen the far:n m.;ner, who previously had given permission for
these tests, destroyed the dams at the two ends of the pond. Consequently,
dye ran out nt both ends of the ponded area and the adjacent basin.
Im!llediate high fluoresce:..1.t readings were detected at points 3-12, 3-13,
3-15, and 3-18 as shm.vn in Table 12. Four days were required for the dye
to travel a distance of 1. 7 miles dm·mstream iu the Dry Fork Creek as
evidenced by its de~ection at check point 1155.

Background
Check point# 4 26 68
TIF* DEC* (days) ( ].1 g)
Blank -- 0.6 3-11 1 4. 2 3-9 1 9. 3 3-8 1 9. 6 3-5 1 13.8
3-2 PM+ --3-lL 3-2L 3-3L 3-4L
3-SL 3-12 1 8.4 3-13 3-15 1 2. 2 3-18
1155a 1 13.8 1155b 1 18.0 3-lC 1 17.4 3-2CL 3-3CL
3-4CL 305CL 306CL
TABLE 12
FIELD TRACING STUDIES IN TEST SITE 3 RHODAMINE WT INTRODUCED INTO MOUTH OF BROWN SPRING
Studies Tracing Studies Date
4 27 68 4 28 68 4-29-68 5-l 68 TIF DEC TIF DEC TIF DEC TIF DEC (days) ( ].1 g) (days) ( ].1 g) (days) ( ].1 g) (days) ( lJ g)
-- 0.6 1 1 3.9 1 3.4 1 1 10.3 1 9 . 7 1 1 9. 6 1 6.9 1 1 12.0 1 13.8
1 1 12.6
I 2 22.6
NA** 2 1 1 48.0
1 50.0 1 42.0
1 1 10. 7 1 46.0
1 1 16.2 1 10. 7 2 10. 8 1 1 14.4 1 10.7 2 12.0 1 1 2 2. 2 1 11.4 2 2 18.6
5-3 68 Check
TIF DEC point /I
(days) ( lJg)
Blank 3-11 3-9 3-8 3-5
3-2 3-lL 3-2L 3-3L 3-4L
3-5L 3-12 3-13 3-15 3-18
2 46.8 1155a 2 36.0 1155b
3-lC 3-2CL 3-3CL
3-4CL 3-SCL 3-6CL
IIFor location of various check points see Figures 7 and 9. *TIF: Time activated carbon packet was in flow; DEC: Dye equivalent concentration recovered from packet. +PM: Packet missing. **All readings invalid because of accidental contamination with dye.
62

63
2. Studies in Test Site 4.
This area (Figure 11) consisted of a circular basin adjacent to
rock bluffs (Figure 12a) located at its northeast end. Fiald r2connaiss&nce
revealed ti:at 'i:ater flo~ving into the Dry Fork Creek bed frorr: F:ell Spring
sank into the alluvial creek bottom after it had travel~d roY a !:ew feet
(Figure 12b). At anot.her loc:1.tion, it was observed that sc~p<qc: from the
top of the roc:k bluffs fell to a ponded are.:;. und~r thA bluffs and thr.·n
flmved back into t~.e bluffs through a hole. Just bE·lcv: this l1o]e, at a
straight-line distance of approximately 30 feet, a sprins ern~rgPd and
flowed into the dry creek bed. Tr~cing tests were conduct2d in test site 4
in order to determine ''T~1ether tl1ere existed an interco;Jnec tioa b'~tv12e11 the
hole through which seepage ran back into the bluf£s and the :o 1n:ing at the
bott..:1m of the hill, and to establish whether the sinl.:.ing Hater i:1 this
are.-q of D·cy Fork Creek flm1ed north throut:,h the bill and fed Her rison
Spring on the otber side of the hill.
In the first test conducted in this site, a sol.ution containi~g 30
grams 0f fluorescein \vas injected in the ponded are8 unde!~ :h•?. reck bluffs.
Activated carbon packets were then placed a.t chec.k polnts 4-1 through
4-3, '•···5, and 4-7 (Figure 11), pGint 1110 (Fif;l!re 9), and poil-:.~s 4-Sa
and b in the Nera.mec Spring ruu; point 4-7 \vas at the sa1;1a location os
The sampling point 111~5 '.lsed by Huang (4) in his Hater qu::..lir.y st,~d.i::s.
o.ctivated carbon packets ,.,rcre collected an(2 :rcplact~d •··ith fresh cncs e·.;cry
three or four days because it hAd been observed in previous treeing tests
· · d car'oon ~.,ras c:1·~c:.ble of adsorb:Lnr. badq~round l·,;Jt.e::ri:;.l at tnat the activate -r -
· d f t 1• a'· •s · ,......., '..-.+-'1ini·vr the a relatively co~wtant rate for fCCl.i) s o up o 'T "'-) , ·"'d ···-· '·..;, ·'-

4 I N
Morrison~4-5 Spring Low wate
bridge
Hill
Bluffs
FIGuRE 11
fj I A n I t 3 N
l't> ~ ~-a.
4-a:
I'/
LOCATION OF CHECK POINTS IN TEST SITE l1
Scale: 1 in. 0. 05 mi.
Meramec Spring
Ponded Area (Dye inj e.ction point j_n
test 1)
Spring
Scale: 1 in. = 0.33 mi. 0\
~-

a. Rock Bluffs
b. Bell Spring Water Sinking in Dry Fork Creek Bed
FIGURE 12
TEST SITE 4
65

66
packets in the flow of water for lon3er f3riods enabled larger quantities
of dye, if pres~nt, to be concentrated on the p~ckets and facilitated
detection. ~i~hin ~ minu~es after the dy~ had been added to the water in
the ponded area under the rock bluffs~ it emerged f-rnm the s:::>ring belm.T
the ponded area at cr-er:k bed level (point 4-2) at a high c.oneentration
pcr~itting direct vislJal detection. The spring flo~ containing the dye
was t:1.::n ob:c;c·~-,;cd to run in the rrc:.ctically dry creek bed for acout one-
P.it;ht:i: r~f ::; r'i.le ,1:!d enter anothcr ponderl arc.a. T\,;o days <>ft2r d•.'e in-
jection, the dye could not be see::1 either in tl:e sprinr:; flow -:>r the ponded
'''3 ~er remainin3 in the creek bed. Thirty more grams of fluoresr:cd_n -;.;rere
th~n add2d into the water of Bell Spring just befo~e it flowed int-:> the
Dry Fork C:-:-cr..:k bed Hhere it sank into Lhe ground. On the next day, the
Jyc~ .--:auld ll<J l<Jn;:_;cor be detected in ti'.e creek bed. The results obtainerl
from this r-:..-::lcing test are presented in Table 13. As can be seen f:c-:xr.
thLse data, no dye hnd passed through the packets located at ~orrison
SI)c'LJ~(; (point 4-S) or Heramec Spring (points !t-··8a and b); hmn~ver, 9 •Lys
j)•Jl:Jt J.l10 in ;)ry Fork Creek at llii~b .. my 68. The auticii-'!J.tt:d coilnection
1 · · 1 · · · ~',!P ·orv "'orl_(_ C:-__,,._nk· b~d :1·,·1d ~·!orrl· "'0~1 Sprl .. llry.•-. Je~".\.-:-cen tll\2 s_Ln·:J~ns \·.:acer l.n ..... ~ J .L - ....... _ ~:;:. ... ~ - ..... - -
~~sited be~w2cn this point 3nd the lm:er part of D~y Fork Creek 15 miles
A second tr:1cjng test Hllich Has es~'.cntinlly a repe:1t of the first
~ l • --'..--. il'.--~q Tl_oP rL.)'"' \·7"1S ~clJed at a :J;ls performed to v..::ri.1:y t•1C _?rev'\..ul!S J:.L,"< "6~ • -~ ~ ~
h 0 -L'o ,-1'-- r.rr'o.i· 1('1()0 feet 11' •• :.:> tream [<ocr. '<Ihere differ~nt l2c~tion in t c ry ~ - - · -~
• ~ 1 • "'C'''"''" of a C011strir..tion thf' rock bluffs started; Lhis H;l5:. a puu; •- ''h1CJ:e, Di .. '-'-'·'->~

67
TABLE 13
FIELD TRACING STUDIES IN TEST SITE 4 FLUORESCEIN ADDED TO PONDED WATER UNDER BLUFFS AND TO THE SINKING WATER OF BELL SPRING
Check Point//
Date 4-1 4-2 4-3 4-5 4-7 1110 4-Sa 4-8b TIF* DEC* TIF DEC TIF DEC TIF DEC TIF DEC TIF DEC TIF DEC TIF DEC
Date
(days) (~g) (days) (~g) (days) (~g) (days) (~g) (days) ( ll g) (days) ( ll g) (days) (llg) (days) ( ll g)
5-1-68 4 26.4 4 25.2 PM# -- 5-1-68 5-2-68 0.8 4 8. 0 0.8 60.0 0. 8 8.4 0.8 3.0 0.8 6.2 5-2-68 5-3-68 1.0 2.8 1.0 50.0 1.0 45.0 1.0 3.0 1.0 5.8 2 18.6 2 14.4 2 9. 7 5-3-68 5-6-68 3.0 8.4 3.0 43.2 3.0 36.0 3.0 6.9 3.0 10.2 5-6-68 5-7-68 PM -- 4 12.0 PM -- 5-7-68
5-9-68 3.0 7.8 FS** -- 5-9-68 5-10-68 3 420.0 3 15.0 3 17.4 5-10-68 5-13-68 4.0 7.8 3 36.6 PM -- 3 13.8 5-13-68 5-16-68 3.0 6.2 3 34.8 3 10.8 3 10.3 5-16-68 5-20-68 4.0 6.6 PM 4 17.4 4 16.0 5-20-68
5-23-68 PM -- 3 10.3 3 12.0 5-23-68
6-3-68 13.0 24.6 6-3-68
#For location of the various check points see Figures 9 and 11. *TIF: Time activated carbon packet was in flow; DEC: Dye equivalent concentration recovered from packet. ##PM: Packet missing. **FS: Flow of water had stopped.

68
-7 .,_ tl'·"' c.,._ ·"'e~., t11- flo'"' of ,, t ~ b ' - b -- -- ~ "• . -.:: •• ,,a e.:. -v:as c ser,·cc to D~ tu-r ulent er:.ough to
disperse a large quantity of the tracer. In order to obtain optimum flow
conditions for this test it was necessary for the creek flow to be at
n:inim'.lm level at the tracer inje.ction site so that the dye 1-:oul::i not be
carried mvay from this area but sink into the creek :,ed in the general
location of the rock bluffs. After a hard rain on May 20th, the Dry Fork
Creek started flowing at all points and approximately 2 1veeks v1ere re-
quired for the creek flo--.v to reach the desired level within tl1c test area.
Activated cRrbon packets were placed at check points 4-4 through 4-6, and
4-8a and b (Figure 11), and points 1130, 1120, 1215, 1110, and 7110 (Fig-
ure 9); 2 packets were placed at each point to protect against loss. Two
pounJs of fluorescein were sprinkled into the flow of Dry Fork Creek at
8:30 p.m. on June l+th. On the next morning the flmv cf the creek wate-..-
in the test area had stopped and only a few ponded areas in the creek had
r.ema:i.ned with fluorescein still visible; both the water and dye ~:ere ob-
se£ved to sink into the creek bed in the test site area withtn the 2 dRys
folloH1ng the :":ldditi.on of the tracer. The results of this test are pre.-
sented in Table 14. A~~J.·n a conn~ct1."on was not established between this "._on ' - -
section of :Ory Fork Creek and Harrison or Ne.ramec S!)rings, but a connection
did exist bct1.;e:=.r.. the tracer injection p.Jint and t~v: section of Dry FoLk
Creek located between Route F (point 1130) and Hishway 68 (point 1110).
The point 1d1 [~re the dye en•:!rged into the creek f".ot.J_d not be pinpointed
any closer bt?.ca:use the packets a.t point 1120 V.'ere missing; i.t does not
l "k 1 h t t1le.c;e packets were ·,,,ash~d m.;ay, r&ther it seems that ap~ear 1 e y t .a .
they were re:aove.d by someone. The tracer 1-:as detected in pac.k0.t lllOa
nineteen days after it had been introduce.d .Ln the tr~st a::.·ea; this was

69
TABLE 14
FIELD TRACING STUDIES IN TEST SITE 4 FLUORESCEIN ADDED TO DRY FORK CREEK 1000 FEET UPSTREAM FROM ROCK BLUFFS
Date Check 6-5-68 6-10-68 6-13-68 6-17-68 6-20-68 6-24-68 6-27-68 Check point# TIF* DEC* TIF DEC TIF DEC TIF DEC TIF DEC TIF DEC TIF DEC point It
(days) (~g) (days) (~g) (days) ( 11 g) (days) (~g) (days) (~g) (days) (~g) (days) (~g)
lllOa 0.6 15.6 PM+ -- 3 54.0 4 46.8 3 49.2 4 150.0 3 44.4 1110a lllOb 5 46.8 18 360.0 lllOb 7110a 5 34.8 7 34.8 3 10.3 7 32.4 7110a 7110b 20 59.0 7110b 1120a 0.6 16.0 PM -- 3 41.0 4 46.9 PM -- PM -- 1120a
1120b 5 54.0 PM -- PM -- 1120b 1215a 0.6 6 . 9 4 25.2 3 13.1 PM -- 1215a 1215b PM -- 1215b 1130a 0.6 9. 6 4 39.0 3 12.3 PM -- 3 15.0 4 12.0 3 12.6 1130a 1130b 5 42.0 1130b
4-6a 0.6 11.0 4 25.2 3 12.3 4 2 7. 0 3 6. 8 4 6.9 FS** -- 4-6a 4-6b 4-6b 4-5 0.7 6.9 4 15.0 3 12.0 4 10.3 3 4.4 PM 3 5.8 4-5 4-4a 4-4a 4-4b 0.6 4 . 2 4 6.8 FS -- 4-4b
4-8a 17 38.0 3 19.2 4 22.8 3 20.4 4 12.0 3 13.8 4-8a 4 8b 17 60.0 3 10.8 4 22.8 3 15.0 PM -- 4-8b
f!For location of various check points see Figures 9 and 11. *TIF: Time activated carbon packet was in flow; DEC: Dye equivalent concentration recovered from packet. +PM: Packet missing. **FS: Flow of water had stopped.

70
verified by packet lllOb u}1ich \oJas chec~'-ed 3 d<::ys :::..at~e1.· after it had been
in the water for 18 days.
A final tracing test was performed concurrently with the second test
in a large ponded area northeast of Morrison Spring on the other siJe of
the low water bridge (Figure 11); water from this pond was s~en to sink
rapidly in the bed o£ the creek next to a small rock outcrop. One pound
of Rhodamine WT (20 per cent) Has poured into the s::nking I·Jatc:r on June
lOth, and within one \veek all the ~vater in the pond b;:.d Enmk into the
creek bed. T:v:: :1ctivated carbon packets which m::re hC:ing used in test 2
were <:llso employ<:.d to detect the tracer used in this ::est ~ecause Rhoda-
Jr .. i_ne \·Yf COuld De distinguished fro:n fluorescein by CL';n:)a·cing the dye
equivalent c•.)r;,centration of the sample at room tempc:r.:Jture (21 °C) <?nd at
a reduced t,~;:.1)e:ra tm~e (6°C); the fluoresc<:>nce of t~1e rhodauir.e dye ,.,·as
consider.ably increast~d at lmver temperatures. The bigh equivalent dye
concentration deter~lned in packets at points lllOa and b on Ju~e ~4th and
.Ju~e 27th was r~c~eckcd after the samples had b~en cooled. Since no in
crease in ~ye concentration was noted in the cooled ~a~:ple, it was con
eluded that rhodamine was not present; conseque;,tly, r.o interconnection
be~wccn the inje2 tion point and the lower p2rt of Dry fork C~eek was
established.

71
V. DISCUSSION
The purpose of this. investigation was to select and evaluate a
tracing method appropriate for use in karstic areas, and to perform field
tracing studies in t~e south central Missouri area previously studied by
Kilgo (3) and Huang (4) in an attempt to eostablish existing d:trect flow
connec t.ions betw·een surface and subsurface ~mters and determine the di-
!:'ection and approximate rate of ground\vate:c flm.;. It may be seen from the
rest:lts presented in previous chapters that an appropriate method 'vas de-
veloped for tracing studies in karstic areas and a subsurface co~nection
betHeen the upper and lower part of Dry Fork Creek was established and the
average rate of flow of the "t-mter in this channel was determined. Several
other suspected :i.ntercon-cections in the Dry Fork Creek basin were not,
ho~ever, verified.
After a cP:.:eful evaluation of the information found in the literature,
fluorescein"':. 1.\hcdam;.r.e n, and Rho.:iamine WT, were selected for use in this
ir.vl:stigar:ion. The three dyes have been employed extensively in tracing
the flcv.• uf '·'ate:r anc!, althoush they have the same general basic structure,
t.h"-Y C!Xhibit different properties. The structural forrr:illas of fluorescein
and Rhoda:rdnE B are as follows (31) •
NaOV:tJ' 0
&COOfu Disodium Fluorescein
L Rhodamine B
--------------------*The sodium salt of fluorescein was used because it is readily \vater
.:.JOluble.

l2
-J: Rhodamine liT has an unpublished fonnJla, hC'\·.'cver, according to infer-
rnation received from the maryufacturer (32) this dye has the same general
structural formula as Rhodamine B with addi_tives to increase its resis-
cance to adsorption on sand and gravel. All three dyes were employed in
i.abcratory s!:udies, but only fluorescein and Rhodamine HT Here used i!l
the field because the results of labo-ratory column studies :i.ndicat2d that
Rhodamine B ~·ms almost entirely adsorbed v.Then passed thro:13h one foot of
sand and gravel. from the field area.
T~m?erature and 3unlight have been reported to affect fluorescein
and chodami.ne in different \vays. Fluorescein is highly S'Jsceptible to
pl1l)toclv:.mical decay but only slightly affected by tewperature, \..rhile the
rhoc~a.::!ine dyes are extremely sensitive to ter,lpcrature but re~:;istant to
photoch,~r,1ical dcc:::m-c1position (6, 7 ,19). Because of l ts sPnsitivity to light,
£Lwresceia v.·as ah..rays :tpplied just before or afte'~ the su.1 bad set.
Special precautions were also teken to control the tem0cratu~e of s~~ples
coJn::a:lnii1g Rhoda:rine \.JT beca.use the brigllt:ness of this r1ye uas signifi-
ca.atly reduced at highe L" tempenltures.
A.:Uwugh act:lvat:ed carbon was the most t?tfectlve of t:1e adsorber.ts
tested for both fluorescein and the rhodamine dyes, it adso~bed a consider-
ably higher percentage of rhodar,1ine than flt.:ores ce:!.n. Ho·.,rcver, only a
small fr·J.c. tion of the rhodan;ine adsorbed could b2 extracted fror.: the car-
1 • tota.l r_~co\•~rv of fluor~scein ~as considerably ban and, consequent_y, tne L~ - J
greEJ.ter. · ,__ · t ~ J·_,,l t1tc 1 :l_boratc·r''· in order Scvcr~l solvents were ~nvesLlga eu . - J
to find the r;;.os·c efficient extracting solution for e:1d1 dye. The asdition
------------:ku·r d f t r tr;1cer (32) • 1v sta.-::1,::; or wa e -

73
of an alkali to et:1yl alcohol cnhJnccd the .:1'Jility of this sc•lvent to
nxt.·r~c~ -._l_Je dy~s fr_o-,n actl·v~t~d c~rbon. \ . 1 , "d f d ~ - - ~ - ,._ ~ u- 1 r.,J-:-:onlu::J. .1yurox1 e \.:.:-,s oun
better for the rhodan!ine dyes and p0tassiur.1 hydroxide for fluorescein.
The difference in the chemi~al strue:ture of the: c.ycs :;;;:,.:· account for the
difference f_n the ex::racti:1.g ability of the tvro ~lkali-<,lcohol ~ystems;
fluorescein \Ihich possesses a.cidic ph"O:nolic c:nd c.:.uboxyl 2;rc-:..1ps \·Jas ex-
tracted better in the presence of the stront;ly b<1sic roL1ssi•w hydrcxi.cle,
Hh.i.!.•:! rhodaT'line '>;rhich possesses b2sic .:Jr.Ji:lO grcn1p~' '.vas cxlract('ti more
effectively in the presence of <1mmoniu~ hydroxid2.
A considerable aHJ.ount of fluorescent b3cLr_;round 1;~.~ ter! .1l ' .. 'as dr:>tf·C ':.cJ
in the streal'lS and sprin1;s of the study ax;;a by Gdsol·ption on ·i.e ,-,cti'-':ItcJ
carbon pad'-ets and extrnction \dth the alkali-:<] ,"ohnl ~>cL·.~nt. Chlorc-
Ph ,-J 1 pll"'o-•il·J- :.1. a.,.,d ot-' .. · .. ,~r ·.~.aturall~· occurr;,...,;:-, r:·i?_.:.:ults :1clV'' h:::,!n rc--.• __, .. __ , "-'1:'·.'--'-l: u ~-. ! ..... ,.,
pol.·t~d (6) to iDp3Lt C. baC~'-ground fluCY'CSCence to tl~e '·.';!tCr · i ;L~gr~ CJ'l.":Jl-
tit:i_;~s of s-:JbstG:.r:cE's of this type ~,,CJuld r.10st likely D•.:' ~JL.c;cnt ~n iJ1e Dry
For:<:. Cn:ek cspcc:~_ally in its u~pE:X rcnc.hC'3 ~.·here the s:.:cc3C'l is iJ~tcc·.itlcnt.
of ;qu::J.tic. plants ctnd the buildup of decay tn?; or:;a.'i1ic r.:tter 1.'1•i.ch in t1.rn
wo1:lrl coLt=ibute background material. Also, th0 intcr~itten: presence
f · · cr,..,ek l...,.,_d \·~ouid c::·,u~~e c•:·:Jti_nual death and !'nt-ancl 2.bse.nce o- ":rater 1n t~F:! ~ l'"' . -
· - , end ,,•et:ds on J::.he edges rtnd bot ton of Lhc> ~~reek bcci. t::.ng oi p.-.an<:s ,.
.B::lci~ground r.u Lt.r:Lal vJas al:3o f oend in ti12 1-Ja tcr of St~ver:3.l in the
~re" l·,...1c·Jucljr,c- Brm·m and 1'1orrison s;Yrin0s and th.:: !'lc:cai~1CC Spring run. <-'- < ..... ' 1-. • - .l. - ••..;:J
1 , l'.·'ve been co,-1 1-rl"\...uted by cieocaving m2t.ter cu th.::. sur-This m&terial cou_u ~ ~ - -
·1 T.,rJ.-.l·ch could have been c:2.rried by the: ini'iltrating face or in the SOl n

74
~vc.tcr; direct su::-face contamination H&s also possible because of the
karstic features of the area. The rate of flm.; of \vater through the
activated ca·cbon packets controlled the amount of backgrou!'~d material
which \vas adsorbed in a given period of ti.me. Thus, cc,mpared to Dry Fork
C-::-eek, less background mate.cial Has found in the Merarnec Spring run \vhen
the amount of w·ater flouing through the carbon packets is taken into ac
count. The presence, of background material did not seriously interf~re
r,!i.th the spectrophotometric or fluorometric detection of the tracers;
how~ver, it did interf~re with visual detection and it was not po6sible
to distin::;uish b2tween the background Jr..aterial and the eye v.rhen it \vas
rrcsent at low concentrations. '•fuen fluorometric il.etection of the dyes
v:as eri1ployed, the equivalent flucrescence of the background naterial
(in ug) could be deter.11inc:.J by rt1eans of control c>.ctivoteG. carbon packets.
'f'he 'l'urnec fltiOrOJ<leter was capable of detecting rhodamine at a concentra
tion. level ~inJcl1 ~ .. 1as considerably lower than that at t,;rhich fluorescein
HdC cetec:tec because the fi.lters contained in the instrument Here specific
for the det~ction of rhodamine: and fluorescein f:!' lters \ve!:e n0t av.>.iL•ble.
The d i..l::f erent sensitivity of the fluoror.~eter tc' the tviO trc.ce.cs is rc
fl<~(.:ted in the relative concenr.r·ations employed in the laboratory evalu-
at~.cr. studies.
I c t . .vn.s not: found feasible to conduct the tracing studies which had
been plau~ed in test sites 1 and 2 (see Figure 6, p. 43) for the early
f:1ll of 1967 because flm-.r ·~or.clit::.ons in the Dry fork Creek were no longer
a~proprlate. These sitc-s ,.,,~n:·. selected in the late surnme:::- ;;.:hen the flow
of the cr2 ek w;.1 s found to be. intermit tent in the tvw areas; l<owever,

75
after ~he first hard rain l"n ·c··n~ ~all the t t" d fl - ~ . , s re&~ can·lnue to ow until
the early summer of 1968. Test site 1 hed been selected because the
sinking water in the area had been reported to contribute to the flow of
Meramec SfJring (.25). Tt l1ad "oeer1 plan d t dd th d 1 .. _- . ne o a e ye to t ~c Hater of
Dry Fork Creek as it entered the area and check the path of the tracer at
several check points located at constrictions elcng the creek bed, test
wells dug in the creek bed, a number of potential emergence points through-
out the fJeld area, and Meramec Spring. The test planned for site 2 \vould
have consisted of the addition of the dye to the Hater of :Cry rork Cr2ek
at a point just north of the Brm.;rn Spring area upstream f::-om a location
\vhere the water was seen to rD.pid.ly sink into the ground a:1d checking for
the presence of dye at sm::pccted emergence points throughout the study
area. Rainfall and associated runoff Here one of the major controlling
f~ctors in the perfcrmance of all field tracing tests beca~se the flow
corulitions in tl~e creek at the various test sites had to be at the level
pL·ur:sd in order for the te;;t to be feasible.
J:'.,.:,sr.!lts obtained from tracing studies in tes'.: sites 3 and 1f (sr;:e
Figures 7 and 11, p. 48 and 64) enabled the calculation of the rate of
flo\•' of some surface and subsurface waters in tl112 study <'-~·22. Table 15
suP~arizes the find5ngs cf tracing tests in these two sites and presenta
the ccrrespcnding t>lopes and rates of flo\.;. Ths flow of surface water in
~ • b J '·.··,~_en .~o·_,,.,p..,red t-o t·h"' t"lo1v of the subsurface site 3 was tounu to c s .ow ... , ~ c - ~
'by ~hP m,~,1v l·•_l·L.~er.M,~tten~ nonded are~s found in Tl;i s 'I-73S causea - - "'- J - .. ~ - •
the Dry Fork Creek 1.;rhich were co:1nectcd by constricticr:.s. Flmvinr~ water
• observed in the constricted set.:tio-;ts of the stream. coulci. only oe
.\ re-
f fl fcunci to exist in the short, l:'lt.tvely fast rate of subsur ace ow was
111lde,. t-_11e rock bluffs boadering Dry Fork Creek; thls s tcep cha::mel ..

TABLE 15
RATE OF FLOW OF SOHE SURFACE AND SUBSURFACE WATERS lN THE ST'(JDY AREA
-I I I !atiim of tracer Test
Site
Tracer used f Loc ,.,.., IQtJantity . .on .Lype I (lb.) AddJ.U l Emergence
I Mode Time of Straight- ,Elevation Slope 1 of travel line dis- differencE (ft/mi' l travel (days) I tance (mi. (ft.) 1
4
3
*
1 lP;nded.
1 under b I boarder I Dry For
0.07
t 1 Fluorescein! 1 I Dry Fo~ I 0.13 jbed (se 1-~23 T.36
2.00 R. 7W., County)
1rea Spring at I luffs Dry Fork ing Creek bed k. Creek level
ec. 14,T.36N,R.7W.~ Sub-Phelps County surface
k Creek Lower Dry c. 14 &. Fork Creek N. ' (section be-Phelps tween Route F
& Highway 68
Dry Fork Creel
Rhodamine HT
check pt. 115i
t Spring (sec. 8,T.35N. Surface R.6W., Dent ?ond County)
0.50 Bro..,:r
-
The exact location of tracer emergence was not established. **creek miles are given; the straightline distance was 1.5 miles.
0.0028 0.0057 25 4,390
9 6-1o* 40-120 p.7-12.0
19 I 6-10* 40-120 p.7-12.0
I I
,
7**
I 4 1. 10 5.9
I
Rate::l flow
(ft/min) !
7.5
2.5-4.1
'
1. 2-1.9
1.6
"-J 0\

77
appeared to be a direct solution channel with no obstructions at either
end. Haxirnum ar..d minimum values are given fer the subsur£.:1ce flow in the
connection established between test site 4 and the lower part of Dry Fork
CrE,ek because t:he exact e:;:nergence point \vas not located. It al-'pe.:us that
the dye had to travel through a direct or partially di!"cct solution channel,
as emphasized by the relatively fast rate of flu\v 2nd also by the results
of column studies performed in the laboratory which demonst!"ated that 65
to 70 per cent of fluorescein \vould be lost ~ihen p.:lss~d throu~l1 one foot
of alluvial material obtained from the field area (test site 3). The
10 day difference in the time that it took the dye to be deter;ted in the
cwo tracing tests performed at this site could have re8ul t.o:d from a dif-
ference in the ra.tc of flow of the \vater in the subsurf.:.c.e channel or a
difference in grounduater level '>vhen the tests w.:xc:. perf~.:.n,~ed which caused
the tracer to travel thro;J.gh different solution ch.::nn•;ls. It is ~lso pes-
sible that the dye Jid n0t sink in the same place in the creek bed in each
tast; the dye was not added at the same point in the cre~k fn both tests,
and it is not j.:nown ;qhether i:be dye added in the second test traveled to
thr~ p0int in the. creek adjacent to L1e ponded area under the bluff~ where
it \v'BS s<::!en to sink in the first test. L\lt~wugh Cl ;;.uch l.<1rger quantity
of dye ''e.s used in the seccnd tesc, a s,TJall2r <J:G.o<mt of t!h~ tracer ' . .'as
.l t t ~ -h 1 t . th{c could 11.~-;·p __ r_0,.a_lll~~.~ f.ro~ a our~ate~ adsorp-ue. ec. E:ct on '-'~c pact;:e s, .,. -~ - - . . - ~~
tion of the dye in the longer travel ti::.e encountc:rr:cl in t!·,c secow.l test.
T. - of d\'e rc·cl,\•ered or1 tl·e carbon packets was also denendent on r..e ~s.r .. n'i.ll·.~.. _ . _J _ ~
~= d '1 · £ tl · · cteri 'ye D, .. _lutivn of the tracer oc-the ~cgc6e OL 1 ut10n o .1c 1nJe ~ u •
cured at both the injection a:1d emergence locations and the possihility
that the dye pc 3 s~d through a subsurface reservoir as it travel~d d1rough
the undergronnd chRnne l cannot '!:>e e:.:clt.:.ded although it is net probable.

78
Other investigators (3,23) have reported that the section of the
Dry Fork Creek uhere the dye emerged 1vas influent (or losing water to the
ground) in the lower part and effluent (or receiving subsurface accretions)
in the upper part. Kilgo (3) based this classificetion on an increase or
decrease in mineralization of the creek wnter after rain; an increase in
mineralization was considered to indicate that the creek was receiving
subsurface disch.:1.rges, ,,,hile a decrease '\·:as attributed to dilution of the
water by runoff. Crouch (23) on the other hand arrived at this classifi-
cation on the basis of his evaluation of a preliminary 1-;ater level map
he developed for the Dry Fork basin. Inspection of the contour lines of
the generalized 'C-:ater level map of the study area presented by Ha~vell,
et al. (24)(see Figure 1, p. 19) vmuld indicate that the flow of the sub-
surfa~e 1vater in the area is in the same general direction as that shovm
by the established underground channel. If the flow of water in this
channel follm,Jed the direction of flmv of the subsurface '\\•ater in the ar~.:.:a,
it slwuld have e:rterged in the vicinity of the confluence of Noru·,an Creek
with Dry Fork Creek (see Figures. p. 42). It is also possible that part
of the sinking D·::y Fork Creek Hater 1"'as lost to the subsurface \vater de-
pression indicated in the generalized water level map; according to Max-
well and his co~orkers, this depression may be interconnected with Meramec
Spring. On the basis of t:hese findings (3,23,24), it appears that the
t t h ::.\:e •"mer<?;ed from the underground channel in the upper part of racer rr,us .. ~ _ '~
the ~::ection of the Dry Fork Creek betv;reen Route F and Highway 63 (}'igure 5) •
Unfortunately, the exa~t location could not be pinpointed any closer be
cause carb 0 n packets \~1ich had been placed at key locations in this sec-
tion of the creek ware found missing at the time the tracer was detected
in the stre;:un water near Highway 68.

19
A""'lother possible path that the tracer injected in site I+ could have
follor.,·ed was t:.:> Neramec Spring through the subsurface \vater depression
reported by HaXI:·;ell, ~ al. (24). The dye \·Jas not detected in the Heomec
Spring run; however, dilution of the ~racer by the water in the dep~ession
\..rould have made its detection at Heramec Spring highly 1mp:cobable.
Kilgo (3) has also reported that phosphates were only detected in the
Little Dry Fork Creek (\vhich recei'.res effluent from the tHo Rolla seuage
tr:~a::PY~nt plants), i.n the Dry Fork Creek below the poi11t ,,rbt.re th·~ Little
Dry Fork discharges into it (which is in the section where the tracer
added in test site 4 was found to emerge), and in Meramec Spring; and has
suzi;03ted a possible subsurface flo~.: connection bet•:1een the Dry Fo-.:k
C:cc:;l~ and ~k:rnrr:ec Spring. Because, as stated previously, the tr.:-.ce:: '''E'S
not d:o•:ected in t.he J.I""ramec Spring run, this connection suggested by
KiJgo c.oulcl not b;; verified. Since the tracer was detected in r:he Dry
Fork Cree!-:: at a rather lm..r concentration, it is "lgain unlikely that it
could ha_v,~ been detected :ln Nc::ramec Spring <:£-::er it i1aci bec::n f:nther di-
let-:cd ·.vith or.he.r vaters feeJtng the spring.
~.J·1ter quality characteristies repor:ted by Huang (!+) o t o;2verc-.l poi:1ts
along the D:y For~ Creek indicated that there was a consideroble incr~ase
in hardn:':!.SS and alkalinity bet~·:ce:;n water sarr,pling points located in the
'Jicinity of dye injection and sarnpling poiuts located in the section of
the cre21c \vhere the dye 0merged. Huang found that the avera~e values of
total hardness and alk~linity were approximately 50 and 40 mg/1 and 130
and .U.S mg/1 ~ res_[:ec t:.:.v.::-ly, at the t.wo locations. The abrupt change in
h t · r"~lac.e ::tt:ou,Hi sarrplin?.: point 1130, the the value of t ese para~eters · ooK _ -

80
beginning of the section of D:;:y Fork Creek lvhere the C.ye emerged. These
findings again point out that subsurface discharges were feeding the lower
portion of the Dry Fork Creek; the mineral content of the water sinking
in the upper part of the creek could have very well been increased as it
traveled through the underground channel.
On the bas:i.s of the results obtained in the field tracing studies, it
is recommended that large quantities of dye be used "1hen tracing ground
water flow in this sturly area, unless a definite di:cect solution channel
is tested. This is necessary both because of the great adsorption of the
tracer on mated.nls encountered in the field through Hhich it must tt"avel
in order to get to a solution channel, and because of the extensive dilu
tion that could take place in subsurface reservoirs. The quantity of dye
r~cGmmended for use in tracing tests such as those planned for sites 1
and 2 is at least 5 pounds of either fluorescein or Rhodamine vff. Other
investigators (33, 34) working in karstic regions of Hissouri have used
quantities of fluorescein up to 10 pounds per test. Since the dyes will
not cause any harmful effects and most o£ the people in the area do not
object to their use, the higher quantity which is recommended seems to
be justified.
The tracing m~thod employed in this investigation ,,Thich consisted of
concentration of the dye on activated carbon, extraction 1-.Tith a 5 per cent
alkali-alcohol solvent, and detection by means of a fluorometer served
the purposes of this study ~.;rell. However, several disadvantages inherent
to this method 1-;rere also noted. Leaves, 1vater Heeds, or trash could at
ti.~nes be caught on the carbon packets restricting the flm·:r of ~.Jater through
them, and thus causing packets located next to each other in the stream

81
tc yield significantly different dye equivalent concentrations. Carbon
packets were also found to wash out because of a change in the rate of
flow in the stream and many of the packets were obviously r2movcd by
people who may not have realized their significance. In & field investl
sation such as t'he study reported in this thesis, many v<n:-iables existed
that viere beyo11d the control of the investigator.

82
VI. CONCLUSIONS
On thG basis of the findings of this investigation, the following
conclusions \..rere drawn:
1. T"t-;o trace.rs, fltwresc.ein (sodium salt) and Rhociamine HT, ::lnd a tracing
method consisting of concentration of the dye on packets of activated
c.a:::.·bon, ext rae tion \·Jith a 5 per cent alkali-ethanol sol vent, and ci-:?-
tection by r::eans of a fluorometer v1ere appropriate for use in the
~arstic field study area.
2. Activated carbon adsorbed a higher percentage of rh~:·da:nine th.:-;.n fluo-
rcscein and the alkali-alcohol solvent extracted a smaller fraction
cf the adsorbed rhodamine with the resulting overall rGcovery he ing
gr..:~<>ter. £or £1 •.wresee:i.n. Ammonium hydroxid.e w·.:.s fou;Hi 1:-e.tter fer
rh:.:·r:L..'li•1i.;1e excraetion a::.1d potassium hydroxiJe better for flnores..::.e.in
ext~~action.
~ ... · . Fluor'?.scen-:: bc:ckground material pr-?sent in the st.r.~flms and sp~:ings
of the s~Gdy area interfered with visual detection of the tr&cers;
fluorcmctric detection of the tracers in the presence of ba2kground
rnaterj_c:~l \•73.<> pcssible at microg:;:-am qu:Jn::ities.
4. A di.1:ec.t or part:i<"illy direct suhsur.face co,mecticm 6 to 10 ''liles long
e.xis te:l b~..::~·/~r:!n the segmE:nt of the Dry Fork Creek located in sc,cticns
., ~ ?~ ·r 3~~ R 7'' ·>~ Pha1~~ Count_v and the section of the l.'+ a.uu ,_ . .:>, .•• u ... , .• •'•, , .L - "-~l~
b ~ .,..., d 11· ' .Ta · ,:.n Th·"' ra tc of subs~Jr-creek contained crueen .:.<.oute .: en · 1gu\v Y ~u. ~
face floT.v in t~ 1 is channel • .. :as estimated to be in the range of 1. 2 to
4.1 fet;t per. rrdnute at a slope of 6.7 to 12.0 feet per mile.

5. The presence of this channel may account in part for the a~ru~t
increase in the mineral content of the Dry Fork C.ccek water in the
vicinityof Route F as reported by previous investig.J.tors.
83

84
VII. RECm·JMENDATIONS FOR FUTURE RESEARCH
0:1 the 'basis of the findi!lgs of this investigation, the following
r;;com:.~2ndations are nade for future tracing studies in the south central
:Iissouri area:
1. r-fhe estnblished su.'bsurface flo·~-1 COili'lection shot1ld be further investi-
gated in orrlt.•r to deter:ni.ne the exact locat:ion in ~-.rhich the water
e:::nerges into tbe c·ceek.
2. Tracing studies should be performed in test sites 1 and 2 <'!nd ot!1er
appropriate locations in the &rea ldth enphasis on t:1e E:f;; tablishnwnt
of the sources of the Heramec Spr:r..g water.
3. Far<'.lJel field studies using fluorescein and Rhodamine PT should be
performed in order to evaluate the characteristics of the t~vo tracers
anclcr COiillJ2Table condi.tions.
Fi1.;.2.lJ.y ~ it is ·recol1h;J.ended that large quantities of the dye (3 pot:.nds
or J1Wn~ per tsst) be used in ficJ.d traeine; r; tudi..es in this area; this Js
c.):lsid.=rcrJ ;1ece~·.:::ary bec<::.use of the gr.?.at adsorpt~on em tr1e traceL" on
~•ti~erials Cllco,mt :;r..:~d :::_n the field <:.1'!.d t~1c possibility of extc-c.,:;ive dilu-
tion in subsurface reseTvoirs.

85
BIBLiOGRAPHY
1. ndall, S. L., "The New Challenge of Water," Journal American vJ"ater l·~orks Association, ~2_, 1199 (1967).
2. Geraghty, J. J., "Ground Hater- a Neglt:cted Resource," Journal .Ameri·.:an Hater Harks Association, 59, 820 (1967).
3. Kilzo, R. R., Quality, 11
"The Effect of Carbonate Karst Terrain on Hater M. S. Thesis, University of Missouri at Rolla (1965).
t_.. i·bang, J. C., "Quality of Surface and Subsu:cface h'ater in a Nissouri Carbonate Karst Terrain (Dry Fork, Norm~n, and Benton Creek Watersheds) , " M. S. Thesis, University of Hissouri at Rolla (1967).
5. Dunn, J. R., "Stream Tracing," National Speleologic<.~l Soc-:iety, }1id-· Arpalac~ian Re~ion Bulletin,~. 7 (1957).
6. KnodieiJ.mus, D. D. , "T:·:acer Studies and Backg·round Fluoresccmce of GrounC. W2ter in the Ocala, Florida, Area," United States Geological Survey, Open File Report (1967).
. ' . Wri~ht~ R. R., and Collings, M. R., ''Application of Fluorescent
Tracins Tech-::1iquEs to Hydrolo~ic Stud:ie·~," Journal Altl<::r-lc<xn
Hater 1-Tor~~s A~sociation, 5~.' 748 (11)64).
8. Ka11fr.1an, \,1 • J., and Orlo'!J, G. T., "Mr.,asnr:_ng Gcou~vl Hater ~1o',.rement \oJitn Rar.'Ucactive and Chem:Lc~n J:':rDc,~rs," Journal A'ner:[.c2i.1 r,;ater TIJ"l"K"" \·,s·o"J.. J.;-l· on LS ~. r;.ll (1956'1 '\.} ~ .• t.J <." . .J \ . .- L- ' _. _, ~ _, ./ J •
9. Fox, C. ;: . , "l sing ::Zadicac t~ve Isoto~es to T:.·:1ce Hovement of Underground Haters," Hun.icip<~l Utilities, 20. 30 (1952).
J 0 r) ) R B "n f T'l r 1' ~ n tl1e S rudy of J.iDde·rgrcnmd \J:l ters, 11 _ , • o _ e , , • • , '-· s e: o · · tl o esc e n .-.
United States Geological Survey, Wate= Supply Paper No. 160,
73 (l906).
].1. Haas, J. L., "Evaluation of Ground Hater Tracing Hethods Used in S ~')elec J.cgy, ' 1 Na tio:1.al Spe: leologic3.l Society Ballet in, 11,
67 (1959).
12. S ' · } c s "T1 Morio·,1s of Uaderc:rouad l·iaters," United :3t.ates .1.lC 1ter, . . , ,1e - <->
Geological Survey, Water Supply Paper No. 67, 48 (1902).
13. 1 c: c "The Rate of Hcvemer.t of U~;derground h'aters," s._.i.::.lltcr, ~·· o., u,1 iccd Stares Geological Survey, Water Supply Pa~er No. 140,
so (1905).

86
1.4. Ha1dmeyer, T. , "R:1 tes of F1m·.' of Underground \\1;;. te:r and the Choice of Tracers to Determine Them, 11 Journal Institute of ~-~a.ter Engineers, 1;_, 389 (1958).
15.
16.
17.
18.
~q
.L- •
2/J.
21.
2 ... , .....
24.
26.
27.
28.
29.
Carter, R. C., Kaufman, W. J., Orlob, G. T., and Todd,J. H., "Helium as a Ground Water Tracer," Journal G~ophysical Research, 64, 2433 (1959).
Voysey, E., "Ser~ati~ !:l_~scens," National Speleological Society, Nitt::tny Grotto Nev:sletter, }._, 8 (1957).
Burdon, D. J ~, Eriksson, E., Payne, B. R., P.?..p:'id:i.mitt:opoulos, T., and Papakis, N. , "Use of Tritil:.m in Tracing Karst Ground lvater i.n Greece," Intern<1 tional Atomic Energy Agency, Radicd.sotopes in Hydrology, Proceedings Series, Vienna, 309 (l~f.3); The Engineering I~dex, 802 (1965).
Turner, T. D. ~ "Stream Tracing, 11 Natio·11al Speleological Society, Nitta.ny Grotto Ne•vsletter, _2, 1 (1957).
Replogle, J. A., Meyers, L. E., and Brust, K. J., "Flow ~1e .. :.s~:."t",,P1cuts 'vi th Fluorescent Tracers, 11 Journal Hydraulics Divis ior .. , Air.,:ricau Society of Civil Engineers, 92, 1 (1966).
"How to T-::ac.e Ground Water F:i.m-1," P:;.blic ~vorks, _8_~, 75 (1951+).
Bu.::h.snan, T. J., "Time of Travel of Soluble Contar:1ina~1ts in Stremas, 11
Amerium Societ] of Civil Engineers Proceedings, 2._Q, 1 (1964).
"R::tdioiscJ\:Ci_)eS in Hydrology," Nucleonics, 21, 94 (1963).
C!.·ouch, .J. H., "Pie:zon:ei.::ric Lt?vels ar.d Sha1.lcw Aqu-;.fers, D·i.lJ en and , 1 ""1" • " ·•• S '~'" • U 'vr.r~l· .. v ~erarncc Spring Quaorang es, ~Lssour1, u. ·• Lncsln: n1 ~-~ -~.
of ~-iissouri ."-t Rolla (1965).
M~lMell, J. C., Gevcckar, V. A. C., and Grigo~orculos, S. G., "Ava.ila"bi1ity, Distribution, Qu:-.ntity ond Qu3lity rJf Hater Resoun.· 2s i.n C'Drbcnate Karst Terrain," Annual PJ:cgrom Report, ~,later Resources Research Center, U.1iversity of l'1issouri, 7 (1967) •
"\~ater Qt:nLi.ty o£ Big, Bourbeuse, and .r.reca!ll.ec River Bc>slns," The Hissouri Water Pollution Board (1964).
Clapha:n, H. F., Technical Hanager- Dyes, E. I. DuPont ce tl'8tT:ours & Company, Hilmington, Delt1~,,are, Personal Conn,unication (1968).
Hudek, A., Persanal Cmr..raunicaticn (1967).
Dillard, J. , Personal Cor.·uilUni.cation (1967).
Cmven, R. , Personal Cot!"!munication (1968).
87
30. Beckr!an, 1-l. C., and Hinchey, N. S., "The L:~~g0 Springs of Hissouri," Missouri Geological Survey and Water ResJurces, Rolla, Missouri, 97 (19/+4).
31. Kirk, R. E. , and Othmer, D. F. , "X.s.nthene Dyes,'' Encyclopedia of Chemical TechGology, 15, 136 (1956).
32. Maymard, C. W., E. I. DuPont de Nemours & C01apnny, Personal Commueication (1968).
33. Vinyard, .J., Head of Information and Publications Section, Nissouri Geological Survey and Hater Resources, Rolla, H:issouri, Personal Commun:i.cation (1968).
34. Tryon, C., Watershed Scientist, U. S. Forest Service, Rolla, Hissouri, Personal Cornmunication (1968).

88
VITA
Ja:c1es William Scanlan was born on Harch 31, 1944, in P2oria, Illinois.
He n~cei.ved his primary education at the St. Hark Grade School and his
secondary education at the Spalding Institute in Peoria.
lie graduated from the University of Missauri at Rolla with the degree
c£ Eac.helor of Science in Civil Engineering in Je.nuary, 1967. Following
g:r~:ciuation, the aut!1or enrolled as a grad~ate st1 ttlent at the Unlversity
of Yi:!..ssouri Rolla and ,.;as appointed as a Re' .. ·~arch Assi.st.ant in \\later
Rescurces; he has E-erved i.n this capacity continuously lo date.
'lhe aut.hu.r is :3. student mem?er uf the American Society of Civil
Eugi i."!2CJ.·s' AF<:>ric<'n vlater Hor.ks .\ssoci.ation, 1-Ja ter Pollution Control Feder
ation ::nd an associate ill:..!P1ber of the Society of the Sigma Xi. He is an
:Ln~inee1.·-·:Ln··Trrdni.1.<;; in Missouri.