Identification of organic acids as potential biomarkers in the urine of autistic children using gas...
7
Please cite this article in press as: J. Kału ˙ zna-Czapli ´ nska, et al., J. Chromatogr. B (2014), http://dx.doi.org/10.1016/j.jchromb.2014.01.041 ARTICLE IN PRESS G Model CHROMB-18753; No. of Pages 7 Journal of Chromatography B, xxx (2014) xxx–xxx Contents lists available at ScienceDirect Journal of Chromatography B jou rn al hom ep age: www.elsevier.com/locate/chromb Identification of organic acids as potential biomarkers in the urine of autistic children using gas chromatography/mass spectrometry Joanna Kału ˙ zna-Czapli ´ nska a,∗ , Ewa ˙ Zurawicz a , Wiktoria Struck b , Michał Markuszewski b a Institute of General and Ecological Chemistry, Department of Chemistry, Lodz University of Technology, ˙ Zeromskiego 116, 90-924 Łód´ z, Poland b Department of Biopharmacy and Pharmacodynamics, Medical University of Gda´ nsk, Hallera 107, 80-416 Gda´ nsk, Poland a r t i c l e i n f o Article history: Received 11 October 2013 Received in revised form 21 January 2014 Accepted 23 January 2014 Available online xxx Keywords: Organic acids Gas chromatography–mass spectrometry Biomarkers Autism Principal component analysis a b s t r a c t There is a need to identify metabolic phenotypes in autism as they might each require unique approaches to prevention. Biological markers can help define autism subtypes and reveal potential therapeutic tar- gets. The aim of the study was to identify alterations of small molecular weight compounds and to find potential biomarkers. Gas chromatography/mass spectrometry was employed to evaluate major metabolic changes in low molecular weight urine metabolites of 14 children with autism spectrum dis- orders vs. 10 non-autistic subjects. The results prove the usefulness of an identified set of 21 endogenous compounds (including 14 organic acids), whose levels are changed in diseased children. Gas chromatog- raphy/mass spectrometry method combined with multivariate statistical analysis techniques provide an efficient way of depicting metabolic perturbations of diseases, and may potentially be applicable as a novel strategy for the noninvasive diagnosis and treatment of autism. © 2014 Elsevier B.V. All rights reserved. 1. Introduction Autism spectrum disorders (ASD) is a complex developmen- tal disability which impairs social interaction and communication. It is characterized by Asperger syndrome, childhood disintegra- tive disorder, and pervasive developmental disorder not otherwise specified (PDDNOS) [1,2]. ASD typically appears during the first 3 years of life. Autism is a multifactorial disorder, which means that a lot of factors must be considered when determining the case. These factors include complex genetic interactions, nutritional deficien- cies or overloads, pre- and postnatal exposure to chemicals or Abbreviations: 3PGPH, 3-phosphoglycerate dehydrogenase; CE–MS, capillary electrophoresis–mass spectrometry; CNVs, copy number variations; CRC, col- orectal cancer; CSF, cerebrospinal fluid; GAII, glutaric aciduria type II; GC–MS, gas chromatography–mass spectrometry; LC–MS, liquid chromatography–mass spectrometry; MADD, multiple acyl-CoA-dehydrogenase deficiency; MSTFA, N- methyl-N-trimethylsilyl-trifluoroacetamide; NMR, nuclear magnetic resonance; PCA, principal component analysis; PKU, phenylketonuria; PLSCV, partial least square cross-validation; PPA, propionic acid; PSPH, phosphoserine phosphatase; SLC, solute carrier; SLOS, Smith–Lemli–Opitz syndrome; SNPs/VNTRs, sin- gle nucleotide polymorphisms/variable number of tandem repeats; TMCS, trimethylchlorosilane. This paper is part of the special issue “Metabolomics II” by G. Theodoridis and D. Tsikas. ∗ Corresponding author. Tel.: +48 426313091; fax: +48 4263131 28. E-mail addresses: [email protected], [email protected] (J. Kału ˙ zna-Czapli ´ nska). viruses, errors during the embryonic neural tube closure process, dysfunctional immune systems and allergies [3–6]. Many causes of autism have been suggested, but the information is still incomplete. There is indisputable evidence of the influence of genes on the pathogenesis of autism. Studies of identical twins show that if one twin is autistic, the probability that the other will be autistic is as high as 58% for boys and 60% for girls, while in the case of fraternal twins the probability falls to 21% for boys and 27% for girls [7]. Thus, it becomes clear that in order to explain the com- plexity of autism, many factors need to be considered, including the impact of genetic heterogeneity, reduced penetrance, epige- netic factors, the involvement of multiple genes, gene–gene and gene–environment interactions [8]. The recent research has focused on a number of known neu- rometabolic disorders identified as having an autistic phenotype, as well as on the theories related to other metabolic abnormal- ities thought to contribute to the development of autism [9]. These metabolic disorders include: phenylketonuria (PKU), dis- orders of purine metabolism, biotinidase deficiency, disorders of cerebrospinal fluid (CSF) neurotransmitters such as deficiencies of folic acid, Smith–Lemli–Opitz syndrome (SLOS), methylmalonic acidemia, dicarboxylic aciduria and other organic acids acidemias [9–14]. The coexistence of numerous psychiatric, behavior, neu- rodevelopmental as well as metabolic disorders in autism [15] requires the study of the relationship between these patholog- ical states. It is suspected that defects in the gut–blood barrier make it possible for the central nervous system to have access to compounds which can be neurotoxic, among them organic acids, 1570-0232/$ – see front matter © 2014 Elsevier B.V. All rights reserved. http://dx.doi.org/10.1016/j.jchromb.2014.01.041
Transcript of Identification of organic acids as potential biomarkers in the urine of autistic children using gas...
C
Ia
Ja
b
a
ARRAA
KOGBAP
1
tItsylfc
eogsmPsSgt
D
(
1h
ARTICLE IN PRESSG ModelHROMB-18753; No. of Pages 7
Journal of Chromatography B, xxx (2014) xxx–xxx
Contents lists available at ScienceDirect
Journal of Chromatography B
jou rn al hom ep age: www.elsev ier .com/ locate /chromb
dentification of organic acids as potential biomarkers in the urine ofutistic children using gas chromatography/mass spectrometry�
oanna Kałuzna-Czaplinskaa,∗, Ewa Zurawicza, Wiktoria Struckb, Michał Markuszewskib
Institute of General and Ecological Chemistry, Department of Chemistry, Lodz University of Technology, Zeromskiego 116, 90-924 Łódz, PolandDepartment of Biopharmacy and Pharmacodynamics, Medical University of Gdansk, Hallera 107, 80-416 Gdansk, Poland
r t i c l e i n f o
rticle history:eceived 11 October 2013eceived in revised form 21 January 2014ccepted 23 January 2014vailable online xxx
a b s t r a c t
There is a need to identify metabolic phenotypes in autism as they might each require unique approachesto prevention. Biological markers can help define autism subtypes and reveal potential therapeutic tar-gets. The aim of the study was to identify alterations of small molecular weight compounds and tofind potential biomarkers. Gas chromatography/mass spectrometry was employed to evaluate majormetabolic changes in low molecular weight urine metabolites of 14 children with autism spectrum dis-
eywords:rganic acidsas chromatography–mass spectrometryiomarkersutism
orders vs. 10 non-autistic subjects. The results prove the usefulness of an identified set of 21 endogenouscompounds (including 14 organic acids), whose levels are changed in diseased children. Gas chromatog-raphy/mass spectrometry method combined with multivariate statistical analysis techniques provide anefficient way of depicting metabolic perturbations of diseases, and may potentially be applicable as anovel strategy for the noninvasive diagnosis and treatment of autism.
rincipal component analysis
. Introduction
Autism spectrum disorders (ASD) is a complex developmen-al disability which impairs social interaction and communication.t is characterized by Asperger syndrome, childhood disintegra-ive disorder, and pervasive developmental disorder not otherwisepecified (PDDNOS) [1,2]. ASD typically appears during the first 3ears of life. Autism is a multifactorial disorder, which means that aot of factors must be considered when determining the case. These
Please cite this article in press as: J. Kałuzna-Czaplinska, et al., J. Chrom
actors include complex genetic interactions, nutritional deficien-ies or overloads, pre- and postnatal exposure to chemicals or
Abbreviations: 3PGPH, 3-phosphoglycerate dehydrogenase; CE–MS, capillarylectrophoresis–mass spectrometry; CNVs, copy number variations; CRC, col-rectal cancer; CSF, cerebrospinal fluid; GAII, glutaric aciduria type II; GC–MS,as chromatography–mass spectrometry; LC–MS, liquid chromatography–masspectrometry; MADD, multiple acyl-CoA-dehydrogenase deficiency; MSTFA, N-ethyl-N-trimethylsilyl-trifluoroacetamide; NMR, nuclear magnetic resonance;
CA, principal component analysis; PKU, phenylketonuria; PLSCV, partial leastquare cross-validation; PPA, propionic acid; PSPH, phosphoserine phosphatase;LC, solute carrier; SLOS, Smith–Lemli–Opitz syndrome; SNPs/VNTRs, sin-le nucleotide polymorphisms/variable number of tandem repeats; TMCS,rimethylchlorosilane.� This paper is part of the special issue “Metabolomics II” by G. Theodoridis and. Tsikas.∗ Corresponding author. Tel.: +48 426313091; fax: +48 4263131 28.
E-mail addresses: [email protected], [email protected]. Kałuzna-Czaplinska).
570-0232/$ – see front matter © 2014 Elsevier B.V. All rights reserved.ttp://dx.doi.org/10.1016/j.jchromb.2014.01.041
© 2014 Elsevier B.V. All rights reserved.
viruses, errors during the embryonic neural tube closure process,dysfunctional immune systems and allergies [3–6].
Many causes of autism have been suggested, but the informationis still incomplete. There is indisputable evidence of the influenceof genes on the pathogenesis of autism. Studies of identical twinsshow that if one twin is autistic, the probability that the other willbe autistic is as high as 58% for boys and 60% for girls, while in thecase of fraternal twins the probability falls to 21% for boys and 27%for girls [7]. Thus, it becomes clear that in order to explain the com-plexity of autism, many factors need to be considered, includingthe impact of genetic heterogeneity, reduced penetrance, epige-netic factors, the involvement of multiple genes, gene–gene andgene–environment interactions [8].
The recent research has focused on a number of known neu-rometabolic disorders identified as having an autistic phenotype,as well as on the theories related to other metabolic abnormal-ities thought to contribute to the development of autism [9].These metabolic disorders include: phenylketonuria (PKU), dis-orders of purine metabolism, biotinidase deficiency, disorders ofcerebrospinal fluid (CSF) neurotransmitters such as deficienciesof folic acid, Smith–Lemli–Opitz syndrome (SLOS), methylmalonicacidemia, dicarboxylic aciduria and other organic acids acidemias[9–14]. The coexistence of numerous psychiatric, behavior, neu-rodevelopmental as well as metabolic disorders in autism [15]
atogr. B (2014), http://dx.doi.org/10.1016/j.jchromb.2014.01.041
requires the study of the relationship between these patholog-ical states. It is suspected that defects in the gut–blood barriermake it possible for the central nervous system to have access tocompounds which can be neurotoxic, among them organic acids,
ING ModelC
2 . Chrom
c(tnrttobpbaeeaapaataStptc[
aeai(ofabtt
stsilaepmbs
yimnccrsof
uos
ARTICLEHROMB-18753; No. of Pages 7
J. Kałuzna-Czaplinska et al. / J
ausing the severity of symptoms in autism spectrum disordersASD) [16,17]. Organic acidurias may interfere with the regula-ion of glutamatergic and gamma-aminobutyric acid (GABA)ergiceurotransmission, neuroenergetics, handling of metabolic water,egulation of transport of hydrophilic compounds from and tohe brain compartment via the blood–brain barrier, as well ashe process of myelination [18]. Although it is difficult to extrap-late the mechanisms of organic acid blood-to-brain influx andrain-to-blood efflux transport, some general rules have beenrovided [19,20]. One of the main functions of the blood–brainarrier is to control the passage of products of metabolismnd xenobiotics. The blood–brain barrier includes brain capillaryndothelial cells and the blood–CSF barrier, which consists ofpithelial cells. Molecules cross the blood–brain barrier via mech-nisms which include diffusion of lipid-soluble small moleculess well as catalyzed transport by one of three families of trans-orters: carrier-mediated transport, receptor-mediated transport,ctive efflux transporters [21,22]. In the transport of organiccids across the blood–brain barrier, the following families ofhe solute carrier (SLC) group of membrane transport proteinsre involved: SLC13 (Na+-sulfate/carboxylate cotransporter) [23],LC16 (monocarboxylate transporter) [24], SLC21 (organic anionransporter) [25], SLC22 (organic cation/anion/zwitterion trans-orter) [26], SLC27 (fatty acid transport proteins) [27]. It is believedhat disruption of the blood–brain barrier in autistic childrenan be the result of acute stress, leaky gut and food intolerance28].
Because of a number of disorders occurring in autism, there is need to identify metabolic phenotypes in autism as they mightach require unique approaches to prevention or treatment. Therere treatment strategies consisting in the correction of biochem-cal imbalance in autistic patients such as: eradication of fungalCandida) overgrowth and restoration of gut integrity, removalf potential sources of opioid peptides from the diet (gluten-ree/casein-free diets) [29,30]. Pharmacotherapy of children withutism in the context of a number of metabolic disorders seems toe a very promising form of treatment, but we need to emphasizehat there is no clear evidence for the efficacy of this approach inhe study of large groups of children.
The study of biological markers may be an important step toolve this problem [31,32]. They can help to define autism sub-ypes and reveal potential therapeutic targets. A perfect markerhould be detectable with good sensitivity and specificity in biolog-cal samples from the patient [33]. Metabolomics, which analyzesow molecular weight compounds such an as organic acid andmino acid, was used as an effective tool for the diagnosis of dis-ase and phenotype prediction. Biological fluids such as urine andlasma contain metabolites which can provide valuable bioinfor-ation on the metabolism of organism [34]. Compared with the
lood sample, the analysis of urine is non-invasive and can giveimilar results.
Metabonomic studies in conjunction with multivariate anal-sis are proved to be a useful information-rich strategy fornvestigating the metabolic state of biological fluids based on
odern analytical techniques such as nuclear magnetic reso-ance (NMR), liquid chromatography/mass spectrometry (LC–MS),apillary electrophoresis–mass spectrometry (CE–MS) and gashromatography–mass spectrometry (GC–MS) [35–37]. Due to itselatively low cost, high separation efficiency and commercial masspectra libraries, gas chromatography/mass spectrometry is veryften used in metabonomic research of biological samples in dif-erent analyses [38].
Please cite this article in press as: J. Kałuzna-Czaplinska, et al., J. Chrom
The aim of this study was to identify alterations of small molec-lar weight compounds and find potential biomarkers in the urinef autistic children using gas chromatography coupled with masspectrometry.
PRESSatogr. B xxx (2014) xxx–xxx
2. Materials and methods
2.1. Participants
The study was restricted to children with a diagnosis of autismin compliance with the criteria detailed in the Diagnostic and Sta-tistical Manual of Mental Disorders [39]. All autistic children wereassessed and diagnosed by clinicians specializing in the diagnosisand management of autistic children from the Navicula.
2.2. Materials
2.2.1. Sample collectionAll overnight urine samples were collected from 14 autistic chil-
dren (4–10 years) who underwent rehabilitation in the Navicula– Center in Lodz and 10 non-autistic children as healthy controls(4–10 years). All procedures were carried out, having the writtenconsent of a parent. The study was performed in agreement withthe Standards and Ethics in Biological Rhythm Research [40]. Urinewas stored at −20 ◦C until analysis.
2.2.2. Chemicals and reagentsHeptadecanoic acid (98%) used as an internal standard
and N-methyl-N-trimethylsilyl-trifluoroacetamide (MSTFA),trimethylchlorosilane (TMCS), urease, methoxyamine, pyridinewere obtained from Sigma–Aldrich (Poznan, Poland). High perfor-mance liquid chromatography-grade ethyl acetate and methanolwere obtained from POCh (Gliwice, Poland).
2.3. Sample preparation
For sample preparation, we used a simple modification ofmethod described by Zhang et al. [41]. 200 �L of urine with 40units of urease were incubated at 35 ◦C for 20 min to decompose theurea present in the sample. Next, 800 �L of methanol and 100 �L ofheptadecanoic acid (1 mg/mL in ethyl acetate) used as IS (internalstandard) were added. The solution was extracted and centrifugedat 12,000 × g, 5 ◦C for 15 min. The supernatant was transferred to avial, and then evaporated to dryness under nitrogen at room tem-perature. 30 �L of methoxyamine in pyridine was added to a vialand the solution was vortexed for 5 min. The reaction of methox-imation lasted 24 h at room temperature. Next, the sample wastrimethylsilylated for another hour by adding 60 �L of MSTFA with1% TMCS. Before the GC–MS analysis, 50 �L of hexane was addedto the vial. All samples were prepared according to the same pro-cedure.
2.4. GC–MS analysis
1 �L of derivatized sample was injected splitless into an Agi-lent 6890N Network GC system and 5973 Network Mass Selectiveequipped with a capillary column (J&W Ultra Inert HP-5ms; Agi-lent Technology; 30 m × 0.25 mm internal diameter; film thickness,0.25 �m). The injector temperature was set at 250 ◦C. Helium wasused as a carrier gas at a constant flow rate of 0.9 mL/min throughthe column. The column temperature was initially kept at 50 ◦Cfor 1 min and then increased to 240 ◦C at 15 ◦C min−1 and furtherincreased at 30 ◦C min−1 to 300 ◦C. The MS quadrupole tempera-ture was set at 150 ◦C and the ion source temperature at 200 ◦C.Masses were acquired from m/z 50–800. GC–MSD ChemStationSoftware (Agilent) was used for autoacquisition of GC total ionchromatograms (TIC) and fragmentation patterns. Each compound
atogr. B (2014), http://dx.doi.org/10.1016/j.jchromb.2014.01.041
had a unique fragmentation pattern composed of a series of splitmolecular ions, whose mass charge ratios and abundance couldbe compared with the standard mass chromatogram in the NIST(National Institute of Standards and Technology) mass spectra
ING ModelC
. Chrom
lwsthTwriicaicvtgpoaprcosmawctpa
2
Gpsib
ARTICLEHROMB-18753; No. of Pages 7
J. Kałuzna-Czaplinska et al. / J
ibrary by the ChemStation Software. For each peak, the softwareill generate a list of similarities comparing them with every sub-
tance within the NIST library. Peaks with the similarity index morehan 80% were assigned compound names [42–44], while thoseaving less than 80% similarity were listed as unknown metabolites.he chromatograms were subjected to noise reduction and peaksith the intensity higher than threefold of the signal-to-noise (S/N)
atio were recorded prior to the peak area integration. The relativentensity of each peak was normalized against the internal standardn GC–MS run. All known artifact peaks such as peaks due to theolumn bleed and MSTFA artifact peaks did not enter the final datanalyses. Integrated peak areas of multiple derivative peaks belong-ng to the same compound were summed and considered a singleompound. Each sample was characterized by the same number ofariables and each of these variables was represented throughouthe observations by the same sequence. Thus, a data matrix wasenerated by intensities of the commensal peaks from all the sam-les to characterize the biochemical pattern of each sample. Thebtained matrix was then employed for the correlation analysisnd pattern recognition. For each case three urine aliquots wererocessed throughout the whole experimental process to test theeproducibility of sample preparation and GC–MS analysis. Analyti-al accuracy and precision were assessed by a consecutive injectionf the three derivatized samples into the GC system. To assess thetability of the analytical system, quality control (QC) samples wereeasured after every fourth run. Prior to QC sample measurement,
liquots of the same volume of all urine samples from this studyere pooled. They were prepared once and measured in tripli-
ate. All urine samples were analyzed with GC–MS according tohe method described above. The stability of the response per com-ound was expressed in relative standard deviation (RSD) of peakreas.
.5. Data processing and pattern recognition
After the GC–MS analysis each sample was represented byC–MS TIC, and the peak areas of compounds were integrated. The
Please cite this article in press as: J. Kałuzna-Czaplinska, et al., J. Chrom
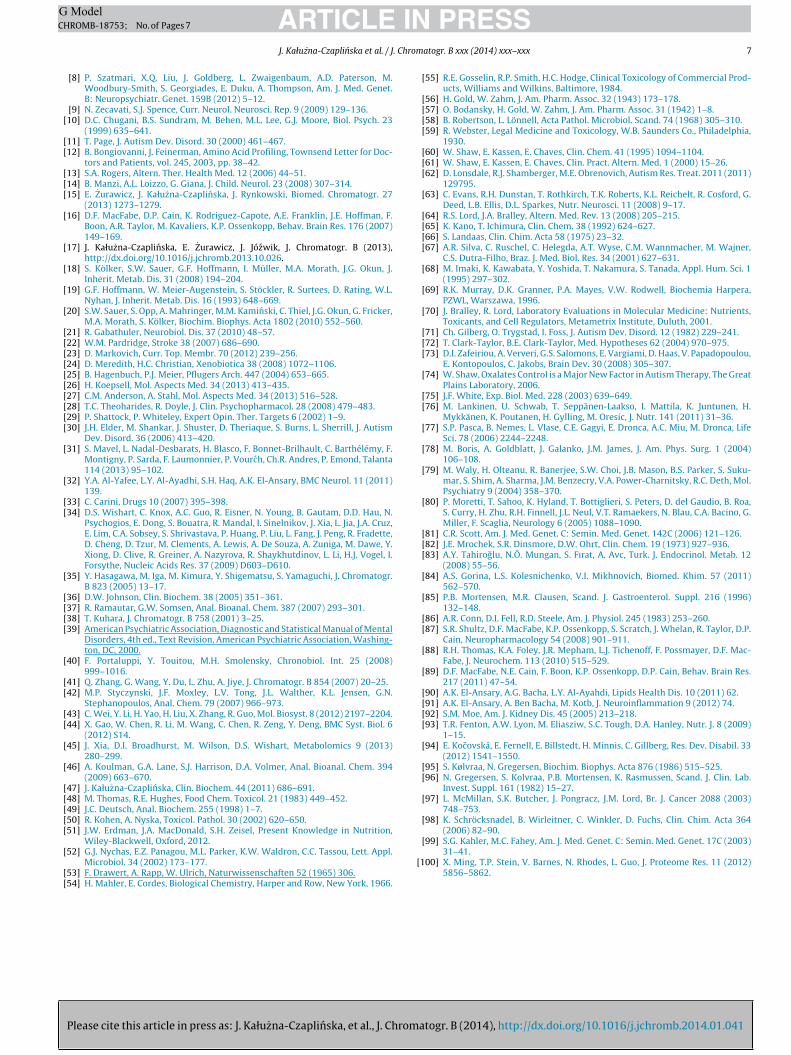
eak area ratio of each compound to the corresponding internaltandard was calculated as the response. The majority of the peaksn the chromatograms were identified as endogenous metabolitesy NIST mass spectra library, including amino acids, organic acids,
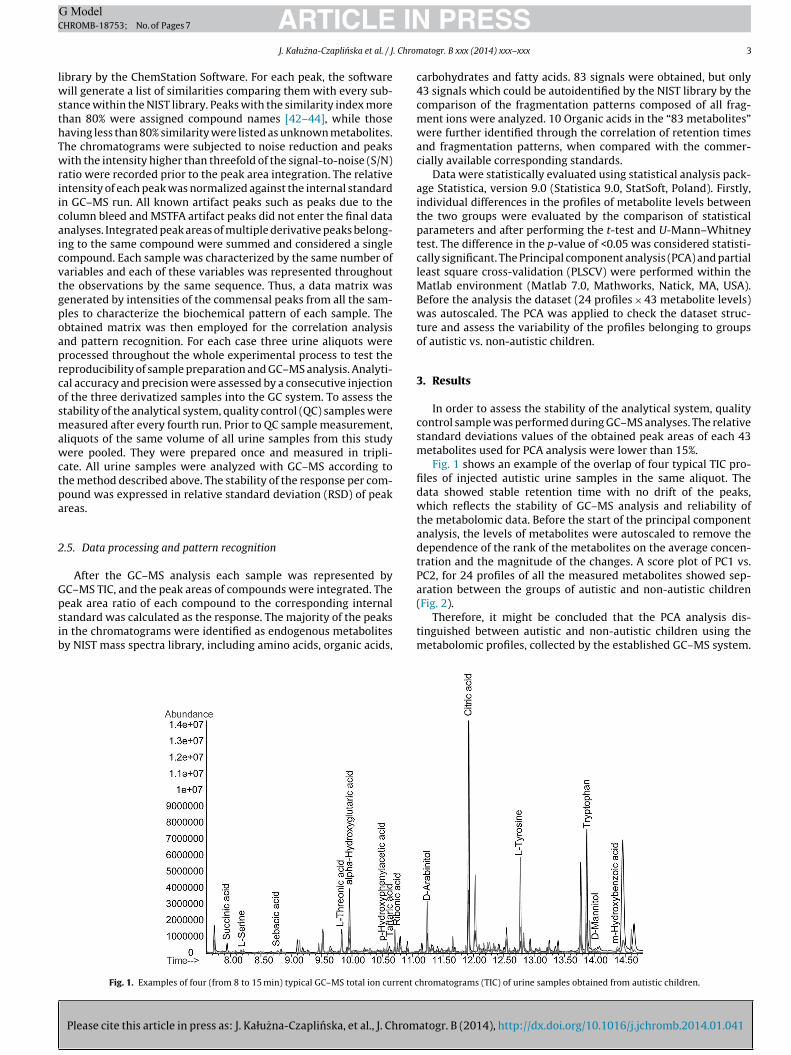
Fig. 1. Examples of four (from 8 to 15 min) typical GC–MS total ion current c
PRESSatogr. B xxx (2014) xxx–xxx 3
carbohydrates and fatty acids. 83 signals were obtained, but only43 signals which could be autoidentified by the NIST library by thecomparison of the fragmentation patterns composed of all frag-ment ions were analyzed. 10 Organic acids in the “83 metabolites”were further identified through the correlation of retention timesand fragmentation patterns, when compared with the commer-cially available corresponding standards.
Data were statistically evaluated using statistical analysis pack-age Statistica, version 9.0 (Statistica 9.0, StatSoft, Poland). Firstly,individual differences in the profiles of metabolite levels betweenthe two groups were evaluated by the comparison of statisticalparameters and after performing the t-test and U-Mann–Whitneytest. The difference in the p-value of <0.05 was considered statisti-cally significant. The Principal component analysis (PCA) and partialleast square cross-validation (PLSCV) were performed within theMatlab environment (Matlab 7.0, Mathworks, Natick, MA, USA).Before the analysis the dataset (24 profiles × 43 metabolite levels)was autoscaled. The PCA was applied to check the dataset struc-ture and assess the variability of the profiles belonging to groupsof autistic vs. non-autistic children.
3. Results
In order to assess the stability of the analytical system, qualitycontrol sample was performed during GC–MS analyses. The relativestandard deviations values of the obtained peak areas of each 43metabolites used for PCA analysis were lower than 15%.
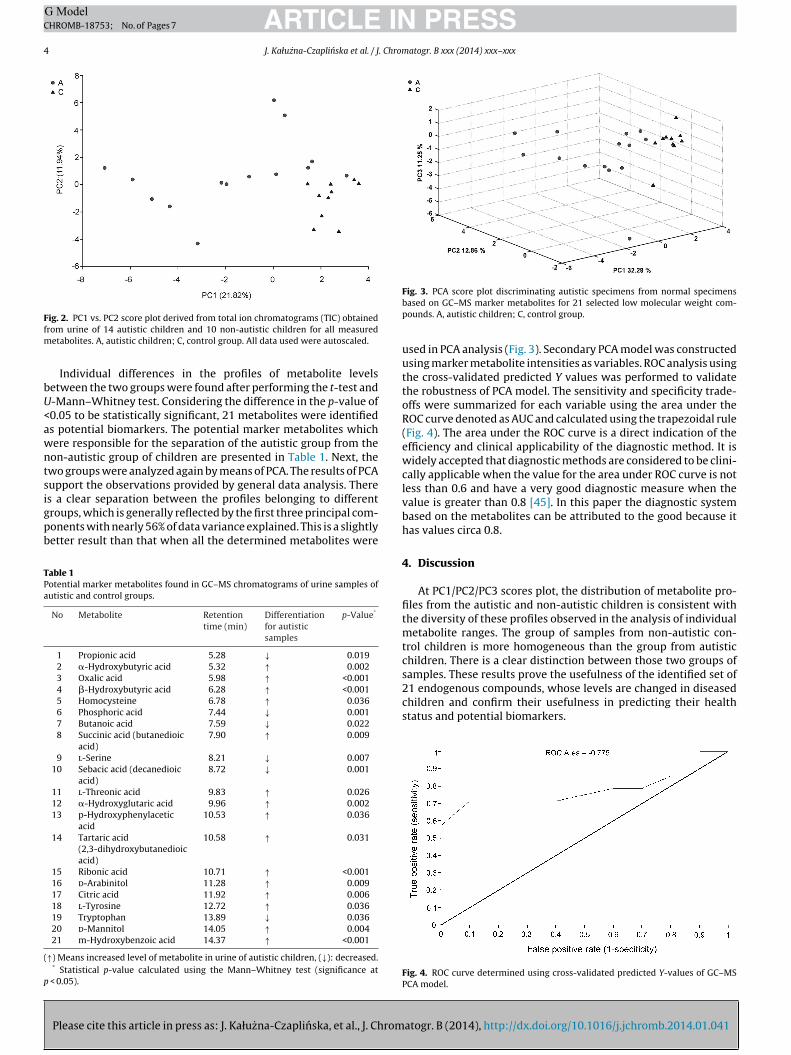
Fig. 1 shows an example of the overlap of four typical TIC pro-files of injected autistic urine samples in the same aliquot. Thedata showed stable retention time with no drift of the peaks,which reflects the stability of GC–MS analysis and reliability ofthe metabolomic data. Before the start of the principal componentanalysis, the levels of metabolites were autoscaled to remove thedependence of the rank of the metabolites on the average concen-tration and the magnitude of the changes. A score plot of PC1 vs.PC2, for 24 profiles of all the measured metabolites showed sep-aration between the groups of autistic and non-autistic children
atogr. B (2014), http://dx.doi.org/10.1016/j.jchromb.2014.01.041
(Fig. 2).Therefore, it might be concluded that the PCA analysis dis-
tinguished between autistic and non-autistic children using themetabolomic profiles, collected by the established GC–MS system.
hromatograms (TIC) of urine samples obtained from autistic children.
ARTICLE IN PRESSG ModelCHROMB-18753; No. of Pages 7
4 J. Kałuzna-Czaplinska et al. / J. Chromatogr. B xxx (2014) xxx–xxx
Ffm
bU<awntsigpb
TPa
(
p
ig. 2. PC1 vs. PC2 score plot derived from total ion chromatograms (TIC) obtainedrom urine of 14 autistic children and 10 non-autistic children for all measured
etabolites. A, autistic children; C, control group. All data used were autoscaled.
Individual differences in the profiles of metabolite levelsetween the two groups were found after performing the t-test and-Mann–Whitney test. Considering the difference in the p-value of0.05 to be statistically significant, 21 metabolites were identifieds potential biomarkers. The potential marker metabolites whichere responsible for the separation of the autistic group from theon-autistic group of children are presented in Table 1. Next, thewo groups were analyzed again by means of PCA. The results of PCAupport the observations provided by general data analysis. There
Please cite this article in press as: J. Kałuzna-Czaplinska, et al., J. Chrom
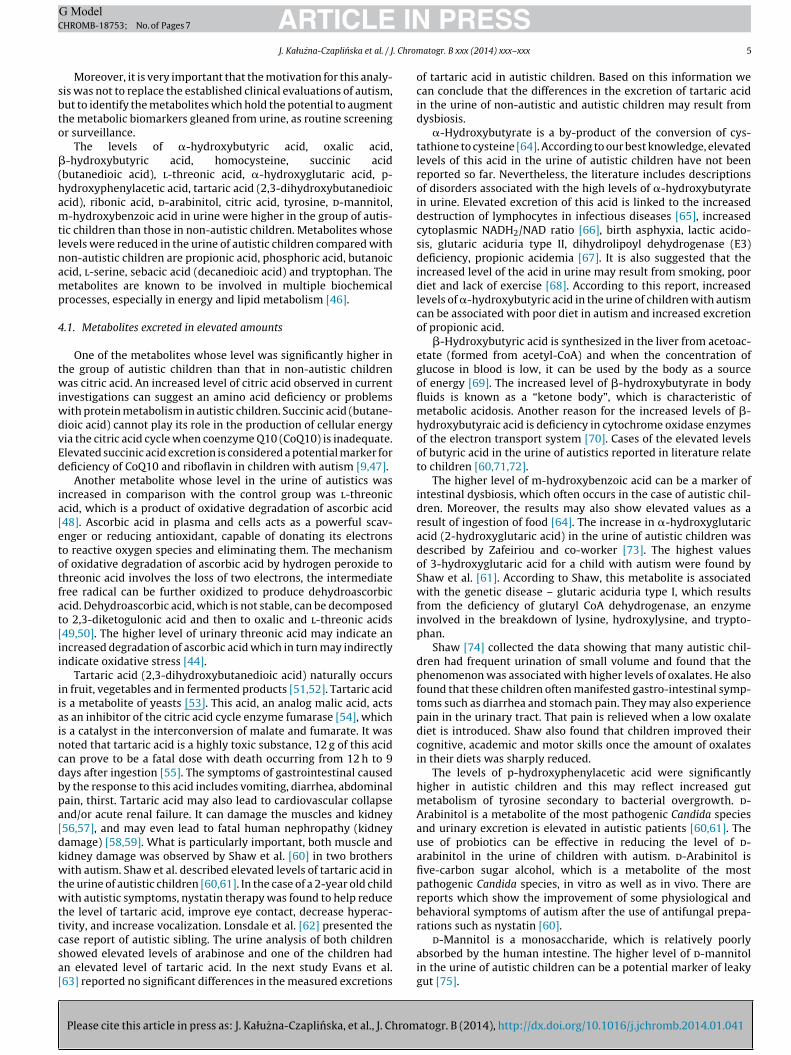
s a clear separation between the profiles belonging to differentroups, which is generally reflected by the first three principal com-onents with nearly 56% of data variance explained. This is a slightlyetter result than that when all the determined metabolites were
able 1otential marker metabolites found in GC–MS chromatograms of urine samples ofutistic and control groups.
No Metabolite Retentiontime (min)
Differentiationfor autisticsamples
p-Value*
1 Propionic acid 5.28 ↓ 0.0192 �-Hydroxybutyric acid 5.32 ↑ 0.0023 Oxalic acid 5.98 ↑ <0.0014 �-Hydroxybutyric acid 6.28 ↑ <0.0015 Homocysteine 6.78 ↑ 0.0366 Phosphoric acid 7.44 ↓ 0.0017 Butanoic acid 7.59 ↓ 0.0228 Succinic acid (butanedioic
acid)7.90 ↑ 0.009
9 l-Serine 8.21 ↓ 0.00710 Sebacic acid (decanedioic
acid)8.72 ↓ 0.001
11 l-Threonic acid 9.83 ↑ 0.02612 �-Hydroxyglutaric acid 9.96 ↑ 0.00213 p-Hydroxyphenylacetic
acid10.53 ↑ 0.036
14 Tartaric acid(2,3-dihydroxybutanedioicacid)
10.58 ↑ 0.031
15 Ribonic acid 10.71 ↑ <0.00116 d-Arabinitol 11.28 ↑ 0.00917 Citric acid 11.92 ↑ 0.00618 l-Tyrosine 12.72 ↑ 0.03619 Tryptophan 13.89 ↓ 0.03620 d-Mannitol 14.05 ↑ 0.00421 m-Hydroxybenzoic acid 14.37 ↑ <0.001
↑) Means increased level of metabolite in urine of autistic children, (↓): decreased.* Statistical p-value calculated using the Mann–Whitney test (significance at
< 0.05).
Fig. 3. PCA score plot discriminating autistic specimens from normal specimensbased on GC–MS marker metabolites for 21 selected low molecular weight com-pounds. A, autistic children; C, control group.
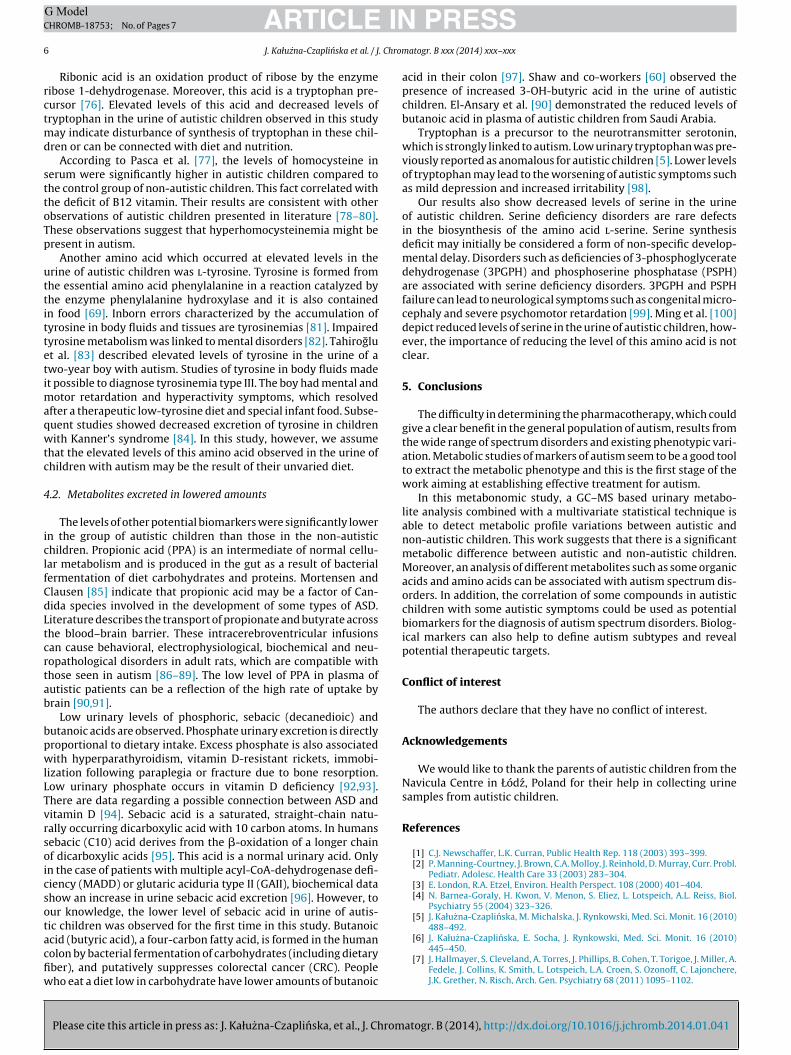
used in PCA analysis (Fig. 3). Secondary PCA model was constructedusing marker metabolite intensities as variables. ROC analysis usingthe cross-validated predicted Y values was performed to validatethe robustness of PCA model. The sensitivity and specificity trade-offs were summarized for each variable using the area under theROC curve denoted as AUC and calculated using the trapezoidal rule(Fig. 4). The area under the ROC curve is a direct indication of theefficiency and clinical applicability of the diagnostic method. It iswidely accepted that diagnostic methods are considered to be clini-cally applicable when the value for the area under ROC curve is notless than 0.6 and have a very good diagnostic measure when thevalue is greater than 0.8 [45]. In this paper the diagnostic systembased on the metabolites can be attributed to the good because ithas values circa 0.8.
4. Discussion
At PC1/PC2/PC3 scores plot, the distribution of metabolite pro-files from the autistic and non-autistic children is consistent withthe diversity of these profiles observed in the analysis of individualmetabolite ranges. The group of samples from non-autistic con-trol children is more homogeneous than the group from autisticchildren. There is a clear distinction between those two groups ofsamples. These results prove the usefulness of the identified set of
atogr. B (2014), http://dx.doi.org/10.1016/j.jchromb.2014.01.041
21 endogenous compounds, whose levels are changed in diseasedchildren and confirm their usefulness in predicting their healthstatus and potential biomarkers.
Fig. 4. ROC curve determined using cross-validated predicted Y-values of GC–MSPCA model.
ING ModelC
. Chrom
sbto
�(hamtlnamp
4
twiwdvEd
ia[etotfat[ii
iiaincdbpa[dkwtwttcsa[
ARTICLEHROMB-18753; No. of Pages 7
J. Kałuzna-Czaplinska et al. / J
Moreover, it is very important that the motivation for this analy-is was not to replace the established clinical evaluations of autism,ut to identify the metabolites which hold the potential to augmenthe metabolic biomarkers gleaned from urine, as routine screeningr surveillance.
The levels of �-hydroxybutyric acid, oxalic acid,-hydroxybutyric acid, homocysteine, succinic acid
butanedioic acid), l-threonic acid, �-hydroxyglutaric acid, p-ydroxyphenylacetic acid, tartaric acid (2,3-dihydroxybutanedioiccid), ribonic acid, d-arabinitol, citric acid, tyrosine, d-mannitol,-hydroxybenzoic acid in urine were higher in the group of autis-
ic children than those in non-autistic children. Metabolites whoseevels were reduced in the urine of autistic children compared withon-autistic children are propionic acid, phosphoric acid, butanoiccid, l-serine, sebacic acid (decanedioic acid) and tryptophan. Theetabolites are known to be involved in multiple biochemical
rocesses, especially in energy and lipid metabolism [46].
.1. Metabolites excreted in elevated amounts
One of the metabolites whose level was significantly higher inhe group of autistic children than that in non-autistic childrenas citric acid. An increased level of citric acid observed in current
nvestigations can suggest an amino acid deficiency or problemsith protein metabolism in autistic children. Succinic acid (butane-ioic acid) cannot play its role in the production of cellular energyia the citric acid cycle when coenzyme Q10 (CoQ10) is inadequate.levated succinic acid excretion is considered a potential marker foreficiency of CoQ10 and riboflavin in children with autism [9,47].
Another metabolite whose level in the urine of autistics wasncreased in comparison with the control group was l-threoniccid, which is a product of oxidative degradation of ascorbic acid48]. Ascorbic acid in plasma and cells acts as a powerful scav-nger or reducing antioxidant, capable of donating its electronso reactive oxygen species and eliminating them. The mechanismf oxidative degradation of ascorbic acid by hydrogen peroxide tohreonic acid involves the loss of two electrons, the intermediateree radical can be further oxidized to produce dehydroascorbiccid. Dehydroascorbic acid, which is not stable, can be decomposedo 2,3-diketogulonic acid and then to oxalic and l-threonic acids49,50]. The higher level of urinary threonic acid may indicate anncreased degradation of ascorbic acid which in turn may indirectlyndicate oxidative stress [44].
Tartaric acid (2,3-dihydroxybutanedioic acid) naturally occursn fruit, vegetables and in fermented products [51,52]. Tartaric acids a metabolite of yeasts [53]. This acid, an analog malic acid, actss an inhibitor of the citric acid cycle enzyme fumarase [54], whichs a catalyst in the interconversion of malate and fumarate. It wasoted that tartaric acid is a highly toxic substance, 12 g of this acidan prove to be a fatal dose with death occurring from 12 h to 9ays after ingestion [55]. The symptoms of gastrointestinal causedy the response to this acid includes vomiting, diarrhea, abdominalain, thirst. Tartaric acid may also lead to cardiovascular collapsend/or acute renal failure. It can damage the muscles and kidney56,57], and may even lead to fatal human nephropathy (kidneyamage) [58,59]. What is particularly important, both muscle andidney damage was observed by Shaw et al. [60] in two brothersith autism. Shaw et al. described elevated levels of tartaric acid in
he urine of autistic children [60,61]. In the case of a 2-year old childith autistic symptoms, nystatin therapy was found to help reduce
he level of tartaric acid, improve eye contact, decrease hyperac-ivity, and increase vocalization. Lonsdale et al. [62] presented the
Please cite this article in press as: J. Kałuzna-Czaplinska, et al., J. Chrom
ase report of autistic sibling. The urine analysis of both childrenhowed elevated levels of arabinose and one of the children hadn elevated level of tartaric acid. In the next study Evans et al.63] reported no significant differences in the measured excretions
PRESSatogr. B xxx (2014) xxx–xxx 5
of tartaric acid in autistic children. Based on this information wecan conclude that the differences in the excretion of tartaric acidin the urine of non-autistic and autistic children may result fromdysbiosis.
�-Hydroxybutyrate is a by-product of the conversion of cys-tathione to cysteine [64]. According to our best knowledge, elevatedlevels of this acid in the urine of autistic children have not beenreported so far. Nevertheless, the literature includes descriptionsof disorders associated with the high levels of �-hydroxybutyratein urine. Elevated excretion of this acid is linked to the increaseddestruction of lymphocytes in infectious diseases [65], increasedcytoplasmic NADH2/NAD ratio [66], birth asphyxia, lactic acido-sis, glutaric aciduria type II, dihydrolipoyl dehydrogenase (E3)deficiency, propionic acidemia [67]. It is also suggested that theincreased level of the acid in urine may result from smoking, poordiet and lack of exercise [68]. According to this report, increasedlevels of �-hydroxybutyric acid in the urine of children with autismcan be associated with poor diet in autism and increased excretionof propionic acid.
�-Hydroxybutyric acid is synthesized in the liver from acetoac-etate (formed from acetyl-CoA) and when the concentration ofglucose in blood is low, it can be used by the body as a sourceof energy [69]. The increased level of �-hydroxybutyrate in bodyfluids is known as a “ketone body”, which is characteristic ofmetabolic acidosis. Another reason for the increased levels of �-hydroxybutyraic acid is deficiency in cytochrome oxidase enzymesof the electron transport system [70]. Cases of the elevated levelsof butyric acid in the urine of autistics reported in literature relateto children [60,71,72].
The higher level of m-hydroxybenzoic acid can be a marker ofintestinal dysbiosis, which often occurs in the case of autistic chil-dren. Moreover, the results may also show elevated values as aresult of ingestion of food [64]. The increase in �-hydroxyglutaricacid (2-hydroxyglutaric acid) in the urine of autistic children wasdescribed by Zafeiriou and co-worker [73]. The highest valuesof 3-hydroxyglutaric acid for a child with autism were found byShaw et al. [61]. According to Shaw, this metabolite is associatedwith the genetic disease – glutaric aciduria type I, which resultsfrom the deficiency of glutaryl CoA dehydrogenase, an enzymeinvolved in the breakdown of lysine, hydroxylysine, and trypto-phan.
Shaw [74] collected the data showing that many autistic chil-dren had frequent urination of small volume and found that thephenomenon was associated with higher levels of oxalates. He alsofound that these children often manifested gastro-intestinal symp-toms such as diarrhea and stomach pain. They may also experiencepain in the urinary tract. That pain is relieved when a low oxalatediet is introduced. Shaw also found that children improved theircognitive, academic and motor skills once the amount of oxalatesin their diets was sharply reduced.
The levels of p-hydroxyphenylacetic acid were significantlyhigher in autistic children and this may reflect increased gutmetabolism of tyrosine secondary to bacterial overgrowth. d-Arabinitol is a metabolite of the most pathogenic Candida speciesand urinary excretion is elevated in autistic patients [60,61]. Theuse of probiotics can be effective in reducing the level of d-arabinitol in the urine of children with autism. d-Arabinitol isfive-carbon sugar alcohol, which is a metabolite of the mostpathogenic Candida species, in vitro as well as in vivo. There arereports which show the improvement of some physiological andbehavioral symptoms of autism after the use of antifungal prepa-rations such as nystatin [60].
atogr. B (2014), http://dx.doi.org/10.1016/j.jchromb.2014.01.041
d-Mannitol is a monosaccharide, which is relatively poorlyabsorbed by the human intestine. The higher level of d-mannitolin the urine of autistic children can be a potential marker of leakygut [75].
ING ModelC
6 . Chrom
rctmd
sttoTp
uttittetimaqwtc
4
iclfCdLtcrtab
bpwlLTvrsoicsotacfiw
ARTICLEHROMB-18753; No. of Pages 7
J. Kałuzna-Czaplinska et al. / J
Ribonic acid is an oxidation product of ribose by the enzymeibose 1-dehydrogenase. Moreover, this acid is a tryptophan pre-ursor [76]. Elevated levels of this acid and decreased levels ofryptophan in the urine of autistic children observed in this study
ay indicate disturbance of synthesis of tryptophan in these chil-ren or can be connected with diet and nutrition.
According to Pasca et al. [77], the levels of homocysteine inerum were significantly higher in autistic children compared tohe control group of non-autistic children. This fact correlated withhe deficit of B12 vitamin. Their results are consistent with otherbservations of autistic children presented in literature [78–80].hese observations suggest that hyperhomocysteinemia might beresent in autism.
Another amino acid which occurred at elevated levels in therine of autistic children was l-tyrosine. Tyrosine is formed fromhe essential amino acid phenylalanine in a reaction catalyzed byhe enzyme phenylalanine hydroxylase and it is also containedn food [69]. Inborn errors characterized by the accumulation ofyrosine in body fluids and tissues are tyrosinemias [81]. Impairedyrosine metabolism was linked to mental disorders [82]. Tahiroglut al. [83] described elevated levels of tyrosine in the urine of awo-year boy with autism. Studies of tyrosine in body fluids madet possible to diagnose tyrosinemia type III. The boy had mental and
otor retardation and hyperactivity symptoms, which resolvedfter a therapeutic low-tyrosine diet and special infant food. Subse-uent studies showed decreased excretion of tyrosine in childrenith Kanner’s syndrome [84]. In this study, however, we assume
hat the elevated levels of this amino acid observed in the urine ofhildren with autism may be the result of their unvaried diet.
.2. Metabolites excreted in lowered amounts
The levels of other potential biomarkers were significantly lowern the group of autistic children than those in the non-autistichildren. Propionic acid (PPA) is an intermediate of normal cellu-ar metabolism and is produced in the gut as a result of bacterialermentation of diet carbohydrates and proteins. Mortensen andlausen [85] indicate that propionic acid may be a factor of Can-ida species involved in the development of some types of ASD.iterature describes the transport of propionate and butyrate acrosshe blood–brain barrier. These intracerebroventricular infusionsan cause behavioral, electrophysiological, biochemical and neu-opathological disorders in adult rats, which are compatible withhose seen in autism [86–89]. The low level of PPA in plasma ofutistic patients can be a reflection of the high rate of uptake byrain [90,91].
Low urinary levels of phosphoric, sebacic (decanedioic) andutanoic acids are observed. Phosphate urinary excretion is directlyroportional to dietary intake. Excess phosphate is also associatedith hyperparathyroidism, vitamin D-resistant rickets, immobi-
ization following paraplegia or fracture due to bone resorption.ow urinary phosphate occurs in vitamin D deficiency [92,93].here are data regarding a possible connection between ASD anditamin D [94]. Sebacic acid is a saturated, straight-chain natu-ally occurring dicarboxylic acid with 10 carbon atoms. In humansebacic (C10) acid derives from the �-oxidation of a longer chainf dicarboxylic acids [95]. This acid is a normal urinary acid. Onlyn the case of patients with multiple acyl-CoA-dehydrogenase defi-iency (MADD) or glutaric aciduria type II (GAII), biochemical datahow an increase in urine sebacic acid excretion [96]. However, tour knowledge, the lower level of sebacic acid in urine of autis-ic children was observed for the first time in this study. Butanoic
Please cite this article in press as: J. Kałuzna-Czaplinska, et al., J. Chrom
cid (butyric acid), a four-carbon fatty acid, is formed in the humanolon by bacterial fermentation of carbohydrates (including dietaryber), and putatively suppresses colorectal cancer (CRC). Peopleho eat a diet low in carbohydrate have lower amounts of butanoic
PRESSatogr. B xxx (2014) xxx–xxx
acid in their colon [97]. Shaw and co-workers [60] observed thepresence of increased 3-OH-butyric acid in the urine of autisticchildren. El-Ansary et al. [90] demonstrated the reduced levels ofbutanoic acid in plasma of autistic children from Saudi Arabia.
Tryptophan is a precursor to the neurotransmitter serotonin,which is strongly linked to autism. Low urinary tryptophan was pre-viously reported as anomalous for autistic children [5]. Lower levelsof tryptophan may lead to the worsening of autistic symptoms suchas mild depression and increased irritability [98].
Our results also show decreased levels of serine in the urineof autistic children. Serine deficiency disorders are rare defectsin the biosynthesis of the amino acid l-serine. Serine synthesisdeficit may initially be considered a form of non-specific develop-mental delay. Disorders such as deficiencies of 3-phosphoglyceratedehydrogenase (3PGPH) and phosphoserine phosphatase (PSPH)are associated with serine deficiency disorders. 3PGPH and PSPHfailure can lead to neurological symptoms such as congenital micro-cephaly and severe psychomotor retardation [99]. Ming et al. [100]depict reduced levels of serine in the urine of autistic children, how-ever, the importance of reducing the level of this amino acid is notclear.
5. Conclusions
The difficulty in determining the pharmacotherapy, which couldgive a clear benefit in the general population of autism, results fromthe wide range of spectrum disorders and existing phenotypic vari-ation. Metabolic studies of markers of autism seem to be a good toolto extract the metabolic phenotype and this is the first stage of thework aiming at establishing effective treatment for autism.
In this metabonomic study, a GC–MS based urinary metabo-lite analysis combined with a multivariate statistical technique isable to detect metabolic profile variations between autistic andnon-autistic children. This work suggests that there is a significantmetabolic difference between autistic and non-autistic children.Moreover, an analysis of different metabolites such as some organicacids and amino acids can be associated with autism spectrum dis-orders. In addition, the correlation of some compounds in autisticchildren with some autistic symptoms could be used as potentialbiomarkers for the diagnosis of autism spectrum disorders. Biolog-ical markers can also help to define autism subtypes and revealpotential therapeutic targets.
Conflict of interest
The authors declare that they have no conflict of interest.
Acknowledgements
We would like to thank the parents of autistic children from theNavicula Centre in Łódz, Poland for their help in collecting urinesamples from autistic children.
References
[1] C.J. Newschaffer, L.K. Curran, Public Health Rep. 118 (2003) 393–399.[2] P. Manning-Courtney, J. Brown, C.A. Molloy, J. Reinhold, D. Murray, Curr. Probl.
Pediatr. Adolesc. Health Care 33 (2003) 283–304.[3] E. London, R.A. Etzel, Environ. Health Perspect. 108 (2000) 401–404.[4] N. Barnea-Goraly, H. Kwon, V. Menon, S. Eliez, L. Lotspeich, A.L. Reiss, Biol.
Psychiatry 55 (2004) 323–326.[5] J. Kałuzna-Czaplinska, M. Michalska, J. Rynkowski, Med. Sci. Monit. 16 (2010)
488–492.
atogr. B (2014), http://dx.doi.org/10.1016/j.jchromb.2014.01.041
[6] J. Kałuzna-Czaplinska, E. Socha, J. Rynkowski, Med. Sci. Monit. 16 (2010)445–450.
[7] J. Hallmayer, S. Cleveland, A. Torres, J. Phillips, B. Cohen, T. Torigoe, J. Miller, A.Fedele, J. Collins, K. Smith, L. Lotspeich, L.A. Croen, S. Ozonoff, C. Lajonchere,J.K. Grether, N. Risch, Arch. Gen. Psychiatry 68 (2011) 1095–1102.
ING ModelC
. Chrom
(2006) 82–90.
ARTICLEHROMB-18753; No. of Pages 7
J. Kałuzna-Czaplinska et al. / J
[8] P. Szatmari, X.Q. Liu, J. Goldberg, L. Zwaigenbaum, A.D. Paterson, M.Woodbury-Smith, S. Georgiades, E. Duku, A. Thompson, Am. J. Med. Genet.B: Neuropsychiatr. Genet. 159B (2012) 5–12.
[9] N. Zecavati, S.J. Spence, Curr. Neurol. Neurosci. Rep. 9 (2009) 129–136.[10] D.C. Chugani, B.S. Sundram, M. Behen, M.L. Lee, G.J. Moore, Biol. Psych. 23
(1999) 635–641.[11] T. Page, J. Autism Dev. Disord. 30 (2000) 461–467.[12] B. Bongiovanni, J. Feinerman, Amino Acid Profiling, Townsend Letter for Doc-
tors and Patients, vol. 245, 2003, pp. 38–42.[13] S.A. Rogers, Altern. Ther. Health Med. 12 (2006) 44–51.[14] B. Manzi, A.L. Loizzo, G. Giana, J. Child. Neurol. 23 (2008) 307–314.[15] E. Zurawicz, J. Kałuzna-Czaplinska, J. Rynkowski, Biomed. Chromatogr. 27
(2013) 1273–1279.[16] D.F. MacFabe, D.P. Cain, K. Rodriguez-Capote, A.E. Franklin, J.E. Hoffman, F.
Boon, A.R. Taylor, M. Kavaliers, K.P. Ossenkopp, Behav. Brain Res. 176 (2007)149–169.
[17] J. Kałuzna-Czaplinska, E. Zurawicz, J. Józwik, J. Chromatogr. B (2013),http://dx.doi.org/10.1016/j.jchromb.2013.10.026.
[18] S. Kölker, S.W. Sauer, G.F. Hoffmann, I. Müller, M.A. Morath, J.G. Okun, J.Inherit. Metab. Dis. 31 (2008) 194–204.
[19] G.F. Hoffmann, W. Meier-Augenstein, S. Stöckler, R. Surtees, D. Rating, W.L.Nyhan, J. Inherit. Metab. Dis. 16 (1993) 648–669.
[20] S.W. Sauer, S. Opp, A. Mahringer, M.M. Kaminski, C. Thiel, J.G. Okun, G. Fricker,M.A. Morath, S. Kölker, Biochim. Biophys. Acta 1802 (2010) 552–560.
[21] R. Gabathuler, Neurobiol. Dis. 37 (2010) 48–57.[22] W.M. Pardridge, Stroke 38 (2007) 686–690.[23] D. Markovich, Curr. Top. Membr. 70 (2012) 239–256.[24] D. Meredith, H.C. Christian, Xenobiotica 38 (2008) 1072–1106.[25] B. Hagenbuch, P.J. Meier, Pflugers Arch. 447 (2004) 653–665.[26] H. Koepsell, Mol. Aspects Med. 34 (2013) 413–435.[27] C.M. Anderson, A. Stahl, Mol. Aspects Med. 34 (2013) 516–528.[28] T.C. Theoharides, R. Doyle, J. Clin. Psychopharmacol. 28 (2008) 479–483.[29] P. Shattock, P. Whiteley, Expert Opin. Ther. Targets 6 (2002) 1–9.[30] J.H. Elder, M. Shankar, J. Shuster, D. Theriaque, S. Burns, L. Sherrill, J. Autism
Dev. Disord. 36 (2006) 413–420.[31] S. Mavel, L. Nadal-Desbarats, H. Blasco, F. Bonnet-Brilhault, C. Barthélémy, F.
Montigny, P. Sarda, F. Laumonnier, P. Vourch, Ch.R. Andres, P. Emond, Talanta114 (2013) 95–102.
[32] Y.A. Al-Yafee, L.Y. Al-Ayadhi, S.H. Haq, A.K. El-Ansary, BMC Neurol. 11 (2011)139.
[33] C. Carini, Drugs 10 (2007) 395–398.[34] D.S. Wishart, C. Knox, A.C. Guo, R. Eisner, N. Young, B. Gautam, D.D. Hau, N.
Psychogios, E. Dong, S. Bouatra, R. Mandal, I. Sinelnikov, J. Xia, L. Jia, J.A. Cruz,E. Lim, C.A. Sobsey, S. Shrivastava, P. Huang, P. Liu, L. Fang, J. Peng, R. Fradette,D. Cheng, D. Tzur, M. Clements, A. Lewis, A. De Souza, A. Zuniga, M. Dawe, Y.Xiong, D. Clive, R. Greiner, A. Nazyrova, R. Shaykhutdinov, L. Li, H.J. Vogel, I.Forsythe, Nucleic Acids Res. 37 (2009) D603–D610.
[35] Y. Hasagawa, M. Iga, M. Kimura, Y. Shigematsu, S. Yamaguchi, J. Chromatogr.B 823 (2005) 13–17.
[36] D.W. Johnson, Clin. Biochem. 38 (2005) 351–361.[37] R. Ramautar, G.W. Somsen, Anal. Bioanal. Chem. 387 (2007) 293–301.[38] T. Kuhara, J. Chromatogr. B 758 (2001) 3–25.[39] American Psychiatric Association, Diagnostic and Statistical Manual of Mental
Disorders, 4th ed., Text Revision, American Psychiatric Association, Washing-ton, DC, 2000.
[40] F. Portaluppi, Y. Touitou, M.H. Smolensky, Chronobiol. Int. 25 (2008)999–1016.
[41] Q. Zhang, G. Wang, Y. Du, L. Zhu, A. Jiye, J. Chromatogr. B 854 (2007) 20–25.[42] M.P. Styczynski, J.F. Moxley, L.V. Tong, J.L. Walther, K.L. Jensen, G.N.
Stephanopoulos, Anal. Chem. 79 (2007) 966–973.[43] C. Wei, Y. Li, H. Yao, H. Liu, X. Zhang, R. Guo, Mol. Biosyst. 8 (2012) 2197–2204.[44] X. Gao, W. Chen, R. Li, M. Wang, C. Chen, R. Zeng, Y. Deng, BMC Syst. Biol. 6
(2012) S14.[45] J. Xia, D.I. Broadhurst, M. Wilson, D.S. Wishart, Metabolomics 9 (2013)
280–299.[46] A. Koulman, G.A. Lane, S.J. Harrison, D.A. Volmer, Anal. Bioanal. Chem. 394
(2009) 663–670.[47] J. Kałuzna-Czaplinska, Clin. Biochem. 44 (2011) 686–691.[48] M. Thomas, R.E. Hughes, Food Chem. Toxicol. 21 (1983) 449–452.[49] J.C. Deutsch, Anal. Biochem. 255 (1998) 1–7.[50] R. Kohen, A. Nyska, Toxicol. Pathol. 30 (2002) 620–650.[51] J.W. Erdman, J.A. MacDonald, S.H. Zeisel, Present Knowledge in Nutrition,
Please cite this article in press as: J. Kałuzna-Czaplinska, et al., J. Chrom
Wiley-Blackwell, Oxford, 2012.[52] G.J. Nychas, E.Z. Panagou, M.L. Parker, K.W. Waldron, C.C. Tassou, Lett. Appl.
Microbiol. 34 (2002) 173–177.[53] F. Drawert, A. Rapp, W. Ulrich, Naturwissenschaften 52 (1965) 306.[54] H. Mahler, E. Cordes, Biological Chemistry, Harper and Row, New York, 1966.
PRESSatogr. B xxx (2014) xxx–xxx 7
[55] R.E. Gosselin, R.P. Smith, H.C. Hodge, Clinical Toxicology of Commercial Prod-ucts, Williams and Wilkins, Baltimore, 1984.
[56] H. Gold, W. Zahm, J. Am. Pharm. Assoc. 32 (1943) 173–178.[57] O. Bodansky, H. Gold, W. Zahm, J. Am. Pharm. Assoc. 31 (1942) 1–8.[58] B. Robertson, L. Lönnell, Acta Pathol. Microbiol. Scand. 74 (1968) 305–310.[59] R. Webster, Legal Medicine and Toxicology, W.B. Saunders Co., Philadelphia,
1930.[60] W. Shaw, E. Kassen, E. Chaves, Clin. Chem. 41 (1995) 1094–1104.[61] W. Shaw, E. Kassen, E. Chaves, Clin. Pract. Altern. Med. 1 (2000) 15–26.[62] D. Lonsdale, R.J. Shamberger, M.E. Obrenovich, Autism Res. Treat. 2011 (2011)
129795.[63] C. Evans, R.H. Dunstan, T. Rothkirch, T.K. Roberts, K.L. Reichelt, R. Cosford, G.
Deed, L.B. Ellis, D.L. Sparkes, Nutr. Neurosci. 11 (2008) 9–17.[64] R.S. Lord, J.A. Bralley, Altern. Med. Rev. 13 (2008) 205–215.[65] K. Kano, T. Ichimura, Clin. Chem. 38 (1992) 624–627.[66] S. Landaas, Clin. Chim. Acta 58 (1975) 23–32.[67] A.R. Silva, C. Ruschel, C. Helegda, A.T. Wyse, C.M. Wannmacher, M. Wajner,
C.S. Dutra-Filho, Braz. J. Med. Biol. Res. 34 (2001) 627–631.[68] M. Imaki, K. Kawabata, Y. Yoshida, T. Nakamura, S. Tanada, Appl. Hum. Sci. 1
(1995) 297–302.[69] R.K. Murray, D.K. Granner, P.A. Mayes, V.W. Rodwell, Biochemia Harpera,
PZWL, Warszawa, 1996.[70] J. Bralley, R. Lord, Laboratory Evaluations in Molecular Medicine: Nutrients,
Toxicants, and Cell Regulators, Metametrix Institute, Duluth, 2001.[71] Ch. Gilberg, O. Trygstad, I. Foss, J. Autism Dev. Disord. 12 (1982) 229–241.[72] T. Clark-Taylor, B.E. Clark-Taylor, Med. Hypotheses 62 (2004) 970–975.[73] D.I. Zafeiriou, A. Ververi, G.S. Salomons, E. Vargiami, D. Haas, V. Papadopoulou,
E. Kontopoulos, C. Jakobs, Brain Dev. 30 (2008) 305–307.[74] W. Shaw, Oxalates Control is a Major New Factor in Autism Therapy, The Great
Plains Laboratory, 2006.[75] J.F. White, Exp. Biol. Med. 228 (2003) 639–649.[76] M. Lankinen, U. Schwab, T. Seppänen-Laakso, I. Mattila, K. Juntunen, H.
Mykkänen, K. Poutanen, H. Gylling, M. Oresic, J. Nutr. 141 (2011) 31–36.[77] S.P. Pasca, B. Nemes, L. Vlase, C.E. Gagyi, E. Dronca, A.C. Miu, M. Dronca, Life
Sci. 78 (2006) 2244–2248.[78] M. Boris, A. Goldblatt, J. Galanko, J.M. James, J. Am. Phys. Surg. 1 (2004)
106–108.[79] M. Waly, H. Olteanu, R. Banerjee, S.W. Choi, J.B. Mason, B.S. Parker, S. Suku-
mar, S. Shim, A. Sharma, J.M. Benzecry, V.A. Power-Charnitsky, R.C. Deth, Mol.Psychiatry 9 (2004) 358–370.
[80] P. Moretti, T. Sahoo, K. Hyland, T. Bottiglieri, S. Peters, D. del Gaudio, B. Roa,S. Curry, H. Zhu, R.H. Finnell, J.L. Neul, V.T. Ramaekers, N. Blau, C.A. Bacino, G.Miller, F. Scaglia, Neurology 6 (2005) 1088–1090.
[81] C.R. Scott, Am. J. Med. Genet. C: Semin. Med. Genet. 142C (2006) 121–126.[82] J.E. Mrochek, S.R. Dinsmore, D.W. Ohrt, Clin. Chem. 19 (1973) 927–936.[83] A.Y. Tahiroglu, N.Ö. Mungan, S. Fırat, A. Avc, Turk. J. Endocrinol. Metab. 12
(2008) 55–56.[84] A.S. Gorina, L.S. Kolesnichenko, V.I. Mikhnovich, Biomed. Khim. 57 (2011)
562–570.[85] P.B. Mortensen, M.R. Clausen, Scand. J. Gastroenterol. Suppl. 216 (1996)
132–148.[86] A.R. Conn, D.I. Fell, R.D. Steele, Am. J. Physiol. 245 (1983) 253–260.[87] S.R. Shultz, D.F. MacFabe, K.P. Ossenkopp, S. Scratch, J. Whelan, R. Taylor, D.P.
Cain, Neuropharmacology 54 (2008) 901–911.[88] R.H. Thomas, K.A. Foley, J.R. Mepham, L.J. Tichenoff, F. Possmayer, D.F. Mac-
Fabe, J. Neurochem. 113 (2010) 515–529.[89] D.F. MacFabe, N.E. Cain, F. Boon, K.P. Ossenkopp, D.P. Cain, Behav. Brain Res.
217 (2011) 47–54.[90] A.K. El-Ansary, A.G. Bacha, L.Y. Al-Ayahdi, Lipids Health Dis. 10 (2011) 62.[91] A.K. El-Ansary, A. Ben Bacha, M. Kotb, J. Neuroinflammation 9 (2012) 74.[92] S.M. Moe, Am. J. Kidney Dis. 45 (2005) 213–218.[93] T.R. Fenton, A.W. Lyon, M. Eliasziw, S.C. Tough, D.A. Hanley, Nutr. J. 8 (2009)
1–15.[94] E. Kocovská, E. Fernell, E. Billstedt, H. Minnis, C. Gillberg, Res. Dev. Disabil. 33
(2012) 1541–1550.[95] S. Kølvraa, N. Gregersen, Biochim. Biophys. Acta 876 (1986) 515–525.[96] N. Gregersen, S. Kolvraa, P.B. Mortensen, K. Rasmussen, Scand. J. Clin. Lab.
Invest. Suppl. 161 (1982) 15–27.[97] L. McMillan, S.K. Butcher, J. Pongracz, J.M. Lord, Br. J. Cancer 2088 (2003)
748–753.[98] K. Schröcksnadel, B. Wirleitner, C. Winkler, D. Fuchs, Clin. Chim. Acta 364
atogr. B (2014), http://dx.doi.org/10.1016/j.jchromb.2014.01.041
[99] S.G. Kahler, M.C. Fahey, Am. J. Med. Genet. C: Semin. Med. Genet. 17C (2003)31–41.
[100] X. Ming, T.P. Stein, V. Barnes, N. Rhodes, L. Guo, J. Proteome Res. 11 (2012)5856–5862.