Pruning of Sensation Mango Trees to Maintain Their Size and ...
Upload
independentCategory
view
1download
0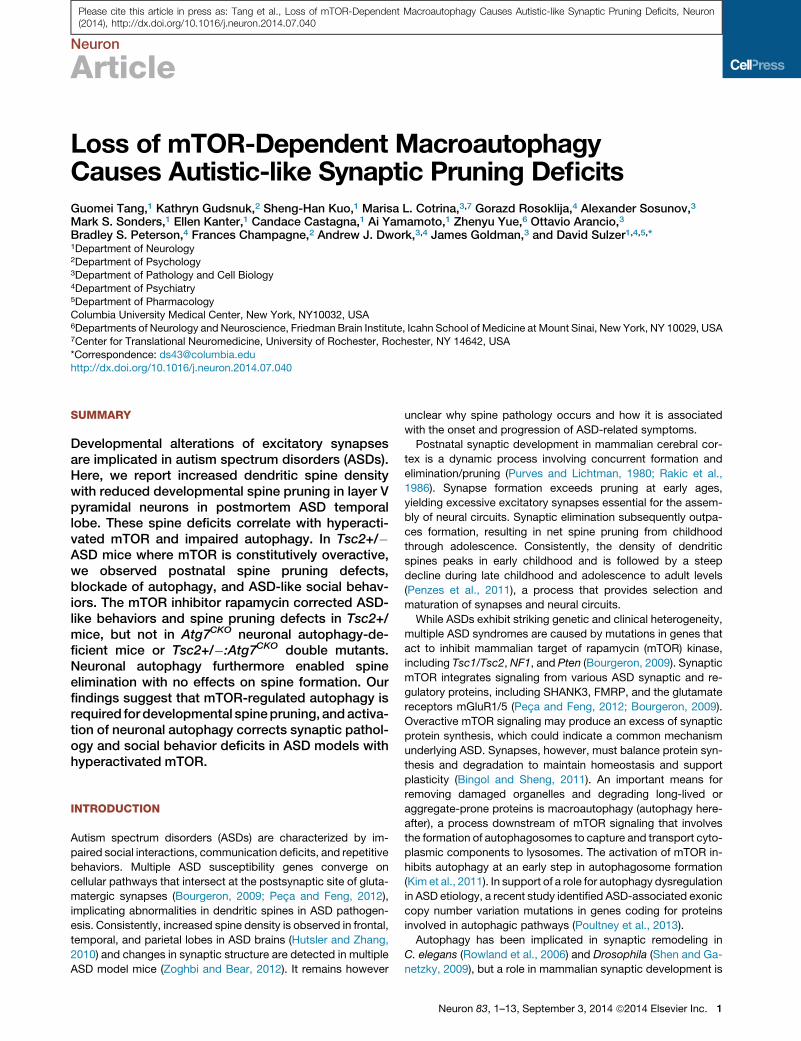
Please cite this article in press as: Tang et al., Loss of mTOR-Dependent Macroautophagy Causes Autistic-like Synaptic Pruning Deficits, Neuron(2014), http://dx.doi.org/10.1016/j.neuron.2014.07.040
Neuron
Article
Loss of mTOR-Dependent MacroautophagyCauses Autistic-like Synaptic Pruning DeficitsGuomei Tang,1 Kathryn Gudsnuk,2 Sheng-Han Kuo,1 Marisa L. Cotrina,3,7 Gorazd Rosoklija,4 Alexander Sosunov,3
Mark S. Sonders,1 Ellen Kanter,1 Candace Castagna,1 Ai Yamamoto,1 Zhenyu Yue,6 Ottavio Arancio,3
Bradley S. Peterson,4 Frances Champagne,2 Andrew J. Dwork,3,4 James Goldman,3 and David Sulzer1,4,5,*1Department of Neurology2Department of Psychology3Department of Pathology and Cell Biology4Department of Psychiatry5Department of PharmacologyColumbia University Medical Center, New York, NY10032, USA6Departments of Neurology and Neuroscience, Friedman Brain Institute, Icahn School of Medicine at Mount Sinai, New York, NY 10029, USA7Center for Translational Neuromedicine, University of Rochester, Rochester, NY 14642, USA
*Correspondence: [email protected]://dx.doi.org/10.1016/j.neuron.2014.07.040
SUMMARY
Developmental alterations of excitatory synapsesare implicated in autism spectrum disorders (ASDs).Here, we report increased dendritic spine densitywith reduced developmental spine pruning in layer Vpyramidal neurons in postmortem ASD temporallobe. These spine deficits correlate with hyperacti-vated mTOR and impaired autophagy. In Tsc2+/�ASD mice where mTOR is constitutively overactive,we observed postnatal spine pruning defects,blockade of autophagy, and ASD-like social behav-iors. The mTOR inhibitor rapamycin corrected ASD-like behaviors and spine pruning defects in Tsc2+/mice, but not in Atg7CKO neuronal autophagy-de-ficient mice or Tsc2+/�:Atg7CKO double mutants.Neuronal autophagy furthermore enabled spineelimination with no effects on spine formation. Ourfindings suggest that mTOR-regulated autophagy isrequired for developmental spinepruning, andactiva-tion of neuronal autophagy corrects synaptic pathol-ogy and social behavior deficits in ASD models withhyperactivated mTOR.
INTRODUCTION
Autism spectrum disorders (ASDs) are characterized by im-
paired social interactions, communication deficits, and repetitive
behaviors. Multiple ASD susceptibility genes converge on
cellular pathways that intersect at the postsynaptic site of gluta-
matergic synapses (Bourgeron, 2009; Peca and Feng, 2012),
implicating abnormalities in dendritic spines in ASD pathogen-
esis. Consistently, increased spine density is observed in frontal,
temporal, and parietal lobes in ASD brains (Hutsler and Zhang,
2010) and changes in synaptic structure are detected in multiple
ASD model mice (Zoghbi and Bear, 2012). It remains however
unclear why spine pathology occurs and how it is associated
with the onset and progression of ASD-related symptoms.
Postnatal synaptic development in mammalian cerebral cor-
tex is a dynamic process involving concurrent formation and
elimination/pruning (Purves and Lichtman, 1980; Rakic et al.,
1986). Synapse formation exceeds pruning at early ages,
yielding excessive excitatory synapses essential for the assem-
bly of neural circuits. Synaptic elimination subsequently outpa-
ces formation, resulting in net spine pruning from childhood
through adolescence. Consistently, the density of dendritic
spines peaks in early childhood and is followed by a steep
decline during late childhood and adolescence to adult levels
(Penzes et al., 2011), a process that provides selection and
maturation of synapses and neural circuits.
While ASDs exhibit striking genetic and clinical heterogeneity,
multiple ASD syndromes are caused by mutations in genes that
act to inhibit mammalian target of rapamycin (mTOR) kinase,
including Tsc1/Tsc2, NF1, and Pten (Bourgeron, 2009). Synaptic
mTOR integrates signaling from various ASD synaptic and re-
gulatory proteins, including SHANK3, FMRP, and the glutamate
receptors mGluR1/5 (Peca and Feng, 2012; Bourgeron, 2009).
Overactive mTOR signaling may produce an excess of synaptic
protein synthesis, which could indicate a common mechanism
underlying ASD. Synapses, however, must balance protein syn-
thesis and degradation to maintain homeostasis and support
plasticity (Bingol and Sheng, 2011). An important means for
removing damaged organelles and degrading long-lived or
aggregate-prone proteins is macroautophagy (autophagy here-
after), a process downstream of mTOR signaling that involves
the formation of autophagosomes to capture and transport cyto-
plasmic components to lysosomes. The activation of mTOR in-
hibits autophagy at an early step in autophagosome formation
(Kim et al., 2011). In support of a role for autophagy dysregulation
in ASD etiology, a recent study identified ASD-associated exonic
copy number variation mutations in genes coding for proteins
involved in autophagic pathways (Poultney et al., 2013).
Autophagy has been implicated in synaptic remodeling in
C. elegans (Rowland et al., 2006) and Drosophila (Shen and Ga-
netzky, 2009), but a role in mammalian synaptic development is
Neuron 83, 1–13, September 3, 2014 ª2014 Elsevier Inc. 1

Neuron
Autism and Neuronal Autophagy
Please cite this article in press as: Tang et al., Loss of mTOR-Dependent Macroautophagy Causes Autistic-like Synaptic Pruning Deficits, Neuron(2014), http://dx.doi.org/10.1016/j.neuron.2014.07.040
unexplored. We hypothesized that autophagy remodels syn-
apse maturation downstream of mTOR, and autophagy defi-
ciency downstream of overactivated mTOR contributes to ASD
synaptic pathology. We found a higher spine density in basal
dendrites of layer V pyramidal neurons in ASD patients than in
controls. The increased spine density was associated with a
defect in net postnatal spine pruning that was correlated with
hyperactivated mTOR and impaired autophagy. Using Tsc1/2
mutant ASD mice and Atg7CKO neuronal autophagy-deficient
mice, we found that aberrant autophagy andmTOR hyperactiva-
tion underlies ASD-like synaptic pathology and correcting auto-
phagy signaling could normalize developmental dendritic spine
pruning defects and social behaviors.
RESULTS
Dendritic Spine Pruning Deficits in ASD Human BrainWemeasured dendritic spines of basal dendrites of layer V pyra-
midal neurons in the superior middle temporal lobe, Brodmann
Area 21 (BA21), a region implicated in ASD due to its partici-
pation in brain networks involved in social and communicative
processes, including language, social and speech perception,
auditory and visual processing, and comprehension of intentions
(Redcay, 2008; Zahn et al., 2007). Abnormalities in ASD temporal
lobe have been confirmed by functional imaging and patholog-
ical studies, including disturbed gene transcription profiles (Gar-
bett et al., 2008; Voineagu et al., 2011), increased dendritic spine
densities in pyramidal neurons (Hutsler and Zhang, 2010), and
reduced functional specialization (Shih et al., 2011).
We compared dendritic spine morphology in ASD patients
and controls (demographic data in Table S1 available online)
using the Golgi-Kopsch technique. In the adolescent group,
only males were examined to exclude effects of hormone status.
No correlation was revealed between spine density and poten-
tial confounding factors, including postmortem interval (PMI),
seizure history, cause of death, brain pH, or tissue storage (Table
S2). As in previous studies (Harris et al., 1992), dendritic protru-
sions with the ratio of head/neck diameter >1 were classified as
spines. The spines were characterized by a neck 0.9–3.0 mm
long and a spine head diameter of 0.5–2.0 mm (Figures S1A
and S1B). The average spine head diameter (p = 0.519) and spine
length (p = 0.819) from individual neurons were similar in ASD
patients and controls at all ages examined (Figures S1C and
S1D). The mean net spine density per individual was significantly
higher in ASD patients than in controls (Figures 1A and 1B:
mean ± SD: 11.32 ± 1.23 spines/10 mm versus 8.81 ± 2.77
spines/10 mm, p = 0.017, two tailed t test).
Linear regression of spine density with age indicated a sub-
stantially greater level of net spine pruning in controls (slope =
�0.40 spines/10 mm/year, R2 = 0.93) than in ASD patients
(slope = �0.19/10 mm/year, R2 = 0.55; difference from linear
regression of controls, F = 9.4, p = 0.007) (Figure 1C). Due to
the limited number of brain samples available, we grouped pa-
tients and controls into two age categories: childhood (2–9 years)
and adolescence (13–20 years) (Figures 1D and 1E). Analysis
revealed profound effects of both disease and age on spine den-
sity (p < 0.001, two-way ANOVA, effect of disease: F (1, 16) =
73.11, p < 0.001; effect of age: F (1, 16) = 145.7, p < 0.001; dis-
2 Neuron 83, 1–13, September 3, 2014 ª2014 Elsevier Inc.
ease 3 age interaction: F (1, 16) = 28.35, p < 0.001). The spine
density was slightly higher in childhood ASD patients than con-
trols (mean ±SD: 12.32 ± 0.60 spines/10 mm in ASD cases versus
11.37 ± 0.68 spines/10 mm in controls) but markedly higher
in adolescent ASD patients than controls (10.33 ± 0.74 spines/
10 mm in ASD cases versus 6.24 ± 0.59 spines/10 mm in
controls). From childhood through adolescence, dendritic spines
decreased by �45% in control subjects but only by �16% in
ASD patients (Figure 1E), demonstrating a developmental defect
in net spine pruning in ASD.
Disturbed mTOR-Autophagy Signaling and SpinePruning in ASDTo test the hypothesis that mTOR-autophagy signaling is
disturbed in ASD and associated with ASD spine pathology,
we performed western blot analysis of phospho-mTOR
(p-mTOR), total mTOR (t-mTOR), phospho-S6 (p-S6), total S6
(t-S6), and the autophagosome marker LC3 and p62 (Figures
2A and 2F) in frozen BA21 brain samples from age-, gender-,
and PMI- matched ASD patients and controls (demographic
data in Table S3). To determine the relationship between
mTOR activity and density of dendritic spines, we examined
the protein levels of postsynaptic marker PSD95 and the presyn-
aptic protein synapsin I (Figure 2A).
No effects of PMI, cause of death, brain pH, or length of stor-
age on protein levels were detected (Table S2). We observed
a decrease in p-mTOR level with age in controls and higher
p-mTOR level in ASD patients than in controls at 13–20 years
(Figure 2B). We observed similar changes in p-S6, a reporter
for mTOR activity (Figure 2C). PSD95 protein level was higher
in controls aged 2–10 years than controls aged 13–20 years,
consistent with normal developmental spine pruning. This
decrease in PSD95 level with age was absent in ASD patients
(Figure 2D), consistent with the lower spine pruning in ASD pa-
tients. The presynaptic marker synapsin I exhibited a near-signif-
icant decrease with age in controls but not in patients (Figure 2E).
Levels of p-mTOR were correlated with PSD95 (Figure 2I), indi-
cating that lower mTOR activity is associated with a higher den-
dritic spine density in children and adolescents.
To determine whether impaired autophagy underlies the spine
pruning deficit in human ASD, we characterized basal autophagy
in postmortem tissue of the temporal lobe in patients with ASD.
The level of LC3-II, a biomarker that indicates the abundance of
autophagosomes, was significantly lower in ASD patients than
controls throughout childhood and adolescence (Figures 2F
and 2G), while the level of p62, a protein substrate for autophagy,
was higher in both childhood and adolescent ASD patients than
controls (Figures 2F and 2H). These data suggest a low level of
basal autophagy in ASD temporal cortex throughout develop-
ment. LC3-II and p62 protein levels were not correlated with
any confounding factor for tissue preservation but were corre-
lated with seizure activity (Table S2), a common feature of ASD.
The impairment in autophagy in ASD patients was confirmed
by immunolabel of LC3-positive puncta in BA21 layer V: the
cellular area occupied by LC3 puncta and the integrated inten-
sity of LC3 puncta were lower in pyramidal neurons from ASD
patients than age-matched controls during both early childhood
and adolescence (Figures S1E, S1F, and S1G). Decreased

Figure 1. Dendritic Spine Pruning in Temporal Lobe of ASD Patients and Controls
(A) Representative Golgi images for postmortem human temporal lobe (left, 103, stitched from nine separate image stacks), layer V pyramidal neurons with basal
dendritic tree (top middle, 203, pseudocolored in red; bottom middle, 403, pseudocolored in green; scale bar, 50 mm). The right four panels (1003; scale bar,
5 mm) are representative images of proximal basal dendritic segments from two control subjects (C, aged 8 years and 18 years) and two ASD cases (A, aged
7 years and 15 years).
(B) Distribution of spine density (mean ± SD) in basal dendrites after the first bifurcation. Age and diagnosis are indicated for each sample. Controls aged 2–8 years
[C(2–8 years)]: n = 5; controls aged 13–18 years [C(13–18 years)]: n = 5; ASD cases aged 2–8 years [A(2–8 years)]: n = 5; ASD cases aged 13–18 years
[A(13–18 years)]: n = 5. Each point represents the average spine density for each individual neuron measured from each individual.
(C) A linear regression of spine density with age in the control subjects (n = 10) and ASD patients (n = 10). The number of spines per 10 mmwas plotted against the
age of each individual. Broken lines indicate 95% confidence intervals.
(D) Spine density (mean ± SD) for the controls and ASD patients in childhood and adolescence. Each point represents the mean spine density for an individual.
Two-way ANOVA, Bonferroni post hoc test. ***p < 0.001, *p < 0.05.
(E) The decrease of spine density with age was greater in the controls than the ASD patients (mean ± SD). ***p < 0.001.
Neuron
Autism and Neuronal Autophagy
Please cite this article in press as: Tang et al., Loss of mTOR-Dependent Macroautophagy Causes Autistic-like Synaptic Pruning Deficits, Neuron(2014), http://dx.doi.org/10.1016/j.neuron.2014.07.040
autophagy in cortical neurons was confirmed by the accumula-
tion of autophagy substrates p62 and ubiquitin (Ub) (Figures
S1H, S1I, and S1J) and is thus an early feature of ASD. Higher
levels of p-mTOR in both control and patients with ASD were
strongly associated with lower levels of LC3-II (Figure 2J), sug-
gesting that the lower level of autophagy in ASD patients was
attributable to high mTOR activity. Higher LC3-II levels were
strongly associated with lower levels of PSD95 (Figure 2K).
These data indicate that mTOR-dependent autophagy is nega-
tively correlated with spine density in human brain during child-
hood and adolescence.
mTOR Dysregulation Causes Spine Pruning Defects inTSC-Deficient Mouse Models of ASDWe then investigated whether mTOR hyperactivation and re-
sulting inhibition of autophagy causes ASD-like dendritic spine
pathology in ASD animal models. We focused on mutations in
genes encoding tuberous sclerosis complexes TSC1 (hamartin)
and TSC2 (tuberin), proteins that form a heterodimer that
constitutively inhibits Rheb to inactivate mTOR (Ehninger and
Silva, 2011). Mutations in both Tsc1 and Tsc2 cause mTOR
hyperactivation and ASD-like behaviors in mice (Chevere-
Torres et al., 2012; Tsai et al., 2012a; Goorden et al., 2007;
Sato et al., 2012).
Tsc2+/� mice however exhibit normal social preference in a
three-chamber test (Ehninger et al., 2008; Ehninger et al., 2012)
but deficient social interaction in a dyadic reciprocal social test
(Sato et al., 2012). This discrepancy in social behaviors could
be due to differences in testing protocols, the gender, the
age, or genetic background of the testing mice. We thus char-
acterized ASD-like social behaviors in P30–P35 adolescent
male Tsc2+/� mice maintained in a B6/C57 background. We
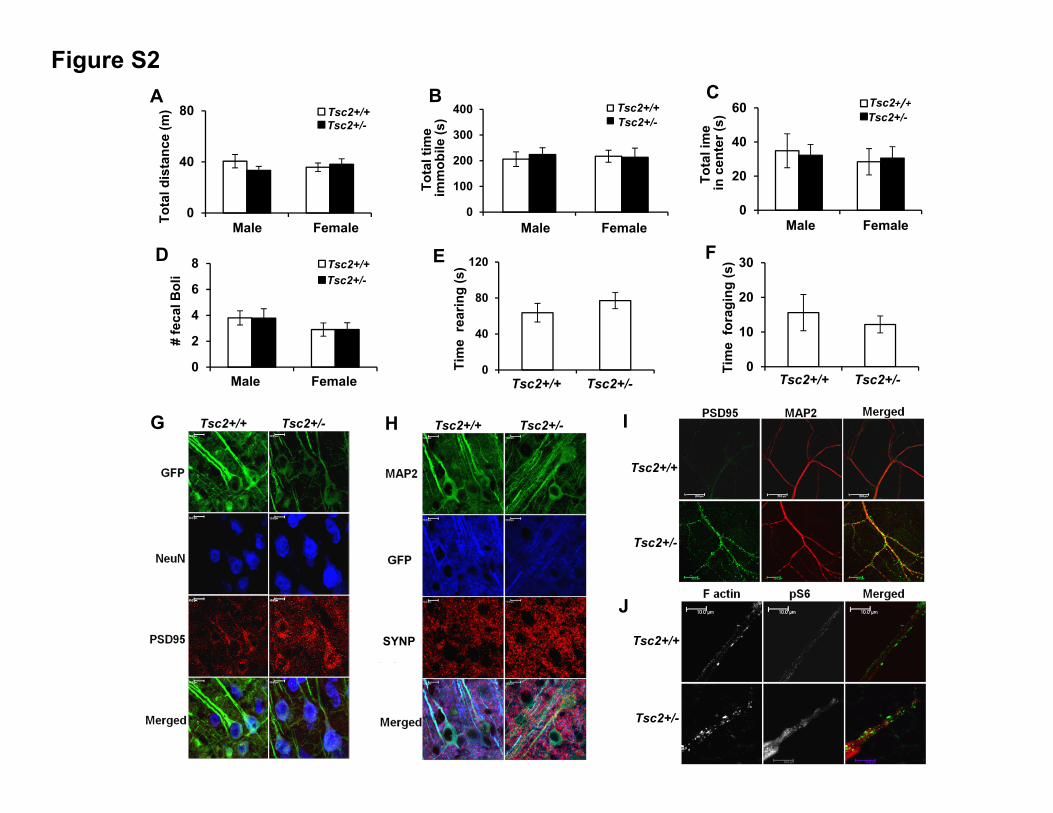
observed no motor defects or anxiety-like behaviors in open
field (Figures S2A–S2F). In the novel object recognition test,
Tsc2+/� mice spent less time exploring the novel object than
their wild-type (WT) littermates, with no difference in time spent
Neuron 83, 1–13, September 3, 2014 ª2014 Elsevier Inc. 3

Figure 2. Dysregulated mTOR-Autophagy Signaling and Spine Pruning in ASD Temporal Lobe
(A) Representative western blots of p-mTOR, t-mTOR, p-S6, t-S6, PSD95, and synapsin I in temporal lobe of ASD patients and control subjects aged 2–9 years
(ASD, n = 8; controls, n = 7) and 13–19 years (ASD, n = 5; controls, n = 9). A, ASD patients; C, controls.
(B–E) The relative density (mean ± SD) for p-mTOR (B) and p-S6 (C) were normalized to t-mTOR and t-S6, respectively. PSD95 (D) and synapsin I (E) levels were
normalized to actin and are presented as scatterplots for ASD patients and controls in two age groups. Each point represents each individual subject. **p < 0.01;
***p < 0.001 (two-way ANOVA, Bonferroni’s post hoc test).
(F) Western blot of autophagy markers, LC3-II and p62, in temporal lobe of ASD patients and control subjects aged 2–9 years and 13–20 years.
(G) LC3-II levels normalized to actin in controls and patients. **p < 0.01; ***p < 0.001 (two-way ANOVA, Bonferroni post hoc test). Mean ± SD.
(H) p62 levels normalized to actin in controls and patients. **p < 0.01; ***p < 0.001 (two-way ANOVA, Bonferroni post hoc test). Mean ± SD.
(I) Correlation between p-mTOR and PSD95 (R2 = 0.598, p < 0.001).
(J) Correlation between p-mTOR and LC3-II in individuals younger than 10 years (R2 = 0.347, p < 0.0001), indicating that LC3-II is regulated by mTOR in both ASD
patients and controls.
(K) Correlation between LC3-II and PSD95 in individuals younger than 10 years (R2 = 0.422, p < 0.0001), suggesting a relationship between synaptic structure
protein levels and autophagy.
Neuron
Autism and Neuronal Autophagy
Please cite this article in press as: Tang et al., Loss of mTOR-Dependent Macroautophagy Causes Autistic-like Synaptic Pruning Deficits, Neuron(2014), http://dx.doi.org/10.1016/j.neuron.2014.07.040
exploring the familiar object (Figure 3A). Tsc2+/� mice, how-
ever, did not exhibit ASD-like repetitive behaviors (Figure 3B).
Sociability was assessed during a dyadic social interaction
with a novel (noncagemate) mouse matched for sex and geno-
type (see Supplemental Information). Tsc2+/� mice spent less
time sniffing the stimulus mouse (Figure 3C), indicating
impaired social interactions. Social deficits were confirmed us-
ing a three-chamber social test. While Tsc2+/� mice showed a
preference for interacting with a social target compared with
nonsocial target (Figure 3D, left), the preference index (the ratio
of time sniffing mouse versus nonsocial target) was decreased
4 Neuron 83, 1–13, September 3, 2014 ª2014 Elsevier Inc.
(Figure 3D, right). In the social novelty test, Tsc2+/� mice spent
a similar amount of time sniffing both novel and familiar social
targets (Figure 3E, left), with decreased preference index (the
ratio of time sniffing a stranger mouse versus a familiar mouse;
Figure 3E, right), indicating a reduced preference for social
novelty.
The density of dendritic spines in pyramidal neuron basal den-
drites of layer V A1/S2 in temporal cortex, which is thought to be
analogous to the primate primary auditory cortex (A1) and sec-
ondary somatosensory cortex (S2) (Benavides-Piccione et al.,
2002), was examined by DiOlistic labeling (Figure 3F). A higher
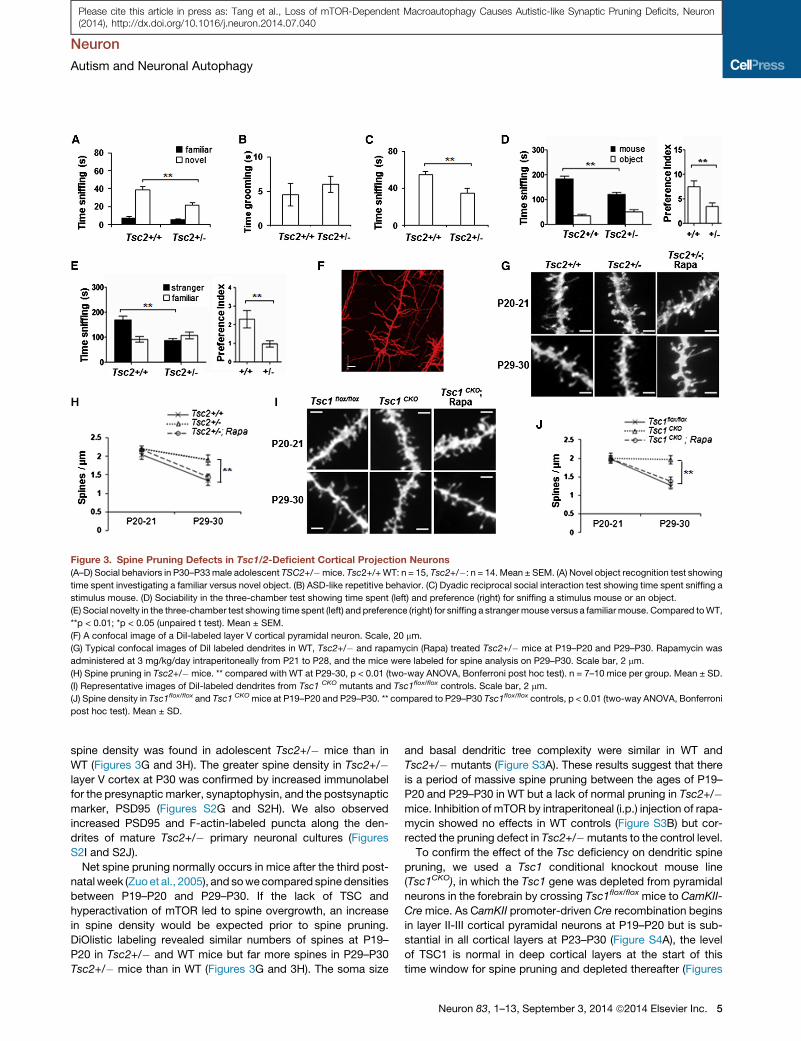
Figure 3. Spine Pruning Defects in Tsc1/2-Deficient Cortical Projection Neurons
(A–D) Social behaviors in P30–P33male adolescent TSC2+/�mice. Tsc2+/+WT: n = 15, Tsc2+/�: n = 14. Mean ± SEM. (A) Novel object recognition test showing
time spent investigating a familiar versus novel object. (B) ASD-like repetitive behavior. (C) Dyadic reciprocal social interaction test showing time spent sniffing a
stimulus mouse. (D) Sociability in the three-chamber test showing time spent (left) and preference (right) for sniffing a stimulus mouse or an object.
(E) Social novelty in the three-chamber test showing time spent (left) and preference (right) for sniffing a strangermouse versus a familiarmouse. Compared toWT,
**p < 0.01; *p < 0.05 (unpaired t test). Mean ± SEM.
(F) A confocal image of a DiI-labeled layer V cortical pyramidal neuron. Scale, 20 mm.
(G) Typical confocal images of DiI labeled dendrites in WT, Tsc2+/� and rapamycin (Rapa) treated Tsc2+/� mice at P19–P20 and P29–P30. Rapamycin was
administered at 3 mg/kg/day intraperitoneally from P21 to P28, and the mice were labeled for spine analysis on P29–P30. Scale bar, 2 mm.
(H) Spine pruning in Tsc2+/�mice. ** compared with WT at P29-30, p < 0.01 (two-way ANOVA, Bonferroni post hoc test). n = 7–10 mice per group. Mean ± SD.
(I) Representative images of DiI-labeled dendrites from Tsc1 CKO mutants and Tsc1flox/flox controls. Scale bar, 2 mm.
(J) Spine density in Tsc1flox/flox and Tsc1 CKOmice at P19–P20 and P29–P30. ** compared to P29–P30 Tsc1flox/flox controls, p < 0.01 (two-way ANOVA, Bonferroni
post hoc test). Mean ± SD.
Neuron
Autism and Neuronal Autophagy
Please cite this article in press as: Tang et al., Loss of mTOR-Dependent Macroautophagy Causes Autistic-like Synaptic Pruning Deficits, Neuron(2014), http://dx.doi.org/10.1016/j.neuron.2014.07.040
spine density was found in adolescent Tsc2+/� mice than in
WT (Figures 3G and 3H). The greater spine density in Tsc2+/�layer V cortex at P30 was confirmed by increased immunolabel
for the presynaptic marker, synaptophysin, and the postsynaptic
marker, PSD95 (Figures S2G and S2H). We also observed
increased PSD95 and F-actin-labeled puncta along the den-
drites of mature Tsc2+/� primary neuronal cultures (Figures
S2I and S2J).
Net spine pruning normally occurs in mice after the third post-
natalweek (Zuoet al., 2005), and sowecompared spine densities
between P19–P20 and P29–P30. If the lack of TSC and
hyperactivation of mTOR led to spine overgrowth, an increase
in spine density would be expected prior to spine pruning.
DiOlistic labeling revealed similar numbers of spines at P19–
P20 in Tsc2+/� and WT mice but far more spines in P29–P30
Tsc2+/� mice than in WT (Figures 3G and 3H). The soma size
and basal dendritic tree complexity were similar in WT and
Tsc2+/� mutants (Figure S3A). These results suggest that there
is a period of massive spine pruning between the ages of P19–
P20 and P29–P30 in WT but a lack of normal pruning in Tsc2+/�mice. Inhibition of mTOR by intraperitoneal (i.p.) injection of rapa-
mycin showed no effects in WT controls (Figure S3B) but cor-
rected the pruning defect in Tsc2+/�mutants to the control level.
To confirm the effect of the Tsc deficiency on dendritic spine
pruning, we used a Tsc1 conditional knockout mouse line
(Tsc1CKO), in which the Tsc1 gene was depleted from pyramidal
neurons in the forebrain by crossing Tsc1flox/flox mice to CamKII-
Cremice. As CamKII promoter-driven Cre recombination begins
in layer II-III cortical pyramidal neurons at P19–P20 but is sub-
stantial in all cortical layers at P23–P30 (Figure S4A), the level
of TSC1 is normal in deep cortical layers at the start of this
time window for spine pruning and depleted thereafter (Figures
Neuron 83, 1–13, September 3, 2014 ª2014 Elsevier Inc. 5

Figure 4. TSC Ablation Downregulates Autophagic Activity and Rapamycin Reconstitutes Normal Autophagy
(A) Western blot analysis of p-mTOR, t-mTOR, and LC3-II in P29 Tsc2+/� mouse brain. Tsc2 WT and Tsc2+/� mice were i.p. injected with DMSO vehicle or
rapamycin from P20 to P28. Right: quantification of p-mTOR and LC3-II levels. Mean ± SD. *p < 0.05; **p < 0.01; ***p < 0.001 (two-way ANOVA, Bonferroni post
hoc test). n = 5–6 animals per group. Tsc2+/�mutant cortex on P29–P30 showed increased p-mTOR levels and decreased levels of LC3-II. Inhibiting mTORwith
rapamycin decreased p-mTOR and increased LC3II in both wild-type and mutant lines.
(B) Impaired autophagic flux in Tsc2+/�; GFP-LC3 cortical neurons. Right: mean number of GFP-LC3 puncta per soma of cortical neurons; 8–10 neurons per
group in triplicates were analyzed. Scale bar, 10 mm. *p < 0.05; **p < 0.01; ***p < 0.001 (two-way ANOVA, Bonferroni post hoc test). Mean ± SD.
Neuron
Autism and Neuronal Autophagy
Please cite this article in press as: Tang et al., Loss of mTOR-Dependent Macroautophagy Causes Autistic-like Synaptic Pruning Deficits, Neuron(2014), http://dx.doi.org/10.1016/j.neuron.2014.07.040
S4B and S4C). Thismouse line allows us tomodel an appropriate
developmental period for evaluating roles for cell-autonomous
effects of neuronal mTOR in the regulation of developmental
spine pruning. At P19–P20, the density of spines in basal den-
drites of A1/S2 layer V pyramidal neurons was equivalent for
both Tsc1flox/flox control and Tsc1CKO mice (p > 0.05), but spines
in control mice were significantly less dense than in Tsc1CKO
mice at P29–P30 (p < 0.01, Figures 3I and 3J). Although soma
size was slightly greater (15%) in P29–P30 Tsc1CKO pyramidal
neurons, the number of primary basal dendrites was similar for
control and Tsc1CKO mice (Figures S4D, S4E, and S4F). Rapa-
mycin treatment did not affect spine density in Tsc1flox/flox control
mice (Figure S5B), but corrected spine pruning in Tsc1CKO mice
to control levels (Figures 3I and 3J), with no effect on basal
dendritic branching. Thus, both Tsc1CKO and Tsc2+/� mutants
showed a lack of efficient postnatal spine pruning, indicating
that TSC inhibition of mTOR is required for postnatal spine prun-
ing. The effects of TSC1 deletion on spine density in pyramidal
neurons at P30 is consistent with those reported in vivo in Pur-
kinje cells (Tsai et al., 2012a).
Autophagy Deficiency in Tsc2+/– Mutant NeuronsWe then addressed whether autophagy remodels dendritic
spines downstream of mTOR. We confirmed suppression of
basal autophagy due to mTOR disinhibition in the Tsc mutant
mouse brain by (1) a decrease in protein levels of LC3-II in
Tsc2+/� cortex, whichwas normalized by rapamycin (Figure 4A);
6 Neuron 83, 1–13, September 3, 2014 ª2014 Elsevier Inc.
(2) an increase in the level of phospho-S6 (pS6), indicatingmTOR
hyperactivation, and a reduction in GFP-LC3 puncta, a fluores-
cent marker for autophagosomes, in cortical pyramidal neurons
from Tsc2+/�: GFP-LC3 mice (Figure S5A), indicating impaired
autophagy and rapamycin-normalized pS6 levels and numbers
of GFP-LC3 puncta; (3) decreased immunolabel for endogenous
LC3 in Tsc2+/� mutant primary neuronal cultures (Figure S5B);
(4) an accumulation of autophagy substrates, including p62 (Ko-
matsu et al., 2007a), lipid droplets, and damaged mitochondria
(Martinez-Vicente et al., 2010), in Tsc2+/� primary neuronal cul-
tures (Figures S5B, S5C, S5D, and S5E); (5) accumulation of p62-
and Ub- positive inclusions in pyramidal neurons in Tsc1CKO
mouse brain (Figure S5F).
We analyzed autophagy flux in Tsc2+/�:GFP-LC3 neurons
in comparison to Tsc2 WT: GFP-LC3 neurons (Figure 4B).
Cultured primary neurons were treated with bafilomycin
(BafA1) and NH4Cl to inhibit lysosomal hydrolase and block au-
tophagosome-lysosome fusion. We reasoned that if autophagy
flux was impaired by mTOR hyperactivation, BafA1/NH4CL
blockade of lysosomal degradation would produce a lower
accumulation of autophagosomes in Tsc2+/� neurons than in
WT. As expected, there was more accumulation of GFP-LC3
puncta in BafA1/NH4CL-treated WT neurons than Tsc2+/�neurons, confirming a failure of autophagosome induction
in Tsc2+/� neurons (Figure 4B). Rapamycin (200 nM, 8 hr)
normalized autophagosome formation in Tsc2+/� neurons.
These findings support the hypothesis that basal neuronal

Figure 5. Dendritic Spine Pruning Defects and ASD-like Behaviors in Atg7CKO Mice
(A) Western blot analysis of autophagy markers in theAtg7CKO cortex. Brain homogenates from P19–P20 and P29–P30mice were immunoblotted with antibodies
against Atg12-Atg5, LC3, and autophagy substrate p62. Data shown are representative of three separate experiments. Loss of autophagy was indicated by a
decrease in levels of Atg5-12 conjugation and LC3-II protein, and an increase in p62 protein.
(B) Immunofluorescent labeling of p62 and ubiquitin (Ub) in P30 Atg7CKO mouse cortex. Scale bar, 10 mm.
(C–F) ASD-like social behaviors in Atg7CKO mice. Atg7flox/floxmales, n = 15; Atg7CKO males, n = 13. (C) Novel object recognition test showing time spent sniffing a
familiar object versus a novel object. (D) Dyadic social interaction test showing the time testing mice spent sniffing a stimulus mouse. ** Compared to Atg7flox/flox;
p < 0.01; unpaired t test. (E) Sociability in the three-chamber test showing time spent (left) and preference (right) for a stimulus mouse or an object. (F) Social
novelty in the three-chamber test showing time spent (left) and preference (right) for sniffing a stranger mouse versus a familiar mouse. Compared to WT,
**p < 0.01 (unpaired t test). Mean ± SEM.
(G) Dendritic segments from Atg7flox/flox and Atg7CKO pyramidal neurons at P19–P20 and P29–P30. n = 7–10 animals per group. Scale bar, 2 mm.
(H) Fewer spines were pruned in Atg7CKO mice. ** Compared to P29–P30 Atg7flox/flox, p < 0.01 (two-way ANOVA, Bonferroni post hoc test). Mean ± SD.
(I) Timeline of infection and spine analysis.
(J) Cultured control and Atg7 siRNA lentiviral infectedmouse hippocampal neurons at DIV20, visualized by GFP and PSD95 fluorescence. Atg7 siRNA expressing
neurons exhibited more PSD95 puncta than controls. Scale bar, 20 mm.
(K) Spine formation and elimination in control and Atg7 siRNA-infected neurons during a 12 hr time window at DIV19–DIV20. Mean ± SD. Scale bar, 10 mm.
Neuron
Autism and Neuronal Autophagy
Please cite this article in press as: Tang et al., Loss of mTOR-Dependent Macroautophagy Causes Autistic-like Synaptic Pruning Deficits, Neuron(2014), http://dx.doi.org/10.1016/j.neuron.2014.07.040
autophagy is depressed due to mTOR hyperactivation in Tsc
mutant ASD mouse models.
Autophagy Deficiency Results in ASD-like SocialBehaviors and Spine Pruning DefectsTo investigate whether neuronal autophagy deficiency produces
ASD-like behaviors and dendritic spine pathology, we generated
forebrain excitatory neuronal specific autophagy-deficient mice
by crossing Atg7flox/flox mice to CamKIIa-cre mice. Atg7 is an
E1-like activating enzyme required for autophagosome forma-
tion (Komatsu et al., 2006). A deficit in autophagy was confirmed
bywestern blot analysis of conjugated ATG5-12, p62, and LC3-II
proteins (Figure 5A) and by immunolabel of p62 and ubiquitin
(Ub) (Figures 5B and 6A), proteins that form aggregates after
autophagy inhibition (Komatsu et al., 2006, 2007a). At P20
there were no differences in LC3-II and conjugated ATG5-12
levels between genotypes, although p62 levels were higher
in Atg7flox/flox:CamKII-Cre (Atg7CKO) autophagy-deficient mice
(Figure 5A). By P30, however, Atg7CKO mice exhibited less con-
jugated ATG5-12 and LC3-II protein and more p62 protein than
the Atg7flox/flox controls. Atg7CKO mice displayed occasional
p62/Ub-positive inclusions in pyramidal neurons at P20 and
prominent p62/Ub-positive aggregates in layer II-III and layer
V-VI pyramidal neurons at P30 (Figure 5B). The results confirm
a loss of autophagy between P20 and P30 in cortical pyramidal
neurons in Atg7CKO mice.
Neuron 83, 1–13, September 3, 2014 ª2014 Elsevier Inc. 7

Neuron
Autism and Neuronal Autophagy
Please cite this article in press as: Tang et al., Loss of mTOR-Dependent Macroautophagy Causes Autistic-like Synaptic Pruning Deficits, Neuron(2014), http://dx.doi.org/10.1016/j.neuron.2014.07.040
Atg7CKOmice exhibited ASD-like social recognition (Figure 5C)
and social interaction deficits similar to those seen in Tsc2+/�mutants. During dyadic encounters, they spent less time sniffing
stimulus mice than their control littermates (Figure 5D). In the
three-chamber test, Atg7CKO mice displayed impaired prefer-
ence for sniffing the social target (Figure 5E) and for social nov-
elty (Figure 5F). However, these mice did not show stereotyped
repetitive behaviors, motor defects, or anxiety-like behaviors
(Figures S6A–S6G).
We did not observe significant changes in the size of neuronal
soma and the number of primary basal dendrites during this
developmental period (Figures S6H–S6J). At P19–P20, Atg7CKO
basal dendrites from layer V A1/S2 pyramidal neurons exhibited
a similar number of spines as those in the Atg7flox/flox control
mice (Figures 5G and 5H). In contrast, by P29–P30 the Atg7CKO
basal dendrites exhibited more spines than controls. Thus, basal
neuronal autophagy is required for normal spine pruning during
postnatal development and for the development of normal social
behaviors. The pruning defect is unlikely to result from abnormal-
ities in microglia and astrocytes, as we observed no activation of
microglia or astrocytes at any age in Atg7CKO mice (Figures S6K
and S6L).
Autophagy Mediates Spine Elimination in PrimaryCultures of Hippocampal NeuronsThe increased spine density and reduced spine pruning in
Atg7CKO mice may result from an increase in synapse formation
or a decrease in synapse elimination. Primary cultures of hippo-
campal neurons have been used as an in vitro system to investi-
gate the formation, maturation, and pruning of dendritic spines,
in which dendritic spines are formed and pruned during a devel-
opmental period similar to that in vivo in mouse brain (Orefice
et al., 2013; Ko et al., 2011; Papa et al., 1995), with spine density
increases between 6–10 days in vitro (DIV6–DIV10), peaks at
DIV14–DIV21, and decreases after weeks 3 or 4 in vitro in
neuronal cultures. We thus infected CA1 hippocampal neurons
with a lentivirus expressing EGFP-Atg7 siRNA or an EGFP con-
trol virus at DIV14–DIV15, a period of active synapse formation
and stabilization in cultures. Three to four days after infection,
the cultures were fixed and stained for postsynaptic marker
PSD95 (Figures 5I and 5J). Neurons expressing Atg7 siRNA
exhibited a higher level of PSD95 puncta at DIV19–DIV20 than
neurons infected with control virus (Figure 5J), suggesting an
increased spine density. We calculated the rate of spine genesis
and spine pruning at DIV19–DIV20 during a 12 hr time window. In
control neurons infected with viral vector controls, �12% of
spines were formed and �13% eliminated, indicating equivalent
rates of spine formation and elimination that reflect stabilized
spine densities (Figure 5K). In contrast, �12% of spines were
formed, but only �5% of pre-existing spines were pruned in
Atg7 siRNA-infected neurons (p < 0.05, t test). Therefore, Atg7
knockdown produced excessive dendritic spines by inhibiting
elimination but exerted no effect on formation.
Autophagy Deficiency Underlies Spine Pruning Defectsin Tsc2+/– MiceWe then asked whether autophagy deficiency underlies spine
pruning defects in Tsc2+/� mice. mTOR regulates a number of
8 Neuron 83, 1–13, September 3, 2014 ª2014 Elsevier Inc.
downstream biological processes including protein synthesis,
autophagy, ribosome biogenesis, and activation of transcription
leading to lysosome biogenesis or mitochondrial metabolism.
To disentangle autophagy from other downstream effectors of
mTOR, we crossed Tsc2+/� mice to the Atg7CKO mice to pro-
duce a Tsc2+/�:Atg7CKO double mutant line. We hypothesized
that if neuronal autophagy were responsible for spine pruning,
rapamycin treatment during the fourth week would reconstitute
normal autophagy and pruning in the Tsc2+/� mice but would
not do so in Atg7CKO and Tsc2+/�:Atg7CKO double mutant mice.
We observed high levels of p62 and ubiquitin in Tsc2+/�,
Atg7CKO, and Tsc2+/�:Atg7CKO double mutant cortices at P30,
consistent with a deficit of autophagy between P20 and P30 (Fig-
ure 6A). We imaged basal dendrites of layer V A1/S2 pyramidal
neurons in all lines at P20 to provide a baseline. We then treated
mice from all lines with DMSO vehicle or rapamycin from P21 to
P28. On P29, basal dendrites of layer V A1/S2 pyramidal neurons
were labeled and analyzed (Figures 6B and 6C). In the DMSO
vehicle-treated mice, the percentage of spines pruned between
P21 and P29 was 26%; 8%, 3%, and 2% were pruned in the
Atg7CKO, Tsc2+/�, and double mutant mouse lines, respec-
tively, all of which were treated with DMSO vehicle (Figure 6D,
two-way ANOVA, Bonferroni’s post hoc test; genotype 3 treat-
ment interaction: F(3,16) = 15.38, p < 0.001; effect of treatment:
F(1,16) = 32.16, p < 0.001; effect of genotype: F(3,16) = 56.17, p <
0.001). Therefore, basal levels of autophagy appeared respon-
sible for�70% ([26� 8)/26]) of postnatal spine pruning in control
mice. No significant effect of rapamycin on spine pruning in
Atg7flox/flox control mice was observed. Rapamycin reversed
spine pruning defects in Tsc2+/� mice to the level of control
mice but did not rescue spine pruning in Atg7CKO mice or in
Tsc2+/�:Atg7CKO double mutants, demonstrating that neuronal
autophagy is required for spine elimination in Tsc2+/� mice.
Note that a relatively small fraction (8%/26% = 30%) of spine
pruning was preserved in Atg7CKO mice, indicating that addi-
tional mechanisms independent from neuronal autophagy are
responsible for the remainder of spine elimination during post-
natal development. Consistently, we found that rapamycin
rescued spine pruning in Tsc2+/�: Atg7CKOmice to this relatively
low level of neuronal autophagy-independent pruning.
Rapamycin Normalizes Social Deficits in Tsc2+/– Micebut Not in Atg7 Conditional KnockoutsWe next examined whether rapamycin rescued social deficits in
Tsc2+/�mice, Atg7CKO mice, and the double mutants. Sociabil-
ity and social novelty were tested with the three-chamber testing
paradigm as above. DMSO vehicle produced no effect on any
mouse line (Figures 3, 5, and 6). Atg7flox/flox control mice treated
with vehicle preferred to sniff the novel mouse more than the
nonsocial object in the sociability test (Figures 6E and 6F) and
preferred to sniff the stranger mouse more than the familiar
mouse in the social novelty test (Figures 6G and 6H). In contrast,
each mutant mouse line displayed impaired preferences for
sociability and social novelty.
The preferences of the Atg7flox/flox control mice were unaf-
fected by rapamycin. In contrast, rapamycin normalized the
sociability and social novelty preferences of the Tsc2+/� mice.
Rapamycin, however, did not normalize preferences of either
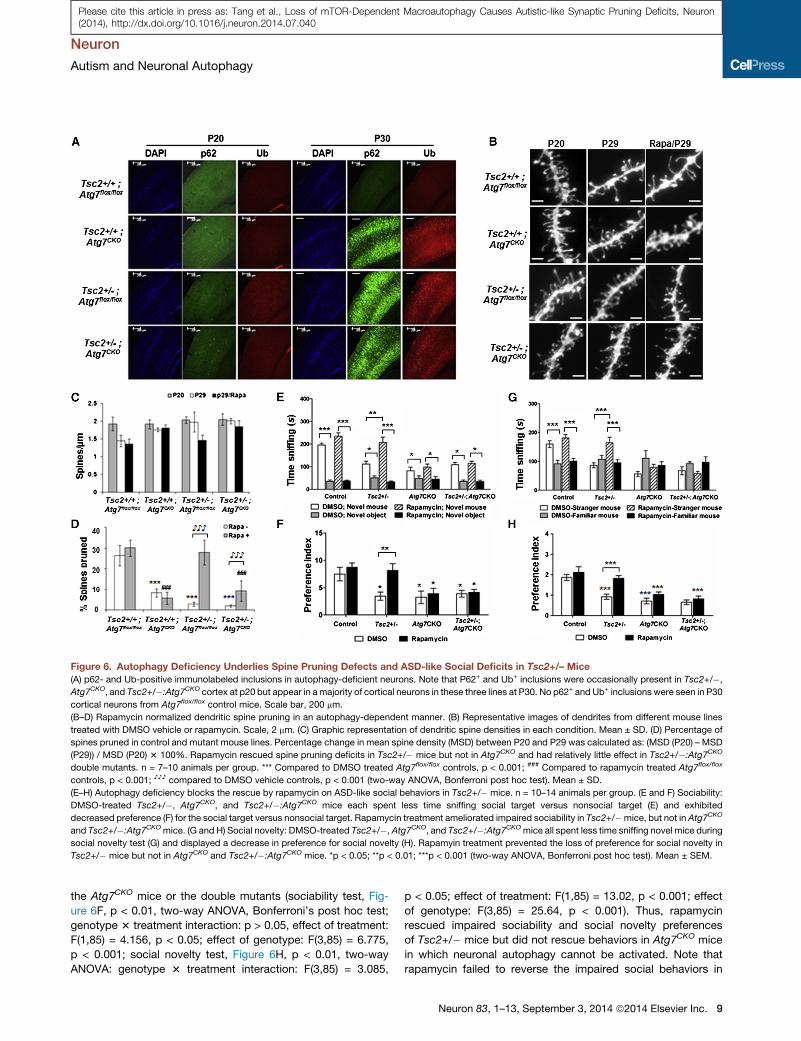
Figure 6. Autophagy Deficiency Underlies Spine Pruning Defects and ASD-like Social Deficits in Tsc2+/– Mice
(A) p62- and Ub-positive immunolabeled inclusions in autophagy-deficient neurons. Note that P62+ and Ub+ inclusions were occasionally present in Tsc2+/�,
Atg7CKO, and Tsc2+/�:Atg7CKO cortex at p20 but appear in amajority of cortical neurons in these three lines at P30. No p62+ and Ub+ inclusions were seen in P30
cortical neurons from Atg7flox/flox control mice. Scale bar, 200 mm.
(B–D) Rapamycin normalized dendritic spine pruning in an autophagy-dependent manner. (B) Representative images of dendrites from different mouse lines
treated with DMSO vehicle or rapamycin. Scale, 2 mm. (C) Graphic representation of dendritic spine densities in each condition. Mean ± SD. (D) Percentage of
spines pruned in control and mutant mouse lines. Percentage change in mean spine density (MSD) between P20 and P29 was calculated as: (MSD (P20) – MSD
(P29)) / MSD (P20) 3 100%. Rapamycin rescued spine pruning deficits in Tsc2+/� mice but not in Atg7CKO and had relatively little effect in Tsc2+/�:Atg7CKO
double mutants. n = 7–10 animals per group. *** Compared to DMSO treated Atg7flox/flox controls, p < 0.001; ### Compared to rapamycin treated Atg7flox/flox
controls, p < 0.001; ♪♪♪ compared to DMSO vehicle controls, p < 0.001 (two-way ANOVA, Bonferroni post hoc test). Mean ± SD.
(E–H) Autophagy deficiency blocks the rescue by rapamycin on ASD-like social behaviors in Tsc2+/� mice. n = 10–14 animals per group. (E and F) Sociability:
DMSO-treated Tsc2+/�, Atg7CKO, and Tsc2+/�:Atg7CKO mice each spent less time sniffing social target versus nonsocial target (E) and exhibited
decreased preference (F) for the social target versus nonsocial target. Rapamycin treatment ameliorated impaired sociability in Tsc2+/�mice, but not in Atg7CKO
and Tsc2+/�:Atg7CKOmice. (G and H) Social novelty: DMSO-treated Tsc2+/�, Atg7CKO, and Tsc2+/�:Atg7CKOmice all spent less time sniffing novel mice during
social novelty test (G) and displayed a decrease in preference for social novelty (H). Rapamyin treatment prevented the loss of preference for social novelty in
Tsc2+/� mice but not in Atg7CKO and Tsc2+/�:Atg7CKO mice. *p < 0.05; **p < 0.01; ***p < 0.001 (two-way ANOVA, Bonferroni post hoc test). Mean ± SEM.
Neuron
Autism and Neuronal Autophagy
Please cite this article in press as: Tang et al., Loss of mTOR-Dependent Macroautophagy Causes Autistic-like Synaptic Pruning Deficits, Neuron(2014), http://dx.doi.org/10.1016/j.neuron.2014.07.040
the Atg7CKO mice or the double mutants (sociability test, Fig-
ure 6F, p < 0.01, two-way ANOVA, Bonferroni’s post hoc test;
genotype 3 treatment interaction: p > 0.05, effect of treatment:
F(1,85) = 4.156, p < 0.05; effect of genotype: F(3,85) = 6.775,
p < 0.001; social novelty test, Figure 6H, p < 0.01, two-way
ANOVA: genotype 3 treatment interaction: F(3,85) = 3.085,
p < 0.05; effect of treatment: F(1,85) = 13.02, p < 0.001; effect
of genotype: F(3,85) = 25.64, p < 0.001). Thus, rapamycin
rescued impaired sociability and social novelty preferences
of Tsc2+/� mice but did not rescue behaviors in Atg7CKO mice
in which neuronal autophagy cannot be activated. Note that
rapamycin failed to reverse the impaired social behaviors in
Neuron 83, 1–13, September 3, 2014 ª2014 Elsevier Inc. 9

Neuron
Autism and Neuronal Autophagy
Please cite this article in press as: Tang et al., Loss of mTOR-Dependent Macroautophagy Causes Autistic-like Synaptic Pruning Deficits, Neuron(2014), http://dx.doi.org/10.1016/j.neuron.2014.07.040
Tsc2+/�:Atg7CKO double mutants, although spine pruning defi-
cits were partially reversed.
DISCUSSION
Dendritic Spine Pruning Defect in the ASD BrainWe assessed spine density across development and confirm an
increase in basal dendrite spine density in layer V pyramidal
neurons in ASD temporal lobe. Layer V pyramidal neurons are
the major excitatory neurons that form cortical-cortical and
cortical-subcortical projections. Basal dendrites receive excit-
atory and inhibitory inputs from local sources, and excitatory
cell types target this compartment almost exclusively (Spruston,
2008). The increase in basal dendrite spine density suggests
an enhanced local excitatory connectivity, a feature of ASD
(Belmonte et al., 2004) proposed to cause failure in differenti-
ating signals from noise, prevent development of normal long-
range cortical-cortical and cortical-subcortical communications,
and underlie neocortical excitation/inhibition imbalance (Sporns
et al., 2000; Gogolla et al., 2009).
Note that while signs of ASD can often be detected at
12–18months,�82%of ASDdiagnoses occur at 4 years or older
(http://www.cdc.gov/ncbddd/autism/data.html), and CNS tis-
sues from very young ASD patients are extremely rare. As human
brain samples from ASD patients cannot be identified prior
to diagnosis, pathological analysis cannot determine whether
increased spine density precedes symptoms. We therefore re-
lied on correlations among an age range of available pathological
specimens, synaptic density, and biochemical markers for anal-
ysis. It is remarkable that the only available brain sample suitable
for morphological study of a very young diagnosed ASD patient
(age = 3 years) displayed a synaptic density higher than any con-
trol subject. We find that a defect in net spine pruning was
responsible for the abnormally high synaptic densities in child-
hood and adolescent ASD, an observation confirmed in animal
models. A variety of results indicate that this deficit is due in large
part to a loss of mTOR-dependent autophagy in neurons. While
synapse formation outpaces synapse elimination at young ages,
yielding the highest synaptic density in early life, significantly
reduced cortical autophagy was also apparent in the youngest
diagnosed ASD patient (age = 2 years, frozen tissue), as indi-
cated by low levels of the autophagic vacuole marker LC3-II
and increased level of autophagy substrates p62. An ongoing
deficiency in autophagy and impaired spine elimination at
younger ages would be expected to increase net spine density
and interfere with the dynamic turnover of synapses that orga-
nizes neural circuits. Interruption of this maturational organiza-
tion of the brain would lead to a persistence of immature or
formation of aberrant circuits in ASD.
The near-linear decrease in spine number from all cases be-
tween the ages of 2 to 19 years indicates that spine pruning in
temporal lobe occurs over the first two decades and that net
loss of synapses is substantially greater in controls than ASD
patients. The spine densities declined during the first and second
decade by 41% in normal controls but only by 16% in ASD pa-
tients, a level independently confirmed by analysis of pre- and
postsynaptic markers. This deficit may contribute to abnormal-
ities in cognitive functions that humans acquire in their late child-
10 Neuron 83, 1–13, September 3, 2014 ª2014 Elsevier Inc.
hood, teenage, or early adult years, such as the acquisition of
executive skills such as reasoning, motivation, judgment, lan-
guage, and abstract thought (Goda and Davis, 2003; Sternberg
and Powell, 1983). Many children diagnosed with ASD reach
adolescence and adulthood with functional disability in these
skills, in addition to social and communication deficits (Seltzer
et al., 2004). The extended duration for normal spine pruning in
human brain may provide an opportunity for therapeutic inter-
vention of multiple functional domains associated with ASD after
the disease is diagnosed.
While our study examined a single brain region, spine pruning
during early postnatal development occurs in cerebral cortex,
cerebellum, olfactory bulb, and hippocampus (Purves and Licht-
man, 1980; Shinoda et al., 2010). As ASD-related neuropa-
thology involves disruptions in connectivity across the brain, it
is likely that additional ASDbrain regionsmay feature spine prun-
ing defects during different periods of synaptic development.
Nevertheless, the disorganization of synaptic connectivity in
the temporal lobe, a central node in the social brain network
(Gotts et al., 2012), may compromise function of a network of
anatomically distinct brain regions that underlie global brain
dysfunction and ASD-like social deficits (Normand et al., 2013;
Tsai et al., 2012a).
mTOR-Regulated Autophagy and ASD SynapticPathologyThe genetic heterogeneity of ASD encourages the identification
of steps that converge on common pathways to produce the
clinical syndrome. Dysregulated mTOR signaling has been iden-
tified in autism, fragile X syndrome, tuberous sclerosis, neurofi-
bromatosis, and PTEN-mediated macroencephaly (Peca and
Feng, 2012; Bourgeron, 2009), each of which features altered
dendritic spine densities. mTOR inhibitors, including rapamycin
and its analogs, have been examined in clinical trials for treating
ASD and neuropsychological deficits in childrenwith TSC (Sahin,
2012).
We find that ASD brains exhibit both disrupted mTOR
signaling and synaptic defects. It is highly unlikely that these
patients possessed TSC mutations, and so our findings suggest
that mTOR signaling provides a common convergent mecha-
nism in ASD. mTOR signaling, however, contributes to protein
synthesis required for neuronal survival, development, synaptic
plasticity, learning, and memory (Hoeffer and Klann, 2010), and
prolonged use of mTOR inhibitors may cause adverse effects
(Rodrik-Outmezguine et al., 2011). An important goal is to iden-
tify specific signaling pathways downstream of mTOR that may
provide more precise targets. For example, a link has been es-
tablished between eIF4E-dependent translational control down-
stream of mTOR and ASD-like phenotypes in mouse models
(Santini et al., 2013). We provide evidence from postmortem
brain that autophagy deficiency, which is a consequence of
mTOR overactivation, strongly correlates with ASD dendritic
spine pathology. The reduction of mTOR-regulated neuronal
autophagy is further consistent with our recent findings of a
lack of autophagic mitochondrial turnover in ASD brains (Tang
et al., 2013).
We have confirmed in mouse models that inhibition of
neuronal autophagy produced ASD-like inhibition of normal

Neuron
Autism and Neuronal Autophagy
Please cite this article in press as: Tang et al., Loss of mTOR-Dependent Macroautophagy Causes Autistic-like Synaptic Pruning Deficits, Neuron(2014), http://dx.doi.org/10.1016/j.neuron.2014.07.040
developmental spine pruning and ASD-like behaviors. Pharma-
cological inhibition of mTOR activity normalized ASD-like spine
pruning deficits and ASD-like behaviors in mice largely by
activating neuronal autophagy. As these data suggest a direct
link between mTOR-regulated autophagy and pruning of syn-
aptic connections during postnatal development, developing
targeted means to enhance autophagy downstream of mTOR
during development may provide the basis for novel ASD
therapeutics.
Autophagy and Spine PruningThe precise control of synapse pruning could be achieved by
multiple signaling systems that converge to eliminate synaptic
connections. This could involve the targeted degradation of syn-
aptic components. Recent evidence suggests that neuronal ac-
tivity decreases dendritic spine number in part through activation
of the myocyte enhancer factor 2 (MEF2) transcription factor
(Pfeiffer et al., 2010), which promotes ubiquitin-proteasome sys-
tem (UPS)-dependent degradation of the synaptic scaffolding
protein PSD95 (Tsai et al., 2012b). In addition to the UPS, which
is primarily responsible for the degradation of short-lived cyto-
solic proteins, neurons rely on lysosomal-dependent degrada-
tion mechanisms for the turnover of long-lived synaptic proteins
and damaged organelles. Ablation of autophagy genes ATG7
or ATG5 causes neurodegeneration associated with aberrant
organelles and ubiquitin-rich inclusions in neuronal cell bodies
(Hara et al., 2006; Komatsu et al., 2006), as well as disrupted
membrane homeostasis in axon terminals (Komatsu et al.,
2007b; Hernandez et al., 2012).
Using an in vitro primary neuronal culture system, we find that
autophagy regulates spine elimination but not spine formation
during developmental pruning of dendritic spines. Autophagy
may remodel dendritic spines by directing internalized postsyn-
aptic membrane neurotransmitter receptors, including GABA-A
(Rowland et al., 2006) and AMPAR (Shehata et al., 2012), toward
lysosomal degradation. Although autophagy was classically
considered an ‘‘in-bulk’’ process, evidence now supports selec-
tivity mediated via recognition of posttranslational modifications
bymolecules that bind cargo and components of the autophagic
machinery. p62 is the most extensively characterized cargo-
recognizingmolecule and binds preferentially to an ubiquitin link-
age (Lys63) on the surface of ubiquitinated protein aggregates,
polyubiquitinated proteins, and organelles. In addition, auto-
phagy may degrade proteins that suppress spine elimination,
and the loss of autophagy could accumulate proteins that block
spine pruning, for example, by releasing translationally sup-
pressed synaptic mRNA for local protein synthesis (Banerjee
et al., 2009).
As neuronal autophagy is responsible for �70% of postnatal
net spine elimination, it is likely that basal autophagy regulates
spine elimination in cooperation with additional regulatory mech-
anisms downstreamofmTOR, including eIF4E-dependent trans-
lational control and neuronal outgrowth (Santini et al., 2013) and
other nonneuronal intrinsic regulatory mechanisms including
neuroimmune disturbances and astrocyte activation (Garbett
et al., 2008; Voineagu et al., 2011; Paolicelli et al., 2011; Schafer
et al., 2012; Chung et al., 2013). Defective neuronal autophagy
can be induced by infected microglia (Alirezaei et al., 2008),
pointing to the possibility of glial non-cell-autonomous autopha-
gic regulation of spine morphogenesis. In addition, changes in
mTOR-autophagy signaling and spine pruning defects may
represent a secondary mechanism in response to an imbalance
between excitatory and inhibitory neurotransmission, identified
in both Mecp2 mutant mice and Tsc1-deficient mice and impli-
cated in ASD-associated stereotypies and social behavioral def-
icits (Chao et al., 2010; Fu et al., 2012; Yizhar et al., 2011). Altered
synaptic function is consistent with our recent finding that
chronic lack of neuronal autophagy enhances evoked neuro-
transmitter release and rate of synaptic recovery (Hernandez
et al., 2012).
In summary, we find that many ASD brains exhibit both dis-
rupted mTOR signaling and synaptic defects during childhood
and adolescence, suggesting that mTOR signaling may provide
a common mechanism involved in ASD synaptic pathology
(Sawicka and Zukin, 2012). We further demonstrated that ASD
behaviors and synaptic deficits are elicited by altered mTOR
signaling via an inhibition of autophagy required for normal
developmental spine pruning. The results indicate a direct link
between mTOR-autophagy and pruning of synaptic connec-
tions during postnatal development and suggest that targeting
neuronal autophagy could provide therapeutic benefit.
EXPERIMENTAL PROCEDURES
ASD-like Social Behavioral Tests
Mice were tested for novel object recognition and social interactions, anxiety-
like behaviors, exploratory locomotion behaviors, and self-grooming repetitive
behavior. Sociability and social novelty were tested in a three-chamber testing
paradigm. Procedures were approved by Columbia University IACUC.
Biochemistry, DiOlistic Labeling, Golgi Staining, and
Immunohistochemistry
Mouse and human brain tissue were lysed with 1X RIPA buffer supplemented
with protease inhibitors and phosphatase inhibitors, and subjected to western
blot analysis. Neurons in mouse brain were labeled with DiI using a Helios gene
gun system at 120 psi. Fluorescent image stacks were acquired with a Leica
multiphoton system. Neuronal morphology in postmortem human brain was
analyzed by Golgi-Kopsch technique. Images were reconstructed with Imaris
FilamentTracer Module (Bitplane).
Full Methods and associated references are in the Supplemental
Information.
SUPPLEMENTAL INFORMATION
Supplemental Information includes Supplemental Experimental Procedures,
six figures, and three tables and can be found with this article online at
http://dx.doi.org/10.1016/j.neuron.2014.07.040.
AUTHOR CONTRIBUTIONS
G.T. and D.S. conceived and designed the study. G.T. and M.L.C. performed
and analyzed DiOlistic labeling experiments; K.G. and F.C. designed, per-
formed, and analyzed all behavioral experiments; G.T. and C.B. performed
mouse breeding; and E.K. made neuronal cultures. G.T. and A.S. performed
biochemistry, Golgi staining, immunolabeling of mouse and human brains,
and establishing neuronal cultures. S.H.K. and M.S. performed data analysis.
G.R., A.J.D., and J.E.G. supervised brain sample selection, Golgi staining,
and data interpretation in human subjects. Z.Y., A.Y., and O.A. assisted
with the design of autophagy and behavioral study. G.T., J.E.G., B.S.P.,
and D.S. wrote the manuscript. All authors read and approved the final
version.
Neuron 83, 1–13, September 3, 2014 ª2014 Elsevier Inc. 11

Neuron
Autism and Neuronal Autophagy
Please cite this article in press as: Tang et al., Loss of mTOR-Dependent Macroautophagy Causes Autistic-like Synaptic Pruning Deficits, Neuron(2014), http://dx.doi.org/10.1016/j.neuron.2014.07.040
ACKNOWLEDGMENTS
This study was supported by the Simons Foundation. Additional support for
D.S. is from DOD TSCRP (TS110056) and the Parkinson’s Disease and JPB
Foundations, for G.T. from NIMH (K01MH096956), for M.L.C. from AHA, for
A.J.D. from NIMH (MH64168), for F.C. from NIH (DP2OD001674-01), for
O.A. from NIH (NS049442). We thank the Autism Tissue Portal, Harvard Brain
Bank, and Maryland NICHD Brain & Tissue Bank for kindly providing us brain
tissues for the present study. We thank Ana Maria Cuervo for reagents and
valuable advice.
Accepted: July 24, 2014
Published: August 21, 2014
REFERENCES
Alirezaei, M., Kiosses, W.B., Flynn, C.T., Brady, N.R., and Fox, H.S. (2008).
Disruption of neuronal autophagy by infected microglia results in neurodegen-
eration. PLoS ONE 3, e2906.
Banerjee, S., Neveu, P., and Kosik, K.S. (2009). A coordinated local transla-
tional control point at the synapse involving relief from silencing and MOV10
degradation. Neuron 64, 871–884.
Belmonte, M.K., Allen, G., Beckel-Mitchener, A., Boulanger, L.M., Carper,
R.A., and Webb, S.J. (2004). Autism and abnormal development of brain con-
nectivity. J. Neurosci. 24, 9228–9231.
Benavides-Piccione, R., Ballesteros-Yanez, I., DeFelipe, J., and Yuste, R.
(2002). Cortical area and species differences in dendritic spine morphology.
J. Neurocytol. 31, 337–346.
Bingol, B., and Sheng, M. (2011). Deconstruction for reconstruction: the role of
proteolysis in neural plasticity and disease. Neuron 69, 22–32.
Bourgeron, T. (2009). A synaptic trek to autism. Curr. Opin. Neurobiol. 19,
231–234.
Chao, H.T., Chen, H., Samaco, R.C., Xue, M., Chahrour, M., Yoo, J., Neul, J.L.,
Gong, S., Lu, H.C., Heintz, N., et al. (2010). Dysfunction in GABA signalling me-
diates autism-like stereotypies and Rett syndrome phenotypes. Nature 468,
263–269.
Chevere-Torres, I., Maki, J.M., Santini, E., and Klann, E. (2012). Impaired social
interactions and motor learning skills in tuberous sclerosis complex model
mice expressing a dominant/negative form of tuberin. Neurobiol. Dis. 45,
156–164.
Chung, W.S., Clarke, L.E., Wang, G.X., Stafford, B.K., Sher, A., Chakraborty,
C., Joung, J., Foo, L.C., Thompson, A., Chen, C., et al. (2013). Astrocytes
mediate synapse elimination through MEGF10 and MERTK pathways.
Nature 504, 394–400.
Ehninger, D., and Silva, A.J. (2011). Rapamycin for treating Tuberous sclerosis
and Autism spectrum disorders. Trends Mol. Med. 17, 78–87.
Ehninger, D., Han, S., Shilyansky, C., Zhou, Y., Li, W., Kwiatkowski, D.J.,
Ramesh, V., and Silva, A.J. (2008). Reversal of learning deficits in a Tsc2+/-
mouse model of tuberous sclerosis. Nat. Med. 14, 843–848.
Ehninger, D., Sano, Y., de Vries, P.J., Dies, K., Franz, D., Geschwind, D.H.,
Kaur, M., Lee, Y.S., Li, W., Lowe, J.K., et al. (2012). Gestational immune acti-
vation and Tsc2 haploinsufficiency cooperate to disrupt fetal survival and may
perturb social behavior in adult mice. Mol. Psychiatry 17, 62–70.
Fu, C., Cawthon, B., Clinkscales, W., Bruce, A., Winzenburger, P., and Ess,
K.C. (2012). GABAergic interneuron development and function is modulated
by the Tsc1 gene. Cereb. Cortex 22, 2111–2119.
Garbett, K., Ebert, P.J., Mitchell, A., Lintas, C., Manzi, B., Mirnics, K., and
Persico, A.M. (2008). Immune transcriptome alterations in the temporal cortex
of subjects with autism. Neurobiol. Dis. 30, 303–311.
Goda, Y., and Davis, G.W. (2003). Mechanisms of synapse assembly and
disassembly. Neuron 40, 243–264.
Gogolla, N., Leblanc, J.J., Quast, K.B., Sudhof, T.C., Fagiolini, M., and
Hensch, T.K. (2009). Common circuit defect of excitatory-inhibitory balance
in mouse models of autism. J. Neurodev. Disord. 1, 172–181.
12 Neuron 83, 1–13, September 3, 2014 ª2014 Elsevier Inc.
Goorden, S.M., van Woerden, G.M., van der Weerd, L., Cheadle, J.P., and
Elgersma, Y. (2007). Cognitive deficits in Tsc1+/- mice in the absence of
cerebral lesions and seizures. Ann. Neurol. 62, 648–655.
Gotts, S.J., Simmons, W.K., Milbury, L.A., Wallace, G.L., Cox, R.W., and
Martin, A. (2012). Fractionation of social brain circuits in autism spectrum dis-
orders. Brain 135, 2711–2725.
Hara, T., Nakamura, K., Matsui, M., Yamamoto, A., Nakahara, Y., Suzuki-
Migishima, R., Yokoyama, M., Mishima, K., Saito, I., Okano, H., and
Mizushima, N. (2006). Suppression of basal autophagy in neural cells causes
neurodegenerative disease in mice. Nature 441, 885–889.
Harris, K.M., Jensen, F.E., and Tsao, B. (1992). Three-dimensional structure of
dendritic spines and synapses in rat hippocampus (CA1) at postnatal day 15
and adult ages: implications for the maturation of synaptic physiology and
long-term potentiation. J. Neurosci. 12, 2685–2705.
Hernandez, D., Torres, C.A., Setlik, W., Cebrian, C., Mosharov, E.V., Tang, G.,
Cheng, H.C., Kholodilov, N., Yarygina, O., Burke, R.E., et al. (2012). Regulation
of presynaptic neurotransmission by macroautophagy. Neuron 74, 277–284.
Hoeffer, C.A., and Klann, E. (2010). mTOR signaling: at the crossroads of plas-
ticity, memory and disease. Trends Neurosci. 33, 67–75.
Hutsler, J.J., and Zhang, H. (2010). Increased dendritic spine densities on
cortical projection neurons in autism spectrum disorders. Brain Res. 1309,
83–94.
Kim, J., Kundu, M., Viollet, B., and Guan, K.L. (2011). AMPK and mTOR regu-
late autophagy through direct phosphorylation of Ulk1. Nat. Cell Biol. 13,
132–141.
Ko, J., Soler-Llavina, G.J., Fuccillo, M.V., Malenka, R.C., and Sudhof, T.C.
(2011). Neuroligins/LRRTMs prevent activity- and Ca2+/calmodulin-depen-
dent synapse elimination in cultured neurons. J. Cell Biol. 194, 323–334.
Komatsu, M., Waguri, S., Chiba, T., Murata, S., Iwata, J., Tanida, I., Ueno, T.,
Koike, M., Uchiyama, Y., Kominami, E., and Tanaka, K. (2006). Loss of auto-
phagy in the central nervous system causes neurodegeneration in mice.
Nature 441, 880–884.
Komatsu, M., Waguri, S., Koike, M., Sou, Y.S., Ueno, T., Hara, T., Mizushima,
N., Iwata, J., Ezaki, J., Murata, S., et al. (2007a). Homeostatic levels of p62
control cytoplasmic inclusion body formation in autophagy-deficient mice.
Cell 131, 1149–1163.
Komatsu, M., Wang, Q.J., Holstein, G.R., Friedrich, V.L., Jr., Iwata, J.,
Kominami, E., Chait, B.T., Tanaka, K., and Yue, Z. (2007b). Essential role for
autophagy protein Atg7 in the maintenance of axonal homeostasis and the
prevention of axonal degeneration. Proc. Natl. Acad. Sci. USA 104, 14489–
14494.
Martinez-Vicente, M., Talloczy, Z., Wong, E., Tang, G., Koga, H., Kaushik, S.,
de Vries, R., Arias, E., Harris, S., Sulzer, D., and Cuervo, A.M. (2010). Cargo
recognition failure is responsible for inefficient autophagy in Huntington’s dis-
ease. Nat. Neurosci. 13, 567–576.
Normand, E.A., Crandall, S.R., Thorn, C.A., Murphy, E.M., Voelcker, B.,
Browning, C., Machan, J.T., Moore, C.I., Connors, B.W., and Zervas, M.
(2013). Temporal and mosaic Tsc1 deletion in the developing thalamus dis-
rupts thalamocortical circuitry, neural function, and behavior. Neuron 78,
895–909.
Orefice, L.L., Waterhouse, E.G., Partridge, J.G., Lalchandani, R.R., Vicini, S.,
and Xu, B. (2013). Distinct roles for somatically and dendritically synthesized
brain-derived neurotrophic factor in morphogenesis of dendritic spines.
J. Neurosci. 33, 11618–11632.
Paolicelli, R.C., Bolasco, G., Pagani, F., Maggi, L., Scianni, M., Panzanelli, P.,
Giustetto, M., Ferreira, T.A., Guiducci, E., Dumas, L., et al. (2011). Synaptic
pruning by microglia is necessary for normal brain development. Science
333, 1456–1458.
Papa, M., Bundman, M.C., Greenberger, V., and Segal, M. (1995).
Morphological analysis of dendritic spine development in primary cultures of
hippocampal neurons. J. Neurosci. 15, 1–11.
Peca, J., and Feng, G. (2012). Cellular and synaptic network defects in autism.
Curr. Opin. Neurobiol. 22, 866–872.

Neuron
Autism and Neuronal Autophagy
Please cite this article in press as: Tang et al., Loss of mTOR-Dependent Macroautophagy Causes Autistic-like Synaptic Pruning Deficits, Neuron(2014), http://dx.doi.org/10.1016/j.neuron.2014.07.040
Penzes, P., Cahill, M.E., Jones, K.A., VanLeeuwen, J.E., and Woolfrey, K.M.
(2011). Dendritic spine pathology in neuropsychiatric disorders. Nat.
Neurosci. 14, 285–293.
Pfeiffer, B.E., Zang, T., Wilkerson, J.R., Taniguchi, M., Maksimova, M.A.,
Smith, L.N., Cowan, C.W., andHuber, K.M. (2010). Fragile Xmental retardation
protein is required for synapse elimination by the activity-dependent transcrip-
tion factor MEF2. Neuron 66, 191–197.
Poultney, C.S., Goldberg, A.P., Drapeau, E., Kou, Y., Harony-Nicolas, H.,
Kajiwara, Y., De Rubeis, S., Durand, S., Stevens, C., Rehnstrom, K., et al.
(2013). Identification of small exonic CNV from whole-exome sequence data
and application to autism spectrum disorder. Am. J. Hum. Genet. 93, 607–619.
Purves, D., and Lichtman, J.W. (1980). Elimination of synapses in the devel-
oping nervous system. Science 210, 153–157.
Rakic, P., Bourgeois, J.P., Eckenhoff, M.F., Zecevic, N., and Goldman-Rakic,
P.S. (1986). Concurrent overproduction of synapses in diverse regions of the
primate cerebral cortex. Science 232, 232–235.
Redcay, E. (2008). The superior temporal sulcus performs a common function
for social and speech perception: implications for the emergence of autism.
Neurosci. Biobehav. Rev. 32, 123–142.
Rodrik-Outmezguine, V.S., Chandarlapaty, S., Pagano, N.C., Poulikakos, P.I.,
Scaltriti, M., Moskatel, E., Baselga, J., Guichard, S., and Rosen, N. (2011).
mTOR kinase inhibition causes feedback-dependent biphasic regulation of
AKT signaling. Cancer Discov 1, 248–259.
Rowland, A.M., Richmond, J.E., Olsen, J.G., Hall, D.H., and Bamber, B.A.
(2006). Presynaptic terminals independently regulate synaptic clustering and
autophagy of GABAA receptors in Caenorhabditis elegans. J. Neurosci. 26,
1711–1720.
Sahin, M. (2012). Targeted treatment trials for tuberous sclerosis and autism:
no longer a dream. Curr. Opin. Neurobiol. 22, 895–901.
Santini, E., Huynh, T.N., MacAskill, A.F., Carter, A.G., Pierre, P., Ruggero, D.,
Kaphzan, H., and Klann, E. (2013). Exaggerated translation causes synaptic
and behavioural aberrations associated with autism. Nature 493, 411–415.
Sato, A., Kasai, S., Kobayashi, T., Takamatsu, Y., Hino, O., Ikeda, K., and
Mizuguchi, M. (2012). Rapamycin reverses impaired social interaction in
mouse models of tuberous sclerosis complex. Nat. Commun. 3, 1292.
Sawicka, K., and Zukin, R.S. (2012). Dysregulation of mTOR signaling in neuro-
psychiatric disorders: therapeutic implications. Neuropsychopharmacology
37, 305–306.
Schafer, D.P., Lehrman, E.K., Kautzman, A.G., Koyama, R., Mardinly, A.R.,
Yamasaki, R., Ransohoff, R.M., Greenberg, M.E., Barres, B.A., and Stevens,
B. (2012). Microglia sculpt postnatal neural circuits in an activity and comple-
ment-dependent manner. Neuron 74, 691–705.
Seltzer, M.M., Shattuck, P., Abbeduto, L., and Greenberg, J.S. (2004).
Trajectory of development in adolescents and adults with autism. Ment.
Retard. Dev. Disabil. Res. Rev. 10, 234–247.
Shehata, M., Matsumura, H., Okubo-Suzuki, R., Ohkawa, N., and Inokuchi, K.
(2012). Neuronal stimulation induces autophagy in hippocampal neurons that
is involved in AMPA receptor degradation after chemical long-term depres-
sion. J. Neurosci. 32, 10413–10422.
Shen, W., and Ganetzky, B. (2009). Autophagy promotes synapse develop-
ment in Drosophila. J. Cell Biol. 187, 71–79.
Shih, P., Keehn, B., Oram, J.K., Leyden, K.M., Keown, C.L., and Muller, R.A.
(2011). Functional differentiation of posterior superior temporal sulcus in
autism: a functional connectivity magnetic resonance imaging study. Biol.
Psychiatry 70, 270–277.
Shinoda, Y., Tanaka, T., Tominaga-Yoshino, K., and Ogura, A. (2010).
Persistent synapse loss induced by repetitive LTD in developing rat hippocam-
pal neurons. PLoS ONE 5, e10390.
Sporns, O., Tononi, G., and Edelman, G.M. (2000). Theoretical neuroanatomy:
relating anatomical and functional connectivity in graphs and cortical connec-
tion matrices. Cereb. Cortex 10, 127–141.
Spruston, N. (2008). Pyramidal neurons: dendritic structure and synaptic inte-
gration. Nat. Rev. Neurosci. 9, 206–221.
Sternberg, R.J., and Powell, J.S. (1983). The development of intelligence. In
Handbook of Child Psychology, 4th Edition, P.H. Mussen, ed. (New York:
John Wiley and Sons), pp. 341–419.
Tang, G., Gutierrez Rios, P., Kuo, S.H., Akman, H.O., Rosoklija, G., Tanji, K.,
Dwork, A., Schon, E.A., Dimauro, S., Goldman, J., and Sulzer, D. (2013).
Mitochondrial abnormalities in temporal lobe of autistic brain. Neurobiol. Dis.
54, 349–361.
Tsai, P.T., Hull, C., Chu, Y., Greene-Colozzi, E., Sadowski, A.R., Leech, J.M.,
Steinberg, J., Crawley, J.N., Regehr, W.G., and Sahin, M. (2012a). Autistic-like
behaviour and cerebellar dysfunction in Purkinje cell Tsc1mutant mice. Nature
488, 647–651.
Tsai, N.P., Wilkerson, J.R., Guo, W., Maksimova, M.A., DeMartino, G.N.,
Cowan, C.W., and Huber, K.M. (2012b). Multiple autism-linked genes mediate
synapse elimination via proteasomal degradation of a synaptic scaffold PSD-
95. Cell 151, 1581–1594.
Voineagu, I., Wang, X., Johnston, P., Lowe, J.K., Tian, Y., Horvath, S., Mill, J.,
Cantor, R.M., Blencowe, B.J., and Geschwind, D.H. (2011). Transcriptomic
analysis of autistic brain reveals convergent molecular pathology. Nature
474, 380–384.
Yizhar, O., Fenno, L.E., Prigge, M., Schneider, F., Davidson, T.J., O’Shea, D.J.,
Sohal, V.S., Goshen, I., Finkelstein, J., Paz, J.T., et al. (2011). Neocortical exci-
tation/inhibition balance in information processing and social dysfunction.
Nature 477, 171–178.
Zahn, R., Moll, J., Krueger, F., Huey, E.D., Garrido, G., and Grafman, J. (2007).
Social concepts are represented in the superior anterior temporal cortex. Proc.
Natl. Acad. Sci. USA 104, 6430–6435.
Zoghbi, H.Y., and Bear, M.F. (2012). Synaptic dysfunction in neurodevelop-
mental disorders associated with autism and intellectual disabilities. Cold
Spring Harb. Perspect. Biol. 4, a009886.
Zuo, Y., Yang, G., Kwon, E., and Gan, W.B. (2005). Long-term sensory depri-
vation prevents dendritic spine loss in primary somatosensory cortex. Nature
436, 261–265.
Neuron 83, 1–13, September 3, 2014 ª2014 Elsevier Inc. 13

Neuron, Volume 83
Supplemental Information
Loss of mTOR-Dependent Macroautophagy
Causes Autistic-like Synaptic Pruning Deficits
Guomei Tang, Kathryn Gudsnuk, Sheng-Han Kuo, Marisa L. Cotrina, Gorazd Rosoklija,
Alexander Sosunov, Mark S. Sonders, Ellen Kanter, Candace Castagna, Ai Yamamoto,
Zhenyu Yue, Ottavio Arancio, Bradley S. Peterson, Frances Champagne, Andrew J.
Dwork, James Goldman, and David Sulzer

Loss of mTOR-dependent macroautophagy causes autistic-like
synaptic pruning deficits
Inventory of Supplemental Information
1) Supplemental Figure S1;
2) Supplemental Figure S2;
3) Supplemental Figure S3;
4) Supplemental Figure S4;
5) Supplemental Figure S5;
6) Supplemental Figure S6;
7) Supplemental Figure Legends;
8) Supplemental Table S1;
9) Supplemental Table S2;
10) Supplemental Table S3;
11) Experimental Procedures;
12) References for Experimental Procedures

Figure S1
Ave
rage
leng
th
(μm
)
C(2-8) C(13-18) A(3-9) A(13-19)
Ave
rage
hea
d di
amet
er (μ
m)
C(2-8) C(13-18) A(3-9) A(13-19)
Average spine length
Ave
rage
spi
ne le
ngth
(μ
m)
A
D
Ave
rage
spi
ne h
ead
diam
eter
(μm
)
B
0.5
1.0
1.5
2.0
0.0
C
Control ASDH
E
C1 C2 C3 C4 C5 C6
A1 A2 A3 A4 A5 A6
J K
Inte
grat
ed in
tens
ity
Area
frac
tion
Inte
grat
ed in
tens
ity
Inte
grat
ed in
tens
ity
F G
I J
0
40
80
Tota
l dis
tanc
e (m
)
Male Female
Tsc2+/-Tsc2+/+
0
100
200
300
400
Tota
l tim
e im
mob
ile (s
)
Male Female
Tsc2+/-Tsc2+/+
0
20
40
60
Tota
l im
e in
cen
ter (
s)
Male Female
Tsc2+/-Tsc2+/+
0
2
4
6
8
# fe
cal B
oli
Male Female
Tsc2+/-Tsc2+/+
0
40
80
120
Tim
e re
arin
g (s
)
Tsc2+/+ Tsc2+/-0
10
20
30
Tim
e fo
ragi
ng (s
)
Tsc2+/+ Tsc2+/-
A
E F
CB
D
G H I
J
Figure S2
Tsc2+/+ Tsc2+/- Tsc2+/+ Tsc2+/-
Tsc2+/-
Tsc2+/+
Tsc2+/-
Tsc2+/+SYNP

0
500
1000
1 2Tsc2+/-Tsc2+/+
Som
a si
ze (µm2 )
Tsc2+/-Tsc2+/+
# of
bra
nche
s
Tsc2+/-Tsc2+/+A
B
Tsc2+/+
Tsc2+/+ Tsc1flox/flox
Figure S3

A
P20
P18
P23
Tsc1flox/flox Tsc1CKOB
Tsc1flox/flox Tsc1CKOC
# of
bra
nche
sTsc1flox/flox Tsc1CKO Tsc1CKO; RapaD
0
5
10
1 2 3Tsc1flox/flox Tsc1CKO Tsc1CKO;Rapa
Tsc1flox/flox Tsc1CKO Tsc1CKO;Rapa
Som
a si
ze (µm2 )
E F
Figure S4

DE F
Fluo
rece
nt in
tens
ity
Mito
Red
/ m
itoG
reen
Figure S5

0
20
40
60
80
Tota
l dis
tanc
e (m
)
Male Female
Atg7CKOAtg7flox/flox
0
100
200
300
400
500
Tota
l im
e im
mob
ile (s
)
Male Female
Atg7CKOAtg7flox/flox
0
20
40
60
Tota
l im
e in
cen
ter (
s)
Male Female
Atg7CKOAtg7flox/flox
0
2
4
6
8
# fe
cal b
oli
Male Female
Atg7CKOAtg7flox/flox
D
FE G
Atg7flox/flox Atg7CKOA
0
500
1000
1 2Atg7CKOAtg7flox/flox
Som
a si
ze (µm2 )
Atg7flox/flox Atg7CKO
# of
bra
nche
s
CB
0
2
4
6
8
Tim
e g
room
ing
(s)
Atg7flox/floxAtg7CKO
0
25
50
75
100
Tim
e re
arin
g (s
)
Atg7flox/flox Atg7CKO
Tim
e fo
ragi
ng (s
)
Atg7flox/flox Atg7CKO0
10
20
30
I
J
H
K P20 P30 9mo
Atg7CKO
Atg7flox/flox
L
Positive control
P20 P30 9mo
Atg7CKO
Atg7flox/flox
Figure S6

Supplemental Figure legends
Figure S1. Dendritic spine length and spine head diameter and autophagy markers in temporal lobe
layer V pyramidal neurons from ASD patients: related to Figures 1 & 2. (A) Distribution of spine length in
controls and ASD patients. Each circle represents the average spine length for each individual neuron imaged;
(B) Distribution of spine head diameter in controls and ASD patients. Each circle represents the average spine
head diameter for one individual neuron imaged. Mean ± SD was plotted. (C&D) Average spine length and
spine head diameter for control and ASD patients. Each circle represents the average spine density (C) or
spine head diameter (D) for each individual. Controls aged 2-8yrs [C(2-8yrs)]: n=5; controls aged 13-18yrs
[C(13-18yrs)]: n=5; ASD cases aged 2-8yrs [A(2-8yrs)]: n=5; ASD cases aged 13-18yrs [A(13-18yrs)]: n=5.
(E) Representative images for LC3 immunohistochemistry from 6 control cases (C1, 2y; C2, 2y; C3, 4y; C4, 5y;
C5, 8y; C6, 13y) and 6 ASD cases (A1, 3y; A2, 7y; A3, 7y; A4, 7y; A5, 9y, A6, 14y) in temporal lobe layer V
pyramidal neurons (C1-A5: fluorescence; C6 & A6: DAB). (F&G) Quantification of LC3 puncta in layer V
pyramidal neurons in temporal lobe of ASD patients and control subjects aged 2-8 yrs and 13-18yrs; Data are
presented as the mean integrated intensity of LC3 puncta per neuron (F) and the mean cellular area occupied
by LC3 puncta (G). 10-15 neurons from each case per age group were quantified. Compared to control
subjects, ASD patients showed a decrease in LC3 puncta, indicating a loss of autophagic activity. * p<0.05; **
p<0.01; *** p<0.001. (H-J) p62 and ubiquitin immunohistochemistry in ASD and control temporal lobe layer V
pyramidal neurons. Representative fluorescent images from 5 control cases (C1, 2y; C2, 2y; C3, 4y; C4, 5y;
C5, 8y) and 5 ASD cases (A1, 3y; A2, 7y; A3, 7y; A4, 7y; A5, 9y) are presented in (H). The mean integrated
intensity of fluorescence was quantified for p62 (I) or ubiquitin (J) per pyramidal neuron in control and ASD
subjects. 10-15 neurons from each case per age group were analyzed. Compared to controls, * p<0.05; **
p<0.01; *** p<0.001. Each point represents an individual. C(2-8yrs): n=5; C(13-18yrs): n=5; A(2-8yrs): n=5;
A(13-18yrs): n=5.
Figure S2. Open field behaviors and synaptic density in Tsc2+/- mice related to Figure 3. (A-F) Open
field measures of locomotor activity and anxiety-like behavior in Tsc2+/- mice (A) Total distance traversed
(meter, m); (B) time (second, s) spent immobile; (C) time (s) spent in the center arena; (D) number of fecal

boli; (E) frequency of rearing during the test session; (F) frequency of digging/foraging during the test session.
No genotype and gender differences were found for all parameters. n (Tsc2+/+, wt, male)=15; n (Tsc2+/+,
female)=20; n (Tsc2+/-, male)=14; n (Tsc2+/-, female)=12. Data are presented as mean ± SEM. (G-J)
Increased synaptic density in Tsc2+/- brain and neuronal cultures. Tsc2+/- mice were crossed to mice
expressing GFP-LC3, a fluorescent membrane marker for autophagosomes. (G&H) Control and Tsc2+/-
cortical sections were immunolabeled with antibodies against postsynaptic marker PSD95, presynaptic marker
synaptophysin (SYNP), and GFP. Compared with Tsc2+/+ wt, Tsc2+/- mouse cortex showed increased PSD95
(G) and SYNP (H) puncta, but decreased GFP-LC3 puncta; (I&J) Postsynaptic marker proteins PSD95 and F-
actin in primary cortical neuronal cultures from wt and Tsc2+/- mice at day 19-20 in vitro. We observed an
increase in PSD95 (I), pS6 (J) and F-actin (J) puncta along Tsc2+/- neurites.
Figure S3. Neuronal morphology in Tsc2+/- mouse brain and effects of rapamycin on dendritic spine
density in control mice, related to Figure 3. (A) Soma size and basal dendritic branches of layer V
pyramidal neurons in Tsc2+/+ and Tsc2+/- mice. No differences were found in either soma size (lower left) and
the number of primary basal dendrites (lower right); (B) Effect of rapamycin on dendritic spine density in
Tsc1flox/flox and Tsc2+/+ control mice. Compared to DMSO vehicle controls, rapamycin treatment at these doses
between P21 and P30 did not show significant effect on spine pruning in either control mouse line. Data are
presented as mean± SD.
Figure S4. CamkII cre mediated recombination in mouse brain, related to Figure 3. (A) CamkII cre mice
were crossed to Rosa-YFP reporter mice. The distribution of cre mediated recombination was examined by
immunolabel for YFP at postnatal day P18, P20 and P23. No labeled cells were detected at deep cortical
layers at P18, and very few cells were observed in layer V cortex at p20. At P23, cre expression was fully
established in all cortical layers. (B) pS6 immunohistochemistry in Tsc1CKO mice at P18, P20 and P23.
Tsc1flox/flox mice were crossed to CamkII cre mice. The deletion of Tsc1 gene was determined by the level of
pS6, a downstream reporter for mTOR activity. In Tsc1flox/flox control mice, pS6 immunoreactivity peaked at P20
and decreased at P23. In Tsc1CKO mice, pS6 increased with age and was higher than in controls at P23,
consistent with the expression level of YFP cre reporter gene in (A); (C) western blot analysis of p-mTOR and

pS6 protein levels in Tsc1flox/flox controls and Tsc1CKO mice at postnatal days P21, P23 and P30; (D) Soma size
and basal dendritic branches in Tsc1flox/flox and Tsc1CKO mice. Compared to Tsc1flox/flox controls. Tsc1CKO mice
displayed a ~15% increase in soma size (E), * compared to Tsc1flox/flox, p<0.05, unpaired t test. No changes in
the number of primary basal dendrites were detected (F). Rapamycin slightly decreased soma size but not the
basal dendritic branches. Data are presented as mean± SD.
Figure S5. Impaired basal autophagy in Tsc deficient neurons related to Figure 4. (A) mTOR activity
and autophagy in Tsc2+/- mouse brain. Tsc2+/- mice were crossed to mice carrying GFP-LC3, a fluorescent
marker for autophagosomes. Cortical slices were immunolabeled for GFP and pS6, a downstream reporter for
mTOR activity. Tsc2+/- cortical pyramidal neurons displayed reduced GFP-LC3 fluorescence and GFP-LC3
puncta, indicating decreased autophagosomes in Tsc2+/- neurons; (B) LC3 and p62 immunolabel in primary
cortical neuronal cultures from wt and Tsc2+/- mice. Tsc2+/- neurons exhibited lower LC3 fluorescence and
more p62 puncta. Rapamycin normalized LC3 and p62 levels; (C-D) Accumulation of damaged mitochondria in
Tsc2+/- neurons. Primary cortical neuronal cultures from Atg7flox/flox; Nestin-Cre mice, in which Atg7 is depleted
in all CNS neurons, were used as controls for autophagy deficiency. Nestin promoter driven cre is expressed
embryonically, which ensures the depletion of Atg7 in these postnatally-derived cultured neurons. wt, Tsc2+/-,
Atg7flox/flox:Nestin-cre (Atg7CKO:Nestin-Cre) primary cortical neurons were stained with MitoTracker red (MitoRed)
and green (MitoGreen) (C). The uptake of MitoRed is dependent on mitochondrial membrane potential, while
MitoGreen shows the total mass of mitochondria. A significant decrease in the ratio of MitoRed (functional
mitochondria) to MitoGreen (total mass of mitochondria) in Tsc2+/- and Atg7CKO:Nestin-Cre neurons denoted an
accumulation of damaged mitochondria due to autophagy inhibition (D). * compared to wt, p<0.05; (E)
Accumulation of lipid droplets in Tsc2+/- and Atg7CKO:Nestin-Cre neurons. Compared to controls, Tsc2+/- and
Atg7CKO:Nestin-Cre neurons displayed higher Lipidtox Red intensity, demonstrating a higher content of lipid
droplets; (F) Autophagy level and mTOR activity in Tsc1CKO and control (Tsc1flox/flox) mouse brains. Tsc1flox/flox
and Tsc1CKO cortical sections were immunolabeled with antibodies against TSC1, pS6 and autophagy markers
LC3, p62 and Ub. Tsc1CKO mice showed loss of TSC1, increased mTOR activity as indicated by increased pS6,

and decreased basal autophagy as indicated by decreased LC3 fluorescence and accumulation of p62 and
Ub.
Figure S6. Behaviors, neuronal morphology, and glial markers in Atg7flox/flox and Atg7CKO mice, related
to Figure 5. (A-G) Open field measures of locomotor activity and anxiety-like behavior in Atg7CKO mice. (A)
Total distance traversed (meter, m); (B) time (second, s) spent immobile; (C) time (s) spent in the center arena;
(D) number of fecal boli; (E) time (s) spent self-grooming; (F) frequency of rearing during the test session; (G)
frequency of digging/foraging during the test session. No genotype and gender differences were found for any
parameter. n(control, male)=15; n(control, female)=20; n (Atg7CKO, male)=13; n(Atg7CKO, female) = 4. Data
are presented as mean ± SEM. (H-J) Soma size and basal dendritic branches in Atg7CKO mice. (H) A
representive DiI labeled layer V pyramidal neurons. No differences were observed for soma size (i) or number
of primary basal dendrites (J) between Atg7flox/flox and Atg7CKO mice. Data are presented as mean± SD. (K-L)
Markers for reactive astrocyte and microglia in Atg7CKO mice at different postnatal ages (P20, P30 and
9months (9mo)). (K) GFAP (Green), p62 (Red) and DAPI (Blue) immunolabel in Atg7CKO mice revealed no
significant increases in GFAP immunofluorescence; (L) microglial marker Iba 1 (Red) and DAPI (Blue)
immunolabel in Atg7CKO mice, showing no significant increases in Iba 1 in Atg7CKO brain. The positive control
indicates microglial activation in mouse hippocampus following pilocarpine induced seizures.

Supplemental Table S1 Demographic data for fixed brains used for Golgi study and immunohistochemistry in Figures 1 & 2.
Group Sample ID
Age (Y) Gender Brain
Weight Brain PH
PMI (Hrs)
Length of Storage (D)
Seizure History Cause of Death
A1 3 Male 1330 N/A 15 102.3 N N/A
A2 7 Male 1560 N/A 11.4 84.0 N Drowning
A3 7 Male 1610 N/A 25 77.0 Y Drowning
A4 7 Male N/A 5.9 3 47.4 N Complication of cancer
ASD (3-9yrs)
n=5
A5 9 Male 1320 N/A 27 127.0 Y Diffuse hemorrhage
C1 2 Female N/A 5.9 16 24.3 N Ingestion of drugs
C2 2 Male N/A 6.3 16 13.3 N Asphyxia, choking on food
C3 5 Male N/A 6.27 17 120.0 N Drowning
C4 6 Female N/A 6.2 24 17.4 N Respiratory failure
Control (2-8yrs)
n=5
C5 8 Male N/A N/A 16 13.7 N Blunt force neck injury
A6 13 Male 1470 N/A 8 111.0 Y Seizure suspected
A7 14 Male 1615 N/A 10.3 158.0 N Heart stroke
A8 15 Male 1090 N/A 26.8 74.0 Y Seizure
A9 15 Male N/A 6.3 9 45.9 N Drowning
ASD (13-19yrs)
n=5
A10 19 Male N/A N/A 22 46.8 Y N/A
C6 13 Male N/A 6.6 16 40.2 N Natural
C7 16 Male N/A 6.67 15 59.8 Y Multiple injuries
C8 17 Male 1460 N/A 30.8 35.0 N Asphyxia
C9 17 Male 1250 N/A 28.9 N/A N N/A
Control (13-18yrs)
n=5
C10 18 Male N/A N/A 21 96.9 N Cardiac Arrhythmia
No significant differences were detected in age, PMI and length of storage between patients and controls from different age groups, p<0.05 for all unpaired t tests. A, ASD; C, control.

Supplemental Table S2 Correlations between spine density, western blot data and confounding factors used in Figures 1 & 2.
Age PMI Gender Cause of
Death Seizure History
Storage Time
Spine Density
r (p) -0.726 (0.000)*
-0.235 (0.318)
0.087 (0.716)
-0.253 (0.283)
-0.057 (0.812)
0.197 (0.420)
p-mTOR r (p) 0.407 (0.006)*
0.231 (0.132)
-0.218 (0.151)
-0.143 (0.348)
-0.054 (0.755)
0.210 (0.232)
LC3 II r (p) -0.419 (0.004)*
-0.154 (0.318)
0.242 (0.109)
0.285 (0.058)
0.474 (0.004)*
-0.243 (0.166)
p62 r (p) 0.221 (0.249)
0.099 (0.608)
0.186 (0.335)
-0.226 (0.239)
-0.487 (0.007)*
0.362 (0.065)
PSD95 r (p) -0.433 (0.003)*
-0.059 (0.701)
0.158 (0.300)
0.261 (0.083)
-0.036 (0.835)
0.163 (0.357)
r denotes spearman correlation coefficient; p in parentheses denotes significance p value.

Supplemental Table S3 Demographic data for postmortem frozen brain samples for western blot analysis used in Figures 1 & 2.
Group Sample ID Age Gender PMI
(Hrs) Length of
Storage (D) Seizure History Cause of Death
A11 9 Male 27.0 127.0 Y Diffuse hemorrhage A12 2 Male 4.0 77.0 N Drowning A13 5 Male 25.5 108.0 N Drowning A14 5 Female 32.7 52.0 N Drowning A15 8 Male 22.2 105.0 N Cancer A16 4 Female 13.0 59.5 N Multiple injuries A17 7 Male 3.0 26.0 N Cancer
ASD (2-9yrs)
n=8
A18 7 Male 20.0 47.9 N Drowning C11 2 Female 16.0 24.3 N Asphyxia, Ingestion of drugs C12 3 Female 12.0 83.7 N Drowning C13 3 Male 16.0 13.3 N Asphyxia, Choking on food C14 5 Male 17.0 59.7 N Trauma C15 5 Male 17.0 120.0 N Drowning C16 5 Female 24.0 17.4 N Respiratory failure
Control (2-9yrs)
n=7
C17 8 Male 16.0 13.7 N Blunt force neck injury A19 20 Male 23.7 127.0 N Accident, multiple injuries A20 16 Male N/A 82.0 Y Seizure A21 19 Male 28.1 49.0 N Asphyxia, Choking on food A22 14 Male 9.0 45.9 N Drowning
ASD (13-20yrs)
n=8
A23 16 Male 20.0 108.9 Y Diabetic Ketoacidosis C18 13 Male 16.0 40.2 N Natural C19 19 Male 9.0 106.7 N Multiple injuries C20 19 Male 17.0 51.0 N Multiple injuries C21 19 Male 15.0 96.9 N Multiple injuries C22 20 Male 12.0 90.4 N Multiple injuries C23 16 Male 21.0 59.8 N Cardiac Arrhythmia C24 17 Male 30.8 35.0 N Asphyxia C25 19 Male 18.6 N/A N Pneumonia
Control (13-20yrs)
n=5
C26 17 Male 28.9 N/A N N/A No significant differences in age, PMI and length of storage were detected between patients and controls, p<0.05 for all unpaired t tests. The distribution of gender was matched between patients and controls aged 2-9yrs. A, ASD; C, control.
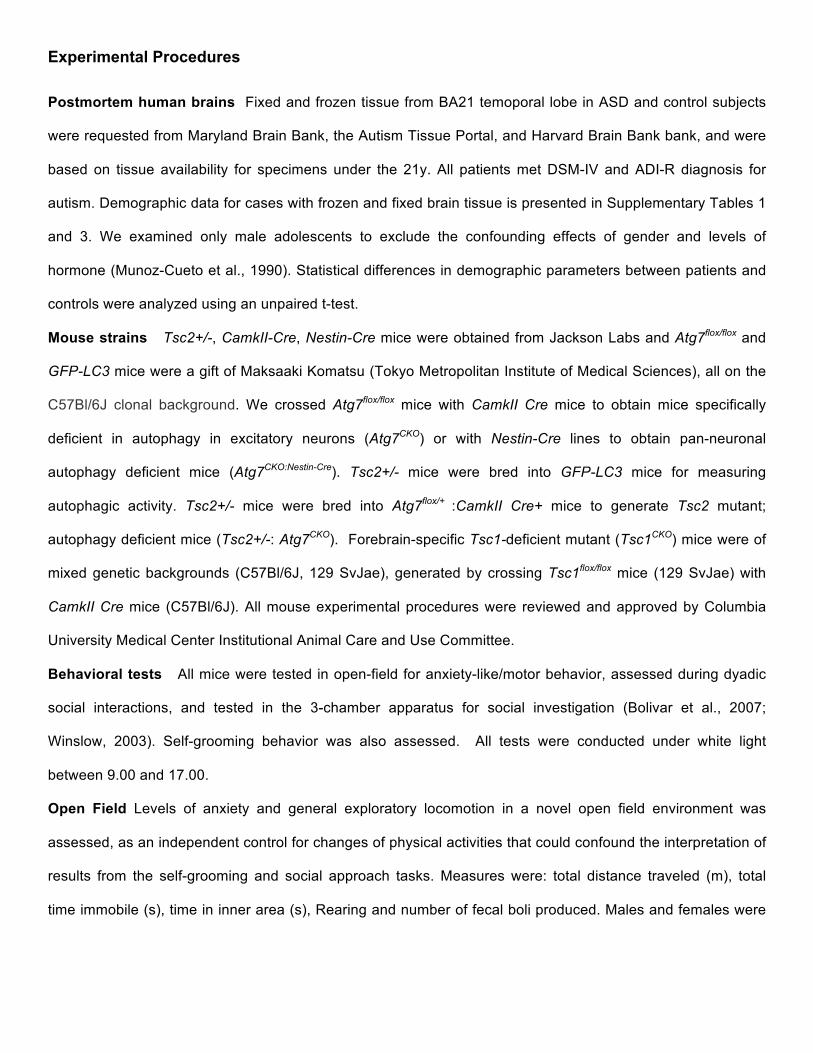
Experimental Procedures
Postmortem human brains Fixed and frozen tissue from BA21 temoporal lobe in ASD and control subjects
were requested from Maryland Brain Bank, the Autism Tissue Portal, and Harvard Brain Bank bank, and were
based on tissue availability for specimens under the 21y. All patients met DSM-IV and ADI-R diagnosis for
autism. Demographic data for cases with frozen and fixed brain tissue is presented in Supplementary Tables 1
and 3. We examined only male adolescents to exclude the confounding effects of gender and levels of
hormone (Munoz-Cueto et al., 1990). Statistical differences in demographic parameters between patients and
controls were analyzed using an unpaired t-test.
Mouse strains Tsc2+/-, CamkII-Cre, Nestin-Cre mice were obtained from Jackson Labs and Atg7flox/flox and
GFP-LC3 mice were a gift of Maksaaki Komatsu (Tokyo Metropolitan Institute of Medical Sciences), all on the
C57Bl/6J clonal background. We crossed Atg7flox/flox mice with CamkII Cre mice to obtain mice specifically
deficient in autophagy in excitatory neurons (Atg7CKO) or with Nestin-Cre lines to obtain pan-neuronal
autophagy deficient mice (Atg7CKO:Nestin-Cre). Tsc2+/- mice were bred into GFP-LC3 mice for measuring
autophagic activity. Tsc2+/- mice were bred into Atg7flox/+ :CamkII Cre+ mice to generate Tsc2 mutant;
autophagy deficient mice (Tsc2+/-: Atg7CKO). Forebrain-specific Tsc1-deficient mutant (Tsc1CKO) mice were of
mixed genetic backgrounds (C57Bl/6J, 129 SvJae), generated by crossing Tsc1flox/flox mice (129 SvJae) with
CamkII Cre mice (C57Bl/6J). All mouse experimental procedures were reviewed and approved by Columbia
University Medical Center Institutional Animal Care and Use Committee.
Behavioral tests All mice were tested in open-field for anxiety-like/motor behavior, assessed during dyadic
social interactions, and tested in the 3-chamber apparatus for social investigation (Bolivar et al., 2007;
Winslow, 2003). Self-grooming behavior was also assessed. All tests were conducted under white light
between 9.00 and 17.00.
Open Field Levels of anxiety and general exploratory locomotion in a novel open field environment was
assessed, as an independent control for changes of physical activities that could confound the interpretation of
results from the self-grooming and social approach tasks. Measures were: total distance traveled (m), total
time immobile (s), time in inner area (s), Rearing and number of fecal boli produced. Males and females were

tested on separate days to avoid odor preferences. Videos were later analyzed with the automated tracking
program ANY-Maze (v4.82, Stoelting).
Novel Object Recognition Subjects were habituated for ten minutes in one of four identical, translucent blue
arenas (18.25”x 13.87”x 10.87”). Each apparatus was cleaned with a 30% warm soap solution and contained
fresh bedding for each trial. One day after habituation, the mouse was reintroduced to the chamber, now
containing two identical objects (yellow rubber ducks) placed in opposite corners of the apparatus. Tests were
video recorded for 15 minutes, after which the mouse was returned to the home cage. Thirty minutes after the
initial test, the mouse was placed into the arena, now containing one original object and one novel object
(yellow cylinder), and behavior was recorded for 15 minutes. Video recorded sessions were coded for time
spent actively sniffing the novel object vs. the original/familiar object.
Dyadic social Interaction Male mice were assessed for dyadic social interactions with unfamiliar (non-
cagemates) mice matched for sex and genotype. One day prior to testing, tails were marked with a non-toxic
marker for identification during analysis. Each animal was placed in an 18.25”x 13.87”x 10.87” arena. Subjects
were brought into the testing room individually, in clean transfer cages, and were placed in opposing corners of
the chamber simultaneously. Behavior was video recorded for 15 minutes and was coded by two researchers
blind to genotype. Minute-by-minute analysis of the number of observed bouts of sniffing, walking, rearing, tail
rattling, dig/foraging, huddling, grooming, biting, mounting as well as total time spent sniffing were measured.
Three Chamber tests for sociability and preference for social novelty Mice were tested in a three-
chambered arena for three 10-min phases: (1) Habituation: the test mouse was first placed in the middle
chamber and allowed to explore, with the doorways into the two side chambers open. (2) Sociability: following
the habituation period, the test mouse was enclosed in the center compartment of the social test box, and an
unfamiliar mouse was enclosed in a wire pencil cup placed in a side chamber. The location for the unfamiliar
mouse alternated between the left and right sides of the social test box across subjects. An empty wire pencil
cup was placed in the opposite side, to serve as a novel object control. Following placement of the mouse and
cup, the doors were re-opened, and the subject was allowed to explore the entire social test box. Measures
were taken of the amount of time spent sniffing the mouse and the empty cup. (3) Preference for social
novelty: at the end of the sociability test, each mouse was further tested for preference to spend time with a

novel mouse. A new unfamiliar mouse (novel mouse) was placed in the wire pencil cup that had been empty
during the previous session. The test mouse then had a choice between the first, already-investigated mouse
(familiar mouse) and the novel unfamiliar mouse (novel mouse). The same measures were acquired as for the
sociability test.
Self-grooming Mice were scored for spontaneous grooming behaviors. A thin (1 cm) layer of bedding
reduced neophobia, while preventing digging; a potentially competing behavior. After a 10-min habituation
period in the test cage, each mouse was scored with a stopwatch for 10 min for cumulative time spent
grooming all body regions.
Immunohistochemistry 10 controls and 10 ASD patients were included for immunohistochemistry on 7µm
thick paraffin-embedded temporal lobe brain sections. Triplicate cryosections (7µm thick) with comparable
anatomy were chosen from mutants and corresponding control mice. Antibodies used for
immunocytochemistry were against LC3 (1:200, Novus), p62 (1:300, American Research Products), ubiquitin
(Ub, 1:300, Millipore), PSD95 (1:100, Abcam) and synaptophysin (1:300, Abcam).
Neuronal culture and immunocytochemistry Cortical neurons from postnatal day1-3 mice were
dissociated and plated on primary rat astrocyte monolayers. At day 14-15 in vitro, primary neurons were fixed
with 4% paraformaldehyde or subjected to live cell staining for lipid droplets (LipdtoxRed, Invitrogen) and
mitochondria (MitoTracker Red and Green, Invitrogen). Fixed neuronal cultures were immunostained with
antibodies against autophagy markers LC3 (1:200, Novus), p62 (1:500, American Research Products), PSD95
(1:100, Abcam) and F-actin (1:50, Alexa Fluor 488 phalloidin, Invitrogen). For spine dynamic analysis,
hippocampal neurons were cultured at low density. At day 14-15 in vitro, neurons were infected with an EGFP
expressing control virus or Atg7SiRNA-EGFP virus. Neurons were fixed for Immunocytochemistry at DIV 19-20
or were live imaged for spine formation or elimination during a 12 hour time window.
Western blotting Mouse and human brain tissue were lysed with 1X RIPA buffer supplemented with
protease inhibitors and phosphatase inhibitors. Homogenates were centrifuged at 14000rpm at 4C for 30min
and supernatant were collected for western blotting. Antibodies used were against LC3 (1:1000, Novus), p-
mTOR(1:1000, Cellsignal), t-mTOR(1:1000, Cellsignal), PSD95(1:2000, Abcam), p-S6(1:1000, Cellsignal), t-

S6(1:1000, Cellsignal), Atg12 & Ag5 (1:1000, Cellsignal), p62(1:2000, American Research Products), and actin
(1:3000, Sigma).
Golgi impregnation and image analysis Neuronal morphology in postmortem human brain was analyzed
using Golgi-Kopsch technique, as described previously (Rosoklija et al., 2003). Thirty-two subjects, ranging in
age from 2y to 20y were included with 20 samples successfully stained (success rate ~62%). In all cases, only
neurons in which the basal dendritic tree was completely stained were included in this analysis. 3-D
reconstruction ensures spines located on the top or bottom surface of the dendrites could be analyzed,
avoiding underestimate of the number of spines and of the spine densities. Because spine density and possibly
spine size changes as a function of distance from the soma (Benavides-Piccione et al., 2002), we compared
similar segments of dendrites between different cells by selecting segments of basal dendrites which were
located at the same proportional distance from the soma. We selected basal dendrites segments that were 70-
100 µm distant from the soma, immediately after the first branching point. 15-30 isolated layer V pyramidal
cells per tissue block were randomly chosen for analysis and 3-4 dendritic segments per cell were analyzed.
Images were acquired using an Olympus BX21 system equipped with a Z axis control and a 100X oil long
working distance objective. The acquired brightfield images were pre-processed with ImageJ to eliminate
background pixels. The resulting transparent “false fluorescent” Z-stacks were reconstructed using Imaris
software FilamentTracer Module (Bitplane). Spine density was represented by average number of spines per
10 µm of dendritic length. Spine density, length of spine neck and spine head diameter was analyzed using
ImarisXT module (Bitplane).
DiOlistic labeling of dendritic spine in mouse brain and imaging Anesthetized mice were transcardially
perfused with 4% PFA. Whole brains were removed and sectioned at 200 µm thickness on a vibratome. Brain
slices were labeled with DiI using a Helios gene gun system at 120 psi. Z stack images with 0.2 µm step size
were acquired with a Leica multiphoton system. The basal dendritic segments were imaged using the same
criteria described above. Fluorescent Z-stacks were reconstructed using Imaris software FilamentTracer
module (Bitplane) and spine analysis was performed using ImarisXT module. Primary auditory cortex (A1) and
secondary somatosensory cortex (S2), approximately the temporal cortices of mice, were selected as reported
previously (Benavides-Piccione et al., 2002).

Statistical analysis Statistical analyses were performed using Graphpad Prism software using one-way or
two-way ANOVA with Bonferroni’s multiple comparison tests for post-hoc analysis. Normal distribution of data
was determined using the Kolmogorov-Smirnov test. Differences between two groups were analyzed by two-
tailed t-test. Correlations were analyzed using Spearman correlation test and nonlinear regression. Results are
presented as mean ± SEM or mean ± S.D. p < 0.05 was considered statistically significant.

References for Experimental Procedures
Winslow, J. T. (2003). Mouse social recognition and preference. in Curr. Protoc. Neurosci., Crawley, J.N., et
al., ed. (John Wiley & Sons. Inc, New york), pp. 8.16.1-8.16.16.
Bolivar, V. J., Walters, S. R. & Phoenix, J. L. (2007). Assessing autism-like behavior in mice: variations in
social interactions among inbred strains. Behav. Brain Res. 176: 21-26.
Munoz-Cueto, J. A., Garcia-Segura, L. M. & Ruiz-Marcos, A. (1990).Developmental sex differences and effect
ofovariectomy on the number of cortical pyramidal cell dendritic spines. Brain Res. 515, 64-68.
Benavides-Piccione, R., Ballesteros-Yáñez, I., DeFelipe, J., Yuste, R. (2002). Cortical area and species
differences in dendritic spine morphology. J Neurocytol. 31:337-346.
Rosoklija, G., Mancevski, B., Ilievski, B., Perera, T., Lisanby, S.H., Coplan, J.D., Duma, A., Serafimova, T.,
Dwork, A.J. (2003). Optimization of Golgi methods for impregnation of brain tissue from humans and
monkeys. J. Neurosci. Methods 131, 1-7.
Copyright © 2022 FDOKUMEN