Identification of Host-Chromosome Binding Sites and Candidate Gene Targets for Kaposi's...
11
Identification of Host-Chromosome Binding Sites and Candidate Gene Targets for Kaposi’s Sarcoma-Associated Herpesvirus LANA Fang Lu, Kevin Tsai, Horng-Shen Chen, Priyankara Wikramasinghe, Ramana V. Davuluri, Louise Showe, John Domsic, Ronen Marmorstein, and Paul M. Lieberman The Wistar Institute, Philadelphia, Pennsylvania, USA LANA is essential for tethering the Kaposi’s sarcoma-associated herpesvirus (KSHV) genome to metaphase chromosomes and for modulating host-cell gene expression, but the binding sites in the host-chromosome remain unknown. Here, we use LANA- specific chromatin immunoprecipitation coupled with high-throughput sequencing (ChIP-Seq) to identify LANA binding sites in the viral and host-cell genomes of a latently infected pleural effusion lymphoma cell line BCBL1. LANA bound with high occu- pancy to the KSHV genome terminal repeats (TR) and to a few minor binding sites in the KSHV genome, including the LANA promoter region. We identified 256 putative LANA binding site peaks with P < 0.01 and overlap in two independent ChIP-Seq experiments. We validated several of the high-occupancy binding sites by conventional ChIP assays and quantitative PCR. Can- didate cellular LANA binding motifs were identified and assayed for binding to purified recombinant LANA protein in vitro but bound with low affinity compared to the viral TR binding site. More than half of the LANA binding sites (170/256) could be mapped to within 2.5 kb of a cellular gene transcript. Pathways and Gene Ontogeny (GO) analysis revealed that LANA binds to genes within the p53 and tumor necrosis factor (TNF) regulatory network. Further analysis revealed partial overlap of LANA and STAT1 binding sites in several gamma interferon (IFN-)-regulated genes. We show that ectopic expression of LANA can down- modulate IFN--mediated activation of a subset of genes, including the TAP1 peptide transporter and proteasome subunit beta type 9 (PSMB9), both of which are required for class I antigen presentation. Our data provide a potential mechanism through which LANA may regulate several host cell pathways by direct binding to gene regulatory elements. K aposi’s sarcoma-associated herpesvirus (KSHV) is a causative agent of Kaposi’s sarcoma (KS), pleural effusion lymphomas (PEL), and multicentric Castleman’s disease (17, 36, 49). KSHV is a member of the gammaherpesvirus family and can establish long- term latent infection in human B lymphocytes. Latent infection is also detected in endothelial cells associated with KS lesions. Dur- ing latent infection, only a small portion of viral genes are ex- pressed, and these genes are known to promote host-cell survival and viral genome maintenance. Among these KSHV latency genes, the latency-associated nuclear antigen (LANA) is consis- tently expressed in all forms of KSHV-positive tissues and cell lines (24, 25, 44, 56). LANA is essential for maintaining the episomal form of the viral genome during latency (4, 12, 56). This maintenance func- tion is mediated by direct and indirect DNA-binding of LANA to the viral and cellular chromosomes (19, 21). The LANA C-termi- nal domain binds directly to two LANA-binding sites (LBS) in the KSHV terminal repeats (TR) that confer DNA replication origin function for the latent viral episome (5, 18, 19, 22, 53). LANA maintains stable episome copy number by tethering KSHV epi- somes to host metaphase chromosomes (4, 5). This function is mediated through the LANA N-terminal chromatin binding do- main that interacts with metaphase chromosome constituents, in- cluding the core histones H2A and H2B (6, 42). LANA also main- tains KSHV latency by repressing transcription of the viral immediate-early gene ORF50, which activates the switch from la- tency to lytic replication (28, 32, 60). In addition to regulating viral genome copy number and gene expression, LANA modulates host cell gene expression. LANA interacts with various transcription factors and chromatin regu- latory proteins, including BRD2 (57, 58), BRD4 (40, 61), HP1 (30), ORC (31, 53), PARP1 (39), p53 (9, 15), Rb (51), mSin3 (26), DNMT3a (50), and RBP-J (28). Many of these interactions have profound effects on host-cell physiology, including enhanced pro- liferation and survival. For example, LANA binding to p53 inhib- its p53 transcriptional activity and prevents p53-mediated apo- ptosis (9, 15). LANA can also alter host-cell interactions with the immune system and attenuate the antiviral response. For exam- ple, LANA inhibits interleukin-4-mediated STAT4 phosphoryla- tion to inhibit apoptosis and maintain latency (7). LANA also inhibits beta interferon (IFN-) expression by competing with IFN regulatory factor-3 for binding to IFNB promoter to attenu- ate the innate antiviral response of the host (10). Global gene expression profiling studies have revealed that LANA modulates a spectrum of cellular genes when ectopically expressed (2). Among these genes were several members of the p16/Ink4 pathway, as well as components of the immunomodu- latory response. Whether LANA binds directly or indirectly to the regulatory regions of these genes remains largely unknown. It is also unknown whether LANA binds to specific regions of the cel- lular chromosome to support episome tethering during cell divi- sion. To identify cellular binding sites for LANA, we applied Illu- mina/Solexa-based deep sequencing methods to analyze the genome-wide interaction sites of LANA in KSHV latently infected BCBL1 PEL cells. Our result revealed numerous LANA binding Received 28 December 2011 Accepted 1 March 2012 Published ahead of print 14 March 2012 Address correspondence to Paul M. Lieberman, [email protected]. Supplemental material for this article may be found at http://jvi.asm.org/. Copyright © 2012, American Society for Microbiology. All Rights Reserved. doi:10.1128/JVI.07216-11 5752 jvi.asm.org 0022-538X/12/$12.00 Journal of Virology p. 5752–5762
Transcript of Identification of Host-Chromosome Binding Sites and Candidate Gene Targets for Kaposi's...

Identification of Host-Chromosome Binding Sites and Candidate GeneTargets for Kaposi’s Sarcoma-Associated Herpesvirus LANA
Fang Lu, Kevin Tsai, Horng-Shen Chen, Priyankara Wikramasinghe, Ramana V. Davuluri, Louise Showe, John Domsic,Ronen Marmorstein, and Paul M. Lieberman
The Wistar Institute, Philadelphia, Pennsylvania, USA
LANA is essential for tethering the Kaposi’s sarcoma-associated herpesvirus (KSHV) genome to metaphase chromosomes andfor modulating host-cell gene expression, but the binding sites in the host-chromosome remain unknown. Here, we use LANA-specific chromatin immunoprecipitation coupled with high-throughput sequencing (ChIP-Seq) to identify LANA binding sitesin the viral and host-cell genomes of a latently infected pleural effusion lymphoma cell line BCBL1. LANA bound with high occu-pancy to the KSHV genome terminal repeats (TR) and to a few minor binding sites in the KSHV genome, including the LANApromoter region. We identified 256 putative LANA binding site peaks with P < 0.01 and overlap in two independent ChIP-Seqexperiments. We validated several of the high-occupancy binding sites by conventional ChIP assays and quantitative PCR. Can-didate cellular LANA binding motifs were identified and assayed for binding to purified recombinant LANA protein in vitro butbound with low affinity compared to the viral TR binding site. More than half of the LANA binding sites (170/256) could bemapped to within 2.5 kb of a cellular gene transcript. Pathways and Gene Ontogeny (GO) analysis revealed that LANA binds togenes within the p53 and tumor necrosis factor (TNF) regulatory network. Further analysis revealed partial overlap of LANA andSTAT1 binding sites in several gamma interferon (IFN-�)-regulated genes. We show that ectopic expression of LANA can down-modulate IFN-�-mediated activation of a subset of genes, including the TAP1 peptide transporter and proteasome subunit betatype 9 (PSMB9), both of which are required for class I antigen presentation. Our data provide a potential mechanism throughwhich LANA may regulate several host cell pathways by direct binding to gene regulatory elements.
Kaposi’s sarcoma-associated herpesvirus (KSHV) is a causativeagent of Kaposi’s sarcoma (KS), pleural effusion lymphomas
(PEL), and multicentric Castleman’s disease (17, 36, 49). KSHV isa member of the gammaherpesvirus family and can establish long-term latent infection in human B lymphocytes. Latent infection isalso detected in endothelial cells associated with KS lesions. Dur-ing latent infection, only a small portion of viral genes are ex-pressed, and these genes are known to promote host-cell survivaland viral genome maintenance. Among these KSHV latencygenes, the latency-associated nuclear antigen (LANA) is consis-tently expressed in all forms of KSHV-positive tissues and celllines (24, 25, 44, 56).
LANA is essential for maintaining the episomal form of theviral genome during latency (4, 12, 56). This maintenance func-tion is mediated by direct and indirect DNA-binding of LANA tothe viral and cellular chromosomes (19, 21). The LANA C-termi-nal domain binds directly to two LANA-binding sites (LBS) in theKSHV terminal repeats (TR) that confer DNA replication originfunction for the latent viral episome (5, 18, 19, 22, 53). LANAmaintains stable episome copy number by tethering KSHV epi-somes to host metaphase chromosomes (4, 5). This function ismediated through the LANA N-terminal chromatin binding do-main that interacts with metaphase chromosome constituents, in-cluding the core histones H2A and H2B (6, 42). LANA also main-tains KSHV latency by repressing transcription of the viralimmediate-early gene ORF50, which activates the switch from la-tency to lytic replication (28, 32, 60).
In addition to regulating viral genome copy number and geneexpression, LANA modulates host cell gene expression. LANAinteracts with various transcription factors and chromatin regu-latory proteins, including BRD2 (57, 58), BRD4 (40, 61), HP1(30), ORC (31, 53), PARP1 (39), p53 (9, 15), Rb (51), mSin3 (26),
DNMT3a (50), and RBP-J� (28). Many of these interactions haveprofound effects on host-cell physiology, including enhanced pro-liferation and survival. For example, LANA binding to p53 inhib-its p53 transcriptional activity and prevents p53-mediated apo-ptosis (9, 15). LANA can also alter host-cell interactions with theimmune system and attenuate the antiviral response. For exam-ple, LANA inhibits interleukin-4-mediated STAT4 phosphoryla-tion to inhibit apoptosis and maintain latency (7). LANA alsoinhibits beta interferon (IFN-�) expression by competing withIFN regulatory factor-3 for binding to IFNB promoter to attenu-ate the innate antiviral response of the host (10).
Global gene expression profiling studies have revealed thatLANA modulates a spectrum of cellular genes when ectopicallyexpressed (2). Among these genes were several members of thep16/Ink4 pathway, as well as components of the immunomodu-latory response. Whether LANA binds directly or indirectly to theregulatory regions of these genes remains largely unknown. It isalso unknown whether LANA binds to specific regions of the cel-lular chromosome to support episome tethering during cell divi-sion. To identify cellular binding sites for LANA, we applied Illu-mina/Solexa-based deep sequencing methods to analyze thegenome-wide interaction sites of LANA in KSHV latently infectedBCBL1 PEL cells. Our result revealed numerous LANA binding
Received 28 December 2011 Accepted 1 March 2012
Published ahead of print 14 March 2012
Address correspondence to Paul M. Lieberman, [email protected].
Supplemental material for this article may be found at http://jvi.asm.org/.
Copyright © 2012, American Society for Microbiology. All Rights Reserved.
doi:10.1128/JVI.07216-11
5752 jvi.asm.org 0022-538X/12/$12.00 Journal of Virology p. 5752–5762

sites throughout the host genome and a subset of those bindingsites located close to known transcription start sites. Our data alsosuggest that LANA has the potential to interfere with STAT1-dependent IFN-� regulation to modulate host cell antiviral im-mune response.
MATERIALS AND METHODSCells and plasmids. KSHV-positive PEL BCBL1, BC-1, and JSC-1 cellsand KSHV-negative Burkitt lymphoma DG75 and BJAB cells were main-tained in RPMI-1640 containing 10% fetal bovine serum and supple-mented with GlutaMAX (Invitrogen) and antibiotics (penicillin andstreptomycin). pCMV-FLAG-LANA-FL was previously described (32).Recombinant LANA-DNA binding domain (DBD) was constructed byPCR amplification of LANA DBD (amino acids [aa] 936 to 1162) withprimers introducing a 5= BamHI and 3= XhoI site cloned in frame to abaculovirus expression vector pFASTBACHTb. LANA-DBD was ex-pressed with an N-terminal hexahistidine tag from baculovirus-infectedSf9 cells and purified using Ni-NTA agarose.
ChIP-Seq. Chromatin immunoprecipitation for high-throughput se-quencing (ChIP-Seq) experiments were performed with 107 BCBL1 cellsper assay with either LANA rat monoclonal antibody (Advanced Biotech-nologies, Inc., Gaithersburg, MD) or control mouse IgG (Santa Cruz Bio-technology, Inc., Santa Cruz, CA). The ChIP methods were describedpreviously (33) except that protein G-Sepharose was replaced by Dyna-beads protein A (Invitrogen). DNA fragments in the range of ca. 150 to300 bp were isolated by agarose gel purification, ligated to primers, andthen subjected to Solexa-based sequencing using manufacturer’s recom-mendations (Illumina, Inc.).
ChIP assays. ChIP assays were performed as described previously (8).Quantification of precipitated DNA was determined using real-time PCRand the threshold cycle (CT) method for relative quantification (ABI7900HT Fast Real-Time PCR System; Applied Biosystems). The primersused for the ChIP assays are listed in Table S1 in the supplemental mate-rial. The following antibodies were used for ChIP assays: anti-LANA (ratmonoclonal antibody 13-210-100; Advanced Biotechnology), anti-IgG(mouse sc-2025 and rabbit sc-2027 antibodies; Santa Cruz Biotechnol-ogy), and anti-STAT1 (rabbit polyclonal sc-345; Santa Cruz Biotechnol-ogy).
EMSA. DNA fragments were labeled using T4 polynucleotide kinase(NEB) in the presence of [�-32P]ATP and purified using G-25 spin col-umns (GE Healthcare). Purified LANA-DBD was incubated with probesat room temperature for 30 min in a total volume of 20 �l of buffercontaining 10 mM Tris-HCl (pH 8.0), 100 mM KCl, 1 mM EDTA, 10 mMMgCl2, 0.05 �g of poly(dI-dC)/�l, 0.5 �g of bovine serum albumin/�l,0.05% NP-40, 35 mM �-mercaptoethanol, and 10% glycerol. For compe-tition assay, 50-pmol portions of cold competitors were mixed withLANA-DBD, and then 0.05 pmol of labeled LBS1/2 probe was added toeach reaction, followed by incubation for 30 min. The samples were thenseparated by electrophoresis on a native 5% polyacrylamide gel. The gelswere dried and analyzed using a Typhoon PhosphorImager system. Theprobe and competitor oligonucleotide sequences are listed in Table S2 inthe supplemental material.
Quantitative RT-PCR. Briefly, 5 � 106 DG75 cells were centrifugedand resuspended in 100 �l of nucleofection solution T (Lonza) containing5 �g of FLAG-LANA or vector control and 0.5 �g of pmaxGFP (Lonza)and then electroporated on a Lonza nucleofector using the program A-23.After nucleofection, the cells were transferred to a flask containing 20 mlof fresh, complete RPMI 1640 medium, incubated at 37°C for 24 h, andinduced with or without 5 ng of human recombinant IFN-�/ml for an-other 24 h. The green fluorescent protein (GFP)-positive cells were thensorted and used in reverse transcription-PCR (RT-PCR) analyses. RNAwas isolated from 2 � 105 cells using an RNeasy kit (Qiagen) and thenfurther treated with DNase I. RT-PCR was performed as previously de-scribed (32). Real-time PCR was performed with SYBR green probe in anABI Prism 7900 according to the manufacturer’s specified parameters.
Primer sequences for RT-PCR are listed in Table S3 in the supplementalmaterial.
Bioinformatics analysis of ChIP-Seq sequencing. We followed pub-lished procedures for the bioinformatics analysis of ChIP-Seq data (29, 46,63). Briefly, image analysis and base calling of ChIP-Seq data was per-formed using Illumina pipeline software. Sequence alignment to the hu-man genome hg18 was performed using Bowtie. Only uniquely alignedsequence tags, with up to two mismatches, were considered for furtheranalysis. Tags aligned to blacklisted areas (the ENCODE consortiumblacklist was downloaded [http://genome.ucsc.edu/cgi-bin/hgFileUi?db�hg19&g�wgEncodeMapability]), and the multiple tags that aligned tothe exact same position were also removed before the peak calling step.
Peak calling. Significant peaks were identified using a two-step pro-cedure, which we have successfully applied in our recent studies (41, 54).In the first step, statistically significant enriched genomic regions (length,1 kb) were identified. A region is defined as statistically significant if thedifference in the number of reads between experiment (LANA) and con-trol IgG samples within the region is higher than a given cutoff read countcalculated using a P value of 0.01. Each ChIP-Seq read distribution in thegenome can be considered the Poisson distribution, and the difference oftwo Poisson distributions is given by the Skellam distribution (52). TheSkellam probability mass function is given by the following equation:
P(n, �1, �2) � e�(�1��2)��1
�2�n ⁄ 2
In�2��1 �2��
where n represents number of reads, �1 and �2 are mean number ofreads for two different samples and In(2��1�2) is a modified Bessel func-tion. A region is considered statistically significant if the difference in thenumber of reads between experiment (LANA) and control IgG sampleswithin the region is higher than a given cutoff read count calculated usinga P value of 0.01 based on the Skellam distribution.
For each of the statistically significant enriched regions, ChIP-Seq readoverlapping profiles were created by extending the sequence reads fromthe 5= end to the 3= end of the reads up to 250 bp (the average length of theChIP-DNA fragment sequenced from the Solexa GA with an Illuminastandard ChIP-Seq protocol) for the experiment sample. Then, withineach enriched region, the significant enriched peaks in experimental dataare identified based on a threshold read count obtained from a secondcutoff P value of �0.01, using a Poisson distribution on the experimentalsample only.
For the KSHV genome, the peak calling method (29, 46, 63) was mod-ified to accommodate the smaller size of the genome, as the KSHV ge-nome is too small to build a robust Poisson distribution model. Also,unlimited multiple mapping was allowed to find the ChIP-Seq peaks interminal repeat regions. After mapping read tags to the KSHV genome,reads were extended to the average read length. In the case of multiplemapped sequence reads, each read was counted as the fraction 1/n todetermine the read counts at each base, where n is the total number ofmultiple maps of the sequence in the genome. In the next step, the numberof reads per base was calculated for moving windows of 250 bp, at every5-bp interval, by dividing the total read count in each window by itslength. Then, the reads per base counts were scaled by using a factor withtotal reads in the KSHV genome (104/total reads). The normalized scoreswere assigned to the middle base of the corresponding moving window.After applying the above method for the two samples, average score wasobtained as final score at every moving window. Finally, peaks were ob-tained using the definition of mathematical maximum on the averagescores using the predefined cutoff described above. All reads were mappedto the BCBL1 reference genome (NCBI no. HQ404500) with 35 TRs(NC_009333, nucleotides [nt]137169 to 137969).
Annotating the ChIP-Seq LANA peaks to known genes. LANA peaksthat overlap from the two independent ChIP-Seq samples were annotatedto genes if they were located within 2,500 bp up- or downstream of knowngene open reading frames. Any two consecutive peaks that are within 250
LANA Cellular Binding Sites
May 2012 Volume 86 Number 10 jvi.asm.org 5753

bp of each other are considered overlapping since the average tag length isaround 250 to 350 bp.
Ingenuity analysis. For pathway analysis, we listed all genes that areannotated to ChIP-Seq peaks with a cutoff of peak score of 5. This genelist was then analyzed using Ingenuity Systems IPA software (IPA version8.7, content version 3202).
LANA binding motif identification. We selected enriched genomicregions (P � 0.01) from the two independent ChIP-Seq samples (over-lapped peaks only) for motif identification. Computational motif predic-tion was performed by submitting a set of DNA sequences, each 100 bp inlength (50 bp around each peak), to the MEME web application version4.3 (3) (http://meme.nbcr.net/meme/intro.html) to find statistically en-riched sequence motifs within the ChIP-Seq peak regions. PossibleLANA-binding motifs were predicted based on the highest number ofoccurrences with the lowest P value, with the parameters “Any number ofrepetitions” of motifs per sequence, and motif length limited to ca. 6 to 30nt. Position-weighted matrixes (PWMs) generated by MEME were thenrepresented in the logo format by using WebLogo (13) (http://weblogo.berkeley.edu/logo.cgi) to generate consensus sequences for multipleLANA cellular binding sites. To assess the similarity of the two motifsfound from our ChIP-Seq with the published LBS1 and LBS2 sequences(18), we utilized the STAMP DNA motif comparison tool-kit (http://www.benoslab.pitt.edu/stamp/) (35). Motif 1 and motif 2 (as shown in Fig. 4A)were submitted to STAMP as PWMs, along with the LBS1 and LBS2 se-quences (5=-CGCCCGGGCATGGGGC-3= and 5=-CGCCGCCGGGGCCTGCGG-3=, respectively). The STAMP setup parameters were as follows:column comparison was done by using the Pearson correlation coeffi-cient, and local alignment was done by using the ungapped Smith-Water-man method with a preference against the edges of the motif.
Overlap of LANA and STAT1 bound genomic regions. The list ofLANA-binding enriched genomic regions was matched for overlappingregions with the IFN-�-stimulated STAT1 ChIP-Seq enrich regions (dataset downloaded from the supplementary data of Robertson et al. [46]) byuploading both data sets (in BED format) as custom tracks on to theUCSC genome browser (http://genome.ucsc.edu/) and using the tablebrowser to output the list of all LANA enrich regions that have any overlapwith STAT1 enrich regions.
RESULTSChIP-Seq analysis of LANA binding to the KSHV genome. Toidentify LANA interactions sites on the KSHV and cellular ge-nome, we performed two independent LANA-specific ChIP-Seqexperiments using the KSHV-positive PEL cell line BCBL1.BCBL1 cells were selected for LANA ChIP-Seq experiments be-cause they maintain a stable copy number of KSHV episomes andbecause they are not infected with other gammaherpesviruses,such as Epstein-Barr virus (EBV). Anti-LANA monoclonal anti-body and IgG control ChIP DNA was analyzed by Solexa-Illu-mina-based sequencing methods. A summary of Solexa sequenc-ing and gene mapping statistics is included in Table S4 in thesupplemental material. Sequence reads were first mapped to theKSHV genome (NCBI reference sequence HQ404500), and LANAenriched peaks are shown in Fig. 1A. The KSHV genome presentin virions consists of a large unique region (LUR) flanked at eachend by variable numbers (normally 35 to 45) of terminal repeats(TR). Since HQ404500 contains only the LUR for the KSHV ge-nome derived from BCBL1 cell lines, we therefore attached 35copies of the TR sequence to the end of the LUR sequence used formapping. As expected, the major ChIP-Seq peaks for LANAmapped to the TR region (Fig. 1A). We also observed severalsmaller LANA binding peaks throughout the KSHV genome (Ta-ble 1), including a cluster in the latency control region spanningnucleotide (nt) position 120000 to 128000 that contained a major
LANA binding peak at the LANA promoter (LANAp) region(marked with red asterisk) as shown in Fig. 1B. To validate thesefindings, we tested the relative binding of LANA to the site atLANAp compared to TR by conventional ChIP assays. We foundthat LANA bound TR �148-fold more than LANAp (Fig. 1D),indicating that LANAp represents a much less occupied bindingsite relative to TR. However, LANAp was significantly enrichedrelative to control R2 region (7-fold enriched) and relative to con-trol IgG at LANAp (9-fold enriched) (Fig. 1E), indicating thatLANA does bind to LANAp with specificity. The relatively smallpeak score at LANAp may reflect weaker or indirect binding ofLANA to this region. Previous studies showed LANA associateswith KSHV ORF50 promoter through indirect interactions (28,32), but these binding sites were not observed in our ChIP-Seqdata. The failure to detect these additional interactions of LANAwith KSHV genome may reflect some of the limitations of ourChIP-Seq methods, as well as the nature of the indirect LANA-DNA interactions at these additional sites. The complete list ofLANA binding peaks in KSHV genome with a cutoff of peak scoreof 2 is included in Table 1. We conclude that LANA binds pre-dominantly to the KSHV TR and to a few additional minor sitesthroughout the KSHV genome (Table 1).
We further investigated the major peaks at the TR region andfound that the nucleotides with highest peak scores were posi-tioned at LBS1/2 (Fig. 1C), which were previously identified ashigh-affinity LANA binding sites at TR. We also found anotherpeak with a relatively lower score located at the border betweenunique region and TR. We selected three different reads (R1 to R3)from this peak region and examined LANA binding to these threesites relative to LBS1/2. First, we performed an independent ChIPassay using real-time PCR methods. LANA was highly enriched atthe LBS1/2, as expected (Fig. 1D and F), and was partially enrichedat R3 located at the beginning of the TR but was not detected atsites R1 and R2, which are situated in the unique region of theKSHV genome (Fig. 1F). To determine whether LANA binds di-rectly to the R3 region, we assayed the ability of purified LANADNA-binding domain (DBD) to bind the candidate sequences invitro using electrophoretic mobility shift assay (EMSA) (Fig. 1G).As expected, LANA-DBD bound efficiently to the LBS1/2 contain-ing two LANA binding sites LBS1 and LBS2. However, LANA-DBD failed to bind DNA probes containing either R3 or R2 bind-ing sites. This suggests that the R3 ChIP peak is not mediated bydirect interaction with the LANA DBD and may represent an in-direct interaction between LANA and cellular factors, includinghigher-order chromatin structure of LANA binding at TR. Alter-natively, R3 may represent a shoulder of the LBS1/2 peak, since itis located within �150 bp across each iterated TR junction.
ChIP-Seq analysis of LANA binding to the human genome.To identify highly confident LANA binding sites in the cellulargenome, we focused on those peaks with P values of �0.01 (usingthe Skellam distribution) and overlaps of �250 bp between peakcenters for two independent ChIP-Seq experiments. Using theseselection criteria, we identified 256 LANA binding peaks. Amongthe 256 total LANA binding peaks, 170 were mapped to within 2.5kb of a known gene transcript (see Table S5 in the supplementalmaterial). Inspection of 256 total LANA binding peaks showedthat the binding sites were at various positions relative to tran-scription start sites (Fig. 2A), with 45 peaks (�17.5% among 256total LANA binding sites) situated within 2 kb of the transcrip-tion start site (TSS).
Lu et al.
5754 jvi.asm.org Journal of Virology

Pathways analysis of genes near LANA binding sites. To in-vestigate the potential functional significance of LANA associa-tion with cellular genes, we performed an Ingenuity analysis witha list of genes selected from LANA ChIP-Seq analysis (see Table S5
in the supplemental material) with a peak score cutoff of 5. Twomajor biological networks were successfully generated, and in-cluded primary nodes linked by p53 (Fig. 2B) and tumor necrosisfactor (TNF) (Fig. 2C). The p53 network had a highly significancescore of 26, included PTEN and DNMT3A, and was annotated ascell death, cellular function and maintenance, and organ mor-phology (Fig. 2B). The focus genes with their LANA binding peakscores in the p53 network are listed in Table S6 in the supplemen-tal material. The TNF network had a significance score of 15, in-cluded LANA binding sites at the TAP1, PSMB9, and miR21genes, and was annotated as cellular function and maintenance,cellular movement, and cell cycle (Fig. 2C). The focus genes withtheir LANA binding peak scores in the TNF network are also listedin Table S7 in the supplemental material.
Validation of LANA ChIP binding sites. To validate theLANA binding sites determined by ChIP-Seq, we assayed 11 inde-pendent loci by traditional ChIP followed by quantitative PCR.Six of these loci were from the 256 peaks that overlap in the twoindependent ChIP assays (Fig. 3A). Five additional loci were se-lected from peaks identified in only one of the two ChIP-Seq ex-periments (Fig. 3B). We also compared LANA binding in three
FIG 1 LANA binding activity on KSHV genome. The UCSC genome browser was used to map LANA ChIP-Seq enrichment peaks to the BCBL1 KSHV genome(GenBank accession no. HQ404500) with 35 copies of terminal repeat (TR) sequence attached. (A) The peaks represent an average of the results of twoindependent ChIP-Seq replicates. Zoomed-in views of the latency cluster region and TR region are shown in panels B and C, respectively. ORF50 and LANAtranscripts are indicated as colored arrows in panels A and B. LANA and K14 genes are indicated in panel B. The LANA binding peak at the LANA promoter wasmarked with a red asterisk. The long unique region (LUR) and TR are indicated in panel C. The annealing locations of the primers for ChIP-PCR validation areindicated in panel C, including region 1 (R1), region 2 (R2), region 3 (R3), and LANA binding sites 1 and 2 (LBS1/2). LANA (black bars) or control IgG (gray bars)were assayed by ChIP and quantitative PCR in BCBL1 cells for DNA binding at the LANA promoter compared to LBS1/2 (D) or with R2 (E). (F) LANA (blackbars) or control IgG (gray bars) were assayed by ChIP in BCBL1 cells for DNA at R1, R2, R3, or LBS1/2. (G) EMSA analysis of 32P-labeled probes containing R2,R3, or LBS1/2.
TABLE 1 LANA binding peaks in the KSHV genome with a peak scorecutoff of 2a
GeneKSHV genomeposition
Avg peakscore
K7 28800 2.541vIRF2 92470 2.082ORF71 121555 2.43ORF72 122615 3.055LANA promoter 126680 4.631K15 3=UTR 133655 2.277K15 133755 2.18TR 136125 7.724TR (LBS1/2) 136955 13.167a LANA peaks generated from two independent ChIP-Seq analyses were annotated tothe KSHV genome (HQ404500). The average peak scores for each LANA binding peakare listed. UTR, untranslated region.
LANA Cellular Binding Sites
May 2012 Volume 86 Number 10 jvi.asm.org 5755

different KSHV positive PEL cell lines, BCBL1 (Fig. 3A and B),JSC-1 (Fig. 3C and D), and BC-3 (Fig. 3E and F). The GAPDH(glyceraldehyde-3-phosphate dehydrogenase) locus was used as anegative control. LANA binding sites derived from the list of 256overlapping sites observed in both ChIP-Seq experiments (includ-ing TAP1, FBXO4, IQGAP3, PARL, NIPAL2, and MEI) were alsoenriched by real-time PCR relative to IgG in BCBL1 (Fig. 3A). TheLANA ChIP-Seq binding sites observed in only one ChIP-Seq ex-periment (including NIPBL, IFI6, MRVI1, ACVR1C, andMETTLE2B) were also enriched by real-time PCR relative to IgGin BCBL1 cells (Fig. 3B). LANA also bound to most of these sites inJSC-1 (Fig. 3C and D) and BC-3 cells (Fig. 3E and F), with someexceptions. LANA failed to bind to NIPAL2 in JSC-1 cells and toIFI6 in BC-3 cells. LANA did not bind to the negative controlGAPDH in any cell types. These findings indicate that most, butnot all, of the high confidence (P � 0.01) ChIP-Seq peaks can bevalidated by conventional ChIP assay with site-specific primers.
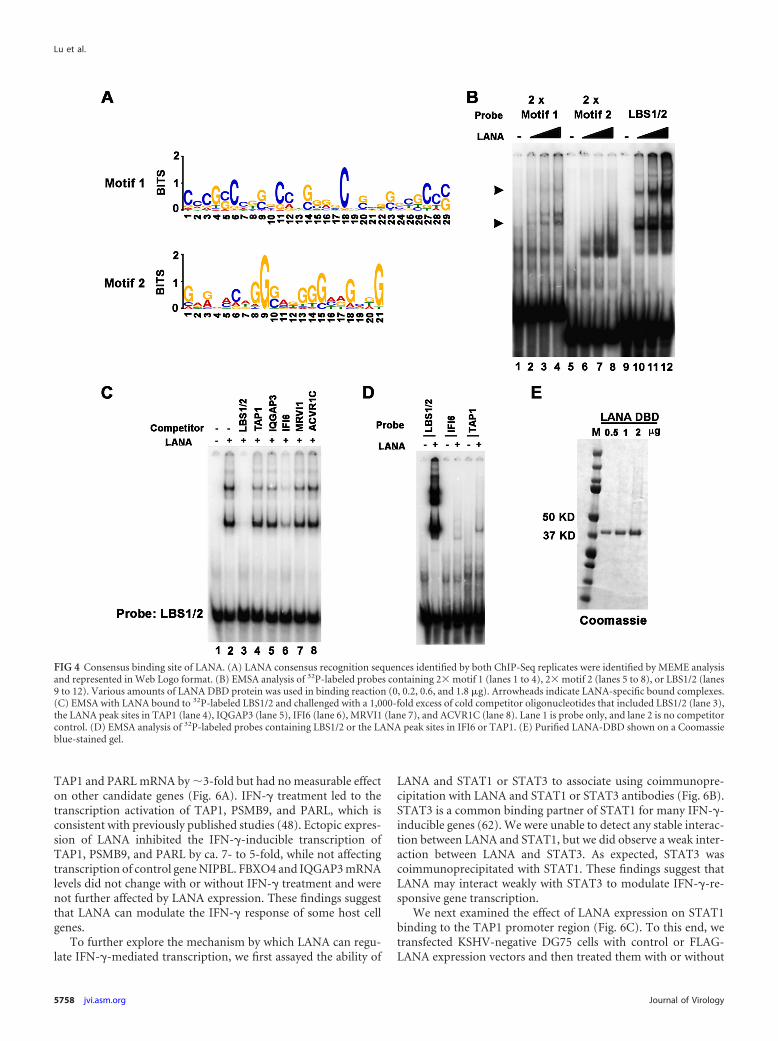
Identification of LANA-binding motifs in the host chromo-some. To identify consensus LANA-binding sites in the cellulargenome, the enriched LANA binding sites from both ChIP-Seqsamples were analyzed using the MEME web application (http://meme.nbcr.net/meme4_3_0/cgi-bin/meme.cgi). The top twocandidate motifs are shown in Web LOGO format (Fig. 4A). Atotal of 50 LANA binding sites contribute to the motif 1, and 36total binding sites contribute to the motif 2. Since the motif 1sequence appears to be similar to the core sequence of KSHVLBS1, we subjected both motif 1 and motif 2 to computationalcomparison with the sequences of LBS1 and LBS2 (18). Interest-ingly, motif 1 aligned to both LBS1 and LBS2, with E-values of1.1102e–16 and 6.3625e–12, respectively, while motif 2 is rela-tively less similar to either LBS1 or LBS2 with E-values of1.7621e– 05 and 9.3032e– 04 (see Table S8 in the supplementalmaterial). The consensus sequences of each motif were synthe-sized as 2� repeat oligonucleotides for use in EMSA to comparewith LANA binding site LBS1/2 (see Table S2 in the supplementalmaterial). As shown in Fig. 4B, 2� motif 1 probe (lanes 1 to 4)formed both fast and slow mobility complexes with LANA-DBD.The shift pattern was similar to the control LBS1/2 probe (lanes 9to 12), although the binding affinity was considerably lower thanfor LBS1/2. LANA-DBD also shifted 2� motif 2 probe but formedonly a single fast mobility complex. To determine whether LANAbound to any of the specific sites at cellular loci, we next tested theability of candidate LANA binding sites to compete for binding tothe LBS1/2 probe (Fig. 4C). As a positive control, we assayed theability of 1,000-fold excess of unlabeled LBS1/2 fragment to com-pete with 32P-labeled LBS1/2 (Fig. 4C, lanes 3) and, as expected,found that unlabeled LBS1/2 competitor abolished LANA-DBD
FIG 2 Summary of LANA ChIP-Seq. (A) LANA peaks generated from twoindependent ChIP-Seq analyses were annotated to genes if they were locatedwithin 2,500 bp up- or downstream of known gene open reading frames. Theannotated peaks from the two independent ChIP-Seq sets were then scannedfor overlapping peaks, where centers within 250 bp of each other are consid-ered overlapping. The overlapped peaks were analyzed for their distance from
transcription start sites annotated in the RefSeq database. Peaks were binnedinto windows of 1,000 bp, as indicated in the x axis. (B) Ingenuity Pathwaysanalysis was performed on the list of gene containing LANA peaks (P � 0.01)generated from overlaps of two independent ChIP-Seq assays. The network inpanel B centered around p53 with a score of 26 and annotated as cell death,cellular function and maintenance, and organ morphology. (C) The networkshown here centered around TNF with a score of 15 and annotated as cellularfunction and maintenance, cellular movement, and cell cycle. Genes withLANA binding sites are highlighted with pink. Solid lines represent directinteractions, while dashed lines represent indirect interactions. Lines with asolid arrowhead represent “acts on”; plain lines represent a “binding-only”relationship.
Lu et al.
5756 jvi.asm.org Journal of Virology

to labeled LBS1/2. Among five cellular binding sites, only IFI6(lane 6) showed partial competition, and substantially weakercompetition was observed for TAP1 (lane 4) and IQGAP3 (lane5). Since LANA affinity for LBS1/2 may be orders of magnitudehigher than that of other candidate sites, we performed EMSAwith direct labeling of several of the candidate binding sites (Fig.4D, and data not shown). Compared to the LBS1/2 probe, only theTAP1 and IFI6 binding site formed a relatively weak complex withLANA (Fig. 4D). These data suggest LANA DBD may bind weaklyto some cellular binding sites, such as those found at the TAP1promoter region. These findings also indicate that LANA bindsLBS1/2 with considerably higher affinity than for most other viraland cellular binding sites tested and that additional cellular factorsor modifications may be required for high-affinity binding invitro.
Overlapping LANA binding peaks with STAT1. We notedthat the LANA binding site upstream of the TAP1 and PSMB9(LMP2) genes are located in a bidirectional promoter regulatoryelement known to be IFN-�-inducible (16, 34, 45). Since IFN-�signals mainly through the JAK-STAT pathway to achieve tran-scriptional activation of IFN-�-inducible genes (23, 55, 62), wecompared our LANA ChIP-Seq analysis data with IFN-�-induc-
ible STAT1 DNA binding ChIP-Seq data from a previouslypublished study (http://www.nature.com/nmeth/journal/v4/n8/suppinfo/nmeth1068_S1.html) (46). We observed that severalLANA binding sites either colocalized with or are located adjacentto STAT1 binding sites at promoter regions of several IFN-� in-ducible genes, including TAP1/PSMB9, FBXO4, IQGAP3, andPARL (Fig. 5). These observations suggest that LANA may alterSTAT1 function at these IFN-�-inducible genes.
Regulation of IFN-� response gene expression by LANA. Todetermine whether LANA could affect transcription regulation ofgenes with overlapping LANA and STAT1 binding sites, we as-sayed the ability of LANA to alter transcription in response toIFN-� treatment (Fig. 6A). We observed that TAP1/PSMB9,FBXO4, IQGAP3, and PARL were IFN-� inducible in KSHV-pos-itive PEL cells. Unfortunately, we were unable to deplete LANAsufficiently using siRNA or shRNA methods to observe anyLANA-dependent changes in this induction (data not shown).Alternatively, we transiently transfected KSHV negative B-celllymphoma cell lines with expression vectors for FLAG-LANA orcontrol vector and then assayed the changes in IFN-�-induciblegene expression for LANA bound genes. In the absence of IFN-�treatment, we found that FLAG-LANA inhibited the expression of
FIG 3 Real-time PCR validation of ChIP-Seq data for LANA cellular binding sites. ChIP assays with antibody to LANA (black bars) or control IgG (gray bars)were conducted with either BCBL1 cells (A and B), JSC-1 cells (C and D), or BC-3 cells (E and F). LANA peaks annotated to TAP1, FBXO4, IQGAP3, PARL,NIPAL2, and MEI1 (peaks found in two independent ChIP-Seq) were validated in panels A, C and E. NIPBL, ACVR1C, METTL2B, MRVI1, or IFI6 (peaks froma single ChIP-Seq only) or GAPDH (control) were validated in panels B, D, and F.
LANA Cellular Binding Sites
May 2012 Volume 86 Number 10 jvi.asm.org 5757
TAP1 and PARL mRNA by �3-fold but had no measurable effecton other candidate genes (Fig. 6A). IFN-� treatment led to thetranscription activation of TAP1, PSMB9, and PARL, which isconsistent with previously published studies (48). Ectopic expres-sion of LANA inhibited the IFN-�-inducible transcription ofTAP1, PSMB9, and PARL by ca. 7- to 5-fold, while not affectingtranscription of control gene NIPBL. FBXO4 and IQGAP3 mRNAlevels did not change with or without IFN-� treatment and werenot further affected by LANA expression. These findings suggestthat LANA can modulate the IFN-� response of some host cellgenes.
To further explore the mechanism by which LANA can regu-late IFN-�-mediated transcription, we first assayed the ability of
LANA and STAT1 or STAT3 to associate using coimmunopre-cipitation with LANA and STAT1 or STAT3 antibodies (Fig. 6B).STAT3 is a common binding partner of STAT1 for many IFN-�-inducible genes (62). We were unable to detect any stable interac-tion between LANA and STAT1, but we did observe a weak inter-action between LANA and STAT3. As expected, STAT3 wascoimmunoprecipitated with STAT1. These findings suggest thatLANA may interact weakly with STAT3 to modulate IFN-�-re-sponsive gene transcription.
We next examined the effect of LANA expression on STAT1binding to the TAP1 promoter region (Fig. 6C). To this end, wetransfected KSHV-negative DG75 cells with control or FLAG-LANA expression vectors and then treated them with or without
FIG 4 Consensus binding site of LANA. (A) LANA consensus recognition sequences identified by both ChIP-Seq replicates were identified by MEME analysisand represented in Web Logo format. (B) EMSA analysis of 32P-labeled probes containing 2� motif 1 (lanes 1 to 4), 2� motif 2 (lanes 5 to 8), or LBS1/2 (lanes9 to 12). Various amounts of LANA DBD protein was used in binding reaction (0, 0.2, 0.6, and 1.8 �g). Arrowheads indicate LANA-specific bound complexes.(C) EMSA with LANA bound to 32P-labeled LBS1/2 and challenged with a 1,000-fold excess of cold competitor oligonucleotides that included LBS1/2 (lane 3),the LANA peak sites in TAP1 (lane 4), IQGAP3 (lane 5), IFI6 (lane 6), MRVI1 (lane 7), and ACVR1C (lane 8). Lane 1 is probe only, and lane 2 is no competitorcontrol. (D) EMSA analysis of 32P-labeled probes containing LBS1/2 or the LANA peak sites in IFI6 or TAP1. (E) Purified LANA-DBD shown on a Coomassieblue-stained gel.
Lu et al.
5758 jvi.asm.org Journal of Virology

IFN-�. STAT1 binding was examined by ChIP assay. We foundthat STAT1 binding was modestly enriched on the TAP1/PSMB9promoter when DG75 cells were treated with interferon-�, butthis enrichment was abrogated in cells transfected with FLAG-LANA (Fig. 6C). Similar experiments with STAT3 were also at-tempted, but STAT3 binding could not be detected by ChIP assay(data not shown). These findings suggest that LANA can interferewith the IFN-�-induced enrichment of STAT1 on the TAP1/PSMB9 promoter.
DISCUSSION
In this study, we used two independent ChIP-Seq experiments toidentify �256 high-confidence binding sites for LANA in the cel-lular chromosome of a human PEL cell line. Several (�11) of thehigh-occupancy binding sites identified by ChIP-Seq were vali-dated for binding by conventional ChIP and real-time PCR (Fig.3) in three different KSHV PEL cell lines. Among these 256 bind-ing sites, we noted that �17.5% (45 sites) are located within 2 kbof an annotated or predicted transcription start sites (Fig. 2). TwoGC-rich DNA motifs were identified in the high-confidenceLANA binding site data set, and position-weighted matrix (PWM)analysis, Web LOGO presentation, and STAMP DNA motif com-parison toolkit revealed that motif 1 sequence is similar to LBS1,while motif 2 shows less apparent similarity to LBS1 or LBS2 (Fig.4A and see Table S8 in the supplemental material). We also ob-served relatively weak or undetectable direct binding of purifiedLANA protein to most validated cellular sites, suggesting that the
viral binding sites in TR are the primary direct binding sites forLANA throughout the virus and host genomes. The relatively fewhigh-confidence LANA binding sites (�256) identified in ourstudy suggest that LANA may interact in a dynamic or indirectmanner with many different chromatin domains and require ad-ditional cellular factors to mediate high-affinity chromosomebinding.
LANA binding sites poorly overlap with previously charac-terized LANA regulated gene targets. A previous gene expressionprofiling study identified a list of cellular gene transcripts thatwere affected by LANA (2). In our study, we identified 170candidate LANA cellular binding sites that could be mapped to218 known genes (see Table S5 in the supplemental material).We found that only three of these genes (PITPNB, PTPRC, andPPP2R5E) were common to the previous gene expression pro-filing study. Our RT-PCR analysis also showed that the tran-scription of several candidate genes with the LANA binding siteon their promoter was not changed by ectopic expression ofLANA (data not shown). This suggests that many of the LANA-bound genes are not subject to LANA-dependent gene activa-tion or repression. Since our data did not analyze LANA in thesame cells as those analyzed in the expression profiling, it ispossible that LANA regulates genes in a cell-type-specific orcontext-specific manner. Alternatively, it is possible that manyLANA binding sites in the cellular genome regulate transcrip-tion of genes located outside of the �1-kb window that weexamined. It is also possible that LANA affects chromosome
FIG 5 Example of LANA and STAT1 binding peaks near transcriptional start sites of cellular genes. The UCSC genome browser was used to map LANA peaks(black) and STAT1 IFN-�-stimulated (blue, top) and unstimulated (blue, bottom) peaks to cellular genes for TAP1 (A), IQGAP3 (B), FBXO4 (C), and PARL (D).RefSeq annotated transcripts are indicated below each ChIP-Seq peak.
LANA Cellular Binding Sites
May 2012 Volume 86 Number 10 jvi.asm.org 5759

structure that modulate transcription of genes far from theLANA binding sites.
The P53 and TNF pathway as a target for LANA function.Network analysis revealed a potential role for LANA in the p53and TNF pathways (Fig. 2). LANA has been shown to physicallyand functionally interact with p53 (9, 14), and our pathways anal-ysis indicated that LANA can bind near the TSS of several genesthat functionally interact with p53. Thus, LANA may functioncoordinately with p53 to regulate a common network of cellulargenes important for cell cycle control in response to DNA damageor other cellular stress responses. We also found that LANA mayhave a role in the TNF network (Fig. 2) and bind to the promoterproximal regions of several STAT1-dependent IFN-�-regulatedgenes (Fig. 5). One of the most enriched LANA binding sites wasin the divergent promoter region of TAP1 and PSMB9. TAP1plays a major role in assembling peptides into the major histo-compatibility complex class I (MHC-I) (43), and PSMB9 (previ-
ously designated low-molecular-weight polypeptide 2 [LMP2]) isa component of 20S proteasome, which is responsible for gener-ating the pool of peptides that are presented on the cell surface byMHC-I molecules (47). TAP1 was identified as an IFN-�-induc-ible gene with STAT1 binding sites on its promoter (34). PSMB9,which shares a bidirectional promoter with TAP1, was also iden-tified as IFN-�-inducible gene (16, 45). Our alignment of LANAand STAT1 peaks on TAP1/PSMB9 promoter region revealed asignificant overlap, which suggests that LANA and STAT1 arelikely to either co-occupy or compete for binding on TAP1/PSMB9 promoter. The RT-PCR analysis revealed the IFN-�-in-duced TAP1 and PSMB9 gene expression was downregulated byectopic expression of LANA in KSHV-negative BL cells. This sug-gests that LANA may compete with STAT1 for binding to theTAP1/PSMB9 promoter region, and this was partially supportedby ChIP assays in IFN-�-treated DG75 cells transfected with orwithout LANA (Fig. 6). Thus, LANA can attenuate IFN-�-induc-ible activation of a target gene and modulate the host cell antiviralimmune response.
Modulation of the innate immune response by viral proteinsappears to be an essential and common strategy for virus infectionand persistence (62). Several other gammaherpesvirus proteinshave been implicated in the regulation of the STAT pathway, in-cluding KSHV vIL6, which can transform cells through a STAT-dependent pathway (37, 38), and the ORF50 immediate-earlyprotein RTA, which can relocalize STAT3 to its nuclear targets(20). STAT1-responsive gene expression can also be stimulated byKSHV vFLIP protein during endothelial cell infection (1). TheEBV-encoded EBNA1 protein, which is the functional orthologueof KSHV LANA, has also been implicated in regulating STAT1gene expression, although the mechanism of this regulation is notclear (59). Our studies suggest that LANA interferes with the IFN-�/STAT1-dependent antigen presentation pathway, since LANAinhibited the IFN-�-inducible expression of TAP1 and PSMB9(Fig. 6). Several other KSHV proteins also promote the downregu-lation of host cell antigen presentation. The virus-encoded pro-teins MIR1 and MIR2 can restrict MHC protein cycling at the cellmembrane (11), and vIRF1 can inhibit MHC-I gene transcription(27). Further attenuation of antigen presentation and IFN-� sig-naling by LANA could greatly facilitate KSHV latently infectedcells from host T-cell recognition and elimination. It is interestingthat LANA bound to genes within the p53 and TNF networks,both of which would help to promote long-term survival of la-tently infected cells. The identification and further characteriza-tion of these LANA targets could reveal a remarkable global strat-egy for LANA-dependent regulation of host cell processes criticalfor viral genome maintenance and host-cell survival during latentinfection.
ACKNOWLEDGMENTS
We thank Sridhar Hannenhalli, University of Maryland, for bioinformaticadvice. We also thank Rolf Renne for sharing related ChIP Seq data priorto publication.
We acknowledge support from a Wistar Institute Cancer Center grant(P30 CA10815) and from the Core Facilities for Genomics, Bioinformat-ics, and Flow Cytometry. This study was funded by a grant from theNational Institutes of Health (RO1 CA117830).
REFERENCES1. Alkharsah KR, et al. 2011. Deletion of Kaposi’s sarcoma-associated her-
pesvirus FLICE inhibitory protein, vFLIP, from the viral genome compro-
FIG 6 Ectopic expression of LANA inhibits IFN-�-induced TAP1 gene ex-pression. (A) KSHV-negative DG75 was transfected with control vector orwith FLAG-LANA expression vector and pmaxGFP. At 24 h after transfection,the cells were induced with 5 ng of human recombinant IFN-�/ml for another24 h. The GFP-positive cells were then sorted out and assayed by RT-PCR forIFN-�-induced transcription of TAP1, PSMB9, PARL, FBXO4, IQGAP3, andNIPBL, as indicated. (B) BCBL1 cells were stimulated or unstimulated withIFN-� for 30 min and then subjected to immunoprecipitation with antibodiesto IgG, LANA, or STAT1. Immunoprecipitates were analyzed by Western blot-ting for LANA and then reprobed for STAT1 or STAT3 as indicated. (C) DG75cells were transfected with control vector or with FLAG-LANA expressionvector and pmaxGFP. At 24 h after transfection, GFP-positive cells weresorted, then treated or not treated with 5 ng of IFN-� for 30 min/ml, andassayed by ChIP with antibodies to IgG and STAT1 at the TAP1/PSMB9 site.
Lu et al.
5760 jvi.asm.org Journal of Virology

mises the activation of STAT1-responsive cellular genes and spindle cellformation in endothelial cells. J. Virol. 85:10375–10388.
2. An FQ, et al. 2005. The latency-associated nuclear antigen of Kaposi’ssarcoma-associated herpesvirus modulates cellular gene expression andprotects lymphoid cells from p16 INK4A-induced cell cycle arrest. J. Biol.Chem. 280:3862–3874.
3. Bailey TL, Williams N, Misleh C, Li WW. 2006. MEME: discovering andanalyzing DNA and protein sequence motifs. Nucleic Acids Res. 34:W369 –W373.
4. Ballestas ME, Chatis PA, Kaye KM. 1999. Efficient persistence of extra-chromosomal KSHV DNA mediated by latency-associated nuclear anti-gen. Science 284:641– 644.
5. Ballestas ME, Kaye KM. 2001. Kaposi’s sarcoma-associated herpesviruslatency-associated nuclear antigen 1 mediates episome persistencethrough cis-acting terminal repeat (TR) sequence and specifically bindsTR DNA. J. Virol. 75:3250 –3258.
6. Barbera AJ, et al. 2006. The nucleosomal surface as a docking station forKaposi’s sarcoma herpesvirus LANA. Science 311:856 – 861.
7. Cai Q, Verma SC, Choi JY, Ma M, Robertson ES. 2010. Kaposi’ssarcoma-associated herpesvirus inhibits interleukin-4-mediated STAT6phosphorylation to regulate apoptosis and maintain latency. J. Virol. 84:11134 –11144.
8. Chau CM, Lieberman PM. 2004. Dynamic chromatin boundaries delin-eate a latency control region of Epstein-Barr virus. J. Virol. 78:12308 –12319.
9. Chen W, Hilton IB, Staudt MR, Burd CE, Dittmer DP. 2010. Distinctp53, p53:LANA, and LANA complexes in Kaposi’s sarcoma-associatedherpesvirus lymphomas. J. Virol. 84:3898 –3908.
10. Cloutier N, Flamand L. 2010. Kaposi sarcoma-associated herpesviruslatency-associated nuclear antigen inhibits interferon (IFN) beta expres-sion by competing with IFN regulatory factor-3 for binding to IFNB pro-moter. J. Biol. Chem. 285:7208 –7221.
11. Coscoy L, Ganem D. 2000. Kaposi’s sarcoma-associated herpesvirus en-codes two proteins that block cell surface display of MHC class I chains byenhancing their endocytosis. Proc. Natl. Acad. Sci. U. S. A. 97:8051– 8056.
12. Cotter MA, II, Robertson ES. 1999. The latency-associated nuclear anti-gen tethers the Kaposi’s sarcoma-associated herpesvirus genome to hostchromosomes in body cavity-based lymphoma cells. Virology 264:254 –264.
13. Crooks GE, Hon G, Chandonia JM, Brenner SE. 2004. WebLogo: asequence logo generator. Genome Res. 14:1188 –1190.
14. Fakhari FD, Jeong JH, Kanan Y, Dittmer DP. 2006. The latency-associated nuclear antigen of Kaposi sarcoma-associated herpesvirus in-duces B cell hyperplasia and lymphoma. J. Clin. Invest. 116:735–742.
15. Friborg J, Jr, Kong W, Hottiger MO, Nabel GJ. 1999. p53 inhibition bythe LANA protein of KSHV protects against cell death. Nature 402:889 –894.
16. Gaczynska M, Goldberg AL, Tanaka K, Hendil KB, Rock KL. 1996.Proteasome subunits X and Y alter peptidase activities in opposite ways tothe interferon-gamma-induced subunits LMP2 and LMP7. J. Biol. Chem.271:17275–17280.
17. Ganem D. 2006. KSHV infection and the pathogenesis of Kaposi’s sar-coma. Annu. Rev. Pathol. 1:273–296.
18. Garber AC, Hu J, Renne R. 2002. Latency-associated nuclear antigen(LANA) cooperatively binds to two sites within the terminal repeat, andboth sites contribute to the ability of LANA to suppress transcription andto facilitate DNA replication. J. Biol. Chem. 277:27401–27411.
19. Garber AC, Shu MA, Hu J, Renne R. 2001. DNA binding and modula-tion of gene expression by the latency-associated nuclear antigen of Kapo-si’s sarcoma-associated herpesvirus. J. Virol. 75:7882–7892.
20. Gwack Y, et al. 2002. Kaposi’s Sarcoma-associated herpesvirus openreading frame 50 stimulates the transcriptional activity of STAT3. J. Biol.Chem. 277:6438 – 6442.
21. Han SJ, Hu J, Pierce B, Weng Z, Renne R. 2010. Mutational analysis ofthe latency-associated nuclear antigen DNA-binding domain of Kaposi’ssarcoma-associated herpesvirus reveals structural conservation amonggammaherpesvirus origin-binding proteins. J. Gen. Virol. 91:2203–2215.
22. Hu J, Renne R. 2005. Characterization of the minimal replicator of Ka-posi’s sarcoma-associated herpesvirus latent origin. J. Virol. 79:2637–2642.
23. Hu X, Ivashkiv LB. 2009. Cross-regulation of signaling pathways byinterferon-gamma: implications for immune responses and autoimmunediseases. Immunity 31:539 –550.
24. Kedes DH, Lagunoff M, Renne R, Ganem D. 1997. Identification of thegene encoding the major latency-associated nuclear antigen of the Kapo-si’s sarcoma-associated herpesvirus. J. Clin. Invest. 100:2606 –2610.
25. Komatsu T, Ballestas ME, Barbera AJ, Kaye KM. 2002. The KSHVlatency-associated nuclear antigen: a multifunctional protein. Front. Bio-sci. 7:d726 – d730.
26. Krithivas A, Young DB, Liao G, Greene D, Hayward SD. 2000. Humanherpesvirus 8 LANA interacts with proteins of the mSin3 corepressorcomplex and negatively regulates Epstein-Barr virus gene expression indually infected PEL cells. J. Virol. 74:9637–9645.
27. Lagos D, et al. 2007. Kaposi sarcoma herpesvirus-encoded vFLIP andvIRF1 regulate antigen presentation in lymphatic endothelial cells. Blood109:1550 –1558.
28. Lan K, Kuppers DA, Robertson ES. 2005. Kaposi’s sarcoma-associatedherpesvirus reactivation is regulated by interaction of latency-associatednuclear antigen with recombination signal sequence-binding protein J�,the major downstream effector of the Notch signaling pathway. J. Virol.79:3468 –3478.
29. Langmead B, Trapnell C, Pop M, Salzberg SL. 2009. Ultrafast andmemory-efficient alignment of short DNA sequences to the human ge-nome. Genome Biol. 10:R25.
30. Lim C, Lee D, Seo T, Choi C, Choe J. 2003. Latency-associated nuclearantigen of Kaposi’s sarcoma-associated herpesvirus functionally interactswith heterochromatin protein 1. J. Biol. Chem. 278:7397–7405.
31. Lim C, Sohn H, Lee D, Gwack Y, Choe J. 2002. Functional dissection oflatency-associated nuclear antigen 1 of Kaposi’s sarcoma-associated her-pesvirus involved in latent DNA replication and transcription of terminalrepeats of the viral genome. J. Virol. 76:10320 –10331.
32. Lu F, Day L, Gao SJ, Lieberman PM. 2006. Acetylation of the latency-associated nuclear antigen regulates repression of Kaposi’s sarcoma-associated herpesvirus lytic transcription. J. Virol. 80:5273–5282.
33. Lu F, et al. 2010. Genome-wide analysis of host-chromosome bindingsites for Epstein-Barr virus nuclear antigen 1 (EBNA1). Virol. J 7:262.
34. Ma W, Lehner PJ, Cresswell P, Pober JS, Johnson DR. 1997. Interferon-gamma rapidly increases peptide transporter (TAP) subunit expressionand peptide transport capacity in endothelial cells. J. Biol. Chem. 272:16585–16590.
35. Mahony S, Benos PV. 2007. STAMP: a web tool for exploring DNA-binding motif similarities. Nucleic Acids Res. 35:W253–W258.
36. Mesri EA, Cesarman E, Boshoff C. 2010. Kaposi’s sarcoma and its asso-ciated herpesvirus. Nat. Rev. Cancer 10:707–719.
37. Moore PS, Boshoff C, Weiss RA, Chang Y. 1996. Molecular mimicry ofhuman cytokine and cytokine response pathway genes by KSHV. Science274:1739 –1744.
38. Nicholas J, et al. 1997. Kaposi’s sarcoma-associated human herpesvirus-8encodes homologues of macrophage inflammatory protein-1 and inter-leukin-6. Nat. Med. 3:287–292.
39. Ohsaki E, et al. 2004. Poly(ADP-ribose) polymerase 1 binds to Kaposi’ssarcoma-associated herpesvirus (KSHV) terminal repeat sequence andmodulates KSHV replication in latency. J. Virol. 78:9936 –9946.
40. Ottinger M, et al. 2006. Kaposi’s sarcoma-associated herpesvirusLANA-1 interacts with the short variant of BRD4 and releases cells from aBRD4- and BRD2/RING3-induced G1 cell cycle arrest. J. Virol. 80:10772–10786.
41. Pal S, et al. 2011. Alternative transcription exceeds alternative splicing ingenerating the transcriptome diversity of cerebellar development. Ge-nome Res. 21:1260 –1272.
42. Piolot T, Tramier M, Coppey M, Nicolas JC, Marechal V. 2001. Closebut distinct regions of human herpesvirus 8 latency-associated nuclearantigen 1 are responsible for nuclear targeting and binding to humanmitotic chromosomes. J. Virol. 75:3948 –3959.
43. Raghavan M, Del Cid N, Rizvi SM, Peters LR. 2008. MHC class Iassembly: out and about. Trends Immunol. 29:436 – 443.
44. Rainbow L, et al. 1997. The 222- to 234-kilodalton latent nuclear protein(LNA) of Kaposi’s sarcoma-associated herpesvirus (human herpesvirus 8)is encoded by orf73 and is a component of the latency-associated nuclearantigen. J. Virol. 71:5915–5921.
45. Robek MD, Garcia ML, Boyd BS, Chisari FV. 2007. Role of immuno-proteasome catalytic subunits in the immune response to hepatitis B virus.J. Virol. 81:483– 491.
46. Robertson G, et al. 2007. Genome-wide profiles of STAT1 DNA associ-ation using chromatin immunoprecipitation and massively parallel se-quencing. Nat. Methods 4:651– 657.
LANA Cellular Binding Sites
May 2012 Volume 86 Number 10 jvi.asm.org 5761

47. Rock KL, et al. 1994. Inhibitors of the proteasome block the degradationof most cell proteins and the generation of peptides presented on MHCclass I molecules. Cell 78:761–771.
48. Rouyez MC, et al. 2005. IFN regulatory factor-2 cooperates with STAT1to regulate transporter associated with antigen processing-1 promoter ac-tivity. J. Immunol. 174:3948 –3958.
49. Schulz TF. 2006. The pleiotropic effects of Kaposi’s sarcoma herpesvirus.J. Pathol. 208:187–198.
50. Shamay M, Krithivas A, Zhang J, Hayward SD. 2006. Recruitment of thede novo DNA methyltransferase Dnmt3a by Kaposi’s sarcoma-associatedherpesvirus LANA. Proc. Natl. Acad. Sci. U. S. A. 103:14554 –14559.
51. Si H, Robertson ES. 2006. Kaposi’s sarcoma-associated herpesvirus-encoded latency-associated nuclear antigen induces chromosomal insta-bility through inhibition of p53 function. J. Virol. 80:697–709.
52. Skellam JG. 1946. The frequency distribution of the difference betweentwo Poisson variates belonging to different populations. J. Royal Stat. Soc.Ser. A 109:296.
53. Stedman W, Deng Z, Lu F, Lieberman PM. 2004. ORC, MCM, andhistone hyperacetylation at the Kaposi’s sarcoma-associated herpesviruslatent replication origin. J. Virol. 78:12566 –12575.
54. Sun H, et al. 2011. Genome-wide mapping of RNA Pol-II promoter usagein mouse tissues by ChIP-Seq. Nucleic Acids Res. 39:190 –201.
55. van Boxel-Dezaire AH, Stark GR. 2007. Cell type-specific signaling inresponse to interferon-gamma. Curr. Top. Microbiol. Immunol. 316:119 –154.
56. Verma SC, Lan K, Robertson E. 2007. Structure and function of latency-associated nuclear antigen. Curr. Top. Microbiol. Immunol. 312:101–136.
57. Viejo-Borbolla A, et al. 2003. A Domain in the C-terminal region oflatency-associated nuclear antigen 1 of Kaposi’s sarcoma-associated Her-pesvirus affects transcriptional activation and binding to nuclear hetero-chromatin. J. Virol. 77:7093–7100.
58. Viejo-Borbolla A, et al. 2005. Brd2/RING3 interacts with a chromatin-binding domain in the Kaposi’s sarcoma-associated herpesvirus latency-associated nuclear antigen 1 (LANA-1) that is required for multiple func-tions of LANA-1. J. Virol. 79:13618 –13629.
59. Wood VH, et al. 2007. Epstein-Barr virus-encoded EBNA1 regulatescellular gene transcription and modulates the STAT1 and TGF� signalingpathways. Oncogene 26:4135– 4147.
60. Ye FC, et al. 2004. Disruption of Kaposi’s sarcoma-associated herpesviruslatent nuclear antigen leads to abortive episome persistence. J. Virol. 78:11121–11129.
61. You J, et al. 2006. Kaposi’s sarcoma-associated herpesvirus latency-associated nuclear antigen interacts with bromodomain protein Brd4 onhost mitotic chromosomes. J. Virol. 80:8909 – 8919.
62. Yu H, Pardoll D, Jove R. 2009. STATs in cancer inflammation andimmunity: a leading role for STAT3. Nat. Rev. Cancer 9:798 – 809.
63. Zhang ZD, Rozowsky J, Snyder M, Chang J, Gerstein M. 2008. Mod-eling ChIP sequencing in silico with applications. PLoS Comput. Biol.4:e1000158.
Lu et al.
5762 jvi.asm.org Journal of Virology