Using comparative genomics to identify virulence ... - CiteSeerX
Upload
independentCategory
view
2download
0
www.elsevier.com/locate/yviro
Virology 328 (20
Association between rate of viral genome replication and virulence of
Marek’s disease herpesvirus strains
Reem Yunis1, Keith W. Jarosinskia, Karel A. Schata,*
aDepartment of Microbiology and Immunology, College of Veterinary Medicine, Cornell University, Ithaca, NY 14853, United States
Received 7 April 2004; returned to author for revision 27 May 2004; accepted 6 July 2004
Abstract
The early pathogenesis of Marek’s disease virus (MDV) infection is characterized by a lytic infection followed by the induction of latency.
Genetically resistant N2a and susceptible P2a chickens were infected with the less virulent JM-16 or the very virulent plus (vv+) RK-1 MDV
strains to examine the relationship between virulence and resistance on virus replication during 1–10 days postinfection (dpi) using real-time
quantitative polymerase chain reaction (qPCR) and quantitative reverse transcriptase (qRT)-PCR assays. The numbers of copies of the viral
DNA or transcripts amplified by these assays were normalized relative to cellular controls and subjected to three-way ANOVA. Viral DNA
but not RNA was present in spleens at 1–3 dpi in decreasing quantities, and at 4 dpi, viral DNA started to increase concomitant with the
initiation of viral transcription independently of virus strain and genetic resistance. At 6 dpi, JM-16 became latent in resistant N2a and
susceptible P2a chickens with low levels of viral transcripts, but transcriptional activity increased in susceptible P2a chickens at 9 and 10 dpi.
In contrast, infection with vv+ RK-1 never went into latency in both chicken lines. Viral transcripts were present from 4 to 10 dpi showing a
higher and more persistent viral activity that may lead to severe damage to the lymphoid organs resulting in increased immunosuppression
and increased incidence of MD. The use of qPCR and qRT-PCR to determine viral DNA load and transcriptional activity may offer an
alternative to the current system of pathotyping to characterize new MDV isolates.
D 2004 Elsevier Inc. All rights reserved.
Keywords: Chicken; Genetic resistance; Immune response; Latency; Lytic infection; Marek’s disease virus; Pathogenesis; Pathotyping; Quantitative PCR;
Quantitative RT-PCR; Virulence
Introduction
Marek’s disease (MD) is a lymphoproliferative disease in
chickens caused by MD virus (MDV), a strictly cell-
associated alphaherpesvirus. Three serotypes of MDV have
been described, but only serotype 1 is oncogenic causing
tumors in susceptible chickens, while the other two serotypes
are non-oncogenic (Witter and Schat, 2003).MDV serotype 1
strains are grouped into three pathotypes according to the
induction of tumors in vaccinated chickens with a known
level of genetic resistance to MD (Witter, 1997). Strains with
0042-6822/$ - see front matter D 2004 Elsevier Inc. All rights reserved.
doi:10.1016/j.virol.2004.07.017
* Corresponding author. Fax: +1 607 253 3384.
E-mail address: [email protected] (K.A. Schat).1 Current address: University of California, Department of Animal
Science, 2111 Meyer Hall, Davis, CA 95616.
the lowest virulence were characterized as virulent (v)MDV,
which includes the JM strain. The next pathotype was
characterized as very virulent (vv)MDV (e.g., RB-1B,
Md5) and these strains were isolated for the first time in the
late 1970s (Schat et al., 1982). More recently, strains were
isolated that were even more pathogenic than the vvMDV
isolates and were named very virulent plus (vv+)MDV (e.g.,
RK-1, 648A) (Calnek et al., 1998, Witter, 1997).
The pathogenesis of infection with oncogenic MDV can
be divided into four phases (Calnek, 1986; Schat, 1987).
The first phase consists of the early cytolytic infection,
which occurs between 3 and 6 days postinfection (dpi)
followed by the onset of latency starting between 6 and 8
dpi. The third and fourth phases consist of a secondary
cytolytic infection and the development of tumors, respec-
tively. These latter phases occur in genetically susceptible
04) 142–150
R. Yunis et al. / Virology 328 (2004) 142–150 143
chickens infected with v strains, or after infection with vv or
vv+ strains in genetically susceptible or resistant chickens.
MDV remains strictly cell-associated during these phases of
the pathogenesis, infectious cell-free virus is only produced
in the feather follicle epithelium starting at approximately
14 days postinfection. Different cell types are important
during these distinct phases of the pathogenesis. B
lymphocytes in spleen, thymus, and the bursa of Fabricius
are the major target cells for the lytic phase, while latent
infections are mostly present in CD4+ T lymphocytes (Shek
et al., 1983). Tumor cells consist mostly of CD4+ T
lymphocytes, although CD8+ T lymphocytes can also be
transformed (Schat et al., 1991). The division into four
phases may be less clear after infection with vv+ strains and
latency may not develop (Jarosinski et al., 2002).
The genetic composition of the host has a significant
influence on the outcome and severity of infection with
MDV. The major histocompatibility complex (MHC) is
strongly associated with genetic resistance or susceptibility
to MDV. The MHC influence has been mapped to the B-F/
B-L region of the MHC locus, with B21B21 (e.g., the N2a
line) and B19B19 (e.g., the P2a line) haplotypes strongly
associated with MD resistance and susceptibility, respec-
tively (reviewed in Bacon et al., 2001; Schat and Davies,
2000). The mechanism(s) involved in MHC-based genetic
resistance is not fully understood, but differences in antigen
recognition by cytotoxic T lymphocytes (CTL) have been
reported (Markowski-Grimsrud and Schat, 2002; Omar and
Schat, 1996). Differences in viral replication rates between
N2a, P2a, and MHC-congenic lines of chickens could not be
detected during the early cytolytic infection using virus
isolation in cell cultures and immunofluorescence assays
(Abplanalp et al., 1985; Calnek et al., 1979; Schat et al.,
1982). The cytolytic phase can normally be detected as early
as 4 dpi.
Non-MHC-linked genetic resistance has also been
reported. For example, lines 6 and 7 chickens are highly
resistant and susceptible to the development of MD,
respectively, but they share the same MHC locus (Bacon
et al., 2001). Baigent and Davison (1999) suggested that
MDV replication and spread is more efficient in line 7 than
in line 6 chickens. However, Kaiser et al. (2003) did not
detect differences in virus loads using real-time quantitative
polymerase chain reaction (qPCR) assays during the first 10
days after infection with the vMDV strain HPRS-16 in line
P, N, 6, and 7 chickens.
In this study, we examined whether virulence is
associated with differences in viral genome replication and
viral gene expression in splenocytes after infection of P2a
and N2a chickens with the JM-16 (vMDV) or RK-1 (vv+
MDV) strains. The spleen is preferred above thymus, blood,
and bursa of Fabricius, because it is a good source for B and
T cells allowing the detection of MDV during the lytic and
latent phases of the pathogenesis of MDV infection. Viral
genome replication was determined by measuring the
number of viral DNA copies using the infected cell protein
4 (ICP4) gene in qPCR assays. Viral gene expression was
determined by quantitative reverse transcriptase-PCR (qRT-
PCR) to quantify the levels of glycoprotein B (gB)
expression as an indicator of virus replication associated
with lytic infection and ICP4–latency-associated transcripts
(LAT) for both the lytic and latent transformation phases of
infection (Jarosinski et al., 2003). The data were analyzed
for three distinct periods during the first 10 dpi based on
results for JM-16. The first period, which we named the
prelytic period (1–3 dpi), was characterized by the absence
of virus transcripts in the presence of viral DNA. The lytic
period was characterized by the presence of gB and ICP4–
LAT transcripts at 4 and 5 dpi, while the latent phase was
considered to be present starting at 6 dpi.
Results
Control chickens
All uninfected control chickens remained negative for
viral DNA and RNA during the experimental period.
Viral genome load
DNA was extracted from splenocytes, subjected to
qPCR, and their copy numbers were normalized per copy
numbers of the cellular inducible nitric oxide synthase
(iNOS) gene. DNA samples were not available for 8 dpi. A
lack of interaction between dpi, virus strain, and chicken
line (Table 1) using the results for the 10-day period
indicated that the magnitude of differences in MDV
genomic copy number between virus–dpi combination
groups was similar in the P2a and N2a lines (Fig. 1).
However, this analysis did not consider the distinct periods
during the early pathogenesis, for example, the establish-
ment of infection or prelytic period (1–3 dpi), the start of
virus replication or lytic infection period (4–5 dpi), and the
initiation of latent infection (6–10 dpi). The grouping of
these distinct phases might mask differences between lines
and virus combinations. Thus the data for dpi were grouped
accordingly to the phase of infection and reanalyzed with
chicken line, infection phase, and virus strain as main effects
and their interactions. In this analysis, significant interac-
tions between dpi, virus strains, and chicken lines were only
found for the latency period between 6 and 10 dpi (Table 2).
During the prelytic period, the highest levels of MDV
genome copies in the spleens were detected at 1 dpi
independently of the chicken line or virus strains. The
number of MDV genome copies decreased at 2 dpi and
reached their lowest levels at 3 dpi (Figs. 1A and B). The
lytic period started at 4 dpi with a significant increase in
MDV genome copy numbers compared to that at 3 dpi
independently of the virus strain or the genetic background
of the chicken line (Fig. 1, Table 3). The only significant
difference was noted at 4 dpi in P2a chickens with a
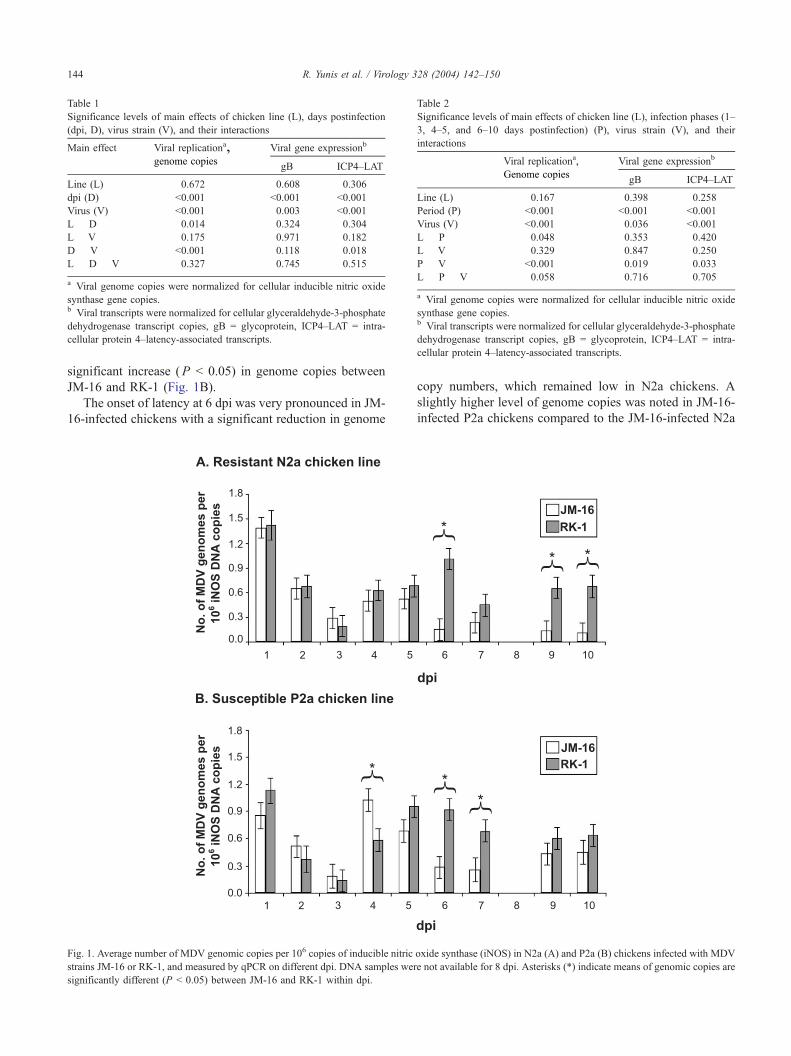
Table 1
Significance levels of main effects of chicken line (L), days postinfection
(dpi, D), virus strain (V), and their interactions
Main effect Viral replicationa,genome copies
Viral gene expressionb
gB ICP4–LAT
Line (L) 0.672 0.608 0.306
dpi (D) b0.001 b0.001 b0.001
Virus (V) b0.001 0.003 b0.001
L � D 0.014 0.324 0.304
L � V 0.175 0.971 0.182
D � V b0.001 0.118 0.018
L � D � V 0.327 0.745 0.515
a Viral genome copies were normalized for cellular inducible nitric oxide
synthase gene copies.b Viral transcripts were normalized for cellular glyceraldehyde-3-phosphate
dehydrogenase transcript copies, gB = glycoprotein, ICP4–LAT = intra-
cellular protein 4–latency-associated transcripts.
Table 2
Significance levels of main effects of chicken line (L), infection phases (1–
3, 4–5, and 6–10 days postinfection) (P), virus strain (V), and their
interactions
Viral replicationa,
Genome copies
Viral gene expressionb
gB ICP4–LAT
Line (L) 0.167 0.398 0.258
Period (P) b0.001 b0.001 b0.001
Virus (V) b0.001 0.036 b0.001
L � P 0.048 0.353 0.420
L � V 0.329 0.847 0.250
P � V b0.001 0.019 0.033
L � P � V 0.058 0.716 0.705
a Viral genome copies were normalized for cellular inducible nitric oxide
synthase gene copies.b Viral transcripts were normalized for cellular glyceraldehyde-3-phosphate
dehydrogenase transcript copies, gB = glycoprotein, ICP4–LAT = intra-
cellular protein 4–latency-associated transcripts.
R. Yunis et al. / Virology 328 (2004) 142–150144
significant increase (P b 0.05) in genome copies between
JM-16 and RK-1 (Fig. 1B).
The onset of latency at 6 dpi was very pronounced in JM-
16-infected chickens with a significant reduction in genome
Fig. 1. Average number of MDV genomic copies per 106 copies of inducible nitric
strains JM-16 or RK-1, and measured by qPCR on different dpi. DNA samples wer
significantly different (P b 0.05) between JM-16 and RK-1 within dpi.
copy numbers, which remained low in N2a chickens. A
slightly higher level of genome copies was noted in JM-16-
infected P2a chickens compared to the JM-16-infected N2a
oxide synthase (iNOS) in N2a (A) and P2a (B) chickens infected with MDV
e not available for 8 dpi. Asterisks (*) indicate means of genomic copies are

Table 3
Mean normalizeda number of MDV genome copies and gB and ICP4–LAT transcripts during the prelytic [1–3 days postinfection (dpi)], lytic (4–5 dpi), and
latent (6–10 dpi) infection periods in susceptible P2a and resistant N2a line chickens inoculated with virulent JM-16 or very virulent RK-1 MDV strains at 7
days of age
Assay Line Number of DNA copies or transcripts during
Prelytic period Lytic period Latent period
JM-16 RK-1 JM-16 RK-1 JM-16 RK-1
qPCR: Viral genome copies N2a 0.634 0.509 0.514 0.653 0.136 0.661*
P2a 0.467 0.507 0.754 0.768 0.356 0.598*
qRT-PCR: gB transcripts N2a 0.045 0.012 0.577 0.752 0.196 0.509*
P2a 0.097 0.056 0.829 0.843 0.097 0.504*
qRT-PCR: ICP4/LAT transcripts N2a 0.017 0.008 0.483 0.736* 0.039 0.316*
P2a 0.027 0.017 0.575 0.763* 0.138 0.279*
a Intracellular protein 4 (ICP4)–latency-associated transcript (LAT) copy numbers were normalized for cellular inducible nitric oxide (iNOS) copy numbers.
ICP4–LAT and glycoprotein B (gB) transcript numbers were normalized for cellular glyceraldehyde-3-phosphate dehydrogenase transcript copies.* Means are significantly different (P b 0.05) within line and infection phase combination between viruses.
R. Yunis et al. / Virology 328 (2004) 142–150 145
chickens, but this difference was only statistically significant
when the data were pooled for 6–10 dpi. The onset of latency
was much less pronounced or absent in RK-1-infected P2a
and N2a chickens. Genome copy numbers remained high
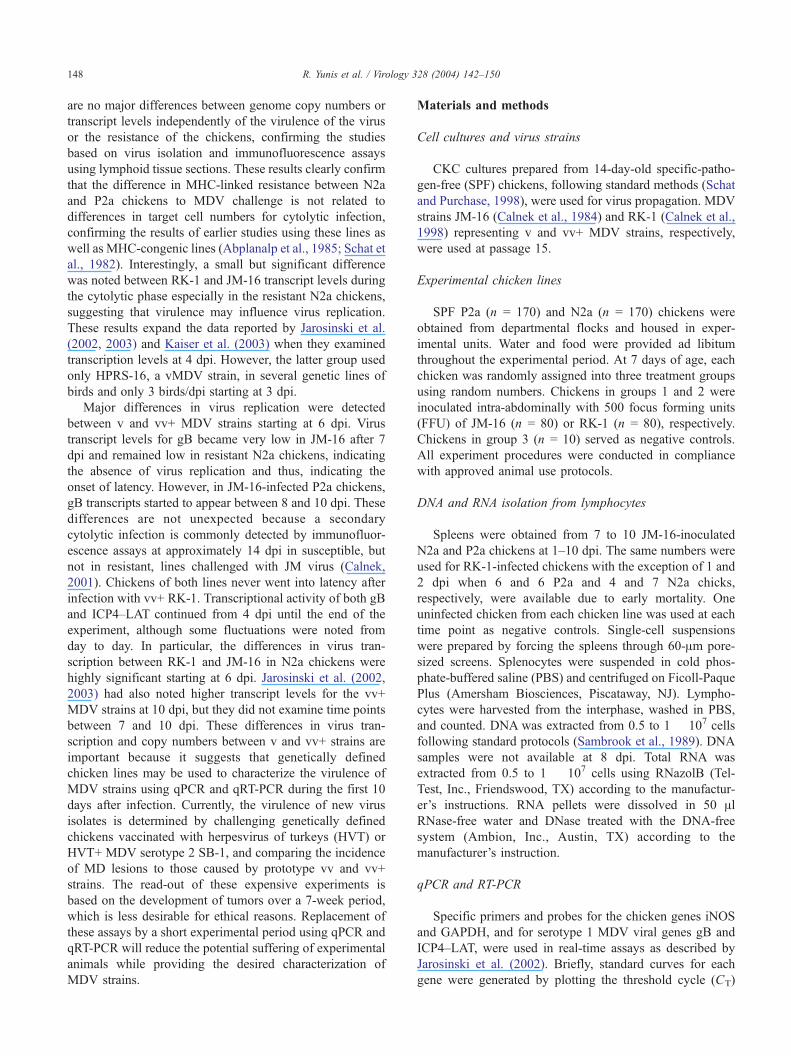
Fig. 2. Average number of glycoprotein B (gB) transcripts per 105 glyceraldehyde
chickens infected with MDV strains JM-16 or RK-1, and measured by qRT-P
significantly different (P b 0.05) between JM-16 and RK-1 within the dpi.
from 4 to 10 dpi. Significant differences in genome copy
numbers between JM-16- and RK-1-infected chickens were
present at several dpi in both lines, although the difference
became less pronounced at 9 and 10 dpi in P2a chickens.
-3-phosphate dehydrogenase (GAPDH) transcripts in N2a (A) and P2a (B)
CR on different dpi. Asterisks (*) indicate means of gB transcripts are
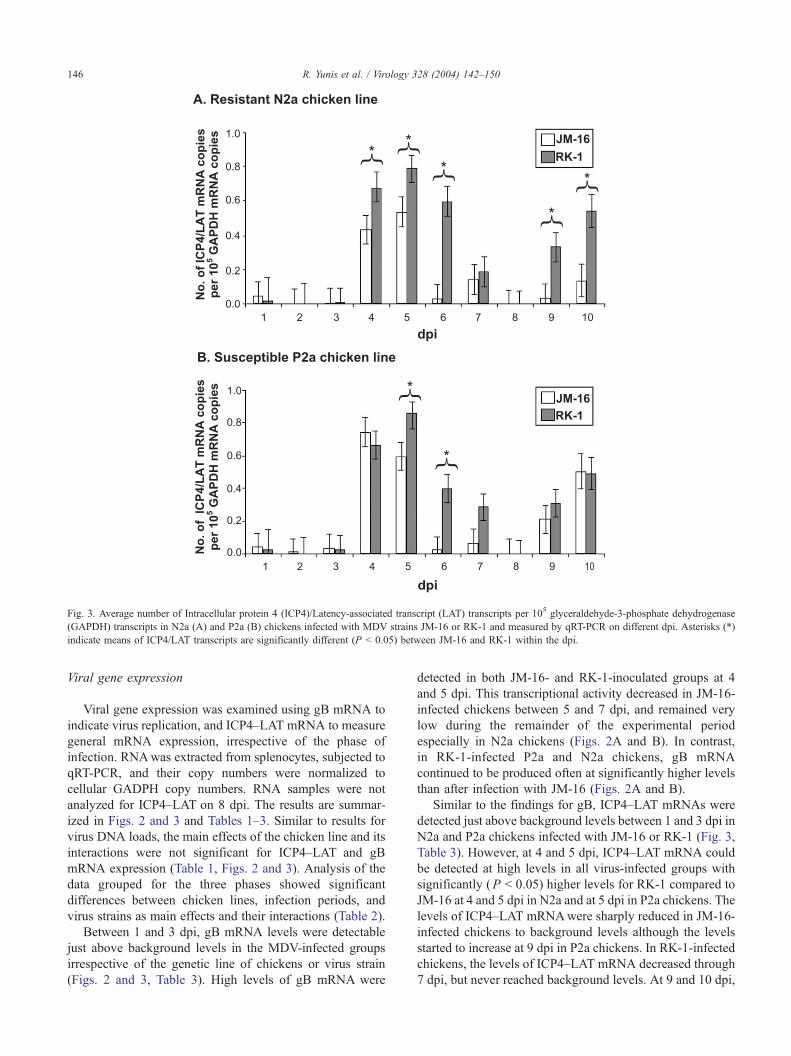
Fig. 3. Average number of Intracellular protein 4 (ICP4)/Latency-associated transcript (LAT) transcripts per 105 glyceraldehyde-3-phosphate dehydrogenase
(GAPDH) transcripts in N2a (A) and P2a (B) chickens infected with MDV strains JM-16 or RK-1 and measured by qRT-PCR on different dpi. Asterisks (*)
indicate means of ICP4/LAT transcripts are significantly different (P b 0.05) between JM-16 and RK-1 within the dpi.
R. Yunis et al. / Virology 328 (2004) 142–150146
Viral gene expression
Viral gene expression was examined using gB mRNA to
indicate virus replication, and ICP4–LAT mRNA to measure
general mRNA expression, irrespective of the phase of
infection. RNAwas extracted from splenocytes, subjected to
qRT-PCR, and their copy numbers were normalized to
cellular GADPH copy numbers. RNA samples were not
analyzed for ICP4–LAT on 8 dpi. The results are summar-
ized in Figs. 2 and 3 and Tables 1–3. Similar to results for
virus DNA loads, the main effects of the chicken line and its
interactions were not significant for ICP4–LAT and gB
mRNA expression (Table 1, Figs. 2 and 3). Analysis of the
data grouped for the three phases showed significant
differences between chicken lines, infection periods, and
virus strains as main effects and their interactions (Table 2).
Between 1 and 3 dpi, gB mRNA levels were detectable
just above background levels in the MDV-infected groups
irrespective of the genetic line of chickens or virus strain
(Figs. 2 and 3, Table 3). High levels of gB mRNA were
detected in both JM-16- and RK-1-inoculated groups at 4
and 5 dpi. This transcriptional activity decreased in JM-16-
infected chickens between 5 and 7 dpi, and remained very
low during the remainder of the experimental period
especially in N2a chickens (Figs. 2A and B). In contrast,
in RK-1-infected P2a and N2a chickens, gB mRNA
continued to be produced often at significantly higher levels
than after infection with JM-16 (Figs. 2A and B).
Similar to the findings for gB, ICP4–LAT mRNAs were
detected just above background levels between 1 and 3 dpi in
N2a and P2a chickens infected with JM-16 or RK-1 (Fig. 3,
Table 3). However, at 4 and 5 dpi, ICP4–LAT mRNA could
be detected at high levels in all virus-infected groups with
significantly (P b 0.05) higher levels for RK-1 compared to
JM-16 at 4 and 5 dpi in N2a and at 5 dpi in P2a chickens. The
levels of ICP4–LAT mRNAwere sharply reduced in JM-16-
infected chickens to background levels although the levels
started to increase at 9 dpi in P2a chickens. In RK-1-infected
chickens, the levels of ICP4–LAT mRNA decreased through
7 dpi, but never reached background levels. At 9 and 10 dpi,
Table 4
Number of viral DNA copies and transcripts before and after three freeze-
thaw cycles
Group DNA F SEMa RNAb
gB ICP4–LAT
JM-16 546 F 98 4980 1382
JM-16 Freeze Thaw 276 F 91 3394 361
RK-1 46 F 15 232 13
RK-1 Freeze Thaw 26 F 6 195 10
a Viral DNA was measured using intracellular protein 4 (ICP4) and were
normalized for cellular inducible nitric oxide (iNOS) copy numbers.b ICP4–latency-associated transcript (LAT) and glycoprotein B (gB)
transcript numbers were normalized for cellular glyceraldehyde-3-
phosphate dehydrogenase transcript copies.
R. Yunis et al. / Virology 328 (2004) 142–150 147
the levels increased again and were significantly higher than
after JM-16 infection in N2a chickens (Figs. 3A and B).
MDV DNA and RNA in virus inoculum
Because MDV DNAwas detected in the spleen at 1 dpi at
relatively high levels, while RNA was barely detected, the
quantities of MDV DNA and RNA were measured in an
aliquot of the same batches of JM-16 and RK-1 that were
used in these experiments. We also examined the effect of the
process of freezing–thawing of the virus on genome and
transcript copies. Ampules of each virus were thawed, diluted
in PBS, and left for 1.5 h to mimic the time it took to inoculate
chickens in the first experiment. Half the inoculum was then
centrifuged and frozen at �20 8C, then thawed rapidly at 37
8C. This was repeated three times and then RNA and DNA
were collected and used in qRT-PCR and qPCR assays using
iNOS and GAPDH as internal standards, respectively. The
process of three freeze–thaw cycles reduced the DNA load in
JM-16 and RK-1 viruses (Table 4). The number of transcripts
of gB and ICP4–LAT was affected by the freeze–thaw
process in JM-16 whereas transcripts in RK-1 were already
low and basically not affected (Table 4).
Discussion
The relation between virus replication, virulence of the
virus strain, and genetic resistance of the host has been the
focus of studies on the early pathogenesis since the late 1960s
(Calnek, 2001). Most of these studies used virus isolation and
staining techniques for viral proteins, for example, immuno-
fluorescence assays, to determine if differences in virus
replication rates during the first 10 dpi could be related to
virulence or genetic resistance. The results suggested that
there are no differences in virus replication rates, a very
insensitive method to determine viral replication rates, when
v and vv strains were compared in chicken lines with
differences in MHC-based genetic resistance or susceptibil-
ity. The data presented in this report add new and important
information to the knowledge about the early viral genome
replication of MDV in relation to MDV virulence and genetic
resistance or susceptibility of the host by quantifying viral
genome load and viral transcripts from 1 to 10 dpi.
Two interesting new findings were the high genomic
copy number that was detected in the spleen at 1 dpi after
intra-abdominal inoculation and the rapid decrease in copy
numbers over the next 2 days. The presence of very low
transcription levels for ICP4–LAT, as well as gB, during the
same time period suggests that the virus-infected CKC
cultures inoculated into the chickens were rapidly degraded
in the spleens. Virus-infected CKC cultures are harvested
and frozen in liquid nitrogen when cytopathic effects are
visible, a process that cannot result in the destruction of the
cells, because intact cells are essential to maintain the
infectivity of this cell-associated virus. It is unlikely that the
absence of virus transcripts was due to this careful freezing
and thawing process. Even three freeze–thaw cycles, which
destroy cells and the cell-associated infectivity of MDV, did
not reduce viral DNA or RNA significantly. The difference
in viral load between JM-16 and RK-1 may simply reflect
that more viral DNA is present per infectious cell in JM-16-
infected CKC than in RK-1-infected CKC, because infec-
tious doses were based on plaque formation in CKC.
It is not clear which cells are involved in the process of
degrading the infected cells and virus, but macrophages,
dendritic cells, and ellipsoid-associated reticulum cells are
possible candidates. Jeurissen et al. (1992) suggested that
ellipsoid-associated reticulum cells were essential to pass
MDV from the blood to the splenocytes before replication.
Thus far, little or no attention has been paid to the importance
of antigen processing during the first 24–72 h after
inoculation with cell-associated MDV. Interferon (IFN)-g
is upregulated as early as 3 dpi (Kaiser et al., 2003; Xing and
Schat, 2000), probably before viral mRNA can be detected.
In addition, natural killer (NK) cells were activated as early
as 4 days post-vaccination (Heller and Schat, 1987)
suggesting that events unrelated to viral replication may be
involved in the early stimulation of NK cells. MDV-specific
CTLs recognizing several MDV proteins are present in the
spleen as early as 7 dpi (Markowski-Grimsrud and Schat,
2002; Omar and Schat, 1996). It is feasible that the
development of the CTL response depends on the early
priming of dendritic cells (Melief, 2003) by virus-infected
inoculum cells, followed by the MHC class I presentation of
neoantigens during the lytic infection cycle. It will be
important to examine the importance of ellipsoid-associated
reticulum cells and dendritic cells for virus transmission to B
lymphocytes and activation of innate and acquired MDV
immune responses during the first 72 h after inoculation with
cell-associated MDV.
The combination of qPCR and qRT-PCR allows a more
detailed examination of virus replication than was possible
with previous techniques. The data clearly demonstrate a
very short window starting at 4 dpi during which MDV
transcripts are detected after infection of MD-resistant N2a
chickens with JM-16. During this period of 2–3 days, there
R. Yunis et al. / Virology 328 (2004) 142–150148
are no major differences between genome copy numbers or
transcript levels independently of the virulence of the virus
or the resistance of the chickens, confirming the studies
based on virus isolation and immunofluorescence assays
using lymphoid tissue sections. These results clearly confirm
that the difference in MHC-linked resistance between N2a
and P2a chickens to MDV challenge is not related to
differences in target cell numbers for cytolytic infection,
confirming the results of earlier studies using these lines as
well as MHC-congenic lines (Abplanalp et al., 1985; Schat et
al., 1982). Interestingly, a small but significant difference
was noted between RK-1 and JM-16 transcript levels during
the cytolytic phase especially in the resistant N2a chickens,
suggesting that virulence may influence virus replication.
These results expand the data reported by Jarosinski et al.
(2002, 2003) and Kaiser et al. (2003) when they examined
transcription levels at 4 dpi. However, the latter group used
only HPRS-16, a vMDV strain, in several genetic lines of
birds and only 3 birds/dpi starting at 3 dpi.
Major differences in virus replication were detected
between v and vv+ MDV strains starting at 6 dpi. Virus
transcript levels for gB became very low in JM-16 after 7
dpi and remained low in resistant N2a chickens, indicating
the absence of virus replication and thus, indicating the
onset of latency. However, in JM-16-infected P2a chickens,
gB transcripts started to appear between 8 and 10 dpi. These
differences are not unexpected because a secondary
cytolytic infection is commonly detected by immunofluor-
escence assays at approximately 14 dpi in susceptible, but
not in resistant, lines challenged with JM virus (Calnek,
2001). Chickens of both lines never went into latency after
infection with vv+ RK-1. Transcriptional activity of both gB
and ICP4–LAT continued from 4 dpi until the end of the
experiment, although some fluctuations were noted from
day to day. In particular, the differences in virus tran-
scription between RK-1 and JM-16 in N2a chickens were
highly significant starting at 6 dpi. Jarosinski et al. (2002,
2003) had also noted higher transcript levels for the vv+
MDV strains at 10 dpi, but they did not examine time points
between 7 and 10 dpi. These differences in virus tran-
scription and copy numbers between v and vv+ strains are
important because it suggests that genetically defined
chicken lines may be used to characterize the virulence of
MDV strains using qPCR and qRT-PCR during the first 10
days after infection. Currently, the virulence of new virus
isolates is determined by challenging genetically defined
chickens vaccinated with herpesvirus of turkeys (HVT) or
HVT+ MDV serotype 2 SB-1, and comparing the incidence
of MD lesions to those caused by prototype vv and vv+
strains. The read-out of these expensive experiments is
based on the development of tumors over a 7-week period,
which is less desirable for ethical reasons. Replacement of
these assays by a short experimental period using qPCR and
qRT-PCR will reduce the potential suffering of experimental
animals while providing the desired characterization of
MDV strains.
Materials and methods
Cell cultures and virus strains
CKC cultures prepared from 14-day-old specific-patho-
gen-free (SPF) chickens, following standard methods (Schat
and Purchase, 1998), were used for virus propagation. MDV
strains JM-16 (Calnek et al., 1984) and RK-1 (Calnek et al.,
1998) representing v and vv+ MDV strains, respectively,
were used at passage 15.
Experimental chicken lines
SPF P2a (n = 170) and N2a (n = 170) chickens were
obtained from departmental flocks and housed in exper-
imental units. Water and food were provided ad libitum
throughout the experimental period. At 7 days of age, each
chicken was randomly assigned into three treatment groups
using random numbers. Chickens in groups 1 and 2 were
inoculated intra-abdominally with 500 focus forming units
(FFU) of JM-16 (n = 80) or RK-1 (n = 80), respectively.
Chickens in group 3 (n = 10) served as negative controls.
All experiment procedures were conducted in compliance
with approved animal use protocols.
DNA and RNA isolation from lymphocytes
Spleens were obtained from 7 to 10 JM-16-inoculated
N2a and P2a chickens at 1–10 dpi. The same numbers were
used for RK-1-infected chickens with the exception of 1 and
2 dpi when 6 and 6 P2a and 4 and 7 N2a chicks,
respectively, were available due to early mortality. One
uninfected chicken from each chicken line was used at each
time point as negative controls. Single-cell suspensions
were prepared by forcing the spleens through 60-Am pore-
sized screens. Splenocytes were suspended in cold phos-
phate-buffered saline (PBS) and centrifuged on Ficoll-Paque
Plus (Amersham Biosciences, Piscataway, NJ). Lympho-
cytes were harvested from the interphase, washed in PBS,
and counted. DNA was extracted from 0.5 to 1 � 107 cells
following standard protocols (Sambrook et al., 1989). DNA
samples were not available at 8 dpi. Total RNA was
extracted from 0.5 to 1 � 107 cells using RNazolB (Tel-
Test, Inc., Friendswood, TX) according to the manufactur-
er’s instructions. RNA pellets were dissolved in 50 AlRNase-free water and DNase treated with the DNA-free
system (Ambion, Inc., Austin, TX) according to the
manufacturer’s instruction.
qPCR and RT-PCR
Specific primers and probes for the chicken genes iNOS
and GAPDH, and for serotype 1 MDV viral genes gB and
ICP4–LAT, were used in real-time assays as described by
Jarosinski et al. (2002). Briefly, standard curves for each
gene were generated by plotting the threshold cycle (CT)
R. Yunis et al. / Virology 328 (2004) 142–150 149
value at each dilution with the amount of standard added to
that dilution. The slope was used to determine the amount of
input gene product for each unknown sample from its CT
value. The coefficient of regression for each standard curve
was higher than 0.98. For qPCR, the reaction mixture
contained Universal TaqMan Master Mix (Applied Bio-
systems, Foster City, CA) with 0.5 Ag RNase-treated DNA,
25 pmol of each gene-specific primer, and 10 pmol of gene-
specific probe in 25-Al volumes. All reactions were
performed in ABI Prism 7700 Sequence Detection System
(Applied Biosystems) with thermal cycling conditions as
follow: 50 8C for 2 min, then a 95 8C hold for 10 min,
followed by 50 cycles at 95 8C for 20 s, and 60 8C for 1 min.
For qRT-PCR, RNA amplifications were performed in one-
step RT-PCR reactions as previously described (Jarosinski et
al., 2002, 2003). Briefly, the reaction mixture contained
TaqMan One-Step RT-PCR Master Mix (Applied Biosys-
tems), 50 ng total RNA, 25 pmol of each gene-specific
primer, and 10 pmol of gene-specific probe in 25- or 50-Alvolumes. Thermal cycling conditions were as follow: 48 8Cfor 30 min, followed by 40 cycles at 94 8C for 20 s, and 60
8C for 1 min.
All results of the qPCR and qRT-PCR were analyzed
using the Sequence Detection Systems v.1.6.3 software
(Applied Biosystems). Any sample with a CT value of 50
(qPCR) or 40 (qRT-PCR) did not have any amplification of
DNA or mRNA, respectively, above background for each
specific gene. For each sample, DNA copies of the ICP4
gene were normalized for DNA loading using the number of
DNA copies of the chicken iNOS gene, and mRNA copies
of ICP4–LAT and gB were normalized for RNA loading to
GAPDH mRNA levels.
Statistical analysis
Data of DNA copies and ICP4–LAT and gB mRNA
levels were subjected to a three-way analysis of variance
(ANOVA), with chicken line, dpi, and virus strain as main
effects, and their interactions. Differences in means were
determined by contrasts using Student’s t tests. All
statistical analyses were carried out using JMP 4.0.0
software (SAS Institute, 2000).
Acknowledgments
This work was supported in part by the Cooperative State
Research, Education, and Extension Service, United States
Department of Agriculture (USDA), under agreement no.
98-35204-6425 and USDA Regional Research NE-60 to
Karel A. Schat, and USDA/CSREES/NRICGP postdoctoral
fellowship award no. 2001-35204-10152 to Keith W.
Jarosinski. Dr. Reem Yunis was supported by the United
States–Israel Binational Agricultural Research and Develop-
ment Fund (BARD), Research Grant Award no. FR-308-
2000.
References
Abplanalp, H., Schat, K.A., Calnek, B.W., 1985. Resistance to Marek’s
disease of congenic lines differing in major histocompatibility
haplotypes to 3 virus strains. In: Calnek, B.W., Spencer, J.L. (Eds.),
Marek’s Disease Symposium 1984. American Association of Avian
Pathologists, Kennett Square, PA, pp. 347–358.
Bacon, L.D., Hunt, H.D., Cheng, H.H., 2001. Genetic resistance to Marek’s
disease. Curr. Top. Microbiol. Immunol. 255, 121–141.
Baigent, S.J., Davison, T.F., 1999. Development and composition of
lymphoid lesions in the spleens of Marek’s disease virus-infected
chickens: association with virus spread and the pathogenesis of Marek’s
disease. Avian Pathol. 28, 287–300.
Calnek, B.W., 1986. Marek’s disease: a model for herpesvirus oncology.
CRC Crit. Rev. Microbiol. 12, 293–320.
Calnek, B.W., 2001. Pathogenesis of Marek’s disease virus infection. Curr.
Top. Microbiol. Immunol. 255, 25–55.
Calnek, B.W., Carlisle, J.C., Fabricant, J., Murthy, K.K., Schat, K.A., 1979.
Comparative pathogenesis studies with oncogenic and nononcogenic
Marek’s disease viruses and turkey herpesvirus. Am. J. Vet. Res. 40,
541–548.
Calnek, B.W., Schat, K.A., Ross, L.J., Shek, W.R., Chen, C.L., 1984.
Further characterization of Marek’s disease virus-infected lymphocytes.
I. In vivo infection. Int. J. Cancer 33, 389–398.
Calnek, B.W., Harris, R.W., Buscaglia, C., Schat, K.A., Lucio, B., 1998.
Relationship between the immunosuppressive potential and the
pathotype of Marek’s disease virus isolates. Avian Dis. 42, 124–132.
Heller, E.D., Schat, K.A., 1987. Enhancement of natural killer cell activity
by Marek’s disease vaccines. Avian Pathol. 16, 51–60.
Jarosinski, K.W., Yunis, R.W., O’Connell, P.H., Markowski-Grimsrud, C.J.,
Schat, K.A., 2002. Influence of genetic resistance of the chicken and
virulence of Marek’s disease virus (MDV) on nitric oxide responses
after MDV infection. Avian Dis. 46, 636–649.
Jarosinski, K.W., O’Connell, P.H., Schat, K.A., 2003. Impact of deletions
within the Bam HI-L fragment of attenuated Marek’s disease virus on
vIL-8 expression and the newly identified transcript of open reading
frame LORF4. Virus Genes 26, 255–269.
Jeurissen, S.H.M., Janse, E.M., Wagenaar, F., de Boer, G.F., 1992. The role
of splenic ellipsoid-associated reticulum cells in the pathogenesis of
Marek’s disease. In: de Boer, G.F., Jeurissen, S.H.M. (Eds.), 4th
International Symposium on Marek’s Disease. vol. 1. Ponsen and
Looijen, Amsterdam, pp. 211–215.
Kaiser, P., Underwood, G., Davison, F., 2003. Differential cytokine
responses following Marek’s disease virus infection of chickens
differing in resistance to Marek’s disease. J. Virol. 77, 762–768.
Markowski-Grimsrud, C.J., Schat, K.A., 2002. Cytotoxic T lymphocyte
responses to Marek’s disease herpesvirus-encoded glycoproteins. Vet.
Immunol. Immunopathol. 90, 133–144.
Melief, C.J., 2003. Mini-review: regulation of cytotoxic T lymphocyte
responses by dendritic cells: peaceful coexistence of cross-priming and
direct priming? Eur. J. Immunol. 33, 2645–2654.
Omar, A.R., Schat, K.A., 1996. Syngeneic Marek’s disease virus (MDV)-
specific cell-mediated immune responses against immediate early, late,
and unique MDV proteins. Virology 222, 87–99.
Sambrook, J., Fritsch, E.F., Maniatis, T., 1989. Molecular Cloning. A
Laboratory Manual. (2nd ed.) Cold Spring Harbor Laboratory Press,
Cold Spring Harbor, NY.
SAS Institute Inc., 2000. SAS Campus Drive, Cary, North Carolina 27513,
USA.
Schat, K.A., 1987. Marek’s disease: a model for protection against
herpesvirus-induced tumours. Cancer Surv. 6, 1–37.
Schat, K.A., Davies, C., 2000. Resistance to viral diseases. In: Axford,
R.F.E., Owen, J.B., Nicholas, F. (Eds.), Breeding for Disease
Resistance in Farm Animals, (2nd ed.) CAB International, Wallingford,
UK, pp. 271–300.
Schat, K.A., Purchase, H.G., 1998. Cell-culture methods. In: Swayne, D.E.,
Glisson, J.R., Jackwood, M.W., Pearson, J.E., Reed, W.M. (Eds.), A

R. Yunis et al. / Virology 328 (2004) 142–150150
Laboratory Manual for the Isolation and Identification of Avian
Pathogens, (4th ed.) American Association of Avian Pathologists,
Kennett Square, PA, pp. 223–234.
Schat, K.A., Calnek, B.W., Fabricant, J., 1982. Characterisation of two
highly oncogenic strains of Marek’s disease virus. Avian Pathol. 11,
593–605.
Schat, K.A., Chen, C.-L.H., Calnek, B.W., Char, D., 1991. Transformation
of T-lymphocyte subsets by Marek’s disease herpesvirus. J. Virol. 65,
1408–1413.
Shek, W.R., Calnek, B.W., Schat, K.A., Chen, C.-L.H., 1983. Character-
ization of Marek’s disease virus-infected lymphocytes: discrimination
between cytolytically and latently infected cells. J. Natl. Cancer Inst. 70,
485–491.
Witter, R.L., 1997. Increased virulence of Marek’s disease virus field
isolates. Avian Dis. 41, 149–163.
Witter, R.L., Schat, K.A., 2003. Marek’s disease. In: Saif, Y.M., Barnes,
H.J., Glisson, J.R., Fadly, A.M., McDougald, L.R., Swayne, D.E.
(Eds.), Diseases of Poultry, (11th ed.) Iowa State Univ. Press, Ames, IA,
pp. 407–464.
Xing, Z., Schat, K.A., 2000. Expression of cytokine genes in Marek’s
disease virus-infected chickens and chicken embryo fibroblast cultures.
Immunology 100, 70–76.
Copyright © 2022 FDOKUMEN