Identification of a putative protein profile associated with tamoxifen therapy resistance in breast...
17
Identification of a Putative Protein Profile Associated with Tamoxifen Therapy Resistance in Breast Cancer* □ S Arzu Umar‡§, Hyuk Kang¶, Annemieke M. Timmermans‡, Maxime P. Look‡, Marion E. Meijer-van Gelder‡, Michael A. den Bakker**, Navdeep Jaitly¶‡‡, John W. M. Martens‡, Theo M. Luider§§, John A. Foekens‡, and Ljiljana Pas ˇ a-Tolic ´¶ Tamoxifen resistance is a major cause of death in patients with recurrent breast cancer. Current clinical factors can correctly predict therapy response in only half of the treated patients. Identification of proteins that are asso- ciated with tamoxifen resistance is a first step toward better response prediction and tailored treatment of pa- tients. In the present study we intended to identify puta- tive protein biomarkers indicative of tamoxifen therapy resistance in breast cancer using nano-LC coupled with FTICR MS. Comparative proteome analysis was per- formed on 5,500 pooled tumor cells (corresponding to 550 ng of protein lysate/analysis) obtained through laser capture microdissection (LCM) from two independently processed data sets (n 24 and n 27) containing both tamoxifen therapy-sensitive and therapy-resistant tu- mors. Peptides and proteins were identified by matching mass and elution time of newly acquired LC-MS features to information in previously generated accurate mass and time tag reference databases. A total of 17,263 unique peptides were identified that corresponded to 2,556 non- redundant proteins identified with >2 peptides. 1,713 overlapping proteins between the two data sets were used for further analysis. Comparative proteome analysis revealed 100 putatively differentially abundant proteins between tamoxifen-sensitive and tamoxifen-resistant tu- mors. The presence and relative abundance for 47 differ- entially abundant proteins were verified by targeted nano-LC-MS/MS in a selection of unpooled, non-micro- dissected discovery set tumor tissue extracts. ENPP1, EIF3E, and GNB4 were significantly associated with pro- gression-free survival upon tamoxifen treatment for recurrent disease. Differential abundance of our top dis- criminating protein, extracellular matrix metalloproteinase inducer, was validated by tissue microarray in an independ- ent patient cohort (n 156). Extracellular matrix metallo- proteinase inducer levels were higher in therapy-resistant tumors and significantly associated with an earlier tumor progression following first line tamoxifen treatment (hazard ratio, 1.87; 95% confidence interval, 1.25–2.80; p 0.002). In summary, comparative proteomics performed on laser capture microdissection-derived breast tumor cells us- ing nano-LC-FTICR MS technology revealed a set of putative biomarkers associated with tamoxifen therapy resistance in recurrent breast cancer. Molecular & Cellular Proteomics 8:1278 –1294, 2009. Tamoxifen is an antiestrogenic agent that has been widely and successfully used in the treatment of breast cancer over the past decades (1). Tamoxifen targets and inhibits the es- trogen receptor-, which is expressed in 70% of all primary breast tumors and is known to be important in the develop- ment and course of the disease. When diagnosed at an early stage, adjuvant systemic tamoxifen therapy can cure 10% of the patients (1). In recurrent disease, 50% of patients have no benefit from tamoxifen (intrinsic resistance). From the other half of patients who initially respond to therapy with an objective response (OR) 1 or no change (NC), a majority even- tually develop progressive disease (PD) due to acquired ta- moxifen resistance (2, 3). With the markers available to date we can insufficiently predict therapy response. Therefore, From the ‡Department of Medical Oncology and Cancer Genomics Centre, **Department of Pathology, and §§Department of Neurology, Josephine Nefkens Institute, Erasmus Medical Center, 3000 CA Rotterdam, The Netherlands and ¶Environmental Molecular Sciences Laboratory, Pacific Northwest National Laboratory, Richland, Wash- ington 99352 Author’s Choice—Final version full access. Received, October 29, 2008, and in revised form, February 24, 2009 Published, MCP Papers in Press, March 27, 2009, DOI 10.1074/ mcp.M800493-MCP200 1 The abbreviations used are: OR, objective response; AMT, accu- rate mass and time; BRB, biometric research branch; CI, confidence interval; CLIC4, chloride intracellular channel protein 4; CR, complete remission; EBP50, ezrin-radixin-moesin-binding phosphoprotein 50; EIF3E, eukaryotic translation initiation factor 3 subunit 6/E; EMMPRIN, extracellular matrix metalloproteinase inducer; GNB4, guanine nucleotide-binding protein subunit 4; HR, hazard ratio; IHC, immunohistochemistry; IPI, International Protein Index; LCM, laser capture microdissection; NAP1L1, nucleosome assembly protein 1-like 1; NC, no change; NET, normalized elution time; OCLN, oc- cluding; PCA, principal component analysis; PD, progressive disease; PR, partial remission; RP, reversed-phase; S100A6, calcyclin; S100A9, calgranulin B; SGPL1, sphingosine-1-phosphate lyase; TMA, tissue microarray; TUBB3, -tubulin type 3; UQCRFS1, ubiqui- nol-cytochrome c reductase iron-sulfur subunit mitochondrial precur- sor; LTQ, linear trap quadrupole; ENPP1, ectonucleotide phospha- tase/phosphodiesterase 1. Research Author’s Choice 1278 Molecular & Cellular Proteomics 8.6 This paper is available on line at http://www.mcponline.org
-
Upload
independent -
Category
Documents
-
view
1 -
download
0
Transcript of Identification of a putative protein profile associated with tamoxifen therapy resistance in breast...

Identification of a Putative Protein ProfileAssociated with Tamoxifen Therapy Resistancein Breast Cancer*□S
Arzu Umar‡§, Hyuk Kang¶�, Annemieke M. Timmermans‡, Maxime P. Look‡,Marion E. Meijer-van Gelder‡, Michael A. den Bakker**, Navdeep Jaitly¶‡‡,John W. M. Martens‡, Theo M. Luider§§, John A. Foekens‡, and Ljiljana Pasa-Tolic¶
Tamoxifen resistance is a major cause of death in patientswith recurrent breast cancer. Current clinical factors cancorrectly predict therapy response in only half of thetreated patients. Identification of proteins that are asso-ciated with tamoxifen resistance is a first step towardbetter response prediction and tailored treatment of pa-tients. In the present study we intended to identify puta-tive protein biomarkers indicative of tamoxifen therapyresistance in breast cancer using nano-LC coupled withFTICR MS. Comparative proteome analysis was per-formed on �5,500 pooled tumor cells (corresponding to�550 ng of protein lysate/analysis) obtained through lasercapture microdissection (LCM) from two independentlyprocessed data sets (n � 24 and n � 27) containing bothtamoxifen therapy-sensitive and therapy-resistant tu-mors. Peptides and proteins were identified by matchingmass and elution time of newly acquired LC-MS featuresto information in previously generated accurate mass andtime tag reference databases. A total of 17,263 uniquepeptides were identified that corresponded to 2,556 non-redundant proteins identified with >2 peptides. 1,713overlapping proteins between the two data sets wereused for further analysis. Comparative proteome analysisrevealed 100 putatively differentially abundant proteinsbetween tamoxifen-sensitive and tamoxifen-resistant tu-mors. The presence and relative abundance for 47 differ-entially abundant proteins were verified by targetednano-LC-MS/MS in a selection of unpooled, non-micro-dissected discovery set tumor tissue extracts. ENPP1,EIF3E, and GNB4 were significantly associated with pro-gression-free survival upon tamoxifen treatment forrecurrent disease. Differential abundance of our top dis-criminating protein, extracellular matrix metalloproteinaseinducer, was validated by tissue microarray in an independ-
ent patient cohort (n � 156). Extracellular matrix metallo-proteinase inducer levels were higher in therapy-resistanttumors and significantly associated with an earlier tumorprogression following first line tamoxifen treatment (hazardratio, 1.87; 95% confidence interval, 1.25–2.80; p � 0.002). Insummary, comparative proteomics performed on lasercapture microdissection-derived breast tumor cells us-ing nano-LC-FTICR MS technology revealed a set ofputative biomarkers associated with tamoxifen therapyresistance in recurrent breast cancer. Molecular &Cellular Proteomics 8:1278–1294, 2009.
Tamoxifen is an antiestrogenic agent that has been widelyand successfully used in the treatment of breast cancer overthe past decades (1). Tamoxifen targets and inhibits the es-trogen receptor-�, which is expressed in �70% of all primarybreast tumors and is known to be important in the develop-ment and course of the disease. When diagnosed at an earlystage, adjuvant systemic tamoxifen therapy can cure �10%of the patients (1). In recurrent disease, �50% of patientshave no benefit from tamoxifen (intrinsic resistance). From theother half of patients who initially respond to therapy with anobjective response (OR)1 or no change (NC), a majority even-tually develop progressive disease (PD) due to acquired ta-moxifen resistance (2, 3). With the markers available to datewe can insufficiently predict therapy response. Therefore,
From the ‡Department of Medical Oncology and Cancer GenomicsCentre, **Department of Pathology, and §§Department of Neurology,Josephine Nefkens Institute, Erasmus Medical Center, 3000 CARotterdam, The Netherlands and ¶Environmental Molecular SciencesLaboratory, Pacific Northwest National Laboratory, Richland, Wash-ington 99352
Author’s Choice—Final version full access.Received, October 29, 2008, and in revised form, February 24, 2009Published, MCP Papers in Press, March 27, 2009, DOI 10.1074/
mcp.M800493-MCP200
1 The abbreviations used are: OR, objective response; AMT, accu-rate mass and time; BRB, biometric research branch; CI, confidenceinterval; CLIC4, chloride intracellular channel protein 4; CR, completeremission; EBP50, ezrin-radixin-moesin-binding phosphoprotein 50;EIF3E, eukaryotic translation initiation factor 3 subunit 6/E;EMMPRIN, extracellular matrix metalloproteinase inducer; GNB4,guanine nucleotide-binding protein � subunit 4; HR, hazard ratio; IHC,immunohistochemistry; IPI, International Protein Index; LCM, lasercapture microdissection; NAP1L1, nucleosome assembly protein1-like 1; NC, no change; NET, normalized elution time; OCLN, oc-cluding; PCA, principal component analysis; PD, progressive disease;PR, partial remission; RP, reversed-phase; S100A6, calcyclin;S100A9, calgranulin B; SGPL1, sphingosine-1-phosphate lyase;TMA, tissue microarray; TUBB3, �-tubulin type 3; UQCRFS1, ubiqui-nol-cytochrome c reductase iron-sulfur subunit mitochondrial precur-sor; LTQ, linear trap quadrupole; ENPP1, ectonucleotide phospha-tase/phosphodiesterase 1.
Research
Author’s Choice
1278 Molecular & Cellular Proteomics 8.6 This paper is available on line at http://www.mcponline.org

identification of new biomarkers that can more effectivelypredict response to treatment and that can potentially func-tion as drug targets is a major focus of research.
The search for new biomarkers has been enhanced by theintroduction of microarray technology. Gene expression stud-ies have resulted in a whole spectrum of profiles for e.g.molecular subtypes, prognosis, and therapy prediction inbreast cancer (4–10). Corresponding studies at the proteinlevel are lagging behind because of immature technology.However, protein-level information is crucial for the functionalunderstanding and the ultimate translation of molecularknowledge into clinical practice, and proteomics technologiescontinue to progress at a rapid pace.
Proteomics studies reported so far have mainly been per-formed with breast cancer cell lines using either two-dimen-sional gel electrophoresis (11–14) or LC-MS for protein sep-aration (15–17). However, it is known that the proteomicmakeup of a cultured cell is rather different from that of atumor cell surrounded by its native microenvironment (18).Furthermore cell lines lack the required follow-up informationfor answering important clinical questions. In addition, tumortissues in general and breast cancer tissues in particular arevery heterogeneous in the sense that they harbor many dif-ferent cell types, such as stroma, normal epithelium, andtumor cells. LCM technology has emerged as an ideal tool forselectively extracting cells of interest from their natural envi-ronment (19) and has therefore been an important step for-ward in the context of genomics and proteomics cancer bi-omarker discovery research. LCM-derived breast cancertumor cells have been used for comparative proteomics anal-yses in the past using both two-dimensional gel electrophore-sis (20, 21) and LC-MS (22). This has resulted in the identifi-cation of proteins involved in breast cancer prognosis (21) andmetastasis (20, 22). Although these studies demonstrated thatproteomics technology has advanced to the level where it cancontribute to biomarker discovery, major drawbacks, such aslarge sample requirements (42–700 �g) and low proteomecoverage (50–76 proteins), for small amounts of starting ma-terial (�1 �g) persist. Because clinical samples are oftenavailable in limited quantities, in-depth analysis of minuteamounts of material (�1 �g) necessitates advanced technol-ogies with sufficient sensitivity and depth of coverage.
Recently we demonstrated the applicability of nano-LC-FTICR MS in combination with the accurate mass and time(AMT) tag approach for proteomics characterization of�3,000 LCM-derived breast cancer cells (23). This studyshowed that proteome coverage was improved comparedwith conventional techniques. The AMT tag approach initiallyutilizes conventional LC-MS/MS measurements to establish areference database of AMT tags specific for a particular pro-teome sample (e.g. breast cancer tissue). Each tag consists ofa theoretical mass calculated from the peptide sequence, anLC normalized elution time (NET) value, and an indicator ofquality. The AMT tag database serves as a “lookup table” for
identifying peptides in subsequent quantitative LC-MS anal-yses. Substituting routine LC-MS/MS analyses (shotgun ap-proach) with LC-FTICR MS analyses (AMT tag approach)significantly increases overall throughput and sensitivity whilereducing sample requirements. Additionally quantitative in-tensity information related to the abundance of the proteincan be discerned from these MS analyses (24). In the presentstudy, we used the same strategy to analyze eight pools oftumor cells in duplicate or triplicate (resulting in 19 samples)derived from 51 fresh frozen primary invasive breast carcino-mas that appeared to be either sensitive or resistant to ta-moxifen treatment after recurrence. This work resulted in theidentification of a putative protein profile associated with ta-moxifen therapy resistance. In addition, the top discriminatingprotein of the putative profile, extracellular matrix metallopro-teinase inducer (EMMPRIN), was validated in an independentpatient cohort and was significantly associated with resist-ance to tamoxifen therapy and shorter time to progressionupon tamoxifen treatment in recurrent breast cancer.
EXPERIMENTAL PROCEDURES
Patients and Tumor Tissues—For the discovery phase of the study,51 different fresh frozen primary breast cancer tissues from our liquidN2 tissue bank were used. Primary tumors were selected from pa-tients that did not receive any systemic adjuvant hormonal therapyand were treated with the antiestrogen tamoxifen as first line therapyupon detection of recurrent breast cancer. Furthermore tumors wereselected on the basis of positive estrogen receptor-� expression asassessed by ligand binding assay or enzyme-linked immunosorbentassay (�10 fmol/mg of cytosolic protein). Tumor tissues were dividedinto two classes based on the type of response to tamoxifen therapy.24 tumors were sensitive to tamoxifen therapy, showing either com-plete remission (CR) or partial remission (PR), and were assigned asOR. 27 tumors were resistant to therapy, showing an increase intumor size, and were designated as PD. Clinical response was de-fined by standards of the International Union against Cancer criteria oftumor response (25). 20 of the above mentioned tumor tissues wereselected for the verification study. Tissues were included based ontheir high tumor cell content of �70%. Tumor cell content was judgedafter hematoxylin/eosin stain of a separately cut 4-�m tissue section.
For immunohistochemical validation, a primary breast tissue mi-croarray (TMA) containing 0.6-�m cores of formalin-fixed paraffin-embedded tumors was used. Within the TMA, there were 156 tumortissues from patients that received tamoxifen as first line treatmentupon recurrence. Median follow-up of patients alive after primarysurgery was 103 months (range, 16–222 months) and 51 months afterthe onset of tamoxifen treatment (range, 9–136 months). Includedpatients showed CR, PR, PD, and NC of �6 and �6 months. Furtherpatient and tumor characteristics are summarized in Table IV.
This study was approved by the Medical Ethics Committee of theErasmus Medical Center Rotterdam, The Netherlands (MEC 02.953)and was performed in accordance to the Code of Conduct of theFederation of Medical Scientific Societies in The Netherlands, andwherever possible we adhered to the Reporting Recommendationsfor Tumor Marker Prognostic Studies (REMARK) (26).
Laser Capture Microdissection—LCM was performed on 8-�mtissue cryosections that were fixed in ice-cold 70% ethanol andstained with hematoxylin as described previously (27). Briefly slideswere washed in Milli-Q water, stained for 30 s in hematoxylin, washedagain in Milli-Q water, subsequently dehydrated twice in 50, 70, 95,
Tamoxifen Resistance Protein Profile in Breast Cancer
Molecular & Cellular Proteomics 8.6 1279

and 100% ethanol for 30 s each, and air-dried. Laser microdissectionand pressure catapulting was performed directly after staining. Tumorepithelial cells were collected, using a P.A.L.M. LCM device, typeP-MB (P.A.L.M. Microlaser Technologies AG, Bernried, Germany).From each cryosection an area of �500,000 �m2 that corresponds to�4,000 cells (area � slide thickness/1,000-�m3 cell volume) wascollected in P.A.L.M. tube caps containing 10 �l of 0.1% RapiGest(Waters Corp., Milford, MA) and then spun down into 0.5-ml Eppen-dorf Protein LoBind tubes (Eppendorf, Hamburg, Germany). Collectedcells were stored at �80 °C until further processing. Because weused small numbers of microdissected cells in this study, the proteinconcentration was typically below the detection limit of any proteinassay. Hence the protein concentration for samples undergoingLC-MS analysis was estimated based on microdissected tissue areaand extrapolations from protein assays performed on whole tissuelysates (i.e. �4,000 cells corresponds to �400 ng of total protein).
Sample Preparation—Microdissected cell batches were pooledinto OR and PD tumor groups (corresponding to �25,000 cells/pool)prior to sample preparation. Briefly cells were lysed by sonicationdirectly in RapiGest solution using an Ultrasonic Disruptor Sonifier II(Model W-250/W-450, Branson Ultrasonics, Danbury, CT) for 1 min at60% amplitude. Proteins were subsequently equilibrated for 2 min at37 °C, denatured at 99 °C for 5 min, and processed for overnighttrypsin digestion according to the instructions of the manufacturerusing MS-grade porcine modified trypsin gold (Promega, Madison,WI) at a 1:20 (w/v) ratio as described previously (23). Digestion wasstopped by incubation with 0.5% TFA at 37 °C for 30 min. Remainingcellular debris were spun down for 20 min at 10,600 � g, andsupernatant was transferred to a new Eppendorf LoBind cup. Pep-tides were lyophilized and stored at �80 °C until further analysis. Priorto FTICR MS analysis, samples were reconstituted in 18 �l ofNH4HCO3, vortexed briefly, and spun down again for 10 min at10,600 � g to pellet any contaminating particulate material.
For the verification study, whole tissue lysates were prepared from20 tumor tissues from which 6 � 4-�m cryosections per sample werecut. Tissue cryosections were placed in a Teflon container, frozen inliquid N2, and then pulverized in a frozen state in a microdismembra-tor (Braun Biotech International). The resulting powder was resus-pended in 100 �l of 0.1% RapiGest. Cell lysis and trypsin digestionwere performed as described above. Prior to trypsin digestion, a BCAprotein assay (Pierce) was performed to determine protein concen-tration. From each total tissue sample, 50 �g of protein lysate wasused for trypsin digestion at a trypsin:protein ratio of 1:50 (w/w) andfurther handled as described above.
Nano-LC-FTICR MS—Nano-LC-FTICR MS was performed using aslightly modified procedure as described previously (23, 28). Eachpooled sample was analyzed in triplicate by injecting 4 �l (equivalentto �5,500 cells or �550 ng) directly via a 3-�l sample loop onto acustom-built reversed-phase (RP) 80-cm � 50-�m-inner diameterfused silica capillary column (Polymicro Technologies, Phoenix, AZ)packed in house with 3-�m C18 particles (300-Å pore size; Jupiter,Phenomenex, Torrence, CA) and subjected to an applied pressure of10,000 p.s.i. through a high pressure syringe pump (ISCO, Lincoln,NE). Flow rate over the column was � 250 nl/min. After an injectionperiod of 45 min, peptides were eluted from the column using agradient from 100% mobile phase A (99.75% H2O, 0.2% acetic acid,0.05% TFA) to �70% mobile phase B (90% acetonitrile, 9.9% H2O,0.1% TFA) over a �200-min period. The nano-LC column outlet wascoupled on line to a 7-tesla FTICR mass spectrometer through anano-ESI emitter; 4,000 mass spectra were acquired in each LC-MSanalysis using 0.3-s ion accumulation time and 50-�s gas pulse (29).
LC-MS/MS—In the verification study, tryptic digests of 20 differentwhole tissue lysates (8 OR and 12 PD) were analyzed on a custom-built RPLC system via ESI utilizing an ion funnel (30) coupled to a
ThermoFisher Scientific LTQ-Orbitrap mass spectrometer (Thermo-Fisher Scientific, San Jose, CA). Separation was performed using acustom-made column (60 cm � 75-�m inner diameter) packed inhouse with Jupiter particles (C18 stationary phase, 5-�m particles,300-Å pore size). The capillary RPLC system used for peptide sepa-rations has been described previously (23, 28). Mobile phase A con-sisted of 0.1% formic acid in water, and mobile phase B consisted of100% acetonitrile. The column was equilibrated at 10,000 p.s.i. with100% mobile phase A. A mobile phase selection valve was switched50 min after injection to create a near exponential gradient as mobilephase B displaced mobile phase A in a 2.5-ml mixer. A split was usedto provide an initial flow rate through the column of �400 nl/min. Thecolumn was coupled to the mass spectrometer using an in-housemanufactured ESI interface with homemade 20-�m-inner diameterchemically etched emitters (31). The heated capillary temperature andspray voltage were 200 °C and 2.2 kV, respectively. Mass spectrawere acquired for 80 min over the m/z range 400–2,000 at a resolvingpower of 100,000. An inclusion list with m/z values corresponding topeptide masses of 100 target proteins was used to select precursorions. In cases when no targeted precursor ion was present, a maxi-mum of six data-dependant LTQ tandem mass spectra were re-corded for the most intense peaks in each survey mass spectrum.
Protein Identification and Quantitation—FT mass spectra, acquiredwith the 7-tesla FTICR or LTQ-Orbitrap, were processed using ICR-2LS, Decon2LS (32), and VIPER v3.39 software developed in house(33). The output data files were visualized as two-dimensional dis-plays of peptide monoisotopic mass versus LC elution time (i.e.spectrum number). Next MS peaks with similar measured neutralmasses and LC elution times were clustered to form LC-MS features(or unique mass classes). LC elution times were converted into NET tomake multiple LC-MS runs comparable (34). The assembled set ofLC-MS features was then searched against the human mammaryepithelial cell line AMT tag database (35), MCF-7 epithelial breastcarcinoma cell line AMT tag database (36), and a composite databasefor a mixture of human mammary epithelial cells and MCF-7-c18,BT-474, MDA-231, and SKBR-3 breast cancer cell lines (37) usingstringent filtering criteria: Xcorr �1.5, 2.7, and 3.3 for 1�, 2�, and 3�fully tryptic peptides, respectively, and Xcorr �3.0, 3.7, and 4.5 for1�, 2�, and 3� partially tryptic peptides (with a minimum length of 6amino acids), respectively, as reported previously (23). The LCM-SWARP (liquid chromatography-based mass spectrometric warpingand alignment of retention times of peptides) algorithm (38) was usedto match LC-MS features to AMT tags. A tolerance window of massmeasurement accuracy �6 ppm and NET error �0.025 was appliedto ensure reliable peptide identification with false discovery rate of�10%. Identified peptides were coupled to their corresponding pro-teins using the human International Protein Index (IPI) databases,2006 version 3.20 including 61,255 protein entries (discovery phase)and 2008 version 3.39 including 69,731 protein entries (verificationphase), and in-house built Qrollup v2.2 software. Two or more con-stituent peptides were required to confidently identify a protein. In thecase of proteins with multiple splice isoforms, these isoformswere only specifically listed if they were identified by at least oneunique peptide (in addition to overlapping peptide sequences). Foraverage abundance calculation, only highly abundant and, wherepossible, unique peptides were used. Protein names and descriptionswere then converted to TrEMBL, NCBI (National Center for Biotech-nology Information), and Swiss-Prot database formats. Protein infor-mation was retrieved from European Molecular Biology Laboratory-European Bioinformatics Institute databases. Proteins identified fromall available AMT tag databases were assembled into a single list,giving rise to some redundancy. A final non-redundant protein list wasgenerated using ProteinProphet software (SourceForge, Inc.). MSpeak intensities were used as a measure of the relative peptide
Tamoxifen Resistance Protein Profile in Breast Cancer
1280 Molecular & Cellular Proteomics 8.6

abundances. The mean abundance of the LC-MS features was used,and the relative abundances of constituent peptides were averaged toderive the relative abundance of the parent protein.
Tandem mass spectra acquired with the LTQ-Orbitrap weresearched against the human IPI 2008 database using TurboSEQUESTv27. We used in-house developed DeconMSn software to correct themonoisotopic masses prior to generation of the dta files used forsubsequent database search. Peptide sequences were consideredconfident with the following filtering criteria: Xcorr of 1.9, 2.2, and 3.75for 1�, 2�, and �3� peptides and �Cn � 0.1. We also applied theAMT tag strategy to identify peptides in survey mass spectra acquiredwith the LTQ-Orbitrap by matching the accurate masses and elutiontimes against the composite breast cancer cell line AMT database.Peak intensities measured in high resolution survey spectra wereused to retrieve relative abundance information as described above.
Immunohistochemistry—Immunohistochemical validation was per-formed with an in-house prepared TMA. The TMA was established inclose collaboration with a dedicated pathologist (M. A. d. B.) whoevaluated all tissues for histology, grade, and Bloom and Richardsonscoring (39). Tissue sections of 4 �m were stained overnight at 4 °Cfor EMMPRIN using a 1:100 diluted antibody directed against the Cterminus of the protein (8D6, sc-21746, Santa Cruz Biotechnology,Inc., Santa Cruz, CA). Antigen retrieval was performed prior to anti-body incubation for 40 min at 95 °C using DAKO retrieval solution, pH6 (DakoCytomation, Carpinteria, CA) after which the slides werecooled down to room temperature. Staining was visualized using theanti-mouse EnVision�� System-HRP (DAB) (DakoCytomation) ac-cording to the instructions provided by the manufacturer. Scoringof immunostaining was performed by two independent observerswho recorded both percentage of positive tumor cells and stainingintensity.
Data Analysis and Statistics—Relative abundance levels of all iden-tified proteins in one sample were intra- and intersample normalizedby log2 transformation using in-house developed MultiAlign softwarev1.1. Subsequently Z-score normalization was applied to each pro-tein across the samples using the formula (value � mean)/standarddeviation. Sample sets 1 and 2 were separately Z-score-normalizedto correct for time and experimental variation. Normalized valueswere subjected to class comparison and prediction analysis usingBRB-ArrayTools version 3.5.0 beta1 developed by Dr. Richard Simonand Amy Peng Lam. Class comparison involved finding differentiallyabundant proteins between therapy-sensitive (OR) and therapy-resis-tant (PD) tumors using a univariate two-sample t test with a signifi-cance threshold of 0.05. All data from sample sets 1 and 2 werecombined to create a general list of differentially abundant proteinsbetween OR and PD tumors and subjected to a Mann-Whitney Wil-coxon rank sum test performed with the STATA statistical package,release 10.0 (STATA, College Station, TX).
Hierarchical clustering of the data was performed using the OmniVizDesktop 3.8.0 package. For clustering, average linkage and the Euclid-ian similarity metric were used. Principal component analysis (PCA) wasperformed using Spotfire DecisionSite 8.1, version 14.3.
Kaplan-Meier survival analysis as a function of time to progressionafter the onset of first line tamoxifen treatment as well as correlationwith response and other clinical parameters was performed usingSTATA. The primary end point for the Cox proportional hazard modelwas disease progression after the onset of tamoxifen treatment.
RESULTS
Protein Identification by Nano-LC-FTICR MS—Large scaleprotein identification is a pivotal step in the discovery of apredictive protein profile. We have previously shown thatnano-LC-FTICR MS coupled to AMT tag-based protein iden-
tification provides the sensitivity and proteome coverage re-quired to achieve this goal (23). In the present study, wedescribe the clinical applicability of this approach by analyz-ing the proteome of eight pools of tumor cells procured byLCM from breast cancer tissues derived from 24 tamoxifentherapy-sensitive and 27 therapy-resistant patients. Fig. 1summarizes our study design.
Tryptic peptides corresponding to �550 ng of protein lysatewere analyzed using nano-LC-FTICR MS. Resulting data setswere visualized in a form of a two-dimensional plot, displayingmonoisotopic mass versus spectrum number (NET) as shownin supplemental Fig. 1. On average �40,000 LC-MS featureswere detected in each analysis. These features were matchedagainst previously established breast (cancer) cell line AMTtag databases. On average, �20% of LC-MS featuresmatched with peptides in the database and were thus iden-tified as illustrated in supplemental Fig. 1B.
For this study, two sample sets were independently pre-pared and analyzed, using a different set of tumors, as shownin Fig. 2. Sample set 1 consisted of 24 tumors of which 11were sensitive (OR) and 13 were resistant (PD) to tamoxifentreatment. Sample set 2 contained 27 tumors, 13 OR and 14PD tissues. Microdissected cells were pooled to averagesample heterogeneity and to enable triplicate analysis andwere analyzed by nano-LC-FTICR MS. Replicate MS analy-ses, for which technical problems such as clogged tips wereobserved, were excluded from further data analysis, leaving19 LC-MS data sets for further analysis (Table I). In total,17,263 peptides corresponding to 2,556 proteins were iden-tified through AMT tag database matching. Between the twosample sets 1,713 proteins, identified by 13,729 peptides,were identical, corresponding to an overlap of 67% (Table I).Protein abundance was computed by averaging intensities ofthe highly abundant peptides identified for the given proteinand, where possible, using unique peptide sequences to ac-count for multiple splice isoforms. It needs to be mentionedthat it is difficult to correctly assess average protein abun-dance of highly homologous proteins that may have differentabundance levels if these proteins are identified through iden-
Laser capture microdissection
On-line ESI coupling
Cell lysis and trypsin digestion
Automated data processing
Primary tumor tissue
Enriched tumor cells
nLC peptide separation
FTICR MS
AMT tag DB search
Filtering
Protein identification
FIG. 1. Experimental flow chart. All steps from sample prepara-tion, MS analysis, and protein identification are described in the text.nLC, nano-LC; DB, database.
Tamoxifen Resistance Protein Profile in Breast Cancer
Molecular & Cellular Proteomics 8.6 1281

tical peptides. In those cases, the additional use of uniquepeptide sequences may partly overcome this problem. Infor-mation on protein identification, such as filtering scores, as-signed peptides and number of peptides used for abundance,mass and NET errors, and additional information is reported insupplemental Table S1. Normalized protein abundances for1,713 proteins are displayed in supplemental Table S2.
Discovery of Tamoxifen Therapy Response-associated Pro-teins—For the discovery of proteins that were associated withtamoxifen resistance, the 1,713 overlapping proteins weresubjected to statistical analysis. The univariate two-sample ttest from BRB-ArrayTools was used to search for differentiallyabundant proteins between OR and PD samples (Fig. 2).Protein abundances from all OR and PD samples from the two
sample sets were analyzed together and compared with eachother. The BRB analysis resulted in a list of 153 discriminatingproteins using a significance threshold of p � 0.05 (the com-plete BRB analysis list is provided in supplemental Table S3).These 153 proteins were subsequently subjected to a Wilc-oxon rank sum test, which narrowed the list down to 100proteins with a p value �0.05. These 100 differentially abun-dant proteins were designated as a putative protein profileassociated with the type of response to tamoxifen therapy. Inthis putative protein profile, 46 proteins had higher relativeabundance in PD, and 54 had higher abundance in OR tis-sues. Protein information as well as OR:PD ratios and p valuesare listed in Table II in which the order and numbering ofproteins corresponds to the order in Fig. 4. Our top discrim-
1. Methodology
Triplicate FTICR MS analysis, 500 ng tryptic digest on 50 µm x 80 cm C18-column
Sample set 1, n=24 Sample set 2, n=27
11 OR 13 PD 13 OR 14 PD
6 76 5 6 7
Pool 1
7 7
Pool 3Pool 1 Pool 3 Pool 4Pool 4Pool 2Pool 2
Hierarchical clustering + prediction
2. Discovery
t-test and Wilcoxon ranking �100 discriminatory proteins
BRB univariate t-test on 1713 overlapping proteins (P< 0.05)
4. Validation
OR set 1+ 2 PD set 1+ 2
3. Verification
8 OR, 12 PD
Total tissue protein lysates
nLC-MS/MS using inclusion list of peptide masses from 100 proteins
Verification of 50 proteins (MS/MS) quantification of 47 proteins (MS)
IHC validation of top discriminating protein, EMMPRIN, on TMA: 156 tam advanced tissues
Survival analysis
FIG. 2. Data analysis flow chart.Tryptic digests from two independentlyprocessed sample sets were analyzed intriplicate by nano-LC-FTICR. MS peakintensity-derived peptide/protein abun-dances were subjected to statisticalanalysis to determine differentially abun-dant proteins between OR and PD sam-ples in both sample sets combined aswell as in the two samples sets sepa-rately. Subsequently hierarchical clus-tering and class prediction was per-formed. nLC, nano-LC.
TABLE IFTICR MS summary
Peptide and protein information for LC-MS analyses that were used for further statistical analysis are summarized for sample set 1, set 2,the combined set, and the overlap.
Data set Tumor set 1 Tumor set 2 Total Overlap sets 1 � 2
Number of analyzed samples 5 OR; 4 PD 5 OR; 5 PD 10 OR; 9 PDTotal unique peptides 14,933 16,059 17,263 13,729Total unique proteins 1,998 2,271 2,556 1,713 (67%)
Tamoxifen Resistance Protein Profile in Breast Cancer
1282 Molecular & Cellular Proteomics 8.6

TABLE IITamoxifen-response protein profile
Name, ratio, p value, IPI number, molecular mass, localization are given on the putative 100-protein profile. The order and numbering areidentical to Fig. 4. EPH, ephrin; snRNA, small nucleolar RNA; GDNF, glial cell-derived neurotrophic factor.
No.a Protein description
Ratio ofgeometric
means,OR:PD
Wilcoxonrank sum IPI Gene symbol Molecular
mass Localizationb
kDa
1 EPH receptor B2 0.458 0.0057 IPI00252979.7 EPHB2 (ERK, EPTH3) 110 Membrane2 Splice isoform 1 of protein kinase
C and casein kinase substrate inneurons protein 2
0.538 0.0366 IPI00027009.2 PACSIN2 56 Cytoplasm
3 40 S ribosomal protein S4, Xisoformc,d
0.478 0.0412 IPI00217030.5 RPS4X (SCAR) 29 Ribosome
4 Calponin-2c 0.478 0.0134 IPI00015262.9 CNN2 33.5 Cytoskeleton5 Calgranulin Bc,d 0.483 0.0127 IPI00027462.1 S100A9 (CAGB, MRP14) 13 Cytoplasm6 Anchor attachment protein 1 0.513 0.047 IPI00021594.2 GPAA1 68 ER7 Epididymal secretory protein E1
precursor0.54 0.0085 IPI00301579.3 NCP2 16.5 Secreted protein
8 Pyrroline-5-carboxylatereductase 1c,d
0.49 0.0274 IPI00550882.2 PYCR1 (P5CR1) 33 u
9 Nucleolar protein NOP5c 0.453 0.0202 IPI00006379.1 NOP5 (HSPC120) 60 Nucleus10 Annexin A8 0.394 0.0127 IPI00218835.4 ANXA8 (ANX8) 37 u11 Lysyl-tRNA synthetasec,d 0.539 0.0127 IPI00014238.2 KARS (KIAA0070) 68 Cytoplasm12 Syntaxin 7 0.484 0.0338 IPI00289876.2 STX7 30 Endosome13 Splice isoform 2 of basigin
precursore0.342 0.0004 IPI00019906.1 BSG (EMMPRIN, CD147) 42 Cell membrane
14 FLJ20625 protein 0.457 0.0411 IPI00016670.2 FLJ20625 18 u15 Eukaryotic translation initiation
factor 50.491 0.003 IPI00022648.2 EIF5 49 Cytosol
16 Splice isoform 1 of Surfeit locusprotein 4c,d
0.449 0.0097 IPI00005737.1 SURF4 30 ER
17 Splice isoform 1 of calumeninprecursorc,d
0.514 0.0222 IPI00014537.1 CALU 38 ER/Golgi
18 Coronin-1Ac,d 0.507 0.0179 IPI00010133.1 CORO1A (CLIPINA) 51 Actin cytoskeleton19 RAS-related protein RAB-10c 0.516 0.0412 IPI00016513.3 RAB10 22.5 Cell membrane20 Splice isoform long of potential
phospholipid-transportingATPase IIA
0.519 0.0221 IPI00024368.1 ATP9A (ATPIIA, KIAA0611) 119 Membrane
21 DNA replication licensing factorMCM2
0.528 0.0292 IPI00184330.5 MCM2 (BM28, CDCL1,KIAA0030)
102 Nucleus
22 Splice isoform long of splicingfactor, proline- andglutamine-richc,d
0.475 0.0179 IPI00010740.1 SFPQ (PSF) 76 Nucleus
23 Collagen-binding protein 2precursorc,d
0.534 0.0114 IPI00032140.2 SERPINH1 (SERPINH2,CBP2, HSP47, Colligin)
46 ER
24 Small nuclear ribonucleoproteinSM D2c,d
0.495 0.0412 IPI00017963.1 SNRPD2 (Sm-D2) 13.5 Nucleus
25 4F2 cell surface antigen heavychainc,d
0.546 0.05 IPI00027493.1 SLC3A2 (MDU1) 58 Membrane
26 Growth factor receptor-boundprotein 7
0.483 0.038 IPI00448767.3 GRB7 60 u
27 Copine I 0.507 0.0221 IPI00018452.1 CPNE1 (CPN1) 59 u28 Serum amyloid A protein precursor 0.442 0.0055 IPI00022368.1 SAA1 (SAA2) 13.5 u29 Ephrin type-A receptor 2 precursor 0.503 0.0221 IPI00021267.1 EPHA1 (ECK) 108 Membrane30 T-complex protein 1, � subunitc,d 0.492 0.05 IPI00018465.1 CCT7 (TCP-1�, CCTH) 59 Cytoplasm31 Guanine nucleotide-binding protein
� subunit 4c,d0.53 0.0403 IPI00012451.1 GNB4 37 u
32 Metalloprotease 1 0.494 0.022 IPI00219613.3 PITRM1 (hMP1) 117 Mitochondrion33 C-1-Tetrahydrofolate synthase,
cytoplasmicc0.485 0.0275 IPI00218342.9 MTHFD1 (MTHFC) 101 Cytoplasm
34 Predicted: septin 8 0.54 0.0179 IPI00022082.4 SEPT8 (KIAA0202) 50 u35 Acetolactate synthase homolog 0.465 0.0135 IPI00549240.1 OR10B1P (ILVBL) 68 u36 Predicted: hypothetical protein
XP_1143170.511 0.0085 IPI00145623.1 RPL22L1 15–21 u
37 Prefoldin subunit 6 0.512 0.0395 IPI00005657.1 PFDN6 (HKE2) 14.5 Cytosol38 NADH-cytochrome b5 reductasec,d 0.395 0.0071 IPI00328415.8 CYB5R3 (DIA1) 34 ER/mitochondrion/
cytoplasm
Tamoxifen Resistance Protein Profile in Breast Cancer
Molecular & Cellular Proteomics 8.6 1283

TABLE II—continued
No.a Protein description
Ratio ofgeometric
means,OR:PD
Wilcoxonrank sum IPI Gene symbol Molecular
mass Localizationb
39 Adenylate kinase isoenzyme 4,mitochondrial
0.428 0.0036 IPI00016568.1 AK3L1 (AK3, AK4) 25 Mitochondrion
40 Phosphoprotein enriched inastrocytes 15c
0.481 0.0363 IPI00014850.3 PEA15 (PED) 15 Cytoplasm
41 Thioredoxin domain-containingprotein 5
0.51 0.0496 IPI00171438.2 TXNDC5 (TLP46, ERp46) 48 ER
42 Coronin-1Bc,d 0.425 0.0055 IPI00007058.1 CORO1B 54 Leading edge43 Ephrin type-B receptor 3 precursor 0.455 0.0077 IPI00289329.1 EPHB3 (ETK2, HEK2) 110 Membrane44 RAB11 family-interacting
protein 1Bc0.518 0.0191 IPI00419433.1 RAB11 FIP1 (RCP) 137 Membrane
45 Splice isoform 1 of exocystcomplex component SEC6
0.467 0.0231 IPI00157734.2 EXOC3 (SEC6, SEC6L1) 87 u
46 Splice isoform 1 of proteinC20ORF116 precursor
0.54 0.0266 IPI00028387.3 C20ORF116 36 Secreted protein
47 Hypothetical proteinDKFZP434E248
0.525 0.0221 IPI00300094.5 LSG1 75 u
48 Adenylate kinase 2 isoform Ac,d 2.036 0.0338 IPI00215901.1 AK2 (ADK2) 26 Mitochondrion49 Trifunctional enzyme � subunit,
mitochondrial precursorc,d2.105 0.0071 IPI00031522.2 HADHA (HADH) 83 Mitochondrion
50 Nucleosome assembly protein1-like 1c,d
1.847 0.0275 IPI00023860.1 NAP1L1 (NRP) 45 Nucleus
51 Secretory carrier-associatedmembrane protein 1
2.301 0.0055 IPI00005129.6 SCAMP1 40 Membrane
52 Sphingosine-1-phosphate lyase 1d 1.924 0.0135 IPI00099463.2 SGPL1 64 ER membrane53 Splice isoform 1 of glucosamine-
fructose-6-phosphateaminotransferase(isomerizing) 1c,d
2.377 0.0101 IPI00217952.6 GFPT1 (GFAT) 79 u
54 Ubiquinol-cytochrome c reductaseiron-sulfur subunit, mitochondrialprecursorc,d
1.991 0.0236 IPI00026964.1 UQCRFS1 30 Mitochondrion
55 U6 snRNA-associated SM-likeprotein LSM2
1.906 0.0394 IPI00032460.3 LSM2 (G7B) 10 Nucleus
56 Lisch protein, isoform 2 2.178 0.0084 IPI00409640.1 LSR (LISCH) 71 Membrane57 Splice isoform 1 of epsin 4 2.385 0.0064 IPI00291930.5 CLINT1 (EPN4) 68 Cytoplasm58 Endothelial protein C receptor
precursor1.932 0.0178 IPI00009276.1 PROCR (EPCR) 30 Membrane
59 Annexin VI isoform 2c,d 2.035 0.0114 IPI00002459.3 ANXA6 75 u60 Pyridoxine-5�-phosphate oxidase 2.081 0.0238 IPI00018272.3 PNPO 30 u61 Ectonucleotide pyrophosphatase/
phosphodiesterase 1d2.087 0.0193 IPI00184311.2 ENPP1 (NPPS, PC1) 105 Membrane
62 Protein C20ORF178, chargedmultivesicular body protein 4bc,d
1.997 0.0275 IPI00025974.3 CHMP4B (SHAX1) 25 Cytoplasm
63 Occludind 1.848 0.0178 IPI00003373.1 OCLN 59 Membrane64 Adipose most abundant gene
transcript 2c2.099 0.0141 IPI00020017.1 APM2 (C10ORF116) 8 u
65 Eukaryotic translation initiationfactor 3 subunit 4
2.413 0.0062 IPI00290460.3 EIF3F 36 u
66 Hypothetical protein MGC5395c,d 1.896 0.05 IPI00031605.1 AHNAK 16 u67 Splice isoform 2 of
methylcrotonoyl-CoACarboxylase � chain,mitochondrial precursor
1.902 0.0066 IPI00294140.4 MCCC2 (MCCB) 58 Mitochondrion
68 Tubulin �-3 chainc,d 1.907 0.009 IPI00013683.2 TUBB3 (TUBB4) 50 u69 KIAA2014 protein (formin-like
protein 1)2.091 0.0236 IPI00385874.4 KIAA2014 117 u
70 Hypothetical protein FLJ90697 2.348 0.0377 IPI00329600.3 u71 Hypothetical protein, isoform 1 of
protein CDV3 homolog1.986 0.0193 IPI00014197.1 CDV3 22–27 u
72 ATP synthase oligomycinsensitivity conferral protein,mitochondrial precursorc,d
2.153 0.0179 IPI00007611.1 ATP5O (ATPO) 23 Mitochondrion
73 Ubiquilin-2 1.843 0.0412 IPI00409659.1 UBQLN2 (PLIC2) 66 Cytoplasm/nucleus74 Ubiquitin and ribosomal protein
S27Ac,d2.273 0.0071 IPI00179330.5 RP27A 18 Ribosome
75 Tubulin �-1 chainc,d 1.953 0.0222 IPI00007750.1 TUBA1 50 u
Tamoxifen Resistance Protein Profile in Breast Cancer
1284 Molecular & Cellular Proteomics 8.6

inating protein in the putative protein profile was splice iso-form 2 of basigin precursor (number 13 in Table II), alsodescribed in the literature as CD147 or EMMPRIN.
Multiple isoforms of EMMPRIN have been described thatare identical in their C-terminal sequence but vary in lengthand sequence at the N-terminal part of the protein (Entrez-Gene 682). In our final, non-redundant protein list we report
the identification of isoforms 1 and 2 by five and six peptides,respectively (supplemental Table S1). Only one of the sixpeptides (AAGTVFTTVEDLGSK) was unique for isoform 2.Isoform 1 is the longer variant of 385 amino acids, whereasisoform 2 lacks amino acids 24–139. Peptide AAGTVFTTV-EDLGSK is uniquely positioned at the splice site in which thefirst two amino acids (AA) are positioned at residues 22 and 23
TABLE II—continued
No.a Protein description
Ratio ofgeometric
means,OR:PD
Wilcoxonrank sum IPI Gene symbol Molecular
mass Localizationb
76 ATP synthase � chain,mitochondrial precursorc,d
1.947 0.0412 IPI00440493.2 ATP5O (ATPO) 60 Mitochondrion
77 Chaperonin containing TCP1,subunit 3c,d
1.872 0.0412 IPI00290770.2 CCT3 60 Cytoplasm
78 Nascent polypeptide-associatedcomplex � subunitc,d
2.159 0.0143 IPI00023748.3 NACA (HSD48) 23 Cytoplasm/nucleus
79 Emerin 2.189 0.0178 IPI00032003.1 EMD 29 Nuclear innermembrane
80 Hypothetical protein KIAA0152c,d 1.974 0.0412 IPI00029046.1 KIAA0152 32 Membrane81 Histone H1.5c,d 2.533 0.05 IPI00217468.2 HIST1H1B (H1F5) 23 Nucleus82 Cation channel TRPM4B 2.03 0.0465 IPI00294933.6 TRPM4B (TRPM4) 134 Membrane83 Calcyclinc,d 2.122 0.0363 IPI00027463.1 S100A6 (CACY) 10 Cytoplasm/nucleus84 Splice isoform 2 of GDNF family
receptor � 1 precursor2.26 0.0184 IPI00220291.1 GFRA1 (GDNFRA, TRNR1) 51 Cell membrane
85 Complement component 1, Qsubcomponent-binding protein,mitochondrial precursorc,d
2.222 0.0274 IPI00014230.1 C1QBP (GC1QBP) 31 Mitochondrion
86 Chloride intracellular channelprotein 4c,d
2.023 0.0275 IPI00001960.2 CLIC4 29 Cytoplasm/mitochondrion
87 Eukaryotic translation initiationfactor 3 subunit 6c,d
2.076 0.0178 IPI00013068.1 EIF3E (INT6) 52 Cytoplasm
88 Protein-disulfide isomerase A4precursorc,d
2.157 0.0275 IPI00009904.1 PDIA4 (ERP70) 73 ER
89 Hypothetical protein MGC5352c,d 1.867 0.0394 IPI00063242.3 PGAM5 28 u90 Splice isoform 1 of polypeptide
N-acetylgalactosaminyl-transferase 3d
2.229 0.0066 IPI00004670.1 GALNT3 73 Golgi
91 OTTHUMP00000028732(thioredoxin, mitochondrialprecursor)
1.823 0.0462 IPI00017799.3 TXN2 (TRX2) 18–22 Mitochondrion
92 Fatty acid-binding protein,epidermal
2.203 0.0075 IPI00007797.1 FABP5 15 Cytoplasm
93 Programmed cell death6-interacting protein,PDCD6IP proteinc,d
2.202 0.0199 IPI00246058.3 PDCD6IP (AIP1) 97 Cytoplasm
94 Ezrin-radixin-moesin-bindingphosphoprotein 50c,d
2.42 0.0025 IPI00003527.3 SLC9A3R1 (EBP50,NHERF1)
39 Intracytoplasmicmembrane,actincytoskeleton
95 Splice isoform 1 of ubiquitinthiolesterase protein
1.974 0.05 IPI00549574.2 OTUB1 u
96 Endozepinec,d 2.184 0.0211 IPI00010182.3 ACBP (DBI, EZ) 10 u97 Phosphoribosylformylglycinamidine
synthase2.221 0.0177 IPI00004534.3 PFAS (KIAA0361) 145 Cytoplasm
98 Histidine triad nucleotide-bindingprotein 1c
1.853 0.0274 IPI00239077.4 HINT1 (PKCI1) 14 Cytoplasm/nucleus
99 BAG family molecular chaperoneregulator-3
1.97 0.0175 IPI00000644.3 u
100 Exocyst complex componentSEC8d
1.856 0.0109 IPI00059279.5 EXOC4 (KIAA1699, SEC8) 110 u
a Numbering according to Fig. 4.b u, data unknown in database; ER, endoplasmic reticulum.c Presence verified in individual tumors by MS/MS.d Presence verified in individual tumor MS survey spectrum and quantified by AMT database match.e Validated by immunohistochemistry.
Tamoxifen Resistance Protein Profile in Breast Cancer
Molecular & Cellular Proteomics 8.6 1285

and the third amino acid (Gly) is positioned at residue 140 inthe full-length sequence. Therefore, this peptide sequence isspecific for isoform 2. The raw mass spectrum for EMMPRINpeptide AAGTVFTTVEDLGSK (Mr 1,496.75 and m/z
748.38) showed a 3-fold higher intensity for the PD sample(Fig. 3B) in comparison with the OR sample (Fig. 3A). Thespectra also showed that there is no significant difference inpeak intensity between OR and PD for the second featureappearing at m/z 749.76, suggesting that the observed differ-ence in peak intensity for the AAGTVFTTVEDLGSK peptide isnot an artifact introduced by e.g. loading differences. It needsto be mentioned, however, that we did not use single spectrato determine abundance ratios of peptides but LC-MS featureintensity, which is defined as a sum of intensities of all mem-bers of the unique mass class. Using LC-MS feature intensity,we investigated the relative abundance of three EMMPRINpeptides across all of the samples. The peptides AAGTVFT-TVEDLGSK and GGVVLKEDALPGQK were present in virtuallyall samples and clearly showed a 2–3-fold increase in abun-dance in PD samples. SESVPPVTDWAWYK peptide was onlypresent in a few samples but showed the same increase in PD(Fig. 3C). This increase in relative peptide abundance there-fore correlated very well with the observed 2-fold increase ofEMMPRIN at the protein level (Fig. 3D).
To test the predictive power of the putative profile of 100proteins within the two sample sets, supervised hierarchicalclustering was performed, represented as a tree-shapeddendrogram (Fig. 4). Vertically the different proteins arelisted numbered from 1 to 100 from top to bottom. Horizon-tally the different samples are listed. Based on their averagerelative abundances, OR and PD samples were effectivelyseparated from each other as illustrated by the two mainclusters in the dendrogram (Fig. 4). Separation of the sam-
ples was based on higher (red) and lower (blue) than medianabundance of each protein within all samples. Furthermorethe length of the dendrogram arms shows that some sam-
FIG. 3. EMMPRIN differential pep-tide and protein abundance. Repre-sentative mass spectra of an LC-MS fea-ture identified as EMMPRIN peptideAAGTVFTTVEDLGSK in OR (A) and PD(B) indicate a 3-fold increase in intensityfor PD sample. C, relative abundanceratios of four EMMPRIN peptides in OR(gray) and PD (black) samples. D, aver-age relative abundance of EMMPRINprotein in all OR and PD samples. pvalue was calculated using the Wilcoxonrank sum test. Box-Whisker plot in whicheach dot represents the value of a sam-ple, and the error bars show the highestand lowest value. The line in the boxrepresents the mean value.
FIG. 4. Hierarchical clustering of OR and PD samples. Red andblue colors indicate relative high and low protein abundance, respec-tively, and white equals median abundance. Gray bars representsample and protein clusters. The length of the tree arms is inverselycorrelated with similarity. Proteins are listed vertically from top tobottom and numbered from 1 to 100 in the same order as in Table II.
Tamoxifen Resistance Protein Profile in Breast Cancer
1286 Molecular & Cellular Proteomics 8.6
ples (replicates) show more similarity to each other than tothe rest of the samples as expected. The order of theproteins numbered from 1 to 100 is identical to the orderand numbering in Table II.
Similar results were obtained by PCA (supplemental Fig. 2).In the PCA complex information is reduced to three principalcomponents, represented by the x, y, and z axes. Samples arevisualized in a three-dimensional plot and cluster according totheir relative protein abundance. From this PCA it is clear that,in this sample set, OR (green squares) and PD samples (redsquares) were completely separated from each other basedon their protein abundance profile.
To verify that individual peptides showed differential abun-dance similar to that of their corresponding proteins, we per-formed hierarchical clustering on all peptides correspondingto the putative 100-protein profile. As expected, clusteringbased on peptides resembled the results of protein clustering(data not shown).
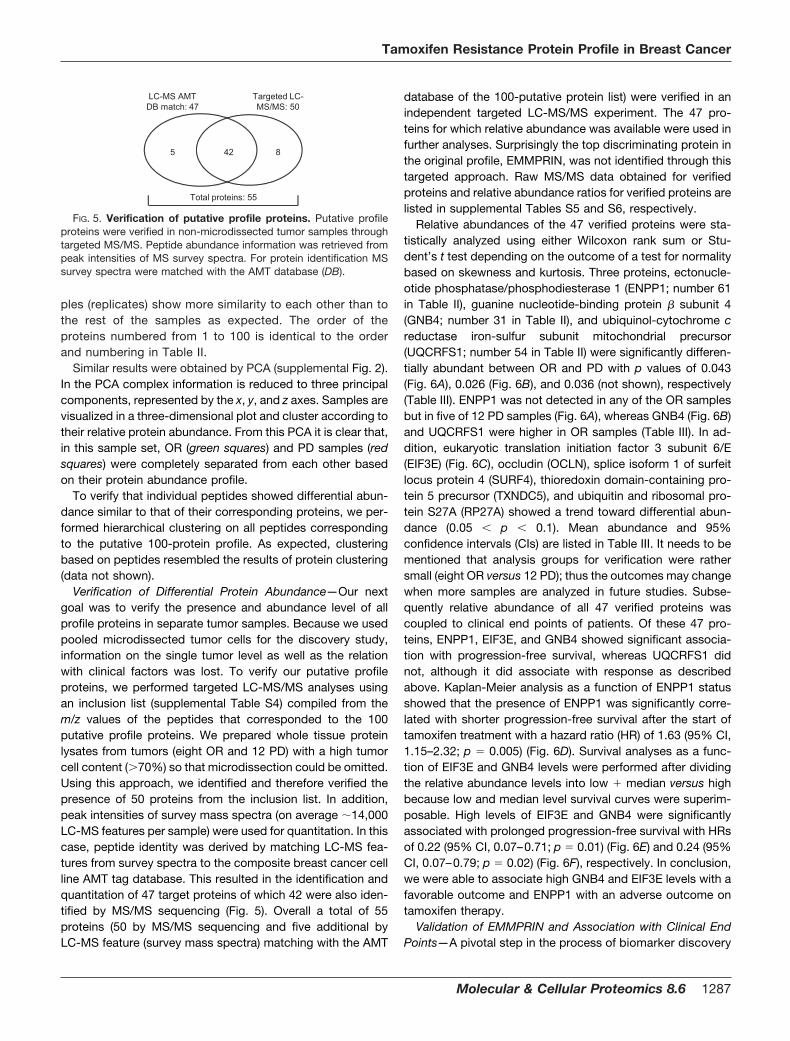
Verification of Differential Protein Abundance—Our nextgoal was to verify the presence and abundance level of allprofile proteins in separate tumor samples. Because we usedpooled microdissected tumor cells for the discovery study,information on the single tumor level as well as the relationwith clinical factors was lost. To verify our putative profileproteins, we performed targeted LC-MS/MS analyses usingan inclusion list (supplemental Table S4) compiled from them/z values of the peptides that corresponded to the 100putative profile proteins. We prepared whole tissue proteinlysates from tumors (eight OR and 12 PD) with a high tumorcell content (�70%) so that microdissection could be omitted.Using this approach, we identified and therefore verified thepresence of 50 proteins from the inclusion list. In addition,peak intensities of survey mass spectra (on average �14,000LC-MS features per sample) were used for quantitation. In thiscase, peptide identity was derived by matching LC-MS fea-tures from survey spectra to the composite breast cancer cellline AMT tag database. This resulted in the identification andquantitation of 47 target proteins of which 42 were also iden-tified by MS/MS sequencing (Fig. 5). Overall a total of 55proteins (50 by MS/MS sequencing and five additional byLC-MS feature (survey mass spectra) matching with the AMT
database of the 100-putative protein list) were verified in anindependent targeted LC-MS/MS experiment. The 47 pro-teins for which relative abundance was available were used infurther analyses. Surprisingly the top discriminating protein inthe original profile, EMMPRIN, was not identified through thistargeted approach. Raw MS/MS data obtained for verifiedproteins and relative abundance ratios for verified proteins arelisted in supplemental Tables S5 and S6, respectively.
Relative abundances of the 47 verified proteins were sta-tistically analyzed using either Wilcoxon rank sum or Stu-dent’s t test depending on the outcome of a test for normalitybased on skewness and kurtosis. Three proteins, ectonucle-otide phosphatase/phosphodiesterase 1 (ENPP1; number 61in Table II), guanine nucleotide-binding protein � subunit 4(GNB4; number 31 in Table II), and ubiquinol-cytochrome creductase iron-sulfur subunit mitochondrial precursor(UQCRFS1; number 54 in Table II) were significantly differen-tially abundant between OR and PD with p values of 0.043(Fig. 6A), 0.026 (Fig. 6B), and 0.036 (not shown), respectively(Table III). ENPP1 was not detected in any of the OR samplesbut in five of 12 PD samples (Fig. 6A), whereas GNB4 (Fig. 6B)and UQCRFS1 were higher in OR samples (Table III). In ad-dition, eukaryotic translation initiation factor 3 subunit 6/E(EIF3E) (Fig. 6C), occludin (OCLN), splice isoform 1 of surfeitlocus protein 4 (SURF4), thioredoxin domain-containing pro-tein 5 precursor (TXNDC5), and ubiquitin and ribosomal pro-tein S27A (RP27A) showed a trend toward differential abun-dance (0.05 � p � 0.1). Mean abundance and 95%confidence intervals (CIs) are listed in Table III. It needs to bementioned that analysis groups for verification were rathersmall (eight OR versus 12 PD); thus the outcomes may changewhen more samples are analyzed in future studies. Subse-quently relative abundance of all 47 verified proteins wascoupled to clinical end points of patients. Of these 47 pro-teins, ENPP1, EIF3E, and GNB4 showed significant associa-tion with progression-free survival, whereas UQCRFS1 didnot, although it did associate with response as describedabove. Kaplan-Meier analysis as a function of ENPP1 statusshowed that the presence of ENPP1 was significantly corre-lated with shorter progression-free survival after the start oftamoxifen treatment with a hazard ratio (HR) of 1.63 (95% CI,1.15–2.32; p 0.005) (Fig. 6D). Survival analyses as a func-tion of EIF3E and GNB4 levels were performed after dividingthe relative abundance levels into low � median versus highbecause low and median level survival curves were superim-posable. High levels of EIF3E and GNB4 were significantlyassociated with prolonged progression-free survival with HRsof 0.22 (95% CI, 0.07–0.71; p 0.01) (Fig. 6E) and 0.24 (95%CI, 0.07–0.79; p 0.02) (Fig. 6F), respectively. In conclusion,we were able to associate high GNB4 and EIF3E levels with afavorable outcome and ENPP1 with an adverse outcome ontamoxifen therapy.
Validation of EMMPRIN and Association with Clinical EndPoints—A pivotal step in the process of biomarker discovery
425 8
LC-MS AMT DB match: 47
Targeted LC-MS/MS: 50
Total proteins: 55
FIG. 5. Verification of putative profile proteins. Putative profileproteins were verified in non-microdissected tumor samples throughtargeted MS/MS. Peptide abundance information was retrieved frompeak intensities of MS survey spectra. For protein identification MSsurvey spectra were matched with the AMT database (DB).
Tamoxifen Resistance Protein Profile in Breast Cancer
Molecular & Cellular Proteomics 8.6 1287

is the validation of putative markers in independent patientcohorts and preferably by using a different methodology,such as using immunohistochemistry (IHC). In our case,validation was only performed for the top discriminatingprotein, EMMPRIN, because there are no appropriate anti-bodies available for ENPP1, EIF3E, and GNB4 or for any of
the other differentially abundant proteins we discovered.The antibody we used in this study was directed against theC-terminal part of EMMPRIN and therefore recognizes allsplice isoforms.
To independently validate differential EMMPRIN proteinabundance between OR and PD patients, IHC was performed
GNB4
OR PD0
100
200Av
g ab
unda
nce p=0.026
EIF3E
OR PD0
5
10
Avg
Abun
danc
e
p=0.085
OR PD0
4
8
Avg
abun
danc
e
p=0.043
ENPP1
abspres
At risk:155
30
10
00
Cum
sur
viva
l (%
)
P= 0.005, HR 1.63, 95% CI [1.15 - 2.32]
time (months)0 604020
100
5075
25
0
4020 60
6 2 1 014 1 0 0
At risk:lowhigh
100
5075
25
time (months)C
um s
urvi
val (
%)
00
60
high 6 2 1 014 1 0 0
At risk: time (months)low
P= 0.02, HR 0.24, 95% CI [0.07 - 0.79]
4020
100
50
75
25
Cum
sur
viva
l (%
)
00
FIG. 6. Clinical association of veri-fied proteins. Differences in relativeabundance ratios between OR (red) andPD (green) tumors for ENPP1 (A), GNB4(B), and EIF3E (C) are shown. Shown isthe Kaplan-Meier survival analysis oftime to progression upon tamoxifentreatment for recurrent breast cancerpatients according to LC-MS abundancelevels. For ENPP1, absence (abs) (greenline) and presence (pres) (red line) ofabundance was compared (D). ForGNB4 (E) and EIF3E (F) low abundanceand medium abundance were grouped(green line) and compared with highabundance (red line). The number of pa-tients at risk in each group is displayedtogether with the hazard ration, 95%confidence interval, and p value. Avg,average; Cum, cumulative; CI, confi-dence interval.
TABLE IIIVerified differentially abundant proteins
Shown are a subset of putative profile proteins verified in targeted MS/MS experiment with a p value �0.1.
Protein descriptionGene
symbolHigher in � mean/median (95% CI) p value
Guanine nucleotide-binding protein � subunit 4 GNB4 OR �35.1 (�65.2 to �4.8) 0.026Ubiquinol-cytochrome c reductase iron-sulfur
subunit, mitochondrial precursorUQCRFS1 OR �31.6 (�61.0 to �2.3) 0.036
Ectonucleotide pyrophosphatase/phosphodiesterase 1a
EPP1 PD 0 (0–1.3) 0.043
Thioredoxin domain-containing protein 5 precursora TXNDC5 PD 2.8 (�0.02 to 20.3) 0.081Eukaryotic translation initiation factor 3 subunit 6 EIF3E OR �2.2 (�4.8 to 0.3) 0.085Occludina OCLN OR 0 (�1.6 to 0) 0.087Splice isoform 1 of O15260 Surfeit locus protein 4 SURF4 PD 3.7 (�0.8 to 8.3) 0.098Ribosomal protein S27A RP27A OR �168.1 (�376.3 to 40.2) 0.100
a Wilcoxon rank sum.
Tamoxifen Resistance Protein Profile in Breast Cancer
1288 Molecular & Cellular Proteomics 8.6

using our primary breast cancer TMA. Among the differenttissues, there were 156 breast tumors of patients who re-ceived first line tamoxifen therapy after recurrence. This set oftumors had no overlap with the discovery set tumors. In total,130 tumors showed reproducible IHC staining on the TMAwhen assays were performed in triplicate. Patient and tumorcharacteristics are described in Table IV. Different stainingoutcomes were categorized as undetectable, weak, medium,and strong membrane staining. Weak membrane staining,present in �10% of tumor cells, was scored as 1�. Mediummembrane staining, present in 10–50% of tumor cells, wasscored as 2�. Strong membrane staining, observed in �50%of tumor cells, was assigned score 3� (Fig. 7). These scoringoutcomes were subsequently related to clinical endpoints. Weobserved that none of the CR tumors displayed EMMPRINstaining, whereas highest EMMPRIN staining (3�) was ob-served in PD tumors (Table V). This finding, originally indicated
using LC-MS-based technology, was thus confirmed by IHC.For comparison, we defined a “clinical benefit” group com-posed of tumors showing NC for �6 months, CR, and PR anda “no clinical benefit” group representing NC for �6 monthsand PD tumors. Absence of detectable EMMPRIN levelsshowed a significant clinical benefit with an odds ratio of 2.98(95% CI, 1.32–6.73; p 0.009). The presence of detectable
B
No stain
D
2+ stain
1+ stain
C
3+ stain
E
A
FIG. 7. Immunohistochemical staining of EMMPRIN. EMMPRINimmunohistochemical staining was performed on an independentsample set of 156 tissues using TMA. A, overview of TMA; B, nega-tively stained tissue; C, 1� membrane stain; D, 2� stain; E, 3� stain.Overview picture was taken at 5� magnification; other pictures weretaken at 100� magnification.
TABLE IVPatient characteristics
Patient and tumor characteristics for samples included in the vali-dation set are shown.
ER, estrogen receptor �; PgR, progesterone receptor.
Characteristics Numbers Median Percent
Patients 130 100Age (years)
Primary surgery 53.5Start first line 56.5
Menopausal status at startfirst line
Pre 40 30.8Post 90 69.2
ER (fmol/mg protein) 97PgR (fmol/mg protein) 54.5Response
Clinical benefit: CR, PR,S.D. � 6 months
77 59.2
No clinical benefit:S.D. � 6 months, PD
53 40.8
Dominant site of relapseLocal regional relapse 15 11.5Bone 65 50.0Other 50 38.5
Disease-free interval (months)�12 16 12.312–36 59 45.4�36 55 42.3
Nodal statusN0 62 47.7N1–3 30 23.1N � 3 34 26.2Unknown 4 3.1
Tumor size�2 cm 67 51.5�2 cm 63 48.5
Tumor gradePoor 46 35.4Unknown 52 40.0Good/moderate 32 24.6 TABLE V
IHC score of EMMPRIN
The average (Avg) EMMPRIN score in tumors grouped by therapyresponse is shown.
Avgscore
CR PRNC � 6months
NC � 6months
PD Total
0 4 20 40 8 25 971 0 4 6 3 12 252 0 0 2 0 4 63 0 0 1 0 1 2Total 4 24 49 11 42 130
Tamoxifen Resistance Protein Profile in Breast Cancer
Molecular & Cellular Proteomics 8.6 1289

EMMPRIN levels was more frequently observed in premeno-pausal women (X2 11.7; p � 0.001) and in patients with ashorter disease-free interval (X2 11.2; p 0.004) defined asthe time from primary diagnosis to recurrence (Table VI). Inaddition, Cox regression analysis showed that presence ofEMMPRIN significantly correlated with shorter progression-free survival from the start of tamoxifen treatment (HR, 1.87;95% CI, 1.25–2.80; p 0.002) (Fig. 8). Thus, high EMMPRINlevels correlate with poor outcome on first line tamoxifentreatment.
DISCUSSION
We performed a comparative proteomics study usingnano-LC-FTICTR MS analyses of tamoxifen therapy-resis-tant and therapy-responsive tumor cells isolated frombreast cancer tissue by LCM. This approach proved to beextremely powerful as exemplified by identification of sev-eral thousand unique proteins from sub-�g quantities ofclinically relevant samples. These efforts resulted in theidentification of a putative protein profile that is associatedwith the type of response to tamoxifen therapy. Furthermorewe validated our top discriminating protein, EMMPRIN, inan independent patient cohort and confirmed its associationwith tamoxifen therapy resistance in recurrent breastcancer.
Protein Identification by Nano-LC-FTICR MS—Many dif-ferent proteomics technologies are available nowadays thatall aid in the quest for cancer biomarkers. The method ofchoice will depend on the type of question asked, the typeof material being investigated, and the availability of re-sources. Several studies have shown that the combinationof dedicated nano-LC separation coupled to high end FTMS offers the best potential for in-depth analysis of limitedsample quantity, which is usually the case with clinicalmaterial (23, 28, 36, 37, 40). In the present study, we usednano-LC-FTICR MS and a composite breast cancer cell lineAMT tag database for the identification of peptides from aslittle as �550 ng of protein lysate. Overall we identified over17,000 unique peptides corresponding to over 2,500 uniqueproteins, a significantly larger fraction of the proteome thanattainable with more conventional proteomics techniques(20, 22). Furthermore we believe there is more to gain if abreast cancer tissue-specific AMT tag database becomesavailable. Although breast cancer cell lines represent as-
pects of normal and malignant breast tissue, it is well knownthat cultured cell lines have quite a distinct proteomic profilecompared with primary cells or tissues. This was clearlydemonstrated by Ornstein et al. (18) who compared pro-teomes of microdissected prostate tumor cells with pro-teomes of matching cell lines from the same patient. Theyshowed that protein expression was strikingly altered incultured cells, which had less than 20% proteins in commonwith uncultured cells (18). Therefore, it is very well possiblethat proteins involved in therapy resistance of breast tumorsare not expressed in cell lines and thus are missing from theAMT tag database used in this study. To overcome thisproblem, we are currently constructing an AMT tag data-base from breast cancer tissues using a selection of tumorsthat have distinct phenotypic characteristics. A breast can-cer tissue-specific AMT tag database will most likely in-crease the number of identified peptides (i.e. proteomecoverage) in LC-MS analyses, thus increasing our chancesof identifying relevant biomarkers. Proteome coveragecould even be further improved using “smart MS/MS,” e.g.by fragmenting currently unidentified LC-MS features.
Discovery and Verification of Putative Tamoxifen TherapyResponse-associated Proteins—The putative protein profiledescribed in this study consists of 100 proteins involved ina variety of biological processes. These proteins can becategorized into different functional classes, such as struc-tural proteins, signaling proteins and kinases, metabolic
Cum
ulat
ive
surv
ival
(%)
abspres
At risk:9733
273
91
41
time (months)0
0
25
50
75
100
604020
FIG. 8. Kaplan-Meier survival analysis. EMMPRIN abundancewas measured by IHC using TMA and was correlated to time toprogression after the onset of first line tamoxifen treatment. Ab-sence (abs) of detectable EMMPRIN (green line) was compared withpresence (pres) (1�, 2�, and 3�) of EMMPRIN staining (red line).
TABLE VIEMMPRIN correlation with clinical factors
EMMPRIN protein abundance correlated with menopausal status and disease-free interval is shown.
EMMPRIN n (%)Menopausal status Disease-free interval (months)
Pre (%) Post (%) �12 (%) 12–36 (%) �36 (%)
Absent 97 (74.6) 22 (55.0) 75 (83.3) 9 (56.3) 39 (66.1) 49 (89.1)Present 33 (25.4) 18 (45.0) 15 (16.7) 7 (43.7) 20 (34.9) 6 (10.9)Total 130 (100) 40 (30.7) 90 (69.2) 16 (12.3) 59 (45.3) 55 (42.3)Pearson �2 11.7 11.2p value �0.001 0.004
Tamoxifen Resistance Protein Profile in Breast Cancer
1290 Molecular & Cellular Proteomics 8.6

enzymes, proteins involved in apoptosis, and others (seeTable II). Several of the putative profile proteins (NAP1L1,pyridoxine-5�-phosphate oxidase, and UQCRFS1) havebeen previously associated with tamoxifen therapy resist-ance in breast cancer (41, 42) or chemotherapy resistance(SGPL1 and TUBB3) in vitro and in clinical specimens (43–45) and with aggressiveness of breast cancer (S100A6,S100A9, CLIC4, EBP50, and OCLN) (46–51).
Because the discovery of putative tamoxifen response-predictive proteins was performed in pooled samples, it wasimportant to verify the presence and relative abundance ofthese proteins in each individual tumor tissue. Using a tar-geted MS/MS approach, we successfully identified 55 profileproteins in individual, non-microdissected tumor lysates andretrieved quantitative information for 47 of these proteins.Clearly 45 putative proteins were left unverified in individualtumor samples, including our top discriminating protein,EMMPRIN. The relatively low verification rate can be justifiedby the use of different samples and LC-MS platforms for thediscovery and verification part of the study. Microdissectedtumor cell lysates were analyzed by ultranarrow LC coupled toFTICR for discovery, whereas whole tissue lysates represent-ing a mixture of cell types were analyzed by a standardizedLC-MS/MS platform for verification. Nano-LC-FTICR analysisyielded an average of �40,000 LC-MS features, whereasLC-MS/MS Orbitrap analysis detected on average �14,000LC-MS features. Therefore, the nano-LC-FTICR platformyielded �3� higher proteome coverage and, one can spec-ulate, resulted in a similar improvement in sensitivity (i.e. limitof detection). Similarly we only used information on accuratemass in targeted MS/MS experiments because it was notpossible to use NET information as an inclusion criterion withthe software version available at the time. The addition of NETinformation as an inclusion criterion will most likely increasethe success rate of target peptide identification throughMS/MS in future studies using updated instrument controlsoftware. The compilation of these effects (i.e. LC-MS plat-form with lower overall sensitivity and inadequate targetedMS/MS strategy) resulted in a failure to confirm the identity ofour top discriminating protein as EMMPRIN in the verificationstudy.
Nevertheless the presence of 55 putative profile proteinswas verified, and based on the abundance ratios, ENPP1,UQCRFS1, and GNB4 were confirmed to be significantly dif-ferentially abundant between OR and PD tumors. In additionENPP1, EIF3E, and GNB4, were significantly associated withtime to progression upon first line tamoxifen treatment ofrecurrent breast cancer. So far, no link between ENPP1 orGNB4 and breast cancer or response to tamoxifen has beendescribed, although ENPP1 overexpression and polymor-phisms have been repeatedly associated with insulin resist-ance and obesity (52, 53). Obesity is a risk factor for breastcancer (54), and insulin resistance may be linked to tamoxifentherapy resistance.
EIF3E protein expression has been shown to be signifi-cantly decreased in breast cancer, which was frequently as-sociated with loss of heterozygosity at the Int-6/eIF3-p48locus (55). EIF3E is ubiquitously expressed and highly con-served, and it encodes the p48 subunit of the translationinitiation factor eIF3, also named INT6. In a multiplex tissueimmunoblotting study by Traicoff et al. (56), EIF3E expressionwas determined in 124 breast cancer tissues. It was shownthat breast tissues clustered according to high or low EIF3Eexpression, and this segregation was not dependent on tumorstage. Furthermore EIF3E expression positively correlatedwith tumor suppressors, such as p53, suggesting a function inthe same signaling pathway (56). It was postulated that EIF3Ehas diverse functions in cell growth in addition to translationinitiation, including tumor suppressive properties. This wasparticularly clearly shown in studies where truncation orknockdown of EIF3E induced angiogenesis and tumor forma-tion (57, 58). This tumor-suppressive role correlates well withthe elevated abundance of EIF3E in OR tumors and its con-tribution to prolonged progression-free survival upon tamox-ifen treatment.
Validation of EMMPRIN—The validation study was focusedon our top discriminating protein, EMMPRIN, which is knownto be involved in breast cancer and for which an appropriateantibody is conveniently available. EMMPRIN has been pre-viously described to play a role in tumor cell invasion andmetastasis (59). In particular, it acts through up-regulation ofthe urokinase-type plasminogen activator system, therebypromoting tumor cell invasion (60). In an immunohistochemi-cal study using high density breast cancer tissue microarrays,it was shown that positive EMMPRIN staining correlated withvarious histopathological parameters, in particular with de-creased tumor-specific survival in postmenopausal patients(61). EMMPRIN is up-regulated in many types of cancer (62),supporting the previous findings that the involvement ofEMMPRIN in urokinase-type plasminogen activator deregula-tion may be a universal phenomenon in tumorigenesis and isnot restricted to breast cancer. In addition, EMMPRIN hasbeen recently shown to predict response and survival follow-ing cisplatin-containing chemotherapy in patients with ad-vanced bladder cancer (63). An IHC analysis in 101 advancedbladder cancer patients showed that high EMMPRIN expres-sion strongly correlated with shorter survival time, in particularin patients with metastatic tumors, and that response tochemotherapy could also be predicted with an odds ratio of4.41 (63). In our study, high expression of EMMRPIN wasmore frequently observed in PD than OR tumors, and it wassignificantly associated with an early tumor progression afterthe onset of first line tamoxifen treatment in recurrent breastcancer. Combining our results with previous findings, one canspeculate that EMMPRIN-induced tumor aggressiveness maybe the result of therapy resistance in general (i.e. tamoxifenand chemotherapy) and that this mechanism is not restrictedto breast cancer.
Tamoxifen Resistance Protein Profile in Breast Cancer
Molecular & Cellular Proteomics 8.6 1291

Concluding Remarks—In this study we demonstratedquantitative analysis of minute amounts of clinically relevanttumor tissues using ultrasensitive nano-LC-FTICR technol-ogy. These analyses have put forward a putative protein pro-file that may predict the outcome of response for tamoxifentherapy in breast cancer patients. Whether this profile as awhole is a good predictor for tamoxifen therapy response in alarger, independent group of patients and whether it is appli-cable to chemotherapy as well will be the subject of furtherinvestigations.
Acknowledgments—We thank Ron Moore for LC-MS/MS analy-ses and Angela Norbeck, Matthew Monroe, Nikola Tolic, and Sam-ual Purvine for assistance in MS data management and analysis.Anita Trapman-Jansen and Renee Foekens are acknowledged fortechnical assistance with IHC and TMA. Portions of this researchwere performed at the Environmental Molecular Sciences Labora-tory, a national scientific user facility sponsored by the Departmentof Energy’s Office of Biological and Environmental Research andlocated at Pacific Northwest National Laboratory, Richland, WA.
* This work was supported, in whole or in part, by NationalInstitutes of Health Grant RR18522 from the National Center forResearch Resources. This work was also supported by the NationalGenomics Initiative/Netherlands Organization for Scientific Re-search (NWO).
□S The on-line version of this article (available at http://www.mcponline.org) contains supplemental material.
§ Supported in part through a personal fellowship from the DutchCancer Society. To whom correspondence should be addressed:Erasmus Medical Center Rotterdam, Josephine Nefkens Inst., Dept.of Medical Oncology, Laboratory of Genomics and Proteomics ofBreast Cancer, Dr. Molewaterplein 50, Be 430c, P. O. Box 2040,3000 CA Rotterdam, The Netherlands. Tel.: 31-10-7043814; Fax:31-10-7044377; E-mail: [email protected].
� Present address: Dept. of Chemistry, Ajou University, Suwon 443-749, Korea.
‡‡ Present address: Dept. of Computer Science, University ofToronto, Toronto, Ontario M5S 3G4, Canada.
REFERENCES
1. Early Breast Cancer Trialists’ Collaborative Group (EBCTCG) (2005) Effectsof chemotherapy and hormonal therapy for early breast cancer on re-currence and 15-year survival: an overview of the randomised trials.Lancet 365, 1687–1717
2. Clarke, R., Liu, M. C., Bouker, K. B., Gu, Z., Lee, R. Y., Zhu, Y., Skaar, T. C.,Gomez, B., O’Brien, K., Wang, Y., and Hilakivi-Clarke, L. A. (2003)Antiestrogen resistance in breast cancer and the role of estrogen recep-tor signaling. Oncogene 22, 7316–7339
3. Massarweh, S., and Schiff, R. (2006) Resistance to endocrine therapy inbreast cancer: exploiting estrogen receptor/growth factor signalingcrosstalk. Endocr.-Relat. Cancer. 13, Suppl. 1, S15–S24
4. Perou, C. M., Sørlie, T., Eisen, M. B., van de Rijn, M., Jeffrey, S. S., Rees,C. A., Pollack, J. R., Ross, D. T., Johnsen, H., Akslen, L. A., Fluge, O.,Pergamenschikov, A., Williams, C., Zhu, S. X., Lønning, P. E., Børresen-Dale, A. L., Brown, P. O., and Botstein, D. (2000) Molecular portraits ofhuman breast tumours. Nature 406, 747–752
5. Sørlie, T., Perou, C. M., Tibshirani, R., Aas, T., Geisler, S., Johnsen, H.,Hastie, T., Eisen, M. B., van de Rijn, M., Jeffrey, S. S., Thorsen, T., Quist,H., Matese, J. C., Brown, P. O., Botstein, D., Eystein Lønning, P., andBørresen-Dale, A. L. (2001) Gene expression patterns of breast carcino-mas distinguish tumor subclasses with clinical implications. Proc. Natl.Acad. Sci. U. S. A. 98, 10869–10874
6. Jansen, M. P., Foekens, J. A., van Staveren, I. L., Dirkzwager-Kiel, M. M.,Ritstier, K., Look, M. P., Meijer-van Gelder, M. E., Sieuwerts, A. M.,
Portengen, H., Dorssers, L. C., Klijn, J. G., and Berns, E. M. (2005)Molecular classification of tamoxifen-resistant breast carcinomas bygene expression profiling. J. Clin. Oncol. 23, 732–740
7. Wang, Y., Klijn, J. G., Zhang, Y., Sieuwerts, A. M., Look, M. P., Yang, F.,Talantov, D., Timmermans, M., Meijer-van Gelder, M. E., Yu, J., Jatkoe,T., Berns, E. M., Atkins, D., and Foekens, J. A. (2005) Gene-expressionprofiles to predict distant metastasis of lymph-node-negative primarybreast cancer. Lancet 365, 671–679
8. Yang, F., Foekens, J. A., Yu, J., Sieuwerts, A. M., Timmermans, M., Klijn,J. G., Atkins, D., Wang, Y., and Jiang, Y. (2006) Laser microdissectionand microarray analysis of breast tumors reveal ER-alpha related genesand pathways. Oncogene 25, 1413–1419
9. Smid, M., Wang, Y., Klijn, J. G., Sieuwerts, A. M., Zhang, Y., Atkins, D.,Martens, J. W., and Foekens, J. A. (2006) Genes associated with breastcancer metastatic to bone. J. Clin. Oncol. 24, 2261–2267
10. Foekens, J. A., Atkins, D., Zhang, Y., Sweep, F. C., Harbeck, N.,Paradiso, A., Cufer, T., Sieuwerts, A. M., Talantov, D., Span, P. N.,Tjan-Heijnen, V. C., Zito, A. F., Specht, K., Hoefler, H., Golouh, R.,Schittulli, F., Schmitt, M., Beex, L. V., Klijn, J. G., and Wang, Y. (2006)Multicenter validation of a gene expression-based prognostic signa-ture in lymph node-negative primary breast cancer. J. Clin. Oncol. 24,1665–1671
11. Gehrmann, M. L., Hathout, Y., and Fenselau, C. (2004) Evaluation of met-abolic labeling for comparative proteomics in breast cancer cells. J.Proteome Res. 3, 1063–1068
12. Malorni, L., Cacace, G., Cuccurullo, M., Pocsfalvi, G., Chambery, A., Farina,A., Di Maro, A., Parente, A., and Malorni, A. (2006) Proteomic analysis ofMCF-7 breast cancer cell line exposed to mitogenic concentration of17beta-estradiol. Proteomics 6, 5973–5982
13. Ou, K., Kesuma, D., Ganesan, K., Yu, K., Soon, S. Y., Lee, S. Y., Goh, X. P.,Hooi, M., Chen, W., Jikuya, H., Ichikawa, T., Kuyama, H., Matsuo, E.,Nishimura, O., and Tan, P. (2006) Quantitative profiling of drug-associ-ated proteomic alterations by combined 2-nitrobenzenesulfenyl chloride(NBS) isotope labeling and 2DE/MS identification. J. Proteome Res. 5,2194–2206
14. Chuthapisith, S., Layfield, R., Kerr, I. D., Hughes, C., and Eremin, O. (2007)Proteomic profiling of MCF-7 breast cancer cells with chemoresistanceto different types of anti-cancer drugs. Int. J. Oncol. 30, 1545–1551
15. Wu, S. L., Hancock, W. S., Goodrich, G. G., and Kunitake, S. T. (2003) Anapproach to the proteomic analysis of a breast cancer cell line (SKBR-3).Proteomics 3, 1037–1046
16. Sandhu, C., Connor, M., Kislinger, T., Slingerland, J., and Emili, A. (2005)Global protein shotgun expression profiling of proliferating mcf-7 breastcancer cells. J. Proteome Res. 4, 674–689
17. Sarvaiya, H. A., Yoon, J. H., and Lazar, I. M. (2006) Proteome profile of theMCF7 cancer cell line: a mass spectrometric evaluation. Rapid Commun.Mass Spectrom. 20, 3039–3055
18. Ornstein, D. K., Gillespie, J. W., Paweletz, C. P., Duray, P. H., Herring, J.,Vocke, C. D., Topalian, S. L., Bostwick, D. G., Linehan, W. M., Petricoin,E. F., 3rd, and Emmert-Buck, M. R. (2000) Proteomic analysis of lasercapture microdissected human prostate cancer and in vitro prostate celllines. Electrophoresis 21, 2235–2242
19. Emmert-Buck, M. R., Bonner, R. F., Smith, P. D., Chuaqui, R. F., Zhuang,Z., Goldstein, S. R., Weiss, R. A., and Liotta, L. A. (1996) Laser capturemicrodissection. Science 274, 998–1001
20. Hudelist, G., Singer, C. F., Pischinger, K. I., Kaserer, K., Manavi, M.,Kubista, E., and Czerwenka, K. F. (2006) Proteomic analysis in humanbreast cancer: identification of a characteristic protein expression profileof malignant breast epithelium. Proteomics 6, 1989–2002
21. Neubauer, H., Clare, S. E., Kurek, R., Fehm, T., Wallwiener, D., Sotlar, K.,Nordheim, A., Wozny, W., Schwall, G. P., Poznanoviæ, S., Sastri, C.,Hunzinger, C., Stegmann, W., Schrattenholz, A., and Cahill, M. A. (2006)Breast cancer proteomics by laser capture microdissection, samplepooling, 54-cm IPG IEF, and differential iodine radioisotope detection.Electrophoresis 27, 1840–1852
22. Zang, L., Palmer Toy, D., Hancock, W. S., Sgroi, D. C., and Karger, B. L.(2004) Proteomic analysis of ductal carcinoma of the breast using lasercapture microdissection, LC-MS, and 16O/18O isotopic labeling. J. Pro-teome Res. 3, 604–612
23. Umar, A., Luider, T. M., Foekens, J. A., and Pasa-Toliæ, L. (2007) NanoLC-FT-ICR MS improves proteome coverage attainable for approximately
Tamoxifen Resistance Protein Profile in Breast Cancer
1292 Molecular & Cellular Proteomics 8.6

3000 laser-microdissected breast carcinoma cells. Proteomics 7,323–329
24. Pasa-Toliæ, L., Masselon, C., Barry, R. C., Shen, Y., and Smith, R. D. (2004)Proteomic analyses using an accurate mass and time tag strategy.Biotechniques 37, 621–624, 626–633, 636 passim
25. Hayward, J. L., Carbone, P. P., Heuson, J. C., Kumaoka, S., Segaloff, A.,and Rubens, R. D. (1977) Assessment of response to therapy in ad-vanced breast cancer: a project of the Programme on Clinical Oncologyof the International Union Against Cancer, Geneva, Switzerland. Cancer39, 1289–1294
26. McShane, L. M., Altman, D. G., Sauerbrei, W., Taube, S. E., Gion, M., Clark,G. M., and Statistics Subcommittee of NCI-EORTC Working Group onCancer Diagnostics (2005) REporting recommendations for tumorMARKer prognostic studies (REMARK). J. Natl. Cancer Inst. 97,1180–1184
27. Umar, A., Dalebout, J. C., Timmermans, A. M., Foekens, J. A., and Luider,T. M. (2005) Method optimisation for peptide profiling of microdis-sected breast carcinoma tissue by matrix-assisted laser desorption/ionisation-time of flight and matrix-assisted laser desorption/ionisa-tion-time of flight/time of flight-mass spectrometry. Proteomics 5,2680–2688
28. Shen, Y., Toliæ, N., Masselon, C., Pasa-Toliæ, L., Camp, D. G., 2nd,Hixson, K. K., Zhao, R., Anderson, G. A., and Smith, R. D. (2004)Ultrasensitive proteomics using high-efficiency on-line micro-SPE-nanoLC-nanoESI MS and MS/MS. Anal. Chem. 76, 144–154
29. Kang, H., Pasa-Toliæ, L., and Smith, R. D. (2007) Targeted tandem massspectrometry for high-throughput comparative proteomics employingnanoLC-FTICR MS with external ion dissociation. J. Am. Soc. MassSpectrom. 18, 1332–1343
30. Shaffer, S. A., Tolmachev, A., Prior, D. C., Anderson, G. A., Udseth, H. R.,and Smith, R. D. (1999) Characterization of an improved electrodynamicion funnel interface for electrospray ionization mass spectrometry. Anal.Chem. 71, 2957–2964
31. Kelly, R. T., Page, J. S., Luo, Q., Moore, R. J., Orton, D. J., Tang, K., andSmith, R. D. (2006) Chemically etched open tubular and monolithicemitters for nanoelectrospray ionization mass spectrometry. Anal. Chem.78, 7796–7801
32. Mayampurath, A. M., Jaitly, N., Purvine, S. O., Monroe, M. E., Auberry, K. J.,Adkins, J. N., and Smith, R. D. (2008) DeconMSn: a software tool foraccurate parent ion monoisotopic mass determination for tandem massspectra. Bioinformatics 24, 1021–1023
33. Monroe, M. E., Toliæ, N., Jaitly, N., Shaw, J. L., Adkins, J. N., and Smith,R. D. (2007) VIPER: an advanced software package to support high-throughput LC-MS peptide identification. Bioinformatics 23, 2021–2023
34. Petritis, K., Kangas, L. J., Ferguson, P. L., Anderson, G. A., Pasa-Toliæ, L.,Lipton, M. S., Auberry, K. J., Strittmatter, E. F., Shen, Y., Zhao, R., andSmith, R. D. (2003) Use of artificial neural networks for the accurateprediction of peptide liquid chromatography elution times in proteomeanalyses. Anal. Chem. 75, 1039–1048
35. Jacobs, J. M., Mottaz, H. M., Yu, L. R., Anderson, D. J., Moore, R. J., Chen,W. N., Auberry, K. J., Strittmatter, E. F., Monroe, M. E., Thrall, B. D.,Camp, D. G., 2nd, and Smith, R. D. (2004) Multidimensional proteomeanalysis of human mammary epithelial cells. J. Proteome Res. 3, 68–75
36. Wang, H., Qian, W. J., Mottaz, H. M., Clauss, T. R., Anderson, D. J., Moore,R. J., Camp, D. G., 2nd, Khan, A. H., Sforza, D. M., Pallavicini, M., Smith,D. J., and Smith, R. D. (2005) Development and evaluation of a micro-and nanoscale proteomic sample preparation method. J. Proteome Res.4, 2397–2403
37. Patwardhan, A. J., Strittmatter, E. F., Camp, D. G., 2nd, Smith, R. D., andPallavicini, M. G. (2006) Quantitative proteome analysis of breast cancercell lines using 18O-labeling and an accurate mass and time tag strategy.Proteomics 6, 2903–2915
38. Jaitly, N., Monroe, M. E., Petyuk, V. A., Clauss, T. R., Adkins, J. N., andSmith, R. D. (2006) Robust algorithm for alignment of liquid chromatog-raphy-mass spectrometry analyses in an accurate mass and time tagdata analysis pipeline. Anal. Chem. 78, 7397–7409
39. Elston, C. W., and Ellis, I. O. (1991) Pathological prognostic factors in breastcancer. I. The value of histological grade in breast cancer: experiencefrom a large study with long-term follow-up. Histopathology 19, 403–410
40. Mustafa, D. A., Burgers, P. C., Dekker, L. J., Charif, H., Titulaer, M. K.,Smitt, P. A., Luider, T. M., and Kros, J. M. (2007) Identification of glioma
neovascularization-related proteins by using MALDI-FTMS and nano-LCfractionation to microdissected tumor vessels. Mol. Cell. Proteomics 6,1147–1157
41. Nebert, D. W., and Russell, D. W. (2002) Clinical importance of the cyto-chromes P450. Lancet 360, 1155–1162
42. Tuquet, C., Dupont, J., Mesneau, A., and Roussaux, J. (2000) Effects oftamoxifen on the electron transport chain of isolated rat liver mitochon-dria. Cell Biol. Toxicol. 16, 207–219
43. Min, J., Van Veldhoven, P. P., Zhang, L., Hanigan, M. H., Alexander, H., andAlexander, S. (2005) Sphingosine-1-phosphate lyase regulates sensitiv-ity of human cells to select chemotherapy drugs in a p38-dependentmanner. Mol. Cancer Res. 3, 287–296
44. Oskouian, B., Sooriyakumaran, P., Borowsky, A. D., Crans, A., Dillard-Telm,L., Tam, Y. Y., Bandhuvula, P., and Saba, J. D. (2006) Sphingosine-1-phosphate lyase potentiates apoptosis via p53- and p38-dependentpathways and is down-regulated in colon cancer. Proc. Natl. Acad. Sci.U. S. A. 103, 17384–17389
45. Smith, L., Welham, K. J., Watson, M. B., Drew, P. J., Lind, M. J., andCawkwell, L. (2007) The proteomic analysis of cisplatin resistance inbreast cancer cells. Oncol. Res. 16, 497–506
46. Arai, K., Takano, S., Teratani, T., Ito, Y., Yamada, T., and Nozawa, R. (2008)S100A8 and S100A9 overexpression is associated with poor pathologi-cal parameters in invasive ductal carcinoma of the breast. Curr. CancerDrug Targets 8, 243–252
47. Georgescu, M. M. (2008) NHERF1: molecular brake on the PI3K pathway inbreast cancer. Breast Cancer Res. 10, 106
48. Osanai, M., Murata, M., Nishikiori, N., Chiba, H., Kojima, T., and Sawada, N.(2007) Occludin-mediated premature senescence is a fail-safe mecha-nism against tumorigenesis in breast carcinoma cells. Cancer Sci. 98,1027–1034
49. Salama, I., Malone, P. S., Mihaimeed, F., and Jones, J. L. (2008) A reviewof the S100 proteins in cancer. Eur. J. Surg. Oncol. 34, 357–364
50. Sanders, M. E., Dias, E. C., Xu, B. J., Mobley, J. A., Billheimer, D., Roder,H., Grigorieva, J., Dowsett, M., Arteaga, C. L., and Caprioli, R. M. (2008)Differentiating proteomic biomarkers in breast cancer by laser capturemicrodissection and MALDI MS. J. Proteome Res. 7, 1500–1507
51. Suh, K. S., Mutoh, M., Gerdes, M., and Yuspa, S. H. (2005) CLIC4, anintracellular chloride channel protein, is a novel molecular target forcancer therapy. J. Investig. Dermatol. Symp. Proc. 10, 105–109
52. Bacci, S., De Cosmo, S., Prudente, S., and Trischitta, V. (2007) ENPP1gene, insulin resistance and related clinical outcomes. Curr. Opin. Clin.Nutr. Metab. Care 10, 403–409
53. Jenkinson, C. P., Coletta, D. K., Flechtner-Mors, M., Hu, S. L., Fourcaudot,M. J., Rodriguez, L. M., Schneider, J., Arya, R., Stern, M. P., Blangero, J.,Duggirala, R., and DeFronzo, R. A. (2008) Association of genetic variationin ENPP1 with obesity-related phenotypes. Obesity 16, 1708–1713
54. Dal Maso, L., Zucchetto, A., Talamini, R., Serraino, D., Stocco, C. F.,Vercelli, M., Falcini, F., Franceschi, S., and Prospective Analysis ofCase-control studies on Environmental factors and health (PACE) studygroup (2008) Effect of obesity and other lifestyle factors on mortality inwomen with breast cancer. Int. J. Cancer 123, 2188–2194
55. Marchetti, A., Buttitta, F., Pellegrini, S., Bertacca, G., and Callahan, R.(2001) Reduced expression of INT-6/eIF3-p48 in human tumors. Int. J.Oncol. 18, 175–179
56. Traicoff, J. L., Chung, J. Y., Braunschweig, T., Mazo, I., Shu, Y., Ramesh,A., D’Amico, M. W., Galperin, M. M., Knezevic, V., and Hewitt, S. M.(2007) Expression of EIF3-p48/INT6, TID1 and Patched in cancer, aprofiling of multiple tumor types and correlation of expression.J. Biomed. Sci. 14, 395–405
57. Chen, L., Uchida, K., Endler, A., and Shibasaki, F. (2007) Mammalian tumorsuppressor Int6 specifically targets hypoxia inducible factor 2 alpha fordegradation by hypoxia- and pVHL-independent regulation. J. Biol.Chem. 282, 12707–12716
58. Mack, D. L., Boulanger, C. A., Callahan, R., and Smith, G. H. (2007)Expression of truncated Int6/eIF3e in mammary alveolar epithelium leadsto persistent hyperplasia and tumorigenesis. Breast Cancer Res. 9, R42
59. Zucker, S., Hymowitz, M., Rollo, E. E., Mann, R., Conner, C. E., Cao, J.,Foda, H. D., Tompkins, D. C., and Toole, B. P. (2001) Tumorigenicpotential of extracellular matrix metalloproteinase inducer. Am. J. Pathol.158, 1921–1928
60. Quemener, C., Gabison, E. E., Naïmi, B., Lescaille, G., Bougatef, F., Pod-
Tamoxifen Resistance Protein Profile in Breast Cancer
Molecular & Cellular Proteomics 8.6 1293

gorniak, M. P., Labarchede, G., Lebbe, C., Calvo, F., Menashi, S., andMourah, S. (2007) Extracellular matrix metalloproteinase inducer up-regulates the urokinase-type plasminogen activator system promotingtumor cell invasion. Cancer Res. 67, 9–15
61. Reimers, N., Zafrakas, K., Assmann, V., Egen, C., Riethdorf, L., Riethdorf, S.,Berger, J., Ebel, S., Janicke, F., Sauter, G., and Pantel, K. (2004) Expressionof extracellular matrix metalloproteases inducer on micrometastatic andprimary mammary carcinoma cells. Clin. Cancer Res. 10, 3422–3428
62. Riethdorf, S., Reimers, N., Assmann, V., Kornfeld, J. W., Terracciano, L.,Sauter, G., and Pantel, K. (2006) High incidence of EMMPRIN expressionin human tumors. Int. J. Cancer 119, 1800–1810
63. Als, A. B., Dyrskjøt, L., von der Maase, H., Koed, K., Mansilla, F., Toldbod,H. E., Jensen, J. L., Ulhøi, B. P., Sengeløv, L., Jensen, K. M., and Orntoft,T. F. (2007) Emmprin and survivin predict response and survival followingcisplatin-containing chemotherapy in patients with advanced bladdercancer. Clin. Cancer Res. 13, 4407–4414
Tamoxifen Resistance Protein Profile in Breast Cancer
1294 Molecular & Cellular Proteomics 8.6


![Breast percent density estimation from 3D reconstructed digital breast tomosynthesis images [6913-43]](https://static.fdokumen.com/doc/165x107/6336264964d291d2a302c4a3/breast-percent-density-estimation-from-3d-reconstructed-digital-breast-tomosynthesis.jpg)