Identification of putative markers linked to grain plumpness in ...
9
RESEARCH ARTICLE Open Access Identification of putative markers linked to grain plumpness in rice (Oryza sativa L.) via association mapping Erbao Liu † , Siyuan Zeng † , Xiangong Chen, Xiaojing Dang, Lijun Liang, Hui Wang, Zhiyao Dong, Yang Liu and Delin Hong * Abstract Background: Poor grain plumpness (GP) is one of the main constraints to reaching the yield potential of hybrid rice. Results: In this study, the GP of 177 rice varieties was investigated in three locations across 2 years. By combining the genotype data of 261 simple sequence repeat (SSR) markers, association mapping was conducted to identify the marker-GP association loci. Among 31 marker-GP association loci detected in two or more environments and determined using general linear model (GLM) analyses, seven association loci were also detected using mixed linear model (MLM) analyses. The seven common loci detected by the two analytical methods were located on chromosomes 2, 3 (2), 7, 8 and 12 (2) and explained 7.24~22.28% of the variance. Of these 7 association loci, five markers linked to GP were newly detected: RM5340 on Chr2, RM5480 and RM148 on Chr3, RM1235 on Chr8, and RM5479 on Chr12. Conclusions: Five marker-GP association loci were newly detected using both the GLM and MLM analytical methods. Elite allele RM505-170 bp had the highest average phenotypic effect on increasing the GP, and the typical carrier variety was ‘Maozitou’. Based on the distribution of the elite alleles among the carrier varieties, the top 10 parental combinations for improving the GP in rice via cross-breeding were predicted. Keywords: Rice, Grain plumpness, Association mapping, Genetic architecture, Elite allele Background Rice (Oryza sativa L.) is the main staple food for more than 50% of the world’ s population [1]. As the amount of arable land area decreases, higher rice yields will be needed to meet the needs of the increasing world popula- tion [2]. The grain yield of rice per unit area of land is de- termined by the panicle number, grain number per panicle and grain weight. When the panicle number per unit area of land and grain number per panicle are opti- mized, improving the grain weight plays a key role in fur- ther increasing the yield in rice breeding programmes [3]. The grain weight is closely related to the grain size and grain plumpness (GP) [4], and the grain size is determined by the grain length, grain width and grain thickness. Several genes have been reported to contribute to con- trolling grain size, including GS3 [5, 6], GL3 [7], GL7 [8], PGL1 [9] and PGL2 [10], which regulate grain length and grain weight, and GW2 (encoding a really interest- ing new gene [RING]-type E3 ubiquitin ligase) [11], qSW5 [12], GW5 [13], GS5 (encoding a putative serine carboxypeptidase) [14] and GW8 (encoding a transcrip- tion factor with a squamosa promoter binding protein- like [SBP] domain) [15], which regulate grain width and grain weight. However, poor GP remains a limiting factor for reaching the yield potential for hybrid rice, es- pecially hybrid japonica rice [16, 17]. Poor GP decreases both grain weight (and thus final grain yield) and rice quality (broken grains increase after being milled). Thus, improving the GP is essential for completely realizing the yield potential of hybrid rice. To our knowledge, 15 quantitative trait loci (QTLs) re- lated to GP have been mapped to date, and they are * Correspondence: [email protected] † Equal contributors State Key Laboratory of Crop Genetics and Germplasm Enhancement, Nanjing Agricultural University, Nanjing, China © The Author(s). 2017 Open Access This article is distributed under the terms of the Creative Commons Attribution 4.0 International License (http://creativecommons.org/licenses/by/4.0/), which permits unrestricted use, distribution, and reproduction in any medium, provided you give appropriate credit to the original author(s) and the source, provide a link to the Creative Commons license, and indicate if changes were made. The Creative Commons Public Domain Dedication waiver (http://creativecommons.org/publicdomain/zero/1.0/) applies to the data made available in this article, unless otherwise stated. Liu et al. BMC Genetics (2017) 18:89 DOI 10.1186/s12863-017-0559-6
-
Upload
khangminh22 -
Category
Documents
-
view
1 -
download
0
Transcript of Identification of putative markers linked to grain plumpness in ...
RESEARCH ARTICLE Open Access
Identification of putative markers linked tograin plumpness in rice (Oryza sativa L.) viaassociation mappingErbao Liu†, Siyuan Zeng†, Xiangong Chen, Xiaojing Dang, Lijun Liang, Hui Wang, Zhiyao Dong, Yang Liuand Delin Hong*
Abstract
Background: Poor grain plumpness (GP) is one of the main constraints to reaching the yield potential of hybrid rice.
Results: In this study, the GP of 177 rice varieties was investigated in three locations across 2 years. By combining thegenotype data of 261 simple sequence repeat (SSR) markers, association mapping was conducted to identify themarker-GP association loci. Among 31 marker-GP association loci detected in two or more environments anddetermined using general linear model (GLM) analyses, seven association loci were also detected using mixedlinear model (MLM) analyses. The seven common loci detected by the two analytical methods were located onchromosomes 2, 3 (2), 7, 8 and 12 (2) and explained 7.24~22.28% of the variance. Of these 7 association loci, fivemarkers linked to GP were newly detected: RM5340 on Chr2, RM5480 and RM148 on Chr3, RM1235 on Chr8, andRM5479 on Chr12.
Conclusions: Five marker-GP association loci were newly detected using both the GLM and MLM analyticalmethods. Elite allele RM505-170 bp had the highest average phenotypic effect on increasing the GP, and thetypical carrier variety was ‘Maozitou’. Based on the distribution of the elite alleles among the carrier varieties, thetop 10 parental combinations for improving the GP in rice via cross-breeding were predicted.
Keywords: Rice, Grain plumpness, Association mapping, Genetic architecture, Elite allele
BackgroundRice (Oryza sativa L.) is the main staple food for morethan 50% of the world’s population [1]. As the amount ofarable land area decreases, higher rice yields will beneeded to meet the needs of the increasing world popula-tion [2]. The grain yield of rice per unit area of land is de-termined by the panicle number, grain number perpanicle and grain weight. When the panicle number perunit area of land and grain number per panicle are opti-mized, improving the grain weight plays a key role in fur-ther increasing the yield in rice breeding programmes [3].The grain weight is closely related to the grain size andgrain plumpness (GP) [4], and the grain size is determinedby the grain length, grain width and grain thickness.
Several genes have been reported to contribute to con-trolling grain size, including GS3 [5, 6], GL3 [7], GL7[8], PGL1 [9] and PGL2 [10], which regulate grain lengthand grain weight, and GW2 (encoding a really interest-ing new gene [RING]-type E3 ubiquitin ligase) [11],qSW5 [12], GW5 [13], GS5 (encoding a putative serinecarboxypeptidase) [14] and GW8 (encoding a transcrip-tion factor with a squamosa promoter binding protein-like [SBP] domain) [15], which regulate grain width andgrain weight. However, poor GP remains a limitingfactor for reaching the yield potential for hybrid rice, es-pecially hybrid japonica rice [16, 17]. Poor GP decreasesboth grain weight (and thus final grain yield) and ricequality (broken grains increase after being milled). Thus,improving the GP is essential for completely realizingthe yield potential of hybrid rice.To our knowledge, 15 quantitative trait loci (QTLs) re-
lated to GP have been mapped to date, and they are
* Correspondence: [email protected]†Equal contributorsState Key Laboratory of Crop Genetics and Germplasm Enhancement,Nanjing Agricultural University, Nanjing, China
© The Author(s). 2017 Open Access This article is distributed under the terms of the Creative Commons Attribution 4.0International License (http://creativecommons.org/licenses/by/4.0/), which permits unrestricted use, distribution, andreproduction in any medium, provided you give appropriate credit to the original author(s) and the source, provide a link tothe Creative Commons license, and indicate if changes were made. The Creative Commons Public Domain Dedication waiver(http://creativecommons.org/publicdomain/zero/1.0/) applies to the data made available in this article, unless otherwise stated.
Liu et al. BMC Genetics (2017) 18:89 DOI 10.1186/s12863-017-0559-6
distributed on chromosomes 1 (3), 2 (1), 5 (2), 6 (3), 7(3), 8 (1), 11 (1) and 12 (1) [18–20]. However, no genesfor GP have been cloned. Other studies have found thatGP is closely related to sucrose synthesis and transport.Two rice sucrose synthase genes—SUS3 on Chr7 andSUS4 on Chr3—may be involved in carbon allocation infilling grains [21]. The cell-wall invertase gene—OsCIN1on Chr2—plays an important role in providing a carbonsource to develop filial tissues during the early course ofgrain filling in the caryopsis [22]. The gene grain incom-plete filling 1 (GIF1) on Chr4 regulates sucrose transportand uploading during the grain-filling stage, and theoverexpression of GIF1 can increase grain filling andfinal grain weight [23].Most QTLs for GP have been detected based on link-
age mapping using bi-parent-derived populations, andonly two alleles at a given locus have been studied [24].Association mapping, which is a new approach, hasgreater power to detect more alleles or alleles with weakeffects [25]. In this paper, we reported elite alleles forGP detected by association mapping using a populationcomposed of 177 rice varieties and 261 simple sequencerepeat (SSR) markers and their carrier varieties.
MethodsGeographical distribution of varieties used and fieldplantingThe 177 rice varieties used in this study represent a subsetof our previous reports [24, 26]. Among them, 148 werefrom China, and 29 were from Vietnam (Additional file 1:Table S1). The varieties were distributed from 17.00°N to41.81°N. The 177 varieties were grown from May toNovember 2013 and 2014 at three locations: JiangpuExperimental Farm (JEF; 118.62°E, 32.07°N), NanjingAgricultural University, Jiangsu province, and XinyangFarm (XF; 114.12°E, 32.10°N) and Yuanyang Farm (YF;113.96°E, 35.05°N), Henan Academy of AgriculturalSciences, Henan Province, China. JEF and XF are locatedat almost the same latitude, but their longitudes differ by4.5°. XF and YF are located at almost the same longitude,but their latitudes differ by 3°. Seedlings aged approxi-mately 30 days were transplanted to the paddy field byhand each year at each location. Each plot consisted of fiverows with eight plants per row, and the spacing was17 cm × 20 cm. The field trial was arranged using a com-pletely randomized block design with two replications ateach location.
PhenotypingThe main stem panicles of the 10 plants in the middlethree rows of each plot were harvested, threshed anddried under natural sunshine to 13% moisture. All driedspikelets were placed on a translucent lamp box, and theempty grains (unfertilized spikelets) were selected by
hand. Then, the full grains were separated from theremaining mixed filled grains (full plus shrunken) usinga salt solution with a specific gravity of 1.1. The fullgrains and shrunken grains were then dried at 105 °C for24 h to constant weight. The measurements of the fullgrains and mixed filled grains for each plot were repli-cated three times. The GP was calculated using thefollowing formula:
GP %ð Þ ¼ Ac
Bc� 100
where Ac represents the average thousand-grain weightof the mixed filled grains of variety c, and Bc representsthe average thousand-grain weight of the full grains ofvariety c [27].
GenotypingThe SSR molecular marker genotype data published in[26] were used in this study, except for RM433 onchromosome 8, which showed no polymorphism amongthe 177 accessions. The base pair start positions on thechromosomes for each SSR marker are presented (Addi-tional file 2: Table S2) for calculating the physical dis-tance between markers on the chromosomes.
Data analysisThe phenotypic data were statistically analysed usingMicrosoft Excel 2010. The broad-sense heritability wascomputed using the formula [28]
H2B ¼ σ2g= σ2g þ σ2e=n
� �
where σ2g is the genetic variance, σ2e is the error variance,and n is the number of replications.Two methods were used to detect the population gene-
tic architecture of the 177 accessions. The first was theBayesian cluster analysis approach, which was imple-mented using STRUCTURE version 2.2 [29]. The secondwas the neighbour-joining method, which was carried outusing MEGA version 5.0 based on Nei’s genetic distance[30]. The computations followed the same approach asthose described in [31]. The coefficient of genetic differen-tiation (FST) [32] was calculated to measure the fixation ofdifferent alleles in different subpopulations using Arlequinversion 3.0 [33]. The number of alleles per locus, gene di-versity and polymorphism information content (PIC) weredetermined using PowerMarker version 3.25. The r2 value[34] calculated via TASSEL version 2.1 [35] was used asthe preferred measure of linkage disequilibrium (LD).Two models, the general linear model (GLM) and the
mixed linear model (MLM), were used to analyse the as-sociations between GP and SSR markers with TASSELversion 2.1. In the GLM, only the Q matrix was used asa covariate, while in the MLM, both the Q matrix and
Liu et al. BMC Genetics (2017) 18:89 Page 2 of 9
kinship matrix were used as covariates [36]. The kinshipmatrix was calculated via SPAGeDi to estimate thegenetic relatedness among individuals [37]. A false dis-covery rate (FDR) of 0.01 was used as a threshold forsignificant associations [38]. Based on the identified as-sociation locus, the ‘null allele’ (non-amplified allele)was used to determine the phenotypic effects of otheralleles [39]. Alleles with frequencies of less than 5% inthe population were regarded as rare alleles and treatedas missing data. The following formula was used to cal-culate the positive (negative) average allele effect (AAE)of each locus:
AAE ¼X
ai=ni
where ∑ai is the positive (negative) allelic phenotypiceffects of locus i, and ni is the number of positive(negative) alleles within locus i.
ResultsPhenotypic variation and genetic diversity in thepopulation studiedAmong the six environments, the mean GP values werehigher than 90%, and the coefficient of variation rangedfrom 3.35% to 4.22%. The broad-sense heritability forthe GP was greater than 90% in each environment(Table 1). No significant differences were detected over2 years at any location, indicating that the GP is influ-enced mainly by genetic factors. A two-way analysis ofvariance (ANOVA) showed that the differences in GPamong the 177 varieties were significant at the α = 0.01probability level, indicating that a large amount of gene-tic variation existed in the entire population.Highly significant correlations (α = 0.01) were ob-
served for the GP trait between the 2 years at each loca-tion. The coefficients of correlation between the 2 yearswere 0.814 at YF, 0.975 at XF and 0.974 at JEF. The coef-ficients of correlation between the pairs of locations were0.432 (rJEF-XF, JEF and XF), 0.312 (rYF-XF, YF and XF) and0.367 (rYF-JEF, YF and JEF). Thus, the variation tendency ofthe GP was consistent across years and locations.
Of the 1948 alleles amplified by 261 SSR marker lociin the 177 varieties, 35.14% were rare alleles with fre-quencies less than 5%. The average number of alleles perSSR locus was 7.46 and ranged from 2 to 20. The aver-age gene diversity was 0.6734 and ranged from 0.0223(RM140 on Chr1) to 0.9152 (RM7545 on Chr10). Theaverage PIC value was 0.6395 and ranged from 0.0221(RM140 on Chr1) to 0.9091 (RM7545 on Chr10)(Additional file 2: Table S2).
Genetic architecture of the original populationAlthough the 177 accessions represent a subset of the540 accessions used in our previous reports [26], thepresent population was still divided into seven sub-populations using ΔK as the diagnostic criterion(Additional file 3: Figure S1a and 1b). This may becaused by a broad geographical distribution (17.00°Nto 41.81°N), although the number of points was re-duced. Based on the criterion of Q > 0.900, 17 var-ieties were assigned to the admixed group and werenot analysed further. The other 160 varieties werereanalysed using the STRUCTURE software package,and they were clearly differentiated into seven sub-populations with Q > 0.900 for each variety (Fig. 1c;Additional file 1: Table S1). The neighbour-joiningtree constructed based on Nei’s genetic distance [30] sup-ported the finding that the original population was com-posed of seven subpopulations (i.e., SP1 to SP7; Fig. 1d).The numbers of varieties included in SP1-SP7 were 29, 28,25, 12, 20, 28 and 18, respectively. The varieties inSP3 and SP4 are mainly from Vietnam, whereas thevarieties in the other five subpopulations are fromChina (Additional file 1: Table S1).
Pairwise FST and Nei’s genetic distance amongsubpopulationsThe average FST value of the seven subpopulations (160varieties) was 0.6587. The FST value between SP3 andSP4 was the lowest (0.5978), while that between SP1 andSP4 was the highest (0.7451). Nei’s genetic distancebetween SP3 and SP1 was the longest (0.7624), whereasthat between SP5 and SP2 was the shortest (0.5032)(Table 2). In addition, when the FST value between SP3and SP4 was lowest, Nei’s genetic distance between SP3and SP4 was shorter, whereas when the FST between SP1and SP4 was highest, Nei’s genetic distance between SP1and SP4 was longer (Table 2). These findings reveal thatthe pairwise FST can reflect the genetic distance betweensubpopulations.
Significant LD of SSR markers in the sevensubpopulationsTable 3 shows the levels of LD estimated for the entirepopulation and the seven subpopulations. For the entire
Table 1 Descriptive statistics for GP (%) for two years at threelocations
Location Year Mean ± SDa Maximum Minimum CV (%)b H2 B (%)c
YFd 2013 94.33 ± 3.68 99.51 84.89 3.91 97.09
2014 93.47 ± 3.77 99.52 79.43 4.04 98.61
XFe 2013 92.20 ± 3.89 99.33 77.89 4.22 96.75
2014 90.31 ± 3.72 98.37 78.23 4.12 96.45
JEFf 2013 93.02 ± 3.20 99.55 82.66 3.44 95.22
2014 93.12 ± 3.12 99.17 83.25 3.35 96.95aSD Standard deviation, bCV Coefficient of variation, cH2
B Broad-sense heritability,dYF Yuanyang Farm, eXF Xinyang Farm, fJEF Jiangpu Experimental Farm
Liu et al. BMC Genetics (2017) 18:89 Page 3 of 9

population, the percentage of significant (P < 0.01) locuspairs in LD among the total number of locus pairs was95.21%. The percentage for pairs of markers from thesame chromosome was 95.97%, higher than the valuedetermined for markers from different chromosomes(95.14%). Of the seven subpopulations, SP4 had the low-est percentage (2.35%), and SP3 had the highest percent-age (44.94%). The 75th percentiles for the backgroundLD values of the seven subpopulations were 0.0785,0.0807, 0.1065, 0.0988, 0.0994, 0.0662 and 0.0982,
respectively (Additional file 4: Figure S2). A regressionanalysis of the r2 value and the genetic distance for thelinked SSR marker pairs showed that the LD decay dis-tances for SP1-SP7 were 4.48 Mb, 5.48 Mb, 4.26 Mb,3.53 Mb, 5.53 Mb, 5.58 Mb and 8.67 Mb, respectively,under the background LD (Additional file 5: Figure S3).This result further validated the significant LD of theSSR markers in the seven subpopulations and demon-strated that the LD decay velocity varied among thesesubpopulations.
Significant SSR marker-GP association loci detected in thepopulation studiedIn total, 31 association loci between the SSR marker andGP with P-values less than 0.01 were detected by boththe GLM and MLM analyses in two or more environ-ments (Additional file 6: Table S3). The GLM analysisrevealed 31 marker loci associated with GP (P < 0.01),and the identified markers were located on all of thechromosomes except for chromosome 11. The rate ofphenotypic variation explained (PVE) ranged from7.24% to 22.28%. RM5479 on Chr12 exhibited thehighest PVE values: 22.28% in 2013 and 20.64% in2014 (Additional file 6: Table S3). The MLM analysis
Fig. 1 Population genetic architecture analysis of 160 varieties. Effects of changes in the log-likelihood function value (a) and the ΔK value (b) onthe number of subpopulations, posterior probabilities of 160 varieties belonging to seven subpopulations (c) and the neighbour-joining tree for160 varieties based on Nei’s genetic distance (d). Each variety is represented by a vertical bar. The coloured subsections within each vertical barindicate the membership coefficients (Q) of that variety in different subpopulations. The identified subpopulations are SP1 (red), SP2 (green), SP3(navy blue), SP4 (yellow), SP5 (purple), SP6 (light blue), and SP7 (brown)
Table 2 Pairwise FST and Nei’s genetic distance among theseven subpopulations
Subpopulation SP1 SP2 SP3 SP4 SP5 SP6 SP7
SP1 – 0.6347 0.6673 0.7451 0.6875 0.6437 0.6671
SP2 0.5548 – 0.6264 0.6933 0.6026 0.6304 0.6446
SP3 0.7624 0.6821 – 0.5978 0.6388 0.6438 0.6235
SP4 0.7465 0.6612 0.5576 – 0.7302 0.7072 0.7056
SP5 0.6207 0.5032 0.6792 0.6607 – 0.6591 0.6743
SP6 0.5844 0.6107 0.7482 0.7151 0.6235 – 0.6109
SP7 0.6581 0.6664 0.7542 0.7346 0.6884 0.5558 –
Nei’s genetic distance is below the diagonal, and FST is above the diagonal. Allpairwise FST values are significant (P < 0.01)
Liu et al. BMC Genetics (2017) 18:89 Page 4 of 9
revealed seven marker loci associated with GP (P < 0.01)located on chromosomes 2, 3 (2), 7, 8 and 12 (2). ThePVE ranged from 9.01% to 21.06%. RM5479 on Chr12also exhibited the highest PVE values: 21.06% in 2013 and20.39% in 2014 (Additional file 6: Table S3). Seven markerloci—RM5340 on Chr2, RM5480 on Chr3, RM148 onChr3, RM505 on Chr7, RM1235 on Chr8, RM511 onChr12 and RM5479 on Chr12—were detected by both theGLM and MLM analyses. Of these seven association loci,RM505 on Chr7 had the highest positive AAE value(1.68%).
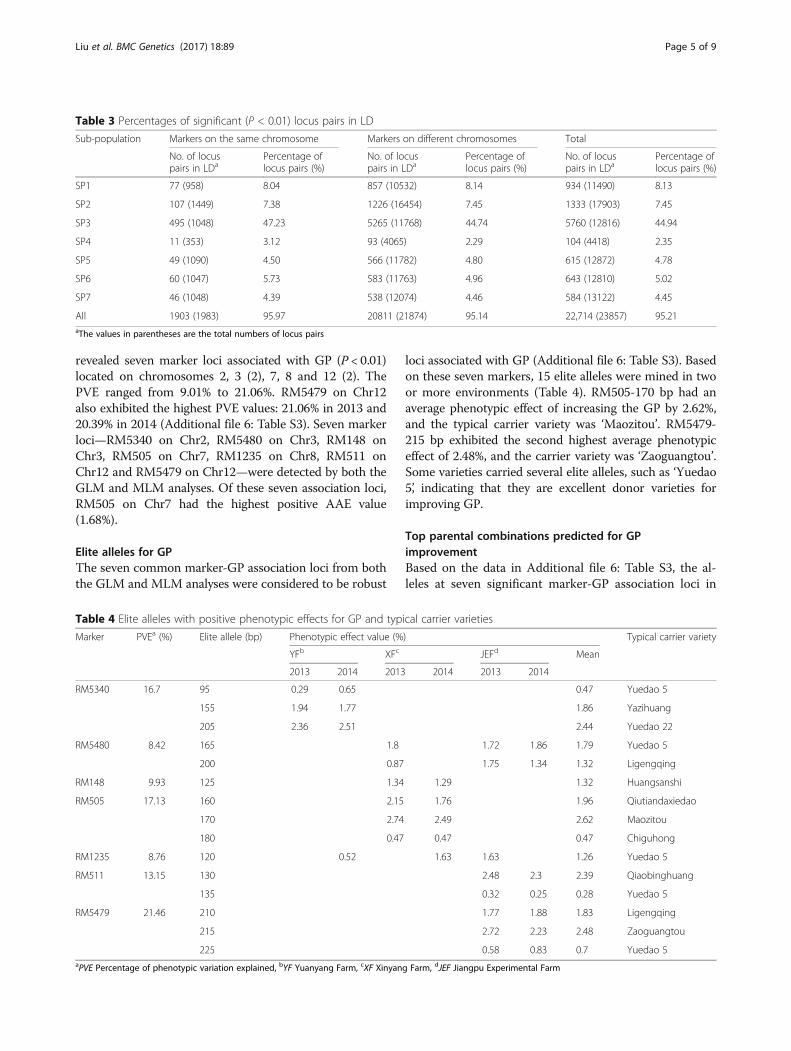
Elite alleles for GPThe seven common marker-GP association loci from boththe GLM and MLM analyses were considered to be robust
loci associated with GP (Additional file 6: Table S3). Basedon these seven markers, 15 elite alleles were mined in twoor more environments (Table 4). RM505-170 bp had anaverage phenotypic effect of increasing the GP by 2.62%,and the typical carrier variety was ‘Maozitou’. RM5479-215 bp exhibited the second highest average phenotypiceffect of 2.48%, and the carrier variety was ‘Zaoguangtou’.Some varieties carried several elite alleles, such as ‘Yuedao5’, indicating that they are excellent donor varieties forimproving GP.
Top parental combinations predicted for GPimprovementBased on the data in Additional file 6: Table S3, the al-leles at seven significant marker-GP association loci in
Table 3 Percentages of significant (P < 0.01) locus pairs in LD
Sub-population Markers on the same chromosome Markers on different chromosomes Total
No. of locuspairs in LDa
Percentage oflocus pairs (%)
No. of locuspairs in LDa
Percentage oflocus pairs (%)
No. of locuspairs in LDa
Percentage oflocus pairs (%)
SP1 77 (958) 8.04 857 (10532) 8.14 934 (11490) 8.13
SP2 107 (1449) 7.38 1226 (16454) 7.45 1333 (17903) 7.45
SP3 495 (1048) 47.23 5265 (11768) 44.74 5760 (12816) 44.94
SP4 11 (353) 3.12 93 (4065) 2.29 104 (4418) 2.35
SP5 49 (1090) 4.50 566 (11782) 4.80 615 (12872) 4.78
SP6 60 (1047) 5.73 583 (11763) 4.96 643 (12810) 5.02
SP7 46 (1048) 4.39 538 (12074) 4.46 584 (13122) 4.45
All 1903 (1983) 95.97 20811 (21874) 95.14 22,714 (23857) 95.21aThe values in parentheses are the total numbers of locus pairs
Table 4 Elite alleles with positive phenotypic effects for GP and typical carrier varieties
Marker PVEa (%) Elite allele (bp) Phenotypic effect value (%) Typical carrier variety
YFb XFc JEFd Mean
2013 2014 2013 2014 2013 2014
RM5340 16.7 95 0.29 0.65 0.47 Yuedao 5
155 1.94 1.77 1.86 Yazihuang
205 2.36 2.51 2.44 Yuedao 22
RM5480 8.42 165 1.8 1.72 1.86 1.79 Yuedao 5
200 0.87 1.75 1.34 1.32 Ligengqing
RM148 9.93 125 1.34 1.29 1.32 Huangsanshi
RM505 17.13 160 2.15 1.76 1.96 Qiutiandaxiedao
170 2.74 2.49 2.62 Maozitou
180 0.47 0.47 0.47 Chiguhong
RM1235 8.76 120 0.52 1.63 1.63 1.26 Yuedao 5
RM511 13.15 130 2.48 2.3 2.39 Qiaobinghuang
135 0.32 0.25 0.28 Yuedao 5
RM5479 21.46 210 1.77 1.88 1.83 Ligengqing
215 2.72 2.23 2.48 Zaoguangtou
225 0.58 0.83 0.7 Yuedao 5aPVE Percentage of phenotypic variation explained, bYF Yuanyang Farm, cXF Xinyang Farm, dJEF Jiangpu Experimental Farm
Liu et al. BMC Genetics (2017) 18:89 Page 5 of 9

typical carrier varieties were analysed (Additional file 3:Table S3). The top 10 parental combinations were pre-dicted (Table 5) for improving the GP in rice viacross-breeding based on the data presented in Add-itional file 3: Table S3. For instance, ‘Yuedao 5’ hadsix elite alleles, and ‘Ligengqing’ had six elite alleles.Seven elite alleles could be pyramided into one plantusing the combination ‘Yuedao 5 × Ligengqing’, andas a result, the GP should theoretically be improved by13.07% (Additional file 7: Table S4; Table 5). Figure 2shows the unhulled rice grains and brown rice grains ofthe varieties corresponding to the predicted combinationsto improve GP.
DiscussionGP in rice affects not only yield but also milling quality(recovery of head rice), especially in hybrid rice whereheavy panicles often increase the yield [17, 40]. Miningelite alleles for GP is beneficial for improving this trait.In the present study, we used 177 accessions, representinga subset of the population (540 accessions) reported in[26], and 261 SSR markers to implement the discovery.To avoid spurious associations in association mapping[41], we first evaluated the present population geneticarchitecture using two different analysis methods(STRUCTURE and Nei’s genetic distance) and de-tected 7 subpopulations (Fig. 1), which was the sameas those detected in [26]. We inferred that the popu-lation genetic structure was mainly affected by geo-graphical location (ecotypes) and nearly unaffected byaccession reducing.We also found that the LD decay distances for SP1-
SP7 were 4.48 Mb, 5.48 Mb, 4.26 Mb, 3.53 Mb, 5.53 Mb,5.58 Mb and 8.67 Mb, respectively. The fast decays inSP3 and SP4 could have resulted from rapid artificialhybridization in Vietnam, which should accelerate therecombination of the chromosomes and, thereby,weaken the LD. We calculated the average standardized
individual allele sizes of the seven subpopulations ac-cording to the methods described by [42] and observedthat the average allele sizes in SP3 and SP4 were signifi-cantly higher than those in the other subpopulations(Fig. 3). This fact further confirmed that directional evo-lution for the allele size has occurred in rice [24, 31].We also observed that the SSR alleles tended to decreasein size from the low-latitude subpopulations (SP3 andSP4, 17–23゜N) to the high-latitude subpopulations (theother five subpopulations, 30–39゜N); this behaviourmay be explained by the emergence of mutations orchanges in the mutation rate causing a change in the al-lele size in rice [43, 44]. No significant differences werefound between SP3 and SP4, possibly because of theshort geographical distance between the two subpopula-tions. The same phenomenon was detected among theremaining five subpopulations (Table 6). Moreover, thehigh proportion of the rare alleles (35.14%) might be re-lated to the geography of rice migration. New alleles ap-peared and certain original alleles disappeared with thechanges in the cultivation environment, resulting in theemergence of varieties with rare alleles.Furthermore, the number of detected marker-GP asso-
ciation loci decreased when the same population wascultivated towards the west and north. As shown inAdditional file 6: Table S3, in JEF (32.07°N, 118.62°E), 24and 21 marker-GP association loci were detected in2013 and 2014, respectively, by the GLM analyses, andfour (RM5480, RM1235, RM511 and RM5479) and three(RM5480, RM511 and RM5479) association markerswere detected in 2013 and 2014, respectively, by theMLM analyses. In XF (32.10°N, 114.12°E), ten and sixmarker-GP association loci were detected in 2013 and2014, respectively, by the GLM analyses, and two(RM148 and RM505) and three (RM148, RM505 andRM1235) association markers were detected in 2013 and2014, respectively, by the MLM analyses. In YF (35.05°N,113.96°E), four and seven SSR marker-GP associationloci were detected in 2013 and 2014, respectively, by theGLM analyses, and only one association marker(RM5340) was detected by the MLM analyses in theboth years. Furthermore, among the seven associationloci detected by the two analytical methods (GLM andMLM), no identical association marker loci were foundamong the three locations except for RM1235 on Chr8.Thus, there are many gene loci underlying GP, and dif-ferent genes exhibit different characteristics in differentenvironments.Based on previous studies, GIF1, as an important gene
cloned associated with rice grain filling, encodes a cell-wall invertase required for carbon partitioning duringearly grain filling. GIF1 is a potential domesticationgene; thus, a domestication-selected gene can be usedfor further crop improvement. In our study, we found
Table 5 Parental combinations predicted for GP improvement
Parental combination predicted Number of elitealleles predicted
GP improvementpredicted (%)
Yuedao 5 × Ligengqing 7 13.07
Yuedao 22 × Ligengqing 7 13.07
Yazihuang × Ligengqing 7 13.07
Yazihuang × Huangsanshi 7 13.07
Yuedao 22 × Yuedao 5 7 12.52
Yazihuang × Yuedao 22 7 12.52
Yuedao 5 × Zaoguangtou 7 12.33
Yuedao 5 × Huangsanshi 7 11.68
Yuedao 5 × Qiaobinghuang 7 10.55
Yuedao 5 × Yazihuang 6 8.37
Liu et al. BMC Genetics (2017) 18:89 Page 6 of 9

no markers associated with GP near the region of GIF1.By comparing with other studies, we found that five ofthe seven SSR markers detected in this study were novel;the other two SSR markers were located near thechromosome regions harbouring grain filling and re-lated QTLs or genes reported in previous studies(Additional file 8: Table S5).Among the seven SSRmarkers, RM505 on Chr7 was in the region of qGR-7-8 for grain-filling rate [20], and RM511 on Chr12was the same as the SSR markers for grain-filling ratedetected by [45], implying that GP was affected bythe grain milk filling rate.Although the PVE of the seven association loci ranged
from 7.24% to 22.28%, the positive AAE values were weak(1.26% on RM1235 to 1.68% on RM505). This resultmight be explained by the coefficient of variation in GP inthe population was not large enough (CV < 5%, Table 1)
because the experimental materials were cultivars in dif-ferent areas. However, because GP is a function of grainweight, a small improvement will contribute considerablyto the grain yield of rice.The elite alleles mined in this study may be used to
improve the GP of hybrid rice. Among the top 10 paren-tal combinations predicted, the combinations ‘Yuedao5 × Ligengqing’, ‘Yuedao 22 × Ligengqing’, ‘Yazihuang ×Ligengqing’ and ‘Yazihuang × Huangsanshi’ could the-oretically improve the GP by 13.07% (Table 5). Six ofthe ten combinations have ‘Yuedao 5’ as a parent, in-dicating that ‘Yuedao 5’ may be an excellent parentfor GP improvement.
ConclusionsSeven marker loci were detected for GP, of which fivewere novel loci. Ten parental combinations were pre-dicted for improving the GP in rice via cross-breeding.
Fig. 2 Unhulled rice grains and brown rice grains of the investigated varieties in the predicted combinations for GP improvement (bar = 1 cm)
Fig. 3 Average standardized individual allele sizes of the sevensubpopulations. The mean, standard deviation, and number ofvarieties per subpopulation are identified
Table 6 Differences in the average standardized individualallele sizes among the seven subpopulations
Subpopulation SP1 SP2 SP3 SP4 SP5 SP6 SP7
SP1
SP2 −1.51
SP3 3.98** 6.21**
SP4 4.41** 6.44** 2.02
SP5 0.37 1.32 −2.89** −3.67**
SP6 0.05 1.25 −4.09** −4.24** −0.32
SP7 −0.48 0.45 −4.30** −4.39** −0.59 −0.53
**indicates that the difference between two subpopulations is significantat P < 0.01
Liu et al. BMC Genetics (2017) 18:89 Page 7 of 9

Additional files
Additional file 1: Table S1. Origins and Q values of the varieties usedin the present study. All varieties used in this study were pure linevarieties. Bold varieties have Q < 0.900 and could not be assigned to anysubpopulation. (XLS 82 kb)
Additional file 2: Table S2. Summary statistics for the 261 SSR markersused in the present study. (DOCX 56 kb)
Additional file 3: Figure S1. Population genetic architecture analysis of177 varieties. Effects of changes in log-likelihood function value (a) andthe ΔK value (b) on the number of subpopulations and the posteriorprobabilities of 177 varieties belonging to seven subpopulations (c). Eachvariety is represented by a vertical bar. The coloured subsections withineach vertical bar indicate the membership coefficients (Q) of each varietyin different subpopulations. The identified subpopulations are sp1 (red),sp2 (green), sp3 (navy blue), sp4 (yellow), sp5 (purple), sp6 (light blue), andsp7 (brown). (TIFF 291 kb)
Additional file 4: Figure S2. Distribution of the linkage disequilibriumr2 values between the unlinked SSRs for the seven subpopulations. The75th percentiles of the r2 values for the seven subpopulations areindicated. (TIFF 287 kb)
Additional file 5: Figure S3. Relationship between the r2 value andgenetic distance for the linked SSR marker pairs for the seven subpopulations.The horizontal line indicates the 75th percentile determined for thedistribution of the unlinked SSRs. (TIFF 766 kb)
Additional file 6: Table S3. Marker-trait association loci with P < 0.01determined by the GLM and MLM analyses, their FDRs, proportions ofphenotypic variance explained, AAE values, and marker positions on thechromosome derived for 261 markers and 160 rice varieties. (DOCX 27 kb)
Additional file 7: Table S4. Alleles at seven maker-trait loci in typicalcarrier varieties. ‘√’ indicates that the variety has the positive allele, and ‘Δ’indicates that the variety has the negative allele. (DOCX 22 kb)
Additional file 8: Table S5. Comparison of SSR markers identified inthis study and genes or QTLs reported in previous studies. The physicalpositions of the third and fifth columns were determined based on datafrom Gramene (http://www.gramene.org/markers) and NCBI (http://blast.ncbinlm.nih.gov/Blast.cgi). (DOCX 19 kb)
Additional file 9: Table S6. Grain plumpness of 177 rice accessions atthree locations in 2013 and 2014. (XLSX 148 kb)
Additional file 10: Table S7. Genotypes of 177 rice accessions with261 SSR markers on 12 chromosomes. (XLSX 244 kb)
AbbreviationsAAE: Average allele effect; ANOVA: Analysis of variance; FDR: False discoveryrate; FST: Coefficient of genetic differentiation; GLM: General linear model;GP: Grain plumpness; H2
B: Broad-sense heritability; LD: Linkage disequilibrium;MLM: Mixed linear model; PIC: Polymorphism information content;PVE: Phenotypic variation explained; SSR: Simple sequence repeat
AcknowledgmentsWe thank the Henan Academy of Agricultural Sciences for help with fieldplanting in Xinyang Farm and Yuanyang Farm.
FundingThis work was supported by the National Natural Science Foundation ofChina (31571743), a grant from the doctoral fund of the Educational Ministryof China (20130097110001) and a special programme of scientific researchbelonging to the Educational Ministry of China (KYZ2012–9).
Availability of data and materialsThe raw genotype data and phenotype data are available in theAdditional files 9 and 10.
Authors’ contributionsDH and EL conceived and designed the experiments. EL, SZ, XC, XD, LL, HW,ZD and YL conducted the experiments. EL and SZ analysed the data andwrote the manuscript. All authors read and approved the final manuscript.
Ethics approval and consent to participateAll the rice seeds used in this research were collected and maintained in ourlaboratory during long-term rice science studies. Accession numbers 1–148were obtained from Dr. Weidong Jin, the former PhD student guided by thecorresponding author (Rf. Doi:https://doi.org/10.1360/biodiv.060189). Accessionnumbers 149-177 were obtained from Mr. Nguyen Phuong Tung, the formerinternational student from Vietnam studying in Nanjing Agricultural Universityfor MS degree guided by the corresponding author (Rf. Doi:10.3969/J.issn.1001-7216.2014.03.004).
Consent for publicationNot applicable.
Competing interestsThe authors declare that the research was conducted in the absence of anycommercial or financial relationship that could be construed as a potentialconflict of interest.
Publisher’s NoteSpringer Nature remains neutral with regard to jurisdictional claims inpublished maps and institutional affiliations.
Received: 30 June 2017 Accepted: 4 October 2017
References1. Fageria N. Yield physiology of rice. J Plant Nutr. 2007;30:843–79.2. Khush G. Green revolution: preparing for the 21st century. Genome. 1999;42:
646–55.3. Zhang Q. Strategies for developing green super rice. Proc Natl Acad Sci U S A.
2007;104:16402–9.4. Kato T, Takeda K. Associations among characters related to yield sink
capacity in space-planted rice. Crop Sci. 1996;36:1135–9.5. Fan C, Xing Y, Mao H, Lu T, Han B, Xu C, et al. GS3, a major QTL for grain
length and weight and minor QTL for grain width and thickness in rice,encodes a putative transmembrane protein. Theor Appl Genet. 2006;112:1164–71.
6. Mao H, Sun S, Yao J, Wang C, Yu S, Xu C, et al. Linking differential domainfunctions of the GS3 protein to natural variation of grain size in rice. ProcNatl Acad Sci U S A. 2010;107:19579–84.
7. Zhang X, Wang J, Huang J, Lan H, Wang C, Yin C, et al. Rare allele ofOsPPKL1 associated with grain length causes extra-large grain and asignificant yield increase in rice. Proc Natl Acad Sci U S A. 2012;109:21534–9.
8. Wang Y, Xiong G, Hu J, Jiang L, Yu H, Xu J, et al. Copy number variation atthe GL7 locus contributes to grain size diversity in rice. Nat Genet. 2015;47:944–8.
9. Heang D, Sassa H. Antagonistic actions of HLH/bHLH proteins are involvedin grain length and weight in rice. PLoS One. 2012;7:e31325.
10. Heang D, Sassa H. An atypical bHLH protein encoded by POSITIVEREGULATOR OF GRAIN LENGTH 2 is involved in controlling grain length andweight of rice through interaction with a typical bHLH protein APG. BreedSci. 2012;62:133–41.
11. Song X, Huang W, Shi M, Zhu M, Lin H. A QTL for rice grain width andweight encodes a previously unknown RING-type E3 ubiquitin ligase. NatGenet. 2007;39:623–30.
12. Shomura A, Izawa T, Ebana K, Ebitani T, Kanegae H, Konishi S, et al. Deletionin a gene associated with grain size increased yields during ricedomestication. Nat Genet. 2008;40:1023–8.
13. Weng J, Gu S, Wan X, Gao H, Guo T, Su N, et al. Isolation and initialcharacterization of GW5, a major QTL associated with rice grain width andweight. Cell Res. 2008;18:1199–209.
14. Li Y, Fan C, Xing Y, Jiang Y, Luo L, Sun L, et al. Natural variation in GS5 playsan important role in regulating grain size and yield in rice. Nat Genet. 2011;43:1266–U134.
15. Wang S, Wu K, Yuan Q, Liu X, Liu Z, Lin X, et al. Control of grain size, shapeand quality by OsSPL16 in rice. Nat Genet. 2012;44:950–4.
16. Yuan L. Increasing yield potential in rice by exploitation of heterosis. In:Virmani S, editor. Hybrid rice technology: new developments and futureprospects. Manila: International Rice Research Institute; 1994. p. 7–62.
Liu et al. BMC Genetics (2017) 18:89 Page 8 of 9

17. Hong D, Leng Y. Genetic analysis of heterosis for number of spikelets perpanicle and panicle length of F1 hybrids in japonica rice hybrids. Chin JRice Sci. 2004;11:255.
18. Niu A, Lu X, Song C. Mapping of QTLs controlling grain plumpness of riceusing doubled haploid lines. J Wuhan Bot Res. 2004;22:477–81.
19. Takai T, Fukuta Y, Shiraiwa T, Horie T. Time-related mapping of quantitativetrait loci controlling grain-filling in rice (Oryza Sativa L.). J Exp Bot. 2005;56:2107–18.
20. Jia X, Yem J, Miao L, Lin H, Lin W. Genetic analysis for grain-filling rate usingrecombinant inbred lines of (Oryza sativa L.). Chin Agric Sci Bull. 2012;28:22–6.
21. Hirose T, Scofield G, Terao T. An expression analysis profile for the entiresucrose synthase gene family in rice. Plant Sci. 2008;174:534–43.
22. Hirose T, Takano M, Terao T. Cell wall invertase in developing rice caryopsis:molecular cloning of OsCIN1 and analysis of its expression in relation to itsrole in grain filling. Plant Cell Physiol. 2002;43:452–9.
23. Wang E, Wang J, Zhu X, Hao W, Wang L, Li Q, et al. Control of rice grain-filling and yield by a gene with a potential signature of domestication. NatGenet. 2008;40:1370–4.
24. Dang X, Thi T, Edzesi W, Liang L, Liu Q, Liu E, et al. Population geneticstructure of Oryza Sativa in east and Southeast Asia and the discovery ofelite alleles for grain traits. Sci Rep. 2015;5:11254.
25. Liu E, Liu Y, Wu G, Zeng S, Thi T, Liang L, et al. Identification of a candidategene for panicle length in rice (Oryza Sativa L.) via association and linkageanalysis. Front. Plant Sci. 2016;7:596.
26. Dang X, Thi T, Dong G, Wang H, Edzesi W, Hong D. Genetic diversity andassociation mapping of seed vigor in rice (Oryza Sativa L.). Planta. 2014;239:1309–19.
27. Yang J, Zhang J. Grain-filling problem in ‘super’ rice. J Exp Bot. 2010;61:1–4.28. Wang L, Liu W, Xu Y, He Y, Luo L, Xing Y, et al. Genetic basis of 17 traits and
viscosity parameters characterizing the eating and cooking quality of ricegrain. Theor Appl Genet. 2007;115:463–76.
29. Falush D, Stephens M, Pritchard J. Inference of population structure usingmultilocus genotype data: dominant markers and null alleles. Mol EcolNotes. 2007;7:574–8.
30. Nei MF, Tajima F, Tateno Y. Accuracy of estimated phylogenetic trees frommolecular data. II. Gene frequency data. J Mol Evol. 1983;19:153–70.
31. Dang X, Liu E, Liang Y, Liu Q, Breria C, Hong D. QTL detection and elitealleles mining for stigma traits in Oryza Sativa by association mapping.Front Plant Sci. 2016;7:1188.
32. Weir B, Hill W. Estimating F-statistics. Annu Rev Genet. 2002;36:721–50.33. Excoffier L, Laval G, Schneider S. Arlequin (version 3.0): an integrated
software package for population genetics data analysis. Evol Bioinforma.2005;1:47–50.
34. Gupta P, Rustgi S, Kulwal P. Linkage disequilibrium and association studiesin higher plants: present status and future prospects. Plant Mol Biol. 2005;57:461–85.
35. Bradbury P, Zhang Z, Kroon D, Casstevens T, Ramdoss Y, Buckler E. TASSEL:software for association mapping of complex traits in diverse samples.Bioinformatics. 2007;23:2633–5.
36. Edzesi W, Dang X, Liang L, Liu E, Zaid I, Hong D. Genetic diversity and eliteallele mining for grain traits in rice (Oryza Sativa L.) by association mapping.Front Plant Sci. 2016;7:787.
37. Hardy O, Vekemans X. SPAGEDi: a versatile computer program to analysespatial genetic structure at the individual or population levels. Mol EcolNotes. 2002;2:618–20.
38. Benjamini Y, Hochberg Y. Controlling the false discovery rate: a practicaland powerful approach to multiple testing. J Roy Stat Soc B Met. 1995;57:289–300.
39. Breseghello F, Sorrells M. Association mapping of kernel size and millingquality in wheat (Triticum Aestivum L.) cultivars. Genetics. 2006;172:1165–77.
40. Virmani SS, Aquino RC, Khush GS. Heterosis breeding in rice (Oryza Sativa L.).Theor Appl Genet. 1982;63:373–80.
41. Pritchard J, Stephens M, Donnelly P. Inference of population structure usingmultilocus genotype data. Genetics. 2000;155:945–59.
42. Vigouroux Y, Matsuoka Y, Doebley J. Directional evolution for microsatellitesize in maize. Mol Biol Evol. 2003;20:1480–3.
43. Rubinsztein D, Amos W, Leggo J, Goodburn S, Jain S, Li S, et al.Microsatellite evolution - evidence for directionality and variation in ratebetween species. Nat Genet. 1995;10:337–43.
44. Vigouroux Y, Jaqueth J, Matsuoka Y, Smith O, Beavis W, Smith J, et al. Rateand pattern of mutation at microsatellite loci in maize. Mol Biol Evol. 2002;19:1251–60.
45. Liu E, Liu X, Zeng S, Zhao K, Zhu C, Liu Y, et al. Time-course associationmapping of the grain-filling rate in rice (Oryza Sativa L.). PLoS One. 2015;10:e0119959.
• We accept pre-submission inquiries
• Our selector tool helps you to find the most relevant journal
• We provide round the clock customer support
• Convenient online submission
• Thorough peer review
• Inclusion in PubMed and all major indexing services
• Maximum visibility for your research
Submit your manuscript atwww.biomedcentral.com/submit
Submit your next manuscript to BioMed Central and we will help you at every step:
Liu et al. BMC Genetics (2017) 18:89 Page 9 of 9