Low penetrance breast cancer susceptibility loci are associated with specific breast tumor subtypes:...
15
Low penetrance breast cancer susceptibility loci are associated with specific breast tumor subtypes: findings from the Breast Cancer Association Consortium Annegien Broeks 1, ∗, { , Marjanka K. Schmidt 1,2, { , Mark E. Sherman 4, { , Fergus J. Couch 5,6, { , John L. Hopper 7 , Gillian S. Dite 7 , Carmel Apicella 7 , Letitia D. Smith 8 , Fleur Hammet 8 , Melissa C. Southey 8 , Laura J. Van ’t Veer 1,3 , Renate de Groot 3 , Vincent T.H.B.M. Smit 9 , Peter A. Fasching 10 , Matthias W. Beckmann 11 , Sebastian Jud 11 , Arif B. Ekici 14 , Arndt Hartmann 12 , Alexander Hein 11 , Ruediger Schulz-Wendtland 13 , Barbara Burwinkel 15,17 , Frederik Marme 15 , Andreas Schneeweiss 15 , Hans-Peter Sinn 16 , Christof Sohn 15 , Sandrine Tchatchou 15,17 , Stig E. Bojesen 19,20 , Børge G. Nordestgaard 19,20 , Henrik Flyger 19,20 , David D. Ørsted 19,20 , Diljit Kaur-Knudsen 19,20 , Roger L. Milne 21 , Jose I. Arias Pe ´rez 23 , Pilar Zamora 25 , Primitiva Mene ´ ndez Rodrı ´guez 24 , Javier Benı ´tez 22,26 , Hiltrud Brauch 27,28 , Christina Justenhoven 27,28 , Yon-Dschun Ko 29 , The Genica Network 30,31 , Ute Hamann 32 , Hans-Peter Fischer 33 , Thomas Bru ¨ ning 34 , Beate Pesch 34 , Jenny Chang-Claude 18 , Shan Wang-Gohrke 35 , Michael Bremer 36 , Johann H. Karstens 36 , Peter Hillemanns 37 , Thilo Do ¨ rk 37 , Heli A. Nevanlinna 38 , Tuomas Heikkinen 38 , Pa ¨ ivi Heikkila ¨ 40 , Carl Blomqvist 41 , Kristiina Aittoma ¨ki 39 , Kirsimari Aaltonen 38,41 , Annika Lindblom 42 , Sara Margolin 43 , Arto Mannermaa 45,46 , Veli-Matti Kosma 45,46 , Jaana M. Kauppinen 45,46 , Vesa Kataja 47 , Pa ¨ ivi Auvinen 48 , Matti Eskelinen 49 , Ylermi Soini 45,46 , Georgia Chenevix-Trench 50 , Amanda B. Spurdle 50 , Jonathan Beesley 50 , Xiaoqing Chen 50 , Helene Holland 50 , kConFab 51 , AOCS 50,51 , Diether Lambrechts 52 , Bart Claes 52 , Thijs Vandorpe 53 , Patrick Neven 53 , Hans Wildiers 53 , Dieter Flesch-Janys 54 , Rebecca Hein 18 , Thomas Lo ¨ ning 55 , Matthew Kosel 5,6 , Zachary S. Fredericksen 5,6 , Xianshu Wang 5,6 , Graham G. Giles 57 , Laura Baglietto 58 , Gianluca Severi 57 , Catriona McLean 58 , Christopher A. Haiman 59 , Brian E. Henderson 59 , Loic Le Marchand 60 , Laurence N. Kolonel 60 , Grethe Grenaker Alnæs 61 , Vessela Kristensen 61,62 , Anne-Lise Børresen-Dale 61,62 , David J. Hunter 63,64 , Susan E. Hankinson 63,64 , Irene L. Andrulis 65,66,67 , Anna Marie Mulligan 67,68 , Frances P. O’Malley 67,69 , Peter Devilee 70 , Petra E.A. Huijts 71 , Rob A.E.M. Tollenaar 72 , Christi J. Van Asperen 71 , Caroline S. Seynaeve 73 , Stephen J. Chanock 74 , Jolanta Lissowska 75 , Louise Brinton 76 , Beata Peplonska 77 , Jonine Figueroa 4 , Xiaohong R. Yang 4 , Maartje J. Hooning 78 , Antoinette Hollestelle 78 , Rogier A. Oldenburg 79 , Agnes Jager 78 , Mieke Kriege 78 , Bahar Ozturk 78 , # The Author 2011. Published by Oxford University Press. All rights reserved. For Permissions, please email: [email protected] ∗ To whom correspondence should be addressed at: Division of Experimental Therapy C2, The Netherlands Cancer Institute, Plesmanlaan 121, 1066 CX Amsterdam, the Netherlands. Tel: +31 205122037; Fax: +31 205122035; Email: [email protected] † The authors wish it to be known that, in their opinion, the first four authors should be regarded as joint First Authors and together with the last two as the writing group. Human Molecular Genetics, 2011, Vol. 20, No. 16 3289–3303 doi:10.1093/hmg/ddr228 Advance Access published on May 19, 2011
-
Upload
independent -
Category
Documents
-
view
0 -
download
0
Transcript of Low penetrance breast cancer susceptibility loci are associated with specific breast tumor subtypes:...
Low penetrance breast cancer susceptibilityloci are associated with specific breast tumorsubtypes: findings from the Breast CancerAssociation Consortium
Annegien Broeks1,∗,{, Marjanka K. Schmidt1,2,{, Mark E. Sherman4,{, Fergus J. Couch5,6,{,
John L. Hopper7, Gillian S. Dite7, Carmel Apicella7, Letitia D. Smith8, Fleur Hammet8,
Melissa C. Southey8, Laura J. Van ’t Veer1,3, Renate de Groot3, Vincent T.H.B.M. Smit9,
Peter A. Fasching10, Matthias W. Beckmann11, Sebastian Jud11, Arif B. Ekici14,
Arndt Hartmann12, Alexander Hein11, Ruediger Schulz-Wendtland13, Barbara Burwinkel15,17,
Frederik Marme15, Andreas Schneeweiss15, Hans-Peter Sinn16, Christof Sohn15,
Sandrine Tchatchou15,17, Stig E. Bojesen19,20, Børge G. Nordestgaard19,20, Henrik Flyger19,20,
David D. Ørsted19,20, Diljit Kaur-Knudsen19,20, Roger L. Milne21, Jose I. Arias Perez23,
Pilar Zamora25, Primitiva Menendez Rodrıguez24, Javier Benıtez22,26, Hiltrud Brauch27,28,
Christina Justenhoven27,28, Yon-Dschun Ko29, The Genica Network30,31, Ute Hamann32,
Hans-Peter Fischer33, Thomas Bruning34, Beate Pesch34, Jenny Chang-Claude18,
Shan Wang-Gohrke35, Michael Bremer36, Johann H. Karstens36, Peter Hillemanns37,
Thilo Dork37, Heli A. Nevanlinna38, Tuomas Heikkinen38, Paivi Heikkila40, Carl Blomqvist41,
Kristiina Aittomaki39, Kirsimari Aaltonen38,41, Annika Lindblom42, Sara Margolin43,
Arto Mannermaa45,46, Veli-Matti Kosma45,46, Jaana M. Kauppinen45,46, Vesa Kataja47,
Paivi Auvinen48, Matti Eskelinen49, Ylermi Soini45,46, Georgia Chenevix-Trench50,
Amanda B. Spurdle50, Jonathan Beesley50, Xiaoqing Chen50, Helene Holland50, kConFab51,
AOCS50,51, Diether Lambrechts52, Bart Claes52, Thijs Vandorpe53, Patrick Neven53,
Hans Wildiers53, Dieter Flesch-Janys54, Rebecca Hein18, Thomas Loning55, Matthew Kosel5,6,
Zachary S. Fredericksen5,6, Xianshu Wang5,6, Graham G. Giles57, Laura Baglietto58,
Gianluca Severi57, Catriona McLean58, Christopher A. Haiman59, Brian E. Henderson59,
Loic Le Marchand60, Laurence N. Kolonel60, Grethe Grenaker Alnæs61, Vessela Kristensen61,62,
Anne-Lise Børresen-Dale61,62, David J. Hunter63,64, Susan E. Hankinson63,64,
Irene L. Andrulis65,66,67, Anna Marie Mulligan67,68, Frances P. O’Malley67,69, Peter Devilee70,
Petra E.A. Huijts71, Rob A.E.M. Tollenaar72, Christi J. Van Asperen71, Caroline S. Seynaeve73,
Stephen J. Chanock74, Jolanta Lissowska75, Louise Brinton76, Beata Peplonska77,
Jonine Figueroa4, Xiaohong R. Yang4, Maartje J. Hooning78, Antoinette Hollestelle78,
Rogier A. Oldenburg79, Agnes Jager78, Mieke Kriege78, Bahar Ozturk78,
# The Author 2011. Published by Oxford University Press. All rights reserved.For Permissions, please email: [email protected]
∗To whom correspondence should be addressed at: Division of Experimental Therapy C2, The Netherlands Cancer Institute, Plesmanlaan 121,1066 CX Amsterdam, the Netherlands. Tel: +31 205122037; Fax: +31 205122035; Email: [email protected]†The authors wish it to be known that, in their opinion, the first four authors should be regarded as joint First Authors and together with the last two asthe writing group.
Human Molecular Genetics, 2011, Vol. 20, No. 16 3289–3303doi:10.1093/hmg/ddr228Advance Access published on May 19, 2011

Geert J.L.H. van Leenders80, Per Hall44, Kamila Czene44, Keith Humphreys44, Jianjun Liu81
Angela Cox82, Daniel Connley82, Helen E. Cramp82, Simon S. Cross83,
Sabapathy P. Balasubramanian84, Malcolm W.R. Reed84, Alison M. Dunning85,
Douglas F. Easton86, Manjeet K. Humphreys86, Carlos Caldas85, Fiona Blows85, Kristy Driver85,
Elena Provenzano85, Jan Lubinski87, Anna Jakubowska87, Tomasz Huzarski87,
Tomasz Byrski87, Cezary Cybulski87, Bohdan Gorski87, Jacek Gronwald87, Paul Brennan88,
Suleeporn Sangrajrang89, Valerie Gaborieau88, Chen-Yang Shen90,91, Chia-Ni Hsiung90,
Jyh-Cherng Yu92, Shou-Tung Chen94, Giu-Cheng Hsu93, Ming-Feng Hou95,
Chiun-Sheng Huang96, Hoda Anton-Culver97, Argyrios Ziogas97, Paul D.P. Pharoah85,86{ and
Montserrat Garcia-Closas4,85,86{
1Department of Experimental Therapy, 2Department of Epidemiology and 3Department of Molecular Pathology, The
Netherlands Cancer Institute, Amsterdam, the Netherlands, 4Division of Cancer Epidemiology and Genetics, National
Cancer Institute, Rockville, MD, USA, 5Department of Laboratory Medicine and Pathology and 6Department of Health
Sciences Research, Mayo Clinic, Rochester, MN, USA, 7Centre for Molecular, Environmental, Genetic and Analytic
Epidemiology and 8Genetic Epidemiology Laboratory, Department of Pathology, The University of Melbourne,
Australia, 9Department of Pathology, Leiden University Medical Centre, Leiden, the Netherlands, 10Division of
Hematology and Oncology, David Geffen School of Medicine, University of California at Los Angeles, Los Angeles,
CA, USA, 11Department of Gynecology and Obstetrics, 12Institute of Pathology, 13Institute of Radiology, University
Breast Center, University Hospital Erlangen, Erlangen, Germany, 14Institute of Human Genetics, Friedrich Alexander
University Erlangen, Nurnberg, Germany, 15Department of Gynecology and Obstetrics and 16Department of
Pathology, University Hospital Heidelberg, Heidelberg, Germany, 17Molecular Epidemiology and 18Division of Cancer
Epidemiology, German Cancer Research Center, Heidelberg, Germany, 19Department of Clinical Biochemistry and20Department of Breast Surgery, Herlev University Hospital, University of Copenhagen, Copenhagen, Denmark,21Genetic & Molecular Epidemiology Group and 22Human Cancer Genetic Group, Spanish National Cancer Research
Centre (CNIO), Madrid, Spain, 23Servicio Cirugıa General and 24Servicio de Anatomıa Patologica, Hospital Monte
Naranco, Oviedo, Spain, 25Servicio de Oncologıa Medica, Hospital La Paz, Madrid, Spain, 26CIBERER, Madrid,
Spain, 27Dr. Margarete Fischer-Bosch-Institute of Clinical Pharmacology, Stuttgart, Germany, 28University Tubingen,
Tubingen, Germany, 29Department of Internal Medicine, Evangelische Kliniken Bonn gGmbH, Johanniter
Krankenhaus, Bonn, Germany, 30Institute of Pathology, Medical Faculty of the University of Bonn, Germany, 31BGFA -
Research Institute of Occupational Medicine of the German Social Accident Insurance, Ruhr University Bochum,
Germany, 32Molecular Genetics of Breast Cancer, Deutsches Krebsforschungszentrum (DKFZ), Heidelberg,
Germany, 33Institute of Pathology, Medical Faculty of the University of Bonn, Bonn, Germany, 34Institute of Prevention
and Occupational Medicine of the German Social Accident Insurance (IPA), Bochum, Germany, 35Department of
Obstetrics and Gynecology, University of Ulm, Ulm, Germany, 36Hannover Medical School, Clinics of Radiation
Oncology, Hannover, Germany, 37Clinics of Obstetrics and Gynaecology, Hannover, Germany, 38Department of
Obstetrics and Gynecology, 39Department of Clinical Genetics, 40Department of Pathology and 41Department of
Oncology, Helsinki University Central Hospital, Helsinki, Finland, 42Department of Molecular Medicine and Surgery,43Department of Oncology and Pathology and 44Department of Medical Epidemiology and Biostatistics, Karolinska
Institute, Stockholm, Sweden, 45Department of Pathology, Institute of Clinical Medicine, University of Eastern Finland
and Kuopio University Hospital, Kuopio, Finland, 46Biocenter Kuopio, Kuopio, Finland, 47Department of Oncology,
Vaasa Central Hospital, Vaasa, Finland, 48Department of Oncology and 49Department of Surgery, Kuopio University
Hospital, Kuopio, Finland, 50Queensland Institute of Medical Research, Brisbane, Australia, 51Peter MacCallum
Cancer Centre, Melbourne, Australia, 52Vesalius Research Center, KU Leuven and VIB, Leuven, Belgium,53Multidisciplinary Breast Center, University Hospitals Leuven, Belgium, 54Institute for Medical Biometrics and
Epidemiology, University Clinic Hamburg-Eppendorf, Germany, 55Albertinen Pathology Department, Hamburg,
Germany, 56Department of Pathology, University Hospital, Heidelberg, Germany, 57Cancer Epidemiology Centre, The
Cancer Council Victoria, Melbourne, Australia, 58Department of Anatomical Pathology, Alfred Hospital, Melbourne,
3290 Human Molecular Genetics, 2011, Vol. 20, No. 16

Australia, 59Department of Preventive Medicine, Keck School of Medicine and Norris Comprehensive Cancer Center,
University of Southern California, Los Angeles, CA 90089, USA, 60Epidemiology Program, Cancer Research Center,
University of Hawaii, Honolulu, HI 96813, USA, 61Department of Genetics, Institute for Cancer Research, Oslo
University Hospital, Radiumhospitalet, Montebello 0310, Oslo, Norway, 62Faculty of Medicine (Faculty Division Ahus),
UiO, Norway, 63Channing Laboratory, Department of Medicine, Brigham and Womens Hospital and Harvard Medical
school, Boston, MA, USA, 64Department of Epidemiology, Harvard school of public health, Boston, MA, USA,65Samuel Lunenfeld Research Institute, Mount Sinai Hospital, Ontario Cancer Genetics Network, Cancer Care
Ontario, Ontario, Canada, 66Department of Molecular Genetics and 67Laboratory Medicine and Pathobiology,
University of Toronto, Toronto, Ontario, Canada, 68Keenan Research Centre, Li Ka Shing Knowledge Institute of St
Michael’s Hospital, Toronto, Ontario, Canada, 69The Department of Laboratory Medicine and the Keenan Research
Centre of the Li Ka Shing Knowledge Institute, St Michael’s Hospital, Toronto, Ontario, Canada 70Department Human
Genetics & Department of Pathology, 71Clinical Genetics and 72Surgical Oncology, Leiden University Medical Center,
Leiden, The Netherlands, 73Department of Medical Oncology, Rotterdam Family Cancer Clinic, Erasmus MC-Daniel
den Hoed Cancer Center, Rotterdam, The Netherlands, 74Advanced Technology Center, National Cancer Institute,
Gaithersburg, MD 20892-4605, USA, 75Department of Cancer Epidemiology and Prevention, Cancer Center and
M. Sklodowska-Curie Institute of Oncology, 02-781 Warsaw, Poland, 76Division of Cancer Epidemiology and Genetics,
National Cancer Institute, Rockville, MD 20852-7234, USA, 77Nofer Institute of Occupational Medicine, 91-348 Lodz,
Poland, 78Department of Medical Oncology, 79Department of Clinical Genetics and 80Department of Pathology,
Rotterdam Family Cancer Clinic, Erasmus University Medical Center, Rotterdam, the Netherlands, 81Human Genetics
Laboratory, Genome Institute of Singapore, Singapore, 82Department of Oncology, Institute for Cancer Studies,83Academic Unit of Pathology, Department of Oncology and 84Academic Unit of Surgical Oncology, Department of
Oncology, University of Sheffield Medical School, Sheffield, UK, 85Department of Oncology and 86Department of
Public Health and Primary Care, University of Cambridge, Cambridge, UK, 87Department of Genetics and Pathology,
International Hereditary Cancer Center, Pomeranian Medical University, Szczecin, Poland, 88International agency for
Research on Cancer, Lyon, France, 89National Cancer Institute, Bangkok, Thailand, 90Institute of Biomedical
Sciences, Academia Sinica, Taipei, Taiwan, 91Graduate Institute of Environmental Science, China Medical University,
Taichung, Taiwan, 92Department of Surgery and 93Department of Radiology, Tri-Service General Hospital, Taipei,
Taiwan, 94Department of Surgery, Changhua Christian Hospital, Changhua, Taiwan, 95Department of Surgery,
Kaohsiung Medical University Hospital, Kaohsiung, Taiwan, 96Department of Surgery, National Taiwan University
Hospital, Taipei, Taiwan, 97Department of Epidemiology, University of California at Irvine, Irvine, CA 92697, USA
Received December 17, 2010; Revised May 10, 2011; Accepted May 16, 2011
Breast cancers demonstrate substantial biological, clinical and etiological heterogeneity. We investigatedbreast cancer risk associations of eight susceptibility loci identified in GWAS and two putative susceptibilityloci in candidate genes in relation to specific breast tumor subtypes. Subtypes were defined by five markers(ER, PR, HER2, CK5/6, EGFR) and other pathological and clinical features. Analyses included up to 30 040invasive breast cancer cases and 53 692 controls from 31 studies within the Breast Cancer AssociationConsortium. We confirmed previous reports of stronger associations with ER1 than ER2 tumors for sixof the eight loci identified in GWAS: rs2981582 (10q26) (P-heterogeneity 5 6.1 3 10218), rs3803662 (16q12)(P 5 3.7 3 1025), rs13281615 (8q24) (P 5 0.002), rs13387042 (2q35) (P 5 0.006), rs4973768 (3p24) (P 5 0.003)and rs6504950 (17q23) (P 5 0.002). The two candidate loci, CASP8 (rs1045485, rs17468277) and TGFB1(rs1982073), were most strongly related with the risk of PR negative tumors (P 5 5.1 3 1026 and P 5 4.1 31024, respectively), as previously suggested. Four of the eight loci identified in GWAS were associatedwith triple negative tumors (P ≤ 0.016): rs3803662 (16q12), rs889312 (5q11), rs3817198 (11p15) andrs13387042 (2q35); however, only two of them (16q12 and 2q35) were associated with tumors with the corebasal phenotype (P ≤ 0.002). These analyses are consistent with different biological origins of breast can-cers, and indicate that tumor stratification might help in the identification and characterization of novelrisk factors for breast cancer subtypes. This may eventually result in further improvements in prevention,early detection and treatment.
Human Molecular Genetics, 2011, Vol. 20, No. 16 3291

INTRODUCTION
Breast tumors are biologically and clinically heterogeneous,and consist of several histo-pathological subtypes that areassociated with different disease outcome and responses totreatment (1–4). Epidemiological studies have provided evi-dence that breast cancer risk factors vary by tumor character-istics (5–9). Therefore, detailed characterization of tumorsmay deepen our understanding of breast cancer etiology,facilitate the discovery of novel risk factors and potentiallyenable risk prediction for specific tumor types.
Recent genome-wide association studies (GWAS) haveidentified common variants associated with breast cancerrisk at multiple genetic loci (10–15). In addition, large com-bined analyses of associations have provided evidence forassociation with coding variants in the caspase 8 (CASP8)and transforming growth factor beta 1 (TGFB1) genes (16).For several of these loci, we and others recently reportedon the heterogeneity of genetic associations with risk ofdeveloping tumor subtypes defined by estrogen receptor(ER), progesterone receptor (PR) and other tumor character-istics, with only a few studies reporting on human epidermalgrowth factor receptor-2 (HER2) expression (12–14,17–19).The strongest evidence of heterogeneity to date is for thevariant rs2981582 in intron 2 of the fibroblast growthfactor 2 (FGFR2) gene that has been found to be associatedprimarily with increased risk of ER positive (ER+) disease(12–14,17,18). Further, the genes harboring these suscepti-bility SNPs were found differentially expressed in thebreast cancer subtypes (20). Studies with larger samplesizes and further tumor characterization might be able toidentify additional heterogeneity of breast cancer suscepti-bility loci.
In clinical practice, tumors are routinely classified accord-ing to protein expression of ER, PR and amplification ofHER2 to guide the choice of treatment. More recently, geneexpression profiling studies, primarily on relatively smallsets of cases with frozen tumors, have identified at least fourmajor breast cancer subtypes associated with distinctly differ-ent gene expression patterns and more importantly, a signifi-cant difference in clinical outcome (1,2). These molecularbreast tumor subtypes include the luminal A and B tumorswhich are characterized by the expression of ER/PR andother luminal epithelial cell markers and are associated withthe best clinical outcomes, particularly luminal A tumorsthat often lack HER2 overexpression. Additional subtypesinclude HER2 enriched tumors that tend to be hormone-receptor negative and overexpress HER2, and the basal-liketumors characterized by the expression of basal myoepithelialcell markers and are frequently triple negative tumors(ER2&PR2&HER22) (1,2). Translation into large clinicalor epidemiological studies has been challenging because ofthe limited availability of frozen tumors in these studies,coupled with the costs and technical difficulties in obtaininghigh-quality gene profiling data from paraffin embeddedtumor material. As a result, immunohistochemistry (IHC) sur-rogate panels based on the expression of three markers used inroutine clinical practice (ER, PR, HER2) and two basalmarkers, cytokeratin 5/6 (CK5/6) and epidermal growthfactor receptor (EGFR), have been used to identify breast
tumor subtypes in large studies, although the correspondencewith subtypes defined by expression profiling is only approxi-mate (21–26).
In this study, we investigated whether common breastcancer susceptibility loci were associated with specific tumorsubtypes defined by five markers (ER, PR, HER2, CK5/6and EGFR), as well as other important tumor characteristics(histology, grade of differentiation, tumor size, nodal involve-ment and stage at diagnosis). This report includes analysis ofall known susceptibility loci identified through GWAS at thetime of analyses, [rs2981582 (10q26), rs3803662 (16q12),rs889312 (5q11), rs13281615 (8q24), rs3817198 (11p15),rs13387042 (2q35), rs4973768 (3p24), rs6504950 (17q23)],as well as two putative susceptibility single-nucleotide poly-morphisms (SNPs) in candidate genes [rs1045485/rs17468277 (CASP8) and rs1982073 (TGFB1)] (10–14,16).Analyses were based on data from 31 case–control orcohort studies in the Breast Cancer Association Consortium(BCAC) that included over 30 000 invasive breast tumors,mostly among women of European origin. This paperexpands and refines our previous reports on analyses by ER(and/or PR) status (14,16,17,27) by including up to 11additional studies (representing �20–60% of additionaldata, depending on the specific analysis), as well as threeadditional tumor markers (HER2, CK5/6 and EGFR). Theaddition of these three markers that were used to identifytumors with the triple negative and basal phenotypes is themost novel aspect of this paper. Moreover, the combinedanalysis and the increased sample size are allowing us tomake more definite conclusions than previous reports.
RESULTS
Analyses by ER and PR status of tumors
Most studies (29 out of 31) were conducted in populations ofEuropean background; therefore, the main analyses wererestricted to these women. As expected, all susceptibilityloci identified in previously published GWAS showed highlysignificant associations with breast cancer risk among subjectsincluded in this report, with per-allele ORs similar to thosepreviously reported (Table 1). The two candidate loci inCASP8 and TGFB1 showed weaker evidence than in previousreports based on a smaller number of cases and controls (16).Small differences in risk estimates compared with previouspublications are likely to be due to random variation or over-estimates in original publications with stronger influence ofdata from discovery studies.
Six (10q26, 16q12, 8q24, 2q35, 3p24, 17q23) of the eightloci identified in GWAS exhibited stronger associations withER+ than ER2 tumors (Table 2). Evidence for differencesby ER status was strongest for rs2981582 (10q26) [per-alleleOR ¼ 1.28 (95% CI ¼ 1.24–1.31) for ER+ versus OR ¼1.05 (1.01–1.09) for ER2; case only P-heterogeneity ¼6.1 × 10218] and rs3803662 (16q12) [per-allele OR ¼ 1.26(1.23–1.30) for ER+ versus OR ¼ 1.15 (1.10–1.20) forER2, P-heterogeneity ¼ 3.7 × 1025]. Although associationswere stronger for ER+ than ER2 tumors, all six loci werealso associated with the risk of ER2 tumors (P ≤ 0.021),except for rs6504950 (17q23) [OR for ER2 tumors ¼ 1.00
3292 Human Molecular Genetics, 2011, Vol. 20, No. 16

(0.95–1.05) P ¼ 0.938]. The strongest evidence of associationwith ER2 disease was for SNP rs3803662 (16q12) [per-alleleOR ¼ 1.15 (1.10–1.20) P ¼ 2.1 × 10210]. The other twoGWAS SNPs, rs889312 (5q11) (P-heterogeneity ¼ 0.531)and rs3817198 (11p15) (P-heterogeneity ¼ 0.426), showedno evidence of an association with ER2 status. The associ-ations with the two putative susceptibility loci in the candidategenes, CASP8 and TGFB1, did not appear to differ strongly byER status, although the data for CASP8 suggested a strongerprotective effect against ER2 than ER+ disease (Table 2,P-heterogeneity ¼ 0.038).
To evaluate the combined effects of the ten SNPs on ER+and ER2 disease, we calculated relative risks at the 10th, 50th
and 90th centiles of the polygenic risk distribution by ERstatus under a log-additive (multiplicative) risk model. Calcu-lations were based on estimates of per-allele ORs and allelefrequencies for the nine loci with P , 0.05 for ER+ andeight loci for ER2 shown in Table 2. The estimated risk dis-tribution on a log relative risk scale was approximately normalwith mean close to zero and variances of 0.085 and 0.022 forER+ and ER2 disease, respectively. The relative risk ofbreast cancer for women at the 10th, 50th and 90th centilesof the risk distribution, when compared with the populationaverage, was 0.66, 0.96 and 1.39, respectively, for ER+tumors. The corresponding relative risks for ER2 tumorswere 0.82, 0.99 and 1.20. According to the risk distribution
Table 1. Association between susceptibility loci and breast cancer risk overall among a total of up to 29 studies in populations of European background with dataon ER and/or PR status
Locus Neighborhood genes rs number n studiesa Controls mafb in controls Cases OR 95% CI P-value
Susceptibility loci identified in GWAS10q26 FGRF2 rs2981582 (C/T)c 27 33 908 0.38 25 182 1.22 1.19–1.25 1.5 3 10259
16q12 TOX3/LOC643714 rs3803662 (C/T) 29 34 857 0.27 26 671 1.24 1.20–1.27 3.0 3 10259
5q11 MAP3K1/MGC33648/MIER3 rs889312 (A/C) 28 34 325 0.28 25 830 1.11 1.08–1.14 7.1 3 10216
8q24 FAM84B/c-MYC rs13281615 (A/G) 26 29 849 0.41 23 172 1.11 1.08–1.13 3.5 3 10215
11p15 LSP1/H19 rs3817198 ((T/C) 24 31 891 0.31 23 879 1.06 1.03–1.09 1.0 3 10205
2q35 TNP1/IGFBP5/IGFBP2/TNS1 rs13387042 (G/A) 25 38 120 0.52 26 334 1.14 1.12–1.17 1.7 3 10229
3p24 SLC4A7/NEK10 rs4973768 (C/T) 21 34 386 0.46 22 506 1.11 1.09–1.14 1.1 3 10217
17q23 COX11/STXBP4/TOM1L1 rs6504950 (G/A) 26 34 236 0.28 26 204 0.94 0.92–0.97 3.2 3 10205
Putative susceptibility loci in candidate genes2q33-q34 CASP8 rs1045485; rs17468277
(G/C;C/T)23 36 976 0.13 24 406 0.95 0.92–0.98 0.004
19q13 TGFB1 rs1982073 (G/C) 17 27 745 0.38 16 123 1.04 1.02–1.08 0.003
aFor none of the 10 SNPs, genotype data were available from all 31 studies. Studies in Asian populations are not included in this table (MEC-Japanese, TBCS,TWBCS; see Supplementary Material, Table S7 for estimates in studies of Asian populations). Analyses included only cases with tumor marker information(defined as having at least information on ER and/or PR status).bMinor allele frequency.cMajor/minor allele.
Small differences in point estimates and significance levels compared with previous publications are due to the different inclusion/exclusion criteria for casesand controls. P-value ,0.05 was used to select findings mentioned in the results and discussion sections, and indicated in bold-face. Findings were interpreted inlight of the strength of evidence based on the estimated OR’s, 95% CI, P-values and prior knowledge of the hypothesis being tested.
Table 2. Odds ratios for breast cancer by ER expression in tumors (up to 29 studies in populations of European backgrounda)
Case–control analyses Case onlyER+ tumors versus controls ER2 tumors versus controls
Locus/gene
SNP Controls maf ER+cases
ORb 95% CI P-value ER2
casesORb 95% CI P-value P-valuec
Susceptibility loci identified in GWAS10q26 rs2981582 33 908 0.38 18 310 1.28 1.24–1.31 4.7 × 10273 5613 1.05 1.01–1.09 0.020 6.1 × 10218
16q12 rs3803662 34 857 0.27 19 420 1.26 1.23–1.30 9.6 × 10260 5968 1.15 1.10–1.20 2.1 × 10210 3.7 × 10205
5q11 rs889312 34 325 0.28 18 835 1.11 1.08–1.15 9.3 × 10214 5735 1.09 1.05–1.14 6.0 × 10205 0.5318q24 rs13281615 29 849 0.41 16 888 1.13 1.10–1.16 2.7 × 10218 5098 1.06 1.01–1.10 0.012 0.00211p15 rs3817198 31 891 0.31 17 427 1.07 1.04–1.10 1.4 × 10205 5223 1.05 1.00–1.09 0.056 0.4262q35 rs13387042 38 120 0.52 19 310 1.16 1.13–1.19 8.5 × 10230 5770 1.09 1.05–1.13 2.9 × 10205 0.0063p24 rs4973768 35 104 0.46 17 067 1.13 1.10–1.16 2.8 × 10218 4854 1.05 1.01–1.10 0.021 0.00317q23 rs6504950 34 386 0.28 16 455 0.93 0.90–0.95 7.2 × 10207 4774 1.00 0.95–1.05 0.938 0.002
Putative susceptibility loci in candidate genesCASP8 rs1045485;
rs1746827736 976 0.13 17 805 0.96 0.93–1.00 0.058 5347 0.90 0.84–0.96 0.001 0.038
TGFB1 rs1982073 27 745 0.38 11 495 1.04 1.01–1.08 0.011 3503 1.06 1.00–1.11 0.033 0.540
aDifferences in total number of ER+ (22 866) and ER2 cases (7174), (Supplementary Material, Table S3) is due to missing genotype data.bOR are adjusted by study.cP-value from logistic regression models including only cases, with ER status as the outcome adjusted by study. P-values ,0.05 are indicated in bold-face.
Human Molecular Genetics, 2011, Vol. 20, No. 16 3293

by ER status, the AUC was slightly higher for ER+ (AUC ¼58.2%) than for ER2 disease (AUC ¼ 54.3%).
Analyses by PR status for the eight SNPs identified inGWAS generally showed a similar pattern to that observedby ER status, as would be expected given the positive corre-lation between these two markers (data not shown). On theother hand, the SNPs in CASP8 and TGFB1 showed strongerevidence of differential in associations by PR than ERstatus. In both cases, the strongest statistical evidence for anassociation was with PR2 tumors [CASP8: per-allele OR ¼0.88 (0.83–0.93) P ¼ 5.1 × 1026; TGFB1: OR ¼ 1.09(1.04–1.14) P ¼ 4.1 × 1024; Table 3].
Classification of tumors according to the co-expression ofER and PR status suggested a weaker association ofrs2981582 (10q26) with ER2&PR+ (per-allele OR ¼ 1.14(1.04–1.26) than ER+&PR+ tumors (OR ¼ 1.29 (1.25–1.33) P-heterogeneity ¼ 0.019; data not shown); and aweaker association of rs3803662 (16q12) with ER+&PR2(per-allele OR ¼ 1.16 (1.09–1.23) than ER+&PR+ tumors(OR ¼ 1.28 (1.24–1.33) P-heterogeneity ¼ 0.001; data notshown). These analyses suggest that the variant in 10q26 is pri-marily associated with ER status, whereas rs3803662 (16q12)might be primarily associated with PR status. No other differ-ences (P . 0.10) were found in ORs for ER+&PR2 andER2&PR+ tumors compared with ER+&PR+ tumors (datanot shown). In spite of these relatively small differences,ER+&PR+, ER+&PR2 and ER2&PR+ tumors were com-bined as ER+ and/or PR+ (luminal) tumors before further stra-tification by HER2 status. This decision was made a prioribased on the co-expression of ER and PR in defining tumor sub-types in studies using expression arrays (21–24).
Analyses by ER, PR and HER2 status of tumors
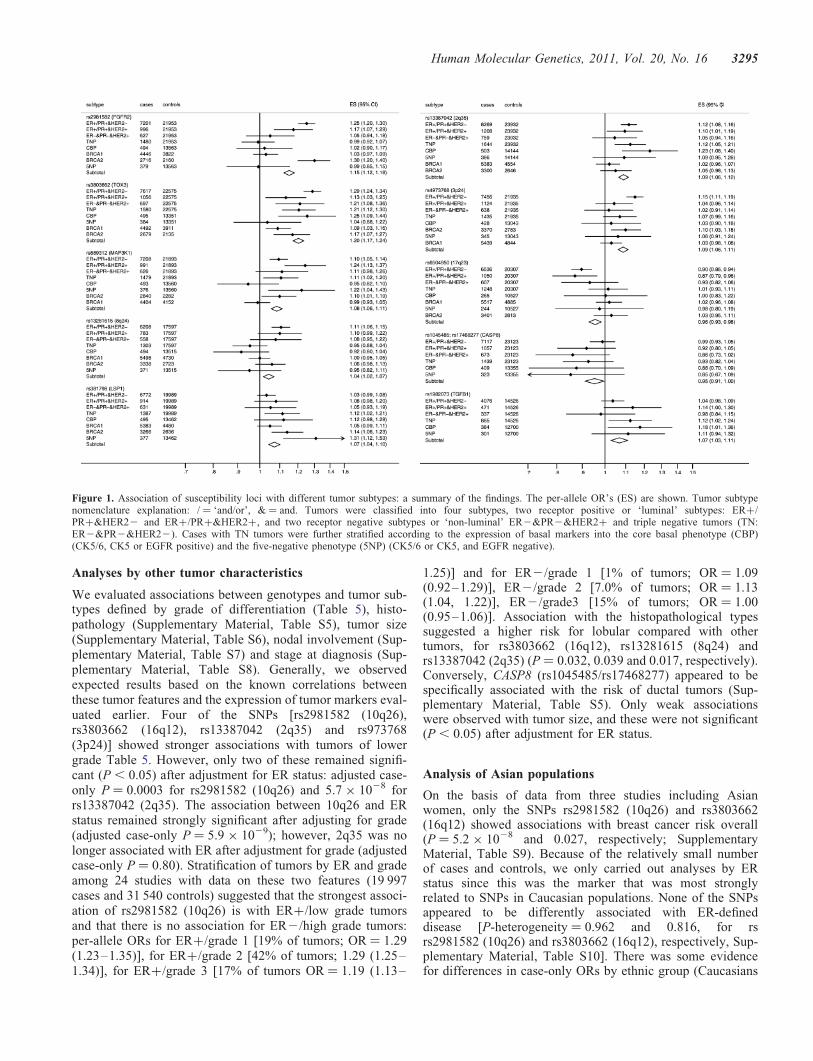
Figure 1 summarizes the findings from analyses of tumor sub-types defined by ER, PR and HER2 (tumor subtype nomencla-ture explanation: / ¼ ‘and/or’, & ¼ and). Within luminaltumors expressing ER and/or PR, three loci showed
differences by HER2 expression: rs3803662 (16q12) andrs4973768 (3p24) showed a stronger association with ER+/PR+&HER22 than ER+/PR+&HER2+ tumors(P-heterogeneity 0.013 and 0.02, respectively), whereasrs889312 (5q11) showed a stronger association with ER+/PR+&HER2+ than ER+/PR+&HER22 tumors(P-heterogeneity ¼ 0.014; Table 4 upper panel).
We found no differences (P ≥ 0.095) in the per-allele ORsfor TN tumors and ER2&PR2&HER2+ tumors for any ofthe SNPs (Table 4, lower panel), although theses analyseswere limited by small numbers of cases in each category. Ofnote, we did not find evidence for an association with TNtumors for the rs2981582 (10q26) [per-allele OR ¼ 0.99(0.92–1.07) P ¼ 0.841] that showed one of the strongestassociations overall with the luminal tumors. However, aneffect size similar to that for all ER2 disease could not beexcluded. Five of the 10 SNPs showed associations (P ≤0.02) with TN disease [rs3803662 (16q12), rs889312 (5q11),rs3817198 (11p15), rs13387042 (2q35) and rs1982073(TGFB1); Table 4]. No additional differences were foundwhen we classified tumors as HER22 and HER2+, indepen-dently of ER and PR status (data not shown).
Analyses by ER, PR, HER2 and basal markers (CK5/6 orCK5 and EGFR2) status of tumors
Figure 1 summarizes the findings from analyses of tumor sub-types defined by ER, PR, HER2 and basal markers. Of the fiveSNPs that showed associations with TN disease, three werealso associated with the risk of core basal phenotype (CBP):rs3803662 (16q12) [per-allele OR ¼ 1.25 (1.09–1.44) P ¼0.001], rs13387042 (2q35) [OR ¼ 1.23 (1.08–1.40) P ¼0.002] and rs1982073 (TGFB1) [OR ¼ 1.18 (1.01–1.36)P ¼ 0.032]. In each case, however, the per-allele OR did notdiffer for TN tumors that did not exhibit basal markers(5NP) when compared with those that did (CBP), P .0.132). The SNPs in 5q11 and 11p15 were associated with5NP but not CBP tumors.
Table 3. Odds ratios for breast cancer by PR expression in tumors for two putative susceptibility loci in CASP8 and TGFB1 (up to 21 studies in populations ofEuropean backgrounda)
Gene/SNP Genotype Controls Case–control analyses Case onlyPR+ tumors versus controls PR2 tumors versus controlsPR+ cases ORb 95% CI P-value PR2 cases ORb 95% CI P-value P-valuec
CASP8 GG/CC 28 109 10 105 1.00 5558 1.00rs1045485/ GC/CT 8206 2833 0.97 0.92–1.02 0.181 1393 0.87 0.81–0.93 2.0 × 10205
rs17468277d CC /TT 661 202 0.83 0.70–0.98 0.026 107 0.81 0.65–1.00 0.047per allele 36 976 13 140 0.95 0.91–0.99 0.027 7058 0.88 0.83–0.93 5.1 × 10206 0.009
TGFB1 GG 10 824 2984 1.00 1649 1.00rs1982073 CG 12 885 3745 1.06 1.00–1.12 0.050 2065 1.04 0.97–1.12 0.278
CC 4036 1164 1.05 0.97–1.14 0.215 752 1.21 1.10–1.33 1.1 × 10204
per allele 27 745 7893 1.03 0.99–1.07 0.091 4466 1.09 1.04–1.14 4.1 × 10204 0.045
aDifferences in total number of PR+ (16 997) and PR2 (9392) cases (Supplementary Material, Table S3) is due to missing genotype data.bOR are adjusted by study.cP-value from logistic regression models including only cases, with PR status as the outcome adjusted by study.dBecause of some technical difficulties (for some technologies) in genotyping the originally reported SNP [rs1045485 (G/C)] in CASP8, another SNP in strong LD[rs17468277 (C/T)] was used as a surrogate (r2 ¼ 1 in HapMap CEU) for a subset of studies. Thirteen studies provided genotype data on rs1045485 and 19 studieson rs17468277. Five of those studies reported genotype data on both SNPs. For individuals that had the two SNPs genotyped, rs17468277 was used. P-values,0.05 are indicated in bold-face.
3294 Human Molecular Genetics, 2011, Vol. 20, No. 16
Analyses by other tumor characteristics
We evaluated associations between genotypes and tumor sub-types defined by grade of differentiation (Table 5), histo-pathology (Supplementary Material, Table S5), tumor size(Supplementary Material, Table S6), nodal involvement (Sup-plementary Material, Table S7) and stage at diagnosis (Sup-plementary Material, Table S8). Generally, we observedexpected results based on the known correlations betweenthese tumor features and the expression of tumor markers eval-uated earlier. Four of the SNPs [rs2981582 (10q26),rs3803662 (16q12), rs13387042 (2q35) and rs973768(3p24)] showed stronger associations with tumors of lowergrade Table 5. However, only two of these remained signifi-cant (P , 0.05) after adjustment for ER status: adjusted case-only P ¼ 0.0003 for rs2981582 (10q26) and 5.7 × 1028 forrs13387042 (2q35). The association between 10q26 and ERstatus remained strongly significant after adjusting for grade(adjusted case-only P ¼ 5.9 × 1029); however, 2q35 was nolonger associated with ER after adjustment for grade (adjustedcase-only P ¼ 0.80). Stratification of tumors by ER and gradeamong 24 studies with data on these two features (19 997cases and 31 540 controls) suggested that the strongest associ-ation of rs2981582 (10q26) is with ER+/low grade tumorsand that there is no association for ER2/high grade tumors:per-allele ORs for ER+/grade 1 [19% of tumors; OR ¼ 1.29(1.23–1.35)], for ER+/grade 2 [42% of tumors; 1.29 (1.25–1.34)], for ER+/grade 3 [17% of tumors OR ¼ 1.19 (1.13–
1.25)] and for ER2/grade 1 [1% of tumors; OR ¼ 1.09(0.92–1.29)], ER2/grade 2 [7.0% of tumors; OR ¼ 1.13(1.04, 1.22)], ER2/grade3 [15% of tumors; OR ¼ 1.00(0.95–1.06)]. Association with the histopathological typessuggested a higher risk for lobular compared with othertumors, for rs3803662 (16q12), rs13281615 (8q24) andrs13387042 (2q35) (P ¼ 0.032, 0.039 and 0.017, respectively).Conversely, CASP8 (rs1045485/rs17468277) appeared to bespecifically associated with the risk of ductal tumors (Sup-plementary Material, Table S5). Only weak associationswere observed with tumor size, and these were not significant(P , 0.05) after adjustment for ER status.
Analysis of Asian populations
On the basis of data from three studies including Asianwomen, only the SNPs rs2981582 (10q26) and rs3803662(16q12) showed associations with breast cancer risk overall(P ¼ 5.2 × 1028 and 0.027, respectively; SupplementaryMaterial, Table S9). Because of the relatively small numberof cases and controls, we only carried out analyses by ERstatus since this was the marker that was most stronglyrelated to SNPs in Caucasian populations. None of the SNPsappeared to be differently associated with ER-defineddisease [P-heterogeneity ¼ 0.962 and 0.816, for rsrs2981582 (10q26) and rs3803662 (16q12), respectively, Sup-plementary Material, Table S10]. There was some evidencefor differences in case-only ORs by ethnic group (Caucasians
Figure 1. Association of susceptibility loci with different tumor subtypes: a summary of the findings. The per-allele OR’s (ES) are shown. Tumor subtypenomenclature explanation: / ¼ ‘and/or’, & ¼ and. Tumors were classified into four subtypes, two receptor positive or ‘luminal’ subtypes: ER+/PR+&HER22 and ER+/PR+&HER2+, and two receptor negative subtypes or ‘non-luminal’ ER2&PR2&HER2+ and triple negative tumors (TN:ER2&PR2&HER22). Cases with TN tumors were further stratified according to the expression of basal markers into the core basal phenotype (CBP)(CK5/6, CK5 or EGFR positive) and the five-negative phenotype (5NP) (CK5/6 or CK5, and EGFR negative).
Human Molecular Genetics, 2011, Vol. 20, No. 16 3295

versus Asians) for rs2981582 (P ¼ 0.042) but not forrs3803662 (P ¼ 0.661). Notably, rs2981582 (10q26) wasmore strongly associated with ER2 disease [OR ¼ 1.34(1.14–1.57)] in Asian compared with European populations.
DISCUSSION
Our data confirm previous reports and provide convincing evi-dence for heterogeneity in the strength of the associations often breast cancer susceptibility loci with respect to the riskof tumor subtypes defined by ER status and grade of differen-tiation of the tumors. In addition, stratification of tumors by
the additional markers provided further insights into etiologi-cal heterogeneity (Fig. 1). These results suggest that low-risksusceptibility loci predict the pathological subtype of breastcancer and provide support for the hypothesis that breasttumor subtypes arise through distinct etiological pathways.
Six out of the eight susceptibility loci previously identifiedthrough GWAS, rs2981582 (10q26), rs3803662 (16q12),rs13281615 (8q24), rs13387042 (2q35), rs4973768 (3p24)and rs6504950 (17q23), showed stronger associations withER+ than ER2 disease. Findings for SNPs in 10q26, 16q12and the 8q24 region have been previously indentified in asubset of this data (16,17), and are confirmed in this reportafter including data from additional studies not available in
Table 5. Odds ratios for breast cancer by grade of differentiation of the tumors (up to 27 studies in populations of European background)
Cases (grade) Grade 1 Grade 2 Grade 3 Case onlyLocus/gene SNP Controls 1 2 3 ORa 95% CI ORa 95% CI ORa 95% CI P-valueb
Susceptibility loci identified in GWAS10q26 rs2981582 31 540 4886 11 380 7475 1.29 1.23–1.34 1.27 1.23–1.31 1.10 1.06–1.14 1.49 × 10210
16q12 rs3803662 32 486 5107 12 034 8042 1.29 1.23–1.35 1.23 1.19–1.27 1.18 1.14–1.23 8.34 × 10204
5q11 rs889312 31 941 4985 11 685 7711 1.09 1.04–1.15 1.11 1.07–1.15 1.10 1.06–1.14 0.8548q24 rs13281615 27 550 4676 10 534 7230 1.13 1.08–1.18 1.14 1.10–1.18 1.07 1.03–1.11 0.02211p15 rs3817198 29 544 4726 10 610 7222 1.09 1.04–1.14 1.07 1.03–1.11 1.08 1.03–1.12 0.9102q35 rs13387042 39 890 5417 12 771 8434 1.24 1.19–1.29 1.16 1.13–1.20 1.07 1.04–1.11 1.06 × 10208
3p24 rs4973768 36 997 5016 11 689 7603 1.17 1.12–1.22 1.11 1.07–1.14 1.08 1.04–1.12 8.96 × 10204
17q23 rs6504950 35 794 4487 10 940 7353 0.94 0.89–0.99 0.91 0.88–0.95 0.97 0.93–1.01 0.083Putative susceptibility loci in candidate genes
CASP8 rs1045485; rs17468277 37 571 4925 11 632 7876 0.93 0.87–0.99 0.97 0.92–1.01 0.95 0.90–1.00 0.764TGFB1 rs1982073 27 361 3479 7778 5088 1.03 0.98–1.09 1.03 1.00–1.07 1.09 1.04–1.13 0.154
aOR are adjusted by study.bP-value from case-only analyses using a polytomous logistic regression model constraining the effect size to increase linearly across levels. P-values ,0.05 areindicated in bold-face.
Table 4. Odds ratios for breast cancer risk by ER, PR and HER2 expression in tumors (18 studies in populations of European background)
Case–control analyses Case onlyControls ER+/PR+&HER22 ER+/PR+&HER2+
Locus/gene SNP n n ORa 95% CI P-value n ORa 95% CI P-value P-valueb
10q26 rs2981582 21 953 7201 1.25 1.20–1.30 2.2 × 10229 996 1.18 1.07–1.29 5.5 × 10204 0.23316q12 rs3803662 22 575 7617 1.29 1.24–1.34 6.8 × 10234 1056 1.13 1.03–1.25 0.011 0.0135q11 rs889312 21 893 7208 1.10 1.05–1.14 2.6 × 10205 991 1.24 1.13–1.37 1.2 × 10205 0.0148q24 rs13281615 17 597 6208 1.11 1.06–1.15 3.2 × 10206 783 1.10 0.99–1.22 0.069 0.96811p15 rs3817198 19 989 6772 1.03 0.99–1.08 0.147 914 1.08 0.98–1.20 0.134 0.3492q35 rs13387042 23 932 8269 1.12 1.08–1.16 1.7 × 10209 1208 1.10 1.01–1.19 0.029 0.6843p24 rs4973768 21 935 7456 1.15 1.11–1.19 6.5 × 10213 1124 1.04 0.96–1.14 0.335 0.02017q23 rs6504950 20 307 6536 0.90 0.86–0.94 2.8 × 10206 1050 0.87 0.79–0.96 0.007 0.577CASP8 rs1045485; rs17468277 23 323 7607 0.99 0.93–1.04 0.633 1117 0.93 0.81–1.06 0.258 0.303TGFB1 rs1982073 14 526 4076 1.03 0.97–1.08 0.327 471 1.15 1.01–1.32 0.035 0.081
Triple negative phenotype ER2&PR2&HER2+ P-valuec
10q26 rs2981582 21 953 1480 0.99 0.92–1.07 0.841 627 1.05 0.94–1.18 0.396 0.15016q12 rs3803662 22 575 1580 1.21 1.11–1.30 3.1 × 10206 697 1.21 1.08–1.36 0.001 0.8275q11 rs889312 21 893 1479 1.11 1.02–1.20 0.016 626 1.11 0.98–1.26 0.094 0.3638q24 rs13281615 17597 1303 0.95 0.88–1.04 0.266 558 1.08 0.95–1.22 0.223 0.09511p15 rs3817198 19 989 1387 1.11 1.03–1.21 0.011 631 1.05 0.93–1.19 0.407 0.4792q35 rs13387042 23 932 1644 1.12 1.05–1.21 0.001 759 1.05 0.94–1.16 0.387 0.2433p24 rs4973768 21935 1435 1.07 0.99–1.16 0.076 638 1.02 0.91–1.14 0.759 0.39217q23 rs6504950 20 307 1248 1.01 0.93–1.11 0.748 607 0.93 0.82–1.06 0.290 0.207CASP8 rs1045485; rs17468277 23 323 1531 0.92 0.82–1.03 0.151 706 0.86 0.73–1.02 0.086 0.267TGFB1 rs1982073 14 526 885 1.11 1.01–1.23 0.038 337 0.98 0.84–1.15 0.809 0.270
aOR are adjusted by study.bP-value from logistic regression models including only cases comparing ER+/PR+&HER2+ versus ER+/PR+& HER22 tumors.cP-value from logistic regression models including only cases comparing non-luminal HER2+ to triple negative tumors. P-values ,0.05 are indicated in bold-face.
3296 Human Molecular Genetics, 2011, Vol. 20, No. 16
the previous publications. Analysis of combined SNP effectsby ER status according to a log-additive polygenetic riskmodel, showed higher relative risks and a slightly higher dis-crimination power for ER+ (AUC ¼ 58.2%) than ER2(AUC ¼ 54.3%) disease, consistent with previous reports (19).
The predominance of loci identified to date that are associ-ated with ER+ disease might reflect that the majority of inva-sive tumors express ER, and thus current GWAS includingcases unselected for ER status had greater power to detectSNPs associated with ER+ disease than those associatedwith a similar relative risk for ER2 disease. Therefore,subtype stratification in GWAS analyses and well-poweredGWAS of more homogenous tumor types could help theidentification of additional breast cancer risk loci. This isexemplified by the discovery of a variant on chromosome19p13 discovered in a GWAS of BRCA1 mutation carrierswho tend to develop TN tumors, and that showed an increasedrisk of ER2 (particularly TN) but not ER+ disease in thegeneral population (28). Studying different ethnic groups canalso lead to the identification of additional loci, such as theloci reported in chromosome 6q25.1, located upstream of thegene encoding ER alpha, which was identified in a GWASin Asian populations, and which was more strongly associatedwith ER2 compared with ER+ disease (15).
Consistent with our previous report, this larger analysis con-firmed that rs2981582 (at 10q26 within FGFR2) is moststrongly associated with ER+/low grade tumors, with noassociation observed for ER2, high-grade tumors. Furtherstratification by the other tumor markers, not included in ourprevious publication, showed the strongest association withER+/PR+&HER22 tumors, and no evidence for an associ-ation with the risk of triple negative tumors or tumors withthe CBP (Fig. 1). FGFR2 is a receptor tyrosine kinase andits strong association with luminal-like tumors is consistentwith the involvement of FGFR2 in estrogen-related breast car-cinogenesis (29). This finding is also consistent with the evi-dence provided by the Consortium of Investigators ofModifiers of BRCA1/2 (CIMBA) consortium; they showedan association of the FGFR2 locus with breast cancer risk inBRCA2 mutation carriers but not in BRCA1 mutation carriers(30,31). CIMBA has evaluated the associations betweencommon susceptibility loci and risk of breast cancer in carriersof BRCA1 and BRCA2 mutations. Although analyses were notstratified by tumor subtypes, BRCA1 carriers tend to develophormone receptor negative tumors, whereas tumors inBRCA2 carriers show similar subtype distributions as tumorsdeveloped in non-carriers (i.e. a predominance of ER+tumors) (32). CIMBA analyses indicated that common suscep-tibility loci identified in populations not selected for carrierstatus have similar associations with risk among BRCA2mutation carriers; however, the evidence for an associationis weaker for BRCA1 carriers (30,31,33).
The rs3803662 (16q12) locus was associated with theincreased risk of all tumor subtypes, with the strongest associ-ation being for ER+/PR+&HER22 tumors (Fig. 1). Thislocus also showed the strongest association with TN tumorsand those with the CBP among the 10 loci examined. Interest-ingly, rs3803662 in 16q12 shows the strongest evidence forassociations with the risk in BRCA1 mutation carriers(30,31,33), and in our data, the SNPs also showed the
strongest evidence for association with the risk of developingtumors with the CBP (Fig. 1). Although this report onlyincludes a relatively small number of tumors with the CBP,our data suggest that they might be a distinct subtype withinTN tumors. The locus at 2q35 was also differentially associ-ated with breast tumor subtypes defined by grade, with thestrongest association being for tumors of low grade.
Although estimates of relative risk for TN tumors (particu-larly the subset of tumors identified as having the CBP), wererelatively imprecise, our data suggest that two SNPs,rs13281615 in the 8q24 region and rs6504950 in the 17q23region, might be associated with an increased risk for alltumor subtypes, except for TN and CBP, On the other hand,rs3817198 (11p15), rs13387042 (2q35) and rs4973768(3p24) seemed to be associated with increased risk of alltumor subtypes. The different patterns of association withspecific tumor subtypes observed in this study suggest thattumor subtypes have some common as well as distinctpathogenic pathways (34).
Previous studies provide strong evidence for a reduced riskassociation between the D302H variant in CASP8 that encodescaspase 8, an important initiator of apoptosis (16). Our datasupport the previous observations that this association mightbe stronger for tumors that do not express PR. The evidencefor a risk association with rs1982073 (L10P) in TGFB1,encoding for the transforming growth factor B1, is weaker(16). Our data suggest that rs1982073 at TGFB1 is associatedwith increased risk of PR negative tumors with aggressivecharacteristics, particularly tumors with the CBP, and tumorsdiagnosed at advanced stages. However, Rebbeck et al. (35)observed that there is no association between TGFB1rs1982073 and breast cancer risk in either BRCA1 or BRCA2mutation carriers. Therefore, additional evidence is neededto confirm a potential association between TGFB1rs1982073 and risk of breast cancer subtypes, particularlysporadic basal-like cancers through mechanisms that mightbe independent of the BRCA1 pathway.
It is unclear whether PR status has an effect on breast car-cinogenesis independent of ER status. About 65% of ER+breast cancers are also PR+, and there is a high correlationbetween ER and PR expression (21,22). Actually, ER2/PR+ tumors (4% in this study) are suspected to be misclassi-fied ER+ tumors. Our data suggest that risk for SNPs in16q12, CASP8 and TGFB1 might be associated with PRexpression, independent of ER expression, indicating that PRmight possibly have a role on tumor etiology beyond itsroles as a co-expressor with ER.
A major strength of our study is the very large sample sizeand consistency of findings across studies, in spite of hetero-geneity of study designs. The majority of subjects includedin this study were of white European origin, with only threestudies including women from Asian populations. Becausethe sample size was considerably smaller for Asian studies,the main conclusions from this manuscript are based on ana-lyses among white European women. Of note, some of thestrongest findings from this study, i.e. the modification ofthe breast cancer risk conferred by loci rs2981582 (10q26)and rs3803662 (16q12) by ER status, were not supported byanalyses in Asian populations. Future studies includinglarger numbers of Asians and subjects of other ethnicities
Human Molecular Genetics, 2011, Vol. 20, No. 16 3297
are necessary to clarify the consistency of findings acrossethnic groups.
A limitation of our study is the use of non-standardized dataon tumor markers, since data were derived from studies usingdifferent tissue collection and processing protocols, IHCassays and criteria for pathology review. In addition, althoughmost cases from studies in this report had data on ER and PRstatus of the tumors, only a subset of studies had data on othertumor markers and the percentage of missing data within thesestudies was higher than that for ER and PR status. Thisresulted in relatively small number of tumors classified by acombination of three or more markers, and thus findingsfrom these analyses need to be interpreted with caution. Forinstance, while we were able to identify 1865 TN tumors,only 509 tumors were classified as having the CBP. As aresult, the power to evaluate associations with these tumorsubtypes, which are known to be characterized by a poorresponse to available treatments, is limited.
Missing data and misclassification probabilities are likely tobe independent of susceptibly loci, and thus would tend tounderestimate associations rather than create spurious associ-ations. Misclassification is likely to be particularly strong forHER2, especially for studies that inferred HER2 status basedon IHC scoring (36). Recently, de Ronde et al. (24) showeda high discordance between HER expression based on IHCand mRNA, 60% of the tumors classified HER2+ by IHCdid not display elevated levels by mRNA expression. Inspite of these limitations, we observed consistent associationsacross studies, indicating that our findings are robust and thatreduction of misclassification and missing data might improveour ability to identify association between risk factors andtumor subtypes (37). To address these limitations, we are cur-rently conducting a study aimed at standardization of scoringof tumor markers in TMA using automated image analysistechnologies, in situ hybridization assays for HER2 amplifica-tion and web based systems for pathological scoring. Thiswork will also provide quantitative or semi-quantitativemeasures of tumor maker expression to evaluate dose–response relationships.
In summary, our data provides strong evidence for etiologi-cal heterogeneity of breast cancer subtypes, particularly thosedefined by the expression of ER status and grade of differen-tiation of the tumors. Future etiological studies should con-sider ER positive and negative tumors as distinct breastcancer subtypes and evaluate the value of additional classifi-cations to expand our understanding of the etiology of this het-erogeneous tumor. Further characterization and understandingof the underlying etiological heterogeneity of breast cancercan provide biological insights on the mechanisms of carcino-genesis, and eventually result in improvement in prevention(population risk stratification in screening programs), earlydetection and treatment.
MATERIALS AND METHODS
Study populations
Thirty-one breast cancer studies participating in BCAC pro-vided tumor marker data on at least ER and/or PR tumorstatus and genotype data for at least one of the 10
susceptibility loci evaluated; rs2981582 (at 10q26 withinFGFR2), rs3803662 (at 16q12 near TOX3, previously indi-cated as TNRC9), rs889312 (at 5q11 near MAP3K1),rs13281615 (at 8q24), rs3817198 (at 11p15 near LSP1),rs13387042 (at 2q35), rs4973768 (at 3p24), rs6504950 (at17q23), rs1045485/rs17468277 (at 2q33-q34 within/nearCASP8) and rs1982073 (at 19q13 within TGFB1). Addition-ally, data on age, gender and ethnicity were provided.Twenty-eight studies included women of European back-ground in Europe, North America and Australia, one study(MEC) included similar numbers of women in the US of Euro-pean and Japanese backgrounds and two studies, from Taiwan(TWBCS) and Thailand (TBCS), included East Asians (seeSupplementary Material, Table S1 for a more detailed descrip-tion of participating studies).
All studies were approved by their institutional review com-mittees and written informed consent was obtained from allparticipants, where applicable.
For studies including mostly women of European back-ground, we excluded from the analyses the small number ofwomen of other ethnic backgrounds to reduce heterogeneitywithin studies. Analyses were restricted to women with inva-sive breast cancer and female controls. This resulted in a totalof 38 360 invasive breast cancer cases and 53 692 controlsfrom 31 case–control or prospective cohort studies eligiblefor study. Twenty of these studies (with a total of 23 839 inva-sive breast cancer cases and 26 928 controls) were included inour previous BCAC report on five breast cancer susceptibilityloci in relation to tumor subtypes defined by ER and PR statusand some pathological characteristics (17). Due to missingtumor marker data, analyses in the present study were basedon a maximum of 30 040 cases with ER data and smallernumber of cases for analyses including other tumor markers.The final numbers of cases and controls with genotype andpathology data included in each analysis are shown in thetables of results.
Pathology and tumor markers
Most studies provided information, regarding the tumors of thecases, on histopathological subtype (27 studies: 75% ductal,14% lobular, 1% medullary and 10% other histologies),grade of differentiation (27 studies: 20% grade 1, 49% grade2 and 31% grade 3+), tumor size (21 studies: 20% 1 cm orless, 43% .1–2 cm and 36% .2 cm), nodal involvement(30 studies with 38% node positive) and stage at diagnosis(23 studies: 51% stage I, 40% stage II, 8% stage III and 2%stage IV). The percentages in brackets represent the distri-bution for each characteristic.
By definition, all studies included in these analyses pro-vided data on ER or PR status of the tumors, and a subset ofstudies also provided data on HER2 (n ¼ 18 studies), CK5/6or CK5 (n ¼ 8 studies) and EGFR (n ¼ 5 studies). Supplemen-tary Material, Table S2 shows the source of information andmethods used by each study to determine tumor markerstatus. The most common source of data for ER, PR andHER2 status was from medical records, followed by IHC per-formed on tumor tissue microarrays (TMAs) or whole sectiontumor slides. Data on CK5/6 (or CK5) and EGFR tumor statuswere derived from IHC performed on TMAs or whole
3298 Human Molecular Genetics, 2011, Vol. 20, No. 16
sections. For the majority of studies, data submitted weredichotomous, i.e. a marker was reported as being positive ornegative for each tumor markers. The cut-offs used in eachstudy are shown in Supplementary Material, Table S2.Most commonly, ER, PR, CK5/6 and EGFR negative weredefined as ,10% of the tumor cells stained, HER2 negativewas typically defined as either as zero cells stained or ascore of 1+.
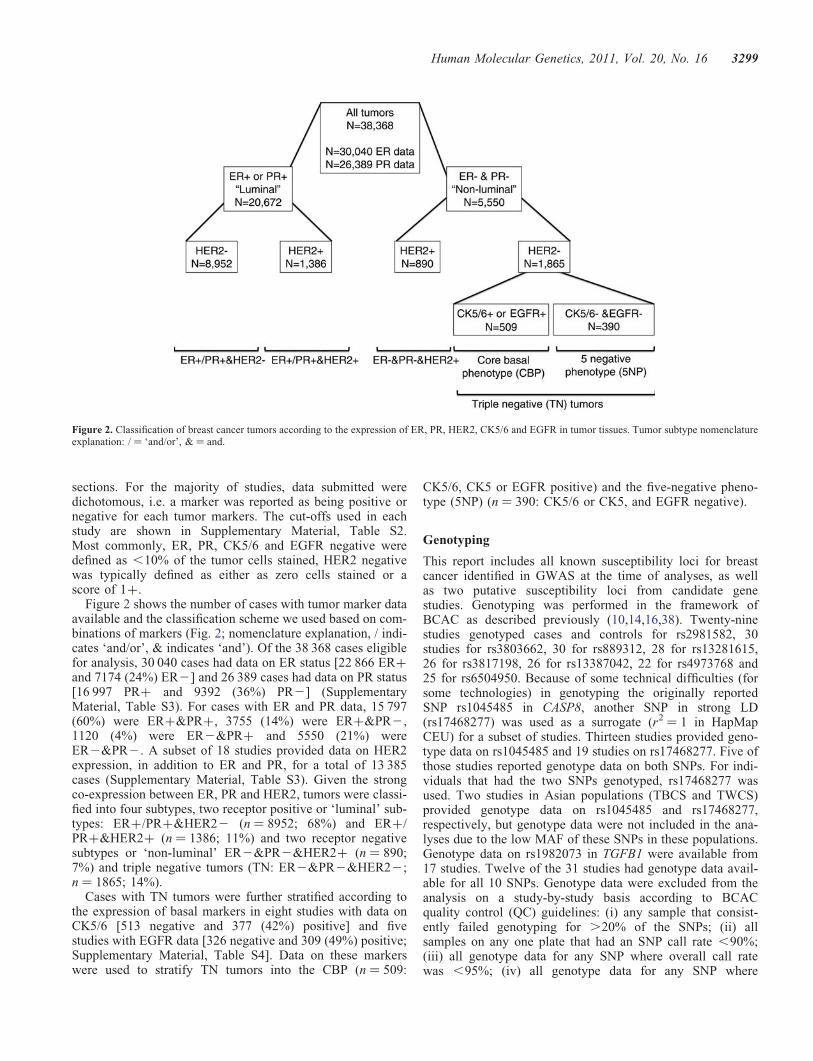
Figure 2 shows the number of cases with tumor marker dataavailable and the classification scheme we used based on com-binations of markers (Fig. 2; nomenclature explanation, / indi-cates ‘and/or’, & indicates ‘and’). Of the 38 368 cases eligiblefor analysis, 30 040 cases had data on ER status [22 866 ER+and 7174 (24%) ER2] and 26 389 cases had data on PR status[16 997 PR+ and 9392 (36%) PR2] (SupplementaryMaterial, Table S3). For cases with ER and PR data, 15 797(60%) were ER+&PR+, 3755 (14%) were ER+&PR2,1120 (4%) were ER2&PR+ and 5550 (21%) wereER2&PR2. A subset of 18 studies provided data on HER2expression, in addition to ER and PR, for a total of 13 385cases (Supplementary Material, Table S3). Given the strongco-expression between ER, PR and HER2, tumors were classi-fied into four subtypes, two receptor positive or ‘luminal’ sub-types: ER+/PR+&HER22 (n ¼ 8952; 68%) and ER+/PR+&HER2+ (n ¼ 1386; 11%) and two receptor negativesubtypes or ‘non-luminal’ ER2&PR2&HER2+ (n ¼ 890;7%) and triple negative tumors (TN: ER2&PR2&HER22;n ¼ 1865; 14%).
Cases with TN tumors were further stratified according tothe expression of basal markers in eight studies with data onCK5/6 [513 negative and 377 (42%) positive] and fivestudies with EGFR data [326 negative and 309 (49%) positive;Supplementary Material, Table S4]. Data on these markerswere used to stratify TN tumors into the CBP (n ¼ 509:
CK5/6, CK5 or EGFR positive) and the five-negative pheno-type (5NP) (n ¼ 390: CK5/6 or CK5, and EGFR negative).
Genotyping
This report includes all known susceptibility loci for breastcancer identified in GWAS at the time of analyses, as wellas two putative susceptibility loci from candidate genestudies. Genotyping was performed in the framework ofBCAC as described previously (10,14,16,38). Twenty-ninestudies genotyped cases and controls for rs2981582, 30studies for rs3803662, 30 for rs889312, 28 for rs13281615,26 for rs3817198, 26 for rs13387042, 22 for rs4973768 and25 for rs6504950. Because of some technical difficulties (forsome technologies) in genotyping the originally reportedSNP rs1045485 in CASP8, another SNP in strong LD(rs17468277) was used as a surrogate (r2 ¼ 1 in HapMapCEU) for a subset of studies. Thirteen studies provided geno-type data on rs1045485 and 19 studies on rs17468277. Five ofthose studies reported genotype data on both SNPs. For indi-viduals that had the two SNPs genotyped, rs17468277 wasused. Two studies in Asian populations (TBCS and TWCS)provided genotype data on rs1045485 and rs17468277,respectively, but genotype data were not included in the ana-lyses due to the low MAF of these SNPs in these populations.Genotype data on rs1982073 in TGFB1 were available from17 studies. Twelve of the 31 studies had genotype data avail-able for all 10 SNPs. Genotype data were excluded from theanalysis on a study-by-study basis according to BCACquality control (QC) guidelines: (i) any sample that consist-ently failed genotyping for .20% of the SNPs; (ii) allsamples on any one plate that had an SNP call rate ,90%;(iii) all genotype data for any SNP where overall call ratewas ,95%; (iv) all genotype data for any SNP where
Figure 2. Classification of breast cancer tumors according to the expression of ER, PR, HER2, CK5/6 and EGFR in tumor tissues. Tumor subtype nomenclatureexplanation: / ¼ ‘and/or’, & ¼ and.
Human Molecular Genetics, 2011, Vol. 20, No. 16 3299
duplicate concordance was ,98%. In addition, for any SNP,where the P-value for departures from Hardy–Weinberg equi-librium among controls was ,0.005, clustering of the inten-sity plots was reviewed manually and the data excluded ifclustering was judged to be poor.
Statistical analyses
Polytomous logistic regression was used to estimate oddsratios (OR) adjusted by study and associated 95% confidenceintervals (CI), as measures of association between genotypesand risk of breast cancer subtypes (comparing case subtypesto all controls). All models included terms for study[dummy variables for each study, with two terms for each eth-nicity in one study (MEC) that included women of both EastAsian and Caucasian origin]. Further adjustment by age atdiagnosis/enrolment did not substantially influence OR esti-mates (data not shown) and so this variable was not includedin final models to avoid dropping women with missing ageinformation from the analyses. We assessed the associationfor each SNP in terms of genotype-specific ORs and per-alleleORs (assuming a log-additive model). Heterogeneity betweengenotype ORs for different tumor subtypes was assessed usinglogistic regression analyses restricted to cases (case-only ana-lyses) with the tumor characteristic as the outcome variable.For tumor subtypes with more than two levels (i.e. grade,size, stage), we used a polytomous logistic regression modelconstraining the effect size to increase linearly across levels(e.g. the parameter for grade 3 versus grade1 was constrainedto be twice that for grade2 versus grade1). To evaluate whichof the several correlated tumor features was most important indetermining genotype associations, we performed stratifiedand adjusted analyses. For adjusted analyses, we fitted logisticregression models with one of the tumor features as theoutcome and the genotype and other tumor features as expla-natory variables. A P-value ,0.05 was used to select findingsmentioned in the results and discussion sections. Findings wereinterpreted in light of the strength of evidence for an association,based on the estimated ORs, 95% CI, P-values and prior knowl-edge of the hypothesis being tested (38).
To evaluate the combined effects of the 10 SNPs on ER+and ER2 disease, we calculated relative risks at the 10th,50th and 90th centiles of the polygenic risk distribution byER status (39). Calculations assumed a log-additive (multipli-cative) risk model, which is consistent with analyses of thecombined effects of the 10 SNPs reported in this manuscript(data not shown), and were based on estimated allele frequen-cies and per-allele ORs. The estimated risk distribution on alog-relative risk scale is approximately normal with meanclose to zero. The area under the curve (AUC) of the receiveroperating characteristic curve was calculated as a measure ofdiscrimination of the estimated risk distribution. An AUC of50% indicates random classification of cases and controlsand an AUC of 100% indicates perfect classification.
SUPPLEMENTARY MATERIAL
Supplementary Material is available at HMG online.
ACKNOWLEDGEMENTS
The ABCFS would like to acknowledge The University ofMelbourne (U01 CA69638) who contributed data to thisstudy. The content of this manuscript does not necessarilyreflect the views or the policies of the National Cancer Insti-tute or any of the collaborating centres in the CFR nor doesthe mention of trade names, commercial products or organiz-ations imply endorsement by the US Government or the CFR.We extend our thanks to the many women and their familiesthat generously participated in the Australian Breast CancerFamily Study and consented to us accessing their pathologymaterial. J.L.H. is a National Health and Medical ResearchCouncil Australia Fellow. M.C.S. is a National Health andMedical Research Council Senior Research Fellow. J.L.H.and M.C.S. are both group leaders of the Victoria BreastCancer Research Consortium. The ABCS would like toacknowledge Hans Peterse, Flora van Leeuwen, Rob Tolle-naar, Renate Udo and other contributors to the ‘BOSOM’study. The BSUCH thanks all participants and colleagues ofthe University Womens Clinic Heidelberg who supportedthis study. Especially, we would like to thank Anne Langheinzfor genotyping. The CNIO-BCS thanks Anna Gonzalez-Neira,Charo Alonso, Tais Moreno and Guillermo Pita. GENICAacknowledges contributions from Christian Baisch, VolkerHarth and Sylvia Rabstein. GESBC thanks Ursula Eilber andTanya Koehler for competent technical assistance. HEBCSthanks R.N. Hanna Jantti for the help with the patient dataand Drs Ari Ristimaki, Mira Heinonen and Laura Hautalafor their help with the TMA studies, and gratefully acknowl-edges the Finnish Cancer Registry for the cancer data.KBCP is grateful to Mrs Eija Myohanen and Mrs Aija Parkki-nen for their skilful assistance. The kConFab study wishes tothank Heather Thorne, Eveline Niedermayr, all the kConFabresearch nurses and staff, the heads and staff of the FamilyCancer Clinics and the Clinical Follow-Up Study for their con-tributions to this resource and the many families who contrib-uted to kConFab. The AOCS Management Group (D. Bowtell,G. Chenevix-Trench, A. deFazio, D. Gertig, A. Green,P. Webb) gratefully acknowledges the contribution of all theclinical and scientific collaborators (see http:// www.aocstudy.org/). LMBC thanks Natacha Lays and Gilian Peute-man for technical assistance. MARIE would like to thankthe pathology institutes and R. Salazar and W. Hoppnerfrom BioGlobe GmBH, Hamburg for their valuable contri-butions, and S. Behrens, R. Birr, W. Busch, U. Eilber,B. Kaspereit, N. Knese, K. Smit, for their excellent technicalassistance. MCBCS thanks Vicki Cafourek for abstraction ofmedical records and other contributors to the MCBCS study.OFBCR wishes to thank the participants in the Ontario Famil-ial Breast Cancer Registry. We wish to thank Gord Glendon,Teresa Selander, Elaine Maloney and Nayana Weerasooriyafrom Cancer Care Ontario and members of the OntarioCancer Genetics Network for their contributions to thestudy. ORIGO wishes to thank E. Krol-Warmerdam andJ. Blom for patient accrual, administering questionnairesand managing clinical information. The PBCS thanksDr Louise Brinton from the Division of Cancer Epidemiologyand Genetics of the National Cancer Institute, USA,Drs Neonila Szeszenia-Dabrowska and Beata Peplonska of
3300 Human Molecular Genetics, 2011, Vol. 20, No. 16
the Nofer Institute of Occupational Medicine (Lodz, Poland),Witold Zatonski of the Department of Cancer Epidemiologyand Prevention, The M. Sklodowska-Curie Cancer Centerand Institute of Oncology (Warsaw, Poland) and Pei Chaoand Michael Stagner from Information Management Services(Silver Spring, MD, USA), for their valuable contributionsto the study. The RBCS would like to acknowledge PetraBos, Jannet Blom, Ellen Crepin, Elisabeth Huijskens andAnnette Heemskerk for their contribution in data managing.The SBCS would like to thank Sue Higham, Gordon MacPher-son and Ian Brock from the University of Sheffield for theircontributions to this study. We also thank all the participantsin all the participating studies.
Conflict of Interest statement. None declared.
FUNDING
This work was supported by funding from the European Com-munity’s Seventh Framework Programme under grant agree-ment no. 223175 (HEALTH-F2-2009-223175). The BCAC isfunded by CR-UK (C1287/A10118, C1287/ A7497, C1287/A12014). Meetings of the BCAC have been funded by theEuropean Union COST program (BM0606). D.F.E. is a Prin-cipal Research Fellow of CR-UK. The ABCFS study was sup-ported by the National Health and Medical Research Councilof Australia, the New South Wales Cancer Council, the Vic-torian Health Promotion Foundation (Australia) and theNational Cancer Institute, National Institutes of Health underRFA-CA-06-503 and through cooperative agreements withmembers of the Breast Cancer Family Registry (CFR) andP.I.s. The ABCS study was supported by the Dutch CancerSociety (grants NKI 2001-2423; 2007-3839) and the DutchNational Genomics Initiative. The BBCC study was partlyfunded by a Grand of ELAN Funding of the University ofErlangen. P.A.F. is partly funded by Dr Mildred Scheel Stif-tung of the Deutsche Krebshilfe e.V. The BSUCH study wassupported by the Dietmar-Hopp Foundation and the HelmholtzSociety. The CGPS study was supported by the Chief Phys-ician Johan Boserup and Lise Boserup Fund, the DanishMedical Research Council and Copenhagen University Hospi-tal, Herlev Hospital. The CNIO-BCS study was supported bythe Red Tematica de Investigacion Cooperativa en Cancer andgrants from the Asociacion Espanola Contra Cancer and theFondo de Investigacion Sanitario (PI081120 to JB andPI081583 to RLM). The GENICA study was supported bythe German Human Genome Project and funded by theFederal Ministry of Education and Research (BMBF)Germany (grants 01KW9975/5, 01KW9976/8, 01KW9977/0and 01KW0114). The Robert Bosch Foundation of MedicalResearch, Stuttgart, Deutsches Krebsforschungszentrum(DKFZ), Heidelberg, Institute for Prevention and Occu-pational Medicine of the German Social Accident Insurance(IPA), Bochum as well as the Department of Internal Medi-cine, Evangelische Kliniken Bonn gGmbH, Johanniter Kran-kenhaus, Bonn, Germany. The GESBC study was supportedby the Deutsche Krebshilfe e. V. (70492) and GESBC geno-typing in part by the state of Baden-Wurttemberg throughthe Medical Faculty of the University of Ulm (P.685). The
HABCS study was supported by an intramural grant fromHannover Medical School. The HEBCS study has been finan-cially supported by the Helsinki University Central HospitalResearch Fund, Academy of Finland (110663), the FinnishCancer Society and the Sigrid Juselius Foundation. TheKARBAC study was supported by The Swedish CancerSociety, The Gustav V Jubilee Foundation And The Bertvon Kantzow Foundation. The KBCP was supported by theKuopio University Central EVO Research Fund, Academyof Finland, the Finnish Cancer Society, the University ofKuopio and EVO research funding of Vaasa Hospital District.The kConFab and its Clinical Follow-Up study were fundedby grants from the National Breast Cancer Foundation, theNational Health and Medical Research Council (NHMRC)and by the Queensland Cancer Fund, the Cancer Councils ofNew South Wales, Victoria, Tasmania and South Australiaand the Cancer Foundation of Western Australia, as well asby NHMRC (grants 145684, 288704 and 454508). TheAOCS study was supported by the US Army MedicalResearch and Material Command (DAMD17-01-1-0729), theCancer Council Tasmania and Cancer Foundation ofWestern Australia and The National Health and MedicalResearch Council of Australia (199600). Amanda B. Spurdleis supported by an NHMRC Senior Research Fellowship,and Georgia Chenevix-Trench by an NHMRC Senior PrincipalResearch Fellowship The LMBC stduy was supported byEuropean Union Framework Programme 6 (Project LSHC-CT-2003-503297) and by the ‘Stichting tegen Kanker’(232–2008). The MARIE study was supported by theDeutsche Krebshilfe e.V., (grant70-2892-BR I), theHamburg Cancer Society, the German Cancer ResearchCenter and the German Federal Ministry of Education andResearch (01KH0402). The MCBCS was supported byNational Institutes of Health (grant R01 CA122340), and anNCI Specialized Program of Research Excellence (SPORE)in breast cancer (P50 CA116201). The MCCS study was sup-ported by Cancer Council Victoria and by NHMRC (grants209057, 251533, 396414,504711, 504715). The MEC studywas supported by National Institutes of Health (grants R01-CA63464, R37-CA54281). The NBCS study was supportedby grants from the Norwegian Research council, (155218/V40, 175240/S10) to ALBD, FUGE-NFR (181600/V11) toVNK and a Swizz Bridge Award to ALBD. The OFBCRwas supported by the National Cancer Institute, National Insti-tutes of Health under (grant CA- 06-503) and through coopera-tive agreements with members of the Breast Cancer FamilyRegistry (BCFR) and Principal Investigators, includingCancer Care Ontario (U01 CA69467), Northern CaliforniaCancer Center (U01 CA69417), and University of Melbourne(U01 CA69638) and by Cancer Care Ontario. The content ofthis manuscript does not necessarily reflect the views or pol-icies of the National Cancer Institute or any of the collaborat-ing centers in the BCFR nor does the mention of trade names,commercial products or organizations imply endorsement bythe US Government or the BCFR. The ORIGO study was sup-ported by the Dutch Cancer Society. The PBCS was supportedby Intramural Research Funds of the National Cancer Institute,Department of Health and Human Services, USA. The RBCSstudy was supported by the Dutch Cancer Society (grantDDHK 2004-3124). The SASBAC study was supported by
Human Molecular Genetics, 2011, Vol. 20, No. 16 3301

funding from the Agency for Science, Technology andResearch of Singapore (A∗STAR), the US National Instituteof Health (NIH) and the Susan G. Komen Breast Cancer Foun-dation. The SBCS study was funded by the Breast CancerCampaign (grant 2004Nov 49) and Yorkshire Cancer Researchcore funding. SEARCH study was supported by CancerResearch UK grants (C490/A1102, C8197/A10123, C490/A10119, C490/A11020, C1287/A10118) and AMD wasfunded by CR-UK grant (C8197/A10865). The pathologywork in Cambridge was supported by the NIHR CambridgeBiomedical Research Centre and by the Cambridge Exper-imental Cancer Medicine Centre. The SZBCS was supportedby Grant (PBZ_KBN_122/P05/2004). The TBCS was fundedby The National Cancer Institute Thailand. The TWBCSstudy was supported by the Institute of Biomedical Sciences,Academia Sinica, National Sciences Counciland TaiwanBiobank. The UCIBCS study was supported by the NationalInstitutes of Health, National Cancer Institute (grants CA-58860) and the Lon V Smith Foundation (grant LVS-39420).
REFERENCES
1. Sorlie, T., Perou, C.M., Tibshirani, R., Aas, T., Geisler, S., Johnsen, H.,Hastie, T., Eisen, M.B., van de Rijn, M., Jeffrey, S.S. et al. (2001) Geneexpression patterns of breast carcinomas distinguish tumor subclasseswith clinical implications. Proc. Natl Acad. Sci. USA, 98, 10869–10874.
2. Perou, C.M., Sorlie, T., Eisen, M.B., van de Rijn, M., Jeffrey, S.S., Rees,C.A., Pollack, J.R., Ross, D.T., Johnsen, H., Akslen, L.A. et al. (2000)Molecular portraits of human breast tumours. Nature, 406, 747–752.
3. Korde, L.A., Lusa, L., McShane, L., Lebowitz, P.F., Lukes, L.,Camphausen, K., Parker, J.S., Swain, S.M., Hunter, K. and Zujewski, J.A.(2010) Gene expression pathway analysis to predict response toneoadjuvant docetaxel and capecitabine for breast cancer. Breast CancerRes. Treat., 119, 685–699.
4. Williams, P.D., Cheon, S., Havaleshko, D.M., Jeong, H., Cheng, F.,Theodorescu, D. and Lee, J.K. (2009) Concordant gene expressionsignatures predict clinical outcomes of cancer patients undergoingsystemic therapy. Cancer Res., 69, 8302–8309.
5. Althuis, M.D., Fergenbaum, J.H., Garcia-Closas, M., Brinton, L.A.,Madigan, M.P. and Sherman, M.E. (2004) Etiology of hormonereceptor-defined breast cancer: a systematic review of the literature.Cancer Epidemiol. Biomarkers Prev., 13, 1558–1568.
6. Anderson, W.F., Jatoi, I. and Devesa, S.S. (2005) Distinct breast cancerincidence and prognostic patterns in the NCI’s SEER program: suggestinga possible link between etiology and outcome. Breast Cancer Res. Treat.,90, 127–137.
7. Anderson, W.F., Chu, K.C., Chang, S. and Sherman, M.E. (2004)Comparison of age-specific incidence rate patterns for differenthistopathologic types of breast carcinoma. Cancer Epidemiol. BiomarkersPrev., 13, 1128–1135.
8. Ma, H., Bernstein, L., Pike, M.C. and Ursin, G. (2006) Reproductivefactors and breast cancer risk according to joint estrogen and progesteronereceptor status: a meta-analysis of epidemiological studies. Breast CancerRes., 8, R43.
9. Yang, X.R., Chang-Claude, J., Goode, E.L., Couch, F.J., Nevanlinna, H.,Milne, R.L., Gaudet, M., Schmidt, M.K., Broeks, A., Cox, A. et al. (2011)Associations of breast cancer risk factors with tumor subtypes: a pooledanalysis from the Breast Cancer Association Consortium studies. J. NatlCancer Inst., 103, 250–263.
10. Easton, D.F., Pooley, K.A., Dunning, A.M., Pharoah, P.D., Thompson, D.,Ballinger, D.G., Struewing, J.P., Morrison, J., Field, H., Luben, R. et al.(2007) Genome-wide association study identifies novel breast cancersusceptibility loci. Nature, 447, 1087–1093.
11. Hunter, D.J., Kraft, P., Jacobs, K.B., Cox, D.G., Yeager, M., Hankinson,S.E., Wacholder, S., Wang, Z., Welch, R., Hutchinson, A. et al. (2007) Agenome-wide association study identifies alleles in FGFR2 associatedwith risk of sporadic postmenopausal breast cancer. Nat. Genet., 39, 870–874.
12. Stacey, S.N., Manolescu, A., Sulem, P., Thorlacius, S., Gudjonsson, S.A.,Jonsson, G.F., Jakobsdottir, M., Bergthorsson, J.T., Gudmundsson, J.,Aben, K.K. et al. (2008) Common variants on chromosome 5p12 confersusceptibility to estrogen receptor-positive breast cancer. Nat. Genet., 40,703–706.
13. Stacey, S.N., Manolescu, A., Sulem, P., Rafnar, T., Gudmundsson, J.,Gudjonsson, S.A., Masson, G., Jakobsdottir, M., Thorlacius, S., Helgason,A. et al. (2007) Common variants on chromosomes 2q35 and 16q12confer susceptibility to estrogen receptor-positive breast cancer. Nat.
Genet., 39, 865–869.14. Ahmed, S., Thomas, G., Ghoussaini, M., Healey, C.S., Humphreys, M.K.,
Platte, R., Morrison, J., Maranian, M., Pooley, K.A., Luben, R. et al.(2009) Newly discovered breast cancer susceptibility loci on 3p24 and17q23.2. Nat. Genet., 41, 585–590.
15. Zheng, W., Long, J., Gao, Y.T., Li, C., Zheng, Y., Xiang, Y.B., Wen, W.,Levy, S., Deming, S.L., Haines, J.L. et al. (2009) Genome-wideassociation study identifies a new breast cancer susceptibility locus at6q25.1. Nat. Genet., 41, 324–328.
16. Cox, A., Dunning, A.M., Garcia-Closas, M., Balasubramanian, S., Reed,M.W., Pooley, K.A., Scollen, S., Baynes, C., Ponder, B.A., Chanock, S.et al. (2007) A common coding variant in CASP8 is associated with breastcancer risk. Nat. Genet., 39, 352–358.
17. Garcia-Closas, M., Hall, P., Nevanlinna, H., Pooley, K., Morrison, J.,Richesson, D.A., Bojesen, S.E., Nordestgaard, B.G., Axelsson, C.K.,Arias, J.I. et al. (2008) Heterogeneity of breast cancer associations withfive susceptibility loci by clinical and pathological characteristics. PLoS
Genet., 4, e1000054.18. Garcia-Closas, M. and Chanock, S. (2008) Genetic susceptibility loci for
breast cancer by estrogen receptor status. Clin. Cancer Res., 14, 8000–8009.
19. Reeves, G.K., Travis, R.C., Green, J., Bull, D., Tipper, S., Baker, K.,Beral, V., Peto, R., Bell, J., Zelenika, D. and Lathrop, M. (2010) Incidenceof breast cancer and its subtypes in relation to individual and multiplelow-penetrance genetic susceptibility loci. JAMA, 304, 426–434.
20. Nordgard, S.H., Johansen, F.E., Alnaes, G.I., Naume, B., Borresen-Dale,A.L. and Kristensen, V.N. (2007) Genes harbouring susceptibility SNPsare differentially expressed in the breast cancer subtypes. Breast Cancer
Res., 9, 113.
21. Nielsen, T.O., Hsu, F.D., Jensen, K., Cheang, M., Karaca, G., Hu, Z.,Hernandez-Boussard, T., Livasy, C., Cowan, D., Dressler, L. et al. (2004)Immunohistochemical and clinical characterization of the basal-likesubtype of invasive breast carcinoma 21. Clin. Cancer Res., 10, 5367–5374.
22. Yang, X.R., Pfeiffer, R.M., Garcia-Closas, M., Rimm, D.L., Lissowska, J.,Brinton, L.A., Peplonska, B., Hewitt, S.M., Cartun, R.W., Mandich, D.et al. (2007) Hormonal markers in breast cancer: coexpression,relationship with pathologic characteristics, and risk factor associations ina population-based study. Cancer Res., 67, 10608–10617.
23. Kreike, B., van Kouwenhove, M., Horlings, H., Weigelt, B., Peterse, H.,Bartelink, H. and van de Vijver, M.J. (2007) Gene expression profilingand histopathological characterization of triple-negative/basal-like breastcarcinomas. Breast Cancer Res., 9, R65.
24. de Ronde, J.J., Hannemann, J., Halfwerk, H., Mulder, L., Straver, M.E.,Vrancken Peeters, M.J., Wesseling, J., van de Vijver, M., Wessels, L.F.and Rodenhuis, S. (2010) Concordance of clinical and molecular breastcancer subtyping in the context of preoperative chemotherapy response.Breast Cancer Res. Treat., 119, 119–126.
25. Kapp, A.V., Jeffrey, S.S., Langerod, A., Borresen-Dale, A.L., Han, W.,Noh, D.Y., Bukholm, I.R., Nicolau, M., Brown, P.O. and Tibshirani, R.(2006) Discovery and validation of breast cancer subtypes. BMC
Genomics, 7, 231.
26. Blows, F.M., Driver, K.E., Schmidt, M.K., Broeks, A., van Leeuwen, F.E.,Wesseling, J., Cheang, M.C., Gelmon, K., Nielsen, T.O., Blomqvist, C.et al. (2010) Subtyping of breast cancer by immunohistochemistry toinvestigate a relationship between subtype and short and long termsurvival: a collaborative analysis of data for 10 159 cases from 12 studies.PLoS Med., 7, e1000279.
27. Milne, R.L., Benitez, J., Nevanlinna, H., Heikkinen, T., Aittomaki, K.,Blomqvist, C., Arias, J.I., Zamora, M.P., Burwinkel, B., Bartram, C.R.et al. (2009) Risk of estrogen receptor-positive and -negative breast cancerand single-nucleotide polymorphism 2q35-rs13387042. J. Natl Cancer
Inst., 101, 1012–1018.
3302 Human Molecular Genetics, 2011, Vol. 20, No. 16

28. Antoniou, A.C., Wang, X., Fredericksen, Z.S., McGuffog, L., Tarrell, R.,Sinilnikova, O.M., Healey, S., Morrison, J., Kartsonaki, C., Lesnick, T.et al. (2010) A locus on 19p13 modifies risk of breast cancer in BRCA1mutation carriers and is associated with hormone receptor-negative breast
cancer in the general population. Nat. Genet., 42, 885–892.
29. Luqmani, Y.A., Graham, M. and Coombes, R.C. (1992) Expression ofbasic fibroblast growth factor, FGFR1 and FGFR2 in normal andmalignant human breast, and comparison with other normal tissues.
Br. J. Cancer, 66, 273–280.
30. Antoniou, A.C., Spurdle, A.B., Sinilnikova, O.M., Healey, S., Pooley,K.A., Schmutzler, R.K., Versmold, B., Engel, C., Meindl, A., Arnold, N.et al. (2008) Common breast cancer-predisposition alleles are associated
with breast cancer risk in BRCA1 and BRCA2 mutation carriers.Am. J. Hum. Genet., 82, 937–948.
31. Antoniou, A.C., Beesley, J., McGuffog, L., Sinilnikova, O.M., Healey, S.,
Neuhausen, S.L., Ding, Y.C., Rebbeck, T.R., Weitzel, J.N., Lynch, H.T.et al. (2010) Common breast cancer susceptibility alleles and the risk ofbreast cancer for BRCA1 and BRCA2 mutation carriers: implications forrisk prediction. Cancer Res., 70, 9742–9754.
32. Lakhani, S.R., van de Vijver, M.J., Jacquemier, J., Anderson, T.J., Osin,P.P., McGuffog, L. and Easton, D.F. (2002) The pathology of familialbreast cancer: predictive value of immunohistochemical markers estrogenreceptor, ‘, HER22, and p53 in patients with mutations in BRCA1 andBRCA2. J. Clin. Oncol., 20, 2310–2318.
33. Antoniou, A.C., Sinilnikova, O.M., McGuffog, L., Healey, S.,Nevanlinna, H., Heikkinen, T., Simard, J., Spurdle, A.B., Beesley, J.,Chen, X. et al. (2009) Common variants in LSP1, 2q35 and 8q24 andbreast cancer risk for BRCA1 and BRCA2 mutation carriers. Hum. Mol.Genet., 18, 4442–4456.
34. Dawson, S.J., Provenzano, E. and Caldas, C. (2009) Triple negative breastcancers: clinical and prognostic implications. Eur. J. Cancer, 45(Suppl. 1), 27–40.
35. Rebbeck, T.R., Antoniou, A.C., Llopis, T.C., Nevanlinna, H., Aittomaki,K., Simard, J., Spurdle, A.B., Couch, F.J., Pereira, L.H., Greene, M.H.et al. (2009) No association of TGFB1 L10P genotypes and breastcancer risk in BRCA1 and BRCA2 mutation carriers: a multi-centercohort study. Breast Cancer Res. Treat., 115, 185–192.
36. Gown, A.M. (2008) Current issues in ER and HER2 testing by IHC inbreast cancer. Mod. Pathol., 21 (Suppl. 2), S8–S15.
37. Collins, L.C., Marotti, J.D., Baer, H.J. and Tamimi, R.M. (2008) Comparisonof estrogen receptor results from pathology reports with results from centrallaboratory testing. J. Natl Cancer Inst., 100, 218–221.
38. Wacholder, S., Chanock, S., Garcia-Closas, M., El Ghormli, L. andRothman, N. (2004) Assessing the probability that a positive report isfalse: an approach for molecular epidemiology studies. J. Natl CancerInst., 96, 434–442.
39. Pharoah, P.D., Antoniou, A.C., Easton, D.F. and Ponder, B.A. (2008)Polygenes, risk prediction, and targeted prevention of breast cancer.N. Engl. J. Med., 358, 2796–2803.
Human Molecular Genetics, 2011, Vol. 20, No. 16 3303