IC', Ah - DTIC
142
UNCLASSIFIED - SECURITY CLASSIFICATION OF THIS PAGE (When Data Intered), REPORT DOCUMENTATION PAGE READ INSTRUCTIONS f BEFORE COMPLETING FORM I. REPORT NUMBER 2. GOVT ACCESSION "10. 3. RECIPIEN r'S CATALOG NUMBER AFIT/CI/NR 88- 17.3 ,. UY TITLE (and Subtitle) 5. TYPE OF REPORT & PERIOD COVERED Af{-tSTI"AIyrT1toQ or 3tUDEuJ P%1LiTy i THESIS __ POtYLICP 'ALOOAGES UswJC THnE RASCH A )(L )- b 6. PERFORMING O'AG. REPORT NUMBER AUTHOR(s) 8. CONTRACT OR GRANT NUMBER(s) PERFORMING ORGANIZATION NAME AND ADDRESS 10. PROGRAM ELEMENT, PROJECT, TASK AREA & WORK UNIT NUMBERS AFIT STUDENT AT: 0/410 5-1ATk VU'vULJIT/ CONTROLLING OFFICE NAME AND ADDRESS 12. REPORT DATE 1988 13. NUMBEROFPAGES )31 14. MONITORING AGENCY NAME & ADDRESS(f different from Controllin Office) IS. SECURITY CLASS. (of this report) AFIT/NR Wright-Patterson AFB OH 45433-6583 UNCLASSIFIED ISa. DECL ASSI FICATION, DOWNGRADING S SCHEDULE 16. DISTRIBUTION STATEMENT (of this Report) DISTRIBUTED UNLIMITED: APPROVED FOR PUBLIC RELEASE 17. DISTRIBUTION STATEMENT (of the abstract entered in Block 20, If different from Report) SAME AS REPORT Approved for Public lease: IAkW AFR 190-1 LYNN E. WOLAVER Dean for Research Professional Development Air Force InstitutW/of Technology Wright-Patterson AFB OH 45433-6583 19. KEY WORDS (Continue on reverse side if necessary and identify by block number) 20. ABSTRACT (Continue on reverse side If necessary and Identify by block number) ATTACHE D DTIC SELECTE AUG 1 9 1988 DD FORM 1473 EITION OF I NOV 65 IS OBSOLETE L.r.,,L~SSIIE, SECURITY CLASSIFICATION OF THIS PAGE (When Data E- . * . 88 8 16 1 IC', Ah
-
Upload
khangminh22 -
Category
Documents
-
view
3 -
download
0
Transcript of IC', Ah - DTIC

UNCLASSIFIED -
SECURITY CLASSIFICATION OF THIS PAGE (When Data Intered),
REPORT DOCUMENTATION PAGE READ INSTRUCTIONS fBEFORE COMPLETING FORM
I. REPORT NUMBER 2. GOVT ACCESSION "10. 3. RECIPIEN r'S CATALOG NUMBER
AFIT/CI/NR 88- 17.3 ,. UYTITLE (and Subtitle) 5. TYPE OF REPORT & PERIOD COVERED
Af{-tSTI"AIyrT1toQ or 3tUDEuJ P%1LiTy i THESIS
__ POtYLICP 'ALOOAGES UswJC THnE RASCH A )(L )- b6. PERFORMING O'AG. REPORT NUMBER
AUTHOR(s) 8. CONTRACT OR GRANT NUMBER(s)
PERFORMING ORGANIZATION NAME AND ADDRESS 10. PROGRAM ELEMENT, PROJECT, TASKAREA & WORK UNIT NUMBERS
AFIT STUDENT AT: 0/410 5-1ATk VU'vULJIT/
CONTROLLING OFFICE NAME AND ADDRESS 12. REPORT DATE
198813. NUMBEROFPAGES
)3114. MONITORING AGENCY NAME & ADDRESS(f different from Controllin Office) IS. SECURITY CLASS. (of this report)
AFIT/NRWright-Patterson AFB OH 45433-6583 UNCLASSIFIED
ISa. DECL ASSI FICATION, DOWNGRADING SSCHEDULE
16. DISTRIBUTION STATEMENT (of this Report)
DISTRIBUTED UNLIMITED: APPROVED FOR PUBLIC RELEASE
17. DISTRIBUTION STATEMENT (of the abstract entered in Block 20, If different from Report)
SAME AS REPORT
Approved for Public lease: IAkW AFR 190-1LYNN E. WOLAVER
Dean for Research Professional DevelopmentAir Force InstitutW/of TechnologyWright-Patterson AFB OH 45433-6583
19. KEY WORDS (Continue on reverse side if necessary and identify by block number)
20. ABSTRACT (Continue on reverse side If necessary and Identify by block number)
ATTACHE D DTICSELECTE
AUG 1 9 1988
DD FORM 1473 EITION OF I NOV 65 IS OBSOLETE L.r.,,L~SSIIE,SECURITY CLASSIFICATION OF THIS PAGE (When Data E-
. * .88 8 16 1 IC', Ah

RX-ESTIMATION OF STUDENT ABILITY
IN FOREIGN LANGUAGES
USING THE RASCH MODEL
DISSERTTIONI
Presented in Partial Fulfillment Of the Requir ements for
the Degree Doctor of.Philosophy in the Graduate
School of the Ohio State University
By
Philip Jean-L~ouis westfall,, 8.5., N.A.
I III III ; ; II jI 1 1, 1

1
RE-ESTIMATION OF STUDENT ABILITYIN FOREIGN LANGUAGES
USING THE RASCH MODEL
Philip Jean-Louis Westfall, Major, USAF
The Ohio State University, 1988
Degree Awarded: Ph.D. Education
Professor Ayres G. D'Costa, Co-kdviserProfessor Gilbert A. Jarvis, Co-Alviis r
This study investigates the effectiveness of the RaschpsychoTetric model in improving predictive validity ofFrench language placement testing. Three multidimensionalmodels, multiple regression, discriminant analysis, and an apriori rational weghting scheme were compared to threeunidimensional ability estimation procedures, raw score,Rasch model score (non-fitting test items deleted), and theRasch model score corrected for five test disturbances(guessing, test start-up anxiety, sloppiness, item contentand person interaction, and plodding). These six estimationprocedures (predictor variables) were applied to a singleFrench placement test used in assigning students to three1-nguage courses of differing levels of instruction. Thecriterion (predicted) variables were the student scoresobtained on all tests during one semester of languageinstruction.- The estimation procedures were investigatedfor their predictive validity using two criteria. ThePearson r was used as the criterion for comparison of thethree unidimensional models with rational scoring andmultiple regression; the percent correctly classifiedstatistic was used to compare the three unidimensionalmodels with discriminant analysis and rational scoring. Inall comparisons, the results show that the Rasch estimates,corrected for test resoonse disturbances, had greaterpredictive validity than all other scoring procedures.Intercorrelations using the Pearson r were shown to havestatistically significant differences with p < 0.5. (Thediscriminant analysis procedure could not be included in thetest of significance.)
Number of Pages: 139
I_

RE-ESTiMATION OF STUDENT ABILITY
IN FOREIGN LANGUAGES
USING THE RASCH MODEL
0 1SS ,R CA 101
Presented in Partial Fulfillment of the Requirements for
the Degree Doctor of Philosophy in the Graduate
School of the Ohio State University
By
Philip Jean-Louis Westfall, B.S., M.A.
The Ohio State University
1988
Approved by
Dissertation CoTmittee" Co-AdviserCollege of Educationhyres G. O'Costa _ ...
Gilbert A. Jarvis _ -___
Elizabeth B. Bernhardt College of Education

Copyright byPhilip Je.:an-Louis Westfall
1988

To my mother
ii7 I

1
ACKOWLEDGMENTS
A major debt of gratitude is owed to Dr. Ayres D'Costa
for his guidance and for the personal interest he took in
advising me throughout the research phase. To Dr. Gilbert
Jarvis I express my thanks for his advising me and
encouraging me to study measurement. My thanks go also to
Dr. Richard Smith who introduced me to the Rasch model and
supplied valuable technical assistance. I wish to thank
Colonels Ruben Cubero and Gerald O'Guin for selecting me for
the PhD program. I am also indebted to Major Michael Bush
for his help in collecting data from the USAF Academy.
Finally, I wish to thank my family. To my wife, Vicki,
ani my children, Marc, Christine and Stephanie, I express my
appreciation for their love and patience. I also thank my
father for his encouragement. I am particularly indebted,
however, to my mother who, desiring to preserve my Frenchheritage, placed me in a French school during my youth in
New York; without this background, I would have had little
opportunity for academic achievement in foreign languageFor
education. r
Soli Deo gloria
B- y . .
iiI A ;.r Fi~ oe
Aviti. and/oriDist Spocial
X&1 14 -,

VITA
1973 .......... B.S., Ohio University, Athens,Ohio
1974-1981 .......... .. Tactical Fighter Navigator,United States Air Force, Osan AB,Korea, and Cannon AFB, New Mexico
1982 .......... M.A., The Ohio State University,Columbus, Ohio
1982-1984 .......... ... Instructor of French,Department of Foreign Languages,United States Air Force Academy,Colorado Springs, Colorado
1984-1986 ............... Assistant Professor of French;Deputy Chairman, French Section;French Exchange Program Director,Department of Foreign Languages,United States Air Force Academy,Colorado Springs, Colorado
PUBLICATIONS
Author, Perspectives on France - A handbook on FrenchCulture. Washington, DC: U. S. Government PrintingOffice, 1985 (339 pages).
FIELDS OF STUDY
Major Field: Foreign Language Education
Studies in Foreign Language EducationProfessor Gilbert A. Jarvis
Studies in Educational Research and EvaluationProfessor Ayres D'Costa
Studies in Humanistic FoundationsProfessor Gerald M. Reagan
iv
' .T'"%%% MV"V r -. '%* .

TABLE OF CONTENTS
ACKNOWLEDGMENTS ......... ................... iii
VITA .......... ........................ iv
LIST OF TABLES .................... vii
LIST OF FIGURES .v.................. Viii
CHAPTER PAGE
I. INTRODUCTION ....... ............... . 1
Introduction to the problem ..... ......... 1Statement of the Problem ..... .......... 7Significance of the Problem .. ......... .. 13Purpose of the Study ... ............ 19Assumptions ...... ................ 21Definition of Terms ... ............. . 23Limitations of the Study .. .......... 27Organization of thp Dissertation ...... 28
II. REVIER OF LITERATURE AND THEORETICAL BASES . . 29
Prediction ................ 29Dimensionality and Predictive Validity . 36An Introduction to the Rasch Model ..... 40Disturbance Detection Past and Present . . 47Item & Person Analysis with the Rasch Model 50Summary ................... 55
III. PROCEDURES . ......... ................ 56
Population and Sample .... .......... . 56Research Design ..... ............... 57Variables and Instrumentation ......... . 59Experimental Procedures & Data Analysis . 82Hypothesis of Study ... ............. . 84
vq
La-uI.
IV. RESULTS ........ .................... 85
Overview ....... .................. 85Predictor Variables .... ............. 86Comparisons of Predictive Validities . . .. 93Summary .......... .................. 98
V. SUMMARY, CONCLUSIONS, AND RECOMMENDATIONS . . . 102
Summary ....... ................... 102Conclusions ...... ................. 103Implications ..... ................ 107Recommendations for Future Research ..... .. 109Limitations ......... ................. 110
APPENDICES
A. IPARM Item Difficlty Assignment .. ........ il1
B. IPARM Subgroup Assignment ... .......... . 113
C. IPARM Total & Subgroup Ability Estimates . . . 116
D. IPARM Person Analysis Summary .. ......... .. 122
LIST OF REFERENCES .................. 124
J.
I
Vj

LIST OF TABLES
TAB.sLE PAGE
i. Percentage of criterion points iper language activity ..... ....... 81
2. Indices of trait unidimensionality forfirst and last MSCALE iterations ......... 88
3. Percentage of disturbance type by course . . . 89
4. Rationally derived weights forscoring each PLAVAL section . ........ 90
5. Multiple regression weights foreach section by course ... ............ . 92
6. Self-test results for cross-validation groups .... .............. . 92
7. Pearson r coefficients of the multipleregression, rational, and unidimensionalmodels with the criterion variables ..... 94
8. Int-nrcorrelations of the measurementmodels for F 131 .... ............... ... 95
9. Intercorrelations of the measurementmodels for F 141 .... ............... ... 96
10. Intercorrelations of the measurementmodels for F 150 .... ............... ... 97
11. Correct classificafinn percentagesof discriminant analysis, rationaland unidimensional models .. .......... . 99
vii

LIST OF FIGURES
FIGURE PAGE
1. Common metric scale for persons and items 16
2. Examples of response patterns . ........ . 17
3. Person measure on calibrated item scale . 43
4. Correct response probability curve ...... . 45
5. IPARM subgroup ability estimation ...... . 52
6. IPARM sejiential standardized residual plot 54
7. Research design .... ............... . 58
8. IPARM example of proper fit . ......... . 65
9. IPARM example of plodding ...... ..... 67
10. IPARM example of item-content interaction 69
11. IPARM example of item-style interaction . 71
12. IPARM example of test start-up anxiety . ... 73
13. IPARM example of guessing .. .......... . 75
14. IPARM example of sloppiness .. ........ . 77
15. Comparison of correct-placement percentages
of the unidimensional, multiple regression,and rational scoring models with the
criterion variables .... ............. . 100
16. Comparison of the Pearson r coefficients
of the unidimensional, rational, anddiscriminant anlyse co-lels with thecriterion variables .... ............. . 101
Priii

I
CHAPTER I
INTRODUCTION
Introduction to the Problem
Increasing predictive validity in foreign language
placement-testing is not simply a problem of creating
well-written items reflecting a particular curriculum. If
the evaluator is to derive maximum benefit from such
testing, he or she must adopt a scoring procedure that
maximizes predictive validity. Fortunately, statistical
scoring packages abound that simplify even the most
elaborate scoring procedures; but Oller (1983a, p. ix)
cautions: ". . electronic wizardry [has] led to an
unfortunate tendency to allow the computer programs
themselves to run ahead of the user's comprehension of the
process actually being carried out by them." Whereas ease
of scoring is certainly to be desired, it must not supplant
critical evaluation of the assumptions on which a particular
scoring procedure is based.
Most scoring packages are created based on one of two
fundamental assumptions of psychometrics: the trait being '
measured is either unidimensional or multidimensional. The 4'

-- w T.Sj -1 W. %I 17 7w- U - I
2
data, therefore, should be examined to see if they fit the
assumptions of the psychometric model used.
Dimensionality of the Construct
In the domain of foreign languages, some theorists
argue that language skills cannot be adequately described in
terms of any single dimension, whereas others argue the !contrary. In a review of foreign language acquisition
theories, Klein (1986, p. 50) argues against viewing second
language acquisition as "essentially a uniform process with S
only superficial variations." Because the structure of the
acquisition process varies across learners, each learner,
therefore, can best be described as having a "constellation
of abilities, with no two learners being exactly alike.
Ellis (1986, p. 4) agrees: "Different learners in different
situations learn a [second language] in different ways."
This argues against looking at foreign language ability on a
universal scale. Indeed, the very concept of proficiency,
or competence, evades consensus among theorists. Carroll
(1968) proposes a multiple proficiency model; Stern (1984),
a four-component model; Canale and Swain (1980), three; and
Cummins (1979), two. whereas the Council of Europe (Coste
et al., 1976) claims proficiency as being variable according
to learner needs, the American Council on the Teaching of
Foreign Languages (1982) has established five universal,
unidimensional scales for several languages; one scale each

3!
for reading, listening, speaking, writing, and cultural
knowledge. In support of this perspective, Omaggio (1984)
and Liskin-Gasparro (1984) argue that foreign language
acquisition has enough regularity that ability, or
proficiency, can be measured along such universal scales.
The implication, of course, is that the problem of valid
testing and placement is reduced at most to five language-
specific scales. Oller (1983b) goes even further by
proposing a unitary hypothesis, which claims that all sub-
skill tests actually measure a single, underlying ability;
it is a global proficiency which, he claims, is verified by
statistical analysis of various language test data.
Dimensionality of Test Data
Regardless of the particular theory of language
acquisition or definition of proficiency that an evaluator
supports, placement testing in foreign languages is still
reduced to describing a learner's ability as a single score.
This is particularly problematic in light of the prevailing
views of language proficiency, which do not acknowledge the
validity of a single scale of language ability. Unless an
institution has a "constellation" of classes to correspond
to learners' different abilities in the various aspects of
the language, however, the evaluator usually relies on a
single measure of ability for placement at the appropriate
level of a standard course sequence.

4
Use of a single numerical description may indeed be
valid if the test results are primarily reflective of a
unidimensional trait. Because a construct is
multidimensional, this does not imply that all tests, which
can only measure that construct in part, are necessarily
multidimensional. The construct "foreign language
competence" is most often described multidimensionally, but
a more restrictive measure of that trait, such as a test of
"academic achievement" in a foreign language, may indeed fit
the unidimensional model.
Assessing the Validity of Test Scores
Placement testing (Oller, 1979), for many academic
institutions where large numbers of students are evaluated,
relies heavily on multiple-choice test items representing
the institution's concept of general language ability or its
specific curriculum. Tests may be divided to represent
various aspects of language. A placement test will often
have sections on reading comprehension, aural skill, grammar
and vocabulary knowledge; and evaluators will often weight
sections of the test depending on the sub-skill tested and
the difficulty of the task (e.g., discrete versus
integrative test items). Regardless of the weighting scheme
employed, the various subscores are, in one way or another,
combined into a single numerical index of the student's
ability. It is important to note that unless each of these

5
subscores are unidimensional measures, the sum of the item
scores will have little meaning.
With the constraint of using a single score, evaluators
must make sense of test scores in the face of varying
individual backgrounds and language competencies. In the
case where individuals are compared or placed in certain
ability groups, the evaluators should have an understanding
of two important aspects of test results. First, how well
test scores represent language ability, and second, how well
a test score represents an individual's performance on the
test (Roid & Haladyna, 1982).
Assuming Unidimensionality.
Unidimensionality is assumed when an examinee's score
of 80 percent on a placement examination, for example, is
said to represent a greater ability than a score of 70
percent (assuming the test is a valid instrument). This
assumption is often made without investigating the nature of
the test, especially the additivity of successes on the
various test items. Smith (1986a) points out that the
notion that a unidimensional standard is represented by a
test "is usually unexpressed, but it is implied when a
single score is reported." This "unexpressed standard"
appears to be especially true of foreign language placement
testing. Without such an assumption, there could be no
reasonable rank-ordering of students.
*

6
Assuming Test Results are "Reasonable."
The second assumption made is that the examinee's
score is a "reasonable" estimate of his or her ability. The
qualifier "reasonable" describes how well the individual's
responses match the expected outcome which is determined by
the person's ability and the difficulty of the items (Smith,
1986a). A low-ability examinee is generally not successful
in attempting difficult language test items, but is able to
respond correctly to easier ones.
It is typically assumed by evaluators that examinee
scores on a valid test are reasonable by virtue of high
reliability (usually measured by Kuder-Richardson 20)
without further investigating the reliability of the
individual response patterns. Lumsden (1978) makes the
point that individuals, not tests, exhibit degrees of
reliability. Rudner (1983) points out that whereas
substantial effort is made in the areas of test analysis and
revision, comparatively little is done to examine an
individual's test responses to determine if the score is
representative of her or his ability. Smith (1980, p. 3)
also underscores this deficiency: "Much of the work [in the
testing field] . . . has [been] concerned [with) the
construction and analysis of items . . . Little, if any,
attention has been given to . . . the analysis of the
individual's . . . pattern of responses." Questions of test
validity and reliability are crucial to the effective use of

7
tests, but the questions should be asked at the individual
level as well.
It would seem to follow then, that any test should meet
the assumptions of the measurement model used to score the
test before using it as a yardstick; and furthermore, each
examinee's test responses should be examined for
reasonableness of the total score. If a test lacks
unidimensionality, then rank-ordering of individual scores
for placement becomes questionable (Wright & Stone, 1979).
What is gained by equating examinees with equal scores when
these scores reflect success in different content areas? If
an individual's response pattern is "unusual" (as in the
case of a student being lucky at guessing), what can be
deduced from her or his score? Without attempting to
address these concerns, scores may be neither valid nor
reliable.
Statement of the Problem
Placement tests are essentially designed as instruments
to match learners to appropriate levels of instruction. The
validity of these tests depends on their ability to match
learners' skills to the level of instruction. This is
usually measured by correlation of pre-instruction test
scores with some measure of performance, usually course
grades. The assumptions made regarding the nature of the
test and examinee will have significant impact on the

8
interpretation of placement scores, thereby affecting the
predictive validity of the placement test. Whereas various
multidimensional scoring schemes are in widespread use among
foreign language evaluators, potential benefits of
unidimensional measurement, particularly analyses of
individual response patterns with a view to ability
re-estimation, have not been well investigated.
Multidimensional Weighting
The foreign language evaluator may reasonably assume
that any general test of language ability involves testing
several skills. Accordingly, the evaluator will
differentially weight items according to the perceived
relative importance of each; this is a rational,
non-empirical weighting scheme based on the evaluator's
experience. For more objective item-weighting, the
evaluator may resort to two other procedures for scoring:
Multiple Regression.
Multiple regression (MR) analysis (Ghiselli, Campbell,
& Zedeck, 1981) results in maximally correlating the
placement test with the criterion variable by differentially
weighting the various sub-skills. The finil result will be
a composite score of the linear combination of weighted
subtest scores. It is assumed that these weights will have
an acceptable, albeit reduced, validity for evaluating
WWII N
9
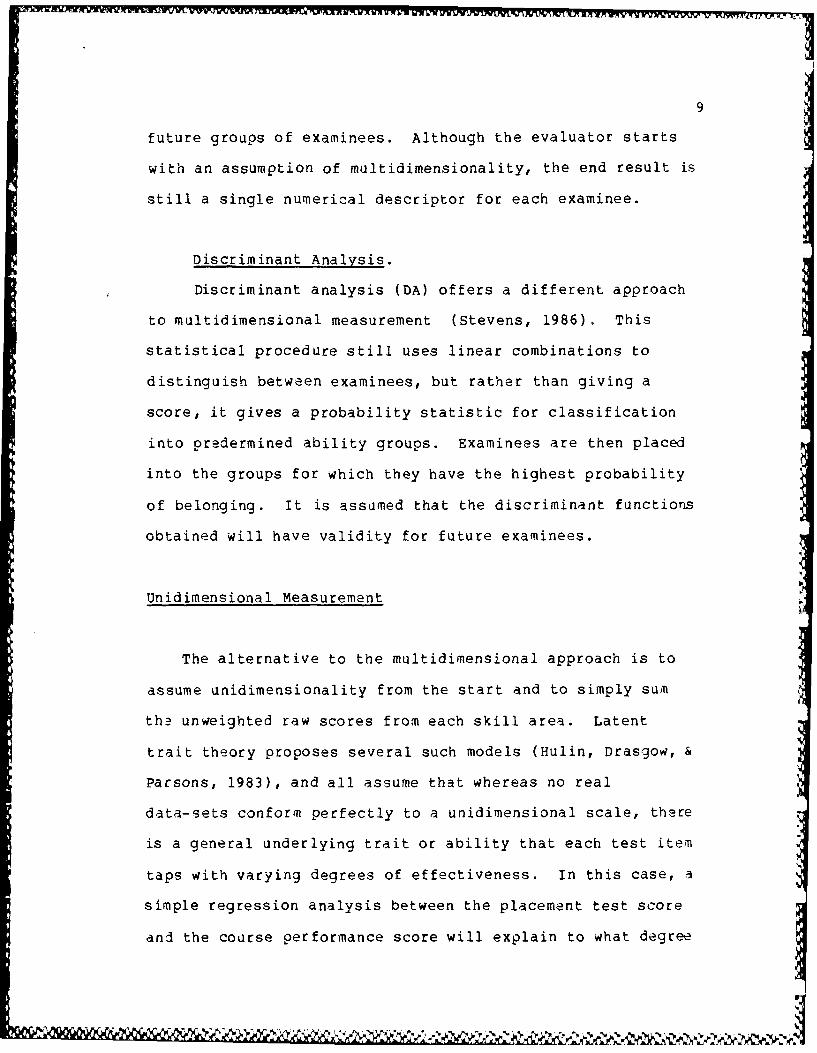
future groups of examinees. Although the evaluator starts
with an assumption of multidimensionality, the end result is
still a single numerical descriptor for each examinee.
Discriminant Analysis.
Discriminant analysis (DA) offers a different approach
to multidimensional measurement (Stevens, 1986). This
statistical procedure still uses linear combinations to
distinguish between examinees, but rather than giving a
score, it gives a probability statistic for classification
into predermined ability groups. Examinees are then placed
into the groups for which they have the highest probability
of belonging. It is assumed that the discriminant functions
obtained will have validity for future examinees.
Unidimensional Measurement
The alternative to the multidimensional approach is to
assume unidimensionality from the start and to simply sum
the unweighted raw scores from each skill area. Latent
trait theory proposes several such models (Hulin, Drasgow, &
Parsons, 1983), and all assume that whereas no real
data-sets conform perfectly to a unidimensional scale, there
is a general underlying trait or ability that each test item
taps with varying degrees of effectiveness. In this case, a
simple regression analysis between the placement test score
and the course performance score will explain to what degree
------

10
the test predicts performance within a given course
(Ghiselli, Campbell, & Zedeck, 1981).
Examinee Unreliability
Regardless of how a test is scored, the problem of
recognizing and dealing effectively with examinee
unreliability remains. It is especially important in the
case of placement examinations because the principal focus
is on individual performance against a set standard, and not
on group characteristics. The evaluator desires to obtain
an estimate of individual ability with as little measurement
error as possible. It would be to the advantage of the
evaluator, then, if a scoring procedure could also highlight
inconsistencies in the individual response patterns.
Individual test responses are assumed to be due, in general,
to ability; but all too often, there are disturbances,
extrinsically or intrinsically caused, that lead to either
an overestimation or an underestimation of that person's
ability. This individual is then improperly placed in the
course sequence.
Types of Test Disturbance
Smith (1986b) identifies two general types of
measurement disturbance. First, there are those
disturbances that are associated with the person. These
L au Is Vv %.: -..

disturbances are independent of the test items and have been
categorized by Smith as follows:
1. Start-up or test anxiety. The examinee has poor
concentration only at the beginning of the test.
2. Plodding or excessive cautiousness. The examinee
works slowly and too deliberately, resulting in insufficient
time to complete the test or one of its sections.
3. Copying from another person. The examinee may have
copied a part or all of the test.
4. External distractions. The examinee may do poorly
on a part of the test due to some disturbance in the test
room.
5. Illness. Onset of illness may cause the same
pattern of response as for external distractions.
6. Guessing to complete the test. The examinee may
resort to guessing to finish the test under a time
constraint.
7. Random guessing. Examinees may randomly respond to
questions when they are disinterested.
8. Sloppiness or excessive carelessness. The examinee
is missing easy items due to boredom, fatigue or illness.
Second, Smith distinguishes five disturbances due
primarily to ite-n-person interaction.
1. Guessing when correct answer is not known. This
usually occurs when items are too difficult for the
exam inee.

12
2. Sloppiness due to over-confidence. Examinees may
become overconfident on the entire test or on a particular
section due to familiarity with the content.
3. Item content and person interaction. This usually
occurs when one of the skills or topics being tested is
over- or under-learned.
4. Item type and person interaction. This usually
occurs when one or more of the item types used on the test
is differentially familiar or unfamiliar to the examinee.
5. Item bias and person interacticn. This normally
occurs when an item subset differentially favors aV
subgrouping of examinees according to gender, race, or
ethnic background.
Gronlund (1985) and Goldman (1971) reiterated four of
the above disturbances (cheating, test anxiety,
interruptions, and bias) and added two more:
I. Favoritism. This occurs when an evaluator gives
hints to examinees who ask questions, thereby causing an
overestimate of certain examinees' ability.
2. Response sets. These are examinee predispositions
to answering a certain way when the answer is unknown. For
example, an examinee may always pick the longest option, the
"c" option, or the text-book phrase on multiple-choice
tests. Other response sets include working for speed rather
than accuracy and having a tendency to gamble.

13
Karmel and Karmel (1978) add practice and coaching
effects to these lists of disturbances, and Chase (1978)
adds test-wiseness, or test-taking strategies.
Each of these disturbances has the potential to
significantly alter an individual's score. Whereas no
evaluator can consistently identify these disturbances and
determine the influence each has had on a particular score
(Rudner, 1983), selection of an appropriate psychometric
model may very well lead to locating several sources of
disturbance, compensating for them, and thereby increasing
accuracy in placement.
Significance of the Problem
A study conducted by Smith (1981), using latent trait
theory, examined student response disturbances in college
placement tests. Out of 822 high school students tested, he
found 30 percent exhibiting unusual response patterns on a
test of elementary algebra. In a more recent study, Smith
(in press a) discovered that 25 percent of 2590 examinees
taking the Dental Admission Test had unexpected response
patterns. In another study nf 1250 examinees taking a
quantitative reasoning test for admission to optometry
schools, 25 percent were found to have highly unexpected
response patterns (Optometry Admission Testing Program,
1988). Although one must be careful in generalizing from
only a few studies, the results certainly underscore the
yR y e e, %1 .

p
14
importance of identifying learners having unusual response
patterns and re-interpreting these scores to enhance their
relevance. Because learner success depends in some measure
on accurate placement, evaluators should employ a
psychometric model that has the greatest potential in
achieving accurate assessment of each individual.
The Importance of Appropriate Scaling
Assuming the evaluator is using a test of appropriate
content, there then remains the critical issue of the
appropriateness of the scale. Specifically, does the test
give a higher score to a person with greater ability? If
the assumption of unidimensionality is met by the foreign
language placement test, then it should be possible to
describe the scale as a measure of increasing ability in
language. That is to say, an examinee will be able more
frequently to answer correctly questions beneath her or his
ability and less frequently to answer correctly items that
are higher on the scale. If this is not done, then the
eiluator cannot be assured that a numerically superior
score represents superior ability (Wright & Stone, 1979).
In both the multidimensional and unidimensional
measurement models, test items are selected on the basis of
their difficulty and discrimination. The evaluator will
normally include questions of varying difficulty in order to
properly assess groups of learners with a wide range of

15
abilities. If the majority of questions are either too
difficult or too easy, information on examinee ability will
be lost. Oller (1979, p. 246) goes so far as to say that
"there is nothing gained [psychometrically] by including
test items chat every student answers correctly or that
every student answers incorrectly" (pedagogical
considerations aside). Wright and Stone (1979) agree; test
items must be of sufficient number and varying difficulty to
adequately separate learners of different ability;
otherwise, the scale that is defined by the items will be
inefficient, at best, and meaningless, at worst.
An item's difficulty, however, becomes a meaningless
statistic if, for some reason or another, the item is more
difficult for high-ability examinees than for those with lo.
ability. Therefore, an item should hav in increasing
proportion of correct responses as ability increases. Items
that do not seem to test what the majority of the other
items are testing (low point-biserial correlation) should be
eliminated from the test.
Both multidimensional and latent (or single) trait
models will generally discover such items in their
respective item analyses (Baker, 1985). only the latent
trait models, however, which assume unidimensionality, allow
the evaluator to determine "person discrimination" or
person-model fit.
r r Or W
16
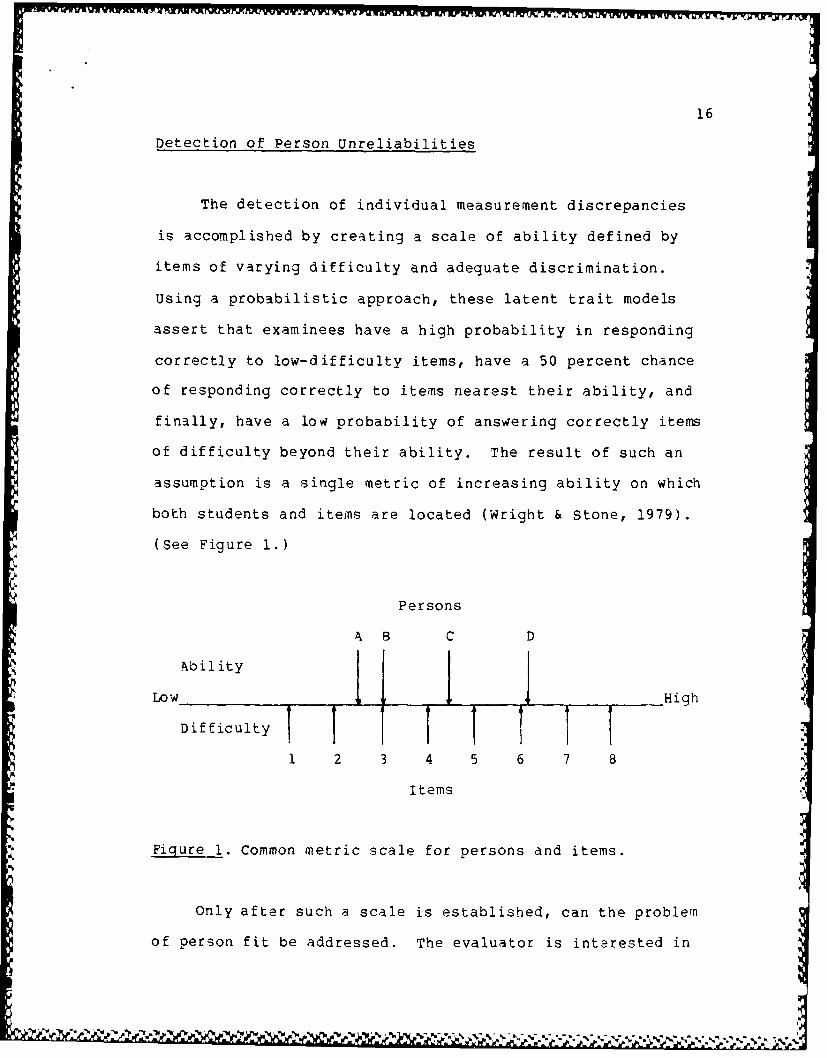
Detection of Person Unreliabilities
The detection of individual measurement discrepancies
is accomplished by creating a scale of ability defined by
items of varying difficulty and adequate discrimination.
Using a probabilistic approach, these latent trait models
assert that examinees have a high probability in responding
correctly to low-difficulty items, have a 50 percent chance
of responding correctly to items nearest their ability, and
finally, have a low probability of answering correctly items
of difficulty beyond their ability. The result of such an
assumption is a single metric of increasing ability on which
both students and items are located (Wright & Stone, 1979).
(See Figure 1.)
Persons
AB C D
kbility I
Low _ __ High
Difficu ty~ II I1 2 3 4 5 6 7 8
Items
Figure 1. Common metric scale for persons and items.
Only after such a scale is established, can the problem
of person fit be addressed. The evaluator is interested in
." " '" "" " 'w' w ,w ' ',', '{
'' ' " "w" "' " . - - . . . '... . . ,. .--

17
discovering whether a student conforms to the expected
response pattern implied by the scale (Smith, 1981). Fron a
probabilistic perspective, and if the items are ordered fron
least to most difficult, the evaluator should expect a
beginning string of correct answers with only occasional
false answers, leading to a transition point that occcurs at
that person's ability level. From this transition point on,
a string of mostly incorrect responses should follow (see
Person A in Figure 2, which is adapted from an illustration
presented by Smith, 1986a).
Items in Order of Difficulty
Easy Average Hard
Person 1 2 3 4 5 6 7 8 9 10 Score
A 1 1 1 1 0 1 0 0 0 0 5
B 1 1 1 0 0 1 0 1 0 0 5
C 1 0 1 0 1 0 1 0 1 0 5
D 0 0 1 1 i 1 0 0 0 0 5
E 0 0 0 0 1 0 1 1 1 1 5
Figure 2. Examples of response patterns.
To use the somewhat simplified illustration in Figure
2, if the evaluator does not examine the response patterns
of the individuals tested, measurement disturbances can go
unnoticed. All five students have a raw score of 5. Person
A has an expected or typical response pattern. Person B,

18
however, has answered some difficult questions while missing
some easier ones. Person C's pattern seems random, whereas
person D has an expected pattern except for the first two
questions. Lastly, person E's pattern is unreasonable if
the notion of item difficulty has any meaning at all. Yet,
in most testing situations, each student would have been
assigned an identical score of 5 and would have received
similar placement decisions based on this information alone.
The problem in this illustration lies in the fact that the
evaluator has not established the meaning of a score of 5.
Is it reasonable to assume, under these circumstances, that
these individuals should be treated in the same fashion?
Under traditional measurement models, only item-fit issues
are considered in improving psychometric scales. Latent
trait models, however, provide for the detection of such
irregularities not only in item-fit terms, but also in
person-fit or response patterns. One model in particular,
the Rasch model (Wright & Stone, 1979), offers the
possibility of correcting some of these individual
irregularities as a post hoc procedure.
If a measurement model could be implemented that would
create a consistent scale of foreign language ability,
examinee response-patterns could be evaluated with reference
to such a scale so that those individuals not conforming to
expect tions could have their ability re-estimated. This
could reduce incocrect placement of learners.
:IIV

19
Purpose of the Study
The principal purpose of this study is to compare the
predictive validity of scores derived from a unidimensional
psychometric model with the results of multidimensional
models often employed in foreign language placement-testing.
Additionally, the use of the Item and Person Analysis with
the Rasch Model (IPARM) program (Smith, Wright, & Green,
1987), will permit the identification of measurement
disturbances commonly occurring in tests of cognitive
ability and provide a method to re-estimate an individual's
ability after making an appropriate correction for such
disturbances. It is hypothesized that such re-estimates
might enhance the predictive validity of the placement test.
The first objective is to interpret the placement
scores according to the dimensionality assumptions of the
various psychometric models. The multidimensional models
assume divisibility of language competence (Oller, 1979).
That is to say, language ability can be described by a
quantification of several variables, each with some degree
of independance from the others. For this particular
placement examination, language ability was divided into
eight component tests: three aural comprehension, three
reading comprehension, and two grammatical competence
subtests. To best represent this divisibility assumption,
three multidimensional scoring procedures were used. The
first was the weighting scheme (non-empirically derived)
a V............ *~'-. -'P-------------

~I~M1N~FJW-WI F.16KV%?ULK
20
presently in use for this test. (The test has different
weights for each of the eight sections.) The second was a
multiple regression of three components on course
performance. (The eight original subtests were combined
into single reading, aural comprehension, and grammar
sections.) The third was a discriminant analysis of the
same components used for MR.
The unidimensional latent trait model seeks only to
extract a single underlying trait from the available data.
Those test items not contributing to this single trait can
be eliminated and subsequent re-estimates of person
abilities are possible. This model does not establish a
universal scale for language ability, but seeks to extract a
single metric from person and item interactions. There is,
therefore, no a priori determination of such a scale. The
model seeks only to establish a consistent scale of
measurement, where similar scores represent similar".u
knowledge.
The second objective of this study is to identify
student response disturbances on an individual level. This
can only be done through analysis of each response pattern.
Only a limited number of disturbances can be reasonably
identified using the Rasch model (Optometry Admission
Testing Program, 1988; Smith, in press a), but when
measurement disturbances are identified, corrections to
ability estimates are possible. These corrected ability

21
estmates are then compared to the initial Rasch ability
estimates to determine if prediction of the placement test
was enhanced.
Specifically, this study investigated the following
questions:
1. Is success in foreign language learning best
predicted by a placement test incorporating the Rasch model
or by one using a variety of weighted multiple components?
2. Can the following test disturbances be identified
and corrected in order to improve test predictive validity:
Test start-up anxiety
Guessing
Plodd ing
Sloppiness
Item-content and person interaction
Assumptions
Criterion Measurement
It is assumed that cumulative test-scores in each of
the three language courses at the USAF Academy are a
comprehensive, valid, and reliable assessment of foreign
language achievement. In a previous study of Academy
language tests, Bush (1983, p. 21) states that "extensive
amounts of time (have] already [been] spent in insuring the

content validity of course examinations, and . .
investigation has shown them to be sufficiently reliable."
Ability estimation
It is assumed that the Placement and Validation
Examination (PLAVAL), although lacking the assessment of
written and oral skills, is a reasonably good estimator of
language ability. It should be noted that writing and
speaking achievement are assessed in course tests and
therefore influence the criterion scores described above.
This assumption is a limitation for this study because the
PLAVNL does lack content validity in this respect. One
justification for this assumption, however, comes from
previous studies, such as those by Oller and Perkins (1978)
that have shown that tests of varying linguistic content
correlate highly with each other. This assumption is more
valid if, indeed, language ability measures assejs a common,
global characteristic.
Item Independance
The Rasch model assunes local independance of each
item. Whereas perfect independance is not a realistic
expectation, it is assumed that violations of this
assumption has not greatly affect item calibration.
R 1i h, 11,1 * . . . -r~

V-1 --I
23
Item Bias
Item bias has not been investigated and it is assumed
that if some items are indeed biased with respect to gender,
race, or cognitive style, it has not significantly affected
the results.
Definition of Terms
Foreign Language Ability
The term is used to describe an examinee's performance
on a test of language skills. Educators speak more often in
terms of "competence" and "proficiency" depending upon which
theory of second language acquisition they support
(Savignon, 1985). For the purposes of this study, however,
the term "ability" will be used to refer to the amount of
knowledge an examinee has of a foreign language represented
by the score on a test regardless of which laaguage
acquisition theory is reflected by that test.
PL AVAL
This term is the acronym used for the USAF Academy's
foreign language? Placement and Validation Examination
(PLAVAL) given to most incoming freshmen. ("Validation"
p - - -

I-
24
here refers to exempting students from language study if
their score is sufficiently high.)
Course Performance
This refers to the student's total of all scores on
objective tests given during the first term of language
instruction. These tests include integrative items (oral
interviews, short essay, and reading comprehension) as well
as discrete-point, grammar and vocabulary items. Tests are
identical for all classes within a course.
Item Fit
It is the degree to which a test item conforms to the
assumptions of the psychometric model (local independence
and unidimensionility). It is also defined by the degree to
which an item conforms to the test's single item-
characteristic curve required by the model (Wright & Stone,
1979) . r
Person Fit
X
It is the degree to which a person's item responses
conform to the expected pattern for a given score. It can
also be thought of as the person counf-Prpart of item
descrimination (Wright & Stone, 1979).
P ~ .A

25 O
• D~
Test start-up anxiety
Examinees exhibiting this disturbance tend to do poorly
at the start of the test, but later show a higher ability on
the remaining items. The total raw or weighted score will %
tend to underestimate their general ability (Smith, 1981).
Guessing
For one reason or another, a particular examinee
chooses to answer in random fashion. If the examinee
guesses on only part of the test due to the difficulty of
the items, there will be several unexpected correct answers
which will lead to an overestimation of ability. If the
examinee is guessing simply to complete a test, both
unexpected correct and incorrect responses will be observed.
In many cases, the overall effect will be an overestimate of
ability (Smith, 1986b).
Plodd ing
Examinees who exhibit excessive cautiousness will work
too slo.ly to complete the test, and this will result in a
series of blanks in the latter part of a timed test orI
section of a test. If these blanks are scored as incorrect
responses, that examinee's ability will most likely be
~ .d" -

26
underestimated (Smith, 1986b). This is equally true of
someone who becomes ill during the test and fails to
complete it.
Sloppiness
Examinees who exhibit disinterest in the test will tend
to be careless to some degree and miss some low-difficulty
test items. The same will occur if an examinee is
overconfident and works too quickly or pays too little
attention to the items. If an examinee becomes bored or
fatigued by the test (especially a long one), the examinee
will have unexpected wrong answers. Examinees who become
ill. and continue with the test may also miss items due to
inattentiveness. Regardless of the reason, sloppiness leads
to an underestimation of a person's ctiit-y (Smith, 1986b).
Item-Content and Person Interaction
This disturbance in the response pattern is due to
content items differentially familiar to the examinee
(Smith, 1981). In a foreign language test, this could occur
if an examinee who had a greater than normal exposure to
reading in a high school curriculum, for example,
demonstrated a higher ability in reading than other
examinees who have equal scores; or, an examinee may do
better on items testing discrete functions of language over

27
those of the integrative type because of a high school
curricular emphasis. This could lead to an overestimate of
general ability assuming, of course, that the placement test
is scored as the unweighted sum of the correct items
answered.
Limitations of the Study
Unidimensionality
If the placement test shows a strong unidimensional
trait, it does not prove, by itself, that foreign language
ability is by nature unidimensional. The test may only
reflect the commonality of language curricula in high
schools nation-wide.
Identification of Test Disturbances
Identification of test disturbances can only be
inferred from teet pattern analysis; it is done without the
benefit of confiri.iation by the individual. Furthermore, in
experiments using simulated data, patterns modified to
reflect random disturbances were not always identified and
escaped detection (Rudner, 1983). Because the experiment is
addressing non-random disturbances with real data, however,
it is assumed that few significant disturbances have gone
unnoticed.
*1

28
General izabil ity
Generalizability is necessarily limited by the nature
of the sample. The Academy generally selects individuals
who graduate in the top ten percent of their class, and fall
within a restricted age-range of 17 to 21. Additionally,
the experiment was limited to the French PLAVAL. Results of
this study, however, may have applicability to similarly
constructed examinations of other language programs at other
undergraduate institutions.
Organization of the Dissertation
The experiment is described in the four remaining
sections. Chapter Two reviews literature concerning
predictive validity, the development of the Rasch model and
its theoretical base, and the development of various
measurement-disturbance models with specific review of
IPARM's theoretical base. Chapter Three describes the
procedures used to conduct the experiment, including sample
selection, research design, instrumentation, and data
analysis. Analysis of the results are found in Chapter
Four, and Chapter Five contains a summary and
recommendat ions.

CHAPTER II
REVIEW OF LITERATURE AND THEORETICAL BASES
The purpose of this chapter is to review pertinent
issues concerning predictive validity and psychometric model
selection. The focus will be on the theoretical bases for
the Rasch model item calibration and IPARM person ability
re-estimation. Use of the Rasch model will be defended with
relevent research, but the primary objective will be to
contrast f-his particular unidimensional measurement model
with multidimensional approaches. Other latent trait models
4ill be addressed less extensively (research contrasting
Rasch with other latent trait models abounds). The unique
advantages of the IPARM re-estimation procedure add another
dimension to the comparison of latent trait with classical
test models.
Prediction
"Predictive ability describes the accuracy with which
we can estimate the extent to which the individual currently
manifests or posesses sone other property" (Ghiselli,
Campbell, and Zedeck, 1981, p. 270). When an evaluator is
interested in appropriate placement of students into
29
V ''

30
sequential foreign language courses, he or she will be most
interested in obtaining the highest correlation possible
between the placement instrument (the predictor variable)
and course performance (the predicted or criterion
variable). The higher the correlation, the higher the
predictive validity (Ghiselli, Campbell, & Zedeck, 1981). In
generally linear relationships, determined by visual
examination of scatterplots of the two variables studied
(Ary and Jacobs, 1976), the Pearson Product-Moment
correlation coefficient (Pearson r) is used to describe the
degree to which one variable predicts the other. (For the
definitional formula, see Cunningham, 1986, p. 49.) Several
factors affecting predictive validity will be reviewed with
a focus on appropriate model selection.
Nonlinearity
A necessary ingredient to valid placement examinations
is the test's co-linearity with course performance.
Otherwise, rank-ordering examinees for placement would be
meaningless. It is important to note, however, that insofar
as the relationship departs linearity, it reduces the
validity of th2 Pearson r as an indication of predictive
validity (Ary and Jacobs, 1976). Underestimates, for
example, will occur when the relationship is curvilinear.
A
Ir ,WS

31
kttenuation
When the range of individual abilities is decreased, as
in the case of examining a subgroup of the sample tested,
the correlation of that particular subgroup's predictor
score with the criterion variable will be lessened
(Ghiselli, Campbell, and Zedeck , 1981). In the case where
correlation coefficients of the placement test with the
criterion variable are calculated within ability
subgroupings, the relationship can decrease significantly
due to the increased homogeneity of the group (Ary and
Jacobs, 1976).
Sample Size
Cunningham (1986) states that larger sample sizes
increase the stability of the corrrelation. If N is too
small, coefficients may either under- or over-estimate the
relationship.
Content
It can reasonably be assumed that the closer a
placement test resembles (in terms of item styles and
content) the types of tests students will encounter in a
particular course, the stronger will be its predictive
vvalidity (all other things being held equal). It should be

32
noted however, that in the field of foreign language testing
research, studies indicate that substantial departures from
similar content do not necessarily invalidate the predictor
instrument. In a study of four ESL proficiency tests used
for placement, Hisama (1978) found that whereas these
instruments represented radically different formats and
reference populations, factor analyses indicated that each
revealed "substantial reliability and validity as measures
of a single proficiency factor." In a study of two
different testing procedures, Shohamy (1983) also
demonstrated the high concurrent validity of oral interview
and the cloze procedure. Indeed, Brown (1980) comments that
content validity is not essential for criterion validity.
This is not to say that attempts to align more properly the
placement test with course content will not increase
predictive validity, but that the predictor need not be a
parallel form of the predicted variable in order to have
useful predictive validity.
Test Reliability
There are various methods employed to assess the
reliability of a measurement instrument (Cunningham, 1986).
Ghiselli, Campbell, and Zedeck (1981) point out that the
lower the reliability in either the predictor or the
predicted variable measures, the lower the correlation of
the two.

: ~3 3 %
To examine the reliability of the test, formulae have
been devised that attempt to determine its internal
consistency. (Discussion will be limited to reliability
coefficients of non-repeated measures.) Different
measurement models suggest different reliability formulae.
If the evaluator adopts the classical test theory, i.e., a
multi-factor approach, reliability is determined through
correlating test-halves split according to content with
matching items in both subtests (split-half reliability).
If the domain sampling model (unidimensional) is in view,
then the Kuder-Richardson (KR) formulae are more
appropriate. These give an indication of the strength of
the unitary factor being tested. To the extent that a test
is multidimensional, these KR coefficients will be lowered
(Gniselli, Campbell, and Zedeck, 1981). Problems of test
reliability are compounded when subjective judgements are
made concerning individual foreign language ability. As in
the case of integrative testing of written or oral skills,
the evaluator must consider inter- and intra-rater
reliability when using scale scores. Hendricks, Sholz,
Spurling, Johnson, and Vandenburg, (1978) ana Shohamy (1983)
demonstrate the possibility of having inter-rater
reliability coefficients greater than .90 but Mullen (1978)
had coefficients below .70.
I

" 34
Person Reliability
Determining the extent of person reliability is more
properly addressed through the use of latent trait theory
(Hulin, Drasgow, and Parsons, 1983). Various indices
(Drasgow, 1982) have been developed to alert the evaluator
when an individual has shown inconsistencies in his or her
response pattern. As Hulin, Drasgow, and Parsons (1983, p.
111) point out, "Standard methods for developing and
assessing tests--for example, classical test theory and
factor analysis--make little or no provision for the
possibility that the latent trait of some individuals may be
poorly reflected in their test scores."
Adoption of a Measurement Model
Streiff (1983, p. 343) asserts that the dimensionality
of foreign language ability is still a topic of controversy.
Streiff contends that whereas there are many researchers who
agree to the multifactorial nature of language, "independant
reasoning suggests nonetheless that [a single] language
[factor] will continue to appear as a highly influential
factor in student . . . performance [on a variety of
educational tests]."
The evaluator must not simply assume that because a
construct is multifactored, this necessarily predetermines
any insLrument purporting to measure that construct as being

35
itself multifactored. Canale (1983), for example, proposes
four different dimensions to language proficiency:
grammatical competence, sociolinguistic competence,
discourse competence, and strategic competence. A test
confined to any one of these dimensions could have the
property of unidimensionality without implying that language
ability, in all its complexities, is unitary in nature. A
test incorporating two or more discrete variables should
employ a measurement model that enhances the unique
contributions that each of these variables bring to the
estimation procedure, otherwise, as Ghiselli, Campbell, and
Zedeck (1981, p. 417) point out, results will have reduced
validity. In contrast, if, as Oller (1983a) believes,
ability estimates are most completely explained by a unitary
factor q, then a measurement model that uses single-source
variance would be the most appropriate on all language
tests.
Ghiselli, Campbell, and Zedeck (1981) claim that
determining the dimensionality of the data before
interpreting the results of any measurement is critical to
its validity. wright and Stone (1979, p. vii) quote
Thorndike in reference to his concern that tests fail to
specify "how far it is proper to add, subtract, multiply,
divide, and compute ratios with the measures obtained." The
evaluator must adopt a model that empirically justifies its
mathematical manipulations if predictive validity is to be
improved.
36
Dimensionality and Predictive Validity
With the constraint of combining multiple criteria into
a single composite, the issue of which weighting paradigm
will yield the highest predictability will be explored.
This section will review validity issues contrasting
multivariate with latent trait models with emphasis on the
latter.
Multivariate Weighting
Single Predicted Variable.
In an experiment comparing four methods of weighting
predictors, including multiple regression and unit weights,
Aamodt and Kimbrough (1985) found that all methods were
highly correlated, concluding that the type of weighting
scheme mployed did not significantly affect predictive
validity of the instrument. Lawsche (1969) (cited in the
study, p. 478) also demonstrated that "differential
weighting of predictors leads to validity coefficients no
higher than the adding of raw scores." Furthermore,
cross-validation revealed that shrinkage was highest (but
not statistically significant) for multiple regression
weighting. Schmidt's (1971) study of the relative
efficiency of regression compared with unit predictor
weights, showed that unit weights were subject to less
shrinkage in cross validation than multiple regression

37
weights. Previous studies by Fralicx and Raju (1982) and
Wainer (1976) support these conclusions. For a complete
discussion of multiple regression see Cohen and Cohen
(1983).
Multiple Predicted Variables.
In the case of multiple dependent variables which are
qualitatively different, appropriate classification is
attempted through the use of discriminant analysis (Stevens,
1986). This procedure is analogous to multiple regression
in that it is designed to maximize predictive power using a
battery of measurements. Linear combination of the
predictors are also used in discriminant analysis to
distinguish the various dependent-variable groups. As
Stevens points out (1986, p. 233), "it [is] clear that
linear combinations are central to many forms of
multivariate analysis." A limitation of the model, however,
is its requirement of large N when variables are numerous.
Stevens (p. 236) cites research (Barcikowski & Stevens,
1975; Huberty, 1975) which implies that unless the ratio of
N (total sample size)/p (number of variables) is larger than
20 to 1, "one should be very cautious in interpreting the
results," otherwise, Stevens claims, discriminant functions
become very unstable. Furthermore, as in the case of
multiple regression, these canonical discriminant functions
are subject to validity shrinkage when cross validated
(Fralicz & Raju, 1982). h thorough discussion of

38 S.
discriminant analysis is found in Stevens (1986).
Predictive validity is determined by percent of correct
placement rather than by Pearson r coefficients.
Latent Trait Models.
Latent trait models have distinct advantages over
classical test theory when the data fit the models'
assuptions, i.e., unidimensionality, item independance, and
item-characteristic-curve (the increased probability
examinees have of responding correctly to an item as ability
increases) (Cunningham, 1986). Classical test theory
assumes that every test item is equal to every other item
(of equal weight) for ability estimation. Each additional
item scored correct assumes an increase of one unit of a
particular attribute. Because items vary in both difficulty
and discrimination (relationship to the underlying trait),
ability scales constructed using such an assumption will
very likely not be interval. Furthermore, latent trait
theory allows for the determination of appropriateness of
the measure for individual examinees (Wright & Stone, 1979).
The three most-widely used latent trait models are:
one-, two-, and three- parameter (Hulin, Drasgow, and
Parsons, 1983). These parameters are a, the slope of the
item characteristic curve (ICC), b, item difficulty, and c,
the lower assymptote of the ICC corresponding to the
probability of a correct response by examinees with very low
ability--also called the pseudo-guessing parameter.
Q.0v

39
Definitional formulae for each model is found in Hulin,
Drasgow, and Parsons (1983). The three-parameter model uses
all three paramters, the two-parameter model uses a and b
with c values being zero, and the one-parameter (the Rasch
model) uses only b with a as a constant value of one and c
as a value of zero.
Andersen (1977, p. 80) addresses the issue of the
minimal sufficient statistic in a study of latent trait
models. He states that "according to the usual
interpretation, a sufficient statistic represents data
reduction that preserves the information contained in the
data. Minimality of the statistic means that the data
reduction is as effective as possible." Anderson
mathematically demonstrates that the minimal sufficient
statistic (when it is assumed to exist) must be the
unweighted raw score, and that this requires that the model
be of the Rasch type. The other latent trait models, Wright
(1977, p. 102) argues, "lead to more complex scoring rules
that involve unknown parameters for which satisfactory
estimators do not exist."
The one-parameter (Rasch) logistic model is
particularly useful with small N. Wright (1977) explains
that the model can provide satisfactory calibrations precise
enough to protect measurements from unnacceptable
disturbance with as few as 20 items with sample sizes as low
as 100 persons. Hulin, Drasgow, and Parsons (1983)
recommend, based on several studies of sample sizes and

40
number of items, that for test lengths as short as 30 items,
the two-parameter model will need 500 examinees and the
three-parameter, 1000 for sufficiently accurate estimation
of ICCs. Because of the Rasch model's efficiency in item
calibration for small N, and its unique feature of
disturbance detection and correction, this model will be
discussed in more detail.
An Introduction to the Rasch Model
In their introductory remarks regarding the development I.
of the Rasch model, Wright and Stone (1979, p. x) quote
Loevinger (1965):
Rasch (1960) has devised a truly new approach to
psychometric problems . . . . He mnkes use of none of
the classical psychometrics, but rather applies algebra
anew to a probabilistic model. The probability that a
person will answer an item correctly is assumed to he
the product of an ability parameter pertaining only to
the person and a difficulty parameter pertaining only
to the item. Beyond specifying one person as the
standard of ability or one item as the standard of
difficulty, the ability assigned to an individual is
independent of that of other members of the group and
of the particular items with which he is tested;
similarly for the item difficulty . . .. When his
model fits, the results are independent of the sample

41
of persons and of the particular items within some
broad limits. Within these limits, generality is, one
might say, complete.
The Rasch model avoids certain problems of classical
psychometric theory (Wright & Stone, 1979; Spada & May,
1982). Estimates of ability are no longer tied only to a
specific set of test items, but are test-freed, thus, tests
varying in overall difficulty but using items from the same
unidimensional metric, can be equated. Item difficulty
estimates are also freed from the distributional properties
of person ability measures so that these estimates are
sample-freed, thus creating a single metric defined by the
order of relative difficulty of the test items. In
classical test theory, the use of standard and percentile
scores cannot be compared across different administrations
of the same test using different samples, and neither can
tests varying in difficulty be compared meaningfully because
test results are dependent on specific sample and set of
test items.
The Rasch model has certain properties that uniquely
address test equating and linking, item banking, log-linear
scale transformation, and partial-credit item calibration
(Wright & Stone, 1979), but only those features of the model
that have a significant contribution toward placement-test
validation will be discussed.

42
Unidimensionality
The most important feature of the Rasch model is its
assumption of unidimensionality. It is assumed by the model
that all test items share a line of inquiry of mental
ability, and that this line can be represented as a single-
metric scale graduated in equal degrees of increasing
ability. This scale is operationalized by the items chosen
for the test. Items are calibrated according to degree of
difficulty (di ) and placed on a single scale accordingly;
items reflecting small differences of ability are closer
together than items of widely differing difficulties (see
Figure 3). These calibrated items, then, become the
operational definition of the variable measure. Persons are
placed on this scale according to their ability (by). v[
Because the model is a probabilistic one, individuals
are not expected to perform in perfectly predictable
patterns; items and persons will lack conformity to expected
performance to some greater or lesser degree. For example,
two items may have identical difficulties but dissimilar
discrimination among ability groups. This signifies that
these items do not interact with the persons in the same
manner. The model establishes a mean item charateristic
curve (ICC) and determines the degree of conformity of each
item to that curve. Where individual items exhibit
statistically significant departures from the expected, or
mean ICC, the item may no longer be a valid indicator of a
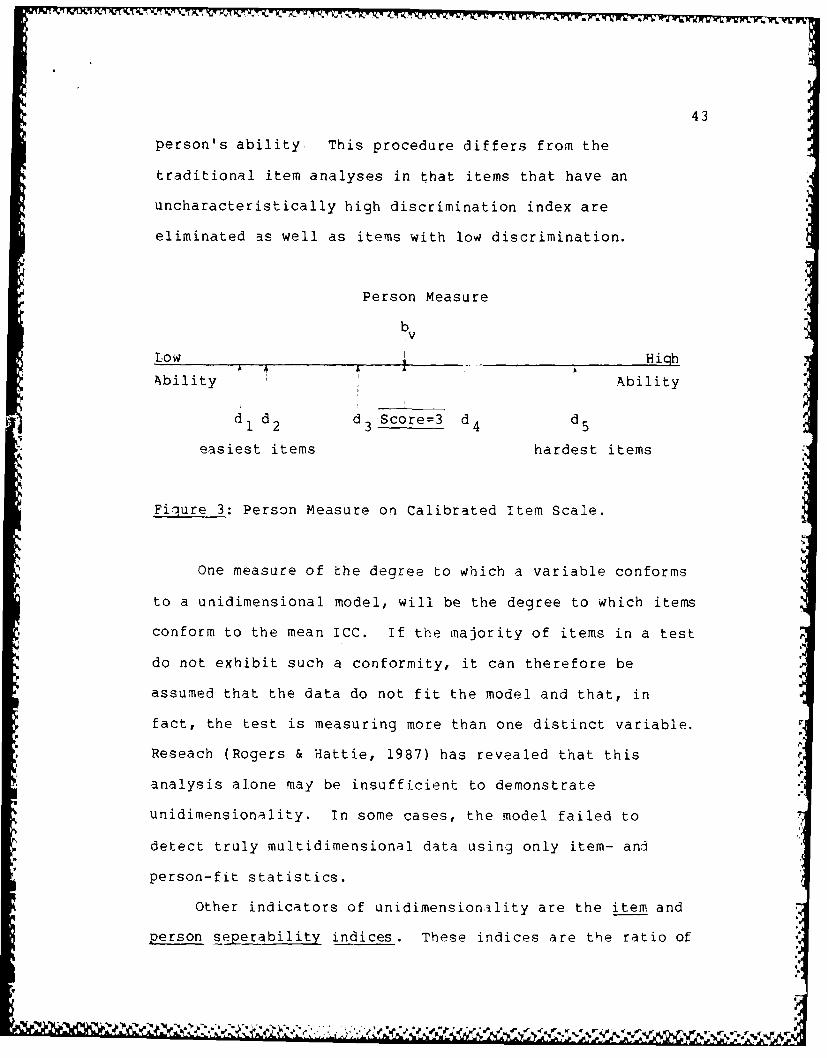
43
person's ability. This procedure differs from the
traditional item analyses in that items that have an
uncharacteristically high discrimination index are
eliminated as well as items with low discrimination.
Person Measure
bv
Low High
Ability AAbility
d1 d 2 d 3 Score=3 d 4 d 5
easiest items hardest items
Fiiqure 3: Person Measure on Calibrated Item Scale.
One measure of the degree to which a variable conforms
to a unidimensional model, will be the degree to which items
conform to the mean ICC. If the majority of items in a test r
do not exhibit such a conformity, it can therefore be
assumed that the data do not fit the model and that, in
fact, the test is measuring more than one distinct variable.
Reseach (Rogers & Hattie, 1987) has revealed that this
analysis alone may be insufficient to demonstrate
unidimensionality. In some cases, the model failed to
detect truly multidimensional data using only item- and
person-fit statistics.
Other indicators of unidimensionality are the item and
person seperability indices. These indices are the ratio of
't

44
the explained variance due to a single factor (separation of
item difficulty or separation of person abilities,
respectively) over variance due to all other factors
(measurement error primarily). If the variance due to
seperability equals that of the measurement error, as in the
case of random data, the ratio is equal to 1, and the data,
not showing any unidimensional property, do not fit the
model. Furthermore, the person separation reliability is a
maximum-likelihood equivalent to the Kuder-Richardson-20 or
Cronbach's Coefficient Alpha reliability indices. This
internal-consistency estimate will be low if the components
lack homogeneity and have lo4 covariances. Low estimates
occur when "the domain or universe from which the components
are sampled represents more than one characteristic or
factor of behavior" (Ghiselli, Campbell, & Zedeck, 1981). If
the data do fit the model, then the evaluator refines the
scale by eliminating persons and items that have high fit
statistics (Wright & Stone, 1979).
Person Ability Estimation
Person abilities are placed on the same metric as the
items, a metric operationalized by the items chosen for the
test. It is assumed that if a person's ability exceeds the
item's difficulty, the person will have a greater than 50
percent chance of answering the itein correctly. As items
close to the persons ability are attempted, the probability

45
(2) of a correct answer approaches 50 percent, and the
probability decreases as items of increasing difficulty are
attempted (see Figure 4).
1.0-
0.5---
0.0 (bvdi)
0
bv<di bv=d i b V>d i
Figure 4: Correct Response Probability Curve
The estimate of person ability is located on the scale
where the person shifts from a string of mostly correct item
responses to mostly incorrect ones. The actual scale used
in the Rasch model is a log-linear score transformation
which results in a score of zero representing the locatio
of the mean of item difficulties, with negative numbers

46
representing lower scores and positive ones representing
abilities beyond the mean item difficulty. (Values of -4.00
to +4.00 are a typical score range with units expressed as
logits.)
Person Fit
The Rasch estimate of ability is appropriate only
insofar as the person's responses conform to the expected
pattern of responses. The degree of appropriateness of a
given test for a particular individual is directly assessed
by the degree of conformity of that person's response
pattern to the expected pattern for that person's total raw
score. This appropriateness, or fit, can be thought of in
terms of a "person discrimination index." In programs used
for item calibration, persons with large discrepancies
(large fit statistics) are often eliminated in order to
calibrate each item more effectively.
Those individuals deemed non-fitting, are considered to
have invalid test results. This leads the evaluator to
several possibilities. He or she can ignore the unusual
pattern and use the score as it is, or retest the
individual, or attempt to salvage the estimate by
discovering the reason for the discrepant pattern and
re-estimating that person's ability as a post hoc procedure
using the original responses. This assumes that at least
part of the test was valid. In the case where a student

47
answered all the items in random fashion, obviously no
amount of correction would lead to a valid estimate of
ability. Whereas other latent trait models attempt
correction of anomalous responses (assumed to be due to
guessing only) by adding an additional estimation parameter
(Hulin, Drasgow, & Parsons, 1983), only the Rasch model
opens the possibility of correcting for more than just
guessing through the use of the IPARM procedure (Mead, 1978;
Smith, 1987).
Disturbance Detection Past and Present
Smith (1988) defined measurement distubance as any
"abnorinalit[y] that may occur during the testing process
that may cause the examinee's test score to be an
inappropriate estimate of the examinee's true ability."
Smith (1986a) traced the history of measurement disturbance
and how past efforts have attempted to minimize its effect
on the validity of measurement. Four major themes in
dealing with disturbances were discussed.
The earliest one was developed by Thurstone (1927).
His solution was to identify those persons who took the test
in a careless mainner or who misunderstood the instructions.
These persons would exhibit an "erratic" response pattern
determined by an identifying criterion based on an absolute
scale of measurement. Continuing this theme, Mosier (1940)
argued that responses either well above or below an
I

48
individual's ability should show a consistent pattern of
right- or wrong-response strings. Lumsden (1978) introduced
the concept of person unreliability corresponding to the
degree to which a person departs from a person
characteristic curve (PCC). These PCCs presuppose stable
item difficulties (as in the Rasch model). Disturbances
will tend to reduce the slope of the PCC. Therefore,
persons whose slope exhibits significant departures from the
test sample's mean slope are considered to have invalid test
scores.
In analyzing data on attitude measures, Cronbach (1946)
developed the theme of response sets . These sets are
defined as an examinee's particular response
predispositions, e.g., tendency to gamble, biases, and speed
versus accuracy. Cronbach recommended constructing tests
that reduced the effect of these response sets. Goldman
(1971) and Gronlund (1985) continued this theme and added to
the number of response sets described by Cronbach.
A third theme representing concepts embodied in
Guttman's (1947) scale, an a priori unidimensional attitude
measure, was developed by Harnish and Linn (1981). They
designed an index of person fit that was also based onk
Sato's (1975) "caution" index, an indicator of the extent to
which a person's response pattern deviates from the expected
pattern. The index, however, is sample- and item-dependent
and its usefulness is therefore confined to the particular
test and sample.

49
The fourth theme, developed by Fowler (1954), is based
on the person-biserial correlation; the lower the
correlation, the greater the degree of person mis-fit.
Donlon and Fischer (1968) continue its use in person fit
analysis.
In her study of current latent trait model person-fit
indices, Birenbaum (1985) states that whereas
psychometricians have been concerned with person fit for
many years, this has had little effect in practice.
Recently, however, interest has been revived, and
consequently, a variety of person-fit measures have been
developed. Rudner (1983) distinguishes four categories:
1. Rasch Model Approaches. Wright and Panchapakesan
(1969), Mead (1976), and Mead and Kreines (1980) employ two
statistics to determine person-fit, the weighted total-fit
mean-square and the unweighted total-fit mean-square. The
former is sensitive to unexpected responses on items near
the person's ability; the latter is more sensitive to those
items remote to that person's ability. (For definitional
formulae see Smith, 1981.) These, according to Rudner
(1983), are perhaps the best known indices of individual S
assessment accuracy.
2. Birenbaum Model Approaches. Two relatively new
indices extend the Rasch model fit statistics to the
three-parameter latent trait model; a third index, based on
the likelihood function, indicates a probability of the
observed response pattern for a given ability estimate. S.

50
3. Correlation Approaches. Two are currently in use:
Donlon and Fisher's (1968) personal-biserial correlation and
the point-biserial correlation.
4. Sequence Approache . Based on the Gutman scale,
Harnish and Linn (1981) propose a modified Sato caution
index (described earlier), and Tatsuoka and Tatsuoka (1982)
use the norm and individual conformity index.
All of these person-fit models examine the expectedness
of an individual's response pattern given a particular
ability. investigation of the effectiveness of these
various indices by Rudner (1983), Drasgow (1982), and
Birenbaum (1985) show that no single index is most effective
in all circumstances, but rather, the circumstances suggest
the choice of person-fit model. Because the Rasch model
indices are not only useful in detecting disturbance, but
particularly useful in re-estimating ability, these are
discussed further.
Item and Person Analysis with the Rasch Model
The unique contribution of the IPARM procedure to
re-estimation of person ability may have a significant
impact on improving the predictive validity of tests,
especially when re-testing or interviewing persons with
unusual test results is not practical (Mead, 1978; Smith
1981). Such is frequently the case with foreign language
placement exams when large numbers of students are tested.

51
IPARM looks at both items and persons. The item
analysis includes the traditional statistics for determining
the validity of particular items, but the person analysis is
the focus of this study.
Essentially, IPARM uses a person's total score to
establish statistical expectancies for each item the
individual attempted. If a low ability person correctly
answered a very difficult question, the standardized
residual (a figure representing the unexpectedness of the
response) becomes large. This residual is interpreted as an
indication of fit and its distibutional properties closely
approximate a one-degree-of-freedom chi-square.
When sflficient numbers of unexpected responses occur within
a person's response pattern, the overall fit statistics also
become large. The larger the fit statistic, the greater the
departure from the expected response pattern, and by
extension, the lower the validity of the test for the
particular individual.
IPARM provides two overall tests-of-fit: an unweighted
total fit (UTF) which is a statistic influenced more by
unexpectancies nearest the person's ability, and a weighted
total fit (WTF) which is influenced more by unexpectancies
at the high or low end of the test. IPARM will provide fit
statistics for one item, a group of items or an entire test.
It is the analysis of groups of items that lead to
discovering the nature of the misfit when present, and
applying an appropriate correction. Test items can be

52
divided into subgroups representing difficulty, order of
presentation, item styles, or content. Each subgroup is
analyzed as a test independent of other subgroups, with fit
statistics characterizing an individual's expected response
pattern. Estimates of ability are determined for each
subgroup (see Figure 5).
Subgroup and Total Test Scales
b
Subgroup A ________________
-4.0 -200 +4.0
Al A2 A3 A4 A5
b
Subgroup B __________________ I___
-41 +4.0
-400 1+1.7 +.
Bl B2 B 3B 4B5
Subgroup C10 1 L-4.00 ; 1. 1 +4.0
C1lC2 C3 C4 C5
b
Total Test _______________________
-400 +0.5 1+4.0
4l Bl Cl C2 A2 A3 C3 B3 B4 A4 A5
B2 C4 B5 C5
Figure 5. IPARM Subgroup Ability Estimation

53
In the example of Figure 5, the test has been divided
into three subgroups based on content or order of
presentation. The questions are placed on each of the
scales by order of difficulty and person ability is
estimated by the calibrated items in each subgroup as well
as in the total test (items are not re-calibrated when
considered as members of a subgroup). The individual now
has three separate ability estimations and one total test
estimation: This person has subgroup logit abilities of
-2.0, +1.7 and +1.9. The total test ability was estimated
at +0.5. Obviously, if the majority of examinees exhibited
such discrepancies, unidimensionality of the test would be
questionable. However, assuming the test is unidimensional,
this individual would have a large tit statistic, alerting
the evaluator to investigate the nature of the disturbance.
If these subgroups represented order of presentation, the
low ability estimated by the first subgroup could be due to
test start-up anxiety. The ability re-estimation would be
to eliminate part or all of the items belonging to subgroup
A and allow the remaining items to estimate the examinee's
total ability.
IPARM also estimates goodness of fit data for each
scale: a within-fit statistic and a between-group-fit
statistic characterizing the agreement of ability estimates
given by each scale (these figures ?r- no- represented in
Figure 5). IPNRM allows the evaluator to assign each item
F,.. ,
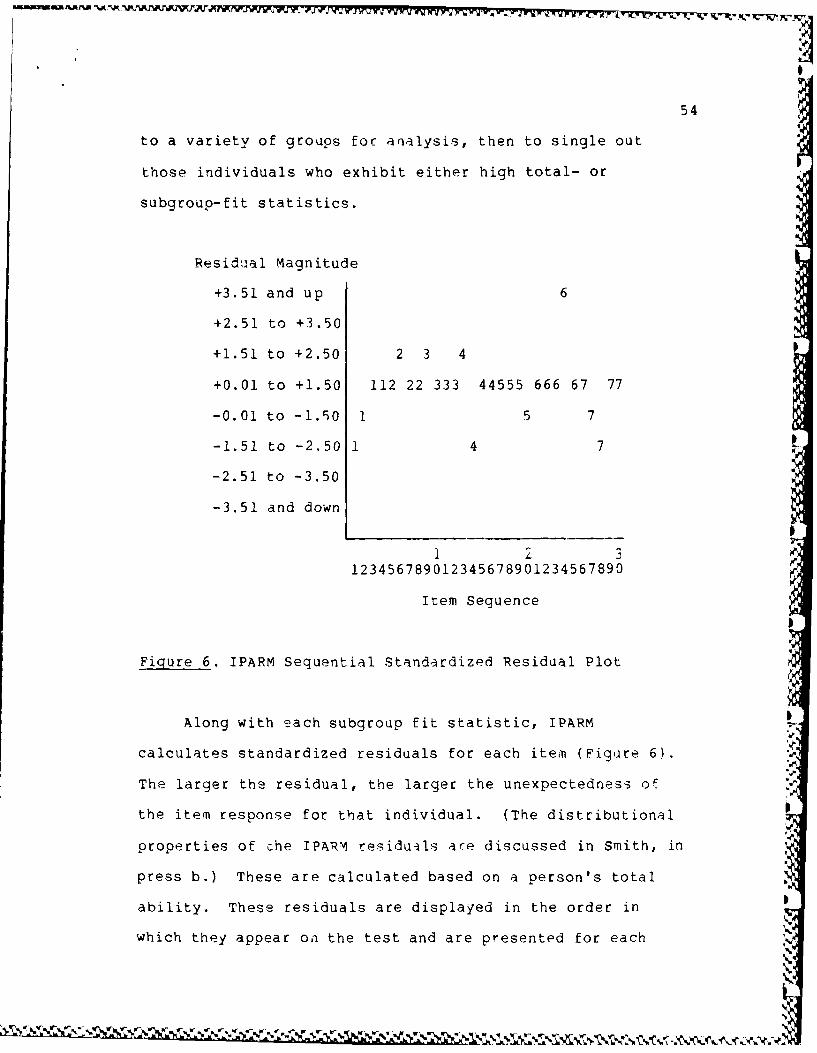
54
to a variety of groups foc analysis, then to single out
those individuals who exhibit either high total- or
subgroup-fit statistics.
Residual Magnitude
+3.51 and up 6
+2.51 to +3.50
+1.51 to +2.50 2 3 4
+0.01 to +1.50 112 22 333 44555 666 67 77
-0.01 to -1.50 1 5 7
-1.51 to -2.50 1 4 7
-2.51 to -3.50
-3.51 and down
123456789012345678901234567890
Item Sequence
I
Figure 6. IPARM Sequential Standardized Residual Plot
Along with each subgroup fit statistic, IPARM
calculates standardized residuals for each item (Figure 6).
The larger the residual, the larger the unexpectedness o-
the item response for that individual. (The distributional
properties of The IPAR'M residuils ace discussed in Smith, in
press b.) These are calculated based on a person's total
ability. These residuals are displayed in the order in
which they appear on the test and are presented for each
Vh
F it it~f .. P\ K ~r -W W~ % ~ .~~
55
subgroup analysis. Each item is coded for subgroup
membership and displayed in a graph crossing item locatin
with the magnitude of the standardized residual. Coupled
with subgroup fit statistics, these residuals reveal the
items that are contributing most to the misfit statistic.
The evaluator can then judge whether misfitting statistics
can be reduced by elimination of one or more of these large-
residual items.
Summary
In this review of literature and theoretical bases,
emphasis was placed on verbal discriptions in an attempt to
create a conceptual context for using the Rasch model in
foreign language testing; for this reason, mathematical
dcItriptions of the various models were kept at a minimum,
these being discussed at length in the various textbooks and
articles referenced in this and other chapters. Whereas the
Rasch model has been used in foreign language testing
(Powers, Lopez, and Douglas, 1987) it is not in widespread
use, and to the knowledge of this researcher, re-estimation
procedures suggested by Smith (1981) and Mead (1978) have
not been applied to foreign language test data.$
,1%

CHAPTER III
PROCEDURES
Population and Sample
The target population was the freshman class of 1987
enrolled at the United States Air Force Academy
(approximately 1200 cadets). The Academy itself is a
four-year, academic, and military institution granting a
bachelor of science degree and a commission as an officer in
the Air Force to each cadet completing the program of
instruction. Individuals are selected on the basis of their
performance in secondary institutions, placement tests, and
leadership potential. Cadets must be unmarried and be
between 17 and 22 years of age. SAT scores average 1200 and
most were graduated in the top ten percent of their class.
Applicants must show high potential as a leader-scholar-
athlete. Consideration of geographical and ethnic origin is
given to ensure proportional representation.
With respect to foreign languages, the Academy requires
of all cadets one year of study in any of seven languages
offered. Students are placed according to the results of
the PLAVAL. Approximately 15 percent are considered
sufficiently knowledgeable to have the language requirement
56

57I
waived. Cadets may continue language study throughout their
four years.
As a population for study, the highly-selective
admission process may decrease its heterogeneity, but
because of geographically proportional representation and an
active minority recruiting program, this population well N
represents not only the diversity of foreign language
curricula in high schools nation-.'ide, but also minorities
and the various socio-economic strata. The sample consisted
of all freshman students enrolled in courses of French for
the Fall semester, a total of 171.
Research Design
Due to the nature of this research study, more than one
statistical procedure was used in determining which scoring
model had the greatest predictive validity. The study
required the use of correlation, multiple regression, and
discriminant analyses. The predicted variable was course
performance as measured on objective tests. There were
three courses, French 131 (low ability), French 141
(intermediate), and French 150 (advanced). Although p'
students were assigned to the courses according to their
ability as measured by th- PLAVAL, the three resulting
groups could not be considered as forming one continuous
ahility variable because each group underwent a different
curriculum. The predicted variable scores were therefore
. .... , . .

58
determined using different tests; each group had to be
treated independently. This is not to say that relative
differences in ability were lost, but only that these groups
could not be considered as constituting a variable blocked
on ability. The predictor variables were the various
scoring procedures, the raw score, the Rasch model, IPARM,
rational weighting, MR, and Dk.
Correlation Classification 2 Statistics
Scoring Model F 131 F 141 F 150
Raw Score
Rasch Model
Rasch+IPARM1
Rational
MR /DA
Figure 7. Research Design
.,
".o .. . . .... o. .' d 'Sp j .~

VV59
The MR and DA could not be compared with the same
procedure. For comparing the three unidimensional
approaches with MR, the Pearson r was the statistical
criterion used. In comparing DA with the unidimensional
measures, only percent correctly classified could be used
as the criterion for comparison (see Figure 7).
Variables and Instrumentation
Assessment of Lanquaqe Ability
The French language PLAVAL exam was used to create the
various predictor variables. The exam consisted of nine
sections: three on reading ability, three on listening pcomprehension, two on discrete grammar knowledge, and one on
culture. (This last section was not included as part of the
ability estimation procedures.) There were a total of 110
multiple-choice, dichotimously scored questions in the firstJ
eight sections of the test. Using the same test data, six
predictor variables were created, three unidimensional and 6
three multidimensional.
Raw Score.
Representing an uncorrected unidimensional model,
examinee raw score (based on the entire 110-item test) was
used as a basis for examining the effects of Rash model item
calibration on predictive validity.
60
Rasch Model. jThe MSCALE calibration program (Wright, Rossner, &
Congdon, 1985) was used to calibrate item difficulties and
to determine the fit of the data to the assumptions of the
model, i.e , local independence and unidimensionality. The
program uses a maximum likelihood procedure to
simultaneously estimate item and person parameters. The
program also provides several methods for the user to
examine the fit of the data to the model. Two indicators of
the presence of unidimensionality are the item and person
seoarability indices. If, indeed, the data generally fit
the model, then the evaluator may refine the scale by
eliminating persons and items that have high fit statistics
(Wright & Stone, 1979). Those persons having either high
in-fit or out-fit statistics should be eliminated for
subsequent calibrations. This procedure may lower some
item-fit statistics, but those still exhibiting high fit
statistics are to be eliminated from the final calibration.
When all remaining items and persons have acceptable fit
statistico, then item calibration is complete. Of course,
ability estimates of persons having unacceptable fit
statistics are not reliable but were included in the
anilysis to note the change of predictive validity over the
110-question raw score estimate. Thus, the Rasch scores
represented ability estimates based solely on a reduced
number of items.
. . --- ' - L' t'n J ' ¢ * ¢US',
"Us
:* ,.. ,i,' '2i "; . . .S?...... o

__ 613
IPARM.
The IPARM program was used to identify mis-fitting
individuals and provide a basis for re-estimating abilities
affected by disturbances. Those disturbances that could be
reasonably identified by IPARM were plodding, guessing:
sloppiness, test start-up anxiety, and item-content and
person interaction (Optometry Admission Testing Program,
1988, and Smith, 1981).
The program requires the input of calibrated items and
types of subscale analyses required. To best detect
response disturbance, the test was subjected to four
analyses (see Figure 8) in which items were sub-grouped into
four levels of increasing difficulty (between analysis No.
1), order of presentation (between analysi No. 2), three
content areas: reading, aural comprehension, and grammar, in
that order (between analysis No. 3), and two item styles:
discrete and integrative, in that order (between analysis
No. 4). Appropriate items were deleted and a re-estimation
of ability was accomplished in accordance with the
guidelines set forth by Wright and Stone (1979) and Smith
(1986b) with the exception of disturbances due to plodding
and item-content and person interaction.
1. Example of Good Fit. Figure 8 shows the person-
response pattern analysis for a high-ability person (total
test loq ability = 2.72) with no detecta3ble disturbance.
Indicators of disturbance are one or more fit statistics 0

62
that exceed 1.5 in overall fit (unweighted total and
weighted total) or in any of the between analyses.
2. Plodding. Because not all blanks indicate
plodding, only strings of blank responses at the end of any
of the eight PLAVAL sections were considered as resulting
from plodding by the examinee; all other blanks were scored
as incorrect responses. Figure 9 shows a response pattern
of a typical plodder, i.e., all blanks occur at the end of
timed sections. In the case where no other disturbance was
noted, there is no need to resubmit the response data to a
second IPARM analysis because the omits excluded log ability
estimation is provided on the first analysis.
3. Interaction with Content. Those exhibiting high
between-fit statistics on the content sections (Figure 10)
had their logit abilities averaged based on the assumption
that each subtest measured the same ability, and, therefore,
all subtests should have the same impact on the estimation
procedure. Of the 88 PLkVAL test items remaining after
misfitting items were removed, 14 were from the reading
comprehension sections (subgroup 1), 18 from aural
comprehension (subgroup 2), and 56 from grammar (subgroup
3).
4. Interaction with Item Style. This same procedure,
averaging the logit abilities, was used in the case of item
style disturbances (Figure 11); ability estimations that
differed significantly in discrete versus integrative item
A All

63
styles (between analysis No. 4) were averaged (discrete
items were over-represented by a margin of 56 to 32).
5. Test Start-Up Anxiety. Figure 12 shows an example
of test start-up anxiety signaled by incorrect responses on
some of the least difficult items at the start of the test.
(See items 4, 9, and 11 in between analysis No. 1.) The
between analysis No. 2 reveals an ability estimate that is
lower in subgroup 1 than in all the other subgroups, thus
indicating an inconsistency with the rest of the test,
possibly due to test anxiety. The procedure in this case
would be to score these items as blanks, and use the
omits excluded logit ability estimation on the susequent
IPARM re-estimation.
6. Guessing. Figure 13 shows the pattern of an
individual whose guesses contributed to an overestimate of
ability (high total and difficulty fits). Elimination of
the most difficult but correctly answered questions would
improve the accuracy of the estimate. In this case, items
36, 56, 57, and 79, having the highest residuals, would be
eliminated for the re-estimation. If an examinee's
responses are random on part of the test, as in the case
whare he or she responds to answer "A" on all questions of a
subtest, that section is entirely removed from that person's
re-estimation. This is discovered by simply examining the
raw response data. These types of disturbances will most
probably be indicated by large fit statistics in several
areas of the IPARM analysis as well. If a student randomly

64
answers all test items, however, no correction can
reasonably be made since no part of the response pattern is
an indication of the examinee's ability.
7. Sloppiness. Sloppiness is generally indicated by
unexpected incorrect responses by high-ability examinees.
Figure 14 shows just such an individual. Elimination of
items 70 and 71 will reduce the high fit statistic for
difficulty along with the unexpectedly low log ability
estimated by subgroup 1 (the least difficult items).
The Rasch+IPARM independent variable includes all
person ability e'timates whether these abilities were
corrected for disturbances or not. A comparison of the
Rasch+IPARM and Rasch correlations with the dependent
variables assesses the extent to which the revised abilities
removed the measurement disturbances from the data.
Rational Weighting.
As a multidimensional model, it represents a weighting
technique in widespread use by foreign language evaluators.
This is not to say that the weights used at the Academy are
typical, but rather that a rationally-derived weighting
scheme is common usage. Abilities were estimated using the
currently used weights with the sole exception of the
"culture" section of the test which was not used.
Vik

65
PERSON NO. 3 ID FIELD
1 2 3 4 5 6 a
It-. 1na 2345676,0123406769012340676901234567199012340474901234567890123454760123457901234567 12.:4547690
U.o....d P..pon... 112111110111111111110111112111111211101111001
N.Ite Plocor. Log Abx1. S.E. U.N. Tot.1 Fit w. Tot.1 Fit
Total T..t as 60 2.72 0.29 -0.27 -0.06
Omit. Ezolud~d as s0 2.12 0.39
5.0.., Analy. "o. 1 D.rrZUL-Y 5.00... Fit -1.44
N.Ita R.Rcor. Log Abil. I.E. a.m. Within Fit
Su.bgroup 1 20 20 2.57 0.20 -0.07
=Subgrou.p 2 21 20 2.63 1.03 0.09
Subrop 3 25 23 2.86 0.74 2.34
Subgroup 4 22 17 2.57 0.03 0.22
SRUEfllA 2 7AMAD!ZED RRSAhV&3. PLOT (K-il/U.S Nber Plotted 2ndiwtse SUbgroup 4sblr6LP
.3.51 wd uP
+2.51 to 43.50
.510 to +2.50
*0.01 to -1.50 124132142211-323 213212123323412134 4433 433 44232234344 4431113321113113 2122342413 1 34
-0.01 to -1.50 4
-1.01 to -2.00 4 4
-2.51 to -3.50 4 4 3 3
-3.01 and do-, 2
1 2 3 4 5 6 1 6 9 0
S.tw.. Ans.p.. No. 2 ORDER 5.tw- Fit -1.13
N.Itma 9 2-ov, Log Abil. S.E. U.N. Ultbio Fit
Subgrup 1 16 15 2.64 1.00 0.09
Subgrop 2 21 2 0 3.26 1.04 0.13
Subgrop 3 21 16 2.69 0.66 -0.62
Sbgroup 6 29 13 2.63 1.04 -0.19
Subgrou.p 5 11 9 1.97 0.82 0.45
SE9VtT4IM STAICARDhEZZ RESMOAL PLOT? (I-P)/U.0 N~b r platted o~ditemt *ubgroup inb-r-hip
.3.51 ad up
+2.51 to *3.0
.2.51 to .2.50
.0.01 to .1.50 111111111111111 222222222222222222 2133 333 33333333333 33444444446444444 6644520005 5 55
-0.01 to -1.50 3
-1.21 to -2.00 3 3
-2.51 t. -3.00 2 4 0 2
-3.51 .o. do-t
1 2 3 4 5 6 S 0
Figure 8. IPARM Example of Proper Fit

66
Inton. AnIysis Iso. 3 Intwee. Fit -0.57
.It- RI.Ser. Log Aol. I.B. U.N. Within rit
S roup 1 14 23 2.7 1.05 0.70
Sub.group 2 1: 16 2.16 0.76 0.20
Subgroup 3 56 01 2.89 0.49 -0.64
If QVlhrTIL flTACAPtDOZU, O N, O PLOT (X-p1/I.! Number plotted Indioates subgroup mbership
+3.01 nd up
.2.01 to 03.0
+1.51 to +2.50
.0.01 to Li.30 111222211111111 333333333333333333 3333 333 33333333333 3322222333333333 3333112222 2 22
-0.01 to -1.50 3
-1.51 to -2.50 3 3
-2.51 to -3.50 3 3 2 2
-3.51 .. d don 1
....................................................................................................
1 2 3 4 5 6 7 S 9 0123436709012345676901234367690123456789012345676001234SO70901234 s678901234397090123456'78901234 567490
eten Anely.lo go. 4 DIC - Betan Fit -0.12
.Xt R.50cr Log Ab.L. 5.1. U.N. Within lit
ubqro.up 1 56 51 2,69 0.49 -0.64
ub.roup 2 32 29 2.40 0.62 0.29
ft006?IJAL ITAMARDIZID RZSIDCALU PLOT (X-P)/W.5 Womb- plotted ind oa t. subgroup .- brhip
'3 51 nd up
02.01 to 03.0
+1.51 to +2.0
00.01 to 01.50 22222-222222222 111111111111111111 1121 111 11111111111 1122222111111111 1111222222 2 22
-0.01 to -1.50 1
-1.51 to -2.50 1 1
-2.01 to -3.90 1 1 2 2
-3.51 nd d- 2
1 2 3 4 0 6 7 8 9 0122346700234567S90123435E?901234567290123456709012345678901234 S67090123456709012345970901234567490
Figure 8. (continued)
opq
Lw

67
PPLSO6 NO. 245 ID FIELD
2 3 4 5 4 6 0
Ite Number 135-913579135791357913579135791351913579135791351
Unaord Pa-p-n.a. 11 11111111101 1111111100110111 1101110110011111 111110 11111101111111011111111.1011111
Soo...d Reap.... 11 11111111101 1111111100110111 1101110110011111 111110 1121125121112101211111201111
NIoa R.Sooae Lg Abl. S.C. U.N. Total Fit 6. Total Fit
Total Teat 66 69 1.57 0.26 -0.40 -0.25
0.1c. Eooodad *1 49 2.05 0.33
loton Moalyat No. 1 DIMIIUT 6atemaa Fit -0.59
H.Item f.Soor .9 LoAbil. S. 0 .N. RithlA Fit
Subgroup 1 20 20 2.57 0.00 -0.51
Subgroup 2 21 i6 1.42 0.63 0.02
Subgroup 3 25 16 1.36 0.45 0.24
Subgroup 4 22 13 1.65 0.45 -0.00
BZOVIALL STM4DADI1Z RLSrDUlI. PLOT (X-F)/U.5 Numbar plotted indscaoa. Pubytoop membership
+3.51 -od up
42.51 to +3.50
.1.51 to +2.50
+0.01 to .1.30 12 132142212 2 21321212 23 121 44 433 43 44232 34344 311133 1113113 212234241 31334
-0.01 to -1.00 4 4 4 4 4 444 4
-1.11 to -2.50 3 32 33 3 3 2 3
-2.51 to -3.50 2
-3.51 and do-
1 2 3 4 5 4 7 a6 0
set..e Maaly ... mo. 2 ORP Satwea Fit -0.09
14.Ite a.Soore Log fbl. S.C. 0.N. With.. Fit
Subgroup 1 14 12 0.91 0.41 -0.39
Buk-gr...p 2 21 14 1.26 0.05 -0.63
Subgroup 3 21 14 1.44 0.0 0.38
B.tqo...p 4 19 17 1.60 0.77 -0.19
Subgroup 0 11 10 2.82 1.07 0.57
muotIfLa STNDCAPDIZlD RZSIW&L PLOT (K-W/.S Unobar plotted lodloata s.ubqroop ebarsbip
*3.51 .od up'4
02.51 to -3 50
01.51 to +2.50 NA*0.01 to +1.50 IL 111111111 2 22222222 22 232 22 233 33 33333 33333 444444 4444444 444455155 5555 to-0.01 to -1.50 1 2 2 3 3 333 4
-1.51 to -0.50 1 11 22 2 3 4 5 .
-2.51 to -3,50 3
-3 51 .od do-
1 2 3 4 5 4 7 6 9 0
F ilure 9.IPARM Example of Plodding
ILI

68
fSt.n An.ly.lo No. 3 CONTENT .to.t9 Fit 0.70
N.0t R.lore Log bil. S.C. 0 W. With=n Fit
ubg.oup 1 14 10 1.02 0.42 -0.19 -
Subgroup 2 29 17 2.94 1.05 046
9ubroup 3 56 42 1.48 0.34 -0.53
ZIQU'I".AL STAMtMfIZED RSI ULL PLOT (X-P)/W 5 unkbr pLotted io dcattm u"rOup m rohlp
ul-5i .od up
-2.51 to .3350
.1.51 to +2.50
+0.01 to *1.0 12 222211111 1 33333333 33 333 33 333 33 33333 33333 222223 3333333 333311222 22222
-0.01 to -1.50 1 3 3 3 3 333 3
-1.51 to -2.10 1 11 33 3 3 3 2
-2.51 to -3.50 3
-3.51 .od d on
--- ------ --- --- --- - -- -- ---..- -- -- - --- -- --- ---- --------- -- -- ----------- ---- -- --------- --- - -- ------ --
1 2 3 4 5 6 7 a 9 0
1214$4"7090123456'70901231456'74901234 $678501234567090123454';' 01231456?09012:1454?8001234567690123456705 0
Stooon AnslyOi* Mo. 4 D1SC " lfm Skoto rit -0.34
.It- R.8or Log Abil. 2.Z. U.W. W thi o rt
Subg.rop 1 56 42 1.46 0.34 -0.53
Subgroup 2 32 27 1.77 0.01 -0.13
SZrDITUL SIAITANDARDIZED RESIDUAL PLOT (I-P)/N.5 Km.r plottod iodicte onbgroup mmberobip
.3.51 .od up
.2.1 to .3.50
+1.51 to .2.50
+0.01 to 01.50 22 222222222 2 11111111 11 111 11 111 11 11111 11111 222221 1111111 111122222 22222
-0.01 to -1.50 2 1 1 1 1 111 1
-1.31 to -2.50 2 22 11 1 1 0 2
-2.S1 to -3.50 1
-3.51 od d-n
1 2 3 4 5 4 a 9 9 0| ~1234$670 01234546891)1231459709012314349012314s6709012314 6769012345678901234567690123145678901 134567890
'F
Figure 9. (continued)
0%*

69
91M094 No0. 227 ID VIEW D1 2 3 4 5 4 7 U 4 0
W.Ita RScoe Leg Abil. 1.1. 1.9. Total Fit w, Total Fit
Total Test to 71 2.44 0.35 2.26 0.70
0.1n. Riolodad of 76 2.44 0.35
St-.. Aalfl. IMo. 1 OIFTICULTTy Iatwn Fit -0.22
14.It.m Ricear. Logq Abl. 2.E. 0.3. Within Fit
Subgroup 1 20 I9 1.54 1.03 1.40
Subgrou p 2 21 1s 1.69 0.70 0-01
Su.bgroup 3 25 20 2.41 0.42 0.15
Icbgrocp 4 22 14 2.47 0.57 0.70
SEQUENTlIAL. STA2AIZED Ate wMfL PLOT [1-V1/1.0 flba plotted indicas *uk.Tonp aoarhop
03.51 and up
+2.51 to *3.55
ti.5l to +2.50
+0.01 to 01.50 41321 2212323221321212332 412134 443344334442 223 3 4444311133 111311342122 4241331334 1
-0.51 to -1.50 4
-1.01 to -2.50 4 4 3 4
-2.31 to -3.00 3 3
-3.51 -od down 12 2
1 2 2 4 S 4 7 a 9 0
Satwan Analy ... So. 2 0RDER batween Fit 0.13
S.2te RScaoa Log Abl. 3.z. 0.9. Within Fit
Subgroup 1 11 13 1.32 0.47 2.03
Scbgo~up 2 21 19 2.46 0.77 0.14
Subgroup 3 21 16 2.89 0.44 0.19
Subgroup 4 19 1s 2.43 1.04 0.36
Subgreup 5 11 10 2.62 1.07 0.44
SEQUENTIAL2 STANARDIZED RISDA.L PLOT (0flU. ibar plotted indinatna Subgrocp baJrahlp
.3.51 and op
+2.51 tn .3.50
01.51 to -2 50
-0.01 to .1.50 11111 12111i11122222222222 222222 223333313333 333 3 3333444444 444444444444 3505550p
-0.01 to -1.00 3r
-1.51 to -2.50 1 2 3 3
-2.51 to -3.50 2
-3.01 end do-n 11
1 2 3 4 5 a 1 9 9 0
Figure 10. IPARM Example of Ttem-ContenLt Interaction

p
70
Betwen ,alyei. No. 3 COpyHTU Beten FIt 2.12
S-ita A.oor. Log Atil. 5.2. OW. Within FitSubgroup 1 14 10 1.02 0.62 2.66
Subgroup 2 is is 4.00 0.00 0.27
Su9gr.p 3 56 50 2.66 0.46 0.21
SKOVDYTIAL STAMlA=flhlt RESIDUALL #LOT fS-P)/W.5 Mmar plotted Indicat.. subgroup sAberuhip+3.51 and up
.2.51 to .3 So
+1.51 to +2,50
+0.01 to +1.50 12222 111111113333333332 333333 333333333333 333 3 3333222223 333333333333 1222222222
-0.01 to -1.00 3
-1.51 to -2.50 1 3 3 3
-2.01 to -3,50 3 1
-3.51 a.d darn 11 3
1 2 ? 5 6 7 a 9 01234367990g 123435'7110123456"t 1101234 iS7890123456189012345676901234 67 901234 SE789012345676901234567090
Retwn A..iy.±i "o. 4 DISC -n 1572 Betwe Fit 0.25
S.Ite A.Scor Log Ibi. 3.3. 0.3. Within rit
Subgtoup 1 06 so 2.66 0.46 0.21
Sub.oup 2 32 28 2.05 0.56 2.33
SEQOUfLAL STAICARDIZt PSWUJL PLOT (X-P)/W.3 1 Sbe plotted Indicata ambgup imbe p
-3.51 end up
+2.31 to -3.50
41.51 to +2.50
+0.01 to +1.00 22222 2222222211111111111 111111 111111111111 I11 1 1111222221 111111111111 2222222222
-0.01 to -1.50 1
-1.51 to -2 50 2 1 1 1
-2.51 to -3.50 1 2
-3.51 and down 22 1
1 2 3 4 5 6 7 5 5 0
1234597e0023436 8901234567890123456709012345678g0123456 8g01234567B9012345670901234367890123456 B90
Figure 10. (continued)
.5,
I
vS
(6
" , ' ," '' ' , ' ''v';." ,. . .',., , '..'. ' ,' '.• : , .'.',:,'','. . ' ' ,,!,%. ./.--/ " ,. ",.,.,.." > r. .. .,

1 2 3 4 5 6 7 S 9 0
rf N N .r Vx.TV_,7 ."e7 v-7W. Tota*l rot
o~tm Lolde OS 74 2.00 0.31
|bru 0 20 2.57 0.00 -0.07|u0; u 1 19 1.69g 0.75 0.00
PIn30te. 4 1" 1 5"o 20 0.r -
T 2.01 to *3.50
t L .1.01 to +2.0
00.01l to .1.30 1241 224220232322032121 33 34121 4 443 633 442 22 3 44 311133201131134212234240331334-0.01 to -1.30 4 4 4 44
-2.51 to -3.50 2 2 3-3.31 tn o n +25
1 2 3 4 3 6 9 0
Stin, oAilyot. Ho., 2 -OnI Stsno rot 1.46 ,
64.1It H.or . Log I 401 9.!.i 0.5IU'. Wtla. rot ~
obq o2p 1 1 15 264 15 0 39
9ubgr up 2 21 17 0.60 0.59 0.46
Subg ro up 3 21 12 .i. 0 4 -0.06
1ubgroup 4 19 19 3 Hg 0.00 -0 19
ub'roup H 11 11 3 99 0 00 -0 6
51OUDfI47al rrANP ADIIH PJXSIVL P1.OT (X-PI/U 5 2Mabor plotted n.dlot-es ubgrop *ae.rp.hp
.3 51 *nd up
.2 !1 to 3
*1 51 to -2 50
o C1 to 1 50 ) 11 111111111112222222 22 22222 2 223 333 333 33 3 33 444444444444444444555555555
-us s o -I 50 3 3 3 33
-1 51 to -2 -0 , 2 33 3 3
- 3 -isd dor...... ......... .......... ..... ........ ..... ...... ......... .......... .......... ........... ....... ..-
1 2 3 4 3 5123456'99' 1 4 5H'902 34567 9' 234597g90123456'H02346'0023456$9012346'901 450'901345' JIG
Fiare ii. IPk Ex-ple of Item-Styli Intpraction
S.
H,I
MEM

72
let waso Analysis Mo. 3 COWFltb? &orn. Fit 1.31
N6.Itsa Rkicor. Log Abil. 5.3. U.N. With"n Fit
Sbgroup 1 14 14 3.83 0.00 -0.06
Sbgr.oup 2 is 11 2.94 1.05 0.51
gubgroup 3 06 43 1.59 0.34 -0.46
SZqIJDIIA.L 8IAJIDAADIW RZEIDVA.L uPLOT tO-Pj/S.S Waho piottad jodiost.. subgroop *bat-hip03.51 -nd op
.2.51 to *3.50
+1.51 to +2.50
.0.01 to .1.50 1112 221111111113333333 33 33333 3 333 333 333 33 3 33 222223333333333333311222222222
-0.01 to -1.50 3 3 3 33
-1.51 to -2.50 2 3 33 3 3
-2.51 to -3.50 3 3 3
-3.51 -od down
1 2 3 4 5 4 1 S 9 0
1234567090123145|?10901234567000O12345671l 0123454 l8 O12345 '7I8 012345918901234 5K 8901234 $471"/2345d;7090
Stwwan Analysis Wo. 4 DISC n 15171 at- lit 1.53
N~rt- ~soora Log Abil. S.C. 0.3. within Fit
Subgroup 1 56 43 1.59 0.34 -0.44
S ubqrp 2 32 31 3.61 1.03 0.51
OOrCfIAL L ITAPRDIZ)E R8DUAL pLST (X-P)/W.5 limber plottad indiottes mubgroup aimbe-oship
.3.51 and up
42.51 to -3 50
u1l51 to *2,50
+0 01 to .1.50 2222 222222222221111111 11 1111 1 111 111 111 11 1 11 222221111111111111122222272222
-0,01 to -1.50 1 1 1 11
-1 51 to -2.50 2 1 11 1 1 u
-2.01 to -3.50 1 1 1
-3.01 a-d do-.....................................................................................................
1 2 3 4 5 6 7 a 9 0
1234S6 89012345670901234 7090123456 89012345 ? O 01234 S 89012345678 012345410901234561*90123454 1190
Figure 11. (continued)
8,,'
S%
4%
r *-* 'i~~6.~5
'j~V%. -o %O~% ~h 0%So *05~.o~.O5..O~:..% ~.~C %0 % s~v .y--;

73 "
rzrsc't NO. 55 10> rt2ZW SACS 058440152 N
1 2 3 4 5 6 7 6 4 0
It-.N.. 123454110123404'1901234564901234547S90335719012 3454'U4012 34547490123454789012345476901234542490
U--,.. P.pn. 11000110010010111010101001110111101101000110111011001100 0111001111 11100011001101101110
S.-d sR..p.,... 1100011001001011101010100111011110010100011101200200 02100O111112100011001101101110
NItam 2-,~ og sobI. 2,9. U.10 Total rnt W. Total rit .0
7-1.1 ?..t so s0 0.34 0.24 1.79 0.30
C-t. L..o~d~d 04 50 0.30 0.24
&at-. Solyol. No . 1 DirrICSILTY 5... tt -0.03
9- bq...p 1 20 17 0 32 ..63 1.92
g0bt-*p 2 21 13 0.10 0.45 0.30
I.qt. 3 25 14 0.45 0.40 -0.21
B..bq...p 4 22 a 0-23 0.49 -0.14
$30UZWT!IAL 5?ANDA401ZE RLSMVAL PLOT 1X-P)/W.5 NOOd plottad l~dicatee *bqroup eab-.h~p
*3.51 and up
*2.51 to .3.50
-1.51 to .2.50 a 4
*0.01 to .1,50 12 21 2 3 322 3 1 1 323 1213 4 3 33 442 22 3 ill 2111311 12 42 13 133
-0.01 to -1.50 4 3 4 2 2 2 23 4 4 4 344 4 3 34 44443 33 34 3 4 3 4
-1.51 to -2.50 2 1 1 2 2 2
-2.31 to -3.50
-3.51 -d do-o 1
1 3 3 4 5 6 7 0 0
M.Itaw At.S.- 09 Abit. V.C. U.N. With-o lit4
g.hq-oo 1 14 N -2.34 0.55 2.18
gub9r.p 2 21 13 0.49 0.49 0.61 9
9u0q,.op 3 21 10 0 73 0.47 -0.11
su.0o. P 4 19 12 0.05 0 32 -1.24
Subqr.p 0 11 7 0 to 0.47 -0 54
szQIEwiOAL f5Ajg159flI0D PMIUVL PWT (X-P)/U.S NmO.0 plott~d Laica1ote. **bqoop *b.0*Nflip
*3 51 ..d up 1
+2.51 to -3 50
.1+51 0.2 !05 2 3
0O'1 to -1.!0 11 11 1 1 112 2 22 222 2222 2 3 33 333 33 3 44 6444 44 55555
01 lt.-1 !9 1 1 1 1 1 2 22 2 2 2 333 3 3 33 33334 44 44 5 5 5 5
-1 11 to - 50 1 1 2 2 4 4
- 51 1. -3 50
-3 51 .. d .- I
1 2 2 4 5 4 7 a S
12 34547090123456'S90123454749012345643901 234347S9012345418901234547S402012345123OIZ45790124574.2
Pa..

74
@at-.e Afnly~i. 14
-. 3 'CN-flfl Setue lit -0.37
N1 I t oR.. boq Ail. S.C. u23. Within lit
Subgroup 1 14 7 -0.02 0.5i C.71
Sbgroup 2 le 11 0 24 c 04 2.33
2-bqr op 3 56 32 0.40 r 30 -0.14
0200D4?'IAL STA24DA~iIZW KIOAL PLOT (X-P1/W.5 Hnak-n plo1td indicetee *ubq.oup .embriip
+351 and up
.2.51 to .350
-1.51 to .2.50 3 3
*0.01 to +1.-0 11 22 1 1 113 3 3 3 333 3333 3 3 33 333 33 3 222 3333333 33 12 22 222
-0.01 to -1.50 1 2 1 1 1 3 33 3 3 3 333 3 3 33 33332 23 33 1 2 2 2
-1.31 to -2.50 1 1 3 3 3 3
-2.31 to -3.50
-3.31 and down 2
1 2 3 4 5 4 a 2 9 0
1234547og01234Si O )012345670l9012345671H)012343E6;$ O12345678go123456T890123456759012345418901234597090
Iet- Aealy. i No. 4 DISC Dma Inet-e Fit 0.12
K.Ie R.Ioore Lcq Abil. 5.3. U.K. within Fit
SobqroUp 1 06 32 0.49 0.30 -0.14
Se bqoup 2 32 1 0.12 0,39 2.25
63Q90fYI1AL ITAN0ARDIZZD RZSMWAL PLOT -(X-)/W.0 Noer plotted i odicae. .bhqoup .mbeam bLp
.3.51 and up
+2.51 to .3.30
*1.31 to -2.50 1 1
+0.01 to .1.30 22 22 2 2 221 1 1 1 111 1111 1 1 11 111 11 1 222 1111111 11 22 22 222
-0.01 to -1.50 2 2 2 2 2 1 11 1 1 1 111 1 1 11 11112 21 11 2 2 2 2
-2.02 to -2.00 2 2 2 2 2 1
-2.31 to -3.50
-3.51 and down 2
1 2 3 4 0 4 7 4 9 0
123456'11 012345678190123456"78901234567101234567$9012345678901234361890123456789012345618g01234567090
Figure 12. (continued)
an10
S.

75
PEMCON NO0. 62 10 FIELD
1 2 3 4 5 4 7 4 P 0
Uo.o.ored teapots.. 0002 111000001010100000000000000001100000000010001101011101011010i010000110011000010100
Soo-n R..poo..n 000i111000000101010000000000000000111000000001000110101110110210010010000110011000020100
W.Ite Rico: log doll. M.S. U.N. ?ot.l Fit W. Total Fit
Total Teat to 26 -0.03 0.25 2.86 3.24
Oita Esaladed a6 28 -0.03 0.25
3so.. A.elysia "o. 1 DIFFCULTY setee.. Fit 3.77.It- Rico:. Log Atil. I.E. U.N. Within Fit
Subgroup 1 20 7 -2.15 0.49 -0.27
subgro..p 2 21 5 -1.57 0.02 0.37
subgroop 3 25 9 -0.11 0.42 0.38
Subgroup 4 22 7 0.44 0.47 0.04
nQUUERTIL STANDARDIZED RZSWOA. PLOT (K-P) /3.0 Nsmbr plotted indiost. subgouop embersaip
.3.01 and UP 4
+2.51 to .3.00 4 4 4
.1.01 to *2.50 3 2 4 4 3 3 4 3 3 3 3 3 3
+0.01 to +1.00 1 21 2 1 2 1 1 1 21
-0.01 to -1.00 24 422123 3 4 32121233234 2134 433443344 232 4 4 4 1 32 11 1134 22 2413 1 34
-1.01 to -2.00 1 1
-2.01 to -3.0
-3.01 and down
1 2 3 4 5 4 7 2
1234047690123404780012340078901234561s00123406790123467901234 54'49012340678901234507S001234507890
Iet.. Analysis No. 2 ORDER 9.toss Fit 1.40
flIts Rico... Log Abll. i.E. 0.3. With4n Fit
Oai...op 1 16 6 -1.02 0.58 0.44
iubgroop 2 21 3 -2.13 0.00 1.84
iobqoop 3 21 7 0.05 0.49 1.03
Subgroup 4 19 6 -0.07 0.01 2.31
Subgroup 5 11 4 -0.43 0.69 1.70
SEQUETIAL STADADIZED RLSIDUA. PLOT (I-P) /W3 NeLber plotted jodiost.. subgroup eflsraip
.3.01 sod op 3
*2,51 to .3.50 2 3 5
+2.3O to 2.00 2 1 2 3 3 33 4 4 4 0 SO5.0.01 to .1.!0 1 11 1 2 3 4 4 4 44
-0.01 to -1.50 11 111111 1 2 22222222222 2222 233333333 333 3 3 3 4 44 44 4444 44 3550 0 55
-1.51 to -2.00 1 2
-2 !1 to -3.50
-3.51 sod don
* Figure 13. WPARM Example of Guessing
I~iX

- - --. . -. 6. - - v
76
ftntu.o Anlysis No. 3 COWTDJT 8.00. Pit 0.99
N.lt Sl2oo Log Ab11. 9.1. 0.3. Within Fit
Subgroup 1 14 4 -1.09 2.64 1.63
Subgrop 2 16 1 -0.05 0.53 0.93
Subgqroup 3 54 14 -1.22 0.34 2.56
IsQUflIAL DTAOCADDIZU' ZSIDUAI PLOT (I-PlU.5 Ninbar plottud Indiats.o sbqroup .b.-hip
.3.51 and op3
.2.31 to .3.50 33 1
+1.51 to 2.50 2 1 3 3 3 33 2 2 3 1 2 2
4..0 0.4 *1.50 2 22 1 3 3 2 2 3 33
-0.01 to -1.00 11 111111 1 3 33333333333 3333 333333333 333 3 3 3 2 33 33 3333 33 2332 2 22
-1.31 to -2.50 1 3
-2.31 to -3.30
-3.31 .nd I,-.
1 2 3 4 0 4 7 # # 0
D.tw. Analysis No. 4 OXAC e ITtO heto.. Fit 0.99
3.1t- RiSoor. L.g DAt).. 8.3. 0.3. Within Fitr
Subgroup 1 54 14 -1.22 0.34 2.06
Subgroup 2 32 14 -0.50 0.40 2.01
nAUODTIAL 6TAMtARDIIED P"fDfLVL PLOT (I-P)/N.5 N~ib r plottod indioat s subgroup .mbrohip
43.01 and op 1
.2.31 to -3.50 11 2
+1.51 to -2.30 3 2 1 1 1 1 1 2 2 1 2 2 2
.02o to .2.30 2 22 2 2 3 .2 2 3 13-0.01 to -1.5o 22 222222 2 1 1111:111111 1111 111111111 ill 1 1 1 2 11 11 1111 11 2222 2 22
-1.31 to -2.50 2 1n
-2.51 to -3.30
-3.51 and dow
1 2 3 4 5 6 7 8 9 0
Figure 13 (continued)

- I.
77
VIl NO0 30 to rrw nnc 3#7400320
1 2 3 4 0 6 8 9 0
it- 1 T 00b. 0123578200 O.0124 l 91.034 760.3457913 600235 ,023519124690135
0 t- .Reaa..
N~itee t~boo.e Log Abil. 8.6. a.*. Total lit W. Total lit
Total Test as 61 2.66 0.41 1.63 0.34
its I£aoludad as 61 2.46 0.41
seaaan Loalp ylk "o. 1 DirICTLTT betaso rle 2.01
14.H-s Moa Log Abil. $.a. U.N. Withi. lit
Subgro.p 1 20 16 0.76 0.75 0.29
S .oup 2 21 20 2.63 1.03 0.04
•uqroup 3 20 22 2-41 0.42 0.16
Sub roup 4 22 21 4.48 1.03 -0.72
SIQfhTIAL, STANDADIZED R a PLOT (X-1)/3.5 Etabar plotted indioates mubgroup Mablanhp
43.51 and p
+2.01 to *3.50
+1.51 to +2.50
+0.01 to *1.50 1241321422123 3221321212332 412134444334433 442 Z23434444431113221113 4222234241331334
-0.01 to -1.50 4
-1.31 to -2.50
-2.01 to -3.0 3 3
-3.51 and do 2 3 11
1 2 3 4 0 6 7 a 9 0
2234.5 '70J)2.3456 1890,123436"70901234596 9012345078901234 S670$90123$45 7090123456 09012345670901234567400
Data- Analysis No. 2 ORDER set- Fit 1.40
H.Itm A.looe Log Abol. 6.1, u.w. Within rit
subgroup 1 16 10 2.64 1.00 0.504
SUbgroup 2 21 20 3.24 2.04 0.36
Sub roup 3 21 19 3.40 0.7 0.13
Subq.rou 4 19 16 1.34 0.66 1.42
Sugroup 5 12 11 3.89 0.00 -0.06
SIal AL STuNDADIZED RESIDUAL PLOT (X-])/U.S RNbar plotted indioatam suqroup wabeo bp
0301 and op
42.51 to 43.00
.1.51 to *2.50
+0.01 to *1.50 1111111111111 1122222222222 222222222333333 333 33333333344444444444 444445055555555
-0.01 to -1.50 3
-1.01 to -2.50
-2.01 to -3.50 3 4
-3.51 and do-r 1 2 44
1 2 3 4 5 6 7 a 9 0
123456 09012343078901234 $67090I145678001236709012367000123456 J9012345670 P012345660 0112456 090
Figure 14. IPARM Example of Sloppiness
---- -N

78
Sot-eo Ae.Iyole Mo. 3 CON7DJTn Between Fit 0.01
Kite iBoors Log AbiI. B.C. U.N. Withn Fit
foqop 1 1: 13 2.71 1.05 0.16Subgrop 2 16 16 4.00 0.00 0.2
Subgrop 3 54 50 2.66 0.6 2.26
S3OVZflIAI STMCDARD2ZWD hZSWO&L PLO? (X-PPUN.3 Neb., plotted ledioete subgt.p eb..ohip
.3.51 .nd up
+2.51 to *330
.1.51 to +2.50
0-001 no 41.50 1112222111111 11333333331333 333333333333333 333 3332333333322222333333 33333112222322222
-0.01 to -1.50 3
-1.51 to -2.0
-2.01 to -3.00 3 3
-3.51 -ed do- 1 3 33
1 2 3 4 5 6 7 S 3 0
b.toee AeI.J-at Io, 4 DISC V. lIfli Setwee Pit 0.26
K.It- R.S-o. Log Ab11. B.S. 0.m. Winkle Fin
Sbq .oup 1 04 50 2.44 0.44 2.24
Subqooop 2 32 31 3.41 1.03 0.70
StO7MflhAL lAiCAPDItLM RZSMDAL PLOT (I-fl/U.S wmber plotted ieducto. subgroup einb-rhbp
+3.51 and op
*2.01 no 03.50
*1.51 to .2.50
00.01 to 41.50 222222222222 2212222222111 111223111131123 111 111111111122232111111 11111220222222222
-0.01 to -1.50 1 6-1.01 to -2.50
-2.51 to -3.0 1 1
-3.51 -od 4o- 2 1 11 (-- -- --- ---- -- - --- --- - --- --- ---- - -- --- ---- --- --- - --- - -- --- ---- --- --- ---- --- ---
1 2 3 4 5 4 7 0 9 0
Figure 14. (continued)
1%
N -nnAop,-k A

79
Multiple Regression.
MR relates a group of variables to a single
quantitative variable, and, therefore, the PLAVAL sections
had to be regressed against each of the three criterion
variables separately. In a preliminary study of
cross-validation, samples were randomly assigned to one of
two groups and derived weights for one group were used in
the "prediction" of the other group. Weights were shown to
be unstable, with no common, discernable pattern, even with
respect to sign (positive or negative) and the Pearson r was
quite low. When the sample N is low, Cohen and Cohen
recommend using the shrunken R as a substitute for direct
cross-validation. This coefficient is the estimate for the
population R based on the sample r. Calculation of the
shrunken R yielded higher rs and this procedure was used as
a measure of the MR's effect on the PLAVAL's predictive
validity.
Discriminant Analysis.
DA is intended for use when multiple independent
variables are used to predict performance in multiple
dependent variables (Stevens, 1986). This is a particularly
useful technique in view of the fact that the three courses
are qualitatively different due to their differing curricula
and in-course testing procedures. The 171 examinees were
randomly assigned to one of two criterion groups for the
purposes of cross-validation. Each group had discriminant

80
functions calculated to use in classifying the other group,
there were, therefore, two reports of correct classification
per course.
In summary, each of the 171 examinees had six scores
representing the various scoring procedures: raw, Rasch,
Rasch+IPARM, rational, MR, and DA.
Course Performance.
Students were placed in one of three courses depending
on the results of the PLAVAL using the Academy's rational
scoring scheme. A criterion variabli was created for each
course, using the objective points scored on all tests
during the first semester of language learning at the
Academy. For a clearer understanding of the nature of the
criterion variables, a brief description of course content
and testing procedures follows.
French 131.
Students placed in this course scored lowest on the
PLAVAL. Also included are students who have no knowledge of
the language. These classes (there are multiple sections)
meet for one hour every other academic day. The curriculum
emphasizes communicative skills and language structure and
employs i basic-level text entitled Invitation (Jarvis;
Bonin, Corbin, and Birckbichler, 1979), in use by many other
S - "-

81i
undergraduate institutions. Testing in this course is done
using a combination of multiple-choice items, short essay,
and interviews in a series of three quizzes, two mid-term
examinations and one final. Table 1 shows the proportion of
points assigned to each language activity (a weighted
average of all tests given during the semester).
Table 1
Percentage of Criterion Points per Language Activity
Percentage of Total Points
Activity F 131 F 141 F 150
Speaking 6 27 16
Writing 7 3 23
Reading 28 29 7
Listening 17 14 16
Vocabulary/Grammar 26 17 29
Culture 16 10 9
French 141.
Students placed in this course generally have between
one and two years of previous language study. These classes
meet for two hours every other academic day for the first
semester. The course also uses Invitation as a basic text,

82
but instruction is at an accelerated pace. The number of
tests are the same as in French 131, and Table 1 shows the
proportions of points per language activity.
French 150.
Students placed in this course have, on the average,
more than two years of language study. The classes meet for
two hours every other academic day. The curriculum is based
on the Sur le vif intermediate-level text (Le Cunff, 1977).
Evaluation is accomplished using three quizzes, seven oral
exercises, four written exercises, two mid-term
examinations, and one final. See Table 1 for proportions.
Experimental Procedures and Data Analysis
Comparisons with Multiple Pegression
Stevens (1986) recommends using a small number of
predictors in order to satisfy the principle of scientific
parsimony, and to enhance stability of the MR weights. The
PLAVAL's eight sections were combined by skill-type into
three: reading, aural comprehension, and grammar. Ip
The shrunken R was used as an indicator of MR's
predictive validity and was compared to the Pearson rs of
the three unidimensional models: raw score, Rasch, and
Rasch+IPARM. The correlations were then tested for
statistically significant differences within each of the

83
three classes. The first test of significance was the
omnibus null test (Cohen and Cohen, 1983), which tests
multiple correlations for the possibility of belonging to a
population where r equals zero. The second test is
suggested by Braden (1986), and is a test of the probability
that a set of correlations belongs to a population where r
equals one. This latter statistic is most appropriate for
correlations between dependent samples; it tests to
determine whether differences in coefficients are due to the
different test reliabilities.
Comparisons with Discriminant Analysis
Comparisons with DA were made using accuracy of
placement across the three ability levels in each of the
three criterion groups. Each course was therefore divided
into three equal n ability groups (low, intermediate, and
high) for a total of nine criterion groups. For purposes of
cross-validation, the entire sample was randomly assigned to
one of two groups. Discriminant functions were calculated
for each group and used for classifying the other. Stevens'
(1986) recommendations for MR are equally valid for DA;
therefore, the saine three predictors used for MR were used
for calculating the discriminant functions. Stevens claims
additionally, that the ratio of sample size to Lredictor
variables should be no less than twenty to one. The ratio
%N

84
of sample size to predictor variables in this experiment
was 28 to 1.Unfortunately, there is no test of statistical~i
significance known to the researcher that can be used in the
comparison of DA classification. It can only be assumed S
that if the Pearson r coefficients for the MR and J,
unidimensional models are due to statistically significant 2*
effects, then the percent correct classifications are also
not due to sampling error.
Hypothesis of Study
The null hypothesis is that there will be no difference
in the ability of the six scoring models, raw score, Rash,
Rasch+IPARM, rational, MR, and DA when used on the PLAVAL to
predict student performance in any of the three language
courses, French 131, 141, and 150.

CHAPTER IV
RESULTS
Overview
This chapter reports the findings resulting from the
questions presented in Chapter I. These questions are:
1. Is success in foreign language learning best
predicted by a placement test incorporating the Rasch model
or by one using a variety of weighted multiple components?
2. Can the following test disturbances be identified
and corrected in order to improve test predictive validity:
Test start-up anxiety
Guessing
Plodding
Sloppiness
Item content and person interaction
The first step in the analyses was to calibrate the
test using the Rasch model and obtain person ability
estimates. Those persons exhibiting correctable
disturbances had their abilities re-estimated. Next, three
multidimensional scoring procedures based on multiple
- I. -*. - -8 5
86
regression, discriminant analysis, and rationally derived
weights were investigated.
No single method of analyzing the results of the six
different approaches is available. To compare the
effectiveness cf Rasch ability estimates with those derived
through multiple regression and rationally derived weights,
a Pearson r was used with the criterion variable. Whereas
no Pearson r is available when using discriminant analysis,
accuracy of placement was determined using a top- middle-
bottom-third-of-course grouping on each of the three
criterion variables.
Predictor Variables
The Rasch Model
Item Calibration.
Using the MSCALE program, a single metric was created
using the raw response data from the PLAVAL. In this
experiment, 317 students were used for the initial item
calibration. All students fell within the limits of the
test, i.e., there were no zero or perfect scores. This
meant that, aside from non-fitting persons, all examinees
could be reasonably estimated in ability. After several
iterations, alternately eliminating non-fitting persons, and
non-fitting items, the final MSCALE results were based on an
88-item test calibrated from 287 persons whose fit V
LI

p
87
statistics were below 2.00. All but two of the persons who
were eliminated from the calibration had negative logit
abilities; this signifies that the most serious disturbances
occurred at the lower end of the ability scale. This
finding could be due to low-ability persons tending to
resort to guessing more than high-ability persons, thereby
causing their abnormal response patterns to be detected by
the Rasch person-fit statistics. Table 2 shows the person
and item separability indices along with their respective
reliability coefficients for the first and last MSCALEp
iterations. The last iteration shows that the known
variance attributable to a single factor (person separation
along a unidimensional scale) is 4.05 times that of the
error of estimation associated with the person abilities
(variance due to all other factors). These data demonstrate
the strength of trait unidimensionality in the PLAVAL
(Smith, 1987).
MSCALE provides useable logit abilities for all persons
retained in the final calibration; these abilities, however,
are based only on items attempted, and items left blank are
not scored. Because some examinees leave answers blank when
the answer is unknown, these estimates were not used in the
person analysis. The person raw score, based on the
remaining 88 items that fit the Rasch model (the Rasch
predictor variabl ), was used as a basis for measuring the
effectiveness of the IPARM ability estimates (the
Rasch+IPARM predictor variable).

88
Table 2
Indices of Trait Unidimensionality for First and Last MSCALE
Iterations
Iteration Separability Index Separation Reliability
First
Person 3.97 0.94a
Item 6.37 0.98
Last
Person 4.05 0.94a
Item 7.10 0.98
aEquivalent to KR-20.
Person Ability Re-estimation.
The MSCALE item calibrations were used for the IPARM
response-pattern analysis. (See Appendix A for
item-difficulty assignment, Appendix B for item-subgroup
asziqnment, and Appendix C for total and subgroup raw score
ability estimates.) Of the initiql 317 students who were
tested, only 171 finished one semester of French at the
Academy. Onl t emainini nqo pnt-s were used Jn
subsequent analyses. (See Appendix D for person analysis
summary.) Using fit criteria as a basis for re-estimation,
Table 3 shows percentages of disturbance type by class.

89
Plodders generally had very small changes in estimated
ability when corrected, and did not present a significant
disturbance; for this reason totals in table 3 reflect the
more serious disturbances only.
Table 3
Percentage of Disturbance Type by Course
Course
Disturbanc- F 131 F 141 F 150
Guessing 33.8 4.8 0.0
Ploddinga 29.2 33.3 28.1
Item/Person 6.2 21.4 12.5
Sloppiness 1.5 2.4 6.3
Test Anxiety 3.1 4.8 3.1
Unknownb 0.0 2.4 0.0
Totalc 44.6 35.7 21.8
Sample Size 65 42 64
afigures indicate correction for plodding only. Those
corrected for other disturbances are not included.
bno correction applied.
cPlodders not included in total unless corrected for a
second disturbance.
K'jr-*K 4

90
Raw Score
Each examinee's raw score was determined using an
unweighted total score on the entire 110-item test. This
was used to determine the effectiveness of the 88-item
Rasch-scored test without the IPARM re-estimations.
Table 4
Rationally-Derived Weights for Scoring Each PLAVAL Section
Section Item Weights Number of Items Maximum Score
Reading I 18 5 90
hural Comp I 20 5 100
Reading II 10 10 100
Grammar I 4 50 200
Aural Comp II 20 5 100
Grammar II 6 20 120
Reading III 20 5 100
Aural Comp III 10 10 100
Totals 110 910
~ N%'%V~\V%.

91
Rational Weighting
Weights presently used at the Academy were derived
r-:tionally, placing greater emphasis on integrative
questions; they were not empirically derived. Table 4 shows
the weights for each PLAVAL section.
Multiple Regression Analysis
Weights were determined using multiple regression of
the three composite sections on each of the three criterion
variables. Due to small n, cross validation would not give
stable section weights. Therefore, weights were derived
from the entire sample in each of the three courses. Table
5 shows the section weights for the three courses.
Table 5
Multiple-Regression Weights for Each Section by Course
Regression Weights
Section F 131 F 141 F 150
Reading 7.60 34.08 21.89
Aural Comp 3.67 21.03 1.27
Grammar 19.72 12.75 12.99

92
Discriminant Analysis
Placement accuracy was investigated across the three
courses by dividing each into three equal-n ability groups
(low, intermediate, high) for a total of nine classification
groups. The 171 examinees were randomly assigned to one of
two cross-validation groups. Discriminant functions were
calculated for each group and used in classifying the other.
Table 6 shows the self-test results of each group.
Table 6
Self-Test Results for Cross-validation Groups
Percent Correctly Classified
Group n F 131 F 141 F 150
1 80 50.00 58.33 57.69
2 91 57.14 83.33 71.05
iI

93
Comparisons of Predictive Validities
Unidimensional Models with Multiple Regression and Rational
Because classifying persons based on weights derived
from the same sample lacks cross-validity, only the shrunken
R was used in comparing predictive validities. This
statistic estimates population R when the cross-validation
weights are too unstable (Cohen and Cohen, 1983).
(Inspection of the various scatter plots revealed that all
the predictor variables under study in this section had
linear relationships with the three criterion variables.)
Table 7 shows the Pearson rs of the various unidimensional
models and multiple regression correlated with the criterion
variables. Tables 8, 9, and 10 show the intercorrelations
of the various test models. To test the hypothesis of no
significant difference, Braden's (1986) critical values
table for joint reliabilities was used. This permits the
testing of the hypothesis H1 : (r = 1.0). This hypothesis
is necessary when comparing correlations based on the same
sample. It also assumes H0: (r = 0.0) has been rejected
(table 7).

94
Table 7
Pearson r Coefficients of Multiple Regression, Rational, and
Unidimensional Models with the Criterion Variables
Pearson r Coefficients with p Statistic
Scoring Model F 131 F 141 F 150
Raw .4822 .4629 .4457
.0001 .0020 .0002
Rasch .5272 .5181 .4546
.0001 .0004 .0002
Rasch+IPARM .6382 .6306 .4879
.0001 .0001 .0001
Rational .4329 .3674 .3369
.0003 .0167 .0065
Multiple Reg .5016 .5150 .4764
.0006 .0005 .0001
Shrunken R .4634 .4552 .4340
I

95
Table 8
Intercorrelations of the Measurement Models for F 131
Measurement Model
Measurement Model Raw Rasch IPARM Ratni MR
Raw score 1.00 .94 .77* .90* .96
Rasch 1.00 .82* .86* .88*
IP.RM 1.00 .75* .69*
Rational 1.00 .78*
MR 1.00
*o < .05, one-tailed. Critical value = .924
.5.

96
Table 9
Intercorrelations of the Measurement Models for F 141
Measurement Model
Measurement Model Raw Rasch IPARM Ratnl MR
Raw score 1.00 .94 .83* .71* .90*
Rasch 1.00 .90* .67* .83*
IPARM 1.00 .71* .84*
Rational 1.00 .82*
MR 1.00
*p < .05, one-tailed. Critical value = .917
Ir
.5

97
Table 10
Intercorrelations of the Measurement Models for F 150
Measurement Model
Measurement Model Raw Rasch IPARM Ratnl MR
Raw score 1.00 .95 .88* .79* .93
Rasch 1.00 .92 .72* .87*
IPARM 1.00 .71* .81*
Rational 1.00 .70*
MR 1.00
*p < .05, one-tailed. Critical value = .924
98
Unidimensional Models with Discrimination analys _ and
Rational Wei i nor
Comparisons were made using percentage of correct
placement in each of three ability levels within each
course. Percentages of the most disparate classifications
(e.g., low criterion-ability misclassed as high ability by
the measurement model) were also investigated (see Table
11).
Summary
Examining the data has revealed several patterns which
are depicted in two figures. Figure 15 shows the
relationship of the various models with multiple regression
with respect to the criterion variable based on their
Pearson rs from Table 7. The patterns are consistent; all
scoring models maintained their relative position with
respect to each other across the three courses. All models
exhibited a decrease in predictive validity in French 150
for reasons unexplored in this research. Figure 16 shows
the relationships of the various models with discriminant
analysis based on correct placement statistics from Table
11. The patterns in Figure 16 were not as consistent as in
Figure 15, but the general trend still seemed to indicate a
loss of predictive validity as ability increased.

99
Table 11
Correct-Classification Percentages of Discriminant Analysis,
Rational, and Unidimensional Models
Percent Correctly and Incorrectly classified
Scoring Model F 131 F 141 F 150
Raw 56.92 52.38 51.56
(7.69) (9.52) (3.13)
Rasch 61.53 52.38 45.31
(4.62) (9.52) (3.13)
Rasch+IPARM 63.08 66.67 53.13
(7.69) (9.52) (3.13)
Rational 53.85 52.38 48.44
(10.77) (9.52) (10.90)
Disc Anal 1a 46.67 29.17 30.77
(6.67) (25.00) (15.38)
Disc Anal 2 b 45.71 22.22 34.21
(8.57) (27.78) (10.53)
Note. Figures in parentheses reflect incorrect placement
only of those misclassified by two levels.
an = 80
bn = 91

100
- • Rasch+ IPARM
.70 - Rasch
n Raw Score
.60 * Shrunken R
r O Rational
.50
.I
F 131 F 141 F 150
Courses
Figure 15
Comparison of Correct-Placement Percentages of the
Unidimensional, Multiple Regression, and Rational Scoring
Models with the Criterion Variables
VA

101
*60 CRasch
C A Raw Score
50 C DA 1
Percent (i DA 2
40 & Rational
30
F 131 F 141 F 150
Courses
Figure 16
Comparison of the Pearson r coefficients of the
Unidimensional, Rational, and Discriminant Analyses Models
with the Criterion Variables
P: 1 l i J1 " - )

CHAPTER V
SUMMARY, CONCLUSIONS, AND RECOMMENDATIONS
Summary
The purpose of this study was to investigate the
measurement properties of a psychometric model that, despite
its conceptual simplicity, has the potential for increased
accuracy in foreign language placement. Not only can the
Rasch model lead to an increased understanding oE the
properties of the measurement instrument, but it has a
unique capability of suggesting sources of individual
disturbances, with the po~en: al o correct several of them.
Its capacity to correct certain individual measurement
disturbances is tied to its assumption of unidimensionality,
an assumption which, if not valid, could seriously reduce
the validity of the affected test scores used for placement.
Investigation of the Rasch model was approached in a
step-wise fashion. The first variable investigated was the
raw score, the most fundamental estimate of ability. It
gave the research a base-line measure from which other
manipulations could be compared. The second step was to
create a placement test in which items not fitting the
unidimensional model, were deleted. The ability estimates
102

103
resulting from the revised test reflected the efficiency of
the Rasch model's item calibration procedure and item fit
statistics. The final step, the most complex and the most
time-consuming, was the use of IPARM to detect and
counteract the effects of certain measurement disturbances.
Each step could then be evaluated in terms of increasing or
decreasing predictive validity.
The three resulting approaches, raw score, Rasch, and
IPARM, were compared to three multidimensional models to
investigate the efficiency of the assumption of
unidimensionality, implicit in the first three approaches.
The Rasch model was contrasted with the a priori rational
weighting schee, the M'R model, and DA. It should be noted
that neither the PLAVAL nor the criterion variables were
constructed with the intention of creating unidimensional
scales, and to the coqtrary, were each created with distinct
sections representing the multidimensional view of language.
This should place unidimensional models at a disadvantage.
Conclusions
Raw Score Statistic
Results show that the assumption of trait
unidimensionality results in greater predictive validity
for the three unidimensional approaches over the three
selected multidimensional models when estimates of ability

104
are limited to a single quantifier. The raw score variable,
for which no items were deleted and no person disturbances
were corrected, had consistently higher results than either
the MvR (shrunken R) or DA models. In view of the number of
disturbances present in the sample, weights statistically
derived by both these models may have been affected by their
influence to such an extent that it significantly decreased
the validity of these weights (or discriminant functions)
for other samples.
Rasch Ability Estimation
Calibrating the items with the Rasch model and
eliminating misfitting items reduces the numbec oE ite on
the test. This lowers the variability on the test, and
could possibly reduce the relationship with the criterion
variables. The results show, however, that with one
exception out of six comparisons with the raw score, the
relationship is equalled or increased. The conclusion is
that the items eliminated from the calibration procedure do
not measure the same construct as the rest of the items ar d
reduce predictive validity as well--an indirect confirmation
of the strength of the unidimensional assumption.

. . ..M11, 5R M I - r ~ % m W 9 5.1 . M
105
Revised Rasch AbilityEst imates
Without exception, the Rasch ability estimates that
included re-estimations to correct for the various person
measurement disturbances were clearly superior to all other
models both in accuracy of placement and correlation witb
each of the three criterion variables. This is especially
notable in view of the reduced number of test items. The
statistics on incorrect placement, however, are unexpected.
Of those who were incorrectly placed by more than one
classification group (e.g., individual predicted as low in
ability by the model but placed high on the criterion
variable), no improvement was noted between the raw score,
original Rasch estimate, and the revised Rasch estimate.
This lack of change could be due to learning effects for
which no model can compensate. Yet, the added predictive
power through the IPARM re-estimation is clearly
de-monstrated. The unidimensional models were, in general,
more successful in reducing extreme misplacement than the
multidimensional models with average misplacement
percentages of 6.4 and 13.9 re3pectively. DA had the
highest rate of misplacement, averaging 15.7 percent. The
measurement disturbances, having reduced the validity of the
discriminant functions for subsequent samples, are likely
the reason for the relatively high misclassification
statistics.

106
Use of Multiple Reagression We iqhtt s
The use of these weights pr sapposes a single criterion
variable. In the case of multiple course assignments, the
weights derived from one course are very likely invalid for
use in predicting performance in other courses as it clearly
was in this experiment. Had these weights revealed some
consistent pattern across the three criterion variables,
some optimal approach might have been used to weight the
test for best overall prediction. Such was not the case,
and therefore, a MR model is unuseable in similar
circumstances.
Use of Discriminant Functions
The larger the sample size, the more valid the
discriminant functions, but in many undergraduate
institutions, very large sample sizes will never be
available. Possibly the largest source of invalidity,
however, is the use of discriminant functions based on a I
sample with uncorrected measurement disturbances being used
on another sample with its own unique pattern of measurement
disturbances, and usually tested at a different time. Other
potential sources could be the presence of suppressor
variables, or the effects of predictor multicolinearity
(Stevens, 1986).

107
Use of the RationalL A Priori WeightingModel
The weights used in this experiment have little
generalizability. They were determined a priori using a
rationale that this study has not explored. All that can be
said concerning the results is that it, too, showed a
consistent pattern of performance. These weights were not
derived using data with response disturbances, which may
partly explain its greater predictive ability over that of
the Dh model. The weights could not surpass the MR weights
in predictive validity because the regression procedure
optimizes weights for the sample. Had the MR weights beeQ
cross-validated on another sample, a fairer comparison could
have been made.
Implicitions
In view of the consistent patterns seen in the data,
the Pasch model seems clearly to be the model of choice to
use in improving the pr- dictive validity of placement tests
when the evaluators are restricted to single numerical
descriptions of individual abilities and when the data
conroc n to the unidimensionality assumption. When the data
fit the unidimensional assumptions, as they did in this
experiment, little is gained and very possibly more is lost
in "comnponentializing" the test. Recalling Andersen's
(1977) mathematical demonstration that the raw score is the

108
minimal sufficient statistic in ability estimation when such
a statistic exists, it follows that any systemn of weighting
test items can only confound the ability estimates.
This e~perinnt not only demonstrates the need for the
:valuator to understand the assumptions made by the
measurement model employed, but also the need to address
measurement disturbance dicectly; no course assignment
should be made without first verifying the reasonableness of
individual response patterns and making appropriate
corrections whenever possible. The direct and individual
correction of multiple measurement disturbances afforded by
IPARM has intuitive appeal; re-estimates of individual
abilities affect neither other persons nor test iten
calibrations. IPARM, therefore, stancid in con'tcas-: o
other nmodels that correct only for guessing by including
adlitiooal pin. ters, blindly applied. The practical value
of the Rasch model for the foreign language evaluator, then,
is the potential for reducing the number of
misclassifications, thereby incce2-sing the number of
successful language learners.
On a more general level, the presence of
unidimensionality in the placement test is insufficient to
conclude that the single metric created by the Rasch model
is a reflection of a global language proficiency scale
advocated by those who adhere to the unitary hypothesis,
whthe-r in its strong or moderate form (Oller, 1983a). The
unidimensional properties of this placement test may only be
%IW\ A:L.:

109reflective of the common aspects of all high school French
language curricula- Whereas test tinidimerisionality would
logically follow from trait unidimensionality, it does not,
of necessity, follow that trait unidimensionality follows
fron test unidimensionality.
Recommendations for Future Research
The Rasch model is a very useful tool in determining
the extent of unidimensionality present in language
measurement instruments. In cases where measurement tools
are created with an underlying hierarchy of language tasks,
Rasch measurement could, given a lirge enough sample and
sufficient items, test the validity of any a priori orders
of difficulty. As in the case of the Provisional
Proficiency Guidelines created by the k.nerican Council on
the Teaching of Foreign Languages (1982), using the Rasch
model coul:l ieternine the validity of its supposed hierarchy
of "task universals." Stability of item calibrations, when
testing individuals representing various foreign language
curricula, would be clear indication of such universals.
Furthermore, a study of calibration stability could result
in a different paradigm altogether. It seems clear and most
logical, that multidimensionality should not be assumed for
a measurenen% instrument unless verified empirically, and
conversely, a latent trait model should not be used on data
that do not fit its assumptions.
iZV

110
Limitations
There was no attempt to analyze the nature of item
misflt, or to make observations3 of the hierarchical nature
of those items used for the calibration. A longitudinal
study involving two or more testing opportunities would have
yielded valuable information on the stability of item
calibrations. The question of whether the unidimensional
scale derived from one sample is essentially the same for
other samples is not answered. Furthermore, discriminant
functions could have had more validity if the entire sample
had been used but cross-validated on the following year's
sample.
From a pragmatic perspective, use of the Rasch inodel
requires the additional step of identifying ,neastir,- .,n -ri
errors and applying an appropriate re-estimate, both
pCocedura.S being subject_ to error themselves. Objective
correction prograns exist, called robust estimators, but
these do not fair as well in making appropriate corrections
to measurement disturbances when compared to IPARA (Smith,
1985).
V%I,,

APPENDIX A
IPRRM ITE~M DIFFICULTY ASSIGNMIEfir

112
Item and Person Analysis with the Rasch Model
02-26-1988
CONTROL INFORMATION
Test Name - FRENCH PLAVALModel - Dichotomous ModelStatistics - Item and Person Fit AnalysisNumber of items - 88Number of persons -317
ITEM DIFFICULTIES
Item Name Diff.1 ra0l -2.43 31 ga15 -0.28 61 ab03 -1.142 ra04 -0.29 32 ga16 -1.25 62 ab04 -1.043 raO5 0.94 33 ga17 0.00 63 ab05 0.454 aa0l -3.11 34 gal9 0.79 64 gbOl 0.375 aa02 0.26 35 ga20 0.79 65 gb02 -0.166 aa03 -0.41 36 ga2l 1.22 66 gb03 -1.927 aa04 -1.66 37 ga22 1.41 67 gb04 -1.158 rbOl 0.93 38 ga23 0.66 68 gbO6 -1.199 rb02 -0.46 39 ga24 0.30 69 gbO7 0.34
10 rb03 -0.56 40 ga25 1.17 70 gb08 -1.1411 rb05 -1.09 41 ga27 0.91 71 gbll -1.6812 rbO6 -0.21 42 ga29 0.38 72 gb12 0.4913 rbO7 0.44 43 ga30 0.41 73 gb13 0.8414 rbO8 -0.06 44 ga3l 3.03 74 gb14 -0.5815 rb09 0.52 45 ga32 0.75 75 gbl5 -2.1516 rblO -0.12 46 ga33 0.88 76 gb16 -0.0217 ga0l -0.86 47 ga36 -0.91 77 gb17 -0.7818 ga02 -1.27 48 ga37 0.70 78 rc03 0.5319 ga03 0.24 49 ga38 -0.21 79 rc04 1.0320 ga04 -0.69 50 ga39 -0.55 80 acOl -0.5121 ga05 -1.05 51 ga40 0.55 81 ac02 1.4322 ga06 -0.11 52 ga42 1.32 82 ac03 -1.2823 gao7 -i.00 53 ga43 0.71 83 ac04 0.3524 gaO8 -0.21 54 ga45 1.70 84 acOS 0.2825 ga09 0.42 55 ga47 0.77 85 ac06 -1.5326 ga10 0.53 56 ga48 1.90 86 ac07 0.3627 gall -0.23 57 ga49 1.36 87 aco 0.2928 gal2 0.12 58 ga50 2.08 88 aclO 1.4129 ga13 1.47 59 abol 0.4930 gal4 -1.77 60 ab02 -1.22
-- **

APPENDIX B
IPARM SUBGROUP ASSIGNMENT
113

114 i
PERSON BETWEEN FIT ANALYSIS
Analysis 1 DIFFICULTYNumber of subgroups 4Group 1 Number of items 20Group 2 Number of items 21Group 3 Number of items 25Group 4 Number of items 22
Item 0 1 2 3 4 5Number 12345678901234567890123456789012345678901234567890
Group 12413214221232322132121233234112134444334433442322
Item 5 6 7 8 9 0
Number 12345678901234567890123456789012345678901234567890
Group 3434444431113321113113 421234241331334*'***
Analysis 2 ORDERNumber of subgroups 5Group 1 Number of items 16Group 2 Number of items 21Group 3 Number of items 21Group 4 Number of items 19Group 5 Number of items 11
Item 0 1 2 3 4 5Number 12345678901234567890123456789012345678901234567890
Group 11111111111111112222222222222222222223333333333333
Item 5 6 7 8 9 0Number 12345678901234567890123456789012345678901234567890
Group 33333333444444 44444444444455555555555

115
Analysis 3 CONTENTNumber of subgroups 3Group 1 Number of items 14Group 2 Number of items 18Group 3 Number of items 56
Item 0 1 2 3 4 5Number 12345678901234567890123456789012345678901234567890
Group 11122221111111113333333333333333333333333333333333
Item 5 6 7 8 9 0Number 12345678901234567890123456789012345678901234567890
Group 33333333222223333333333333311222222222
Analysis 4 DISC vs INTEGNumber of subgroups 2Group 1 Number of items 56
Group 2 Number of items 32
Item 0 1 2 3 4 5Number 12345678901234567890123456789012345678901234567890
Group 22222222222222221111111111111111111111111111111111
Item 5 6 7 8 9 0Number 12345678901234567890123456789012345678901234567890
Group 11111111222221111111111111122222222222
0.

APPENDIX C
IPARM TOTAL AND SUBGROUP ABILITY ESTIMATES
116

117
Total Test Ability Estimates
Raw Score Ability SEM0 -6.08 0.00 45 0.07 0.241 -5.06 1.01 46 0.13 0.242 -4.33 0.73 47 0.19 0.243 -3.89 0.61 48 0.24 0.244 -3.57 0.53 49 0.30 0.245 -3.32 0.48 50 0.36 0.246 -3.10 0.44 51 0.41 0.247 -2.92 0.42 52 0.47 0.248 -2.75 0.39 53 0.53 0.249 -2.61 0.38 54 0.59 0.24
10 -2.47 0.36 55 0.65 0.2411 -2.35 0.35 56 0.70 0.2412 -2.23 0.34 57 0.76 0.2513 -2.12 0.33 58 0.82 0.2514 -2.02 0.32 59 0.89 0.2515 -1.92 0.31 60 0.95 0.2516 -1.83 0.30 61 1.01 0.2517 -1.74 0.30 62 1.08 0.2618 -1.65 0.29 63 1.14 0.2619 -1.57 0.28 64 1.21 0.2620 -1.49 0.28 65 1.28 0.2621 -1.41 0.28 66 1.35 0.2722 -1.34 0.27 67 1.42 0.2723 -1.27 0.27 68 1.50 0.2724 -1.20 0.26 69 1.57 0.2825 -1.13 0.26 70 1.65 0.2826 -1.06 0.26 71 1.73 0.2927 -0.99 0.26 72 1.82 0.3028 -0.93 0.25 73 1.91 0.3029 -0.86 0.25 74 2.00 0.3130 -0.80 0.25 75 2.10 0.3231 -0.74 0.25 76 2.21 0.3332 -0.68 0.25 77 2.32 0.3433 -0.62 0.25 78 2.44 0.3534 -0.56 0.24 79 2.57 0.3735 -0.50 0.24 80 2.72 0.3936 -0.44 0.24 81 2.88 0.4137 -0.38 0.24 82 3.06 0.4438 -0.32 0.24 83 3.27 0.4839 -0.26 0.24 84 3.52 0.5340 -0.21 0.24 85 3.84 0.6041 -0.15 0.24 86 4.27 0.7342 -0.09 0.24 87 5.00 1.0143 -0.04 0.24 88 6.01 0.0044 0.02 0.24
' -x!V

118
Person Subgroup Ability Estimates Subgroup 3Raw Score Ability SEM
0 -3.80 0.001 -2.78 1.022 -2.05 0.74
Person Between Analysis 1 - DIFFICULTY 3 -1.60 0.62Subgroup 1 4 -1.26 0.55Raw Score Ability SEM 5 -0.99 0.50
0 -5.64 0.00 6 -0.75 0.471 -4.60 1.04 7 -0.54 0.452 -3.83 0.76 8 -0.35 0.433 -3.34 0.64 9 -0.17 0.424 -2.97 0.58 10 -0.00 0.415 -2.66 0.53 11 0.16 0.406 -2.39 0.51 12 0.33 0.407 -2.15 0.49 13 0.49 0.408 -1.92 0.47 14 0.65 0.409 -1.70 0.46 15 0.82 0.41
10 -1.49 0.46 16 0.99 0.4211 -1.27 0.46 17 1.17 0.4312 -1.06 0.47 18 1.36 0.4513 -0.83 0.48 19 1.57 0.4714 -0.60 0.50 20 1.80 0.5015 -0.33 0.53 21 2.07 0.5516 -0.04 0.57 22 -.41 0.6217 0.32 0.63 23 2.86 0.7418 0.79 0.75 24 3.60 1.0219 1.54 1.03 25 4.62 0.0020 2.57 0.00
Subgroup 4Subgroup 2 Raw Score Ability SEMRaw Score Ability SEM 0 -2.89 0.00
0 -4.44 0.00 1 -1.87 1.021 -3.42 1.03 2 -1.12 0.752 -2.67 0.75 3 -0.65 0.633 -2.21 0.63 4 -0.31 0.564 -1.86 0.56 5 -0.02 0.525 -1.57 0.52 6 0.23 0.496 -1.32 0.49 7 0.46 0.477 -1.09 0.47 8 0.67 0.458 -0.88 0.45 9 0.87 0.449 -0.68 0.44 10 1.07 0.44
10 -0.49 0.44 11 1.26 0.4411 -0.29 0.44 12 1.46 0.4412 -0.10 0.44 13 1.65 0.4513 0.10 0.45 14 1.86 0.4614 0.31 0.47 15 2.07 0.4715 0.54 0.49 16 2.31 0.5016 0.79 0.52 17 2.57 0.5317 1.08 0.56 18 2.87 0.5718 1.42 0.63 19 3.23 0.6419 1.89 0.75 20 3.71 0.7620 2.63 1.03 21 4.48 1.0321 3.66 0.00 22 5.51 0.00
I
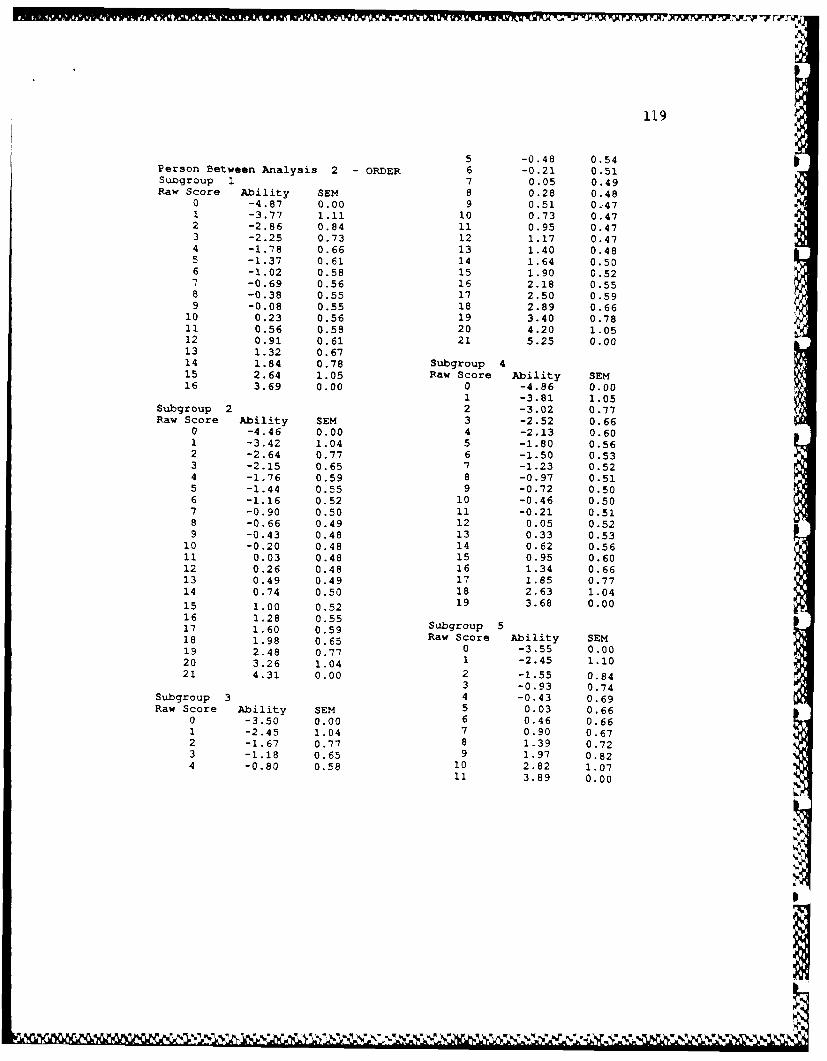
119
5 -0.48 0.54Person Between Analysis 2 - ORDER 6 -0.21 0.51Suogroup 1 7 0.05 0.49Raw Score Ability SEM 8 0.28 0.48
0 -4.87 0.00 9 0.51 0.471 -3.77 1.11 10 0.73 0.472 -2.86 0.84 11 0.95 0.473 -2.25 0.73 12 1.17 0.474 -1.78 0.66 13 1.40 0.485 -1.37 0.61 14 1.64 0.506 -1.02 0.58 15 1.90 0.527 -0.69 0.56 16 2.18 0.558 -0.38 0.55 17 2.50 0.599 -0.08 0.55 18 2.89 0.66
10 0.23 0.56 19 3.40 0.7811 0.56 0.58 20 4.20 1.0512 0.91 0.61 21 5.25 0.0013 1.32 0.6714 1.84 0.78 Subgroup 415 2.64 1.05 Raw Score Ability SEM16 3.69 0.00 0 -4.86 0.00
1 -3.81 1.05Subgroup 2 2 -3.02 0.77Raw Score Ability SEM 3 -2.52 0.66
0 -4.46 0.00 4 -2.13 0.601 -3.42 1.04 5 -1.80 0.562 -2.64 0.77 6 -1.50 0.533 -2.15 0.65 7 -1.23 0.524 -1.76 0.59 8 -0.97 0.515 -1.44 0.55 9 -0.72 0.506 -1.16 0.52 10 -0.46 0.507 -0.90 0.50 11 -0.21 0.518 -0.66 0.49 12 0.05 0.529 -0.43 0.48 13 0.33 0.53
10 -0.20 0.48 14 0.62 0.5611 0.03 0.48 15 0.95 0.6012 0.26 0.48 16 1.34 0.6613 0.49 0.49 17 1.85 0.7714 0.74 0.50 18 2.63 1.0415 1.00 0.52 19 3.68 0.0016 1.28 0.5517 1.60 0.59 Subgroup 518 1.98 0.65 Raw Score Ability SEM19 2.48 0.77 0 -3.55 0.0020 3.26 1.04 1 -2.45 1.1021 4.31 0.00 2 -1.55 0.84
3 -0.93 0.74Subgroup 3 4 -0.43 0.69Raw Score Ability SEM 5 0.03 0.66
0 -3.50 0.00 6 0.46 0.661 -2.45 1.04 7 0.90 0.672 -1.67 0.77 8 1.39 0.723 -1.18 0.65 9 1.97 0.824 -0.80 0.58 10 2.82 1.07
11 3.89 0.00
W.U

120
Person Between Analysis 3 - CONTENT 7 -2.21 0.43Subgroup 1 8 -2.03 0.41Raw Score Ability SEM 9 -1.87 0.39
0 -4.11 0.00 10 -1.72 0.381 -3.01 1.10 11 -1.59 0.372 -2.13 0.83 12 -1.46 0.363 -1.54 0.71 13 -1.33 0.354 -1.09 0.64 14 -1.22 0.345 -0.70 0.61 15 -1.10 0.336 -0.35 0.58 16 -1.00 0.337 -0.02 0.57 17 -0.89 0.328 0.31 0.58 18 -0.79 0.329 0.66 0.59 19 -0.69 0.31
10 1.02 0.62 20 -0.59 0.3111 1.44 0.68 21 -0.50 0.3112 1.97 0.79 22 -0.40 0.3013 2.78 1.05 23 -0.31 0.3014 3.83 0.00 24 -0.22 0.30
25 -0.13 0.30Subgroup 2 26 -0.04 0.30Raw Score Ability SEM 27 0.05 0.30
0 -4.88 0.00 28 0.14 0.301 -3.79 1.09 29 0.23 0.302 -2.92 0.82 30 0.32 0.303 -2.36 0.70 31 0.40 0.304 -1.92 0.63 32 0.49 0.3C5 -1.54 0.59 33 0.58 0.306 -1.21 0.56 34 0.68 0.307 -0.91 0.55 35 0.77 0.318 -0.61 0.54 36 0.86 0.319 -0.33 0.53 37 0.96 0.31
10 -0.05 0.53 38 1.06 0.3111 0.24 0.54 39 1.16 0.3212 0.53 0.55 40 1.26 0.3213 0.85 0.58 41 1.37 0.3314 1.20 0.61 42 1.48 0.3415 1.61 0.67 43 1.59 0.3416 2.14 0.78 44 1.72 0.3517 2.94 1.05 45 1.84 0.3618 4.00 0.00 46 1.98 0.38
47 2.13 0.39Subgroup 3 48 2.29 0.41Raw Score Ability SEM 49 2.46 0.43
0 -5.42 0.00 50 2.66 0.461 -4.40 1.02 51 2.89 0.492 -3.67 0.73 52 3.15 0.543 -3.22 0.61 53 3.49 0.624 -2.89 0.54 54 3.94 0.745 -2.63 0.49 55 4.68 1.02
6 -2.40 0.46 56 5.71 0.00

121
Person Between Analysis 4 - DISC vs INTEGSubgroup 1 45 1.84 0.36Raw Score Ability SEM 46 ..98 0.38
0 -5.42 0.00 47 2.13 0.391 -4.40 1.02 48 2.29 0.412 -3.67 0.73 49 2.46 0.43
3 -3.22 0.61 51 2.89 0.49
4 -2.89 0.54 52 3.15 0.54
5 -2.63 0.49 53 3.49 0.62
6 -2.40 0.46 54 3.9 0.74
7 -2.21 0.43 54 3.94 0.748 -2.03 0.41 56 5.61 1.02
9 -1.87 0.39 56 5.71 0.0010 -1.72 0.3811 -1.59 0.37 Subgroup 211 -1.59 0.37 Raw Score Ability SEM13 -1.33 0.35 0 -5.31 0.0014 -1.22 0.34 1 -4.26 1.05
15 -1.10 0.33 2 -3.46 0.7816 -1.00 0.33 3 -2.95 0.6517 -0.89 0.32 4 -2.57 0.5818 -0.79 0.32 5 -2.26 0.5319 -0.69 0.31 6 -2.00 0.5020 -0.59 0.31 7 -1.76 0.4721 -0.50 0.31 8 -1.54 0.4522 -0.40 0.30 9 -1.35 0.4423 -0.31 0.30 10 -1.16 0.4224 -0.22 0.30 11 -0.98 0.4125 -0.13 0.30 12 -0.82 0.4126 -0.04 0.30 13 -0.65 0.4021 0.05 0.30 14 -0.50 0.4028 0.14 0.30 15 -0.34 0.3929 0.23 0.30 16 -0.19 0.3930 0.32 0.30 17 -0.03 0.3931 0.40 0.30 18 0.12 0.3932 0.49 0.30 19 0.27 0.3933 0.58 0.30 20 0.43 0.4034 0.68 0.30 21 0.59 0.4035 0.77 0.31 22 0.76 0.4136 0.86 0.31 23 0.93 0.4237 0.96 0.31 24 1.12 0.4438 1.06 0.31 25 1.31 0.4539 1.16 0.32 26 1.53 0.4840 1.26 0.32 27 1.77 0.5141 1.37 0.33 28 2.05 0.5642 1.48 0.34 29 2.40 0.6243 1.59 0.34 30 2.86 0.7544 1.72 0.35 31 3.61 1.03
32 4.64 0.00

APPENDIX D
IPARM PERSON ANALYSIS SUMMARY
122
1'
r ~ - w ~ V ~ ~ ~~,*%*''. '.-~.

123
Item and Person Analysis with t'-* Reach Model
02-29-1908
fRnj~c PLAVAL
PERSON ANALYSIS SUM*ARY INfORATION - All Persons
Value of Unweighted Weighted DIrTICULTY ORDER CONTENT DISC we fIT
Pit statistic Total rt Total rit Between rit Between tit Between rt Betweeb rit
V> 4.0 3 1
4.0 > V > 3.0 2 1 7 4 2
3.0 > V > 2.5 7 4 7 4 1 4
2.5 > V > 2.0 a 6 14 14 10 6
2.0 > V > 1.5 1 14 14 24 25 21
1.5 > V > 1.0 27 24 37 30 39 35
1.0 > V > 0.5 36 45 49 60 55 55
.5 > v > 0.0 53 57 46 61 58 60
0.0 > V >-o.5 51 69 56 51 43 52
-0.5 > V >-1.0 62 48 42 40 49 46
-1.0 > V >-1.5 32 30 24 20 24 34
-1.5 > V >-2.0 12 20 16 6 6 4
-2.0 > V >-2.5 3 6 1 3 3
-2.5 > V >-3.0 1 1
-3.0 > V >-4.0 1 2
-4.0 > V
Mean 0.11 -0.01 0.26 0.36 0.25 0.20
S.D. 1.19 1.06 1.22 1.04 1.03 0.97
N 317
F
"4

LIST OF REFERENCES
Aamodt, M. and Kimbrough, W. W. (1985). Comparison of fourmethods for weighting multiple predictors. Educationaland Psychological Measurement, 45, 477-482.
American Council on the Teaching of Foreign Languages.(1982). The ACTFL provisional proficiency guidelines.New York: Author.
Andersen, E. B. (1977). Sufficient statistics and latenttrait models. Psychometrika,42, 69-81.
Ary, D. & Jacobs, L. C. (1976). Introduction to statstics.New York: Holt, Rinehart and Winston.
Baker, F. B. (1985). The basics of item response theory.Portsmouth, NH: Heinemann.
Barcikowski, R. S. & Stevens, J. P. (1975). A Monte Carlostudy of the stability of canonical correlations,canonical weights and canonical variaLe-variablecorrelations. Multivariate Behavioral Research,10, 353-364.
Birenbaum, M. (1585). Comparing the effectiveness of severalIRT based appropriateness measures in detecting unusualresponse patterns. Educational and PsychologicalMeasurement, 45, 523-534.
Braden, J. P. (1986). Testing correlations between similarmeasures in small samples. Educational andPsychological Measurement, 46, 143-148.
Brown, H. D. (1980). Principles of language learning.Englewood Cliffs, NJ: Prentice-Hall.
Bush, M. D. (1983). Selected variables in the mathematicalformulation of a model of second language learning.Unpublished doctoral dissertation, The Ohio StateUniversity, Columbus, OH.
Canale, M. (1983). On some dimensions of languageproficiency. In J. Oller, Jr. (Ed.), Issues in languagetesting research (pp. 333*-342). Rowley, MA: NewburyHouse.
124

125
Canale, M. & Swain, M. (1980). Theoretical bases ofcommunicative approaches to second language teachingtesting. Applied Linguistics, 1, 1-47.
Carroll, J. B. (1968). Language testing. In A. Davies (Ed.),Language testing symposium: A psycholinquisticapproach (pp. 46-69). Oxford: Oxford University Press.
Chase, C. 1. (1978). Measurement for educational evaluation.Reading, PA: Addison-Wesley.
Cohen, J. & Cohen, P. (1983). Applied multiple regression/correlation analysis for the behavioral sciences.Hillsdale, NJ: Lawrence Erlbaum Associates.
Coste, D., Courtillon, J., Ferenczi, V., Martins-Balzar, M.,Papo, E., & Roulet, E. (1976). Un niveau seuil.Strasbourg: Council of Europe.
Cronbach, L. J. (1946). Response sets and test validity.Educational and Psycholoqical Measurement, 6, 475-494.
Cummins, J. (1979). Cognitive/academic language proficiency,linguistic interdependance, the optimal age questionand some other matters. Working Papers on Bilingualism,19, 197-205-
Cunningham, G. K. (1986). Educational and psychologicalmeasurement. New York: Macmillan.
Donlon, T. F. & Fischer, F. E. (1968). An index of anirdividual's agreement with group-determined itmdifficulties. Educational and PsychologicalMeasurement, 28, 105-113.
Drasgow, F. (1982). Choice of test model for appropriatenessinezisurement. Applied Psychological Measurement, 6,297-308.
Ellis, R. (1986). Understanding second language acquisition.Oxford: Oxford University Press.
Fowler, H. M. (1954). An application of the Ferguson methodof computing item conformity and person conformity.Journal of Experimental Education, 22, 237-254.
Fralicz, '. D. & Raju, N. S. (1982). A comparison of fivemethods for combining multiple criteria into a singlecomposite. Educational and Psychological Measuremenrt,42, 823-827.

126
Ghiselli, E. E., Campbell, J. P., & Zedeck, S. (1981).Measurement theory for the behavioral sciences.San Francisco: W. H. Freeman and Company.
Goldman, L. (1971). Using tests in counseling. New York:Meredith Corporation.
Gronlund, N. E. (1985). Measurement and evaluation inteaching. New York: MacMillan.
Guttman, L. (1944). A basis for scaling qualitative data.American Sociological Review, 9, 139-150.
Harnish, D. L. & Linn, R. L. (1981). Analysis of itemresponse patterns: Questionable test data anddissimilar curriculum practices. Journal of EducationalMeasurement, 18, 133-146.
Hendriks, D., Scholz, G., Spurling, R., Johnson, M., andVandenburg, L. (1978). Oral proficiency testing in anintensive English language program. In J. Oller, Jr.,and K. Perkins (Eds.), Language in education: Testingthe tests (pp. 77-90). Rowley, MA; Newbury House.
Hisama, K. K. (1978). An analysis of various ESL proficiencytest. In J. Oller, Jr., and K. Perkins (Eds.), Languagein education: Testing the tests (pp. 47-53). Rowley,MA: Newbury House.
Huberty, C. J. (1975). The stability of three indices ofrelative variable contribution in discriminantanalysis. Journal of Experimental Education, 43, 59-64.
Hulin, C. L., Drasgow, F., & Parsons, C. K. (1983). Itemresponse theory: Application to psychologicalmeasurement. Homewood, IL: Dow Jones-Irwin.
Jarvis, G. A., Bonin, T.? Corbin, D., & Birckbichler, D.(1979). Invitation. New York: Holt, Rinehart andWinston.
Karmel, L. & Karmel, M. (1978). Measurement and evaluationin the schools. New York: MacMillan.
Klein, W. (1986). Second language acquisition. Cambridge:Cambridge University Press.
Le Cunff, M. (1977). Sur le vif. St. Paul, MN: EMCCorporation.
Loevinger, J. (1965). Person and population as psychometricconcepts. Psychological Review, 72, 143-155.

127
Liskin-Gasparro, J. E. (1984). The ACTFL proficiencyguidelines: a historical perspective. In T. V. HiggsEd.), Teaching for proficiency, the organizingprinciple (pp. 11-42). Lincolnwood, IL: NationalTextbook.
Lumsden, J. (1978). Tests are perfectly reliable. BritishJournal of Mathematics, Statistics & Psychology, 31,19-'26 ,
Mead, R. J. (1976). Analysis of fit to the Rasch model.Unpublished doctoral dissertation, University ofChicago, Chicago.
Mead, R. J, (1978). PANAL: Person analysis with the Raschmodel. Chicago: University of Chicago.
Mead, R. J. & Kreines, D. C. (1980, April). Person fitanalysis with the dichotomous Rasch model. Paperpresented at the meeting of the American EducationalEducational Research Association, Soston.
Mosier, C. I. (1941). Psychophysics and mental test theory:Fundamental postulates and elementary theorems.Psychological Review, 47, 355-366.
Mullen, K. A. (1978). Rater reliability and oral proficiencyevaluations. In J. Oller, Jr., and K. Perkins (Eds.),Language in education: Testing the tests (pp. 91-101).Rowley, MA: Newbury House.
Oller, J. W., Jr. (1979). Language tests at school. London:Longman Group.
Oller, J. W., Jr. (1983a). An introduction. In J. Oller, Jr.(Ed.), Issues in language testing research (pp. ix-xvi). Rowley, MA: Newbury House.
Oller, J. W., Jr. (1983b). Evidence for a generalproficiency factor: an expectancy grammar. InJ. Oller, Jr. (Ed.), Issues in language testingresearch (pp. 3-10). Rowley, MA: Newbury House.
Oller, J. W., Jr. & Perkins, K. (1978). Language ineducation: Testing the tests. Rowley, MA: NewburyHouse.
Omaggio, A. C. (1984). The Proficiency-oriented classroomIn T. V. Higgs (Ed.), Teaching for proficiency, theorganizing principle (pp. 43-84). Lincolnwood, IL:National Textbook.
.....................................p *p ---

128
Optometry Admission Testing Program. (1988). A guide to theinterpretation of the uqT response pattern scorereport. Chicago: Author.
Powers, S., Lopez, Jr. R. L., and Douglas, P. (1987). Theperformance of Spanish-speaking and English-speakingpreschool children: a Rasch item analysis. Educationaland Psychological Research, Z, 103-112.
Roid, G. H., & Haladyna, T. M. (1982). A technology fortest-item writing. Orlando, FL: Academic Press.
Rogers, H. J., and Hattie, J. A. (1987). A Monte Carloinvestigation of several person and item fit statistisfor item response models. Applied PsychologicalMeasurement, 11, 47-57.
Rudner, L. M. (1983). Individual assessment accuracy.Journal of Educational Measurement, 20, 207-219.
Sato, T. (1975). The construction and interpretation of S-Ptables. Tokyo: Meijo Tosho.
Savignon, S. J. (1985). Evaluation of communicativecompetence: The ACTFL provisional proficiencyguidelines. Modern Lanquage Journal, 69, 129-133.
Shohamy, E. (1983). Interrater and intrarater reliability ofthe ocal interview and concurrent validity with clozeprocedure in Hebrew. In J. W. Oller, Jr. (Ed.), Issuesin language testing research (pp. 229-236). Rowley, MA:Newbury House.
Schmidt, F. L. (1971). The relative efficiency of regressionand simple unit predictor weights in applieddifferential psychology. Educational and PsycholoqicalMeasurement, 31, 699-714.
Smith, R. M. (1980, April). An analysis of Rasch person fitstatistics in college placement tests. Paper presentedat the meeting of the National Council on Measurementin Education, Boston.
Smith, R. M. (1981). Person fit analysis with the Raschmodel. Unpublished manuscript, University of Chicago,Chicago.
Smith, R. M. (1985). A comparison of Rasch person analysisand robust estimators. Educational and PsychologicalMeasurement, 45, 433-444.
Smith, R. M. (1986a). Person fit in the Rasch model.Educational and Psychological Measurement, 46, 359-372.

129
Smith, R. M. (1986b). Diagnosing and correcting measurementdisturbances. Unpublished manuscript. The Ohio StateUniversity, Columbus, OH.
Smith, R. M. (in press a). Using the Dental Admission Testsupplemental score report. Journal of Dental Education.
Smith, R. M. (in press b). The distributive proprties of theRasch standardized residuals. Educational andPsychological Measurement.
Smith, R. M., Wright, B. D., & Green, K. E. (1987).Applications of the Rasch model. Unpublishedmanuscript.
Spada, H. & May, R. (1982). The linear logistic test modeland its application in educational research. InD. Spearritt (Ed.), The improvement of measurement ineducation and psychology: Contributions of latent traittheories. Victoria, Australia: Australian Council forEducational Research.
Stern, H. H. (1984). Fundamental concepts of languageteaching. Oxford: Oxford University Press.
Stevens, J. (1986). Applied multivariate statistics for thesocial sciences. Hillsdale, NJ: Lawrence EarlbaumAssociates.
Streiff, V. (1983). The roles of language in educationaltesting. In J. Oller, Jr. (Ed.), Issues in languagetesting research (pp. 343-350). Rowley, MA: NewburyHouse.
Tatsuoka, K. K. & Tatsuoka, M. M. (1983). Detection ofaberrant response patterns and their effect ondimensionality. Journal of Educational Statistics, 7,215-231.
Thurstone, L. L. (1927). A law of comparative judgement.Psychological Review, 34, 273-286.
Wainer, H. (1976). Estimating coefficients in linear models:It don't make no nevermind. Psychological Bulletin,83, 213-217.
Wright, B. D. (1977). Solving measurement problems with theRasch model. Journal of Educational Measurement, 14,97-116).
Wright, B. D. & Panchapakesan, N. A. (1969). A procedure forsample free item analysis. Educational andPsychological Measurement, 29, 23-48.

130
Wright, B. D., Rossner, M., & Congdon, R. (1985). MSCALE: ARasch program for dichotomous and rating scale data.Chicago: University of Chicago, MESA PsychometricLaboratory.
Wright, B. D., & Stone, M. H. (1979). Best test design.Chicago: MESA Press.