Impact of Storage Time, Rain and Quality of Molasses in the ...
i n t e r n a t i o n a l j o u r n a l o f h y d r o g e n en e r g y 3 6 ( 2 0 1 1 ) 1 4 3 8 1e1 4 3 9 0
Avai lab le a t www.sc iencedi rec t .com
journa l homepage : www.e lsev ier . com/ loca te /he
Hydrogen production from acid hydrolyzed molassesby the hydrogen overproducing Escherichia coli strainHD701 and subsequent use of the waste bacterial biomassfor biosorption of Cd(II) and Zn(II)
Fatthy Mohamed Morsy*
Botany Department, Faculty of Science, Assiut University, Assiut 71516, Egypt
a r t i c l e i n f o
Article history:
Received 26 April 2011
Received in revised form
23 July 2011
Accepted 29 July 2011
Available online 3 September 2011
Keywords:
Hydrogen production
Biosorption
Cd2þ
Heavy metals
Zn2þ
Waste Escherichia coli biomass
* Tel.: þ20 0167714518; fax: þ20 088 234270E-mail address: [email protected].
0360-3199/$ e see front matter Copyright ªdoi:10.1016/j.ijhydene.2011.07.121
a b s t r a c t
This study was devoted to investigate production of hydrogen gas from acid hydrolyzed
molasses by Escherichia coli HD701 and to explore the possible use of the waste bacterial
biomass in biosorption technology. In variable substrate concentration experiments (1, 2.5,
5, 10 and 15 g L�1), the highest cumulative hydrogen gas (570 ml H2 L�1) and formation rate
(19 ml H2 h�1 L�1) were obtained from 10 g L�1 reducing sugars. However, the highest yield
(132 ml H2 g�1 reducing sugars) was obtained at a moderate hydrogen formation rate (11 ml
H2 h�1 L�1) from 2.5 g L�1 reducing sugars. Subsequent to H2 production, the waste E. coli
biomass was collected and its biosorption efficiency for Cd2þ and Zn2þ was investigated.
The biosorption kinetics of both heavy metals fitted well with the pseudo second-order
kinetic model. Based on the Langmuir biosorption isotherm, the maximum biosorption
capacities (qmax) of E. coli waste biomass for Cd2þ and Zn2þ were 162.1 and 137.9 (mg/g),
respectively. These qmax values are higher than those of many other previously studied
biosorbents and were around three times more than that of aerobically grown E. coli. The
FTIR spectra showed an appearance of strong peaks for the amine groups and an increase
in the intensity of many other functional groups in the waste biomass of E. coli after
hydrogen production in comparison to that of aerobically grown E. coli which explain the
higher biosorption capacity for Cd2þ or Zn2þ by the waste biomass of E. coli after hydrogen
production. These results indicate that E. coli waste biomass after hydrogen production can
be efficiently used in biosorption technology. Interlinking such biotechnologies is poten-
tially possible in future applications to reduce the cost of the biosorption technology and
duplicate the benefits of biological H2 production technology.
Copyright ª 2011, Hydrogen Energy Publications, LLC. Published by Elsevier Ltd. All rights
reserved.
1. Introduction succeed in bringing down costs [1e4]. Biological hydrogen
Hydrogen is currently more expensive than traditional
energy sources, so it is likely to play a major role in the
economy in the long run, if technology improvements
8.
2011, Hydrogen Energy P
production processes are found to be more environment
friendly and less energy intensive as compared to thermo-
chemical and electrochemical processes [5e7]. Biological
hydrogen production requires a waste and by-product
ublications, LLC. Published by Elsevier Ltd. All rights reserved.
i n t e rn a t i o n a l j o u r n a l o f h y d r o g e n en e r g y 3 6 ( 2 0 1 1 ) 1 4 3 8 1e1 4 3 9 014382
strategy to compete with other production technologies of
hydrogen gas. A way to reduce the cost of biological
hydrogen production is through improving the practical
bacterial hydrogen productivity from organic wastes [8e14].
Another way is to make use of its waste products in other
biotechnological applications. One possibility is to make use
of the waste bacterial biomass in heavy metals biosorption
technology for wastewater treatment. The biosorption of
heavy metals by certain types of microorganisms’ biomass
is a highly cost-effective technology for the decontamina-
tion of metal-containing effluents [15]. Both living and non-
living microorganisms biomass have been used in bio-
sorption of toxic metal ions [16e21]. The use of heterotro-
phic bacteria for biosorption of heavy metals [22e24] is
rather expensive in comparison to green algae and cyano-
bacteria [25e27] which grow autotrophically. Using the
waste bacterial biomass of hydrogen production in heavy
metals biosorption would make the biosorption technology
of heavy metals by heterotrophic bacteria inexpensive and
duplicates the benefits of biological hydrogen production
technology.
Hydrogen production by Escherichia coli is mediated by the
formate hydrogenlyase (FHL) complex [28e34]. The mutant E.
coli HD701 constructed previously [35] cannot synthesize the
(Hyc A) repressor of the FHL complex. Consequently, this
mutant has an up-regulated FHL system and can, therefore,
evolve hydrogen at a greater rate than its parental wild type, E.
coli MC4100 [36]. The main objectives of this work were to
investigate the hydrogen production from acid hydrolyzed
molasses by the hydrogen overproducing E. coli HD701 and to
examine the biosorption efficiency of the waste E. coli biomass
for Cd2þ and Zn2þ.
2. Materials and methods
2.1. Culture conditions for E. coli
E. coli was maintained aerobically at 30 �C on nutrient agar
[containing (g L�1): peptone, 5; beef extract, 5; NaCl, 3; agar,
15]. Prior to hydrogen production, E. coli was grown aerobi-
cally overnight on nutrient broth [containing (g L�1):
peptone, 5; beef extract, 5; NaCl, 3] with shaking (100 rpm) at
30 �C.
2.2. Acid hydrolysis of molasses
Several preliminary experiments were conducted to optimize
the conditions of acid hydrolysis of molasses. The optimum
conditions used for acid hydrolysis of molasses were as
fellow: Molasses was diluted two times by distilled water and
adjusted to 2 M HCl. Subsequently, the acid hydrolysis was
conducted at 120 �C for 20 min.
2.3. Determination of reducing sugars concentration
Samples of acid hydrolyzed molasses were neutralized by 1 M
NaOH. Subsequently, the reducing sugars concentration was
determined by Nelson reagent [37].
2.4. Hydrogen production from acid hydrolyzedmolasses by E. coli
Batch experiments for hydrogen production by E. coli were
conducted as described by Penfold et al. [36] with modifica-
tions using the reducing sugars of acid hydrolyzed molasses
as a carbon source. The experiments were conducted at 30 �Cin 1 L fermentor with a working volume of 970 ml. The
fermentor contained 80% (v/v) of 10mMpotassium phosphate
buffer (pH 7.3) and 10% (v/v) of acid hydrolyzed molasses
(previously neutralized to pH 7.3 by 1 M NaOH) in a final
concentration of 1, 2.5, 5, 10 and 15 (g/L) reducing sugars. After
autoclaving, 10% (v/v) inoculum of E. coli cells, pre-grown in
nutrient broth (OD600 equal 0.25), was added. The fermentor
was fitted with rubber stopper and purged with N2 gas for 1 h
to ensure an anaerobic environment. Fermentation tempera-
ture was controlled at 30 �C in a water bath. The fermentor
was set in dark and the evolved H2 gas was collected and
measured by displacement of 1 M NaOH in an inverted
cylinder. NaOH was used to absorb CO2 [36]. All gas volumes
are reported at 1 atm and 25 �C.
2.5. Preparation of the waste E. coli biomass forbiosorption
Subsequent to the hydrogen production experiments, cells of
E. coli in the spent medium of the fermentor were collected by
centrifugation at 10,000 �g for 20 min at 4 �C. The biomass
pellets of E. coli were washed three times with distilled water.
Thewashed biomasswas freeze-dried and stored at�80 �C for
subsequent heavy metals biosorption experiments.
2.6. Metal solution for biosorption
Stock solutions of Cd2þ and Zn2þ (1000mg/L) were prepared by
dissolving 1.63, and 4.39 g of CdCl2 and ZnSO4$7H2O, respec-
tively in a 1000 ml of distilled water.
2.7. Biosorption experiments
Biosorption experiments were conducted at pH 6. The freeze-
dried E. coli waste biomass (20 mg) was suspended in 20 ml of
Cd2þ and Zn2þ solutions at various initial concentrations (Ci)
ranging from 0 to 300 mg L�1. Shaking was conducted at
200 rpm for 25 min till equilibrium attained at room temper-
ature (25 � 2 �C). Subsequent to centrifugation at 10,000 �g for
20 min, the heavy metal equilibrium (final) concentration (Ce)
in the supernatant was measured by atomic absorption
spectroscopy (AAS) (Model 210 VGP Buck Scientific). The
quantity of metal ion (mg) biosorbed per gram (dry weight) of
E. coli biomass was calculated using the following equation:
qeðmg=gÞ ¼�Ci�Ce
M
�� V (1)
where, qe ¼ equilibrium (final) quantity of metal ions bio-
sorbed (mg metal ions/g bacterial biomass); Ci ¼ initial metal
ions concentration (mg/L); Ce ¼ equilibrium (final) metal ion
concentration (mg/L); M ¼ dry weight of E. coli biomass (g);
V ¼ the volume of metal ions solution (L).
i n t e r n a t i o n a l j o u r n a l o f h y d r o g e n en e r g y 3 6 ( 2 0 1 1 ) 1 4 3 8 1e1 4 3 9 0 14383
2.8. Biosorption isotherms
Several isothermmodels are available to describe equilibrium
distribution of metal ions between the aqueous and solid
phases. The two most common types for describing bio-
sorption isotherms are the Langmuir and Freundlich models
[16,17,38,39].
2.8.1. Langmuir isotherm modelThe mathematical formula of Langmuir equation can be
expressed as:
qe ¼ qmaxbCe
1þ bCe(2)
The linear form of the equation is:
Ce=qe ¼ 1=qmaxbþ Ce=qmax (3)
where, qmax (mg/g) is the maximum biosorption capacity of
the metal ions (mg) per unit weight (g) of bacterial biomass
to make monolayer coverage by the metal ions on the
bacterial surface. The Langmuir constant b (L/mg) represents
the affinity between biosorbent and biosorbate. The
maximum biosorption capacity qmax, and b can be deter-
mined from the linear form of Langmuir equation Eq. (3) by
plotting Ce/qe versus Ce. The plot of Ce/qe versus Ce gives
a straight line. The slope equals 1/qmax while intercept
equals 1/(qmaxb).
2.8.2. Freundlich isotherm modelThe general form of the Freundlich isotherm equation is:
qe ¼ KfC1=ne (4)
The linear form of the equation is:
ln qe ¼ ln Kf þ 1=n ln Ce (5)
where, Kf and n are the biosorption capacity and intensity,
respectively. If the value of n is greater than unity, this is an
indication of a favorable adsorption. A plot of ln qe versus ln Ce
gives a straight line. The slope equals 1/n while the intercept
equals ln Kf.
2.9. Biosorption rate kinetics
Experiments for determining the kinetics of the biosorption
process were performed at room temperature (25 � 2 �C). Thefreeze-dried E. coli waste biomass (100 mg) was suspended in
100 ml of 50 mg L�1 Cd2þ or Zn2þ solutions (pH 6) with shaking
at 200 rpm. Aliquots (2 ml) of metal solution were taken at
desired time intervals and were immediately centrifuged at
15,000 �g for 5 min. Subsequently, the heavy metal concen-
tration in the supernatant wasmeasured by AAS. The changes
in Cd2þ and Zn2þ biosorption (mg/g) with time were deter-
mined and the data were analyzed using pseudo first-order
Lagergren and pseudo second-order kinetic models.
2.9.1. The pseudo first-order modelThe first-order rate equation [40] is one of the most widely
used for the sorption of solute from a liquid solution. The
pseudo first-order Lagergren model is generally expressed as:
dqt
dt¼ K1
�qe � qt
�(6)
where qt is the amount of metal ions biosorbed (mg/g) at any
given time t (min), qe is the amount of metal ion biosorbed
(mg/g) at equilibrium and K1 is the Lagergren rate constant of
pseudo first-order biosorption (min�1).
Integrating Eq. (6) between the limits, t¼ 0 to t¼ t and qt¼ 0
to qt ¼ qe, it becomes
log�qe � qt
� ¼ logqe � K1
2:303t (7)
The plot of log (qe � qt) vs. t should give a linear relationship
from which k1 and qe can be determined from the slope and
intercept of the plot, respectively.
2.9.2. The pseudo second-order modelThe pseudo second-order model [40] can be expressed as:
dqt
dt¼ K2
�qe � qt
�2(8)
where qt is the amount ofmetal ions biosorbed by freeze-dried
waste E. coli biomass (mg/g) at any given time t (min), qe is the
amount of metal ion biosorbed (mg/g) at equilibrium and k2 is
the rate constant of the pseudo second-order biosorption
(g mg�1 min�1).
For the boundary conditions t¼ 0 to t¼ t and qt¼ 0 to qt¼ qe,
the integrated form of Eq. (8)
tqt
¼ 1k2q2
e
þ 1qe
t (9)
The plot of (t/qt) vs. t of Eq. (9) should give a linear rela-
tionship from which qe and k2 can be determined from the
slope and intercept of the plot, respectively.
2.10. Comparison between waste E. coli biomass afterhydrogen production and aerobically grown E. coli forbiosorption of Cd2þ and Zn2þ
Biosorption of Cd2þ and Zn2þ by freeze-dried biomass of aero-
bically grown E. coli in nutrient broth were also investigated for
comparison with the biosorption capacity of the waste E. coli
biomass after hydrogen production. E. coli HD701 was grown
aerobically onnutrient broth as described above. Subsequently,
E. coli cells were collected by centrifugation at 10,000 �g for
20min at 4 �C. The biomass pellets of E. coliwere washed three
times with distilled water. The washed biomass was freeze-
dried and stored at �80 �C for subsequent heavy metals
biosorption experiments. Biosorption experiments were con-
ducted at pH 6. The freeze-dried biomass of aerobically grown
E. coli (20mg)was suspended in20ml ofCd2þ andZn2þ solutions
at various initial concentrations (Ci) ranging from 0 to
300 mg L�1. Shaking was conducted at 200 rpm for 25 min till
equilibrium attained at room temperature (25 � 2 �C). Subse-quent to centrifugation at 10,000�g for 20min, the heavymetal
equilibrium concentration (Ce) in the supernatant was
measured by AAS. The data were analyzed as described above.
2.11. Fourier transform infra-red (FTIR) analysis
The freeze-dried cells of aerobically grown E. coli and the
freeze-dried waste biomass of E. coli after hydrogen
f H
form
atio
n (m
l hL
)
d (
ml)
/g r
educ
ing
suga
rs
10
15
20
60
80
100
120
140
i n t e rn a t i o n a l j o u r n a l o f h y d r o g e n en e r g y 3 6 ( 2 0 1 1 ) 1 4 3 8 1e1 4 3 9 014384
production from acid hydrolyzed molasses (metal free
biomass) as will as the waste E. coli biomasses after bio-
sorption of Cd2þ or Zn2þ (metal ions loaded) were analyzed
using an Fourier transform infra-red (FTIR) spectrometer
(Model: Nicolet 6700; Thermo-Electron Corporation). The FTIR
analysis was performed to give a qualitative characterization
of the main chemical groups present on the cell wall that are
responsible for heavy metal biosorption.
Reducing sugars (g L )
Rat
e o
Hyi
el
0
5
0
20
40
0 2 4 6 8 10 12 14 16
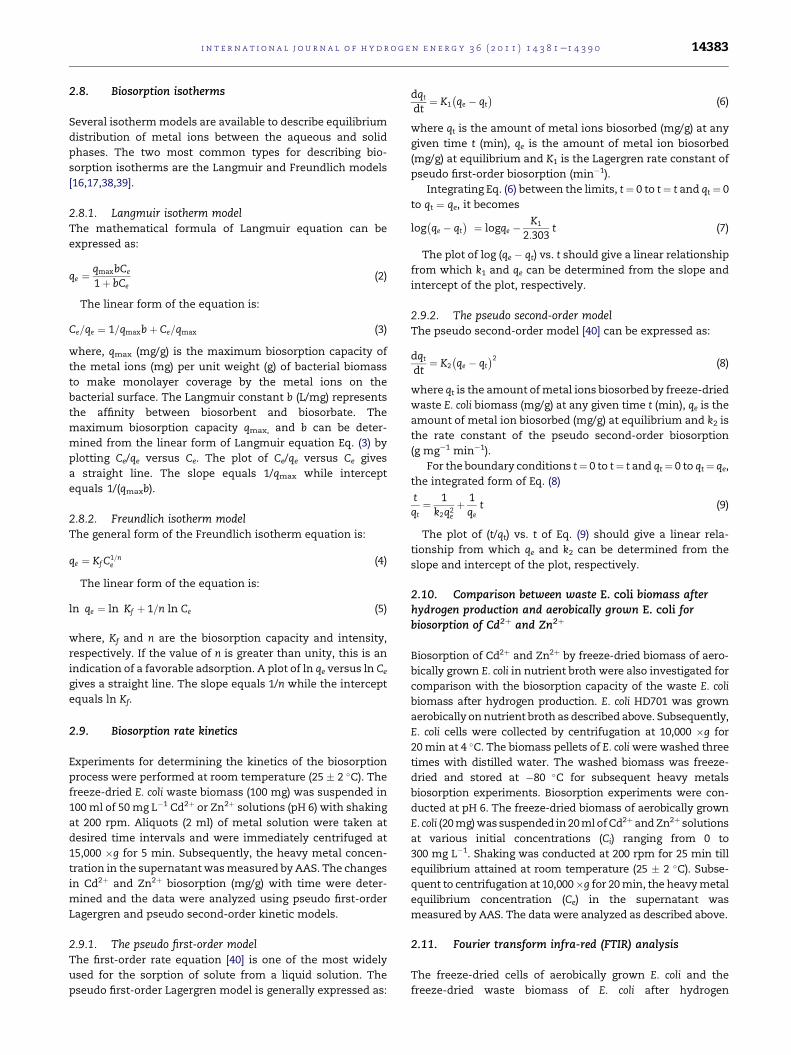
Fig. 2 e Average rate of hydrogen formation and the
hydrogen yield by E. coli HD701 from acid hydrolyzed
molasses. Mean values were estimated from three
independent experiments.
3. Results and discussion
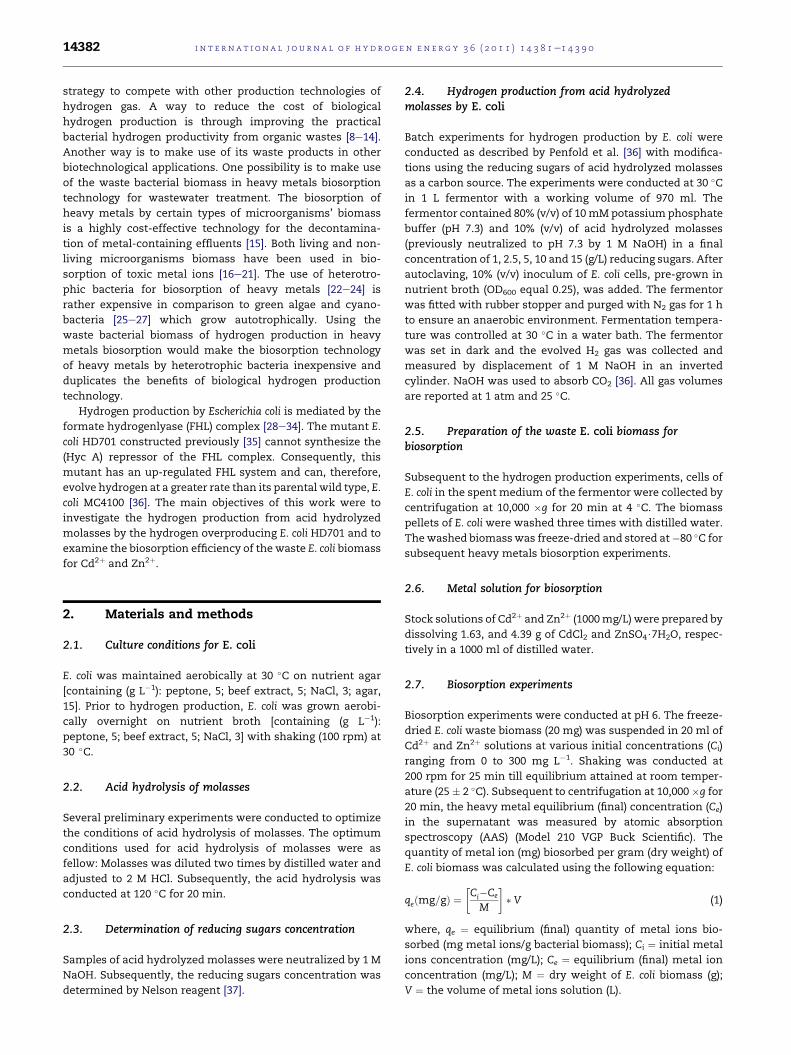
3.1. Hydrogen production by E. coli from acidhydrolyzed molasses
Dark fermentation batch experiments were conducted for
hydrogen production by E. coli using the reducing sugars of the
acid hydrolyzed molasses as a carbon source. Hydrolysis of
molasses was substantial for hydrogen production by E. coli.
The major component of molasses was sucrose (data not
shown). However, E. coli cannot normally utilize sucrose
[36,41]. Thus, it could not produce hydrogen from non-
hydrolyzed molasses. E. coli HD701 was previously reported
to produce only H2 and CO2 [36]. Hydrogen evolution began
after two hours from the fermentation start time and
continued for a period of 30 h followed by a plateau in the
hydrogen evolution pattern (Fig. 1). The highest cumulative
hydrogen (570 ml H2 L�1) (Fig. 1) and formation rate (19 ml H2
h�1 L�1) (Fig. 2) were obtained from 10 g L�1 reducing sugars.
However, the highest yield (132 ml g�1 reducing sugars) was
obtained from 2.5 g L�1 reducing sugars (Fig. 2). The rate of
hydrogen evolution increased by increasing the substrate
concentration up to 10 g L�1 but it declined at 15 g L�1 (Fig. 2).
The accumulation of fermentation end-products (e.g. ethanol
and organic acids) and fall in pH can exert sufficient ‘stress’ to
halt mesophilic H2 production by E. coli in an excess of
substrate [42,43]. It is more advantageous to operate the
fermentation by E. coli at low reducing sugars concentration
(2.5 g L�1) to obtain the highest hydrogen yield at a moderate
hydrogen formation rate (11 ml H2 h�1 L�1) (Fig. 2).
Time (h)
Cum
ulat
ive
hydr
ogen
gas
(m
l)
0
100
200
300
400
500
600
700
0 10 20 30 40
012.551015
Reducing Sugars (g L )
Fig. 1 e Cumulative hydrogen production from acid
hydrolyzed molasses by E. coli HD701 at various reducing
sugars concentrations. Mean values and standard errors
from three independent experiments are shown.
3.2. Biosorption of Cd2þ and Zn2þ by the waste E. colibiomass
Subsequent to hydrogen production by E. coli from the acid
hydrolyzed molasses, the waste bacterial biomass was
collected and its biosorption efficiency for Cd2þ and Zn2þ was
investigated. The optimum pH for biosorption of Cd2þ and
Zn2þ by freeze-dried waste biomass of E. coli was 6 and the
optimum contact time was 20 min at room temperature (data
not shown).
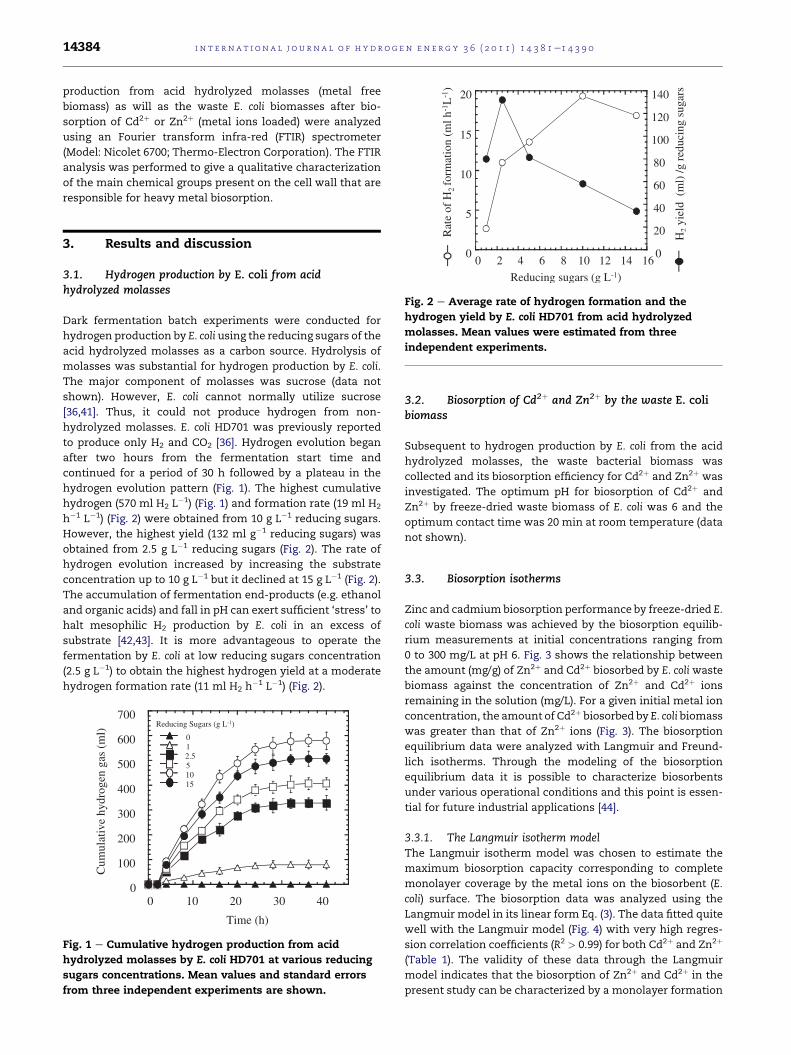
3.3. Biosorption isotherms
Zinc and cadmiumbiosorption performance by freeze-dried E.
coli waste biomass was achieved by the biosorption equilib-
rium measurements at initial concentrations ranging from
0 to 300 mg/L at pH 6. Fig. 3 shows the relationship between
the amount (mg/g) of Zn2þ and Cd2þ biosorbed by E. coli waste
biomass against the concentration of Zn2þ and Cd2þ ions
remaining in the solution (mg/L). For a given initial metal ion
concentration, the amount of Cd2þ biosorbed by E. coli biomass
was greater than that of Zn2þ ions (Fig. 3). The biosorption
equilibrium data were analyzed with Langmuir and Freund-
lich isotherms. Through the modeling of the biosorption
equilibrium data it is possible to characterize biosorbents
under various operational conditions and this point is essen-
tial for future industrial applications [44].
3.3.1. The Langmuir isotherm modelThe Langmuir isotherm model was chosen to estimate the
maximum biosorption capacity corresponding to complete
monolayer coverage by the metal ions on the biosorbent (E.
coli) surface. The biosorption data was analyzed using the
Langmuir model in its linear form Eq. (3). The data fitted quite
well with the Langmuir model (Fig. 4) with very high regres-
sion correlation coefficients (R2 > 0.99) for both Cd2þ and Zn2þ
(Table 1). The validity of these data through the Langmuir
model indicates that the biosorption of Zn2þ and Cd2þ in the
present study can be characterized by a monolayer formation
C (mg L )
Am
ount
ads
orbe
d q
(mg)
/ g d
ry m
ass
0
50
100
150
200
0 50 100 150 200
Zn
Cd
Fig. 3 e Biosorption of Cd2D and Zn2D by freeze-dried E. coli
waste biomass at various initial metal ion concentrations.
Table 1 e The Langmuir and Freundlich isothermconstants for Cd2D and Zn2D biosorption by freeze-driedwaste E. coli biomass.
Heavy metalions
Langmuir Freundlich
qmax (mg/g) b (L/mg) R2 Kf n R2
Cd2þ 162.1 0.192 0.999 1.41 2.57 0.921
Zn2þ 137.9 0.069 0.995 1.33 2.37 0.958
i n t e r n a t i o n a l j o u r n a l o f h y d r o g e n en e r g y 3 6 ( 2 0 1 1 ) 1 4 3 8 1e1 4 3 9 0 14385
of the metal ions on the surface of E. coli. The maximum bio-
sorption capacities (qmax) of E. coli for Cd2þ and Zn2þwere 162.1
and 137.9 mg/g, respectively (Table 1). Taking into account the
atomic weight of both heavy metals, the maximum bio-
sorption capacities (qmax) of E. coli for Cd2þ and Zn2þ would be
3.377 and 4.597 mmol g�1, respectively. Thus, the E. coli
maximum biosorption capacity for Zn2þ would be higher than
Cd2þ. This differential type of Cd2þ and Zn2þ biosorption can
be ascribed to the difference in their ionic radii [45]. The
smaller-ionic radii metal ions appear to adsorb more on the
biomass, which is consistent with surface adsorption mech-
anism, since smaller-radius metal ions have greater adsorp-
tion tendency than larger ones as the element with smaller-
ionic radius will compete faster for exchange sites than those
of lager ionic radius [45]. This may explain the greater bio-
sorption ability of Zn2þ on the E. coli biomass than Cd2þ as the
ionic radius of Zn2þ (0.74 A�) is smaller than that of Cd2þ
(0.95 A�).
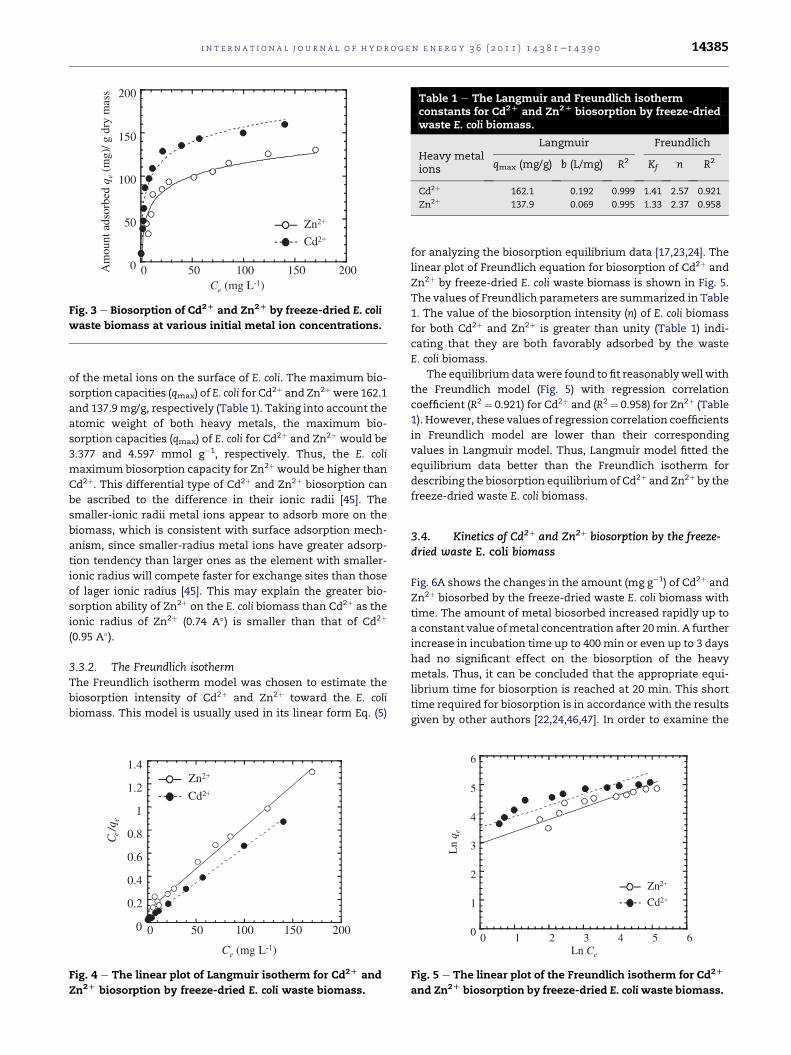
3.3.2. The Freundlich isothermThe Freundlich isotherm model was chosen to estimate the
biosorption intensity of Cd2þ and Zn2þ toward the E. coli
biomass. This model is usually used in its linear form Eq. (5)
C (mg L )
C/q
0
0.2
0.4
0.6
0.8
1
1.2
1.4
0 50 100 150 200
Zn
Cd
Fig. 4 e The linear plot of Langmuir isotherm for Cd2D and
Zn2D biosorption by freeze-dried E. coli waste biomass.
for analyzing the biosorption equilibrium data [17,23,24]. The
linear plot of Freundlich equation for biosorption of Cd2þ and
Zn2þ by freeze-dried E. coli waste biomass is shown in Fig. 5.
The values of Freundlich parameters are summarized in Table
1. The value of the biosorption intensity (n) of E. coli biomass
for both Cd2þ and Zn2þ is greater than unity (Table 1) indi-
cating that they are both favorably adsorbed by the waste
E. coli biomass.
The equilibriumdatawere found to fit reasonablywell with
the Freundlich model (Fig. 5) with regression correlation
coefficient (R2 ¼ 0.921) for Cd2þ and (R2 ¼ 0.958) for Zn2þ (Table
1). However, these values of regression correlation coefficients
in Freundlich model are lower than their corresponding
values in Langmuir model. Thus, Langmuir model fitted the
equilibrium data better than the Freundlich isotherm for
describing the biosorption equilibriumof Cd2þ and Zn2þ by the
freeze-dried waste E. coli biomass.
3.4. Kinetics of Cd2þ and Zn2þ biosorption by the freeze-dried waste E. coli biomass
Fig. 6A shows the changes in the amount (mg g�1) of Cd2þ and
Zn2þ biosorbed by the freeze-dried waste E. coli biomass with
time. The amount of metal biosorbed increased rapidly up to
a constant value ofmetal concentration after 20min. A further
increase in incubation time up to 400 min or even up to 3 days
had no significant effect on the biosorption of the heavy
metals. Thus, it can be concluded that the appropriate equi-
librium time for biosorption is reached at 20 min. This short
time required for biosorption is in accordance with the results
given by other authors [22,24,46,47]. In order to examine the
Ln C
Ln
q
0
1
2
3
4
5
6
0 1 2 3 4 5 6
Zn
Cd
Fig. 5 e The linear plot of the Freundlich isotherm for Cd2D
and Zn2D biosorption by freeze-dried E. coliwaste biomass.

A
B
C
0
2
4
6
8
10
12
0 100 200 300 400 500Time (min)
t/q
ZnCd
-1.5
-1
-0.5
0
0.5
1
1.5
2
0 10 20 30 40Time (min)
Log
(q
-q)
ZnCd
0
10
20
30
40
50
0 100 200 300 400 500Time (min)
q(m
g/g)
ZnCd
Fig. 6 e Kinetics of Cd2D and Zn2D biosorption by freeze-
dried E. coli waste biomass. Panel (A) shows the changes in
the amount (qt) of Cd2D and Zn2D biosorbed by the freeze-
dried waste E. coli biomass with time (t). Panel (B) and (C)
show the linearized pseudo first- and second-order kinetic
models respectively; for biosorption of Cd2D and Zn2D by
freeze-dried E. coli waste biomass.
Table 2 e Kinetic parameters obtained from pseudo first-order and pseudo second-order for Cd2D and Zn2D
biosorption by freeze-dried waste E. coli biomass.
HeavyMetal
Initialconc.
(mg L�1)
qexp(mg/g)
Pseudofirst-order
Pseudosecond-order
K1 qe R2 K2 qe R2
Cd2þ 50 44.5 0.139 29.76 0.998 0.0187 45.16 0.999
Zn2þ 50 43 0.135 35.78 0.994 0.0146 43.21 0.999
i n t e rn a t i o n a l j o u r n a l o f h y d r o g e n en e r g y 3 6 ( 2 0 1 1 ) 1 4 3 8 1e1 4 3 9 014386
controlling mechanism of the biosorption process, experi-
ment kinetic data in Fig. 6A were analyzed using two kinetic
models; the pseudo first-order and the pseudo second-order
model. Fig. 6B and C show linear plots of the linearized
forms of the pseudo first-ordermodel in Eq. (7) and the pseudo
second-order model in Eq. (9) respectively, for the biosorption
of Cd2þ and Zn2þ by the freeze-dried waste E. coli biomass.
Table 2, shows the theoretical qe values obtained from both
models in comparison with the experiment values (qexp). The
theoretical biosorption capacities (qe) for Cd2þ and Zn2þ esti-
mated from the pseudo first-order model showed a deviation
from the experiment values (qexp). In contrast, the pseudo
second-order results showed a theoretical qe values very close
to the experiment values (Table 2). Therefore, it can be
concluded that the pseudo second-order biosorption model is
more suitable to describe the biosorption kinetics of Cd2þ and
Zn2þ by the freeze-dried waste E. coli biomass.
3.5. Comparison between waste E. coli biomass afterhydrogen production and aerobically grown E. coli forbiosorption of Cd2þ and Zn2þ
Biosorption of Cd2þ and Zn2þ by freeze-dried biomass of
aerobically grown E. coli (in nutrient broth) were also investi-
gated for comparison with the waste E. coli biomass after
hydrogen production. Zinc and cadmium biosorption perfor-
mance by freeze-dried cells of aerobically grown E. coli was
achieved by the biosorption equilibrium measurements at
initial concentrations ranging from 0 to 300 mg L�1 of Cd2þ or
Zn2þ (Supplementary Fig. 1). The qmax deduced from Langmuir
isotherm for biosorption of Cd2þ and Zn2þ by aerobically
grown E. coli (Supplementary Fig. 2) were 55.3 and 42.6 mg g�1
respectively. In contrast, themaximum biosorption capacities
(qmax) of waste E. coli (after hydrogen production) for Cd2þ and
Zn2þ were around three times more than that of aerobically
grown E. coli in nutrient broth (Table 3). Such maximum bio-
sorption capacity values of waste E. coli (after hydrogen
production) for Cd2þ (162.1 mg/g) and Zn2þ (137.9 mg/g) are
also higher than those ofmany previously studied biosorbents
(Table 3).
3.6. Fourier transform infra-red (FTIR) analysis
The FTIR spectra were taken, in the range of 500e4000 cm�1,
for the freeze-dried cells of aerobically grown E. coli (Fig. 7A)
and the freeze-dried waste biomass of E. coli after hydrogen
production from acid hydrolyzed molasses (metal free
biomass) (Fig. 7B) as will as the waste E. coli biomasses after
biosorption of Cd2þ (Fig. 7C) or Zn2þ (Fig. 7D) (metal ions
loaded). The spectra display a number of absorption peaks,
reflecting the complex nature of the biomass. The FTIR spectra
of the waste biomass of E. coli after hydrogen production
(Fig. 7B) differed from that of aerobically grown E. coli (Fig. 7A).
The absorption peaks at 2359e2342 cm�1, corresponded to the
amine (]NeH2þ) group [74,75], appeared in the spectrumof the
waste biomass of E. coli after hydrogen production (Fig. 7B) in
comparison to that of aerobically grown E. coli (Fig. 7A). In the
spectrum of aerobically grown E. coli (Fig. 7A), the peak at
861 cm�1 is attributed to the presence of aromatic eCH
stretching [76]. Such peak disappeared in the spectrum of the
waste biomass of E. coli after hydrogen production (Fig. 7B).
The absorption bands characterizing hydroxyl and amine
groups were assigned at 3500e3200 cm�1. A peak at
3500e3200 cm�1 region is due to the stretching of the NeH
bond of amino groups and indicative of bonded hydroxyl
group [44,77]. Such bandswere stronger in the spectrum of the
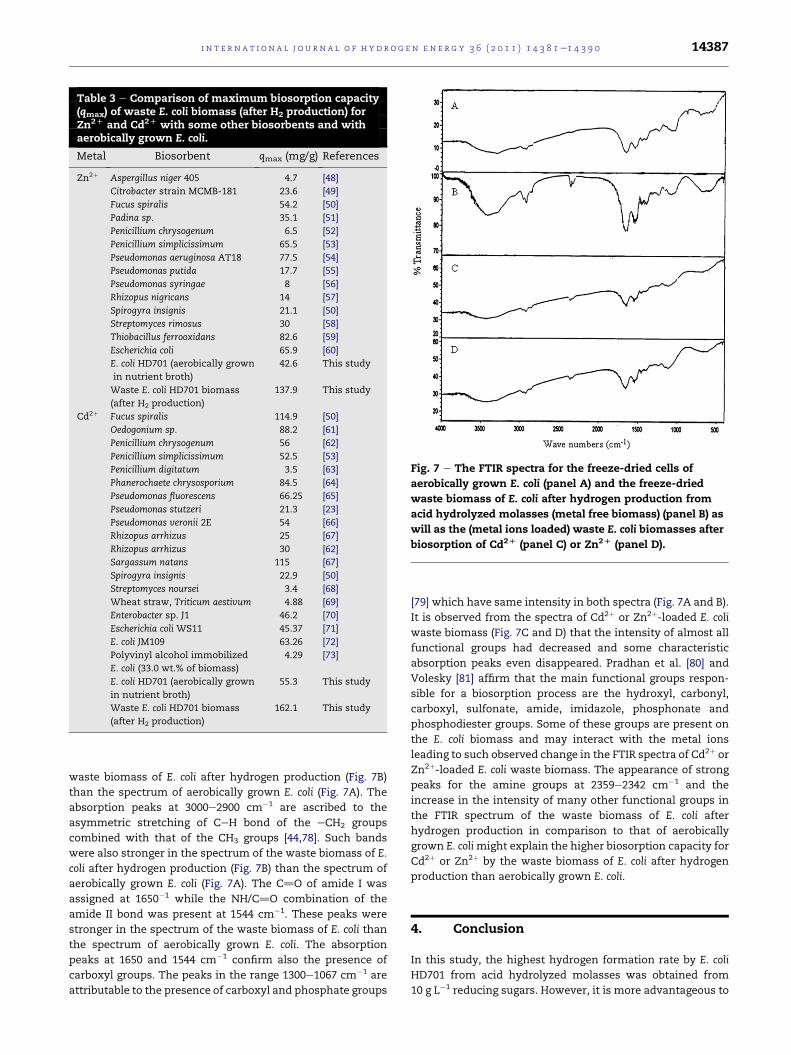
Table 3 e Comparison of maximum biosorption capacity(qmax) of waste E. coli biomass (after H2 production) forZn2D and Cd2D with some other biosorbents and withaerobically grown E. coli.
Metal Biosorbent qmax (mg/g) References
Zn2þ Aspergillus niger 405 4.7 [48]
Citrobacter strain MCMB-181 23.6 [49]
Fucus spiralis 54.2 [50]
Padina sp. 35.1 [51]
Penicillium chrysogenum 6.5 [52]
Penicillium simplicissimum 65.5 [53]
Pseudomonas aeruginosa AT18 77.5 [54]
Pseudomonas putida 17.7 [55]
Pseudomonas syringae 8 [56]
Rhizopus nigricans 14 [57]
Spirogyra insignis 21.1 [50]
Streptomyces rimosus 30 [58]
Thiobacillus ferrooxidans 82.6 [59]
Escherichia coli 65.9 [60]
E. coli HD701 (aerobically grown
in nutrient broth)
42.6 This study
Waste E. coli HD701 biomass
(after H2 production)
137.9 This study
Cd2þ Fucus spiralis 114.9 [50]
Oedogonium sp. 88.2 [61]
Penicillium chrysogenum 56 [62]
Penicillium simplicissimum 52.5 [53]
Penicillium digitatum 3.5 [63]
Phanerochaete chrysosporium 84.5 [64]
Pseudomonas fluorescens 66.25 [65]
Pseudomonas stutzeri 21.3 [23]
Pseudomonas veronii 2E 54 [66]
Rhizopus arrhizus 25 [67]
Rhizopus arrhizus 30 [62]
Sargassum natans 115 [67]
Spirogyra insignis 22.9 [50]
Streptomyces noursei 3.4 [68]
Wheat straw, Triticum aestivum 4.88 [69]
Enterobacter sp. J1 46.2 [70]
Escherichia coli WS11 45.37 [71]
E. coli JM109 63.26 [72]
Polyvinyl alcohol immobilized
E. coli (33.0 wt.% of biomass)
4.29 [73]
E. coli HD701 (aerobically grown
in nutrient broth)
55.3 This study
Waste E. coli HD701 biomass
(after H2 production)
162.1 This study
Fig. 7 e The FTIR spectra for the freeze-dried cells of
aerobically grown E. coli (panel A) and the freeze-dried
waste biomass of E. coli after hydrogen production from
acid hydrolyzed molasses (metal free biomass) (panel B) as
will as the (metal ions loaded) waste E. coli biomasses after
biosorption of Cd2D (panel C) or Zn2D (panel D).
i n t e r n a t i o n a l j o u r n a l o f h y d r o g e n en e r g y 3 6 ( 2 0 1 1 ) 1 4 3 8 1e1 4 3 9 0 14387
waste biomass of E. coli after hydrogen production (Fig. 7B)
than the spectrum of aerobically grown E. coli (Fig. 7A). The
absorption peaks at 3000e2900 cm�1 are ascribed to the
asymmetric stretching of CeH bond of the eCH2 groups
combined with that of the CH3 groups [44,78]. Such bands
were also stronger in the spectrum of the waste biomass of E.
coli after hydrogen production (Fig. 7B) than the spectrum of
aerobically grown E. coli (Fig. 7A). The C]O of amide I was
assigned at 1650�1 while the NH/C]O combination of the
amide II bond was present at 1544 cm�1. These peaks were
stronger in the spectrum of the waste biomass of E. coli than
the spectrum of aerobically grown E. coli. The absorption
peaks at 1650 and 1544 cm�1 confirm also the presence of
carboxyl groups. The peaks in the range 1300e1067 cm�1 are
attributable to the presence of carboxyl and phosphate groups
[79] which have same intensity in both spectra (Fig. 7A and B).
It is observed from the spectra of Cd2þ or Zn2þ-loaded E. coli
waste biomass (Fig. 7C and D) that the intensity of almost all
functional groups had decreased and some characteristic
absorption peaks even disappeared. Pradhan et al. [80] and
Volesky [81] affirm that the main functional groups respon-
sible for a biosorption process are the hydroxyl, carbonyl,
carboxyl, sulfonate, amide, imidazole, phosphonate and
phosphodiester groups. Some of these groups are present on
the E. coli biomass and may interact with the metal ions
leading to such observed change in the FTIR spectra of Cd2þ or
Zn2þ-loaded E. coli waste biomass. The appearance of strong
peaks for the amine groups at 2359e2342 cm�1 and the
increase in the intensity of many other functional groups in
the FTIR spectrum of the waste biomass of E. coli after
hydrogen production in comparison to that of aerobically
grown E. colimight explain the higher biosorption capacity for
Cd2þ or Zn2þ by the waste biomass of E. coli after hydrogen
production than aerobically grown E. coli.
4. Conclusion
In this study, the highest hydrogen formation rate by E. coli
HD701 from acid hydrolyzed molasses was obtained from
10 g L�1 reducing sugars. However, it is more advantageous to
i n t e rn a t i o n a l j o u r n a l o f h y d r o g e n en e r g y 3 6 ( 2 0 1 1 ) 1 4 3 8 1e1 4 3 9 014388
operate the fermentation by E. coli at low reducing sugars
concentration (2.5 g L�1) to obtain the highest hydrogen yield
at a moderate hydrogen formation rate. The waste E. coli
biomass showed a high efficiency for biosorption of Cd2þ and
Zn2þ withmaximumbiosorption capacities (qmax) of 162.1 and
137.9 (mg/g), respectively. These qmax values were around
three times more than that of aerobically grown E. coli and are
higher than those of many previously studied biosorbents,
indicating a potential biosorption of both heavy metals by the
waste E. coli biomass. The FTIR spectrum of the waste biomass
of E. coli after hydrogen production showed an appearance of
strong peaks for the amine groups and an increase in the
intensity of many other functional groups in comparison to
that of aerobically grown E. coli which might explain the
higher biosorption capacity for Cd2þ or Zn2þ by the waste
biomass of E. coli after hydrogen production than aerobically
grown E. coli. The use of the waste bacterial biomass in heavy
metals biosorption would make the biotechnology of heavy
metals biosorption by heterotrophic bacteria inexpensive and
duplicates the benefits of biological hydrogen production
technology. Further future studies, for exploring the efficiency
of the waste biomass of other dark fermentative and also
photofermentative hydrogen producing bacteria in bio-
sorption technology, would be of interest to interlink such
biotechnologies.
Acknowledgments
Sincere thanks to Professor Dr. L.E. Macaskie and Dr. Mark
Redwood (School of Biosciences, University of Birmingham,
Edgbaston, Birmingham, UK) for kindly providing E. coli
HD701.
Appendix. Supplementary data
Supplementary data associated with this article can be found,
in the online version, at doi:10.1016/j.ijhydene.2011.07.121.
r e f e r e n c e s
[1] Muradov NZ, Veziro�glu TN. “Green” path from fossil-based tohydrogen economy: an overview of carbon-neutraltechnologies. Int J Hydrogen Energy 2008;33:6804e39.
[2] Kırtay E. Recent advances in production of hydrogen frombiomass. Ener Conver Manag 2011;52:1778e89.
[3] Kotay SM, Das D. Biohydrogen as a renewable energyresourcedprospects and potentials. Int J Hydrogen Energy2008;33:258e63.
[4] Momirlan M, Veziroglu TN. The properties of hydrogen asfuel tomorrow in sustainable energy system for a cleanerplanet. Int J Hydrogen Energy 2005;30:795e802.
[5] Das D, Veziroglu TN. Hydrogen production by biologicalprocesses: a survey of literature. Int J Hydrogen Energy 2001;26:13e28.
[6] Balat M, Balat M. Political, economic and environmentalimpacts of biomass-based hydrogen. Int J Hydrogen Energy2009;34:3589e603.
[7] Balat H, Kırtay E. Hydrogen from biomass-present scenarioand future prospects. Int J Hydrogen Energy 2010;35:7416e26.
[8] Guo XM, Trably E, Latrille E, Carrere H, Steyer JP. Hydrogenproduction from agricultural waste by dark fermentation:a review. Int J Hydrogen Energy 2010;35(19):10660e73.
[9] Su H, Cheng J, Zhou J, Song W, Cen K. Combination of dark-and photo-fermentation to enhance hydrogen productionand energy conversion efficiency. Int J Hydrogen Energy2009;21:8846e53.
[10] Wang JL, WanW. Factors influencing fermentative hydrogenproduction: a review. Int JHydrogenEnergy2009;34(2):799e811.
[11] Das D, Veziroglu TN. Advances in biological hydrogenproduction processes. Int J Hydrogen Energy 2008;33:6046e57.
[12] Levin DB, Pitt L, Love M. Biohydrogen production: prospectsand limitations to practical application. Int J HydrogenEnergy 2004;29:173e85.
[13] Hallenbeck P, Benemann JR. Biological hydrogen production:fundamentals and limiting processes. Int J Hydrogen Energy2002;27:1185e94.
[14] Hawkes FR, Dinsdale R, Hawkes DL, Hussy I. Sustainablefermentative hydrogen production: challenges for processoptimization. Int J Hydrogen Energy 2002;27:1339e47.
[15] Kratochvil D, Volesky B. Advances in the biosorption ofheavy metals. Trends Biotechnol 1998;16:291e300.
[16] Volesky B. Advances in biosorption of metals: selection ofbiomass types. FEMS Microbiol Rev 1994;14:291e302.
[17] Volesky B, Holan ZR. Biosorption of heavy metals. BiotechnolProg 1995;11:235e50.
[18] Karna RR, Uma L, Subramanian G, Maruthi Mohan P.Biosorption of toxic metal ions by alkali-extracted biomass ofa marine cyanobacterium, Phormidium valderianum BDU30501. World J Microbiol Biotechnol 1999;15:729e32.
[19] Volesky B. Detoxification of metal-bearing effluents: biosorption for the next century. Hydrometallurgy 2001;59:203e16.
[20] Gabr RM, Hassan SHA, Shoreit AAM. Biosorption of lead andnickel by living and non-living cells of Pseudomonasaeruginosa ASU 6a. Int Biodeter Biodeg 2008;62:195e203.
[21] Kumar PA, Chakraborty S, Ray M. Removal and recovery ofchromium from wastewater using short chain polyanilinesynthesized on jute fiber. Chem Engineer J 2008;141:130e40.
[22] Gabr RM, Gad-Elrab SMF, Abskharon RNN, Hassan SHA,Shoreit AAM. Biosorption of hexavalent chromium usingbiofilm of E. coli supported on granulated activated carbon.World J Microbiol Biotechnol 2009;25:1695e703.
[23] Hassan SHA, Kim SJ, Jung AY, Joo JH, Oh SE, Yang JE.Biosorptive capacity of Cd(II) and Cu(II) by lyophilized cells ofPseudomonas stutzeri. J Gen Appl Microbiol 2009;55:27e34.
[24] Oh SE, Hassan SHA, Joo JH. Biosorption of heavy metals bylyophilized cells of Pseudomonas stutzeri. World J MicrobiolBiotechnol 2009;25:1771e8.
[25] De Philippis R, Sili C, Paperi R, Vincenzini M.Exopolysaccharide-producing cyanobacteria and theirpossible exploitation: a review. J Appl Phycol 2001;13:293e9.
[26] Anjana K, Kaushik A, Kiran B, Nisha R. Biosorption of Cr(VI)by immobilized biomass of two indigenous strains ofcyanobacteria isolated from metal contaminated soil. JHazard Mater 2007;148:383e6.
[27] Gupta VK, Rastogi A. Sorption and desorption studies ofchromium(VI) from nonviable cyanobacterium Nostocmuscorum biomass. J Hazard Mater 2008;154:347e54.
[28] Rosales-Colunga LM, Garcıa RG, De Leon Rodrıguez A.Estimation of hydrogen production in genetically modified E.coli fermentations using an artificial neural network. Int JHydrogen Energy 2010;35:13186e92.
[29] Rosales-Colunga LM, Razo-Flores E, Ordonez LG, Alatriste-Mondragon F, De Leon-Rodrıguez A. Hydrogen production byEscherichia coli DhycA DlacI using cheese whey as substrate.Int J Hydrogen Energy 2010;35:491e9.

i n t e r n a t i o n a l j o u r n a l o f h y d r o g e n en e r g y 3 6 ( 2 0 1 1 ) 1 4 3 8 1e1 4 3 9 0 14389
[30] Ghosh D, Hallenbeck PC. Fermentative hydrogen yields fromdifferent sugars by batch cultures of metabolicallyengineered Escherichia coli DJT135. Int J Hydrogen Energy2009;34:7979e82.
[31] Kim S, Seol E, Oh Y-K, Wang GY, Park S. Hydrogen productionand metabolic flux analysis of metabolically engineeredEscherichia coli strains. Int J Hydrogen Energy 2009;34:7417e27.
[32] Seol E, Kim S, Raj SM, Park S. Comparison of hydrogen-production capability of four different Enterobacteriaceaestrains under growing and non-growing conditions. Int JHydrogen Energy 2008;33:5169e75.
[33] Turcot J, Bisaillon A, Hallenbeck PC. Hydrogen production bycontinuous cultures of Escherchia coli under different nutrientregimes. Int J Hydrogen Energy 2008;33:1465e70.
[34] Bisaillon A, Turcot J, Hallenbeck PC. The effect of nutrientlimitation on hydrogen production by batch cultures ofEscherichia coli. Int J Hydrogen Energy 2006;31:1504e8.
[35] Sauter M, Bohm R, Bock A. Mutational analysis of the operon(hyc) determining hydrogenase 3 formation in Escherichia coli.Mol Microbiol 1992;6:1523e32.
[36] Penfold DW, Forster CF, Macaskie LE. Increased hydrogenproduction by Escherichia coli strain HD701 in comparisonwith the wild-type parent strain MC4100. Enz MicrobTechnol 2003;33:185e9.
[37] NelsonN.Aphotometricadaptationof theSomogyimethodforthe determination of glucose. J Bioll Chem 1944;153:375e80.
[38] Kratochvil D, Fourest E, Volesky B. Biosorption of copper bySargassum fluitans biomass in fixed-bed column. BiotechnolLett 1995;17:777e82.
[39] Volesky B. Biosorption process simulation tools. Hydrometall2003;71:179e90.
[40] Ho YS, McKay G. The sorption of lead(II) ions on peat. WaterRes 1999;33:578e84.
[41] Tsunekawa H, Azuma S, Okabe M, Okamoto R, Aiba S.Acquisition of a sucrose utilization system in Escherichia coliK-12 derivatives and its application to industry. Appl EnvironMicrobiol 1992;58:2081e8.
[42] Redwood MD, Penfold DW, Yong P, Macaskie LE. A two-stageprocess for biohydrogen from glucose. In: ProceedingsInternational Hydrogen Energy Congress and ExhibitionIHEC; July 13e15, 2005. Istanbul, Turkey.
[43] Redwood MD, Macaskie LE. A two-stage, two-organismprocess for biohydrogen from glucose. Int J Hydrogen Energy2006;31:1514e21.
[44] Quintelas C, Rocha Z, Silva B, Fonseca B, Figueiredo H,Tavares T. Removal of Cd(II), Cr(VI), Fe(III) and Ni(II) fromaqueous solutions by an E. coli biofilm supported on kaolin.Chem Engineer J 2009;149:319e24.
[45] Horsfall Jr M, Spiff AI. Adsorption of transition metals inaqueous solutions by fluted pumpkin (Telfairia occidentalisHook f) waste. Chem Biodivers 2005;2:1266e76.
[46] Sar P, Kazy SK, Asthana RK, Singh SP. Metal adsorption anddesorption by lyophilized Pseudomonas aeruginosa. IntBiodeter Biodeg 1999;44:101e10.
[47] Hassan SHA, Abskharon RNN. Gad El-Rab SMF, Shoreit AAM.Isolation, characterization of heavy metal resistant strain ofPseudomonas aeruginosa isolated from polluted sites in Assiutcity, Egypt. J Basic Microbiol 2008;48:168e76.
[48] Filipovic-Kovacevic Z, Sipos L, Briski F. Biosorption ofchromium, copper, nickel and zinc ions onto fungal pellets ofAspergillus niger 405 from aqueous solutions. Food TechnolBiotechnol 2000;38:211e6.
[49] Puranik PR, Paknikar KM. Biosorption of lead, cadmium, andzinc by Citrobacter strain MCM B-181: characterizationstudies. Biotechnol Prog 1999;15:228e37.
[50] Romera E, Gonzalez F, Ballester A, Blazquez ML, Munoz JA.Comparative study of biosorption of heavy metals
using different types of algae. Bioresour Technol 2007;98:3344e53.
[51] Sheng PX, Ting Y-P, Chen JP, Hong L. Sorption of lead, copper,cadmium, zinc, and nickel by marine algal biomass:characterization of biosorptive capacity and investigation ofmechanisms. J Colloid Interface Sci 2004;275:131e41.
[52] NiuH,XuXS,Wang JH.Removalof lead fromaqueoussolutionsby Penicillium biomass. Biotechnol Bioeng 1993;42:785e7.
[53] Fan T, Liu Y, Feng B, Zeng G, Yang C, Zhou M, et al.Biosorption of cadmium(II), zinc(II) and lead(II) by Penicilliumsimplicissimum: isotherms, kinetics and thermodynamics. JHazard Mater 2008;160:655e61.
[54] Perez Silva RM, Abalos Rodrıguez A. Gomez Montes De OcaJM, Cantero Moreno D. Biosorption of chromium, copper,manganese and zinc by Pseudomonas aeruginosa AT18 isolatedfrom a site contaminated with petroleum. Bioresour Technol2009;100:1533e8.
[55] Chen XC, Wang YP, Lin Q, Shi JY, Wu WX, Chen YX.Biosorption of copper(II) and zinc(II) from aqueous solutionby Pseudomonas putida CZ1. Colloids Surf B Biointerfaces 2005;46:101e7.
[56] Cabral JPS. Selective binding of metal ions to Pseudomonassyringae cells. Microbios 1992;71:47e53.
[57] Zhang L, Zha L, Yu Y, Chen C. Removal of lead from aqueoussolution by non-living Rhizopus nigricans. Water Res 1998;32:1437e44.
[58] Mameri N, Boudries N, Addour L, Belhocine D, Lounici H,Grib H, et al. Batch zinc biosorption by a bacterial nonlivingStreptomyces rimosus biomass. Water Res 1999;33:1347e54.
[59] Celaya RJ, Noriega JA, Yeomans JH, Ortega LJ, Ruiz-Manriquez A. Biosorption of Zn(II) by Thiobacillus ferrooxidans.Bioproc Biosys Engineer 2000;22:539e42.
[60] Kao W-C, Huang C-C, Chang J-S. Biosorption of nickel,chromium and zinc by MerP-expressing recombinantEscherichia coli. J Hazard Mater 2008;158:100e6.
[61] Gupta VK, Rastogi A. Equilibrium and kinetic modeling ofcadmium(II) biosorption by nonliving algal biomassOedogonium sp. from aqueous phase. J Colloid Interface Sci2008;153:759e66.
[62] Holan ZR, Volesky B. Accumulation of cadmium, lead andnickel by fungal and wood biosorbents. Appl BiochemBiotechnol 1995;53:133e46.
[63] Galun M, Galun E, Siegel BZ, Keller P, Lehr H, Siegel SM.Removal of metal ions from aqueous solutions by Penicilliumbiomass: kinetic and uptake parameters. Water Air Soil Poll1987;33:359e71.
[64] Gabriel J, Vosahlo J, Baldrian P. Biosorption of Cadmium tomycelial pellets of wood rotting fungi. Biotechnol Techniq1996;10:345e8.
[65] Yu CL, Lu ZP, Ge FZ, Zhao EL. Biosorption of cadmium ontoPseudomonas fluorescens: application of isotherm and kineticmodels. Advan Mater Res 2011;171e172:49e52.
[66] Vullo DL, Ceretti HM, Daniel MA, Ramırez SAM, Zalts A.Cadmium, zinc and copper biosorption mediated byPseudomonas veronii 2E. Bioresour Technol 2008;99:5574e81.
[67] Volesky B. Removal of heavy metals by biosorption. In:Ladisch MR, Bose A, editors. Harnessing Biotechnology forthe 21st Century. Washington, D.C: American ChemicalSociety; 1992.
[68] Mattuschka B, Straube G. Biosorption of metals by a wastebiomass. J Chem Technol Biotechnol 1993;58:57e63.
[69] Dang VBH, Doan HD, Dang-Vu T, Lohi A. Equilibrium andkinetics of biosorption of cadmium(II) and copper(II) ions bywheat straw. Bioresour Technol 2009;100:211e9.
[70] Lu W-B, Shi J-J, Wang C-H, Chang J-S. Biosorption of lead,copper and cadmium by an indigenous isolate Enterobactersp. J1 possessing high heavy-metal resistance. J HazardMater 2006;134:80e6.
i n t e rn a t i o n a l j o u r n a l o f h y d r o g e n en e r g y 3 6 ( 2 0 1 1 ) 1 4 3 8 1e1 4 3 9 014390
[71] Ansari MI, Malik A. Biosorption of nickel and cadmium bymetal resistant bacterial isolates from agricultural soilirrigated with industrial wastewater. Bioresour Technol 2007;98:3149e53.
[72] Deng X, Yi XE, Liu G. Cadmium removal from aqueoussolution by gene-modified Escherichia coli JM109. J HazardMater B 2007;139:340e4.
[73] Kao W-C, Wu J-Y, Chang C-C, Chang J-S. Cadmiumbiosorption by polyvinyl alcohol immobilized recombinantEscherichia coli. J Hazard Mater 2009;169:651e8.
[74] Basha S, Murthy ZVP, Jha B. Sorption of Hg(II) from aqueoussolutions onto Carica papaya: application of isotherms. IndustEng Chem Res 2008;47:980e6.
[75] Ahluwalia SS, Goyal D. Removal of heavy metals by wastetea leaves from aqueous solution. Eng Life Sci 2005;5(2):158e62.
[76] Tunali S, Abuk AC, Akar T. Removal of lead and copper ionsfrom aqueous solutions by bacterial strain isolated from soil.Chem Eng J 2006;115:203e11.
[77] Park D, Yun Y-S, Park JM. Studies on hexavalent chromiumbiosorption by chemically-treated biomass of Ecklonia sp.Chemosphere 2005;60:1356e64.
[78] Kazy S, Das SK, Sar P. Lanthanum biosorption bya Pseudomonas sp.: equilibrium studies and chemicalcharacterization. J Ind Microbiol Biotechnol 2006;33:773e83.
[79] Pistorius A. Biochemical applications of FT-IR spectroscopy.Spectrosc 1995;7:8e15. Europe.
[80] Pradhan S, Singh S, Rai LC. Characterization of variousfunctional groups present in the capsule of Microcystis andstudy of their role in biosorption of Fe, Ni and Cr. BioresourTechnol 2007;98:595e601.
[81] Volesky B. Biosorption and me. Water Res 2007;41:4017e29.
Copyright © 2022 FDOKUMEN