DESIGN AND DEVELOPMENT LIQUID HYDROGEN MIXER ...
183
- 3 NASA CR-120963 Final Report DESIGN AND DEVELOPMENT LIQUID HYDROGEN MIXER UNIT By Robert W. Morgw* Kenneth Wuertz \^ Robert R. Rudich Distribution of this report is provided in the interest of information exchange. Responsibility for the contents resides in the author or organization that prepared it. Prepared under Contract No. NAS 3-11208 by AiResearch Manufacturing Company Torrance, California for NATIONAL AERONAUTICS AND SPACE ADMINISTRATION National Aeronautics and Space Administration LE
-
Upload
khangminh22 -
Category
Documents
-
view
0 -
download
0
Transcript of DESIGN AND DEVELOPMENT LIQUID HYDROGEN MIXER ...
- 3NASA CR-120963
Final Report
DESIGN AND DEVELOPMENTLIQUID HYDROGEN MIXER UNIT
ByRobert W. Morgw*Kenneth Wuertz \^Robert R. Rudich
Distribution of this report is provided in the interest ofinformation exchange. Responsibility for the contentsresides in the author or organization that prepared it.
Prepared under Contract No. NAS 3-11208
byAiResearch Manufacturing Company
Torrance, California
for
NATIONAL AERONAUTICS AND SPACE ADMINISTRATION
National Aeronautics and Space Administration
LE
NASA CR-120963
Final Report
DESIGN AND DEVELOPMENTLIQUID HYDROGEN MIXER UNIT
ByRobert W. MorganKenneth WuertzRobert R. Rudich
Distribution of this report is provided in the interest ofinformation exchange. Responsibility for the contentsresides in the author or organization that prepared it.
Prepared under Contract No. NAS 3-11208
byAiResearch Manufacturing Company
Torrance, California
for
NATIONAL AERONAUTICS AND SPACE ADMINISTRATION
National Aeronautics and Space Administration

CONTENTS
Section - Page
1 Summary I-I
2 Introduction 2-1
3 Symbols 3-1
4 Design and development of l i q u i d hydrogen mixer unit 4-1
General 4-1
Design analyses 4-1
Philosophy 4-1
Mechanical design 4-2
Electrical motor 4-13
Electronic motor control module principles ofoperation 4-18
Posit ion sensor development 4-25
Circuit diagram 4-44
Development testing 4-44
Fabrication 4-50
Evaluation 4-54
5 Conclusions 5-1
6 Recommendations 6-1
Appendix A Evaluation testing A-l
Appendix B Evaluation test procedure B-l
Appendix C Failure analysis C-l
Appendix D Bearing report D-l
i i i
FINAL REPORT ON DESIGN ANDDEVELOPMENT OF A LIQUID
HYDROGEN MIXER UNIT
By R. W. Morgan, K. Wuertz,and R. R. Rudich
SECTION 1SUMMARY
A dc brushless motor driven "mixer unit" (a vaneaxial fan) was designedand evaluated for use in cryogenic fluids (liquids and gases). It was foundto operate well in all fluids in which it was tested. The test fluids werel i q u i d and gaseous helium, hydrogen in the l i q u i d phase gas phase and mixturesof the two phases, and l i q u i d nitrogen. It operated for over 100 hr at cryo-genic temperatures without damage to the bearings and at the conclusion oftesting the condition of .the bearings was such that an operational life of5000 hr appeared possible.
The unit demonstrated that (with the brushless dc motor principle) usefulpumping of cryogenic fluids could be accomplished with very small power inputsto the mixer motor. During test, the motor input power varied from approxi-mately 0.5 W to 2.5 W, depending on f l u i d density. The high power input pro-duced a mixer efficiency of over 49 percent. In an earlier program (see NASAReport CR-72365.) , a mixer using an ac induction motor demonstrated an efficiencyof 17.7 percent under the same conditions, illustrating the advantage of the dcbrushless motor driven unit.
The mixer also demonstrated its a b i l i t y to automatically vary speed as afunction of the density of the fluid being pumped. This causes the unit todeliver higher volumetric flow rates as fluid density decreases.
1-1

SECTION 2INTRODUCTION
Contract No. NAS 3-11208 was awarded bv the NASA Lewis Research Center todevelop a prototype dc brushless motor driven cryogenic mixer unit for instal-lation in l i q u i d hydrogen (LHL) tanks of long duration space vehicles. The
contract specified a unit to operate from 28 +2 Vdc power with a shaft powernot to exceed 3 W in l i q u i d hydrogen and with a maximum starting time of 500msec in LI-L. It was also specified that the unit was to have 5000 hours of
operation as a design goal and was to operate in LH? , gaseous helium (GHe) , and
gaseous hydrogen (GFL) or mixtures of these fluids.
The fluid pumping characteristics specified were:
Liquid hydrogen
Flow rate: 1320 Ib (600 kg) per hr at a pressure riseof 2 in. H20 (I»g8 N/m2)
Gaseous helium: 57.*» Ib (26.1 kg) per hr at a pressurerise of 0.2 in. H20 (A9.8 N/m2)
The program to accomplish these objectives was divided into the followingtasks:
Design and development
Fabricat ion
Testing
Data evaluation
Three engineering disciplines also made major contributions to identifiableportions of the unit:
Medianica1—The basic fan, including fluid dynamics
Electrical—The motor
Electronics—The motor control module
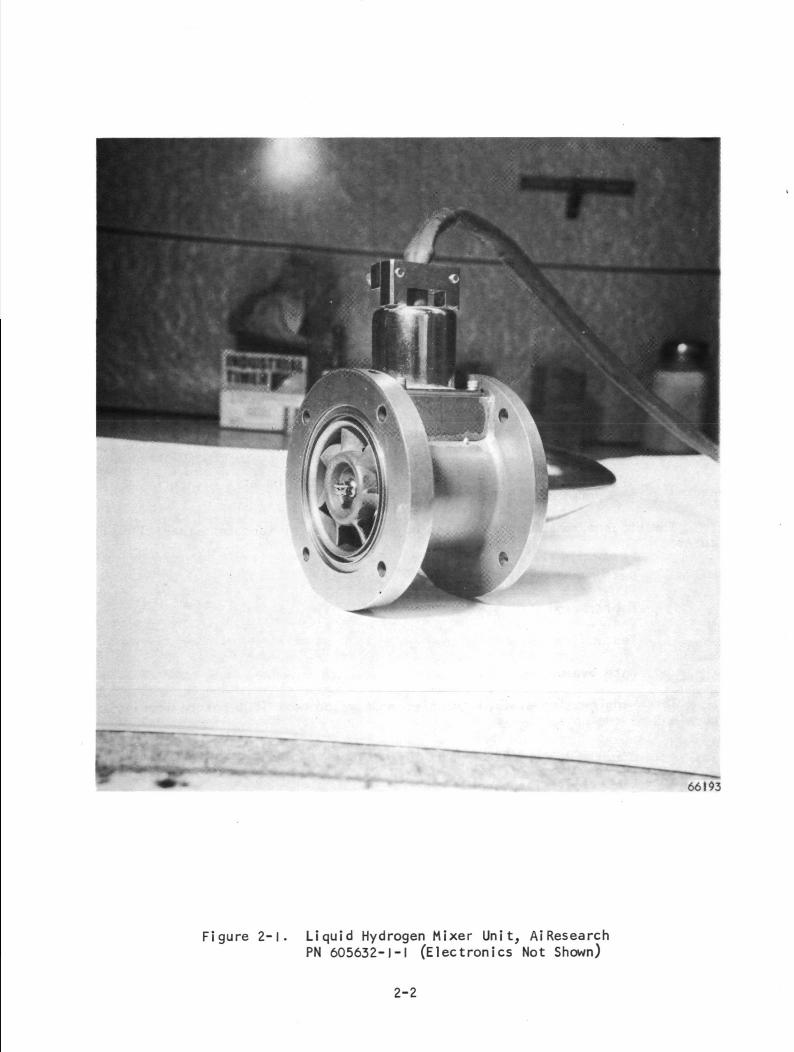
This report attempts to separate these tasks, disciplines, and major compo-nents to the extent possible to achieve order. Figure 2-1 is a photograph ofthe mixer unit produced.
2-1
66193
Figure 2-1. Liquid Hydrogen Mixer Unit, AiResearchPN 605632-1-1 (Electronics Not Shown)
2-2
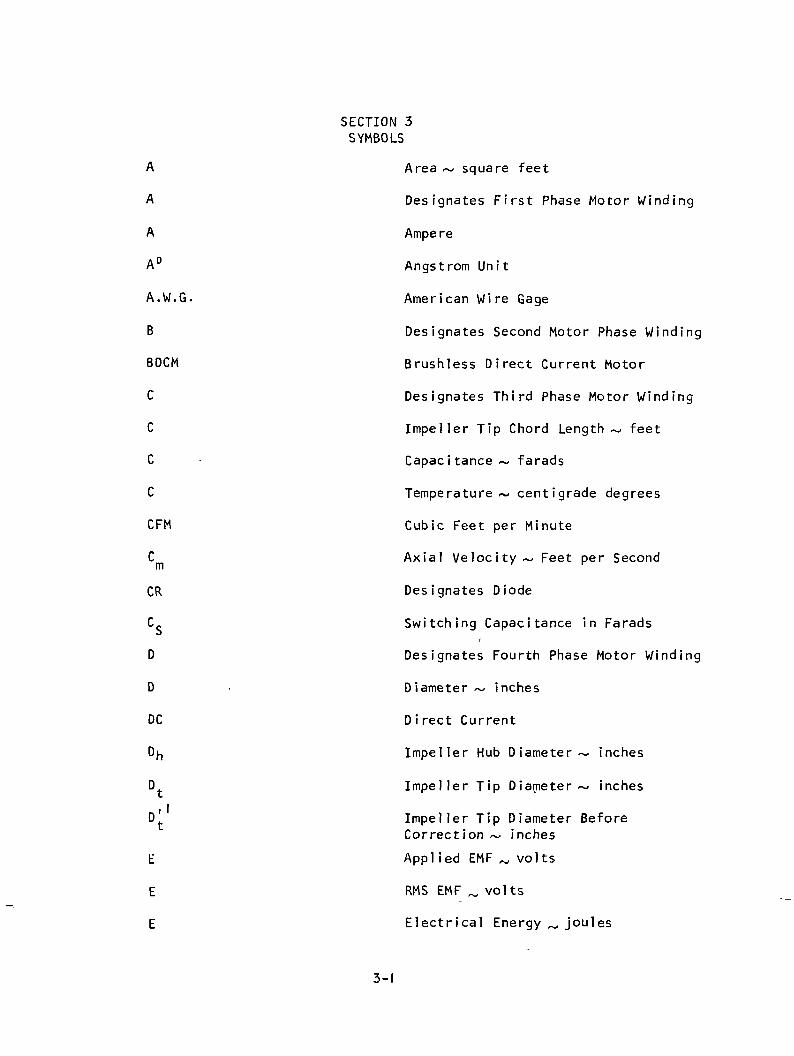
SECTION 3SYMBOLS
A Area ~ square feet
A Designates First Phase Motor Winding
A Ampere
A° Angstrom Unit
A.W.G. American Wire Gage
B Designates Second Motor Phase Winding
BDCM Brushless Direct Current Motor
C Designates Third Phase Motor Winding
C Impeller Tip Chord Length ~ feet
C - Capacitance ~ farads
C Temperature ~ centigrade degrees
CFM Cubic Feet per Minute
C Axial Velocity ~ Feet per Second
CR Designates Diode
C_ Switching Capacitance in FaradsI
D Designates Fourth Phase Motor Winding
D . Diameter ~ inches
DC Direct Current
Dn Impeller Hub Diameter ~ inches
D Impeller Tip Diameter ~ inches
D' Impeller Tip Diameter BeforeCorrection ~ inches
E Applied EMF volts
E RMS EMF _ volts
E Electrical Energy ^ joules
3-1
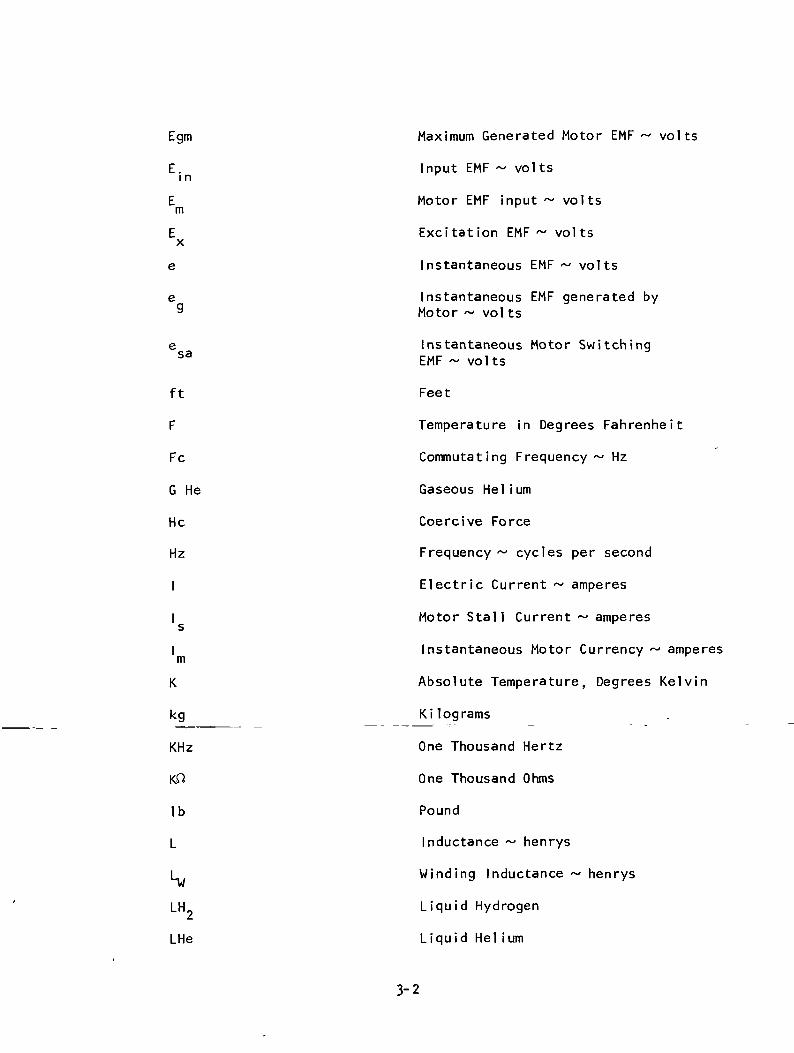
Egm Maximum Generated Motor EMF ~ volts
E. Input EMF ~ voltsin
E Motor EMF input ~ voltsm
E Excitation EMF ~ voltsx
e Instantaneous EMF ~ volts
e Instantaneous EMF generated by9 Motor ~ volts
e Instantaneous Motor Switchingsa EMF ~ volts
ft Feet
F Temperature in Degrees Fahrenheit
Fc Commutating Frequency ~ Hz
G He Gaseous Helium
He Coercive Force
Hz Frequency ~ cycles per second
I Electric Current ~ amperes
I Motor Stall Current ~ amperes
I Instantaneous Motor Currency ~ amperesm
K Absolute Temperature, Degrees Kelvin
kg Kilograms
KHz One Thousand Hertz
Kfi One Thousand Ohms
lb Pound
L Inductance ~ henrys
L, Winding Inductance ~ henrys
\_\\ L i quid Hydrogen
LHe Liquid Helium
3-2
M
min
m
mh
N
N
Ncorr
RN
P
P
PSIA
PU
Pv
PWR
PWR.r
PWR
PWRf
Q
Q
shaft
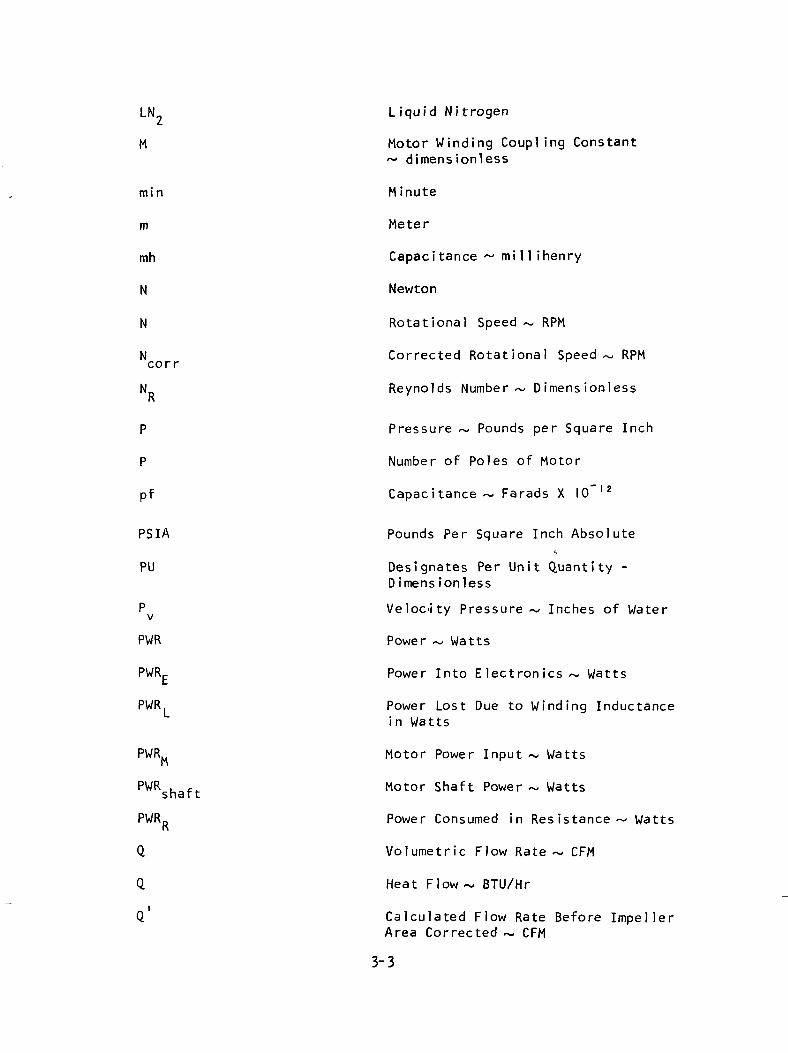
L iquid Nitrogen
Motor Winding Coupling Constant~ dimensionless
Minute
Meter
Capacitance ~ millihenry
Newton
Rotational Speed ~ RPM
Corrected Rotational Speed ~ RPM
Reynolds Number ~ Dimensionless
Pressure ~ Pounds per Square Inch
Number of Poles of Motor
Capacitance ~ Farads X 10 l2
Pounds Per Square Inch Absolutef,
Designates Per Unit Quantity -D imens ionless
Velocity Pressure ~ Inches of Water
Power ~ Watts
Power Into Electronics ~ Watts
Power Lost Due to Winding Inductancein Watts
Motor Power Input ~ Watts
Motor Shaft Power ~ Watts
Power Consumed in Resistance— Watts
Volumetric Flow Rate ~ CFM
Heat Flow ~ BTU/Hr
Calculated Flow Rate Before ImpellerArea Corrected ~ CFM
3-3
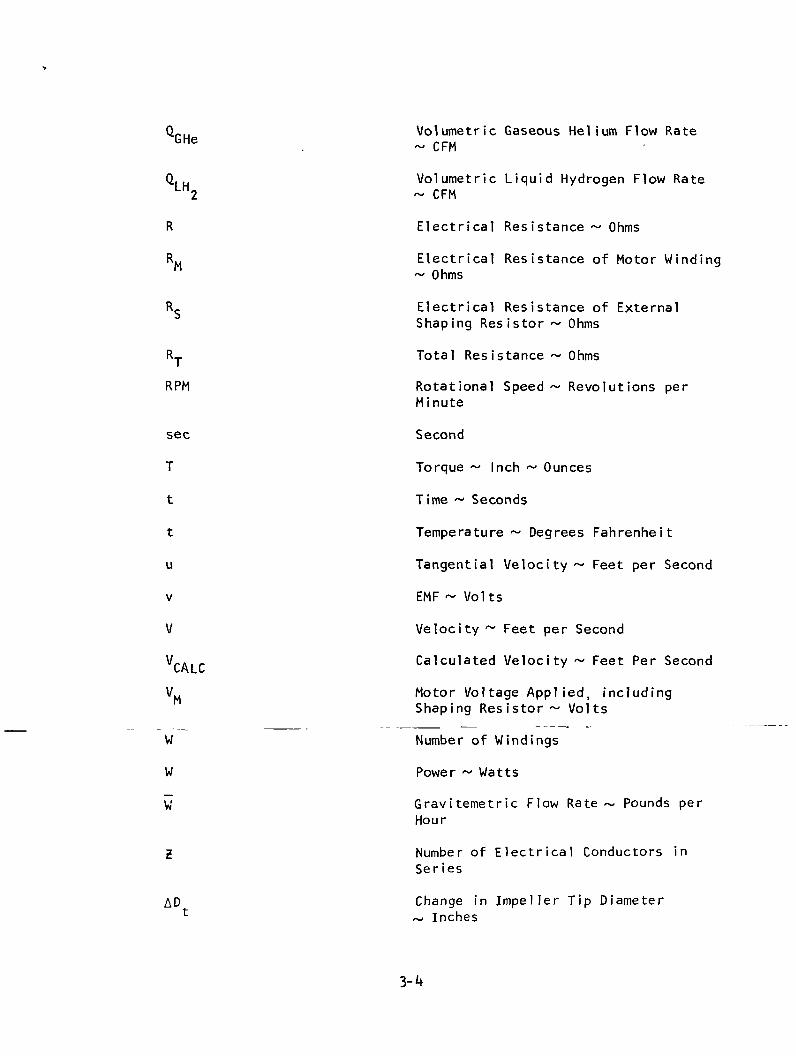
Q.,L1 Volumetric Gaseous Helium Flow RateGHe , ~ CFM
Q. H Volumetric Liquid Hydrogen Flow RateM2 ~ CFM
R Electrical Resistance ~ Ohms
RM Electrical Resistance of Motor Winding~ Ohms
RS Electrical Resistance of ExternalShaping Resistor ~ Ohms
RT Total Resistance ~ Ohms
RPM Rotational Speed ~ Revolutions perMinute
sec Second
T Torque ~ Inch ~ Ounces
t Time ~ Seconds
t Temperature ~ Degrees Fahrenheit
u Tangential Velocity ~ Feet per Second
v EMF ~ Volts
V Velocity ~ Feet per Second
V_. Calculated Velocity ~ Feet Per Second
VM Motor Voltage Applied, includingShaping Resistor ~ Volts
W Number of Windings
W Power ~ Watts
W Gravitemetric Flow Rate ~ Pounds perHour
Z Number of Electrical Conductors inSeries
AD Change in Impeller Tip Diameter*• ~ Inches
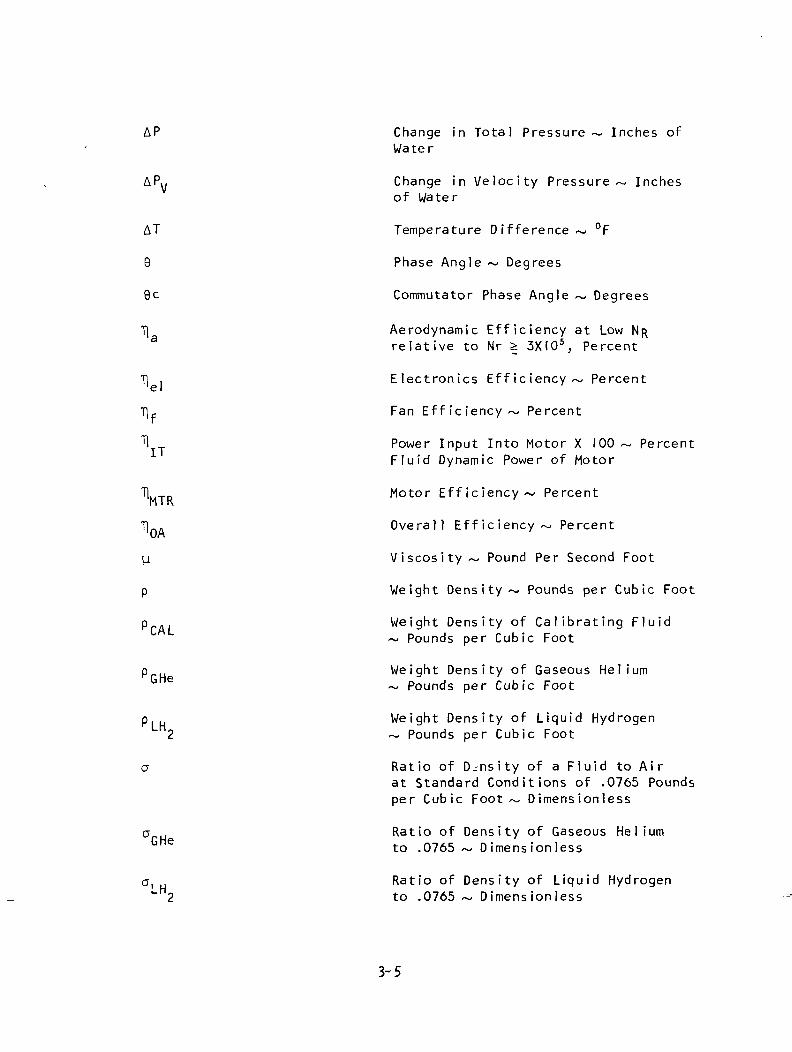
AP Change in Total Pressure ~ Inches ofWater
APy Change in Ve loc i t y Pressure ~ Inchesof Water
AT Temperature Difference ~ °F
8 Phase Angle ~ Degrees
9c Commutator Phase Angle ~ Degrees
Tj Aerodynamic Efficiency at Low NRrelative to Nr 3XI05, Percent
T) , Electronics Efficiency ~ Percent
TU Fan Efficiency ~ Percent
fl Power Input Into Motor X 100 ~ PercentFl u i d Dynamic Power of Motor
I] Motor Efficiency ~ Percentn I K
T| . Overall Efficiency ~ Percent
(a Viscosity~ Pound Per Second Foot
p Weight Density ~ Pounds per Cubic Foot
p . Weight Density of Calibrating F l u i d~ Pounds per Cubic Foot
p Weight Density of Gaseous Helium~ Pounds per Cubic Foot
p Weight Density of Liquid Hydrogen2 ~ Pounds per Cubic Foot
a Ratio of Density of a F l u i d to Airat Standard Conditions of .0765 Poundsper Cubic Foot ~ Dimension less
a H Ratio of Density of Gaseous HeliumGHe to .0765 ~ Dimensionless
a, H Ratio of Density of Liquid Hydrogen"2 to .0765 ~ Dimensionless
3-5

0 Magnetic Flux~ Lines
0p Magnetic Flux per Pole ~ Lines
^ Electrical Resistance ~ Ohms
cu Rotational Speed ~ Radians per Second
3-6
SECTION 4DESIGN AND DEVELOPMENT OF LIQUID HYDROGEN MIXER UNIT
General
This program was undertaken by the NASA Lewis Research Center becausecryogens offer high-vehicle performance capa b i l i t y when used as propellants forlong-duration space missions. In u t i l i z i n g cryogens, a problem requiring solu-tion involves the efficient control of tank pressure during zero or low-gravitycoast periods. Heat leak into the propellant tanks results in increased inter-nal pressure, the pressure can be efficiently controlled if only vapor, (i.e.,no l i q u i d ) is vented to space. In a zero or low gravity environment, however,the location of the l i q u i d and vapor phases is uncertain. An approach to tankpressure control, which does not require active or passive fluid phase control,and allows only vapor to be vented to space, has been defined in NASA ReportNo. CR-72365. This concept, a l i q u i d propellant thermal conditioning system,maintains tank pressure control by extracting fluid from the tank, expandingthe f l u i d and then passing the expanded refrigerated f l u i d through a heatexchanger to c h i l l the ullage gas. This causes a reduction in tank pressure;the expanded f l u i d in passing through the heat exchanger, is completely vapo-rized, may be sli g h t l y superheated and is vented overboard. Fluids on theullage side of the heat exchanger must be pumped through the heat exchangerusing a mixer unit. The mixer unit is completely contained within the propel-lant tank, so that all power consumed by the mixer appears in the propellanttank as heat. Consequently, it is important that the power input to the mixerunit be as low as practical to minimize the boil-off, and waste by overboardventing of the propellants
Earlier work on the Apollo program had shown that small power sizes ofbrushless dc motors could be made more efficient than ac induction motors. Thus,the dc brushless-type motor was selected to power the mixer. In the dc brushlessmotor, an electronic control module is necessary to commutate the motor. Thismodule was located outside the tank to remove the heat generated by the ineffi-ciencies of the control module from the propellant tank. This also greatlys i m p l i f i e d circuit component selection and circuit board design and fabrication.
Design Analyses
Philosophy.—There were essentially two (2) design points for the mixerwhose required pressure rises were not related by the first power of f l u i ddensity. This dictated the use of a motor having a speed curve inversely pro-portional to torque, so that the motor would run slowly in l i q u i d hydrogen andmuch faster in gaseous helium. Conventional ac induction motors tend to beconstant speed machines and even "high slip" motors could not be expected tomeet the required speed/torque relationship with the desired accuracy withoutthe incorporation of relatively complex control circuitry.
In a dc motor the establishment of a straight line torque-speedcharacteristic, defined by the two required operating points, is a simple matter.However, the conventional brush-type motor is not suitable for operation in acryogen due to brush wear and brush mechanical problems. Moreover, brush spark-ing is obviously incompatible with an explosive atmosphere. Accordingly, apermanent magnet rotor, brushless dc motor was selected for this application.
The dc brushless motor is s i m i l a r to a dc brush-type motor except that therotor is a permanent magnet field and the stator is commutated. The commutationis accomplished by sensing the position of the rotating field poles and elec-tronically switching the stator windings accordingly. The switching is accom-plished by power transistors which are turned on by the rotor position sensors.Since the position sensors are subjected to the same cryogenic temperatures asthe motor, considerable attention was given to their design.
The i n i t i a l design technique was to determine, the mechanical powers androtational speeds required by the fluid dynamic component at each design condi-tion. The motor was then sized for these conditions with its input power,winding resistance, inductance, number of poles, number of phases, and waveformtype selected. The value of a "shaping resistor" to regulate the speed of themotor as a function of load at the two design points was also considered. Theelectronic motor control module was then designed to match the required motorcharacterist ics.
Mechanical design.--The first step in designing the mixer was to find theshaft power requirements and speed ratio so that the motor could be sized. Todo this, the volumetric flow at each design condition had to be known. The unit
5 2must operate through the range of pressures from 17 psia (1.17 x 10 N/m ) to
5 228 psia (1.93 x 10 N/m ). For saturated l i q u i d , the density change for LH is
only 3-7 percent in this pressure range, so for convenience the LH,. density at5 2
17 psia (l.l? x 10 N/m ) was selected. In addition, the mixer would producer o
the lowest head rise at 17 psia (1.17 x 10 N/m ) in helium. Thus densities for5 2both media at 17 psia (1.17 x 10 N/m ) and saturated LH- temperature were used,
producing the following values:
p.u = 4.38 lb/ft3 (70.1 kg/m3)LH2
PGHe= 0.179 lb/ft3 (2.86 kg/m3)
The LH« volumetric flow rate is then:
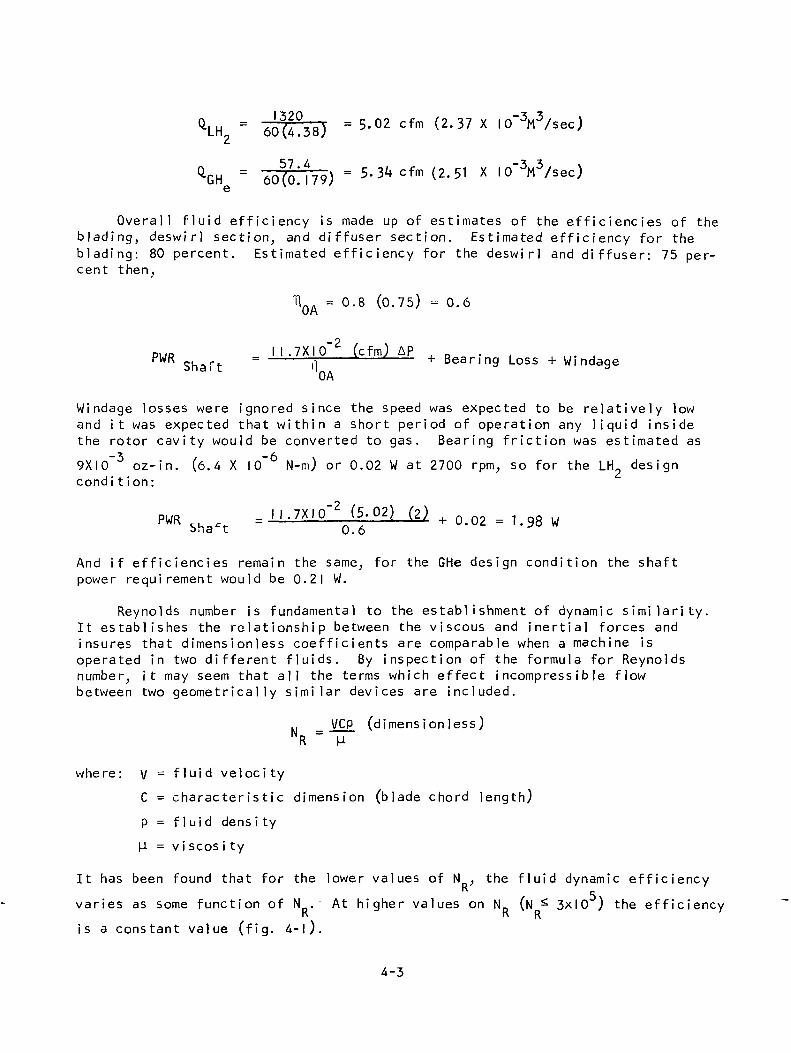
1320 .. ,.o ,. /o -}-i v60(4.38) = 5'°2 Cfm (2'37 X
Overall f l u i d efficiency is made up of estimates of the efficiencies of theblading, deswirl section, and diffuser section. Estimated efficiency for theblading: 80 percent. Estimated efficiency for the deswirl and diffuser: 75 per-cent then,
T1QA = 0.8 (0.75) = 0.6
PI/O I I .7X1 0"2 (cfm) AP , _Shaft = - il - - - Bearing Loss + Windage
OA
Windage losses were ignored since the speed was expected to be relatively lowand it was expected that w i t h i n a short period of operation any l i q u i d insidethe rotor cavity would be converted to gas. Bearing friction was estimated as
9X1 0~3 oz-in. (6.4 X I0~6 N-m) or 0.02 W at 2700 rpm, so for the LH2 designcondi t ion:
PWR .. ., =H.7XIO-2 (5.02) (2) + Q = w
" i 0.6
And if efficiencies remain the same, for the GHe design condition the shaftpower requirement would be 0.21 W.
Reynolds number is fundamental to the establishment of dynamic s i m i l a r i t y .It establishes the relationship between the viscous and inertia] forces andinsures that dimens ionless coefficients are comparable when a machine isoperated in two different fluids. By inspection of the formula for Reynoldsnumber, it may seem that all the terms which effect incompressible flowbetween two geometrically s i m i l a r devices are included.
VCP (dimens ionless)NR ~ H
where: V = f l u i d velocity
C = characteristic dimension (blade chord length)
p = f l u i d dens i ty
H = vi scos i ty
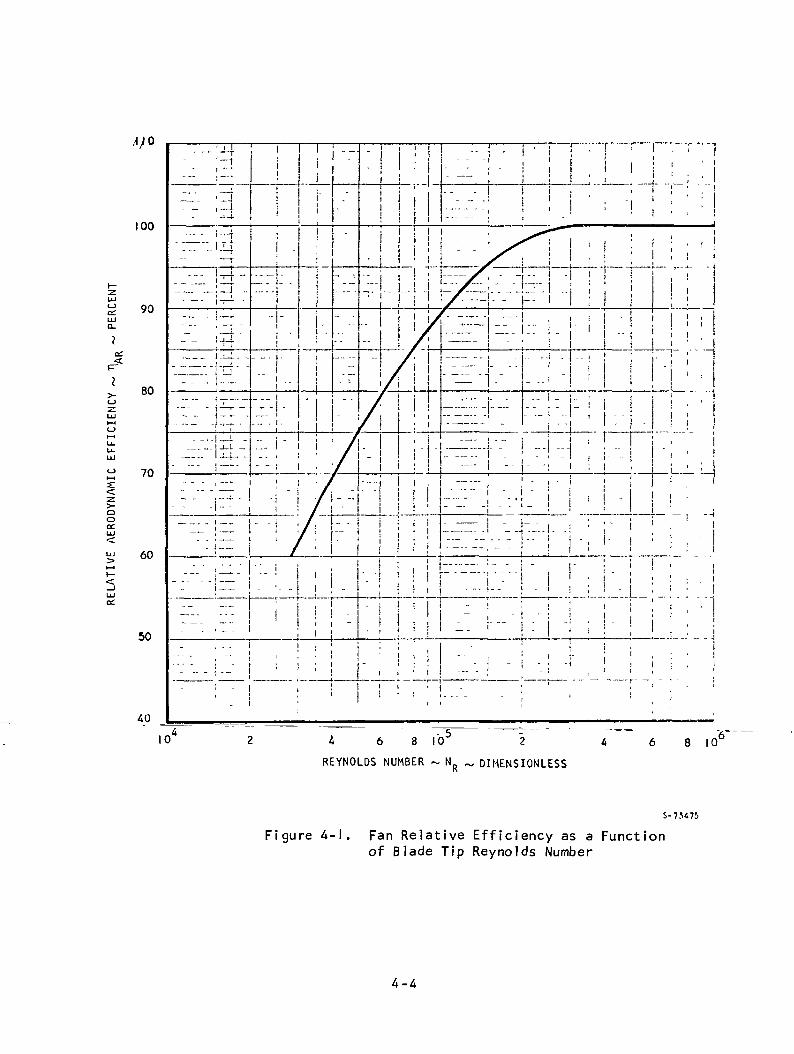
It has been found that for the lower values of N . the fluid dynamic efficiency5varies as some function of'N . At higher values on N (N 3x10 ) the efficiency
R R Ris a constant value (fig. 4- I ) .
4-3
cz.LUO.
>-LJ
Ooa:
10 i 6 8 10
REYNOLDS NUMBER ~ N
8 10
R DIMENSIONLESS
S-73475
Figure 4-1. Fan Relative Efficiency as a Functionof Blade Tip Reynolds Number
4-4
A preliminary analysis indicated that the required motor diameter was_ 2
1.125 in. (2.86 X 10 m). An existing fan impeller was available having a
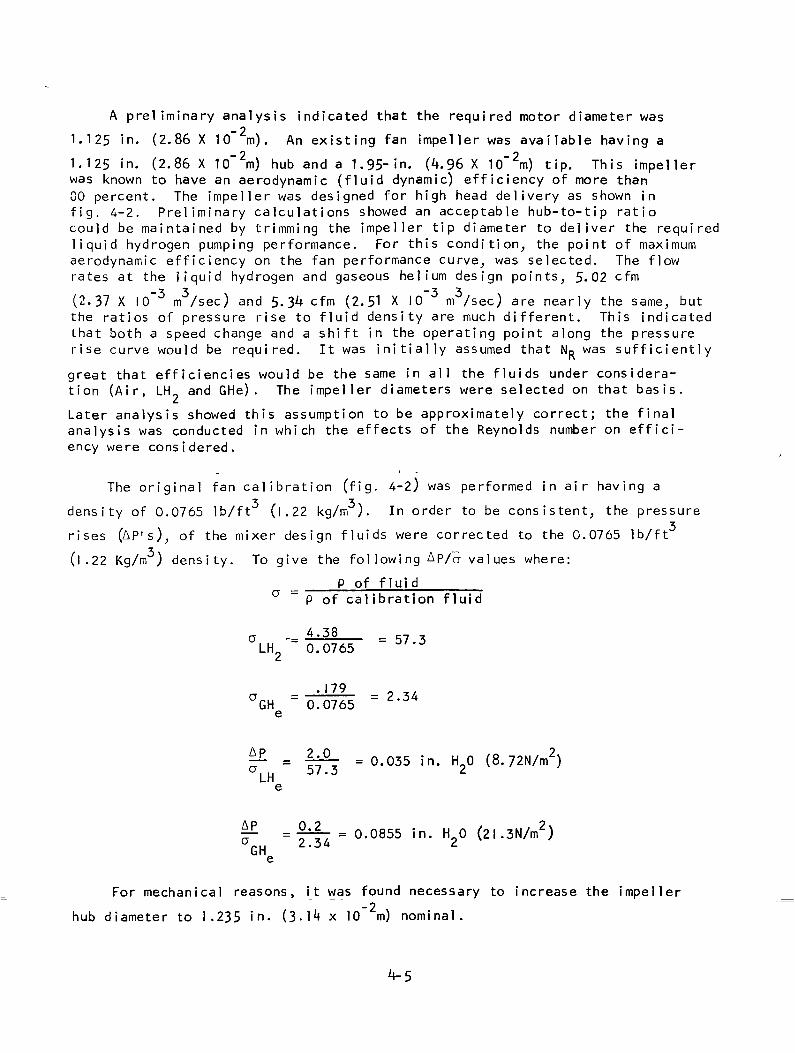
1.125 in. (2.86 X I0"2m) hub and a 1.95-in. (4.96 X 10~2m) tip. This impellerwas known to have an aerodynamic (fluid dynamic) efficiency of more thanGO percent. The impeller was designed for high head delivery as shown infig. 4-2. Preliminary calculations showed an acceptable hub-to-tip ratiocould be maintained by trimming the impeller tip diameter to deliver the requiredl i q u i d hydrogen pumping performance. For this condition, the point of maximumaerodynamic efficiency on the fan performance curve, was selected. The flowrates at the l i q u i d hydrogen and gaseous helium design points, 5-02 cfm
(2.37 X I0~3 m3/sec) and 5-34 cfm (2.51 X Io"3 m3/sec) are nearly the same, butthe ratios of pressure rise to fluid density are much different. This indicatedthat both a speed change and a shift in the operating point along the pressurerise curve would be required. It was i n i t i a l l y assumed that Nn was sufficiently
great that efficiencies would be the same in all the fluids under considera-tion (Air, LH and GHe). The impeller diameters were selected on that basis.
Later analysis showed this assumption to be approximately correct; the finalanalysis was conducted in which the effects of the Reynolds number on effici-ency were considered.
The original fan calibration (fig. 4-2) was performed in air having a
density of 0.0765 Ib/ft (l.22 kg/m ). In order to be consistent, the pressure
rises (AP's), of the mixer design fluids were corrected to the 0.0765 Ib/ft
(l.22 Kg/m ) density. To give the follow!ng Ap/a values where:
P of fluidP of cal ibration f luid
4.380.0765
GH 0.0765e
= 57.3
= 2.34
^ = !=£- =0.035 in. H00 (8.72N/m2)CTLH 57'3 2
e
= 0.0855 in. H00 (21.3N/m )"GHe — 2
For mechanical reasons, it was found necessary to increase the impeller_2
hub diameter to 1.235 in. (3. ]k x 10 m) nominal.
4-5
o
X
2:Q_
(19.84) 8
(17 .36 ) 7
<" (14 .88) 6
UJ
0 ( 1 2 . 4 0 ) 5
C\JI Xo
(9.92)4UJo-
OL >-UJ O ,
( 7 . 4 4 ) 3o
LJ_ i— iO Ll-
uj (4 .96)2
( 2 . 4 8 ) 1LUOLQ-
OI-
I I ' ,I >—L—i L_ 4- -1_-L
10 20 30 40 50 60 70 80(4.72) (9.34) (14.16) (18.88) (23.60) (28.32) (33.04) (37.76)
FLOW RATE ~ CUBIC FT PER MIN (M3/SEC X I03)
Figure 4-2. Performance of a Motor D r i ven fan, PN 207640-9S-73170
4-6
TT ? 2The original flow area (annulus) of the impeller where A= /4 (D - D. ) was:
A = n/4 (I.95"2 - I.I252) = 2.535(n/4) in2 (l.63 x IO~3("/4) m2)
The corrected area is:
A = "/4 (I.952 - I.2352) = 2. 275 /4) in2 (1.467 x IO~3(n/4) m2)
So the f low rates in f ig. 4-2 must be reduced to / 2 - 2 7 5 \ = 0.898 of thoseshown. I2-535)
In selecting the stal l point for operation in GHe the dump loss for the_ O •z
or ig ina l fan was found for 35 cfm (l.65 x 10 m /sec) where:
A (60)
For the annulus:
55 (144)V = JJ * ' = 42.2 ft/sec (12.86 m/sec)
60 (2.535) /4
P = 0.0962 pV2 = 0.0962 (.0765) 42.22
= 0.4 in. H0 (99.5 N/m2)
In the duct:
Pv = 0 .18 in. H20 (44.9 N/m2)
APy = 0.4 - 0 .18 = 0.22 in. HgO (54.7
Therefore, the s ta l l point may be considered as 35 (0.898)= 3 1 . 4 cfm at a stage
A£ = I .95 + 0.22 = 2.17 in. HO (54.1 N/m2)a ^ _ 2
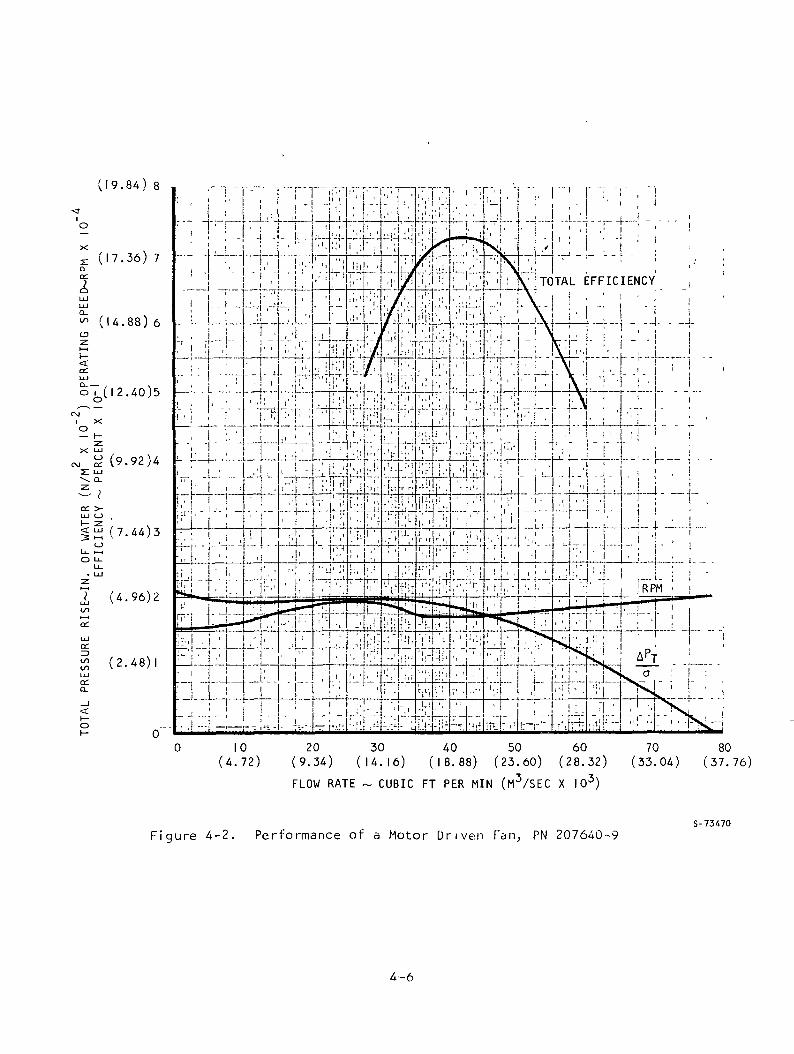
Assuming an impeller tip diameter of I.8 in. (4.57 x 10 m) for the mixer— *)
unit with the mixer discharging to a 1.9 in. (4.83 x 10 m) i.d. duct, thefollowing values were found for the configuration of the mixer shown in fig.4-3.
Motor Annulus Area = 0.01005 ft2 (9-3^x lo"4 m2)
p / oMinimum Annulus Area = 0.0059 ft (5.49 x 10 m )
Duct Cross Sections Area = 0.0197 ft2 (l.83 x I0~3 m2)
4-7
IMPELLER
BEARING
OUTER HOUSING
.MOTOR-HOUSING ANNULUS
MOTOR ROTOR
DESWIRL VANE
POSITION SENSORS
MOTOR STATOR
COMMUTATION DISC
HEADER
Figure 4-3. Cut Away View of Liquid Hydrogen Mixer Unit(Motor Control Electronics Not Shown)
4-8
when Flowing 5.3 cfm (2.49 X I0"3m3/sec)
^ (motor annulus) = 0.016 in. HO (3.98 N/m2)
jp (min. Annulus) = 0.0465 in. HO (11.57 N/m2)
~ (duct) = 0.0042 in. H20 (l.I N/m )
For a 50 percent eff iciency acceleration and deceleration of the f luidthe losses are:
|£ = [0.0465 - 0.016 + 0.0465 - 0.0042]0.5 = 0.035 in. H.O (8-71 N/m2)
AP 9So the stage — = 0.2 + 0.035 = 0.235 in water (58.6 N/m )
1/2
/0.235 (D \\2 .17 (2.34)/
1/2= 17,5001 r-^,v;M = 3770 rpm
i M0 = f)
N . xal corrected
0.' = 77^500 ^ 3 I ' 4 ^ = 6'77 cfm (3.2XIO~3m3/sec)
= Aannulus ' impeller corrected
Aannulus = 0 'OI24 = 0'00972 Ft * (6'26 X
Dt' = I .78 in. (4.53 x I0~2m)
Considering thermal contraction:
=12 x IO"6 (l .71) (530-37)
ADt = 0.010 in. (2.54 x lo"Am) •
Dt = |.79 in. (4.55 X I0~2m)
_ oSo the assumed 1.0 in. (4.57 X 10 m) tip diameter is considered sufficientlyaccurate.
The above calculations assume the fan efficiency flowing GHe is identicalwith that flowing air. Fan efficiency is dependent on Reynolds number.Fig. 4-1 is a plot of AiResearch experience using axial flow fans to determinethe effects of ND on relative efficiency. It may be noted that for values
R5
above ND = 3 x 10 . no further increase in efficiency is achieved; the rela-tetive efficiency is 1.00.
The N of the original impeller in air and of the trimmed impeller opera-R
ting in LH and GHe at 37°R (20.5 K) were calculated. For these calculations,f~2 2~
the ve loc i ty was taken as vU + C' m
For GHe with
"0.79)3770720 720
= 29.5 ft/sec (8.99 m/sec)
C™ - S lmp.ll.r ' "%.&# * - '•'* «/•« fc-« m/sac)
then V =/29.52 + 7.I52 = 30.3 ft/sec (9.11 m/sec)
and . »R=^
= 0.85 (30.3) 0.179
12 (2.86) I0"6
= 1.35 X 10⁵/
If we assume that for LH0, N = 2700 rpm, then N = 7.2 x 10² K
For the original fan in Air,, operating at 1 8> 000 rpm N =7.2 xlO
The corresponding relative efficiencies from fig. 4- I are:
Ai r ~ 83 percent
GHe ~ 93 percent
LH ~ 1 00 percent
4-10
4
Due to uncertainties of the properties present in actual operation and thelarge effects of relatively small variations in viscosity, it was decided toignore the efficiency increase in GHe and to take only half the theoreticalvalue for calculating the operating speed in LH? .
In a manner s i m i l a r to that used to obtain the GH operating speed, the
LH operating speed was found to be 2680 rpm, with the operating point corres-2 3
ponding to the 52 cfm (2.45 x 10 M /sec) point of fig. 4-2. The shaft torquerequired to drive the impeller for GHe is
T = I .59 (cfm) AP (lp)2
'II f N
" '^O 685° (3770) 2?g) 1° = 0-073 oz-in. (5.15 X 1(f5N-m)
Bearing torque per Barden Catalog M6 using R-3 bearings, 0.0004 in (1.016 x 10 m)
radial clearance and 3 Ib thrust load is 0.021 oz-in. (1.49 x 1 0" N-m). The
motor torque for operation in GHe is 0.073 + 0.021 « 0. I oz-in. (7 x 1 0~ N-m).S i m i l a r l y the torque for operation in GhL was found to be I.I oz-in. (7.8 x
/ ^10 N-m) considering the effects of dump losses.
In preparing a motor problem statement, it was felt that there was con-siderable confidence in the calculated values for the (LH ) operating point,
but less confidence was felt in the GHe operating point near s t a l l . Thus, aI.I m u l t i p l i e r was used to establish the GHe motor speed and torque designpoints, making the motor speed and torque design points as tabulated below:
Rotational Speed Torque_ rpm _ oz-in. (N-m)
4150 0. I I (7.8 X I0"5)
2680 I.I (7.8 X I0~4)
The mechanical design of the mixer was a straight/forward vane axial flowfan except for the following:
(a) Differential coefficients of thermal expansion in the materialsselected had to be avoided or an allowance made for them.
(b) The physical size was such that very small hardware had to beused, particularly around the position sensors.
(c) The bearings were shielded to minimize the entry of contaminantsand restrict the entry of l i q u i d into the motor rotor chamber.
(d) Normal types of turbomachinery bearing lubrication such as oil andgrease could not be used.
4-1 I
By using stainless steel for the rotor shaft, basic housing, endbells,and bearings, then, as the machine cooled to cryogenic temperatures, all partstended to cool together. A spring was installed to provide a three-poundnominal preload to the bearings. The spring was sized to allow a 400°F(222°C) AT between the shaft and motor housing before the preload springwent solid. This prevented b r i n n e l l i n g of the bearing races by axial loadingas the machine was cooled down. The bearings were fitted to the shaft with
a zero-to-0.0004 in. (l.OIS x 10 m) loose fit. The rear bearing was s l i p
fitted to the endbell with a 0.0008-0.0014 in. (2.03 - 3.55 x I0~ m) clearance.
This coupled with a radial play of 0.0008 to-O.OOII in (2.03 to 2.79 x lo"6m)permitted a temperature increase across the bearing of more than 400°F(222°C). The front bearing was fitted with a resilient mount to permit someuneven shrinkage of the housing without putting b r i n e l l i n g loads on thebearings. The commutator disc on the shaft also had sufficient axial clearanceto not contact the stationary sensors with a 400°F (222°C) AT, shaft to housing
The motor stator was wound with copper wire and used no iron for poles.A laminated iron flux shield was used at the o.d. of the stator in the areaof the rotor magnet. The stator windings has an open weave glass clothinsulation on the i.d. and o.d. The o.d. insulation protected the motorwindings from damage as the flux shield expanded and contracted at a differentrate from the windings. The i.d. insulation served to keep the windings inplace and insure that all windings were held in place by the encapsulant.The motor stator was encapsulated with Stycast 2850 ft compound havingessentially the same coefficient of thermal expansion as the winding magneticwire. Thus, appreciable tensile loading of the very fine No. 39 wire wasavoided. The same encapsulant was also used in the position sensor coils toprevent winding failure.
The impeller was of die cast aluminum insuring ample clearance betweenthe impeller tip and the housing i.d. The clearance per side between impel-ler and housing increased approximately 0.003 in. (7.6 x lO'^m) at l i q u i dhydrogen temperatures. The impeller is connected to the shaft by compressionbetween the shaft nut and bearing inner race at room temperature. With theimpeller rotor and bearings at l i q u i d hydrogen temperature, the rotor shafthas a higher coefficient of thermal expansion that the bearings and shrinks
_more than^the.,bea_rj ng.__ __Ih i s_i ns.ures_tha±-_a-t -1 ow -tempera tu res—the-shaf t- wi H- —s l i d e in the bearings, m i n i m i z i n g problems of uneven thermal expansion. Thismeans that the nut holding the impeller to the shaft moves toward the bearing
approximately 0.00103 in. (2.62 X 10 m) while the impeller hub length
shrinks approximately 0.0009 in. (2.29 x >| 0 m), increasing the force lockingthe impeller to the shaft. When being slugged with l i q u i d hydrogen, it ispossible for the impeller to cool much more rapidly than the shaft. If noother provision were made to lock the impeller to the shaft, it could becomeloose. The impeller bore and shaft tolerances have been selected such thatthe impeller bore shrinks to the shaft, insuring that it stays in place duringcool down. The commutator disc is held in place in the same manner as theimpeller, except it w i l l not be colder that the shaft, so a transient condition
4-12
did not have to be considered. Due to the absence of a hub, the radial clamp-ing force on it in l i q u i d helium is somewhat greater than for the impeller.
The motor rotor is constructed of platinum-cobalt magnetic material,aluminum balance washers, and steel magnetic end shields. The shaft includesaxial ly raised material from indentation which holds the rotor components to theshaft. This system allows some axial movement of the shaft during cooldown
0-Rings are used as stati,c seals to restrict the entry of l i q u i d hydrogeninto the areas of the unit containing rotating components. L i q u i d in thoseareas would produce drag forces which would reduce the motor efficiency.
During assembly of the motor, it is necessary to adjust the position ofthe commutating disc relative to the magnetic poles. This is accomplishedby achieving a proper wave shape on an oscilloscope while operating. Adjust-ment is accompl i shed by stopping the machine, loosening the commutation discnut and rotating the disc. It is a t r i a l and error procedure. A lack ofspace prevented a more convenient method of setting the commutation.
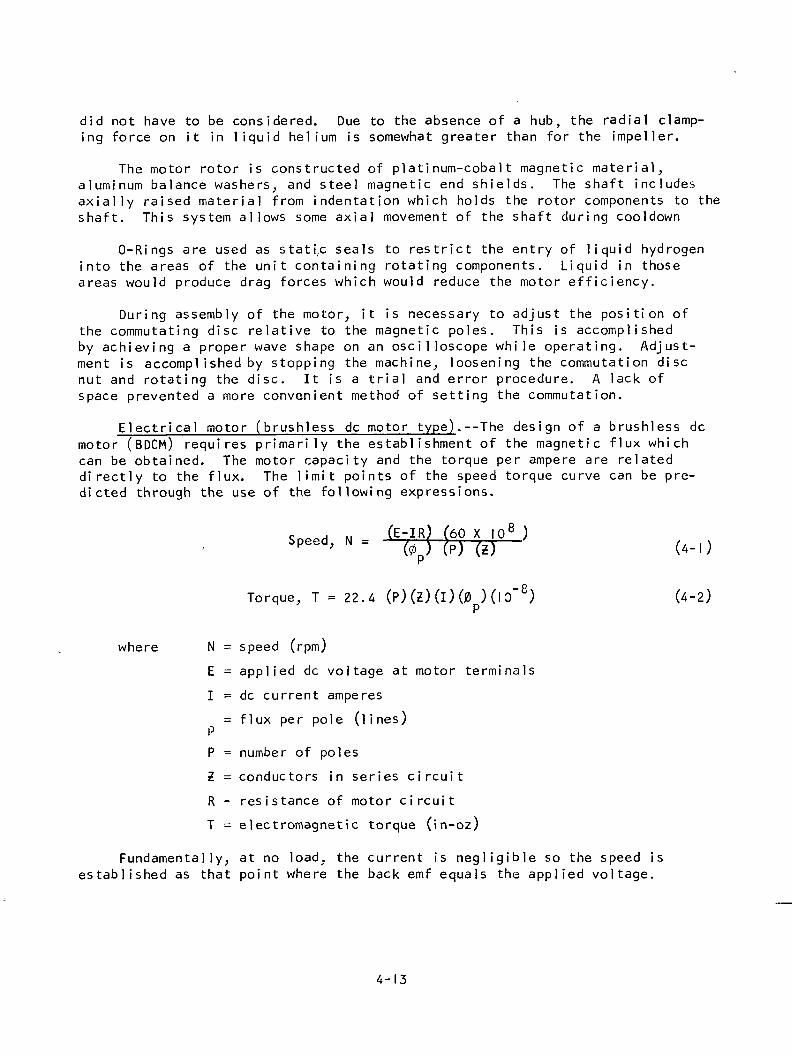
Electrical motor (brushless dc motor type). --The design of a brushless dcmotor (BOOM) requires primarily the establishment of the magnetic flux whichcan be obtained. The motor capacity and the torque per ampere are relateddirectly to the flux. The l i m i t points of the speed torque curve can be pre-dicted through the use of the following expressions.
CE-IR) (60 X IP8 )MN =
Torque, T - 22.4 (P)(z)(l)(0 )(lo"8) (4-2)
where N = speed (rpm)
E = applied dc voltage at motor terminals
1 = dc current amperes
= flux per pole (lines)P
P = number of poles
2 = conductors in series circuit
R - resistance of motor circuit
T = electromagnetic torque (in-oz)
Fundamentally, at no load, the current is n e g l i g i b l e so the speed isestablished as that point where the back emf equals the applied voltage.
4-13
At stal l conditions, there is no back emf so the appl ied voltage is equal tothe IR drop across the motor winding. This current, at stal l is l imited onlyby the winding resistance.
where I = stall current (ampere)
R.. = motor winding resistance (ohms)M
Under cryogenic operating temperatures the resistance of the stator windingbecomes so small that too much current is drawn, the torque is too high and theproper speed-torque slope is not obtainable. It is necessary to include a lineresistor to bring the total resistance seen by the applied voltage to the propervalue. Thus, for low temperature operation:
RT = RM + R$ and I& = f-
where R = shaping resistance (ohms)
R = total resistance (ohms)
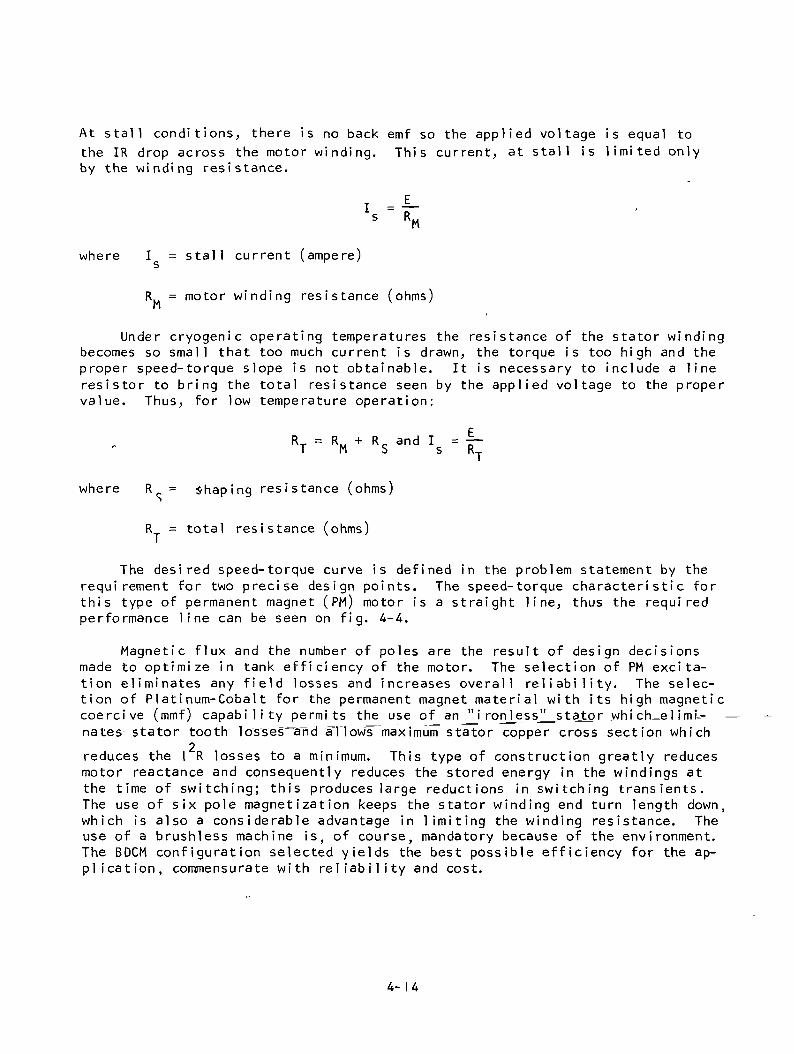
The desired speed- torque curve is defined in the problem statement by therequirement for two precise design points. The speed-torque characterist ic forthis type of permanent magnet (PM) motor is a straight line, thus the requiredperformance l ine can be seen on fig. 4-4.
Magnetic f lux and the number of poles are the result of design decis ionsmade to opt imize in tank e f f i c iency of the motor. The select ion of PM excita-tion el iminates any f ie ld losses and increases overal l re l iab i l i ty . The selec-tion of Platinum-Cobalt for the permanent magnet material wi th its high magneticcoercive (mmf) capab i l i t y permits the use of an ^jj-on^ess" stator^whi ch_e1 imu-nates stator-toothr los'ses^ andlTlows' maximum stator copper cross section which
2reduces the I R losses to a minimum. This type of construction greatly reducesmotor reactance and consequently reduces the stored energy in the windings atthe time of switching; this produces large reductions in switching transients.The use of six pole magnetization keeps the stator winding end turn length down,which is also a considerable advantage in l i m i t i n g the winding resistance. Theuse of a brushless machine is, of course, mandatory because of the environment.The BDCM configuration selected yields the best possible efficiency for the ap-plication, commensurate with r e l i a b i l i t y and cost.
4-14
5000 -i
4000 -
3000 -
aLlJLUQ.t/7 2000 -
1000 -
DEST ••;,•: P O L 1
(6 Hj
DESIGN POINT 2(LH2)
0 .5 1.0 1.5 2.0 2.5(3.58) (7.06) (10.59) (14.12) (17.65)
Torque in in.-oz (m-N x 10 )
Figure 4-4. Speed-Torque Characteristic for BDCM Unit
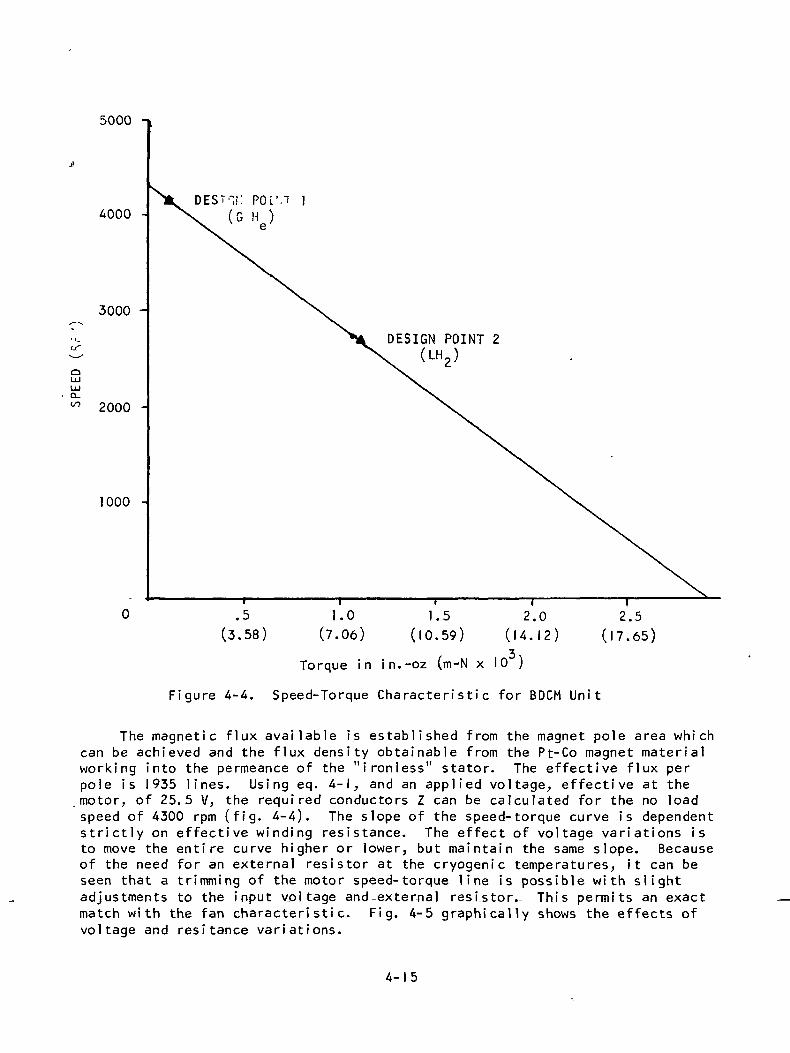
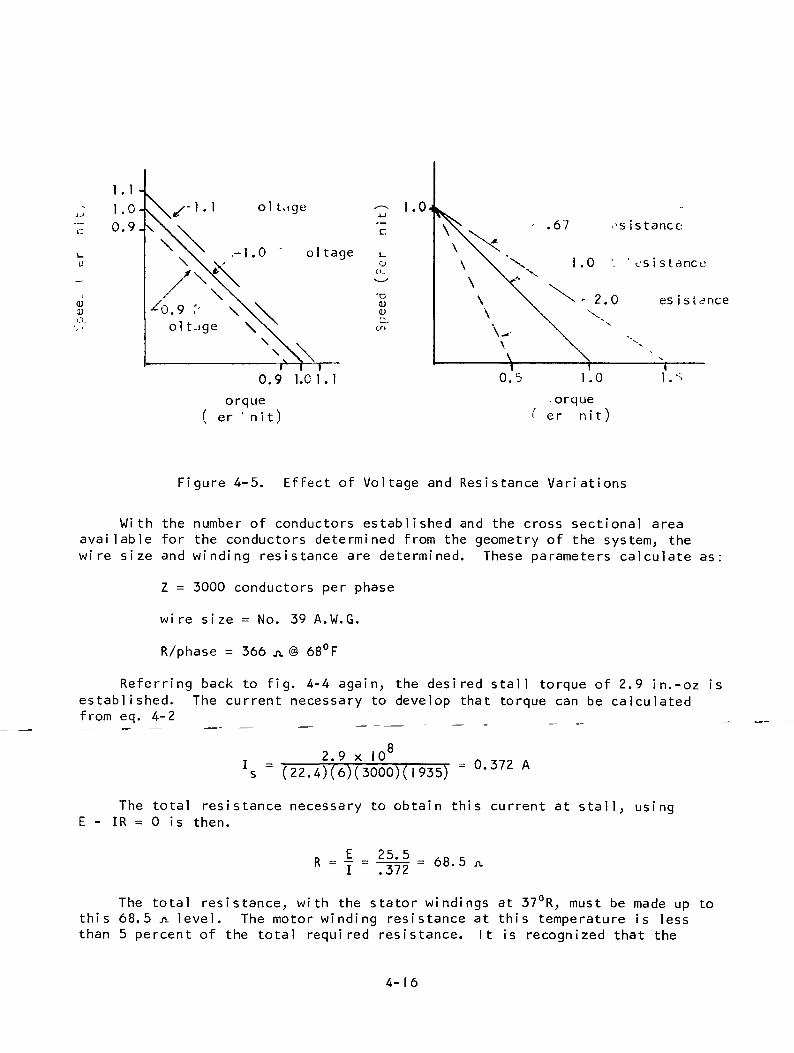
The magnetic flux available is established from the magnet pole area whichcan be achieved and the flux density obtainable from the Pt-Co magnet materialworking into the permeance of the "ironless" stator. The effective flux perpole is 1935 lines. Using eq. 4-1, and an applied voltage, effective at themotor, of 25.5 V, the required conductors Z can be calculated for the no loadspeed of 4300 rpm (fig. 4-4). The slope of the speed-torque curve is dependentstrictly on effective winding resistance. The effect of voltage variations isto move the entire curve higher or lower, but maintain the same slope. Becauseof the need for an external resistor at the cryogenic temperatures, it can beseen that a trimming of the motor speed-torque line is possible with slightadjustments to the input voltage and external resistor. This permits an exactmatch with the fan characteristic. Fig. 4-5 graphically shows the effects ofvoltage and resitance variations.
4-15
0)D
1.1 -1.0-0.9.
.-1.0 " oltage i_1.0 '. ' es i stance
0.9 1.01.1
orque( er ' n i t )
0.5 1.0
.orqueer n i t )
Figure 4-5. Effect of Voltage and Resistance Variations
With the number of conductors established and the cross sectional areaavailable for the conductors determined from the geometry of the system, thewire size and winding resistance are determined. These parameters calculate as:
Z = 3000 conductors per phase
wire size = No. 39 A.W.G.
R/phase = 366 A @ 68°F
Referring back to fig. 4-4 again, the desired stall torque of 2.9 in.-oz isestablished. The current necessary to develop that torque can be calculatedfrom eq. 4-2
2.9 x 10s ~ (22.4)(6)(3000)(|935)
- 0.372 A
E -The total resistance necessary to obtain this current at stal l , using
IR = 0 is then.
25.57372
_ B
~ 68'
The total resistance, with the stator windings at 37°R, must be made up tothis 68.5 A level. The motor winding resistance at this temperature is lessthan 5 percent of the total required resistance. It is recognized that the
4-16
higher motor currents w i l l result in heating of the stator which will increasestator resistance. However, this is considered a second-order effect and isprobably not detectable within the l i m i t s of instrument accuracy.
The electromagnetic losses were then predicted. Because of the lowabsolute magnitude of the losses, good accuracy in the calculations was diffi-cult to obtain. The motor electromagnetic losses consist of copper loss2
I R, eddy current loss in the conductors, iron loss in the flux containmentsleeve, and stray load losses. The motor electromagnetic torque is alsodecreased by the windage and friction loss before the resultant output shafttorque is achieved. An inductive loss relating to the motor winding inductance
2and the current at the time of switching (LI ) does not occur in the motor butis attributable to motor characteristics.
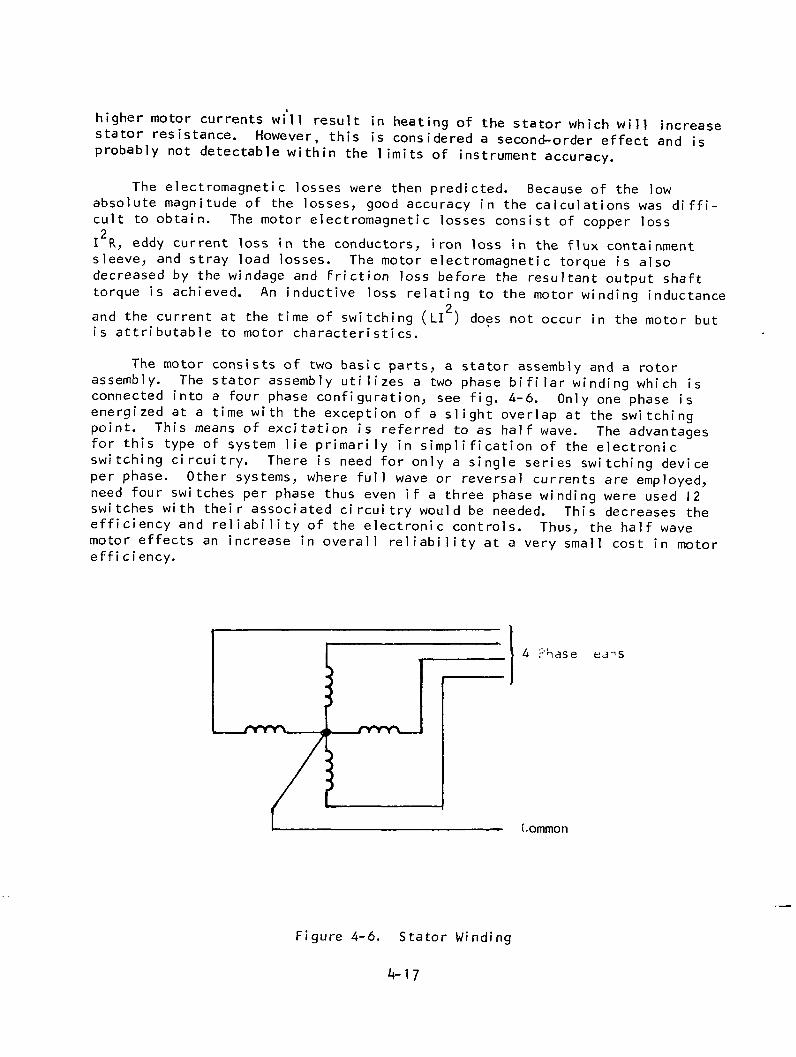
The motor consists of two basic parts, a stator assembly and a rotorassembly. The stator assembly utilizes a two phase b i f i l a r winding which isconnected into a four phase configuration, see fig. 4-6. Only one phase isenergized at a time with the exception of a slight overlap at the switchingpoint. This means of excitation is referred to as half wave. The advantagesfor this type of system lie p r i m a r i l y in simplification of the electronicswitching circuitry. There is need for only a single series switching deviceper phase. Other systems, where full wave or reversal currents are employed,need four switches per phase thus even if a three phase winding were used 12switches with their associated circuitry would be needed. This decreases theefficiency and r e l i a b i l i t y of the electronic controls. Thus, the half wavemotor effects an increase in overall r e l i a b i l i t y at a very small cost in motoreffi ci ency.
i.ommon
Figure 4-6. Stator Winding

The use of four phases provides a smoother torque pattern as a function ofrotor position than three phase and it is wound as a conventional two phase unitwith stranded conductors. These strands are subsequently separated and reverseconnected to give the four phase configuration.
Only those conductors which are in proper relationship to react with maxi-mum effect with the magnetic field are energized. The current flowing throughthose conductors located in the magnetic field results in an electromagnetictorque on the rotor. This torque causes the rotor to rotate with respect tothe stator. To maintain motor torque with the new rotor position, the nextgroup of conductors in the direction of rotation is energized and the othersturned off. This process continues throughout the full rotation of the rotor.
The second basic electromagnetic part is the rotor. It consists of acylinder of piatinum-cobalt permanent magnet material mounted on a shaft. Thefundamental reason for the use of permanent magnet excitation was discussedearlier. The specific use of p1atinum-cobalt deserves some further explanation.At the time of the development of this motor (1968), platinum-cobalt was oneof two magnet materials exhibiting an energy product as high as 10.0 m i l l i o ngauss-oersteds, the other material being Alnico 9- The significance of the high-energy product is that the work obtainable from a particular volume of materialis maximum. Of these two magnet materials, platinum-cobalt is the only onecapable of working into large effective air gaps because of its resistance todemagnetization (high H ). Within the last two years new permanent magnet
materials have been developed. These are the rare earth-cobolt alloys. Thehigher magnetic quality versions are samarium-cobalt and are capable ofachieving energy products in the 15 to 20 m i l l i o n gauss-orsted region. Thesenew alloys are magnetically superior to the platinum-cobalt material in allaspects: energy product, coercive force, and residual induction. Thus someconsideration could now be given to its use in future versions of this motor.The mechanical properties of platinum-cobalt are easily the best of any respect-able permanent magnet alloy. The rare earth-cobalt alloys exhibit physicalproperties similar to Alnico 9; they are brittle, tend to crack or chip andhave no appreciable tensile strength. Platinum--cobalt is s t i l l the only goodmagnet material with isotropic characteristics. That is to say, its goodmagnetic properties are not restricted to a particular axis. To date, therare earth-cobalt alloys as well as Alnico 9 are anisotropic. This combinationof magnetic and mechanical properties probably s t i l l makes platj num-cojjaj t __the_best magnet mater-ial -foi—this—appl'icatTonT"~~Tn"eTmaghet~cy 1 inder is all that isrequired, whereas the rare earth-cobalt approach would need magnet segmentsand a nonmagnetic support ring and end plates. The necessity of providingsupport for a rare earth-cobalt magnet assembly has a detrimental magneticeffect in that it would increase the effective air gap and thus negate some ofthe benefits of better magnet properties. A composite rotor would cause con-siderable problems in maintaining part fits over wide temperature rangesencountered in assembly and use.
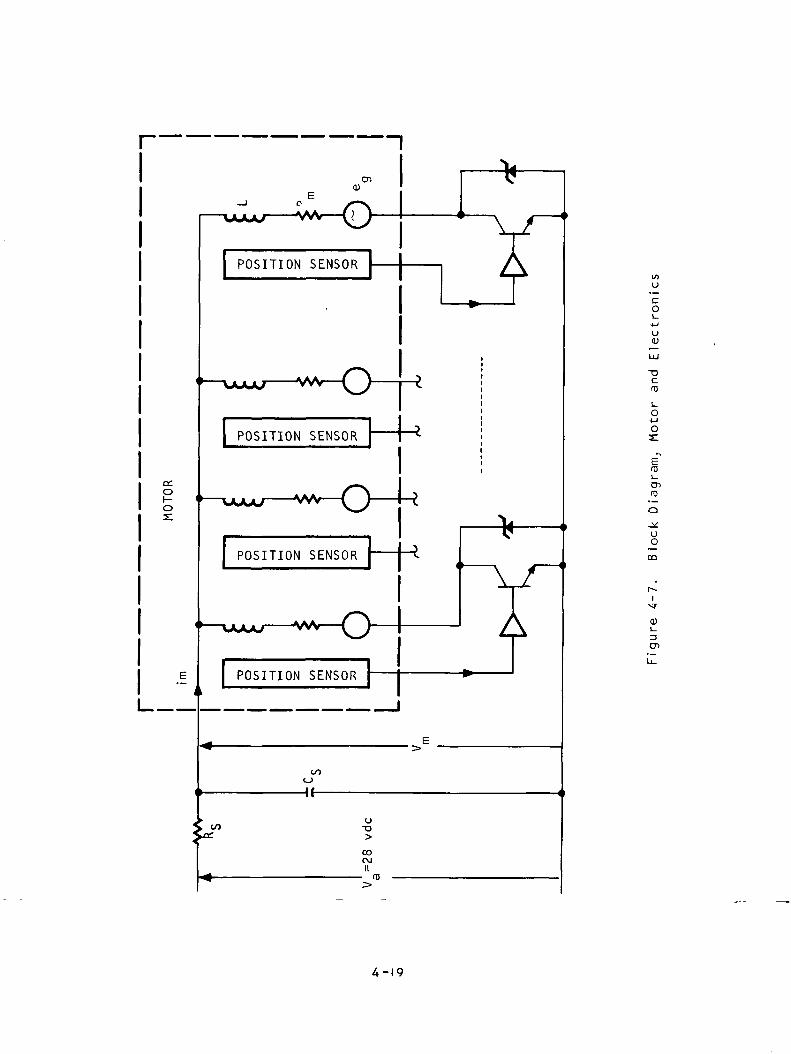
Electronic motor control module principles of operation.--The block diagramof a four-phase half-wave brushless dc motor and of its associated electronicsis shown in fig. 4-7- Each motor winding is represented by its generated volt-age (counter-emf) e , its winding resistance RM, and its winding inductance L.
4-18
CC
o
co
U(U
o3:
O)fD
uo
CT)
LJ-
4-19
In addition, each winding is coupled to each other winding, thereby introducing
an additional voltage e = M -rj: which is significant to the understanding of the
observed voltage waveforms, but which otherwise has no effect on the operationbecause only one winding conducts at a time. For simplicity only two of thefour amp l i f i e r (switching) stages are shown. The resistor R^ is used in this
particular application only in order to shape the torque-speed characteristic,as previously discussed. The capacitor C is used to assure a dc voltage at
VM in the presence of a pulsating motor current i . The capacitor is not needed
for the operation of the machine; however, it greatly s i m p l i f i e s the instrumenta-tion needed for the separation of losses required in order to determine the i n-tank efficiency of the motor. Operating the machine with and without thecapacitor revealed no measurable difference in speed or current under load;it was therefore concluded that the capacitor did not materially changeperformance. The entire subject of instrumentation is detailed in Appendix Bof this report.
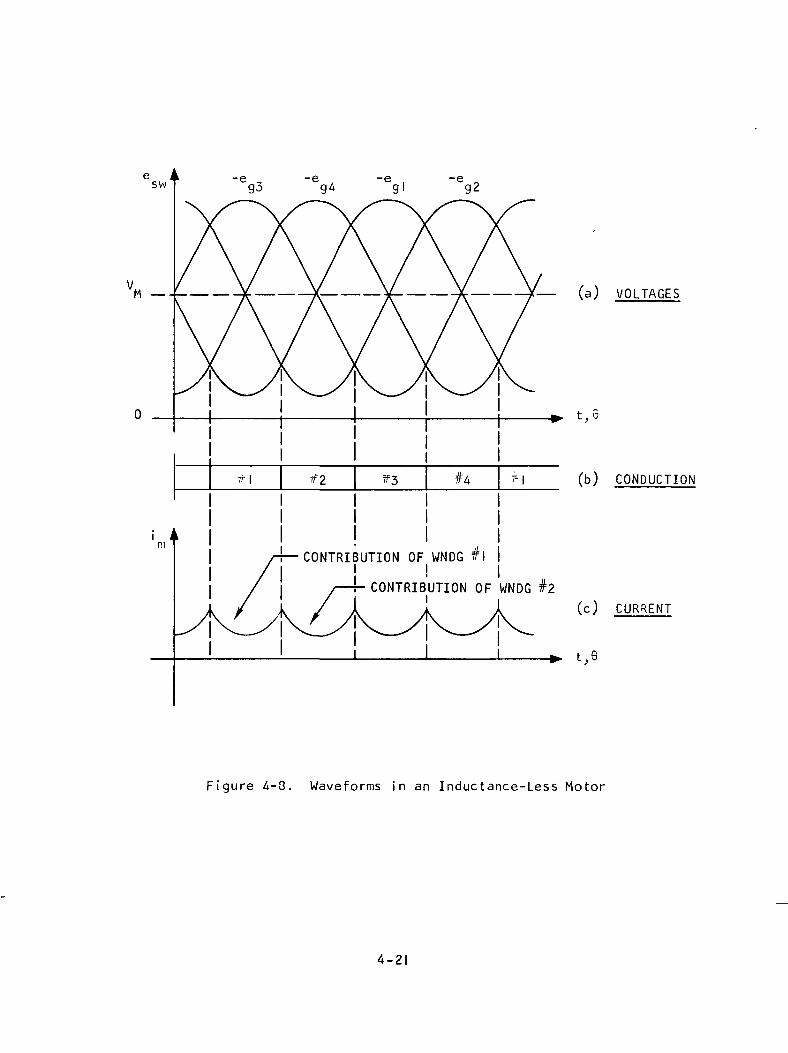
Fig. 4-8 depicts the waveforms that would be associated with a motor freeof inductance. This assumption is reasonably correct for the ironless motorunder consideration. The effects of inductance w i l l be qualitatively discussedlater.
Fig. 4-8(a) depicts the voltages that exist across the non-conductingswitches (transistors). These voltages consist of the motor generated emfsubtracted from the voltage VM applied to the motor. Fig. 4-8(b) tags the
switch which is closed at any particular instant. It can be seen that eachswitch conducts sequentially for 90 electrical degrees during that part of thecycle when the generated voltage in the associated winding is maximum, i.e.,when the voltage across a non-conducting switch would be minimum. Fig. 4-8(c)shows the resulting scalloped motor current.
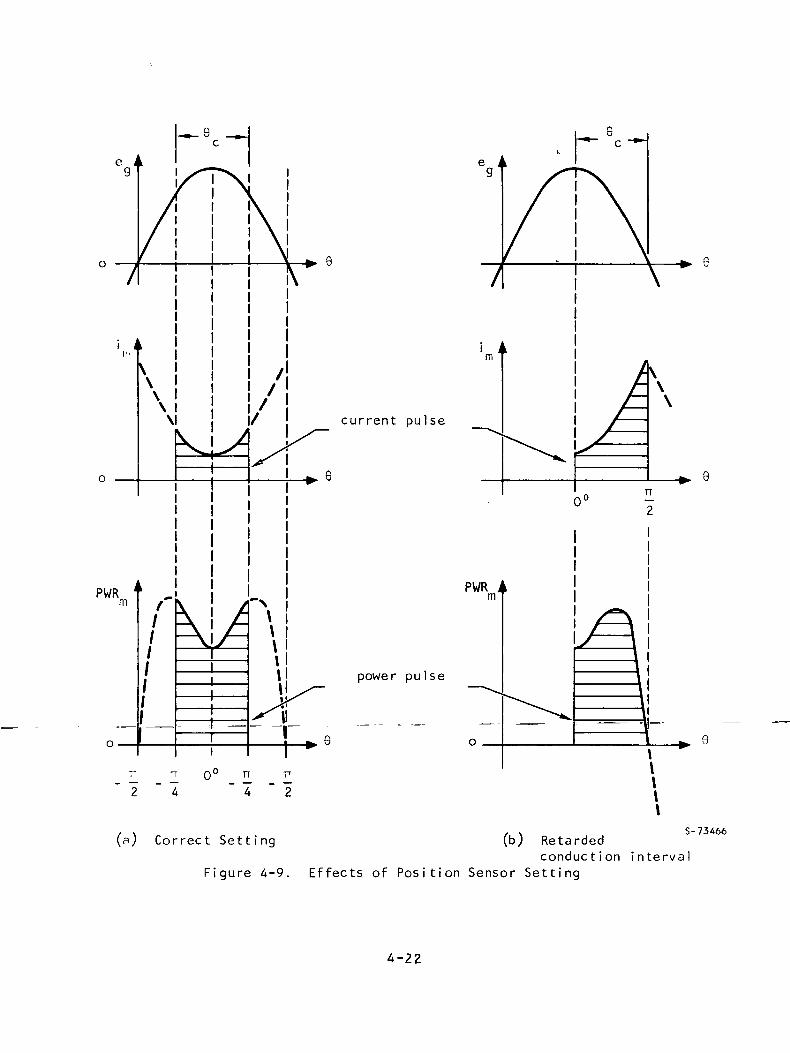
The timing and duration of switch conduction is controlled by the positionsensors as a function of the relative position of rotor poles with respect tothe stator windings. Proper functioning of the position sensors is critical tothe performance of the motor, as can be seen in fig. 4-9. A position sensorcorrectly set for a four-phase motor is shown in fig. 4-9(a). Conduction is
symmetrical for ± -j radius about the generated voltage peak.
At any given speed, the instantaneous voltage generated by the motor isgiven by:
e = Egm cos cut = Egm cos 9,
where Egm is directly proportional to speed. The instantaneous current in aconducting winding is:
- - Dm RM RM
4-20
cos
-e
—¥ Y V -X y— (a) VOLTAGES
CONTRIBUTION OF WNDGIi
r- CONTRIBUTION OF WNDG #2I
(b) CONDUCTION
(c) CURRENT
t,e
Figure 4-3. Waveforms in an Inductance-Less Motor
4-21
m
current pulse
PWR
power pulse
r -T o° " ^2 " 4 4 " 2
Correct Setting
TT
(b) Retardedconduction interval
Figure 4-9. Effects of Position Sensor Setting
S-73466
4-22
from which the instantaneous mechanical power developed by the motor becomes
VM Egm7- - cos 9 Egm cos 9.
m m g
Refering to fig. 4-9(a), it can be seen that as the conduction angle 9
is increased symmetrically about 0°, the instantaneous mechanical power increasesuntil a peak is reached at just before 120° (three-phase operation), from whereit then decreases sharply to zero. The ratio of instantaneous power to instan-taneous current follows the e curve, and this is highest at 9 =0, and is
zero at 6 = 180°, i.e., the high current at the end of a pulse produces no
torque at a l l . Thus the selection of conduction angle is a trade-off betweenefficiency and a reasonable number of phases and their associated electronicschannels. The four-phase configuration used at AiResearch represents a goodcompromise, and may well be optimum when all factors are considered.
Fig. 4-9(b) shows the condition situation resulting from a 45° (electrical)shift of the conduction angle. In a six-pole machine this corresponds to 15°mechanical. It can be seen, that although a respectable power pulse is obtained,the current has increased greatly, reducing the efficiency of the machine. Afurther shift would result in negative, i.e., retarding power, un t i l at a 30°(mechanical) shift, the motor produces no power yet draws stall current.Experience operating this motor indicates the shutter should be set to withinapproximately three mechanical degrees for essentially optimum performance.
It is clear that the proper operation of the position sensors is especially2
critical to performance of this motor in order to minimize its in-tank I R losses.Since the position sensors operate immersed in the cryogenic fluid, their designand test comprised the major portion of the electronics development effort.
The effects of motor inductance are considered with the aid of fig. 4-10,which is a photograph of motor waveforms taken during operation in l i q u i d nitro-gen during the development tests. The upper waveform shows the current pulse.The effect of the inductance is to slow the current rise and to shift the phaseof the sinusoidal portion. The effect is small due to the low value of induc-tance associated with the ironless winding of the AiResearch motor. The lowerwaveform is the voltage across the phase-A transistor, shown inverted due to theinstrumentation setup. It is noted that the waveform is distorted. This is
due to M — contributions of the other phases. In the first segment, for
example, the contribution is from phase-B conduction.
The voltage spikes are by-products of motor commutation, and are theresult of rapid current decay in |_w, the winding self inductance. The switchingtransistors are protected by zener diodes against the harmful I effects of thesespikes. Referring to fig—4-10, .the-second-spike seen af-ter the conductioninterval is coupled from phase-B, and the third spike from phase-C. The latteris clipped at the zero axis by forward conduction of the zener; it is more
4-23
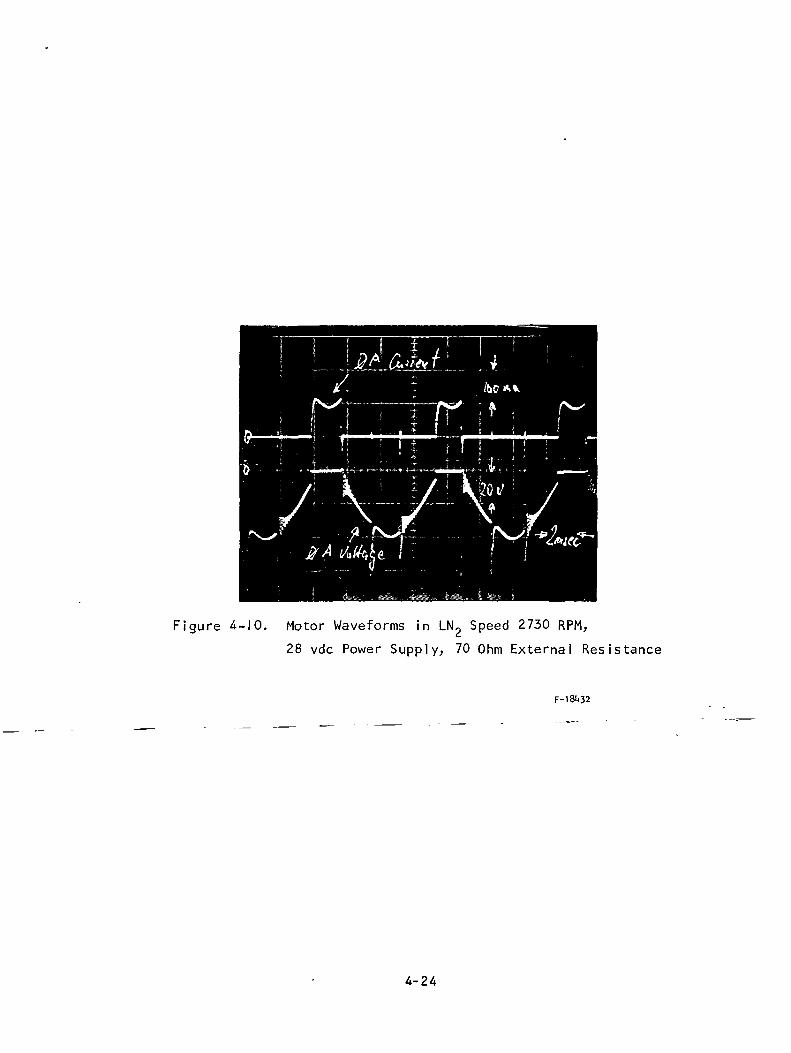
Figure 4-10. Motor Waveforms in LN2 Speed 2730 RPM,
28 vdc Power Supply, 70 Ohm External Resistance
F-18U32
4-24
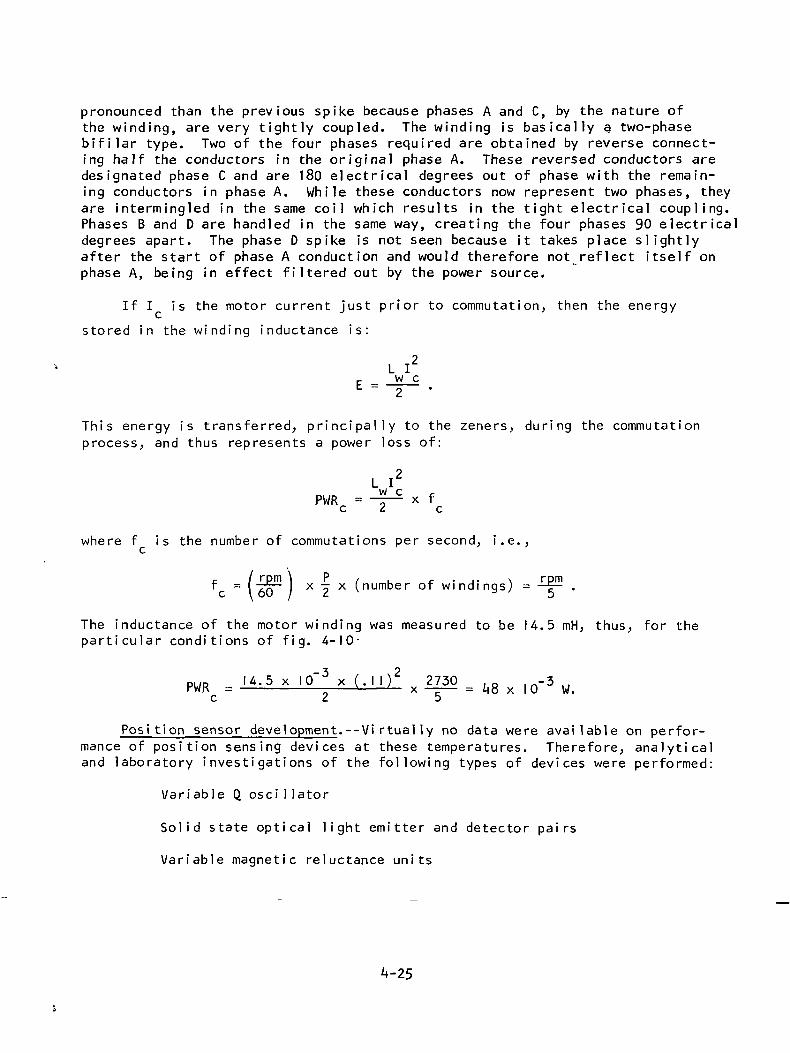
pronounced than the previous spike because phases A and C, by the nature ofthe winding, are very tightly coupled. The winding is basically a two-phasebifilar type. Two of the four phases required are obtained by reverse connect-ing half the conductors in the original phase A. These reversed conductors aredesignated phase C and are 180 electrical degrees out of phase with the remain-ing conductors in phase A. While these conductors now represent two phases, theyare intermingled in the same coil which results in the tight electrical coupling.Phases B and D are handled in the same way, creating the four phases 90 electricaldegrees apart. The phase D spike is not seen because it takes place slightlyafter the start of phase A conduction and would therefore not reflect itself onphase A, being in effect filtered out by the power source.
If I is the motor current just prior to commutation, then the energy
stored in the winding inductance is:
LI 2
c _ W cE - 2 .
This energy is transferred, p r inc ipa l l y to the zeners, during the commutationprocess, and thus represents a power loss of:
L I 2
PWR = HP x fc 2 c
where f is the number of commutations per second, i.e.,
,- / rpm \ P / , , . ,. >, rpmf = I -TQ I x y x (number of windings) = —£- .
The inductance of the motor winding was measured to be 14.5 mH, thus, for theparticular conditions of fig. 4-10-
PWRc = I*.5xl0-3x(.||)2 x =1.8 x .O-3 W.
Position sensor development.--Virtual1y no data were available on perfor-mance of position sensing devices at these temperatures. Therefore, analyticaland laboratory investigations of the following types of devices were performed:
Variable Q. oscillator
Solid state optical light emitter and detector pairs
Variable magnetic reluctance units
k-25
The basic application of the position sensors described herein requiresthe use of a shutter disc or cup. This commutation device is secured to themotor shaft and is provided with indexes that serve as position indicators.
An analysis of the optimum number of sensors showes a four-sensor systemto be most advantageous. From a circuit standpoint, a minimum of two sensorscould be used, however, this approach would increase the complexity of theinterface electronics between the sensor outputs and the main transistor switches.Moreover, if one sensor failed, the motor would stop and would not be restartable.
The four-sensor system has two distinct advantages. First, if one senssd, the motor would continue to operate, and, if stopped, it would have
To facilitate the i n i t i a l development and testing program for the varioussensors, work was done at room ambient and at l i q u i d nitrogen temperatures.The selection of l i q u i d nitrogen was based on two factors: (l) it was easilyobtainable and posed no major personnel hazard due to evaporation, and (2) itstemperature, from a gross viewpoint, is nearly the same as l i q u i d hydrogen,(-198° and -256°C, respectively). Therefore, the effect of thermal stress dueto immersion was nearly the same and was adequate for the early test period.
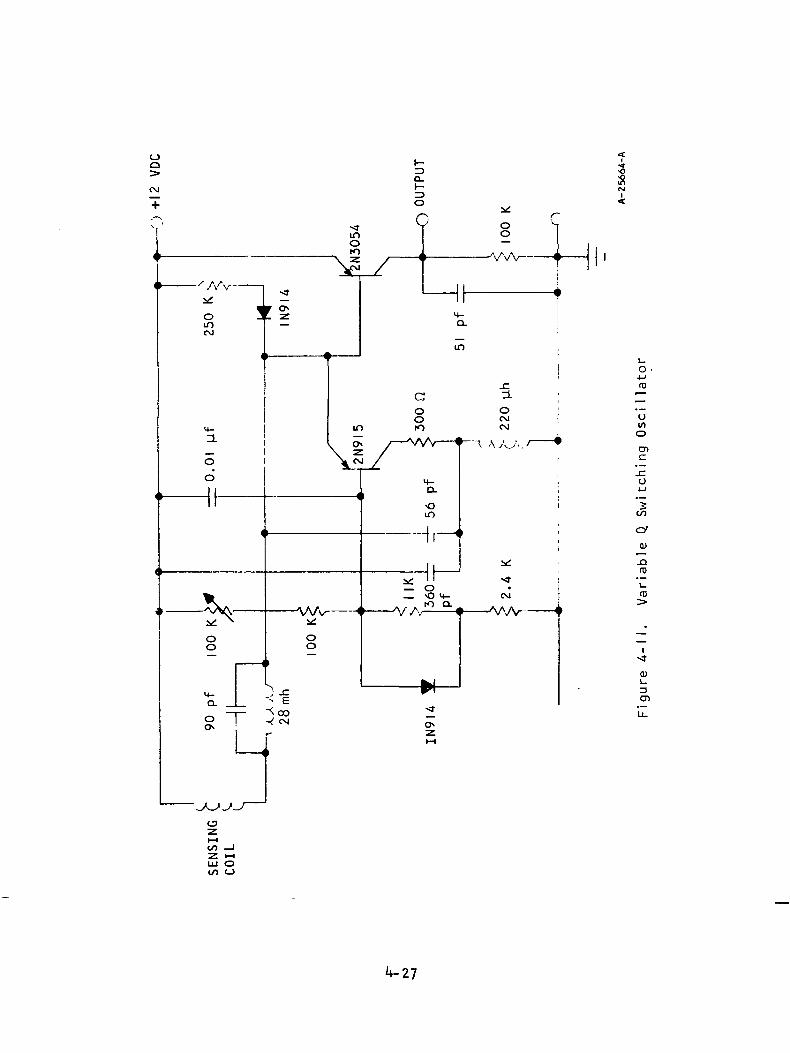
The variable Q, oscillator circuit was o r i g i n a l l y developed to measure thelinear displacement of metal surfaces. The circuit used an oscillator in whichthe ac signal level is a linear function of the spacing between the oscillatorcoil assembly and a metal surface. The oscillator output voltage is demodulatedinto a dc analog of displacement. For purposes of this application, the circuitwas modified to provide for on-off switching. The resulting circuit, as shownin fig. 4-11 was used for the tests described herein. The oscillator requiresa high-Q. inductor in order to sustain oscillations. If the inductor Q. is suf-ficiently reduced, oscillations stop.
For the purpose of testing the commutator performance, a notched aluminumdisc and a sensing coil were mounted in a test fixture. The disc was drivenby a dc motor at speeds varying from 1000 rpm to 13 000 rpm. Fig. 4-12 showsthe relative position of the chopper disc and a 1/8-in. coil which demonstratedthe best performance of the four different sensing coils tested. The dischad four 45° notches equally spaced around its periphery. At the maximum motorspeed thi s^provi ded^ a chopping rate^oJL approximately -900 HZT The hiductor co~ily~™havi ng~dimens ions compatible with the motor, consisted of 30 turns of 50 gagewire on a 0.125-in. (3.3 X 10³m) bobbin. The coil was encapsulated in a porcelainf i l l e d epoxy in order to minimize the dissipation factor at the 3 mHz oscilla-tion frequency.
The commutator performance was observed over a range of -320°F (-196°C)to +215°F (102°C). The duty cycle of the commutator varied with both speed andtemperature. The "on" period decreases with both increasing speed and tempera-ture. Operation was observed to be very sensitive to circuit adjustment andcoil to disc gap. For proper operation the gap had to be held to within 0.005and 0.010 in. (1.3 X 10'4 to 2.5 X 10⁻⁴m).
k-26
oo
J
•N
> — / ^v^v '
" 1s 5CO
H-
o0
1 II' II
i A i\iA' *TXoo
14-Q.
— i —
u
moro
ti
if\ z
1
•TJ* A ^VW ^
OO
-<-§
^00-! CNI
1
1—
0
0
uc
u
a0o
) K)
; , — A^v <
H-Q-
<Om1 . 11 1 ^
1^ 1— o— -O M-
. . A to a.
1*1
o•z.
<m
o
A A A .,. J L. _». I
3.
T
o.^ 03
d. —
CM OCM W
OV A y-_^>. (-P,
C
_co•M
CO
0)
^^ O
>* ! ' —
~ , 5> . A A A.J 411 VVV "
1Nj
0)
cn
LI.
LU OCO O
4-27
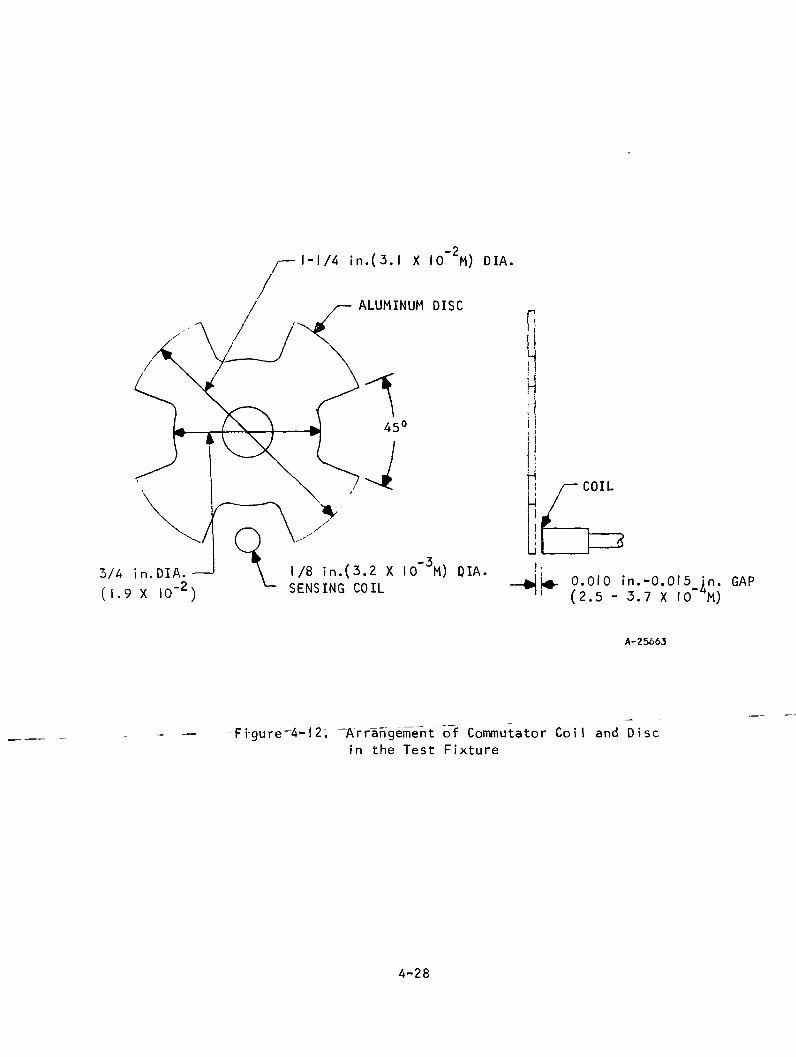
3/4 in.DIA. -( 1.9 X IO"2)
1-1/4 in.(3.I X IO~2M) DIA.
ALUMINUM DISC
1/8 in.(3.2 X IO"3M) DIA.SENSING COIL
COIL
—+|U- 0.010 in.-0.015 in. GAP'' (2.5 - 3.7 X IO~*M)
A-25663
Figure 4-12. Arrangement of Commutator Coil and Discin the Test Fixture
4-28
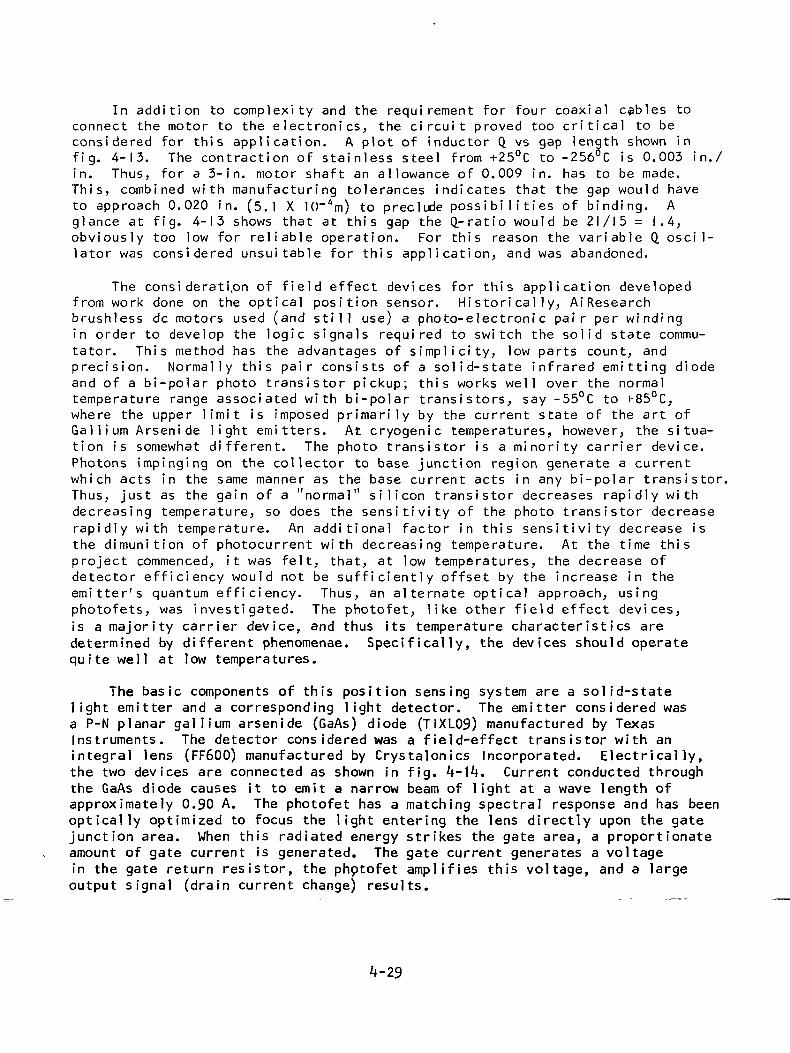
In addition to complexity and the requirement for four coaxial cables toconnect the motor to the electronics, the circuit proved too critical to beconsidered for this application. A plot of inductor Q. vs gap length shown infig. 4-13. The contraction of stainless steel from +25°C to -256°C is 0.003 in./in. Thus, for a 3-in. motor shaft an allowance of 0.009 in. has to be made.This, combined with manufacturing tolerances indicates that the gap would haveto approach 0.020 in. (5.1 X 10~4m) to preclude p o s s i b i l i t i e s of binding. Aglance at fig. 4-13 shows that at this gap the Q.-ratio would be 21/15 = 1.4,obviously too low for reliable operation. For this reason the variable Q. oscil-lator was considered unsuitable for this application, and was abandoned.
The consideration of field effect devices for this application developedfrom work done on the optical position sensor. Historically, AiResearchbrushless dc motors used (and still use) a photo-electronic pair per windingin order to develop the logic signals required to switch the solid state commu-tator. This method has the advantages of simplicity, low parts count, andprecision. Normally this pair consists of a solid-state infrared emitting diodeand of a bi-polar photo transistor pickup; this works well over the normaltemperature range associated with bi-polar transistors, say -55°C to +85°C,where the upper l i m i t is imposed primarily by the current state of the art ofG a l l i u m Arsenide light emitters. At cryogenic temperatures, however, the situa-tion is somewhat different. The photo transistor is a minority carrier device.Photons impinging on the collector to base junction region generate a currentwhich acts in the same manner as the base current acts in any bi-polar transistor.Thus, just as the gain of a "normal" silicon transistor decreases rapidly withdecreasing temperature, so does the sensitivity of the photo transistor decreaserapidly with temperature. An additional factor in this sensitivity decrease isthe dimunition of photocurrent with decreasing temperature. At the time thisproject commenced, it was felt, that, at low temperatures, the decrease ofdetector efficiency would not be sufficiently offset by the increase in theemitter's quantum efficiency. Thus, an alternate optical approach, usingphotofets, was investigated. The photofet, like other field effect devices,is a majority carrier device, and thus its temperature characteristics aredetermined by different phenomenae. Specifically, the devices should operatequite well at low temperatures.
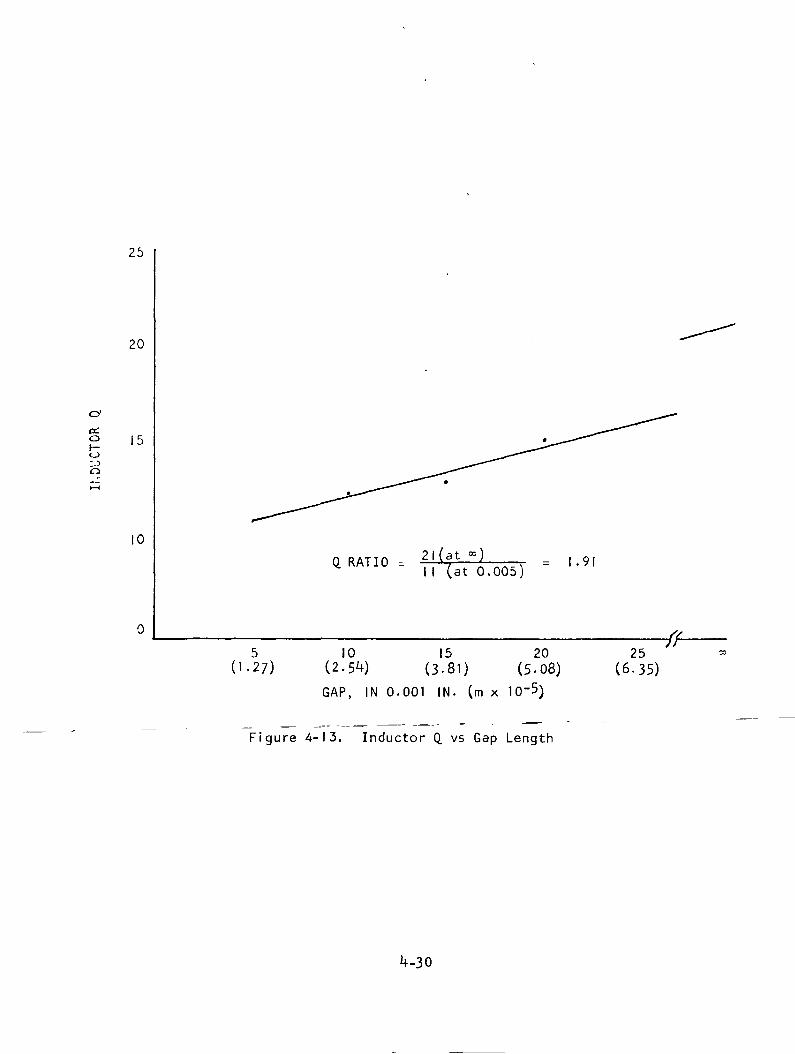
The basic components of this position sensing system are a solid-statelight emitter and a corresponding light detector. The emitter considered wasa P-N planar gallium arsenide (GaAs) diode (TIXL09) manufactured by TexasInstruments. The detector considered was a field-effect transistor with anintegral lens (FF600) manufactured by Crystalonics Incorporated. Electrically,the two devices are connected as shown in fig. 4-14. Current conducted throughthe GaAs diode causes it to emit a narrow beam of light at a wave length ofapproximately 0.90 A. The photofet has a matching spectral response and has beenoptically optimized to focus the light entering the lens directly upon the gatejunction area. When this radiated energy strikes the gate area, a proportionateamount of gate current is generated. The gate current generates a voltagein the gate return resistor, the phptofet amplifies this voltage, and a largeoutput signal (drain current change) results.
4-29
25
20
OLO 15
RATIO 2l(at «)RATI° " II (at 0.005;
= 1.91
5 10 15 20 25(1.27) (2-5^) (3-81) (5-08) (6.35)
GAP, IN 0.001 IN. (m x 10-5)
Figure 4-13. Inductor Q. vs Gap Length
E, _=
DIODE
GATE |_1
PHOTO-FET
DRAIN
SOURCE
Figure 4-14. Test Circuit Photo Electronic Sensor
The system is operated as a position sensor by inserting a shutter discbetween the lenses of the GaAs diode and the photofet. The disc has openingsthat make or break the light beam, thus resulting in a modulated drain current.As indicated earlier, the shutter disc is attached to the motor shaft andhence provides the necessary shaft position information. The drain current isthen used to drive the power amplifiers, which provide motor winding excitation.
Of primary importance is the a b i l i t y of the GaAs diode and/or the photofetto withstand thermal shock stress when immersed in l i q u i d hydrogen from roomambient (or higher) temperatures. Of particular concern was the glass-to-metal,seal associated with the lens of each device. To evaluate this potential prob-lem, five sets of devices were obtained, and photo enlargements of their lensareas were made. In addition, the hermetic seal of each device was tested on afine-leak tester. The intended test method was to immerse the photo sensor setsin l i q u i d nitrogen until stabilized and then return them to room ambient untilstabilized. This procedure was to be repeated five times and then the photoenlargements and leak tests repeated. However, the electrical test results wereso gratifying that extended electrical testing was done prior to completion ofthe thermal testing.
4-31

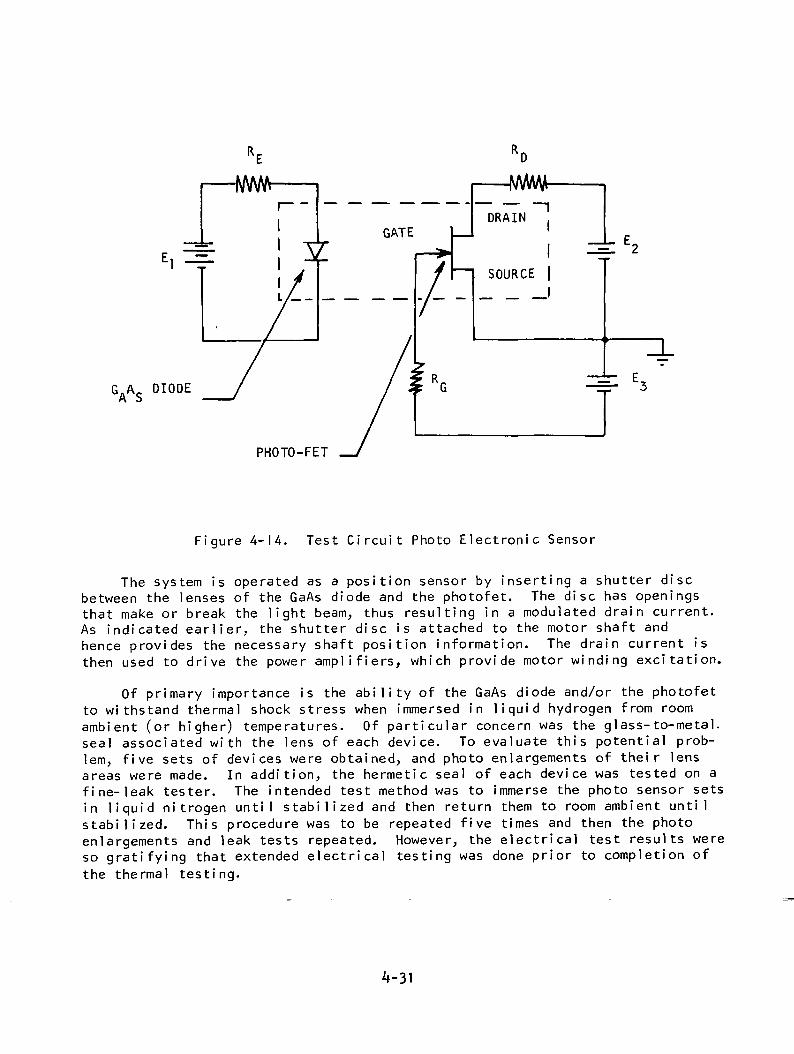
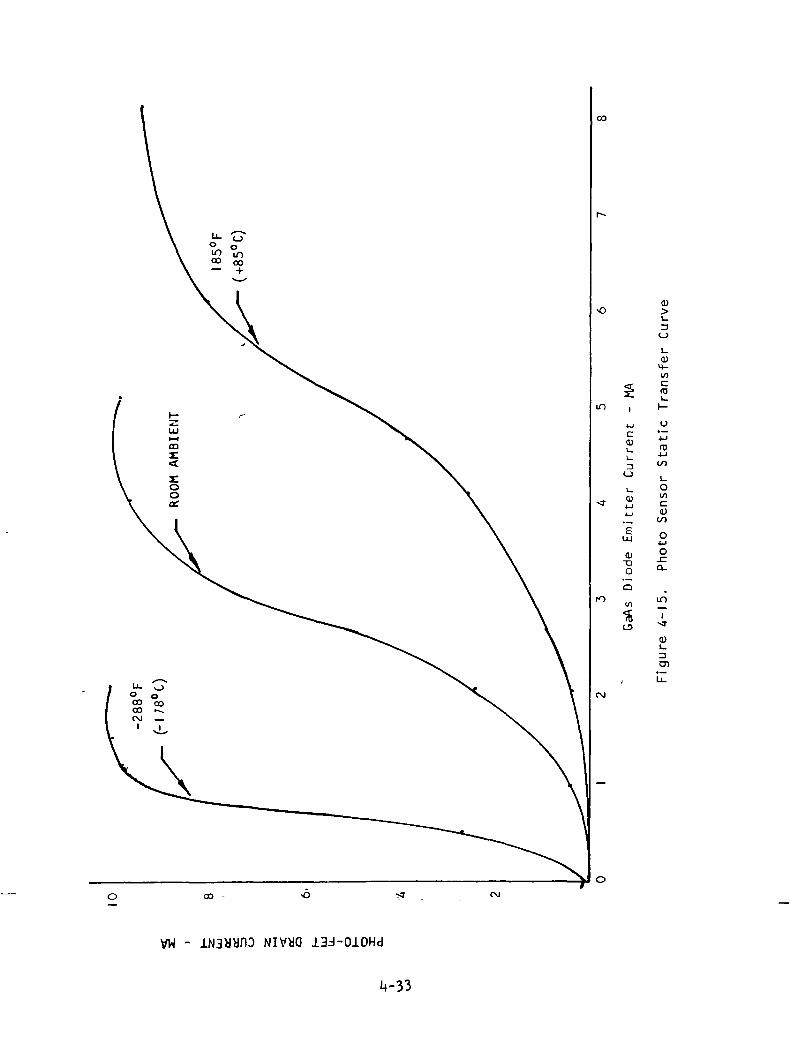
Tests were conducted on four sets of photo sensors to determine theirtransfer characteristics, that is, the relationship between a change of currentthrough the GaAs diode and the resultant change in the drain (load) current ofthe fet. To accomplish the static electrical tests, the GaAs diode and fet weremounted in an aluminum test fixture. The distance between their lenses was setat O.I in. This distance, which is not a critical factor was selected as arealistic spacing possible in the motor housing. Using the test circuit shownin fig. 4-14, transfer curves were made for each of the photo sensor sets at168°F (85°C), room ambient, and -320°F (-198°C). The results are shown infig. 4-15. The transfer curve shown is typical of each of the four sensor setstested. It can be readily seen that the gain and linearity of the photo systemsignificantly increased as the temperature decreased. The linear gain of thesystem was 3.3 at 185°F (85°C) and 16 at -325°F (-198°C). Also, the switching(on-to-off) system gain was from 0.85 at 185°F (85°C) to 6.6 at -325°F (-198°C).This results in an increase in system gain of 4.85 and 1.11, respectively. Theswitching gain is defined as the maximum drain current divided by the correspond-ing emitter current.
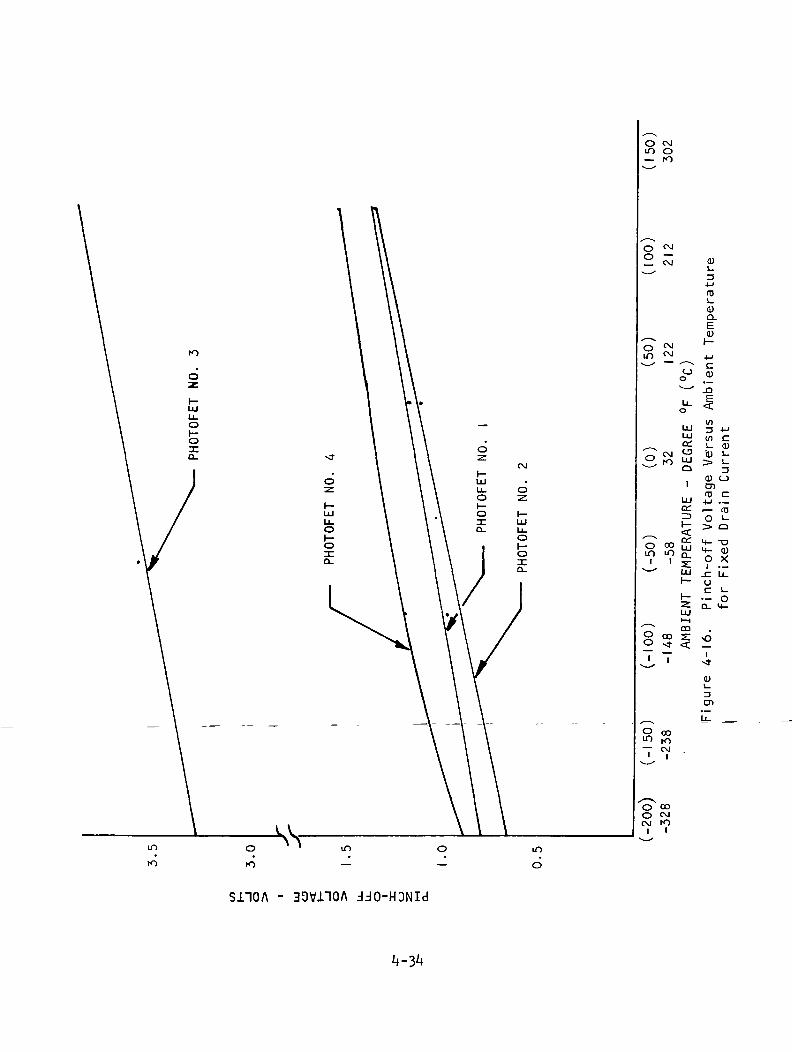
Tests were conducted to determine the exact gate bias voltage E3, called fetpinchoff voltage, that would result in current cutoff of each of the four fet's.The tests were run at257°F (125°C), 185°F (8b°C), 77°F (25°C), -85°F(-65°C)and -325°F (-198°C), and the results are shown in fig. 4-16. Of the four fet'stested, the characteristics of one device only differed from the others. In allunits, the bias level was within the specified maximum of 5.0 V at 25°C. There-fore, if each photo system must have the same switching gain, special provisionswould be required to bias each device separately. Fortunately, this conditionis not required for proper operation as a position sensor. As long as suffi-cient emitter current can be conducted through the GaAs diode, enough energycan be radiated to cause any reasonable fet to switch.
Dynamic electrical tests were conducted to check the photo sensors inl i q u i d nitrogen in conjunction with a rotating shutter disc. The disc wasrotated at 3600 rpm with an induction motor. Fig. 4-17 shows the observedwaveforms of the sensor at room ambient, and fig. 4-18 shows the l i q u i dnitrogen temperature waveforms. The duty cycle of the output waveform iswider when immersed in l i q u i d nitrogen because the increased gain in l i q u i dresulted in a response to scattered light leakage in the relatively crudeexperimental set-up.
As mentioned earlier, a prime area of concern for this system is the abilityof the devices to withstand the thermal shock associated with immersion in thecryogenic l i q u i d .
A test program that thermally cycled the devices from room ambient to -325°F(-I98°C)(1iquid nitrogen) was conducted. After 26 cycles (elapsed time of 13 hr),one fet indicated an open circuit between the drain and the source leads. Asecond fet could not be biased off after 160 temperature cycles. The two faileddevices were subjected to a failure analysis to determine the exact cause offailure (see Appendix C). Surprisingly, the failures were traced not to afundamental problem in materials, as was originally suspected, but rather topoor process controls which would result' in low r e l i a b i l i t y under any conditions.
4-32
tO
ua)
0)T3O
Q
l/l
16
Q)>
<D<4-
l/>c
*J O
£ £<u _,
o1/1c
o4-1O^Q-
m
v*Q)L.3cn
vw - NIVM i3d-oioHd
14-33
mrO
O c\jm o— ro
om
S
oo
a:IDI—<
LUf-
-zLUI— IDO
0)Q.
c0)
LULU C
0)1-
0) O01(0 C
O 1-> Q
4- -a4- a;0 X1 •—
C L.
— OQ- M-
s s
o ooo <M ro
tomo
S110/\ - 39V110A JJO-HONId
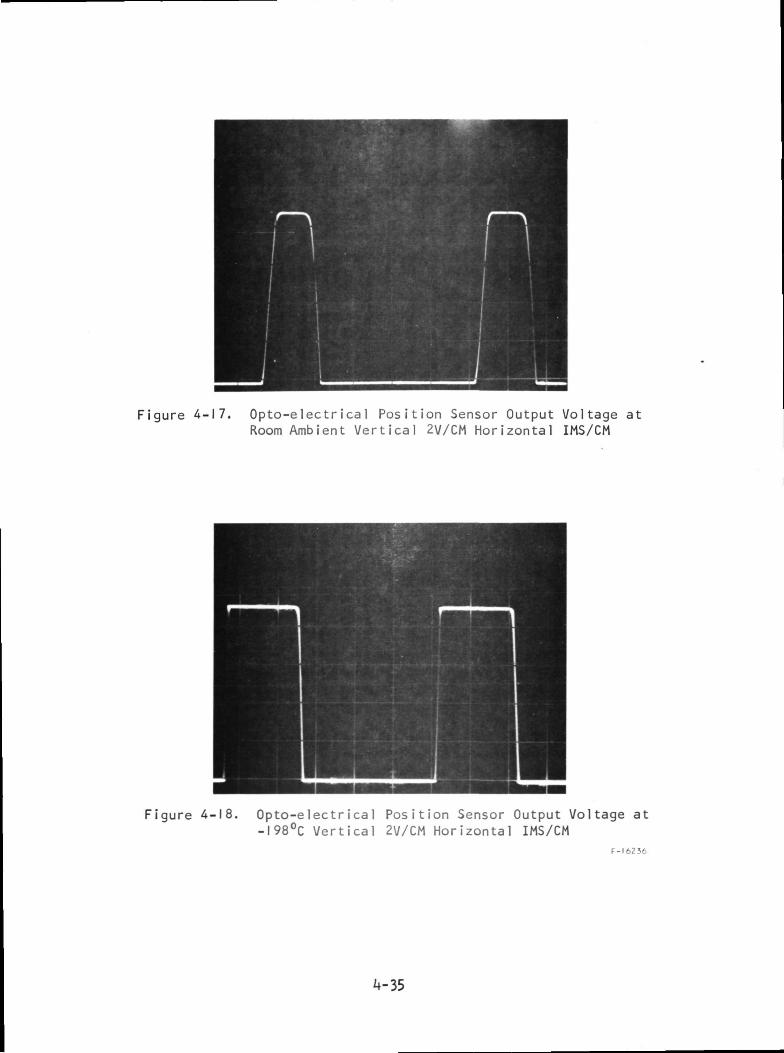
Figure 4-17. Opto-electrical Position Sensor Output Voltage atRoom Ambient Vertical 2V/CM Horizontal IMS/CM
Figure 4-18. Opto-electrica1 Position Sensor Output Voltage at-I98°C Vertical 2V/CM Horizontal IMS/CM
F-16236
-35
This, of course, opened the possibility of introducing improved process controlsand screening techniques, and possibly, the development of an alternate sourceof supply. The effort required to do this was outside the scope of the presentprogram, and since the failure rate of two of six devices was obviously notacceptable, this approach was abandoned.
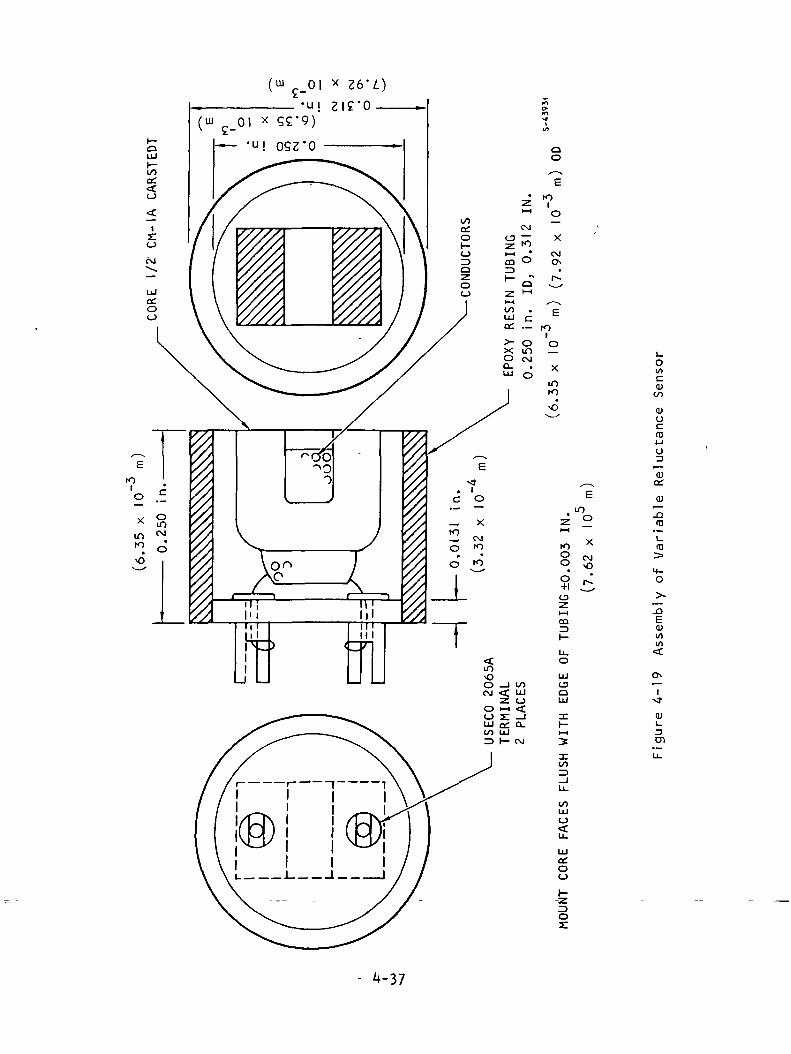
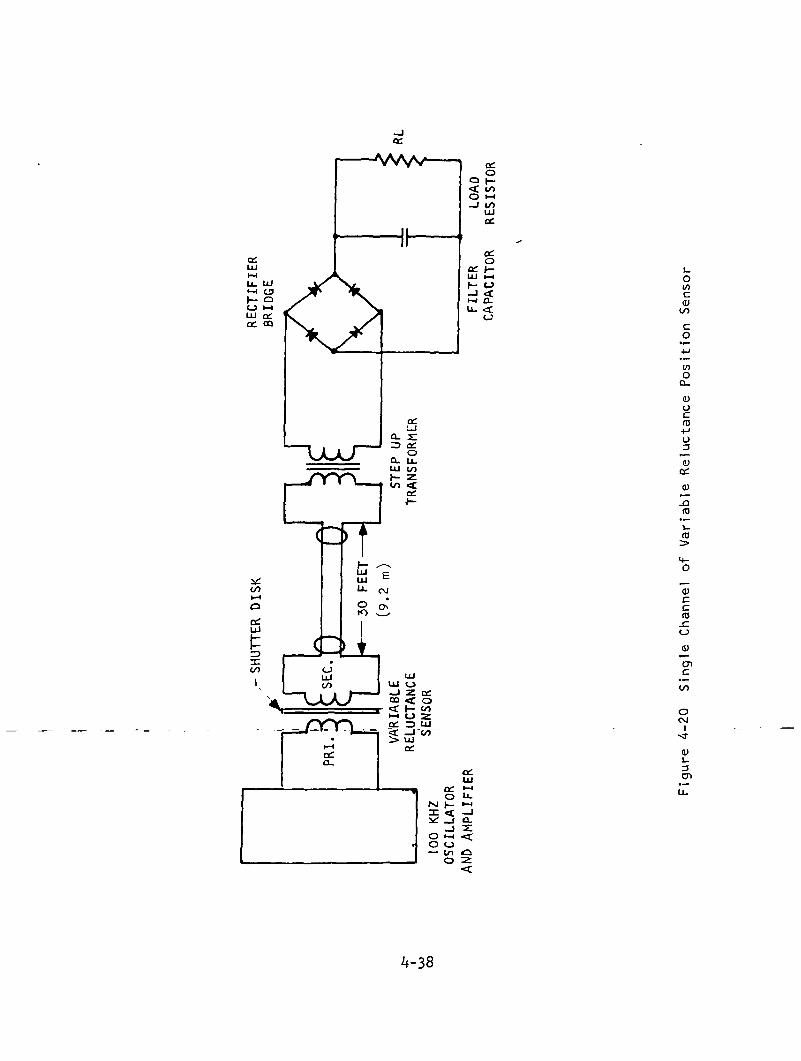
The variable reluctance position sensor consisted of two separate trans-former windings. Each winding was wound on one half of a transformer U typecore. The two halves of the sensor were separated by a gap through which theshutter passed. The primary half was excited by a 100 kHz voltage. If nometal was within the gap area, magnetic flux was coupled from the primary to thesecondary core, and voltage was present at the output. When a metal passedwithin the area of the gap, the flux was decoupled from the secondary core byeddy current shielding, and output voltage was substantially reduced. Fig. 4-19depicts the construction of a sensor, and fig. 4-20 shows schematically theoperation of one position sensor channel.
The core losses are a function of the core size, core material, tapethickness, and the frequency of the exciting voltage. The sensors werefabricated from (l) mil Silectron tape; they dissipated approximately 30 mWeach and showed no measurable change from room temperature to -320°F (-198°C).Use of 1/2 mil tape to reduce dissipation was investigated. The thinnertape had a lower watts-per-pound loss factor, but it also had a lower stackingfactor which resulted in higher flux densities and increased losses. Theoverall sensor tank dissipation could be reduced by using only two positionsensors with external gating circuitry to provide switching logic. However,as previously stated, if one sensor failed, the motor would stop. With a four-sensor system, if one sensor failed when the motor is running, the motor wouldcontinue to run, and it would s t i l l have a 75-percent chance of restarting.
The variable reluctance position sensor required a 100 kHz sine waveoscillator circuit to provide excitation for the sensors. The oscillator wasalso used to provide the required positive and negative low-voltage biasesneeded for the power amplifiers that drive the motor windings. The 100 kHzpower was transmitted to and from the motor by shielded twisted pair conductors.Coaxial cable was not required.
The variable reluctance position sensors were jfj_rst_ character!zed at room __- -^-ambi ent under—the""fol 1'owi iTcrco"ncli tTohsT"
(a) Primary winding: 200T; No. 40 wire, resistance 14 ±3 ohms.
(b) Secondary winding: 650T, No. 44 wire, resistance 100 ±20 ohms.
(c) Core: Carstedt CMI-A
(d) Excitation. 8.5-V rms; 19-ma rms; 100 kHz; voltage andcurrent phase angle = 80 degree
(e) Load. Rectified into a resistor filtered with a capacitor.An impedance matching transformer was not used.
4-36
01 x 26 'Z.)"•u j 2 | £ ' 0 —
(ui 01 x SC'9)
c.0)to
0)u
u
0)or
0)
OJ
l_(D
_oE0)1/1
Sf
(1)
oco
Q I-<f toO 1-1-I to
Oce. HUl t-H
H tJ-J <<-> o-u. <t
L.O!/>C0)toco
oa.
o0]-(-<o
i-m
CDccCO
o0>
encto
oCO
4-38
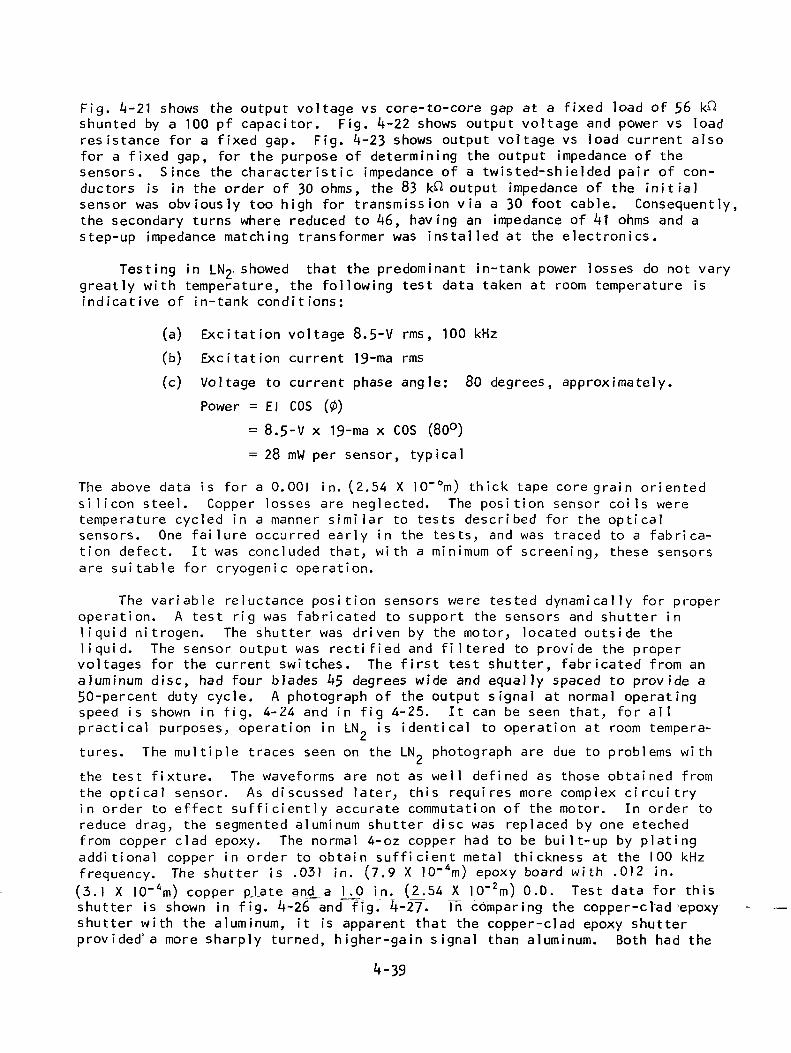
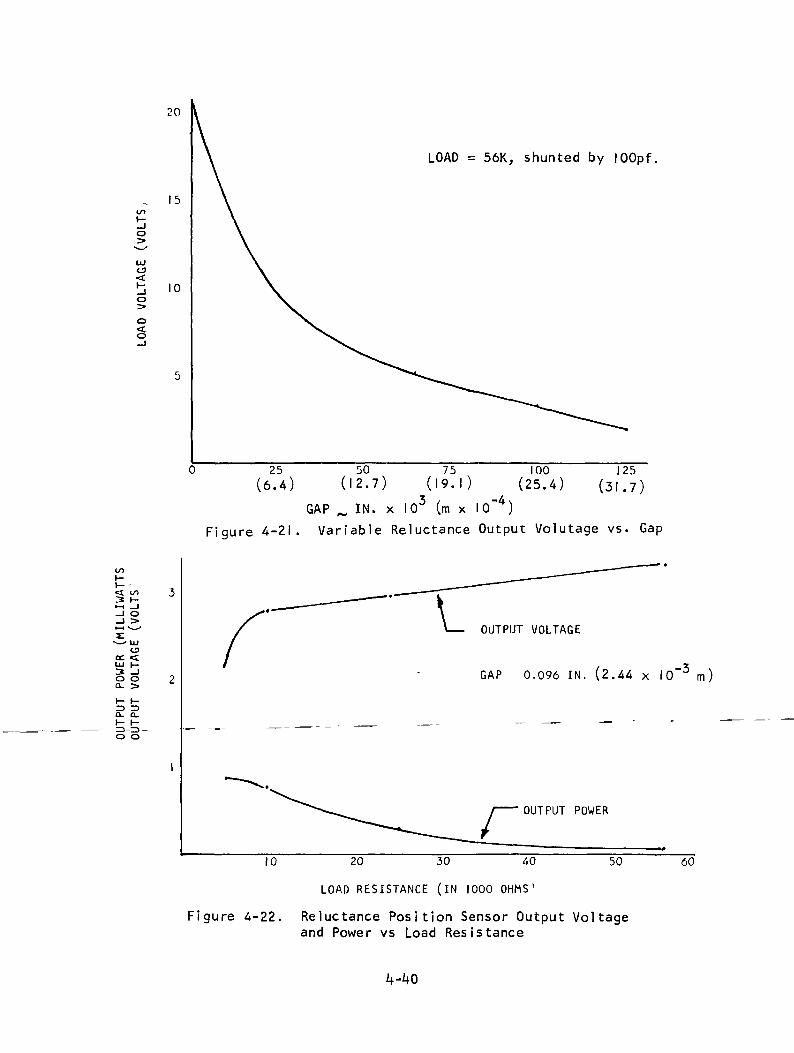
Fig. 4-21 shows the output voltage vs core-to-core gap at a fixed load of 56 k^shunted by a 100 pf capacitor. Fig. 4-22 shows output voltage and power vs loadresistance for a fixed gap. Fig. 4-23 shows output voltage vs load current alsofor a f ixed gap, for the purpose of determining the output impedance of thesensors. Since the character ist ic impedance of a twisted-shielded pair of con-ductors is in the order of 30 ohms, the 83 k^ output impedance of the initialsensor was obviously too high for transmission via a 30 foot cable. Consequently,the secondary turns where reduced to 46, having an impedance of 41 ohms and astep-up impedance matching transformer was installed at the electronics.
Testing in LN£> showed that the predominant in-tank power losses do not varygreatly wi th temperature, the following test data taken at room temperature isindicative of in-tank conditions:
(a) Excitat ion voltage 8.5-V rms, 100 kHz
(b) EXcitat ion current 19-ma rms
(c) Voltage to current phase angle: 80 degrees, approximately.
Power = El COS (0)
= 8.5-V x 19-ma x COS (80°)
= 28 mW per sensor, typical
The above data is for a O.OOI in. (2.54 X ]0~°m) thick tape core grain or ienteds i l i con steel. Copper losses are neglected. The posit ion sensor co i ls weretemperature cycled in a manner s im i la r to tests described for the opticalsensors. One fa i lure occurred ear ly in the tests, and was traced to a fabrica-tion defect. It was concluded that, w i th a minimum of screening, these sensorsare su i tab le for cryogenic operation.
The var iable reluctance posit ion sensors were tested dynamical ly for properoperation. A test rig was fabricated to support the sensors and shutter inl iqu id nitrogen. The shutter was driven by the motor, located outside thel iquid. The sensor output was rect i f ied and f i l te red to provide the propervoltages for the current switches. The f i rst test shutter, fabricated from analuminum disc, had four blades 45 degrees wide and equally spaced to provide a50-percent duty cycle. A photograph of the output signal at normal operatingspeed is shown in tig. 4-24 and in fig 4-25. It can be seen that, for allpract ical purposes, operation in LN? is identical to operation at room tempera-
tures. The mul t ip le traces seen on the LN_ photograph are due to problems with
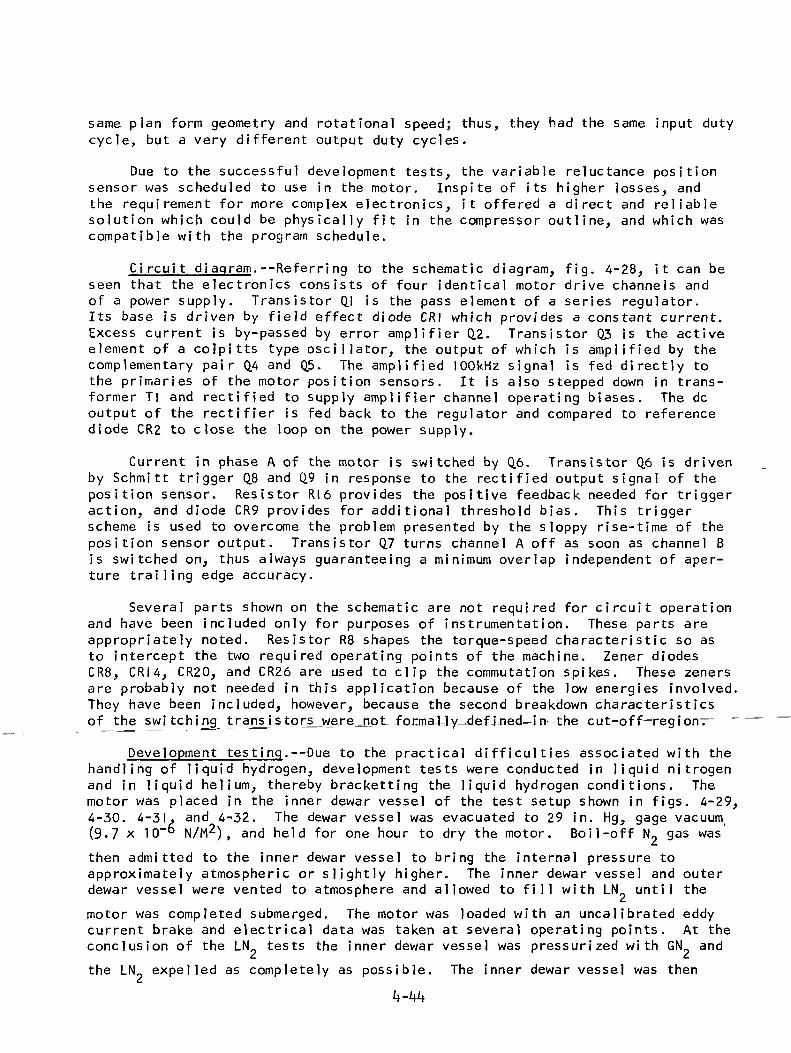
the test f ixture. The waveforms are not as wel l defined as those obtained fromthe optical sensor. As discussed later, this requires more complex c i rcu i t ryin order to ef fect su f f i c ien t l y accurate commutation of the motor. In order toreduce drag, the segmented aluminum shutter disc was replaced by one etechedfrom copper clad epoxy. The normal 4-oz copper had to be built-up by platingaddit ional copper in order to obtain suf f ic ient metal thickness at the 100 kHzfrequency. The shutter is .031 in. (7.9 X 10~4m) epoxy board w i th .012 in.(3.1 X 10~4m) copper plate and_a K_0 in. (^54J<_ KT2ni) O .D . Test data for thisshutter is shown in fig. 4-26 and fig. 4-27- In comparing the copper-clad epoxyshutter w i th the aluminum, it is apparent that the copper-clad epoxy shutterprovided'a more sharply turned, higher-gain signal than aluminum. Both had the
4-39
tnV-
o
o>o
15
10
LOAD = 56K, shunted by lOOpf.
25 50 75 100 125(6.4) (12.7) (19.1) (25.4) (3|.7)
GAP „ IN. x I03 (m x I0"4)Figure 4-21. Variable Reluctance Output Volutage vs. Gap
O OQ- =»
Z3-ZJo o
—•—
OUTPUT VOLTAGE
GAP 0.096 IN. (2.44 x 10 m)-3
OUTPUT POWER
10 20 30 40
LOAD RESISTANCE (IN 1000 OHMS'
50
Figure 4-22. Reluctance Position Sensor Output Voltageand Power vs Load Resistance
60
k-kO
25= 8 3 K a t 5 V
o>ILU
O.i-
O
SLOPE AT OPERATING POINT
NORMAL OPERATING POINT
0. 0,2
LOAD CURRENT - MA
0,3 \ 0,4
\
0,5
Figure 4-23 Sensor Load Characteristics
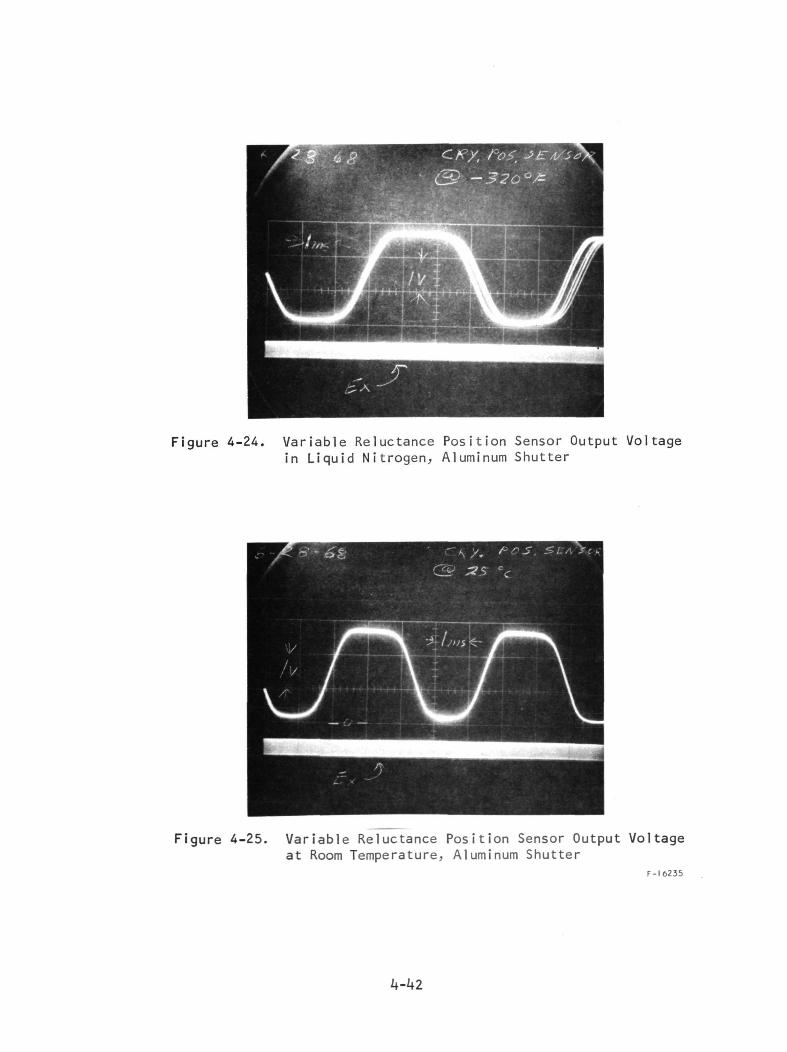
Figure 4-24. Variable Reluctance Position Sensor Output Voltagein Liquid Nitrogen, Aluminum Shutter
Figure 4-25. Variable Reluctance Position Sensor Output Voltageat Room Temperature, Aluminum Shutter
F-16235
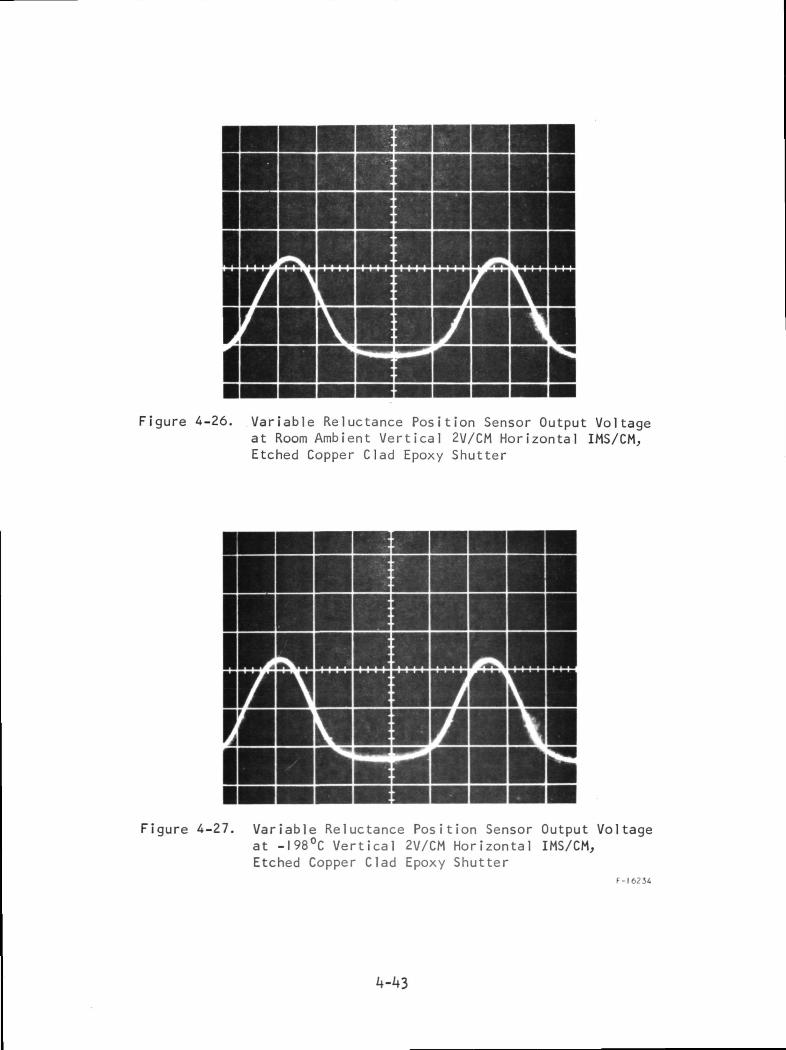
Figure 4-26. Variable Reluctance Position Sensor Output Voltageat Room Ambient Vertical 2V/CM Horizontal IMS/CM,Etched Copper Clad Epoxy Shutter
Figure 4-27. Variable Reluctance Position Sensor Output Voltageat -I98°C VerticalEtched Copper Clad
2V/CM Horizontal IMS/CM,Epoxy Shutter
F-I62J4
same plan form geometry and rotational speed; thus, they had the same input dutycycle, but a very different output duty cycles.
Due to the successful development tests, the variable reluctance positionsensor was scheduled to use in the motor. Inspite of its higher losses, andthe requirement for more complex electronics, it offered a direct and reliablesolution which could be physically fit in the compressor outline, and which wascompatible with the program schedule.
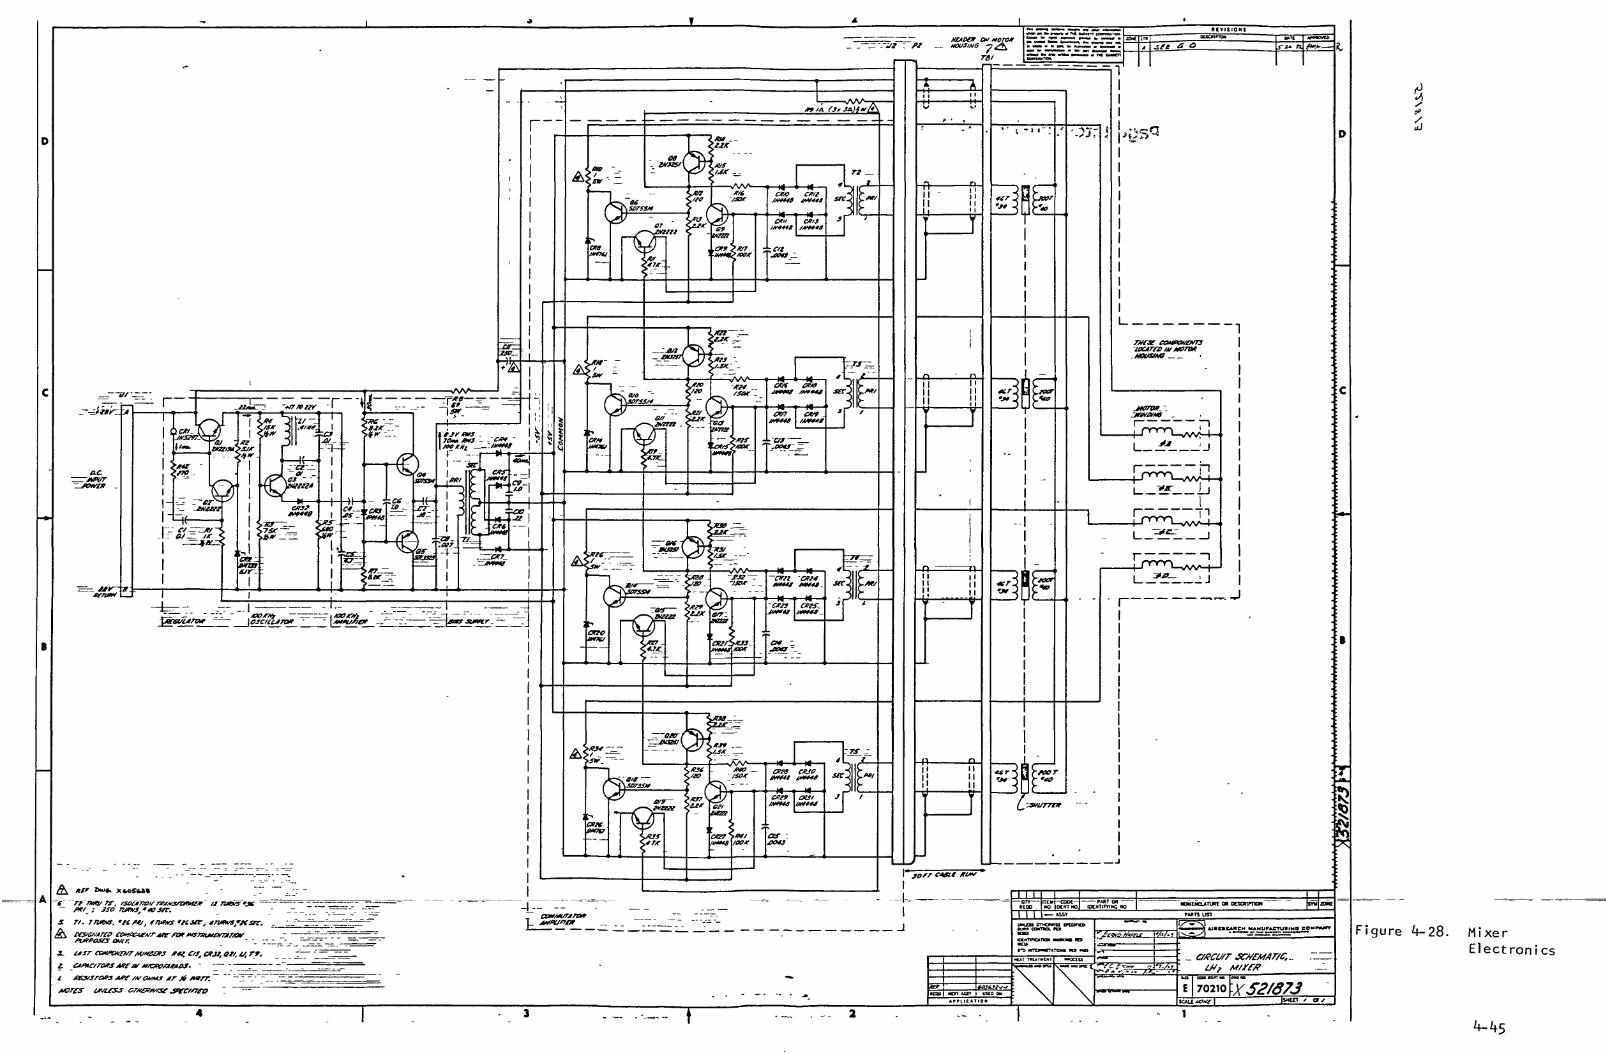
Circuit diagram.--Referring to the schematic diagram, fig. 4-28, it can beseen that the electronics consists of four identical motor drive channels andof a power supply. Transistor Q.I is the pass element of a series regulator.Its base is driven by field effect diode CRI which provides a constant current.Excess current is by-passed by error amplifier Q.2. Transistor Q3 is the activeelement of a colpitts type oscillator, the output of which is amplified by thecomplementary pair Q4 and Q.5. The amplified 100kHz signal is fed directly tothe primaries of the motor position sensors. It is also stepped down in trans-former T| and rectified to supply amplifier channel operating biases. The dcoutput of the rectifier is fed back to the regulator and compared to referencediode CR2 to close the loop on the power supply.
Current in phase A of the motor is switched by Q.6. Transistor Q.6 is drivenby Schmitt trigger Q.8 and Q.9 in response to the rectified output signal of theposition sensor. Resistor RI6 provides the positive feedback needed for triggeraction, and diode CR9 provides for additional threshold bias. This triggerscheme is used to overcome the problem presented by the sloppy rise-time of theposition sensor output. Transistor Q.7 turns channel A off as soon as channel Bis switched on, thus always guaranteeing a minimum overlap independent of aper-ture trailing edge accuracy.
Several parts shown on the schematic are not required for circuit operationand have been included only for purposes of instrumentation. These parts areappropriately noted. Resistor R8 shapes the torque-speed characteristic so asto intercept the two required operating points of the machine. Zener diodesCR8, CRI4, CR20, and CR26 are used to cl i p the commutation spikes. These zenersare probably not needed in this application because of the low energies involved.They have been included, however, because the second breakdown characteristicsof the switcjiijTg J rajTSj s tors^were _nQt_for.ma-U.y^def-kied^in—the cut-of f-regionT -^~
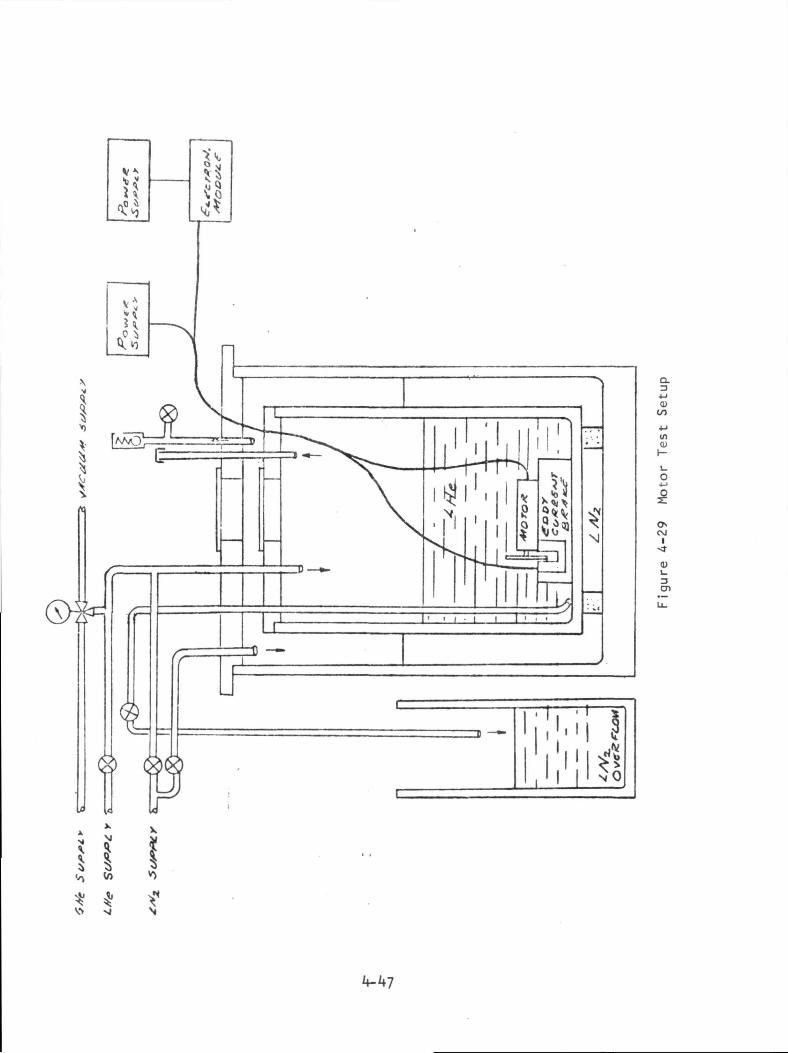
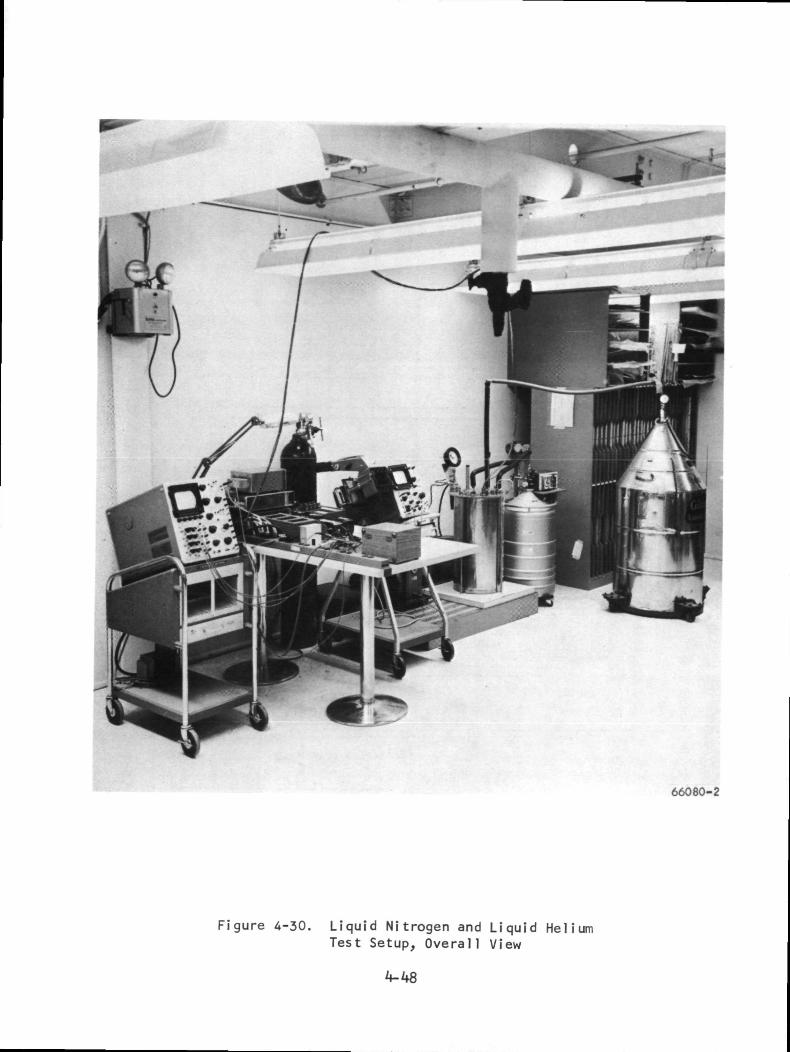
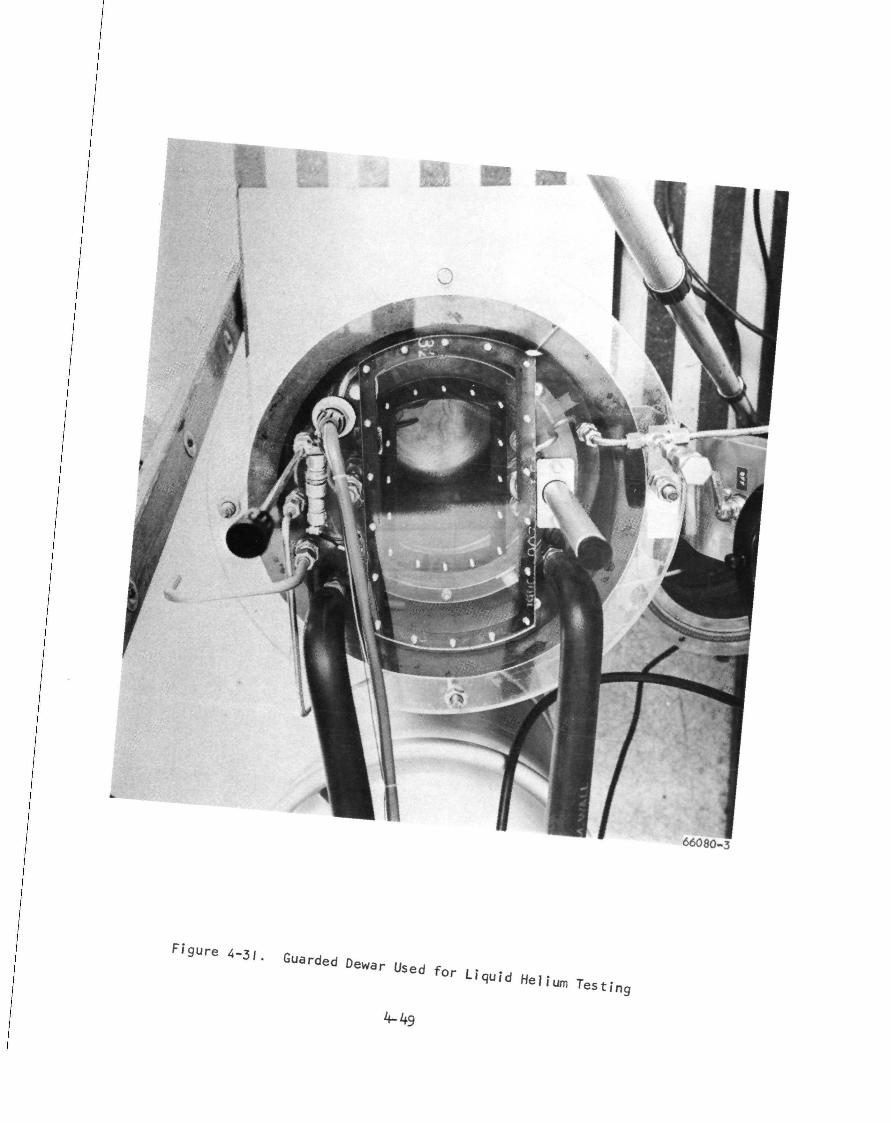
Development testing.—Due to the practical difficulties associated with thehandling of li q u i d hydrogen, development tests were conducted in liq u i d nitrogenand in l i q u i d helium, thereby bracketting the liquid hydrogen conditions. Themotor was placed in the inner dewar vessel of the test setup shown in figs. 4-29,4-30. 4-31, and 4-32. The dewar vessel was evacuated to 29 in. Hg, gage vacuum(9.7 x 10~° N/M2), and held for one hour to dry the motor. Boil-off N2 gas was
then admitted to the inner dewar vessel to bring the internal pressure toapproximately atmospheric or slightly higher. The inner dewar vessel and outerdewar vessel were vented to atmosphere and allowed to f i l l with LN until the
motor was completed submerged. The motor was loaded with an uncalibrated eddycurrent brake and electrical data was taken at several operating points. At theconclusion of the LN tests the inner dewar vessel was pressurized with GN and
the LN expelled as completely as possible. The inner dewar vessel was then
k-kk
HEJtDfJf Off MOFO*ft HOU3MS -;^
rsi
( rr natyrr, /seam*/mtafarm* a mea: jso run/s'taser.
Figure 4-28. Mixer
Electronics

Page Intentionally Left Blank
CL=1-J-iOJ
CO
4-1inttj
•_O
00I
3cn
66080-2
Figure 4-30. Liquid Nitrogen and Liquid HeliumTest Setup, Overall View
66080-3
R9ure 4-31. Guard,Dewar Used for i
f°r L'um Testing
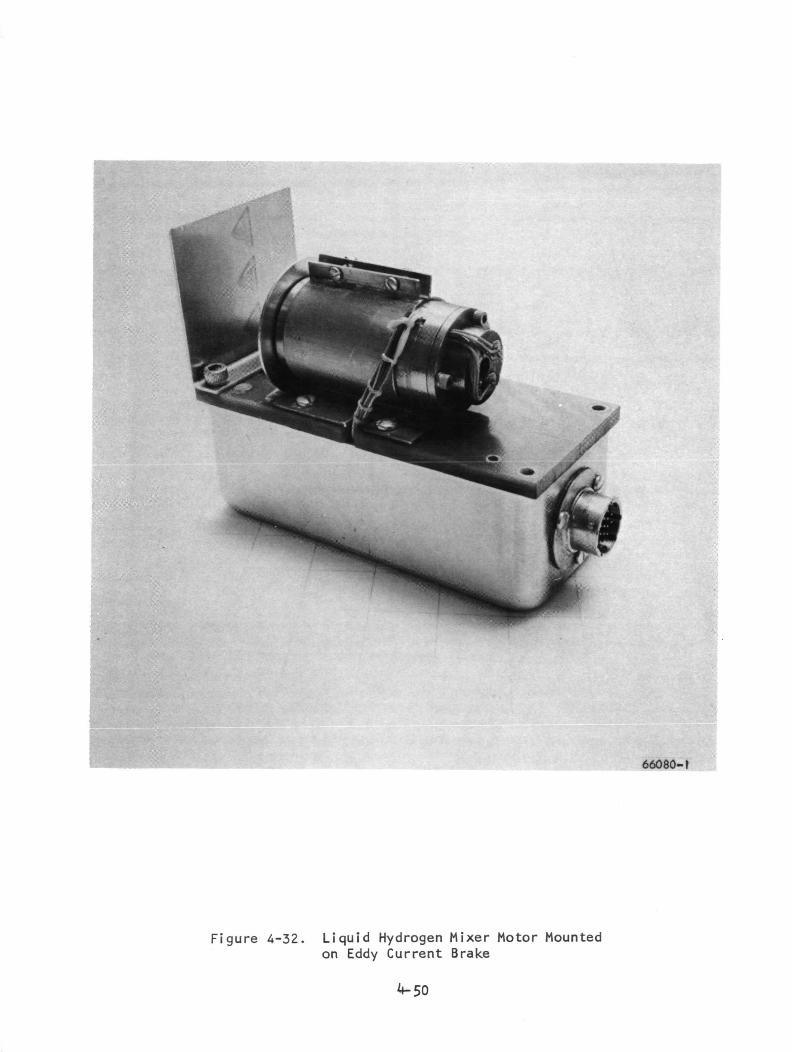
66080-1
Figure 4-32. Liquid Hydrogen Mixer Motor Mountedon Eddy Current Brake

evacuated to approximately 29 in. Hg, (9.7 X 10"6 N/MZ) gage vacuum, to remove theLN? remaining w i t h i n the motor. At a pressure of 29 in. Hg, gage vacuum, nitrogenfreezes, so the motor was checked for rotation briefly, to assure no blockageof the bearings due to frozen nitrogen. Boil-off helium was then admitted tothe dewar vessel, bringing the pressure of the inner dewar vessel to approxi-mately one atmosphere. With the inner dewar vessel vented to atmosphere, f i l l -ing with LHe continued until the motor was completely submerged. The motor wasagain operated with the eddy current brake to obtain performance data in l i q u i dheli urn.
The significant results of the above tests are summarized in fig. 4-33 forl i q u i d nitrogen and in fig. 4-34 for l i q u i d helium. These speed-power curvesshow three lines. The highest power line represents the input power to theelectronics or total power input. The middle line is the input power to themotor itself, and the lower line represents the electromagnetic power availablein the motor. The first two lines represent measured data, excluding thepower supply in the first case and the 112 mW of sensor power in the secondcase. The electromagnetic power was calculated as follows:
Torque x Speed= I 352
where torque is in in.-oz and speed in rpm. The torque was calculated for eachoperating point using the torque constant of the motor and the measured averagemotor current. The successful completion of these tests indicated that themotor and its associated electronics are fully capable of operation in the cryo-genic fluid, and layed the ground work for final tests and calibration with theimpeller attached.
In all cryogenic testing, it was necessary to p u l l a vacuum of 29.5 in. Hg(9.9 X 10"6 N/M2) or greater to remove moisture before immersing in cryogenicf l u i d or the bearings would freeze. It was also found that leakage of nitrogengas from the guard dewar into the l i q u i d helium dewar produced "nitrogen ice"which would also block the bearings.
Fabri cation
Fabrication of the mixer and motor was basically straightforward. Theproblem areas were the stator windings, position sensor coils, welding of themounting base to the electrical connection header and physical handling of smallscrews in the position sensing-commutating section of the motor, see fig. 4-3.
The stator windings are of No. 39 magnet wire with the i. d. formedby a mandrel. It was necessary to be very careful in removing the mandrel toprevent wires from breaking. Several different mold release agents were triedwith the most successful being M i l l e r Stepphensen MSI22 Flurocarbon. It isbelieved that use of a mandrel with removable conical ends might improve thisprocedu re.

Temp = I40°R (78°K)
LO
4-1
0)
6coo
Wi thoutbrake disk
Electromagnetic power
1000 2000 3000
Motor speed, rpm
400'1 5000
Figure 4-33. Motor Performance Test in Liquid Ni t rogen
4-52
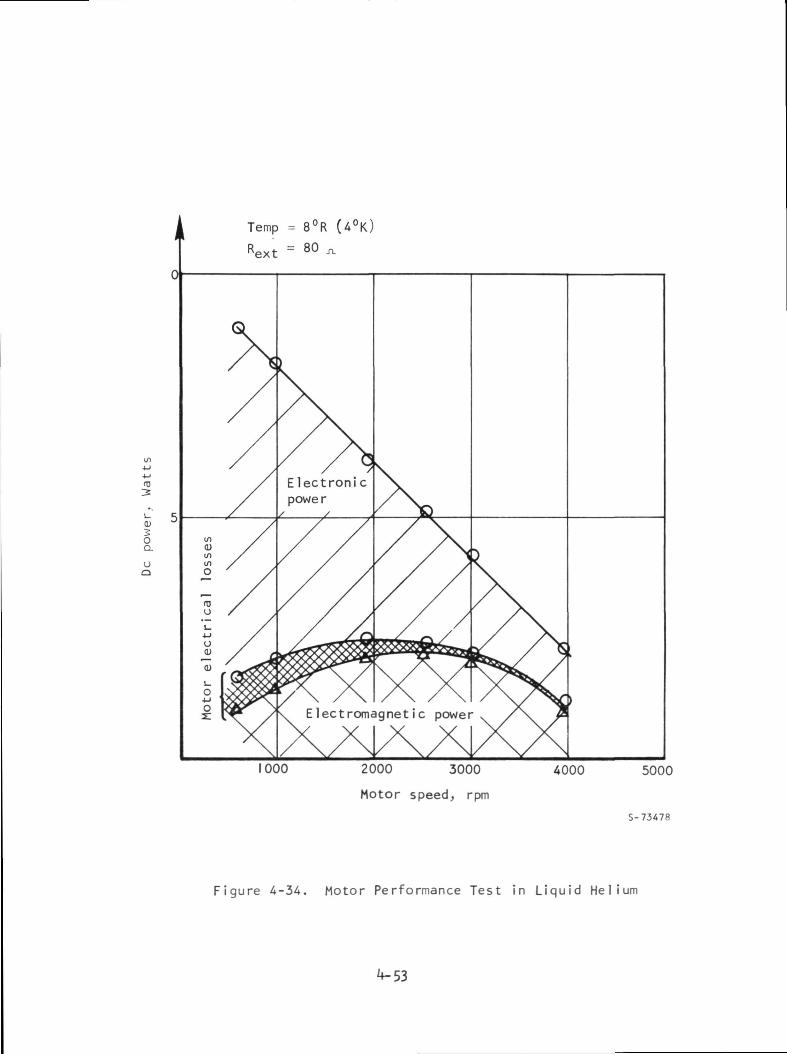
Temp = 8°R (4°K)
uQ
Electromagnetic power
1000 2000 3000
Motor speed, rpm
4000 5000
S-73478
Figure 4-34. Motor Performance Test in Liquid Helium
The position sensing coils are made of No. kk magnet wire on laminatedcores. These coils were hand wound with great care. After the sensors werewound, they were potted and the "gap" end was ground flush. The problems werethat the wire broke during winding and there was a tendency of the core laminationto cut through the wire insulating varnish, shorting the coils. In addition,when the surface of the potted sensor was ground to the proper dimension, therewas a chance that a strand of wire might be cut through. In a l l , three sensorshad to be started to finish with one useable device. It is believed that aspecial lamination stack deburring procedure and more sophisticated encapsulationtooling would considerably reduce the number of parts lost in fabrication.
The electrical connection header uses a manufacturer's standard fusedglass insulator with conductor pins and a metal ring around the outside. Thismetal ring was electron beam welded to a stainless steel mounting plate. Atotal of five pieces was obtained and attempts made to weld the mounting plate.In each instance the glass cracked. One piece, having only a small crack wasthermally shocked by dropping into a container of l i q u i d nitrogen. The partwas not further damaged, so it was used. It is believed that a special orderpart with the glass fused directly to the mounting plate could be made withoutdifficulty. For such a header there would be special tooling and a long leadtime would be involved.
The positioning sensors must be mounted to the shaft of a dc brushlessmotor. The most logical place was at the end of the shaft opposite the impeller.The location and overall dimensions reduced all sizes and resulted in some screwsas small as No. 0 being used. Parts of this size are difficult to handle andcare must be taken in torquing such screws. Within the constraints of therequired performance of the machine, there appear to be few options regarding thesize of fasterner to use.
There are a number of considerations involved in assuring that the statorassembly is properly fabricated. There are no iron teeth in the stator assemblyto guarantee the winding position and flux linkage. A Teflon liner for thestator ID was i n i t i a l l y tried to protect the stator windings from damage whenremoved from the assembly mandrel. This liner shrunk excessively during low-temperature operation, causing the rotor to drag. A loose-weave glass clothliner replaced the Teflon and bonded well enough to eliminate the problem.Proper tooling must be fabricated and test procedures instituted to achieveconsistently good production stators. The brushless dc motor stators whichAiResearch makes in production are b u i l t using a fixture which simulates thelocating feature of normal stator iron teeth. The windings, after they are inplace, are tested statically and dynamically. The static test is a resistancemeasurement which assures that all connections are properly made and that thenumber of turns and wire size in each phase is correct. The dynamic testconsists of operating the stator with a rotating magnetic field as a generator.The phase terminal voltage and line-to-line terminal voltages are measured.Compliance with this type of test provides assurance that the deeign flux-linkageshave been obtained. Reversed coils, shorted turns, or poor geometrical wirelayout would be detected here. All tests are repeated after encapsulation.The test generator would not fit the stator used in this motor and since onlyone unit was being b u i l t , a new generator was not fabricated.
In that the cryogenic mixer motor was the first of its size b u i l t , therewas some difficulty in establishing the actual flux-linkage level. Thisnecessitated one winding design change. Because of the one unit requirementof this program, production test fixtures for this size hardware were not built.Comparable tests were accomplished using the motor rotor and a test housing.
Evaluation
The mixer was tested to:
(a) Insure that it operated in LH?, GH?, GHe with "slugging" flow of
mixtures of l i q u i d and gaseous hydrogen.
(b) Measure its performance in each of the above fluids.
(c) Determine the condition of the unit after 100 hr of operationin LH2.
(d) Evaluate the measured performance and efficiencies with respect tothe values calculated during design.
Demonstrations of unit performance in each test f l u i d (LH?, GHL and GHe) were
accomplished at the Lockheed Missies and Space Company Cryogenics Systems TestFacility at Santa Cruz, California. Pressure rise, flow rate, operating speedand input power to the total system (electronics and motor driven mixer) andto the motor were measured.
At the start of testing at Santa Cruz, an irregularity in the shape of twoof the switching transistor current waveforms was observed. All other waveformshad the correct shape. This had gone undetected in preliminary checks at roomtemperature and in l i q u i d nitrogen because only two transistors were looked atby a dual-beam scope to check commutation. The trouble was found to be areversed coil in one of the stator windings. This was not detectable withnormal resistance and inductance measurements because of the nature of thestator and of the problem. The reversed coil could only be detected with thestator electrically excited and a search coil used to measure the field created.This stator had replaced the original stator used for LHe testing because theoriginal stator was damaged during removal from the LHe test housing.
During the i n i t i a l investigation of the motor waveform problem, a routinecheck of the power supply voltages revealed that the ±5-V biases were at about±2.5 V. Investigation of this problem led to the conclusion that this was nota recent "failure" but that this condition had existed undetected for sometime. A close look at the data taken during previous motor tests indicated thatthis voltage was low during those tests, and also that the motor performancewas v i r t u a l l y unaffected by this low voltage. The low voltage was caused by alow gain transistor in the series regulator. When the series regulator transis-tor was replaced, the power supply voltages were restored to the correct levels.During the checkout of the power supply problem, the power consumption of the
magnetic shaft position sensors was measured, and appeared to have increasedsubstantially over e a r l i e r measurements.
After eliminating the p o s s i b i l i t y of significant characteristic changesin the position sensor exciters, a review of the measurement techniques wasconsidered necessary. Careful investigations showed that the low value sampl-ing resistors used to measure excitation current do have a significant reactanceat the 100-kHz excitation frequency. The particular O.l-ohm resistor which wasinstalled on the breadboard indicated a phase shift in the order of 20°, depend-ing on its lead length and on the exact point of measurement. Calculations nowshow that the phase shift errors can be reduced to a tolerable level, in theorder of 1°, if a l-ohm carbon resistor is used for current sampling. To thisend, the breadboard was modified and new readings of power consumption weretaken. The power consumption of the position sensor is now established to bein the order of 112 mW. This value can be reduced to about 70 mW if the ampli-tude of the 100-kHz oscillator is reduced by approximately 40 percent. Thisreduced amplitude is more than adequate for proper operation. However, sincethis change required a new excitation transformer, it was not incorporated inthe present breadboard.
After making the changes to the motor and to the breadboard as notedabove, the mixer was operated in both l i q u i d nitrogen and l i q u i d helium inorder to check its cryogenic performance as well as to affirm the v a l i d i t y ofe a r l i e r test results. The load changes required in order to sample the torque-speed characteristic were obtained by varying the depth to which the impellerwas submerged in the cryogenic fluids. A plot of this data showed very goodagreement with the previous cryogenic development test, and thus the calibra-tion data obtained in the'past is v a l i d with the exception of the power lost inthe position sensor excitation.
New bearings were installed in the unit and the unit was tested in l i q u i dnitrogen and l i q u i d helium prior to going into test at Santa Cruz. The testsetup at Santa Cruz was also found to contain "goose-necks" in which l i q u i dcould become trapped, resulting in erroneous pressure readings. These wereeliminated before testing was resumed. The testing is reported in LockheedReport LMSC/73465, which included in this report as Appendix A. The mixer wasfirst calibrated in GH? then in LhL- The total pressure rise was 2.27 in H^O
2 -33(565 N/m ) at 5.0I cfm (2.36 x 10 m /sec) as opposed to the design goal of2.0 in. HO. There were no design goals for GH~ operation. The next test was
an endurance test of 87 operating hours in LH?. Shortly after starting this
test, a decrease in speed from approximately 2550 rpm to approximately 2250 rpmwas observed. Since there was no evidence of distress, testing was continuedand the u n i t successfully operated for 87 hr in LH?, one hour (approximately)
of which was in slugging ( l i q u i d and gas mixture) flow. The GHe calibrationwas then performed and I 2 hr of endurance testing in GHe were completed.
At the conclusion of the test it was found that the 5-W 68-Q shapingresistor had been damaged by some unknown mechanism and its resistance hadincreased to 120 Q. This increase in resistance was responsible for theobserved reduction in the LH£ endurance test operating speed. It also reducedthe operating speed in GHe.
The actual resistance of the shaping resistor can be determined by calcu-lating the voltage drop across the resistor and d i v i d i n g by the motor current.(The transistor switch drop is insignificant.) Because of the accuracy of themeter readings involved in this calculation some inconsistency in values at agiven load condition can be seen. However, a basic trend showing resistordegration and a change in value from approximately 65 0 to approximately 120 Qover the test period can be established. This occurred because inadvertently awi re -wound resistor was not used.
The speed at which a dc motor w i l l run is established when the sum of thegenerated back emf and the voltage drop in the stator winding is equal to thevoltage at the motor terminals. Thus, knowing the motor voltage, the back emfconstant (volts/rpm) and the motor current, the effective motor winding resist-ance (Rfp) can be calculated.
Motor Voltage - (Back emf Constant) (RPM)m Motor Amps
Using this relationship with the test data of LMSC/73^65 Report pages 12, 13,and ]k, it appears the motor winding resistance per phase varies from 8.5 ohmsto 16 ohms, the higher values being associated with the higher current. Againthe accuracy of the readings reflect in this calculation, but the fundamentalresult indicates that the basic resistance of the winding is higher than assumedfrom analytical data on pure copper at cryogenic temperatures. This may be dueto impurities in the copper magnet wire and internal heating due to the motorcurrent. Increasing this current correspondingly increases the stator I^R losswhich tends to increase the stator resistance.
The -performance in GHe was calculated for the mixer operating with a 68-0res istor.
N _ NCORR - OBS
- 68VMTR - 120
2But, I is proportional to T and, for a fan, T is a function of N ; therefore,
2I is a function of N
CORR OBS \N /
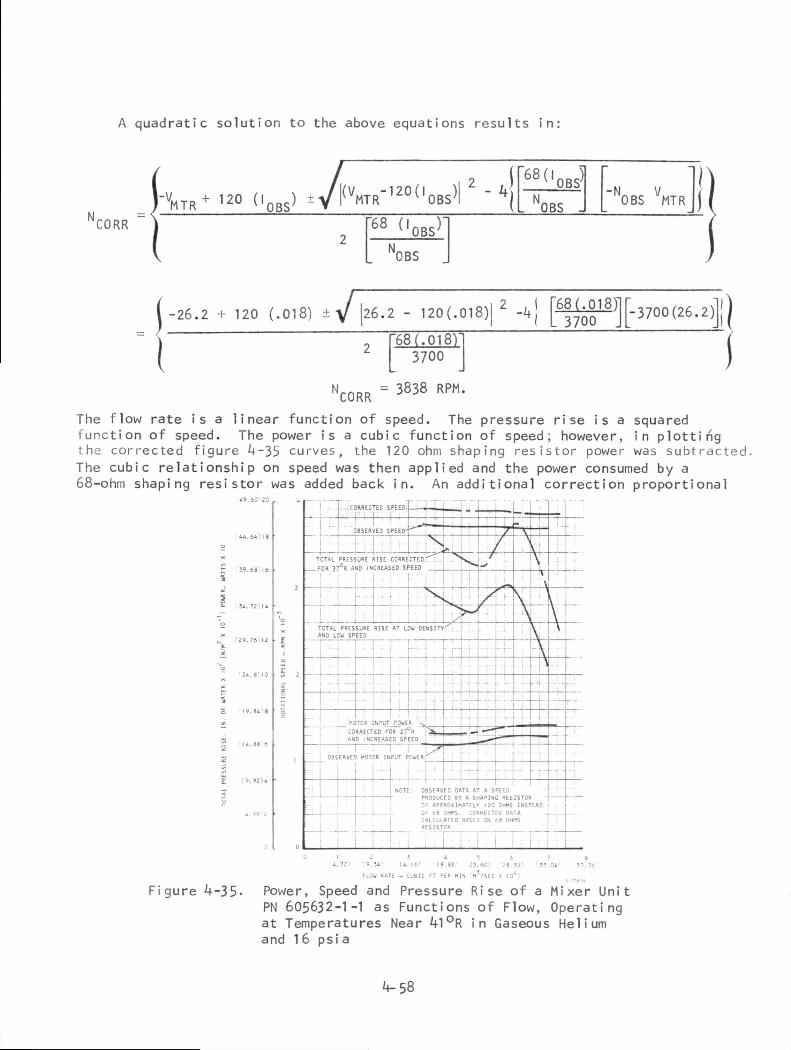
A quadratic solution to the above equations results in:
CORR
;
/ 2 f' V MTR + 12° COBS) ±Y I (VMTR-12° ( IOBS)| ' 4(
2"68 COBS)'
NOBS
"68(IOBS)
. NOBS"NOBS VMTRjj
( -26 .2 + 120 (.018) ±V 26.2 - 120(.018) |2 -it] [68J^18)][-3700(26.2)]|t • - - • • • "" ^™" f~,. f^ f „ ^ rt \ "i
I"68 (.018)'
3700
N CORR ^ 3838
The f low rate is a linear function of speed. The pressure r ise is a squaredfunction of speed. The power is a cubic function of speed; however, in plott ingthe corrected figure 4~35 curves, the 120 ohm shaping res is to r power was subtracted.The cubic relat ionship on speed was then applied and the power consumed by a68-ohm shaping resistor was added back in. An additional correction proportional
TOTAL PRESSURE RISE CORRECTED
FOR 37°R AND INCREASED SPEED
r.OTCR INPUT POWER
CORRECTED FOR 27°R<-ND INCREASED SPEED
NOTE: OBSERVED DATA AT A SPEEDPRODUCED BY A SHAPING RESISTOR
CALCULATED BASED ON f.8 OHMSRESISTOR
'9.34' 14.16' IB. 88s '23.60! 28. !2
FLOU RATE ~ CUBIC FT PER nIN 'N/S£C X l
Fi gure 4-35- Power, Speed and Pressure R i s e of a Mixer UnitPN 605632-1-1 as Functions of Flow, Operatingat Temperatures Near 4l°R in Gaseous Heliumand 16 psia
4-58
to the density change was then made. The dashed curves of fig. 4-35 werecalculated from those relationships to account for the speed increase operatingwith a 68 ohm resistor. The total pressure rise was calculated to be 0.166 in.HO or 20.5 percent lower than the design goal of 0.2 in. HO. If the 0.2-in.
HLO pressure rise were required in gaseous helium, the best method of achieving
it would be by reducing the impeller tip diameter to 1.69 in. (from 1.8 in.)and increasing the motor speed by 9 percent in GHe and 13 percent in LH_ .
Figs. 4-36 through 4-40 are plots of measured performance and calculated ef f i -ciences in LH. , GH_ and GHe. The curves are smooth plots to show the true
performance rather than exactly joining every data point. The rotational speedand flow rates were taken directly from test data. The test measured pressurerise from total-to-stati c. The pressure rise was converted to a total-to-totalbasis by adding one velocity head as discussed under design philosophy. Inputpower to the electronics was the product of applied emf and applied current.Motor power (in tank power) is the product of motor emf and current plus thepower lost in the position sensors less the power returned from the motor tothe electronics and dissipated in the electronics as switching losses. Theposition sensor losses were measured and found to be 112 mW. The switchingpower is composed of two components: (1) the energy dissipated in the switching
I 2transistor is — — , and (2) the I R in the current sensing resistor. In LH at
6.02 cfm there are:
(I.45X ,0-2) I2/2
PWRD = I2R
K
R = in
PWRD = (0. I I6)2 (l) = 0.0135 W
K
In-tank efficiency" is fluid dynamic power divided by motor input power.
1 1.7 x io"2 (CFM)APE + PWR - PWRmtr mtr sensors switch
Yinn
At 6.02 cfm (2.84 X I0~3m3/sec), ARt = 1.94 in H^ (358. N/m )
4-59
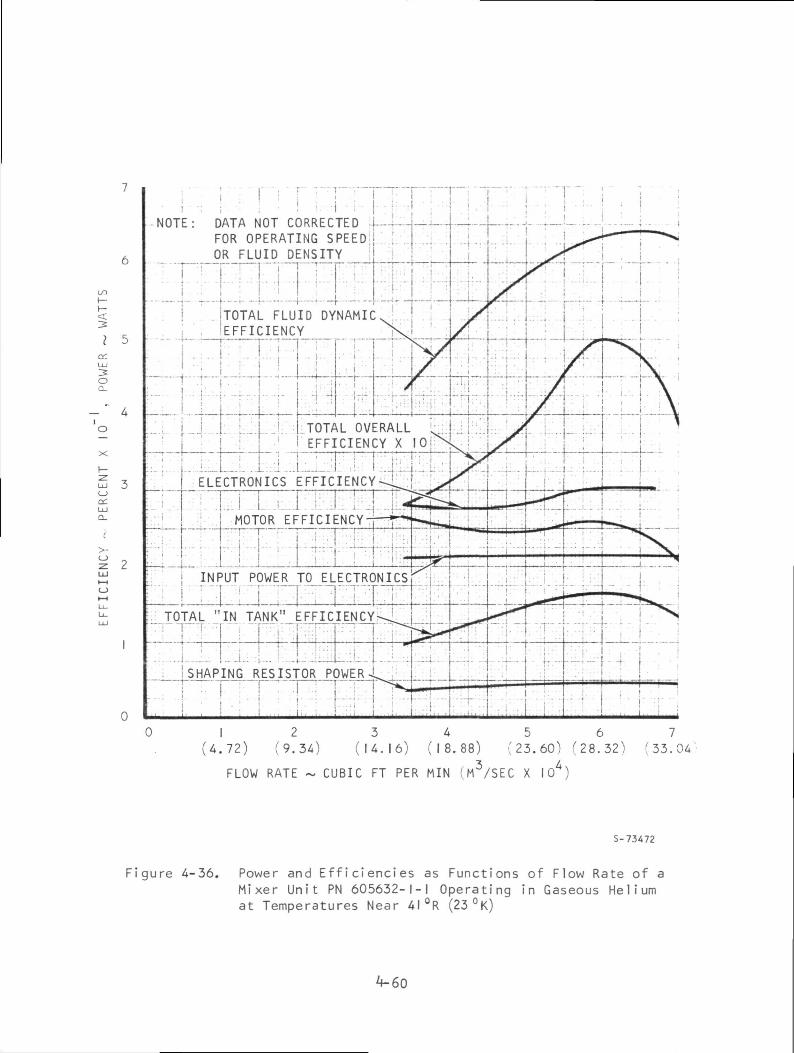
I 5aLLJ3
o
-I-5 3cc.LU
L
TT~]
NOTE: DATA NOT CORRECTED -I—UFOR OPERATING SPEED;OR FLUID DENSITY_
I I ' I ' '
TOTAL FLUID DYNAMICEFFICIENCYn
TOTAL OVERALLEFICIENCY X IO
ELECTRONICS EFFICIENCY^
MOTOR EFFICIENCY
INPUT POWER TO ELECTRONICS
TOTAL "IN TANK" EFFICIENCY—T—F
SHAPING RESISTOR POWERT~l—
h
1 2 3 U 5 6 7>.72) (9.34) (K.I6) (18.88) (23.60) (28.32) (33.04
FLOW RATE ~ CUBIC FT PER MIN (M3/SEC X I04)
S-73472
Figure 4-36. Power and Ef f ic iencies as Functions of Flow Rate of aMixer Unit PN 605632-1-1 Operat ing in Gaseous Hel iumat Temperatures Near 41°R (23°K)
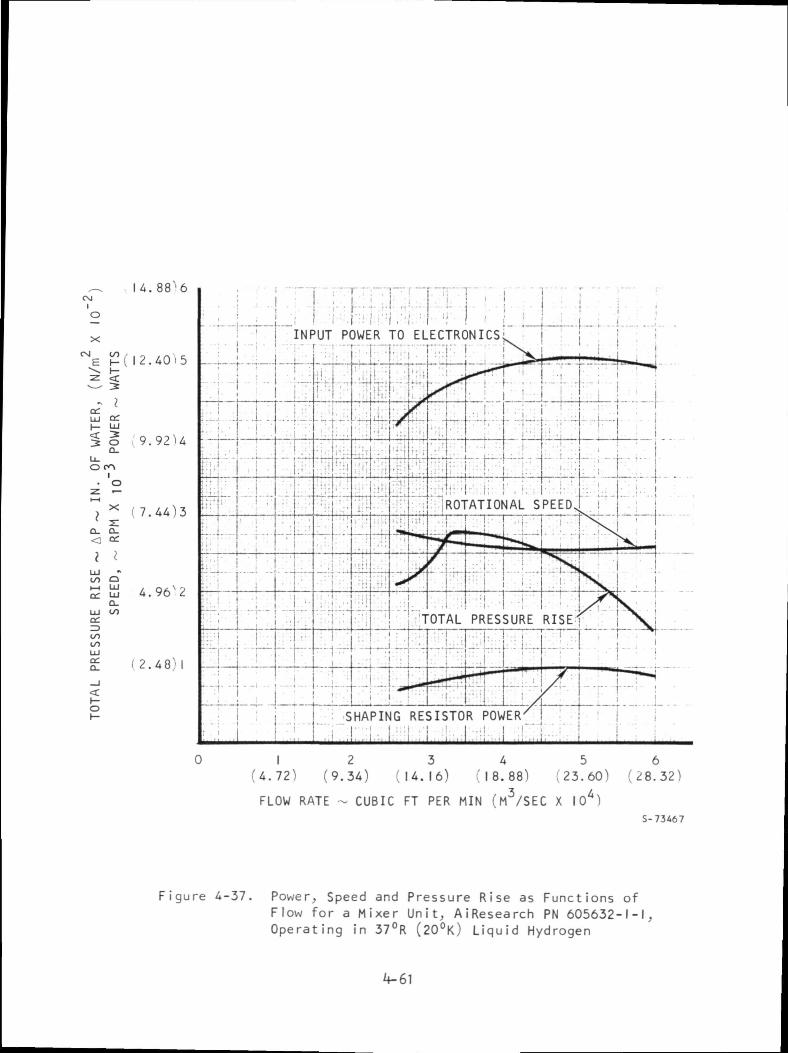
U. 8 8 ' 6CM
o
( 1 2 . 4 0 1 5
uj(_
<
o >'9a. 92U
Io
X (
2:Q_
•
UJQC
OUJ
Q.1/5
00
, Q, \ r,4. Vo ^.
( 2 . 4 8 ) 1
i '•" I FfTF-I M'INPUT POWER TO ELECTRONICS
..H- M
TOTAL PRESSURE RISE-T |—_. -r
_L_:_J i : L_J L/\ L_i_i_4SHAPING RESISTOR POWER^
0 1 2 3 4 5( 4 . 7 2 ) (9.34) ( 1 4 . 1 6 ) ( 1 8 . 8 8 ) (23.60)
FLOW RATE ~ CUBIC FT PER MIN (M3 /SEC X I04)
62 8 . 3 2 )
S- 73467
Figure 4-37. Power, Speed and Pressure R ise as Funct ions ofFlow for a Mixer Unit, AiResearch PN 605632-1-1,Operat ing in 37°R (20°K) Liquid Hydrogen

00
h-I—=t
?
OCL
O
X
ceUJ
, M- r • : • • y t - r i——| r—I- j u_-;-,U_l—*_ ._
I . | 'ELECTRONIC'EFFICIENCY^
" II ' ! . !.:„!. .LM_...L.
MOTOR EFFICIENCY.__ —r -
v ! i ; -
• • •j.r_j. .4._U__J——_ _r; i i
FLUID DYNAMICEFFICIENCY_.._.
; i .TOTAL "IN TANK"EFFICIENCY
i MOTOR INPUT POWER
TOTAL OVERALLEFFICIENCY
0 I 2(4.72) (9.34)
3 4 5 6(U.I 6) ('18.881 (23.60) (28.32)
MIXER VOLUMETRIC FLOW RATE - CUBIC FT PER MIN (M3/SEC X I04)
S-73469
igure 4-38. E f f i c i e n c i e s and Motor Power as Functions of Flowfor a Mixer Unit, A iResearch PN 605632-1-1 Operat ingin 37°R (20°C) Liquid Hydrogen
4-62
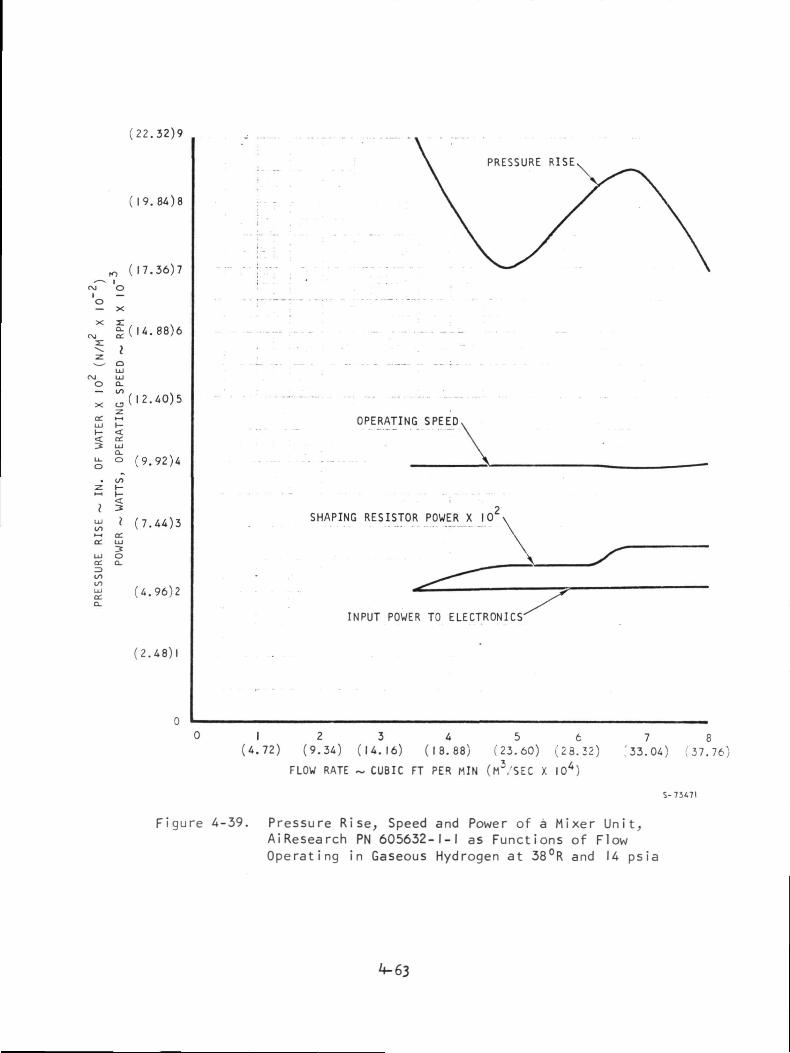
(22.32)9
(19.84)8
(17 .36)7*-^ i
CM O
'o— X
£ ( 1 4 . 8 8 ) 6
I
C\J UJO Q-— m
UJ t-l- << a:
12.40)5
£ o (9 .92)4
SJ l ( 7 .44 )3M a:a: uj
3UJ Oor CL
- (4.96)2a.
(2.48)1
OPERATING SPEED,
SHAPING RESISTOR POWER X 10\
INPUT POWER TO ELECTRONICS'
1 2 3 4 5 t(4.72) (9.34) (14.16) (18.88) (23.60) (23.22)
FLOW RATE ~ CUBIC FT PER MlN (M3/SEC X I04)
'33.04) ( 3 7 . 7 6 )
S-73471
Figure 4-39. Pressure Rise, Speed and Power of a Mixer Unit,AiResearch PN 605632-1-1 as Functions of FlowOperating in Gaseous Hydrogen at 38°R and U psia
V63
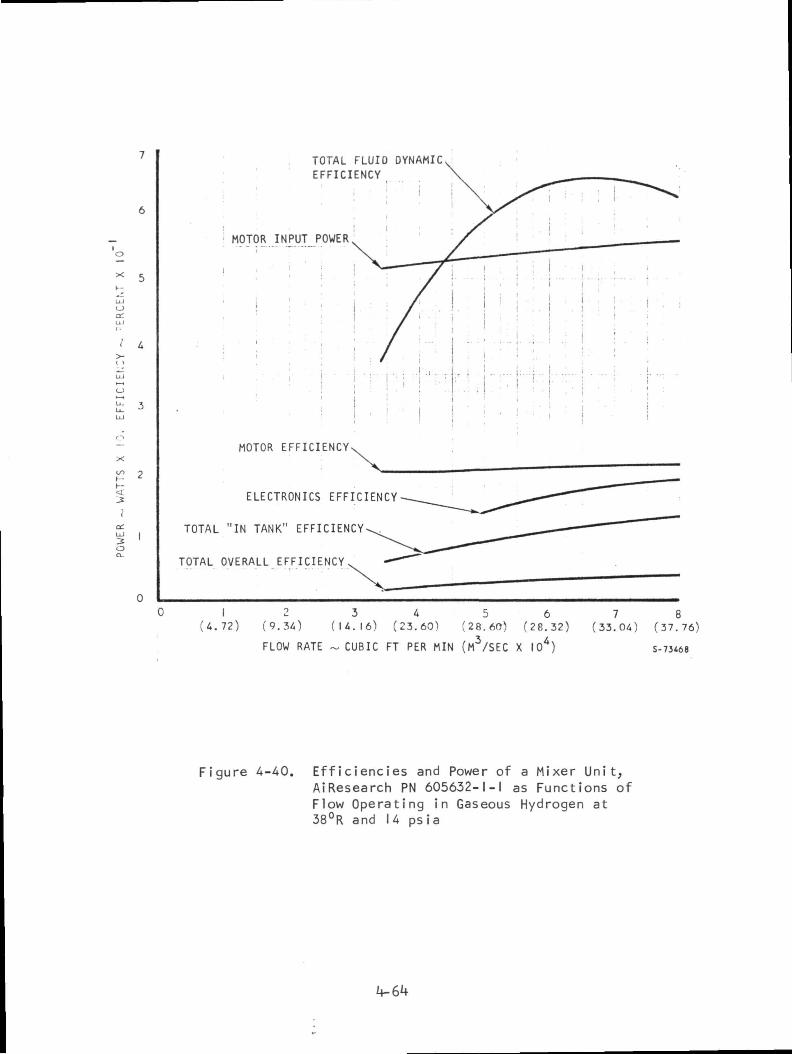
LJa:
i-d
,OC
TOTAL FLUID DYNAMICEFFICIENCY
MOTOR INPUT POWER
MOTOR EFFICIENCY-
ELECTRONICS EFFICIENCY
TOTAL "IN TANK" EFFICIENCY^,
TOTAL OVERALL EFFICIENCY
0
(*.
172)
o
(9.34)
FLOW RATE
3(U. 16)
~ CUBIC
(zFT
43.60)
PER MIN
5(28.60)
(M3 /SEC
6(28 .
X 10*
32)
)
7(33.04)
8(37.76)
S-7J468
Figure 4-40. Ef f ic ienc ies and Power of a Mixer Unit,AiResearch PN 605632-1-1 as Functions ofFlow Operat ing in Gaseous Hydrogen at38°R and 14 psia
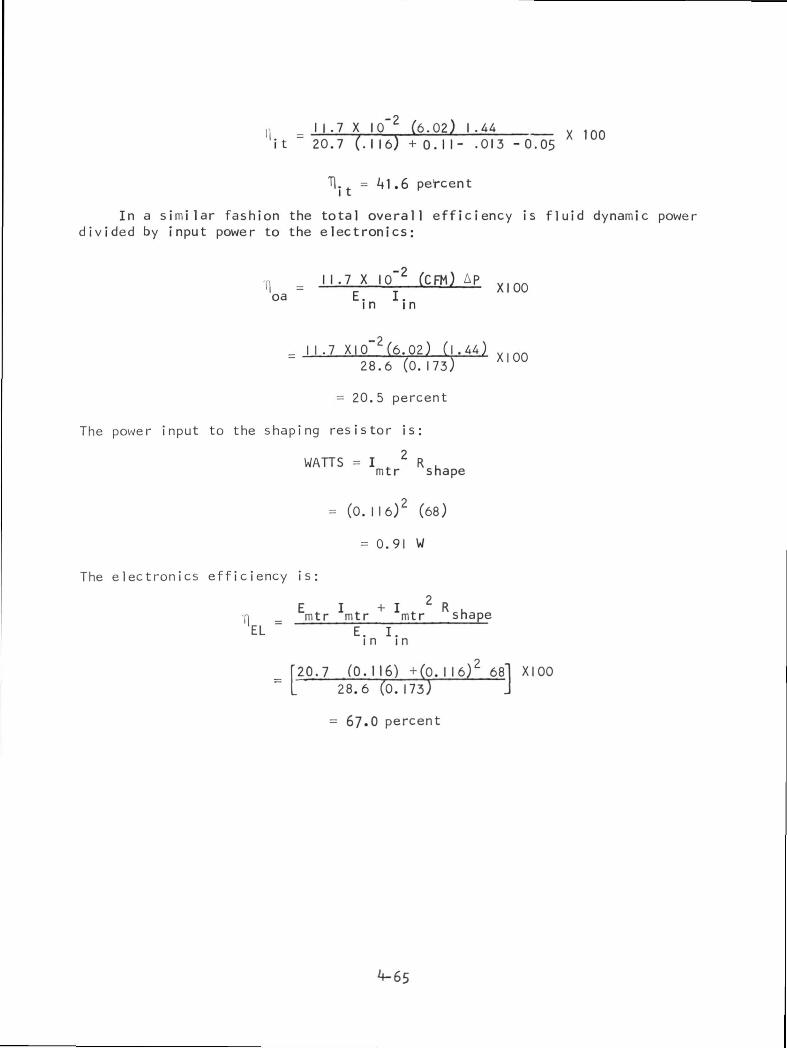
n 1 1 . 7 X IP"2 (6.02) I .44 x 1QO
it 20.7 (.116) + 0 . 1 1 - .013 - 0.05
"H. t = ^1.6 percent
In a s i m i l a r fashion the total overall efficiency is f l u i d dynamic powerdivided by input power to the electronics:
T[ = 1 1 . 7 x io"2 (cm) AP X | O Qoa E. I.
in in
I I.7 XIO~ 2 (6 .02) (1 .44) nn
28.6 (0.173)
= 20.5 percent
The power input to the shaping resistor is:
WATTS =1 2 R .mtr shape
- (0.II6)2 (68)
= 0.91 W
The electronics efficiency is;
F- + T R•n mtr mtr mtr shapeEL ' E. I.
in in
20.7 (0. 116) +(p. I I6)2 681 XI 00[20.7 (0.116) +(0. I 16) 68]: L 28.6 (0. 173) J
= 67.0 percent
Motor efficiency is the shaft output power divided by the input power(E I ). In order to obtain motor efficiency, the shaft load must bemtr mtr
known. Measurement of torques of 0.05 to one oz-in. at l i q u i d hydrogentemperature is very d i f f i c u l t because no known convenient method exists. Asa result, it was decided to calibrate the mixer impeller in air, correct foroperating f l u i d density, and use it as the load to determine motor shaft power.The methods for accomplishing the calibration are discussed in Appendix B(Section 4 of AiResearch Report 68-4223). The calibration data were obtainedfor these conditions and are presented in Lab Data Sheets on tables 4-1through 4-3. It was o r i g i n a l l y intended to maintain complete dimensionals i m i l a r i t y between test and operation by adjusting the air pressure such that:
- -Pcal operat i ng p.operating
For LH this is:
p .4.38 C- 2 7 X '°"7j0.80 X 10"'
P . = 6.32 LB/FT3(l00.8kg/m3)C 3 I
Which corresponds to a pressure of 1260 psia (8.69 X IO6 N/m ) at 80°Fc ^
(29°C) rather than the 161 ( l . l l X 10 N/m ) Psia called out in report 68-4223.The pressures specified to simulate conditions in GHe and LH contain s i m i l a r
errors. The test data was corrected by solving for the Reynolds number at testconditions as described in the design philosophy section and finding the aero-dynamic efficiency from fig. 4-1. This figure is a plot of the ratio ofactual efficiency obtained by AiResearch fans to the efficiency available
at Reynolds numbers above 3 X 10 . The Reynolds number under operating con-ditions was computed and its relative efficiency found from fig. 4-1. Thecalibration efficiency was found and increased by the ratio of operatingefficiency to calibration efficiency as follows:
From aerodynamic test data at 148 psig (table 4-I) at a flow rate of6.02 cfm
ND . = 9.4 x I04R cal
Tl, = 88.7 percent relativer cal
|, = 100 percent relative

CD<
tLJ
5\
Ms a
^
oCLa3
io<a
I
&
1
to
§
ci >
ll
•J ti
N "
" §
If
\,
^i til ^
°'I
U
ex
<K ' ^Cr 5f
It^?
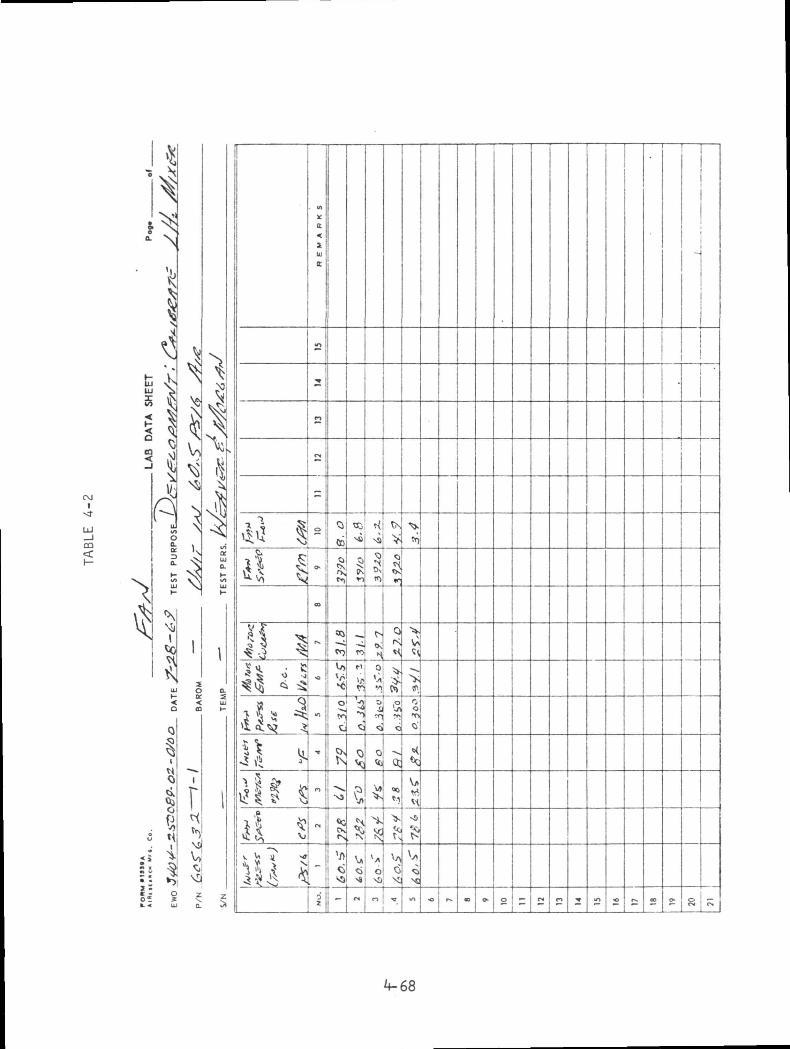
CM1
CO
\
2 I2
-i1
1*
i.o
<o
r
4-
i
-i'j Is
— f-
. rll 0
VJ ijJ ^•^ n y;
0,
r^
4
OIS
<-J"<N
o O
1
4-68

ro
LJ
ca
fcUJ
s
k-63

So the test fan e f f ic iency was increased to:
' _ = 1 . 1 3 times the test valueo o . /
Aerodynamic hp'f Shaft hp
Shaft hp - T
I .013 x 10
Where torque was determined from the room temperature motor cal ibrat ion asplotted in f ig. 4-41. Over the range of values plotted, motor torque was alinear function of motor current. At 5.45 cfm, motor current = 31 ma, so fromf ig . 4-20, the torque was 0.1865 oz-in., rpm = 2550
shaft hp = 0.186? (2»0)
1.013 x 10
-- 4.7 x 10"^* hp
W i t h an observed pressure rise of 0.305 in HO the air hp is:
hp = O.OOOI57 (cfm) Ap
- O.OOOI57 (5.45) .305
= 2.61 x 10~^
So the test aerodynamic ef f ic iency is:
_ 2.61 x IP"4 x |OQ
4.7 x I0~4
= 55-5 percent
Correcting for N effects:
\ correct = 55-5 0-13) =62.7 percent
The motor efficiency, then was found by d i v i d i n g the "in tank" efficiency by thefluid dynamic efficiency; thus at 5.45 cfm in LH this is:
^ =*£*-71mtr .67
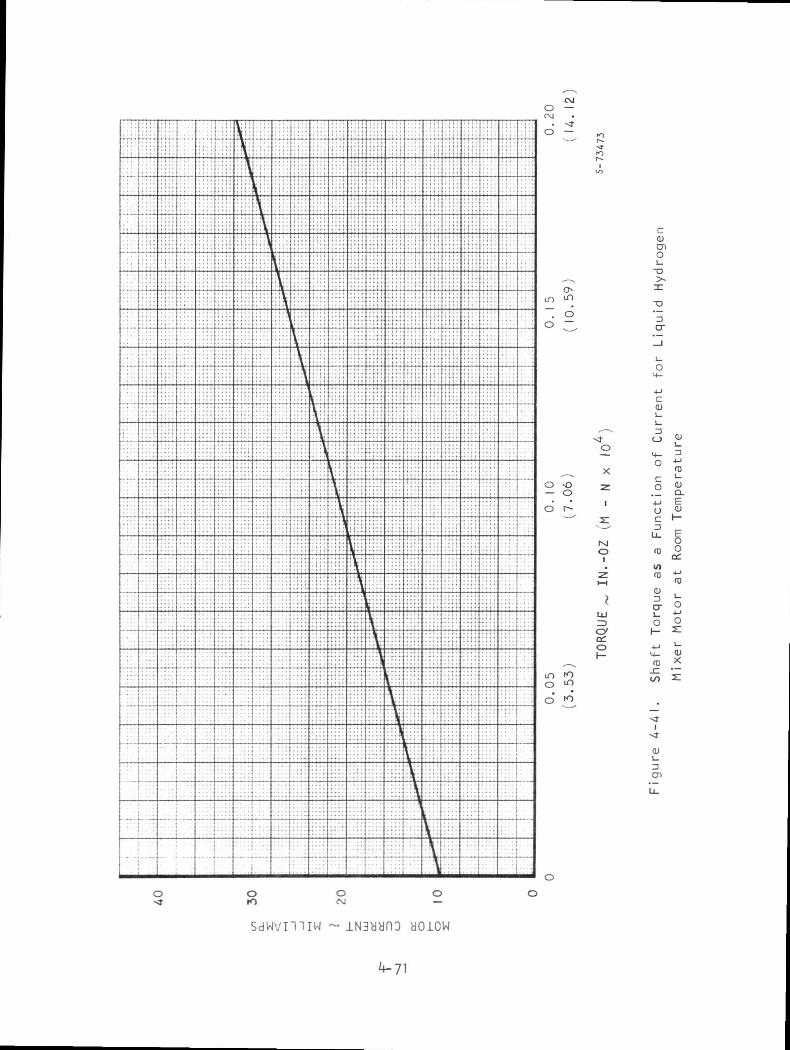
o
X
MoI
o
c01eno
3cr
o
o <uc I—
Sdwwmiw yoicw
The gaseous he l i u m data is plotted in figs. 4-35 and 4-36. All observed dataand values calculated directly from observed data are shown as solid lines. Allcalculated data based on increased speed conditions to correct for the improperresistor value, are shown dashed. The performance at the design point is20 percent low. This performance reduction was caused in part by operation ats l i g h t l y less than design speed. It is hypothesized that this s l i g h t l y lowerspeed may have been caused by the use of a s l i g h t l y more powerful magnet in themotor rotor than design calculations assumed. Operation at design speed wouldhave resulted in a pressure rise of approximate!y ?-2 in. HO, or essentially the
design point pressure rise at aerodynamic stall.
It was intended that the GHe operating point would be at or just to the,-ight of aerodynamic s t a l l . Aerodynamic stall was computed from fig. 4-2 usingthe methods set forth in the design philosophy section. Actual aerodynamic
stall took place at approximately 6.1 cfm (2.87 m /sec) instead of 5-3 cfm
(2. 9 x 10 m /sec). This indicates that the fluid incidence angle with the bladewas lower than normally associated with stall. The reasons for the shift areunknown-, it is believed that possible errors in measurement are unlikely tohave caused the apparent shift. It is possible that at lower Reynolds Numbers,the impeller hub and tip clearances from the housing may exert larger influencesthan formerly throught. This could result in more tip leakage which wouldcause premature boundary layer separation at the blade tip, resulting in apremature stal 1.
The l i q u i d hydrogen test (see figs. 4-37 and 4-38) produced 13 percent moreperformance than predicted, probably because the forecast f l u i d dynamic losseswere higher than those that actually occurred and because 10 percent of excessperformance was b u i l t into the design by not f u l l y allowing for efficiencyimprovements due to increases in N . Since the design torque was not required,
power consumption was lower than forecast. The dashed portion of the fluiddynamic efficiency curve is extrapolated.
There were no requirements for flow or pressure rise in GhL, so no analysis
of that condition was made. With motor power of the order of 0.** W and mixerpressure rises of the order of 0.1 in. H_0, values become so small that accuracy
diminishes rapidly. The general trend of the data in figs. k~3S and *t- 0 appearsproper, but the apparent steps and discontinuities of the curves of efficienciesand shaping resistor power probably are cumulative measurement errors.
At the conclusion of the cryogenic testing, the mixer was disassembled andinspected. Other than the partially failed shaping resistor, no signs of damageor distress could be found. The bearings were removed and examined in detailthe bearings had operated for more than 100 hr. At l i q u i d hydrogen temperatureplus approximately half an hour in l i q u i d nitrogen and l i q u i d helium, andapproximately 10 min. in room temperature air. Fig. k-k2 and k-k3 are photographsof the bearings with their shields removed; fig. k-kk through k-kj show them dis-assembled. Only three balls of each bearing were shown to avoid possible cluttei—ing of the photo, although there was no observable difference in the balls. The
k-72

01 ARD FROMBEARING
LIQUID H2 MIXER
Fig. 4-42 AiResearch PN 605632-1-1, wi th shield removed after 100 hr test
OUTBOARD REARBEARING
LIQUID H2 MIXER
Fig. 4-43 AiResearch PN 605632-1-1, with shie ld removed af ter (00 hr test
f-16233
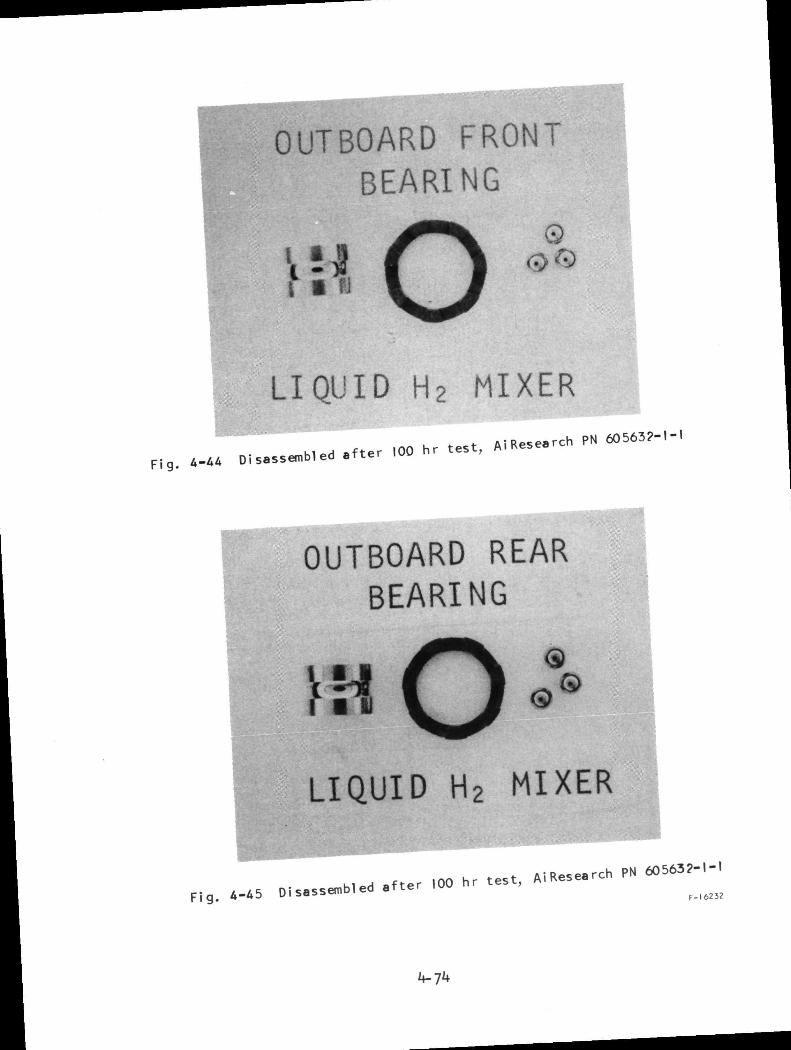
OUTBOARD FRONTBEARING
LIQUID H2 MIXER
Fig. A-Disassembled after 100 hr test, A.
i Research PN 60563?-!-I
OUTBOARD REARBEARING
LIQUID H2 HIXER
MO »fter 100 hr test, AiReseaFig. 4-45 Disassembled atte
rch PN 5632-1-.
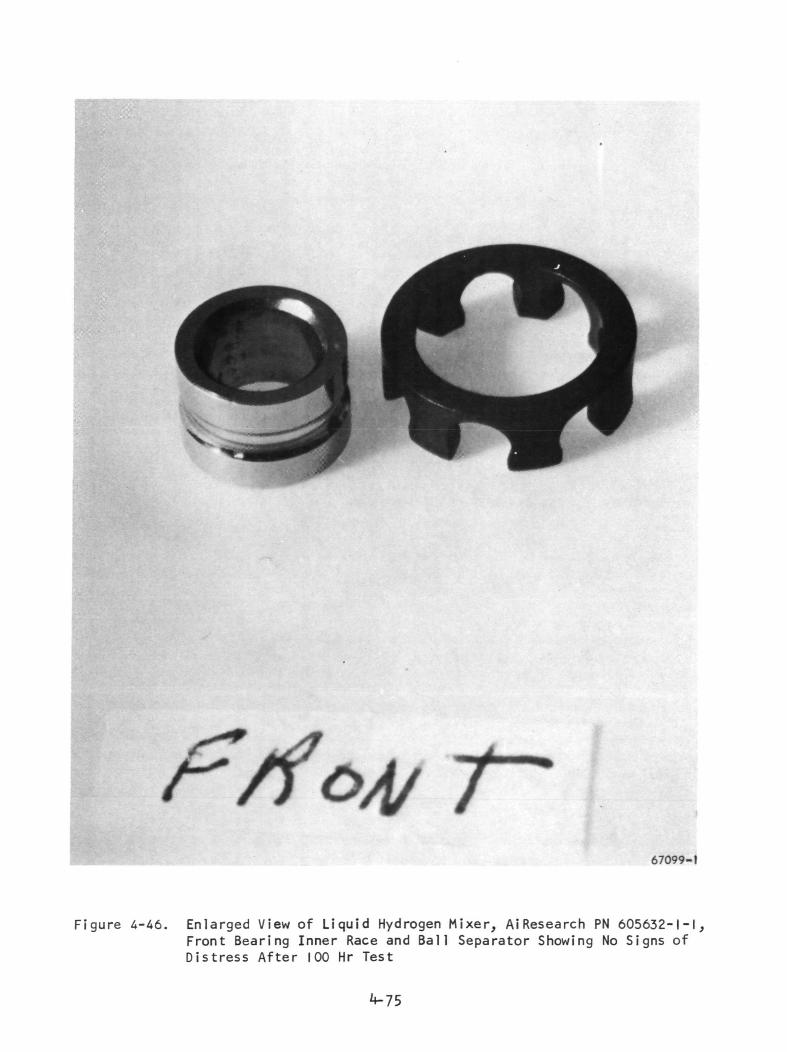
67099-1
Figure 4-46. Enlarged V iew of Liquid Hydrogen Mixer, AiResearch PN 605632-1-1,Front Bearing Inner Race and Ball Separator Showing No Signs ofDist ress After 100 Hr Test
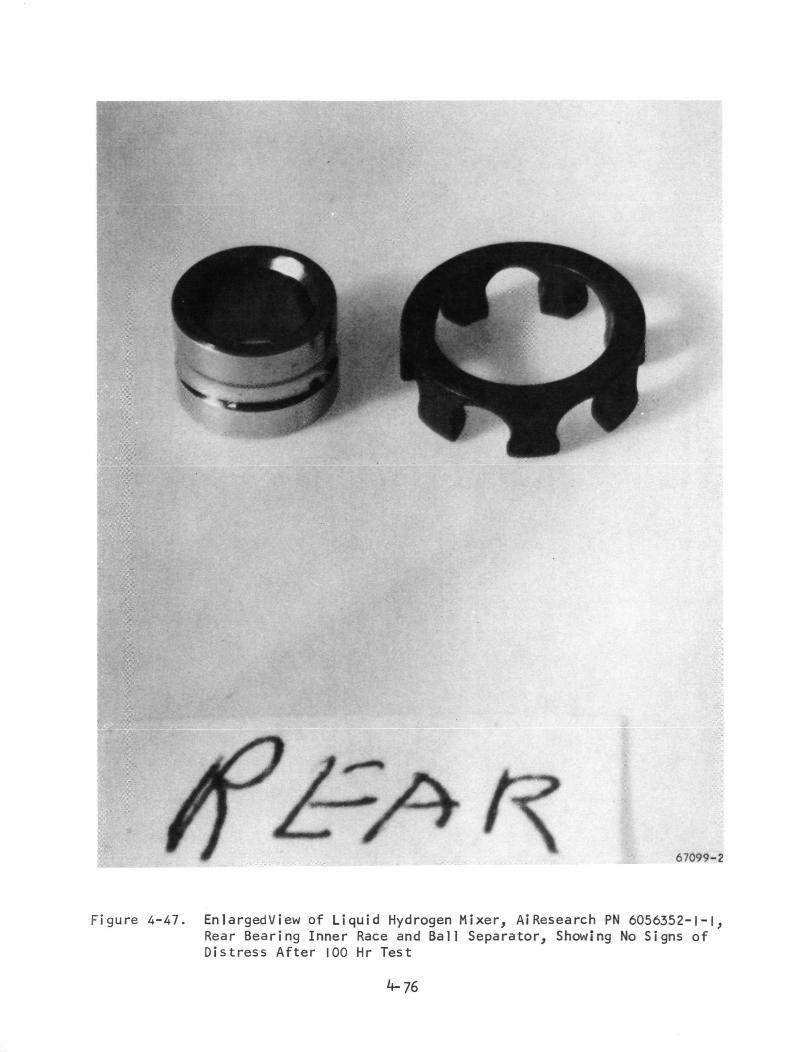
67099-2
Figure 4-47. EnlargedView of Liquid Hydrogen Mixer, AiResearch PN 6056352-1-1,Rear Bearing Inner Race and Ball Separator, Showing No Signs ofDistress After 100 Hr Test

bearings were microscopically examined and found to be in excellent conditionand would have very possibly operated for 5000 hr in LH . Appendix D is acopy of the bearing report.
77
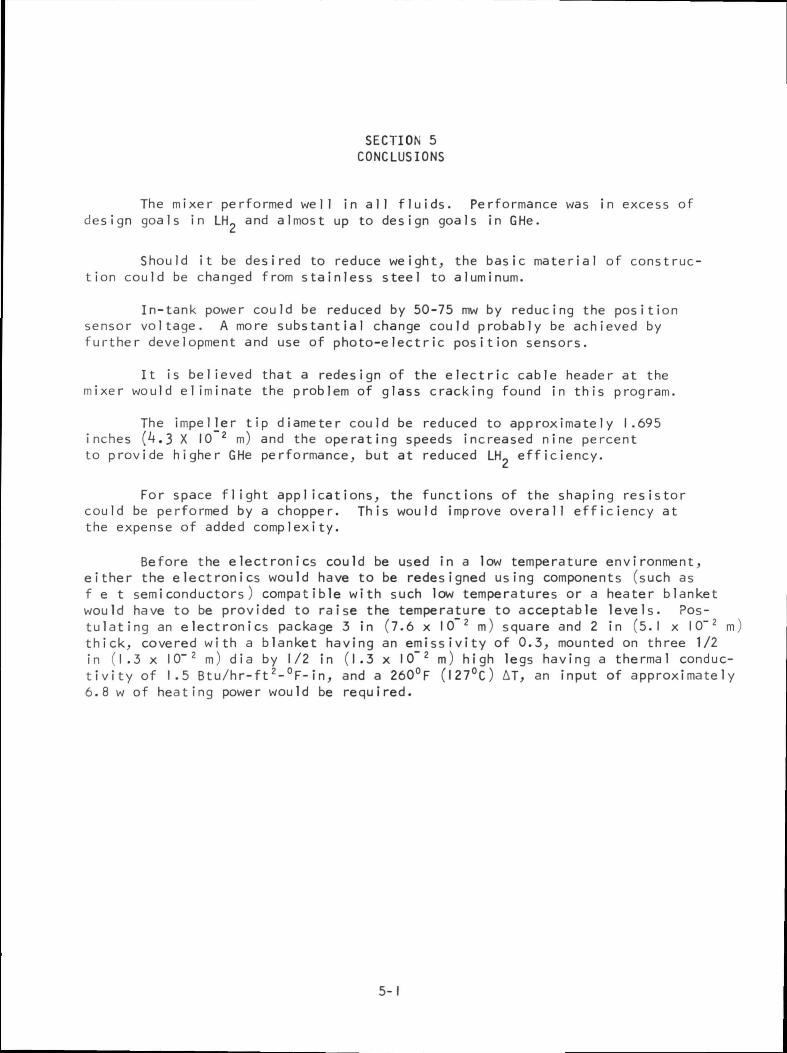
SECTION 5CONCLUSIONS
The mixer performed well in all fluids. Performance was in excess ofdesign goals in LH_ and almost up to design goals in GHe.
Should it be desired to reduce weight, the basic material of construc-tion could be changed from stainless steel to aluminum.
In-tank power could be reduced by 50-75 mw by reducing the positionsensor voltage. A more substantial change could probably be achieved byfurther development and use of photo-electric position sensors.
It is believed that a redesign of the electric cable header at themixer would eliminate the problem of glass cracking found in this program.
The impeller tip diameter could be reduced to approximately 1.695inches ( .3 X 10 2 m) and the operating speeds increased nine percentto provide higher GHe performance, but at reduced LH_ efficiency.
For space f l i g h t applications, the functions of the shaping resistorcould be performed by a chopper. This would improve overall efficiency atthe expense of added complexity.
Before the electronics could be used in a low temperature environment,either the electronics would have to be redesigned using components (such asf e t semiconductors) compatible with such low temperatures or a heater blanketwould have to be provided to raise the temperature to acceptable levels. Pos-tulating an electronics package 3 in (7.6 x 10 2 m) square and 2 in (5.1 x 10"2 m]thick, covered with a blanket having an emissivity of 0.3, mounted on three 1/2in (1.3 x IO"2 m) dia by 1/2 in (1.3 x 10 2 m) high legs having a thermal conduc-t i v i t y of 1.5 Btu/hr-ft2-°F-in, and a 260°F (I27°C) AT, an input of approximately6.8 w of heating power would be required.
5-1

SECTION 6RECOMMENDATIONS
It is recommended that the following tasks be undertaken to extend thework of this program:
1. Develop electronics capable of operating efficiently andr e l i a b i l y at spacecraft temperatures below -65°F (-54°C)without resorting to heaters.
2. Perform extended l i f e testing of the mixer bearings in l i q u i dhydrogen.
6-1
APPENDIX A
LMSC REPORT
EVALUATION AND DEMONSTRATIONBRUSHLESS DC MIXER UNIT
Report No. LMSC/73465 July 15, 1969

NOTES OF EXPLANATION TO LMSC/73465
All oscillograph traces are for 20 V/cm at a sweep rate of 150 ms/cm.Oscillograph traces were taken across the electronics unit switching transistors,These traces were arranged with phases A through D presented successively fromthe top to the bottom of each page of oscilloscope data. The endurance testingtraces were for operation in LH- except for the endurance tests in GH which
are identified. The operating speeds corresponding to these oscillograph tracesare presented in the raw test data sheets.
A-l
COPY NO.
REPORT NO. LK:
DATED July 13. 196
REVISED
LOCKHEED MISSILES & SPACE COMPANYA G R O U P D I V I S I O N O F L O C K H E E D A I R C R A F T C O R P O R A T I O N
SUNNYVALE. CALIFORNIA
TITLE
Evaluation and Demonstration
Brushless DC Mixer Unit
SUBMITTED UN PER
EFFECTIVE UNDER
MODEL. REFERENCE.
PREPARED
CHECKED BY-
D. R. cryogencs yseras esSanta Cruz Test Base
APPROVED BYW. H, Sterbentz, MerPropulsion Vehicle
REVISIONS
DATE REV. BY PAGES AFFECTED REMARKS

LMSC/73 5
FOREWORD
This test report documents the activity performed by
Lockheed Missiles and Space Company under AiResearch
Contract P0025A9011-9, "Evaluation and Demonstration
Test Program, Brushless DC Mixer Unit". This activity
is part of NASA LeRe contract HAS 3-11208 for the
"Development and Demonstration of a Liquid Hydrogen
Brushless DC Mixer Unit".
ill

Evaluation r.ndrcL-'.onstraticnBruchlecs DC MixerUnit
LKSC/73 65
TABLE OF CONTENTS
Foreword
1.0 Scope
2.0 Summary
3-0 Description of Test Program
3.1 Introduction
3.2 Test Facility Description
3.3 Testing Discussion
k.O Appendix
Test Data
Oscilloscope Traces
i
1
1
1
1
3
k
9
9
9
iv
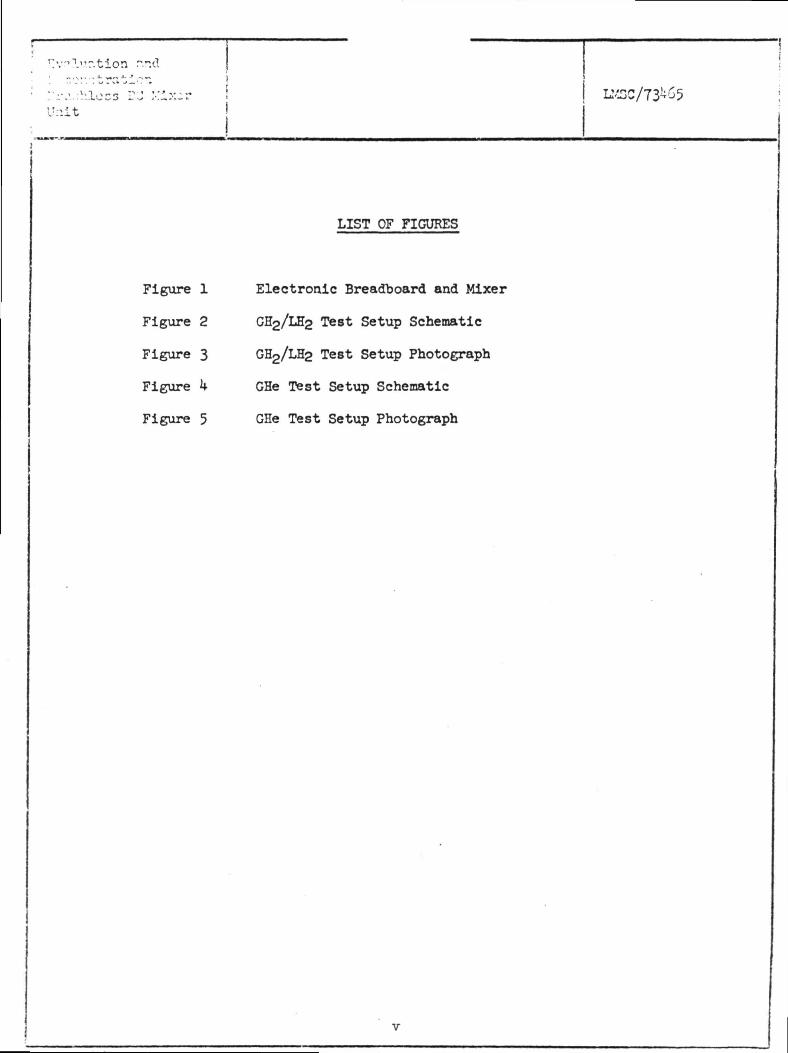
Unit
LIST OF FIGURES
Figure 1 Electronic Breadboard and Mixer
Figure 2 GH2/LH2 T68* Setup Schematic
Figure 3 GH2/LH2 Test Setup Photograph
Figure k GHe Test Setup Schematic
Figure 5 GHe Test Setup Photograph
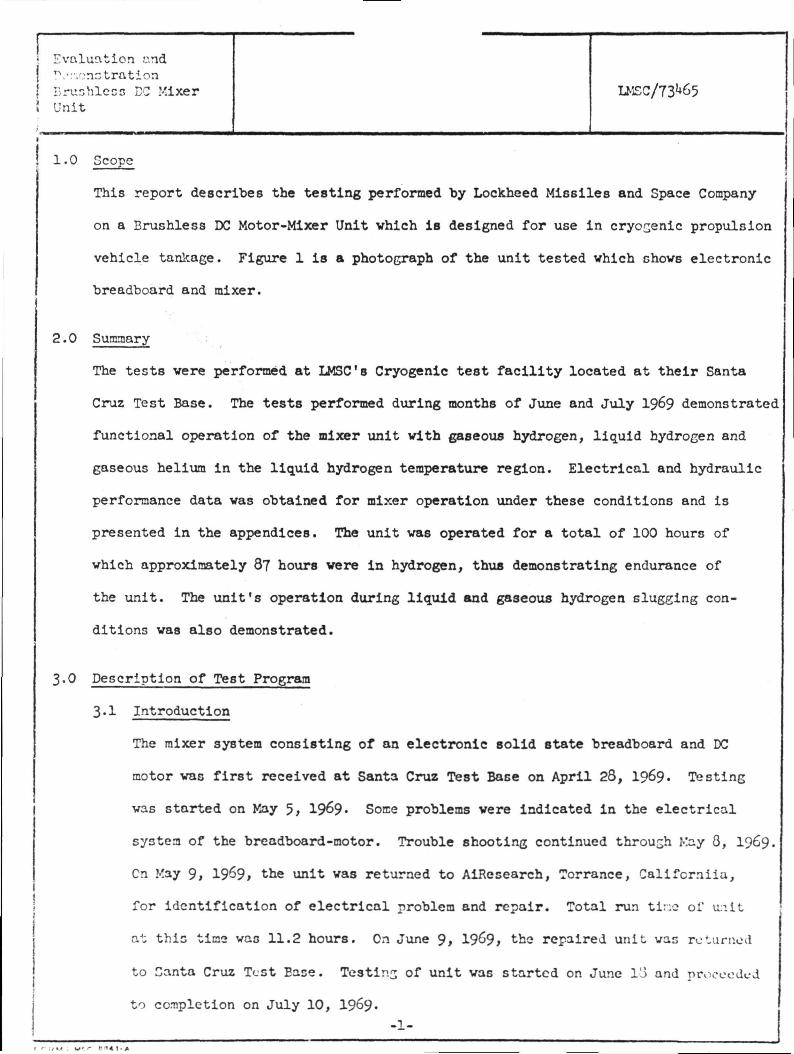
Evaluation andTV penetration!>rushlecs DC .Mixer
! UnitLMSC/73 65
1.0 Scope
This report describes the testing performed by Lockheed Missiles and Space Company
on a Brushless DC Motor-Mixer Unit which is designed for use in cryogenic propulsion
vehicle tankage. Figure 1 is a photograph of the unit tested which shows electronic
breadboard and mixer.
2.0 Summary
The tests were performed at LMSC's Cryogenic test facility located at their Santa
Cruz Test Base. The tests performed during months of June and July 1969 demonstrated
functional operation of the mixer unit with gaseous hydrogen, liquid hydrogen and
gaseous helium in the liquid hydrogen temperature region. Electrical and hydraulic
performance data was obtained for mixer operation under these conditions and is
presented in the appendices. The unit was operated for a total of 100 hours of
which approximately 87 hours were in hydrogen, thus demonstrating endurance of
the unit. The unit's operation during liquid and gaseous hydrogen slugging con-
ditions was also demonstrated.
3.0 Description of Test Program
3-1 Introduction
The mixer system consisting of an electronic solid state breadboard and DC
motor was first received at Santa Cruz Test Base on April 28, 1969. Testing
was started on Kay 5, 19 9 • Son:e problems were indicated in the electrical
system of the breadboard-motor. Trouble shooting continued through Kay 8, 1969,
Cn Kay 9, 1969, the unit was returned to AiResearch, Torrance, Califcrniia,
for identification of electrical problem and repair. Total run tino oi' unit
a4; this time was 11.2 hours. On June 9, 1969, the repaired unit was returned
to Canta Cruz Test Ease. Testing of unit was started on June 13 and proceeded
to completion on July 10,
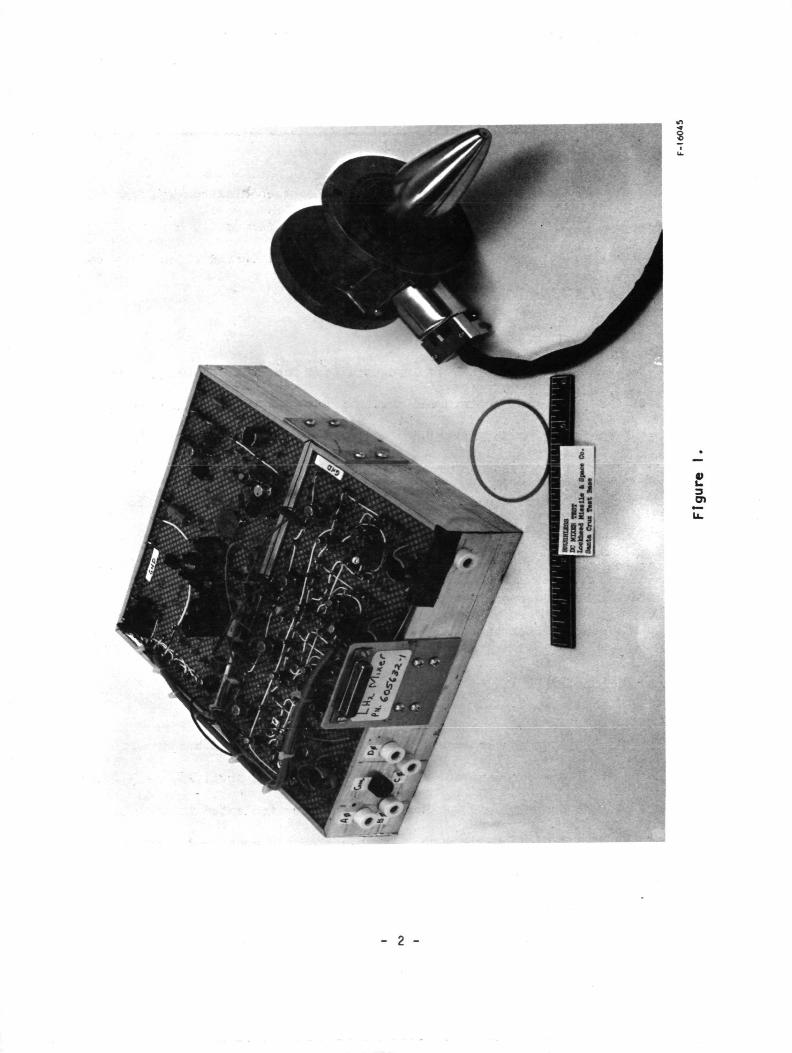
w >
i
£O)
- 2 -
Evaluation ~
J T*r»-H5 C *ii '
LMSC/73 5
3.2 Test Facility Description
The test program discussed herein was conducted in the Cryogenic Test Facility
at LKSC's Santa Cruz Test Base. The capabilities of this facility include
storage and transfer equipment for liquid hydrogen, liquid nitrogen and
liquid oxygen; gaseous helium, gaseous hydrogen, gaseous nitrogen storage
and distribution systems; and varied and high accuracy data acquisition
equipment. Specific test equipment and instrumentation equipment used during
this program is listed below:
3.2.1 Components test dewar 22 inch diameter by kO inches deep.
3.2.2 Liquid hydrogen storage and transfer system.
3.2.3 Dymec 2010J digital integrating voltmeter with paper tape printer
recorder.
3.2.4 DC povrer supply, Trygon Electronics SHR 20-3.
3.2.5 Oscilloscope, Techtronix 535 with Polaroid photographic equipment.
3-2.6 Inclined water manometer, 0 to 2 inch range.
3.2.7 Pressure Transducer, 0 to 10 inch H£0 range; CCC-^lGPl^A.
3.2.8 Pressure Transducer, 0 to 50 psia range; CEC-4-35 -0118.
3.2.9 Fluid Temperature Transducer, 0 to 50°R range; Cryo Cal
CR-2500L-14-100.
3.2.10 Fluid Temperature Transducer, 0 to 520°R range; Rosemont 150MA10.
3.2.11 Flovmeter; 0 to 25 CFM range; 2 inch diameter Potter special, 66101A.
-3-
K v . i l u:\tion andr • -, •-•itrntionPrn::hlcGC EG MixerUnit
LMSC/73 65
3.3 Tenting Discussion
3.3.1 Calibration in Gaseous Hydrogen
The motor-mixer unit was installed in the upper half of the 2 inch
test loop as shown schematically in Figure 2. Figure 3 is a photo-
graph of this setup prior to installation in test dewar. Upon com-
pletion of installation in the test dewar, the internal systems were
dried by evacuation to 10 microns, holding for a minimum of 15 minutes
and then back filling internal systems with dry gaseous nitrogen.
The internal systems were then purged with boil-off hydrogen gas at
ambient temperature. Liquid hydrogen was then admitted to the test
dewar and filled to a level approximately 8 inches below the mixer
inlet level. The unit was then started by application of 29 VDC to
the breadboard electronics package. Performance data was obtained
at flow rates from 8.0 CFM to $.k CFM by adjustment of the loop
throttling valve. Complete performance data obtained from this test
is presented in the appendix.
3.3.2 Calibration in Liquid Hydrogen
This test continued from the gaseous hydrogen calibration described
above by filling the test dewar with liquid hydrogen to above the
top of the test loop. Performance data was obtained at flow rates
from 6.0 CFM to 2.6 CFM by adjustment of the loop throttling valve.
With throttling valve full open, maximum flow rate of 6.0 CFM was
obtained. Complete performance data from this test is presented in
the appendix.
-4-

LOCKHEED MISSILES & SPACE COMPANY* C • O W f 0 . i ' 1 i G N Of l O C I " I I C * • l C I * ' I C G l » C i » » ' ' O « "Pogc
Checked
Approved
Model
Report No
)P?,MWS Til
• ic , . Z
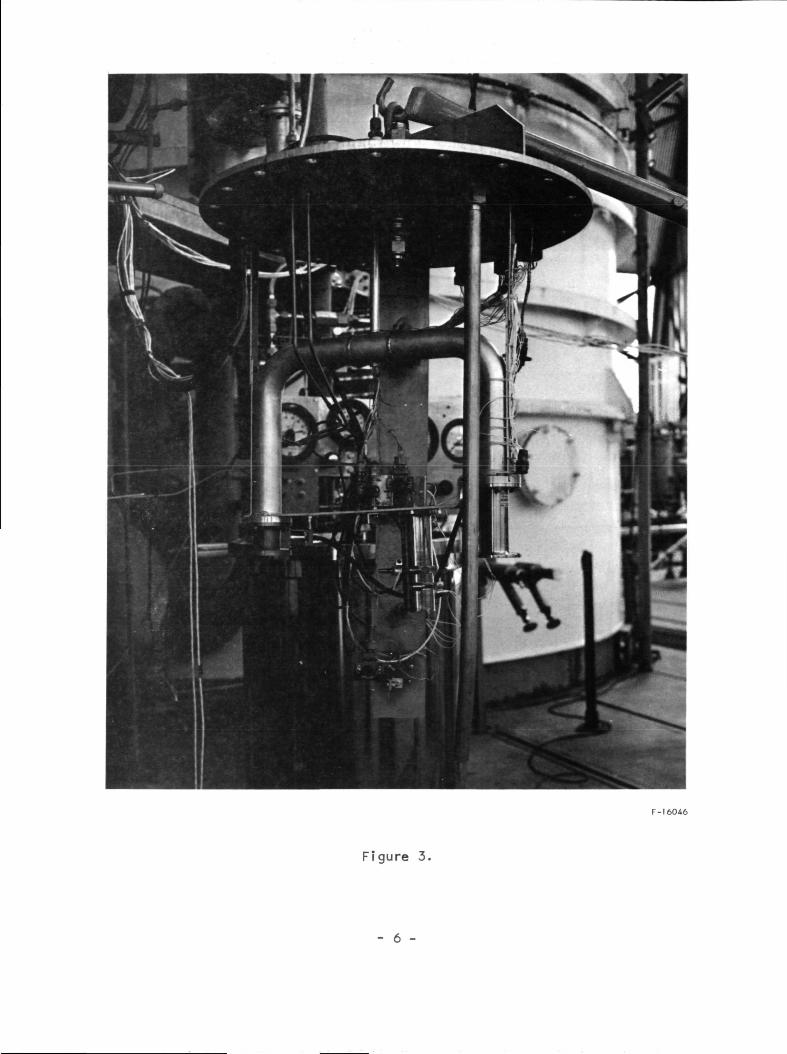
F-1 6046
Figure 3.
- 6 -
Evaluation andDo-.or.ctration
3-3-3 Hydroron Slu in.r; TGst
This test vas performed on June 23, 1969. The tent setup was the
open loop configuration as described in 3-3-1 above. The test
sequence was initiated with the test devar and system at ambient
temperature (approximately 520°R) and containing gaseous hydrogen.
Liquid hydrogen was admitted to the test dewar at a slow rate with
the test unit off. When the dewar internal temperature reached
100 R, 28 volts DC was applied to the breadboard electronics.
When the liquid hydrogen slugging occurred (two phase hydrogen flow)
speed oscillated between approximately 3800 and 2 00 R?M while
motor current oscillated between approximately 0.02 and 0.15 amps.
When loop was totally submsrged in liquid hydrogen the performance
stabilized at a flow rate of 5A CFM, speed of 2300 RPM and motor
current of 0.09 amps. Complete stabilized performance at end of
slugging test is presented in the appendix. No adverse effects to
unit's performance was observed as a result of the slugging test.
Approximately one hour elapsed during the performance of this test.
3.3.U Endurance
This test was performed with the unit installed in the test setup
as described in above paragraph 3.3.!. The loop wan totally
submerged in liquid hydrogen for the complete endurance test phase.
Data was teken periodically during this testing and is presented in
the appendix.
-7-
IEvaluation andDe.Tcr.c trationTruolilecs D3 KixerUnit
A suinary of endurance operating time of unit in various con-
figurations is listed below;
o 1.0 hour - Gaseous hydrogen calibration
o 2.0 hours- Liquid hydrogen calibration
o 85 hours - Liquid hydrogen with cycle timer and slugging(k nin. on and 2 min. off)
o 12 hours - Gaseous helium
o 100 hours - Total operating time
3-3-5 Calibration in Gaseous Helium
The lover half of the flow loop was installed in the test setup
resulting in a test configuration as shown in the schematic of
Figure k and photograph of Figure 5. Prior to test, the loop
internal system and dewar internal system were evacuated to
10 microns pressure and held for a minimum of 15 minutes in order
to accomplish drying of systems. The closed loop was then re-
pressurized to approximately 16 psia with helium and maintained at
a positive differential above the test dewar pressure throughout this
test phase. The test dewar was.filled with liquid hydroccn to a
level that totally submerged the loop and maintained in this condition
throughout test. When helium loop temperature stabilized at 3?°R the
unit was energized by application of 28 volts to the electronic
breadboard. Performance data was obtainsd at flow rates from 7.0 CFM
to 3.1*- era by adjustment of the loop throttling valve. Complete
performance data is presented in the appendix. Upon completion of
tho helluT. calibration trot the unit vac operated in this co:ifl,j-.!:v t
to ob!;.-.'..p. tho totv.l 1CD Lours operatinj iirao. Thin scries co:v:plc\..-d
tho t'-'Ctlry-; .-.ctivity pcnVr.-;od by L'l'C c:r t'lio u:iit.
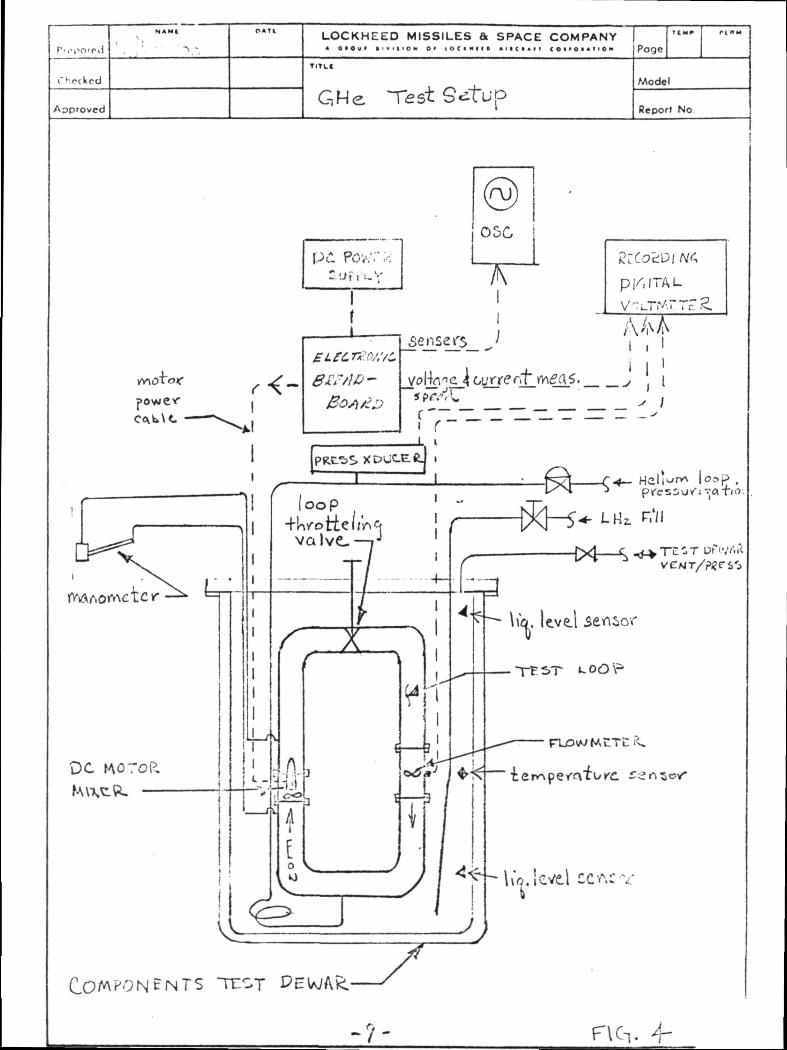
LOCKHEED MISSILES & SPACE COMPANYPogc
ApprovedGHe
Model
Report No
w\oto>c
PC.
05C
EL£C.r«::c!/;/z.8£?/ID-
&04/Z3
7\ii
Sense's !
SWA.
MAI , I' ' 1.s , I
|'un* |osp ,SS\)fftO(TlO\
\ \ o . level COM-v
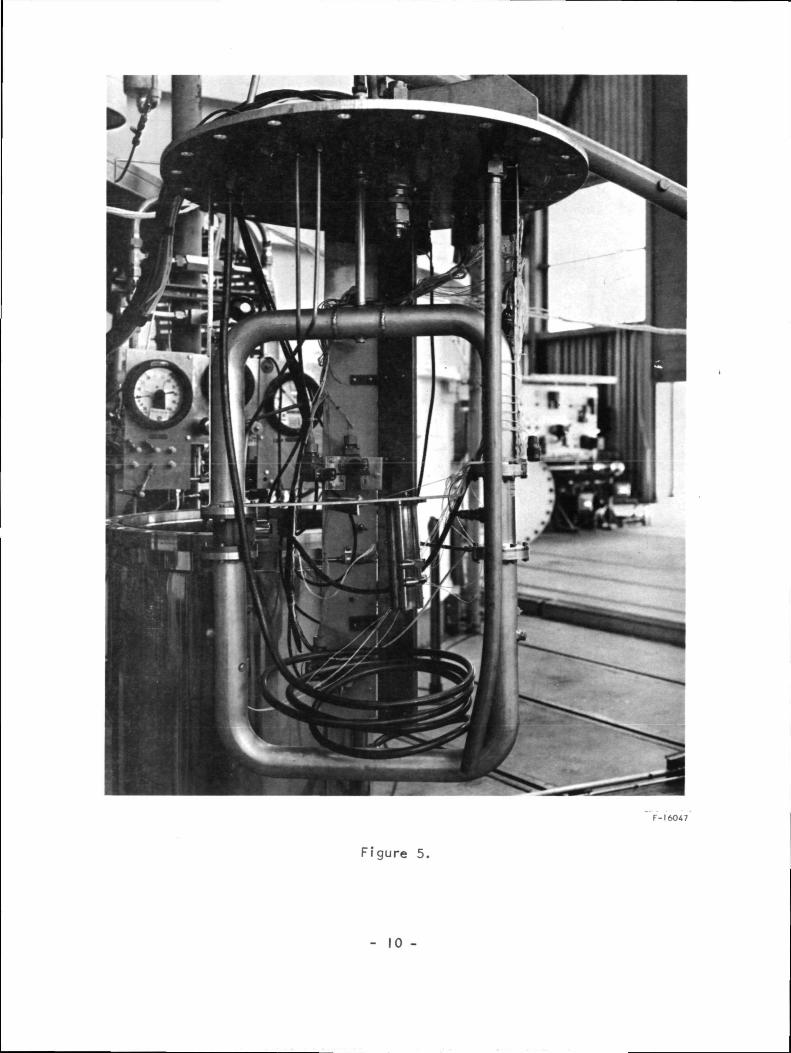
F-16047
Figure 5.
- 10 -

!•' valuation and
r-j:-.L'nit
_3 Mixer
k. 0 Apporrlix
o Tost Data
o Occilloscone Traces
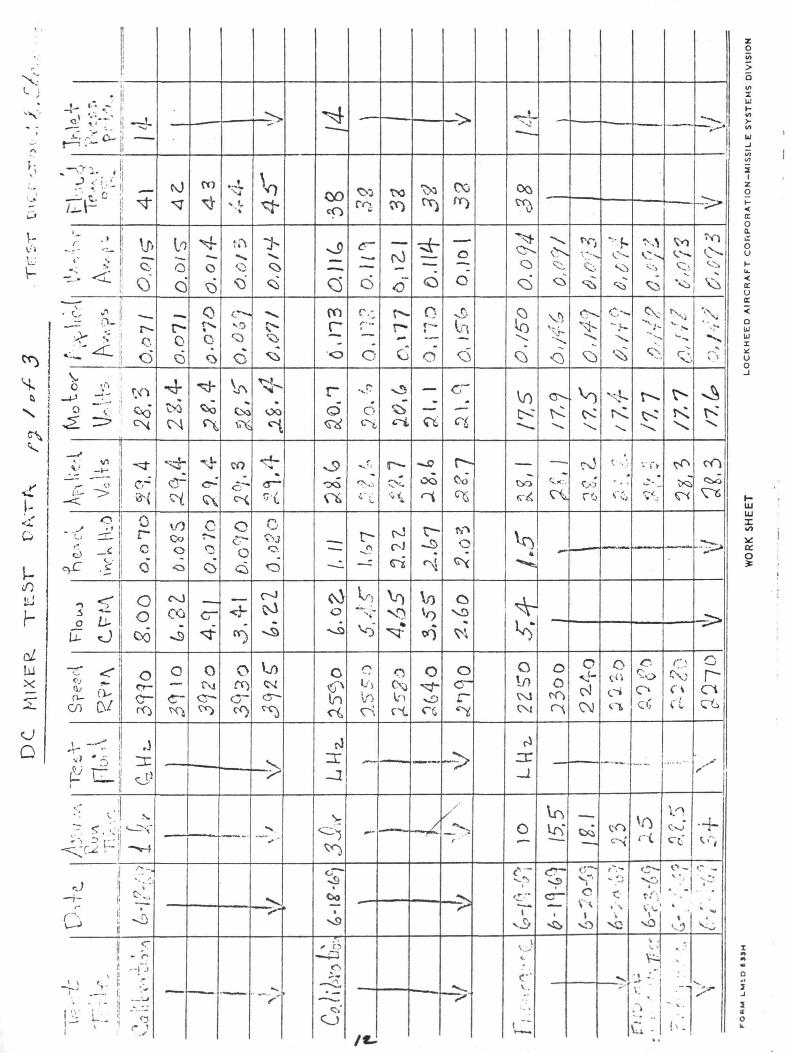
J_J
cO
V->
v-
r-o<r
V) Cvj vo (Xf f)
00
i u
- I
loo0
'0
O
rO
o
-•-f.Q>
O C
.CO
t>0 o
COr
O
o
o
la
<H. ..-V.
Aoo
rQ"
C
ovn
CtK
CO onOQ
Oi ei
o i Co s! r-^ -< \ c
.£'!! oo
O
OcS
c- c-
UJ
r£ O
Oq06
ooo
V) 0
o Q o
01 (V
ocr
o
Inci
to
oOlr-
O
CN;
oo
o c
CM
Oa
cr-o
Q 4- -< j
-a>•
-S. Vlo
to
o-
00 oV A l N
vO
, s -v>^ .± •>
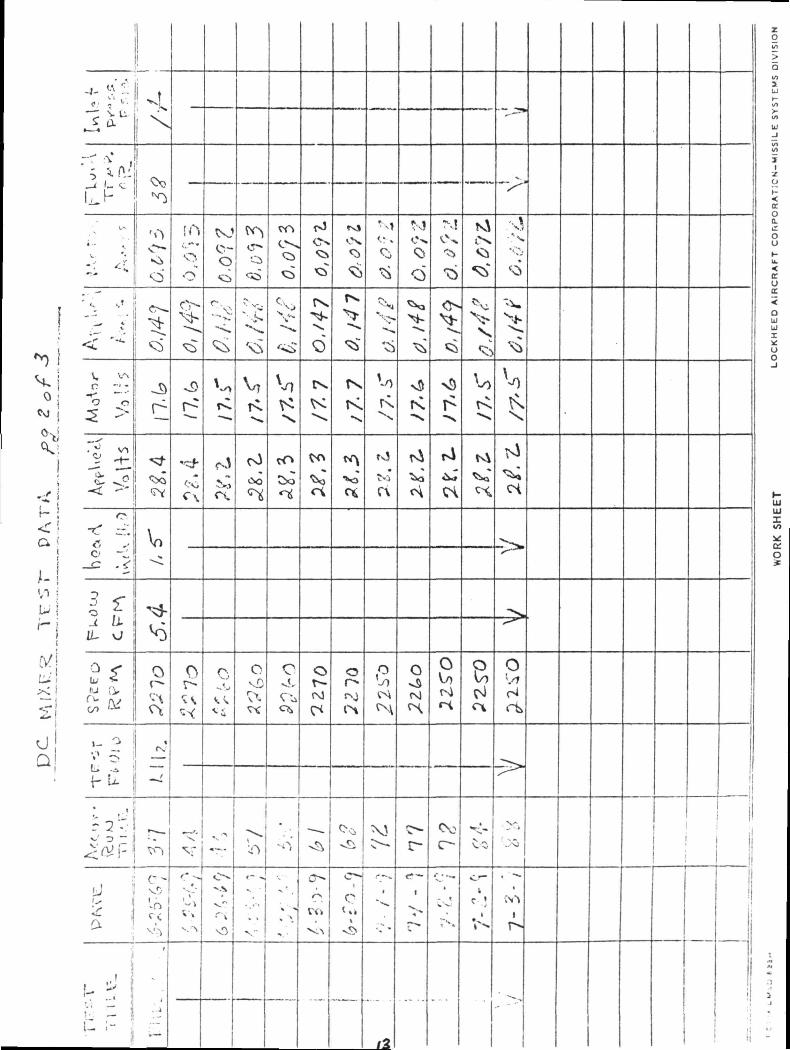
pu;>!>_'
[A
•b
ro tsj
O-O Cl 05
O
O
0
<X
J: -
r K K rx
<*0*3
(TV
ao -,:
\n
/i iiIL
LU i>>;
oa!
0U; 0 o, O O
;v r-0vSN
0 O
-.
t-
£ ^
',0f C
vO
ro
NJ
iC » i
rH
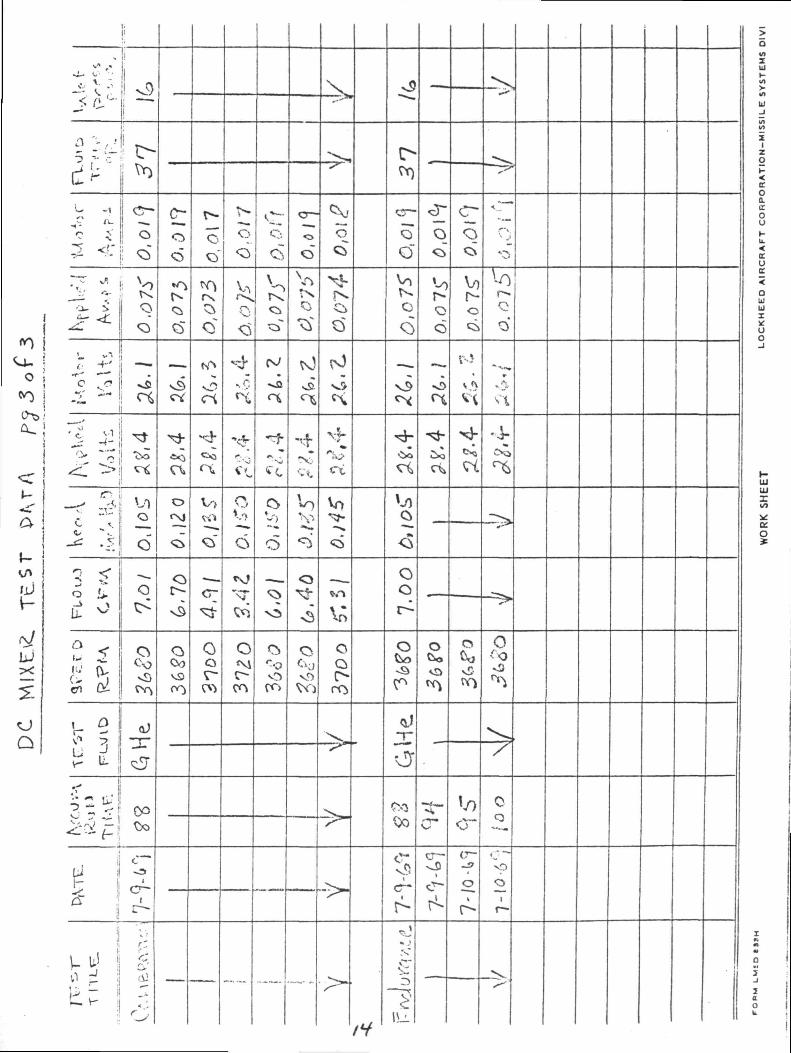
a.
a i
h
uJ
5
o
J? i-C i' I O
' \2
0
-,-J
o^li.
<
e <en
O
0
i £
•5 -^
ui
V
o
o °.
VS1
0or-
c
c
6
OMr-
N)
o
o
^
O
o
ex.
Vo
CQ
O
oO
o
oo
Oo
cr—
o
V)l -0
O
<
c?V
r-
>aV}
uHulV»n
III_Jinui
Z
ZO
<£Oc
r-
O
4-
HUJillwVQiO
o
0o
vp
oi
i./ia.0(.
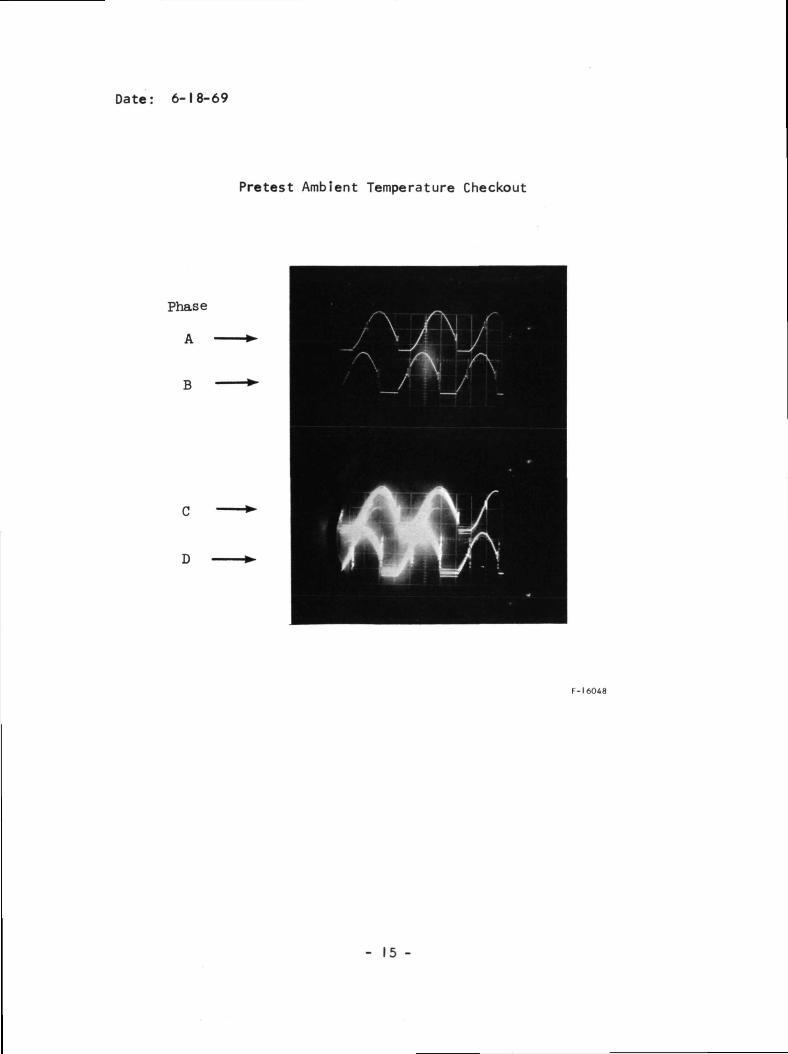
Date: 6-18-69
Pretest Ambient Temperature Checkout
Phase
A
B
F-16048
- 15 -
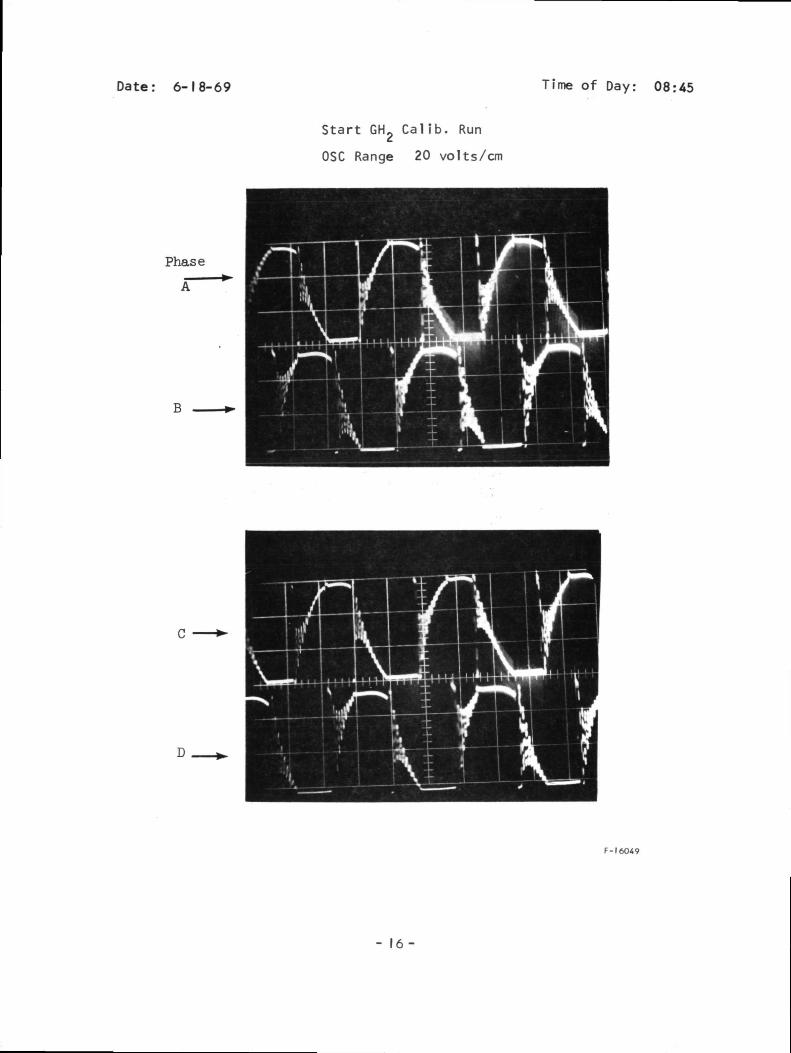
Date: 6-18-69 Time of Day: 08:45
Start GH2 Calib. Run
OSC Range 20 volts/cm
Phase
A"
B
D
F-I 60*9
- 1 6 -
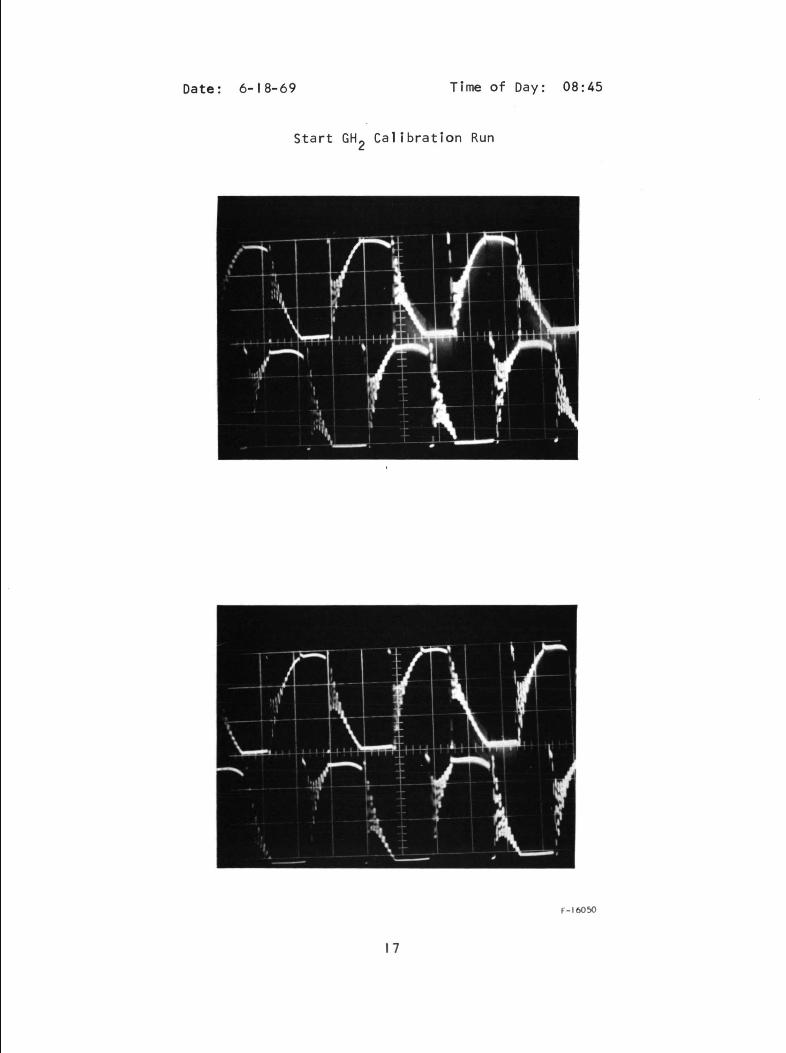
Date: 6-18-69 Time of Day: 08:45
Start GH- Calibration Run
F-16050
17
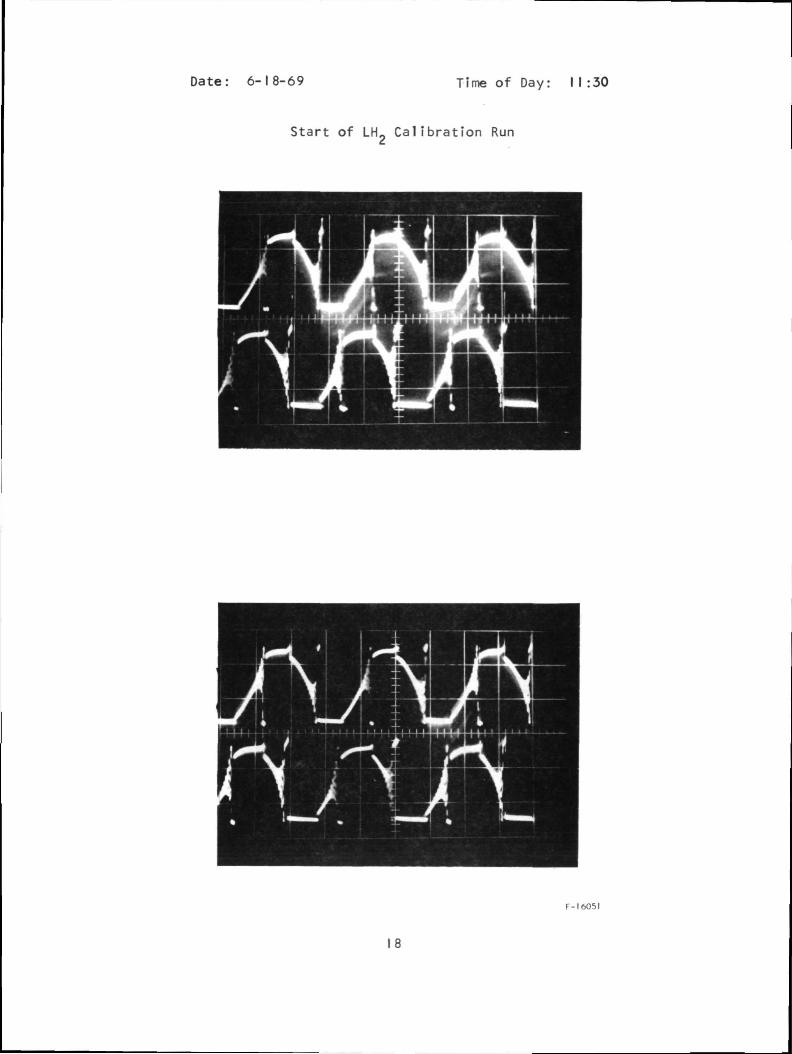
Date: 6-18-69 Time of Day: I I:30
Start of LH. Calibration Run
F-I605I
18
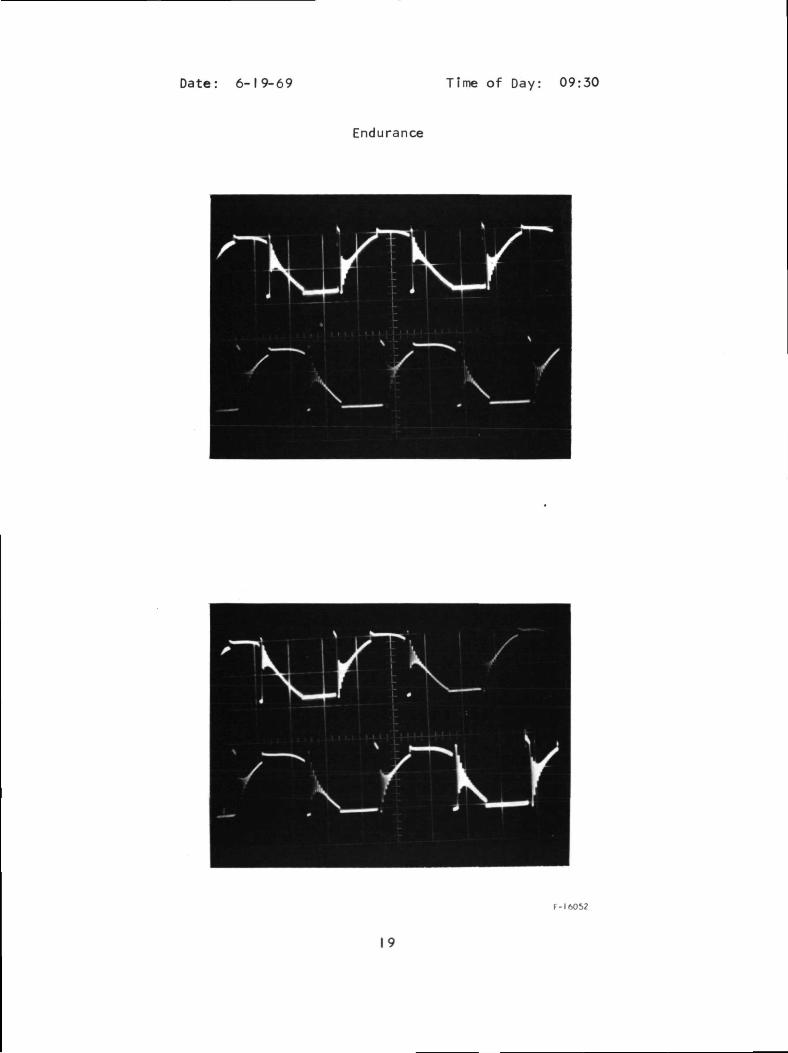
Date: 6-19-69 Time of Day: 09:30
Endurance
F-I 6052
19
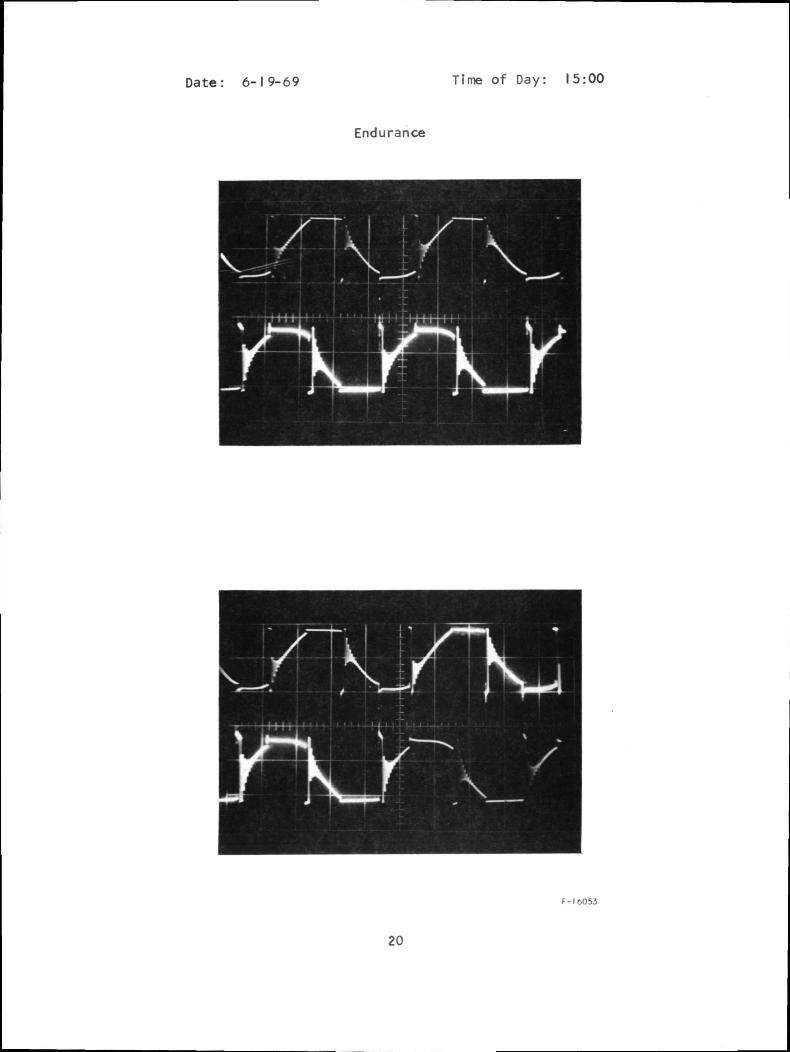
Date: 6-19-69 Time of Day: 15:00
Endurance
F-I 6053
20
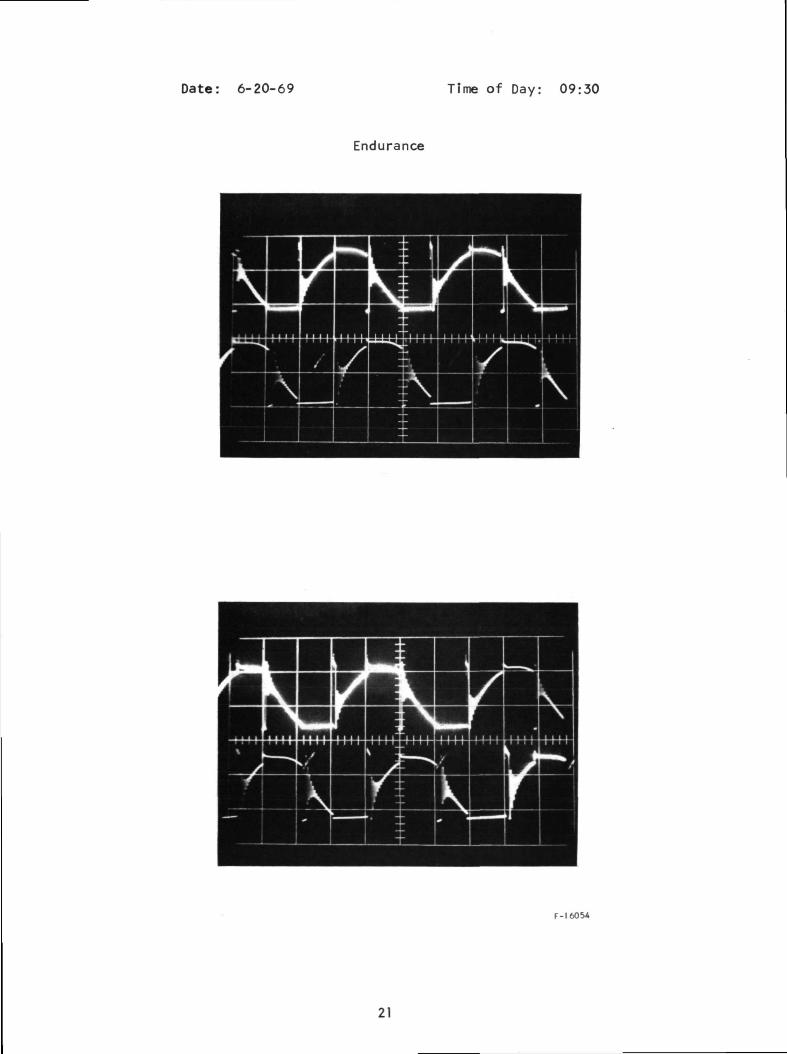
Date: 6-20-69 Time of Day: 09:30
Endurance
F-16054
21
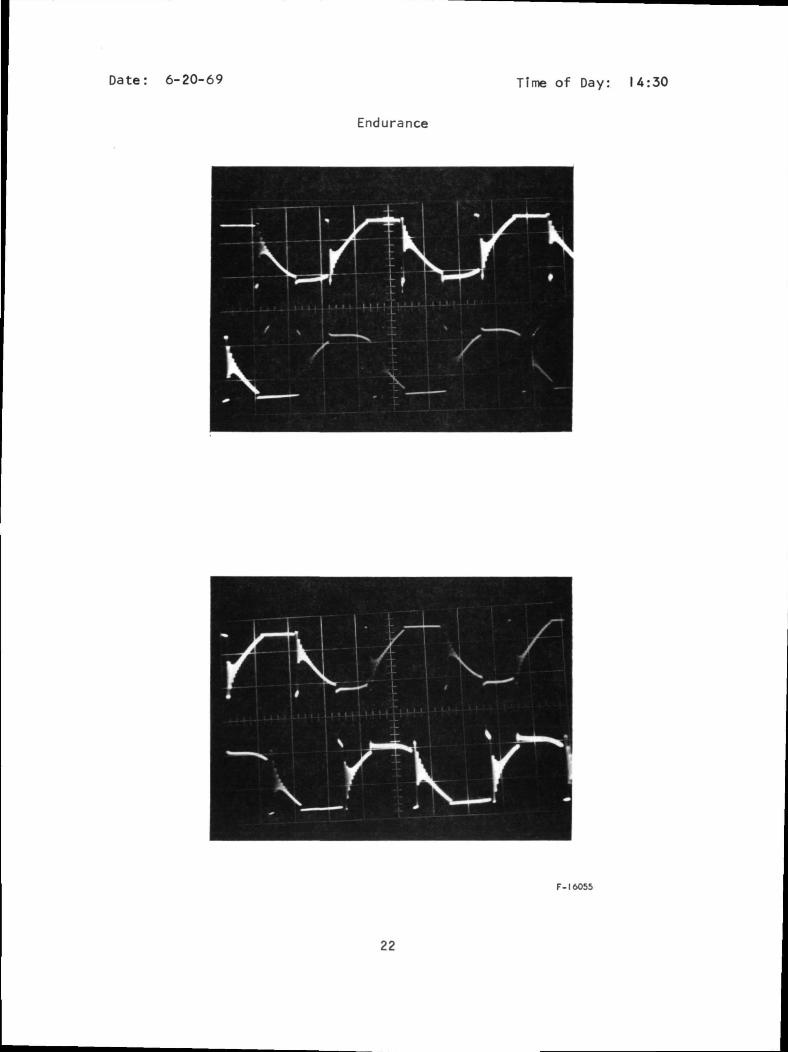
Date: 6-20-69 Time of Day: U:30
Endurance
F-1 6055
22

Date: 6-23-69 Time of Day: 15:15
Endurance
F-16056
23
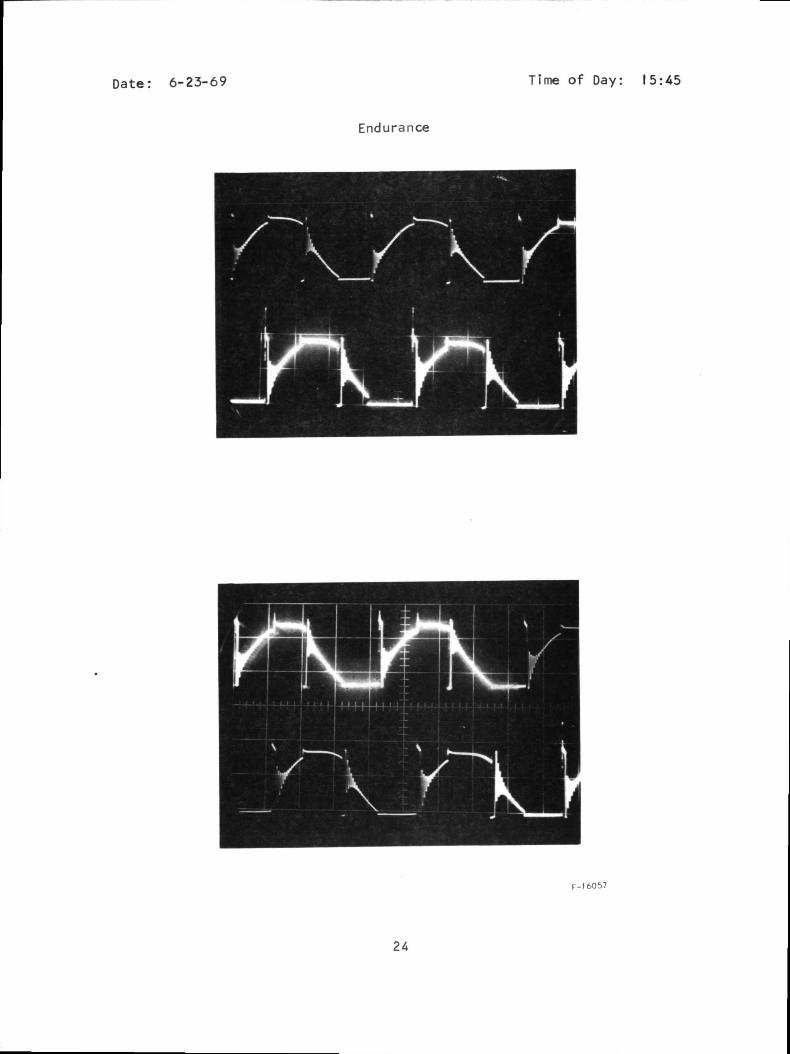
Date: 6-23-69 Time of Day: 15:45
Endurance
J U
—->^m L.F-16057
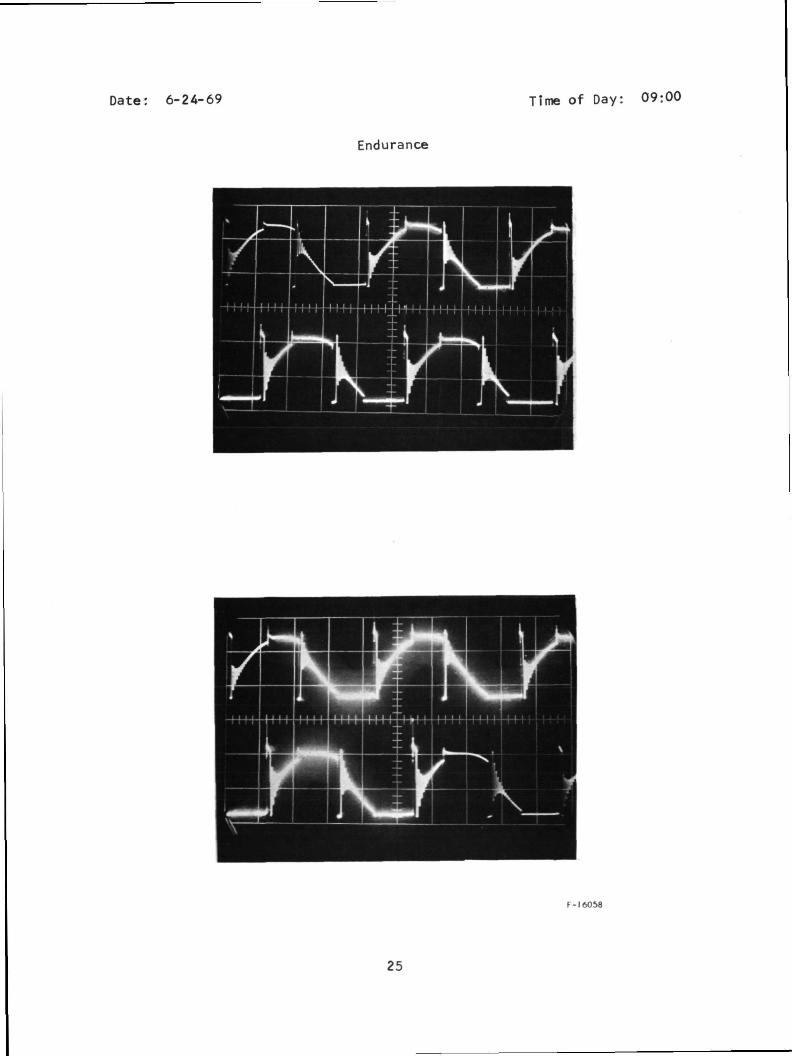
Date: 6-24-69 Time of Day: 09:00
Endurance
F-16058
25
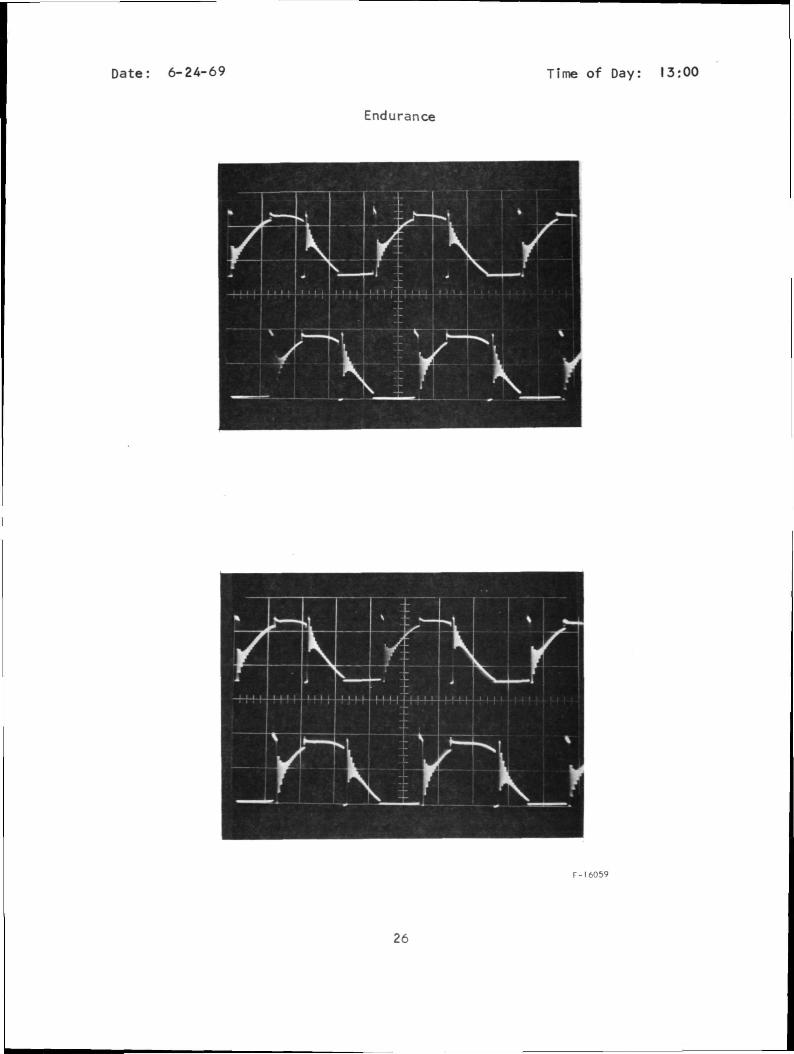
Date: 6-24-69 Time of Day: 13:00
Endurance
F-1 6059
26
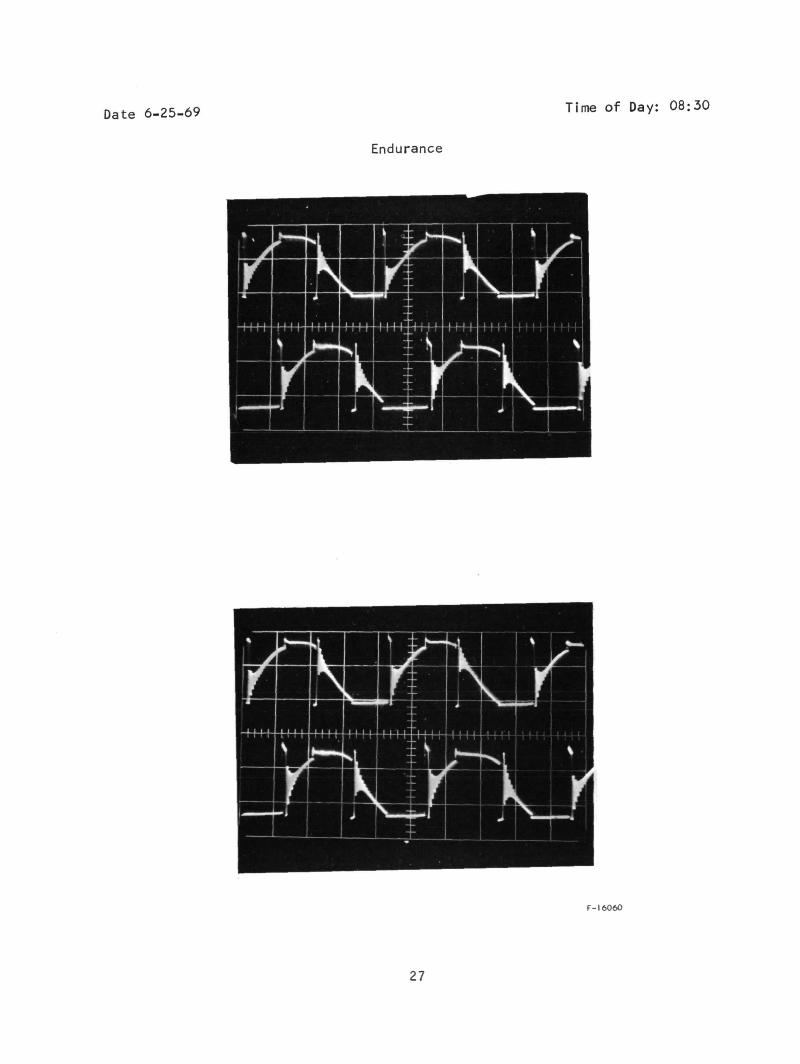
Date 6-25-69 Time of Day: 08:30
Endurance
F-1 6060
27

Date: 6-25-69 Time of Day. |5:30
Endurance
F-I606I
28
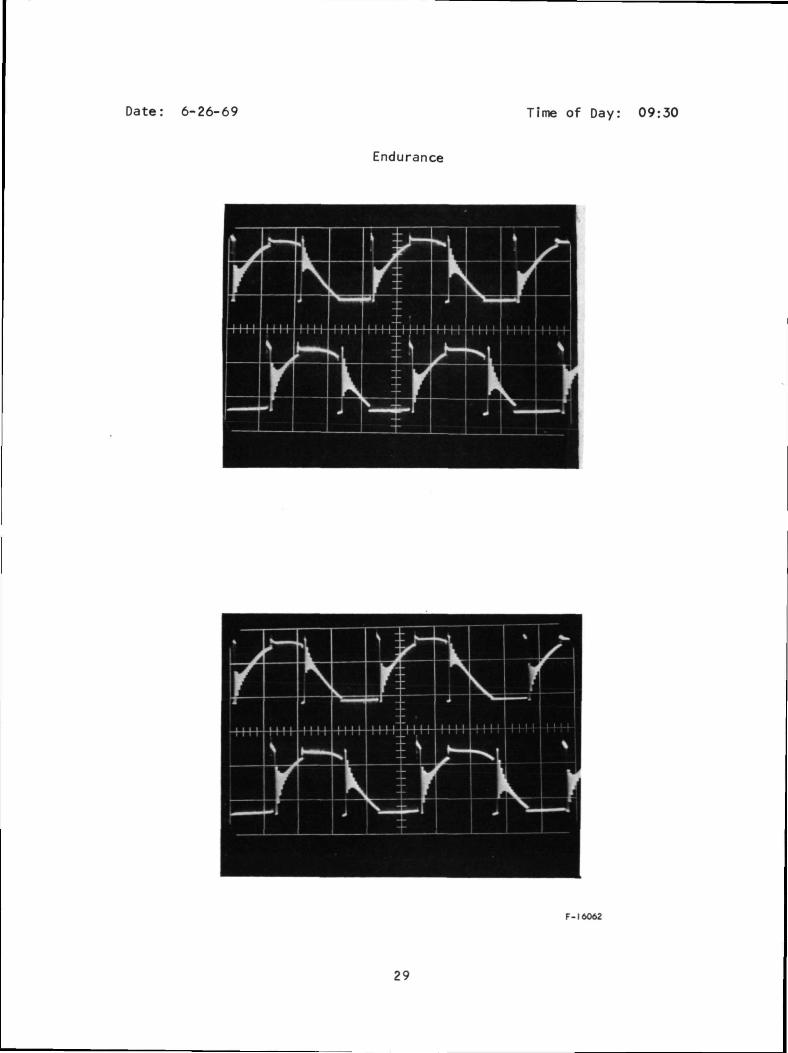
Date: 6-26-69 Time of Day: 09:30
Endurance
F-16062
29
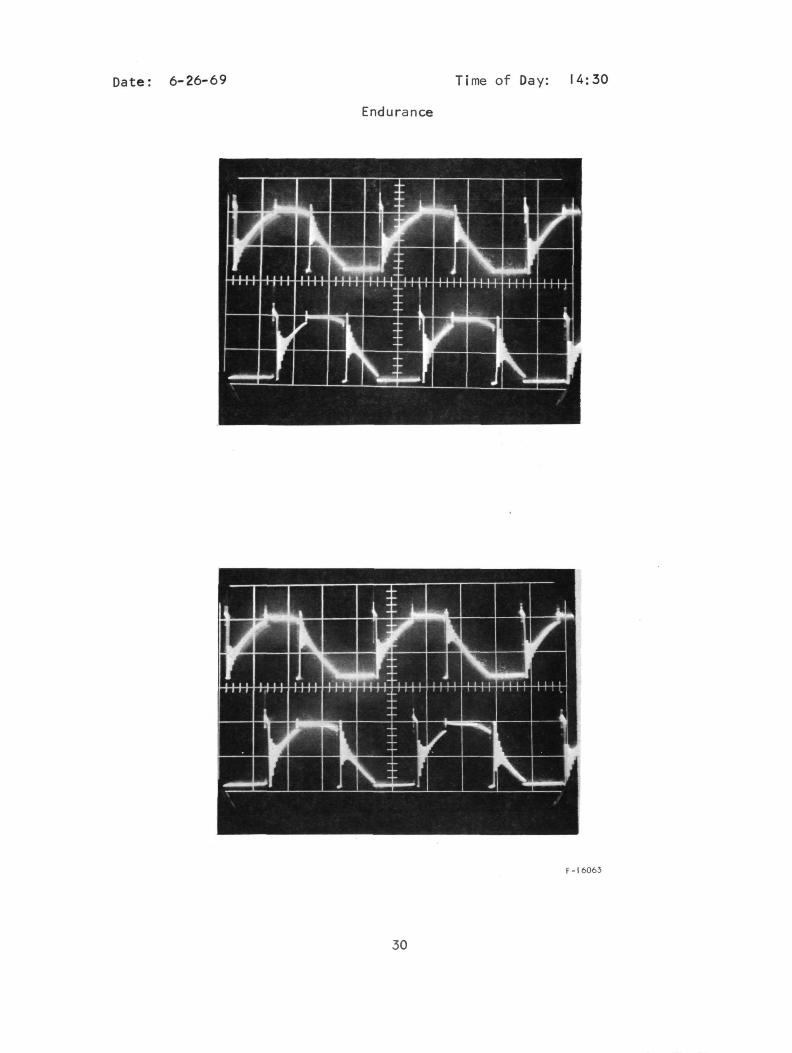
Date: 6-26-69 Time of Day: U:30
Endurance
F-16063
30

Date: 6-27-69 Time of Day: 10:00
Endurance
F-1606*
31
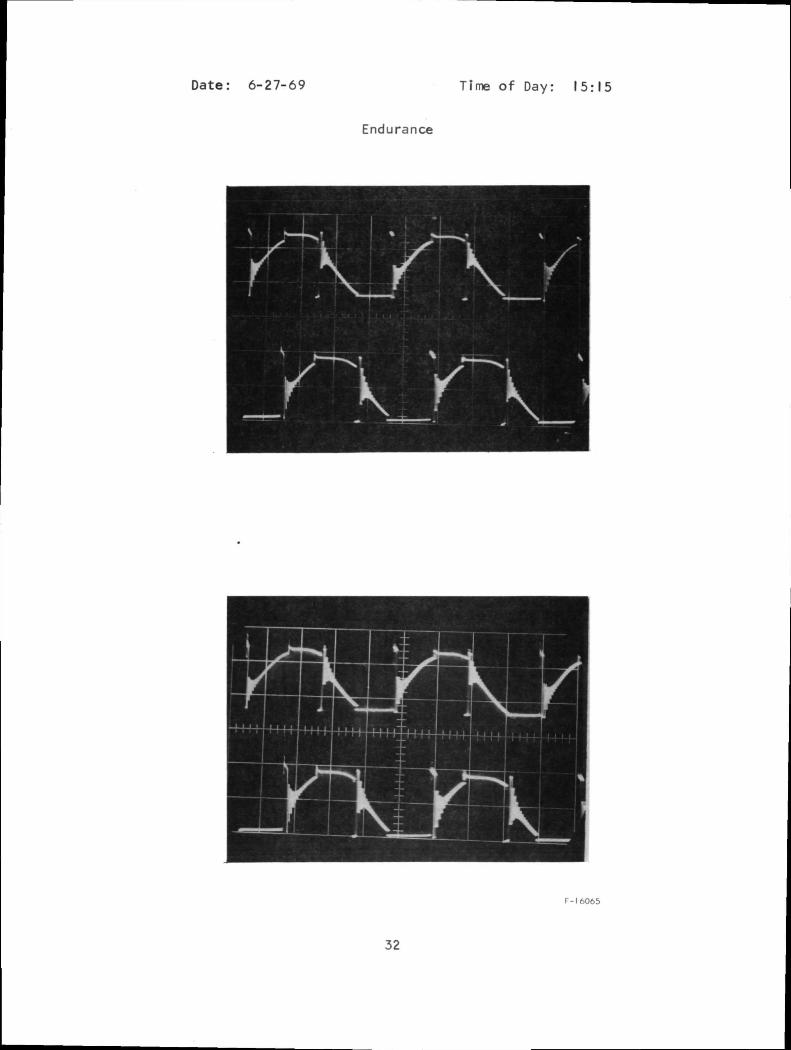
Date: 6-27-69 Time of Day: 15:15
Endurance
r vr \yT
F-1 6065
32

Date: 6-30-69 Time of Day: 09:00
Endurance
F-16066
33
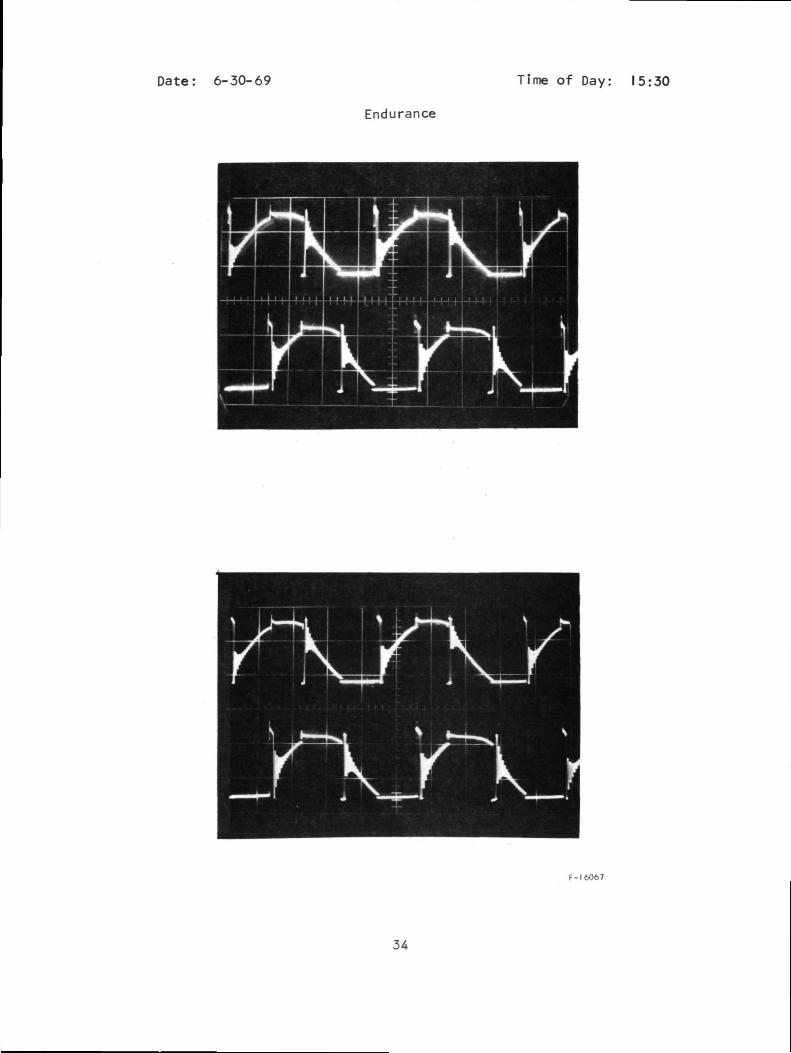
Date: 6-30-69 Time of Day: 15:30
Endurance
F-I 6067
34
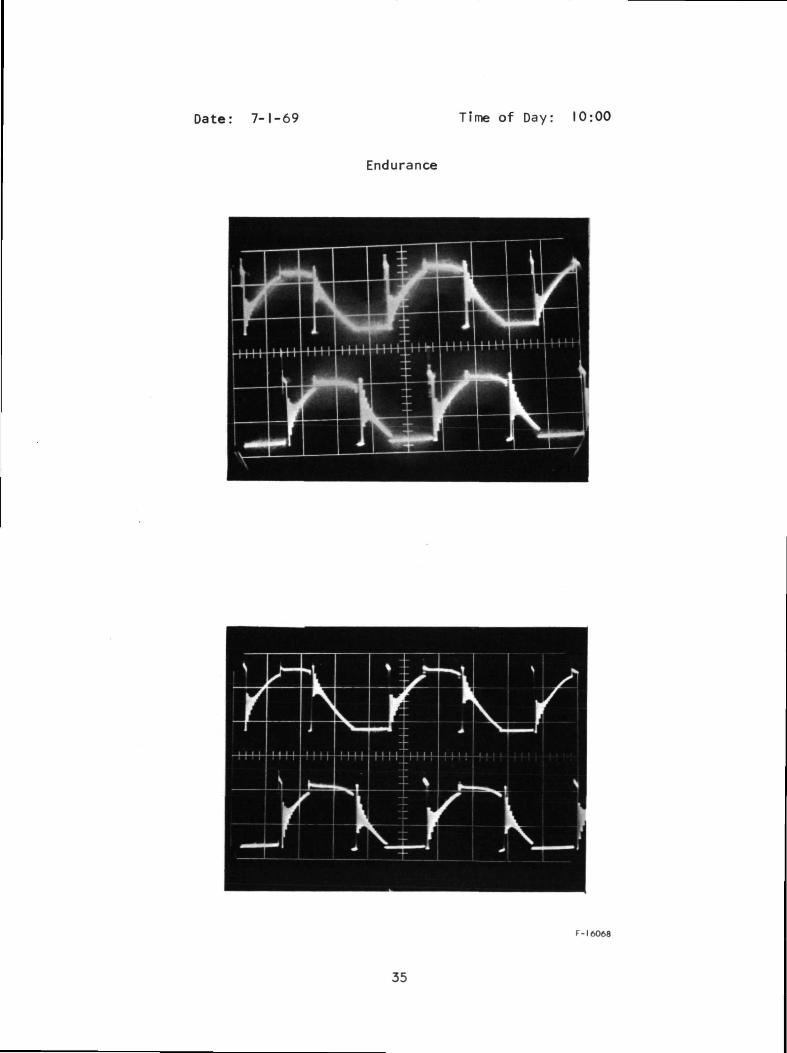
Date: 7-1-69 Time of Day: 10:00
Endurance
F-1 6068
35
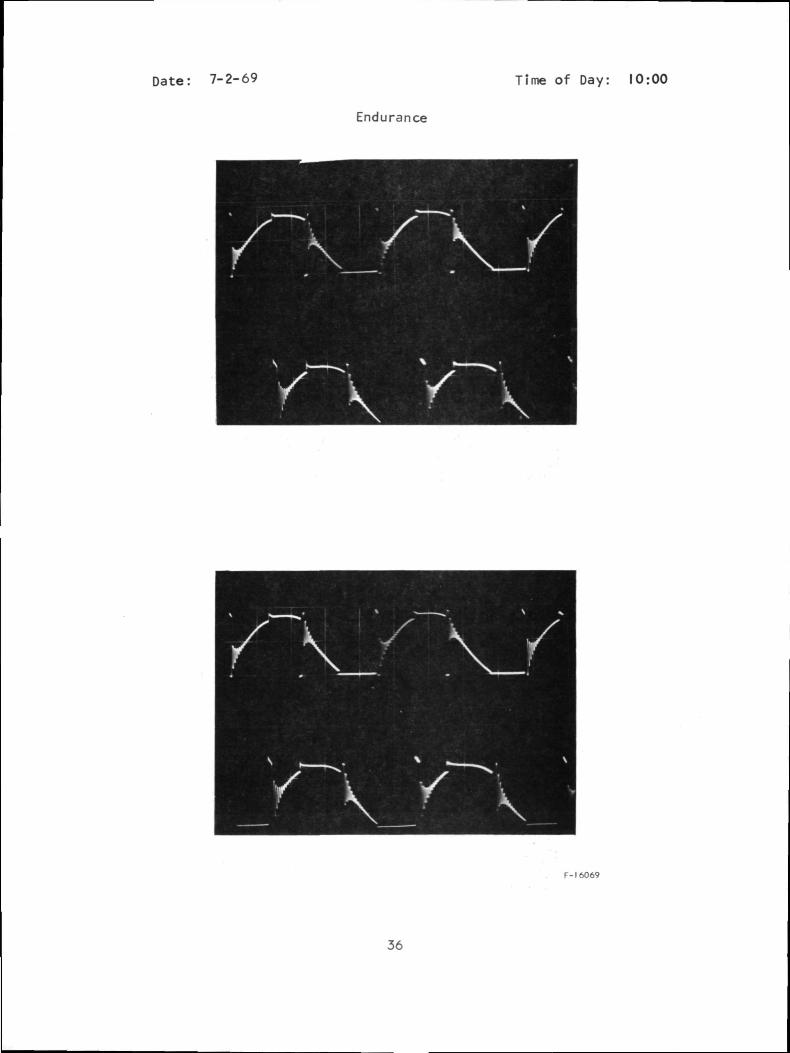
Date: 7-2-69 Time of Day: 10:00
Endurance
F-1 6069
36
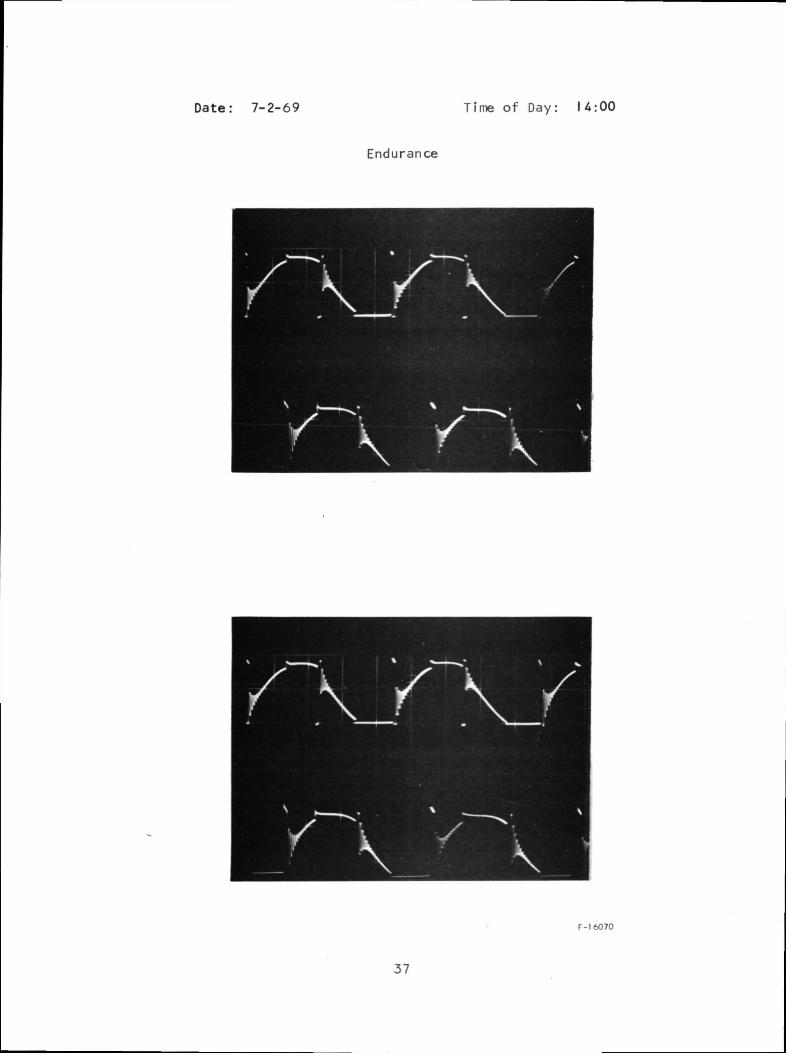
Date: 7-2-69 Time of Day: U:00
Endurance
F-16070
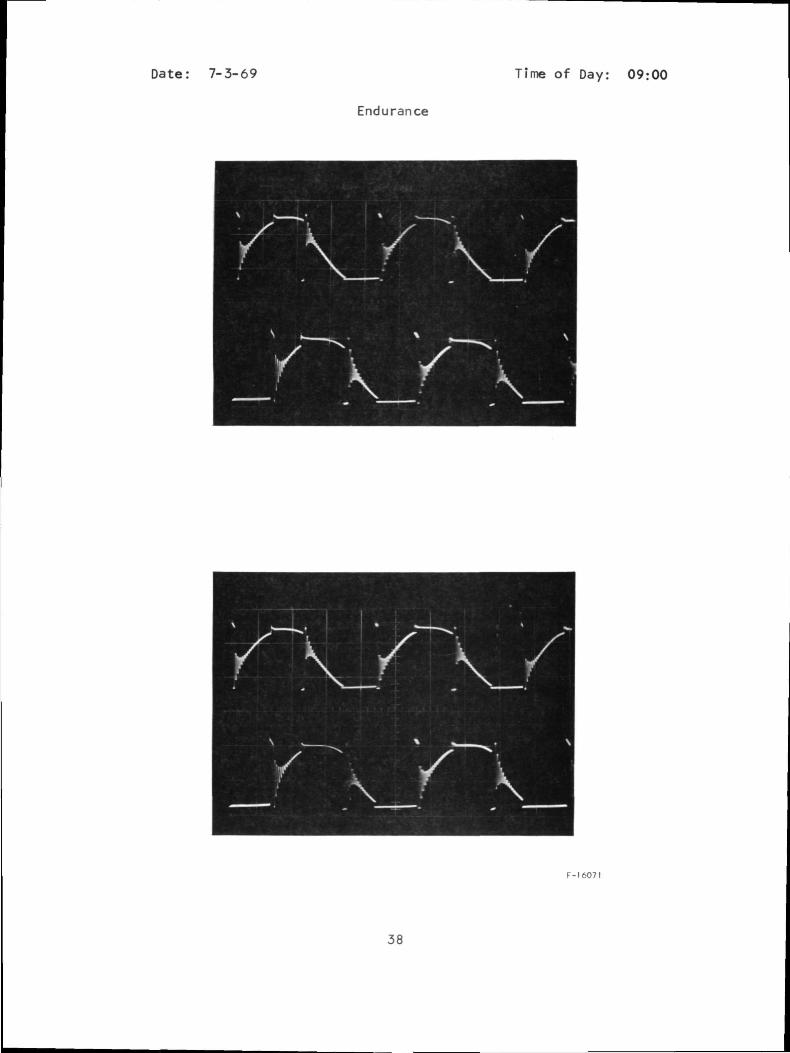
Date: 7-3-69 Time of Day: 09:00
Endurance
F-I 607 I
38
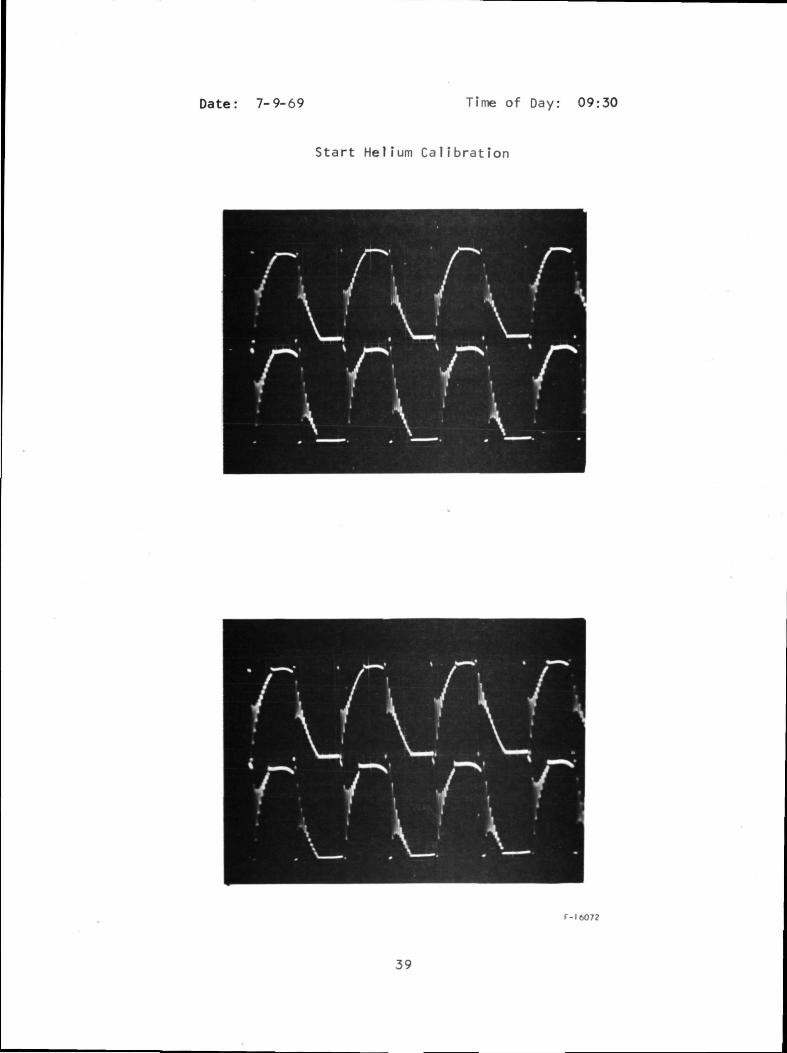
Date: 7-9-69 Time of Day: 09:30
Start Helium Calibration
F-16072
39
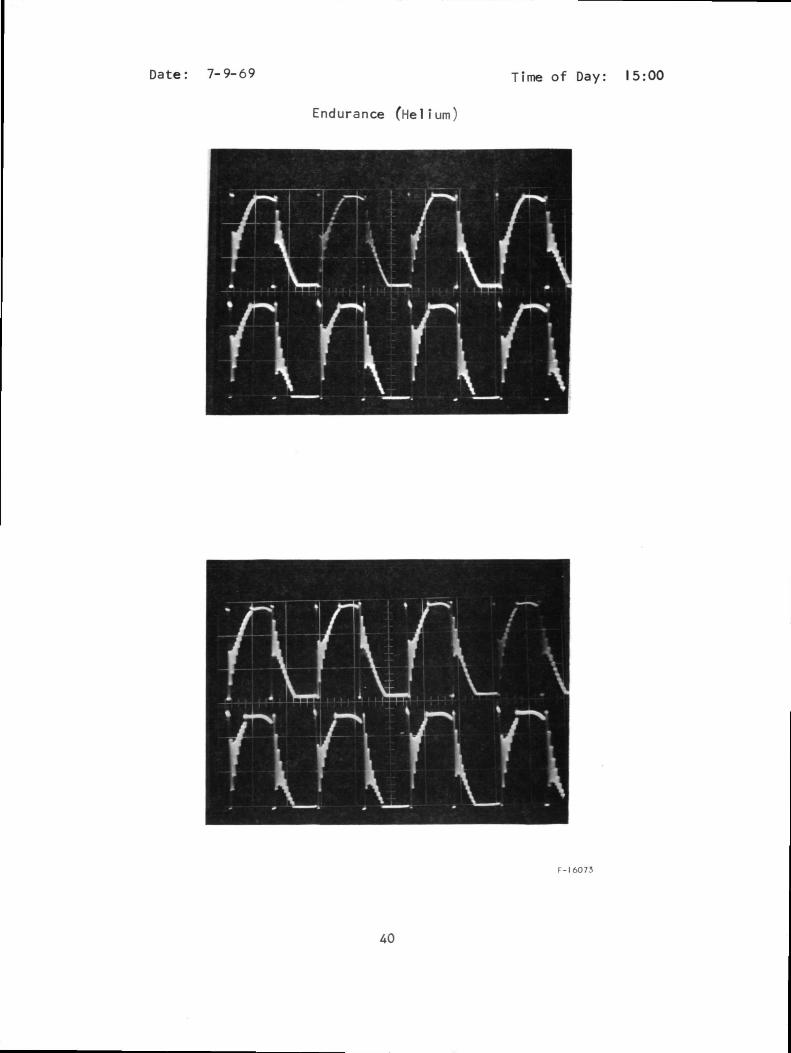
Date: 7-9-69 Time of Day: |5 :QO
Endurance (Helium)
F-16073
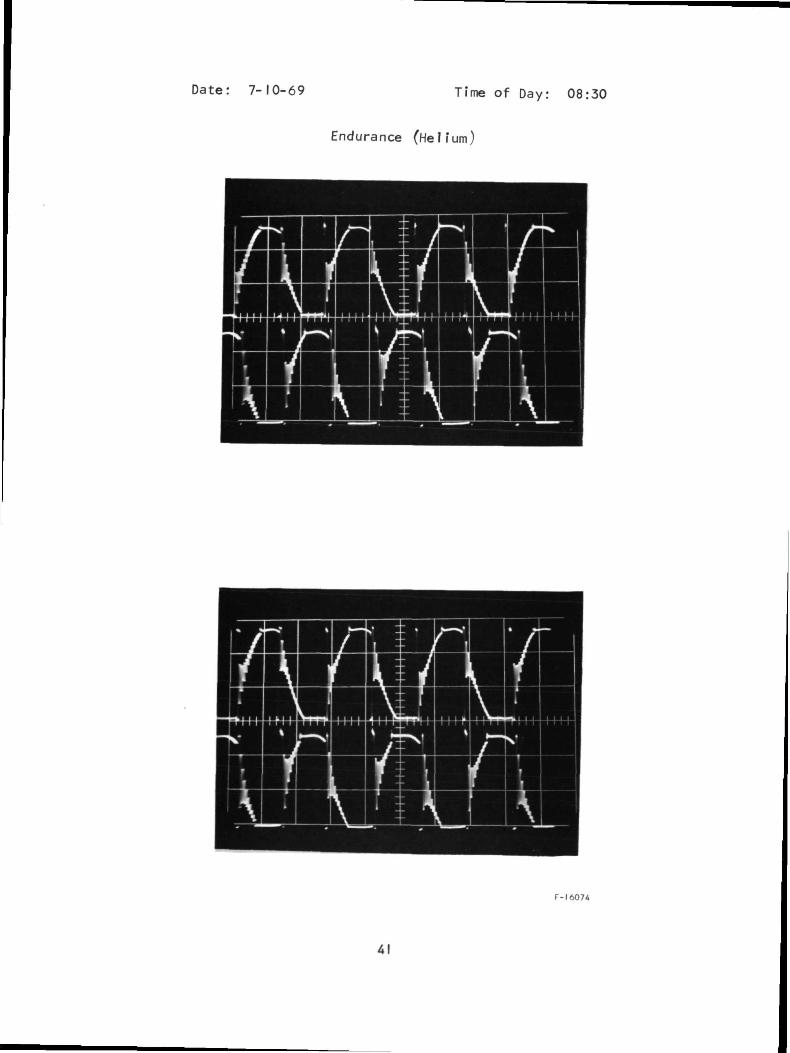
Date: 7-10-69 Time of Day: 08:30
Endurance (Helium)
F-1 6074
41

Date: 7-10-69 Time of Day: U:00
Endurance (Helium)
F-16075

APPENDIX B
AIRESEARCH REPORT
EVALUATION AND DEMONSTRATIONTEST PROCEDURE
CRYOGENIC MIXER PN 605632-1
Report No. 68-4223, Rev 2(18 pages) June 12 1972
AIRESEARCH MANUFACTURING DIVISIONLos Angeles. California
EVALUATION AND DEMONSTRATIONTEST PROCEDURE
AIRESEARCH CRYOGENIC MIXERP/N 605632-1-1
Report Mo. 68-4223, Rev. 2 June 12, 1972
This document is the property of The Garrett Corporation. It is furnished toinform Buyer of the status of Seller's performance and is not to be duplicated,used, or disclosed for any other purpose without the prior written permissionof The Garrett Corporation.
Revised by_ M. W. Meister (6-12-72)
Orlg. Date August 29. 1968 Prepared by
Approved
R- Rudich *•
V. A. A/Nona
REVISIONSRev. No.
1
2
Date
1-10-69
6-12-72
Rev. & New Pages
Complete4-1, 4-2, 4-3,4-4, 4-5, 4-6,4-11
Rev. No. Date Rev. & New Pages

OARRETTAIRESEARCH MANUFACTURING COMPANY
A DIVISION OF THE G A H R t T T COR FOR AT I ON
DOCUMENT CHANGE NOTICEK'l' NO.
Noneth m:TIVIT>
CONTRACT NO. AND AUTHORITY
N/AEND ITEM NO.
605632-1-1
DCN NO.. DOC RbV_ f._
DOC NO._ 68-4225
PAGE _OF
6-5-72
SUPERSEDINGDCN NO.
DISPOSITION INSTRUCTION
D ERRATA SHEET (PARTIAL DOCUMENT!.\ J FILE OPPOSITE PAGE AFFECTED.
J FILE AFTER TITLE PAGE.
J CHANGED PAGE(S) (PARTIAL DOCUMENT] REPLACE PAGE(S) AFFECTED
J SUPPLEMENT OR ADDENDUM. ADD TO EXISTING DOCUMENT.
1x1 COMPLETE DOCUMENT REPLACE PREVIOUS ISSUE.
I ADVANCE
|| PROPOSED
["xl APPROVED
DESCRIPTION OF CHANGE (S)
1. Revised t i t l e page to reflect latest revision.
2. Page 4-1, Para. 4.2.1, 2nd para, line 8 word "it" was "this".
3. Page 4-2, Para. 4.2.2, 3rd para, first two sentences were one, subscript for R wasS (thus R was R_).
4. Page 4-3, Para. 4.2.3, 3rd para, added last phrase.
5. Page 4-4, last para, line 4 added plural to Zener.
6. Page 4-5, completely revised.
7. Page 4-6, 1st para, subscript R was R_.C o
8. Page 4-11, upper left area, R was R .
PREPARED BY DATE CHECKED BY DATE APPROVED BY DATE CONFIG. CONTROL DATE

I. INTRODUCTION
This procedure presents a description of the proposed evaluation anddemonstration testing of a brushless dc motor driven l i q u i d hydrogen mixerunit, Part No. 605632-1-1. The mixer u n i t is designed to demonstrate thef e a s i b i l i t y of this type equipment for cryogenic tanks used in space f l i g h tas set forth in Exhibit A of NASA Contract NAS3-II208.
The tests described in this procedure w i l l be a demonstration that theunit w i l l operate with li q u i d hydrogen, gaseous hydrogen and gaseous heliumat l i q u i d hydrogen temperatures. The tests described w i l l also demonstrateoperation with a slugging flow consisting of mixtures of l i q u i d and gaseoushydrogen.
These tests are des.igned to measure the motor and hydrodynamic efficien-cies separately. In order to accomplish this, a procedure is presented whichpermits an aerodynamic calibration in high density air to be related to l i q u i dhydrogen by the laws of dynamic similarity. Liquid nitrogen and li q u i dhelium tests w i l l also be conducted to predict certain electronic losses atl i q u i d hydrogen temperatures.
68-4223Page I-I
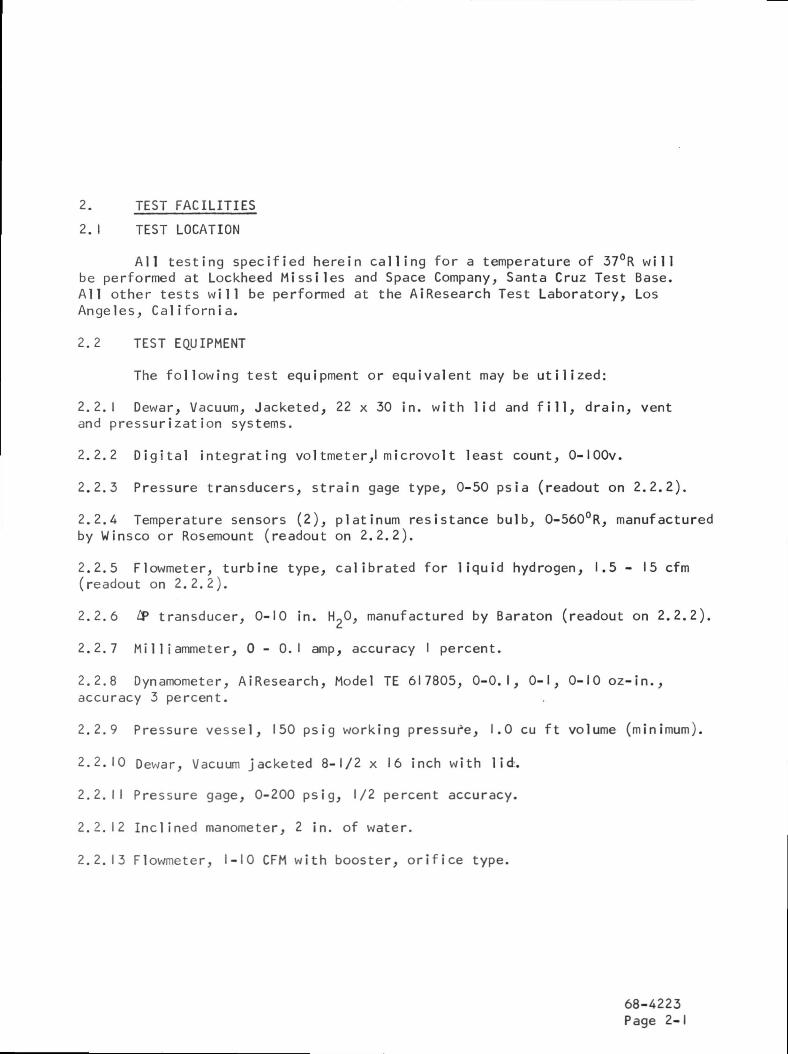
2. TEST FACILITIES
1.I TEST LOCATION
All testing specified herein calling for a temperature of 37°R w i l lbe performed at Lockheed Missiles and Space Company, Santa Cruz Test Base.All other tests w i l l be performed at the AiResearch Test Laboratory, LosAngeles, California.
2.2 TEST EQUIPMENT
The following test equipment or equivalent may be utilized:
2.2.1 Dewar, Vacuum, Jacketed, 22 x 30 in. with lid and f i l l , drain, ventand pressurization systems.
2.2.2 Digital integrating voltmeter,! microvolt least count, 0-IOOv.
2.2.3 Pressure transducers, strain gage type, 0-50 psia (readout on 2.2.2).
2.2.4 Temperature sensors (2), platinum resistance bulb, 0-560°R, manufacturedby Winsco or Rosemount (readout on 2.2.2).
2.2.5 Flowmeter, turbine type, calibrated for liq u i d hydrogen, 1.5 - 15 cfm(readout on 2.2.2).
2.2.6 IP transducer, 0-10 in. HpO, manufactured by Baraton (readout on 2.2.2).
2.2.7 Mi 11iammeter, 0 - 0 . 1 amp, accuracy I percent.
2.2.8 Dynamometer, AiResearch, Model TE 617805, 0-0.1, 0-1, 0-10 oz-in.,accuracy 3 percent.
2.2.9 Pressure vessel, 150 psig working pressure, 1.0 cu ft volume (minimum).
2.2.10 Dewar, Vacuum jacketed 8-1/2 x 16 inch with lid.
2.2.11 Pressure gage, 0-200 psig, 1/2 percent accuracy.
2.2.12 Inclined manometer, 2 in. of water.
2.2.13 Flowmeter, 1-10 CFM with booster, orifice type.
68-4223Page 2-1
2.2.14 Temperature bridge, Leeds &. Northrup potentiometer bridge type, ironconstantan couples.
2.2.15 Ammeter, dc. 0.5 amps, 1/2 percent accuracy.
2.2.16 Voltmeter, dc 0-30 v, 1/2 percent accuracy.
2.2.17 D i g i t a l counter.
2.2.18 Dynamometer, Magtrol model HDI06-I, 0-0.5, 0-1, 0-2 oz-in., accuracy2-1/2 percent.
2.2.19 Variable dc power supply 0-40 v. 0-0.5 amp (min.)
2.2.20 Pressure gage.0-30 psig ?l/2 percent accuracy.
2.2.21 Pressure gage 0-100 psig 1/2 percent accuracy.
2.2.22 Oscilloscope, Techtronix 547 with I Al plug in, or equivalent.
68-4223Page 2-2
3. TEST CONDITIONS
1.I TEST SPECIMEN
Only one u n i t is being fabricated on the subject contract; it w i l l beu t i l i z e d for all tests specified herein.
3.2 GENERAL
Each test setup shall be photographed. Unless otherwise specified, alltests shall be performed at the following laboratory ambient conditions:
Temperature 0 to 35°C
Atmospheric Pressure 28 to 31 in. Hg abs
Relative Humidity Not greater than 90 percent relative
3.3 TEST TOLERANCES
Unless otherwise specified, test tolerances shall not vary more than ±3°Ffor all temperatures above -100 F or ±5°F for all temperatures below -IOO°F;±2 percent for all applied voltages.
68-4223Page 3-1
4.0 PROCEDURE
1.I Examination of Product
The mixer assembly shall be examined for conformance to the outlinedrawing with respect to workmanship, finish dimensions and markings. Examinethe assembly thoroughly for evidence of damage due to handling and/or shipping.The impeller shall turn freely with no evidence of binding.
4.2 Motor Power Determination
4.2.1 Test Philosophy
The methods presented herein to measure the total power input to themotor, and the efficiency of the electronics module, are explained withthe aid of Figure I.
It can be seen that there are two power input paths to the motor: Themain motor power bus and the position sensor excitation lines, both from theelectronics. There are two power output paths from the motor back to theelectronics: The position sensor feedback lines and the electronic commutator.The balance of the power supplied to the motor remains in the tank in the formof losses and in the form of useful work. The determination of the latter iscovered elsewhere in this report. The net power input to the motor is obtainedby measuring the gross power input to the motor and subtracting from it thatpower which is returned to the electronics. With the measurement the totalinput current to the electronics, sufficient information is also obtained todetermine the efficiency of the electronics.
The net input power to the motor, PMN, is given by:
P =P + P -P -PMN MB ME EF EC
where PUI1 is the power supplied to the motor by the motor busMb
P P is the power supplied to excite the shaft positionsensors
PPF is the power returned to the electronics as theshaft position feedback signal
P... is that portion of P.._ which is dissipated in thetL MB
electronic commutator in the form of switchinglosses and forward drops.
68-4223, Rev.Page 4-1
If PF. is the input power to the electronics, then the efficiency ofthe electronics module is given by
\ - PMN *' PEi 2
The power input to the electronics (Pp.) from the power supply isreadily measured. The methods for obtaining the other powers involved aredescribed in the following paragraphs.
4.2.2 Motor Bus Power
The power supplied to the motor via the bus connecting the motor tothe electronics is given by:
em
where e is the instantaneous motor input voltage, i is the instantaneousmotor input current, and T is the periodicity of the power pulses.
Capacitor C shown in Figure I is sufficiently large to hold the motor voltageconstant at a given operating point. Mathematically:
e = Vu = constant 4m
and thus: „ r . ,dt - M Mv rT
4 i '•where Iu is the average motor current.n
V w i l l be directly measured in the test set-up by means of a DC digitalvoltmeter. The average motor current is obtained indirectly. It may benoted from Figure I that all of current I , and only IM, is supplied viathe shaping resistor, RE- Since the potentials at both the terminationsof this resistor are DC, the current is given by
and thus finally
PHB - "M
68-4223, Rev. 2Page 4-2
where V. is the DC voltage supplied to the electronics module (alsomeasured with a digital voltmeter). RE is a fixed wire-wound resistor,thus its value is accurately known and stable.
It is well to note that if C_ were absent, then both e and i wouldbe complex wave forms containing significant fourier components tovery high frequencies,making the integration and multiplication calledfor by equation 5 difficult to achieve accurately without a ratherspecial wattmeter transducer.
4.2.3 Shaft Position Sensor Excitation Losses
The excitation power of the motor shaft position sensors is virtuallyall dissipated in the tank. The IOOK Hz excitation voltage is sinusoidal,E . sin uut; the excitation current is also essentially sinusoidal and lagging,pKI . sin (uut-9). Thus the real power is given by
PM_ - 1 I . E . COS9 . 8ME g Pk Pk
This power is readily measurable to an accuracy of ± 15$ with the shuntand oscilloscope set-up shown in Figure I. These losses are temperaturesensitive but independent of motor load.
For simplicity, the measurement of these losses will be performed in theelectronics laboratory rather than in the cryogenics laboratories. Since LH~cannot be used in the electronics laboratory, measurements w i l l be made inLH and LN?. The losses under these conditions w i l l then be linearlyextrapolated to obtain the losses at LH- temperatures. It should be notedthat because the excitation losses are small compared to the total in-tankpower, relatively large errors in their measurement have little effect onthe accuracy of the total in-tank power determination. It has been foundthat copper and iron losses are essentially linear in this temperaturerange, thus the linear extrapolation is valid.
4.2.4 Position Feedback Signal Power
The portion of the position sensor excitation power extracted from thetank in the form of a feedback signal actuating the commutator amplifiersis typically in the order of two milliwatts, and thus is considered to benegligible. Consequently
P£F !• 0
68-4223, Rev. 2Page 4-3
4.2.5 Commutation Losses
Not all the power entering the tank via the motor power bus is dissipatedinside the tank. Some of it is dissipated in the commutator which is locatedin the electronics package. These losses consist of two components: Forwardconduction losses of the transistors and switching losses of the transistorsand of their protective zeners. The measurement of both of these lossespresent sufficient difficulties that again they will be measured in theelectronics laboratory rather than the cryogenics laboratory.
4.2.5.1 Commutator Series Drop
The commutator forward conduction drop consists of the product of themotor current and of the transistor collector to emitter saturation voltage.This saturation voltage is difficult to measure under dynamic conditions be-cause the large, normal, col lector to emitter signal excursions make smalldeviations from zero hard to resolve.
The transistor saturation and wiring losses will be statically determinedas a function of current for each of the four commutators, and the powerabsorbed w i l l be graphed as a function of the average motor current. Thisdata can then be used with the information obtained during cryogenic testingto calculate the in-tank power losses. For a given operating point theselosses are independent of motor temperature, thus calibration at lab ambientis adequate.
4.2.5.2 Switching Losses
The switching losses of the commutator present a rather complex pictureparticularly in the presence of the stray capacitance associated with the longcable.
In the absence of stray capacitance, (including the transistor's junctioncapacitance), the turn-on pulse would be dissipationless since the i n i t i a ltransistor voltage would be instantly transferred to the motor winding induc-tance, after which current would build up in the standard L/R circuit manner.In practice, however, the stray capacitance results in a somewhat triangularpower pulse which is a complex function of the circuit parameters, of currentrise time, (i.e., of motor speed) of amplifier gain, and of sensor dynamics.This power pulse is measurable by numerical integration of a simultaneousdisplay of transistor collector current and collector to emitter voltage.
The turn-off transient consists primarily of the discharge of the energystored in the motor inductance just prior to commutation. Some of thisenergy is lost in the winding resistance, some in the switching transistor,and some in the protective Zeners. This energy is again measurable bynumerical integration of a simultaneous oscilloscope display of collectorto emitter voltage and the combined transistor/zener current. This poweris a function of circuit parameters, motor load, motor speed, and motortemperature.
68-4223, Rev. 2Page 4-4
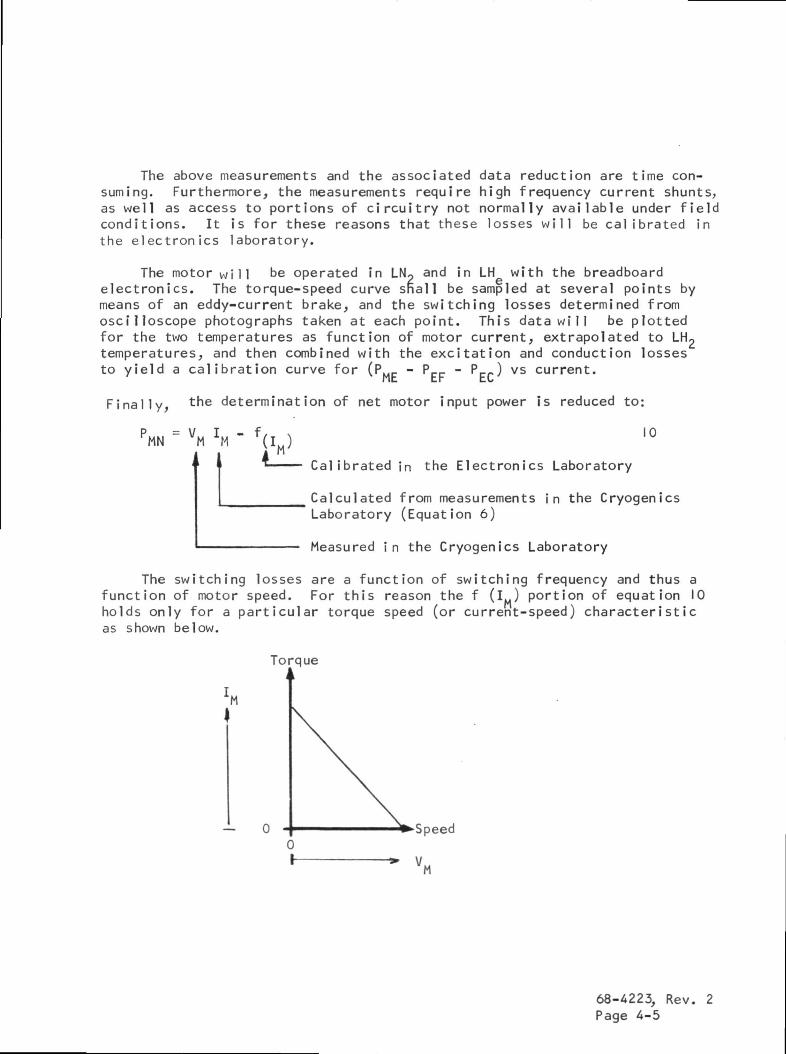
The above measurements and the associated data reduction are time con-suming. Furthermore, the measurements require high frequency current shunts,
well as access to portions of circuitry not normally available under fieldasconditions. Itthe electronics
is for these1aboratory.
reasons that these losses w i l l be calibrated in
The motor w i l l be operated in LN2 and in LH with the breadboardelectronics. The torque-speed curve shall be sampled at several points bymeans of an eddy-current brake, and the switching losses determined fromoscilloscope photographs taken at each point. This data wi11 be plottedfor the two temperatures as function of motor current, extrapolated to LH~temperatures, and then combined with the excitation and conduction lossesto yield a calibration curve for (PMC - P
ME EF vs current.
Finally, the determination of net motor input power is reduced to:
P = V*MN
i
M ]
i
H " f <V_10
Calibrated in the Electronics Laboratory
Calculated from measurements in the CryogenicsLaboratory (Equation 6)
Measured i n the Cryogenics Laboratory
The switching losses are a function of switching frequency and thus afunction of motor speed. For this reason the f (I ) portion of equation 10holds only for a particular torque speed (or current-speed) characteristicas shown below.
Torque
— 0
68-4223, Rev. 2Page 4-5
Over the temperature range under consideration (4°K to 77°K) the fluxof the rotor magnet has been found to remain constant and thus the torque-speed characteristic is determined by the total circuit resistance only.In order to compensate for stator resistance changes, the tests at Lh^ andLN? must be run with external resistance (RE) chosen to obtain the torque-speed characteristic specified for LHp temperatures, thus maintaining aconstant relationship between speed and motor current.
4.3 Cryogenic Testing
4.3.1 Cool Down and Slugging
The mixer shall be installed in the test ducting with the electronicspackage mounted to a convenient surface outside the dewar as shown in Figure2. The setup and fan shall be purged for 15 minutes minimum by evacuatingthe dewar to 10 microns- pressure. The setup (dewar) shall then be filledwith boiloff-hydrogen gas to a pressure of 17 to 20 psia. Liquid hydrogenshall then be introduced into the dewar. When the dewar temperature reachesIOO°R apply 28 ± 0.5 vdc to the electronics package. A record of test timeshall be maintained and recorded on the applicable data sheet. Motor cur-rent shall be observed during filling. The current may vary but if thecurrent remains at or above 0.32 amps for more than I minute it is an indi-cation that the mixer has stopped. Shut power OFF to motor immediately andnotify proper AiResearch representative. If motor current remains below0.32 amps, f i l l i n g shall continue until the proper liquid level is reached.
4.3.2 Calibration in Liquid Hydrogen
Immediately upon completion of the operations called out in Paragraph4.3.1, the dewar pressure shall be adjusted to 17 ± 0.5 psia and the temper-ature allowed to stabilize at 37 ± 2°R. The back pressure valve shall beopened fully and the first data point recorded. The valve shall be partiallyclosed and data points recorded at flows of approximately 8, 6.5, and 3.5 cfm.A data point recording shall include the following:
Mixer Inlet Pressure
Mixer Inlet Temperature
Mixer Pressure Rise
Flow Rate
Applied Voltage
Input Current
Motor Speed
68-4223, Rev. 2Page 4-6
Motor Voltage
Operating Time
4.3.3 Calibration in Gaseous Hydrogen
Continuing from 4.3.2, if possible, l i q u i d shall be drained from thedewar until the mixer inlet duct is above the level of the l i q u i d hydrogenand is positioned to pick up hydrogen vapor at a pressure of 17 ±0.5 psiaand a temperature of 37 ± 2°R. The mixer shall be operated and data pointsrecorded as called out in Paragraph 4.3.2.
4.3.4 Calibration in Gaseous Helium
The mixer shall be mounted in a closed loop with a helium connectionand the loop reinstalled in the dewar as shown in Figure 3, The loop ventvalve shall be opened and the system evacuated as discussed in Paragraph4.3.1. Prior to f i l l i n g with hydrogen, the loop vent valve shall be closedand the loop pressurized to 17 to 20 psia and f i l l i n g with hydrogen started.During f i l l i n g and operation, the pressure inside the loop shall be main-tained greater than dewar pressure with makeup helium to prevent hydrogenfrom leaking into the loop through any minor system leaks that might beproduced by thermal contraction. After the helium temperature is stabil-ized at 37 ± 2°R and its pressure is stabilized at 17 ± 0.5 psia data pointsshall be recorded as specified in Paragraph 4.3.2. Voltage, pressure andtemperature shall also be recorded.
4.3.5 Endurance
The mixer shall be reinstalled in the dewar as described in Paragraph4.1.2 and a cycle timer installed on the input power line. The timer shallbe set to cycle 4 min ± 15 sec ON and 2 min ± 15 sec OFF. The inlet ductshall be immersed in l i q u i d hydrogen at all times. The test shall be con-tinued until the total duration of this test plus the operating times ofParagraphs 4.3.1, 4.3.2, 4.3.3, and 4.3.4 equal 100 hr. The sum of timesof this test and Paragraph 4.3.2 shall not be less than 75 hr. The loopback pressure shall be such that after coming up to speed the mixer does notflow less than 5 cfm. The data point recordings called out in Paragraph4.3.2 shall be recorded every four hours.
4.4 Aerodynamic Calibration
4.4. I
In order to determine motor efficiency at very low temperatures, it isnecessary to know the motor shaft power. To know motor shaft power, it isnecessary to measure motor torque at these very low temperatures or to applya known load to the motor shaft. Measurement of motor torque at l i q u i dhydrogen temperatures is very difficult, so the mixer aerodynamic componentsw i l l be calibrated in air to provide a known load in the operational fluids(LH0, GH9 and GHo), and as shown in Figure 4.
68-4223Page 4-7
For such a calibration to be valid, geometric and dynamic similaritymust be maintained. For geometric similarity to be maintained, the mechanicalconfiguration must be the same for the unit operating in the operating fluidand in the calibrating fluid. Both the operating and calibrating fluids mustalso strike the aerodynamic components at the same angle for geometricsimilarity to be maintained. To maintain dynamic similarity, both thecalibrating fluid and operating fluid Reynolds Numbers (ND) must be the same.
K
ND =K(dimensionless)
Y Fluid Velocity
C Characteristic Dimension (blade chord length)
Q Fluid Density
jj. Viscosity
In order to insure geometric similarity, the rotational speed and flowrate may be held constant in both the calibrating and operating fluids.Since the same aerodynamic components are used for both calibration andoperation, geometric similarity is assured if the angle at which the bladingmeets the fluid (air angle) is the same in both the calibrating and operatingfluids. The rotational speed and through flow velocity determine the airangle, and if the rotational speed and volumetric flow rates are the same forboth the calibrating and operating fluids, geometric similarity is assured.
Reynolds Number is fundamental to the establishment of dynamic similar-ity. It establishes the relationship between the viscous and inertial forcesand insures that dimensionless coefficients are comparable when a machine isoperated in two different fluids. By inspection of the formula for ReynoldsNumber, it may be seen that all the terms which effect incompressible flowbetween two geometrically similar devices are included. By way of contrastSpecific Speed (N ) is often considered an influencing rotating machineryperformance.
N = rpm >/ CFMAP/<r
A P Pressure change
CT ratio of fluid densities
Specific Speed does influence performance and may be applied without knowingthe dimensions of the machine in question. It tacitly assumes that anyviscous changes are unimportant. It is, a good rule of thumb but ignorestwo items which may exercise a powerful influence on performance,blade chord
68-4223Page 4-8
length and fluid viscosity. A careful examination wi l l show that for aconstant geometry, all terms effecting performance included in Ns areincluded in MR, but NR also includes dimensional and viscosity dimensionswhich Ns does not have.
The "C" term in the NR equation is a constant; V w i l l be the samewhenever the rotational speed and volumetric flow rates are the same forboth fluids. The viscosity term is independent of pressure in the rangeof pressures under consideration; it is a function only of the propertiesof the fluid and the fluid temperature. Then for NR to be the same forboth the calibrating and operating fluids the following relationship holds:
0 i =P |-i cal> cal \operating —cM. operating
The pressures called out in the following paragraphs were found using thisrelationship. In order to make sure that the air angles and velocitiesare the same, each operating point must have a calibration point. This hasbeen accomplished in the paragraphs that follow.
It has been found that the brushless motor will operate satisfactorilyat room temperature, so it w i l l be used for the aerodynamics calibration.
4.4.2 In order to maintain dynamic similarity the air pressure at the mixerinlet shall be maintained at 161 ±2 psia (146.3 ±2 psig). The fan speed andback pressure shall be adjusted to within I percent of each of the values ofspeed and volume flow obtained for the liquid hydrogen calibration of Para-graph 4.1.3. The following parameters shall be recorded:
Mixer Inlet Pressure
Mixer Inlet Temperature
Mixer Pressure Rise
Flowrate
Motor Voltage
Motor Current
Motor Speed
4.4.3 The test specified in Paragraph 4.1.7.1 shall be repeated except thatthe mixer inlet pressure shall be 32 ±0.5 psia (17.3 ±0.5 psig) and theoperating points from the helium test of Paragraph 4.1.5 shall be used.
68-4223Page 4-9
4.4.4 The test specified in Paragraph 4.1.7.1 shall be repeated except thatthe mixer inlet pressure shall be 75 ±1.0 psia (60.3 ±1.0 psig) and thespeeds and volume flows shall be within I percent of those obtained duringthe gaseous hydrogen calibration, Paragraph 4.1.4.
4.4.5 Motor Calibrat ion
The impeller shall be removed from the motor. The motor shall beconnected to a dynamometer. The dynamometer shall be set to maintain eachof the motor voltages, currents and speeds from Paragraphs 4.1.7.1, 4.1.7.2,and 4.1.7.3. The following data shall be recorded:
Voltage
Motor Current
Motor Speed
Dynamometer Reading (Load)
68-4223Page 4-10
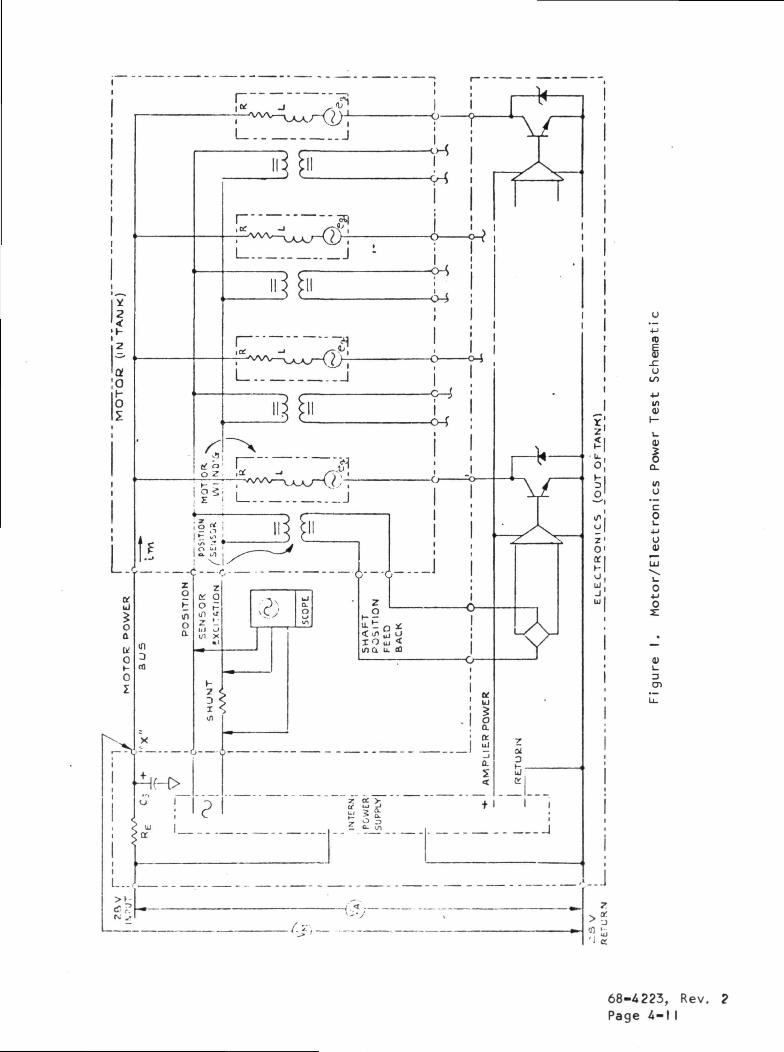
2
'h
a10
o
J
Y1
|
•r£vw ju^-<2)T' v I
\ ---------- J I-o-l
-A^^KK
>
u00
Ul<u
L.0)
I/Io
o
o0)
o
uen
68-4223, Rev. ?Page 4-1 I
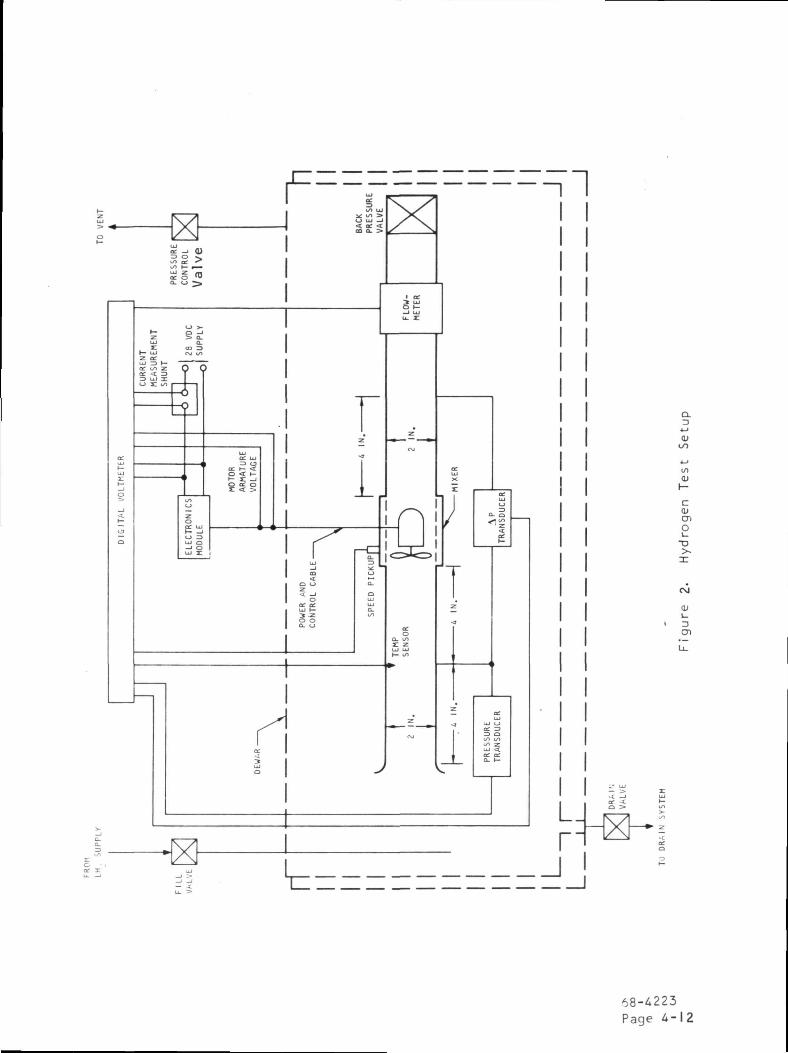
•nOJ
C<Ua-£
co
1JL.
cn
68-A223Page 4 - 1 2
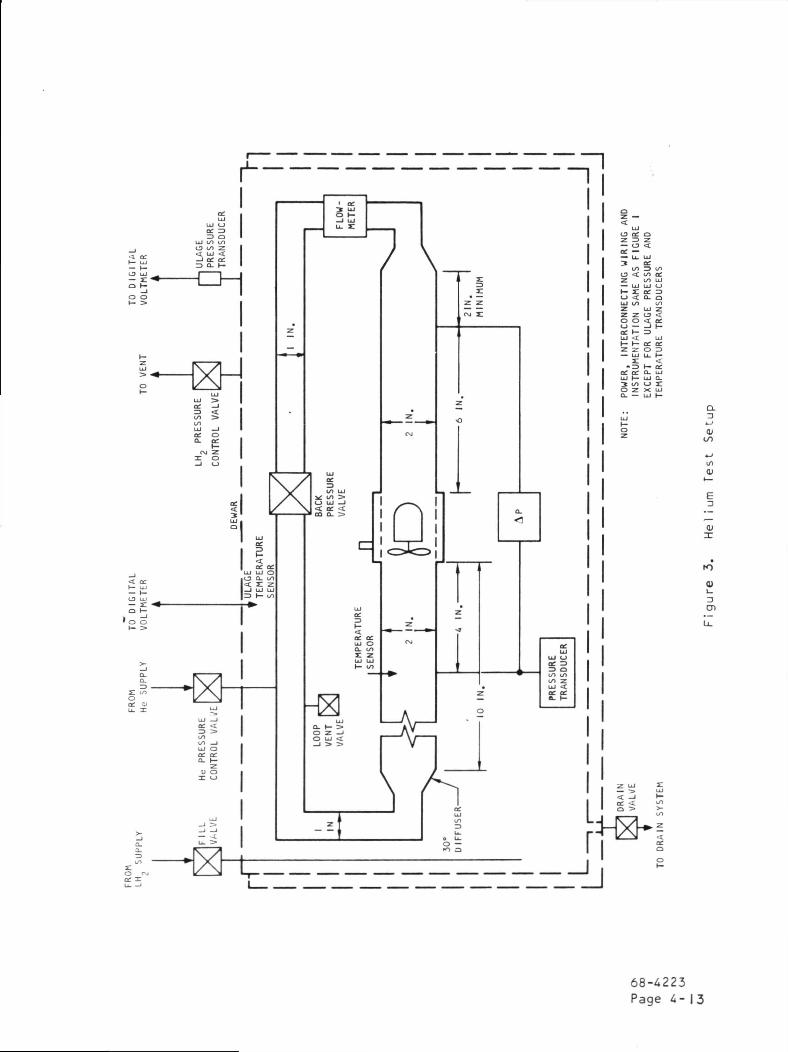
Z> Quj t/i <yiO i/) Z
c>1
CD U-t
Q t-
"7
gg
<oc a:
UJ UJ O
<n z: z
OC OCUJ OQ. tn£ Z
ui Uit^ Zuj •;.
o <t to tiCZ iyi uj—• 111 Lj I LJ
K H 0£ 3<j < a. aUJ I/) i/>Z UJ Zz z o <o o < ee<j — -i t-
e>£ or o_ ujuj h- uj a.5 u^ <-> rO Z X UJa. — uj f-
D.3
I/IU
E
K)
<U
301
L
{]
68-^223Page 4 - 1 3
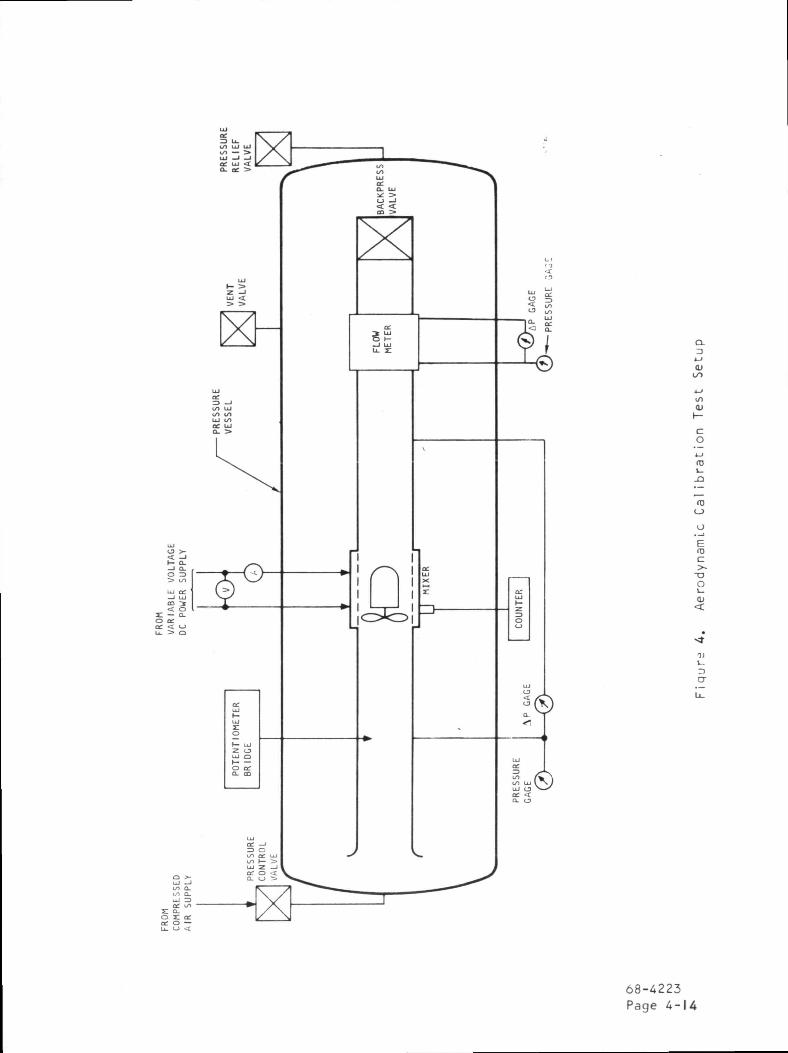
QC UJ <0- QC =>
*f =•O —1< <
QJ
cO
ID
J3
fD
O. —:
rc>~
-*11
DCT
68-4223Page 4-

APPENDIX C
COMPONENT FAILUREANALYSIS REPORT
ARINC Research Corp.Report No. 571 A, B September 1968
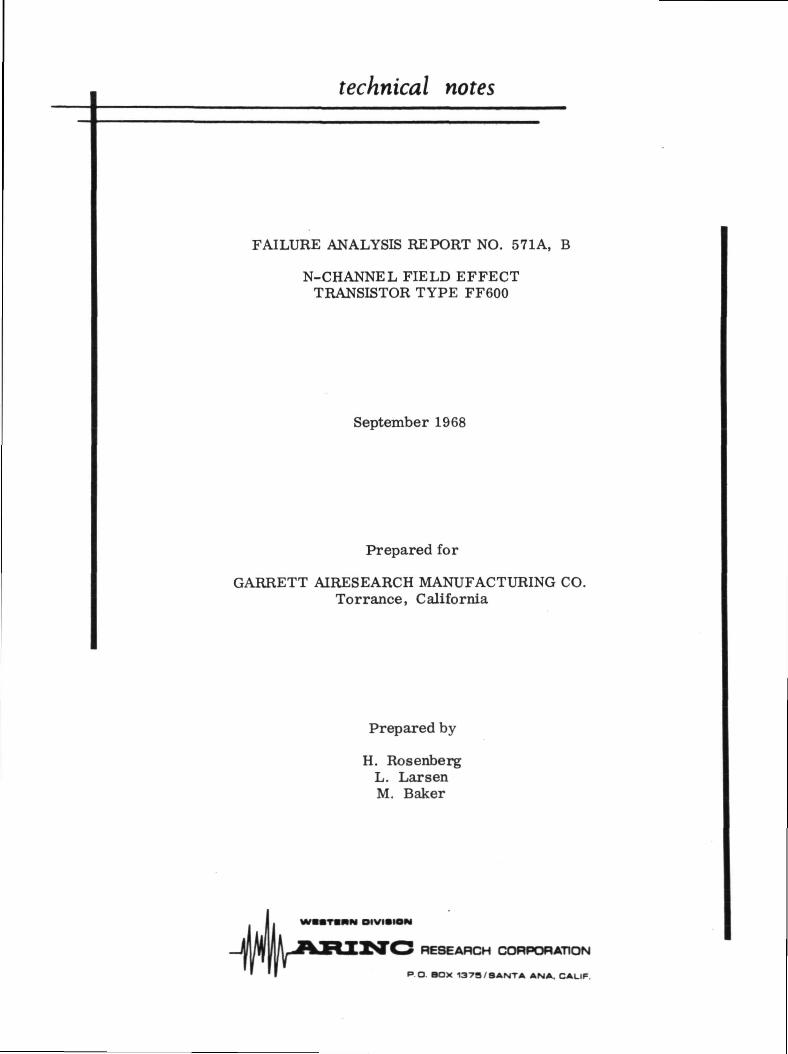
technical notes
FAILURE ANALYSIS REPORT NO. 571 A, B
N-CHANNEL FIELD EFFECTTRANSISTOR TYPE FF600
September 1968
Prepared for
GARRETT AIRESEARCH MANUFACTURING CO.Torrance, California
Prepared by
H. RosenbergL. LarsenM. Baker
WBMTBHN DIVISION
RESEARCH CORPORATION
P.O. BOX 1379/SANTA ANA. CALIF.
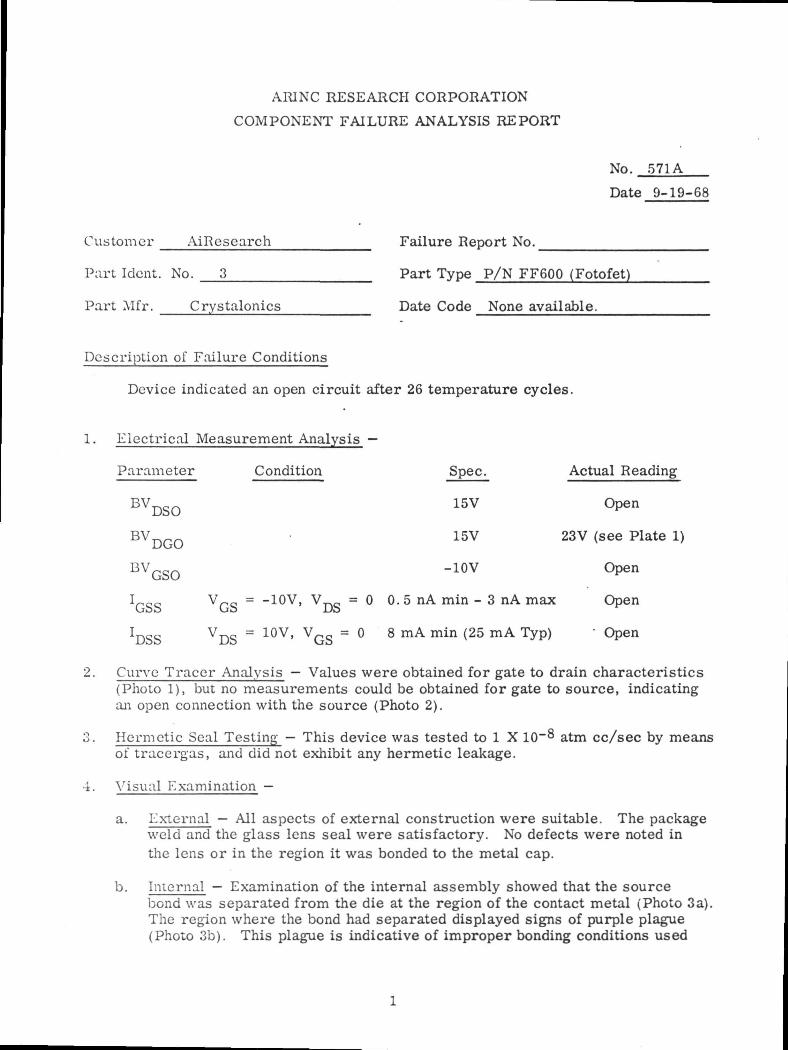
AIUNC RESEARCH CORPORATION
COMPONENT FAILURE ANALYSIS REPORT
No. 571A
Date 9-19-68
Customer AiResearch Failure Report No.
Part Idcnt. No. __3 Part Type P/N FF600 (Fotofet)
Part Mfr. Crystalonics Date Code None available.
Description of Failure Conditions
Device indicated an open circuit after 26 temperature cycles.
1. Electrical Measurement Analysis —
Parameter Condition Spec. Actual Reading
BVDSQ 15V Open
BV^^ 15V 23V (see Plate 1)L)(j(J
BVGSO -10V Open
!„ V~c, = -10V, V_, = 0 0. 5 nA min - 3 nA max OpenUbb ub JJb
IDSS VDS = 10V, VGS = 0 8 mA min (25 mA Typ) • Open
2. Curve Tracer Analysis — Values were obtained for gate to drain characteristics(Photo 1), but no measurements could be obtained for gate to source, indicatingan open connection with the source (Photo 2).
3. Hermetic Seal Testing — This device was tested to 1 X 10~8 atm cc/sec by means01 tracergas, and did not exhibit any hermetic leakage.
4. Visual Examination —
a. External — All aspects of external construction were suitable. The packageweld and the glass lens seal were satisfactory. No defects were noted inthe lens or in the region it was bonded to the metal cap.
b. Internal — Examination of the internal assembly showed that the sourcebond was separated from the die at the region of the contact metal (Photo 3a).The region where the bond had separated displayed signs of purple plague(Photo 3b). This plague is indicative of improper bonding conditions used

No. S71A
in the assembly operations. In addition to the above, contamination,pinholcs, and oxide defects were present on the die surface. These werenot related to the existing failure, but are indicative of poor manufacturingtechniques (Photo 3a).
6. Mi crop robe Analysis — Microprobing of the die assembly indicated all param-eters to be within specification. 'This verified that no other failure modes werepresent.
7. Mode and Cause of Failure — The failure mode of this device is an electricalopen condition. The failure mechanism is a defective lead bond at the sourceregion of the device. This defective bond was created by improper manufacturingconditions during device assembly.
S. Recommendations — The existence of purple plague and other surface and oxidedefects relate ib inadequacies in the processing operations used by the manu-facturer of this device. Since these findings can be related to having a deleteriouseffect on reliability, it is recommended that 1) the device manufacturer be shownthe photographs of this unit, 2) corrective action be verified by the manufacturerthrough properly established documentation and quality control procedures,and 3) a screening test be established to eliminate open bond failures of the typedescribed in this report.
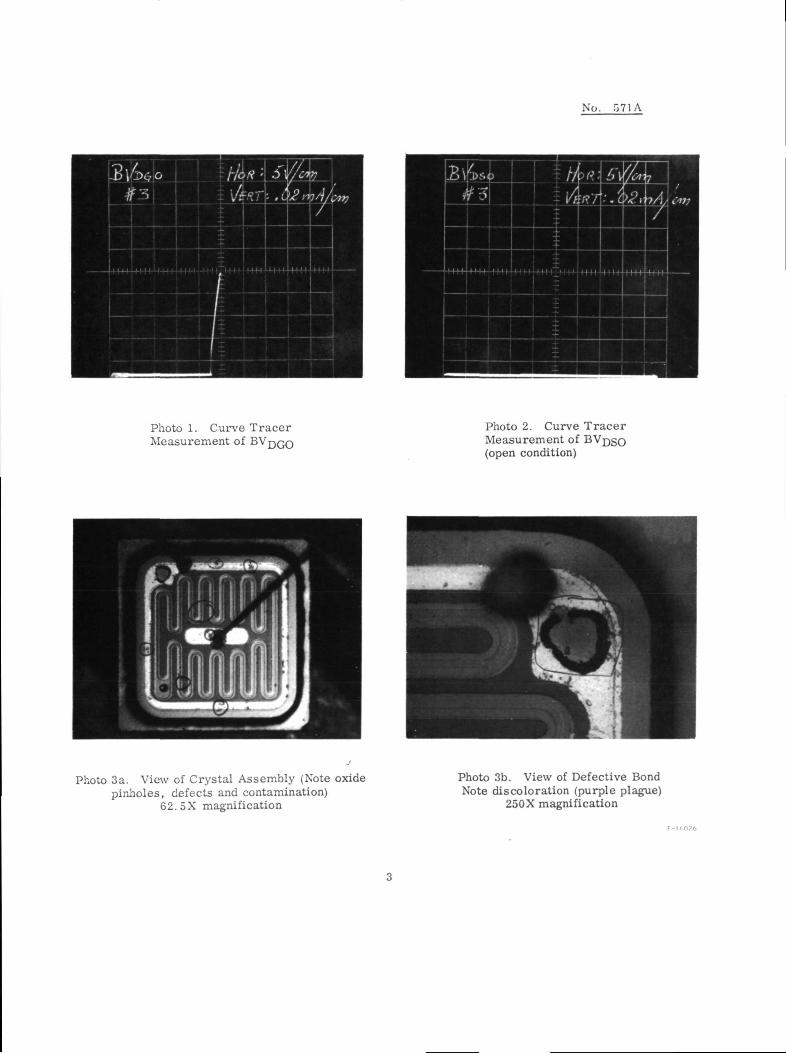
No. 571A
Photo 1. Curve TracerMeasurement of
Photo 2. Curve TracerMeasurement of(open condition)
Photo 3a. View of Crystal Assembly (Note oxidepinholes, defects and contamination)
62. 5X magnification
Photo 3b. View of Defective BondNote discoloration (purple plague)
250 X magnification
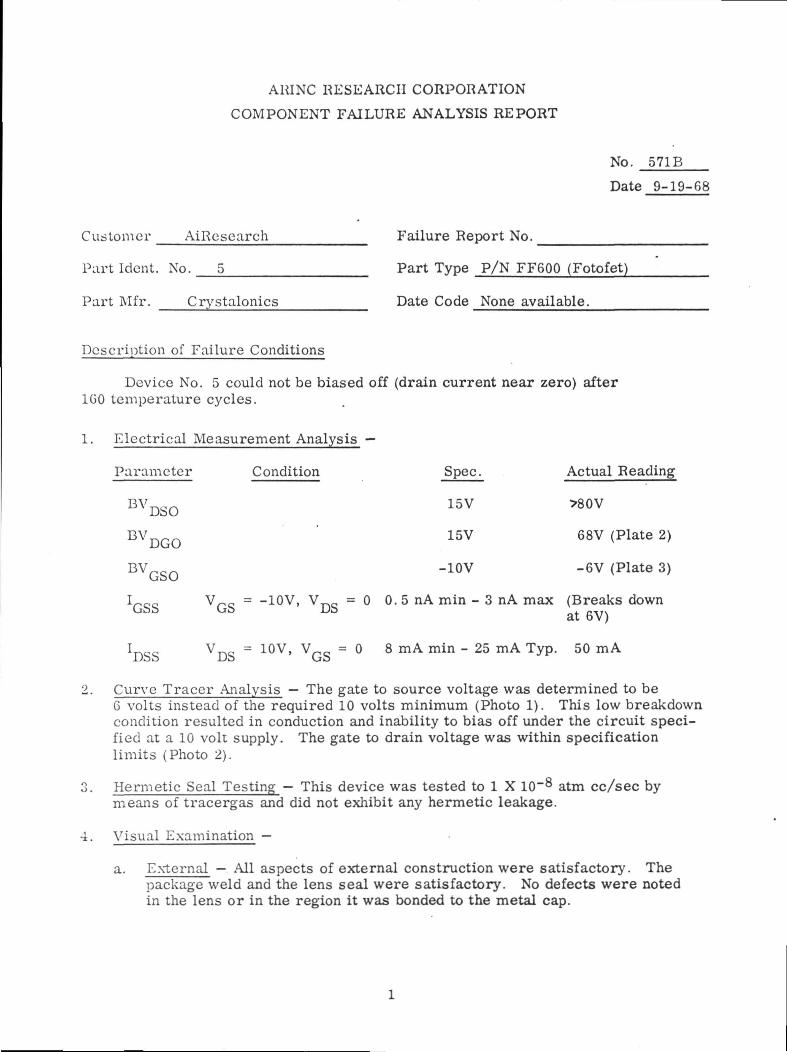
A1UNC RESEARCH CORPORATION
COMPONENT FAILURE ANALYSIS REPORT
No. 571B
Date 9-19-68
Customer AiResearch Failure Report No.
Part Idcnt. No. __5 Part Type P/N FF600 (Fotofet)
Part Mfr. Crystalonics Date Code None available.
Description of Failure Conditions
Device No. 5 could not be biased off (drain current near zero) after160 temperature cycles.
1. Electrical Measurement Analysis —
Parameter Condition Spec. Actual Reading
15V >80V
15V 68V (Plate 2)
BV., -10V -6V (Plate 3)UbU
!„ V~0 = -10V, V_ , = 0 0. 5 nA min - 3 nA max (Breaks downat 6V)
v™? = 10V> v/-c = ° 8 mA min - 25 mA Typ- 5°iJo (jb
2. Curve Tracer Analysis — The gate to source voltage was determined to beG volts instead of the required 10 volts minimum (Photo 1). This low breakdowncondition resulted in conduction and inability to bias off under the circuit speci-fied at a 10 volt supply. The gate to drain voltage was within specificationlimits (Photo 2).
3. Hermetic Seal Testing — This device was tested to 1 X 10"^ atm cc/sec bymeans of tracergas and did not exhibit any hermetic leakage.
4. Visual Examination —
a. External — All aspects of external construction were satisfactory. Thepackage weld and the lens seal were satisfactory. No defects were notedin the lens or in the region it was bonded to the metal cap.

No. 571B
b. Internal — Examination of the internal assembly displayed several suspectdefects on the crystal. One defect, noted at the drain-source junction(Photo 3) appeared as a hole in the oxide, extending into the silicon. Thishole was shown to be a microplasm center that resulted in the prematurebreakdown voltage described above. Microplasms result from contaminationinti'oduced during processing operations such as high temperature diffusion.In addition to the microplasm, pinholes, resist residue, lint particles, etc.were present on the surface of the crystal (Photo 4). Although these werenot related to the failure described above, they are indicative of poor manu-facturing conditions, and have been shown to be related to device reliability.
5. Chemical Analysis — Several attempts were made to clean up the defect conditionby sequential etching of the protecting oxide layer. No significant change inelectrical characteristics was noted, verifying the condition to be existent insome form not related directly to surface effects.
6. Mode and Cause of Failure — The failure mode of this device is an inferiorbreakdown voltage for the gate to source characteristics. The failure mechanismis a micro plasm, or region of high current density that was caused by defectivemanufacturing techniques.
7. Recommendations — Since this is the second failure related to manufacturingtechniques, it is recommended that the statement for 571A be followed, andadditionally an effort be made towards obtaining a more reliable source for thiscomponent.

No. 571B
Photo 1. Curve Tracer Results of BVGSo(Should be 10 volts min.)
Photo 2. Curve Tracer Results of(Satisfactory voltage level)
Photo 3. View of Defect at Drain-Source Junction250X magnification
Photo 4. View of Crystal Assembly (Defectsand contamination are circled in red)

APPENDIX D
BEARING REPORT
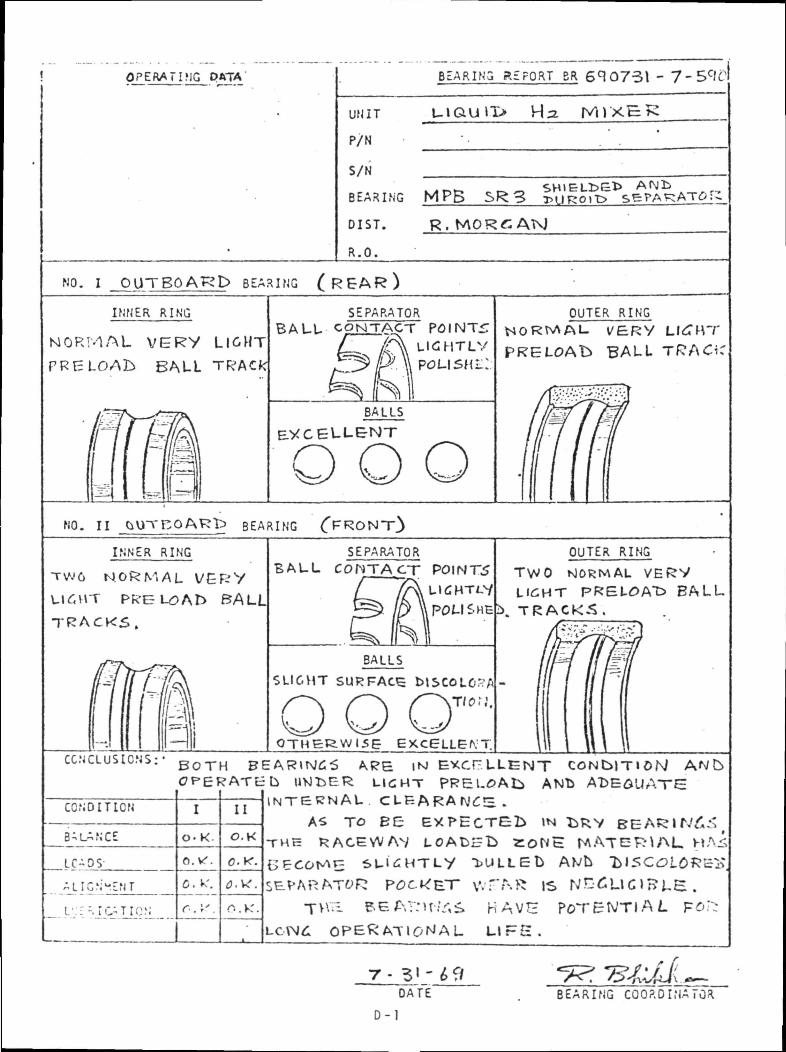
OPERATING DATA B E A R I N G R E P O R T BR 6^0751 - 7-5c/T
uiau>i>UNIT
P/N '• _ .
S/N
BEARING MPB SR3 T.\jRoit>~
DIST.
R . O .
R.
N°- i OUTBOARD BEARING (REAR)I N N E R R I N G
NORMAL VERY LIGHT
PRELOAb BALL TRACK
SEPARATORBALL CONTACT POINTS
LIGHTLY
POLISHED
BALLS
EXCELLENT
OUTER RINGNORMAL. VERY
BALL
NO. I I BEARING
I N N E R R I N G
TW6 N.
UJ6MT PREL£>Ar> BALL
TRACKS.
SEPARATOR
BALL CONTACT POINTS
BALLS
SLIGHT SURFACE
O
O U T E R R I N G
TWO NORMAL VERY
LlCHT PRELOA"D BALL
TRACKS.
CONCLUSIONS:- BoTH BEAR»N£5 APE |M EXCELLENT CONDITION
'cb UVJfcER UCHT PREI-0A& ANt> ADEQUATEINTERNAL . <
AS TO BEC O N D I T I O N
BALANCE
LC-^OS
ALIGNMENT
I0-K
o. vr.
0. K'.
r.. vx.
I I
O.K
n. v:.
THK RACE WAV LOAbi='b
RAT^R P^c^ET \vrr-.R IS NE6UC»Hi.ETVVII ^EAr-'u.^s HAVE POTENTIAL F
LCVNd OPERATIONAL LIPS.
7-D A T E B E A R I N G C O O R D I N A T O J l
D - ]

APPENDIX E
DISTRIBUTION LIST FOR FINAL REPORT
CR-120963 NAS3-11208
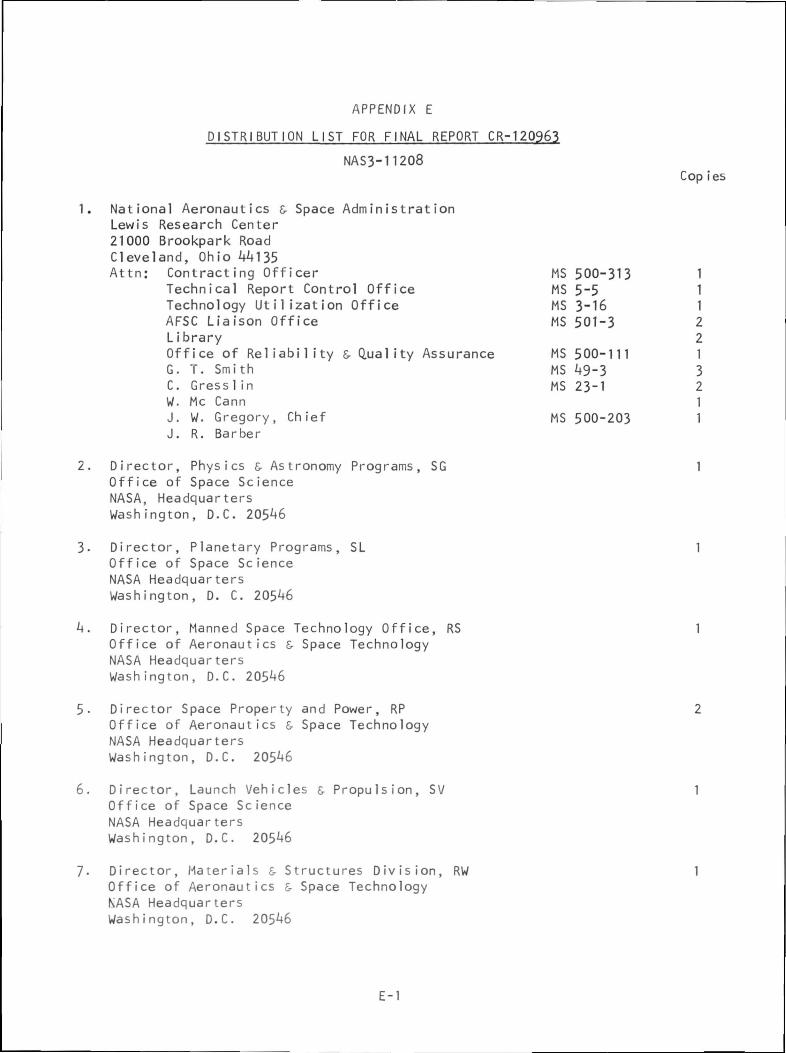
APPENDIX E
D I S T R I B U T I O N L IST FOR FINAL REPORT CR-120963
NAS3-11208Cop ies
1. National Aeronautics & Space AdministrationLewis Research Center21000 Brookpark RoadCleveland, Ohio Mt135Attn: Contracting Officer MS 500-313 1
Technical Report Control Office MS 5-5 1Technology Utilization Office MS 3-16 1AFSC Liaison Office MS 501-3 2Library 2Office of R e l i a b i l i t y & Quality Assurance MS 500-111 1G. T. Smith MS i+9-3 3C. Gressl in MS 23-1 2W. Me Cann 1J. W. Gregory, Chief MS 500-203 1J. R. Barber
2. Director, Physics & Astronomy Programs, SG 1Office of Space ScienceNASA, HeadquartersWashington, D.C. 205 6
3. Director, Planetary Programs, SL 1Office of Space ScienceNASA HeadquartersWashington, D. C. 205 6
k. Director, Manned Space Technology Office, RS 1Office of Aeronautics & Space TechnologyNASA HeadquartersWashington, D.C. 205 6
5- Director Space Property and Power, RP 2Office of Aeronautics & Space TechnologyNASA HeadquartersWashington, D.C. 205 6
6. Director, Launch Vehicles 5. Propulsion, SV 1Office of Space ScienceNASA HeadquartersWashington, D.C. 205 6
7- Director, Materials 5- Structures D i v i s i o n , RW 1Office of Aeronautics & Space TechnologyNASA HeadquartersWashington, D.C. 205^+6
E-1

Cop ies8. Director, Advanced Programs, MT 1
Office of Manned Space F l i g h tNASA HeadquartersWashington, D.C. 205*46
National Technical Information Services 16Springfield, V i r g i n i a 22151
10. National Aeronautics & Space AdministrationAmes Research CenterMoffett Field, California 9 035Attn: Library 1
11. National Aeronautics & Space Administration 1F l i g h t Research CenterP.O. Box 273Edwards, California 93523Attn: Library
12. Director, Technology U t i l i z a t i o n Division 1Office of Technology U t i l i z a t i o nNASA HeadquartersWashington, D.C. 205 6
13- Office of the Director of Defense 1Research & EngineeringWashington, D.C. 20301Attn: Office of Asst. Dir. (Chem Technology)
1*+. Office of Aeronautics & Space Technology, R 1NASA HeadquartersWashington, D.C. 205 6
15- NASA Scientific & Technical Information F a c i l i t y 2P.O. Box 33College Park, Maryland 207 +0Attn: NASA Representative
16. Nation Aeronautics & Space Administration 1Goddard Space F l i g h t CenterGreenbelt, Maryland 20771Attn: Library
17- National Aeronautics & Space Administration 1John F. Kennedy Space CenterCocoa Beach, Florida 32931Attn: Library
E-2
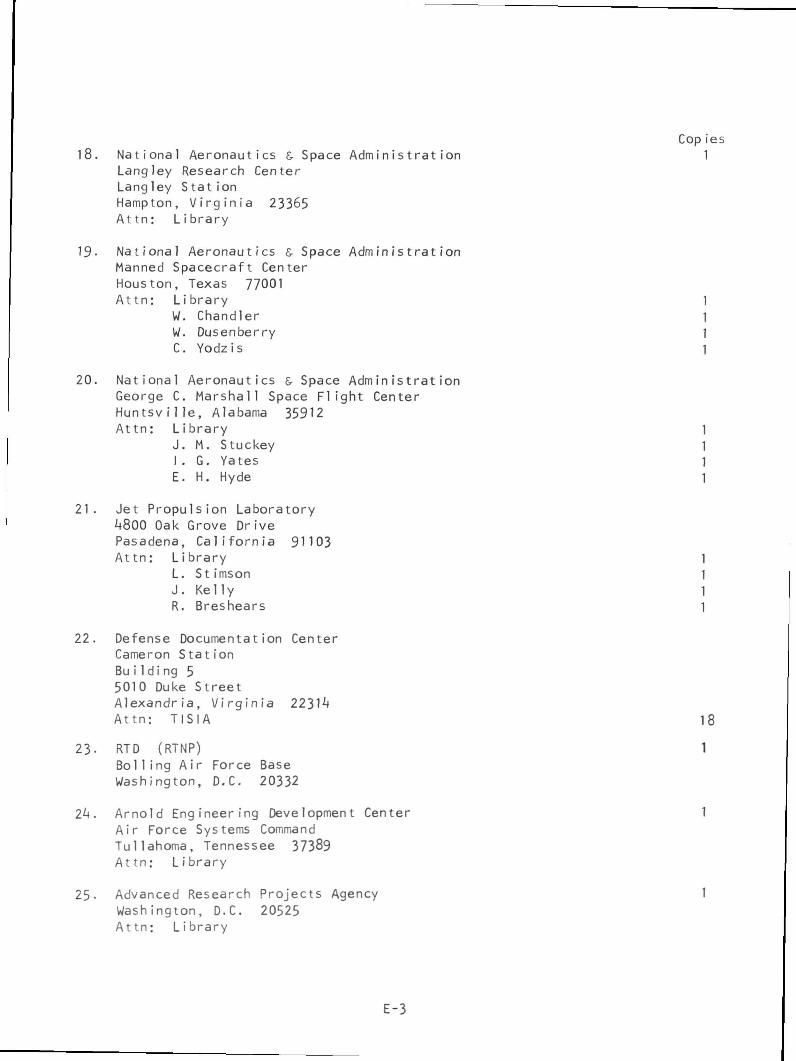
Cop ies18. National Aeronautics & Space Administration 1
Langley Research CenterLang ley Stat ionHampton, V i r g i n i a 23365Attn: Library
19- National Aeronautics & Space AdministrationManned Spacecraft CenterHouston, Texas 77001Attn: Library 1
W. Chandler 1W. Dusenberry 1C. Yodzis 1
20. National Aeronautics & Space AdministrationGeorge C. Marshall Space F l i g h t CenterHuntsville, Alabama 35912Attn: Library 1
J. M. Stuckey 1I. G. Yates 1E. H. Hyde 1
21. Jet Propulsion Laboratoryi+800 Oak Grove DrivePasadena, California 91103Attn: Library 1
L. Stimson 1J. Kelly 1R. Breshears 1
22. Defense Documentation CenterCameron StationBu i 1 di ng 55010 Duke StreetAlexandria, V i r g i n i a 2231*+Attn: T I S I A 18
23- RTD (RTNP) 1B o i l i n g Air Force BaseWashington, D.C. 20332
2^4. Arnold Engineering Development Center 1Air Force Systems CommandTullahoma, Tennessee 37389Attn: Library
25. Advanced Research Projects Agency 1Washington, D.C. 20525Attn: Library
E-3

Copies26. Aeronautical Systems D i v i s i o n 1
Air Force Systems CommandWright-Pat terson Air Force BaseDayton, OhioAttn: Library 1
AFML (MAAE) 1AFML (MAAM) 1
27. Air Force Rocket Propulsion Laboratory (RPM) 1Edwards, California 93523Attn: Library
28. Air Force FTC (FTAT-2) 1Edwards Air Force Base, California 93523Attn: Library
29- Air Force Office of Scientific Research 1Washington, D.C. 20333Attn: Library
30. Space & M i s s i l e Systems Organization 1Air Force Unit Post OfficeLos Angeles, California 900 5Attn: Technical Data Center
31. Office of Research Analyses (OAR) 1Holloman Air Force BaseNew Mexico, 88330Attn: Library
32. U. S. Air Force 1Washington, D.C.Attn: Library
33- Commanding OfficerU. S. Army Research Office (Durham)Box CM, Duke StationDurham, North Carolina 27706Attn: Library
3^4. Bureau of Naval Weapons 1Department of the NavyWashington, D.C.Attn: Library
35- Director (Code 6180) 1U. S. Naval Research LaboratoryWashington, D.C. 20390

Cop ies36. Picatinny Arsenal 1
Dover, New Jersey 07801Attn: Library
37- Air Force Aero Propulsion La!x>ratory 1Research & Technology DivisionAir Force Systems CommandUnited States Air ForceWright-Patterson AFB, Ohio ^5^33Attn: APRP (Library)
38. Electronics D i v i s i o n 1Aerojet-General CorporationP.O. Box 296Azusa, California 91703Attn: Library
39- Space D iv is ion 1Aerojet-General Corporation9200 East Flair DriveEl Monte, California 9173^Attn: Library
^0. Aerojet Ordance & Manufacturing 1Aerojet-General Corporation1 1 7 1 1 South Woodruff AvenueFullerton, California 902^1Attn: Library
k\ . Aerojet L i q u i d Rocket Company 1P.O. Box 158i+7Sacramento, California 95813Attn: Technical Library 248A-201A
k2. Aeronutronic Division of Phi1co Ford Corp. 1Ford RoadNewport Beach, California 92663Attn: Technical Information Department
kj>. Aerospace Corporation 12 400 E. El Segundo Blvd.Los Angeles, California 900 5Attn: Library-Documents
kk. Arthur D. L i t t l e , Inc.20 Acorn ParkCambridge, Massachusetts 021^0Attn: Library 1
R. B. Hinckley 1
E-5

45- Astropower LaboratoryMcDonnell-Douglas Aircraft Company2121 PaularinoNewport Beach, California 92163Attn: Library
46. ARO, IncorporatedArnold Engineering Development CenterArnold AF Station, Tennessee 37389Attn: Library
47. Susquehanna CorporationA t l a n t i c Research D i v i s i o nShirley Highway £- Edsall RoadAlexandria, V i r g i n i a 22314Attn: Library
48. Beech Aircraft CorporationBoulder F a c i 1 i tyBox 631Boulder, ColoradoAttn: Library
49- Bell Aerosysterns, Inc.Box 1Buffalo, New York 14240Attn: Library
50. Instruments £- Life Support D i v i s i o nBendix CorporationP.O. Box 4508Davenport, Iowa 52808Attn: Library
51. Boeing CompanySpace Div is ionP.O. Box 868Seattle, Washington 98124Attn: Library
D. H. Zimmerman
52. Boeing Comapny1625 K Street, N.W.Washington, D.C. 20006
53- Chemical Propulsion Information AgencyApplied Physics Laboratory8621 Georgia AvenueSilver Spring, Maryland 20910
Copies1
E-6

Cop ies5 4. Chrysler Corporation 1
M i s s i l e D iv is ionP.O. Box 2628Detroit, MichiganAttn: Library
55- Chrysler Corporation 1Space Div is i onP.O. Box 29200New Orleans, Louisianna 70129Attn: Librarian
56. Curtiss-Wright Corporation 1Wright Aeronautical Divi s i o nWoodridge, New JerseyAttn: Library
57- University of Denver 1Denver Research InstituteP.O. Box 10127Denver, Colorado 80210Attn: Security Office
58. F a i r c h i l d Stratos Corporation 1Aircraft Missiles DivisionHagerstown, MarylandAttn: Library
59- Research Center 1Fai r c h i l d H i l l e r CorporationGermantown, MarylandAttn: Library
60. Republic Aviation 1F a i r c h i l d H i l l e r CorporationFarminyton, Long IslandNew York
61. General Dynamics/ConvairP.O. Box 1128San Diego, California 92112Attn: Library 1
R. Tatro 1
62. M i s s i l e s and Space Systems Center 1General Electric CompanyValley Forge Space Technology CenterP.O. Box 8555Phila d e l p h i a , Pa. 19101Attn: Library
E-7
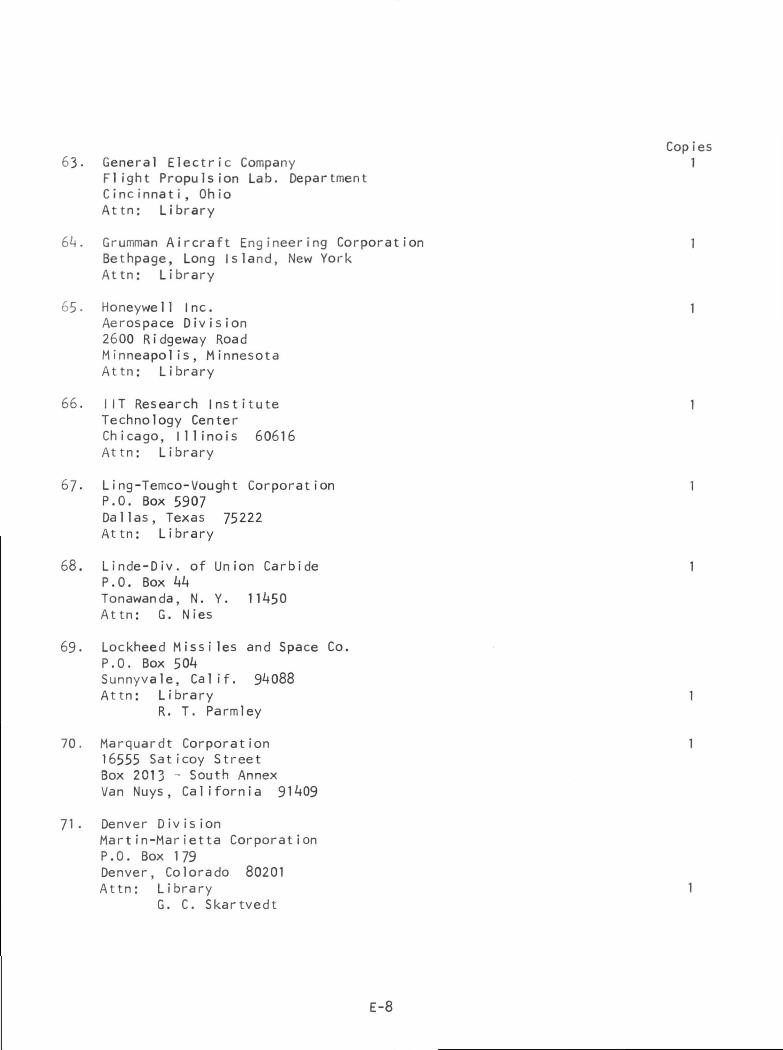
Cop ies63- General Electric Company 1
F l i g h t Propulsion Lab. DepartmentC inc innat i, Oh ioAttn: Library
6 4. Grumman Aircraft Engineering Corporation 1Bethpage, Long Island, New YorkAttn: Library
65• Honeywe11 Inc. 1Aerospace Division2600 Ridgeway RoadMinneapolis, MinnesotaAttn: Library
66. NT Research Institute 1Technology CenterChicago, I l l i n o i s 60616Attn: Library
67. Ling-Temco-Vought Corporation 1P.O. Box 590?Dallas, Texas 75222Attn: Library
68. Linde-Div. of Union Carbide 1P.O. Box kkTonawanda, N. Y. 11^50Attn: G. Nies
69- Lockheed Missiles and Space Co.P.O. Box 504Sunnyvale, Ca1 if. 9 088Attn: Library 1
R. T. Parmley
70. Marquardt Corporation 116555 Sat icoy StreetBox 2013 - South AnnexVan Nuys, California 91^09
71• Denver D iv is ionMartin-Marietta CorporationP.O. Box 179Denver, Colorado 80201Attn: Library 1
G. C. Skartvedt
E-8
Cop ies72. Western D i v i s i o n
McDonnell Douglas Astronautics5301 Bolsa AvenueHuntington Beach, California 92647Attn: Library 1
P. Klevatt
73- McDonnell Douglas Aircraft CorporationP.O. Box 516Lambert Field, Missouri 63166Attn: Library 1
L. F. Kohrs 1
74. Rocketdyne Division 1North American Rockwell Inc.6633 Canoga AvenueCanoga Park, California 91304Attn: Library, Department 596-306
75- Space & Information Systems DivisionNorth American Rockwell12214 Lakewood Blvd.Downey, CaliforniaAttn: Library 1
E. Hawkinson AC10 1
76. Northrop Space Laboratories 13401 West BroadwayHawthorne, CaliforniaAttn: Library
77. Purdue Univers ity 1Lafayette, Indiana 47907Attn: Library (Technical)
78. Goodyear Aerospace Corporation 11210 Mass iIon RoadAkron, Ohio 44306Attn: C. Shriver
79. Hamilton Standard Corporation 1Windsor Locks, Connecticut 06096Attn: Library
80. Stanford Research Institute 1333 Ravenswood AvenueMenlo Park, California 94025Attn: Library
E-9

Copies81. TRW Systems Inc. 1
1 Space ParkRedondo Beach, California 902/8Attn: Tech. Lib. Doc. Acquisitions
82. United Aircraft Corporation 1Pratt & Whitney DivisionFlorida Research & Development CenterP.O. Box 2691West Palm Beach, Florida 33 02Attn: Library
83- United Aircraft Corporation 1United Technology CenterP.O. Box 358Sunnyvale, California 9 038Attn: Library
8*4. Vickers Incorporated 1Box 302Troy, Michigan
85. Airesearch Mfg. Div. 1Garrett Corporation9851 Sepulveda Blvd.Los Angeles, California 90009Attn: Library
86. Airesearch Mfg. Div. 1Garrett Corporation*402 South 36th StreetPhoenix, Arizona 8503*4Attn: Library
87. Commanding Officer 1U.S. Naval Underwater Ordnance StationNewport, Rhode Island 028V*Attn: Library
88. National Science Foundation 1Engineering Division1800 G Street N.W.Washington, D.C. 205 0Attn: Library
89. G. T. Schjeldahl Company 1Northfield, MinnesotaAttn: Library
E-10

Copies90. General Dynamics 1
P.O. Box 7k8Fort Worth, Texas 76101
91. Cryonetics Corporation 1Northwest Industrial ParkBurlington, Massachusetts
92. Institute of Aerospace Studies 1University of TorontoToronto 5, OntarioAttn: Library
93- FMC Corporation 1Chemical Research & Development CenterP.O. Box 8Princeton, New Jersey 085*tO
94. Westinghouse Research Laboratories 1Buelah Road, Churchill BoroPittsburg, Pennsylvania 15235
95- Cornell University 1Department of Materials Science & EngineeringIthaca, New York 14850Attn: Library
96. Marco Research & Development Co. 1Whittaker Corporation131 N. Ludlow StreetDayton, Ohio 45402
97- General Electric Company 1Apollo Support DepartmentP.O. Box 2500Daytona Beach, Florida 32015Attn: C. Ray
98. E. I. DuPont, DeNemours & Company 1Eastern LaboratoryGibbstown, New Jersey 08027Attn: Library
99- Esso Research & Engineering Company ]Special Projects UnitP.O. Box 8Linden, New Jersey 07036Attn: Library
E-11

Cop ies100. Minnesota Mining & Manufacturing Company 1
900 Bush AvenueSt. Paul, Minnesota 55106Attn: Library
E-12