
Multi-objective reliability-based optimization of prestressed concrete beams

Engineering Structures 32 (2010) 115–128
Contents lists available at ScienceDirect
Engineering Structures
journal homepage: www.elsevier.com/locate/engstruct
Hybrid health monitoring of prestressed concrete girder bridges by sequentialvibration-impedance approaches
Jeong-Tae Kim a,∗, Jae-Hyung Park a, Dong-Soo Hong a, Woo-Sun Park b
a Department of Ocean Engineering, Pukyong National University, Busan, Republic of Koreab Coastal Engineering & Ocean Energy Research Department, Korea Ocean Research & Development Institute, Republic of Korea
a r t i c l e i n f o
Article history:Received 12 February 2008Received in revised form24 August 2009Accepted 26 August 2009Available online 11 September 2009
Keywords:Hybrid health monitoringDamage detectionPSC girderAcceleration signaturesImpedance signaturesDamage index method
a b s t r a c t
A hybrid health monitoring system using sequential vibration-impedance approaches is newly proposedto detect two damage types in prestressed concrete (PSC) girder bridges, which are tendon damage andgirder damage. Itmainly consists of three sequential steps: global damagewarning, damage classification,and damage estimation. In Step 1, a global occurrence of damage is warned by monitoring changesin acceleration features. In Step 2, damage-types are classified into either tendon damage or girderdamage by recognizing patterns of vibration and impedance features. In Step 3, the location and theextent of damage are estimated by using a mode shape-based method and a frequency-based method.The feasibility of the proposed system is evaluated on a laboratory-scaled PSC girder model for whichacceleration responses and electro-mechanical impedances were measured for several damage scenariosof tendon damage and girder damage.
© 2009 Elsevier Ltd. All rights reserved.
1. Introduction
Recently, interest on structural health monitoring of prestre-ssed concrete (PSC) girder bridges has increased. For a PSC girderbridge, structural properties (i.e., mass, damping and stiffness) inconcrete girders and the prestress force in tendons are importantparameters that should be secured for its serviceability and safety.In general, girder damage such as cracking and added-mass occursat local girder sections and tendon damage such as prestress-lossoccurs along the entire girder [1,2].Since as early as 1970s, many researchers have focused on the
possibility of using vibration characteristics of a structure as anindication of its structural damage and also as an uncertain im-pact due to varying ambient conditions [3–5]. Recently, researchefforts have been made to monitor the change in modal proper-ties in relation to the change in prestress forces [6], to investigatethe dynamic behaviors of prestressed composite girder bridges [7],and to identify the change in prestress forces by measuring thedynamic responses of prestressed beams [8,9]. Also, research at-tempts have been made to detect real damage in a PSC bridge by
∗ Corresponding address: Department of Ocean Engineering, Pukyong NationalUniversity, Busan 608-737, Republic of Korea. Tel.: +82 51 629 6585; fax: +82 51629 6590.E-mail address: [email protected] (J.-T. Kim).
0141-0296/$ – see front matter© 2009 Elsevier Ltd. All rights reserved.doi:10.1016/j.engstruct.2009.08.021
using the change inmodal curvatures [10], to identify damage sim-ulated in PSC beams by using the change in modal strain ener-gies [11], to investigate the sensitivity of vibration-based damagedetection methods for detecting progressive cracks in a PSC high-way bridge [12] and to identify damage in PSC bridges without apriori known levels of damage by using fuzzy pattern recognitiontechniques [13].Based on previous work, however, vibration-based approaches
cannot easily distinguish the twodamage types, girder damage andtendon damage, since the change in vibration characteristics maybe attributed to both damage types. Therefore, other nondestruc-tive evaluation techniques that are complementary to vibration-based approaches should be sought. Recently, electro-mechanicalimpedance-based health monitoring has shown the promisingsuccess to detect minor changes in structural integrity [14–16].Compared to vibration-based approaches, the impedance-basedmethod has the capability of more accurately locating damagesuch as cracks on small scale. Moreover, its local monitoring can-not characterize the entire structure, which means that the globalhealthy state cannot be easily captured to couple with the localmonitoring information.To-date, some researchers have worked on implementing the
impedance-based technique for structural health monitoring ofcivil engineering structures. Research attempts have been madeto extensively investigate the applicability of the impedancetechnique on a scaled bridge element [16], to verify the feasibility

116 J.-T. Kim et al. / Engineering Structures 32 (2010) 115–128
of the technique for detecting the change in structural integrityof a model reinforced concrete frame [14], to identify the changein support conditions simulated in a model plate-girder bridgeby using the change in impedance signatures [17], to long-termmonitor post-tensioned tendons by using direct capacitance andresistance measurements [18], and to monitor cracks incurred ina reinforced concrete beam by using the change in impedancesignatures [19].In this paper, a hybrid health monitoring system using sequen-
tial vibration-impedance approaches is newly proposed to detecttwo damage types, which are tendon damage and girder damage,in PSC girder bridges. A hybrid health monitoring scheme for PSCgirder bridges is designed. It mainly consists of three sequentialsteps: global damage warning, damage classification, and dam-age estimation. In Step 1, global occurrence of damage is warnedby monitoring changes in acceleration features. In Step 2, damagetypes are classified into either tendon damage or girder damage byrecognizing patterns of vibration and impedance features. In Step3, the location and the extent of damage are estimated by usinga mode shape-based method and a frequency-based method. Thefeasibility of the proposed system is evaluated on a laboratory-scaled PSC girder model for which acceleration responses andelectro-mechanical impedances were measured for several dam-age scenarios of tendon damage and girder damage.
2. Hybrid health monitoring scheme for psc girder bridge
Structural healthmonitoring (SHM) canbe classified in twopos-sible ways, global and local, depending on the acquired inspec-tion data and the area inspected [20–24]. Vibration-based healthmonitoring is the global SHM activity to acquire the informationon the entire structure. This global SHM activity includes detect-ing damage and estimating structural safety by monitoring dy-namic responses of the entire structure. Usually, vibration-basedmethods can estimate structural damage by utilizing the modalinformation obtained from limited sensor arrays; however, thesemethods cannot detect small incipient damage, but only detectparticular forms of damage depending on sensor lay-out. Also, theyneedwell-established baselinemodels to identify the perturbationfrom the monitored information.Contrarily, impedance-based health monitoring is the local
SHM activity to acquire the information on the oriented local area,but does not cover the entire structure. The basic idea is that thechange in the structural integrity at a local area results in a changein the electro-mechanical impedance, then damage is detected bymeasuring the change in impedance signatures at the local zone.This local SHM activity requires locally denser sensor arrays thanglobal health monitoring, so that it has the capability of detectingsmall incipient damage.As the combined activity of global and local health monitoring
techniques, a hybrid health monitoring scheme needs to deal withtwo damage types, which are tendon damage and girder damage.To design a suitable hybrid monitoring system for PSC girderbridges, at least two issues should be solved. The first issue isto quantify the variability in vibration and impedance featuresattributed to the two different damage types. That is related todiscriminating a unique pattern of damage occurrence warningfor each damage-type from the mixed information on damageprediction results. For each damage type, a correct warning ofdamage occurrence is a prerequisite for damage localization andseverity estimation tasks. Naturally, the second issue is to custom-make healthmonitoring techniques suitable for individual damagetypes. It is needed to differentiate a damage estimationmethod foreach damage type. This issue is also related to optioning damagewarning methods.
To deal with those issues on PSC girder bridges, a hybrid mo-nitoring scheme using sequential vibration and impedance appro-aches is designed to detect the occurrence of the twodamage types,girder damage and tendon damage. Fig. 1 shows the schematic ofthe proposed system that consists of three sequential steps: (1)Step 1 — Global Damage Warning, (2) Step 2 — Damage Classifi-cation, and (3) Step 3 — Damage Estimation.In Step 1, the occurrence of damage is alerted in a global man-
ner by using frequency response changes in the target structure.A global damage warning method using frequency-response-ratioassurance criterion (FRRAC), as described in Section 2.1, is newlyproposed to monitor damages in the entire structure. Note thatfrequency response functions can be acquired by measuring ac-celeration responses attached on the target structure. As long asany damage (i.e., girder damage and tendon damage) occurs in thetarget structure, the acceleration responses will be affected andconsequently the FRRAC will be decreased. In other words, the in-dication by the FRRAC can be the warning sign of the occurrence ofgirder damage and/or tendon damage. However, the type of dam-age, which is either girder damage or tendon damage, cannot bedistinguished from the indication of the FRRAC.In Step 2, the alerted damage is classified into either girder
damage or tendon damage by using the change in impedance sig-natures. A local damage warning method using changes in electro-mechanical impedance, as described in Section 2.2, is selected tomonitor the occurrence of tendon damage. Note that the electro-mechanical impedance change is sensitive to the sensor-vicinityzone, which makes it feasible to be used to detect damage in a lo-cal area. That is, by attaching the sensor onto tendon or anchor,the impedance-based local health monitoring senses mostly thechange in prestress force due to tendon damage but almost noneof the change in a girder’s structural properties due to girder dam-age. Actually, the occurrence of girder damage causes a changein structural behavior, thus the prestress force in a tendon couldbe changed. However, the change in the tendon’s prestress forcecaused by the girder damage is relatively small and it also leads to asmall change in the impedance signature in the tendon. Therefore,damage can be classified as: tendon damage occurring or not. Con-sidering mixed situations with the two damage cases, the alerteddamage can be allocated into one of three potential scenarios: (1)tendon damage, (2) girder damage, and (3) combined tendon dam-age and girder damage. The last scenario needs further verificationprocess through the next step tomake sure the occurrence of girderdamage.In Step 3, the damage estimation is performed on the classified
damage. If the classified damage is ‘Girder Damage Occurrence’,a mode-shape-based damage index method, as described inSection 2.3, is used to estimate the location and severity of girderdamage. If the classified damage is ‘Tendon Damage Occurrence’,a frequency-based prestress-loss index method, as described inSection 2.4, is used to identify the severity of ‘prestress-loss’damage in tendon. For the combined girder damage plus tendondamage case, both the mode-shape-based damage index methodand the frequency-based prestress prediction method could beimplemented.
2.1. Global damage alarming by frequency-response-ratio assurancecriterion
Damage occurrence may be detected using frequency responseof the structure. The basic idea is that frequency responses arefunctions of the structural properties such as mass, damping andstiffness. Damage causes changes in the structural properties,which, in turn, results in a change in the frequency responses ofthe structure [22,25].For the relationship between the input force and the output
response of a structural system, the frequency response function,

J.-T. Kim et al. / Engineering Structures 32 (2010) 115–128 117
Fig. 1. Hybrid health monitoring scheme for PSC girder bridges.
H(f ), is defined as follows [26]:
H(f ) =V (f )U(f )
=1
−m(2π f )2 + ic(2π f )+ k(1)
where U(f ) and V (f ) are the force and displacement transformedinto the frequency domain, respectively. The symbols m, c andk are the mass, damping and stiffness of the structural system,respectively.On assuming a harmonic force, Uj(ωk), is excited with the kth
natural frequency ωk and is applied at m locations (j = 1, . . . ,m)at the same time, then the displacement ratio between two outputsat locations i and i+ 1 is given as follows:
Vi(ωk)Vi+1(ωk)
=
m∑j=1Hi,j(ωk)Uj(ωk)
m∑j=1Hi+1,j(ωk)Uj(ωk)
=Hi(ωk)Hi+1(ωk)
. (2)
Furthermore, a frequency-response-ratio (FRR) function betweenthe locations i and i+ 1 is defined as
FRRi,i+1(ωk) =ASDi,i(ωk)CSDi,i+1(ωk)
=E[V ∗i (ωk)Vi(ωk)]E[V ∗i (ωk)Vi+1(ωk)]
=Hi(ωk)Hi+1(ωk)
(3)
where CSDi,i+1(ωk), ASDi,i(ωk) are cross-spectral density and auto-spectral density functions, respectively. By comparing a frequency-response-ratio measured at an undamaged baseline state to thecorresponding one at a subsequent damaged state, a frequency-response-ratio assurance criterion (FRRAC) can be defined asfollows:
FRRAC(b, d) ={FRRTbFRRd}
2
{FRRTbFRRb}{FRRTdFRRd}
(4)
where the subscripts b and d denote the undamaged baselinestate and its corresponding damaged state, respectively. Eq.(4) represents the linear relationship between the pre-damagedfrequency-response-ratio, FRRb, and the post-damage frequency-response ratio, FRRd. The FRRAC remains close to 1.0 if there is nodamage. Otherwise, the FRRAC decreases from 1.0 if damage hasoccurred (i.e., changes in physical propertiesm, c and k).
2.2. Local damage alerted by an electro-mechanical impedancechange
Impedance-based health monitoring techniques utilize piezo-electric materials as sensors and actuators. When a piezoelectric
Fig. 2. 1-DModel of electro-mechanical interaction of piezoelectric patch and hoststructure [15].
material is mechanically strained, an electrical field is produced.Conversely, its shape is changedwhen an electrical field is charged.In addition, thematerials have uniquemolecular structures, whichallow bidirectional coupling between an electric field and strain;hence, they are useful for self-sensing, power harvesting, and SHMapplications [14–16,19,23,24,27].As shown in Fig. 2, the active material is described by its short
circuited mechanical impedance, which is powered by voltageor current. The host structure is modeled as the effect of mass,stiffness, damping, and boundary conditions. When a piezoelectricpatch is surface-bonded to a structure, the electrical admittance(the inverse of electro-mechanical impedance Z(ω)) of the patch,Y (ω) (units Siemens or ohm−1), is a combined function of themechanical impedance of the host structure, Zs(ω), and that of thepiezoelectric patch, Za(ω):
Y (ω) = iωwltc
[(εT33 − d
23xY
Exx
)+
Za(ω)Za(ω)+ Zs(ω)
d23xYExx
(tan klkl
)](5)
where Y Exx is the complex Young’s modulus of the at zero electricfield; εT33 is the dielectric constant of piezoelectric wafer; d3xis the piezoelectric coupling constant in the x direction at zerostress; k is the wave number that depends on mass density andYoung’s modulus of the piezoelectric material; andw, l, and tc are,respectively, the width, length, and thickness of the piezoelectrictransducer.Eq. (5) indicates that the electrical impedance of the piezoelec-
tric patch bonded onto a host structure is directly related to themechanical impedance of the structure. The first term of the equa-tion is the capacitive admittance of the free piezoelectric patch.The second term includes the mechanical impedance of both thepiezoelectric patch and the host structure.When damage occurs toa structure, its mechanical impedance will be shifted. Hence, any
118 J.-T. Kim et al. / Engineering Structures 32 (2010) 115–128
changes in the electrical impedance signature (such as magnitudeof admittance and resonant frequency) are attributed to damage orchanges in the structure. In this study, two damage indices such as‘frequency-shift index’ and ‘root-mean-square-deviation (RMSD)index’ are selected to quantify the change in impedance signature.The ‘frequency-shift index’, fshift , and ‘RMSD index’ are calculated,respectively, as follows:
fshift(%) =f ∗I − fIfI× 100 (6)
RMSD(%) =n∑i=1
√[Re (Z∗(ωi))− Re (Z(ωi))]2
[Re (Z(ωi))]2× 100 (7)
where fI and f ∗I are the peak frequencies extracted from impedancesignatures monitored before and after damage occurrence, re-spectively; and Re (Z(ωi)) and Re (Z∗(ωi)) are the real part of theimpedancemeasured at the ith frequencymeasured before and af-ter damage occurrence, respectively.To enhance the sensitivity to incipient damage, the electrical
impedance is usually measured at high frequencies, at whichthe wavelengths of the structural vibration are shorter than thedamage to be detected. In general, high frequency (over than30 kHz) low voltage (less than 1 V) structural excitations are usedto monitor the electrical impedance of the piezoelectric patch.
2.3. Girder damage estimation by mode-shape and frequency-basedmethods
2.3.1. Damage localizationKim et al. [11] proposed a damage index method using changes
in modal strain energies of a structure. Consider a uniform cross-sectional, one-dimensional beam with NE elements and N nodes.Damage in the jth element is defined the relative change betweenundamaged stiffness kj and damaged one k∗j of the same element.For all identifiable NM modes of vibration, the damage locationindex for the jth location βj is given by:
βj =kjk∗j=
NM∑i=1
γ ∗ij
/ NM∑i=1
(γigi + γij
)(8)
where γij =∫j[φ′′
i (x)]2dx, γ ∗ij =
∫j[φ′′∗
j (x)]2dx, and γi =
∫ Lo k(x)
[φ′′i (x)]2dx. The term gi is a dimensionless factor symbolizing the
fractional change in the ith eigenvalue due to damage. The termφ′′i (x) is the ith mode shape curvature function and the asteriskdenotes the damaged state. Damage is indicated from Eq. (8) as thedamage index βj is greater than one.A statistical-based method is utilized to assign damage to an
element. The collection of values βj (j = 1, 2, . . . ,NE) associatedwith each member and each mode is treated as a random variable.The damage indices are normalized according to the standard rule.
Zj = (βj − µβj)/σβj (9)
where Zj is the standard normalized damage index of the elementj. Also, the symbols µβj and σβj are the mean and the standarddeviation of βj. The beam elements are next assigned to a damageclass by utilizing hypothesis testing. The null hypothesis (i.e., Ho)is taken to be the structure undamaged at the jth element and thealternate hypothesis (i.e., H1) is taken to be the structure damagedat the jth element. In assigning damage to a particular location,the following decision rule was utilized: (1) choose H1 if Zj ≥ zo;and (2) choose HO if Zj < zo, where zo is number which dependsupon the confidence level of the localization test. Then damage isassigned to a particular location j if Zj exceeds the confidence level.The intensity of the normalized damage indices depends on
experimental conditions such as the number of sensors (i.e.,
sensor resolution), the accuracy of extracted mode shapes, andthe size and localization of damage [11,28]. Therefore, the ob-jective threshold, zo, should be determined on the basis of thoseconditions. In general, the intensity becomes higher (i.e., locallyconcentrated) as damage is confined within a very small range(e.g., such as a crack). In general applications which deal witha concentrated local damage type, an objective threshold with ahigh confidence level should be selected to guarantee accuratelocalization of damage. For crack-type damage, for example, anobjective threshold of 2.0 that corresponds 97.2% confidence levelwas selected [28]. For distributed damage, however, an objectivethreshold less than 2.0may be selected to decide damage locationswith the cost of the confidence level.
2.3.2. Damage severity estimationThe severity of damage can be directly estimated from Eq. (8)
[11]. The fractional change in elemental stiffness for jth locationcan be estimated by:
(k∗j − kj)
kj=1βj− 1. (10)
However, this equation is defined only for a change in elementstiffness. Since there is no simple conversion between stiffness-change and mass-change in an element level of a multi degree offreedom system, an alternative way must be sought to estimatedamage severity due to the change in element mass.To overcome the above-mentioned problem, a severity esti-
mation method using fractional change in eigenvalue and eigen-sensitivity was selected [4]. The severity of damage at the jthelement that indicates the damaged location is estimated by:
ω∗2i − ω2i
ω2i= Fijαj − Qijγj (11)
where ωi is the natural frequency for ith mode at the undamagedstate, ω∗i is the natural frequency for ith mode at the damagedstate, Fij is the sensitivity of the ith frequency change for the jthelement stiffness, Qij is the sensitivity of the ith frequency changefor the jth element mass, αj is the fractional change in stiffness atjth element, and γj is the fractional change in mass at jth element.The sensitivities Fij and Qij can be calculated from numerical modalanalysis on the structure by perturbing the element stiffness andelementmass, respectively [4]. In caseswhere there is no stiffness-change in the structural system, Eq. (11) can be simplified toestimate the mass-change γj.
2.4. Prestress-loss estimation by frequency-based prestress-loss index
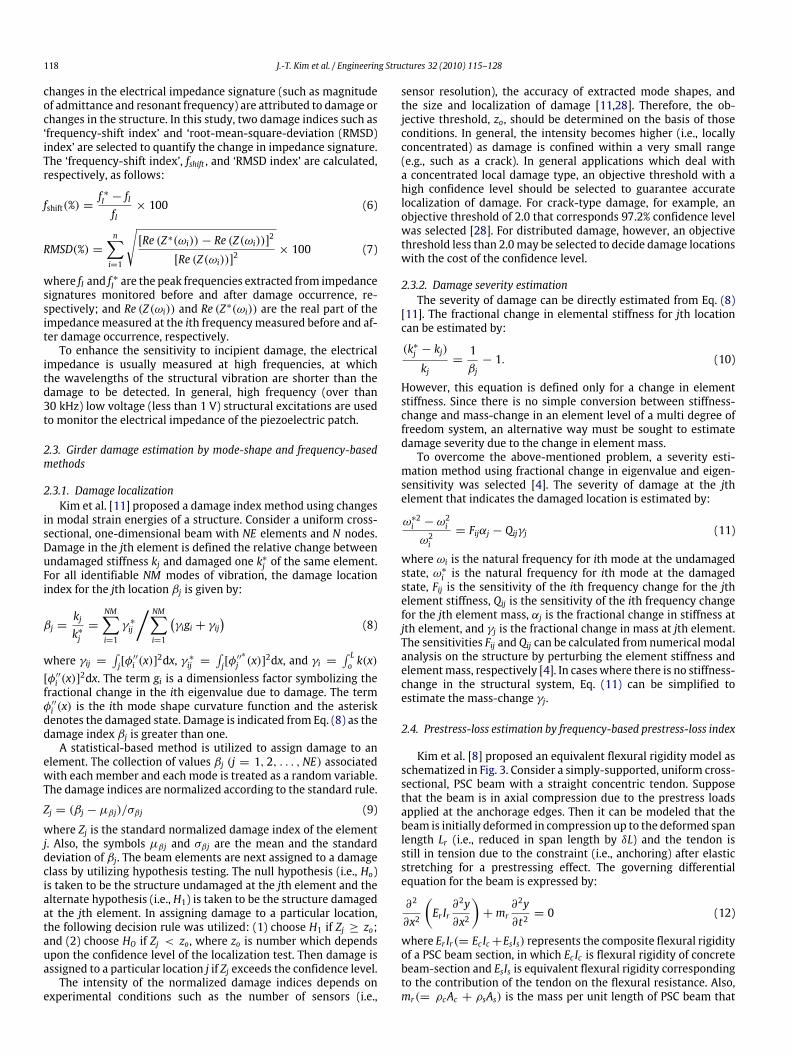
Kim et al. [8] proposed an equivalent flexural rigidity model asschematized in Fig. 3. Consider a simply-supported, uniform cross-sectional, PSC beam with a straight concentric tendon. Supposethat the beam is in axial compression due to the prestress loadsapplied at the anchorage edges. Then it can be modeled that thebeam is initially deformed in compression up to the deformed spanlength Lr (i.e., reduced in span length by δL) and the tendon isstill in tension due to the constraint (i.e., anchoring) after elasticstretching for a prestressing effect. The governing differentialequation for the beam is expressed by:
∂2
∂x2
(Er Ir
∂2y∂x2
)+mr
∂2y∂t2= 0 (12)
where Er Ir(= Ec Ic+EsIs) represents the composite flexural rigidityof a PSC beam section, in which Ec Ic is flexural rigidity of concretebeam-section and EsIs is equivalent flexural rigidity correspondingto the contribution of the tendon on the flexural resistance. Also,mr(= ρcAc + ρsAs) is the mass per unit length of PSC beam that
J.-T. Kim et al. / Engineering Structures 32 (2010) 115–128 119
(a) PSC beam under prestressed deformation. (b) Beam of equivalent flexural rigidity.
Fig. 3. Equivalent flexural rigidity model of PSC beam [8].
combines the mass of concrete beam, ρcAc , and the mass of thetendon, ρsAs.By equating the modal characteristics of a cable under tension
load N to those of a beam with equivalent flexural stiffness, theequivalent flexural rigidity of tendon is derived as follows [8]:
EsIs =(Lrnπ
)2N. (13)
Applying Eq. (13) and appropriate boundary conditions toEq. (12) leads to the nth natural frequency, ωn, of the residual-tension model as follows:
ω2n =
(nπLr
)4 Er Irmr=
(nπLr
)4 1mr
(Ec Ic +
(Lrnπ
)2N
). (14)
As an inverse solution of Eq. (14), the prestress force which isidentified by the nth mode is obtained as:
(N)n = ω2nmr
(Lrnπ
)2− Ec Ic
(nπLr
)2. (15)
By assuming that no change occurs in beam’s geometry and massproperties, the first variation of the prestress force that can beidentified by the nth mode is given by:
(δN)n ∼= δω2nmr
(Lrnπ
)2− δ(Ec Ic)
(nπLr
)2(16)
where δωn is the variation in the nth natural frequency due tothe prestress-loss and δ(Ec Ic) is the change in flexural rigidityof concrete beam section occurring due to the prestress-loss. Byrelating Eq. (15) to Eq. (16), the relative change in prestress force,which is identified from the nth mode, is obtained as:(δNN
)n=
[δω2nmr
(Lrnπ
)2− δ(Ec Ic)
(nπLr
)2]/[
ω2nmr
(Lrnπ
)2− Ec Ic
(nπLr
)2]. (17)
Rearranging Eq. (17) gives:(δNN
)n=δω2n − δ$
2n
ω2n −$2n
(18)
where $n is the nth natural frequency of the beam with zeroprestress force, and δ$n is the variation of$n due to the change inflexural perturbation δ(Ec Ic) occurred due to the prestress-loss.
$ 2n =
Ec Icmr
(nπLr
)4, δ$ 2
n =δ(Ec Ic)mr
(nπLr
)4. (19)
Eq. (18) is simplified by further assuming δ$ 2n ≈ 0 (i.e., no change
occurred in flexural rigidity of concrete beam section due to theprestress-loss). The relative change in prestress force, δN/N , canbe estimated by measuring the change in natural frequencies ofthe PSC beam.
3. Experimental verification
3.1. Test structure and experimental setup
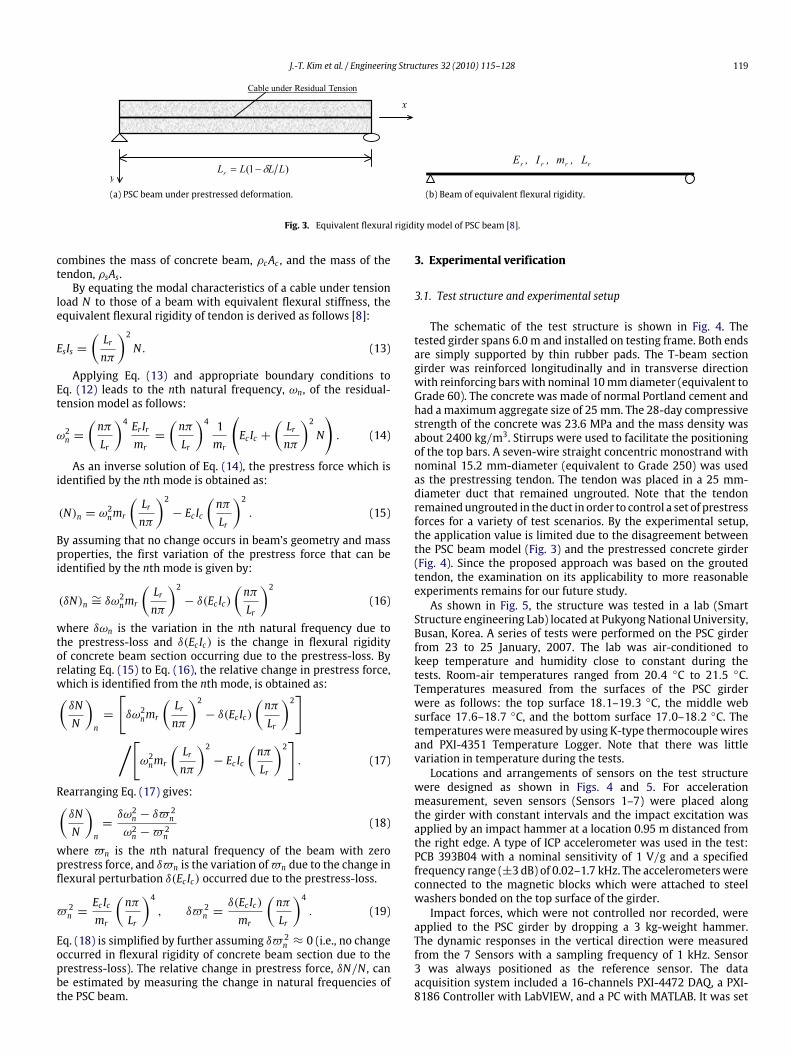
The schematic of the test structure is shown in Fig. 4. Thetested girder spans 6.0 m and installed on testing frame. Both endsare simply supported by thin rubber pads. The T-beam sectiongirder was reinforced longitudinally and in transverse directionwith reinforcing bars with nominal 10mmdiameter (equivalent toGrade 60). The concrete was made of normal Portland cement andhad amaximum aggregate size of 25mm. The 28-day compressivestrength of the concrete was 23.6 MPa and the mass density wasabout 2400 kg/m3. Stirrups were used to facilitate the positioningof the top bars. A seven-wire straight concentric monostrand withnominal 15.2 mm-diameter (equivalent to Grade 250) was usedas the prestressing tendon. The tendon was placed in a 25 mm-diameter duct that remained ungrouted. Note that the tendonremainedungrouted in theduct in order to control a set of prestressforces for a variety of test scenarios. By the experimental setup,the application value is limited due to the disagreement betweenthe PSC beam model (Fig. 3) and the prestressed concrete girder(Fig. 4). Since the proposed approach was based on the groutedtendon, the examination on its applicability to more reasonableexperiments remains for our future study.As shown in Fig. 5, the structure was tested in a lab (Smart
Structure engineering Lab) located at Pukyong National University,Busan, Korea. A series of tests were performed on the PSC girderfrom 23 to 25 January, 2007. The lab was air-conditioned tokeep temperature and humidity close to constant during thetests. Room-air temperatures ranged from 20.4 ◦C to 21.5 ◦C.Temperatures measured from the surfaces of the PSC girderwere as follows: the top surface 18.1–19.3 ◦C, the middle websurface 17.6–18.7 ◦C, and the bottom surface 17.0–18.2 ◦C. Thetemperatures weremeasured by using K-type thermocouple wiresand PXI-4351 Temperature Logger. Note that there was littlevariation in temperature during the tests.Locations and arrangements of sensors on the test structure
were designed as shown in Figs. 4 and 5. For accelerationmeasurement, seven sensors (Sensors 1–7) were placed alongthe girder with constant intervals and the impact excitation wasapplied by an impact hammer at a location 0.95 m distanced fromthe right edge. A type of ICP accelerometer was used in the test:PCB 393B04 with a nominal sensitivity of 1 V/g and a specifiedfrequency range (±3 dB) of 0.02–1.7 kHz. The accelerometerswereconnected to the magnetic blocks which were attached to steelwashers bonded on the top surface of the girder.Impact forces, which were not controlled nor recorded, were
applied to the PSC girder by dropping a 3 kg-weight hammer.The dynamic responses in the vertical direction were measuredfrom the 7 Sensors with a sampling frequency of 1 kHz. Sensor3 was always positioned as the reference sensor. The dataacquisition system included a 16-channels PXI-4472 DAQ, a PXI-8186 Controller with LabVIEW, and a PC with MATLAB. It was set
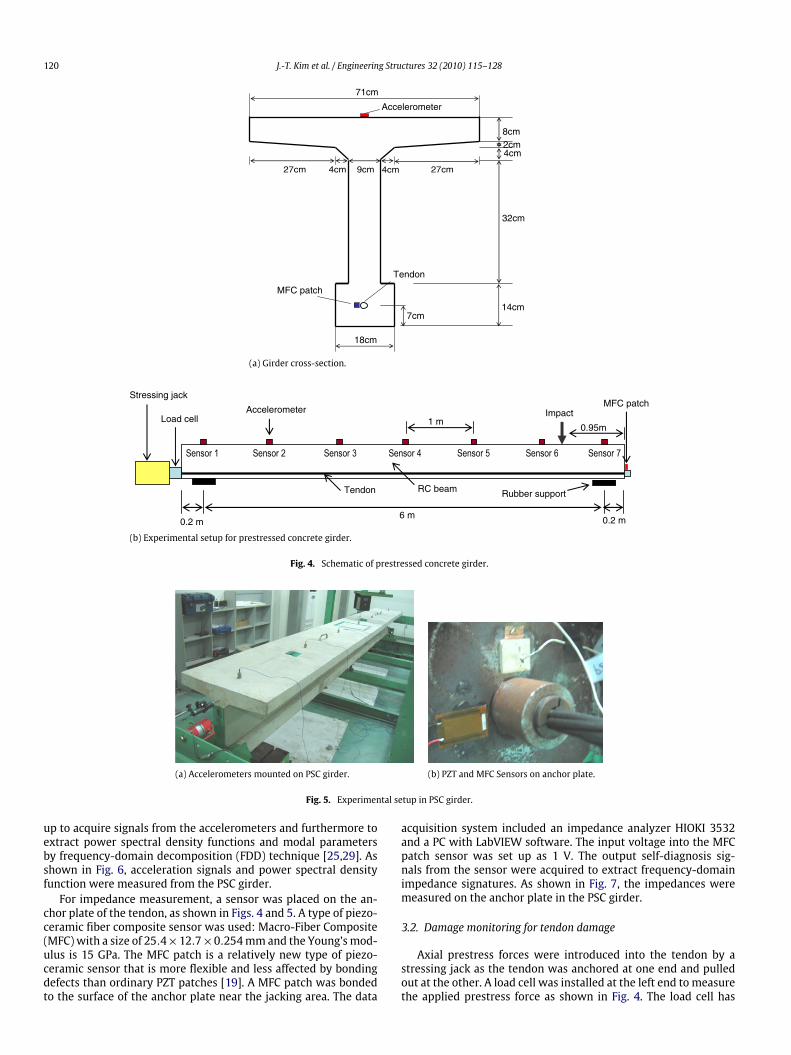
120 J.-T. Kim et al. / Engineering Structures 32 (2010) 115–128
71cm
8cm
4cm4cm27cm
32cm
14cm
4cm
18cm
7cm
9cm 27cm
2cm
MFC patch
Accelerometer
Tendon
(a) Girder cross-section.
Stressing jack
Tendon RC beam
1 m
6 m 0.2 m 0.2 m
Impact
0.95m
MFC patch
Load cellAccelerometer
Rubber support
(b) Experimental setup for prestressed concrete girder.
Fig. 4. Schematic of prestressed concrete girder.
(a) Accelerometers mounted on PSC girder. (b) PZT and MFC Sensors on anchor plate.
Fig. 5. Experimental setup in PSC girder.
up to acquire signals from the accelerometers and furthermore toextract power spectral density functions and modal parametersby frequency-domain decomposition (FDD) technique [25,29]. Asshown in Fig. 6, acceleration signals and power spectral densityfunction were measured from the PSC girder.For impedance measurement, a sensor was placed on the an-
chor plate of the tendon, as shown in Figs. 4 and 5. A type of piezo-ceramic fiber composite sensor was used: Macro-Fiber Composite(MFC)with a size of 25.4×12.7×0.254mmand the Young’smod-ulus is 15 GPa. The MFC patch is a relatively new type of piezo-ceramic sensor that is more flexible and less affected by bondingdefects than ordinary PZT patches [19]. A MFC patch was bondedto the surface of the anchor plate near the jacking area. The data
acquisition system included an impedance analyzer HIOKI 3532and a PC with LabVIEW software. The input voltage into the MFCpatch sensor was set up as 1 V. The output self-diagnosis sig-nals from the sensor were acquired to extract frequency-domainimpedance signatures. As shown in Fig. 7, the impedances weremeasured on the anchor plate in the PSC girder.
3.2. Damage monitoring for tendon damage
Axial prestress forces were introduced into the tendon by astressing jack as the tendon was anchored at one end and pulledout at the other. A load cell was installed at the left end to measurethe applied prestress force as shown in Fig. 4. The load cell has

J.-T. Kim et al. / Engineering Structures 32 (2010) 115–128 121
(a) Acceleration signal measured from data acquisition system. (b) Power spectral density function.
Fig. 6. Acceleration signal and power spectral density function of PSC girder.
(a) Impedance measured from impedance analyzer HIOKI 3532. (b) Impedance signatures (400 kHz–1 MHz).
Fig. 7. Impedance measured from MFC patch on anchor plate of PSC girder.
the lowest measurable force of 0.98 kN. Each test was conductedafter the desired prestress force has been applied and the cable hasbeen anchored. During the measurement, the stressing jack wasremoved from the structure to avoid the effect of the jackweight ondynamic characteristics of the test structure. The prestress forceswere applied to the test structure up to five different prestresslevels (i.e., PS 1–PS 5) as summarized in Table 1. There werefour prestress-loss cases between the five prestress levels. Themaximum andminimum prestress levels were set to 117.6 kN and39.2 kN, respectively. For each prestress-loss case, the prestressforce was uniformly decreased by 19.6 kN.
3.2.1. Global damage warning by FRRACDamage monitoring was performed in the following steps. In
Step 1, the occurrence of damage was alerted in a global mannerby using the FRRAC described in Eq. (4). For each of the fiveprestress levels, acceleration signals were measured up to eightensembles fromSensors 2 and3,which are closely spaced as shownin Fig. 4. (Note that the choice of optimal sensor location is aresearch issue thatwill be examined in a separate study.) As shownin Fig. 8, FRR(2, 3) (frequency-response-ratio functions betweenSensors 2 and 3) were obtained for the five prestress levels bycomputing CSD(2, 3) (cross-spectral density functions betweenSensors 2 and 3) and ASD(2, 2) (auto-spectral density functions ofSensor 2), as described in Eq. (3). It is observed from the figure thatthose power spectral functions were shifted due to the change inprestress levels. By setting the maximum prestress level, PS 1, as
the undamagedbaseline state, FRRAC values between the referencePS 1 and four other prestress levels (i.e., PS 2 – PS 4)were computedas shown in Fig. 9. The FRRAC values decreased from unity as theprestress-loss occurred. (Note that eight consecutive FRRAC valuescorresponding to eight ensembles of signals were measured foreach prestress level.) For all prestress-loss cases, the occurrenceof damage was successfully alerted by monitoring the change inthe FRRAC value; however, the type of damage (‘added-mass’ or‘prestress-loss’) could not be distinguished from the results shownin Fig. 9.
3.2.2. Damage classification by impedance signatureIn Step 2, the alerted damage was classified by using the
change in impedance signatures described in Eq. (5). For the fiveprestress levels, real impedances were measured from the MFCpatch, as shown in Fig. 10(b). Resonant frequencies were extractedby peak-peaking and outlined in Table 1. By following the previousstudies [30,31], the frequency range has been determined in trial-and-error manner by searching a band of frequency which wassensitive to the change in impedance signature. In this study, awide frequency range of 400 kHz to 1 MHz was first selectedand then divided into several segments to search for the mostsuitable frequency range. Fig. 7(a) shows themeasured impedancesignatures in the wide frequency range of 400 kHz to 1 MHz. Itwas then identified that the frequency range of 880–980 kHz wasthe most sensitive range to monitor the prestress-loss, as shownin Fig. 10(a). Also, the changes in impedance signatures were

122 J.-T. Kim et al. / Engineering Structures 32 (2010) 115–128
Table 1Impedance signatures measured for five prestress levels of PSC girder.
Prestress level Prestress force (kN) Resonant frequency (kHz) Frequency shift index (%) RMSD damage index (%)
PS 1 117.6 928.84 – –PS 2 98.0 931.09 0.24 3.69PS 3 78.4 932.08 0.35 5.74PS 4 58.8 933.33 0.48 6.28PS 5 39.2 935.58 0.73 9.41
Room-air temperatures ranged from 20.4 ◦C to 21.5 ◦C.
(a) ASD(2, 2). (b) CSD(2, 3).
(c) FRR(2, 3) = ASD(2, 2)/CSD (2, 3).
Fig. 8. Frequency-response-ratio functions by sensors 2 and 3 for five prestress levels (PS 1–PS 5).
quantified by a ‘frequency-shift index’ and ‘root-mean-square-deviation (RMSD) index’ described in Eqs. (6) and (7). As shown inTable 1 and Fig. 10(b), the frequencies were shifted and the RMSDindiceswere changed and outbounded the control limit of about 2%(see the Reference [22] for the control chart analysis). These resultsindicate that the alerted damage was prestress-loss.
3.2.3. Damage estimation by prestress-loss prediction algorithmIn Step 3, the classified damage was estimated in detail.
Since the alerted damage was identified as the prestress-loss,the frequency-based prestress prediction model (as described inEq. (18)) was implemented to estimate the amount of theprestress-loss. As summarized in Table 2, the first four natural fre-quencies for the five prestress levels were extracted from accelera-tion signals of the test structure. Also, the natural frequencies weremeasured for a prestress-free case (i.e., zero prestress force). Thecorresponding mode shapes were extracted by the FDDmethod asshown in Fig. 11. All six cases in Table 2 were examined to detectthe prestress-loss and the results are outlined in Table 3.The prestress-loss prediction results show good matches with
the inflicted ones. Prediction errors are as follows: 0%–30% formode 1, even higher 24%–44% for mode 2, 0%–9% for mode 3,
Fig. 9. Global damage warning of prestress-loss occurrence.
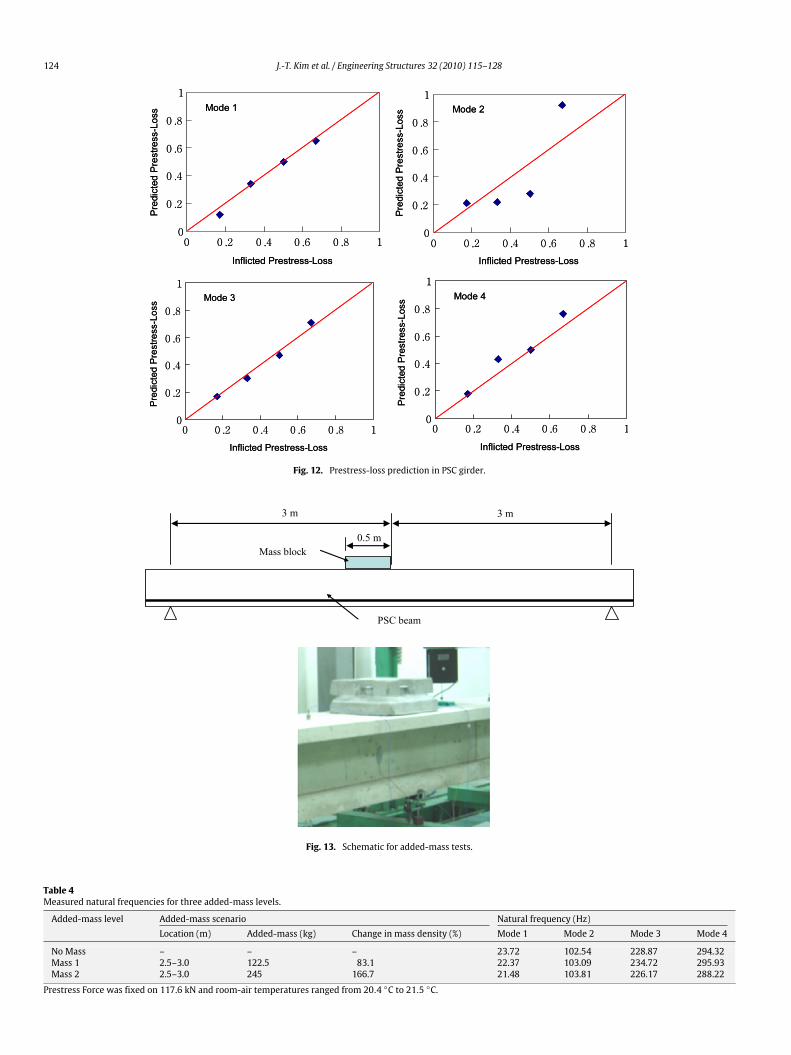
0%–33% for mode 4, and 0%–14% for the average of all 4 modes.The predicted prestress-losses versus the inflicted prestress-losseswere plotted in Fig. 12. The correlation between those two sets isrelatively high and itmeans that the prestress-loss in the PSC girdercan be detected via monitoring changes in natural frequencies.
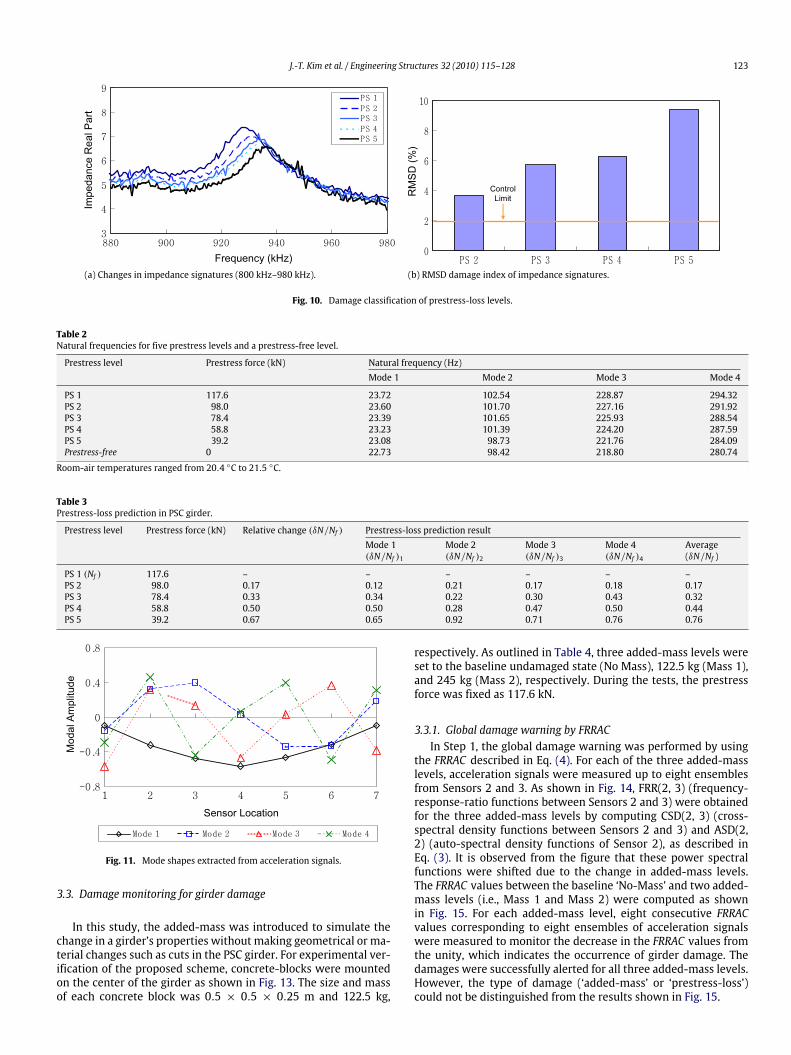
J.-T. Kim et al. / Engineering Structures 32 (2010) 115–128 123
(a) Changes in impedance signatures (800 kHz–980 kHz). (b) RMSD damage index of impedance signatures.
Fig. 10. Damage classification of prestress-loss levels.
Table 2Natural frequencies for five prestress levels and a prestress-free level.
Prestress level Prestress force (kN) Natural frequency (Hz)Mode 1 Mode 2 Mode 3 Mode 4
PS 1 117.6 23.72 102.54 228.87 294.32PS 2 98.0 23.60 101.70 227.16 291.92PS 3 78.4 23.39 101.65 225.93 288.54PS 4 58.8 23.23 101.39 224.20 287.59PS 5 39.2 23.08 98.73 221.76 284.09Prestress-free 0 22.73 98.42 218.80 280.74
Room-air temperatures ranged from 20.4 ◦C to 21.5 ◦C.
Table 3Prestress-loss prediction in PSC girder.
Prestress level Prestress force (kN) Relative change (δN/Nf ) Prestress-loss prediction resultMode 1(δN/Nf )1
Mode 2(δN/Nf )2
Mode 3(δN/Nf )3
Mode 4(δN/Nf )4
Average(δN/Nf )
PS 1 (Nf ) 117.6 – – – – – –PS 2 98.0 0.17 0.12 0.21 0.17 0.18 0.17PS 3 78.4 0.33 0.34 0.22 0.30 0.43 0.32PS 4 58.8 0.50 0.50 0.28 0.47 0.50 0.44PS 5 39.2 0.67 0.65 0.92 0.71 0.76 0.76
Fig. 11. Mode shapes extracted from acceleration signals.
3.3. Damage monitoring for girder damage
In this study, the added-mass was introduced to simulate thechange in a girder’s properties without making geometrical or ma-terial changes such as cuts in the PSC girder. For experimental ver-ification of the proposed scheme, concrete-blocks were mountedon the center of the girder as shown in Fig. 13. The size and massof each concrete block was 0.5 × 0.5 × 0.25 m and 122.5 kg,
respectively. As outlined in Table 4, three added-mass levels wereset to the baseline undamaged state (No Mass), 122.5 kg (Mass 1),and 245 kg (Mass 2), respectively. During the tests, the prestressforce was fixed as 117.6 kN.
3.3.1. Global damage warning by FRRACIn Step 1, the global damage warning was performed by using
the FRRAC described in Eq. (4). For each of the three added-masslevels, acceleration signals were measured up to eight ensemblesfrom Sensors 2 and 3. As shown in Fig. 14, FRR(2, 3) (frequency-response-ratio functions between Sensors 2 and 3) were obtainedfor the three added-mass levels by computing CSD(2, 3) (cross-spectral density functions between Sensors 2 and 3) and ASD(2,2) (auto-spectral density functions of Sensor 2), as described inEq. (3). It is observed from the figure that these power spectralfunctions were shifted due to the change in added-mass levels.The FRRAC values between the baseline ‘No-Mass’ and two added-mass levels (i.e., Mass 1 and Mass 2) were computed as shownin Fig. 15. For each added-mass level, eight consecutive FRRACvalues corresponding to eight ensembles of acceleration signalswere measured to monitor the decrease in the FRRAC values fromthe unity, which indicates the occurrence of girder damage. Thedamages were successfully alerted for all three added-mass levels.However, the type of damage (‘added-mass’ or ‘prestress-loss’)could not be distinguished from the results shown in Fig. 15.
124 J.-T. Kim et al. / Engineering Structures 32 (2010) 115–128
Fig. 12. Prestress-loss prediction in PSC girder.
Fig. 13. Schematic for added-mass tests.
Table 4Measured natural frequencies for three added-mass levels.
Added-mass level Added-mass scenario Natural frequency (Hz)Location (m) Added-mass (kg) Change in mass density (%) Mode 1 Mode 2 Mode 3 Mode 4
No Mass – – – 23.72 102.54 228.87 294.32Mass 1 2.5–3.0 122.5 83.1 22.37 103.09 234.72 295.93Mass 2 2.5–3.0 245 166.7 21.48 103.81 226.17 288.22
Prestress Force was fixed on 117.6 kN and room-air temperatures ranged from 20.4 ◦C to 21.5 ◦C.

J.-T. Kim et al. / Engineering Structures 32 (2010) 115–128 125
(a) ASD(2, 2). (b) CSD(2, 3).
(c) FRR(2, 3)= ASD(2, 2)/CSD(2, 3).
Fig. 14. Frequency-response-ratio functions by sensors 2 and 3 for three added-mass levels.
Fig. 15. Global damage warning of added-mass occurrence.
3.3.2. Damage classification by impedance signatureIn Step 2, the alerted damagewas classified by using the change
in impedance signatures described in Eq. (5). For the three added-mass levels, impedance real-part signals were measured from theMFC patch. A frequency range of 880–980 kHz was set up to detectthe change of the impedance signature. As shown in Fig. 16 and alsolisted in Table 5, both resonant frequencies and magnitudes of theimpedances remained almost unchanged. That is, the frequency-shift indices and RMSD indices are very small and remainedwithinthe control limit of about 2% (see the Reference [22] for the controlchart analysis). These results indicate that the alerted damage wasdue to the added-mass (i.e., girder damage) other than prestress-loss (i.e., tendon damage). In experiments, the added-mass causedlittle change in tendon’s prestress-force, which in turn resulted inlittle change in impedance signatures at the tendon anchor plate.The small change in impedance signature, as observed in Fig. 16,was due not only by the added-mass but also from measurement
noise. During the added-mass tests, the prestress force which wasmonitored by load cells remained unchanged. Note that the min-imum measurable force of the load-cell used for the experimentswas 0.98 kN.
3.3.3. Damage estimation by girder damage prediction algorithmIn Step 3, the classified damage was estimated in detail.
Since the alerted damage was classified as the added mass, themodal strain energy-based damage index algorithm and eigen-sensitivity-based damage detection method were utilized to es-timate the location and severity of damage, respectively. For thethree added-mass levels, natural frequencies of the four bend-ing modes were extracted from acceleration signals as outlined inTable 4. Note that the added-mass resulted in the decrement of nat-ural frequencies of the structure. As shown in Fig. 17, the first fourbending mode shapes were extracted for the three added-masslevels.The damage location index, βj, was computed according to Eq.
(8). As shown in Fig. 18, the normalized damage indices werecomputed fromEq. (9). In assigning damage to a particular location,the decision rule was utilized as: (1) choose H1 if Zj ≥ 1.5 and(2) choose Ho otherwise. In the present study, the added-mass wasdistributed over 0.5m (i.e., 8.3% range of the 6mspan) in the girder,so the objective threshold of 1.5 was selected with a confidencelevel of 93.3%. Damage locations were predicted as outlined inTable 6.Once damage locations had been predicted, severities of dam-
agewere estimated using Eq. (11). For the three added-mass levels,damage locations and severities were predicted as listed in Table 6.Locations of damage were predicted with relatively good accuracyin terms of position error (with respect to girder span). Position er-rors are as follows: 1.7%–3.3% forMass 1 and 3.2%–10.0% forMass 2.

126 J.-T. Kim et al. / Engineering Structures 32 (2010) 115–128
Table 5Impedance signatures measured for three added-mass levels.
Added-mass level Added-mass (kg) Change in mass density (%) Resonant frequency (kHz) Frequency shift index (%) RMSD damage index (%)
No mass – – 928.09 – –Mass 1 122.5 83.1 928.84 0.08 1.41Mass 2 245 166.7 928.09 0 1.34
Room-air temperatures ranged from 20.4 ◦C to 21.5 ◦C.
(a) Changes in impedance signatures. (b) RMSD damage index of impedance signatures.
Fig. 16. Damage classification of added-mass levels.
Fig. 17. Mode shapes for added-mass levels.
Severities of damage (i.e., the change in mass density of the girdersection where the mass was mounted) were predicted with rela-tively low accuracy in terms of size error. Size errors are as follows:48.2% for Mass 1 and 53.7% for Mass 2. The predicted severities of
damage are quite smaller than real severities of damages. Theseerrors may be due to errors in measured natural frequencies anderrors in computed eigen-sensitivities of the baseline model (e.g.,Eq. (11)).

J.-T. Kim et al. / Engineering Structures 32 (2010) 115–128 127
(a) Mass 1. (b) Mass 2.
Fig. 18. Damage prediction results for added-mass levels.
Table 6Damage prediction results for added-mass levels.
Added-mass level Inflicted added-mass Added-mass prediction resultLocation(m)
Added mass(kg)
Change in mass density(%)
Location(m)
Location error(%)
Change in mass density(%)
Size estimation error (%)
Mass 1 2.5–3.0 122.5 83.1 2.6–3.2 1.7–3.3 43.0 48.2Mass 2 2.5–3.0 245 166.7 3.2–3.6 3.3–10.0 77.0 53.7
4. Summary and conclusion
In this paper, a hybrid health monitoring system using seque-ntial vibration-impedance approaches was newly proposed todetect twodamage-types,which are tendondamage (i.e., prestress-loss) and girder damage (i.e., added-mass), in PSC girder bridges. Ahybrid health monitoring scheme for PSC girder bridges was de-signed. It mainly consists of three sequential steps: global damagewarning, damage classification, and damage estimation. In Step 1,the occurrence of damage is warned in a global manner by moni-toring changes in acceleration-based vibration features. In Step 2,damage-types are classified into either prestress-loss or added-mass by recognizing patterns of vibration and impedance features.In Step 3, the location and the extent of damage are estimated byusing modal strain energy-based damage index methods.The feasibility of the proposed system was evaluated on a
laboratory-scaled PSC girder model for which acceleration re-sponses and electro-mechanical impedances were measured forseveral damage scenarios of prestress-loss in tendon and added-mass in girder. First, the occurrence of damage was alarmed bymeasuring the change in frequency responses from accelerometersmounted on the PSC girder. Next, the type of damage was iden-tified by measuring the change in electro-mechanical impedancefrom a piezoelectric MFC patch bonded on the anchoring plate ofthe PSC girder. Once alerted and identified as ‘prestress-loss’ dam-age, the extent of damage was estimated with relatively high ac-curacy. Otherwise, alerted and identified as ‘added-mass’ damage,the location of damage was predicted with relatively good accu-racy and the severity of damage was estimated with relatively lowaccuracy.
Acknowledgements
This study was supported by Korean Science and EngineeringFoundation through Smart Infra-Structure Technology Center inthe program year of 2005–2007. Also, the authors would like to
thank Dr. G. Park of Los Alamos National Laboratory and Dr. M.Todd and Mr. D. Mascarenas of Univ. of California at San Diego fortheir technical supports on impedance measurement.
References
[1] Lin TY. Design of prestressed concrete structures. New York, (NY): Wiley-Interscience; 1963.
[2] Nawy EG. Prestress concrete — A fundamental approach. Englewood Cliffs,(NJ): Prentice-Hall; 1996.
[3] Adams RD, Cawley P, Pye CJ, Stone BJ. A vibration technique for non-destructively assessing the integrity of structures. J Mech Eng Sci 1978;20:93–100.
[4] Stubbs N, Osegueda R. Global nondestructive damage evaluation in solids.Internat J Anal Exp Modal Anal 1990;5(2):67–79.
[5] Kim JT, Park JH, Lee BJ. Vibration-based damage monitoring in model plate-girder bridges under uncertain temperature conditions. Eng Struct 2006;29(7):1354–65.
[6] Saiidi M, Douglas B, Feng S. Prestress force effect on vibration frequency ofconcrete bridges. J Struct Eng 1994;120:2233–41.
[7] Miyamoto A, Tei K, Nakamura H, Bull JW. Behavior of prestressed beamstrengthened with external tendons. J Struct Eng 2000;126:1033–44.
[8] Kim JT, Yun CB, Ryu YS, Cho HM. Identification of prestress-loss in PSC beamsusing modal information. Struct Eng Mech 2003;17(3–4):467–82.
[9] Law SS, Lu JR. Time domain responses of a prestressed beam and prestressidentification. J Sound Vibration 2005;288(4-5):1011–25.
[10] Abdel WMM, De RG. Damage detection in bridges using modal curvatures:Application to a real damage scenario. J Sound Vibration 1999;226(2):217–35.
[11] Kim JT, Ryu YS, Cho HM, Stubbs N. Damage identification in beam-typestructures: Frequency-based method vs. mode-shape-based method. EngStruct 2003;25:57–67.
[12] Huth O, Feltrin G, Maeck J, Kilic N, Motavalli M. Damage identification usingmodal data: Experiences on a prestressed concrete bridge. J Struct Eng 2005;131(12):1898–910.
[13] Reda TahaMM, Lucero J. Damage identification for structuralmonitoring usingfuzzy pattern recognition. Eng Struct 2005;27(12):1774–83.
[14] Bhalla S, Soh CK. Structural impedance based damage diagnosis by piezotrans-ducers. Earthq Eng Struct Dynam 2003;32(12):1897–916.
[15] Liang C, Sun FP, Rogers CA. An impedance method for dynamic analysisof active material systems. J Vibration Acoustics-Trans ASME 1994;116(1):120–8.
[16] Park G, Cudney H, Inman DJ. Impedance-based health monitoring of civilstructural components. J Infrastruct Syst-ASCE 2000;6(4):153–60.
[17] Kim JT, NaWB, Park JH, Hong DS. Hybrid healthmonitoring of structural jointsusing modal parameters and EMI signatures. Proc SPIE- Internat Soc Opt Eng2006;6174: 61742O-1-11.

128 J.-T. Kim et al. / Engineering Structures 32 (2010) 115–128
[18] Elsener B. Long-term monitoring of electrically isolated post-tensioningtendons. Struct Concrete 2005;6(3):101–6.
[19] Park S, Ahmad S, Yun CB, Roh Y.Multiple crack detection of concrete structuresusing impedance-based structural health monitoring techniques. Exp Mech2006;46(5):609–18.
[20] Doebling SW, Farrar CR, Prime MB. A summary review of vibration-based damage identification methods. Shock Vibration Digest 1998;30(2):91–105.
[21] Zou Y, Tong L, Steven GP. Vibration-based model-dependent damage(delamination) identification and health monitoring for composite structures— A review. J Sound Vibration 2000;230(2):357–78.
[22] Sohn H, Farrar CR, Hemez FM, Shunk DD, Stinemates DW, Nadler BR. A reviewof structural health monitoring literature: 1996–2001, Los Alamos NationalReport, LA-13976-MS; 2001.
[23] Kessler SS. Piezoelectric-based in-situ damage detection of compositematerials for structural health monitoring systems. Ph.D. dissertation,Massachusetts Institute of Technology; 2002.
[24] Park G, Farrar CR, Scalea FL. Performance assessment and validation of
piezoelectric active-sensors in structural health monitoring. Smart MaterStruct 2006;15(6):1673–83.
[25] Yi JH, Yun CB. Comparative study on modal identification methods usingoutput-only information. Struct Eng Mech 2004;17(3–4):445–66.
[26] Bendat JS, Piersol AG. Engineering applications of correlation and spectralanalysis. New York, NY: Wiley-Interscience; 1993.
[27] Liang C, Sun FP, Rogers CA. An impedance method for dynamic analysisof active material systems. J Vibration Acoustics-Trans ASME 1994;116(1):120–8.
[28] Kim JT, Stubbs N. Nondestructive crack detection algorithm for full-scalebridges. J Struct Eng, ASCE 2003;129(10):1358–66.
[29] Brinker R, Zhang L, Andersen P. Modal identification of output-only systemsusing frequency domain decomposition. Smart Mater Struct 2001;10:441–5.
[30] Yang YW, Hu YH, Lu Y. Sensitivity of PZT impedance sensors for damagedetection of concrete structures. Sensors 2008;8(1):327–46.
[31] Park S, Ahmad S, Yun CB, Roh Y.Multiple crack detection of concrete structuresusing impedance-based structural health monitoring techniques. Exp Mech2006;46(5):609–18.
Copyright © 2022 FDOKUMEN


![คาน[Beam or Girder] - Tumcivil](https://static.fdokumen.com/doc/165x107/63166eeac72bc2f2dd051417/beam-or-girder-tumcivil.jpg)
