Human T cells monitored by impedance spectrometry using field-effect transistor arrays: A novel tool...
7
Human T cells monitored by impedance spectrometry using field-effect transistor arrays: A novel tool for single-cell adhesion and migration studies Jessica Ka Yan Law a,n , Anna Susloparova a , Xuan Thang Vu a , Xiao Zhou b , Felix Hempel a , Bin Qu b , Markus Hoth b , Sven Ingebrandt a a Department of Informatics and Microsystem Technology, University of Applied Sciences Kaiserslautern, Zweibrücken, Germany b Department of Biophysics, Saarland University, Faculty of Medicine, Homburg, Germany article info Article history: Received 4 June 2014 Received in revised form 4 August 2014 Accepted 6 August 2014 Available online 13 August 2014 Keywords: Field-effect transistors Human CD8 þ T cells Cell adhesion Cell migration Single cells abstract Cytotoxic T lymphocytes (CTLs) play an important role in the immune system by recognizing and eliminating pathogen-infected and tumorigenic cells. In order to achieve their function, T cells have to migrate throughout the whole body and identify the respective targets. In conventional immunology studies, interactions between CTLs and targets are usually investigated using tedious and time- consuming immunofluorescence imaging. However, there is currently no straightforward measurement tool available to examine the interaction strengths. In the present study, adhesion strengths and migration of single human CD8 þ T cells on pre-coated field-effect transistor (FET) devices (i.e. fibronectin, anti-CD3 antibody, and anti-LFA-1 antibody) were measured using impedance spectroscopy. Adhesion strengths to different protein and antibody coatings were compared. By fitting the data to an electronically equivalent circuit model, cell-related parameters (cell membrane capacitance referring to cell morphology and seal resistance referring to adhesion strength) were obtained. This electronically- assessed adhesion strength provides a novel, fast, and important index describing the interaction efficiency. Furthermore, the size of our detection transistor gates as well as their sensitivity reaches down to single cell resolution. Real-time motions of individually migrating T cells can be traced using our FET devices. The in-house fabricated FETs used in the present study are providing a novel and very efficient insight to individual cell interactions. & 2014 Elsevier B.V. All rights reserved. 1. Introduction Migration of cytotoxic T lymphocytes (CTLs) throughout the body is crucial for the defensive immune system. CTLs are activated by recognizing the antigen presented by major histo- compatibility complex (MHC)-I on the antigen-presenting cells (APCs) via the antigen-specific T cell receptor (TcR) (Nel, 2002). By crosslinking the signaling CD3 subunit of the TcR, CTLs can be activated with increased interleukin level detected (Dixon et al., 1989). A tight junction, named immunological synapse (IS), is formed where cytotoxic granules are released from the T cell to the APC cell. The confined space of the IS therefore offers the cytotoxic granules to be released in high and effective concentration once responding to the triggered mechanisms (Huppa and Davis, 2003). Presence and activation of the co-receptor CD8 are essential for CTL activation. By activating CD8 receptors, the engagement between the APC and T cell is more specific and prolonged (Nel, 2002). After the crosslinking of TcR-CD3 and MHC, several mor- phological and actin cytoskeletal changes are occurring to form a stable IS. One of the surface molecules that help to strengthen cell adhesion is the lymphocyte function-associated antigen (LFA)-1. LFA-1 is a member of the integrin family of adhesion receptors and it is present at the microtubule organizing center (MTOC) where several important adhesion molecules are located to enhance IS stability (Bierer and Burakoff, 1988). Furthermore, other studies have shown that LFA-1 alone can induce the formation of an actin cloud at the site of contact, which co-stimulates T cells via an outside-in pathway (Suzuki et al., 2007). It is therefore important to understand the interactions of these molecules and the T cells at the IS. In order to monitor the migration process, real-time motion tracking microscopy has been used for analyzing the cell move- ment over time. The technique offers to study the polarity and Contents lists available at ScienceDirect journal homepage: www.elsevier.com/locate/bios Biosensors and Bioelectronics http://dx.doi.org/10.1016/j.bios.2014.08.007 0956-5663/& 2014 Elsevier B.V. All rights reserved. n Corresponding author. E-mail address: [email protected] (J.K.Y. Law). Biosensors and Bioelectronics 67 (2015) 170–176
-
Upload
independent -
Category
Documents
-
view
0 -
download
0
Transcript of Human T cells monitored by impedance spectrometry using field-effect transistor arrays: A novel tool...
Biosensors and Bioelectronics 67 (2015) 170–176
Contents lists available at ScienceDirect
Biosensors and Bioelectronics
http://d0956-56
n CorrE-m
journal homepage: www.elsevier.com/locate/bios
Human T cells monitored by impedance spectrometry using field-effecttransistor arrays: A novel tool for single-cell adhesion and migrationstudies
Jessica Ka Yan Law a,n, Anna Susloparova a, Xuan Thang Vu a, Xiao Zhou b, Felix Hempel a,Bin Qu b, Markus Hoth b, Sven Ingebrandt a
a Department of Informatics and Microsystem Technology, University of Applied Sciences Kaiserslautern, Zweibrücken, Germanyb Department of Biophysics, Saarland University, Faculty of Medicine, Homburg, Germany
a r t i c l e i n f o
Article history:Received 4 June 2014Received in revised form4 August 2014Accepted 6 August 2014Available online 13 August 2014
Keywords:Field-effect transistorsHuman CD8þ T cellsCell adhesionCell migrationSingle cells
x.doi.org/10.1016/j.bios.2014.08.00763/& 2014 Elsevier B.V. All rights reserved.
esponding author.ail address: [email protected] (J.K.Y. Law).
a b s t r a c t
Cytotoxic T lymphocytes (CTLs) play an important role in the immune system by recognizing andeliminating pathogen-infected and tumorigenic cells. In order to achieve their function, T cells have tomigrate throughout the whole body and identify the respective targets. In conventional immunologystudies, interactions between CTLs and targets are usually investigated using tedious and time-consuming immunofluorescence imaging. However, there is currently no straightforward measurementtool available to examine the interaction strengths. In the present study, adhesion strengths andmigration of single human CD8þ T cells on pre-coated field-effect transistor (FET) devices (i.e.fibronectin, anti-CD3 antibody, and anti-LFA-1 antibody) were measured using impedance spectroscopy.Adhesion strengths to different protein and antibody coatings were compared. By fitting the data to anelectronically equivalent circuit model, cell-related parameters (cell membrane capacitance referring tocell morphology and seal resistance referring to adhesion strength) were obtained. This electronically-assessed adhesion strength provides a novel, fast, and important index describing the interactionefficiency. Furthermore, the size of our detection transistor gates as well as their sensitivity reaches downto single cell resolution. Real-time motions of individually migrating T cells can be traced using our FETdevices. The in-house fabricated FETs used in the present study are providing a novel and very efficientinsight to individual cell interactions.
& 2014 Elsevier B.V. All rights reserved.
1. Introduction
Migration of cytotoxic T lymphocytes (CTLs) throughout thebody is crucial for the defensive immune system. CTLs areactivated by recognizing the antigen presented by major histo-compatibility complex (MHC)-I on the antigen-presenting cells(APCs) via the antigen-specific T cell receptor (TcR) (Nel, 2002). Bycrosslinking the signaling CD3 subunit of the TcR, CTLs can beactivated with increased interleukin level detected (Dixon et al.,1989). A tight junction, named immunological synapse (IS), isformed where cytotoxic granules are released from the T cell to theAPC cell. The confined space of the IS therefore offers the cytotoxicgranules to be released in high and effective concentration onceresponding to the triggered mechanisms (Huppa and Davis, 2003).Presence and activation of the co-receptor CD8 are essential for
CTL activation. By activating CD8 receptors, the engagementbetween the APC and T cell is more specific and prolonged (Nel,2002). After the crosslinking of TcR-CD3 and MHC, several mor-phological and actin cytoskeletal changes are occurring to form astable IS. One of the surface molecules that help to strengthen celladhesion is the lymphocyte function-associated antigen (LFA)-1.LFA-1 is a member of the integrin family of adhesion receptors andit is present at the microtubule organizing center (MTOC) whereseveral important adhesion molecules are located to enhance ISstability (Bierer and Burakoff, 1988). Furthermore, other studieshave shown that LFA-1 alone can induce the formation of an actincloud at the site of contact, which co-stimulates T cells via anoutside-in pathway (Suzuki et al., 2007). It is therefore importantto understand the interactions of these molecules and the T cells atthe IS.
In order to monitor the migration process, real-time motiontracking microscopy has been used for analyzing the cell move-ment over time. The technique offers to study the polarity and

J.K.Y. Law et al. / Biosensors and Bioelectronics 67 (2015) 170–176 171
migration pattern of moving cells in 2-dimensional and 3-dimen-sional microenvironments (Mehes and Vicsek, 2014). With thehelp of high-end total internal reflection microscopy, the adhesionfoci can be visualized and studied. However, the instrumentationis expensive and additional chemical tags for identifying specificproteins involved during adhesion are required (Roy et al., 2002).Until now, there is no quantitative label-free method to measurethe adhesion strength between cell and substrate in a high-throughput manner.
Besides the conventional microscopic imaging techniques, lab-on-a-chip techniques have been used to identify and study theactivation of T cells. A microsystem consisting of an array of goldmicroelectrodes fabricated on a glass substrate has been devel-oped. Specific antibodies recognizing the T cell antigens wereimmobilized on microelectrode surfaces to catch the identified Tcells (Zhu et al., 2008). The captured T cells were then releasedfrom the microelectrodes by applying a reductive potential via thereference electrode. By incorporating a microfluidic delivery sys-tem, this platform offers a simple approach to purify the target Tcells from cell mixtures for downstream analysis and re-culturing.Another high throughput all-electronic sensing approach, whichinvolves digital electronic bar-coded labels, has been reported and1000 individual cells can be identified per second (Wood et al.,2007). The amount of fluorescence-labeled T cells out of a cellmixture can also be calculated using a microfluidic lab-on-a-chipdevice, which has the advantages of low setup and running cost aswell as a small sample volume required (Wang et al., 2008).Miniature devices have been developed for T cell sorting; more-over, study of T cell activation using electronic readouts is stilllimited. One of the major limitations is the sensitivity of suchdevices. Extracellular acidification as a result of specific T cellactivation has been detected using a label-free electronic readout;however, the response is detected from a population of �210 cells(Stern et al., 2008). The report clearly indicated that the signalstrength is highly correlated with the cell population. Since T cellsare non-adherent migrating cells and they function individually, ahigh sensitivity device on a single cell level would be very valuablefor many different applications.
Previously, we have demonstrated that our field-effect transis-tor (FET) devices are a suitable pharmacological platform forcancer studies (Koppenhöfer et al., 2013; Susloparova et al.,2013). In the present study, we used the in-house fabricated FETdevices to study two important properties of the T cells: adhesionand migration. Interaction of single T cell with transistor surfaces,which were coated with different molecules involved in IS forma-tion can be modeled as a real IS. The cell-transistor adhesion in ourapproach is evaluated by the transistor-transfer function (TTF)method, which is quite similar to Electric Cell-substrate Impe-dance Sensing (ECIS) with metal microelectrodes. ECIS is one ofthe examples for electronic label-free biosensors detecting the cellmigration and invasion via impedance changes (Wegener et al.,2000). However, for such ECIS assays, confluent cell cultures arerequired due to the size limitation of the detection electrodes to beused with the instrumentation (Susloparova et al., 2014). There-fore it is not useful when the intended study model is in the formof single cell cultures. Compared to the well-established method,the FETs have lower input impedance than the metal–liquidinterfaces in ECIS. However, the potential changes at the cell–sensor interface are converted at the transistor gate to currentsignals in the FET channel, and are then carried on top of a largerDC current through the transistor to the first amplifier stage. Thiscan be regarded as a pre-amplification right at the sensor spot.Therefore the ECIS method with FETs is more stable against cableimpedance and other external influences. By fitting the TTF spectrato an electrically equivalent circuit (EEC) which describes a FETdevice in contact with an adhered cell, cell-related parameter like
the seal resistance Rseal formed between the cellular membraneand the device surface and the combined membrane capacitanceCM can be obtained. The Rseal value indicates how tight the celladheres on top of the transistor; while the CM value indicates theshape of the cell (Susloparova et al., unpublished results). Besidescell-related parameters, our present system is able to record theimpedance changes of static and migrating T cells. This offers anelectronic platform for monitoring T cell activities with so farunbeatable spatial resolution.
2. Materials and methods
2.1. Chemicals and reagents
Antibodies against human CD3 (BB-11, Diaclone, France) andhuman LFA-1 (Acris, Germany) were used in the present study. Forthe migration experiments, 0.1 mg/ml fibronectin (AppliChem,Germany) was used. All chemicals for cell culture were purchasedfrom Life Technologies, USA.
2.2. Isolation and culture of primary human T cells
All experiments performed for this study with human materialshave been approved by the local ethics committee. In brief,peripheral blood mononuclear cells (PBMCs) were purified fromhuman donor blood samples. In the present study, CD8þ T cellswere negatively isolated from PBMC by Dynabeadss Untouched™Human CD8 T Cells Kit (Life technologies, USA). Then CD8þ T cellswere stimulated by Dynabeadss Human T-Activator CD3/CD28(Life technologies, USA) for 3 days. The beads were removed by amagnet on day 3. The remaining activated CD8þ T cells were thenre-suspended in complete medium (AIM Vs medium supplemen-ted with 10% Fetal Calf Serum and 100 U/ml recombinant humanIL-2).
2.3. FET devices
In the present study, p-type open-gate FET devices were used.All FETs were fabricated in the cleanroom at the Zweibrückencampus of the University of Applied Sciences Kaiserslautern,Germany. Compared to the former FET devices, the FET devicesused in the present study have an almost flat silicon oxide surfaceon the whole chip, which promotes improved cell attachments onthe transistors and unhindered cell migration across the wholechip (Susloparova et al., 2014). Transistor gates were arranged inan array of 12 on a 7�7 mm2 silicon chip, with a distance of200 mm between individual gates. In order to achieve single cellmeasurements, FETs with transistor gate size (width 12 mm andlength 5 mm) were used in this study. The FET devices were thenconnected to 68-pin Lead Chip Carriers (Global chip Materials, LLC,USA) via wire bonding. The bonded chips were then encapsulatedwith a glass ring using a silicone adhesive (Dow Corning, 96-083),which functioned as a confined culture chamber. Finally, allbonding pads and wires within the culture chamber were pro-tected by a layer of silicone adhesive.
2.4. Measurement setup
A portable custom-made 16 channel amplifier system was usedto monitor the cell adhesion strength via impedance spectroscopy(Schäfer et al., 2009). Transistor gates of the FET devices werecharacterized and were set to a working point of maximumtransconductance. A 10 mV sinusoidal signal with frequenciesranging from 1 Hz to 1 MHz is applied via an Ag/AgCl referenceelectrode (Fig. 1a). The applied voltage has two possible pathways
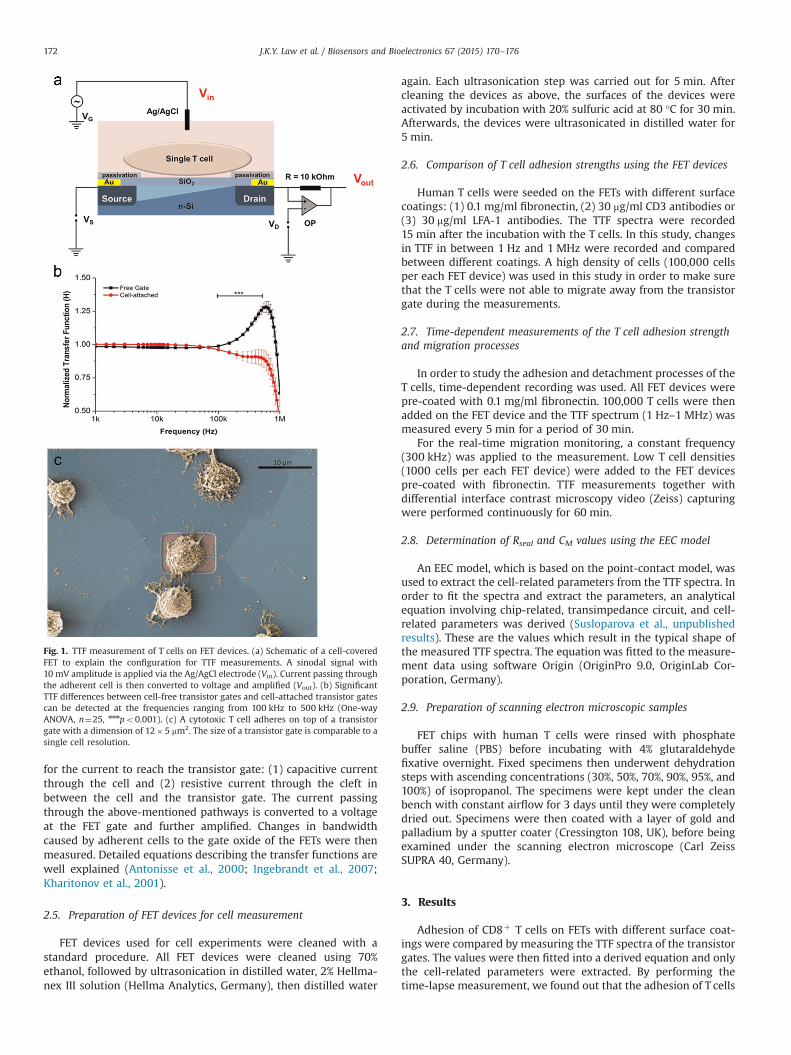
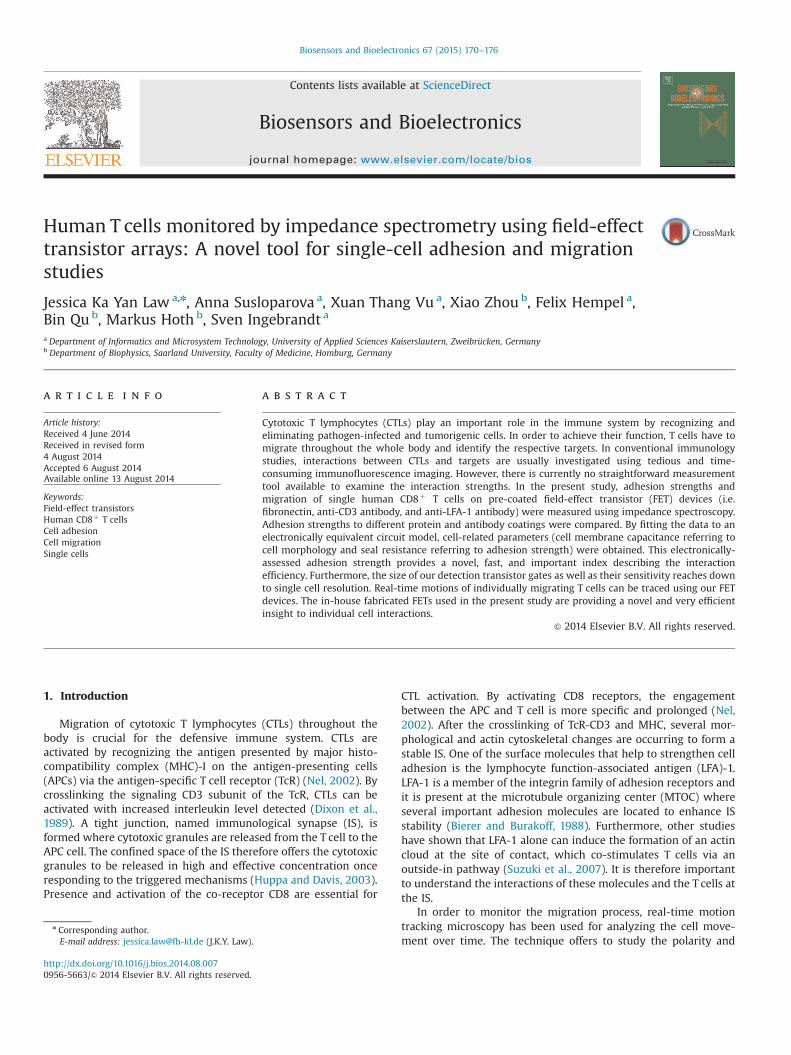
Fig. 1. TTF measurement of T cells on FET devices. (a) Schematic of a cell-coveredFET to explain the configuration for TTF measurements. A sinodal signal with10 mV amplitude is applied via the Ag/AgCl electrode (Vin). Current passing throughthe adherent cell is then converted to voltage and amplified (Vout). (b) SignificantTTF differences between cell-free transistor gates and cell-attached transistor gatescan be detected at the frequencies ranging from 100 kHz to 500 kHz (One-wayANOVA, n¼25, nnnpo0.001). (c) A cytotoxic T cell adheres on top of a transistorgate with a dimension of 12�5 mm2. The size of a transistor gate is comparable to asingle cell resolution.
J.K.Y. Law et al. / Biosensors and Bioelectronics 67 (2015) 170–176172
for the current to reach the transistor gate: (1) capacitive currentthrough the cell and (2) resistive current through the cleft inbetween the cell and the transistor gate. The current passingthrough the above-mentioned pathways is converted to a voltageat the FET gate and further amplified. Changes in bandwidthcaused by adherent cells to the gate oxide of the FETs were thenmeasured. Detailed equations describing the transfer functions arewell explained (Antonisse et al., 2000; Ingebrandt et al., 2007;Kharitonov et al., 2001).
2.5. Preparation of FET devices for cell measurement
FET devices used for cell experiments were cleaned with astandard procedure. All FET devices were cleaned using 70%ethanol, followed by ultrasonication in distilled water, 2% Hellma-nex III solution (Hellma Analytics, Germany), then distilled water
again. Each ultrasonication step was carried out for 5 min. Aftercleaning the devices as above, the surfaces of the devices wereactivated by incubation with 20% sulfuric acid at 80 °C for 30 min.Afterwards, the devices were ultrasonicated in distilled water for5 min.
2.6. Comparison of T cell adhesion strengths using the FET devices
Human T cells were seeded on the FETs with different surfacecoatings: (1) 0.1 mg/ml fibronectin, (2) 30 mg/ml CD3 antibodies or(3) 30 mg/ml LFA-1 antibodies. The TTF spectra were recorded15 min after the incubation with the T cells. In this study, changesin TTF in between 1 Hz and 1 MHz were recorded and comparedbetween different coatings. A high density of cells (100,000 cellsper each FET device) was used in this study in order to make surethat the T cells were not able to migrate away from the transistorgate during the measurements.
2.7. Time-dependent measurements of the T cell adhesion strengthand migration processes
In order to study the adhesion and detachment processes of theT cells, time-dependent recording was used. All FET devices werepre-coated with 0.1 mg/ml fibronectin. 100,000 T cells were thenadded on the FET device and the TTF spectrum (1 Hz–1 MHz) wasmeasured every 5 min for a period of 30 min.
For the real-time migration monitoring, a constant frequency(300 kHz) was applied to the measurement. Low T cell densities(1000 cells per each FET device) were added to the FET devicespre-coated with fibronectin. TTF measurements together withdifferential interface contrast microscopy video (Zeiss) capturingwere performed continuously for 60 min.
2.8. Determination of Rseal and CM values using the EEC model
An EEC model, which is based on the point-contact model, wasused to extract the cell-related parameters from the TTF spectra. Inorder to fit the spectra and extract the parameters, an analyticalequation involving chip-related, transimpedance circuit, and cell-related parameters was derived (Susloparova et al., unpublishedresults). These are the values which result in the typical shape ofthe measured TTF spectra. The equation was fitted to the measure-ment data using software Origin (OriginPro 9.0, OriginLab Cor-poration, Germany).
2.9. Preparation of scanning electron microscopic samples
FET chips with human T cells were rinsed with phosphatebuffer saline (PBS) before incubating with 4% glutaraldehydefixative overnight. Fixed specimens then underwent dehydrationsteps with ascending concentrations (30%, 50%, 70%, 90%, 95%, and100%) of isopropanol. The specimens were kept under the cleanbench with constant airflow for 3 days until they were completelydried out. Specimens were then coated with a layer of gold andpalladium by a sputter coater (Cressington 108, UK), before beingexamined under the scanning electron microscope (Carl ZeissSUPRA 40, Germany).
3. Results
Adhesion of CD8þ T cells on FETs with different surface coat-ings were compared by measuring the TTF spectra of the transistorgates. The values were then fitted into a derived equation and onlythe cell-related parameters were extracted. By performing thetime-lapse measurement, we found out that the adhesion of T cells

Table 1A summary of cell-related parameters, Rseal and CM, derived by fitting the averagedFET impedance spectra (n¼25–40) to an established EEC model. This model takesvariations of the seal resistance Rseal formed between the cellular membrane andthe device surface and the membrane capacitance CM, which project the dynamic
J.K.Y. Law et al. / Biosensors and Bioelectronics 67 (2015) 170–176 173
on transistor gates can be an independent event from sensor spotto sensor spot in the array and the activation time can vary. Lastly,our results clearly showed that movement of a single migrating Tcell can be detected with our FET platform.
changes of the cellular shape, into account. CD8þ T cells adhering on anti-CD3antibodies surfaces have the highest Rseal, reflecting the strongest adhesionstrength; while the CD8þ T cells adhering on anti-LFA-1 antibodies surfaces havethe highest CM, indicating the most widespread cell morphology.
Rseal (MΩ) CM (pF)
Fibronectin 1.23 1.52CD3 4.71 0.50LFA-1 2.95 2.16
3.1. T cell adhesion on FETs
Fibronectin serves as the extracellular matrix for T cell migra-tion and signaling. Here, fibronectin was used as a control adhe-sion protein for cell adhesion. By using the fibronectin pre-coatedFET devices, significant differences between cell-covered transistorgates and cell-free transistor gates were observed at the frequencyrange of 100 kHz–500 kHz (n¼25) (Fig. 1b). This is a signature celladhering signal for our impedance measurement. An exemplarySEM image of a T cell adhered on one transistor gate of a FET arrayis shown in Fig. 1c. The electronically-active area of a transistorgate (approximately 12�1 mm2) is in comparison to the size of anattached T cell. Comparison of TTF between different coatings wasperformed. More significant changes in the spectral shapes wereobserved at the anti-CD3 pre-coated transistors compared to theLFA-1 pre-coated transistors. The TTF spectrum of the cell-freetransistors is shown as a control (n¼25) (Fig. 2). T cells generallyadhered stronger on anti-CD3 coated FET devices than on LFA-1coated FET devices.
By fitting the averaged spectrum data (n¼40) according to anEEC as previously described, Rseal and CM of the T cells attached ondifferent coatings can be derived (Table 1). Rseal can be used as anindex indicating how tight the T cells are adhering on thetransistor gates. With higher Rseal values, stronger adherence withlarger footprints is correlated. Compared to the fibronectin pre-coated FET devices, the Rseal between anti-CD3 and the T cells hasthe highest value of 4.71 MΩ, while the Rseal between anti-LFA-1and the T cells has the value of 2.95 MΩ. The CM, which reflects themorphology of the adhered cell, was derived by fitting the spectrato the EEC model. This CM value is the series combination of themembrane area attached to the surface and the free membranefacing the electrolyte solution. A higher value of CM indicates aflatter morphology of the cells. The CM values between anti-CD3and anti-LFA-1 are 0.49 pF and 2.16 pF, respectively.
Fig. 2. CD8þ T cells form a tighter contact with the anti-CD3 antibodies-coatedtransistors compared to the anti-LFA-1 antibodies-coated transistors. Significantchanges in TTF are observed when the T cells adhere on anti-CD3 coated surfacesthan the anti-LFA-1 antibodies coated surfaces (Two-way ANOVA, n¼40,nnnpo0.001).
3.2. Differential adhesion of T cells on FETs
In the present study, differential adhesions of the single T cellswere visualized via the changes in TTF of the transistors. Threedifferent transistor gates from one FET chip were monitored at thesame time (Fig. 3). Data showed that T cells from the samepopulation can have different adhesion onset time and adhesionperiods. One of the T cells adhered tightly to the transistor gateimmediately after 5 min incubation time and gradually detachedfrom the transistor gate over the next 15 min (Fig. 3a); whileanother T cell started the adhesion process after 10 min ofincubation and detached over the next 10 min (Fig. 3b). AnotherT cell from the same population was partially attached to thetransistor gate after 5 min incubation, the adhesion process wasthen continued and the increased adhesion strength was reflectedby the changes in transfer function over the next 10 min; after-wards, the cell started to detach from the transistor gate (Fig. 3c).
3.3. Single migrating T cell on FETs
In order to capture individual dynamic motions of the T cells,transfer functions of a transistor gate with a migrating T cell on topwere measured over time. This is done by setting the amplifier to afixed frequency and observing changes over time (Schäfer et al.,2009). A fixed frequency of 300 kHz was chosen since the TTFvalues between cell-covered and cell-free transistor had the mostsignificant differences there (Fig. 1b). TTF was changing accord-ingly when the single T cell was migrating towards the transistorgate and partially or completely covering it (Fig. 4). TTF wasunchanged when there was nothing on the transistor gate(T¼420 s); and it was gradually decreased when the transistorgate was covered by the T cell (T¼600 s). The T cell was moving ontop of the transistor and its micro-motion was detected andreflected by the fluctuations in transfer function (T¼1200 s). Theamplitude of the transfer function at 300 kHz returned back to itsbaseline when the T cell was not adhering tightly on the transistorgate (T¼1600 s). Almost all T cells, including the one on therecording transistor gate, became round in shape and lost theirmigration mobilities after around 60 min. Even though the tran-sistor gate was partially covered by the T cell until the end of therecording, its transfer function remained as non-covered(T¼4000 s).
Fluctuations of transfer functions which were due to mem-brane trafficking during migration were observed during thedetection process. Small magnitudes of signal fluctuations wereobserved when the transistor gate was covered by the cellmembrane during the cell migration process (Fig. 5, upper panel).The fluctuations of signal were not observed when the cell movedaway from the transistor gate (Fig. 5, lower panel). The signal isclearly due to the interaction of the cell membrane and the sensorsurface.

Fig. 3. Adhesion and detachment processes of single T cells happenindependently in the same culture on one chip. T cells on three individualtransistor gates (a, b, and c) from one FET device are plotted exemplarily. TheFET devices are sensitive enough to detect minor changes in TTF during theprocesses.
J.K.Y. Law et al. / Biosensors and Bioelectronics 67 (2015) 170–176174
4. Discussion
In the present study, we offer an alternative label-free electro-nic platform for T cell adhesion and T cell migration studies whichcan go down to single cell resolution. All FET devices used in thisstudy have been optimized, therefore providing better results forimpedimetric sensing of cellular adhesion (Susloparova et al.,2014). The present FET devices have the almost flat surfaces byminimizing the height of the edges between the contact lines andthe open transistor gate area, which allow the T cells to migratealmost unaffected by topographical obstacles (Fig. 1c). The stepheight was measured using atomic force microscopy and wasfound to be approximately 200 nm. With this new device design,cells are no longer preferably adhered on the edge of the contactlines instead of the transistor gate area (Susloparova et al., 2014).Additionally, the size of a transistor gate of our devices is incomparison to the size of an attached single T cell.
4.1. TTF spectra of adhered cells on different protein coatings
In this article, static adhesion measurements recording full TTFspectra were performed in order to study the sensitivity of the FETdevices and the cell-related parameters of the T cells. The TTFspectra can be well explained when cells are adhering on top ofthe detection transistors in our previous studies (Susloparovaet al., 2013). When compared between cell-free transistors andcell-attached transistors, significant differences in TTF spectrawere observed between 100 kHz and 500 kHz (Fig. 1b). The resultis in line with our previously published data, in which we usedsimilar FET devices having a slightly different topography notsuitable for migration studies (Koppenhöfer et al., 2013). Asmentioned earlier, CD3 and LFA-1 receptors play important rolesin T cell–APC interaction. The IS formed in between two cell typesis the region where the cytotoxic action of the T cell and the killingof the target cell takes place. Both CD3 and LFA-1 are involved in ISformation, stabilization, and further T cell activation. We are,therefore, interested in studying the cellular strengths as well asthe possible changes of the T cells after the formation of the IS. Inthis study, our FET devices serve as the artificial APC, which haveanti-CD3 antibodies and anti-LFA-1 antibodies pre-coated on theirsurfaces. By measuring the TTF changes due to the responses ofthe T cells towards the adhesion bonding, the adhesion strengthscaused by two different important receptors can then be com-pared. In our experiments, we found that anti-CD3 antibodiesformed a much tighter bond than anti-LFA-1 antibodies with the Tcells (Fig. 2). In our former works, we simply compared the FETimpedance data qualitatively by comparing spectra with or with-out cells attached to the gate of the FET devices (Koppenhöferet al., 2013; Susloparova et al., 2013).
4.2. Quantitative analysis of the TTF spectra
To analyze the impedance spectra quantitatively, we fitted themeasurement data to a derived equation for the EEC based on acommonly used point-contact approach (Susloparova et al.,unpublished results). Here, we found that the Rseal of the T cellsadhered on anti-CD3 antibodies coated transistors (Rseal¼4.71 MΩ) has a much higher value than the ones adhered onanti-LFA-1 antibodies (Rseal¼2.95 MΩ) (Table 1). For different celltypes, the typical distance values between the cellular membraneand the transistor surface are in the range of 10–100 nm, whichcorrespond to values of 1–10 MΩ for the seal resistance (Braunand Fromherz, 1998; Wrobel et al., 2008). Compared to the T cellsadhered on the fibronectin-coated transistors (Rseal¼1.23 MΩ),the T cells bound almost 4 times and 2 times tighter on anti-CD3antibodies and anti-LFA-1 antibodies, respectively. CD3 receptor is

Fig. 4. A single CD8þ T cell migrates towards one of the transistor gates over time (approximately 60 min). Images of the migrating cells at different time points (5, 8, 12, 20,and 35 min) are selected and shown. TTF changes, due to the adhesion of single cell to the transistor gate (indicated with a white arrow), were monitored and measured at afixed 300 kHz frequency. Fluctuations in signals are mainly due to the micro-motions of cell membrane on top of the transistor gate during the migration.
Fig. 5. Cell membrane micro-motions of a migration T cell. The upper panel showsthe fluctuations in transfer function when the cell membrane is attaching on one ofthe transistor gates. When the T cell migrated away from the transistor gate, thefluctuation in signal was not observed (lower panel). This proves that thefluctuation is due to the micro-motion effects of the cell membrane.
J.K.Y. Law et al. / Biosensors and Bioelectronics 67 (2015) 170–176 175
the co-receptor of the antigen specific TcR on the T cells. Thebonding between the CD3 receptor and the anti-CD3 antibodies isspecific and strong. On the other hand LFA-1 does not have such ahigh binding affinity. T cells typically express 104 to more than 105
LFA-1 molecules; however, they do not adhere spontaneously tosurfaces bearing with intracellular adhesion molecule 1. The LFA-1binding is rapidly increased only when the T cells are activated bycross-linking functionally important cell surface receptors (Lolloet al., 1993). The Rseal value presented here can be used as anadhesion strength index for adhesion studies. It helps working outthe relative involvements of different signaling molecules to theformation of a tight IS in a quick and convenient way.
The combined membrane capacitance (CM), which is a measureof morphology of the adhered T cells, can be derived from themeasured TTF spectra as well (Table 1). However, this should notbe confused with the total membrane capacitance which istypically measured by patch-clamp pipettes from inside to outsideof the whole cell (Susloparova et al., unpublished results). Thehigher the CM value, the flatter morphology of the adhered cell onthe transistor. After fitting the spectra, we found that the T cellsadhered on the anti-CD3 antibodies had a much smaller CM value(CM¼0.50 pF) than those adhered on the fibronectin (CM¼1.52 pF)or anti-LFA-1 antibodies (CM¼2.16 pF). The results presented inthis study indicate that the T cells maintained a slightly elongatedcell shape when adhered on the anti-CD3 antibodies surface; butcompared to this, the T cells are highly spread in morphologywhen adhering to the anti-LFA-1 antibodies surface. When thecrosslinking of TcR-CD3 and MHC happens, the T cells will changefrom a round to a slightly elongated morphology due to thepolarization of MTOC within the T cells (Huse, 2012). That explainswhy the CM value of the T cells on anti-CD3 antibodies iscomparably small. But for T cells adhered on the surfaces withanti-LFA-1 antibodies, they exhibited widely-spread and flatmorphologies. Several studies have shown that T cells plating onLFA-1 ligands generate a broad contact area (Dustin and Springer,1988; Shaw and Dustin, 1997). Upon adhesion to the APC, actinrearrangement occurs in the T cell. The rearrangement of the actinresults in changing the T cell morphology and T cell activationprocess (Beemiller and Krummel, 2010; Yu et al., 2013). The CMvalue in the present study provides information about the T cellmorphologies under different conditions.
4.3. Demonstration of individual cell-adhesion events using thepresent FET device
Static adhesion measurements are generally useful to deter-mine the spectra and the quantitative cell-related parameters atparticular time points. However, one should bear in mind that theT cells adhesion process involves dynamic steps. The full spectra of

J.K.Y. Law et al. / Biosensors and Bioelectronics 67 (2015) 170–176176
the T cell adhesion process was measured and compared every5 min (Fig. 3). Our FET devices are sensitive enough to distinguishimpedance changes due to nm differences in between the cellsand the transistors. Twelve individual adhesion processes can bemeasured simultaneously on a single FET device. Time-dependentmeasurements of a transistor gate with a freely-migrating T cell ontop were also measured. When a T cell was migrating on top of atransistor gate partially or completely covering it, the amplitude ofthe signal was changing accordingly (Fig. 4). Furthermore, fluctua-tions of signals during the migration process were recorded(Fig. 5). It is believed that those fluctuations are mainly due tothe micro-motion of cell membrane on top of the transistor duringthe migration. Indeed, similar signals have been previously re-ported for colonies of cells on ECIS electrodes and are regarded asan additional index for cell viability (Giaever and Keese, 1991).
5. Conclusions
We introduce an alternative, label-free electronic platform tosupplement ECIS with the possibility to reach down to single cellresolution. Our FET devices can be used as a simple and low-costtool for cell adhesion and cell migration studies. In the presentstudy, significant differences in the transistor spectra due to theadhesion of human CD8þ T cells on FETs with different surfacecoatings (fibronectin, anti-CD3 antibody, and anti-LFA-1 antibody)were measured and compared. Seal resistance (Rseal) formedbetween the cellular membrane and the device surface andcombined membrane capacitance (CM) were obtained for eachadhesion event. Rseal can be used as an index to evaluate theadhesion strength between cells and coating molecules; while CMcan be used to assess how the morphology of the adhered cellschange during adhesion or as a response to stimulants. Ourtransistor is sensitive enough to measure the attachment anddetachment process of a single T cell. Parallel video recordings andTTF measurements were performed and the results clearly showthat movement of single migrating T cells can be detected with ourelectronic platform. Furthermore, fluctuations of signals duringthe migration process were recorded. So far, there is no label-freemethod, which can be used to measure the direct adhesionstrength between cell and substrate. We are very confident thatour system can be applied to other cellular models, for example,migrating cells during wound healing or single neuron migrationsduring brain development. We hope that by this publication, weopen a whole-new direction within the biosensor, immune cells,and neurosciences communities.
Acknowledgments
This work was supported by the Federal Ministry of Educationand Research (BMBF) in Germany under projects BMBF/AIF17008X10 and BMBF/AIF 17042X11; and by project A2 of theSonderforschungsbereich 1027 (to MH and BQ). The authors thankMr. Rainer Lilischkis (University of Applied Sciences Kaiserslau-tern) for his support with SEM imaging.
Appendix A. Supplementary information
Supplementary data associated with this article can be found inthe online version at http://dx.doi.org/10.1016/j.bios.2014.08.007.
References
Antonisse, M.M., Snellink-Ruël, B.H., Lugtenberg, R.J., Engbersen, J.F., van den Berg,A., Reinhoudt, D.N., 2000. Anal. Chem. 72, 343–348.
Beemiller, P., Krummel, M.F., 2010. Cold Spring Harb. Perspect. Biol. 2, a002444.Bierer, B., Burakoff, S., 1988. FASEB J. 2, 2584–2590.Braun, D., Fromherz, P., 1998. Phys. Rev. Lett. 81, 5241–5244.Dixon, J.F., Law, J.L., Favero, J.J., 1989. J. Leukoc. Biol. 46, 214–220.Dustin, M.L., Springer, T.A., 1988. J. Cell Biol. 107, 321–331.Giaever, I., Keese, C.R., 1991. Proc. Natl. Acad. Sci. 88, 7896–7900.Huppa, J.B., Davis, M.M., 2003. Nat. Rev. Immunol. 3, 973–983.Huse, M., 2012. Front. Immunol. 3, 235.Ingebrandt, S., Han, Y., Nakamura, F., Poghossian, A., Schöning, M.J., Offenhäusser,
A., 2007. Biosens. Bioelectron. 22, 2834–2840.Kharitonov, A.B., Wasserman, J., Katz, E., Willner, I., 2001. J. Phys. Chem. B 105,
4205–4213.Koppenhöfer, D., Susloparova, A., Docter, D., Stauber, R.H., Ingebrandt, S., 2013.
Biosens. Bioelectron. 40, 89–95.Lollo, B.A., Chan, K.W., Hanson, E.M., Moy, V.T., Brian, A.A., 1993. J. Biol. Chem. 268,
21693–21700.Mehes, E., Vicsek, T., 2014. arXiv:1403.1127.Nel, A.E., 2002. J. Allergy Clin. Immunol. 109, 758–770.Roy, P., Rajfur, Z., Pomorski, P., Jacobson, K., 2002. Nat. Cell Biol. 4, E91–E96.Schäfer, S., Eick, S., Hofmann, B., Dufaux, T., Stockmann, R., Wrobel, G., Offenhäusser,
A., Ingebrandt, S., 2009. Biosens. Bioelectron. 24, 1201–1208.Shaw, A.S., Dustin, M.L., 1997. Immunity 6, 361–369.Stern, E., Steenblock, E.R., Reed, M.A., Fahmy, T.M., 2008. Nano Lett. 8, 3310–3314.Susloparova, A., Koppenhöfer, D., Law, J.K., Vu, X.T., Ingebrandt, S., unpublished
results.Susloparova, A., Koppenhöfer, D., Vu, X.T., Weil, M., Ingebrandt, S., 2013. Biosens.
Bioelectron. 40, 50–56.Susloparova, A., Vu, X.T., Koppenhöfer, D., Law, J.K.Y., Ingebrandt, S., 2014. Phys.
Status Solidi A 211 (6), 1395–1403.Suzuki, J., Yamasaki, S., Wu, J., Koretzky, G.A., Saito, T., 2007. Blood 109, 168–175.Wang, Y.-N., Kang, Y., Xu, D., Chon, C.H., Barnett, L., Kalams, S.A., Li, D., Li, D., 2008.
Lab Chip 8, 309–315.Wegener, J., Keese, C.R., Giaever, I., 2000. Exp. Cell Res. 259, 158–166.Wood, D.K., Braun, G.B., Fraikin, J.-L., Swenson, L.J., Reich, N.O., Cleland, A.N., 2007.
Lab Chip 7, 469–474.Wrobel, G., Höller, M., Ingebrandt, S., Dieluweit, S., Sommerhage, F., Bochem, H.P.,
Offenhäusser, A., 2008. J. R. Soc. Interface 5, 213–222.Yu, Y., Smoligovets, A.A., Groves, J.T., 2013. J. Cell Sci. 126, 1049–1058.Zhu, H., Yan, J., Revzin, A., 2008. Colloids Surf. B Biointerfaces 64, 260–268.