HSBC 4Xb - Fundsquare
226
HSBC Global Investment Funds Unaudited Report for the period from I April 2006 to 30 September 2006 HSBC 4Xb
-
Upload
khangminh22 -
Category
Documents
-
view
0 -
download
0
Transcript of HSBC 4Xb - Fundsquare

HSBC Global Investment Funds
Unaudited Report for the period from I April 2006 to 30 September 2006
HSBC 4Xb

Unaudited report for the period from 1 April 2006 to 30 September 2006
Societe d'lnvestissement a Capital Variable (SICAV), Luxembourg
HSBC Global Investment Funds ~. ~. .~ .~ ~

Information concerning the distribution of shares of HSBC Global Investment Funds in Switzerland or from Switzerland. HSBC Private Bank (Suisse) SA, Quai du General Guisan 2, case postale 3580 CH-121 I Geneva 3, is the legal representative of the Fund in Switzerland and the Fund's paying agent. The prospectus, simplified prospectuses, articles and annual and semi-annual reports of the Fund may be obtained free of charge upon request from the HSBC Private Bank (Suisse) SA. A breakdown of all the transactions carried out on behalf of each sub-fund of HSBC Global Investment Funds in the period under review can be obtained, free of charge, from the Fund's representative in Switzerland.
Information concerning the distribution of shares of HSBC Global Investment Funds in Germany or from Germany. HSBC Trinkaus & Burkhardt KGaA, 21-23 Königsallee, D-40212 Düsseldorf, is the legal representative of the Fund in Germany and the Fund's paying and information agent. The prospectus, simplified prospectuses, articles and annual and semi-annual reports of the Fund may be obtained free of charge upon request from the HSBC Trinkaus & Burkhardt KGaA. A breakdown of all the transactions carried out on behalf of each sub-fund of HSBC Global Investment Funds in the period under review can be obtained, free of charge, from the Fund's representative in Germany.
No subscription can be received on the basis of financial reports. Subscriptions are only valid if made on the basis of the current Prospectus accompanied by the latest annual and the most recent semi-annual report, if published thereafter.
Unaudited report for the period from I April 2006 to 30 September 2006
HSBC Global Investment Funds ~ . .

-
Table of Contents
Board of Directors.. . . . . . . . . . . . . . . . . . . . . . . . . . . . . . . . . . . . . . . . . . . . .
Management and Administration. . . . . . . . . . . . . .
Directors' Report . . . . . . . . . . . . . . . . . . . . . . . . . . . . . . . . . . . . . . . . . . . .
Statement of Net Assets as at 30 September 2006.. . . . . . . . . . . . . . . .
Statement of Operations and Changes in Net Assets,. . . . . . . . . . . . . .
Comparative Table of Net Assets..
Currency Conversion Table.. . . . . . . . . . . . . . . . . . . . . . . . . . . . . . . . . . . . . . . . .
Dealing Day of the Fund..
. . . . . . . . . . . . . . . . . . . .
. . . . . .
. . . . . . . .
Notes to the Financial Statements. . . . . . . . . . . . . . . . . . . . . . . . . . . . . . . . . . . . . . . .
. . . . . . . . . . . . . . . . . . . . . . . . . . . . . . . . . . . . .
Portfolio of Investments and Other Net Assets . . . . . . . . . . . . . . . . . . . . . . . . . . . . . . . . .
. . . . . . . . . . . . . . . . . . . . . . . . . . . . . . . . . . . . . . . . . . . . . .
. . . . . . . . . . . . . .
. . . . . . . . . . . . .
. . . . . . . . . . . . .
. . . . . . . . . . . . .
. . . . . . . . . . . . . .
. . . . . . . . . . . . . .
. . . . . . . . . . . .
. . . . . . . . . . .
. . . . . . . . . . . . . .
. . . . . . . . . . . .
4
5
7
18
38
49
74
86
216
21 7
-A - HSBC Global Investment Funds

I
- +
~- Board of Directors
I
Marc-Andre Bechet, Managing Director, RBC Dexia Investor Services Bank S.A., 5, rue Thomas Edison, L-1445 Strassen, Grand Duchy of Luxembourg. (resigned on 19 May 2006)
Simeon Brown, Chief Operating Officer, HSBC Investments (Hong Kong) Limited, Level 22, HSBC Main Building, 1, Queen's Road Central, Hong Kong.
Sylvie Vigneaux, Head of Regulatory and Savings, HSBC Investments (France), 4, Place de la Pyramide, lmmeuble Ile de France, La Defense 9, 92800 Puteaux, France.
Didier Deleage, Chief Operating Officer, HSBC Investments (France), 4, Place de la Pyramide, lmmeuble Ile de France, La Defense 9, 92800 Puteaux, France. (since 19 May 2006)
Deshmukh-Rao Dhondee, Assistant Manager, HSBC Offshore Banking Unit, The Hong Kong and Shanghai Banking Corporation Limited Les Cascades, 5th Floor, Edith Cavell Street, Pori Luis, Mauritius.
David Dibben, Chief Operating Officer, HSBC Group Investment Businesses Limited, 8 Canada Square, London E14 5HQ, United Kingdom. (since I 9 May 2006)
George Efthimiou, Global Chief Operating Officer, HSBC Group Investment Businesses Limited, 8 Canada Square, London E14 5HQ, United Kingdom.
Laurent Facque, Chief Operating Officer, HSBC Investments (France), 4, Place de la Pyramide, lmmeuble Ile de France, La Defense 9, 92800 Puteaux, France (resigned on 19 May 2006)
Bryan Greener, Head of Product Management - Global Products, HSBC Group Investment Businesses Limited, Level 21,8 Canada Square, London E14 5HQ, United Kingdom.
Thies Clemenz, Chief Operating Officer, HSBC Investments Deutschland Grnbh Königsallee 21 /23,40212 Düsseldorf, Germany (since 28 July 2006)
I
- A HSBC Global Investment Funds

~. ppp---
M an age men t and Ad m in ist ration ~- ~
~ ~ - - ~ -
b
Registered Office 69, route d'Esch, L-1470 Luxembourg, Grand Duchy of Luxembourg (until 1 June 2006). 40, avenue Monterey, L-2163 Luxembourg, Grand Duchy of Luxembourg (since 1 June 2006).
Management Company HSBC Investment Funds (Luxembourg) S.A., 40, avenue Monterey, L-2163 Luxembourg, Grand Duchy of Luxembourg.
Custodian and Administration Agent Dexia Banque Internationale a Luxembourg S.A., 69 route d'Esch, L-1470 Luxembourg (until 1 June 2006). RBC Dexia Investor Services Bank S.A., 5, rue Thomas Edison, L-1445 Strassen, Grand Duchy of Luxembourg. (since 1 June 2006).
Transfer Agent RBC Dexia Investor Services Bank S.A., 5, rue Thomas Edison, L-1445 Strassen, Grand Duchy of Luxembourg.
Investment Advisers Halbis Capital Management (Hong Kong) Limited (formerly HSBC Halbis Partner (Hong Kong) Limited), HSBC Main Building, 1, Queen's Road Central, Hong Kong.
HSBC Investments (USA) Inc., 452 Fifth Avenue, 18th Floor, New York, NY 10018, USA.
HSBC Halbis Partnerc (USA) Inc., 452 Fifth Avenue, 18th Floor, New York, NY 10018, USA.
HSBC Investments (UK) Limited, 8, Canada Square, London E14 5HQ, United Kingdom.
HSBC Halbis Partners (UK) Limited, 8, Canada Square, London E14 5HQ, United Kingdom.
HSBC Investments (France), lmmeuble Ile de France, 4, Place de la Pyramide, La Defense 9, 92800 Puteaux, France.
HSBC Halbis Partners (France), lmmeuble Ile de France, 4, Place de la Pyramide, La Defense 9, 92800 Puteaux, France.
HSBC FCP2 (France), lmmeuble He de France, 4, Place de la Pyramide, La Defense 9, 92800 Puteaux, France. (since 1 August 2006).
HSBC Bank Brazil SA - Banco Muitipio, Travessa Oliviera Belo, 11-B,80020-030 Cuntiba, Brazil.
HSBC Investments Deutschland GmbH, Königsallee 21/23, 0-4021 2 Düsseldorf, Germany
Sinopia Asset Management, lmmeuble Ile de France, 4, Place de la Pyramide, La Defense 9,92800 Puteaux, France.
Share Distributor HSBC Investment Funds (Luxembourg) S.A., 40, avenue Monterey, L-2163 Luxembourg, Grand Duchy of Luxembourg.
Austria and Germany Share Distributor HSBC Trinkaus & Burkhardt KGaA, Königsallee 21 123, D-40212 Düsseldorf, Germany.
Hona Kona ReDresentative and Share Distributor HSBC Investment Funds (Hong Kong) Limited, HSBC Main Building, I Queen's Road Central, Hong Kong, Tel: (852) 2284 I I I 1 Fax: (852) 2845 0226
- HSBC Global Investment Funds

~~~
Man age men t and Ad m in ist ra t ion (continued ) ~- ~
b Share Distributor (continued)
United Kinqdom Representative HSBC Investments (UK) Limited, 8, Canada Square, London E14 5HQ, United Kingdom, Tel: (44) 207 991 8888 Fax: (44) 207 024 1999
ReDublic of Ireland Representative HSBC Securities Services (Ireland) Limited, HSBC House, Harcouri Centre, Harcouri Street, Dublin 2, Ireland.
Jersey Representative HSBC Funds Nominee (Jersey) Limited, HSBC House, Esplanade, St Helier, Jersey, JE1 IHS Channel Islands.
Sinqapore Representative and Share Distributor HSBC Investments (Singapore) Limited, 21, Collyer Quay, # I 3-02 HSBC Building, Singapore 049320, Singapore.
Swiss Representative HSBC Private Bank (Suicse) S.A., Quai du General Guisan 2, Case postale 3580, CH-I211 Geneva 3, Switzerland.
Korea Share Distributor The Hong Kong and Shanghai Banking Corporation Limited Seoul Branch, HSBC Building #25, I-Ka, Bongrae- Dong, Chung-Ku, Seoul, Korea.
Share Distributor for Continental Europe HSBC Investments (France), lmmeuble Ile de France, 4, Place de la Pyramide, La Defense 9, 92800 Puteaux, France .
b Central Paying Agent
Dexia Banque Internationale a Luxembourg S.A., 69, route d’Esch, L-1470 Luxembourg, Grand Duchy of Luxembourg (until I June 2006).
RBC Dexia Investor Services Bank S.A., 5, rue Thomas Edison, L-1445 Strassen, Grand Duchy of Luxembourg (since I June 2006).
Paying Agent in Hong Kong The Hongkong and Shanghai Banking Corporation Limited, HSBC Main Building, 1, Queen’s Road Central, Hong Kong.
b
b Auditor KPMG Audit S.a r.1. Reviseurs d’Entreprises, 31, allee Scheffer, L-2520 Luxembourg, Grand Duchy of Luxembourg.
b Legal Advisers
Luxembourg Elvinger, Hoss & Prussen, 2, Place Winston Churchill, B.P. 425, L-2014 Luxembourg, Grand Duchy of Luxembourg.
United Kingdom Linklaters and Paines, Barrington House, 59-67, Gresham Street, London EC2V ?JA, United Kingdom.
__ HSBC Global Investment Funds
I
Asia Ex Japan Equity The fund underperformed the benchmark for the six months ending 30 September 2006 rising 4.8% (share class AC) during the period versus 5.6% for the benchmark. Stock selection amongst technology stocks and financials provided the largest positive contributions during the period. The underperformance of consumer stocks offset these gains. While we may see continued volatility in the markets given uncertainty about global growth, we believe that the outlook for the Asian market remains positive given strong fundamentals and attractive valuations.
Asia Ex Japan Equity Smaller Companies The fund underperformed the market for the six months ending 30 September 2006, delivering a return of 4.3% (share class AC) versus 5.6% for the benchmark. Excluding cash, performance would have been ahead of the market. Stock selection amongst cyclicals provided the largest contributions to performance during the period, alongside financials. We were hurt by our exposure to the telecoms sector, in which we held a zero weighting for the period. While we may see continued volatility in the markets given uncertainty about global growth, we believe that the outlook for the Asian market remains positive given strong fundamentals and attractive valuations.
Asia Pacific Ex Japan Equity High Dividend The fund delivered a return of 2.21% (gross of fees) for the six months ending 30 September 2006, outperforming the peer group average. The fund maintains its strategy of selecting high-quality, high yielding stocks in Asia without adhering to a benchmark. This bias towards high-yielding stocks has been a major factor contributing to the fund's relative underperformance within the Asia ex Japan universe, as high-yield stocks fell from favour during the period under review.
Brazil Equity The fund outperformed the benchmark and the peer group average in the six-month period ending 30 September 2006 falling 1.9% (share class AC) versus declines of 2.9% and 2.5% respectively. The investment process has been based on a bottom-up process and, as a result, the portfolio has been concentrated on the consumer related sector, infrastructure and energy. Macro fundamentals in Brazil remain solid with low inflation, lower interest rates and a fiscal policy good enough to stabilize the debt/GDP ratio. We do not think presidential elections will change that picture. The biggest risk is a stronger than expected slowdown in the global economy.
BRlC Markets The BRlC Markets fund returned 4.7% (share class AC) in US$ terms over the period, compared to 2.8% for the customised equally-weighted MSCI ERIC index. The fund benefited over the period from an overweight country allocation to China, which was the strongest performing market over the six months, rising 7.8%. Russia was the largest country overweight throughout this period. This position has lost some ground recently as a result of softening commodities prices so ended the period only marginally positive. Brazil was the weakest performing market, falling 4. i%, while India continued to consolidate on its recent strong run to end the period up 5.8%.
BRlC Markets Equity Over the period since its launch on I June 2006 to 30 September 2006, the fund has returned 4.8% (share class AC) in US dollar terms versus 3.6% for the average fund in the sector. The MSCI ERIC returned 7.5% for the same period. The fund maintains its strategy of selecting countries and stocks with a quantitative approach. The fund was overexposed to the Brazilian market, and was slightly underexposed on Russia, India and China. The latest economic reports show BRlC economies will still benefit from strong GDP growth. This growth may lead to an improvement in microeconomic conditions, with positive earnings momentum.
Chinese Equity The fund delivered a return of 9.5% (share class AC) during the six-month period ending 30 September 2006, performing ahead of peers but behind the benchmark, which returned 8.9% and 10.8% respectively. Our overweight call on the insurance sector and underweight call on banks generated positive performance during the period. However, this was offset by underperformance amongst cyclicals, which were impacted by concerns about global growth. Our telecoms exposure was also negative. Our natural underweight in China Mobile (17% of the benchmark versus our 10% rnax holding) was a drag on performance, as China Mobile
- HSBC Global Investment Funds
~. 7

continues to perform well relative to the market and peers. We remain positive on the market over the medium term, as we continue to expect growth and earnings to be strong in 2007.
Emerging Europe Equity For the six months ending 30 September 2006 the fund returned -4.3% (share class AC). It is difficult to judge the funds relative performance versus the peer group and benchmark, as we changed the benchmark in the reporting period from DJ Stoxx EU Enlarged TMI to MSCl EM Europe 10140. This was done to be more competitive in the Eastern European peer group due to the inclusion of particular Russian stocks (around 55% in the benchmark) in our investment universe. We remain confident on the outlook of the Emerging European markets and we expect superior economic growth rates for the region compared to Western Europe for the upcoming years.
Euroland Equity The fund underperformed its benchmark over the period, returning -1.7% (share class AC) versus +2.9%, while its peer group returned 1.4%. The main reason for this underperformance was stock selection in the IT services sector and unfavourable positioning in the bank and utilities sectors. In the bank sector, the fund did not hold the Spanish and French banks, which outperformed strongly over the period. The fund's underweight in the utility sector was a negative factor especially in the context of sector consolidation that has been taking place. The fund has remained focused on its profitabilityhaluation approach, selecting companies on the basis of improvements in their profitability profile.
Euroland Equity Smaller Companies The fund performed in line with its benchmark over the period, falling 2.7% (share class AC) versus 2.6%. The fund's positioning in growth companies was very favourable in the second quarter of the year. However, the fall of the equity markets in May weighed heavily on the fund. The market rally over the summer allowed the fund to regain its outperformance on the year. Unfortunately, over the month of September three profit warnings from technology stocks saw performance suffer again. However, performance has remained in line with the index over the quarter. It is important to note that starting June Ist, the fund became a Euroland smaller companies fund from a European smaller companies fund. The benchmark changed to the EMU Smaller index, but the peer group is still European. This needs to change. In line with a slowing macro economic scenario we exited from our positions in shipping and early cyclicals, and reduced our exposure to petrol company stocks. We positioned the fund on late cyclical stocks with high a high level of visibility.
Euroland Value Creation The fund underperformed its benchmark over the period falling 0.6% (share class MIC) versus a rise of 2.9%. Its peer group returned an average of 1.4%. The main reason for underperformance in the second quarter of the year was stock selection in the IT services and bank sectors and an underweight in utilities. On I June 2006, the fund embarked on a bold new strategy, markedly improving its performance to rise 2.3% ahead of its peer group. The strategy concentrates on companies that reinvest practically all their cash flows into profitable projects so as to capitalise on their competitive edge.
Sustainability Leaders The fund performed in line with its benchmark over the period, returning 3.5% (share class MIC). It focuses on the best SRI-ranked companies in a pan-European universe. The universe is composed of the 10% best SRI- ranked stocks. The fund holds around 45 stocks. Over the period, the main move has been to move to an equally-weighted portfolio structure. This has included reducing our stake in Roche, Sanofi-Aventis, Danone and CRH. We have built new positions in Yell, Royal Bank of Scotland and Munich Re.
Europe Ex UK Equity The fund made a modest gain of I .2% (share class AC) during the review period, in line with the average fund in the sector but underperforming the index, which returned 3.8%. This placed the fund in the second quartile, despite the underperformance. The largest negative contribution was from Neste Oil, a Finnish oil refiner. In the third quarter, refining margins fell largely because of technical factors in the US. We expect this to reverse going forward. We own this company because new diesel capacity will boost margins and overall cashflow. There were a number of takeover situations in significant companies where the fund did not have exposure: Arcelor, Suez, Endesa and lberdrola together cost 60 basis points. Jazzte1 was weak because Telefonica has slowed the successful connection of new broadband customers. We view this as a timing issue with attractive
I
I
I
& - HSBC Global Investment Funds - - .

growth of cashflows expected. OPAP fell back after missing market profit forecasts. The issue was higher short term costs. We expect this should not recur and we are confident about the overall investment case. Financials performance was positive: in France, our bank holdings rose to better reflect the strength in domestic banking; we also found attractive opportunities in Italian and Greek banking restructuring with Marfin announcing three way tie with Laiki and Egnatia banks. Our holdings in Health care performed well with Roche, UCB and Novo Nordisk contributing. We sold Roche after it reached our price target and continue to hold UCB and NOVO Nordisk because the market is not correctly pricing the future prospects.
Global Emerging Markets Equity For the six-month period ending 30 September 2006, the fund rose by 0.9% (share class AC) during the review period: beating both benchmark and the average fund in the sector which returned 0.5% and -0.4% respectively. Following a strong first quarter and a good start to the second quarter, Global Emerging Markets corrected sharply in early May, falling by 24% to a six-month low in mid-June. The sell-off was prompted by concerns over a deteriorating growth and inflation outlook and fears over the course of interest rates as well as peaking commodity prices. During the correction, we reduced our positions in higher risk markets such as Turkey, Korea and South Africa and raised the cash level to protect the fund. From mid-June, Emerging Markets started to recover as concerns over interest rates and inflation eased, and commodity prices began falling, and in the third quarter we reduced the portfolio's exposure to energy stocks.
Global Equity The fund made a modest gain of I .4% (share class AC) over the review period underperforming both the MSCl World and the average fund in the sector which rose by 4.2% and 1.9% respectively. There were three main factors that were negative for performance. The fund's holdings in Japanese financials were generally weak, including Mizuho Trust & Banking, Jafco and Nikko Cordial. We were a little surprised by this because the economy has continued to expand and the banks will benefit from rising short rates. Turkey experienced significant macro problems in May with the currency and stockmarket falling. The fund had exposure, especially in the banks. We did reduce the exposure but have maintained some holdings. Neomax was squeezed between higher raw material prices its customer Toyota. We viewed this as likely to persist and sold the position. We were pleased with how some of the positions developed: Akamai Technology has grown its broadband delivery software business; Mediceo Paltac has successfully grown its drug distribution business in Japan; and Henkel has cut costs and successfully promoted its leading brands.
HSBC Global Investment Funds -. -.
Global Equity SRI The fund outperformed both the benchmark and the average fund in the sector, rising by 4.8% (share class AC) during the review period, compared with 4.2% and 2.5%. The majority of this outperformance was due to successful stock selection based on valuation and momentum quantitative signals. Positive growth, rising inflation and high energy prices remain the prevailing global economic conditions. These conditions provide a neutral background for global equity markets. In this environment, the portfolio will maintain exposure to valuation and momentum signals.
Global Equity Technology The fund rose by 2.2% (share class AC) during the review period, compared with 2.7% for the benchmark index. It significantly outperformed the average fund in the sector which fell by 2.4%. The majority of this outperformance was due to successful stock selection based on valuation and momentum quantitative signals. Positive growth, rising inflation, and high energy prices remain the prevailing global economic conditions. These conditions provide a neutral background for global equity markets. In this environment, the portfolio will maintain exposure to valuation and momentum signals.
Global Ex Euroland Equity For the six months ending 30 September 2006 the fund returned -2.3% (share class AD) in euro terms, in line with its benchmark. Stockpicking in the US market contributed positively to relative performance with strong gains coming from pure growth stories such as Akarnai (which rose 50%). On the other hand, the Europe ex- Eurozone contributed negatively in part because of its exposure to online casinos such as Pariygaming. Geographical allocation contributed negatively with an overweight stance on the Japanese market. The portfolio remains positioned for a global soft landing by switching into bigger capitalisation stocks with less cyclical exposure.
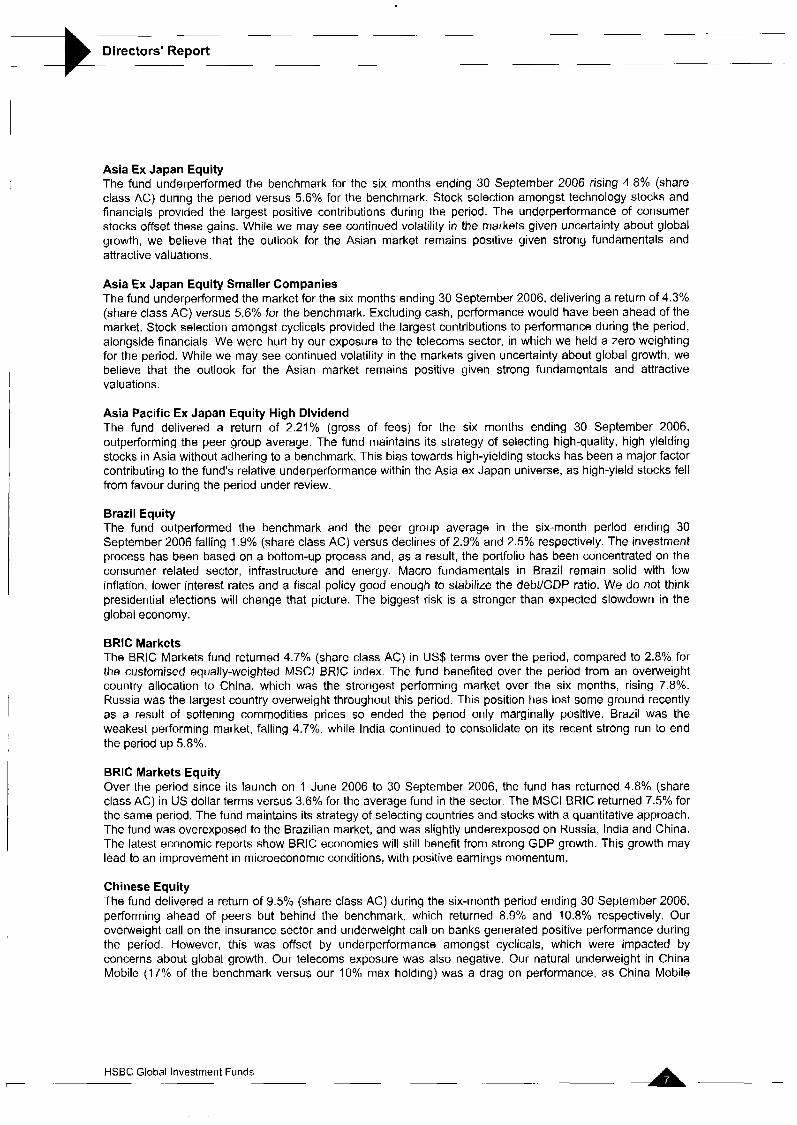
Hong Kong Equity For the six months ending 30 September 2006 the fund returned 7.6% (share class AC), whilst the benchmark Hang Seng Total Return Index was up 13%. The market was well supported by strong liquidity, driven by expectations of further renminbi appreciation and the positive sentiment boosted by the strong debuts of lPOs such as China Merchants Bank. In terms of sector performance, the commerce and industrial sector was the only sector that outperformed the market, led by the strong share price performance of China Mobile. Due to our de-facto underweight in China Mobile - with a maximum limit of 10% in the portfolio - it was the biggest negative for performance during the quarter. However, several stocks that reported better-than-expected results contributed positively to performance, and these include Kingboard Chemical, Nine Dragons and Esprit. On the economic front, the reported GDP growth for 2006 showed slower rate of growth at 5.2% year-on-year in real terms, down from 8% in the first quarter. We are looking for a gradual normalisation of growth following an above-trend growth since 2004 and a conservative outlook for trade growth on the back of slowing global economies.
Indian Equity HGlF Indian underperformed its benchmark, returning 0.8% (share class AC) versus 6%. One reason was our holding of 2.71 % in cash which negatively affected performance despite market volatility. The benchmark has fallen by over 30% since 10 May - when it reached a life-time high - before recovering to within 5% of that high by the end of September. The other reason was our significant underweight in energy which hurt performance, with our underweight in Reliance Industries a key part of that. Sector allocation, including cash, had a negative impact with stock selection contributing the balance. Notwithstanding the sharp underperformance against the benchmark, the fund was ranked 11/36 in its peer group for the six months ended 30 September 2006.
Japanese Equity For the six months ending 30 September 2006 the fund returned -6.6% (share class AC) in Japanese yen terms, ranking in the second quartile over the period. The active Quants strategy of the fund produced small positive gains on stocks selection whereas sector allocation results were negative. These losses essentially stemmed from the underweight in defensive stocks which outperformed in a context where risk aversion was rising. Our long-term outlook for Japanese economies remains sound, with growth potentials still intact. We expect the Japanese equity market to remain undervalued and expect a market rise fuelled by an improvement of micro economic forecasts, in view of earnings releases in October.
Korean Equity The fund delivered a return of -0.1% (share class AC) during the period, performing broadly in line with the benchmark which was flat over the period. Stock selection amongst financials provided positive performance during the period. However, this was offset by weakness in the consumer sector which has suffered on concerns about a slowdown in consumption. Worth noting is that the market's performance was boosted by the strong performance of Samsung Electronics (which comprises 23% of the MSCl Korea), in which we can only hold a maximum weighting of 10%.
Pan-European Equity The fund made a modest gain of I .7% (share class AC) during the review period, outperforming the average fund in the sector but underperforming the FTSE Europe index, which returned 1.1% and 4.1% respectively. This placed the fund in the second quartile, despite the underperformance. The largest negative contribution was from Neste Oil, a Finnish oil refiner. In the third quarter, refining margins fell largely because of technical factors in the US. We expect this to reverse going forward. We own this company because new diesel capacity will boost margins and overall cashflow. Industrials, such as FKI and Heidelberger Druck were weak on market concerns about global growth. Jazztel was weak because Telefonica has slowed the successful connection of new broadband customers. We view this as a timing issue with attractive growth of cashflows expected. Financials performance was positive: in France, our bank holdings rose to better reflect the strength in domestic banking. We also found attractive opportunities in Italian and Greek banking restructuring beneficiaries with Marfin announcing a three-way tie with Laiki and Egnatia banks.
Pan-European Equity High Dividend The fund underperformed its benchmark over the period returning -0.9% (share class AC) versus +3.5% while its peer group returned 1 .I %. The vast majority of the underperformance came in the first three months of the period when investor risk aversion increased due in part to geopolitical risk in May. The fund's holdings in
A - HSBC Global Investment Funds __

companies with exposure to emerging markets (Greek banks for example) and more cyclical companies suffered more than the average. In the last three months, performance has been in line with its benchmark and above its peer group.
Singapore Equity For the six months ending 30 September 2006, the fund underperformed the benchmark and peer group average returning 0.3% (share class AC) versus 7.1% and 5.4% respectively. Performance was hurt by heavy profit-taking in the property sector after strong first quarter performance. Stock selection was also negative for performance with some disappointing profit guidance from small caps, a zero weight in DBS which outperformed and Keppel Corp, which benefited from the buoyant rig-building market. We maintain our bottom- up approach. We continue to have a large exposure to luxury residential developers, due to strong sales and rising prices, and luxury hotels funded by a large underweight in banks. We maintain a substantial allocation to high quality small caps, and high yielding shares.
Thai Equity For the six months ending 30 September 2006, the fund underperformed the benchmark and peer group average falling 4.2% (share class AC) versus declines of 0.5% and 3.7% respectively. The portfolio was negatively impacted by our holdings in underperforming construction companies after Thaksin unexpectedly stepped down from government. Stock selection also hurt performance with some disappointing profit guidance from small caps such as Aapico, and capital restructuring stocks Nakornthai and TPI Polene. We are positive on the Thai market in the medium term, given attractive valuations and the likelihood of interest rate cuts. We expect the market to be volatile in the near term, until investors more clearly see the composition and policies of the interim government.
UK Equity The UK Equity fund fell 0.8% (share class AC) during the review period, underperforming the FTSE All Share index and the average fund in the sector which rose 1.7% and fell 0.2% respectively. The fund was in the third quartile. BAE Systems, a significant holding, was weak over this period largely on Airbus developments. BAE Systems had started the process of selling its 15% in Airbus to EADS when Airbus announced significant problems in the new A380 “super-jumbo” project. This led to a much lower valuation than envisaged earlier. BAE Systems also announced a significant extension of its business with Saudi Arabia. Trading Emissions cost 50 basis points after the price of carbon fell in Q2. Two factors were at play: the apparent over-allotment of carbon credits in Europe; and the withdrawal of Canada as a buyer of credits after a change in government. Daily Mail 8 General Trust underperformed contributing 51 basis points of negative attribution. The advertising market has been tough and there is new competition in the London evening newspaper market. Utilities were strong and the underweight cost 40 basis points. The underweights in BT and Vodafone were also negative over this period. Elsewhere, the fund suffered due to the general shift to more defensive sectors as fears of a global economic slowdown have taken hold. We continue to believe that the valuation of many of the stocks within sectors such as consumer staples, utilities, and property look very unattractive, though in general they have performed well so far this year. In oil & gas, the underweight in Shell added 34 basis points. The underweights in the major materials stocks Anglo American, BHP Billiton and Rio Tinto were also positive. Homeserve, a long standing position in the fund, continues to perform well with the strategy of offering emergency plumbing service policies in the US beginning to pay dividends.
US Equity The fund underperformed the benchmark, returning 3.1 % (share class PD) versus 4.1 %, but outperformed its peer group which saw an average return of 0.3%. The fund was in the second quartile for the period. Sector allocation had a negative impact on the fund’s performance. It suffered from our overweight in growth sectors relative to defensive sectors as risk aversion was rising and investors were switching to defensive stocks. The fund has been also penalised by the oil price drop, which negatively impacted the US oil companies. Stock- picking generated a good performance. It particularly benefited from the selection within the IT sector. The overweight in Freescale, which was taken over by a capital investment fund, was well received by the markets. A significant part of the gain came from our positive bet on Apple as the group released higher than expected earnings. The long-term outlook for US markets remains attractive. We are confident of the US market rebound on the coming quarters. The portfolio maintains a weighting to stocks with positive momentum coupled with attractive valuation.
-A - HSBC Global Investment Funds
-. -

US Index The fund saw top quartile performance over the quarter, rising 3.7% (share class PD) versus 0.3% for the average fund in the sector but slightly lagged the S&P 500 Composite index, which returned 4.1%. US equities were supported by both economic and corporate news during the third quarter of 2006. The Federal Reserve's decision to hold interest rates at their August meeting has met with a degree of relief from investors, helping to keep sentiment positive. Economic data during the period was mostly supportive of the decision and the prospect of rates remaining at their current level in the near-term was a catalyst for equities to move higher. Sharp declines in the oil price in the latter part of the period also resulted in reduced expectations for further monetary tightening. Wall Street's large investment banks, including Goldman Sachs and Lehman Brothers, were among the companies to release stronger than forecast earnings, a trend continued across most market sectors. The S&P 500 has reached a five-year high level over the period. Performance was led by telecoms services, healthcare and information technology while industrials, materials and energy underperformed.
Asia Freestyle The fund outperformed the average fund in the sector for the six months ending 30 September 2006, delivering a return of 4% (share class AC) versus 3.7% for the market. Positive contributions came from our consumer stock picks, as well as our positions in telecom. Our overweight position in technology stocks hurt performance given weakness in the sector during the period. While we may see continued volatility in the markets given uncertainty about the global growth, we believe that the outlook for the Asian market continues to be positive given strong fundamentals and attractive valuations.
ERIC Freestyle For the six month period ending 30 September 2006 the BRlC Freestyle fund returned 2% (share class MIC) compared to 1.4% for the average fund in the sector. Following a strong first quarter and a good start to the second quarter, Global Emerging Markets corrected sharply in early May, falling by 24% to a six-month low in mid-June. The sell-off was prompted by concerns over a deteriorating growth and inflation outlook and fears over the course of interest rates as well as peaking commodity prices. China was by far the best performing ERIC market in the six-month period, rising by 10.8%, whilst Brazil was the worst performing market and fell by 3.7%. During the market falls in May and June we reduced our exposure to India, increased the cash position of the fund and increased our exposure to Russian energy stocks, which continued to benefit from rising energy prices. In the second quarter, as commodity and energy prices began falling we began reducing our Russian exposure in favour of India.
Global Emerging Markets Equity Freestyle The GEM Equity Freestyle fund underperformed the average fund in the sector over the six-month period ending 30 September 2006, falling 0.7% (share class M1C) versus a 0.4% loss respectively. Following a strong first quarter and a good start to the second quarter, Global Emerging Markets corrected sharply in early May, falling by 24% to a six-month low in mid-June. The sell-off was prompted by concerns over a deteriorating growth and inflation outlook and fears over the course of interest rates as well as peaking commodity prices. During the correction, we increased the cash level of the fund and reduced exposure to higher risk markets such as Korea and Turkey. In the third quarter, commodity and energy prices have been falling and we have reduced our exposure to Russian energy stocks in favour of Russian companies geared into the rapidly expanding domestic economy.
Latin American Freestyle The fund was launched on 6 July 2006 and from that date until the end of the September it had a positive performance of 2.2% (share class MIC). Mexico and Colombia showed the strongest performance in the period while Brazil and Argentina had a negative performance. At a sector level, consumer-related stocks substantially outperformed. The fund benefited from the positions in these stocks and from the relatively low exposure to cyclical sectors, which saw negative performance in the period. Political news dominated the scenario with elections in Mexico and the campaign for presidential election in Brazil. The result in Mexico was favourable for the domestic markets. In Brazil, the major pillars of the economic policy should continue independently of who wins the elections. Macro fundamentals across Latin America are better than in the past with low inflation, well underpinned economic growth and current account surpluses. The biggest risk is a stronger than expected slowdown in economic growth, although we expect that domestic drivers will provide an economic underpin.
I
I
HSBC Global Investment Funds _.

UK Freestyle The fund has fallen by 0.4% (share class MID) during the past six months, underperforming the average fund in the sector which fell 0.2%. The FTSE All Share gained 1.7% over this period. This was clearly a period of disappointing performance. BAE Systems, a significant holding, was weak over this period largely on Airbus developments. BAE Systems had started the process of selling its 15% in Airbus to EADS when Airbus announced significant problems in the new A380 "super-jumbo" project. This led to a much lower valuation than envisaged earlier. BAE Systems also announced a significant extension of its business with Saudi Arabia. Daily Mail & General Trust fell 12%. The advertising market has been tough and there is new competition in the London evening newspaper market. BP fell 11% over the six months. While Brent crude fell 16% in sterling over this period, the company had some significant pipeline problems in Alaska that constrained production. We view these as temporary issues and believe the company is fundamentally attractive. Alpha Pyrenees fell in May after rising in the first quarter post its IPO. Investors have been concerned about the pace of investment for this new property company. This is largely an issue of timing. The strongest contributions were from Inchcape, HBOS and Legal & General.
Brazil Bond From its inception on June 1 st to September 30th 2006, the fund returned 7.76% ( share class AD) in US dollar terms. The main drivers for the good performance were the local interest rates, which remain attractive despite several reductions by the Central Bank, and the strength of the local currency, supported by healthy current account figures. The fund maintains its strategy of keeping low duration, investing in floating rate Brazilian Treasury Notes and in floating rate CD's issued by banks of high credit quality. Our outlook for the Brazilian economy remains positive, given the benign external environment, and this should continue to have positive effect on the local currency.
Euro Corporate Bond For the six month ending 30 September 2006, the fund returned 1.8% (share class AC), underperforming its benchmark, which returned 2.3% but outperforming its peer group mean, placing it in the top quartile over the period. The reporting period was characterised by high interest rate volatility and some pockets of weakness for credit spreads. Our slight short duration bias versus the benchmark and our pronounced underweight in high yield due to expensive valuations therefore prevented a better performance. The positioning towards flatter yield curves and the strong emphasis on subordinated financial and non-financial paper, however, was successful. Our main focus was on the primary market, but we also made use of the volatility in subordinated paper and longer-dated telecoms, where we increased our exposure during times of weakness. Due to supportive fundamentals and technicals, we expect investment grade spreads to remain range-bound in the fourth quarter, while lower rated high yield spreads should widen due to expensive valuations. While we went underweight in the auto sector at the beginning of October, our main focus will be on the avoidance of single name underperformers for the remainder of the year.
Euro Credit Bond For the six months ending 30 September 2006, the fund returned 1.6% (share class AD), underperforming the benchmark, which returned 1.9%. A short duration position was in place until mid-July, which was changed to a long position via options in August and this was positive for performance. Our credit strategy focused on fundamental selective stock-picking, which was also positive. However, our sector selection, with an overweight in sub financials and telecoms, was negative. Equities are high; implied volatility and default rate are in the range of historical lows and third quarter earnings seem set to record another double digit rise. This cannot be bad news for credit in the short term and we remain slightly overweight.
Euro Investment Grade Bond For the six months ending 30 September 2006 the fund returned 1.8% (share class AC), underperforming slightly the LE Euro Aggregate Bond Index, which gained 2%. The main contribution to the fund performance in the last six months was the duration positioning. The fund was positioned short against the benchmark duration in the ten-year area during the spring and benefited from a sharp rise in European yield during this period caused by the strengthening of the Eurozone economy. We returned to neutral for a short period and during the summer we positioned the fund long versus benchmark in the ten-year area, anticipating a cooler economy. Our selective approach in credit, rather than a strategic approach, also added to performance.
I
HSBC Global Investment Funds

Directors' Report (continued) __
Euro Investment Grade Corporate Bond For the six month ending 30 September 2006, the fund returned 1.7% (share class AC), underperforming its benchmark, which returned 1.9%, but outperforming its peer group mean, placing it in the top quartile over the period. During the reporting period, which was characterised by high interest rate volatility and some pockets of weakness for credit spreads, our slight short duration bias versus our benchmark prevented a better performance. The positioning towards flatter yield curves and the strong emphasis on subordinated financial and non-financial paper, however, proved successful. Our main focus was on the primary market, but we also made use of the volatility in subordinated paper and longer-dated telecoms, where we increased our exposure during times of weakness. Due to supportive fundamentals and technicals, we expect investment grade spreads to remain range-bound in the fourth quarter. While we went underweight in the auto sector at the beginning of October, our main focus will be on the avoidance of single name underperformers for the remainder of the year.
Euro High Yield Bond For the six months ending 30 September 2006 the fund returned 2.6% (share class AC) versus 3.1% for the benchmark. The fund maintained its investment policy focused on careful credit analysis of bond issuers. It did not experience any significant capital loss due to credit quality deterioration. On the other hand the fund benefited from the continued positive environment for Euro High Yield bonds: the default rate remains historically low and investors' appetite for high yielding assets is high. Going forward we expect the default rate to rise slightly but overall fundamental and technical factors should remain supportive for the Euro High Yield market.
Global Emerging Markets Bond For the six months ending 30 September 2006 the fund returned 3.3% (share class AC) ! underperforming the JP Emerging Market Bond Index, which gained 4.3%. The fund's entire underperformance came in two months (June and August), as the account maintained a strategy of being underweight duration, while overweight higher-beta credits and commodity-related sovereigns. The fund's year-to-date performance remains above the benchmark (6.02% versus 5.80%) and the account is now fully invested.
Global Investment Grade Bond For the six months ending 30 September 2006 the fund returned 3.9% (gross of fees), underperforming the Lehman Global Aggregate benchmark, which gained 4.6%. The main reasons for the fund's underperformance were its underweight stance towards shorter duration Japanese government bonds, which performed well during the third quarter, and its underweight position in the US dollar, which rallied during the summer. These negatives were partly offset by positive contributions from sector allocation (primarily corporates and emerging markets) and security selection, for example GM and Time Warner. The fund remains positioned to take advantage of the potential outperformance of US Treasuries relative to European and Japanese bonds, which we anticipate due to a divergence in growth prospects and monetary policy. It is also structured to generate more yield than its benchmark, as it remains invested in higher-yielding bonds in both developed and developing markets.
Pan-European Government Bond For the six months ending 30 September 2006 the fund returned 2.3% (share class AC), slightly underperforming the JP Morgan Europe Gvt Bonds Index, which gained 2.4% but coming top quartile against its peer group. Primarily, the fund strategy focuses on active duration, yield curve and currency management in investment grade debt securities issued or sponsored by European Government and secondly seeks to enhance returns through tactically investing in EUlEurozone countries' debt. While duration and curve management strategies were positive for the fund performance, investments in Eastern European countries were negative for performance and explain the relative's fund underperformance.
Sterling Investment Grade Bond The fund has risen by 1.6% (share class PC) during the review period, comfortably outperforming the benchmark IBOXX index, and ahead of the average fund in the sector, seeing top quartile performance over 3, 6 and 12 months. The fund benefited from its underweight position in duration as the market fell and we took profits, switching to an overweight position in June. Performance continued in the second quarter as gilts rallied and we closed our overweight to a neutral position at the end of September. The fund's underweight credit position and especially the decision to hold no telecoms bonds paid off in the third quarter. The fund currently
HSBC Global Investment Funds A- -

Directors’ Report (continued) .. .
has a neutral stance on bond yields, as likely interest rate developments seem fully priced. At the same time, we have used the sell-off in credit markets to rebuild some positions but remain slightly defensively positioned.
US Dollar High Yield Bond During the six months to the end of September 2006, the fund underperformed the Merrill Lynch Global High Yield US Master II Index, returning 2.7% (share class AC) versus 4.2%. It performed broadly inline with the average fund in the sector, which returned 2.9%. The main reason for its underperformance relative to the index can be attributed to its underweight to the automotive and the broadband sectors, which both rose around 10% over the period. This was offset somewhat by its overweight to the CCC-rated sector, which rose by 6.67% outperforming their higher-rated counterparts, B and BE-rated assets.
During the six months, a decline in Treasury yields and the failure of issuance volumes to match market expectations drove high yield spreads tighter. In September, total returns for the asset class were above 1 YO for a second consecutive month. With Fed policy now seemingly on an extended pause, probability of a rise on volatility by year-end has decreased.
Our outlook for the remainder of 2006 is cautiously optimistic. We expect to see sustained economic growth, low default rates, and constructive capital markets. Although wider spreads are an eventual certainty, we believe that strong fundamentals and technicals will lead to a prolonged period of compressed spread levels. In terms of industries, we remain positive on the energy, gaming, wireless and cable sectors.
US Dollar Investment Grade Bond The HGlF USD Investment Grade Fund had its benchmark changed from the Citigroup U.S. Government Bond Index to the Lehman U.S. Aggregate Index on 1 September 2006. For the five-month period ending August 31 the fund outperformed its benchmark by 15 basis points (share class AC). The fund benefited from an overweight in corporate and securitised debt relative to benchmark. Both sectors provided strong excess returns relative to U.S. Treasuries and Government Agencies. The portfolio’s short duration positioning detracted from performance as yields on average moved 10 basis points lower along the yield curve. For the month of September the fund outpaced the Lehman U.S. Aggregate Index by 11 basis points. Once again, overweights in the corporate and securitised debt sector provided incremental performance which more than offset the negative impact of having been slightly short duration as yields continued to move approximately 10 basis points lower across the curve.
Euro Reserve The fund returned 1 . I YO (share class AC) for the six-month period ending 30 September 2006, in line with the Standard & Poor peer group and underperforming its benchmark. The ECB policy of increasing the refinance rate has been the main driver of performance. The strategy of the fund remains unchanged and cautious, investing in very short term papers (with under 3-month maturities) to benefit from short-term rate increases. Investment is also done to privilege issuers with the best rating while ensuring enough liquidity.
US Dollar Reserve The portfolio continues to fall short of benchmark, but performed in line with the average fund in the sector returning 2.4% (share class AC) versus 2.3%. The main negative was that commercial paper rates have been steady as interest rates have been steady for the quarter. We continue to purchase short-dated commercial paper in order to preserve the principal of the portfolio and are starting to extend it out to the end of the fourth quarter. We continue to look at floating rate notes that are attractive and fit the funds weighted average maturity as well as keeping issuer names below 5%. The spread between commercial paper yields and Libor remains relatively wide. As the Federal Reserve did not raise rates in September, for the next meeting on October 25th, we expect it to keep rates steady, as the economy has slowed down while job growth has grown but not as expected. As the third quarter of 2006 drew to a close, the Fed Funds target remained at 5.25%. The New York team feels that the Fed Reserve will continue to take a “Data Dependent” stance, as the price of new homes and cooling down of the economy continues. Inflation is still an issue that is monitored carefully. We continue to ladder maturities in the portfolio. We continue to look at commercial paper in the 30 - 90 day area, as well as floating rate notes which will give the portfolio income. We also look to purchase corporate notes rated single A or better.
HSBC Global Investment Funds

-
Directors' Report (continued) -
Turkish Convergence The fund has fallen by about 14% (share class AC) during the review period, performing in line with the average fund in the sector but outperforming the benchmark index which fell around 15%. The main reason for the fall in returns was a severe depreciation of TRY and a sell-off in Turkish assets, mostly related to a distortion of the disinflationary trend and increasing political risks, coupled with the significant correction in EM seen in May and June. During May and June the fund was adversely affected from the sell off and because of the long term bond positions, underpetformed the benchmark. However, in the last three months significantly outperformed, which led to a total of 1% outperformance over the last six months. Stock selection was the strongest contributor to performance. Our underweight position in banks and energy stocks helped reduce the loss during the retreat, While overweights in food and staples retailing and tactical long positions in telecoms added value during bounce back. The current account deficit is still widening and consumer price inflation is still very distant from the targets. Furthermore, it is no secret that Turkey-EU relations are getting worse and probably won't get better until the EU leaders summit in December. However, as of early October global risk appetite is likely to be on the rise and given the high level of interest rates (above 20%) Turkish debt market prices a big portion of the risks and is attracting a lot of foreign portfolio investments. Considering the strong positioning of foreigners, the bigger risk remains as a sudden rise in risk aversion due to a probable US-led global recession. We believe in the short run volatility will remain but especially local bonds offer good value for patient investors. The fund is likely to favour fixed income to equities and increase exposure to long duration bonds as and if further yield increases arise.
HSBC Global Investment Funds

.- A

Statement of Net Assets as at 30 September 2006 -
Equity Sub-Fu-nds CONSOLIDATED ASIA EX JAPAN ASIA EXJAPAN ASIA PACIFIC EX
USD EQUITY EQUITY SMALLER JAPAN EQUITY USD COMPANIES HIGH DIVIDEND
USD USD
Portfolio at Cost 15,755,719,066 384,489,399 21,898,503 146,684,097 8,171,580 Unrealised Appreciation/(Depreciation) 3,380,344,478 110,032,702 5,382,047
-
Portfolio at Market Value
Cash at Bank Receivable from Brokers Payable to Brokers Receivable from Shareholders Payable to Shareholders Other Assets Other Liabilities
19,136,063,544
1,000,525,901 142,927,097
(1 83.201 ,I 29) 110,928,287 (130,915,640) 64,337,199 (59,324,752)
. .~
494,522,101
37,803,684 826,260
(7,351,791) 4,003,520 (1,278,170) 752,829 (807,739)
- .. .- 27,280,550
2,204,711 33,494
(1 78,673) 18,514
(190,121) 42,802 (42,945)
. .~ 154,855,677
556,585 243,975
-
60,208 (750,966) 325,836 (264,171 )
Total Net Assets 20,081,340,507 528,470,694 29,168,332 155,027,144
The accompanying notes form an integral part of these financial statements.
HSBC Global Investment Funds

Statement of Net Assets as at 30 September 2006 -~
-
BRAZIL EQUITY BRlC MARKETS BRlC MARKETS CHINESE EQUITY EMERGING EUROLAND EQUITY USD USD EQUITY USD EUROPE EQUITY EUR
USD EUR
489,481,096 187.293.994 63,981,290 2,423,025,878 20,986,054 421,797,918 33,251,196 24,781,440 1,864,784 779,402,636 (244,122) 25,104,754
522,732,292 21 2,075,434 65,846,074 3,202,428.514 20,741,932 446,902.672 7
~
-
59,219,348 7,712.080
(8,481,902) 13,771,817
(1 2,312,095) 946,531
(907,578)
I
2,433,323 11,082,748 8,640,078
(5,060) 5,441,300
(11,418,724) (14.1 04) 546,154 79,937
(220,085) (84,737) ..
197,630,897 7:001,594
(28,790,555) 28,515,910
(12,011,260) 10,548,548 (4,758.549)
608,391 1,980,872
(1,049,547) 21,346
(1 8,553) 152,085 (33,795)
1,122,311 7,538,301
(3,644,208) 348,498
(969,020) 973.315
(642,629) --
582,680,493 - 21 2,056.1 80 82,346,158 3,400,565,099 22,402,731 451,629,240
HSBC Global Investment Funds

Statement of Net Assets as at 30 September 2006
Portfolio at Cost Unrealised Appreaatton/(Depreciatton)
Portfolio at Market Value
Cash at Bank Receivable from Brokers Payable to Brokers Receivable from Shareholders Payable to Shareholders Other Assets Other Liabilities
Total Net Assets
EUROLAND EQUITY EUROLAND VALUE -SUSTAINABILITY EUROPE EX UK SMALLER CREATION LEADERS EQUITY
COMPANIES EUR EUR EUR EUR
.. ~. .
51,904.253 99,647,276 14.628.807 66.977.91 8 9,930,909 7,924,817 1,309,481 15,025,011
. ..
61,835,162
926,155
153,386 (349.649)
61,657 (75,443)
-.
107,572,093
2,039,398 -
10,218 (25,983) 31,389
(228,241 ) ~.
15,938,288
231,151
27,990 (33,959)
-- .
82,002,929
1,066,324 489,750
(390,642) 839,847
(251,500) 483,909
(120.297) -. -
84,120,320 -
16,163,410 ..
62,551,268 109,398,874
The accompanying notes form an integral part of these financial statements.
L- HSBC Global Investment Funds -. -. ..

- ~ ~.
Statement of Net Assets as at 30 September 2006 ~~~ .~ ~
~- .~
HONG KONG EMERGING USD SRI TECHNOLOGY EUROLAND EQUITY EQUITY
MARKETS EQUITY USD USD EUR USD
GLOBAL GLOBAL EQUITY GLOBAL EQUITY GLOBAL EQUITY GLOBAL EX
USD .~ I
11,148,996 6,495,827 44,430,293 140,068,427 I 21 9.31 4,669 135,954,826 32,070.278
251,384,947
16,004,951 2,001,242 (4,001,711)
186.854 (145,221 ) 707,941 (402,933)
.- 23,328,805
159,283,631 ~. .
1,326,829
12,475,825 ~~
1,235,354 1,041,050 (1,437,922)
53,970 (389,104) 392,938 (89,393)
3,778
30,497 (3,720)
- 587,043 6,177.509 -
7,082,870 50,607,802
42,776 4,524,796 ~.
2,351 28.1 36 (24,701 ) (1 30,123) 12,466 118,884
(32,530) (I 0,343) ~-
43,815,914
183,884.341
7,514.897 1,914,922
3,930,846 (752,591) 670,420 (1 86,310)
~~
~-
(1,000.1 01)
195,976,424 ~-
55.1 16,965 . -
265,736,070 160,090,524 12,650,867 7,105,419 +
. .& .~ HSBC Global Investment Funds
I--

- - -~
Statement of Net Assets as at 30 September 2006
INDIAN EQUITY JAPANESE EQUITY KOREAN EQUITY PAN-EUROPEAN USD JPY USD EQUITY
EUR
Portfolio at Cost Unrealised Appreciation/(Depreciation)
Portfolio at Market Value
Cash at Bank Receivable from Brokers Payable to Brokers Receivable from Shareholders Payable to Shareholders Other Assets Other Liabilities
Total Net Assets
- . -
-
3,798,249,838 31,613,718,911 130,847,702 636,401,816 13,274,161 76,422,502 1,501,326,880 6,060,146,185
37m,a65,096 144,121,863 71 4,824,318 5,299,576,718
98,282,126 2,352,063,405 7,508,470 1,313,285 21,817.21 1 1,320,540 2,958,012 (45,991,315) (6,684,2 1 9) (21 7,441 ) 25,407,052 59,846,530 1,290,114 613,684 (21.793,024) (973,926,225) (598,226) (51 55,240) 8,096.277 169,605,981 9,567 3,708,990 (7,704,117) (95,022,018) (174,047) (880,198)
5,377,690,928 39,186,432,769 146,794,062 71 7,165,410
-
The accompanying notes form an integral part of these financial statements.
~
HSBC Global Investment Funds

..
Statement of Net Assets as at 30 September 2006 _
_. . _- __ .
PAN-EUROPEAN SINGAPORE THAI EQUITY UK EQUITY US EQUITY US INDEX EQUITY HIGH EQUITY USD GBP USD USD
DIVIDEND USD EUR
._
69,777,421 22.046.702 21 5,740,815 129,973,042 178,965,642 30.825.978 2 560,756 3,202,588 (8,159,254) 15,053,414 15,707,187 7.41 5,751
72,338,177 25,249,290 207,581,561 145,026.456 194,672,829 38,241 -729 I--:.
-..
1,472,807 1,800,432 7,015,988 6.514.535 11,376,251 241,759 1,379,307 914,551 1,776,383 293,993
50.727 634,87 1 3,261,693 653,549 85.964 2,585 (263,716) (1 45,564) (2,708,329) (1.052,610) (660,694) (308,819) 184.282 9.309 717.583 746,936 519,842 64,797
(1 ,I 80,245) (566,347) (151 4,961 )
(1 04.997) (30,423) (314,491) (21 0,770) (609,310) (21,009) . -.
73,876,342 27,517,915 215,902,209 151,939.51 8 205,3a4,aa2 38,515,035
HSBC Global Investment Funds

TJilEiEL Statement - ._
of Net Assets as at 30 September 2006 - . -_ -
.. Freestyle Sub-Funds ASIA FREESTYLE BRlC FREESTYLE GLOBAL LATIN AMERICAN
USD USD EMERGING FREESTY LE MARKETS EQUITY USD
FREESTYLE USD
Portfolio at Cost 229,727,329 2.245.460,954 1,211,810,123 15,586,501 429,927 Unrealised Appreciation/( Depreciation) 31,919,037 463,912,031 22,066,007 _ - -
Portfolio at Market Value
Cash at Bank Receivable from Brokers
261,646,366 2,709,372,985 1,233,876,130 16,016,428
19,005,614 330.51 1,922 85,210,553 2,956,052 6,631,925 43,286,993 11,570,045 161,720
Payable to Brokers (10,981.21 6) (2,321,217) (19,582,111) (368.1 14) Receivable from Shareholders 1,372,792 2,319 1,814,112 Payable to Shareholders (1,544,282) (33,500,727) (6,141.750) Other Assets 539,804 7,669.1 26 2,136,713 Other Liabilities (616,428) (34,278.61 6) (2,178,439)
448,640
21,545 (20.800)
I
19,215,471 __ Total Net Assets 276,054,575 3,020,742,785 1,306,705,253 .- - ._ -
The accompanying notes form an integral part of these financial statements.
HSBC Global Investment Funds - . . _- ~
- ...
Statement of Net Assets as at 30 September 2006 - - ~.
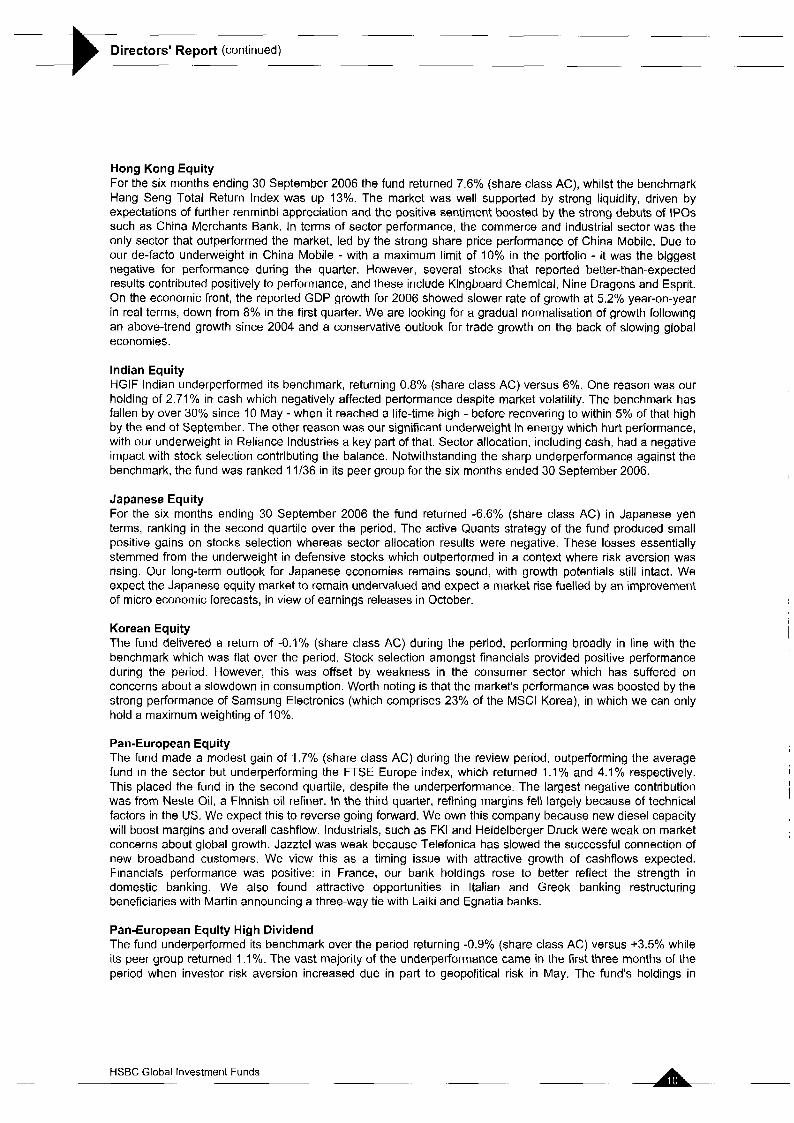
Bond Sub-Funds .-__ - . .... I uK-FREESTYLE BRAZIL BOND EURO CORPORATE EURO CREDIT 1
GBP EURO EURO
USD BOND BOND INVESTMENT INVESTMENT EUR EUR GRADE BOND GRADE
EUR CORPORATE BOND EUR
10,667,420 5,012.247 48,770,919 48,350,749 169,196,559 9,956,716 1,014,626 400,028 (1,066,426) (702,504) (888,348) (311,691)
11,682,046 5,412,275 47,704.493 47,648,245 168,308,211 9,645,025
190,986 155.954 3.169.a22 1,663,296 5,090,762 835,951 281,640 224.091 364,674 1,298.496 57,551
(530.876) (1,775,341) (2,3 I 2,350) (212,492) 29,806 32,228 244,098 14.106
(4,360) (2,576) (174,497) (609,930) 69,479 1.018 1,013,950 1,207,212 3,806,443 221.871
(12,839) (1.305) (85,257) (85,731) (1 25,871 )
1 (1 17.1 06)
(9,274)
12,119,652 5,565,366 51,496,223 4a,aso,oa6 175,699,859 10,552,738
~.
HSBC Global Investment Funds A

Statement of Net Assets as at 30 September 2006
Portfolio at Cost Unrealised Appreciationl(Depreciati0n)
EURO HIGH YIELD GLOBAL GLOBAL PAN-EUROPEAN BOND EMERGING INVESTMENT GOVERNMENT
EUR MARKETS BOND GRADE BOND BOND USD USD EUR
70,314,757 101,260,243 95,276,051 148,728,373 1,614,069 2,493,058 937,063 102,997
Portfolio at Market Value 71,928,826 103,753,301 96,213,114 148,831,370
Cash at Bank Receivable from Brokers Payable to Brokers Receivable from Shareholders Payable to Shareholders Other Assets Other Liabilities
123,264 3,038.701 17.147.478 566,382 247,327 547,270 61,175 437,884
(6,565,358) (134,625) 104,969 1,083,337 107,164 564,336
(388,358) (593,373) (82,147) (402,530) 1,588,928 1.844.373 562,136 2,731,075
(89,985) (93,083) (75,050) (1 17,990)
Total Net Assets 73,514,971 109,580,534 107,368,512 152,475,902
The accompanying notes form an integral part of these financial statements.
HSBC Global Investment Funds . . . . . ___

Statement of Net Assets as at 30 September 2006 ~ .
Other Sub-Funds STERLING US DOLLAR HIGH US DOLLAR EURO RESERVE US DOLLAR TURKISH
INVESTMENT YIELD BOND INVESTMENT EUR RESERVE CONVERGENCE GRADE BOND USD GRADE BOND USD EUR
Reserve Sub-Funds .
GBP USD ... .
30,594,092 (44,578)
30,549,514 . . . -. .
5,183.035 67,461,758 425,706
5,227,066 67,887,464 ..
44,031 51,915,528
38,007
51,953,535
761,149 287,500 (301,074) 15,973
(229,857) 482.938
17.21 1 1,144,600 978.805
(9,379,88 1 ) 16,360
(1 67,530) 1 1 1,146 571,767
762,780
(5,031 -604) 9,206,149 (61,768) 413,751
18,315,399 46,363,963 (1,506,519)
18,362.353 44,857.444
1,629,248 8,921,059
(697,840) (3,381,138) 1,577.625 393,607 (657,585) (702,818) 11,236 1,027.41 1
.. 46,954
-. .
(381,865) (I ,073) (27,873) (205,568) (7,934) 149,838
31,184,270 5,354,350 61,023,712 57,037,275 20,217,103 51,265,403
HSBC Global Investment Funds

.... ..
Key Figures as at 30 September 2006 ... .- -
Equity Sub-Funds CONSOLIDATED ASIA EX JAPAN ASIA EX JAPAN ASIA PACIFIC EX
USD EQUITY EQUITY SMALLER JAPAN EQUITY USD COMPANIES HIGH DIVIDEND
USD USD I
CLASS A C (see note 3) Number of Shares Outstanding N ‘A 4657 347537 76 552 170 645 416 589 Net Asset Value per Share N ‘A 37 69 22 50 11 89
CLASS A C H (see note 3) Number of Shares Outstanding N ‘A 1 161 293 995 NIA NIA
NIA - Net Asset Value per Share N ‘A 16 73 NIA
Number of Shares Outstanding N ‘A 6505799981 I252602815 8730324631
-~ .-
CLASS A D (see note 3)
- N A 35 85 21 91 11 20 Net Asset Value per Share CLASS A D H (see note 3)
- -
Number of Shares Outstanding NiA 20,068.1 03 N/A N/A -..
N.A 16.67 .- . .. Net Asset Value per Share CLASS E C (see note 3) Number of Shares Outstanding N;A NIA N/A
NiA NIA NIA Net Asset Value per Share CLASS E D (see note 3) Number of Shares Outstanding N;A 77.631 008 N/A
N /A Net Asset Value per Share .. NiA
... .
. - 35.47 . .
CLASS I C (see note 3) Number of Shares Outstanding NJA 1,383,872.049 N/A .. Net Asset Value per Share CLASS I D (see note 3)
NIA
NIA NiA
NIA N/A
NIA NIA . . ..
NIA NIA
36.39 N/A
Number of Shares Outstanding NIA NIA N/A 4,152 089 000 Net Asset Value per Share N/A NIA NIA 11 46
CLASS J 1 C (see note 3) Number of Shares Outstanding NiA NIA NIA NIA
NIA NIA NIA NIA Net Asset Value per Share _ _ - CLASS M 1 C (see note 3) Number of Shares Outstanding NIA N /A N/A NIA Net Asset Value per Share NiA N/A N/A - N/A
Number of Shares Outstanding NIA N/A N/A N/A NIA N/A N ’A N/A
CLASS M 1 D (see note 3)
Net Asset Value per Share CLASS M 2 C (see note 3) Number of Shares Outstanding Net Asset Value per Share CLASS M 2 D (see note 3) Number of Shares Outstanding Net Asset Value p>r Share CLASS P C (see note 3) Number of Shares Outstanding Net Asset Value per Share CLASS P D (see note 3) Number of Shares Outstanding Net Asset Value per Share - CLASS W C (see note 3) Number of Shares Outstanding
-.
-
NIA
N/A N/A
NIA NIA
NIA N/A
N/A N/A . -
N/A NIA N/A N/A NIA N/A - .
NIA NIA NIA NIA NIA NIA -
NiA N/A NIA N/A N/A N/A
N/A N/A N/A N /A N/A N/A . . ..
NIA N/A N/A N/A - NIA N/A NIA ._
Net Asset Value per Share CLASS W D (see note 3) Number of Shares Outstanding N/A N/A NIA NIA
NIA Net Asset Value per Share N /A NIA NIA - - CLASS 2 C (see note 3) Number of Shares Outstanding N/A 849,126 130 NIA NIA Net Asset Value per Share N/A 39 07 N/A NIA -- CLASS 2 D (see note 3) Number of Shares Outstanding NIA 379 900 559 N /A 181.720011 Net Asset Value per Share N/A 35 90 N/A 11 21
HSBC Global Investment Funds - ~

. . . . . . . .-
Key Figures as at 30 September 2006 . _ -. . . . . . ..
BRAZIL EQUITY BRlC MARKETS BRlC MARKETS CHINESE EQUITY EMERGING EUROLAND EQUITY USD USD EQUITY USD EUROPE EQUITY EUR
USD EUR
14,334 751 289 N/A 3 388 517 342 10,926 319 384 1 141178130 13994908539 N/A 10 50 51 49 12 51 29 47 . . _. 23 35
N/A N/A NIA NIA N/A N/A N/A N/A NiA NIA N /A N /A
5,966,951.429 N/A 121 426 885 49 173.591 699 92,003.751 1,284,546.343 10 50 50 73 12 51 29.40
N/A N/A NIA NIA N/A N /A NIA N/A N/A N/A N/A
10,784.358 NIA 43,682 054 454.766 517 NIA N /A t k ........ 23.28 NIA 10.48 51.09 N/A N/A
. . . . ......
.... ............ . 23.25 NIA
~. .- ......... ..... NIA ..
NIA NIA N/A NIA N/A NIA NIA NIA NIA NIA
1,344,649 089 NIA 125.000.000 3,696.253.427 347.000.000 12.59 . . . ... ....... ... 23.48 NIA 10.50 52.01
9.947.773 29.22
NIA N/A
2,756 816 349 NIA N/A 282 184 251 207 000 000 N/A NIA - .. 23 48 NIA N/A 52 01 12 59 .. c
N/A NIA 4,155.470 867 N/A NIA NIA I. N/A N/A 10 52 N/A NIA NIA .-
N/A NIA NIA NIA NIA N/A NIA NIA N/A NIA
NIA NIA NIA N/A N/A NIA NIA N/A N/A NIA . . _.
NIA NIA NIA NIA N/A NIA NIA NIA NIA NIA N/A N/A - .....
NIA NIA N/A N/A NIA N/A NIA NIA N IA NIA NIA NIA
................
NIA NiA NIA N/A NIA NIA NIA N/A NiA N/A NIA NIA -.
N /A N/A NIA NiA NIA NIA NiA NIA N/A NIA NIA N/A ._ . _
N/A N/A NIA NIA NIA NIA NIA NIA NIA N/A NiA NIA .- __ . . . ..... .........
N/A NIA NIA NIA N/A N/A NIA NIA N:A NIA N/A N/A ..
523.479 259 12 097.456 000 N/A 370,162 000 NIA 38.781 3 3 1 17 53 N/A 51.92 NIA 31.19 . . . . .
24.24
NIA NIA
N/A NIA
N/A 1.758.007.1 32 NIA 51 3 2
NIA NIA
NIA NIA
HSBC Global Investment Funds -. .. L

_._ . .
Key Figures as at 30 September 2006
I
EUROLAND EQUITY EUROLAND VALUE SUSTAINABILITY EUROPE EX UK SMALLER CREATION LEADERS EQUITY
COMPANIES EUR EUR EUR EUR
CLASS A C (see note 3)
Net Asset Value per Share CLASS A C H (see note 3)
Number of Shares Outstanding 1 124,495.876 N/A N/A 16.295 791 38.43 N/A N/A 20.29
~ ....... -. ..........
Number of Shares Outstanding NIA N/A N/A NIA
Net Asset Value per Share NIA N/A N/A NIA
CLASS A D (see note 3)
Net Asset Value per Share CLASS A D H (see note 3)
Number of Shares Outstanding 39.037.915 N /A NIA 4 174.465 732 20.07 - ~
38 43 NIA NIA .~ . . . . . . . . . . . .
Number of Shares Outstanding N/A NIA NIA NIA
Net Asset Value per Share N/A NIA NIA NIA . . ..
CLASS E C (see note 3) Number of Shares Outstanding N/A NIA NIA NIA
Net.Asset Value per Share N/A NIA NIA NIA
Number of Shares Outstanding N/A N/A N/A N/A
Net Asset Value per Share N/A NIA NIA N/A
CLASS E 0 (see note 3)
CLASS I C (see note 3) Number of Shares Outstanding 296,300 000 N/A N/A N/A
38.48 N/A N/A N/A ~ Net Asset .... Value per Share . - ...
CLASS I D (see note 3)
Net Asset Value per Share CLASS J I C (see note 3)
Number of Shares Outstanding NIA N/A N/A N/A NIA N/A N/A NIA
-. .- .. ....
Number of Shares Outstanding NIA NIA NIA NIA
Net Asset Valueper.Share N/A NIA NIA NIA
Number of Shares Outstanding N/A 8.166.323.103 584,393 620 NIA
Net Asset Value per Share N/A 13 11 11 15 NIA
. . . . .
CLASS M 1 C (see note 3)
-. .
CLASS M 1 D (see note 3) NIA Number of Shares Outstanding N/A 160.462.240
Net Asset Value per Share N /A 13.16 11 23 NIA 859.007 104
___. ... . ..
CLASS M 2 C (see note 3) Number of Shares Outstanding N /A N/A N/A NIA Net Asset Value per Share-. NIA NIA NIA N/A
Number of Shares Outstanding NIA N/A N/A N/A NIA Net Assetvalue per Share NIA
CLASS P C (see note 3) Number of Shares Outstanding NIA NIA NIA NIA Net Asset Value per Share N/A NIA N /A NIA
....
CLASS M 2 D (see note 3)
-- N/A N/A - - .- - - .....
.....
CLASS P D (see note 3) Number of Shares Outstanding NIA NIA NIA NIA
Net Asset Value per Share N/A NIA NIA NIA - .. . . . . . . . ...
CLASS W C (see note 3) Number of Shares Outstanding N/A NIA NIA NIA
Net Asset Value per Share N/A NIA NIA NIA ....
CLASS W D (see note 3) Number of Shares Outstanding NIA N/A N/A NIA Net Asset Value per %a& NIA N/A N/A N/A
Number of Shares Outstanding 158.672.038 N IA N/A N/A 40.57 N /A N/A N/A
Number of Shares Outstanding NIA NIA NIA NIA Net Asset Value per Share N/A NIA NIA NIA
........ - CLASS 2 C (see note 3)
Ne! Asset Value per Share CLASS 2 D (see note 3)
~ .......
HSBC Global Investment Funds

-- .
Key Figures as at 30 September 2006 __
...
GLOBAL GLOBAL EQUITY GLOBAL E Q U . GLOBAL EQUITY GLOBAL EX HONG KONG EMERGING SRI TECHNOLOGY EUROLAND EQUITY EQUITY
MARKETS EQUITY USD USD EUR USD
...........
1,013 348.642 23,284 841 69,282.753 23.904.568 836.650.187 22.518.486 14.20 25.01 14 25 21 63 20.67 83.63 I -
NIA N/A NIA N:A NIA N /A NIA NIA NiA N/A NIA NIA
.- - ........
15.933 470.743 1,743.569.716 6.626.226 1,814,014.326 1.673.759 43,510 662 14.05 25.01 14 24 3.62 20.67 80.69 ... .
N/A NIA NIA NIA N /A NIA NIA NIA NIA N/A .
383.009.949 N/A NIA NIA NIA N/A 13.73 NIA NIA NiA NIA N /A - +-
I 4,695 775 N/A NIA 4.500 000 NIA N/A 13.67 N/A N!A 3 53 NIA N/A .... r
1,416.879.428 14.26
N/A N/A
NiA NIA
NiA NIA
NIA NIA .
N /A N/A
1 NIA NIA NiA NIA N/A N/A N/A N/A N:A NIA NIA N/A .....
NIA NIA N iA NIA N/A N/A NiA NIA N/A N /A N/A NIA ~. -.
NIA NIA NiA NIA N /A N/A N/A NIA NIA NIA N/A NIA .. ~ . .
NIA NIA N/A N /A N/A NIA NIA NiA N/A N/A NIA NIA - ._
NIA N/A N/A N/A NIA N ‘A NIA N ,A NIA NIA - .
NIA NIA NIA NIA NIA N/A N/A N/A NIA NIA NIA N/A
1 :;: ~ _. -
I N /A N/A NIA NIA NIA N/A N /A N/A
.- NIA _ _ NIA N/A NiA ._
I N/A N/A NIA NIA NIA 2.032 794 088 NIA N/A NiA NIA NIA 79 68 I
N/A NiA 29,532 840 NIA N/A NIA NIA NIA 14 73 NIA N/A NIA
NIA NIA N/A N/A N/A NIA NIA NIA N/A NIA N/A NIA .- - . ........
NIA NIA 760 200 502 NIA 1 728,576 737 N/A N/A NIF. NIA 14 65 NIA 21 86 .-
135 414 439 4,331.990.946 14 08 26.75
N/A NIA
NIA NIA
NIA 344 350.312 NIA 83.10
HSBC Global Investment Funds .. - . . .

Key Figures as at 30 September 2006 -_ ~ - .-
. .~
INDIAN EQUITY JAPANESE EQUITY KOREAN EQUITY PAN-EUROPEAN USD JPY USD EQUITY
EUR
CLASS A C (see note 3) Number of Shares Outstanding 9,796.443 129 2,140,192.504 1,930.869.572 6,262,276.983 Net Asset Value per Share 121 45 9,260.09 13.54 38.15 ........ . . .
CLASS A C H (see note 3)
Net Asset Value per Share CLASS A 0 (see note 3)
Net Asset Va!ue-pg[Share CLASS A 0 H (see note 3)
Net Asset Value per Share CLASS E C (see note 3)
Number of Shares Outstanding NIA N /A NIA N/A NIA N/A N/A N/A . . . - . . . . . . . - ... ._ . .. ..
Number of Shares Outstanding 31,985.957.526 331,580.270 5,734,096.01 3 369.474.036 37.45
~
1381.21 13.54 . ~ . . . . . . . . . . . . . . . . . . . . . . . 121.45
Number of Shares Outstanding NIA N /A N/A N/A N/A -. -. NIA N/A N/A .. . . .
Number of Shares Outstanding 401,379.382 249.355.957 N/A NIA NIA Net Asset Value per Share 119.37 1.352.38 N/A -
CLASS E 0 (see note 3) Number of Shares Outstanding NIA 166.287 742 NIA 524,915 787
CLASS I C (see note 3) Number of Shares Outstanding 1,750,700.210 109.400.000 2,320.282.233 NIA
9.283 85 13.63 NIA Net Asset Value per Share CLASS I 0 (see note 3) Number of Shares Outstanding 168,957.303 NIA NIA NIA Net Asset Value per Share 125.20 NIA NIA NIA
Net Asset Value per Share NIA 1,352 39 NIA 37 03 . . . . .
.- 125.21 .~ . .
...
CLASS J 1 C (see note 3) Number of Shares Outstanding N/A N/A NIA NIA
Net AsgValue per Share N/A NIA NIA NIA
Number of Shares Outstanding N/A N/A NIA N:A
Net Asset Value per Share N/A N/A NIA N/A
CLASS M 1 C (see note 3)
.
CLASS M 1 D (see note 3)
Net Asset Value per Share CLASS M 2 C (see note 3)
Number of Shares Outstanding N/A N/A NIA N/A NIA N/A N/A N/A ...... ...... - ~-
Number of Shares Outstanding NIA NIA N /A N/A NIA Net Asset Value per Share NIA NIA N/A
Number of Shares Outstanding NIA NIA N/A NIA NIA
.
CLASS M 2 0 (see note 3)
~
NIA NIA N/A Net Asset Value per Share .-
CLASS P C (see note 3) Number of Shares Outstanding NIA 54.263 444 NIA 12 296.000
NIA 9.225.51 NIA 38 84 ._ . . . . . . . . . . . . . . Net Asset Value per Share -.
CLASS P 0 (see note 3) Number of Shares Outstanding N/A 8,767,775,573 NIA 9,309,998.628 Net Asset Value per Share N/A 1,408.56 NiA 37.18 ...
CLASS W C (see note 3) Number of Shares Outstanding NIA N/A N/A N/A
NiA Net Asset Value per Share N/A N/A N/A ~ .-
CLASS W 0 (see note 3) Number of Shares Outstanding NIA 184.561.320 N/A 2,173.565.433 Net Asset Value per Share NIA 12.720.31 N/A 22.74
Number of Shares Outstanding NIA 187,650 000 N/A N/A
. . ......
CLASS 2 C (see note 3)
Net Asset Value per Share -- NIA 9,385 29 N/A N/A
Net Asset Value per Share 123.02 1,382.91 13.70 37 49
CLASS 2 D (see note 3) Number of Shares Outstanding 120.916 690 269.654.472 829.422.059 1,305,205 151
HSBC Global Investment Funds -

Key Figures as at 30 September 2006 _
~
PAN-EUROPEAN SINGAPORE THAI EQUITY UK EQUITY US EQUITY US INDEX EQUITY HIGH EQUITY USD GBP USD USD
DIVIDEND USD EUR
L -
3,741 719 109 171 676 a97 1,118,580363 1474199497 839 693 695 1 396 355 891 9 62 ._ 14 65 31 56 8 97 26 82 21 15
..
N'A NiA N/A N/A I 2 9 9 6 0 0 5 7 5 NIA NIA N 'A 24.29 NIA NIA _ _ NiA -. . ..
I I i R n 47fi w n 56 791 R?7 , _" """ . .- 21 812.207 933 4,364,944 41 1 506 343 191 45 924 915
14 65 29 28 8 7 0 25 65 23 67 9.48 _.
NIA NIA NIA N!A 5,966 625 N/A N/A NIA NIA N!A 25 00 N/A - .-
NIA NIA NIA N/A NIA NIA
NiA NIA NIA N!A N/A NIA
N/A 21.197478 681.169 NiA NiA 18.98 23.51 NIA
.
1 523.994 699 NIA NIA N/A NIA NIA N/A NIA N!A ... 9 E
NiA N/A NIA NIA NIA N 'A NIA NIA NIA N!A NiA N/A _
N/A N /A NIA NIA N/A NIA
N/A NiA NIA NIA N;A NIA ...
N/A NIA NIA NiA N/A N:A
N/A N:A NIA NIA NIA NiA NIA NiA N 'A N/A
NIA N!A N:A NiA N IA N/A NIA NIA NiA NIA N/A NIA .._ .-
N/A N/A NIA NiA NIA NiA N 'A N 'A NIA NIA NIA N/A
- . ...
N/A N/A N:A NiA NIA NiA N/A NIA NiA NIA N:A NIA
.. .
N/A 618.016.467 N:A N/A 1.13*,284.109 2 655,547 929 NiA 29 26 NIA NIA 24.03 9.28
. ... .. . .
N!A NiA N/A NIA N/A NIA NIA NIA NiA NIA N/A N/A . .. .. .
NIA NIA N/A NiA 292 839 354 NIA I NIA N!A NIA NIA 13744 NIA ..
116,126000 NiA NIA 1 926 000 2,055,089 on0 NIA NIA NiA 27 25 21 45 NIA _. .- 15 14
NIA N/A
76,516.524 274,449.836 30.80 8.92
NiA 1.364.160.723 NIA 23.70
N/A NIA
.-
HSBC Global Investment Funds

..
Key Figures as at 30 September 2006 - __
~
.. Freestyle Sub-Funds ASIA FREESTYLE BRlC FREESTYLE
. ..
GLOBAL LATIN AMERICAN USD USD EMERGING FREESTYLE
MARKETS EQUITY USD FREESTYLE
USD CLASS A C (see note 3) Number of Shares Outstanding Net Asset Value per Share CLASS A C H (see note 3) Number of Shares Outstanding Net Asset Value per Share CLASS A D (see note 3) Number of Shares Outstanding Net Asset Value per Share - -
CLASS A 0 H (see note 3) Number of Shares Outstanding Net Asset Value per Share CLASS E C (see note 3) Number of Shares Outstanding
.~
4,442,203.856
. 13.48 . ..
76,255.268 14.49
13 474,430 074 13 36
NIA NIA NIA NIA NIA NIA
NIA N/A NIA N/A N/A NIA .. .
N/A N/A
N/A N/A
NIA NIA
1,045,294,471 14 30
440 983 865
N/A N/A N/A N/A N!A N/A
. .
NIA NIA N/A Net Asset Value per Share 13.31 NIA NIA NIA . .
CLASS E D (see note 3) Number of Shares Outstanding NIA NIA NIA N/A Net Asset Value per Share NIA NIA NIA NIA . .. . .
CLASS I C (see note 3) Number of Shares Outstanding 1,037,872,960 N/A NIA NIA Net Asset Value per Share 13.75 N/A N/A NIA
CLASS I D (see note 3) Number of Shares Outstanding N/A N/A N/A NiA Net Asset Value per Share --. N/A N/A N IA N/A
CLASS J 1 C (see note 3)
.-
-.-
Number of Shares Outstanding N/A 55.275.632.391 N/A N/A Net Asset -. Value per Share N/A 12.94 NIA N/A
CLASS M 1 C (see note 3)
Net Asset Value per Share CLASS M 1 D (see note 3)
Net Asset Value per Share CLASS M 2 C (see note 3)
Number of Shares Outstanding N/A 6,641.469.146 127 559,049 501 1 128,696.694 10.21 .. . .- 10.13 .. . N/A 18.05 . - __
Number of Shares Outstanding NIA NIA 1391,871 015 754.122.621 NIA NIA 10.04 10.20 .-
Number of Shares Outstanding NIA 103 530,563 309 N 'A NIA Let AsSet Value per Share NIA 17.27 N!A NIA
Number of Shares Outstanding N IA 23 295 241.009 NIA NIA NIA 17.10 N/A NIA
.. .
CLASS M 2 D (see note 3)
Net Asset Value per Share CLASS P C (see note 3)
. -.
Number of Shares Outstanding N IA N/A N/A NIA Net Asset Value per Share NIA N/A N/A NIA . .. ..
CLASS P D (see note 3)
Net Asset Value per Share CLASS W C (see note 3) Number of Shares Outstanding N/A N!A NIA N/A
N/A NIA NIA N/A Net Asset Value per Share CLASS W D (see note 3) Number of Shares Outstanding N/A NIA N!A N/A
NiA NIA NiA N/A Net Asset Value per Share CLASS 2 C (see note 3)
Number of Shares Outstanding N /A N/A N/A NiA N/A N/A NIA N/A . ..
. .. . . .
.- ..
Number of Shares Outstanding NIA N!A NIA N!A NIA NiA NIA N/A Net Asset Value per Share .
CLASS 2 D (see note 3) Number of Shares Outstanding NIA NIA NIA N/A Net Asset Value per Share NIA NIA NIA N!A
HSBC Global Investment Funds ....

Key Figures as at 30 September 2006 - . ___ -~
Bond Sub-Funds UK FREESTYLE BRAZIL BOND EURO CORPORATE EURO CREDIT EURO EURO
GBP USD BOND BOND INVESTMENT INVESTMENT EUR EUR GRADE BOND GRADE
EUR CORPORATE BOND EUR _. _.
N/A 14 352 062 106 566 000 2624931172 8183503581 1 250 000 N/A 10 7H 1025 - 17 25 1702 10 18 -~
N/A N/A NIA NIA NiA NIA N /A NIA NIA NIA N/A N/A .-.
NIA 852 41 1 5,046 807 675 18,506 678 6,892 609 543 453 008 NIA 10 78 9 99 15 29 16 26 9 92
NIA NIA N/A N/A N:A NIA NIA _- L 7 NIA NIA NiA N IA N IA _. .. ~
I N/A NIA NiA NIA NIA NIA NIA NIA N/A N:A N:A NIA
NiA N/A NiA N/A NIA I . N/A NIA NiA NiA NIA N/A
N/A
NIA N/A NIA 41.098.000 2 096.932.591 N /A N:A NIA 17 62 17 30 N/A N/A
. . . . .
NIA NIA NiA NiA NiA N/A NIA N 'A NIA NiA NIA N/A ._ -.
NIA NIA N/A NiA N /A NIA NIA NiA N:A N/A N/A NIA
N/A NIA N/A NiA NiA NIA NIA N/A NIA N!A NIA
.. .- NIA .... . -. . __ - .. -
N/A NIA N/A NiA NiA NIA NIA N/A NIA N!A NIA
.. .- NIA .... . -. . __ - .. -
996.627 685 N iA N!A NIA NIA N/A 12.16 N/A NiA N:A NIA N:A
N/A NiA NIA NIA NIA NIA - NIA NIA NIA NIA N!A N/A
NIA NiA NiA NIA N/A NIA NIA NIA NIA N/A NiA N/A . __ _- __ -
N /A NIA N/A NIA NIA N/A N/A NIA NIA NIA N/A NIA . .. -
N /A NIA N/A NIA NIA N/A N/A NIA NIA NIA N/A NIA . .. -
N/A N/A NIA NIA NIA N/A N/A N /A NiA NIA NIA N/A - ..
NIA N/A NIA NIA N/A N/A NIA NIA NiA N/A NIA NiA
. ... .- . 7
NIA NIA N/A NIA NIA NIA N:A N 'A NIA NiA NiA N:A - - ~-
N/A 500 000.000 NiA 45.522.904 1.750.010 499,500.000 10.31 _. 17 59 17.54 . . NIA .-
N/A 10.80 N/A 500 000.000 NiA 45.522.904 1.750.010 499,500.000
10.31 _. 17 59 17.54 . . NIA .- N/A 10.80
NiA NIA
NIA N/A
HSBC Global Investment Funds ... .
NiA 104,406 949 N 'A 17 12
NIA NiA
NIA NiA

- _ ....
Key Figures as at 30 September 2006 .- ~. __
EURO HIGH YIELD GLOBAL GLOBAL PAN-EUROPEAN BOND EMERGING INVESTMENT GOVERNMENT
EUR MARKETS BOND GRADE BOND BOND USD USD EUR
. .~ ..... . . .
CLASS A C (see note 3) Number of Shares Outstanding 3 354.552.587 351.760.191 18,153.931 8,514.31 5.320
Net Asset Value per Share 20 83 19.21 13.32 16.87 . . . . .
CLASS A C H (see note 3) Number of Shares Outstanding NIA N/A N/A NIA
Net Asset Value pel Share NIA N/A N/A NIA ......
CLASS A 0 (see note 3) Number of Shares Outstanding 11,914.965 3.719.154 524 4,611,062 536 80 138.543 Net Asset Value per Share 18.14 16 28 13 18 13.45
CLASS A D H (see note 3) Number of Shares Outstanding N/A NIA NIA N/A
N /A Net Asset Value per Share N/A NIA NIA - ..... ~.
CLASS E C (see note 3) Number of Shares Outstanding N/A NIA NIA NIA
Net Asset Value per Share NiA N/A N/A NIA __ . . . . . . .
CLASS E 0 (see note 3) Number of Shares Outstanding N/A N/A N/A NIA Net Asset Value-per Share N/A NIA N /A NIA
Number of Shares Outstanding 117,995.784 90,000 000 N/A 351,085.627 19 27 NIA 17.15 21 3 5
.- ..
CLASS I C (see note 3)
.- Net Asset Value per Share -.
CLASS I 0 (see note 3) Number of Shares Outstanding NIA NIA NIA 11 3 076.482
Net Asset Value per Share N/A NIA NIA 15.30
Number of Shares Outstanding N/A NIA NIA N/A
Net Asset Value per Share N/A N/A NIA NiA
........
CLASS J I C (see note 3)
CLASS M 1 C (see note 3) Number of Shares Outstanding N/A N/A N/A N!A
N/A N/A N/A NIA Net Asset Value per Share .... .
Net Asset value per Share -. .. .......
Net Asset . Value peySke--. . . .. ....
Net Asset Value per Share .... ....
CLASS M 1 D (see note 3) Number of Shares Outstanding NIA N /A N/A NIA
NIA NIA NIA .- NIA
CLASS M 2 C (see note 3) Number of Shares Outstanding NIA NIA NIA N/A
N/A NIA NIA N/A
CLASS M 2 0 (see note 3) Number of Shares Outstanding NiA NIA NiA N/A
N /A N/A NIA NIA
CLASS P C (see note 3) Number of Shares Outstanding NIA N/A N/A NIA
Net Asset Value per Share NIA N/A N/A NIA
Number of Shares Outstanding NIA NIA NIA NIA
Net Asset Value per Share . NIA NIA NIA NIA
Number of Shares Outstanding N/A NIA N!A N /A
Net Asset Value per Share N/A NIA NIA N/A
Number of Shares Outstanding NIA N/A 20.596.891 NIA
Net Asset Value per Share NIA N/A 178.53 NIA
Number of Shares Outstanding 41 949.280 2.074.624 106 N/A NIA
Net Asset Value per Share 21.31 19.54 NIA NIA
Number of Shares Outstanding N /A NIA 3 238.924.913 N/A
Net Asset Value per Share NIA NIA 13.18 N/A
.. - .... ~
CLASS P D (see note 3)
~
CLASS W C (see note 3)
-.
CLASS W 0 (see note 3)
... . .
CLASS 2 C (see note 3)
. .
CLASS 2 0 (see note 3)
HSBC Global Investment Funds

_ _
Key Figures as at 30 September 2006 ...
Reserve SublFunds Other Sub-- TURKISH STERLING US DOLLAR HIGH US DOLLAR EURO RESERVE US DOLLAR
INVESTMENT YIELD BOND INVESTMENT EUR RESERVE CONVERGENCE GRADE BOND USD GRADE BOND USD EUR
GBP USD
N:A 500.000 106 204.893 3.554.380 759 496.692 808 3,744,443.233 10.59 12 08 15 83 1603 12.87 N:A .. .
N 'A NIA NiA N:A NIA NIA
NIA NIA N:A N/A NIA NIA ~
NIA 990.933 839.299 970 50 496 765 307,587.443 250,129.783 12 30 NIA 10 61 10.67 15.1Y . _- 8.00 . . . -
NiA NIA NIA N 'A N IA N:A NIA N/A NIA NIA NIA NIA
N/A N/A N A NIA NiA 684 587 NiA N/A NiA N 'A NIA 12 89
I
N/A NIA NiA N 'A NIA N 'A NIA NiA N 'A NIA N A N/A .-
I
N/A NIA NiA N:A NIA NIA NIA NIA N/A NIA NiA N 'A - _ _. . .- - .
NIA NIA NIA N:A NIA NIA NIA NiA N IA N 'A N 'A NIA ._ .- -_
NIA N:A NIA NIA NIA N/A N 'A NIA N/A NIA NIA NIA - - -. ._ ........
NIA NIA NIA N!A NIA N:A NIA N!A NIA N:A NIA . . . . . . ._ NiA ...
N/A N/A N!A NiA NIA NiA NIA N /A NIA N!A NIA NIA
.
N/A NIA N:A NIA NIA NIA N'A N/A NiA NIA N!A NiA _- . ... -
NIA NIA N 'A NiA N/A NIA NIA NIA N:A NiA N 'A NIA
.
NIA N!A NIA NIA N/A NIA NIA N!A N!A NiA N:A NIA
2 924,445 425 NiA 3013980862 N 'A I 171,~0745 i NIA 5 58 NIA 1044 NIA 8 36 N:A
NIA NIA 176,249 493 N.A N/A NIA NiA N 'A 13 83 NiA NIA NiA - .. . - . ._
146,809 540 N/A 827 671 854 NiA NIA NiA 99 11 N 'A 10 48 NIA NIA NiA ..
NIA 499,500.000 353,391 .OOO N!A NIA N/A N!A NIA 10.69 12 21 . -. . . N!A NIA
.. .. ~
54 346.607 5.63
N IA 365 116.829 N!A 10.68
NIA NiA
NIA NIA
N/A N/A
HSBC Global Investment Funds

Statement of Operations and Changes in Net Assets
for the period from 1 April 2006 to 30 September 2006
~
.. .
Equity Sub-Funds .
CONSOLIDATED ASIA EX JAPAN ASIA EX JAPAN ASIA PACIFIC EX USD EQUITY EQUITY SMALLER JAPAN EQUITY
USD COMPANIES HIGH DIVIDEND USD USD
.. .
Net Assets at the Beginning of the Period 19,254,376.61 7 582,349,188 31,219,270 192,121,007
INCOME Investment Income Bank Interest Other Income
360,563,339 8,979,986 434,658 6,287.768 16.968,208 143,103 17.31 1 28,135
602,153 -
Total Income 378,133,700 9,123,089 451,969 6,315,903
EXPENSES ~-
Management Fees (note 4.2) Performance Fees (note 4.3) Operating, Administrative and Servicing Fees (note 4.4) Bank Interest Paid
121,755,181 3.620,053 1,504,124
221,668 1,229,067
38,280,257 901,529 51,723 300,219 693,945
- -.
TotarExpenses 162,233,507 4,521,582 273,391 1,529,286
Net Investment ProfiV(Loss) 21 5,900,193 4,601,507 178,578 4,786,617 Realised Profit/(Loss) on Sale of Investments 1,141.41 5.366 45,350,409 2,397,197 1,262,941
Realised Profitl(Loss) for theperiod before Foreign Currency Movement 1,357,315,559 49,951,916 2,575,775 6,049,558
._
. ..
. . ..
Profit/(Loss) on Foreign Currency (26,641,471) (1,315,659) (62,857) Change in unrealised appreciation/(depreciation) of investments. futures and forward exchange contracts (1.065.568,261) (25,547,580) (1,217,480)
(268,022)
(3,810.900)
Change in Total Net Assets as a Result of Operations 1,970,636 265,105,827 23,088,677 1,295.438 -
Proceeds on Issue of Shares 7,152,387,220 149,480,433 1,522,758 48,521,860 Payments on Redemption of Shares (6,674,499,654) (225,012,724) (4,658,204) (85,157,630) Dividends Paid (46,218,738) (1,434,880) (21 0,930) (2,428,729) Currency Translation 130,189.235
Net Assets as at 30 September 2006 20,081,340,507 528,470,694 29,168,332 155,027,144
The accompanying notes form an integral part of these financial statements.
HSBC Global Investment Funds .

- - -.-
Statement of Operations and Changes in Net Assets -~
-.
BRAZIL EQUITY BRIC MARKETS BRIC MARKETS CHINESE EQUIT? EMERGING EUROLAND EQUITY USD USD EQUITY USD EUROPE EQUITY EUR
USD EUR
- _- 351.102,078 223,573.945 2,891,006,873 29,983,564 292,922,023
3,877,592 3,280,207 168,974 73,649,631 739,089 7.41 0,705 1,167,611 16,791 52,397 3,583,340 13.548 9,908
~- 5,045,203 3,296,998 221.371 77,232,971 752,637 7,420,613
..- _. . __
3,987,261 1,102,246 132,221 22,731,695 173?994 3,042,219
986,467 275,562 41,856 6,261.839 49,381 1,140,469 17,900 3,519 753 4,185 79.152
- . -.
4,973,728
71 -475
(2,125,049)
(2,053,574)
(3.3 70,643)
(5,945,826)
(1 1,370,043)
591,440,161 (348,118,641)
(373,062)
-
227,560 4,261,840
1,901,290 43,775 48,238,684 525,077 3.1 58.773
9,196,930 270,069 142,649.1 65 1,666,557 12,438,908
1,395,708 177,596 28,994,287
11,098,220 313.844 190,887,849 2,191,634 15,597,661 .-
88,136 (1 96.833) (4,366.265) (422,328) (85. i58)
(3,542,170) (1 6,237,491)
392,670 1,973,015 270,940,878 (1,772,864) (724.968)
174,692,190 94,661.088 1 ,I 95,176.1 78 8,794,128 297.1 14,048 (1 86,602,625) (14,287,945) (94 1 ,I 1 1,282) ( 14,602,097) (137,681,863)
(15,447548)
(10,793,686) 1,856,004 84,419.294
582,680,493 212,056,iao 82,346,158 3,400,565,099 22,402,731 451,629,240 - .. .
HSBC Global Investment Funds

Statement of Operations and Changes in Net Assets
for the period from I April 2006 to 30 September 2006
-_ ~
- EUROLAND EQUITY EUROLAND VALUE- SUSTAINABILITY EUROPE EXUK
SMALLER CREATION LEADERS EQUITY COMPANIES EUR EUR EUR
EUR
88.51 7.699 28,902,712 9,830,322 114,656,209 Net Assets at the Beginning of the Period ..
INCOME Investment Income Bank Interest Other Income
881,825 655,904 227:949 1,829.61 7 18,990 3,152 3,163 9,521
4,714 18,119 -
Total Income 900,815 663,770 249,231 1.839.1 38 -.
EXPENSES-..
Management Fees (note 4.2) 388,631 370,869 76,010 728,131 Performance Fees (note 4.3) Operating, Administrative and Servicing Fees (note 4.4) Bank Interest Paid
115,324 103:856 18,245 277,254 2,862 7,626 2,467 132
~-
Total Expenses 506.81 7 482,351 96,722 1,005,517
Net Investment Profit/(Loss) 393,998 181,419 152,509 833,621 Realised Profit/(Loss) on Sale of Investments 5,913.872 1,043,808 131,596 12,341,314
Realised Profit/(Loss) for the Period before Foreign Currency Movement 6.307.870 1,225,227 284.105 13,174,935
-. -. .
Profit/(Loss) on Foreign Currency (1 73.998) (5,464) (1.385) 8,625 Change in unrealised appreciation/(depreciation) of investments, futures and forward exchange contracts (9,230,335) 4.7 1 8,192 563,645 (12,642,566)
Change in Total Net Assets as a Result of Operations (3,096,463) 5,937,955 846,365 540,994
.. - _. ~. .
. . - - - .-
Proceeds on Issue of Shares 23,775,752 82,855,096 5,754:610 3,559,735 Payments on Redemption of Shares (46,645,720) (8,296,889) (267,827) (34,110,443) Dividends Paid (526,175) Currency Translation
Net Assets as at 30 September-ZO6 62,551,268 109,398,874 16,163,470 - 84,120,320- .- .. -. .-. .
The accompanying notes form an integral part of these financial statements.
I I
i I I
i I
I
I
I I
HSBC Global Investment Funds

Statement of Operations and Changes in Net Assets _..
I GLOBAL GLOBAL EQUITY -- GLOBAL EQUITY- GLOBAL EQUITY GLOBAL EX HONG KONG EMERGING USD SRI TECHNOLOGY EUROLAND EQUITY EQUITY
MARKETS EQUITY USD USD EUR USD USD
._
232,800,507 164,972,157 10,848,034 7,914,102 59,070,237 194,270,521 -
5,491,145 1,739.349 11 3,823 149,312 138,678 3,482
90,016 1.939
394,850 3,393,026 56,292 150,882
5,640,457 1,878.027 117,305 91,955 451,142 3,543,900
1,838,421 770,293 4,777 54,925 135.074 950,595
496,183 322,660 14,470 13,693 77.484 330,095 329 198 409 33,497
.~
2,335.256 1,093,282 19,445 69,027 246,055 1,280,690
784,745 97,860 22.928 205.087 2,263,218
19,696,523 9,505,293 577.730 33,796 120,462 13,339,588
F:- 23,001,724 10,290,038 675.590 56,724 325,549 15,602,806
(576,859) (24,643) (2,475) (10,755) (41.275) (247,361)
(21,777,109) (7,954,023)
647,756 2,311,372
55,736,816 90.122 292 (22,297,253) (96,876,506) (1 ,I 51,756) (438,791)
_.
.._ - -
(14,051 ) 69,720 (1,452,697) (1,218,532)
659.064 11 5,689 (1,168,423) 14,136,913
1,159,291 3,708,708 666,074 58,077,133 (1 5,497) (4,633,080) (3,450,923) (66.535.669)
(25) (3,972,474)
265,736,070 160,090,524 12,650,867 7,1Q5,419 55,116,965 195,976,424
HSBC Global Investment Funds . .- .. 7 - - -

-
Statement of Operations and Changes in Net Assets
for the period from 1 April 2006 to 30 September 2006
INDIAN EQUITY JAPANESE EQUITY KOREAN EQUITY PAN-EUROPEAN USD JPY USD EQUITY
EUR
Net Assets at the Beginning of the Period 6,029,705,648 32,542,790,513 152,431,357 568,630,360
INCOME
Investment Income 82,230,345 201,272,948 303,492 1 1,175,284 Bank Interest 2,809,730 3,525,842 31,431 123,401 Other Income
Total Income 85,040,075 204,798,790 334,923 11,298,685
EXPENSES
Management Fees (note 4.2) 37,948,842 208,040,533 964,604 3,663,693 Performance Fees (note 4.3) Operating. Administrative and Servicing Fees (note 4.4) 10,212.307 59,154,166 291,562 2,069,656 Bank Interest Paid 332.142 3:880,161 686 1,280
Total Expenses 48,493,291 271,074,860 1,256,852 5,734,629
Net Investment Profit/(Loss) 36,546,784 (66,276,070) (921,929) 5,564,056
-. . ....
. - .. .
.. .
. -
Realised Profit/(Loss) on Sale of Investments 574,023,208 197,901,134 2,781,412 39,091,322
- Realised Profit/(Loss) for the Period before Foreign Currency Movement 61 0,569,992 131,625,064 1,859,483 44,655,378
__ Profit/(Loss) on Foreign Currency (7,231,911) (1 2,522,817) (374,681) (1 23,037) Change in unrealised appreciation/(depreciation) of investments, futures and forward exchange contracts (640,177,816) (2.586,798,920) (5,545.935) (33:066,151)
-. .
Change in Total Net Assets as a Result of Operations (36,839,735) (2,467,696,673) (4,061,133) 1 1,466.1 90
Proceeds on Issue of Shares 785.303,675 23,512,020,554 103,499,451 333,396.1 O f Payments on Redemption of Shares (1,400,451,351) (14.400.681,625) (1 05,044,142) (1 91,465,140) Dividends Paid (27,309) (31,471) (4,862,107) Currency Translation
Net Assets as at 30 September 2006 5,377,690,928 39,186,432,769 146,794,062 717,165,410
~. ~ - .. -
The accompanying notes form an integral part of these financial statements.
HSBC Global Investment Funds -.

- _- . .
Statement of Operations and Changes in Net Assets _..
- ..- . - SINGAPORE THAI EQUITY UK EGITY US EQUITY US INDEX
EQUITY HIGH EQUITY USD GBP USD USD DIVIDEND
_. ~
83,304,250 26,242,522 264,861,559 164,915,960 137,953,697 101,754,702
1,984,826 639.549 5.065.575 3,008,047 1,632.324 760,775 22,487 40,322 140,646 20,928 303,962 1,698
... .. ._ ..
2,007,313 679,871 5,206,221 3,028,975 1.936,286 762,473 -. ._ . . . - . . .. . I-
558,822 133,321 1,761,440 1,143,199 607,054 144,860
132,615 50,638 41 9,247 278,654 286,121 11 8,969 19,213 237 28,641 4,997 8,107 1,286
710,650 184,196 2.209.328 1,426,850 901,282 265,115 -. -- - .~
- .
1,296,663 495,675 2,996,893 1,602,125 1,03<004 497,358
(5,169.1 66) 4.789270 1.456.136 9,158,795 2,544,605 1,543,842
3.841,268 2,039,517 (2,172,273) 6,391,395 2,491,140 9,656,153
36,886 (54,668) (210,650) (7.591) 52.481 (521 1) ._ -.
(5,396,772) (2.005.724) (12,203,606) (8,214,118) 5,029,930 (10,987.837) . . . .. .. .
(1,518,618) (20,875) (1 4,586,529) (1,830,314) 7,573,551 (1,336,895)
24,898,564 9,704,098 96.426.926 25,283,140 130.039,482 10.244.493 (32,807,854) (7,275.605) (1 2571 6,549) (35,191,467) (70,074,367) (71,355,033)
(1,132,225) (5,083,198) (1,237,801) (107,481) (792,232)
.. . . -.- _ ~-
.. .-
73,876,342 27,517,915 215,902,209 151,939,518 205,384,882 38.51 5,035 ~. . .
HSBC Global Investment Funds

Statement of Operations and Changes in Net Assets - -
for the period from I April 2006 to 30 September 2006
Freestyle Sub-Funds
ASIA FREESTYLE BRlC FREESTYLE GLOBAL LATIN AMERICAN USD USD EMERGING FREESTYLE
MARKETS EQUITY USD FREESTYLE
USD
Net Assets at the Beginning of the Period 374,242,604 3,377,707,464 660,549,914
INCOME Investment Income 15,773,123 53.01 1,400 24,680,128 24,567 Bank Interest 138,778 5,681,006 909:783 30,002 Other Income 564,190
Total Income 15,911,901 58,692,406 26.1 54,101 54,569
EXPENSES Management Fees (note 4.2) Performance Fees (note 4.3) Operating, Administrative and Servicing Fees (note 4.4) Bank Interest Paid
Total Expenses
2,628,864 5,202,566 5,877,409 1,504,083
604,164 6,327,321 2.350.964 61 172 9,545
3,233,089 23,034,142 8,23?,9 I 8 ...
35,626
14,250 246
50,122
Net Investment Profit/(Loss) Realised Profit/(Loss) on Sale of Investments
12,678,812 35,658,264 17,916,183 4,447
40,915,706 21 7,896,733 (34,796,979) (61,442)
Realised Profit/(Loss) for the Period before Foreign Currency Movement 53,594,518 253,554,997 (16,880,796) (56,995) -. - Profit/(Loss) on Foreign Currency Change in unrealised appreciation/(depreciation) of investments, futures and forward exchange contracts
. . .
(671,300) (1.430.132) (4,245,834) (69,286)
(41,990,742) (237,646,489) 3,254,105 429,927
Change in Total Net Assets as a Result of Operations
. . . . ~.
10,932,476 14,478,376 (17,872,525) 303,646
Proceeds on Issue of Shares 23,694,124 827,639,672 838,992,105 21,019,517 Payments on Redemption of Shares (131,243,872) (1,199,082,727) (1 74,964,241 ) (2,107,692) Dividends Paid (1,570,757) Currency Translation
Net Assets as at 30 September 2006 276,054,575 3,020,742.7a5 1,306,705,253 19,215,471 ... . . -. .. .. . . . .. -
The accompanying notes form an integral part of these financial statements.
HSBC Global Investment Funds . .

. _ -
Statement of Operations and Changes in Net Assets .-
Bond Sub-Funds -.
UK FREESTYLE BRAZIL BOND EURO CORPORATE EURO CREDIT EURO EURO GBP USD BOND BOND INVESTMENT INVESTMENT
EUR EUR GRADE BOND GRADE EUR CORPORATE BOND
EUR
14,691,270 48.600.380 90,422,i 34 141,727,068 10,644,652 -_- - - - .. . - - . .
.- . . .
228.733 302,303 1,203,642 1,379,425 3,065,008 244,888 9,108 2,475 48,389 10,933 43,106 6,308
.-. . .- ~ _- -.
237.841 304.778 1,252,231 1.390.358 3,108,114 251,196 -. .... .
I
62,815 22
546 243,604 287,560 517,638 20,164
21,933 23,000 85,306 104,266 176,866 10,512 1 5,938 1,047
84,771 29,484
153,070 275,294 . . . .. . . .
328,910 392,873 694,504 30,676
923.321 997,485 2,413,610 220,520
(1 15,892) 645,812 (276,318) (476,013) (1,697,017) 1,702,688
798,882 (1,024) 447,308 (699,532) 4.116.298 104,628
I
86 15,835 (50) (418) (43) 33
(935,647) 400,027 407,362 1,419,461 (739,097) 87,163
(136,679) 414,838 854.620 719.51 I 3.377.158 191,824
699,180 5,418,598 3,193,453 5,565,899 102,622,179 18,076 (3.134.119) (268,070) (1,152,230) (47,827.458) (72,026.546) (301.814)
,-- ..
-.
. . . . . .. . .- . . . . .
48,880,086 175,699,859 10,552,730 12,119,652 5,565,366 51,496,223
HSBC Global Investment Funds ..

._
Statement of Operations and Changes in Net Assets
for the period from I April 2006 to 30 September 2006
..... - _ . _ __
I
.... .- .... ._
EURO HIGH YIELD GLOBAL GLOBAL GLOBAL BOND EMERGING INVESTMENT INVESTMENT
EUR MARKETS BOND GRADE BOND GRADE BOND (US
USD
Net Assets at the Beginning of the Period 124,271,638 11 9,634,250 88,081,665 453,246
INCOME Investment Income 3,411,557 3,700,095 1,842,266 1,634 Bank Interest 10,370 142,339 283,405 817 Other Income 8.994
T o t i Income 3,421,927 3,842.434 2,134,665 2,451
EXPENSES Management Fees (note 4.2) 559,402 338,490 336,204 612 Performance Fees (note 4.3)
USD USD DOLLAR-HEDGED)
...... ~ .......
...... . . . . . ...
........
~-
Operating, Administrative and Servicing Fees (note 4.4) Bank Interest Paid
165,233 172,429 117,169 338 24,818
153 I
. ._
Total Expenses 724,635 51 1,257 478,191 765
Net Investment Profit/(Loss) 2,697,292 3,331,177 1,656,474 1,686 Realised Profit/(Loss) on Sale of Investments 364,339 26,071 (1,514,600) (12,282)
Realised Profit/(Loss) for the Period before Foreign Currency Movement 3,061,631 3,357,248
Profit/(Loss) on Foreign Currency Change in unrealised appreciation/(depreciation) of investments, futures and forward exchange contracts
Change in Total Net Assets as a Result of Operations
13,861 - .
(1 44,812)
141,874
.....
(10.596)
434,566 6,434
(1,318,186) (336,188) 3,160,345 6,639 '
1,757,306 2,876,248 3,736,785 2,477
I Proceeds on Issue of Shares 31,313.465 28,320,204 68,245,003 12,748 Payments on Redemption of Shares (83,827,438) (41,250,168) (51,586,666) (468,471 ) Dividends Paid (1,108,275) Currency Translation
Net Assets as a t30 September 2006 73,514,971 109,5a0,534 107,368,512 .........
The accompanying notes form an integral part of these financial statements.
HSBC Global Investment Funds . - ._ . .

I Statement of Operations and Changes in Net Assets I
_-.
Reserve Sub-Funds .
PAN-EUROPEAN US DOLLAR EURO RESERVE US DOLLAR GOVERNMENT INVESTMENT YIELD BOND INVESTMENT EUR RESERVE
US DOLLAR HIGH
GRADE BOND USD GRADE BOND USD USD
.. . . . . .
11 7,815,022 21.583.331 5.1 72.610 46,965,872 47,661,285 22,672,829
I- __ . . . . . .
2,686,037 910,318 206.54 1 1.558.459 676.467 51 0,683 14,318 11,920 694 43,802 35,389 48,452
- -. . .-. . .
2,700,355 922,238 207 235 1,602.261 71 1,856 559,135
40,810 I
472.151 46.1 83 51 1 15,387 129,270
159 187 23.129 6 509 56,115 38.785 16,229 10,630 10,063
- - 641.968 69,312 6 560 181,565 168,055 57,039
502,096 - _ _ ~_
2,058,387 852,926 200 675 1,420,696 543,801
(1,450,951) (51 8.555) 625 (609,428) 33,883 46,098 _- ..
607,436 334,371 201,300 81 1.268 577,684 548,194 -
12,024 (467) (205) 72 (320) I
2.777.286 95,358 (29,875) 1,160,209 (1 5,572) (46,111)
3,396,746 429,262 171,425 1,971,272 562.184 501,763
a9,i 80.020 26,926,898 10,315 32,306,944 51,975.428 19.1 66,159 (57.91 5.886) (16,906,335) (20,220,376) (43,161,622) (22,123,648)
-. - - . . .- .~
(848,878)
__ 152,475,902 31,184,278 5,354,350 61,023,712 57,037,275 20,217,103
HSBC Global Investment Funds - ....

for the period from I April 2006 to 30 September 2006
I
Other Sub-Funds
TURKISH CONVERGENCE
EUR
.. .- . . -. .. .
67,383.0 14
2.502,658 199,273
2,701,931
351,289
90,872
...
442,161
2,259,770
(8,255,793)
I
(5,996,023)
(981,055)
(2,963,877)
(9,940,955)
-. . ... ~
30,623,271 (36,669.01 7)
(130:910)
51,265,403
1
The accompanying notes form an integral part of these financial statements.
HSBC Global Investment Funds I
... ..
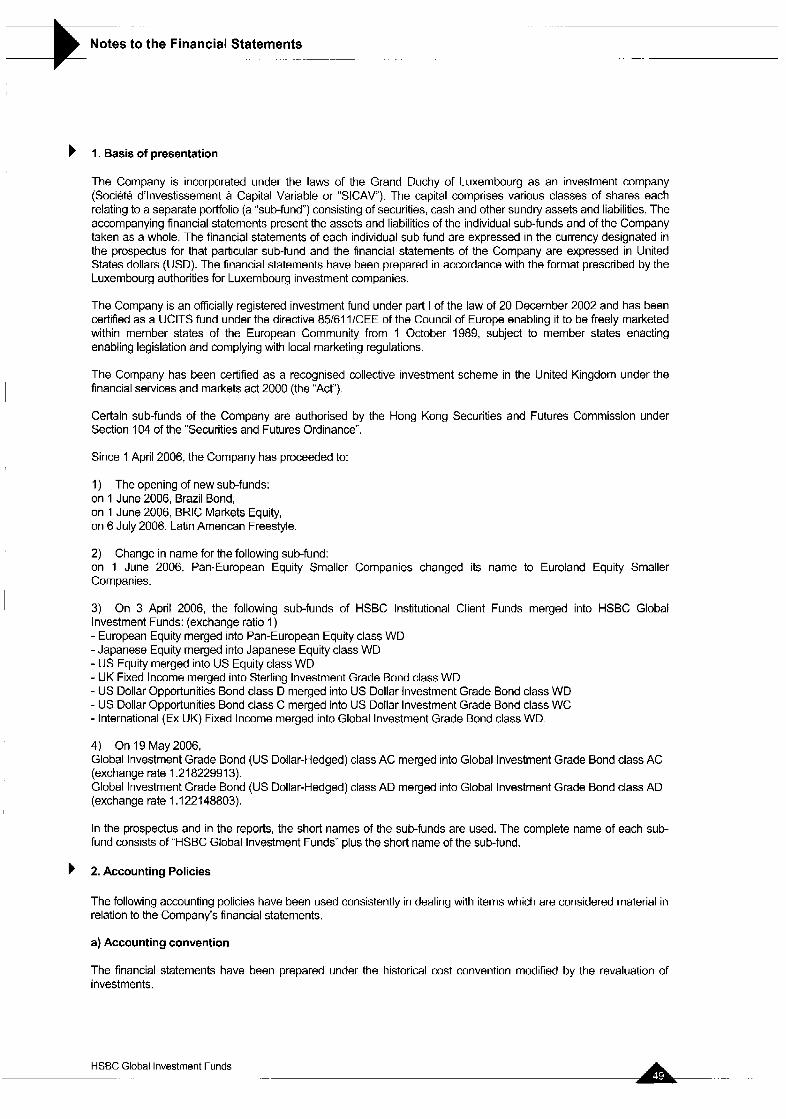
Notes to the Financial Statements ..
b I. Basis of presentation
The Company is incorporated under the laws of the Grand Duchy of Luxembourg as an investment company (Societe d’lnvestissement a Capital Variable or “SICAV). The capital comprises various classes of shares each relating to a separate potlfolio (a “sub-fund”) consisting of securities, cash and other sundry assets and liabilities. The accompanying financial statements present the assets and liabilities of the individual sub-funds and of the Company taken as a whole. The financial statements of each individual sub-fund are expressed in the currency designated in the prospectus for that particular sub-fund and the financial statements of the Company are expressed in United States dollars (USD). The financial statements have been prepared in accordance with the format prescribed by the Luxembourg authorities for Luxembourg investment companies.
The Company is an officially registered investment fund under part I of the law of 20 December 2002 and has been certified as a UCITS fund under the directive 85/61 I/CEE of the Council of Europe enabling it to be freely marketed within member states of the European Community from 1 October 1989, subject to member states enacting enabling legislation and complying with local marketing regulations.
The Company has been certified as a recognised collective investment scheme in the United Kingdom under the financial services and markets act 2000 (the “Act”).
Certain sub-funds of the Company are authorised by the Hong Kong Securities and Futures Commission under Section 104 of the “Securities and Futures Ordinance”.
Since 1 April 2006, the Company has proceeded to:
1) on 1 June 2006, Brazil Bond, on 1 June 2006, BRlC Markets Equity, on 6 July 2006, Latin American Freestyle.
The opening of new sub-funds:
2) on 1 June 2006, Pan-European Equity Smaller Companies changed its name to Euroland Equity Smaller Companies.
Change in name for the following sub-fund:
3) Investment Funds: (exchange ratio I) - European Equity merged into Pan-European Equity class WD -Japanese Equity merged into Japanese Equity class WD - US Equity merged into US Equity class WD - UK Fixed Income merged into Sterling Investment Grade Bond class WD - US Dollar Opportunities Bond class D merged into US Dollar Investment Grade Bond class WD - US Dollar Opportunities Bond class C merged into US Dollar Investment Grade Bond class WC - International (Ex UK) Fixed Income merged into Global Investment Grade Bond class WD.
4) On 19 May 2006, Global Investment Grade Bond (US Dollar-Hedged) class AC merged into Global Investment Grade Bond class AC (exchange rate 1.218229913). Global Investment Grade Bond (US Dollar-Hedged) class AD merged into Global Investment Grade Bond class AD (exchange rate 1.122148803).
On 3 April 2006, the following sub-funds of HSBC Institutional Client Funds merged into HSBC Global
In the prospectus and in the reports, the short names of the sub-funds are used. The complete name of each sub- fund consists of “HSBC Global Investment Funds” plus the short name of the sub-fund.
b 2. Accounting Policies
The following accounting policies have been used consistently in dealing with items which are considered material in relation to the Company’s financial statements.
a) Accounting convention
The financial statements have been prepared under the historical cost convention modified by the revaluation of investments.
HSBC Global Investment Funds . .

b 2. Accounting Policies (continued)
b) Assets and portfolio securities valuation
The assets of each Class within each sub-fund are valued as at I 1 .OO a.m. (Luxembourg time) as at 30 September 2006.
In addition, potlfolio securities and/or financial derivative instruments which are listed on an official stock exchange are valued at the last available price on the principal market on which such securities are traded. Securities traded on other organised markets are valued at the last available price or yield equivalents obtained from one or more dealers in such organised markets at the time of valuation. If such prices are not representative of their fair value, all such securities and all other permitted assets will be valued at their fair value at which it is expected they may be resold as determined in good faith by or under the direction of the Directors.
The financial derivative instruments which are not listed on any official stock exchange or traded on any other organised market will be valued in accordance with market practice. Shares or units in underlying open-ended investment sub-funds shall be valued at their last available net asset value reduced by any applicable charges.
c) Income and Expenses
Interest is accrued on a day-to-day basis. Dividends are accounted for on an ex-dividend basis.
d) Foreign Exchange
The cost of investments, income and expenses in currencies other than the fund relevant reporting currency have been recorded at the rate of exchange ruling at the time of the transaction. The market value of the investments and other assets and liabilities in currencies other than the relevant reporting currency have been converted at the rates of exchange ruling at 30 September 2006.
e) Realised Profitl(L0ss) on Sale of Investments
Realised profiff(loss) on sale of investments is the difference between the historical average cost of the investment and the sale proceeds.
b 3. Share capital
The Company has issued either A, E, I, J, L, M, P, W, Y or Z Shares to investors in one or several sub-funds as detailed below.
Within each sub-fund, the Company is entitled to create different share classes andlor sub-classes, distinguished by their distribution policy (Capital-Accumulation (C) and Distribution shares (D)), their hedging activity (H) and/or by any other criterion to be stipulated by the Directors.
All share classes are available as both Capital-Accumulation and Distribution Shares.
Shares in existence before 2 October 2000 have been designated Class A Shares and are available to all investors. On 25 November 2002, all Shares in issue in Class A of the sub-funds Pan-European Equity, Hong Kong Equity, Japanese Equity, Singaporean Equity, North American Equity, US Index, US Dollar Bond and US Dollar Reserve were renamed Class P Shares. The rights and obligations relating to such Shares remain unchanged (except that the minimum initial investment amount was increased to USD 50,000).
HSBC Global Investment Funds

.. . - ..
Notes to the Financial Statements (continued) ._ A- - --
I
b 3. Share capital (continued)
Description Minimum Initial Minimum
Class A
Class E
Class I
Class J
Class L
Class M
Class P
Class W
Class Y
Class Z
E Shares will be available in certain countries, subject to the relevant regulatory approval, through specific distributors selected by the Share Distributor. E Shares will incur annual management fees equivalent to that of the Class A Shares plus 0.3% to 0.5% per annum of the Net Asset Value of Class E Shares, which may be payable to specific distributors in certain countries.
I Shares are available through specific distributors selected by the Share Distributor.
J Shares are available for investment by fund of fund ranges managed by the HSBC Group only.
L Shares are available through specific distributors selected by the Share Distributors.
M Shares are available to all investors.
P Shares are available for subscription in certain jurisdictions or through certain selected distributors.
W Shares are available through specific distributors that will also be members or affiliated entities of the HSBC Group as selected by the Share Distributor provided (in addition) the investors qualify as institutional investors within the meaning of article 129 of the 2002 Law. No Operating, Administrative and Services Expenses will be charged to Class W Shares. All the fees and charges allocated to this Class will be paid directly by members or affiliated entities of the HSBC Group.
Y shares are available to all investors in certain jurisdictions or through certain specific distributors approved by the Share Distributor.
Z Shares are available to investors having entered into a discretionary management agreement with an HSBC Group entity and to investors subscribing via distributors selected by the Share Distributor provided that such investors qualify as institutional investors within the meaning of article 129 of the 2002 law.
USD 5,000
EUR 1,000,000
USD 100,000
EUR 1,000,000
USD 5,000
USD 50,000
USD 100,000
USD 1,000
USD 1,000,000
Investment Holding USD 5,000 A Shares are available to all investors. USD 5,000
USD 5,000
EUR 1,000,000
USD 100,000
EUR 1,000,000
USD 5,000
USD 50,000
USD 100,000
USD 1,000
USD 1,000,000
The Board of Directors of the Company have authority to issue different Classes of Shares in one or several sub- funds. Details of the characteristics of such Share Classes offered by one or several sub-funds will be determined by the Board of Directors. In case of the creation of additional Classes of Shares, this Prospectus will be updated.
The subscription proceeds of all Shares in a sub-fund are invested in one common underlying portfolio of investments. All Shares of the same class have equal rights and privileges. Each Share is, upon issue, entitled to participate equally in assets of the relevant class of the sub-fund to which it relates on liquidation and in dividends and other distributions as declared for such sub-fund. The Shares will carry no preferential or pre-emptive rights and each whole Share will be entitled to one vote at all meetings of Shareholders.
The minimum initial investment amount and minimum holding amount may be reduced at the discretion of the Company.
HSBC Global Investment Funds ._ .
. ... -. A

-. - . . - - ..
Notes to the Financial Statements (continued) . .-
3. Share capital (continued)
Share Class Denominations:
The Share Classes issued in the different sub-funds are designated by their class name, followed by their distribution characteristics and, if applicable, their specific hedging policy. This means that for example Shares issued in Class A which are distributing income and applying a hedging policy, as defined above, would be identified as ADH whereas Class I Shares accumulating income would be identified as IC.
4. Charges and Expenses
1. Explanation of the Charging Structure
Investment in the Company is currently offered via nine charging structures, as represented by the A, E, I, J, M, P, W, Y and Z Classes of Shares.
The Management Company is entitled, in respect of each Class of Shares, to a management fee to cover all investment management, investment advisory and distribution services provided in relation to the relevant class (see 2. “Management Fee” below).
In addition, the Company pays to the Management Company a fee to cover operating administrative and servicing expenses. To preserve Shareholdels from fluctuations in a sub-fund’s operating, administrative and servicing expenses, the Company has agreed with the Management Company that the fee charged to cover such operating, administrative and servicing expenses is fixed at an annual rate. The excess of such expenses above such annual rate will be borne directly by the Management Company (see 4. “Operating, Administrative and Servicing Expenses” below).
2. Management Fee
The Company pays to the Management Company an annual management fee calculated as a percentage of the Net Asset Value of each sub-fund or Share Class (“Management Fee”). The Management Fee is accrued daily and payable monthly in arrears at the rates specified in the table page 65.
The maximum rate for Class E, I, J and M Shares is 3.5%.
The maximum rate for Class A, P, Y and Z Shares is as stated in the table page 65.
No Management Fee is currently charged for Class W Shares.
The Management Fee covers management and distribution services provided in relation to the relevant sub-fund of the Company by the Management Company, the Investment Advisers and the Share Distributors. The Management Company is responsible for discharging, out of such fee, the fees of the Investment Advisers and the Share Distributors and may pay part of such fee to recognised intermediaries or such other person as the Management Company may determine, at its discretion.
The Management Company may instruct the Company to pay a portion of the Management Fee directly out of the assets of the Company to any of such service providers. In such case the Management Fee due to the Management Company is reduced accordingly.
3. Performance Fee
For sub-funds issuing Classes J Shares, L Shares and M Shares, the Management Company is also entitled to a Performance Fee, payable annually in arrears after the end of each twelve month period (financial year for Class M I Shares of Global Emerging Markets Equity Freestyle).
Each Dealing Day, the Performance Fee accrual will be calculated as 20% (10% in the case of Global Equity Freestyle) of the difference between the change in the Net Asset Value per share of the relevant Class of the sub- fund since the previous Dealing Day (net of all other fees and expenses and excluding the effect of subscriptions and redemptions) and the simple daily equivalent of the percentage defined below for the relevant sub-funds (hereafter the “Percentage”) provided that on such Dealing Day the Net Asset Value per Share of the relevant Class of the sub- fund is higher than the Low Tide Mark (as defined below). On the first issue of the relevant Class of Shares in a sub- fund, the Low Tide Mark will equal the initial offer price of the relevant Class of Shares of the sub-fund. The Low Tide Mark will not be set at a level below the initial offer price of the relevant Class of Shares of the sub-fund.
I
HSBC Global Investment Funds A -
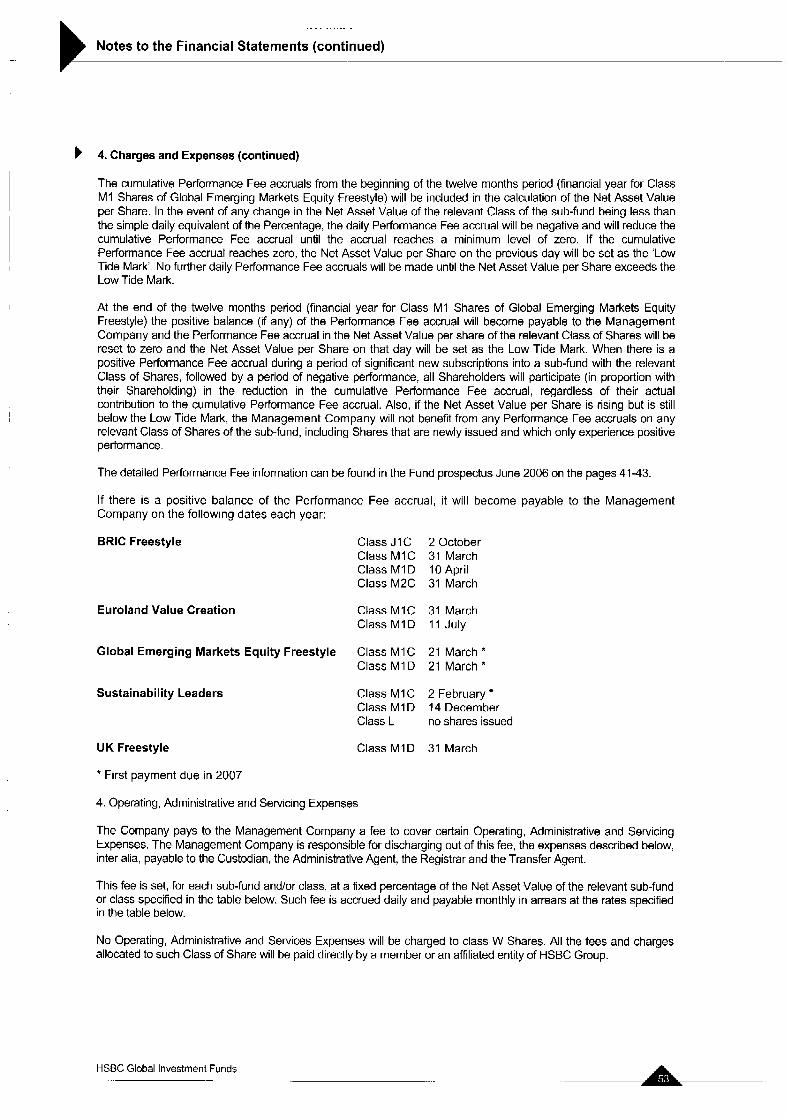
. . ..
Notes to the Financial Statements (continued)
b 4. Charges and Expenses (continued)
The cumulative Performance Fee accruals from the beginning of the twelve months period (financial year for Class M I Shares of Global Emerging Markets Equity Freestyle) will be included in the calculation of the Net Asset Value per Share. In the event of any change in the Net Asset Value of the relevant Class of the sub-fund being less than the simple daily equivalent of the Percentage, the daily Performance Fee accrual will be negative and will reduce the cumulative Performance Fee accrual until the accrual reaches a minimum level of zero. If the cumulative Performance Fee accrual reaches zero, the Net Asset Value per Share on the previous day will be set as the 'Low Tide Mark'. No further daily Performance Fee accruals will be made until the Net Asset Value per Share exceeds the Low Tide Mark.
At the end of the twelve months period (financial year for Class M I Shares of Global Emerging Markets Equity Freestyle) the positive balance (if any) of the Performance Fee accrual will become payable to the Management Company and the Performance Fee accrual in the Net Asset Value per share of the relevant Class of Shares will be reset to zero and the Net Asset Value per Share on that day will be set as the Low Tide Mark. When there is a positive Performance Fee accrual during a period of significant new subscriptions into a sub-fund with the relevant Class of Shares, followed by a period of negative performance, all Shareholders will participate (in proportion with their Shareholding) in the reduction in the cumulative Performance Fee accrual, regardless of their actual contribution to the cumulative Performance Fee accrual. Also, if the Net Asset Value per Share is rising but is still below the Low Tide Mark, the Management Company will not benefit from any Performance Fee accruals on any relevant Class of Shares of the sub-fund, including Shares that are newly issued and which only experience positive performance,
The detailed Performance Fee information can be found in the Fund prospectus June 2006 on the pages 41-43.
If there is a oositive balance of the Performance Fee accrual, it will become payable to the Management Company on 'the following dates each year:
BRlC Freestyle
Euroland Value Creation
Global Emerging Markets Equity Freestyle
Sustainability Leaders
UK Freestyle
* First payment due in 2007
Class J I C 2 October Class MIC 31 March Class M I D I O April Class M2C 31 March
Class M I C 31 March Class M I D 11 July
Class MIC 21 March * Class M I D 21 March *
Class M I C 2 February Class M1D 14 December Class L no shares issued
Class M I D 31 March
4. Operating, Administrative and Servicing Expenses
The Company pays to the Management Company a fee to cover certain Operating, Administrative and Servicing Expenses. The Management Company is responsible for discharging out of this fee, the expenses described below, inter alia, payable to the Custodian, the Administrative Agent, the Registrar and the Transfer Agent.
This fee is set, for each sub-fund andlor class, at a fixed percentage of the Net Asset Value of the relevant sub-fund or class specified in the table below. Such fee is accrued daily and payable monthly in arrears at the rates specified in the table below.
No Operating, Administrative and Services Expenses will be charged to class W Shares. All the fees and charges allocated to such Class of Share will be paid directly by a member or an affiliated entity of HSBC Group.
HSBC Global Investment Funds -.. ~-

. . _. -
Notes to the Financial Statements (continued)
b 4. Charges and Expenses (continued)
The maximum rate for class A, E, I, J, M, P, Y and Z Shares is I .O%. However, the Board of Directors reserves the right to amend the fixed level of the Operating, Administrative and Servicing Expenses applicable to each class of Share. In the event of an increase in such expenses, the concerned Shareholders will be given at least three months prior notice of such increase. During this three months notice, such Shareholders may request the redemption of their shares, free of charge.
Operating, Administrative and Servicing Expenses cover the ongoing custody fees and safekeeping charges payable to the Custodian and its correspondent banks, fees for fund accounting and administration services (including domiciliary services) payable to the Administrative Agent and transfer agency fees for registrar and transfer agency services payable to the Registrar and Transfer Agent.
Operating, Administrative and Servicing Expenses also cover expenses relating to the creation of new sub-funds; the costs of the Subsidiary (see below); the Luxembourg asset-based taxe d’abonnernent, at the rate referred to under “Taxation” below; attendance fees and reasonable out-of-pocket expenses incurred by the Company’s Directors; legal, auditing fees and other expenses; ongoing registration and listing fees, including translation expenses; the costs and expenses of preparing, printing, and distributing the Company’s prospectus, financial reports, statements and other documents made available directly or through intermediaries to its shareholders.
The Management Company may instruct the Company to pay a portion of the aforesaid fee directly out of the assets of the Company to any of the aforementioned service providers. In such case the fee due to the Management Company is reduced accordingly.
b 5. Transaction expenses and extraordinary expenses
The transaction expenses linked to security dealing are written off against the realised profiffloss from the sale of investments.
Each sub-fund bears the costs and expenses of buying and selling portfolio securities and financial instruments, brokerage fees and commissions, interest or taxes payable, and other transaction related expenses. These transaction fees are accounted for on a cash basis and are paid when incurred or invoiced from the net assets of the sub-fund to which they are attributable. Transaction fees are allocated across each sub-fund’s Share Classes.
The Company bears any extraordinary expenses including, without limitation, litigation expenses and the full amount of any tax, levy, duty or similar charge and any unforeseen charges imposed on the Company or its assets.
b 6. Indian Equity
The Company wholly owns a subsidiary in Mauritius namely HSBC Global Investment Funds Mauritius Limited, Manor House, 1” floor Corner of St GeorgeKhazal Streets, Port Louis, Mauritius (“the Subsidiary“). The Subsidiary manages the Indian Equity sub-fund’s investments in India.
The Subsidiary is an open-ended investment company incorporated in Mauritius on 3 October 1995. The accounts of the Indian Equity sub-fund and the Subsidiary have been consolidated.
The Subsidiary has appointed Multi Consult Limited, 10 Frere Felix de Valois Street, Port Louis, Mauritius, to provide administrative services to the Subsidiary in Mauritius, including maintenance of its accounts, books and records. The Subsidiary has appointed KPMG Mauritius of KPMG Centre, 30 St George Street, Port Louis. Mauritius, as auditors of the Subsidiary in Mauritius to perform the auditor‘s duties required by Mauritius law.
b 7. Taxation
Belgium
The Belgian government has enacted a law which charges an annual net asset value tax on foreign investment funds registered with the Belgian Banking and Finance Commission. An annual tax of 0.07% is charged on the net outstanding amounts of sub-funds placed in Belgium through Belgian financial intermediaries, or where that figure is not substantially documented, the tax authorities may calculate the tax on the total assets of those subfunds.
The tax will increase to 0.08% as from 1 January 2007.
HSBC Global Investment Funds A

Notes to the Financial Statements (continued) . .
b 7. Taxation (continued)
The Company understands that the validity of this tax charge is being questioned on the basis that it is contrary to European law and further developments are awaited. To date as the amounts are small, the Management Company has paid this tax cost on behalf of the Company out of the Operating, Administration and Servicing Expenses it receives. However, should the cost become substantial or long term the Management Company may require the subfunds concerned to bear that tax charge for future periods.
India
On the basis that it is a Mauritian tax resident, the Subsidiary will benefit from the tax advantages available to it under the India-Mauritius double taxation treaty, which became effective on 1 July 1983. The Subsidiary will file, through its Custodian, a declaration of Mauritian residency with the registrar of each Indian company in which it invests. Capital gains resulting from the purchase and sale by the Subsidiary of stocks on the Indian stock exchanges will be exempt from tax on the basis that the Subsidiary is able to benefit from the provisions of the India-Mauritius double taxation treaty.
Interest on certain notified securities and bonds and on deposits in foreign currency with scheduled banks is exempt from income tax. The sale and purchase of stocks and securities is exempt from Indian sales tax.
The above-stated tax treatment under the India-Mauritius tax treaty will be available provided that the Subsidiary does not have a permanent establishment or its effective management and control in India. No guarantee or warranty can be given or should be assumed that the tax benefits of the treaty will continue to be available to the Indian Equity sub-fund in future periods due to, among others, changes in the regulatory environment in Mauritius, India or the European Union.
The Indian Central Board of Direct Taxes has confirmed the availability of the treaty benefits to companies holding a certificate of Mauritian tax residence, The Supreme Court of India confirmed on 7 October 2003 the validity of this position.
Luxembourg
The Company is not liable to any Luxembourg tax on profits or income nor are dividends paid by the Company liable to any Luxembourg withholding tax. The Company is, however, liable in Luxembourg to a tax of 0.05% per annum of its Net Asset Value, such tax being payable quarterly on the basis of the value of the net assets of the Company at the end of the relevant calendar quarter. The tax rate is reduced to 0.01 % per annum for the US Dollar Reserve and Euro Reserve sub-funds and Classes J Share, W Share and Z Share in the relevant sub-funds. No stamp duty or other tax is payable in Luxembourg on the issue of Shares.
The Class or sub-funds may be exempted of this 0.01 % tax if they comply with the requirements of the Luxembourg law of 19 December 2003.
No Luxembourg tax is payable on the realised or unrealised capital appreciation of the assets of the Company.
The Company paid a tax of EUR 1,239.46 on its incorporation.
Mauritius
The Subsidiary is registered with the Mauritius Offshore Business Activities Authority as an offshore company. As a result it is subject to a reduced rate of Mauritian income tax on its income. In addition, no Mauritian capital gains tax will be payable in respect of the Subsidiary’s investments in India and any dividends and redemption proceeds paid by the Subsidiary to the Indian Equity sub-fund will be exempt from Mauritian withholding tax. A certificate of Mauritian tax residence has been granted to the Subsidiary by the Commissioner of Income Tax in Mauritius. On the basis that it is Mauritian tax resident, the Subsidiary will qualify for certain reliefs from Indian tax as set out in the Indian tax section below. No guarantee or warranty can be given or should be assumed that the tax benefits of the treaty will continue to be available to the Indian Equity sub-fund in future periods due to, among others, changes in the regulatory environment in Mauritius, India or the European Union.
HSBC Global Investment Funds

Notes to the Financial Statements (continued) 3 7. Taxation (continued)
Turkey
A new tax system takes effect from I January 2006 which will charge a 10% withholding tax on dividends received by the Company and a 15% withholding tax on all other investment returns received by the Company from investments made in Turkey. The Company understands that this tax system has passed into law in Turkey and, the costs of this tax will be borne by shareholders in sub-funds investing in Turkey.
Thailand
Where possible Thai stocks of the Thai Equity sub-fund are held through custody arrangements in London which enables the Company to benefit from the United Kingdom-Thailand double tax treaty and therefore gains realised by the sub-fund are currently not liable to tax in Thailand. Although the Company will seek to maintain this favourable position, no guarantee or warranty can be given or should be assumed that the tax benefits of the treaty will continue to be available to the sub-fund in future periods. Should the sub-fund become subject to Thai tax on its gains this will have an adverse effect on investment returns and a possible impact on the Net Asset Value.
United Kingdom
It is the intention of the Board of Directors to conduct the affairs of the Company so that it does not become resident in the United Kingdom. On the basis that the Company is not resident in the United Kingdom for tax purposes it should not be subject to United Kingdom corporation tax on its income and capital gains.
The Company has received certification as a distributing fund under Schedule 27 of the Income and Corporation Taxes Act 1988.
General
Dividends and interest received by the Company on its investments are generally subject to non-recoverable withholding taxes in the countries of origin. Investors and potential investors should note the paragraph concerning Emerging Markets in the “Risk Factors” section of the Prospectus.
8. Public and bank holidays in Hong Kong
HSBC Investment Funds (Hong Kong) Limited has been appointed by the Company as its Representative and Share Distributor in Hong Kong. There will be no dealing for the Shares of the Company in Hong Kong on a day which is a public or bank holiday in Hong Kong.
9. Forward foreign exchange contracts
As at 30 September 2006, the Company had entered into various forward foreign currency contracts for the purpose of hedging the portfolio which oblige the Company to deliver currencies at specified future dates. Open contracts are as follows:
Sub-funds Contract Date
Asia Ex Japan Equity 27/06/2006
2810612006 03107l2006 04/07/2006 1 110712006 12107l2006 13/07/2006 1710712006 19/07/2006 2010712006 20l0712006 21 107l2006 2410712006 2810712006
USD USD USD USD USD EUR USD EUR EUR EUR USD USD USD USD
In exchange Settlement for
23,306,830 300,737
1,285 448,171 292,000 247,000 42,217
495,000
11,733,000 30,361
315,704 6,332
175,871
368,000
29109l2006 2910912006 2910912006 2910912006 2910912006 2910912006 2910912006 2910912006 2910912006 2910912006 2910912006 2910912006 2910912006 2910912006
EUR EUR EUR EUR EUR USD EUR USD USD USD EUR EUR EUR EUR
Contract to deliver
18,412,000 238,000
1,000 348,000 228,000 316,555 33,000
624,739 461,730
14,842,832 24,000
248,000 5,000
138,000
Unrealised Gain/( loss)
HSBC Global Investment Funds

. .~ . ..
Notes to the Financial Statements (continued) .-
b 9. Forward foreign exchange contracts (continued)
Sub-funds
Asia Ex Japan Equity
BRlC Markets
Europe Ex UK Equity
Global Emerging Markets Equity
Global Equity
Global Equity Technology
Pan-European Equity
Contract Date
31l0712006 USD 01/08/2006 USD 02/08/2006 EUR 02l08l2006 USD 03/08/2006 USD 0910812006 USD 11/08/2006 USD 14l08l2006 EUR 17lO812006 USD I810812006 USD 2310812006 USD 2510812006 EUR 2510812006 USD 28/08/2006 USD 31l0812006 USD 01l0912006 USD 05l09l2006 USD 0710912006 USD 08l09l2006 USD 1110912006 USD I210912006 EUR 15l09l2006 USD 18l09l2006 USD 1910912006 USD 20/09/2006 USD 2210912006 USD 2510912006 USD 2610912006 EUR 2610912006 USD 2810912006 USD
2610912006 USD 2710912006 USD
26/09/2006 USD 2810912006 GBP
2210912006 ZAR 2610912006 EUR 2810912006 EUR 2810912006 SGD
2610912006 SGD 2710912006 EUR 2710912006 USD 2810912006 SGD
27/09/2006 USD 2810912006 USD
2710912006 EUR
In exchange Settlement for
5,120 3,178,775
125,000 3,854
189,648 3,869
21 9,304 103,000
3,867 183,901
2,570 124,000
2,558 7,699 1,287
3,389,136 279,015
3,840 7,637 6,364
299,000 17,805
277,616 31 :691
250,003 15,377 8,959
12,495,000 15,969.672 3,095,448
2910912006 29/09/2006 2910912006 2910912006 29/09/2006 2910912006 29/09/2006 2910912006 2910912006 2910912006 2910912006 2910912006 2910912006 29/09/2006 2910912006 2910912006 29/09/2006 29l0912006 29/09/2006 2910912006 2910912006 2910912006 2910912006 2910912006 29/09/2006 2910912006 2910912006 2910912006 2911 212006 2911 212006
EUR EUR USD EUR EUR EUR EUR USD EUR EUR EUR USD EUR EUR EUR EUR EUR EUR EUR EUR USD EUR EUR EUR EUR EUR EUR USD EUR EUR
3,808,486 29/09/2006 EUR 7,610,988 0211012006 EUR
2,766 2910912006 EUR 1,058 0311 012006 EUR
3,249,213 0211 012006 USD 2,216 29/09/2006 USD
18,045 0311 012006 USD 48,565 0311 012006 USD
25,400 2910912006 USD 8,912 0211012006 USD
25,811 0211 012006 SGD 12,800 03/10/2006 USD
8,184 0211012006 SGD 9,455 03/10/2006 SGD
6,450 02110l2006 SGD
Contract to deliver
4,000 2,484,000
160,563 3,000
148,000 3,000
171,000 131,531
3,000 143,000
2,000 158,571
2,000 6,000 1,000
2,639,000 217,000
3,000 6,000 5,000
380,358 14,000
219,000 25,000
197,000 12,000 7,000
15,891,141 12,495,000 2,424,000
2,999,989 5,999,991
2,179 1,563
426,851 2,814
22,917 30,611
15,995 1 1,305 41,000 8,068
13,000 15,000
13,000
Unrealised Gainl(loss)
USD (85,834)
USD 636
EUR 1
USD 3,055
USD 15
USD 10
EUR 7
HSBC Global Investment Funds - .

-
Notes to the Financial Statements (continued) - .- _. . ._ ~- .. . -_ -
I
b 9. Fowuard foreign exchange contracts (continued)
Sub-funds
UK Equity
US Equity
Asia Freestyle
Contract Date
2610912006 GBP 26/09/2006 USD 27/09/2006 GBP 2810912006 GBP
In exchange Settlement for
33,604 29/09/2006 EUR 6,726 29/09/2006 GBP
1 1,818 0211 Ol2006 EUR 13,579 0311 012006 EUR
Contract to deliver
50,178 3,549
17,595 20,057
24,447,000 768,873 25,000
11,039,000 364,000 199,000 245,431 200,000 239,659 324,360 225,846 174,577 292,000 122,000 260,794 325,000 158,708
9,000 14,130
172,000 268,000 150,000 254,481 188,610 169,000 288,000 267,142 221,000 158,000
15,424,391 12,128,000
1,680,655 529,696 21 2,573 414,455 163,175 656,875 144,028
14,588,192
2,016,285 80,080
112,176 164,905 85,801 48,141 16,372
1,364 4,931
Unrealised Gain/(loss)
GBP 502
USD (373,498)
06/09/2006 USD 06/09/2006 EUR 1910912006 USD
31,421,118 1211012006 EUR 600,000 1211012006 USD 31 -765 1211 012006 EUR
2710612006 USD 03/07/2006 USD 05/07/2006 USD 07/07/2006 EUR 11/07/2006 USD 12/07/2006 EUR 17/07/2006 EUR 19/07/2006 EUR 20/07/2006 EUR 21/07/2006 USD 26/07/2006 USD 27/07/2006 EUR 28/07/2006 USD 31/07/2006 EUR 01/08/2006 USD 02/08/2006 EUR 03/08/2006 USD 1 1/08/2006 USD 2310812006 USD 2510812006 EUR 2910812006 EUR 3010812006 USD 05/09/2006 USD 12/09/2006 EUR 18/09/2006 USD 2010912006 USD 26/09/2006 EUR 26/09/2006 USD
13,973,718 467,668 255,181 191,000 256,140 187,000 257,000 180,000 138,000 371,716 154,233 204,000 414,190 124,000 11,517 1 1,000
220,401 343,705 192,735 199,000 147,000 21 7,207 370,305 210,000 280,151 200,510
12,128,000 15,500,615
2910912006 2910912006 29/09/2006 29/09/2006 29/09/2006 29/09/2006 29/09/2006 2910912006 2910912006 29/09/2006 2910912006 2910912006 2910912006 29/09/2006 2910912006 29/09/2006 2910912006 29/09/2006 29/09/2006 2910912006 2910912006 2910912006 2910912006 29/09/2006 29/09/2006 29/09/2006 29/09/2006 2911 2/2006
EUR EUR EUR USD EUR USD USD USD USD EUR EUR USD EUR USD EUR USD EUR EUR EUR USD USD EUR EUR USD EUR EUR USD EUR USD 10.475
BRlC Freestyle 2610912006 USD 26/09/2006 USD 26/09/2006 USD 27/09/2006 USD 27/09/2006 USD 28/09/2006 USD 28/09/2006 USD 2810912006 USD
2,133,592 68,026
133,862 525,736 102,723 834,231 90,783
1,873,043
29/09/2006 2910912006 2910912006 0211 012006 0211 012006 0311 Ol2006 0311 012006 0411 012006
EUR HKD SGD EUR SGD EUR SGD HKD USD (1,681 )
Global Emerging Markets Equity Freestyle 22/09/2006 ZAR
2610912006 USD 2610912006 SGD 27/09/2006 EUR 27/09/2006 USD 2810912006 EUR 28/09/2006 SGD
15,348,088 02/10/2006 USD 101,661 29/09/2006 EUR 178,136 2910912006 USD 130,000 0211 012006 USD 54,014 02/10/2006 SGD 37,906 03/10/2006 USD 25,975 0311 012006 USD USD 14,240
GBP (64) 2610912006 USD 2710912006 EUR
2,585 29/09/2006 GBP 7,341 02/10/2006 GBP
UK Freestyle
HSBC Global Investment Funds

Notes to the Financial Statements (continued) __
b 9. Fonnrard foreign exchange contracts (continued)
Sub-funds Contract Date
Global Emerging Markets Bond 0110912006
I I10912006 1410912006 22/09/2006 26109i2006 28/09/2006
Global Investment Grade Bond 01 I0812006
0310812006 0310812006 I510812006 2910812006 30108/2006 3010812006 31 /08/2006 1210912006 I310912006 I410912006 I510912006 2210912006
In exchange Settlement for
EUR 269,011 2910912006 USD COP 4,980,000,000 0611012006 USD USD 2,068,966 0611012006 COP COP 4,980,000,000 23/10/2006 USD TRY 876,730 2711012006 USD SGD 191,418 0311012006 USD
CAD USD AUD USD USD USD CAD EUR USD GBP GBP USD USD
5,180,000 1,477,486 5,206,000 3,122,673
526,056 1 ,I 39,653 1,260,000
80,000 10,203,672 8,250,000 2,040,000 5,170,074 6,942,540
0211 112006 0211 1 I2006 0311 112006 0211 112006 0311 1 12006 0211 1 12006 0211 112006 2211 1 12006 I911 212006 1211 212006 1211 212006 1811 212006 1811212006
USD CAD USD CAD AUD CAD USD USD EUR GBP USD JPY JPY
Contract to deliver
345,598 2,080,201
4,980,000,000 2,063,821
570,899 120,654
4,574,881 1,657,000 3,960,569 3,523,000
690,000 1,260,000 1,136,364
102,977 8,000,000
15,485,539 3,854,356
600,000,000 800,000,000
b I O . Futures
As at 30 September 2006, the Company had entered into the following outstanding futures contracts:
BRlC Markets Equity H-Shares IDX-Hang Seng China
Global Ex Euroland Equity SPI 200 Futures Topix Index S&P 500 Indices
Japanese Equity Topix Index
Pan-European Equity High Dividend Dow Jones Euro Stoxx 50
Number Currency of
contracts
228 HKD
5 AUD 32 J PY 2 USD
143 J PY
22 EUR
Unrealised Gainl(1oss)
USD (15,276)
USD (1 8,633)
Commitments Maturity Unrealised gain (loss) Date in sub-fund currency
81,019,800 27/10/2006 (8,780) USD (8,780)
648,250 2111 212006 16,728 516,800,000 0811212006 9,624
674,850 1511 212006 14,995 EUR 41,347
2,309,450,000 0811 a2006 (41,470,000) JPY (41,470,000)
864,600 1511 a2006 19,360 EUR 19,360
HSBC Global Investment Funds

Notes to the Financial Statements (continued) __
b I O . Futures (continued) Number
of Maturity Unrealised gain (loss) contracts Currency Commitments Date in sub-fund currency
US Equity S8P 500 Indices 34 USD 1 1,452,050 1511 212006 294,288
USD 294,288 Euro CorDorate Bond Euro Bund 1OY Future (25) EUR (2,961,500) 0711212006 (30,260)
EUR (30,260) Euro Credit Bond Euro Bund 1OY Future Euro Schatz 2Y Future Euro BOBL 5YR 6% Future (EUX)
(35) EUR (4,146,100) 0711212006 (38,l I O ) 51 EUR 5,307,570 1111212006 3,060
(16) EUR (1,761,920) 11112/2006 (640) EUR (35,690)
Euro Investment Grade Bond Euro Bund 1 OY Future Euro Schatz 2Y Future Euro BOBL 5YR 6% Future (EUX)
114 EUR 13,504,440 0711 212006 123,120 (14) EUR ( I ,456,980) I 1 I1 212006 (2,800)
6 EUR 660,720 I 1 I1 212006 1,800 EUR 122.120
Euro Investment Grade Corporate Bond Euro Bund 1 OY Future (4) EUR (473,840) 0711 212006 (4,400)
EUR (4,400) Global Investment Grade Bond Euro Bund Euribor 3 Months Long Gilt Sterling Future 3 Months Euro Yen Future US Tsy Note I O Yr US Tsy Note 2 Yr US Tsy Note 5 Yr US Tsy Note Long
(24) 8
19 14 25 18 25 (5)
EUR EUR GBP JPY USD USD USD USD
(2,838,240) 1,926,500 2,095,130
348,145,000 2,703,906 3,681,844 2,639,453 (562,031)
0711 212006 (35,O 1 8) 1811 212006 888 2911 212006 15,645 1511 212006 127 2911 212006 12,994 04101 12007 0 04101 12007 19,219 2911 212006 (1 0,781)
USD 3,074 Pan-European Government Bond Bund 30Y Futures Euro Bund Euro Schatz 2Y Future Euro BOBL 5Y 6% Future Euribor 3 Months Libor 3 Months Long Gilt Sterling Future Life Sterling 3 Months Future
I 6 38 19
(69) (3)
3 8 3
EUR EUR EUR EUR EUR GBP GBP GBP
609,360 4,501,480 1,977,330
(7,598,280) (721,838)
355,463 883,440 355,425
I 1 I1 212006 0711 212006 I I I1 212006 1 111 212006 1910312007 2111 212006 2911 212006 21 10312007
16,560 41,690
0 (21,390)
41 3 (2,932)
6,254 443
EUR 41,038 I
b I I. Dividends
At the Annual General Meeting held at the Company’s Registered Office on 28 July 2006, the following dividends were declared, out of the profits for the year ended 31 March 2006, for the classes of shares listed below.
Name Currency Dividend Ex-date Payment Number Total amount per share date of shares paid
Asia Pacific ex Japan Equity High Dividend A D USD 0.029243 3110312006 I810412006 13,533,871 395,771 Asia Pacific ex Japan
Euro Corporate Bond A D EUR 0.261782 3110312006 I810412006 4,818,335 1,261,353 Euro Credit Bond A D EUR 0.977134 3110312006 1810412006 14,329 14,001 Euro Credit Bond Z D EUR 0.458083 3110312006 1810412006 94,245 43,172
Equity High Dividend I D USD 0.057609 3110312006 18/04/2006 1,274,002 73,394
HSBC Global Investment Funds ._

. . . - -
Notes to the Financial Statements (continued)
b I I. Dividends (continued)
Name
Euro High Yield Bond A D Euro Investment Grade Bond A D Euro Investment Grade Corporate Bond A D Euro Reserve A D Global Emerging Markets Bond A D Global Investment Grade Bond A D Global Investment Grade Bond (US Dollar-Hedged) A D Pan-European Government Bond A D Pan-European Government Bond I D Sterling Investment Grade Bond P D US Dollar Investment Grade Bond A D US Dollar Investment Grade Bond P D US Dollar Reserve A D US Dollar Reserve P D Asia Pacific Ex Japan Equity AD Asia Pacific Ex Japan Equity ID Indian Equity ID Indian Equity ZD Turkish Convergence AD Global Investment Grade Bond AD
Currency Dividend Ex-date Payment per share date
EUR 1.322955 31/03/2006 18/04/2006
EUR 0.743922 31/03/2006 18/04/2006
EUR 0.2481 88 31/03/2006 18/04/2006 EUR 0.1 38249 31/03/2006 I810412006
USD 0.77723 31/03/2006 18/04/2006
USD 0.232852 31/03/2006 18/04/2006
USD 0.672651 31/03/2006 18/04/2006
EUR 0.1 5977 31/03/2006 18/04/2006
EUR 0.553959 31/03/2006 18/04/2006
USD 0.0401 86 31/03/2006 18/04/2006
USD 0,150535 31/03/2006 18/04/2006
USD 0.512539 31/03/2006 18/04/2006 USD 0.724053 31/03/2006 18/04/2006 USD 0.396575 31/03/2006 18/04/2006
USD 0.173451 01/08/2006 11/08/2006
USD 0.197927 01/08/2006 11/08/2006 USD 0.0081 11 01/08/2006 11/0812006 USD 0.293054 01/08/2006 11/08/2006 EUR 0.536702 01/08/2006 11/08/2006
USD 0.145793 01/08/2006 11/08/2006
Number of shares
12,226
2,995
572,684 35,631
4,004,930
6,852,838
6,916
75,997
297,136
3,a35,067
445,471
3,671,527 I 1,089
1,316,931
12,377,450
1,424,000 158,048 88,813
243,916
7,601,700
Total amount paid
16,175
2,228
142,133 4,926
3,112,752
1,595,697
4,652
12,142
164,601
154,116
67,059
1,881,801 8,029
522,262
2,146,881
281,848 1,282
26,027 130,910
I , I 08,275
Each of these payments exceeds the 85% of distributable income requirements and the Company has applied for certification under the Distributor Status requirements of the UK Revenue and Customs. This Status is always granted retrospectively. The Company has been granted this Status every time the Company intended to obtain this status. The Company intends to obtain certification from the Inland Revenue to be a "distributing fund" for the period ending 30 September 2006 and 30 September 2007.
b 12. Information concerning the Swiss Investors. Publication of TER (Total Expenses Ratio)
Please refer to table page 66.
HSBC Global Investment Funds

Notes to the Financial Statements (continued) -.. .~ . . _. -. - . -. .
b 13. Equalisation received/(paid)
Equalisation is calculated for Bond and Reserve sub-funds only and is included in the profit/(loss) on investment.
Name
Euro Corporate Bond Euro Investment Grade Bond Euro Investment Grade Corporate Bond Euro Credit Bond Euro High Yield Bond Global Emerging Markets Bond Global Investment Grade Bond Pan-European Government Bond Sterling Investment Grade Bond US Dollar High Yield Bond US Dollar Investment Grade Bond Euro Reserve US Dollar Reserve Brazil Bond
Currency
EUR EUR EUR EUR EUR USD USD EUR GBP USD USD EUR USD USD
Total amount Received/(paid)
35,642 258,778 (1,181)
(1 99,261) (662,141 ) (1 71,531) (488,832)
245,124 (1 29,237)
88 (66,307)
53,407 (38,773) (5,354)
Equalisation received reflects the amounts received by the sub-fund in respect of undistributed income on the shares issued during the accounting period. Equalisation paid reflects the amounts paid by the sub-fund in respect of undistributed income on shares purchased during the period.
b 14.Swaps
Euro Reserve
As at 30 September 2006, the Company entered into the following Eonia floating rate swaps:
Eligible securities Currency Net notional amount Unrealised gain (loss) in EUR
BNP Paribas 2.83% 1012006 EUR 1,986,974 Caylon 2.83% 1112006 EUR 1,984,078 Societe Generale 3.1 7% I 112006 EUR 1,790,149 Societe Generale 3.21 YO 12/2006 EUR 1,488,693 Caylon 3.24% 12l2006 EUR 1,487,702 lxis Corporate & Investment Bank 3.13% 10/2006 EUR 1,495,805 BNP Paribas 3.1 5% 10/2006
b 15. Securities lending
EUR 1,994,857 (39) (962)
HSBC Global Investment Funds has entered an exclusive 12 month stock lending agreement with HSBC Bank plc. As at 30 September 2006, the value of securities lent is as follows:
Euroland Equity Europe Ex UK Equity Global Emerging Markets Equity Global Equity Global Equity Technology Pan-European Equity US Equity US Index UK Equity
5,676,205 EUR 16,143,893 USD 2,183,201 USD 9,508,463 USD
21 5,277 USD 89,576,766 EUR 2,899,040 USD
448 USD 25,301,196 GBP
I
HSBC Global Investment Funds . A

Notes to the Financial Statements (continued) c pp--
b 16. Subsequent event I
The following investment advisers changed their names:
Effective on 29 September 2006:
- HSBC Halbis Partners (Hong Kong) Limited changed into Halbis Capital Management (Hong Kong) Limited HSBC Main Building, 1, Queen's Road Central, Hong Kong
Effective on 2 October 2006:
- HSBC Halbis Partners (USA) Inc. changed into Halbis Capital Management (USA) Inc. 452 Fifth Avenue, 18th Floor, New York, NY 10018, USA
- HSBC Halbis Partners (UK) Limited changed into Halbis Capital Management (UK) Limited 8, Canada Square, London E14 5HQ, United Kingdom
- HSBC Halbis Partners (France) (since 1 August 2006) changed into Halbis Capital Management (France) lmmeuble Ile de France, 4, Place de la Pyramide, La Defense 9, 92800 Puteaux
- HSBC FCP2 (France)(since 1 August 2006) changed into HSBC Investments FCP (France) lmmeuble Ile de France, 4, Place de la Pyrarnide, La Defense 9, 92800 Puteaux, France
HSBC Global Investment Funds ~ . -. . ..

- -~
Charges and Expenses _. _ _ ..
Operating, Administration and Servicing Expenses
Sub-fund
RESERVE SUB-FUNDS Euro Reserve US Dollar Reserve
BOND SUB-FUNDS Brazil Bond Euro Corporate Bond Euro Credit Bond Euro Investment Grade Bond Euro Investment Grade Corporate Bond Euro High Yield Bond Global Emerging Markets Bond Global Investment Grade Bond Pan-European Government Bond Sterling Investment Grade Bond US Dollar High Yield Bond US Dollar Investment Grade Bond
EQUITY SUB-FUNDS a) International and Regional sub-funds Asia Ex Japan Equity Asia Ex Japan Equity Smaller Companies Asia Pacific Ex Japan Equity High Dividend BRlC Markets BRlC Markets Equity Emerging Europe Equity Euroland Equity Euroland Equity Smaller Companies (formerly: Pan-European Equity Smaller Companies) Euroland Value Creation Europe Ex UK Equity Global Emerging Markets Equity Global Equity Global Equity SRI Global Equity Technology Global Ex Euroland Equity Pan-European Equity Pan-European Equity High Dividend Sustainability Leaders
b) Market Specific sub-funds Brazil Equity Chinese Equity Hong Kong Equity Indian Equity Japanese Equity Korean Equity Singapore Equity Thai Equity UK Equity US Equity US Index
FREESTYLE SUB-FUNDS Asia Freestyle BRlC Freestyle Global Emerging Markets Equity Freestyle Latin American Freestyle UK Freestyle
OTHER SUB-FUNDS Turkish Convergence
i
Class A, E, M, P Class I, J,L,Y, Z
0.15% 0.15%
0.35% 0.35% 0.35% 0.25% 0.25% 0.35% 0.35% 0.25% 0.25% 0.25% 0.35% 0.25%
0.35% 0.35% 0.35%
0.35% 0.40% 0.35% 0.35%
0.35% 0.35% 0.40% 0.35% 0.35% 0.35% 0.35% 0.35% 0.35% 0.30%
0.40% 0.40% 0.35% 0.40% 0.35%
0.40% 0.40%
0.35% 0.31% 0.35% 0.25%
0.40% 0.40% 0.40% 0.40% 0.35%
0.10% 0.10%
0.25% 0.25% 0.25% 0.15% 0.15% 0.25% 0.25%
0.15% 0.15%
0.15% 0.25% 0.15%
0.25% 0.25% 0.25% 0.25% 0.25%
0.25% 0.30%
0.25%
0.25% 0.30% 0.25% 0.25% 0.25% 0.25% 0.25% 0.25% 0.20%
0.30% 0.30% 0.25% 0.30% 0.25% 0.30% 0.30% 0.25% 0.25% 0.25% 0.15%
0.30% 0.30% 0.30%
0.35% 0.25%
1
- A -- HSBC Global Investment Funds

Charges and Expenses (continued) .. . -
Management Fees Percentages
Sub-Fund name
RESERVE SUB-FUNDS Euro Reserve US Dollar Reserve
BOND SUB-FUNDS Brazil Bond Euro Corpomte Bond Euro Credit Bond Euro Investment Grade Bond Euro Investment Grade Corporate Bond Euro High Yield Bond Global Emerging Markets Bond Global Investment Grade Bond Pan -European Government Bond Sterling Investment Grad8 Bond US Dollar High Yield Bond US Dollar Investment Grade Bond
EQUITY SUB-FUNDS a) International and Regional sub-funds Asia Ex Japan Equity Asia Ex Japan Equity Smaller Companies Asia Pacific Ex Japan Equity High Dividend BRlC Markets BRlC Markets Equity Emerging Europe Equity Euroland Equity Euroland Equity Smaller Companies (formerly Pan-European Equity Smaller Companies) Euroland Value Creation Europe Ex UK Equity Global Emerging Markets Equity Global Equity Global Equity SRI Global Equity Technology Global ex Euroland Equity Pan-European Equity Pan-European Equity High Dividend Sustainability Leaders b) Market Specific Equity sub-funds Brazil Equity Chinese Equity Hong Kong Equity Indian Equity Japanese Equity Korean Equity Singapore Equity Thai EqAity UK Equty
US Index US Equity
FREESTYLE SUB-FUNDS Asia FE8Styl8 BRlC Freestyle Global Emerging Malkets Equity Freestyle Latin American Freestyle UK Freestyle
OTHER SUB-FUNDS Turkish Convergence
HSBC Global Investment Funds
Base Cumncy
EUR USD
USD EUR EUR EUR EUR EUR USD USD EUR GBP USD USD
USD USD USD USD USD EUR EUR EUR
EUR EUR USD USD USD USD EUR EUR EUR EUR
USD USD USD USD JPY USD USD USD GBP USD USD
USD USD USD USD GBP
EUR
EUR
0.50
1 .oo 1 .oo 1 .oo 0.75 0.75 1.20 1 .oo 0.75 0.75 0.75 1.20 0.75
1.50 1.50 1.50
1.50 1.75 1.50 1.50
1.50 1.50 1.50 1.50 1.50 1.50 1.50 1.50
1.75 1.50 1.50 1.50 1.50 1.50 1.50 1.50 1.50 1.50 0.75
1.75
1.35
Class A Dealina Currencv
USD
0.50
1 .oo 1 .oo 1 .oo 0.75 0.75 1.20 1 .oo 0.75 0.75 0.75 1.20 0.75
1.50 1.50 1.50
1.50 1.75 1.50 1.50
1.50 1.50 1.50 1.50 1.50 1.50 1.50 1.50
1.75 1.50 1.50 1.50 1.50 1.50 1 . 5 0 1.50 1.50 1 .50 0.75
1.75
1.35
SGD
1 .oo 1 .oo 0.75 0.75 1.20 1 .oo 0.75 0.75 0.75 1.20 0.75
1.50 1.50 1.50
1.50 1.75 1.50 1.50
1.50 1.50 1.50 1.50 1 50 1 50
1.50
1.75 1.50 1.50 1.50
1.50 1.50 1.50 1.50
0.75
1.75
1.35
GBP
0.75
1.20 1 .oo 0.75
0.75 1.20 0.75
1.50 1.50 1.50
1.50 1.75
1 S O 1.50 1.50 1.50
1.50 1.50
1.50
1.50
1.50
1.75
OTHER
JPY 1.50
CAD 1.50
EUR
1.30 1.30 1.30 1.05 1.05 1.50 1.30 1.05 1.05 1.05 1 S O 1.05
2.m 2.00 2.00
2.00 2.25 2.00 2.00
2.00 2.00 2.00 2.00 2.00 2.00 2.00 2.00
2.25 2.00 2.00 2.00 2.00 2.00 2.00 2.00 2.00 2.00 1.25
2.25
1.70
Class E Dealins Currency
USD
1.30
2.00
2.00
2.00
2.25 2.00
2.00 2.00
2.00
2.25
GBP
1.50 1.30 1.05
1.05 1.50 1.05
2.00 2.00 2.00
2.00 2.25
2.00 2.00 2.00
2.00 2.00
2.00
2.00
2.00
2.25
OTHER
JPY 2.00
SGD2.25
.

. ..
Charges and Expenses (continued) . .
Management Fees Percentages (continued)
Sub-Fund name
RESERVE SUE-FUNDS Euro Reserve US Dollar Reserve
BOND SUB-FUNDS Brazil Bond Euro Corporate Bond Euro Credit Bond Euro Investment Grade Bond Euro Investment Grade Corporate Bond Euro High Yield Bond Global Emerging Markets Bond Global Investment Grade Bond Pan-European Government Bond Stelling Investment Grade Bond US Dollar High Yield Bond US Dollar Investment Grade Bond
EQUITY SUB-FUNDS a) International and Regional sub-funds Asia Ex Japan Equity Asia Ex Japan Equity Smaller Companies Asia Pacific Ex Japan Equity High Dividend ERIC Matkets BRlC Markets Equity Emerging Europe Equity Euroland Equity Euroland Equity Smaller Companies (formerly: Pan-European Equity Smaller Companies) Euroland Value Creation Europe Ex UK Equity Global Emerging Markets Equity Global Equity Global Equity SRI Global Equity Technology Global Ex Euroland Equity Pan-European Equity Pan-European Equity High Dividend Sustainability Leaders b) Market Specific sub-funds Brazil Equity Chinese Equity Hong Kong Equity Indian Equity Japanese Equity Korean Equity Singapore Equity Thai Equity UK Equity US Equity US Index
FREESTYLE SUB-FUNDS Asia Freestyle
BRlC Freestyle Global Emerging Markets Equity Freestyle Latin American Freestyle UK Freestyle
OTHER SUB-FUNDS Turkish Convergence
HSBC Global Investment Funds
Base Currency
EUR USD
USD EUR EUR EUR EUR EUR USD USD USD GBP USD USD
USD USD USD USD USD EUR EUR EUR
EUR EUR USD USD USD USD EUR EUR EUR EUR
USD US0 USD USD JPY USD US0 US0 GBP USD USD
USD
USD USD USD GBP
EUR
EUR
0.25 0.25
0.50 0.50 0.50 0.375 0.375 0.60 0.50 0.375 0.375 0.375 0.60 0.375
0.75 0.75 0.75
0.75 0.875 0.75 0.75
0.75 0.75 0.75 0.75 0.75 0.75 0.75 0.75
0.875 0.75 0.75 0.75 0.75 0.75 0.75 0.75 0.75 0.75 0.375
0.875
0.675
Class I Dealing Currency
USD
0.25 0.25
0.50 0.50 0.50 0.375 0.375 0.60 0.50 0.375 0.375
0.60 0.375
0.75 0.75 0.75
0.75 0.875 0.75 0.75
0.75 0.75 0.75 0.75 0.75 0.75 0.75 0.75
0.875 0.75 0.75 0.75 0.75 0.75 0.75 0.75 0.75 0.75 0.375
0.875
0.675
GBP
0.375
0.60 0.50 0.375
0.375 0.60
0.375
0.75 0.75 0.75
0.75 0.875
0.75 0.75 0.75
0.75 0.75
0.75
0.75
0.75
0.875
OTHER
JPY 0.75
CAD 0.75
SGD 0.875
EUR
1.25
1.25
1 .oo 1 .oo 1 .oo 1 .oo
1 .oo
Class M Dealinq Currency USD
1.25
1.25
1 .oo 1 .oo 1 .oo 1 .oo
1 .oo
SGD
1.25
1.25
1-00 1 .oo 1 .oo 1 .oo
1 .oo
GEP
1.25
1.25
1 .oo 1 .oo 1 .oo 1 .oo
1 .oo
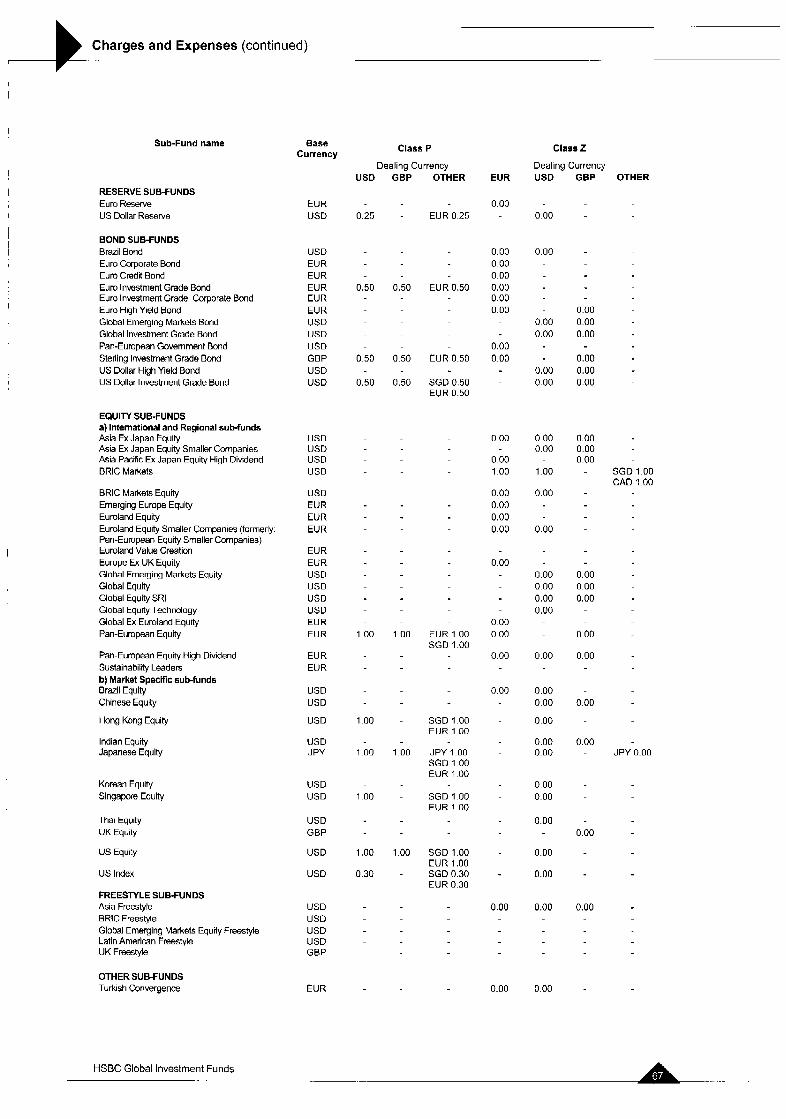
Charges and Expenses (continued) 3- Sub-Fund name Base
Currency Class P
Dealing Currency USD GBP OTHER EUR
Class 2
Dealing Currency USD GBP OTHER
RESERVE SUB-FUNDS Euro Reserve US Dollar Reserve
EUR USD
0.00 0.25 - EUR 0.25 - 0.00
BOND SUB-FUNDS Brazil Bond Euro Corporate Bond Euro Credit Bond Euro Investment Grade Bond Euro Investment Grade Corporate Bond Euro High Yield Bond Global Emerging Markets Bond Global Investment Grade Bond Pan-European Government Bond Sterling Investment Grade Bond US Dollar High Yield Bond US Dollar Investment Grade Bond
USD EUR EUR
0.00 0.00 0.00
0.50 0.50 EURO50 0.00 0.00 0.00
0.00
EUR EUR
0.00 0.00 0.00 0.00 0.00
0.00 0.00 0.00 0.00 0.00
I EUR USD USD USD GBP USD USD
0.00 0.50 0.50 EUR 0.50 0.00
0.50 0.50 SGD 0.50 - EUR 0.50
EQUITY SUB-FUNDS a) Internatlonal and Regional sub-funds Asia Ex Japan Equity Asia Ex Japan Equty Smaller Companies Asia Pacrfic Ex Japan Equity High Diwdend BRlC Markets
BRlC Markets Equrty Emerging Europe Equity Euroland Equity Euroland Equity Smaller Companies (formerly Pan-European Equity Smaller Companies) Euroland Value Creation Europe Ex UK Equity Global Emerging Markets Equity Global Equity Global Equity SRI Global Equity Technology Global Ex Euroland Equity Pan-European Equity
Pan-European Equity High Dividend Sustainability Leaders b) Market Specfic sub-funds Brazil Equity Chinese Equity
Hong Kong Equity
Indian Equity Japanese Equity
US0 USD USD US0
USD EUR EUR EUR
0.00
0.00 1 .oo
0.00 0.00 0.00 0.00
0.00
0.00 0.00 0.00 0.00
0.00 1.00 - SGD 1.00
CAD 1.00 0.00
0.00
EUR EUR USD USD us0 USD EUR EUR 1.00 1.00
EUR EUR
0.00 0.00 0.00 0.00 0.00 0.00 0.00
0.00
0.00 0.00
0.00 EUR 1.00 0.00 SGD 1 .OO
0.00
USD USD
USD
USD JPY
0.00 0.00 0.00
0.00
0.00 0.00
0.00
1 .oo SGD 1.00 - EUR 1.00
JPY 1 .OO SGD 1 .OO EUR 1 .OO
SGD 1.00 - EUR 1 .OO
0.00 - JPY 0.00 1.00 1.00
Korean Equity Singapore Equity
Thai Equity UK Equity
US Equity
US Index
FREESTYLE SUB-FUNDS Asia Freestyle BRlC Freestyle Global Emerging Markets Equity Freestyle Latin American Freestyle UK Freestyle
OTHER SUB-FUNDS Turkish Convergence
USD US0
0.00 0.00 1.00 -
USD GBP
0.00 0.00
USD 1.00 1.00 SGD 1.00 - 0.00
US0 0.30 - SGD 0.30 - 0.00 EUR 1 .OO
EUR 0.30
USD 0.00 0.00 0.00 USD USD USD GBP
EUR 0.00 0.00
HSBC Global Investment Funds

_ _ _. _ _
Publication of TER (Total Expenses Ratio) - Information concerning the Swiss Investors . __ .~
TER including the performance fees
Asia ex Japan Equity Class Class Class Class Class Class Class Class Class
Class Class
Class Class Class Class
Asia ex Japan Equity Smaller Companies
Asia Pacific ex Japan Equity High Dividend
Brazil Equity
BRlC Markets
BRlC Markets Equity
Chinese Equity
Emerging Europe Equity
AC ACH AD ADH ED IC ID zc ZD
AC AD
AC AD ID ZD
Class AC Class AD Class EC Class IC Class ID Class ZC
Class ZC
Class AC Class AD Class EC Class IC Class J 1 C Class ZC
Class AC Class AD Class EC Class IC Class ID Class ZC Class ZD
Class AC Class AD Class IC Class ID Class ZC
1.84 % 1.85 % 1.84 % 1.88 % 2.35 Yo 1.01 % 1.00 % 0.25 % 0.26
1.84 % 1.84 %
1.85 Yo
1.85 % 0.96 Yo 0.24 Yo
2.15 Yo 2.15 Yo 2.65 % 1.17 % 1.16 % 0.30 %
1.25 %
1.82 %
2.33 % 0.75 % 0.84 % 0.25 Yo
1.85 %
1.90 % 1.90 % 2.40 % 1.05 %
0.30 % 0.30 %
1.05 %
2.15 % 2.14 % 1.17 %
0.31 % 1.16 Yo
I
HSBC Global Investment Funds . . _.

. .- - ...
Publication of TER (Total Expenses Ratio) - Information concerning the Swiss Investors (continued) _.
Euroland Equity Class Class Class Class
Class Class Class Class
Class Class
Class Class
Class Class
Class Class Class Class Class Class
Euroland Equity Smaller Companies
Euroland Value Creation
Sustainability Leaders
Europe Ex UK Equity
Global Emerging Markets Equity
AC AD ED zc
1.85 % 1.85 % 2.35 % 0.27 %
AC AD IC
1.85 % 1.85 % 1.00 % 0.25 % zc
MIC M I D
1.59 % 1.60 %
M I C M I D
1.54 % 1.70 %
AC AD
1.85 % 1.85 %
AC AD EC ED IC ZD
1.89 % 1.89 % 2.39 % 2.36 % 1.04 % 0.29 %
Global Equity Class AC Class AD Class ZD
1.85 %
0.25 % 1.84 Yo
Global Equity SRI
Global Equity Technology
Global Ex Euroland Equity
Class AC Class AD Class ZC
1.85 %
0.25 % 1.86 Yo
Class AC Class AD Class ED
1.85 Yo 1.84 % 2.41 %
Class AC Class AD Class ZC
1.85 % 1.84 % 0.25 %
Hong Kong Equity Class AC Class AD Class PD Class ZD
1.85 % 1.85 % 1.34 Yo
0.25 % Indian Equity
Class AC Class AD
1.89 Yo
1.89 %
HSBC Global Investment Funds ..- ~-
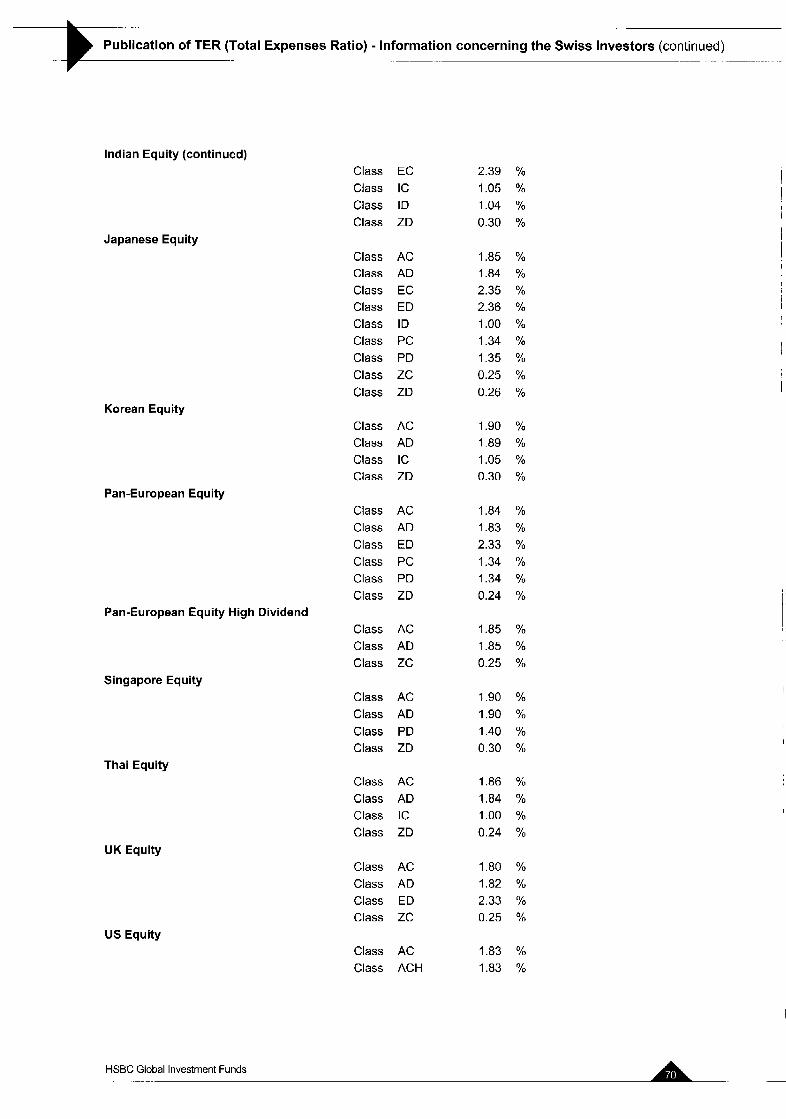
-
Publication of TER (Total Expenses Ratio) - Information concerning the Swiss Investors (continued) _-__ _ _ .
Indian Equity (continued)
Japanese Equity
Korean Equity
Pan-European Equity
Class EC Class IC Class ID Class ZD
Class AC Class AD Class EC Class ED Class ID Class PC Class PD Class ZC Class ZD
Class AC Class AD Class IC Class ZD
Class Class Class Class Class Class
Class Class Class
Class Class Class Class
Pan-European Equity High Dividend
Singapore Equity
Thai Equity
UK Equity
US Equity
AC AD ED PC PD ZD
AC AD ZC
AC AD PD ZD
Class AC Class AD Class IC Class ZD
Class AC Class AD Class ED Class ZC
Class AC Class ACH
2.39 % 1.05 % 1.04 % 0.30 %
1.85 % 1.84 % 2.35 % 2.36 % 1.00 % 1.34 % 1.35 % 0.25 Yo
0.26 %
1.90 % 1.89 % 1.05 % 0.30 %
1.84 % 1.83 % 2.33 % 1.34 % 1.34 Yo
0.24 %
1.85 % 1.85 % 0.25 %
1.90 % 1.90 % 1.40 % 0.30 %
1.86 % 1.84 % 1.00 % 0.24 %
1.80 % 1.82 % 2.33 % 0.25 Yo
1.83 % 1.83 %
HSBC Global Investment Funds -

Publication of TER (Total Expenses Ratio) - Information concerning the Swiss Investors (continued) .- ._ _
US Equity (continued) I
US Index
BRlC Freestyle
Class AD Class ADH Class ED Class PD Class ZC Class ZD
Class AC Class AD Class PD
Asia Freestyle Class AC Class ACH Class AD Class ADH Class ED Class IC
Class Class Class Class
Class Class
Class Class
Class
Class Class Class
Class Class Class
Global Emerging Markets Equity Freestyle
Latin American Freestyle
UK Freestyle
Brazil Bond
Euro Corporate Bond
J I C M I C M2C M2D
M I C M I D
M I C M I D
MID
AC AD zc
AC AD zc
Euro Credit Bond Class AC Class AD Class IC Class ZC Class ZD
1.83 % 1.83 % 2.32 % 1.34 % 0.25 % 0.26 Yo
1.00 Yo
1.00 Yo
0.55 Yo
2.14 %
2-14 % 2.14 % 2.67 %
2.14 %
1.17 Yo
4.70 % 1.56 % 1.54 % 1.41 %
1.45 Yo
1.39 %
1.39 % 1.41 %
1.36 Yo
1.33 % 1.34 % 0.25 Yo
1.35 Yo
1.35 Yo
0.26 Yo
1.35 % 1.35 % 0.75 % 0.25 % 0.25 %
HSBC Global Investment Funds _. ~- - .- _. _ . - .__ __

Publication 3 1 .-
of TER (Total Expenses Ratio) - Information concerning the Swiss Investors (continued)
Euro Investment Grade Bond Class AC Class AD Class IC Class ZC
1-00 % 1.00 Yo 0.53 Yo
0.15 %
Euro Investment Grade Corporate Bond
Euro High Yield Bond
Class AC Class AD Class ZC
1.01 % 1.00 Yo
0.15 Yo
Class AC Class AD Class IC Class ZC
1.55 % 1.55 % 0.86 % 0.25 Yo
Global Emerging Markets Bond Class AC Class AD Class IC Class ZC
1.35 Yo
1.35 Yo
0.75 Yo
0.25 % Global Investment Grade Bond
Pan European Government Bond
Class AC Class AD Class ZD
1.00 % 1.00 % 0.16 %
Class AC Class AD Class IC Class ID
1.00 % 1-00 Yo 0.53 Yo 0.53 %
Sterling Investment Grade Bond
US Dollar High Yield Bond
Class PD Class ZD
0.75 % 0.14 %
Class AC Class AD Class ZC
1.55 % 1.56 % 0.25 %
US Dollar Investment Grade Bond Class AC Class AD Class PD Class ZC Class ZD
1.00 % 1.00 % 0.75 % 0.15 % 0.16 %
Euro Reserve
US Dollar Reserve
Class AC Class AD
0.65 % 0.66 Yo
Class AC Class AD Class PD
0.65 % 0.63 % 0.40 Yo
HSBC Global Investment Funds .
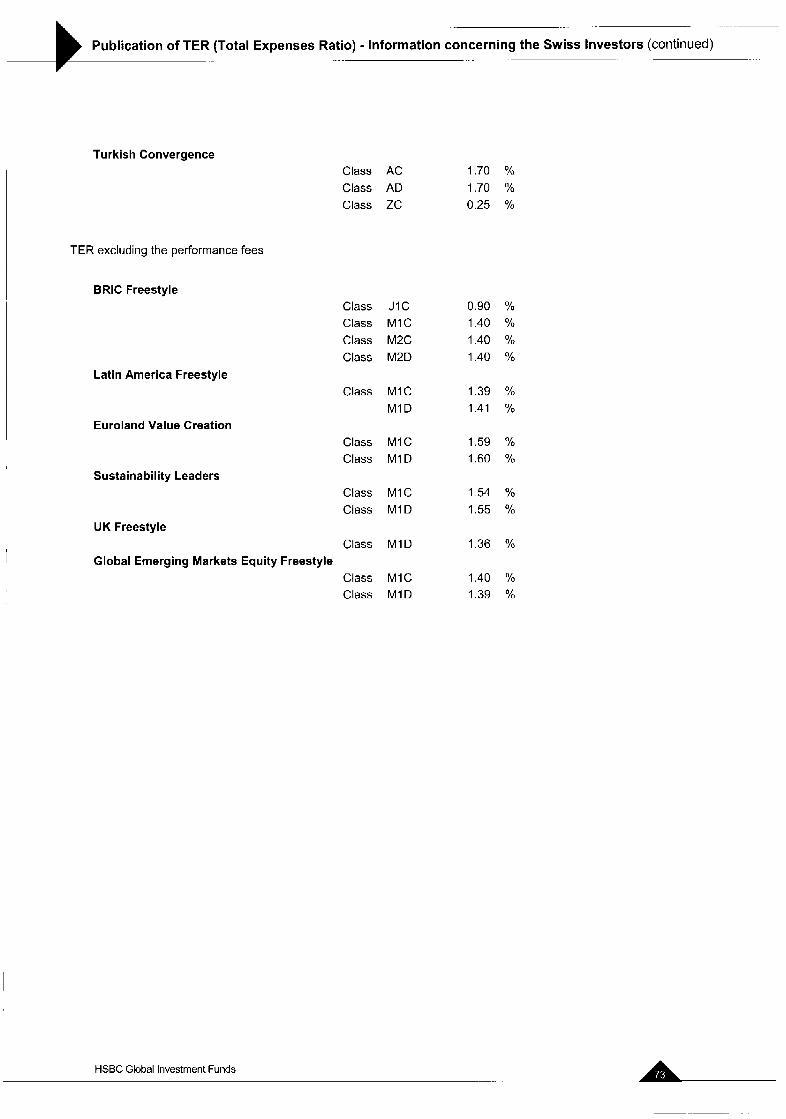
...
Publication of TER (Total Expenses Ratio) - Information concerning the Swiss Investors (continued) .. . .. .. ..
Turkish Convergence Class AC Class AD Class ZC
TER excluding the performance fees
BRlC Freestyle Class Class Class Class
Latin America Freestyle Class
Euroland Value Creation Class Class
Class Class
Class
Class Class
Sustainability Leaders
UK Freestyle
Global Emerging Markets Equity Freestyle
J1 C MIC M2C M2D
MIC M I D
M I C M I D
M I C M I D
M I D
M I C M I D
1.70 % 1.70 % 0.25 Yo
0.90 % 1.40 % 1.40 Yo 1.40 %
1.39 % 1.41 %
1.59 % 1.60 %
1.54 % 1.55 %
1.36 %
1.40 % 1.39 Yo
HSBC Global Investment Funds

Comparative Table of Net Assets _.
at 31 March 2006 at 30 September 2006 __.. __ at 31 March 2005
- .. -_ .
I ASIA EX JAPAN EQUITY USD
Net Asset Value per Share
CLASS A C
CLASS A C H
CLASS A D
CLASS A D H
CLASS E D
CLASS I C
CLASS I D
CLASS z c CLASS Z D
27.55
NIA
26.53 NIA
26.17
NIA
NIA
27.89 NIA
35.98 15.54 34.42
NIA
33.97 34.59
34.59
37.00 NIA
37.69 16.73
35.85 16.67
35.47 36.39
NIA
39.07 35.90
I
Total Net Assets 354,554,ao4 582,349,188 528,470,694
ASIA EX JAPAN EQUITY SMALLER COMPANIES USD I
I
Net Asset Value per Share
CLASS A C
CLASS A D
16.87
16.67 21.57 21.17
22.50 21.91 I
Total Net Assets
ASIA PACIFIC EX JAPAN EQUITY HIGH DIVIDEND USD
32,023,474 31,219,270 29.1 68,332 _.
I ... - . -.
Net Asset Value per Share
11.89 , CLASS A C 10.17 11.71 CLASS A D
CLASS I D
CLASS Z D
Total Net Assets
B R A ~ L EQUITY USD
10.17 NIA
NIA
11.21 I 1.44
NIA
11.20 1 1 -46
11.21
234 ~ 747,567 192,121,007 155,027,144 .. ._
Net Asset Value per Share
CLASS A C
CLASS A D
CLASS E C
CLASS I C
CLASS I D
CLASS z c
Total Net Assets
HSBC Global Investment Funds
12.30 12.30
NIA
NIA
NIA
12.42
39,199,791
. . . . . . . . . .. _
23.80 23.78 23.79
23.82 23.82
24.49
23.35 23.25 23.28
23.48 23.48
24.24
351,102,078 582,680,493
_. .
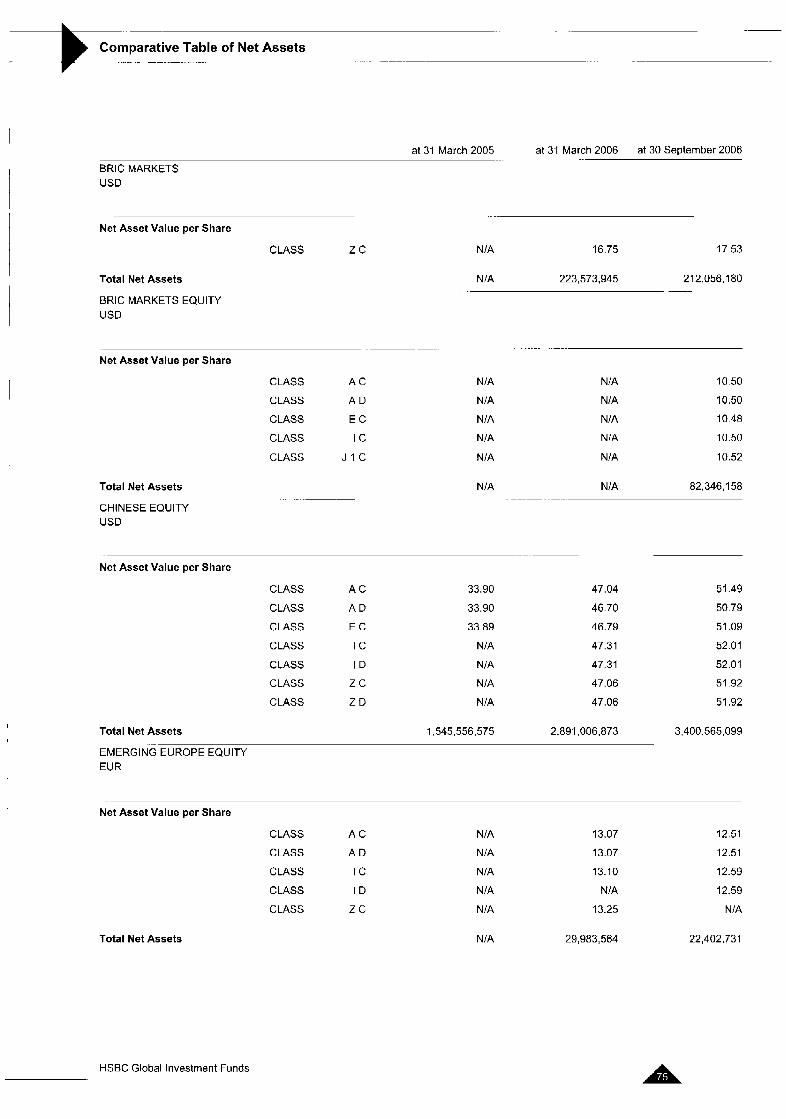
.~ ~~
Comparative Table of Net Assets - . . . .- -. -.
at 31 March 2006 at 30 September 2006 .. .
at 31 March 2005
BRlC MARKETS USD
Net Asset Value per Share
CLASS z c
Total Net Assets
BRlC MARKETS EQUITY USD
Net Asset Value per Share
CLASS A C
CLASS A D
CLASS E C
CLASS I C
CLASS J I C
Total Net Assets
CHINESE EQUITY USD
NIA 16.75 17.53
NIA 223,573,945 21 2.056,180 .
NIA
NIA
NIA
NIA
NIA
NIA NIA 82,346,158
Net Asset Value per Share
CLASS A C
CLASS A D
CLASS E C
CLASS I C
CLASS I D
CLASS z c CLASS Z D
Total Net Assets
NIA
NIA
NIA
NIA
NIA
10.50
10.50
10.48
10.50
10.52
33.90
33.90
33.89
NIA
NIA
NIA
N/A
1,545,556,575
47.04
46.70
46.79
47.31
47.31
47.06
47.06
2,891,006,873
EMERGING EUROPE EQUITY EUR
51.49
50.79
51.09
52.01
52.01
51.92
51.92
3,400,565,099
Net Asset Value per Share
CLASS A C
CLASS A D
CLASS I C
CLASS I D
CLASS z c
Total Net Assets
NIA
NIA
NIA
NIA
NIA
13.07
13.07
13.10
NIA
13.25
12.51
12.51
12.59
12.59
NIA
NIA 29,983,564 22,402,731
HSBC Global Investment Funds .- .- -

Comparative Table of Net Assets _- -
-
.... . . .. .~
at 31 March 2005 at 31 March 2006 at 30 September 2006
EUROLAND EQUITY EUR
Net Asset Value per Share
CLASS A C
CLASS A D
CLASS E D
CLASS Z C
22.07
22.02
N/A
22.80
29.99
29.92
29.81
31.47
29.47
29.40
29.22
31.19
Total Net Assets 50,171,277 292,922,023 451,629,240
EUROLAND EQUITY SMALLER COMPANIES EUR
. -
_ .... - .. _ . __ Net Asset Value per Share
CLASS A C
CLASS A D
CLASS I C
CLASS z c
27.27
N/A
NIA
28.1 1
39.50
39.50
NIA
41.37
30.43
38.43
38.48
40.57
Total Net Assets 60,907,458 88,517,699 62,551,268
EUROLAND VALUE CREATION EUR
._ .. ...
Net Asset Value per Share
CLASS M I C
CLASS M I D
9.92
N/A
13.18
13.19
Total Net Assets 5,702,275 28,902,712
13.1 1
13.16
109,398.874
SUSTAINABILITY LEADERS EUR
Net Asset Value per Share
CLASS M I C
CLASS M I D
NIA
N/A
10.84
10.85
11.15
11.23
16,163,470 Total Net Assets NIA 9,830,322
EUROPE EX UK EQUITY EUR
.- . .- - __ Net Asset Value per Share
CLASS A C
CLASS A D
Total Net Assets
HSBC Global Investment Funds
15.22
15.19
114,215,570
. . .. .
20.05
19.94
114,656,209
20.29
20.07
84,120.320

. ._
Comparative Table of Net Assets . ..
at 31 March 2006 at 30 September 2006 -.
at 31 March 2005 . . . ..
GLOBAL EMERGING MARKETS EQUITY USD
. -
Net Asset Value per Share
CLASS A C
CLASS A D
CLASS E C
CLASS E D
CLASS I C
CLASS Z D
9.45
9.41
NIA
9.31
NIA
NIA
14.08
14.01
13.65
13.65
NIA
NIA
14.20
14.05
13.73
13.67
14.26
14.08
Total Net Assets 134,372:978 232,800,507 265,736,070
GLOBAL EQUITY US0
.- ~
Net Asset Value per Share
CLASS A C
CLASS A D
CLASS Z D
Total Net Assets
GLOBAL EQUITY SRI USD
Net Asset Value per Share
CLASS A C
CLASS A D
CLASS W C
CLASS z c
Total Net Assets
GLOBAL EQUITY TECHNOLOGY USD
N /A
19.81
21.10
24.66
24.66
26.44
. .
25.01
25.01
26.75
144,629,801 164,972,157 160,090,524
11.64
NIA
11.71
11.69
13.59
13.59
13.92
13.86
14.25
14.24
14.73
14.65
1 1,6951 85 10,848,034 12,650,867
.-.
Net Asset Value per Share
CLASS A C 19.48
CLASS A D 3.26
CLASS E D 3.20
Total Net Assets 9,044,946
HSBC Global Investment Funds .-
21.17
3.55
3.46
7.91 4,102
21.63
3.62
3.53
7,10541 9
A .-

___
Comparative Table of Net Assets ~.
at 31 March 2006 at 30 September 2006 -. -.
at 31 March 2005
GLOBAL EX EUROLAND EQUITY EUR
Net Asset Value per Share
CLASS A C
CLASS A D
CLASS z c
17.24
N/A
17.80
21.17
21.17
22.21
20.67
20.67
21.86
Total Net Assets 93,199,546 59,070,237 55,116,965
HONG KONG EQUITY USD
Net Asset Value per Share
CLASS A C
CLASS A D
CLASS P D
CLASS Z D
Total Net Assets
62.84
62.70
61.60
NIA
77.94
76.63
75.78
77.42
83.63
80.69
79.68
83.10
179,118,104 194:270,521 195,976,424
INDIAN EQUITY USD
. .
Net Asset Value per Share
CLASS A C
CLASS A D
CLASS E C
CLASS I C
CLASS I D
CLASS Z D
70.41
70.41
69.72
71.66
N/A
NIA
120.49
120.49
118.72
123.69
123.69
121.42
121.45
121.45
11 9.37
125.21
125.20
123.02
Total Net Assets 2,763,872,800 6,029,705,648 5,377,690,926
JAPANESE EQUITY J PY
- .-- - ~
Net Asset Value per Share
CLASS A C
CLASS A D
CLASS E C
CLASS E D
CLASS I C
CLASS P C
CLASS P D
CLASS W D
CLASS z c CLASS Z D
Total Net Assets
HSBC Global Investment Funds
. .
6,512.80
971 -43
N/A
958.42
NIA
6,439.73
983 23
N/A
N/A
N/A
14,660.51 6,179
9,938.65
1,482.43
1,455.23
1,455.23
N/A
9,876.68
1,507.99
N/A
9,992.50
N/A
32,542,790.51 3
9,260.09
1,381.21
1,352.38
1,352.39
9,283.85
9,225.51
1,408.56
12,720.31
9,385.29
1.382.91
39,186,432,769

Comparative Table of Net Assets :--- - ..
at 31 March 2005 at 31 March 2006 at 30 September 2006
CLASS A C
CLASS A D
CLASS E D
CLASS P C
CLASS P D
CLASS W D
CLASS Z D
Total Net Assets ~.
PAN-EUROPEAN EQUITY HIGH DIVIDEND EUR
KOREAN EQUITY USD
.. . . . ... . . .. ..
Net Asset Value per Share
CLASS A C
CLASS A D
CLASS I C
CLASS Z D
NIA
N/A
N/A
N/A
Total Net Assets N/A . .. . .
PAN-EUROPEAN-EQUITY EUR
Net Asset Value per Share
28.82
28.70
28.32
29.13
28.74
N/A
N/A
497,242,491
13.56
13.56
13.58
13.65
152,431,357
13.54
13.54
13.63
13.70
146,794,062 -
37.61
37.15
36.69
38.20
37.08
N/A
N/A
568,630,360
38.15
37.45
37.03
38.84
37.18
22.74
37.49
717,165,410
Net Asset Value per Share
CLASS A C
CLASS A D
CLASS z c
11.25
N/A
11.35
14.79
14.79
15.16
14.65
14.65
15.14
Total Net Assets 76,520,434
SINGAPORE EQUITY USD
.. .
Net Asset Value per Share
CLASS
CLASS
CLASS
CLASS
Total Net Assets
HSBC Global Investment Funds
A C
A D
P D
Z D
83,304,250 73,876,342
24.08
24.08
23.98
N/A
31.55
31.02
31.02
31.26
20,725,989 26,242,522
31 -56
29.28
29.26
30.80
27,517,915

-.
Comparative Table of Net Assets
at 31 March 2006 at 30 September 2006 . .
at 31 March 2005
THAI EQUITY USD
Net Asset Value per Share
CLASS A C
CLASS A D
CLASS I C
CLASS Z D
8.58
8.58
NIA
NIA
9.36
9.32
9.38
9.37
8.97
8.70
9.02
8.92
Total Net Assets 213,816,074 264,861,559 215,902.209
UK EQUITY GBP
-
_~ .- _.
Net Asset Value per Share
CLASS A C
CLASS A D
CLASS E D
CLASS z c
21.53
21.48
NIA
NIA
27.03 26-14
19.34
27.25
26.82
25.65
18.98
27.25
28,272,884 164,915,960 151,939,518 Total Net Assets
US EQUITY USD
_.
~
Net Asset Value per Share
CLASS
CLASS
CLASS
CLASS
CLASS
CLASS
CLASS
CLASS
CLASS
. .. .
A C
A C H
A D
A D H
E D
P D
W D
z c Z D
18.99
22.89
21.26
NIA
NIA
21.50
NIA
NIA
NIA
20.56
22.93
23.01
23.62
22.91
23.37
NIA
20.69
N/A
21.15
24.29
23.67
25.00
23.51
24.03
137.44
21.45
23.70
Total Net Assets 125,053,186 137,953,697 205,384,882
US INDEX USD
-.
Net Asset Value per Share
CLASS A C
CLASS A D
CLASS P D
Total Net Assets
8.41
8.38
8.42
9.30
9.23
9.27
9.62
9.48
9.28
94,645:332 101.754.702 38,515,035
I I
I I
I
I I
I i j I
HSBC Global Investment Funds .-
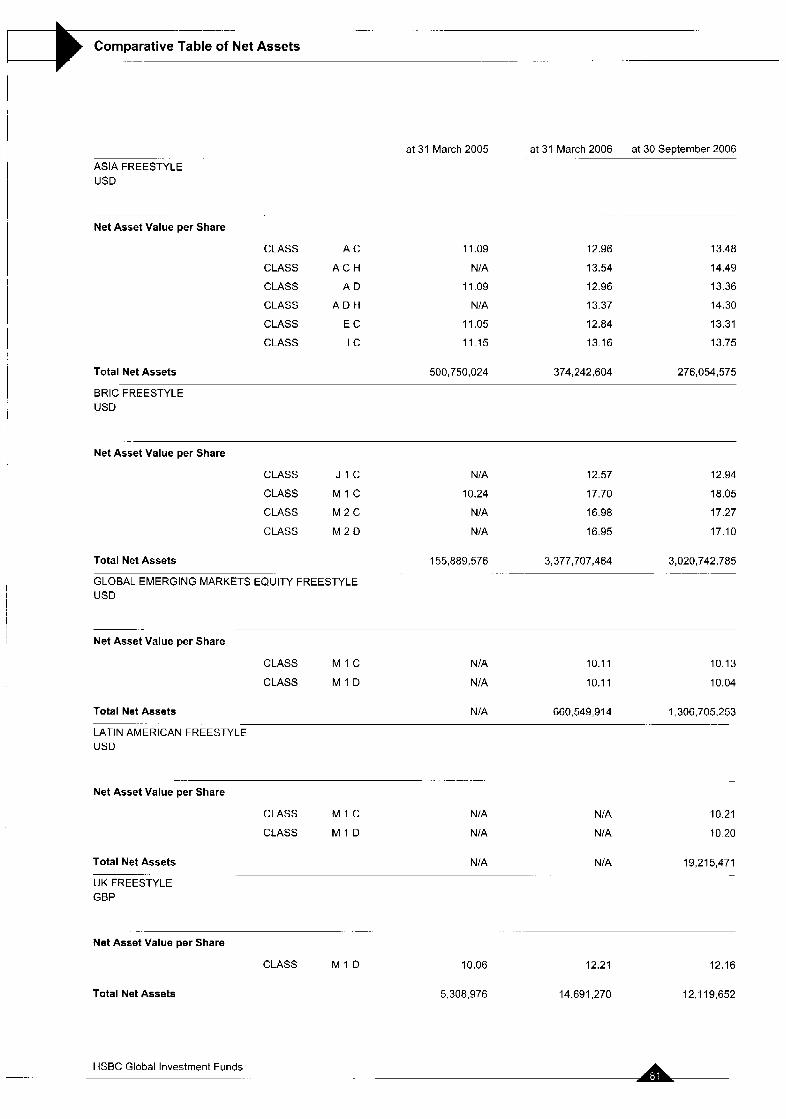
. .- ..
Comparative Table of Net Assets . -. . .
ASIA FREESTYLE USD
- ...
Net Asset Value per Share
CLASS A C
CLASS A C H
CLASS A D
CLASS A D H
CLASS E C
CLASS I C
at 31 March 2005 at 31 March 2006 at 30 September 2006
11.09
NIA
11.09
N/A
11.05
11.15
12.96
13.54
12.96
13.37
12.84
13.16
13.48
14.49
13.36
14.30
13.31
13.75
Total Net Assets 500,750,024 374,242,604 276,054,575
BRlC FREESTYLE USD
Net Asset Value per Share
CLASS J I C
CLASS M I C
CLASS M 2 C
CLASS M 2 D
NIA
10.24
NIA
NIA
12.57
17.70
16.98
16.95
12.94
18.05
17.27
17.10
Total Net Assets 155,889,576 3,377,707,464 3,020,742,785
GLOBAL EMERGING MARKETS EQUITY FREESTYLE USD
Net Asset Value per Share
CLASS M I C
CLASS M I D
NIA
NIA
10.1 1
10.1 1
10.13
10.04
Total Net Assets NIA 660,549,914 1,306,705,253
LATIN AMERICAN FREESTYLE USD
- . .
- -. . - .
Net Asset Value per Share
CLASS M 1 C NIA
CLASS M I D NIA
Total Net Assets NIA
UK FREESTYLE GBP
-. -.
Net Asset Value per Share
CLASS M I D
Total Net Assets
HSBC Global Investment Funds _-
NIA
NIA
NIA
10.21
10.20
19,215,471
10.06
5.308.976
12.21 12.16
14,691,270 12,119,652

~ .
Comparative Table of Net Assets -. ... .- .
at 31 March 2005 at 31 March 2006 at 30 September 2006
BRAZIL BOND USD
Net Asset Value per Share
CLASS A C
CLASS A D
CLASS z c
Total Net Assets
EURO CORPORATE BOND EUR
. . . - -
NIA
NIA
NIA
NIA
NIA
NIA
10.78
10.78
10.80
N/A NIA 5,565,366
Net Asset Value per Share
CLASS A C
CLASS A D
NIA
NIA
10.08
9.82
10.25
9.99
Total Net Assets NIA 48,600,380 51,496,223
EURO CREDIT BOND EUR
~
Net Asset Value per Share
CLASS A C
CLASS A D
CLASS I C
CLASS I D
CLASS Z C
CLASS Z D
16.78
16.21
16.98
16.47
16.83
NIA
16.99
15.05
17.30
NIA
17.22
16.77
17.25
15.29
17.62
NIA
17.59
17.12
Total Net Assets 98,866,400 90,422,134 48,880,086 '
EURO INVESTMENT GRADE BOND EUR
-.
I
- . .. I ..
Net Asset Value per Share
CLASS A C
CLASS A D
CLASS I C
CLASS z c
16.44
NIA
16.60
16.72
16.72
15.97
16.95
17.15
Total Net Assets 125,768.237 141,727,068
EURO INVESTMENT GRADE CORPORATE BOND EUR
~-
Net Asset Value per Share
CLASS A C
CLASS A D
CLASS z c
Total Net Assets
HSBC Global Investment Funds
NIA
NIA
NIA
10.01
9.76
10.09
17.02
16.26
17.30
17.54
175,699.859 -~
10.18
9.92
10.31
NIA 10,644,652 10,552,738
-. .. .

_..- -. - .. ..-.
Comparative Table of Net Assets ....
at 31 March 2006 at 30 September 2006 .- ...
at 31 March 2005
EURO HIGH YIELD BOND EUR
Net Asset Value per Share
CLASS A C
CLASS A D
CLASS I C
CLASS I D
CLASS z c
18.95
18.69
19.22
18.16
19.01
20.30
17.67
20.73
NIA
20.63
20.83
18.14
21.35
NIA
21 -31
Total Net Assets 126,066,364 124,271,638 73,514,971
GLOBAL EMERGING MARKETS BOND USD
Net Asset Value per Share
CLASS A C
CLASS A D
CLASS I C
CLASS z c
Total Net Assets
GLOBAL INVESTMENT GRADE BOND USD
16.08
15.13
NIA
16.09
18.59
15.76
18.60
18.81
19.21
16.28
19.27
19.54
45,943,698 119,634.250 109,580,534 . . . . . ..
._ ~ .-. . .- -
Net Asset Value per Share
CLASS A C
CLASS A D
CLASS W D
CLASS Z D
13.79
13.79
NIA
NIA
13.29
12.82
NIA
NIA
13.32
13.18
178.53
13.18
Total Net Assets 109,990.1 35 88,081,665 107,368,512 - ~- _. _
GLOBAL INVESTMENT GRADE BOND (US DOLLAR-HEDGED) USD
Net Asset Value per Share
CLASS
CLASS
A C
A D
Total Net Assets
15.88
15.51
20,535,844
HSBC Global Investment Funds .. - .. ... -
15.97
14.71
453,246
NIA
NIA
NIA
A i

__ ___
Comparative Table of Net Assets .-
at 31 March 2005 at 31 March 2006 at 30 September 2006 _ .-
PAN-EUROPEAN GOVERNMENT BOND EUR
- _ - __ . __ - .-
Net Asset Value per Share
CLASS A C
CLASS A D
CLASS I C
CLASS I D
16.17
15.74
16.32
15.65
16.49
13.15
16.72
14.92
16.87
13.45
17.15
15.30
Total Net Assets 78,232,337 117,815,022 152,475,902
STERLING INVESTMENT GRADE BOND GBP
Net Asset Value per Share
CLASS A C
CLASS P D
CLASS W D
CLASS Z D
NIA
NIA
NIA
NIA
5.69
5.63
NIA
NIA
NIA
5.58
99.11
5.63
Total Net Assets N IA 21,583,331 31,184,278
US DOLLAR HIGH YIELD BOND USD
_ __ -
Net Asset Value per Share
CLASS A C
CLASS A D
CLASS z c
NIA
N/A
NIA
10.31
NIA
10.35
10.59
10.61
10.69
Net Asset Value per Share
CLASS A C
CLASS A D
CLASS P D
CLASS w c CLASS W D
CLASS z c CLASS Z D
Total Net Assets
Total Net Assets NIA 5,172,610 5,354,350
US DOLLAR INVESTMENT GRADE BOND USD
_. .. . .-
1 1.46
11.01
10.87
NIA
NIA
NIA
NIA
52.1 69,973
11.68
10.32
10.08
NIA
NIA
11.75
NIA
46,965,872
HSBC Global Investment Funds .- _ . .
12.08 , 10.67 ' 10.44
13.83
10.48
12.21
10.68
61,023,712

__
Comparative Table of Net Assets - .-
at 31 March 2005 at 31 March 2006 at 30 September 2006
EURO RESERVE EUR
- .-....
Net Asset Value per Share
CLASS A C
CLASS A D
15.42
15.27
15.66
15.03
15.83
15.19
Total Net Assets 69,964,934 47,661,285 57,037.275
US DOLLAR RESERVE USD
-~
Net Asset Value per Share
CLASS A C
CLASS A D
CLASS P D
Total Net Assets
TURKISH CONVERGENCE EUR
15.20
8.34
8.33
51,859,445 . .
15.67
7.62
8.16
22,672,829 _-
16.03
8.00
8.36
20.21 7,103
Net Asset Value per Share
CLASS A C
CLASS A D
CLASS E C
CLASS z c
Total Net Assets
10.14
N/A
N/A
10.15
14.98
14.98
N/A
N/A
12.87
12.30
12.89
N/A
7,252,084 67,383,014 51,265,403
HSBC Global Investment Funds I- . -. . ..- A .

_.
Portfolio of Investments and Other Net Assets __ . _
ASIA EX JAPAN EQUITY Description Quantity Currency Evaluation
1,124,795
1,497,179
5,245,950
1 919,840
1.880.135
4.733.232
2,269.638
1.490.705
2,927.450
1 843,000
2.791.211
3,086,177
7,168,380
3,706,684
830,000
1,740,656
1 581 326
2,169.621
0.00
6 222 652
7.371.362
% net assets
0.21
0.28
0.99
0.36
0.36
0 90
0 43
0.28
0 55
0 35
0.53
0.58
1.36
0.70
0.16
0.33
0.30
0.41
0.00
1.18
1.39
Statement of investments as at 30 September 2006 (expressed In USD)
ClTlC INTL FIN HLD
ClTlC PACIFIC LTD
CNOOC LTD
COSCO PACIFIC LTD
DAH SING BANKING GROUP LTD ESPRIT HOLDINGS
GREAT EAGLE HOLDINGS LTD
HENDERSON INVESTM.LTD
HONGKONG &CHINA GAS
HONGKONG LAND HLDS LTD
HONGKONG+SHANGH.HOTELS
HSBC HOLDINGS PLC
HUTCHISON WHAMP
KINGBOARD CHEMICALS HOLDINGS LI & FUNG LTD
MELCO INTL DVPT LTD
NEW WORLD DEVELOPMENT
CO. LTD PCCW LTD
RIGHTS SUNG HUNG KAI
PROPERTIE SUN HUNG KAI PROPERTIES
LTD SWIRE PACIFIC LTD - A -
1,956,000 HKD
486,000 HKD
6,307,000 HKD
960,000 HKD
879.200 HKD
519.000 HKD
622.604 HKD
826.000 HKD
1249,000 HKD
475,000 US0
2,196,500 HKD
169,200 HKD
811,720 HKD
1.029500 HKD
334000 HKD
813,000 HKD
918,000 HKD
..... .........
Description Quantity Currency Evaluation net assets
INVESTMENTS
TRANSFERABLE SECURITIES ADMITTED TO AN OFFICIAL STOCK
EXCHANGE LISTING
SHARES
BERMUDA ISLANDS
FIRST PACIFIC CO LTD 3,528.000 HKD 1,657,433 0 31
PEACE MARK (HOLDINGS) 1910,000 HKD 1260.152 0 2 4
LIMITED SIM TECHNOLOGY GROUP LTD 4,948,000 HKD 1,943.468 0 37
3,551.000 HKD
570,000 HKD
570,000 HKD
705,500 HKD
4,861,053 0 92 ... ...
CAYMAN ISLANDS
PIN JIA YUAN MEDIA SERVICES 7 940.000 HKD 2.344.093 0 44
co XlNYl GLASS HOLDING CO LTD 4,852,000 HKD 1 613,046 0 31
3,957,139 ............
1,725,145
796.262
12,184
1 938,345
10,268,048
1,539.045
6 958.085
2.519 863
1,776,283
1,953 203
2.979.572
1.337.203
2,286,564
9,097.834
1,422.382
46,610,018
0.75
0 33
0 15
0 00
0 37
1 94
0 29
1 32
0 48
0 34
0 37
0.56
0.25
0 43
1 72
0 27
8.82
__
98.094 718 18 56
HKD
HKD
HKD
HKD
HKD
HKD
HKD
HKD
HKD
HKD
HKD
HKD
HKD
HKD
HKD
INDONESIA CHINA
BANK CENTRAL ASIA
BANK NIAGA TBK -A-
PERUSAHAANGASNEGARA
TBK -E- PT ASTRA INTERNATIONAL TBK
TELKOM INDONESIA /S-E-
UNITED TRACTORS
AIR CHINA LTD
BElJlNG ENTERPRISES HLD
CHINA BLUECHEMICAL LTD -H-
CHINA CONSTRUCTION BANK
CORP CHINA LIFE INSURANCE CO LTD-H- CHINA MERCHANTS BANK I-H-
CHINA PETROLEUM & CHEM
CORP -H- CHINA SHENHUA ENERGY CO - H- CHINA SHIPPING
DEVELOPMENT -H- CHINA TELECOM CORP LTD -H-
DATANG INT POWER
GENERATION-H- JIANGXI COPPER CO LTD -H-
NINE DRAGONS PAPER HLDGS
LTD PETROCHINA CO LTD 1-H-
ZlJlN MINING GROUP -H-
4,000,000
422 000
42,000
4,481,000
5,249.000
1,092,000
11,200.000
1,565,500
1,860.000
5,396,000
3,968 000
1,404 000
2,022.000
8.458 000
2 856.000
7.575000 IDR 3.961 221 0 7 5
9,786,000 IDR 784849 0 1 5
1.721 000 IDR 2.247590 0 4 3
672000 IDR 906750 0.17
4,484,000 IDR 4,106497 0 77
2,944,500 IDR 1,930706 037
13.937.613 2.64
JAPAN
KOREA ZINC CO LTD
MALAYSIA
24360 KRW 2.201 498 0.42
2,201 498 0 4 2
COMMERCE ASSET-HOLDING
BHDlFOR REG. GENTING EERHAD/FOR.REG.
IJM CORPORATION BHD
MALAKOFF BERHAD
TELEKOM MALAYSIA BHDlFOR.REG.
4,453,400 MYR 8.038 844 1.52
1.248.100 MYR 8.164821 1 5 4
333,100 MYR 560592 0 I 1
1,360,900 MYR 3.620.200 0 69
691,200 MYR 1716,742 0 3 2
22 101,199 4.18 HONG KONG
PHILIPPINES BANK OF EAST ASIA LTD 697400 HKD 3,182,319 0 6 0
EOC HONG KONG HOLDINGS 1,585,000 HKD 3 560 358 0 67
LTO CHEUNG KONG HOLDINGS E45000 HKD 9.072960 1.72
CHINA MOBILE LTD 2289000 HKD 16,174,447 306
AYALA LAND INC.
UNIVERSAL ROBINA CORP
4000.000 PHP 1,135668 0 2 1
5 010.979 PHP 1,797,097 0.34
2.932765 0 55
SINGAPORE CHINA OVERSEAS LAND AND 2.092.500 HKD 1 614,233 0 INVESTMENT CHINA RESOURCES 1.334.000 HKD 2,890,378 0 ENTERPRISE LTD
31
55 BANYAN TREE HOLDINGS LTD
CITY DEVELOPMENTS LTD
6,823,000 SGD 3,654,871 0 69
267,000 SGD 1,800416 0 34
HSBC Global Investment Funds - -.

Portfolio of Investments and Other Net Assets . ..-. . .. _..
. ..
Quantity Currency Evaluation % net assets
Description Quantity Currency Evaluation 70 net assets
Description
32aa.000 TWD
2 799.592 TWD
40.961 US0
1786.000 TWD
5087303 TWO
58.375 TWO
175.000 TWO
445.421 US0
i.2692a4 TWO
33.600 TWO
625,095 TWD
438.197 TWO
2 190.a60 TWD
97 782 TWO
1,166.454 TWD
2,312.658 TWD
202,931 USD
629,000 TWD
4665000 TWD
3673,712 TWD
1.632 000 TWD
481 859 USD
6.465476 TWD
180,723 TWD
7.188731 TWD
1979123 TWD
3 638 143
2 412.162
705,840
1 935.698
3 460.485
83.386
4 634.566
5 545.491
7,732,158
174,717
1.842 543
4 159.738
3 066.638
64.444
745 a39
2 . 1 2 ~ 951
1.248 026
750 178
2 228 310
2,754 379
2,654 418
4.654 758
11.669 216
551,825
4.031 466
2,246 723
0.69
0 46
0 13
0.37
0.65
0.02
0.88
1.05
1.46
0.03
0.35
0.79
0.58
0.01
0.14
0.40
0.24
0.14
0.42
0.52
0.50
0.88
2.21
0.10
0.76
0.43
19.35
.
DES GROUP HOLDINGS LTD
KEPPEL C O W LTD
KEPPEL LAND LTD
OSlM INTERNATIONAL LTD
OVERSEA-CHINESE BK CORP
SINGAPORE AIRLINES LTD
SINGAPORE TELEClBOARD LO1
1000 UTDOVERSEASBANKiLOCAL
VENTURE CORPORATION LTD
WING TAI HLDS
490.000
387,000
382.000
2,427,600
1 387,200
233,000
2,360.750
494 000
190 000
2,945666
SGD
SGD
SGD
SGD
SGD
SGD
SGD
SGD
SGD
SGD
-
5 928.912
3,609 szn 1.194051
2,876,158
5 726.oa9
2143011
3,630,091
5,074 488
1.508 696
3,508 512
40 655 623
1 1 2
0.68
0.23
0.54
1.08
0.41
0.69
0.96
0.29
0.66
CHI ME1 OPTOELECTRONIC
CORP CHINA STEEL
CHINA STEEL jGDS
FAR EASTONE TELECOM CO LTD FIRST FINANCIAL HOLDING
COMP FORMOSA PLASTICS
HIGH TECH COMPUTER CORP
HON HA1 PRECISION IND iGDR
HON HA1 PRECISION IND CO
LTD KING SLIDE WORKS CO LTD
KINSUS INTERCONNECT
TECHN.CORP MEDIA TEK INCORPORATION
NAN YA PLASTICS CORP
NANYA TECHNOLOGY CO LTD
POWERCHIP SEMICONDUCTOR
CORP SHIN KONG FINANCIAL HLD CO
LTD SILICONWARE PREC.IND.
rSADR SILICONWARE PRECISION
INDUSTR. SINOPAC HOLDINGS
TAIWAN CEMENT CORP
TAIWAN FERTILIZER CO LTD
TAIWAN
SEMICONDUCT MANUFXADR TAIWAN SEMICONDUCTOR
MANUFACT. TRIPOD TECHNOLOGY CO LTD
UNITED MICROELECTRONICS
CORP WISTRON CORP
7.69
SOUTH KOFiEA
DAEGU BANK
DAELIM INDUSTRIAL CO LTD
DAEWOO M3TORS SALES
CORP DAlSHlN SECURITIES CO LTD
DONGBU INSURANCE CO LTD
DOOSAN HEAVY INDUST.LCONSTR. HOTEL SHILLA
HYNIX SEMICONDUCTOR INC
HYUNDAI DEPARTMENT STORE
co HYUNDAI DEVELOPM CO-
ENG.&CONS. HYUNDAI MOTOR CO LTD
KOOKMIN BANK
KT8. G CORP
LG CORP
MEGASTUDY CO LTD
NHN CORPORATION
ORION CORPORATION
POSCO
SAMSUNG ELECTRONICS CO
LTD SAMSUNG ENGINEERING CO
LTD SAMSUNG HEAVY INDUSTRIES
SAMSUNG TECHWIN CO LTD
SHINHAN FINANCIAL GROUP
SHINSEGAE CO LTD
S-OIL CORP
WOORI INVESTMENTgSECURlT CO
129 960 KRW
27.333 KRW
157,950 KRW
118,930 KRW
156120 KRW
54.240 KRW
268.670 KRW
107070 KRW
17.340 KRW
29.130 KRW
87,070 KRW
159310 KRW
45960 KRW
143190 KRW
35.649 KRW
42040 KRW
9.083 KRW
22 988 KRW
61.260 KRW
114,600 KRW
141 720 KRW
70.590 KRW
86.460 KRW
14159 KRW
35480 KRW
73.470 KRW
2.177 278
I ,863.46n
4 474,344
2,583 320
3.696 422
2.256.002
4,188 767
4.221 353
1,246.330
1,299355
7,454.672
12 561 944
2 793.334
4 162 175
4.031 866
4.412.523
2,092 959
5 953.087
42 995.209
5 475.175
3.460 335
2 895.009
3.897.708
7,333,371
2 373 899
1.564 804
0.41
0 35
0.85
0 49
0.70
0.43
0.79
0.80
0 24
0 25
1 40
2 37
0 53
0 79
0.76
o a3
0.40
1.13
H 13
1.04
0.65
0 55
0.74
1 39
0.45
0.30
102,250 358
THAILAND
BANGKOK BANK PUBLIC !FOR
REG ITALIAN-THAI DEV PUB :FOR
REG THAI OIL PUBLIC C0:FOR REG
THANACHART
CAP PUBLjFOREIGN
1.512800 THE 4.431 112 0 8 4
5.432 100 THB 817,250 0.15
1.585 700 THE 2,533.441 0 4 8
1,001 400 THB 397.313 0.08
8.179 116 1.55
A87.245,809 92.20 TOTAL SHARES
INVESTMENT COMPANIES 141,464 709 26.77
TAIWAN BERMUDA ISLANDS
ACER INC
ASIA CEMENT CORP
ASUSTEK CDMPUTER INC
AU OPTRONICS CORP
CATCHER TECHNOLOGY CO
LTD CATHAY FINANCIAL HOLDING
CATHAY FIN.HLD!GDR REG-S
CHANG HWA COMMERCIAL
BANK
1,034 000
2 896.560
1 989.515
3 926.504
370 213
TWD
TWO
TWD
TWD
TWD
1,753 680
2.101,651
4.626.443
5,561,379
3.178 607
0.33
0.40
0.88
1.05
0.60
MACQUARIE INTL
INFRASTRUCTURE
12,068.000 SGD 7,224,979 1 37
7,224.979 1 37
TOTAL INVESTMENT COMPANIES 7,224.979 1.37
TOTAL TRANSFERABLE SECURITIES ADMITTED TO AN OFFICIAL STOCK EXCHANGE LISTING 494.470.786 93.57 1.519.992
233.993
3.579,OOO
TWD
USD
TWO
3 046,644
4 703.259
2.1 58,597
0 58
0.89
0 41
HSBC Global Investment Funds

---F I
-_ -.
Portfolio of Investments and Other Net Assets - _.
Description Quantlty Currency Evaluation Yo net assets
...
TRANSFERABLE SECURITIES TRADE0 ON ANOTHER REGULATED MARKET
SHARES
TAIWAN
VANGUARD 31.601 TWD 20.254 000 INTL SEMICONDUCT WISTRON CORP jGDR 2,736 USD 31,059 0.01
51.313 001
TOTAL SHARES 51,313 0.01
TOTAL TRANSFERABLE SECURITIES TRADED ON ANOTHERREGULATEDMARKET 51,313 0.01
TOTALINVESTMENTS 494,522!%1 . 3.z
OTHER NET ASSETS LESS LIABILITIES 33.948.593 6.42
TOTAL NET ASSETS 528,470,694 100.00
HSBC Global Investment Funds . .

___.
Portfolio of Investments and Other Net Assets - __ .- - ._ .-
ASIA EX JAPAN EQUITY
Economic Division of Investment
(expressed as a percentage of net assets)
Electronics and electrical equipment Banks and financial institutions Holding companies News transmission Real estate companies Energy Gastronomy Insurance Coal mines, heavy industries Office equipment and computers Automobile industry Mechanics, machinery Public services Construction, building materials Retail trade, department stores Internet Software Investment companies Textile Chemicals Transport Pharmaceuticals and cosmetics Food Other business houses Non-ferrous metals Miscellaneous Tobacco and spirits Graphic art and publishing Forest products and paper industry Other services Clock and watch-making industry
Other net assets less liabilities
Yo
22.65
7.93 6.36 5.73 5.39 3.88 2.64 2.47 2.20 1.94 1.93 1-80 1.78 1.63 1.59 1.37 1.24 1.10 1.10 0.79 0.74 0.70 0.67 0.55 0.53 0.44 0.43 0.28 0.24
13.48
6.42
Total Net Assets
HSBC Global Investment Funds
100.00
. . . . . . ..

_ _
Portfolio of Investments and Other Net Assets . __ -
ASIA EX JAPAN EQUITY SMALLER COMPANIES Statement of Investments as at 30 September 2006 (expressed in USD)
... . _ _ .
Description Quantity Currency Evaluation % net assots
INDONESIA
UNITED TRACTORS 1.577.000
695,000
4.700
191,500
195 600
186,000
29.000
4,704.000
114.000
776.000
371 000
780,000
1.253,OOO
694 000
623,000
17.860
15 640
12,400
1 1.400
68.390
4 530
4 490
6,500
4,263
16,589
1,212
19.740
12.050
293 760
IDR 1.034.037 3 55
1.034 037 3.55 Descrlptlon Quantity Currency Evaluatlon "io net assets ISRAEL
SARIN TECHNOLOGIES LTD SGD 229,944 0.79 INVESTMENTS
TRANSFERABLE SECURITIES ADMITTED TO AN OFFICIAL STOCK
EXCHANGE LISTING
SHARES
229.944 0.79
JAPAN
KOREA ZINC CO LTD KRW 424755 1.46
424.755 1.46
MALAYSIA
COMMERCE ASSET-HOLDING
BHD8FOR.REG. IJM CORPORATION BHD
RESORTS WORLD
UCHl TECHNOLOGIES BHD
BERMUDA ISLANDS MYR 345.677 1.19
PEACE MARK (HOLDINGS)
LIMITED REGAL HOTELS INTL
SIM TECHNOLOGY GROUP LTD
TAI CHEUNG HOLDINGS LTD
340,000
I 200,000
750.000
527 000
240.000
296,000
316 000
384.000
195 000
20 500
1,352 000
1.184 000
406,000
502 000
380,000
420,000
413,000
34.000
45,000
102.000
122.000
26,000
23 000
HKD 224,320 0.77
HKD 100,120 034
HKD 294.584 1.01
HKD 264,493 091
MYR 329.186 1.13
MYR 560,423 1.92
MYR 24,403 0.08
1.259.689 4.32 883,517 3.03 PHILIPPINES
CAYMAN ISLANDS AYALA LAND INC PHP 1,335,546 4 58
AAC ACOUSTIC
TECHNOLOGIES HLD CHINA PARADISE ELEC.RETAIL
LTD CHINA WIRELESS
TECHNOLOGIES FAR EAST CONSORTIUM INTL
LTD LIFESTYLE INTL HLD LTD
PARKSON RETAIL GROUP LTD
QIN JIA YUAN MEDIA SERVICES
co WIN HANVERKY HOLDINGS LTD
HKD 277255 095
HKD 79028 027
HKD 61 248 021
HKD 158.713 054
HKD 385462 132
HKD 75.915 026
WKD 399 145 137
HKD 525,841 1 81
1.335 546 4.58
SINGAPORE -
BANYAN TREE HOLDINGS LTD
HO BEE INVESTMENT LTD
HOTEL PROPERTIES
INTER-ROLLER ENGINEERING
LTD MEIBAN GROUP
WHEELOCK
PROPERT(SINGAP0RE) LTD WING TAI HLDS
SGD 61.066 0.21
SGD 464,583 1.59
SGD 481 636 1.65
SGD 407,991 1.40
SGD 225,047 0.77
SGD 782.871 2.69
SGD 742,040 2.54 1 962.607 6.73
3,165,234
220,873
262.024
351 262
269 916
1.066 252
325 598
560,020
281,347
482.141
400,665
279,276
943.106
494 190
10 85 CHINA
SOUTH KOREA
ANGANG NEW STEEL CO LTD -
H- BElJlNG CAP INTL AIRPORT -H-
CHINA CONSTRUCTION BANK
CORP CHINA LIFE INSURANCE CO
LTD-H- NINE DRAGONS PAPER HLDGS
LTD
HKD 322 584 1 11
HKD 329269 113
HKD 164377 056
HKD 821 600 282
HKD 467038 160
BANK OF PUSAN
DAEGU BANK
DAEWOO MOTORS SALES
CORP DONGBU INSURANCE CO LTD
HOTEL SHILLA
HYUNDAI DEPARTMENT STORE
co HYUNDAI MlPO DOCKYARD CO LTD KOREA INVESTMENT
HOLDINGS CO MEGASTUDY CO LTD
MODETOUR NETWORK INC
ORION CORPORATION
SAMSUNG ENGINEERING CO
LTD SAMSUNG TECHWIN CO LTD
KRW
KRW
KRW
KRW
KRW
KRW
KRW
KRW
KRW
KRW
KRW
KRW
KRW
0 76
0 90
1 20
0 93
3 65
1.12
1 92
0 96
1.65
1 37
0 96
3 23
1 69
20 34
2,104.868 1.22 HONG KONG
CHEUNG KONG HOLDINGS
ESPRIT HOLDINGS
HONGKONG LAND HLDS LTD
LIU CHONG HlNG BANK LTD
SWIRE PACIFIC LTD - A -
TELEVISION BROADCASTS LTO
HKD 365,066 1.25
HKD 410,395 140
USD 395.760 136
HKD 270,915 0.93
HKD 271 65Y 093
HKD 123995 043
1.837 79@ 6.30 5,936 670
TAIWAN
ASIA CEMENT CORP TWO 213.143 0 73
HSBC Global Investment Funds

Portfolio of Investments and Other Net Assets
Descrlotlon Quantity Currency Evaluation % net assets
AU OPTRONICS CORP
CATCHER TECHNOLOGY CO
LTD CHONG HOYG CONSTRUCTION
CO LTD CHUNG HWA PULP CORP
ELITE MATERIAL CO LTD
EPISTAR CORP
EVERLIGHT ELECTRONICS LTD
FORMOSA INTL HOTELS CORP
GOLDSUN DEVPT & CONSTRUCTION HOLTEK SEMICONDUCTOR INC
HON HA1 PRECISION IND.CO LTD HOTA INDUSTRIAL
MANUFACTURING KING SLIDE WORKS CO LTD
KINSUS INTERCONNECT TECHN.CORP MIRLE AUTOMATION CORP
RICHTEK TECHNOLOGY CORP
SHlHLlN ELEC.8ENGINEERING
CORP SILICONWARE PRECISION
INDUSTR. TAIWAN CEMENT CORP
TAIWAN FERTILIZER CO LTD
TAIWAN SEWICONDUCTOR MANUFACT TRIPOD TECHNOLOGY CO LTD
WISTRON CORP
253,730 TWD
20955 TWD
e3433 TWD
287,000 T W O
313000 T W O
47,238 TWO
70380 TWD
99 000 TWD
596700 TWD
96955 TWD
92,694 TWD
136200 TWD
27200 TWD
43,762 TWD
112,636 TWD
2400 TWD
264000 TWD
262695 TWD
196 370 TWD
iagooo TWO
479,192 TWD
97,553 TWD
127109 TWO
359,375
179,917
232.056
119,737
157 079
154.Y4Y
194,474
269,367
239.924
167.36e
564.669
184,880
141 437
128.994
99,773
19.191
253,405
313,304
147 229
307 405
864 871
297.871
144 296
123
0 62
0 80
0 4 1
0 54
0 53
0 67
0 92
0 82
0 57
1 Y5
0 63
o 48
0 44
0 34
0 07
0 87
1 07
0 50
1 05
2 98
1 02
0 49
5,754.714 19.73
THAILAND
THAI OIL PUBLIC CO/FOR.REG.
UNlVANlCH PALM OIL
PUBL.CO/FOR
34.800 THE 55,599 0 19
75900 THE 68211 0 2 3
TOTAL SHARES
INVESTMENT COMPANIES
BERMUDA ISLANDS
MACQUARIE INTL
INFRASTRLCTURE
26,053,181 89.32
1,160,000 SGD 694,479 2.38
694479 2.38
TOTAL INVESTMENT COMPANIES 694.479 2.38
TOTAL TRANSFERABLE SECURITIES ADMITTED TO AN OFFICIAL STOCK EXCHANGE LISTING 26,747,660 91.70
TRANSFERAQLESECURlTlESTRADEDONANOTHERREGULATED MARKET
SHARES
TAIWAN
Description Quantity Currency Evaluation % net assets
. .. . __ . WISTRON CORP lGDR 14497 US0 164,570 0.57
439050 1.51
TOTAL SHARES 439,050 1.51
TOTAL TRANSFERABLE SECURITIES TRADED ON
ANOTHERREGULATEDMARKET
OTHER TRANSFERABLE SECURITES
SHARES
TAIWAN
SHIN ZU SHING CO LTD 16,000
439,050 1.51
TWD 93,840 0.32
93,840 0 3 2
TOTAL SHARES
TOTAL OTHER TRANSFERABLE SECURITIES
TOTAL INVESTMENTS
OTHER NET ASSETS LESS LIABILITIES
TOTAL NET ASSETS
93,840 0.32
93,840 0.32
27.280.550 93.53
~ 1!087,702 6.47
29.168.332 100.00
CHIPBOND TECHNOLOGY 109,000 TWD 113.358 0 3 9 CORP TAIWAN CHI CHENG 60.770 TWD 161.122 0 5 5 ENTERPRISE
HSBC Global Investment Funds . .. .

-
Portfolio of Investments and Other Net Assets .-
ASIA EX JAPAN EQUITY SMALLER COMPANIES
Economic Division of Investment - __ . -.
(expressed as a percentage of net assets)
Electronics and electrical equipment Real estate companies Gastronomy Mechanics, machinery Banks and financial institutions Construction, building materials Insurance Automobile industry Textile Holding companies Retail trade, department stores Transport Investment companies Forest products and paper industry Internet Software Non-ferrous metals Graphic art and publishing News transmission Coal mines, heavy industries Office equipment and computers Chemicals Food Precious metals Clock and watch-making industry Other business houses Photography and optics Agriculture and fishing Energy
Other net assets less liabilities
Total Net Assets
%
20.52 11.86 11.38 5.63 4.34 3.98 3.75 3.55 3.21 2.80 2.70 2.50 2.38 2.01 1.65 1.46 1.37 1.22 1.11 1.06 1.05 0.96 0.79 0.77 0.63 0.43 0.23
0.19
6.47
100.00
-
HSBC Global Investment Funds .- - -.. ..

__...
Portfolio of Investments and Other Net Assets -
ASIA PACIFIC EX JAPAN EQUITY HIGH DIVIDEND Statement of Investments as at 30 September 2006 (expressed in USD)
Doscription Quantity Currency Evaluation "h net assets
MALAYS I A
BERJAYA SPORTS TOTO BHD 1.336 500
BRITISH AMERICAN TOBACCO 308.500
MAXIS COMMUNICATIONS BHD 843.400
MYR 1.697833 1 1 0
MYR 3.579906 2 3 1
MYR 2,037,529 1 31
. .. .
Description Quantity Currency Evaluation Yo net assets
~. . 7.315268 4 7 2
SINGAPORE INVESTMENTS
BANYAN TREE HOLDINGS LTD 1 041.000
BRILLIANT MANUFACTURING 3,121,000
LTD CHUAN HUP HOLDINGS LTD 1,977,000
COMFORTDELGRO i 9a2.000
CORPORATION LTD MOBILEONE LTD 1.953.950
PARKWAY HOLDINGS LTD a35 ooo SINGAPORE AIRPORT 975 000 TERMIN.SERV SINGAPORE EXCHANGE LTD 650.000
SINGAPORE FOOD INDUSTRIES 1 415,000
SINGAPORE PETROLEUM CO 600,000
LTD SINGAPORE POST LTD 3,638 000
SINGAPORE TELECIBOARD LOT 1,051.650 1000 SMRT CORPORATION LTD 1,629.000 SMRT UNISTEEL TECHNOLOGY LTD 859,000
UTD OVERSEAS BANK !LOCAL 339.000
YELLOW PAGES (SINGAPORE) 5 262.000
LTD
SGD 557.632 0.36
SGD 560.553 0.36
SGD 398689 0.26
SGD 2 110.902 1 3 6
SGD 2598206 1 6 8
SGD 1.473 405 0.95
SGD 1.339488 0.86
SGD 1.8ia.754 1.17
SGD 811,476 0 52
SGD 1.777.161 1.15
SGD 2,315,591 1.49
SGD 1,617107 1 0 4
SGD 1.139 520 0.74
SGD 1 109,749 0.72
SGD 3482.290 2.24
SGD 3,481.912 2.25
TRANSFERABLE SECURITIES ADMITTED TO AN OFFICIAL STOCK EXCHANGE LISTING
SHARES
BERMUDA SLANDS -. -
SIM TECHNOLOGY GROUP LTD 3,092,000
3 009,000
120 500
1,410.000
1.314.000
3.856.000
1,784,000
346 500
731,400
594,000
416.500
5 113,000
408.500
154 500
1 279.000
69,500
408.000
657.000
2,879.000
365 200
6,156.000
317,000
1,349.000
9.926 000
1,279.500
HKD 1.214471 0.78
1.214 471 0.78
CHINA -
CHINA CONSTRUCTION BANK
CORP CHINA MERCHANTS BANK I-H-
DATANG INT POWER
GENERATION-H- JIANGSU EXPRESSWAY CO -H-
MAANSHAN IRON 8 STEEL CO H PETROCHINA CO LTO !-H-
HKD 1301.603 0 8 4
HKD 169831 0 1 1
HKD 1058769 068
HKD 760673 0 4 9
HKD 1.356 169 0 8 7
HKO 1918.957 1 2 5
6 566.002
1,619,084
3,337 497
1.334.292
2 943.057
2,940.222
2.474 916
1,409 026
2 731,808
878 268
2.977.261
3,073.896
2,220 969
6.661.180
1 106.249
i.7oa.972
874.439
4.24
1.17
2.15
0.86
1 90
1.90
1 60
0.91
1.76
0.57
1.92
1.98
1 4 3
4.31
0 71
1 1 0
0.56
24.83
-.
HKD
HKD
HKD
HKD
HKD
HKD
HKD
HKD
HKD
HKD
HKD
HKD
HKD
WKD
HKD
HKD
HONG KONG 26.592.435 17 15
SOUTH KOREA ASM PACIF C TECHNOLOGY
LTD BANK OF EAST ASIA LTD
BOC HONG KONG HOLDINGS
LTD CHINA MOGILE LTD
ClTlC INTL FIN.HLD
CLP HOLDINGS LTD
ESPRIT HOLDINGS
HANG LUNG PROPERTIES LTD
HANG SENG BANK LTD
HONG KONS EXCHANGES a CLEARING HONGKONG ELECTRIC HOLDINGS LTD HOPEWELL HIGHWAY
INFRASTR. HSBC HOLDINGS PLC
ORIENTAL PRESS GR LTD
TELEVISION BROADCASTS LTD
VARITRONIX INTL LTD
DAEGU BANK
DONGBU INSURANCE CO LTD
KOOKMIN BANK
KTR G CORP
LE PETROCHEMICAL CO LTD
POSCO
SAMSUNG ELECTRONICS CO LTD SK TELECOM CO LTD
S-OIL CORP
76.400
135.530
30 520
32 870
92.810
5811
6 772
10.335
20.690
KRW 1,279.964 0 83
KRW 3,2oa.916 2 07
KRW 2 406.569 1.55
KRW 1997756 1 2 9
KRW 2,025769 1 3 1
KRW 1,504,846 0 9 7
KRW 4.752914 3 0 6
KRW 2201.205 1 4 2
KRW 1.3a4.329 o 89
20,762.26a 13 39
-
TAIWAN
ASIA CEMENT CORP
AU OPTRONICS CORP
CHINA STEEL
CHUNG HSlN ELECTRIC MACHINERY CHUNGHWA TELECOM CO LTD
COMPAL ELECTRONICS INC
DELTA ELECTRONIC INDUSTRIAL ELAN MICROELECTRONINCS
CORP. FAR EASTONE TELECOM. CO
LTD FU SHENG INDUSTRIAL CO LTD
FUBON FINANCIAL HOLDING
CO LTD
1,086.320
64 1,000
1,119.216
1,041,000
1016.120
33,615
970.551
3,781 537
1,017 000
1,123,200
1,528,000
TWO
TWO
TWD
TWD
TWO
TWO
TWO
TWD
TWD
TWO
TWO
788.199 0.51
907.893 0 5 9
964,330 0.62
594812 0.38
1 686,492 1.09
29776 0.02
2787,461 179
1,503 353 0.97
1.102.242 0.71
1.052.654 0.68
1,268.039 0.82
38,491.136
INDONESIA
PT BANK MANDlRl PERSERO
TBK TELKOM INDONESIA S B -
IDR 2,501 188 1.61
IDR 1171,780 0 7 6
3672,968 2 37 .. - -
HSBC Global investment Funds -

Portfolio of Investments and Other Net Assets . .-.
..
Description Quantity Currency
GIANT MANUFACTURE CO LTD
HIGH TECH COMPUTER CORP
LITE-ON IT CORP
MEDIA TEK INCORPORATION
MEGA FINANCIAL HOLDING
COMPANY NAN YA PLASTICS CORP.
PHOENIXTEC POWER
POWERCHIP SEMICONDUCTOR
CORP TAIWAN MOBILE CORP.
TAIWAN SEMICONDUCTOR
MANUFACT. TEST-RITE INTL
WISTRON CORP
1,132.000 TWO
4 5 . m TWO
1654.380 TWO
185.000 TWO
1.376000 TWD
1,107250 TWD
2496000 TWO
1 177.643 TWD
1530000 TWD
1124749 TWD
1,605,427 TWO
1193.423 TWO
Evaluation st net assets
1,779.576 1 15
1.191 745 0.77
1,450 441 0.94
1.756.177 1.13
975502 0.63
1,549 864 1 .OO
2,735,391 1.76
752.993 049
1466,282 0 95
2.030,004 1.31
859074 0.55
1,354 788 0.87
30 587.088 19 73
THAILAND
BANGKOK EXPRESSWAY
/FOR.REG KlATNAKlN BANK PUBLICIFOR REG KRUNG THAI BANK /FOR REG
RATCHABURI
EL GEN /FOR REG THAI OIL PUBLIC COlFOR REG
THAI PLAST 8 CHEMIC PUB !FOR REG
3 163.300 THE 1 752.033 1 13
2354 100 THE 1.849207 1.19
7 024.200 THE 2,150,965 1 39
2,029,300 THE 1.891 267 122
568800 THE 908.760 0 5 9
5 840.500 THE 2,426.125 1 56
.- -
10.978 357 7.08
TOTAL SHARES
INVESTMENT COMPANIES
BERMUDA ISLANDS
MACQUARIE INTL INFRASTRUCTURE
146,179,993 94.29
9.948.000 SGD 5.955.759 3.85
5,955.759 3.85
HONG KONG
PROSPERITY REAL EST
INV.TRUST THE LINK RElT
1 278.603 HKD 323,317 0.21
753,500 HKD 1,568,774 1.01
1,892.091 1.22 .~
THAILAND
CPN RETAIL GROWTH
PROPERTY FD
2905.500 THE 827.834 053
HSBC Global Investment Funds
827834 0.53
TOTAL INVESTMENT COMPANIES 8,675,684 5.60
TOTAL TRANSFERABLE SECURITIES ADMITTED TO AN OFFICIAL STOCK EXCHANGE LISTING 154.855.677 99.89
154.855.677 99.89 TOTAL INVESTMENTS
OTHER NET ASSETS LESS LIABILITIES 171,467 0.11
TOTAL NET ASSETS 155,027,144 100.00

Portfolio of Investments and Other Net Assets ~.
ASIA PACIFIC EX JAPAN EQUITY HIGH DIVIDEND
Economic Division of Investment
(expressed as a percentage of net assets)
._
..
Yo
Banks and financial institutions Electronics and electrical equipment News transmission Transport Investment companies Public services Chemicals Energy Tobacco and spirits Graphic art and publishing Coal mines, heavy industries Holding companies Insurance Real estate companies Office equipment and computers Gastronomy Photography and optics Text i I e Retail trade, department stores Food Construction, building materials Mechanics, machinery
Other net assets less liabilities
Total Net Assets
HSBC Global Investment Funds ~
22.64 15.91 11.64 8.42 5.60 5.48
3.88 3.60 2.96 2.46 2.40 2.07 1.76 1.66 1.46 1.10 0.91 0.55 0.52 0.51 0.49
3.87
0.11
100.00

. _
Portfolio of Investments and Other Net Assets
I
BRAZIL EQUITY Statement of Investments as at 30 September 2006 (expressed in USD)
Descripticn Quantity Currency Evaluation % net assets
INVESTMENTS
TRANSFERABLE SECURITIES ADMITTED TO AN OFFICIAL STOCK
EXCHANGE LISTING
SHARES
BERMUDA ISLANDS ~. ~
GP INVESTMENTS LTD IBDR
BRAZIL
ALL AMERICA LATINA /UNIT
AMBEV CIA DE BEBIDAS iADR
BANCO BRADESCO SA FREF.
BANCO BRADESCO ISADR
BRADESPAR SA BRASIL WREF.
BRASILAGRO
CIA DE CONCESSOES RODOVIARIAS CIA VALE RIO DOCEISADR
CIA VALE RIO
DOCE!SADR(IORDSH) COMGAS /PFD SHS I-A-
COMPANY SA
CONFAB INDUSTRIAL
/PRIV.NOM. CONTAX PARTICIPACOES SA
CONTAX PARTICIPACOESFFD
SHS CPFL ENERGIA SA
CYRELA BRAZIL REALTY SA
DATATSUL SA
DIAGNOST DA AMERICA SA BRL
DURATEX SA IPRIV.
566 500
5 775 660
219,300
345.050
750,900
21 800
1.5.200
688 500
90,000
1.134 300
710 000
2.310 300
60 134
2 503 000
8.107 900
13,000
395.300
1.769 700
672 100
1 955.400
ELETROB EL.BRASIL./PREF B 360,600,000
ELETROBRAS CENTR.ELETR.B 300,300,000
RAS EMBRAER 1,658,500
EMPR.BRASIL AERONAUT, GAFISA SA 454.900
GAFISA SA;GDR 144A 50.000
GERDAU IPREF. 1.143 050
GUARARAPES CONFECCOES 171,200
SA INVESTIMENTOS ITAU IPREF. 2,244,900
ITAU HOLDING P F D SHSiSADR 438.000
ITAU HOLDING SA IPREF. 160 800
KLABIN RIOCELL SAIPREF. 2.700
LOCALIZA RENTA A CAR 832.200
LOJAS AMERICANAS SA PRIV. 277 500.000
LOJASRENNERSA 388 700
LUPATECH SA 384,400
BRL 9,652 541 1.66
9652.541 166 ~.
BRL 45.215,833
USD 10.032.975
BRL 11 488.421
USD 25,057,533
BRL 726.733
BRL 7,699,744
BRL 6.658.298
US0 1,681.200
US0 24.194 619
BRL 97.370
BRL 18,182 368
BRL 115.477
BAL 3757.668
BRL 6.907488
BAL 168.584
BRL 6,593,469
BRL 12.868 318
BRL 12.380 378
BRL 22.494.071
BRL 7,306,652
BRL 6,513.527
BRL 16,266,035
BRL 5.687.557
US0 1,245,125
BRL 15.623.169
BRL 6.542.100
BRL 9.355.900
USD 13,161.900
BRL 4,828071
BRL 5 695
BRL 17,743.885
ERL 11.308.297
BRL 22,536,179
BRL 4,027,215
7 77
1.72
1.97
4 30
0.12
1.32
1.14
0.29
4.15
0 02
3.12
0.02
0 64
1.19
0.03
1.13
2 21
2.12
3.86 1.25
1 1 2
2.79
0.98
0.21
2.68
1.12
1.61
2 26
0.83
0.00
3 05
1.94
3 a7
0.69
Description Ouantity Currency Evaluation YO net assets
MARCOPOLO POMO /PREF. 6,643 fin0 BRL 12.696.721 2.18
NATURA COSMETICOS SA 1 106.300 BRL 13,312,277 2.28
OBRASCON HUARTE LAIN 1.265 700 BRL 14,326,914 2.46
BRASIL SA P ACUCAR-CBD /PREF 1000.000 BRL 26456 0.00
PERDIGAO SA 1.285.164 BRL 12 931.533 2 22
PETROLEO BRASILEIRO 575400 BRL 10,758,108 185 /PREF.SHS PETROLEO BRASILEIRO ISADR 301,200 USD 25,123.092 4.31
PETROLEO IPIRANGA’PREF. 254,800 BRL 2,053.419 0.35
ROSS1 RESIDENCIAL ON 2.034 027 BRL 21,965,423 3.77
SADIA SAlPREF 4.623.882 BRL 12.627.037 2.17
SOUZA CRUZ 394,000 BRL 6.169.005 1 06
SUZANO PETROQUIMICA SA 60,000 ERL 91.457 002
TAM SA 6.000 BRL 195,%9 0.03
TELE NORT.LESTE TNLP 278.100 USD 3.732.102 0.64
IPF.SADR UNIBANCO lADR 114200 US0 8,513,610 146
WEG SA !PREF 35000 BRL 161.179 0.03
503,157 556 86.35 -
TOTAL SHARES 512,810,097 88.01
TOTAL TRANSFERABLE SECURITIES ADMITTED TO
AN OFFICIAL STOCK EXCHANGE LISTING
OTHER TRANSFERABLE SECURITES
SHARES
BRAZIL -
SARAIVA SA LIVREIROS IPRIV 1,102,100
512,810,097 88-01
BRL 9,922.195 1 70
TOTAL SHARES
TOTAL OTHER TRANSFERABLE SECURITIES
TOTAL INVESTMENTS
OTHER NET ASSETS LESS LIABILITIES
TOTALNETASSETS
9,922.‘195 1.70
9,922,195 1.70
9322.195 1.70
~. 522,732,292 89.71
-
59,948,201 10.29
$82,680,493 -100.00
!
I
A HSBC Global Investment Funds

BRAZIL EQUITY
Economic Division of Investment
(expressed as a percentage of net assets)
__ .. .. ..
. .. . -. . . . . . . . . .... . . . .. . . . . ~ . ..
Transport Other services Holding companies Coal mines, heavy industries Construction, building materials Energy Banks and financial institutions Retail trade, department stores Automobile industry Other business houses Agriculture and fishing Aerospace technology Tobacco and spirits Public services Real estate companies Pharmaceuticals and cosmetics Food Graphic art and publishing Textile Miscellaneous News transmission Mechanics, machinery Chemicals Forest products and paper industry
%
8.94 8.19 7.94 7.14 6.89 6.51 6.27 5.81 5.23 4.29 3.54 2.79 2.78 2.42 2.32 2.28 2.17 1.70 1.12 0.69 0.64 0.03 0.02 0.00
Other net assets less liabilities 10.29
Total Net Assets 100.00
HSBC Global Investment Funds . - . . ._

-
Portfolio of Investments and Other Net Assets -
BRlC MARKETS Statement of Investments as at 30 September 2006 (expressed In USD)
~ . ..... .. .- . . . ... . . . ..
Descriprinn Quantity Cdrrency Evaluation % net assets
INVESTMENTS
TRANSFERABLE SECURITIES ADMITTED TO AN OFFICIAL STOCK EXCHANGE LISTING
SHARES
BERMUDA ISLANDS
BRILLIANCE CHINA
AUTOMOTIVE GOME ELECT APPLIANCES
HOLDINGS SINOCHEM HONG KONG HOLDING LTD TPV TECHNOLOGY LTD
BRAZIL
ALL AMERICA LATINA 'UNIT
AMBEV CIA DE EEBIDAS 'ADR
ARACRUZ CEL -E- PREFlSADR
BANCO ERADESCO 'SADR
BANCO NOSSA CAIXA SA
BRASIL DlSTR PA0 ADR
BRASIL TELECOM
PARTICIPACOES BRASIL TELECOM PART (PFD /SADR BRASKEM GADR
CEMIG 'SADR (1000 NV-PFD)
CIA DE CONCESSOES
RODOVIARIAS CIA SIDERURG NAC'SADR
(REP 1SH) CIA VALE DO RIO DOCE A'PREF
CIA VALE RIO DOCE'SADR
CIA VALE RIO DOCESADR(1 ORDSH) COMGAS 'PFD SHS !-A-
COPEL (SADR
COSAN SA INDUSTRIA E
COMERCIO COTEMINAS CIA TECIDOS
iPREF CYRELA BRAZIL REALTY SA
DIAGNOST DA AMERICA SA BRL
DURATEX SA IPRIV.
EDP ENERGIAS DO BRASIL SA
ELETROBRAS 'ADR (500 PFD B )
ELETROERAS GADR REP 500
SH ELETROPAULO -A- 'PREF
EMBRAER PREF'SADR
EMBRATEL PARTIC lSADR
GAFISA SA
406 000
207.000
504.000
332 000
90.000
53 100
12 900
120 000
10.500
5 200
11.300.000
12,000
24.400
24.000
38 600
36 600
38 186
247,200
174,200
470.000
31,400
15,000
700,000
24,200
8.400
15.200
16 300
43.600
59,700
1 820.000
26.900
9,100
16,000
HSBC Global Investment Funds
HKD 63,058 003
HKD 167.924 0.08
HKD 181.140 0 0 9
HKD 315.353 0.14
727,475 0.34 .
ERL
us0 US0
US0
BRL
USD
BRL
USD
USD
US0
ERL
US0
BRL
USD USD
BRL
USD
ERL
BRL
BRL
BRL
ERL
ERL
USD
USD
ERL
USD
US0
BRL
704 582
2.429 325
655 320
4.004 400
210.338
135,928
132,176
364.200
304,024
960,000
373 290
1,044,198
704.81 0
4,617 696
3 715.686
64,456
356,390
247,294
58.347
403 649
154.732
174 854
208.601
436,000
639.984
74.007
1,060,667
142,32A
200,046
0.33
1.15
0.31
1.89
0 10
0 06
0 06
0 17
0.14
0 45
0.18
0.49
0.33
2.18
1.75
n 03
0.17
0.12
0.03
0.19
0.07
0.08
0.10
0 21
0.30
0.03
0.50
0 07
0.09
Descriution Quantity Currency Evaluation "la net assets
GERDAU SA / SADR PFD SHS
GOL LINHAS AEREAS 'ADR
ITAU HOLDING lPFD SHS'SADR
KLABIN SA /SADR
LOJAS AMERICANAS SA PR lV
LOJAS RENNER SA
NATURA COSMETICOS SA
PERDIGAO SA
PERDIGAO !SADR
PETROBRAS /SADR REP 1 SHS
PETROLEO BRASILEIRO /SADR
SAEESP iSADR
SADIA lADR
SOUZA CRUZ
TAM SA !SADR
TELECELULARSUL
PARTICP ISADR TELE NORT LESTE TNLP
IPF SADR TELEMAR
TMCP'SPONS ADR REP 20000
PREF UNIBANCO 'ADR
USIF~.-A-'SADR(10000 PFD REG
5) USlMlNAS 'PREF -A-
VIVO PARTlClPACOES SA
iSADR VIVO PARTICIPACOES SkPFD
SHS VOTORANTIN CEL 'SADR
WEG SA !PREF
CAYMAN ISLANDS
AGILE PROPERTY HOLDINGS
LTD CHAODA MODERN
AGRICULT.HOLD. CHINA MENGNIU DAIRY CO LTD
CHINA RESOURCES LAND
FU JI FOOD a CATERING SERV
LI NlNG COMPANY LTD
TCL COMM TECHN.HOLDINGS
CHINA
AIR CHINA LTD
ALUMINUM CORP OF CHINA
LTD ANGANG NEW STEEL CO LTD -
H- ANHUI CONCH CEMENT CO LTD
BANK OF CHINA LTD-H
BANK OF COMMUNICATIONS CO LTD EElJlNG CAP.INTL AIRPORT -H-
BElJlNG ENTERPRISES HLD
EYD COMPANY LIMITED -H-
CHINA CONSTRUCTION BANK
CORP CHINA COSCO HOLDINGS -H-
76 500
12.500
136,100
14 100
7 500 000
5 700
31.500
549
9.000
101.700
73,200
15,700
10,900
16,800
16,400
14,500
64 700
16 000
2,100
26 000
30.400
3.400
125.580
7 732
22 800
34,000
288,000
440,000
229 000
282 000
38.000
172.000
112,000
714 000
836.000
246.000
128 000
5.993 000
1.515 000
338 ooa
53 500
88 000
6,437.000
453 500
USD
US0
USD
USD
ERL
ERL
BRL
ERL
US0
USD
US0
US0
USD
BRL
US0
US0
US0
ERL
USD
USD
USD
BRL
US0
BRL
US0
BRL
1035,810
437,000
4,089,805
297,510
305,630
330.477
379,044
5,524
180,450
7 608.176
6,105,612
442 740
297,025
263 044
533 492
407,740
868,274
486.300
77.742
2,087,400
898 320
102,258
396.833
24,355
389.880
156,574
0.49
0.21
1.93
0.14
0.14
0.16
0.18
0.00
0.09
3 60
2 89
0 21
0.14
0 12
0 25
0 19
0.41
0.23
0.04
0.98
0.42
0.05
0 19
0.01
0.18
0.07
52.784.339 24.90
HKD 234.373 0.11
HKD 269.400 0.13
HKD 383,887 0.18
HKD 190.036 0.09
HKD 63.507 0.03
HKD 196492 0 0 9
HKD 3.882 0.00
1,341.577 0.63
HKD 307.938 0.15
HKD 531.175 0.25
HKD 195.457 0.09
HKD 253,350 0.12
HKD 2,577,006 I 22
HKD 1,067607 0 5 0
HKD 221.699 0.10
HKD 166.045 0.08
HKD 154.512 0.07
HKD 2.784.452 1.31
HKD 208395 0.10
I
I
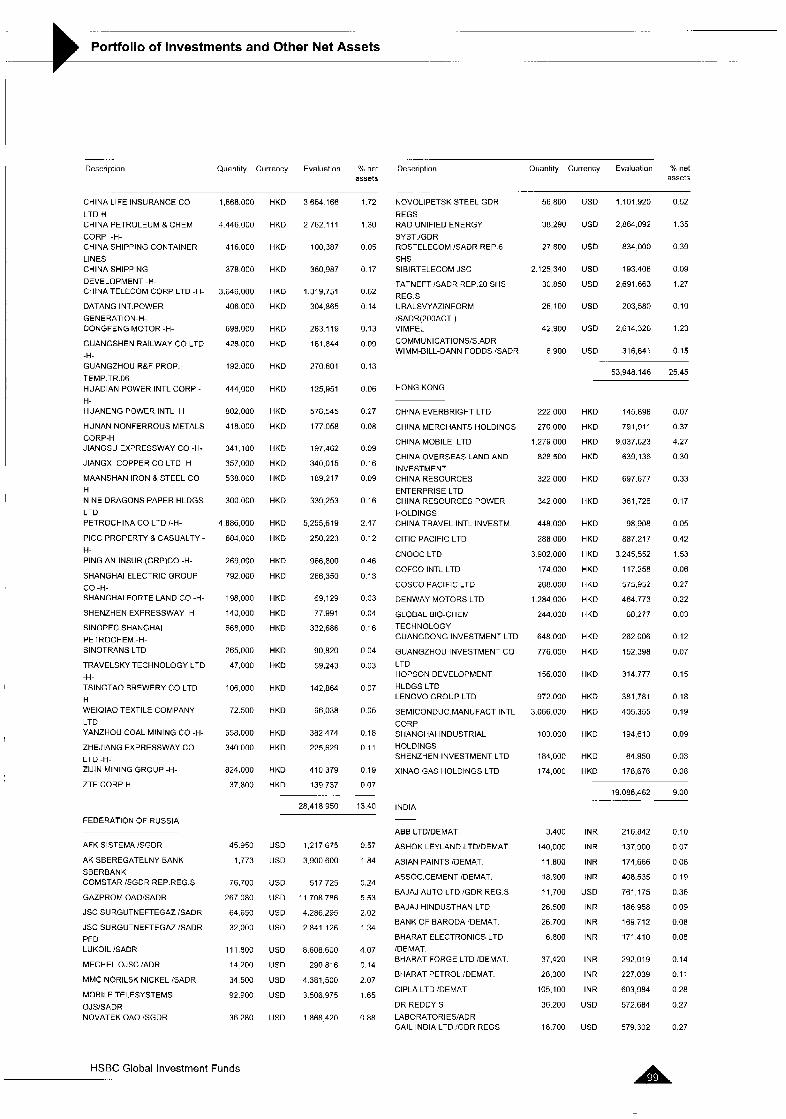
I .. . -.
Portfolio of Investments and Other Net Assets - - ._ _-
Description Quantity Currency Evaluation ?4 net assets
CHINA LIFE INSURANCE CO
LTD-H- CHINA PETROLEUM 8. CHEM
CORP -H- CHINA SHIPPING CONTAINER
LINES CHINA SHIPPING
DEVELOPMENT -H- CHINA TELECOM CORP LTD -H-
DATANG INT.POWER
GENERATIOU-H- DONGFENG MOTOR -H-
GUANGSHEN RAILWAY CO LTD
-H- GUANGZHOU R&F PROP..
TEMP.TR.06 HUADIAN POWER INTL CORP . H- HUANENG POWER INTL H
HUNAN NONFERROUS METALS
CORP-H JIANGSU EX'RESSWAY CO -H-
JlANGXl COPPER CO LTD -H-
MAANSHAN IRON a STEEL co H NINE DRAGONS PAPER HLDGS
LTD PETROCHINA CO LTD I-H-
PICC PROPERTY a CASUALTY - H- PING AN INSUR (GRP)CO -H-
SHANGHAI ELECTRIC GROUP
CO -H- SHANGHAI FORTE LAND CO -H-
SHENZHEN EXPRESSWAY H
SINOPEC SHANGHAI
PETROCHEM.-H- SINOTRANS LTD
TRAVELSKY TECHNOLOGY LTD
-H- TSINGTAO BREWERY CO LTD
H WElQlAO TEXTILE COMPANY
LTD YANZHOU COAL MINING CO -H-
ZHEJIANG EXPRESSWAY CO LTD -H- ZlJlN MINING GROUP -H-
ZTE CORP H
FEDERATION OF RUSSIA
1,868,000 HKD
4446.000 HKD
416.000 HKD
378.000 HKD
3,646,000 HKD
406.000 HKD
698,000 HKD
428.000 HKD
192.000 HKD
444,000 HKD
802.000 HKD
418.000 HKD
341.100 HKD
357,000 HKD
538000 HKD
300 000 HKD
4886.000 HKD
684000 HKD
26Y 000 HKD
792000 HKD
198.000 HKD
140,000 HKD
668,000 HKD
265,000 HKD
47.000 HKD
106,000 HKD
72.500 HKD
558,000 HKD
340.000 HKD
824,000 HKD
37.800 HKD
3,654 166
2762 111
100.387
360.987
1,319,751
304.865
283 119
181.844
270 601
125,951
578 545
177 058
197 462
340 015
189217
339 253
5,255,619
250 223
966,800
266 350
69.129
77.991
332 686
90.820
59,243
142.864
96.038
382 474
225,629
410 379
139 737
AFK SISTEMA ISGDR
AKSBEREGATELNYBANK
SBERBANK COMSTAR /SGDR REP.REG.S
GAZPROM OAO/SADR
JSC SURGUTNEFTEGAZ iSADR
JSC SURGU-NEFTEGAZ /SADR PFD LUKOIL lSADR
MECHEL OJSC /ADR
MMC NORILSK NICKEL iSADR
MOBILE TELESYSTEMS
OJSISADR NOVATEK OAO /SGDR
45 950
1,773
76.700
267 080
64.650
32.000
11 1,800
14 200
34 500
92 900
36 280
HSBC Global Investment Funds
.-
I .72
1 30
0 05
0 17
0.62
0 14
0.13
0.09
0.13
0 06
0.27
0.08
0.09
0.16
0.09
0.16
2.47
0.12
0.46
0.13
0.03
0.04
0.16
0.04
0.03
0 07
0.05
0.18
0.11
0 19
0.07
26,418,950 13.40
Descrlptlon Quantity Currency Evaluation Yo net assets
NOVOLIPETSK STEEL GDR
REGS RAO UNIFIED ENERGY
SYST lGDR ROSTELECOM ISADR REP 6
SHS SIBIRTELECOM JSC
TATNEFT GADR REP 20 SHS
REG S URALSVYAZINFORM
'SADR(200ACT ) VIMPEL
COMMUNICATI0NS:S ADR WIMM-BILL-DANN FOODS 'SADR
56 800
38.290
27 800
2.1 25,340
30 850
26,100
42,900
6.900
US0
USD
USD
USD
USD
USD
USD
USD
1,101 920
2,864 092
834 000
193 406
2 691 663
203 580
2,614 326
316,641
0.52
1.35
0.39
0.09
1.27
0.10
1.23
0.15
53,948 146 25.45
HONG KONG
CHINA EVERBRIGHT LTD
CHINA MERCHANTS HOLDINGS
CHINA MOBILE LTD
CHINA OVERSEAS LAND AND
INVESTMENT CHINA RESOURCES
ENTERPRISE LTD CHINA RESOURCES POWER
HOLDINGS CHINA TRAVEL INTL INVESTM.
ClTlC PACIFIC LTD
CNOOC LTD
COFCO INTL LTD
COSCO PACIFIC LTD
DENWAY MOTORS LTD
GLOBAL BIO-CHEM
TECHNOLOGY GUANGDONG INVESTMENT LTD
GUANGZHOU INVESTMENT CO
LTD HOPSONDEVELOPMENT
HLDGS LTD LENOVO GROUP LTD
SEMICONDUC.MANUFACT INTL
CORP SHANGHAI INDUSTRIAL
HOLDINGS SHENZHEN INVESTMENT LTD
XINAO GAS HOLDINGS LTD
222000 HKD
270,000 HKD
1.279000 HKD
828500 HKD
322000 HKD
342000 HKD
448.000 HKD
288000 HKD
3902.000 HKD
174,000 HKD
288.000 HKD
1284000 HKD
244.000 HKD
648000 HKD
776.000 HKD
156.000 HKD
972000 HKD
3066000 HKD
103000 HKD
184,000 HKD
174.000 HKD
145 898
791,911
9 037,623
639.136
697.677
361.726
98 908
887.217
3 245.552
117.256
575,952
464.773
68 277
262 006
152 398
314 777
381 781
405,355
194 613
64.950
178.676
0.07
0.37
4.27
0.30
0.33
0.17
0.05
0.42
1.53
0.06
0.27
0.22
0.03
0 12
0.07
0 15
0.18
0.19
0.09
0.03
0.08
19 086.462 9 00 ~
INDIA
US0 1,217.675 0.57
US0 3.900 600 1.84
US0 517,725 0.24
US0 11 708.786 5 53
US0 4.286.295 2.02
USD 2.841.126 1 3 4
USD 8,608.600 4 0 7
US0 290.816 0.14
USD 4 381,500 2.07
USD 3506.975 1.65
USD 1868420 0.88
ABB LTDlDEMAT
ASHOK LEYLAND LTD!DEMAT
ASIAN PAINTS /DEMAT
ASSOC.CEMENT IDEMAT
BAJAJ AUTO LTD IGDR REG S
BAJAJ HINDUSTHAN LTD
BANK OF BARODA !DEMAT
BHARAT ELECTRONICS LTD
IDEMAT BHARAT FORGE LTD IDEMAT
BHARAT PETROL iDEMAT
ClPLA LTD IDEMAT
OR REDDY S LABORAT0RIES:ADR GAIL INDIA LTD !GDR REGS
3,400 INR
140,000 INR
11 800 INR
18.900 INR
11 700 USD
26.500 INR
26700 INR
6.800 INR
37,420 INR
28.300 INR
105.100 INR
36,200 US0
16700 USD
216.842 0.10
137,900 0 0 7
174666 0 0 8
A08.535 0 19
761 175 036
186958 0 0 9
169712 0 0 8
171 410 0.08
292,019 0.14
227.039 0.11
603,984 0.28
572.684 0.27
579.302 0.27
.. ... -. ... . ..

.- .
Portfolio of Investments and Other Net Assets --. - - -
Description Quantity Currency Evaluation % net assets
GLAXOSMITHKLINE
PHARMA,/DEMAT. GRASIM IND./GDR 144A
GUJARAT AMBUJA CEMENTS /GOR HINDALCO IND.!GDR 144A REG
HINDUSTAN PETRJDEMAT
HOUSING DEVT FIN CORP iADR
IClCl BK /SADR
I-FLEX SOLUTIONS LTD
IDEMAT. INDIABULLS FINANCIAL
SERVICES :DEMAT INDIAN HOTELS /DEMAl
INDlAh
PETROCHEM.!DEMATERIALlSE D INFOSYS TECHNOL.: SADR
INFRASTRUCTURE DVPT
FINIDEMAT. ITC lGDR
JAIPRAKASH ASSOCIATES LTD
JET AIRWAYS INDIA LTD
/DEMAT JINDAL STEEL & POWER
/DEMAT KOTAK MAHINDRA BANK
LTD!DEMAT. LARSEN & TOUBRO !GDR
MAHANAGAR TELE.NIGAM 'ADR
MAHINDRA&MAHINDRAiDEMAT.
MARUTI UDYOG LTD iDEMAT.
NESTLE INDIA 'DEMAT
RANBAXY LABORAT !GDR
(EO SHS).RECEIPTS R RELIANCE CAPITAL LTD
IDEMAT. RELIANCE COMM.VENT(RCVL)!DEMAT RELIANCE
ENERGY'DEMATERIALISED RELIANCE IND.iGDR144A
RELIANCE NATURAL
RESOURCES DEMAT SATYAM COMPUTER lADR
SIEMENS LTD
/DEMATERIALISED STATE BK OF INDIA /GDR
(REGS) SUN PHARMACEUTICAL
IND.LTD /DEMAT TATA IRON & STEEL!DEMAT
TATA MOTORS LTD /ADR
TATA POWER CO 'DEMAT
TATA TEA LTD ! DEMAT
ULTRA TECH CEMENT LTD
IDEMAT. UTI BANK LTD !GDR REGS
VIDESH SANCHAR NIGAM'SADR
WIPRO LTD 'SADR
ZEE TELEFILMS LTD IDEMAl
7.700 INR
12.100 USD
177,600 US0
167,6110 US0
16,100 INR
23.700 US0
105,900 USD
13,500 INR
38.000 INR
12,400 INR
33.500 INR
126.600 US0
100000 INR
376,300 USD
18.500 INR
8000 INR
4000 INR
43,600 INR
38900 USD
35200 USD
48400 INR
23.200 INR
9,200 INR
52,600 USD
50.690 INR
253,900 INR
9735 INR
107,600 US0
129,800 INR
35800 USD
16.500 INR
8.000 USD
17.100 INR
51,367 INR
65,450 US0
25,900 INR
10.100 INR
13600 INR
46 100 USD
12,200 USD
60000 USD
66900 INR
207,313
664,012
453.858
610,098
98.831
1,439 538
3.244.775
423,023
343,281
370 942
225 878
6 071.735
147,696
1,531,848
190.380
112.3a0
148.545
323,306
1 077,879
232,672
715,744
491.635
210.299
502,330
629 777
1,923,359
102.788
5.508 117
63,856
1 389,040
386.667
444,800
346,735
592.623
1,216,716
316 851
165,849
265.745
384.334
208,498
787.800
446.204
0 10
0 31
0.21
0 29
0.05
0.68
1.53
0.20
0.16
0.17
0.1 1
2.86
0.07
0.72
0.09
0.05
0.07
0.15
0.51
0.11
0 34
0 23
0 10
0.24
0.30
0.91
0.05
2.60
0.03
0.66
0.18
0.21
0.16
0.28
0.57
0.15
0.08
0.13
0.18
0.10
0.37
0.21
TOTAL SHARES
HSBC Global Investment Funds
39.519.943 18 64
195,826,892 92.36
Description Quantity Currency Evalsation % net assets
- . . .- .. -.
INDEX TRACKER
HONG KONG
ISHARE MSCl CHINA TRACKER 61,700 HKD 310.850 0.15
310.850 0.15 . . .- .. . . . . . ... . . .
UNITED STATES
ISHARESiMSCl BRAZIL /INDEX 52.600 US0 2.031,412 0 9 5 FD
2,031 412 0 9 5
TOTAL INDEX TRACKER 2,342,262 1.10
WARRANTS I EQUITY LINKED SECURITIES
-_ _-- - --
GREAT BRITAIN __ DEUT.BK 04-8.10 07
WRT/REL.EN. 0 43,695 USD 461.085 0.22
461.085 0 2 2
INDIA
DEUTSCHE BANKAG 04-
27 08 07 ION HINDUSTAN
LEVER LTD MSDW ASIA 04-10 8 07 /ON
HINDUSTAN PETROLEUM
282,200 US0 1,581,958 0.74
44000 US0 269.966 0 13
1.851.924 0.87
NETHERLANDS ANTILLES
MERR.LYN.INTL 06-
02 05.1 I lWRT HERO 0 27,200 USD 460.559 0.22
460,559 0.22
UNITED STATES
MERRILL LYNCH INTL & CO 04-
23.03.09 /ON OIL & NATURAL GASCORP 0
64.600 US0 1,651,261 0.78
. . . .. .
1.657 261 0.78
VIRGIN ISLANDS
MSDW ASIA SECURITIES
PRODUCTS 04-09.12.07 /ON
TATA CONSULTANCY 0 MSDW ASIA04-9.2.07WRT
HOUS.DEV 0 MSDW 05-22.08.08 /ON BHARAT
HEAVY 0
49,200 USD 1,096.050 0 52
71,700 USD 2,371.212 1 12
21,600 USD 1,130.725 0 53
4 597.987 2 17
TOTAL WARRANTS I EQUITY LINKED SECURITIES 9,028,816 4.26
INVESTMENT COMPANIES
HONG KONG
GZI REAL ESTATE INV TRUST 1310 HKD 535 0.00
535 000
...

~ .... ..
Portfolio of Investments and Other Net Assets _. . . ...__. ...
DescriDtion Quantity Currency Evaluatian net assets
SINGAPORE
ISHARES MSCl INDIA ETF 150.300 USD 748.494 0.35
748.494 0 35
TOTAL INVESTMENT COMPANIES 749.029 0.35
TOTAL TRANSFERABLE SECURITIES ADMITTED TO
AN OFFICIAL STOCK EXCHANGE LISTING 207,946,999 98.07
TRANSFERABLE SECURITIES TRADED ON ANOTHER REGULATED
MARKET
. . . .
SHARES
BRAZIL
SUBMARINO SA jSGDR -144A- 5,000 US0 200239 0 0 9
TRACTEBEL iSADR 5600 USD 232.400 0.11
432.639 020
FEDERATION OF RUSSIA
POLYUS GOLD /ADR IW.ISSUED 36.200 US0 1,538,500 0 73
VOLGATELEZOM JSC 38,050 USD 154 io3 0 0 7
1.692.603 0.80
TOTAL SHARES 2,125,242 1.00
TOTAL TRANSFERABLE SECURITIES TRADED ON
ANOTHERREGULATEDMARKET 2,125,242 .loo OTHER TRANSFERABLE SECURITES
SHARES
FEDERATION OF RUSSIA
TRANSNEFTOJSC MOSCOW 725 USD 1.344875 0 6 3
UES lPREF 1,000.000 US0 630,000 0.30
URALSVYAANFORM JSC 713,300 USD 28,318 001
2 003,193 0.94
TOTAL SHARES 2,003,193 0.94
TOTAL OTHER TRANSFERABLE SECURITIES 2,003,193 0.94
TOTAL INVESTMENTS 212,075,434 100.01
OTHER NET ASSETS LESS LIABILITIES (19,254) (0.01)
TOTALNETASSETS 212,056,180 100.00
HSBC Global Investment Funds ..

Portfolio of Investments and Other Net Assets -
ERIC MARKETS
Economic Division of Investment - -
(expressed as a percentage of net assets) .-
Energy News transmission Banks and financial institutions Coal mines. heavy industries Holding companies Internet Software Public services Non-ferrous metals Chemicals Miscellaneous Transport Insurance Tobacco and spirits Automobile industry Investment companies Pharmaceuticals and cosmetics Real estate companies Construction, building materials Electronics and electrical equipment Forest products and paper industry Food Precious metals Aerospace technology Retail trade, department stores Mechanics, machinery Other services Office equipment and computers Textile Agriculture and fishing Photography and optics Gastronomy
Other net assets less liabilities
26.32 11.61 10.95 7.27 6.70 4.09 4.03 3.30 3.1 1 2.93 2.35 2.30 2.06 1.82 1.45 1.23 1.21 1.12 0.92 0.79 0.77 0.73 0.50 0.45 0.43 0.43 0.26 0.25 0.22 0.21 0.20
(0.01)
Total Net Assets 100.00
1
HSBC Global Investment Funds . - . - .-

-. _.
Portfolio of Investments and Other Net Assets ..
BRlC MARKETS EQUITY Statement of investments as at 30 September 2006 (expressed in USDl
Descripliun auantlty Currency Evaluation "h net assets
INVESTMENTS
Description Quantity Currency Evaluation 'lo net assets
...
TEMAR I PREF
TIM PARTICIPACOES SAIPREF
TRACTEBEL (BRESIL)
UNIBANCO
iUNIT(1 UBBPN+lUBHDBN) USlMlNAS :PREF -A-
VALE RIO DOCE INAM
VIVO PARTICIPACOES SAlPFD
SHS VOTORANTIM IPREF
TRANSFERABLE SECURITIES ADMITTED TO AN OFFICIAL STOCK
EXCHANGE LISTING
CAYMAN ISLANDS SHARES
BERMUDA ISLANDS
CHAODA MODERN
AGRICULT HOLD CHINA MENGNIU DAIRY CO LTD
TPV TECHNOLOGY LTD 68.000 HKD 64,590 0.08
BRAZIL
ALL AMERICA LATINA :UNIT
AMBEV CIA DE BEDIDAS !PREF
ARACRUZ CELULOSE B PREF NOM BANCO BRADESCO SA :PREF
BANCO NOSSA CAIXA SA
BRASIL TELECOM
PARTlClP PREF BRASKEM SA -A-:PREF
CIA DE CONCESSOES
RODOVIARIAS CIA
ENERGET MIN GERAIS:PRIV CIA VALE DO RIO DOCE AIPREF
COPEL CIA PARAN EN iPREF B
COSAN SA INDUSTRIA E COMERCIO CYRELA BRAZIL REALTY SA
ELETROB EL BRASIL :PREF B
ELETROBRASCENTRELETRB
RAS EMBRAER
EMPR BRASIL AERONAUT EMBRATEL PARTlClP :PREF
GERDAU PREF
GOL LINHAS AEREAS
INTELIGENTES ITAU HOLDING SA iPREF
KLABIN RIOCELL SA IPREF
LOJASRENNERSA
NATURA CCSMETICOS SA
PETROBRAS
PETR BRASlLElRO SA PETROLEO BRASlLElRO iPREF SHS SABESP CIA
SANEAM BPS ESTADO SADIA SAIPREF
SID NACIONAL
SOUZA CRLZ
SUBMARINO SA
TAM SA
TELEMAR
38,000
2.183 500
50.300
47 700
9 400
22 597,500
11 800
13,800
9 763 500
98,200
9 599.400
5 700
10.600
a 285 500
12 427.700
44 100
22 724 600
32,300
5 100
54.000
55.000
2 900
10,600
115,500
159,000
1.280 200
42.000
14,500
7 700
4 100
6 300
6 400
64.590
BRL
BRL
BRL
BRL
BRL
BRL
BRL
BRL
BRL
BHL
BRL
BRL
BRL
BRL
BRL
BRL
BRL
BRL
BRL
BRL
BRL
BRL
BRL
BAL
BRL
BRL
BRL
BRL
BRL
BRL
BRL
BRL
297.490
995,471
258.739
1588.169
188,303
137.364
73.740
133,456
393,417
1 812.505
107,421
Y3.972
176,805
167,885
269 558
432 572
71.371
441.475
177 320
1,621,367
116 003
168,137
127 551
2,409,462
2,972,782
145 618
114 695
413 999
120 562
82 321
205.116
194 520
u on
0 36
1 2 1
11 31
1.93
0 23
0 17
0.09
0 16
0.48
2 20
0.13
0.1 1
0.21
0 20
0 33
0.53
0 09
u.54
0.22
1.97
0.14
0.20
0.15
2.92
3.60
0.18
0.14
0.50
0.15
0.10
0.25
0.24
CHINA
AIR CHINA LTD
ALUMINUM CORP OF CHINA
LTD BANK OF CHINA LTD-H
BANK OF COMMUNICATIONS
CO LTD CHINA CONSTRUCTION BANK
CORP CHINA LIFE INSURANCE CO
LTD-H- CHINA PETROLEUM & CHEM
CORP -H- CHINA SHIPPING
DEVELOPMENT -H- CHINA TELECOM CORP LTD -H.
DATANG INT POWER
GENERATION-H- DONGFENG MOTOR -H-
HUANENG POWER INTL H
JlANGXl COPPER CO LTD -H-
PETROCHINA CO LTD r-H
PING AN INSUR (GRPCO -H-
SHANGHAI ELECTRIC GROUP
CO -H- SINOPEC SHANGHAI
PETROCHEM -H- YANZHOU COAL MINING CO -H-
ZlJlN MINING GROUP -H
FEDERATION OF RUSSIA
AFK SISTEMA GGDR
GAZPROM OAOiSADR
JSC SURGUTNEFTEGAZ lSADR
LUKOIL (SADR
MMC NORILSK NICKEL rSADR
NOVATEK OAO (SGDR
RAO UNIFIED ENERGY
SYST :GDR ROSTELECOM :SADR REP 6
SHS TATNEFT ISADR REP 20 SHS REG S
29.100
60,999.700
12,100
148 300
12,100
69.200
51 800
7 700
128,000
68,000
120.000
208 000
1 .I 38,000
805 000
1 257 000
360,000
804.000
128.000
666 000
80.000
238,000
270 000
113000
910,000
60,000
270.000
200.000
94 000
234.000
34 100
128,400
31,500
60 700
10.2u0
20.900
7 700
24.700
9,150
BRL 391.171 0 4 8
BRL 169.951 0.21
BRL 100,355 0 1 2
BRL 1.112,506 1 3 5
BRL 363919 0 4 4
BRL 1,481,514 1 8 0
BRL 163165 0.20
BRL 132973 0.16
20,424.720 24.80
-
HKD 78.371 0.10
HKD 113.993 0.13
192,364 0.23
HKD
HKD
HKD
HKD
HKD
HKD
HKD
HKD
HKD
HKD
HKD
HKD
HKD
HKD
HKD
HKD
HKD
HKD
HKD
51.754
132.158
489 343
567,276
543,740
704 229
499 491
122 239
241,074
60 072
96 536
194,772
107 624
978 a40
215 643
90 801
99,607
64 431
116540
5 376,170
0.06
0.16
0.59
0.69
0.66
0.86
0 61
0 15
0.29
0 07
0.12
0.24
0 13
1 1 9
0.26
0.11
0 12
0 08
0.14
6.53
US0 903,650 1 1 0
USD 5629056 6 8 3
USD 2 088,450 2 54
US0 4673.900 5 6 7
US0 1295,400 1 5 7
USD 1.076.350 1 31
USD 575,960 0 7 0
US0 741.000 090
US0 798.338 097
17 782,104 21 59 .~
HSBC Global Investment Funds

-
Portfolio of Investments and Other Net Assets -. . . - ~.
I
Description
HONG KONG
Quantity Currency Evaluation % net Description assets
Quantity Currency Evaluation ?'a net assets
CHINA MERCHANTS HOLDINGS
CHINA MOBILE LTD
CHINA OVERSEAS LAND AND INVESTMENT CHINA RESOURCES
ENTERPRISE LTD ClTlC PACIFIC LTD
CNOOC LTD
COSCO PACIFIC LTD
DENWAY MOTORS LTD
HOPSON DEVELOPMENT
HLDGS LTD LENOVO GROUP LTD
SEMICONDUC.MANUFACT INTL
CORP
156,000 HKD
237,500 HKD
208000 HKD
76.000 HKD
71,000 HKD
727,000 HKD
7fi.OOU HKD
386.000 HKD
42.000 HKD
202000 HKD
665,000 HKD
457,546
1,678,214
160 459
164 669
218,724
E04 694
151,987
139.721
84.748
79 341
87,920
TOTALNETASSETS
0 56
2 04
0 19
0 20
0 27
0 73
0 18
0 17
0 10
0 10
0 11
82,345,158 100.00
3 828.025 4.65
INDIA
DR REDDY S LABORATORIES/ADR HOUSING DEVT IDEMAT.
HOUSING DEVT.FIN.CORP !ADR
IClCl BK ISADR
INFOSYS TECHN0L.I SADR
MAHANAGAR TELE.NIGAM !ADR
RELIANCE IND.:GDR144A
SATYAM COMPUTER !ADR
STATE BK OF INDIA /GDR
(REGS) TATA MOTORS LTD /ADR
VIDESH SANCHAR NIGAMGADR
WIPRO LTD lSADR
56,600
160
14 500
43 600
48,500
45 900
39.000
14 600
12 300
90,400
22 000
32 500
USD
INR
USD
USD
US0
US0
US0
US0
US0
US0
US0
US0
895,412
5.226
880.730
1,335,904
2,326,060
303,399
1,996 437
566.480
683,880
1,680.536
375,980
426 725
11,476 769
. ...
1 09
0.01
1 07
1.62
2.82
0.37
2.42
0.69
0.83
2.04
0.46
0.52
13.94
_
TOTAL SHARES
INDEX TRACKER
UNITED STATES
ISHARES/MSCI BRAZIL /INDEX
FD ISHARES/MSCI EMERG MKT INDX
63500 US0 2452370 2 9 8
43533 US0 4,246644 5.16
.
6,699014 8.14
TOTAL INDEX TRACKER
WARRANTS I EQUITY LINKED SECURITIES
HONG KONG
6,699,014 8.14
CHINA OVS LD 06-18 7 07 WRT 10750 HKD 2318 000 4 5
2,318 0.00
TOTAL WARRANTS I EQUITY LINKED SECURITIES 2,318 0.00
TOTAL TRANSFERABLE SECURITIES ADMITTED TO
AN OFFICIAL STOCK EXCHANGE LISTING 65,846,074 79.98 TOTAL INVESTMENTS 65,846,074 7 9 2
OTHER NET ASSETS LESS LIABILITIES 16,500,084 20.04
HSBC Global Investment Funds ~- -_ - _... ... A

- ..
Portfolio of Investments and Other Net Assets .. . ~.
ERIC MARKETS EQUITY
Economic Division of Investment
(expressed as a percentage of net assets)
%
Energy Investment companies Banks and financial institutions News transmission Coal mines, heavy industries Holding companies Internet Software Chemicals Non-ferrous metals Automobile industry Public services Tobacco and spirits Pharmaceuticals and cosmetics Insurance Transport Forest products and paper industry Aerospace technology Real estate companies Miscellaneous Food Electronics and electrical equipment Retail trade, department stores Textile Mechanics, machinery Office equipment and computers Agriculture and fishing
Other net assets less liabilities
25.15 8.14 7.63 6.55 5.70 5.46 4.03 2.54 2.34 2.21 1.97 1.36 1.24 1.12 1.01 0.61 0.53 0.50 0.52 0.38 0.30 0.20 0.15 0.12 0.10 0.10
20.04
Total Net Assets 100.00
L-- HSBC Global Investment Funds . ..

Portfolio of Investments and Other Net Assets ... .
CHINESE EQUITY Statement of investments as at 30 September 2006 (expressed in USD)
Description Quantity Currency Evaluation Yo net assets
INVESTMENTS
TRANSFERABLE SECURITIES ADMITTED TO AN OFFICIAL STOCK EXCHANGE LISTING
SHARES
BERMUDA ISLANDS
CHINA YURUN FOOD GROUP 32,023.000
LTD
CAYMAN ISLANDS
CHINA MENGNIU DAIRY CO LTD
LIFESTYLE INTL HLD LTD
SHUl ON LAND LTD
7,639 000
9 184 000
5 951,000
CHINA
HKD 26,635.653 0 78
_ - 26 635.653 0 78
HKD 12.805.779 0 38
HKD 18,154275 0.53
HKD 4086.675 0 12
35.046 729 1.03
AIR CHINA LTD 85 804,000
ALUMINUM CORP OF CHINA 30.000.000
LTD ANHUI EXPRESSWAY CO LTD - 16,374,000
H- BANK OF CHINA LTD-H 120.000.000
BANK OF COMMUNICATIONS 136.515 000 CO LTD BElJlNG CAP.INTL AIRPORT -H- 22,010 000
BY0 COMPANY LIMITED -H- 2.228 500
CHINA BLUECHEMICAL LTD -H- 1,224 000
CHINA COSCO HOLDINGS -H- 35,000 000
CHINA EASTERN AIRLINES -H- 36 658.000
CHINA LIFE INSURANCE CO 149,830.000
LTD-H- CHINA PETROLEUM 8 CHEW 368.370.000
CORP -H- CHINA SHENHUA ENERGY CO - 67.310.000
H- CHINA SHIPPING 109,468,000
DEVELOPMENT -H- CHINA TELECOM CORP LTD -H- 391.252.000
DATANG INT POWER 73.678 000 GENERATION-H- DONGFENG MOTOR -H- 164.074,OOO
GUANGSHEN RAILWAY co LTD 55 080 000
-H- HUANENG POWER INTL H 73,688 000
JIANGSU EXPRESSWAY CO -H- 47.172 000
JlANGXl COPPER CO LTD -H- 65.585 000
PETROCHINA CO LTD /-H- 277,670.000
PlCC PROPERTY & CASUALTY - 108,176.000
H- PING AN INSUR (GRP)CO -H- 43 339.500
SHENZHEN EXPRESSWAY H 30 084.000
HKD 37,006 085
HKD 19.061,312
HKD 11,559 626
HKD 51,600 318
HKD 96.200 880
HKD 14436678
HKD 6.436081
HKD 355,072
HKD 16,083,383
HKD 6,305,215
HKD 293 096,122
HKD 228 852.647
HKD 108,343,647
HKD 104 540,950
HKD 141,622,418
HKD 55.324 821
HKD 66.550 784
HKD 23 401,745
HKD 53.156 871
HKD 27 307.828
HKD 62,464.714
HKD 298 675.296
HKD 39 573.285
HKD 155764,417
HKD 16 759.136
1.09
0.56
0.34
1.52
2.83
0 42
0 19
0.01
0 47
0.19
8.62
6.73
3.19
3.07
4.16
1 63
1 96
0 69
1 56
0 80
1.84
8.79
1.16
4.58
0.49
Description Quantity Currency Evaluation % net assets
. - . . . ... . ._ .. . .
WEIOIAO TEXTILE COMPANY 11.605,500
LTD ZlJlN MINING GROUP -H- 63,000.000
ZTE CORP H 6 000,000
HKD 15373,398 0 4 5
HKD 31 376.074 0 9 2
HKD 22 180,435 0 6 5
HONG KONG
CHINA MERCHANTS HOLDINGS
CHINA MOBILE LTD
CHINA OVERSEAS LAND AND
INVESTMENT CHINA POWER INTL
DEVELOP LTD CHINA RESOURCES
ENTERPRISE LTD CHINA RESOURCES POWER HOLDINGS CHINA TRAVEL INTL INVESTM
ClTlC PACIFIC LTD
CNOOC LfD
COFCO INTL LTD
COSCO PACIFIC LTD
DENWAY MOTORS LTD
HOPEWELL HOLDINGS
INDUSTR AND COMM BANK OF CHINA LENOVO GROUP LTD
NETEASE COM INC :ADR
SEMICONDUC MANUFACT INTL
CORP SHANGHAI INDUSTRIAL
HOLDINGS SHENZHEN INVESTMENT LTD
TlNGYl HLD CORP (CAYMAN
ISL )
TOTAL SHARES
20,090,000
46 504.000
63.694300
44.999 709
44.000 000
34,856,000
100,000.000
19.963 000
210.821,OOO
18.000 000
40.298 000
17 166 000
15,600 000
6,476.000
56.000 000
1 900,000
85 000.000
15.284.000
23 322 000
8 204 000
HKD 58,924.033
HKD 328,604.843
HKD 49,136,332
HKD 18.425 515
HKD 95.334 796
HKD 36,866,430
HKD 22,077 748
HKD 61.498 337
HKD 175,353 307
HKD 12.129 326
HKD 80.589 279
HKD 6213,618
HKD 44,453 289
HKD 11 288.414
HKD 21 995598
US0 30 666,000
HKD 11 237.830
HKD 28.878.269
HKO 8232.369
HKD 6.128793
1 73
9 67
1 44
0.54
2.80
1.08
0.65
1.81
5.16
0.36
2.37
0.18
1.31
0 33
0 65
0 90
0.33
0.85
0 24
0 18
2.003,409 238 58 91
I
1,108,035,526 32 58
3.173.127.1A6 93 30 .
TOTAL TRANSFERABLE SECURITIES ADMITTED TO AN OFFICIAL STOCK EXCHANGE LISTING 3,173,127,146 93.30
TRANSFERAQLESECURlTlESTRADEDONANOTHERREGULATED MARKET
SHARES
CHINA
SHANGHAI ZHENHUA PORT 31.608.468 USD 28.099.928 0.83
MACH -E-
28.099 928 0.83
TOTAL SHARES 28.099,928 0.83
TOTAL TRANSFERABLE SECURITIES TRADED ON ANOTHERREGULATEDMARKET 28,099,828 0.83
HSBC Global Investment Funds
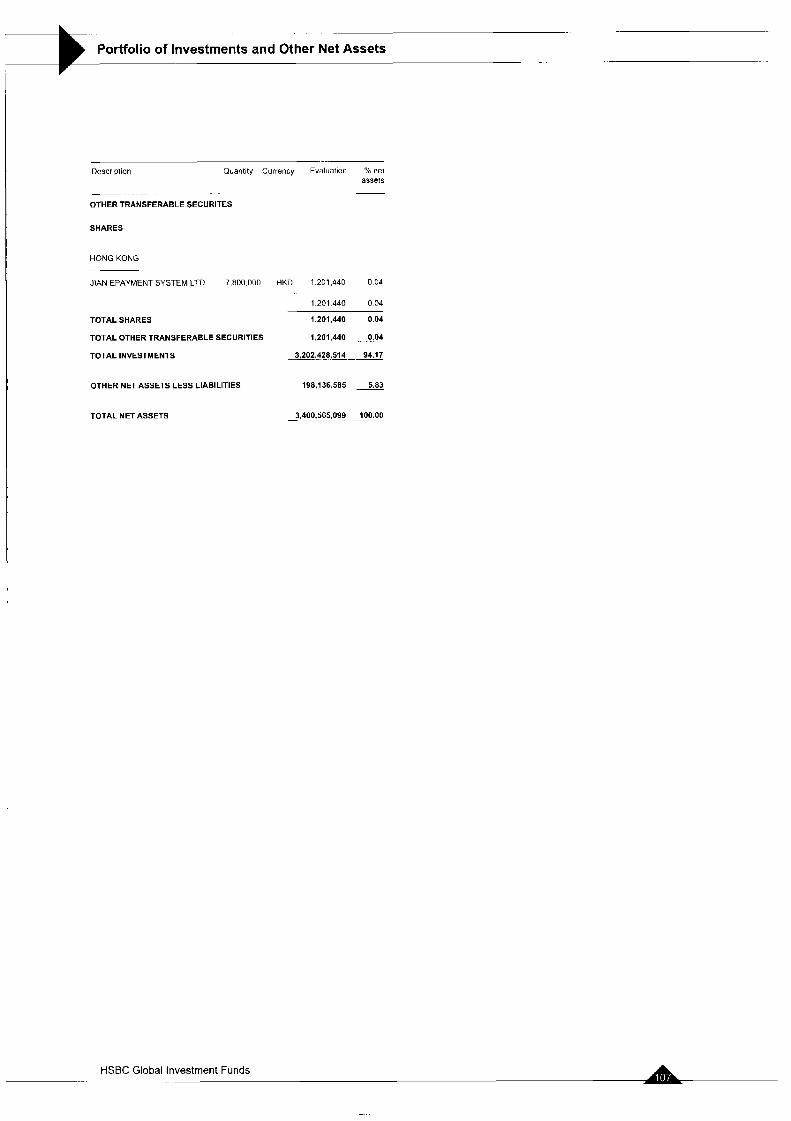
~
Description Quantity Currency Evaluation 76 net assets
- _....
OTHER TRANSFERABLE SECURITES
SHARES
HONG KOhG
J lAN EPAYMENT S Y S T E M LTD 7,800.000 HKD 1201.440 0.04
1.201 440 0 04
TOTAL SHARES
TOTAL OTHER TRANSFERABLE SECURITIES
TOTAL INVESTMENTS
OTHER NET ASSETS LESS LIABILITIES
TOTAL NET ASSETS
1,201,440 0.04
1,201,440 .. -0.04
5,202.428,514 94.17
198,136.585 5.83
3,400,565,099 100.00
__
Portfolio of Investments and Other Net Assets . . -
HSBC Global Investment Funds .
. .
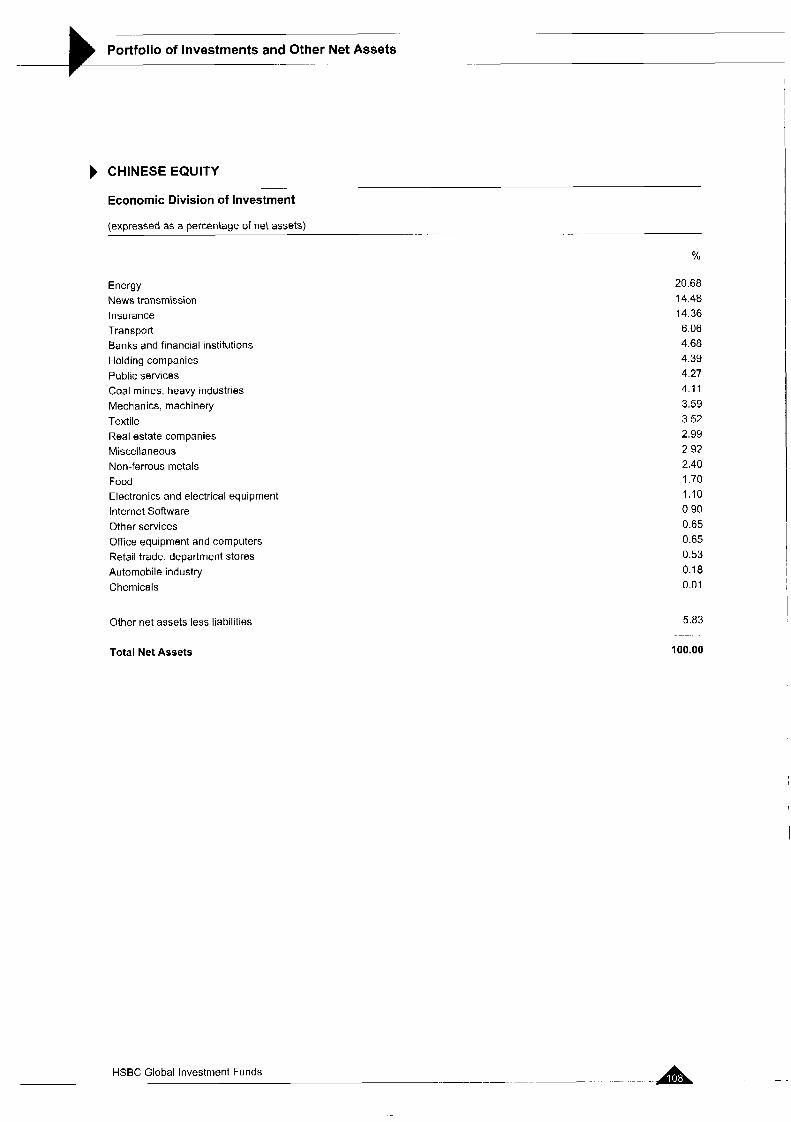
-.
Portfolio of Investments and Other Net Assets .
CHINESE EQUITY
Economic Division of Investment
(expressed as a percentage of net assets) .- _. .
Energy News transmission Insurance Transport Banks and financial institutions Holding companies Public services Coal mines, heavy industries Mechanics, machinery Textile Real estate companies Miscellaneous Non-ferrous metals Food Electronics and electrical equipment Internet Software Other services Office equipment and computers Retail trade, department stores Automobile industry Chemicals
Other net assets less liabilities
Total Net Assets
20.68 14.48 14.36 6.06 4.68 4.39 4.27 4.11 3.59 3.52 2.99 2.92 2.40 1.70 1.10 0.90 0.65 0.65 0.53 0.18 0.01
5.83
100.00
.
HSBC Global Investment Funds -. ~-

. .
Portfolio of Investments and Other Net Assets
EMERGING EUROPE EQUITY Statement of investments as at 30 September 2006 (expressed in EUR)
- Description Quantity Currency Evaluation % net
assets
RICHTER GEDEON LTD 1,900
4 620
1180
4.850
2~6 ,650
a ooo
683
8.450
16.450
2,000
a4.000
4 400
40,100
38,000
7,000
32,800
101 055
41,100
5,600
25,950
26,000
1
65 000
33,300
49,950
16,630
56 000
56.159
75,000
90.000
40,400
HUF 312.045 1 3 9
1,771.496 7 Y1 .
NETHERLANDS Description Ouantity Currency Evalualiori net
assets ZENTIVA NV CZK
PLN
PLN
PLN
PLN
PLN
PLN
PLN
PLN
PLN
PLN
PLN
PLN
PLN
212.970 0.95
212,970 0 9 5
~
INVESTMENTS
TRANSFERABLE SECURITIES ADMITTED TO AN OFFICIAL STOCK
EXCHANGE LISTING
SHARES
POLAND
BANK BPH SA.
BANK ZACHODNI WBK SA
WROCLAW BIOTON NEWS SHS
BK POLSKA KASA OPlEKl
PEKAO COMPUTERLAND SA
GRUPA LOTOS SA
KGHM POLSKA MlEDZ SA
PEG S.A
POLISH TELECOM WARSZAWA
POLSKA GRUPA
FARMACEUTYCZNA POLSKI KONCERN NAFTOWY
ORLEN POWSZECHNA KASA
0SZCZED.POLSKI TVN
240.185 1.07
236.952 1.06
160237 0.72
400.074 1.79
BERMUDA ISLANDS 17.463 0.08
97.966 0.44
425 140 1.89
425.131 1.89
82.722 0.37
95.256 0.43
CENTRAL EUROP MEDIA ENT. A 1 000
11 300
21 700
12 500
625
22 700
35,000
56 000
27 251
35.050
8.250
23,320
6 020
22.300
10.750
11,270
90,000
8.320
2,900
11,700
6 700
45.500
a 250
29,000
USD 52,895 0.24
CZECH REPUBLIC _-
CESKY TELECOM A S
CEZ.CESKE ENERGETICKE
ZAVODY
CZK 177.600 0.79
CZK 603704 2.70 489932 2.18
... ._ 355,7no 1 . 5 ~
187.754 0.84
781 304 3 49
1 1 7
4 a3
0 54
1 34
8 63
6 35
9 49
3 69
3 10
1 09
1 52
1 6 7
2 97
2 56
o ah
0.89
2.51
FEDERATION OF RUSSIA .~
AFK SISTEMA iSGDR
AKSBEREGATELNYBANK
SBERBANK COMSTAR lSGDR REP REG S
GAZPROM OAO
GAZPROM OAO/SADR
JSC SURGUTNEFTEGAZ XADR
LUKOIL 'SADR
MMC NORILSK NICKEL ISADR
MOBILE TELESYSTEMS
OJS/SADR NOVATEK OAO 'SGDR
NOVOLIPETSK STEEL GDR REGS POLYUS GOLD OJSC
RAO UNIFIED ENERGY
SYST /GDR ROSNEFT OIL COMPANY OJSC
lSGDR ROSTELECOM /SADR REP 6 SHS TATNEFT 'SADR REP 20 SHS
REG S VIMPEL
COMMUNICATIONS'S ADR
3,214.592 14.35 US0
USD
USD
USD
USD
USD
US0
US0
US0
U S 0
USD
US0
USD
USD
USD
USD
USD
m . o n 4
I ,083,744
120,768
299 310
1.935.007
1,424,033
2.127 172
a25 a i 3
693 856
244.359
340 gal
374,926
664.430
573 .~72
196.729
199.429
561.969
TURKEY
ADANA CIMENTO SANAYI A
AKBANK
AKSIGORTA
ANADOLU EFES BlRAClLlK VE
MALT ClMSA CIMENTO SANAYI VE
TICAR. EREGLI DEMIR CELIK
FINANSBANK
HURRIYET GAZETE
KOC HLD AS
SABANCI HOLDING
TUPRAS TURKIYE PETROL
RAFINEL TURK SlSE CAM
TURKCELL ILETlSlM HIZMET
TURKIYE GARANTI BANKASI
!NOM. TURKIYE IS BANKASI AS C
TURKIYE VAKIFLAR BANKASI TAO
TRY
TRY
TRY
TRY
TRY
TRY
TRY
TRY
TRY
TRY
TRY
TRY
TRY
TRY
TRY
TRY
168,264
41 7 389
121,099
110,492
118,767
93 024
2
130 644
85,852
140 605
202,998
146 144
223.090
181,523
385,934
141.356
0 75
1 a7
0.54
0 49
0 53
0 42
0 00
o 5a
0 38
0 63
0 91
0 65
1 00
0.81
1 72
0 63
2 667,203 11 91
GREAT BRITAIN TOTAL SHARES 20,741,932 92.59
KAZAKHMYS LIMITED
HUNGARY
TOTAL TRANSFERABLE SECURITIES ADMITTED TO
AN OFFICIAL STOCK EXCHANGE LISTING 20.741.932 92.59
TOTAL INVESTMENTS 20,73932-92.59
GBP 113.990 0.51
113,990 0.51
~- -.
MAGYAR TELEKOM LTD
MOL MAGYAR !-A-
OTP BANK LTO
OTHER NET ASSETS LESS LIABILITIES 1,660,799 7.41 HUF 146.457 0.65
HUF 593,273 2 6 5
HUF 719721 3.22 TOTALNETASSETS 22,402,731 2 0 0 . 0 0
HSBC Global Investment Funds . ... .-.

~ -.
Portfolio of Investments and Other Net Assets - ~. __ _ .. . -
EMERGING EUROPE EQUITY
. . . . . . . . .
Economic Division of Investment
(expressed as a percentage of net assets) - ..
%
Energy Banks and financial institutions News transmission Public services Non-ferrous metals Pharmaceuticals and cosmetics Coal mines, heavy industries Holding companies Precious metals Graphic art and publishing Construction, building materials Miscellaneous Consumer goods Insurance Tobacco and spirits Other business houses Office equipment and computers
Other net assets less liabilities
Total Net Assets
HSBC Global Investment Funds .. . -
35.44 18.59 11.77 6.10
3.06 2.45 2.10 1.67 1.42 1.28 I .oo 0.65 0.54 0.49 0.37 0.08
5.58
7.41
100.00

of - .. .- - . .
Investments and Other Net Assets
EUROLAND EQUITY Statement of investments as at 30 September 2006 (expressed in EUR)
. . . . . . . . . . . .. .
Descriptian Quantity Currency Evaluation 7" net assets
INVESTMENTS
TRANSFERABLE SECURITIES ADMITTED TO AN OFFICIAL STOCK EXCHANGE LISTING
SHARES
AUSTRIA
WIENER STAEDTISCHE
VERSICHER ZUMTOBEL AG
BELGIUM
KBC GROUPE SA
UMICORE
98000 EUR 4866.680 1 0 8
297171 EUR 5750259 1 2 7
10 616.939 2 35
83.611 EUR 6977 338 1 5 5
59.000 EUR 6,926600 1 5 3
13 Y03,93H . ...
FINLAND
ELlSA CORPORATION A
KEMIRA OYJ
NESTE OIL OYJ
NOKIA OY
OK0 OSUUSPANKK. KESKUSPANKKI A UPM-KYMMENE CORP
285,000 EUR 4.959 000
350000 EUR 5 106500
216000 EUR 4.970 160
342502 EUR 5.360 156
730,000 EUR 9.015 500
460.000 EUR 8,588,200
37.999 516
FRANCE
ASSURANCES GEN.DE FRANCE
BOUYGUES
BULL ACT NOUV.PROV. DE
REGROUP BUSINESS OBJECTS SA
CARBONE LORRAINE .LE
CREDIT AGRICOLE SA.
NEXANS PARIS
NRJ GROUF
PARROT SA
PEUGEOT SA
SANOFCAVENTIS
SUEZ
TOTAL SA
VEOLIA ENVIRONNEMENT
VIVENDI UNIVERSAL SA
GERMANY
ALLIANZ AG 'NAM.
COMMERZBANK AG
DEUTSCHE BOERSE AG !NAM
no.58n EUR 7,986,271
207,000 EUR 8 710.560
937.853 EUR 4,426,666
195,000
58.740
402,944
62.000
295 000
294.975
190 391
213 500
163.192
211 545
215 000
533 901
EUR
EUR
EUR
EUR
EUK
EUR
EUR
EUR
EUR
EUR
EUR
EUR
5 220.150
2.568 113
13.998.275
4.1 85.000
4,395,500
8.200 305
8.516 18Y
14.945 000
5.711 720
11,106 113
10,326 450
15 205 499
3 08 ~
1.10
1.13
1.10
1.19
1.99
1.90
8.41
1.77
1.93
0.98
11.8
0.57
3 10
0 93
0 Y7
1 a2
1 89
3 30
1.26
2 46
2.29
3.36
.~
Description Quantity Currency Evaluation % net assets
DEUTSCHE POST AG BONN
FRESENIUS MEDICAL CARE AG
MUENCHENER
RUECKVERSICHER iNAM PUMA AG
SIEMENS AG 'NAM
GREECE -.
COSMOTE MOBILE TELECOMMUNICAT OPAP
ITALY
ALlTALlA /POST
RAGGRUPPAMENTO AUTOGRILL SPA
CAPlTALlA SPA
SEAT PAGINE GIALLE SPA
UNICREDITO ITALIAN0 SPA
NETHERLANDS
AEGON NV
EXACT HOLDING NV DELFT
HEINEKEN NV
ING GROEP NV' CERT. OF SHS
KONINKLIJKE DSM NV
KONINKLIJKE KPN NV
QIAGEN NV
REED ELSEVIER NV
SNS REAAL NV
SPAIN
ALTADIS SA'REG
GRIFOLS SA -A-
REPSOL YPF SA MADRID
SWEDEN
ERICSSON TEL. -6
NORDEA BANK AB
281.000
129.949
101,500
16 800
250.000
413 018
322 355
5 000 000
866 330
1.972 414
10,901 000
500,000
604.416
166410
130,000
400.000
200,000
1,340 000
410.000
395,000
510.000
271.987
795.931
320,000
3,085.703
833 000
EUR 5847.610 1.29
EUR 13.44~,524 2.98
EUR 12.737.235 2.82
EUR 4 520 376 1.00
EUR 17.255.000 3.82
95.799 005 21.21
.~ -.
EUR 7.830821 1.73
EUR 8.787.398 1.95
16,618219 3 68
EUR 4,105,000 0 9 1
EUR 10.941 748 2.42
EUR 12,830.553 2 8 4
EUR 4.262291 0.94
EUR 3.287500 0 7 3
35,427,092 7 84
EUR 8.993710 1 99
EUR 3.885 674 0.86
EUR 4.667,OOO 1 03
EUR 13908.000 3 0 9
EUR 6,940000 1 5 4
EUR 13480.400 2 9 8
EUR 5.051 200 1.12
EUR 5.206,lOO 1 15
EUR 7736.700 1 7 1
69.868.784 15.47
EUR 10185,913 2 2 6
EUR 6 335.611 1.40
EUR 7.625.600 1 69
24 147.124 5.35
SEK 8,531 974 1 8 9
EUR 8.488 270 1.88 .-
17.020.244 3.77
TOTAL SHARES 446,902,672 98.95
TOTAL TRANSFERABLE SECURITIES ADMITTED TO
AN OFFICIAL STOCK EXCHANGE LISTING 446,902,672 98.95
TOTALINVESTMENTS 446,902,672 98.95
OTHER NET ASSETS LESS LIABILITIES 4,726,568 1.05
i 25 ,so i .n i i 27.79 TOTALNETASSETS 451,629,240 100.00
129949 EUH 17.767927 3 9 3
so4,sno EUR 13,487423 2 9 9
91 000 EUR 10738910 2 3 8
HSBC Global Investment Funds . .-
- . .

Portfolio of Investments and Other Net Assets -.- . ~.
EUROLAND EQUITY
Economic Division of Investment . .
. (expressed as a percentage of net assets)
Banks and financial institutions News transmission Insurance Pharmaceuticals and cosmetics Electronics and electrical equipment Energy Gastronomy Holding companies Public services Non-ferrous metals Tobacco and spirits Chemicals Other services Transport Graphic art and publishing Internet Software Construction, building materials Forest products and paper industry Automobile industry Miscellaneous Textile Office equipment and computers
Other net assets less liabilities
Total Net Assets
HSBC Global Investment Funds ... .
%
19.88 12.25 11 -59 6.28 5.32 5.25 4.37 3.65 3.55 3.35 3.29 2.67 2.37 2.20 2.09 2.02 1.93 1.90 1.89 1.12 1 .oo 0.98
1.05
100.00

.._
Portfolio of Investments and Other Net Assets .-
EUROLAND EQUITY SMALLER COMPANIES Statement of investmenta as at 30 September 2006 (expressed in EUR)
.. .~ . . . .
Description Quantity Currency Evaluation % net assets
DEUTSCHEEUROSHOP
rNAMENAKTlE EPCOS AG MUENCHEN
GEA GROUP AG
IVG IMMOBlLlEN AG
K & S A G
MTU AERO ENGINES HLDS
:NAMEN. QSC AG
SALZGITTER AG
SOLARWORLD AG BONN
STADA ARZNEIMITTEL AG
WINCOR NIXDORF AG
18,000
75 000
70.000
36.000
15,000
30,000
200,000
12.000
18.500
20,000
6.000
55,000
90.000
4o.ono
38,000
300.000
90,000
18.500
95,975
110,000
400,000
16.000
180 000
40.000
12 212
60.000
28.528
158,000
17,000
65,470
30.000
50 000
41.290
18.000
15,000
12.070
EUR 979.920 1.57
EUR 899250 1 4 4
EUR 1.000.300 1.60
EUR 1,019.880 1.62
EUR 950,250 1.52
EUR 893,100 1.43
EUR 930.000 1.49
EUR 885.240 1.42
EUR 789,025 1.26
EUR 800,200 1.28
EUR 679.080 1.09
Quantity Currency Evaluation % net assets
Description
INVESTMENTS
TRANSFERABLE SECURITIES ADMITTED TO AN OFFICIAL STOCK
EXCHANGE LISTING
SHARES
11.213.444 17.93 AUSTRIA
GREECE
BWT AG
IMMOEAST IMMOBILIEN
ANLAGEN AG WIENERBERGER AG
28,000
90 000
20 000
6.859
44 000
8 400
29.710
40 000
75 000
30 000
32 000
40 000
20,000
8 084
6 000
25.000
27.000
30.000
15,745
9 000
i:j 000
15000
5,000
30 000
EUR 808.640 1.29
EUR 859500 1.37
EUR 743200 1.19
HELLENIC EXCHANGE HOLDING SA HELLENIC TECHNODOMI TEV
SA!REG MOTOR OIL SA
MYTILINEOS HOLDINGS /REG
EUR 687,500 1.10
EUR 691.200 1.11
EUR 817.600 1.30
EUR 751,640 1.20 2.411 340 3 8 5
_._.. -. - BELGIUM
2,947,940 4.71 KINEPOLIS GROUP
OPTION N\I
UMICORE
EUR 257.213 0 4 1
EUR 686,400 1.10
EUR 986.160 1 5 8
IRELAND
INDEPENDENT NEWS AND
MEDIA PLC
EUR 696000 1 1 1
1.929.773 3.09 696000 1 1 1
DENMARK ITALY
SYDBANK AJS DKK 862.259 1 3 8 AMPLIFON SPAlAFTER SPLIT
BANCA ITALEASE
BCA POPOLARE DI MILANO
CEMENTIR. CEM.DEL TIRRENO
SPA C.1.R CIE INDUSTRIAL1 RlUNlTE
ITALMOBILIARE SPA /REP IN-
cv NAVIGAZIONE MONTANARI SPA
VALENTINO FG
EUR 570600 0 9 1
EUR 716320 1 1 5
EUR 988 543 1 5 8
EUR 672,100 1.07
EUR 944000 1 5 1
EUR 905600 1 4 5
EUR 623250 100
EUR 1.088.000 1 73
862.259 13A
FINLAND
AMER YHTYMAE A
OK0 OSUUSPANKK.
KESKUSPANKKI A RAMIRENTOYJ
WARTSILA CORPORATION
YIT OYJ
EUR 701 600 1.12
EUR 926.250 1.48
EUH 1,020,000 1 63
EUR 1017600 1 6 3
EUR 729200 1 17
6 508.413 10 40 4.394 650 7.03
FRANCE NETHERLANDS
AALBERTS INDUSTRIES
BUHRMANNNV
FUGRO NV
HAGEMEYER NV (EUR 1.2)
KON.BOSKALIS WESTMINSTER
NV KONINKLIJKE BAM GROEP NV
KON.VOPAK NV
ORDINA NV EUR 0 1
SBM OFFSHORE NV
UNIVAR NV
USG PEOPLE GROUP NV
CARBONE LORRAINE LE
GEN.DE GEOPHYSIOUE CIE
GEODIS (EX-CALEERSON) SA
GROUPE BOURBON
GROUPE STERIA VELIZY
VILLAC. HAULOTTE GROUP
MAISONS FRANCE CONFORT
NEOPOST
NEXANS PARIS
ORPEA
VALLOURE:
EUR 874,400 1.40
EUR 989.482 1 5 8
EUR 761.400 1.22
EUR 955000 1.53
EUR 1 140.210 1.82
EUR 619200 0.99
EUR 802.995 1.28
EUR 853200 1.36
EUR 877.500 1.40
EUR 897750 1.44
EUR 916500 1.47
EUR 716234 1 1 5
EUR 721,200 1.15
EUR 940283 1 5 1
EUR 606.720 0 9 7
EUR 862.750 138
EUR 922.472 147
EUR 915.600 1 4 6
EUR 738000 1 i a EUR 881.954 1 4 1
EUR 595.800 0.95
EUR 837750 1 3 4
9.687 637 15.49
EUR 1387.199 2.21
8,738,763 13.97
GERMANY NORWAY
BlLFlNGER BERGER AG AKERYARDSASA NOK 722.442 1 15
HSBC Global Investment Funds

.- - _.
Portfolio of Investments and Other Net Assets -.
Descript.on Quantity Currency Evaluation % net assets
. . .. . . .
BERGESEN WORLDWIDE GAS
ASAI-A- PROSAFE ASA
TANDBERG TELEVISION ASA
74,276 NOK 786,137 1.26
15.784 NOK 767,122 1.23
49.208 NOK 319076 0.51
SPAIN
AEENGOA SA
PROSEGUR CIA DE SEGURID
INAM. SOL MELIA SA
SWEDEN
BOLIDEN AB
0 & CO-CARNEGIE INVESTMENT AB MODERN TIMES GROUP AB -E-
SAABAB B
SSAB SWEDISH STEEL B
2.594 777 4.15
37.000 EUR 815,850 130
33000 EUR 796950 127
70.000 EUR 987.000 1.59
2,599,800 4.16
37 138 SEK 564576 090
5[1 non SEK 831 ~ f i i 1 33
16712 SEK 680495 109
29710 SEK 585627 094
41 780 SEK 582 121 0 9 3
3,244,480 5 19
SWITZERLAND
BANK SARASIN 8 CIE SAINAM:
B- FISCHER GEORG AGINAM.
PHONAK HOLDING AG ;NOM.
SIKASA EAAR
SULZER AG iNAM. (CHF6O)
300 CHF 686.715 1 1 0
2321 CHF 856,209 1 3 7
16.712 CHF 832,011 1.33
743 CHF 727.159 116
1.439 CHF 903.792 1 4 4
TOTAL SHARES
4,005,886 6.40
61,835.162 98.86
TOTAL TRANSFERABLE SECURITIES ADMITTED TO
AN OFFICIAL STOCK EXCHANGE LISTING 61,835,162. 98.86
TOTAL INVESTMENTS _. 51,835,162 98.86
OTHER NET ASSETS LESS LIABILITIES 716.106. 1.14
TOTALNETASSETS 62,551,268 100.00
HSBC Global Investment Funds

_. ..
.~ Portfolio of Investments and Other Net Assets
EUROLAND EQUITY SMALLER COMPANIES
Economic Division of Investment
(expressed as a percentage of net assets)
. .._
Construction, building materials Mechanics, machinery Banks and financial institutions Energy Electronics and electrical equipment Internet Software Transport Chemicals Pharmaceuticals and cosmetics Aerospace technology Coal mines, heavy industries Holding companies Real estate companies Non-ferrous metals News transmission Other services Public services Gastronomy Textile Retail trade, department stores Healthcare, education and social services Office equipment and computers Consumer goods Graphic art and publishing
Other net assets less liabilities
%
16.23 9.65 9.12 8.29 6.69 4.49 3.68 3.63 3.52 3.52 3.25 3.13 2.94 2.78 2.70 2.61 2.55 2.00 1.73 1.53 1.44 1.15 1.12 1.11
1.14
Total Net Assets 100.00
- . . . . .. .. HSBC Global Investment Funds

. -
Portfolio of Investments and Other Net Assets - - .... .~ . . -___ .
I
EUROLAND VALUE CREATION Statement of investments as at 30 September 2006 (expressed in EUR)
.
Description Quantlty Currency Evaluation Yo net assets
OPAP
IRELAND
51 040
160,194
506,840
313 971
149 210
210 480
102.41 3
i o 4 358
357,329
30.648
325.185
130,000
92.695
EUR 1,391,350 I 27
3.055 602 2.79
Descripmn Ouantity CJrrency Evaluation % net assets C K GROUP PLC
ITALY
EUR 1.704464 1.56
1,704,464 1.56
INVESTMENTS
CAPlTALlA SPA
RECORDATI IND CHIMICNPOST
RAG SAIPEM SPA
EUR 3.296.995 3.02
EUR 1.729980 1.58 TRANSFERABLE SECURITIES ADMITTED TO AN OFFICIAL STOCK EXCHANGE LISTING
EUR 2,570888 2.35 SHARES
7,597863 6 9 5 - ~ . .__
AUSTRIA NETHERLANDS
AEGON NV
HEINEKEN NV
ING GROEP NV/ CERT OF SHS
KONINKLIJKE KPN NV
TOMTOM NV
ZUMTOBEL AG EUR 381 389 0.35 EUR 3,131,942 2.86
EUR 3,676,627 3.35
EUR 3.628.528 3.32
EUR 3,594,730 3.29
EUR 1,026,095 0.94
15 057,922 13.76
. . .
1Y,710
32.892
21 378
244.563
264.568
65.932
64,077
104 358
80 136
58.844
9,940
68 027
50.233
112.556
34.386
95 683
33 638
137 475
37.376
33,190
25.415
82.379
13,006
87.777
381.389 0.35
BELGIUM
KBC GROUPE SA
UMICORE
EUR 2.744838 2 5 1
EUR 2,509777 2 2 9
5254.615 480 SPAIN
FINLAND BANCO BILBAO
VKARGENTARIA /NAM GRIFOLS SA -A-
INDITEX !REG
EUR 5.944,382 5.43
EUR 1,034,800 0.95
EUR 3,415,811 3.12
10.394.993 9.50
107,572,093 98.33
NOKIA OY
OK0 OSUUSPANKK.
KESKUSPANKKI A
EUR 3827,411
EUR 3,267.415
3 50
2 99
6.49
2.54
1.57
3.31
2.14
3.76
0.81
3.26
2 21
2.93
22 53
4.30
2.95
3.63
2.62
3 53
2.26
2.92
5.51
1 88
7,094,826
FRANCE TOTAL SHARES
TOTAL TRANSFERABLE SECURITIES ADMITTED TO AN OFFICIAL STOCK EXCHANGE LISTING 107,572,093 98.33
107,572,093 98.33 TOTAL INVESTMENTS -~
BOUYGUES
BUSINESS OBJECTS SA
CREDIT AGRICOLE SA
IPSOS SA PARIS
SANOFI-AVENTIS
SCHNEIDER ELECTRIC SA
TOTAL SA
VEOLIA ENVIRONNEMENT
VIVENDI UNIVERSAL SA
EUR 2774.419
EUR 1.715341
EUR 3,625396
EUR 2.339971
EUR 4,119,079
EUR 883.169
EUR 3571.418
EUR 2,412.691
EUR 3,205,595
24,647,079
OTHER NET ASSETS LESS LIABILITIES 1.026.781 1.67
TOTALNETASSETS 109,398,874 100.00
GERMANY
ALLIANZ AG :NAM
BOSS
AG HUGO!VORZUGSAKTIE DEUTSCHE BOERSE AG /NAM
DEUTSCHE POST AG BONN
FRESENIUS MEDICAL CARE AG
LINDE A G
MUENCHENER
RUECKVERSICHER rNAM RWE AG (NEU) ESSEN A
SAP AG
EUR 4.701.598
EUR 3,225474
EUR 3,969620
EUR 2,860,855
EUR 3,866.921
EUR 2.468.672
EUR 3,189,328
EUR 6.043.323
EUR 2,057.549
32,383,340 29.60
GREECE _
COSMOTE MOBILE
TELECOMMUNICAT.
EUR 1,664,252 1.52
HSBC Global Investment Funds - .. ...

.. . . .. . . .. .. .
Portfolio of Investments and Other Net Assets - . -. . .
EUROLAND VALUE CREATION
Economic Division of Investment
(expressed as a percentage of net assets)
Banks and financial institutions News transmission Insurance Pharmaceuticals and cosmetics Public services Textile Energy Tobacco and spirits Holding companies Internet Software Transport Construction, building materials Non-ferrous metals Mechanics, machinery Graphic art and publishing Electronics and electrical equipment Gastronomy Other services
Other net assets less liabilities
Total Net Assets
HSBC Global Investment Funds
%
20.58 11.24 10.08
7.72 6.07 5.61 4.91 3.98 3.45 2.62 2.54 2.29 2.26 2.14 1.75 1.27 0.95
8.87
1.67
100.00

- -_ -
Portfolio of Investments and Other Net Assets
SUSTAINABILITY LEADERS Statement of Investments as at 30 September 2006 (expressed in EUR)
.
Description Quantity Currency Evaluation Yo net assets
PEARSON PLC
ROYAL BK OF SCOTLAND PLC
ROYAL DUTCH SHELL PLC-A-
SCOTTISH POWER PLC
YELL GROUP PLC
31.533
18,400
14.100
51,053
34.800
8,984
72 915
83,500
42,700
20,375
19.074
18,002
37 402
11,407
5 644
2 018
8,650
GBP 357.088 2.21
GBP 500,140 3 0 9
EUR 366.600 2.27
GBP 491.741 3 0 4
GBP 307.474 1.90
4.566.347 28.25
Description .. . . .. . .
Quantity Currency Evaluatior % net assets
INVESTMENTS IRELAND
CRH PLC
ITALY
EUR 241 670 1.50
241.670 1.50
TRANSFERABLE SECURITIES ADMITTED TO AN OFFICIAL STOCK EXCHANGE LISTING
SHARES
AUSTRIA
WIENERBERGER AG
BELGIUM
ASM BRESCIA SPA
HERA SPA
EUR 283.639 1.75
EUR 246.743 1.53
530,382 3 2 8 3.556
17 172
10,500
10,050
6,667
17,498
8.893
2,243
3.858
6,862
3.853
5,905
4,636
6.138
4,469
16012
3.275
5 078
3.150
5,200
50,314
43,734
85.973
25.625
37.798
44 026
EUR 132,141 0.82
132.141 0.82 NETHERLANDS
REED ELSEVIER NV
SPAIN
EUR 562.786 3.48
DEXIA SA
FIN LAN 0
562,786 3 4 8 EUR 352.541 2 18
352.541 2 18
. . -
EBRO PULEVA SA
ENAGAS
SOL MELIA SA
TELEFONICA SA
EUR 331.501 2.05
EUR 367 175 2 2 7
EUR 253,828 1.57
EUR 511.659 3.17
NESTE OIL OYJ
NOKIA OY
EUR 241,605 1.50
EUR 157,283 0.97
398,888 2.47 1 464.163 9.06
FRANCE SWEDEN
ACCOR SA
AXA
DASSAULT SYSTEMES SA
GROUPE DANONE
L' OREAL
MlCHELlN B INOM.
RENAULT SA
SAINT-GOBAIN
SANOFI-AVENTIS
SCHNEIDER ELECTRIC SA
VlNCl
VIVENDI UNIVERSAL SA
EUR 357351 2 2 1
EUR 516,366 3 1 9
EUR 401 875 2 4 9
EUR 249,197 1 5 4
EUR 309797 1 9 2
EUR 398,339 2 4 6
EUR 353,127 2 1 8
EUR 339 833 2 10
EUR 324520 2 0 1
EUR 545,361 3 3 8
EUR 394166 2 4 4
EUR 456022 2 8 2
HENNES & MAURITZ AB SEK 379.470 2.35
379.470 235
SWITZERLAND
HOLCIM LTD INAM
ROCHE HOLDING AG
IGENUSSSCHEIN UBS AG INAMENSAKTIEN
CHF 363,024 225
CHF 275.631 1.71
CHF 403,370 2.49
1,042.025 6 45
15.938.288 98 61 TOTAL SHARES
TOTAL TRANSFERABLE SECURITIES ADMITTED TO AN OFFICIAL STOCK EXCHANGE LISTING 15,938,208 90.61
TOTAL INVESTMENTS 15,930,200 98.61
OTHER NET ASSETS LESS LIABILITIES 225,182 1.39
TOTAL NET ASSETS 16,163,470 1ORO.Q
4 645,954 28.74
GERMANY
ALLIANZ AG INAM.
HENKEL PREF
MUENCHENER
RUECKVERSICHER INAM. SOLARWORLD AG BONN
EUR 447,791 2 7 7
EUR 557056 3.44
EUR 395,294 2.45
EUR 221,780 1.37
1,621,921 10.03
GREAT BRITAIN
BARCLAYS PLC
BP PLC
ET GROUP PLC
DIAGEO PLC
HSBC HOLDINGS PLC
MARKSANDSPENCER
GBP 503,177 3.11
GBP 379,256 2.35
GBP 338.908 2 10
GBP 357,945 2.21
GEP 545,156 3.38
GBP 418,862 2.59
HSBC Global Investment Funds .... . ..... ....
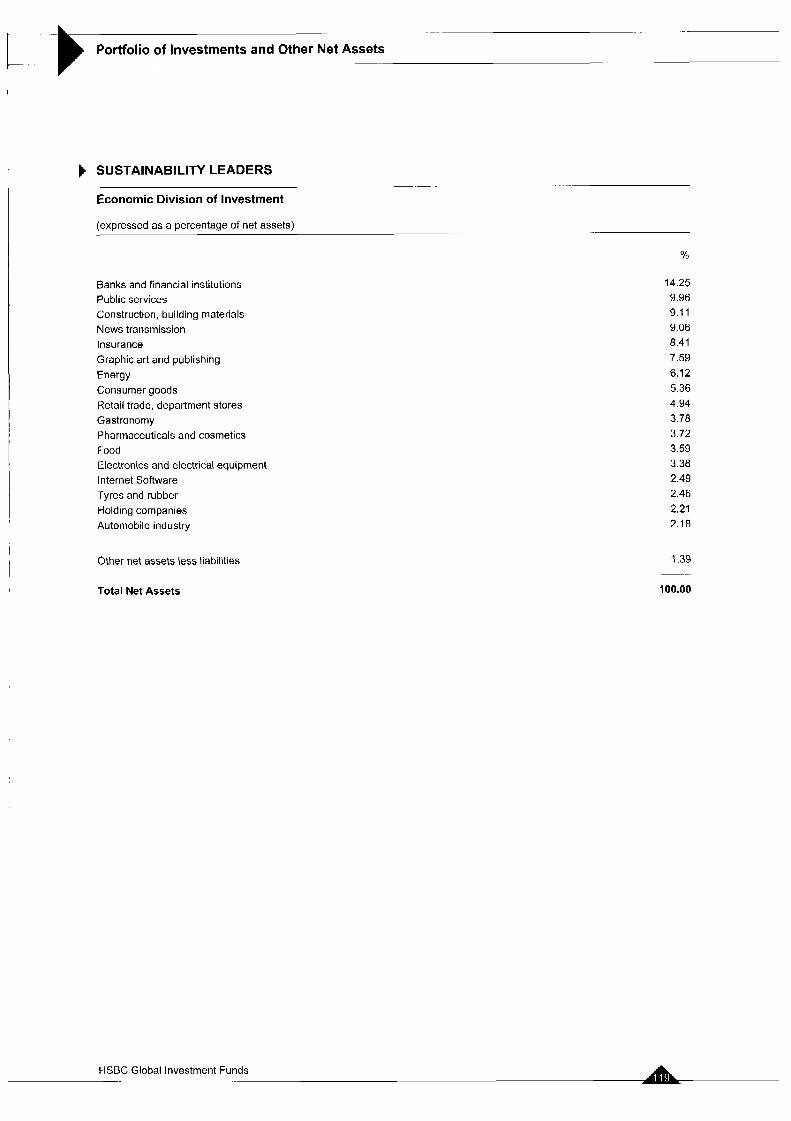
. _. .-
Portfolio of Investments and Other Net Assets I- ~.
I SUSTAINABILITY LEADERS
Economic Division of Investment
(expressed as a percentage of net assets) --. . . .
Banks and financial institutions Public services Construction, building materials News transmission Insurance Graphic art and publishing Energy Consumer goods Retail trade, department stores Gastronomy Pharmaceuticals and cosmetics Food
Electronics and electrical equipment Internet Software Tyres and rubber Holding companies Automobile industry
Other net assets less liabilities
%
14.25 9.96 9.11 9.06 8.41 7.59 6.12 5.36 4.94 3.78 3.72 3.59 3.38 2.49 2.46 2.21 2.18
1.39
Total Net Assets 100.00
HSBC Global Investment Funds

- . . - .-
Portfolio of Investments and Other Net Assets
EUROPE EX UK EQUITY Statement of Investments as at 30 September 2006 (expressed in EUR)
Description Quantity Currency Evaluation % net assets
_. ..... .~ .
GREAT BRITAIN
1,084,826
57 940
97,664
45,786
44.020
119.155
87,164
66,504
77.195
406,238
96,240
42,551
39.250
53,117
15 714
33 148
160 414
74.558
26,554
41.748
628.246
46.373
23,704
3,049
54,273
15 694
15 662
JAZZTELPLC
GREECE
EUR 444779 0 5 3
444779 0 5 3 . . _- -
Description Quantity Currency Evaluation “h net assets
....
BANK OF PIRAEUS
HELLENIC TELECOM
MARFIN FINANCIAL GROUP HLD
SA OPAP
EUR 1181 976
EUR 1,935701
EUR 1396473
1 4 1
2.29
1 66
1 4 3
6 79
2.18
2 18
1 07
1 86
1 53
3 17
7 63
INVESTMENTS
TRANSFERABLE SECURITIES ADMITTED TO AN OFFICIAL STOCK
EXCHANGE LISTING EUR 1.199.985
5 714 135 SHARES
IRELAND
BELGIUM BANK OF IRELAND
ITALY
EUR 1,831.412
1.831 412 ... - ........
UCB 22 335
17,816
30,463
65 067
87,705
115,279
32,980
61.673
10.246
10.170
15 264
442,504
24 692
32.557
12 277
52.587
11.900
28 034
18,531
92.962
24.737
79.91 1
25 489
43,221
1.273
EUR 1,113846 1.32
1.113846 1 3 2
BCA POPOLARE 01 MILANO
EN1 SPA ROMA
SAN PAOLO-IMI SPA
UNICREDITO ITALIAN0 SPA
DENMARK EUR 897789
EUR 1,560849
EUR 1289157
EUR 2,671 014
6.418 809
NOVO NORDISK Ais B DKK 1,041.295 1.24
1,041,295 1.24
FINLAND
FURTUM CORPORATION
NESTE OIL OYJ
NOKlA OY
EUR 636,981 0 7 6
EUR 1497 192 1 7 8
EUR 1372,583 1 6 3
NETHERLANDS
BUHRMANN NV
KONINKLIJKE NUMICO NV
MITTAL STEEL CLASS A
SNS REAAL NV
EUR 1,156805 1 3 8
EUR 1,510,135 179
EUR 1.078590 1 2 8
EUR 805.785 0.96
4,551.315 5.41
..........
3506.756 4 17
FRANCE
AXA
ENP PARIBAS
CREDIT AGRICOLE SA.
GROUP! DANONE
LAFARGE SA
LVMH MOET HENNESSY
RHODIA
SAINT-GOBAIN
SANOFI-AVENTIS
SCHNEIDER ELECTRIC SA
TOTAL SA
VALLOUREC
VEOLIA ENVIRONNEMENT
EUR 3,401.883 4 0 4
EUR 2801.651 3 3 3
EUR 2,142.520 2 55
EUR 1,138.331 1 3 5
EUR 1,038,357 1.23
EUR 1.241 726 1.48
EUR 783,232 0.93
EUR 1.421 025 1.69
EUR 2,278.990 2.71
EUR 1,090 811 1.30
EUR 2,760,818 3.28
EUR 2.181 270 2.59
EUR 1346473 1.60
SPAIN
ACCIONA SA
ALTADIS SAjREG.
BANCO BILBAO
VIZ.ARGENTARIA lNAM GAMESA CORP.TECNOLOGICA
SA TECNICAS REUNIDAS SA
EUR 1.874680 2.23
EUR 1241.393 1 4 8
EUR 2.932.368 3 4 8
EUR 1,294,327 1 5 4
EUR 647652 0 7 7
7990420 9 5 0
- ........
SWEDEN
BOLIDEN AB
ERICSSON TEL -B-
SEK 634,658 0 7 5
SEK 1737,101 2 0 7
23,627,087 28.08 2.371 759 2 8 2
GERMANY SWITZERLAND
ALLIANZ AG :NAM
DEUTSCHE POST AG BONN
E ON AG
GEA GROUP AG
HEIDELBERGER
DRUCKMASCHINEN AG LANXESS AG
PORSCHE AG IVZ A SDV
EUR 2533,744 3 0 1
EUR 1.934.539 2 30
EUR 2.302.273 2 74
EUR 1141.928 1 3 6
EUR 824824 0.98
CREDIT SUlSSE GROUP /NOM
JULIUS BAER HOLDING INAMENAKT. NESTLEINOM
NOVARTIS AG BASEL INAM.
ROCHE HOLDING AG
/GENUSSSCHEIN SYNGENTA AG iNAM
CHF 2,121,540 2.52
CHF 1,853.497 2.20
CHF 843,093 1 0 0
CHF 2,512.053 2 99
CHF 2 143.585 2 5 5
CHF 1882.430 2 2 4
EUR 1,468,650 1 75
EUR 1,038.182 1 2 3
11.244 140 1337
HSBC Global Investment Funds
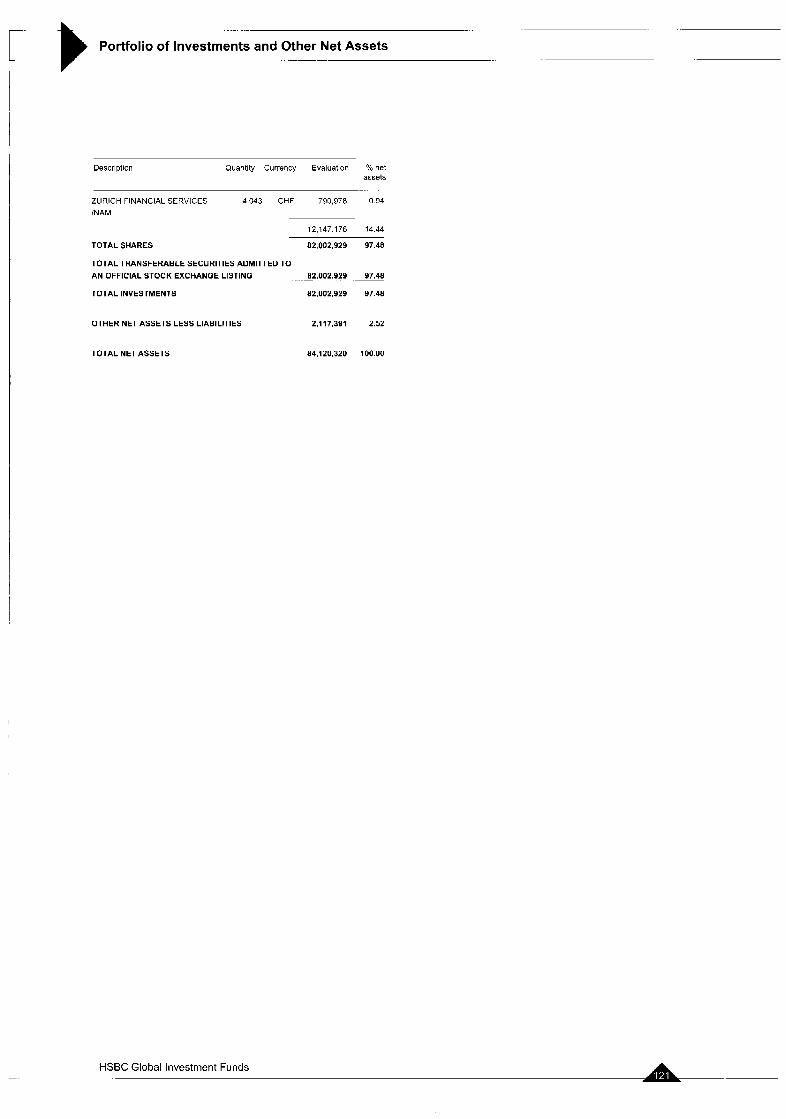
... ... ._
Portfolio of Investments and Other Net Assets
I
Description Quantity Currency Evaluation Yo net assets
ZURICH FINANCIAL SERVICES 4,043 CHF 790,978 (194
INAM
12.147 176 14.44
TOTAL SHARES 82,002,929 97.48
TOTAL TRANSFERABLE SECURITIES ADMITTED TO AN OFFICIAL STOCK EXCHANGE LISTING . -. 82,002.929 97.48
TOTAL INVESTMENTS 82.002.929 97 46
OTHER NET ASSETS LESS LIABILITIES 2.117.391 2.52
TOTALNETASSETS 84.120.320 100.00
HSBC Global Investment Funds

EUROPE EX UK EQUITY
Economic Division of Investment - ___.
(expressed as a percentage of net assets) -.
Banks and financial institutions Pharmaceuticals and cosmetics Insurance Energy News transmission Mechanics. machinery Construction, building materials Chemicals Public services Food Electronics and electrical equipment Transport Coal mines, heavy industries Graphic art and publishing Textile Tobacco and spirits Gastronomy Office equipment and computers Automobile industry
Other net assets less liabilities
I
Portfolio of Investments and Other Net Assets -
24.40 10.81 7.99 7.68 6.52 5.70 5.15 4.92 4.34 4.14 2.84 2.30 2.03 I .66 1.48
1.43 1.38 1.23
I .4a
2.52
Total Net Assets 100.00
HSBC Global Investment Funds _.

I
Portfolio of Investments and Other Net Assets
GLOBAL EMERGING MARKETS EQUITY Statement of investments as at 30 September 2006 (expressed in USD)
Description Quantity/Face Currency Evaluation 'In net Value as5ets
. ...
EGYPT ~
ORASCOM TELECOM
HLD/GDR(REG.S)
68,687 USD 3.788088 1.43
Description Quantity/Face Currency Evaluation Value
% riel assets
0 Y3
1 30
0 00
0 87
0 64
0 48
0 30
0 49
0 58
0 40
0 60
2 82
0 69
0 46
3.788 088 1 4 3
FEDERATION OF RUSSIA -. .
AK SBEREGATELNY BANK
SBERBANK GAZPROM OAO
GAZPROM OAOiSADR
LUKOIL iSADR
MOBILE TELESYSTEMS
OJSlSADR RAO UNIFIED ENERGY
SYST./GDR
.. . ..
2194 USD 4,826,800 182
185609 USD 2,013 858 0 76
99187 USD 4,348358 1 6 4
84,074 USD 6473697 2 4 3
44,448 USD 1677.912 0 6 3
46.302 US0 3.463.390 1 30
INVESTMENTS
TRANSFERABLE SECURITIES ADMITTED TO AN OFFICIAL STOCK
EXCHANGE LISTING
SHARES
BRAZIL
22.804.015 8.58 ALL AMERICA LATINA /UNIT
AMBEV CIA DE BEBIDAS /ADR
ARCELOR BRASIL SA
CIA VALE RIO DOCElSADR
DIAGNOST DA AMERICA SA BRL
GERDAU /PREF.
GERDAU SA I SADR PFD SHS
ITAU HOLDING !PFD SHSlSADR
ITAU HOLDING SA /PREF
LOCALIZA RENTA A CAR
PETROBRAS lSADR REP.l SHS.
PETROLEO BRASlLElRO /SADR
TELEMAR A /PFD SHS
VIVAX UNITS / ISH + 2 PFD SHS
314.210 BRL
75400 USD
1 BRL
124037 USD
92.013 BRL
92.807 BRL
58,700 USD
43400 USD
51,760 BRL
49500 BRL
21,373 US0
90025 USD
87 115 BRL
76482 BRL
2,459.852
3 449.550
18
2.317 011
1 694.920
1 268,483
794 798
1304.170
1,554.1 10
1 055.422
1598,914
7,508.985
1 833.366
1 225.684
HONG KONG
CHINA MOBILE LTO
CHINA NETCOM GROUP CORP
HK LTD CHINA RESOURCES
ENTERPRISE LTD CNOOC LTD
DENWAY MOTORS LTD
579.000 HKD 4,091,309 1.54
1,748,958 HKD 3,138.433 1.18
639,835 HKD 1,386.330 0.52
930,456 HKD 773,922 0.29
7 966.000 HKD 2,883.472 1.09
12,273,466 4 62 - -
HUNGARY
MOL MAGYAR /-A- 20.286 HUF 1,850,857 0.70
1,850 857 0.70 ~-
INDIA
28,065,283 10.56 1,788,000 HKD 3,162,590 1 18
14,522 US0 444954 0 17
29.338 US0 812,926 0 3 1
107.409 US0 1.587.755 0.60
10,531 US0 585,524 0 2 2
- - .
6.593 749 2 4 8
HUTCHISON
TELECOMM.INTERNAT. IClCl BK /SADR
LARSEN & TOUBRO /GDR
MAHINDRA & MAHINDRA lGDR
REG.S STATE BK OF INDIA iGDR
(REGS)
CAYMAN ISLANDS __ .
AAC ACOUSTIC TECHNOLGGIES HLD KINGDOM HOTEL INV./SGDR
REGS
2.191.795 HKD 2 532.030 0 96
143,726 USD 1 178.553 0 4 4
3710.583 1 4 0 - ... .~
CHILE
EMPR.NAC.EL./SP.ADR (30AJ 108.800 US0 3.267.264 1.23
3,267,264 1.23
INDONESIA
BANK RAKYAT INDONESIA
PT TELEKOM.INDONESIA
/SP.AOR
3,574,000 IDR 1 898.016 0.71
72,266 US0 2,642,045 1.00 CHINA
ANGANG NEW STEEL CO LTD - H- CHINA SHENHUA ENERGY CO - H- DONGFANG ELECTRICAL
MACH. H PETROCHINA CO LTD /-H-
2,731.739 HKD 2,170.482 0.82 4540.061 1.71
ISRAEL 1 773,208 HKD 2,854.194 1 0 7
356.000 HKD 619.635 0 2 3
2.671 363 HKD 2873448 1 0 9
8517.759 3 2 1
.-
TEVA PHARMACEUTICAL./ADR 95,400 USD 3.249.324 1.22
3.249.324 1.22
LUXEMBOURG . ..
TENARIS lADR CZECH REPUBLIC 44433 US0 1.595.145 0.60
1595.145 0 6 0
-. .-
CEZ.CESKE ENERGETICKE ZAVODY
102.113 CZK 3604.303 1 3 6
MALAYSIA
GENTING BERHADlFOR REG.
S P SETIA
3604.303 1 3 6 . . ~ 327,400 MYR 2.141 786 0 8 0
1.465808 MYR 1,504.004 0.57
HSBC Global Investment Funds .

Portfolio of Investments and Other Net Assets I
I
-.
Descrip!ion Ouantity!Face Currency Evaluation % net Value assets
DeSCriDtiOn OuantitylFace Currency Evaluation Yo nct Value assets
.
TELEKOM MALAYSIA
BHDjFOR.REG. SAMSUNG ELECTRONICS CO LTD SHINHAN FINANCIAL GROUP
16,264
36,290
1,420 000
341 610
2 261 477
3,447 000
1 500 760
2 153 000
3.961 880
946,000
129.362
827,882
1881,205
2.645 580
1,151 900
2,237,809
2,062.700
7,000 000
85,799
1
276,801
31.972
257,470
258.891
KRW 11 414,857 4.29
KRW 1,635,991 0.62
44,458,394 16.72
497850 MYR 1,236,516 047
4,882,306 1 84 -
MEXICO
TAIWAN ALSEA SA DE CV MEXICO
AMERICA MOVIL SA lADR WI-L-
CORP.MOCTEZUMA SA DE CV
82 EMPRESAS ICA SA DE CV
GEO /-E-
GRUPO AEROPUERTO DEL
PAClFlADR GRUPO FAMSA SA DE CV -A-
GRUPO TELEVISA jGDS
GRUPO TELEVISA
SAXERT PAR.
305 844 MXN 1,250.916 0 47
35,804 USD 1.396.714 0 53
1150.278 MXN 2349.733 088
659,735 MXN 2370.710 089
305.556 MXN 1276,092 048
79,302 US0 2.680407 1 0 1
325805 MXN 831 480 0 3 1
42966 USD 907.872 034
3371 MXN 14.265 001
AU OPTRONICS CORP
CATCHER TECHNOLOGY CO
LTD CATHAY FINANCIAL HOLDING
CHI ME1 OPTOELECTRONIC
CORP CHINATRUST FINANCIAL HLDG
co FAREASTERNDEPARTMENT
STORES FAR EASTERN TEXTILE LTD
FAR EASTONE TELECOM. CO
LTD HON HA1 PRECISION IND !GDR
HON HA1 PRECISION IND.CO LTD TAIWAN CEMENT CORP
TAIWAN SEMICONDUCTOR MANUFACT.
TWD
TWD
TWD
TWD
TWD
TWD
TWD
TWO
US0
TWO
TWD
TWO
2.01 1,244
2 933,025
4,532 863
3,814,075
1,120.663
1,031,669
2,940 490
1.025 291
1 610 557
5.043 249
1,410440
4.774 876
0 76
110
1 70
1 44
0 42
0 39
1 1 1
0 39
0 61
1 89
0 53
1 79
13 078,189 4 92
17,337 CZK 1,013.974 0 3 8
NETHERLANDS
ZENTIVA NV
PHILIPPINES
1,013.97L 0.38
32,248,442 12 13 AYALA LAND INC 6,023 719 PHP 1,710,236 0 64
THAILAND
1,710.236 0.64 BANGKOK BK PUB./NV
DEP.RECEIPT KASIKORNBANK
PUBL.COM.LTDINVDR KlATNAKlN BANK
PUBLIC/FOR.REG LAND AND HOUSE PUBLIC
/NVDR
THE 3,281 989 124
THB 3.992422 1.50
THE 1,620304 0 6 1
THE 1,351 371 0 5 1
SOUTH AFRICA
BARLOWORLD LTD
BIDVEST GROUP LTD
GOLD FIELDS
IMPALA PLAT HOLDINGS
MURRAY AND ROBERTS
HOLDINGS SASOL LTD ;REG.
TIGER BRANDS LTD
166.804 ZAR 2,850,877 1.07
145,653 ZAR 2,166,332 0.82
106 074 ZAR 1,945,093 0.73
10288 ZAR 1791.225 0.67
469 563 ZAR 1,960,399 0.74
119061 ZAR 4,030951 1.52
71.870 ZAR 1.336 175 0.50
10.246 086 3 86
TURKEY .. _- CIMSA CIMENTO SANAYI VE TlCAR FINANSBANK
SABANCI HOLDING
TUPRAS TURKIYE PETROL
RAFINEL TURKIYE GARANTI BANKASI
/NOM TURKIYE IS BANKASI AS C
TRY 498299 0.19
16 081,052
2,017 982
53 794
2,971,911
1812,063
1,998 147
651.514
2 719.481
2,717.807
3.751.135
1 616.672
3,509.1 59
2 103,832
1 273.349
831,753
1,636,942
997,015
744.990
6 05
0.76
0.02
1.12
0.68
0.75
0 25
1 02
1 02
1.40
0.61
1.32
0 79
o 48
0.31
0.62
0 38
0 28
TRY 2 0.00
TRY 988574 0.37
TRY 495161 019
SOUTH KOREA
AMORE PACIFIC CORP (NEW)
AMOREPACIFIC CORPORATION
DAEGU BANK
DAELIM INDUSTRIAL CO LTD
DAlSHlN SECURITIES CO LTD
HALLA CLIMATE CONTROL
CORP HlTE BREWERY CO LTD
HYUNDAI DEVELOPM CO- ENG.8CONS. HYUNDAI MlPO DOCKYARD CO LTD INDUSTRIAL BANK OF KOREA
KOOKMIN BANK
KOOKMIN BANK lSADR
KT8 G CORP
LG ELECTRONICS INC
LOTTE CONFECTIONERY CO LTD POSCO
POSCO lSADR
4,339 KRW
393 KRW
177,391 KRW
26579 KRW
91,990 KRW
55,781 KRW
21 990 KRW
60.930 KRW
30.075 KRW
94.A13 USD
44,503 KRW
26,520 USD
20951 KRW
12900 KRW
1,342 KRW
3.850 KRW
11 527 USD
TRY 790629 0.30
TRY 1,408519 052
4.181.184 1 5 7
231,759,760 87.21 TOTAL SHARES
WARRANTS / EQUITY LINKED SECURITIES
GERMANY
DT BK 06-23.01 O9WRT 30.516
RELCAP 0 DT BK 06-23 1 09WRT;RELIANCE 30.516
NO
US0 13511 001
US0 15006 000
28517 0.01
GREAT BRITAIN
DB BK LN 06-23 1 09 WRT/RELIAN 0 DEUT BK 04-8 10 07 WRT/RELEN 0
30,516
2 289
US0 231.055 009
US0 24154 001
HSBC Global Investment Funds - . - _- .- ~. . -.

Portfolio of Investments and Other Net Assets -. _ _
Description QuantltylFace Currency Evaluation net Value assets
...
DT BK LD 04- 53.751 US0 962,193 0 35
15.03.07WRTISATYAM 0 DT BK LN 04-22 10.07 WRTlRELI 1.525 USD 18.963 0 0 1
0 DT.BK 06-23 1 09 WRT 30516 US0 21.778 001
REL.ENERG 0 UBS LON 06- 5.000 USD 282.399 0 11 2.7.07WRT/LARS&TOUB 0 UBS LN 06-08.06 07WRT 20,448 USD 529.329 0.20
OILBNATL 0
2.069 871 0.78
INDIA
DEUTSCHE BANK AG 04- 22,800 US0 918249 0 3 5
05 04 07 /OU INFOSYS
TECHNOLOGIES LTD ~
918,249 0 3 5
TOTAL WARRANTS / EQUITY LINKED SECURITIES 3.016.637 1.14
TOTAL TRANSFERABLE SECURITIES ADMITTED TO AN OFFICIAL STOCK EXCHANGE LISTING 234,776.3L 8835
TRANSFERABLE SECURITIES TRADED ON ANOTHER REGULATED MARKET
SHARES
EGYPl
ORASCOM CONSTR IND lSGDR 43,762 USD 3 811 671 1 43
3.811 671 1.43
SOUTH KOREA ~
INDUSTRIAL BANK OF KOREA 119,970 KRW 2 054,294 0 77
2,054.294 0.77 ~
TAIWAN
CAPITAL SECURITIES CORP 4.874 526 TWD 1.878,Y25 0.71
TOTAL SHARES
1,878925 071
7,744,890 2.91 ~. - -.
TOTAL TRANSFERABLE SECURITIES TRADED ON
ANOTHERREGULATEDMARKET 7.74439q -2.91
OTHER TRANSFERABLE SECURITES
SHARES
FEDERATION OF RUSSIA
MAGNIT JSC 28.186 USD 918.864 0.35
918.864 0.35
- . ._
TOTAL SHARES
BONDS
GREAT BRITAIN
918.864 0.35
UBS LDN 0% 05-19.12 06ISTEEL 86 567.700 US0 1,408,456 0.53
1.408.456 0.53
.. . -. -
TOTAL BONDS 1,408,456 0.53
HSBC Global Investment Funds
Descrivtion
. . .~
QuantitylFace Currency Evaluation % net Value assets
WARRANTS I EQUITY LINKED SECURITIES
GERMANY
DT BK 06-2.2.11 WRT GAZPROM 6 US0 6,536.340 2.46
0
6.536.340 2.46
TOTAL WARRANTS I EQUITY LINKED SECURITIES 6.536.340 2.46
TOTAL OTHER TRANSFERABLE SECURITIES 8363,660 3.34
TOTAL INVESTMENTS 251,384,947 94.60
OTHER NET ASSETS LESS LIABILITIES 14,351,123. .. 5.40
TOTAL NET ASSETS 265,736!070 100.00

.... __ I
Portfolio of Investments and Other Net Assets I . ...-
I
GLOBAL EMERGING MARKETS EQUITY
Economic Division of Investment .__
(expressed as a percentage of net assets) __ ~ . ..
Banks and financial institutions Electronics and electrical equipment Energy News transmission Construction, building materials Holding companies Coal mines, heavy industries Public services Automobile industry Tobacco and spirits States, provinces and municipalities Mechanics, machinery Other services Pharmaceuticals and cosmetics Real estate companies Precious metals Gastronomy Food Textile Transport Chemicals Miscellaneous Retail trade. department stores
Other net assets less liabilities
Total Net Assets
HSBC Global Investment Funds
14.54 13.38 12.04
9.85 7.75 5.85 4.80 3.89 3.16 2.80 2.46 1.75 1.65 1.60 1.56 1.40 1.27 1.12 1.11 0.93 0.78 0.52 0.39
5.40
100.00

- ..-
Portfolio of Investments and Other Net Assets
GLOBAL EQUITY Statement of Investments as at 30 September 2006 (expressed in USD)
... .. . ..
Dcscription Quantity Currency Evaluation % net assets
RIO TINTO PLC /REG
SCOTTISH POWER PLC
SHIRE PLC
VODAFONE GROUP PLC
WOOD GROUP (JOHN) PLC
27.769
192,960
90,773
605.866
307 204
209.000
2 330,000
1 361,500
45 400
75.467
266,027
75,700
122 229
120,700
42
148
236.000
464
39,000
417
19000
18 700
101 700
236 242
39.900
37.737
20.451
40.367
392.468
GBP 1,333.099 0.83
GBP 2,358.081 1.47
GBP 1.498 316 0.94
GBP 1 398.417 0.87
GBP 1336,682 0.83 Description Quantity Currency Evaluation net
assets
15,454.949 9.65 ~
INVESTMENTS HONG KONG
SWIRE PACIFIC LTD - A -
INDONESIA
HKD 2,183.720 1.36 TRANSFERABLE SECURITIES AOMITTEO TO AN OFFICIAL STOCK EXCHANGE LISTING
SHARES
2,183,720 1.36
BANK RAKYAT INDONESIA
TELKOM INDONESIA !S-B-
IDR 1237.374 0 7 7
IDR 1.246877 0 7 8 BRAZIL
ALL AMERICA LATINA /UNIT
DENMARK
2,484.251 1 5 5 11 1.756
26 400
14.247
40 105
80.748
10 319
20.455
11,433
6 807
26.231
20.324
36.643
9.604
14.452
11 357
34 779
20 003
27 498
21 945
147,925
193 073
28 581
41,016
43 128
34 148
BRL 874.903 0 5 5
ISRAEL -
NICE SYSTEMS LTD ! SADR
874903 0.55
USD 1284.366 0.80
1,284,366 0 80 ~ -. NOVO NOROISK AIS B DKK 1957.689 1 2 2
1.957 689 1 2 2 ITALY
FEDERATION OF RUSSIA CAMPARI AZlPOST
FRAZIONAMENTO UNICREDITO ITALIAN0 SPA
EUR 691 785 0.43
LUKOIL /SADR
NOVOLIPETSK STEEL GDR
REGS
US0 1.097 019 0.68
USD 778.037 0.49
EUR 2,219.205 1.39
2,910,990 1.82
JAPAN 1875.056 1 1 7
CAS10 COMPUTER CO.LTD
KlTZ CORP
MEDICEO PALTAC HOLDINGS
CO LTD MILLEA HOLDINGS INC
MlTSUBlSHl UFJ FINANCIAL
GROUP NIPPON EXPRESS CO LTD
NTT DATA CORP
OMRON CORP
RESONA HOLDINGS INC
SEVEN & I HOLDINGS CO LTD
SONY CORP
SUZUKI MOTOR CORP
TOSHIBA CORP
YAMAHA MOTOR CO LTD
FRANCE JPY 1.527 737 0.95
JPY 978,413 0.61
JPY 2.476843 1.56
JPY 733656 0.46
JPY 1907573 1.19
JPY 1,266 752 0.79
JPY 2.144 324 1.34
JPY 959 1144 0.60
JPY 1.251 743 0.78
JPY 612.228 0 3 8
JPY 757.958 0 4 7
JPY 2,587,130 1 6 3
JPY 1.534482 0.96
JPY 1.058.993 0 66
AXA
BNP PARIBAS
CLARINS SA
GROUPE DANONE
STE GEN. PARIS -A-
SUEZ
TOTAL SA
VEOLIA ENVIRONNEMENT
EUR 3023.272 1 8 8
EUR 1 112.185 0.69
EUR 1.471.494 0 9 2
EUR 1,611.574 1 0 1
EUR 1.096.820 0.69
EUR 1.164.820 0.73
EUR 1,353.769 0 85
EUR 2.232 953 1.39 . . ...
13.066 887 8.16
GERMANY
BASF AG
CONTINENTAL AG
DEUTSCHE BANK AG iNAM
HEIDELBERGER
DRUCKMASCHINEN AG HENKEL PREF
LlNDE A.G.
MAN AG
EUR 771 437 0.48
EUR 1,681,959 1.05
EUR 1.380 113 0.86
EUR 1,427 913 0.89
EUR 2.784 054 1.74
EUR 2,594 976 1.62
EUR 1,852.655 1.16
19 796.876 12.38
JERSEY
MEINL EUROPEAN LAND
LIMITED
EUR 824.952 0.52
824.952 0 5 2 .. .- - . 12,493 107 7.80
MEXICO GREAT BRITAIN
AMERICA MOVIL SA rADR WI-L-
CEMEX 'ADR
COMERCI UNITS ( ISH C + 3 SH
8 )
US0 797.794 0 5 0
USD 1 215,450 0.76
MXN 790.313 0 4 9
-~
2 803,557 1.75
BAE SYSTEMS PLC
BARCLAYS PLC
CARNIVAL PLC
GLAXOSMI-HKLINE PLC
HSBC HOLDINGS PLC
KAZAKHMYS LIMITED
GBP 1,103,378 I1 69
GBP 2.449 794 1 5 4
GBP 1362337 085
GBP 1088.530 0 6 8
GBP 789.201 0 4 9
GBP 737.114 0 4 6
-. . . - HSBC Global Investment Funds
. . . . . - . -_ . . .-. . ...

.-
Portfolio of Investments and Other Net Assets _.
~
"h net assets
0 74
1.15
0.87
0.53
1.22
0.89
1.33
0.46
1 66
1.41
1.11
1 88
... .. -. -. . .
Description Description Ouanlity Currency Evaluation % net assets
Quantity Currency Evaluation
1,183 027
1 839,165
1.367.233
855,427
1.946.231
1,426,674
2,123.039
732.090
2,692.778
2,263.024
1,774,059
3,007 496
.- - .
NABORS INDUSTRIES LTD
NVlDlA CORP.
PEPSICO INC
PRUDENTIAL FINANCIAL INC
SCHLUMBERGER LTD
SYSCO CORP.
TEXAS INSTRUMENTS INC
UNITED TECHNOLOGIES CORP.
VERIZON COMMUNICATIONS
INC WALT DISNEY !DISNEY SER.
WELLPOINT INC
WELLS FARGO B CO
NETHERLANDS 40.239 US0
62 197 USD
21.244 USD
11.121 USD
32,U42 USD
42,600 USD
62.645 USD
11,500 USD
72.896 USD
MITTAL STEEL CLASS A
ROYAL PHILIP5 ELECTRONICS NV ZENTIVA GDR /REG
76.996
50 081
32.096
6.290
25.601
1.745
4 538
27,764
6 672
53.997
1
45,950
254.155
50 300
49 972
7.868
25 214
74,422
44,783
11,906
19 933
38.332
31.731
13,223
32.378
25 692
8.565
63 323
24.542
42,017
17,963
44,081
25.904
54.058
58.641
37.743
EUR 2,684,485 1.68
EUR 1763878 1.10
US0 1.677.160 117
6,325,523 3 95
SPAIN
ACCIONA SA
SWITZERLAND
EUR 952.066 0 5 9
952.066 0.59 73.166 USD
23.154 US0
83,264 US0 CIE FIN RICHEMONT UNITS -A-
GIVAUDAN SA ;REG
NESTLEINOM
NOVARTIS AG EASEL INAM
ROCHE HOLDING AG
IGENUSSSCHEIN UBS AG /NAMENSAKTIEN
CHF 1.241 236 078
CHF 1,407,281 0 8 8
CHF 1,592 058 0.99
CHF 1,630433 1 0 2
CHF i.502a04 094
61.521,701 38.44
TOTAL SHARES 158,426,444 98.96
TOTAL TRANSFERABLE SECURITIES ADMITTED TO
AN OFFICIAL STOCK EXCHANGE LISTING 158.426.444 98.96
TRANSFERABLE SECURITIES TRADED ON ANOTHER REGULATED MARKET CHF 3.194717 199
10,568 529 6 60 SHARES
TAlWAh . . .-
FAR EASTERN TEXTILE LTD
/GDRS
JAPAN USD 7 0.00
7 0.00 .~
OSAKA SECURITIES 243 JPY 857.187 0 5 4 EXCHANGE CO
857,187 0.54
TOTAL SHARES 857,187 0.54
TOTAL TRANSFERABLE SECURITIES TRADED ON
a 5 7 , w 0.54 ANOTHERREGULATEDMARKET ~
159,283.631 99-50 TOTAL INVESTMENTS
TURKEY
CIMSA CIMENTO SANAYI VE
TICAR TURKIYE GARANTI BANKASI
/NOM
TRY 266.866 0.17
TRY 780,449 0 4 8
1.047.315 0 65
UNITED STATES
ACCENTURE LTD I-A-
AKAMAI TECHNOLOGIES INC
ALLERGAN INC.
ALTRIA GROUP
BANK OF AMERICA CORP
BANK OF NEW YORK CO
BOEING CO
CATERPILLAR INC.
ClTlGROUP INC
CORNING INC.
COSTCO WHOLESALE CORP
OR HORTON INC
ELECTRONIC ARTS
EMERSON ELECTRIC CO.
EXXON MOBlL CORP
GENERAL MOTORS CORP.
HONEYWELL INTERNATIONAL
INC. JOHNSON&JOHNSON
MCDONALD'S CORP.
MERRILL LYNCH 8. CO INC
METLIFE INC
MICROSOFT CORF
MORGAN STANLEY
OTHER NET ASSETS LESS LIABILITIES 806,893 .._-&50
USD
US0
US0
US0
USD
US0
US0
USD
US0
US0
USD
US0
USD
US0
USD
US0
US0
US0
USD
USD
USD
USD
USD
1,589.480
2.502 oga
896,952
1 940 722
3,983,065
1,592 483
943,908
1.327 338
1,913,917
784,708
662,076
796,499
1 434.384
719,803
4.271 771
81 1,359
1,736,243
1,165,799
1,745,167
2,048.747
3 065.069
1,606.763
2,751,087
0.99
1.56
0.56
1.21
2.49
0.99
0.59
0.83
1.20
0.49
0.41
0.50
0.90
0.45
2.67
0.51
1.09
0.73
1.09
1 28
1 9 1
1 .oo 1 72
TOTALNETASSETS 160,090.524. 100.00
HSBC Global Investment Funds . . - .. - .

Portfolio of Investments and Other Net Assets . -
GLOBAL EQUITY
Economic Division of Investment . . . . . . . . . . .. -.
(expressed as a percentage of net assets) .
Banks and financial institutions Holding companies Pharmaceuticals and cosmetics Energy Internet Software News transmission Mechanics, machinery Electronics and electrical equipment Insurance Public services Food Aerospace technology Automobile industry Coal mines. heavy industries Construction, building materials Gastronomy Consumer goods Tobacco and spirits Chemicals Transport Healthcare, education and social services Tyres and rubber Other services Office equipment and computers Retail trade, department stores Other business houses Miscellaneous Non-ferrous metals Real estate companies Textile
Other net assets less liabilities
Total Net Assets
-. ... HSBC Global Investment Funds
. ...
%
14.94 12.51 8.18 6.16 5.95 5.12 5.11 4.90 3.79 3.59 2.87 2.83 2.80 2.63 2.02 1.94 1.74 1.64 1.36 1.34 1.11 1.05 0.99 0.96 0.90 0.89 0.83 0.83 0.52 0.00
0.50 ... .
100.00
-. . . . .-

.- - . _. I
Portfolio of Investments and Other Net Assets I - .
GLOBAL EQUITY SRI Statement of investments as at 30 September 2006 (expressed in USD)
Description Quantity Currency Evaluation ? b net assets
STE AIR FRANCE
STE GEN. PARIS -A-
UNlBAlL HOLDING
2 100
900
280
720
750
2,250
440
120
1100
3.500
4 500
7.200
10.600
10 260
3,100
2 100
14.500
5,200
7 100
5 600
1100
2.500
5.800
3.400
1400
1,150
1 970
12 100
6.500
1 600
5.400
4.000
5.000
4.300
3,200
3.600
1100
500
2 100
3 000
EUR 63119 050
EUR 145018 1 1 4
EUR 58510 0 4 6
Descriotion Quantity Currency Evaluation “h net assets
721.573 5 70
GERMANY .. .- .
ADIDAS AG
DEUTSCHE BANK AG /NAM.
DEUTSCHE LUFTHANSA INAM.
MUENCHENER
RUECKVERSICHER /NAM. PUMA AG
VOLKSWAGEN AG
EUR 33,909 0 2 7
EUR 91,141 0.72
EUR 47,473 0 3 8
EUR 70,055 0.55
EUR 40,966 0.32
EUR 95.726 0.76
INVESTMENTS
TRANSFERABLE SECURITIES ADMITTED TO AN OFFICIAL STOCK EXCHANGE LISTING
SHARES
379 270
50,935
65,519
91,357
131 180
112885
25,404
54 029
72,521
53,621
52 086
21 037
29 193
45 748
57 148
126 241
67 209
39 235
65 366
57 489
59 697
52011
52 255
49 781
3 00 AUSTRALIA
ANZ BANKING GROUP
BHP BILLITON LTD
FOSTERS GROUP LTD
QANTAS AIRWAYS LTD
RIO TINTO LIMITED
..... GREAT BRITAIN
ALLIANCE BOOTS PLC
AVIVA PLC
BARCLAYS PLC
BG GROUP PLC
BP PLC
BRITISH AIRWAYS PLC
BRITISH LAND
BT GROUP PLC
CAPITA GROUP PLC
CORUS GROUP PLC
FIRST CHOICE HOLIDAYS
GLAXOSMITHKLINE PLC
HSBC HOLDINGS PLC
INCHCAPE PLC
LAND SECURITIES GROUP PLC
RIO TINTO PLC !REG
ROYAL DUTCH SHELL -6-
ROYAL DUTCH SHELL PLC -A-
SAGE GROUP PLC
SMITH AND NEPHEW PLC
TRAVIS PERKINS PLC
WIMPEY PLC.GEORGE
WPP GROUP PLC !ISS 05
2.900
4,000
1 1 .BUO
19 200
1,712
870
530
1,600
2 310
2,300
290
1 000
800
1,400
1,700
26
1,400
1,SUO
450
1.600
1,060
760
1,010
AUD 58.261 0.46
AUD 76,680 0.61
AUD 5fi838 0 4 5
AUD 56150 0.44
AUD 89,762 0 7 1
GBP
GBP
GBP
GBP
GBP
GBP
GBP
GBP
GBP
GBP
GBP
GBP
GBP
GBP
GBP
GBP
GBP
GBP
GBP
GBP
GBP
GBP
GBP
0 40
0.52
0.72
1 .os 0.89
0.20
0.43
0.57
0.42
0.41
0.17
0.23
0 36
0 45
1.01
0.53
0.31
0.52
0 45
0.47
0.41
0.41
0.39
337.691 2.67
AUSTRIA
OMV AG EUR 45.157 0.36
45,157 0.36
BELGIUM
KBC GROUPE SA EUR 56.115 0.44
56115 0 4 4
CANADA
BANK OF NOVA SCOTIA
ENCANA CORP
PETRO-CANADA
SUNCOR ENERGY INC.
TELUS CORP
CAD 70.188 0 5 5
CAD i09,2oe 087
CAD 94400 0.75
CAD 21,077 0 17
CAD 56281 0 4 4
351 155 2.78
DENMARK ..
NOVO NORDISK AIS B DKK 59.324 0.47 1.431 947 11.32
59324 0 4 7 HONG KONG
FIN LAND SWlRE PACIFIC LTD - A
ITALY
HKD 52242 0.41
52242 0.41
. .- EUR 51 529 0.41
EUR 48.206 0.38
METSO CORP
RAUTARUUKKI OY K
99.735 0.79 .- EN1 SPA ROMA EUR 128.044 1.01
128.044 1.01
FRANCE
ARKEMA FRANCE
BUSINESS OBJECTS SA
CREDITAGRICOLE SA.
LAFARGE SA
PAGESJAUNES PARIS
SANOFCAVENTIS
SCHNEIDER ELECTRIC SA
SODEXHO ALLIANCE SA
EUR 1,230 0.01
EUR 47,550 0.38
EUR 66115 0.52
EUR 58,293 0.46
EUR 45.553 0.36
EUR 94,141 0.74
EUR 85.674 0 6 8
EUR 56.370 0.45
JAPAN
ALPS ELECTRIC CO
ASAHI BREWERIES
BENESSE CORP
CANON INC
CANON SALES CO INC
DAl NIPPON PRINTING CO L
JPY 33484 0 2 6
JPY 52.567 042
JPY 40,761 0 3 2
JPY 26.117 0 2 1
JPY 50,394 0 4 0
JPY 46,375 0.37 .TO
HSBC Global Investment Funds ~ ..

... ~
Portfolio of Investments and Other Net Assets ._.
I
Description
~-
DAIWA SECURITIES GROUP INC
EAST JAPAN RAILWAY CO
ElSAl CO LTD
FUJI ELECTRIC HOLDINGS CO LTD KOMATSU LTD
MlTSUBlSHl ELECTRIC CORP
MIZUHO FINANCIAL GROUP INC
NIPPON EXFRESS CO LTD
NIPPON OIL CORP
NIPPON STEEL CORP
NIPPON TEL 8 TEL
NIPPON YUSEN K K
NISSAN MOTOR CO LTD
NOMURA RESEARCH INSTITUTE LTD OMRON CORP
RICOH CO LTD
SOMPO JAPAN INSURANCE INC
SONY CORP
TOKYO ELECTRIC POWER
TOKYO ELECTRON CO LTD
TOPPAN PRINTING CO LTD
TOYOTA MOTOR CORP
YAHOO JAPAN CORP TOKYO
YAMAHA MOTOR CO LTD
NETHERLANDS
HEINEKEN NV
ING GROEP UVI CERT. OF SHS
RANDSTAD HOLDING
STMICROELECTRONICS NV
SINGAPORE
NEPTUNE ORIENT LINES
SPAIN
BANCO BILBAO
VIZ ARGENTARIA iNAM BCO SANTANDER CENTR HISP
/REG ENDESA SA
INDITEX /REG
SWEDEN
ATLAS COPCO AB - A -
LUNDIN PETqOLEUM AB
SCANIA AB - B-
SKAN0INAV.ENSK BANKEN A
SSAB SWEDISH STEEL B
VOLVO -E-
Quantity Currency
5 000
3
1 200
10 000
3,000
10 000
5
10 000
6,000
15 000
12
14.000
7 100
400
2,000
2.000
4 000
2.900
3.900
1 600
5.000
2 300
130
1 900
1.200
2,100
460
4.200
5 000
5 200
6,550
1.930
2.780
1 800
3.800
1,100
3 200
1 200
1 000
JPY
JPY
JPY
JPY
JPY
JPY
JPY
JPY
JPY
JPY
JPY
JPY
JPY
JPY
JPY
JPY
JPY
JPY
JPY
JPY
JPY
JPY
JPY
JPY
Evaluation
58,425
21 012
58 102
51 641
51,895
84.372
38.837
53.676
44.264
61.816
59.018
85,356
79 652
55 626
49.182
39,854
52,472
117 544
112,440
118.443
55.541
125.21 1
48.999
50,428
O h net assets
0.46
0.17
0.46
0 41
0.41
0.67
0.31
0.42
0.35
0.49
0.47
0.67
0 63
0 44
0.39
0.32
0.41
0.92
0.89
0.93
0.44
0 98
0.39
0 40
1,823,504 14.41
EUR 54658 0.43
EUR 92,641 073
EUR 26321 021
EUR 73,643 0 5 8
247.263 195
SGD 6 397 0.05
6 397 0.05
EUR 120,602 0.95
EUR 103879 0.82
EUR 83.035 066
EUR 129,975 103
437.491 346 -
SEK 47606 038
SEK 40,747 032
SEK 65,873 0.52
SEK 87,045 068
SEK 21 213 017
SEK 60.158 048
322642 255
HSBC Global Investment Funds
-. . ..
Description Quantity Currency Evaluation YO net assets
SW ITZE RLAN D
GEEERIT AG. JONA INAM.
NESTLE/NOM
NOVARTIS AG BASEL INAM
ROCHE HOLDING AG
/GENUSSSCHEIN
UNITED STATES
ALCOA INC
ALLSTATE CORP
AMBAC FINANCIAL GROUP INC
AMERICAN EXPRESS CO
AMERICAN INTERNATIONAL GP
ANHEUSER-EUSCH COS INC
A T B T
BAKER HUGHES INC
BANK OF AMERICA CORP
BAXTER INTL INC
BECTON DICKINSON 8 CO
BRISTOL MYERS SQUIBB CO
CAPITAL ONE FINANCIAL CORP
CISCO SYSTEMS INC
ClTlGROUP INC
COCA-COLA CO
COUNTRYWIDE FINANCIAL
CORP CUMMINS INC
DELL INC
DIRECTV GROUP INC
DONNELLEY AND SONS RR
DTE ENERGY COMPANY
DUKE ENERGY HOLDING CORP
ECOLAB INC
EXPEDIA INC DEL
FPL GROUP INC
GENERAL ELECTRIC CO
GENZYME CORP
GOLDMAN SACHS GROUP INC
GOOGLE INC A
HEWLETT-PACKARD CO
HOME DEPOT INC
IBM CORP
JOHNSON a JOHNSON
JOHNSON CONTROLS INC
J.P MORGAN CHASE 8 CO
LIZ CLAIBORNE INC
MANPOWER INC.
MATTEL INC
MCGRAW HILL COMPANIES INC
MERRILL LYNCH 8 CO INC
MOTOROLA INC
NEWFIELD EXPLORATION CO
NOBLE CORP
NORTHERN TRUST CORP
OMNICOM GROUP INC
44
74
440
620
1,100
1,800
700
1,500
I .a70
510
1,900
350
3.25A
600
1.500
3.260
700
7,800
2,900
3.300
2.860
410
1.100
6,200
2,300
570
3,400
2,400
3.000
580
5,100
1,400
500
110
4,500
2.100
1,520
2 960
1.300
1,700
1,300
1,300
1.900
1,000
440
5,200
470
290
400
1.000
CHF 54740 0.43
CHF 25.961 021
CHF 25.839 020
CHF 107,443 0 8 5
213,983 1.69
US0
US0
US0
US0
US0
US0
US0
US0
US0
US0
US0
US0
US0
US0
USD
USD
USD
USD
USD
USD
USD
US0
US0
US0
us0 USD
US0
US0
US0
USD
USD
US0
USD
USD
USD
US0
USD
US0
US0
US0
USD
US0
USD
USD
USD
USD
30.679
113,112
57,988
83,985
123.869
24 465
61.503
23,436
174,154
26 958
104 100
81.011
56,070
183,143
144.797
148.335
99.785
49.372
25,278
121,148
75,900
23,786
104,244
103.728
47.760
26.309
180,948
95,326
85.000
44 394
161,865
77,070
124 625
192 103
94.107
80.155
51,545
80,132
37 601
57.220
34,800
129.272
18 086
18.337
23,408
93.900
0.24
0.89
0.46
0.66
0.98
0 19
0.49
0.19
1 36
0 21
0.82
0.64
0 44 145
114
1.17
0 79
0 39
0.20
0.96
0.60
0.19
0.82
0.82
0.38
0.21
1.43
0.75
0 67
0 35
1.28
0.61
0 99
1.53
0.74
0.63
0.41
0.63
0.30
0.45
o 28
0 14
1.02
0.14
0.19
0.74

.. ~- -~ ._ _ _ _ _ -
.
pb Portfolio of Investments and Other Net Assets
Description Quantity Currency Evaluation % net assets
PEPSICO INC
PITNEY BOWES INC
PLUM CREEK TIMBER CO INC
PPL CORP
PROCTER 8 GAMBLE CO
QUEST DIAGNOSTICS INC
QWEST COMMUNICATIONS
INTL ROHM + HAAS CO
SAFECO CORP
SCHLUMBERGER LTD
SPRINT NEXTEL CORPlFON
SER.l STATE STREET CORP
SUNOCO INC.
TARGET CORP
TIME WARNER INC
TXU
UNITED TECHNOLOGIES CORP.
UTD PARCEL SERVICE INC "E"
WALT DISNEY lDlSNEY SER.
WELLS FARGO & CO
WEYERHAEUSER CO
YAHOO INC
ZIMMER HOLDINGS INC
TOTAL SHARES
INVESTMENT COMPANIES
AUSTRALIA
MACQUARIE OFFICE TRUST
2 300
1,730
1 400
2 400
2,420
n70
6.600
1,970
1,500
600
1,590
1,600
1.300
2 030
6.900
1,000
2 040
290
4,000
4.000
1100
71 0
950
45,000
USD 150.190 1.19
USD 77,156 0 6 1
USD 48146 0 3 8
US0 79,896 063
USD 150669 1.19
USD 53.914 043
USD 57,618 0 4 6
USD 94639 0 75
USD 88,410 0.70
USD 36444 0.29
US0 26,537 0.21
US0 100,016 0.79
USD 80.743 0 6 4
US0 114,167 0 9 0
US0 125,580 0.99
US0 63,330 0.50
USD 129.866 1 0 3
US0 21.034 0.17
US0 123,720 0.98 US0 144.480 1.14
USD 68.508 0.54
USD 17,984 0.14
US0 64 116 0.51
5.711 974 45.16
12,425,507 98.22
AUD 50.318 0.40
50,318 0 4 0
TOTAL INVESTMENT COMPANIES 50,318 0.40
TOTAL TRANSFERABLE SECURITIES ADMITTED TO AN OFFICIAL STOCK EXCHANGE LISTING 12.475,825 98.62
TOTAL INVESTMENTS 12.475,825 98.62
OTHER NET ASSETS LESS LIABILITIES 175.042 1.38
TOTAL NET ASSETS 12,650,867 100.00
HSBC Global Investment Funds _.

___
Portfolio of Investments and Other Net Assets . ._ -
GLOBAL EQUITY SRI
Economic Division of Investment ..
(expressed as a percentage of net assets)
Banks and financial institutions Holding companies Pharmaceuticals and cosmetics Energy Electronics and electrical equipment Office equipment and computers Insurance Automobile industry News transmission Graphic art and publishing Public services Transport Food Other services Consumer goods Internet Software Coal mines, heavy industries Textile Retail trade, department stores Real estate companies Construction, building materials Mechanics. machinery Tobacco and spirits Non-ferrous metals Aerospace technology Chemicals Biotechnology Forest products and paper industry Other business houses Investment companies Miscellaneous Gastronomy
Other net assets less liabilities
14.18 8.77 7.87 7.83 6.32 4.53 4.51 3.75 3.66 3.59
3.00 2.57 2.12 2.12 2.07 2.06 2.03 1.91 1.90 1.71 1.59 1.49 1.48 1.03 0.76 0.75 0.54 0.45 0.40 0.38 0.17
3.08
1.38 ~
Total Net Assets 100.00
HSBC Global Investment Funds -. -L

I
Portfolio of Investments and Other Net Assets I .. .
GLOBAL EQUITY TECHNOLOGY Statement of investments as at 30 September 2006 (expressed in USD)
-. . . . . - . . . ... . . .
Description Quantity Currency Evaluation net assets
GREAT BRITAIN
AEGIS GROUP PLC
BRITISH SKY BROADCASTING
GROUP BT GROUP PLC
EMAP -B- ASS.IN RED. PREF
EMAP PLC
SAGE GROUP PLC
UTD BUSINESS MEDIA
VODAFONE GROUP PLC
WPP GROUP PLC llSS 05
YELL GROUP PLC
8.900
5.200
5.300
2,140
1.783
11 500
1,600
66.875
5 300
1,900
5,100
3.000
42,400
1.500
2 550
15
12,000
1.000
10
17
61
1.700
3.000
900
1,500
2 aoo 2,190
2,400
14,000
34 200
25 000
GBP
GBP
GBP
GBP
GBP
GBP
GBP
GBP
GBP
GBP
.. .
HKD
HKD
22.610 0.32
53.475 0.75 Quantity Currency Evaluation YO net
assets 26508 0 3 7
4405 0 0 6
24.842 0 35
54538 0 7 7
19,837 0.28
154357 2 17
65.960 0 9 3
21,299 030
.. - - . . .. .
INVESTMENTS
TRANSFERABLE SECURITIES ADMITTED TO AN OFFICIAL STOCK EXCHANGE LISTING
SHARES
447.931 6.30 AUSTRALIA ._
HONG KONG
TELSTRA CORPORATION LTD
BELGIUM
6.500
190
1 400
540
2.800
1,400
1.300
700
1.000
a 550
1.100
540
1,258
1 300
3 140
2.000
720
130
150
ASM PACIFIC TECHNOLOGY
LTD TELEVISION BROADCASTS LTD
ITALY
26.775 0.37
la037 0.25 16,173 0.23
42.948 0.60
__
BARCO NV
BELGACOM SA
MOBISTAR
EUR 17.389 0 2 4
EUR 54709 0.78
EUR 44,978 0 6 3
117,056 1 6 5
. SEAT PAGINE GIALLE SPA
JAPAN
EUR 21,034 0 3 0
21,034 030
BERMUDA ISLANDS
MARVELL TECHNOLOGY
GROUP ALPS ELECTRIC CO
CANON INC
EACCESS LTD
HlTACHl LTD
HOYA CORP
KDDl CORP
NIPPON TEL 8 TEL
NTT DOCOMO INC
OMRON CORP
RlCOH CO LTD
TOKYO ELECTRON CO LTD
TREND MICRO INC .TOKYO
USD 55.076 0.78 JPY 15,696 0 2 2
JPY i33.19a 1.87
J PY 9069 0 1 3
JPY 70,109 0 9 9
JPY 37.734 0 53
JPY 62,410 088
JPY 83,609 I i a JPY 94.141 1 3 2
JPY 41.804 0 5 9
JPY 59.781 0 8 4
JPY 66.624 0 9 4
JPY 44009 0 6 2
55076 0.78
CANADA
CGI GROUP INCJSUB.VOT - A -
OPEN TEXT CORP
SHAW C0MMUNIC.-B/NON-VOT
THOMSON CORP.
CAD 9,344 0.13
CAD 23059 0 3 2
CAD 21.1a1 0 3 0
CAD 40,657 0 5 8
94,241 1 3 3
-
FINLAND
NOKIA OY
FRANCE
EUR 169768 2.39
71a.ia4 10.11
NETHERLANDS
ASML HOLDING NV
WOLTERS KLUWER NV
EUR 65,508 0.92
EUR 57,211 o a i BOUYGUES
BUSINESS OBJECTS SA
FRANCE TELECOM SA
PUBLICIS GROUPE SA
VIVENDI UNIVERSAL SA
EUR 58.728 0 8 3
EUR 18,341 0 2 6
EUR 29033 0 4 1
EUR 51.312 0.72
EUR 113.460 1.59
122.719 1.73
NORWAY
TELENOR AS
SINGAPORE
NOK 31,339 0 4 4
31.339 0 4 4
- . .-
GERMANY
DEUTSCHE TELEKOM /NAM
PROSIEBEN SAT
IMED.NORZ.-OPA' SAP AG
WINCOR NIXDORF AG
EUR 31 922 0.45
EUR 20.115 0.28
EUR 26.093 0.37
EUR 21.540 0.30
SINGAPORE PRESS HOLDINGS
LTD SINGAPORE TELECBOARD LOT
1000 STATS CHIPPAC LTD
SGD 36173 0 5 1
SGD 52589 0 7 4
SGD 15361 0.22
99670 1.40 104123 1.47
HSBC Global Investment Funds

.~ _._ -
Portfolio of Investments and Other Net Assets
Description ~
Quantity Currency Evaluation VQ net assets
.~ .. .
Descriplion Quantity Currency Evaluation % net assets
SPAIN
GRUPO PRISA
TELEFONICA SA
SWEDEN
ENlRO AB
ERICSSON TEL. -6-
TELIASONERA AB
UNITED STATES
ACCENTURE LTD I-A-
AFFILIATED COMPUTER SERV
AMPHENOL CORPORATION -A-
APPLE COMPUTER INC
APPLIED MATERIALS INC
ARROW ELECTRONICS INC
A T & T
AUTODESK INC
BEA SYSTEMS INC
BELLSOUTH CORP
CADENCE DESIGN SYSTEMS
CDW CORP
CERlDlAN
CHECKFREE CORP
CISCO SYSTEMS INC
COMCAST CORP :-A-SPEClAL
COMCAST C0RP:-A-
COMPUTER SCIENCES CORP
CONVERGYS CORP
CORNING INC
DELL INC
DIRECTV GROUP INC
EBAY INC
EMBARQCORP
FIDELITY NATIONAL INFORM
SERV FIRST DAT.4 CORP
FISERV INC
FREESCALE SEMICONDUCTOR -B- GANNETT CO INC
GOOGLE INC A
HEWLETT-PACKARD CO
IBM CORP
INTEL CORP
LAM RESEARCH CORP
LEXMARK INTL INC
MCGRAW HILL COMPANIES INC
MICROSOFT CORP
MOTOROLA INC
NEWS CORP -A-
NVlDlA CORP
OMNICOM SROUP INC
ORACLE CORP
2 300
5.463
900
12.800
9 500
2 400
930
910
a30
5.100
1,300
6.991
1,400
4 000
1,950
2.500
740
1,700
Y70
11 950
700
900
1,090
1.850
900
2 110
3.600
940
1.200
1100
600
1 300
1 700
440
278
5,900
2.880
7,400
1100
930
1,400
14 770
4.300
1,300
2 100
740
7 aoo
EUR 37.527 0 5 3
EUR 94.819 1.33
SEK 11 162 0.16
SEK 44,904 0.63
SEK 61,185 0.86
117.251 1.65
US0
US0
USD
US0
US0
USD
USD
US0
US0
US0
US0
USD
US0
US0
USD
US0
US0
USD
USD
USD
USD
USD
USD
US0
USD
USD
USD
USD
US0
US0
US0
US0
US0
US0
US0
US0
US0
USD
USD
US0
USD
USD
75.840
48 751
57 093
63 968
90,474
35.126
226,299
48.342
62.040
82.758
42 550
46 620
38.743
280,586
39 479
25.550
32,949
53 519
38 591
22.257
48.488
70,344
26.705
58,164
41,151
25,068
61 997
64 532
24.873
112 195
212,223
236 131
153.846
50 479
53 847
80.108
404.697
106.89a
25 220
62,097
69,486
140,322
1.07
0 69
11 80
0 90
1.27
n 49
0.68
3.18
0.87
1.16
0 60
0 66
0.55
11 56
3 95
0.36
0 46
0.75
0 54
0.31
0 68
0.99
o 3a
0.82
0.58
0.35
0.87
0.91
0.35
I .5a
2.99
3.32
2.17
0 71
0.76
1.13
5 70
1 50
0 35
0 87
0.98
1.97
Q LOGIC CORP
OUALCOMM INC.
OWEST COMMUNICATIONS INTL SANDISK CORP
SPRINT NEXTEL C0RP:FON
SER.1 TELEPHONE 8 DATA SYSTEMS
TEXAS INSTRUMENTS INC
TIME WARNER INC
VERIZON COMMUNICATIONS
INC VIACOM INC
WALT DISNEY :DISNEY SER.
YAHOO INC
TOTAL SHARES
INVESTMENT COMPANIES
CANADA .. _- YELLOW PAGES INCOME FUND
TOTAL INVESTMENT COMPANIES
INDEX TRACKER
UNITED STATES
ISHARESIS&P GL.1NF.TECH.S IND
2 400
1,650
6.400
1210
2.387
1,000
4,000
8.920
3 aoo
490
2.170
1 030
3,100
1.500
USD
USD
USD
USD
USD
USD
u50
u50
u50
USD
u50
u50
45,192
61,083
55 a72
6A,191
39 a39
42 450
135,560
162,344
140.372
18.130
67 118
26.090
0.64
o a6
0 79
0 90
0 56
0 60
1 9 1
2.28
1.98
0.26
0 94
0.37
4.398.647 61.90
6.961.2AP 97.97
CAD 39.261 0.55
39.261 0.55
39,261 0.55
USD 82365 1 1 6
82.365 1.16
TOTAL INDEX TRACKER 82,365 1.16
TOTAL TRANSFERABLE SECURITIES ADMITTED TO
AN OFFICIAL STOCK EXCHANGE LISTING
TOTALINVESTMENTS
7,082,870 99.68
7,082,870 99.68
OTHER NET ASSETS LESS LIABILITIES 22,549-- . . 2 2
TOTALNETASSETS 7,105,419 100.00
HSBC Global Investment Funds

_ - __
Portfolio of Investments and Other Net Assets 1 _ _
I
GLOBAL EQUITY TECHNOLOGY
Economic Division of Investment - - ...
. _. (expressed as a percentage of net assets)
News transmission Electronics and electrical equipment Internet Software Office equipment and computers Graphic art and publishing Other services Miscellaneous Investment companies Holding companies Retail trade, department stores Construction, building materials States, provinces and municipalities Photography and optics
Other net assets less liabilities
29.62 17.79 17.06 13.50 10.76 2.54 2.32 1.71 1.50 1.04 0.83 0.78 0.23
0.32
Total Net Assets 100.00
I
HSBC Global Investment Funds

-. _- -. . . .-.
Portfolio of Investments and Other Net Assets -~ .. . ... . .
GLOBAL EX EUROLAND EQUITY Statement of investments as at 30 September 2006 (expressed in EUR)
Quantity Currency Evaluation % net assets
Description
NORWAY
ACERGY SA
DNB NOR ASA
NORSK HYDRO AS
ORKLAAS A
NOK 165537 0 3 0
NOK 272805 0 5 0
NOK 114773 0.21
NOK 122,671 0 2 2
12 455
28 136
6.407
3 258
9 000
133613
6 323
7 261
10,641
10.617
3.743
4,157
1 440
8,146
3.324
2 662
1,207
7 634
971
8 366
9 600
20,506
15 501
25 941
22 921
28,342
17 416
19,500
44.635
27,934
10,591
13 079
14 634
49 037
7 147
5 301
15,968
16.135
13.702
33 869
53,191
13,176
1 098
Description Quantity Currency Evaluation 'lo net assets
675.786 1 2 3 INVESTMENTS SWEDEN
.-
ELEKTA AB
ERICSSON TEL. -B-
HENNES 8 MAURITZ AB
NORDEA BANK AB
SKANSKA B
SKFAB B
TRANSFERABLE SECURITIES AOMITTEO TO AN OFFICIAL STOCK EXCHANGE LISTING
SHARES
SEK 131.959 0 2 4
SEK 369,440 0 67
SEK 210344 0.38
SEK 75915 0 1 4
SEK 143,951 0 2 6
SEK 125,279 0 2 3 CANADA
CANADIAN NATIONAL RAILWAY
DENMARK
11,952
10
2,044
60,000
6.881
44 492
15,242
10 SI4
14,734
31.349
15.298
19.744
36,599
51,229
31.660
9 492
23.923
56.199
32,890
4 960
14 704
9.212
18.710
13.778
8.925
6 123
7 197
208 894
16 515
CAD 397 826 0.72 1.056,888 1.92 _-- ~ ..
397.826 0.72 SWITZERLAND
ALCON INC 'NOM
CREDIT SUISSE GROUP INOM
NESTLE,'NOM
NOVARTIS AG EASEL INAM
PHONAK HOLDING AG INOM.
ROCHE HOLDING AG
'GENUSSSCHEIN SYNGENTA AG INAM
UBS AG INAMENSAKTIEN
ZURICH FINANCIAL SERVICES
!NAM
US0 344,666 0 6 3
CHF 190,181 0 3 5
CHF 398,181 0 7 2
CHF 377041 0 6 8
CHF 165486 0 3 0
CHF 363593 0 6 6
CHF 145070 0 2 6
CHF 355991 0 6 5
CHF 189968 0 3 4
A.P. MOELLER - MAERSK A!S B
DANISCO A'S
DKK 67563 0.12
DKK 130.015 0.24
197.578 0.36
GIBRALTAR
PARTYGAMING PLC GBP 93591 0.17
93.591 0.17
GREAT BRITAIN
ASTRAZENECAPLC
BAE SYSTEMS PLC
BG GROUP PLC
BHP BILLITON PLC
BP PLC
BRAMBLES INDUSTRIES PLC
BRITISH AMERICAN TOBACCO
BRITISH SKY BROADCASTING
GROUP ET GROUP PLC
CABLE &WIRELESS PLC iGBP
0.25 COMPASS GROUP PLC
GALLAHER GROUP PLC
GLAXOSMITHKLINE PLC
HSBC HOLSINGS PLC
INTERNATIONAL POWER PLC
LAND SECURITIES GROUP PLC
PRUDENTIAL PLC
RIO TINTO PLC /REG
ROYAL BK OF SCOTLAND PLC
ROYAL DUTCH SHELL -6-
SCHRODERS PLC
SCOTTISH POWER PLC
SEVERN TRENT PLC
VODAFONE GROUP PLC
WPP GROUP PLC :ISS.O5
GBP
GBP
GBP
GBP
GBP
GBP
GBP
GBP
GEP
GBP
GBP
GBP
GBP
GBP
GBP
GBP
GBP
GBP
GBP
GBP
GBP
GEP
GBP
GBP
GBP
339.508
261.570
148 670
146.090
648.084
223.806
328.773
160,031
144.274
104,090
125.388
122.229
500,411
nln,551
151 970
145.153
140.869
348.562
508.566
370 498
122,695
58,977
143.423
380 u23
161.995
0 62
0 47
0 27
0 27
1 1 8
0 41
0 60
0 29
0 26
0 19
0 23
0 22
0 91
1 46
0 28
0 26
0 26
0 63
0 92
0 67
0 22
11 11
0 26
0 69
0 29
2,530,177 4 59 -.
USD
USD
USD
USD
USD
USD
US0
USD
US0
USD
USD
USD
USD
USD
USD
USD
USD
USD
USD
USD
USD
USD
USD
USD
UNITED STATES
ACCENTURE LTD '-A-
AKAMAI TECHNOLOGIES INC
ALTRIA GROUP
AMGEN INC
ARCHER-DANIELS MIDLAND
co A T & T
BANK OF AMERICA CORP
BEST BUY GO INC
BOSTON SCIENTIFIC CORP
CISCO SYSTEMS INC
ClTlGROUP INC
ClTRlX SYSTEMS INC
COACH INC
COUNTRYWIDE FINANCIAL
CORP CVS CORPORATION
DEAN FOODS CO
DEERE 8 CO.
DOW CHEMICAL CO
EhlC CORP
EXELON CORP
EXXON MOBlL CORP
GENERAL ELECTRIC CO
GOLDMAN SACHS GROUP INC
GOOGLE INC A
208 367
378,855
1244,017
874,165
770 000
584 790
1,195,558
745 233
227 007
826 033
1,099 306
304,770
351.316
402 428
1 247 617
237,661
354 222
493 356
150 954
6K2 016
1 800 830
1,487,461
1,765,454
349 266
0.38
0.69
2 26
1 59
1.40
1.06
2 17
1.35
0.41
1.50
1 99
0 55
0.64
0.73
2.26
0.43
0 64
0.90
0 27
1.20
3.27
2.70
3.20
0.63 6,596,206 11 97
HSBC Global Investment Funds

__ . -
Portfolio of Investments and Other Net Assets _ _
Description
HEWLETT-PACKARD CO
HOME DEPOT INC
IBM CORP
ITT CORP
MCDONALD'S CORP.
METLIFE INC
MICROSOFT CORP
MOTOROLA INC.
PEPSICO INC
PFIZER INC
PHELPS DODGE CORP
PROCTER & GAMBLE CO
PRUDENTIAL FINANCIAL INC
RED HAT INC
REPUBLIC SERVICES INC.
REVLON INC /-A-
ROCKWELL AUTOMATION
SPRINT NEXTEL CORPiFON
SER.l TEXAS INSTRUMENTS INC
TREEHOUSE FOODS /WHEN
ISSUED UNITED HEALTH GROUP INC
UNITED TECHNOLOGIES CORP
VALERO ENER. CORP/VVH.ISSUED VERIZON COMMUNICATIONS
INC WASHINGTON MUTUAL INC
XTO ENERGY INC
3M CO
TOTAL SHARES
INDEX TRACKER
HONG KONG
ISHARESjMSCI HONG KONG INDEX
UNITED STATES
ISHARES INC!MSCI AUSTRALIA
IND ISHARES IMSCI JAPAN INDEX
FD
... .
Ouarirlry Currency Evaluation Yo net assets
. . .
21.980
10,866
10 612
14 614
13.093
27,796
39.7fil
9 821
21,826
81.895
5 040
15.559
18 109
15.839
8.775
137.101
5,367
11,933
47 358
1
7.790
9.306
17.687
18,905
9 024
35,836
4.062
63.200
73.500
300 000
USD
US0
USD
US0
USD
US0
US0
US0
us0 US0
USD
USD
USD
USD
USD
USD
USD
USD
USD
USD
USD
USD
USD
USD
USD
USD
USD
623 149
314 311
685 776
591,010
408.553
1.242 194
858,681
192 434
1,123 340
1,826,703
336.662
763 510
1 097.887
257 044
278 518
124,269
243.064
156,975
1264.995
19
303,680
466 932
714,068
550.424
309.465
1,180.646
238.838
1 1 3
0 57
1 24
1 07
0 74
2 25
1.56
0 35
2 04
3 31
0 61
1 39
1 99
0 47
0 51
0 23
0 44
0 28
2 30
0 00
0 55
0 85
1 30
1 00
0 56
2 14
0 43
33 914.629 61 53
45,462,681 82.49
USD 715,312 1.30
715,312 1.30 .- .. . .-
USD 1.223.503 2 22
USD 3,206.306 5.81
4.429.809 8.03
TOTAL INDEX TRACKER 5,145,121 9.33
TOTAL TRANSFERABLE SECURITIES ADMITTED TO AN OFFICIAL STOCK EXCHANGE LISTING 50,607,802 91.82
TOTAL INVESTMENTS 50,607,802 91.82
OTHER NET ASSETS LESS LIABILITIES 4,509,163 8-18
TOTALNETASSETS 55,116,965 100.00
HSBC Global Investment Funds -.

~ . _. -
Portfolio of Investments and Other Net Assets
GLOBAL EX EUROLAND EQUITY
Economic Division of Investment
(expressed as a percentage of net assets)
..
Banks and financial institutions Pharmaceuticals and cosmetics Investment companies Energy Holding companies Food News transmission Retail trade, department stores Office equipment and computers Internet Software Tobacco and spirits Insurance Electronics and electrical equipment Mechanics. machinery Public services Consumer goods Chemicals Aerospace technology Non-ferrous metals Gastronomy States. provinces and municipalities Other services Textile Healthcare. education and social services Transport Environmental services & recycling Precious metals Real estate companies Construction, building materials Agriculture and fishing Leisure
Other net assets less liabilities
%
9.99 9.58 9.33 9.13 8.02 4.81 4.79 4.56 4.14 3.90 3.08 2.85 2.74 1.94 1.85 1.39 1.37 1.32 1.24 0.97 0.72 0.67 0.64 0.55 0.53 0.51 0.27 0.26 0.26 0.24 0.17
8.18
Total Net Assets
HSBC Global Investment Funds
100.00

.- . -. -
Portfolio of Investments and Other Net Assets
HONG KONG EQUITY Statement of investments as at 30 September 2006 (expressed in USD)
.
Description Quantity Currency Evaluation net assets
Description Quantity Currency Evaluation YO net assets
INVESTMENTS
TRANSFERABLE SECURITIES ADMITTED TO AN OFFICIAL STOCK EXCHANGE LISTING
SHARES
BERMUDA ISLANDS
GOME ELECT APPLIANCES
HOLDINGS PEACE MARK (HOLDINGS)
LIMITED SIM TECHNOLOGY GROUP LTD
2 390,000 HKD 1938,837 0 9 9
3,750.000 HKD 2,474 120 1.26
6.276 000 HKD 2.465.078 1 26
6.878.035 3.51
CAYMAN ISLANDS - . . .. ..
FAR EAST CONSORTIUM INTL
LTD LIFESTYLE INTL HLD LTD
NEW WORLD CHINA LAND LTD
OIN JIA YUAN MEDIA SERVICES
co VISION GRANDE GROUP
HOLDINGS WIN HANVERKY HOLDINGS LTO
XlNYl GLASS HOLDING CO LTD
3413.000 HKD 1410.647 0 7 2
586.500 HKD 1159.351 0 59
3482400 HKD 1425.922 0 7 3
6956.000 HKD 2053.590 1 0 5
1954.000 HKD 1655.369 0 8 4
2,454.000 HKO 1.089.876 0 56
4.964000 HKD 1650,281 0 8 4
CHINA UNICOM LTD
CNOOC LTD
ESPRIT HOLDINGS
HANG LUNG PROPERTIES LTD
HENDERSON LAND DEV.
HONGKONGEXCHANGES&
CLEARING HONGKONG 8 CHINA GAS
HONGKONG LAND HLDS LTD
HSBC HOLDINGS PLC
HUTCHISON WHAMP
HYSAN DEVELOPMENT CO
KINGBOARD CHEMICALS
HOLDINGS LI 8 FUNG LTD
MASS TRANSIT RAILWAY CORP
NEW WORLD DEVELOPMENT
CO. LTD PCCW LTD
SUN HUNG KAI PROPERTIES
LTD SWIRE PACIFIC LTD - A -
WHARF HLD
WING LUNG BANK LTD
3366,000
12.870 000
766 500
2,459 000
326,000
415.000
1,589 000
919,000
975,472
1 126261
1,561,000
1,028,000
1,254 200
1,575 000
2,881 000
3.164 000
843 700
387 500
488.000
462,100
HKD 3,318193
HKD 10.704 833
HKD 6,990,409
HKD 5,252 163
HKD 1.832 812
HKD 3,028.342
HKD 3.724 354
USD 3.565720
HKD 17.792 428
HKD 9.946123
HKD 4.003361
HKD 3,701.283
HKD 3,116,725
HKD 3,954 356
HKD 4962 747
HKD 1,933169
HKD 9210616
HKD 4048764
HKD 1,672.466
HKD 4 552403
140,928.523
1.69
5.46
3.57
2.68
0.94
1.55
1.90
1.82
9.08
5.08
2.04
1.89
1.59
2.02
2.53
0.99
4.70
2.07
0.85
2.32
71.91
TOTAL SHARES 183.884.341 93.83
TOTAL TRANSFERABLE SECURITIES ADMlTrED TO AN OFFICIAL STOCK EXCHANGE LISTING . 183,884,341 93.83
TOTAL INVESTMENTS
OTHER NET ASSETS LESS LIABILITIES 12,092.083 6.17
10,445 036 5 33
CHINA TOTAL NET ASSETS 195,976,424 100.00
AIR CHINA LTD
ANGANG NEW STEEL CO LTD -
H- CHINA BLUECHEMICAL LTD -H-
CHINA CONSTRUCTION BANK
CORP CHINA LIFE INSURANCE CO
LTD-H- CHINA MERCHANTS BANK '-H-
CHINA PETROLEUM & CHEM
CORP -H- DALIAN PORT PDA CO LTD -H-
NINE DRAGONS PAPER HLDGS
LTD PETROCHINA CO LTD I-H-
SHENZHEN EXPRESSWAY H
ZlJlN MINING GROUP -H-
HONG KONG
BANK OF EAST ASIA LTD
CATHAY PACIFIC AIRWAYS
CHEUNG KONG HOLDINGS
CHINA MOBILE LTD
CHINA RESOURCES
ENTERPRISE LTD
3,592.000 HKD 1,549 180 0 79
1,998,000 HKD 1,587,495 0.81
72000 HKD 20.887 0 0 1
6.208,OOO HKD 2,685,394 1.37
725000 HKD 1.418239 0 7 2
771.000 HKD 1,086,633 0.55
5.720000 HKD 3.553593 1.82
4.996000 HKD 2,212421 1.13
2,807.000 HKD 3 174,276 1.62
3,204000 HKD 3.446378 1.76
4.548.000 HKD 2.533 591 1.29
4,748,000 HKD 2,364,660 1 21
25 632.747 13 08
. . .
444000 HKD 2,026,044 1 0 3
1057.000 HKD 2 165.380 1 1 0
830.000 HKD 8,311.901 4 55
2694.000 HKD 19036,242 9 7 1
682000 HKD 1,477.689 0 7 5
HSBC Global Investment Funds . -

.- ....
Portfolio of Investments and Other Net Assets . . . . . - ... . . .
HONG KONG EQUITY
Economic Division of Investment
(expressed as a percentage of net assets)
Real estate companies Banks and financial institutions News transmission Energy Holding companies Transport Textile Electronics and electrical equipment Coal mines, heavy industries Public services Graphic art and publishing Forest products and paper industry Other business houses Clock and watch-making industry Office equipment and computers Miscellaneous Insurance Retail trade, department stores Chemicals
Other net assets less liabilities
Total Net Assets
-
. . . . . . . . . . . . . _. .-
HSBC Global Investment Funds
%
20.71 15.90 13.65 9.04 8.00 6.33 4.13 2.73 2.02 I .90 1.89 1.62 1.59 1.26 0.99 0.75 0.72 0.59 0.01
6.17
100.00

INDIAN EQUITY Statement of investments as at 30 September 2006 (expressed in USD)
Descriptian Quantity/Face Currency Evaluation net Value assets
Description QuantityIFace Currency Evaluation Yo net Value assets
.- . ... .
INVESTMENTS
TRANSFERABLE SECURITIES ADMITTED TO AN OFFICIAL STOCK
EXCHANGE LISTING
SHARES
CANADA
NlKO RESOURCES LTD
GREAT BRITAIN
CAIRN EYERGY PLC
VEDANTA RESOURCES PLC
INDIA
ABB LTDIDEMAT
ABG SHIPYARD LTD IDEMAT
ADITYA BIRLA NUVO
LTD/DEMATER ALLAHABAD BANK IDEMAT
ALOK IND LTDIDEMAT
AMBIKA COTTON MILLS LTD
/DEMAT AMTEK AUTO LTD 'DEMAT
ANDHRA BANK I DEMAT
APOLLO TYRES LTD I DEMAT
ASHAPURA MINECHEM LTD
/DEMAT ASSOCCEMENTIDEMAT
AUROBINDO PHARMA'DEMAT
BAJAJ AUTO LTD IDEMAT
BAJAJ HINDUSTHAN LTD
BALLARPUR INDUSTRIES
LTDIDEMAT BALRAMPUR CHIN1 MILLS
/DEMAT BANK OF BARODA IDEMAT
BANK OF INDIAIDEMAT
BF UTILITIES LTD 'DEMAT
BHARAT ELECTRONICS LTD
lDEMAT BHARAT FORGE LTD 'DEMAT
BHARAT HEAVY EL IDEMAT
BHARAT PETROL IDEMAT
BHARTI TELE-VENTURES LTD'DEMAT BIOCON LTD 'DEMAT
BOMBAY DYEING 8 MANUFACT/DEMAT CADILA HEALTHCARE LTD
iDEMAT CANARABANK'DEMAT
409.200
1.674 216
2.000 000
168.308
122 762
1,090.512
3,821.596
4.605.632
257.575
3.000,OOO
6 281.307
761 168
2 129,000
5.422 158
91.347
339,315
I a~5.428
500 000
5,319.115
1,500.000
8 103,462
62.500
54 964
3,7ao,ooo
4.460 978
1.350.000
12 662.249
914.173
1.500.709
2 366.422
10.286 479
CAD 24,715,796 0.46
24,715.796 0 46
GBP 59.519,113
GBP 44.802.513
104.321 626
INR 10,734,175
INR 732.473
INR 20.414.908
INR 7462,009
INR 6717.112
INR 1,166,794
INR 21,569911
INR 13,139 a96
INR 5,384,959
INR 9433,336
INR 117 203 329
INR 1.256894
INR 22,069,992
INR 13,301,711
INR I 31ao52
INR 11 769697
INR 9,534,384
INR 2a 752.574
INR I 385,496
INR 2,433,322
INR 29,498,470
INR 70,895,655
INR 35.788.626
INR 130 360.077
INR 7,561.893
INR 2 4 . ~ 3 0 516
INR 16,617.860
INR 64,062,389
1 1 1
0 83
1 94
0 20
0 01
0 38
0 14
0 12
0.02
0 40
0 24
0 10
0 18
2 18
0 02
0 41
0 25
0 02
0 22
0 18
0 53
0 05
0 03
0 55
1 32
0 67
2 42
0 14
0 46
0 31
1 1 9
CASTROL INDIA IDEMAT
CENTURION BANK LIMITED
/DEMAT CENTURY TEXTILES 8. IND!
DEMAT. CESC LTD /DEMAT.
CHENNAI PETROLEUM CORP
IDEMAT. CUMMINS INDIA LTD /DEMAT.
DHAMPUR SUGAR MILLS LTD
DEMAT. DR REDDY S LABORATORIES
IDEMAT. DR REDDY S LABORATORIES/ADR ERA CONSTRUCTION LTD
/DEMAT. EVEREADY INDUSTRIES
(1)IDEMAT. FEDERAL BANK LIMITED
FINANCIAL TECHNO.INDIA
IDEMAT. GAMMON INDIA LTD IDEMAT.
GATEWAY DISTRIPARKS LTD
GRASIM INDUST./DEMAT.
GUJARAT AMBUJA CEMENT
/DEMAT. GUJARAT NRE COKE LTD I DEMAT GUJARAT STATE PETRONET
IDEMAT GVK POWER & INFRASTR.LTD/DEMAT HAVELL S INDIA LTD IDEMAT.
HCL INFOSYSTEMS LTD
/DEMAT. HCL TECHNOLOGIES /DEMAT
HEROHONDAMOTORS
IDEMAT. HEXAWARE TECHIDEMAT.
HI N DALCO IN D/DE MATIPARTLY
PAID HINDALCO IND.IGDR 144A REG
HINDALCO IND/SGDR 144A
HINDALCO INDUSTRIES I
DEMAT. HINDUJA TMT LTD IDEMAT.
HINDUSTAN CONSTR. LTD
IDEMAT HINDUSTAN LEVER
HINDUSTAN LEVER LTD
IDEMAT. HINDUSTAN PETRIDEMAT.
HOTEL LEELA VENTURE LTD
HUTCHISON TELECOM.INTL
ISADR HUTCHISON
TELECOMM.INTERNAT. IBP CO LTD /DEMAT
IClCl BK LTD /DEMAT.
IClCl BK/SADR
I-FLEX SOLUTIONS LTD
/DEMAT.
1091,526
20,691,457
693,000
5,807,217
3 a69 716
5,347,578
1,246,500
6,347.964
3.506.000
1 . I 67,623
6,940,000
1,000 000
128,591
5,301,856
2 350 000
2.908 313
1 389.424
11 .ooo.ooo
19,367,984
227 844
343 016
13 092 078
12.753 500
471.801
2,986.a50
4,300,727
5,388 ooo 1 108 750
11 129,564
593,190
4,420,000
805
5,704,519
4,886,433
8.013 060
6 918,000
6,000,000
1.913 472
8,597,000
1 147,000
543.000
IGATE GLOBAL SOLUTIONS LTD 68,326
/ DEMAT. IND.DEV.BK INDIAIDEMAT. 22 579,459
INDIA CEMENTS LTDIDEMAT. 2,559.667
INR 5,274,795
INR 10,809,879
INR 7,671,591
INR 38,871,536
INR 17.563 201
INR 26,494,023
INR 3287,261
INR 101 163,394
US0 55.464.920
INR 8,077,465
INR 14,789 745
INR 4.636584
INR 4,780,980
INR 40,936,211
INR 8414,965
INR 159 663.174
INR 3,547,736
INR 8,296,873
INR 16.316,ooa
INR aa5,308
INR 2281 099
INR 41,380309
INR 152,967 623
INR 8,015,863
INR 10.539.377
INR 8,472449
USD 19,613 398
USD 2,183.007
INR 41 561,135
INR 7024.433
INR 9.924532
INR 4.524
INR 32.056 327
INR 29.995 740
INR 11.791 352
US0 177,861,781
HKD 10,612.722
INR 21.867 541
INR 131,764,319
USD 35.144 380
INR 17,014.825
INR 270.692
INR 41 041,057
INR 12 428.085
0.10
0 20
0 14
0.72
0.33
0.49
0.06
I .aa
1.03
0 15
o 2a
0 09
0.09
0.76
0.16
2.97
0.07
0.15
0.30
0.02
0.04
0.77
2.84
0 15
0.20
0.16
0.36
0.04
0.77
0.13
n 18
0 00
0.60
0.56
0.22
3.31
0 20
0.41
2 45
0.65
0.32
0.01
0.76
0.23
I
HSBC Global Investment Funds

Portfolio of Investments and Other Net Assets - .-
- - Descriplion Qiiantity/Face Currency Evaluation "YO net
Value assets
INDIAN OIL CORPiDEMAT 4.044 450
INDIAN 6.693.206 PETROCHEM IDEMATERIALISE
D INFOSYS TECH LTD IDEMAT. 5,588,137
INFOSYS TECHNOL.' SADR 1 ioa.600
INFRASTRUCTURE DVPT 25.954 420
FINIDEMAT. ITC iGDR 4.900,000
ITC LTD IDEMAT 23.751.500
IVRCL INFRASTRUCTURES AND
PROJ JAlN IRRIGPTION SYSTEMSIDEMAT JAIPRAKASH ASSOCIATES LTD
JET AIRWAYS INDIA LTD
!DEMAT JINDAL IRONBSTEEL CO
LTD/DEMAT JINDAL SOUTH WEST HLDGS
!DEMAT JINDAL STEEL 8 POWER lDEMAT J K CEMENT LTD
KEC INTERNATIONAL LTD IDEMAT KEC INTERNATIONAL
LTD/DEMAT KESORAM IND LTWDEMAT
KOTAK MAHINDRA BANK
LTDIDEMAT KOTAK MAHINDRA BK
LTDiSGDR REG KULKARNI
DEVEL ~DEMATERIALISED LARSEN & TOUBRO 'GDR
LARSEN 8 TOUBRO LTD I
DEMAT LUPIN LIMITED /DEMAT
MADHUCON PROJECTSIDEMAT
MAHINDRA & MAHINDRA (GDR
REG S MAHINDRA AND MAHINDRA FIN
SECS / DEM4T MAHINDRA GESCO 'DEMAT
MAHINDRABMAHINDRNDEMAT
MARUTI UDVOG LTD IDEMAT
MASTEK !DEMAT
MATRIX
LABORATORIESIDEMAT MCDOWELL AND CO LTD
IDEMAT MICRO INKS LTD !DEMAT
MONNET
ISPATBENERGYIDEMATERIA, MOSER BAER (INDIA) DEMAT
MPHASIS BFL DEMAT
NAGARJUNA CONSTRUCTION
/DEMAT NATL THERMAL POWER CORP
lDEMAT NESTLE INDIA/DEMAT
NICHOLAS PIRAMAL
INDIAIDEMAT NllT TECHNOLOGIES
LTDiDEMAT NOlDA TOLL
BRlDGElDEMATERlAL
5,049,120
2 304.578
957 500
2,453.926
8,50U,U00
867.025
2,420.526
667.750
932.831
1,089 830
1,008.137
2,371 569
150,000
19,108
642 000
800,000
2,018.210
1,102.400
2 062,000
2 095.324
2,158 733
I i 333.ao2
9 140.000
1428.186
771.481
2,248.989
720,665
881 9ao
1.346.142
2.037.831
12 200.000
3 796 297
1,249,961
040 000
1 468.973
16 680,138
HSBC Global Investment Funds
INR 45,868.625
INR 45 129.a65
INR 225.275 952
USD 53,168,456
INR 38.333 609
USD 19,946,998
INR 96,734,938
INR 28.004.a75
INR 13,640 150
INR ga53,462
INR 34459346
INR 53,473 092
INR 3 151 858
INR 89.889.157
INR 2848,974
INR 535.060
INR 6 179951
INR 11,060 344
INR 17.585.823
US0 1107359
INR 108062
USD 17,789.157
INR 22 185075
INR 20369255
INR 6 156.441
US0 30481,154
INR 10 7H7.005
INR 38.105.245
INR 167,605,294
INR 193,687,094
INR 10 884.172
INR 4,465.418
INR 30 401.671
INR 5.098417
INR 3,019033
INR 6002.682
INR 8310,753
INR 42 225.566
INR 10,751.177
INR 2a.572 330
INR 4.333 573
INR 6027.590
INR 14,305.874
0.85
o a4
4.20
0.99
0.71
0.37
1 .80
0.52
0.25
0 18
0 64
0.99
0.06
1.67
0 05
0 01
0.1 1
0.21
0.33
0.02
0 00
0.33
0.41
0.38
0.1 1
0.57
0 20
0.71
3.12
3.60
0.20
0.08
0 57
0.09
0.06
0.11
0 15
0 79
0.20
0.53
0.08
0 11
0 27
~ .. . ..
Descrlptlon QuanlitylFace Currency Evaluatlon
~
OIL8NATURAL GASIDEMAT
ORCHID CHEMICALS PHARMA
rDEMAT ORIENT BK
COMMERCE'DEMAT PANACEA BIOTEC LTD
PATEL ENGINEERING LTD
'DEMAT PATNI COMPUTER SYSTEMS
/ADR PATNl COMPUTERS SYSTEMS LTD :DEMAT RADICO KHAITAN LTD (DEMAT
RANEAXY LAEORAT 'GDR (EQ SHS) RECEIPTS R RAYMOND LTD IDEMAT
RELIANCE CAPITAL LTD
'DEMAT RELIANCE
COMM VENT(RCVL)/DEMAT RELIANCE
ENERGY8DEMATERIALISED RELIANCE INP IGDR144A
RELIANCE INDUS IDEMAT
RELIANCE INDUSTRIES LTD
RELIANCE NATURAL
RESOURCES' DEMAT RUCHI SOYA INDOEMAT
S KUMARS NATIONWIDE LTD
DEMAT SASKEN COMMC TECHN LTD
DEMAT SATYAM COMPUTER SERVICES
SATYAM COMPUTER SERVICES
IDEMAT SESA GOA LTD IDEMAT
SHREEPRECOATEDSTEELS
LTD DEMAT SIEMENS LTD 'DEMATERIALISED STATE BK OF INDIA 'GDR
(REGS) STEEL AUTHORITY OF INDIAIDEMAT STERLITE INDUSTRIES LTD
iDEMAT SUN PHARMACEUTICAL
IND LTD IDEMAT SYNDICATE BANK LTD lDEMAT
TASC PHARMACEUTICALS
LTWDEMAT TATA CHEMICALS LTD/DS
IDEMAT TATA CONSULTANCY SERVIDEMAT TATA IRON B STEEL'DEMAT
TATA MOTORS LTD IADR
TATA MOTORS LTDiDEMAT
TATA POWER CO IDEMAT
TATA TEA LTD I DEMAT
TORRENT PHARMACEUTICALS
LTD TRlVENl
ENGINEER INDUSTR/DEMAT ULTRA TECH CEMENT LTD IDEM AT UNION BANK OF INDIADEMAT
UNITECH LTD (DEMAT
Value
7.870 000
3.000 000
1,204 600
2.395 196
102 523
532.516
8.1 84,801
1,248,055
675.000
31 1,272
4.478.674
ia.895 494
2,797 a37
690.470
4.492 066
50
5,075.494
I ia3.200
7,623 496
612,519
1,200
194.500
107,100
333,739
162,109
205 000
58,621.764
6,300.000
468 000
11,354 425
1,157 918
958 589
619 200
12.600.000
400,000
7.100 000
666,145
600.000
45
9,663.217
1 845,350
4.112 808
390.594
INR 201,910 a70
INR 13,684,453
INR 7.15a533
INR 20,0a6.406
INR 724751
US0 10 059.227
INR 68.59A.198
INR 4,075,149
USD 6,446.250
INR 3.055533
INR 55,643 431
INR 143,138 355
INR 29 541.153
USD 35,345.632
INR 114.919815
INR 1,279
INR 2496.Y24
INR 7.726769
INR 12,653,555
INR 5,339,992
INR 21 486
INR 3482.575
INR 2.261 878
INR 1,289,507
INR 3,79a.917
US0 11.398.000
INR 98,959.ag2
INR 60.162 616
INR 9,489585
INR 22.430 053
INR 2620.118
INR 5,041,362
INR 13 7aa.757
INR 145 366,704
US0 7,436.000
INR 133.100,871
INR H,149,362
INR 9.852.414
INR 179
INR 14.482.522
INR 36.058 222
INR 12,314522
INR 2.830.041
96 net assets
3.76
0.25
0.13
0.37
0.01
0.19
-
1.28
0.08
0.12
0 06
1.03
2.66
0.55
0 66
2 14
0 00
0 05
0.14
0.24
0.10
0 00
0 06
0.04
0.02
0.07
0 21
1 84
1.12
0.18
0 42
0 05
0.09
0.26
2.70
0 14
2.48
0.15
o. ia 0.00
0 27
0.67
0.23
0.05
- .. ... . A
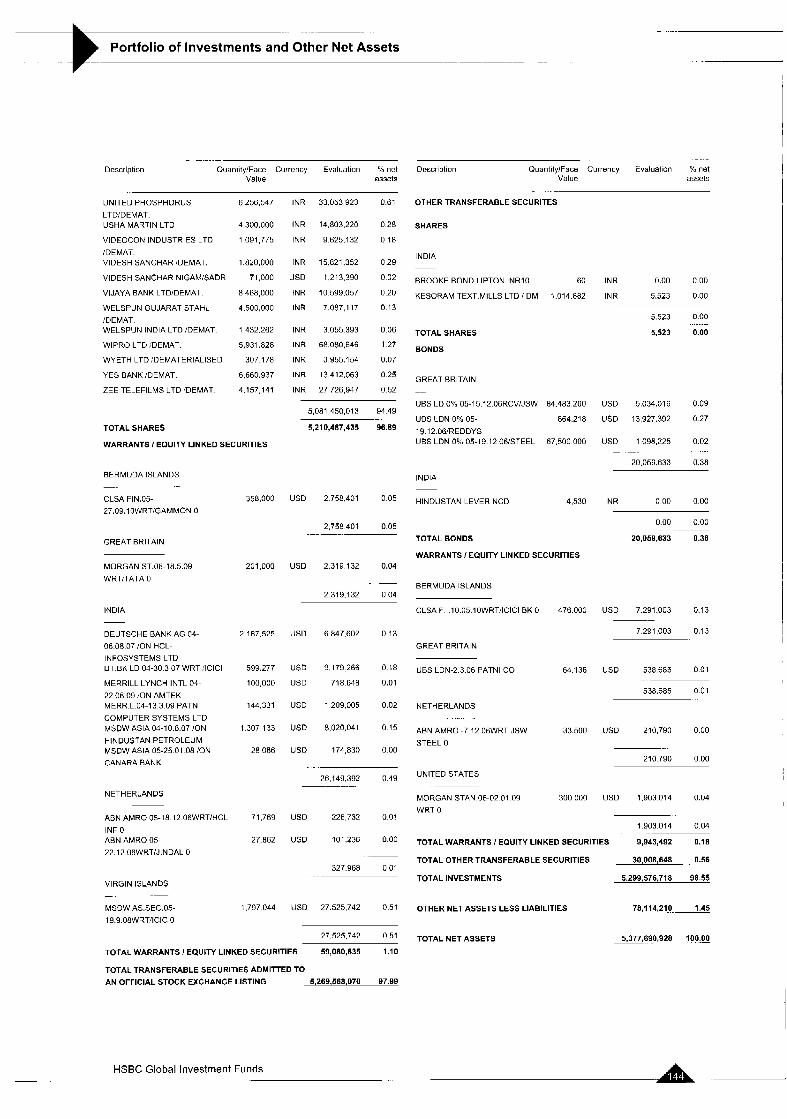
.
Portfolio of Investments and Other Net Assets -
. . . . ..
Description Ouantity!Face Currency Evaluation YO net Value assets
Description QuantitylFace Currency Evaluation C net Value assets
.
OTHER TRANSFERABLE SECURITES UNITED PHOSPHORUS
LTDIDEMAT USHA MARTIN LTD
VIDEOCON INDUSTRIES LTD
IDEMAT. VIDESH SANCHAR iDEMAT
VIDESH SANCHAR NIGAMSADR
VIJAYA BANK LTDiDEMAT
WELSPUN GUJARAT STAHL
IDEMAT WELSPUN INDIA LTD iDEMAT
WIPRO LTD rDEMAT
WYETH LTD iDEMATERIALISED
YES BANK /DEMAT
ZEE TELEFILMS LTD 'DEMAT
6,256,547
4,300.000
1,091,775
1,820,000
71,000
a 468,000
4.500,OOO
1 432.262
5,931.828
307 178
6.660.937
4,157 141
INR 33,053 923 0.61
INR i4.a03,220 0.28
INR 9625.132 0 1 8
INR i5.a21,352 0 2 9
USD 1.213.390 0.02
INR 10 599.057 0.20
INR 7,087,117 0.13
INR 3.055 393 0.06
INR f ia.080,m 1.27
INR 3,955,154 0.07
INR 13,412.063 025
INR 27726,947 0 5 2
SHARES
INDIA
BROOKE BOND LIPTON INRlO 60 INR 0.00 0.00
KESORAM TEXT.MILLS LTD I DM 1.014.882 INR 5.523 0.00
5,523 0 00
TOTAL SHARES 5,523 0.00
BONDS
GREAT BRITAIN
UBS LD 0% 05-15.12.06RCV!JSW 84.483 200 USD 5,034.016 0.09
UBS LON 09b 05- 864.218 USD 13,927,392 0.27
19.12.06!REDDYS UBS LON 0% 05-19.12 OGISTEEL 67,500 000 USD 1 096,225 0.02
20,058,633 0.38
... -
5,061,450,013 94.49
5,210,487,435 96.89
USD 2758,401 0 0 5
TOTAL SHARES
WARRANTS I EQUITY LINKED SECURITIES
BERMUDA ISLANDS -.
CLSA FIN.05-
27,09,10WRT,GAMMON 0
INDIA
358.000
201 000
2 167 525
599 277
100 000
144,331
1307 133
28 086
71,769
27 862
1 797 044
HINDUSTAN LEVER NCD 4,530 INR 0 00 0.00
000 000
20,059,633 0.38 . 2.758 401 0.05
TOTAL BONDS
WARRANTS I EQUITY LINKED SECURITIES
GREAT BRITAIN
MORGAN ST.06-18.5.09
WRTiTATA 0
US0 2.319 132 0.04
BERMUDA ISLANDS 2 319.132 0.04
CLSA F 10 05 10WRT:ICICI BK 0
GREAT BRITAIN
INDIA 476000 USD 7.291.003 0.13
7291,003 0.13 DEUTSCHE BANK AG 04- 06.08.07 /ON HCL- INFOSYSTEMS LTD DT BK LD 04-30 3 07 WRT !ICICI
MERRILL LYNCH INTL 04- 22 06 09 :ON AMTEK MERR L 04-13 3 09 PATNl
COMPUTER SYSTEMS LTD
HINDUSTAN PETROLEUM MSDW ASIA 05-25 01 08 /ON CANARA BANK
MSDW ASIA 04-10 a 07 ION
USD 6.847.602 0.13
USD 9.179268 0 1 8
US0 718648 0.01
USD 1 209.005 0.02
USD 8,020.041 0 15
USD 174,830 000
UBS LON-2.3.06 PATNl CO 64.136 US0 538,685 0 0 1
538.685 0.01
NETHERLANDS . . .
ABN AMRO -7 12 O6WRT JSW
STEEL 0 33.500 US0 210,790 0.00
210790 000
UNITED STATES 26,149,392 0 49 I
NETHERLANDS MORGAN STAN.06-02.01 09 WRT 0
300000 USD 1.903.014 0.04
ABN AMRO 05-18.12.06WRTIHCL
INF 0 ABN AMRO 05- 22.12.06WRTiJlNDAL 0
US0 226732 0.01
US0 101.236 0.00
1903014 0.04
TOTAL WARRANTS I EQUITY LINKED SECURITIES 9,943,492 0.18
30,008,648 0.56 TOTAL OTHER TRANSFERABLE SECURITIES
TOTAL INVESTMENTS 5.299.576.716 98.55 327.968 0.01
VIRGIN ISLANDS
USD 27,525,742 0.51 MSDW AS.SEC.05-
19.9.O8WRT!ICIC 0
OTHER NET ASSETS LESS LIABILITIES 78,114,210.. 1.45
27.525.742 0.51 TOTALNETASSETS 5,377,690,928 . 100LOA
TOTAL WARRANTS I EQUITY LINKED SECURITIES 59,080,835 1.10
TOTAL TRANSFERABLE SECURITIES ADMITTED TO AN OFFICIAL STOCK EXCHANGE LISTING 5.269.568.070 97.99
HSBC Global Investment Funds

. __ .
Portfolio of Investments and Other Net Assets
INDIAN EQUITY
Economic Division of Investment . . ... ...
(expressed as a percentage of net assets) .
%
Automobile industry Internet Software Banks and financial institutions News transmission Coal mines, heavy industries Energy Construction, building materials Holding companies Chemicals Pharmaceuticals and cosmetics Non-ferrous metals Office equipment and computers Other business houses Tobacco and spirits Food Public services Electronics and electrical equipment Mechanics, machinery Miscellaneous Textile Transport Photography and optics Gastronomy Healthcare, education and social services Tyres and rubber Forest products and paper industry
Other net assets less liabilities
Total Net Assets
11.07 10.48 9.61 8.90 8.09 7.19 6.49 6.48 6.23 4.86 2.45 2.35 2.21 2.17 2.01 1.49 1.49 1.30 1.01 0.96 0.65 0.52 0.22 0.20 0.10 0.02
1.45
100.00
.. _.
HSBC Global Investment Funds ._

Portfolio of Investments and Other Net Assets L JAPANESE EQUITY Statement of investments as at 30 September 2006 (expressed in JPY)
_. .. .
Descrtvtion Quanlily Currency Evaluation
....
INVESTMENTS
TRANSFERABLE SECURITIES ADMITTED TO AN OFFICIAL STOCK EXCHANGE LISTING
SHARES
JAPAN
ACOM CO LTD
AEON CO LTD
AEON CREDIT SERVICE LTD
AJINOMOTO CO INC
AMADA CO LTD
ASAHI BREWERIES
ASAHI GLASS CO LTD
ASAHI KASEI CORP
BRIDGESTONE CORP
CANON INC
CHUBU ELECTRIC POWER C
JPY500 DAllCHl SANKYO CO LTD
DAIMARU INC.
DAITO TRUST CONSTRUCT.
DENSO CORP
DENTSU INC TOKYO
EAST JAPAN RAILWAY CO
ElSAl CO LTD
FANUC LTD
FAST RETAILING CO LTD
FUJI PHOTO FILM CO LTD
FUJI TELEVISION NETWORK
INC HlTACHl CABLE LTD
HlTACHl LTD
HONDA MOTOR CO LTD
HOYA CORP
IT0 EN LTD
ITOCHU CORP
JAPAN TOBACCO INC.
JFE HOLDINGS INC
JS GROUP CORP
KAJIMA CORP.
KANSAI ELECTR. POWER CORP
KAO CORP
KAWASAKI KISEN
KlRlN BREWERY CO LTD
KOBE STEEL LTD
KOMATSU LTD
KONAMI CORP
KYOCERA CORP
14.700
72,600
16,000
23.640
82.494
14,300
214 970
309,000
64,579
233.000
54,500
78.300
55 000
14.900
51,500
671
1,021
26 900
40 717
12,562
a6.400
164
66,000
736 333
151 200
93,321
2,300
341 000
174
140.500
60,400
204 000
66.800
42 367
152 000
30 000
706.000
203,800
23.700
35.500
JPY 74 088,000
JPY 210,177.000
JPY 45 200,000
JPY 30 070.0ao
JPY 97 837.884
JPY 24,624.600
JPY 313.21 1 290
JPY 233.604,OOO
JPY 154 O2O,Y15
JPY 1 435,280 000
JPY 167 315,000
JPY 262 305 000
JPY 80245000
JPY 95,509 000
JPY 213,725,000
JPY 215.391,OOO
JPY 843.346 000
JPY 153.599 000
JPY 375.410 740
JPY 139.312 580
JPY 372.384 000
JPY 43,788,000
JPY 35.178,OOO
JPY 507,333 437
JPY 600.264 000
JPY 415,278 450
JPY 9361 000
JPY 312,015000
JPY 79.866 000
JPY 650.515 000
JPY 149 188 000
JPY 110.160000
JPY 182,030.000
JPY 133,456,050
JPY 113.392 000
JPY 47310000
JPY 261,926,000
JPY 415 752,000
JPY 71,100 000
JPY 358 905.000
Yo net assets
0 19
0.54
0 12
o oa 0.25
0.06
0.80
0.60
(1.39
3.66
0.43
0.67
0.20
0.24
0.55
0.55
2.15
0.39
0.96
0.36
0.95
0.11
0.09
1.29
1.53
1.06
0.02
0.80
0.20
1 66
0.38
0.28
0.46
0.34
0.29
0 12
0.67
1 06
0.18
0 92
Description Quantity Currency Evalualion % net assets
LAWSON INC
LEOPALACEZI CORP
MARUI CO LTD
MATSUSHITA ELECTR IND
MEITEC
MILLEA HOLDINGS INC
MINEBEA CO LTD
MlTSUBlSHl CORP
MlTSUBlSHl ELECTRIC CORP
MlTSUBlSHl ESTATE CO
MITSUBISHI HEAVY
INDUSTRIES MlTSUBlSHl UFJ FINANCIAL
GROUP MITSUI a co LTD
MlTSUl OSK LINES LTD
MlTSUl SUMITOMO INSURANCE
co MIZUHO FINANCIAL GROUP INC
MURATA MANUFACTURING CO
LTD NAMCO BANDAI HLDG
NEC CORP
NINTENDO CO LTD
NIPPON EXPRESS CO LTD
NIPPON OIL CORP
NIPPON STEEL CORP
NIPPON TEL & TEL
NIPPON YUSEN K K
NISSAN MOTOR CO LTD
NlSSHlN STEEL CO LTD
NlSSlN FOOD PRODUCTS
CO.LTD NITTO DENKO CORP
NOMURA HOLDINGS INC
NSK LTD
NTT DOCOMO INC
OBAYASHI CORP
OJI PAPER CO LTD
OLYMPUS CORP
ONWARD KASHIYAMA
ORIENTAL LAND CO LTD
ORlX CORP
PIONEER CORP
PROMISE CO LTD
RAKUTEN INC TOKYO
RESONA HOLDINGS INC
RlCOH CO LTD
ROHM CO LTD
RYOHIN KEIKAKU CO LTD
SEKlSUl CHEMICAL CO LTD
SEKlSUl HOUSE LTD
SEVEN 8 I HOLDINGS CO LTD
SHARP CORP
SHlSElDO CO LTD
SOFTBANK
SONY CORP
SUMITOMO CHEMICAL CO LTD
7 500
23.600
74,200
347 000
27.200
258
77.000
305,800
438 ooo 21 0 000
726.528
1.544
350 oon 326 000
212 000
1,722
44 293
36 aoo 443.764
25,134
239,000
503.857
1 543.000
685
314.000
219.400
213,000
3 500
41.528
393,699
100,000
2,470
147.000
182,000
40.000
24.292
25.800
19.020
27,000
18,000
1,514
816
1A6.000
27,400
5,300
81,000
94,000
104 500
176.470
31.000
97,468
177.000
375.000
JPY 31,125,000
JPY 101 716.000
JPY 128,291.800
JPY a67.500,ooo
JPY 98,736,000
JPY 531.48@ 000
JPY 49 742.000
JPY 678.876.000
JPY 435,81C 000
JPY 541,EOC 000
JPY 355.272 192
JPY 2.346,880.000
JPY 525,70C,OOO
JPY 284.598 000
JPY 313.124,OOO
JPY 1,577,352,000
JPY 363.202 600
JPY 68,337 600
JPY 288 002 836
JPY 611,761,560
JPY 151 287 000
JPY 438,355,590
JPY 749 age.000
JPY 397,300,000
JPY 225 766.000
JPY 290 268,200
JPY 74,550,000
JPY 13.16C,OOO
JPY 290.698,OOO
JPY e i a . e ~ 3 . ~ 2 0
JPY 99,700,000
JPY 449 540.000
JPY 122,304.000
JPY 117 754.000
JPY 139.200.000
JPY 41,247 816
JPY 171.054 000
JPY 621 003,000
JPY 56 160,000
JPY a4600000
JPY 2aa.864.000
JPY 70.098,200
JPY 343,100,000
JPY 300 578 000
JPY 44,255,000
JPY 80,678 000
JPY 167 976.000
JPY 397,100.000
JPY 357,351.750
JPY 73 160000
JPY 238 309.260
JPY 846,060.000
JPY 330.750.000
0.08
0 26
0.33
2.21
0.25
1.36
0.13
1.73
1.11
1.38
0.91
5.98
1.34
0 73
0.80
4.03
0 93
0 17
0 73
1 56
0 39
1.12
1 9 1
1.01
0 58
0 74
0 19
0.03
0.74
2 09
0.25
1 1 5
0.31
0.30
0.36
I1 11
0 44
1 58
0 14
0 22
0.18
0.74
0.88
0 77
0.11
0 21
0.43
1.01
0.91
0 19
0.61
2 16
0 84
HSBC Global Investment Funds

-. _-
Portfolio of Investments and Other Net Assets ... ... . . .- .. . .__
Description Quantity Currency Evaluation net assets
SUMITOMO ZORP.
SUMITOMO ELECTRIC
INDUSTRIES SUMITOMO METAL INDUSTRIES
SUMITOMO MlTSUl FINANCIAL
GR. SUMITOMO
REALTY+DEVELOPMENT SUMITOMO TR.+ BANKING
TAlSEl CORP.
TAKEDA PHARMACEUTICAL CO
LTD TAKEFUJI CORP
TERUMO CORP
TOKYO ELECTRIC POWER
TOKYO ELECTRON GO LTD
TOKYO TATEMONO CO LTD
TONENGENERAL SEKIYU KK
TOKYO TOPPAN PRINTING CO.LTD
TORAY INDUSTRIES INC.
TOSHIBA CORP
TOYOTA MOTOR CORP
WEST JAPAN RAILWAY CO
YAMADA DENKI CO LTD
241,000 JPY 354.993.000
163,600 JPY 261,596,400
1 029.000 JPY 466 137.000
1,101 JPY 1.365.240,OOO
68 000 JPY 235.960 000
225.000 JPY 278.100.000
217,000 JPY 92,008 000
95 000 JPY 700.150 000
22,617 JPY 122,584,140
29 100 JPY 130 368 000
99800 JPY 339320000
41,617 JPY 363,316,410
53,000 JPY 70 384,000
120,000 JPY 128.040,OOO
435 000 JPY 569,850 000
335,000 JPY 297,815,000
633 116 JPY 484,966 856
279,997 JPY 1,797,580,740
51 1 JPY 258,055 000
19,730 JPY 233,603,200
37.673.865.096
0 91
0.67
1.19
3.48
0.60
0.71
0.23
1.79
0.31
0.33
0.87
0.93
0 18
0.33
1.45
0.76
1.24
4.58
0.66
0.60
96.14
TOTAL SHARES 37,673,865,096 96.14
TOTAL TRANSFERABLE SECURITIES ADMITTED TO AN OFFICIAL STOCK EXCHANGE LISTING 37,673,865,046 .E96j4
TOTAL INVESTMENTS 37,673,865.096- .... 46.14
OTHER NET ASSETS LESS LIABILITIES 1,512,567.673 3.86
TOTAL NET ASSETS 39.186.432.769 100.00
HSBC Global Investment Funds .

Portfolio of Investments and Other Net Assets -1 .-
I
JAPANESE EQUITY
Economic Division of Investment ... .- ..
- .. (expressed as a percentage of net assets) . ...
Electronics and electrical equipment Holding companies Banks and financial institutions Automobile industry Transport Other business houses Coal mines, heavy industries Pharmaceuticals and cosmetics Construction, building materials Mechanics, machinery Real estate companies News transmission Retail trade, department stores Chemicals Office equipment and computers Public services Graphic art and publishing Energy Photography and optics Internet Software Insurance Other services Gastronomy Tyres and rubber Tobacco and spirits Forest products and paper industry Food Textile Non-ferrous metals
Other net assets less liabilities
Total Net Assets
%
20.90 13.80 10.52 7.40 4.80 4.78 3.96 3.04 2.88 2.60 2.42 2.27 2.22 2.20 1.97 1.76 1.45 1.45 1.31 1.22 0.80 0.55 0.44 0.39 0.38 0.30 0.13 0.1 1 0.09
3.86
100.00
HSBC Global Investment Funds

__ .. .-_ -
Portfolio of Investments and Other Net Assets
KOREAN EQUITY Statement of investments as at 30 September 2008 (expressed in USDi
Description Ouantity Currency Evaluation Yo net ass&
.~
Description Quantity Currency Evaluation 'lo net assets
S-OIL CORP 45.200
WOORI FINANCE HOLDINGS CO 55.500
LTD WOORI 125,190
lNVESTMENT&SECURlT CO YUHAN CORP 5,000
~.
KRW 3 024,246 2 0 6
KRW 1.170.337 0 80
KRW 2 666 365 1.82
KRW 776,895 0.53
INVESTMENTS
TRANSFERABLE SECURITIES ADMITTED TO AN OFFICIAL STOCK EXCHANGE LISTING
TOTAL SHARES
143,906,625 98.03
143.906.625 98.03 ~.
TOTAL TRANSFERABLE SECURITIES ADMITTED TO AN OFFICIAL STOCK EXCHANGE LISTING 143,906,625 98.03
TRANSFERABLE SECURITIES TRADED ON ANOTHER REGULATED
MARKET SHARES
SHARES
SOUTHKOREA
AMORE PACIFIC CORP (NEW)
BANK OF PUSAN
DAEGU BANK
DAELIM INDJSTRIAL CO LTD
DAEWOO MOTORS SALES
CORP DONG-A PHARMACEUTICAL CO
LTD DONGBU INSURANCE CO LTD
GS ENGINEERINGBCONSTRUCT
CORP HAN KOOK TIRE
MANUFACTURING CO HANA TOUR SERVICE INC
HOTEL SHILLA
HYNIX SEMICONDUCTOR INC
HYUNDAI DEPARTMENT STORE
co HYUNDAI FIRE 8. MARINE INS
co HYUNDAI MOTOR CO LTD
INTELLIGENT DIGITAL
INTEGRAT. KOOKMIN BANK
KOREA EXCHANGE BANK
KOREAN AIR
KTB G CORP
LG CORP
LG ELECTRONICS INC
LG PETROCHEMICAL CO LTD
LG PHILIPS LCD CO LTD
MEGASTUDY CO LTD
MODETOUR NETWORK INC
NHN CORPORATION
ORION CORPORATION
POSCO
SAMSUNG ELECTRONICS CO
LTD SAMSUNG ENGINEERING CO
LTD SAMSUNG HEAVY INDUSTRIES
SAMSUNG TECHWIN CO LTD
SHINHAN FlUANClAL GROUP
SHINSEGAE CO LTD
SK TELECOM CO LTD
2,663 KRW
181,000 KRW
133.440 KRW
10,800 KRW
155.000 KRW
10 700 KRW
186.000 KRW
41 000 KRW
235.86LJ KRW
37000 KRW
191.000 KRW
70,000 KRW
46.700 KRW
96,000 KRW
78,380 KRW
89 500 KRW
157,400 KRW
118,000 KRW
20.510 KRW
114,000 KRW
105,000 KRW
32.320 KRW
72,300 KRW
53640 KRW
44 700 KRW
121,500 KRW
44.646 KRW
21,900 KRW
30.400 KRW
20.740 KRW
97.000 KRW
176,000 KRW
70.510 KRW
89.700 KRW
6.750 KRW
16.759 KRW
HSBC Global Investment Funds
1.238 508
2,238.409
2 235,580
736,306
4,390,778
841 457
4.403.885
2,868 909
3.103 835
2 624.214
2,977 833
2,159,827
3.356.609
1,268,400
6.71 0.66U
1.333 881
12,411,336
1509.185
752,264
6.928.635
3.052.088
2,083,897
1,578 096
1 780 301
5,055 525
2,934.523
4,686 049
5 046.32'3
7,872.536
14 556.327
4,634.31 1
4.297 339
2,891.72a
4.043.770
3,49fi.028
3.569.424
0.84
1 52
1 52
0.50
2.99
0.57
3.00
1.95
2.1 1
1.79
2.03
1 88
2.29
o a6
4.57
0.91
8.46
1 0 3
0.51
4.72
2.08
1.42
I .oa 1.21
3.44
2.00
3.19
3.44
5 36
9 93
3 16
2.93
1 97
2.75
2 38
2.43
SOUTH KOREA
ASIANA AIRLINE INC
TOTAL SHARES
29.469 KRW 215,23R 0.15
215,238 0.15
215.236 0.15
TOTAL TRANSFERABLE SECURITIES TRADED ON ANOTHERREGULATEDMARKET 215,238 0.15
TOTAL INVESTMENTS 144,121,863 98.18
OTHER NET ASSETS LESS LIABILITIES 2,672,199 1.82
146,794,062 100.00 TOTALNETASSETS

.. ... . . .. .
Portfolio of Investments and Other Net Assets .. - . .~ . .
KOREAN EQUITY
Economic Division of Investment
(expressed as a percentage of net assets)
-
.. .-
%
Electronics and electrical equipment Banks and financial institutions Internet Software Mechanics, machinery Coal mines, heavy industries Tobacco and spirits Retail trade, department stores Automobile industry Insurance Holding companies Food News transmission Pharmaceuticals and cosmetics Transport Construction. building materials Tyres and rubber Energy Gastronomy Chemicals Other services Office equipment and computers
Other net assets less liabilities
Total Net Assets
- HSBC Global Investment Funds
18.36 14.35 6.63 5.92 5.36 4.72 4.67 4.57 3.86 3.55 3.44 3.34 3.18 2.66 2.45 2.1 1
2.06 2.03 1.92 1.79 1.21
1.82 ~
100.00

._ -
Portfolio of Investments and Other Net Assets ~
PAN-EUROPEAN EQUITY Statement of investments as at 30 September 2006 (expressed in EUR)
...
Quantity Currency Evaluation Yo net assets
Descriptlon
CARPHONE WAREHOUSE
GROUP FKI PLC
GKN PLC
GLAXOSMITHKLINE PLC
HSBC HOLDINGS PLC
JAZZTELPLC
KAZAKHMYS LIMITED
RESOLUTION PLC
SHIRE PLC
TESCO PLC
XSTRATAPLC
2 616.607
4,102.895
3.320.376
69 1.926
1.469 427
6,513,505
242 652
1,866,394
921.583
1,453,641
216.542
338 758
671,262
197 164
360,564
477.132
710.070
706,074
546,366
3.028.735
61 1,325
379 652
255,421
356 632
141,135
204 879
1.266.821
376 587
610.741
182 624
3.976.209
157.372
GBP 11,926,115 1.66
GBP 5446.719 076
GBP 14,546.081 2.03
GBP 14,473.398 2.02
GBP 21.193373 2.96
EUR 2.670.537 0.37
GBP 4,128,356 0.58
GBP 16.848 327 2.35
GBP 11,989,610 1 67
GBP 7.842.986 1.09
GBP 7,167.489 100
.
Description Quantity Currency Evaluation nct assets
INVESTMENTS
TRANSFERABLE SECURITIES ADMITTED TO AN OFFICIAL STOCK
EXCHANGE LISTING
SHARES
BELGIUM
192.483,362 26.83
GREECE
UCB BANK OF PIRAEUS
HELLENIC TELECOM
MARFIN FINANCIAL GROUP HLD
SA OPAP
EUR 6,910,663 096
EUR 13304,413 186
EUR 6013502 0.84
172.988
215.930
124.977
576,837
490,533
586.614
273 933
541.262
64.203
117501
3,236.658
236.955
214.450
349.1 97
101,690
146.449
641.916
147,340
461.046
173,339
338.049
8.705
284,920
4.195 012
1.444.629
2,930,785
EUR 8626.912 120
8 626.912 120
DENMARK
NOVO NORDISK AIS B EUR 9.628.975 1.37
DKK 12.620 5113 1 76 36,057.553 5 03
12,fi211.503 1.76 IRELAND
FINLAND
BANK OF IRELAND EUR 7 333.519 1.02 FORTUM CORPORATION
NESTE OIL OYJ
NOKIA OY
EUR 2613.269 0.36
EUR 13,273,020 1.86
EUR 7,676,841 1.07
7,333.519 1.02
ITALY
23,563,130 3.2Y EUR 7313.721 102
EUR 16,571.557 2 31
EVA 9124.312 127
EUR 19,913.933 2 78
BCA POPOLARE Dl MILANO
EN1 SPA ROMA
SAN PAOLO-IMI SPA
UNICREDITO ITALIAN0 SPA
FRANCE
AXA
BNP PARIBAS
CREDIT AGRICOLE SA.
GROUPE DANONE
LVMH MOET HENNESSY
RHODIA
SAINT-GOB41N
SANOFI-AVENTIS
TOTAL SA
VALLOUREC
EUR 17,310979 241
EUR 23.270608 325
EUR 18,803442 263
EUR 7 132,953 099
EUR 9.556706 133
EUR 5,728885 1180
EUR 13636,760 1 YO
EUR 15011 500 209
EUR 18332843 256
EUR 18639777 260
52,923,523 7.38
NETHERLANDS
BUHRMANN NV
KONINKLIJKE NUMICO NV
MITTAL STEEL CLASS A
SNS REAAL NV
EUR 7348.127 1.02
EUR 13.473,850 1.88
EUR 7,018,969 0.98
EUR 5,440,447 0.76
33,281,393 4.64
SPAIN 147 426.453 20 56
. .~
ACCIONA SA
ALTADIS SAIREG
BANCO BILBAO
VIZ ARGENTARIA :NAM ENAGAS
GAMESA CORP TECNOLOGICA
SA TECNICAS REUNIDAS SA
GERMANY EUR 16,637,406 2.35
EUR 7.672 719 1.07
EUR 23,157,487 3.23
EUR 7,249,300 1.01
EUR 10,602,464 1.48
EUR 4.454 199 0.62
ALLIANZ AG INAM
DEUTSCHE POST AG. BONN
E.ON AG
GEA GROUP AG
HEIDELBERGER
DRUCKMASCHINEN AG LANXESS AG
PORSCHE AG !VZ.A SDV
EUR 20023.972 280
EUR 13358272 186
EUR 13712,934 191
EUR 6588.347 092
EUR 5.609.250 0 78
EUR 1 1 486.905 160
EUR 7099276 0.99
77,078,956 10.86
69.973 575 9.76
SWEDEN
ERICSSON TEL. -B
SWITZERLAND
SEK 10,994,225 1.53 GREAT BRITAIN
10,994,225 153 . .-
ANGLO AMERICAN PLC
BAE SYSTEMS PLC
BARCLAYS PLC
BP PLC
GBP 9.724.971 1.36
GBP 24,662 656 3.44
GBP 14.447.345 2.01
GBP 25415,397 3.53
JULIUS BAER HOLDING
INAMENAKT
CHF 12.305459 1.72
HSBC Global Investment Funds I .. 4- -. ..
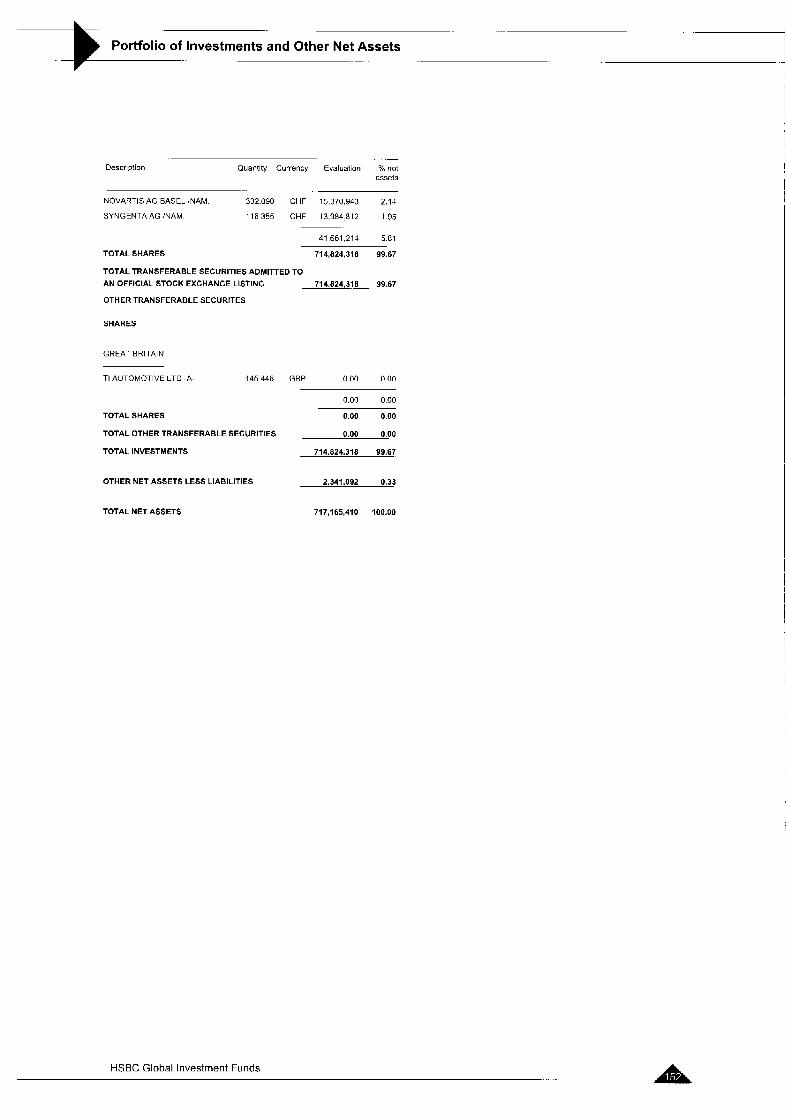
Portfolio of Investments and Other Net Assets - 4 -
.-
Description Quantity Currency Evaluation % net assets
NOVARTIS AG BASEL INAM. 332.090 CHF 15,370343 2.14
SYNGENTA AG INAM. 116355 CHF 13.984812 1.95
41 661 214 581
TOTAL SHARES 714,824,318 99.67
TOTAL TRANSFERABLE SECURITIES ADMITTED TO
AN OFFICIAL STOCK EXCHANGE LISTING 714.824,31.8- 99.67
OTHER TRANSFERABLE SECURITES
SHARES
GREAT BRITAIN
TI AUTOMOTIVE LTD -A- 145446 GBP 0.00 0.00
TOTAL SHARES
0.00 0.00
0.00 0.00
TOTAL OTHER TRANSFERABLE SECURITIES 0.00 0.00
TOTAL INVESTMENTS 714.624.318 99.67
OTHER NET ASSETS LESS LIABILITIES 2341.092 0.33
TOTAL NET ASSETS 717,165,410 'lO!fl
HSBC Global Investment Funds

..
Portfolio of Investments and Other Net Assets -
I
PAN-EUROPEAN EQUITY
Economic Division of Investment
(expressed as a percentage of net assets)
%
Banks and financial institutions Pharmaceuticals and cosmetics Energy Insurance Mechanics, machinery News transmission Chemicals Construction. building materials Aerospace technology Public services Food Retail trade, department stores Coal mines, heavy industries Electronics and electrical equipment Transport Gastronomy Non-ferrous metals Textile Tobacco and spirits Office equipment and computers Automobile industry Graphic art and publishing
Other net assets less liabilities
Total Net Assets
23.61 10.88 10.62 7.56 6.95 4.83 4.35 4.25 3.44 2.92 2.01 2.75 2.56 2.24 1.86 1.37 1.36 1.33 1.07 1.02 0.99 0.84
0.33
100.00
HSBC Global Investment Funds ~. - . .

- ..
Portfolio of Investments and Other Net Assets
PAN-EUROPEAN EQUITY HIGH DIVIDEND Statement of investments as at 30 September 2006 (expressed in EUR)
.. . . .
Quantity Currency Evaluation YO net assets
Description
GREAT BRITAIN
BARCLAYSPLC
COMPASS GROUP PLC
DSG INTERNATIONAL PLC
LLOYDS TSB GROUP PLC
ROYALBKOFSCOTLANDPLC
SCOTTISH POWER PLC
VODAFONE GROUP PLC
198 174
277 994
444 114
159 518
50 651
112 175
617,075
53.709
52.066
50.194
50.256
90,766
293,033
82.817
173.244
103,700
891,609
417,390
92.258
47,648
59.941
60.238
53 028
52 687
135 963
114,829
146,176
52 841
23 207
GBP 1.981.885 2 6 9
GBP 1.100,986 1 4 9
GBP 1.436.270 1 94
GEP 1.276.473 1 73
GBP 1376771 1 86
GBP 1080.466 1 4 6
GBP 1,122,591 1 5 2
Description Quantity Currency Evaluation "h net assets
INVESTMENTS
TRANSFERABLE SECURITIES ADMITTED TO AN OFFICIAL STOCK EXCHANGE LISTING 9 375 442 12.69
GREECE
SHARES BQ NATIONA.GRECEINOM; s CP COSMOTE MOBILE
TELECOMMUNICAT. EFG EUROBANK ERGASIAS SA
OPAP
EUR 1.843293 2 5 0
AUSTRIA -
TELEKOM AUSTRIA AG
WIENERBERGER AG
ZUMTOBEL AG
EUR 987 171 1 3 4
EUR 1.218710 1 6 5
EUR 1,369979 1 8 5
55.821
26,137
58.325
21.291
59.837
67.343
75 447
47 873
86 977
78.397
14,558
64,349
72 419
1 584
51 500
50.875
44 822
76.153
82 020
28.502
65.983
20.406
833.062
EUR 1.115862 1 5 1
EUR 971.251 1.31
EUR 1.128588 1 5 3 5,419 153 7 3 4
3.215 701 4.35 ITALY
BELGIUM BCA POPOLARE Dl MILANO
CAPlTALlA SPA
EN1 SPA ROMA
MEDIASET SPA
SARAS RAFFINERIE SARDE
SPA TELECOM ITALIA SPA/RISP.N-
cv UNIPOL SPA .CIA
ASSKURATRICE
EUR 934890 1 2 7
EUR 1.906,180 2.50
EUR 1.943714 2 6 2
EUR 1,469 109 1 9 9
EUR 418.430 0.57
EUR 1.719.022 2 33
KBC GROUPE SA
FINLAND
EUR 1.776734 2.41
1776,734 2 4 1
ELISA CORPORATION A
FORTUM CORPORATION
KEMIRA OYJ
NESTE OIL OYJ
OKOOSUUSPANKK
KESKUSPANKKI A UPM-KYMMENE CORP
EUR 1.041 164 1 4 1
EUR 1408.142 1 9 1
EUR 1100.772 1 4 9
EUR 1101,558 1 4 9
EUR 1074,166 1 4 5
EUR 1.463.671 1 98
EUR 1.103.997 1.49
9,495,342 12.85
NETHERLANDS
BUHRMANN NV
ING GROEP NV! CERT. OF SHS
KONINKLIJKE BAM GROEP NV
MITTAL STEEL CLASS A
SNS REAAL NV
EUR 1,108,941 1.50
EUR 1,656.721 2.25
EUR 844.569 1.14
EUR 1,655,340 2.24
EUR 804.435 1.09
7,189,473 9.73
FRANCE
ASSURANCES GEN.DE FRANCE
AXA
FRANCE TELECOM SA
PINAULT PR.REDOUTE
SUEZ
VIVENDI UNIVERSAL SA
EUR 1.442.698 1.95
EUR 1,898,939 2.58
EUR 1317,302 1 7 8
EUR 185.486 0 2 5
EUR 1.802 500 2.44
EUR 1.448.920 1.96
8.095 845 10.96
. . . -.
6 070.006 8.22
NORWAY
STATOIL ASA
TELENOR AS
NOK 995.098 1.35
NOK 1,399.335 1.89
2 394433 3 2 4
. . .. ..
GERMANY
SPAIN -
BCO SANTANDER CENTR. HlSP /REG
ADIDAS AG
COMMERZBANK AG
DEUTSCHE POST AG. BONN
HYPO REAL ESTATE HOLDING
AG MOBILCOM
RWE AG (NEU). ESSEN A
EUR 1663793 2 2 5
EUR 2,035.569 2 76
EUR 1706836 2 3 1
EUR 1,406.574 1 90
EUR 1,204.190 1 6 3
EUR 1496.984 2 0 3
EUR 1,435,363 1.94
1.435363 1 9 4
SWEDEN
ENlRO AB
HENNES & MAURITZ AB
SEK 1,428,828 1 93
SEK 1757832 2 3 8 9.513.946 12.88
3,186,660 4 31 GIBRALTAR
SWITZERLAND PARTYGAMING PLC GBP 1299.450 1 7 6
1,299,450 1.76 JULIUS EAER HOLDING
INAMENAKT.
CHF 1814,635 2 4 6
A . ..... . -. . HSBC Global Investment Funds
... .

I
Portfolio of Investments and Other Net Assets ~ - __ .- . __
Description . ... . ..
Quantity Currency Evaluation net assets
ZURICH FINANCIAL SERVICES 10,509 CHF 2.055.994 2.78 !NAM
3,870.629 5 24
TOTAL SHARES n , n a , 1 7 r 97.92
AN OFFICIAL STOCK EXCHANGE LISTING 72,33a.177 97.92
TOTAL INVESTMENTS 72.338.177 97.92
TOTAL TRANSFERABLE SECURITIES ADMITTED TO
OTHER NET ASSETS LESS LIABILITIES 1,530,165 2.08
HSBC Global Investment Funds

_.
Portfolio of Investments and Other Net Assets *- _ _ . _ _
PAN-EUROPEAN EQUITY HIGH DIVIDEND ~ __
Economic Division of Investment
(expressed as a percentage of net assets)
Yo
Banks and financial institutions News transmission Insurance Energy Public services Retail trade, department stores Holding companies Gastronomy Construction, building materials Transport Textile Coal mines. heavy industries Forest products and paper industry Graphic art and publishing Leisure Office equipment and computers Chemicals
Other net assets less liabilities
Total Net Assets
HSBC Global Investment Funds
28.64 17.36 8.80 7.94 5.93 4.57 3.43 3.34 2.45 2.31 2.25 2.24 1.98 1.93 1.76 1.50 1.49
2.08
100.00
-

-__ . . . . .. . . - .. . .. . . . . . . . . . ~ 3- Portfolio of Investments and Other Net Assets
Description Quantity Currency Evaluation “h net assets
SINGAPORE EQUITY Statement of investments as at 30 September 2006 (expressed in USD) .~
TOTAL INVESTMENTS 25,249,290 91.76
OTHER NET ASSETS LESS LIABILITIES 2,268,625 8.24 ~ - Description Quantity Currency Evaluation 70 net
TOTAL NET ASSETS 27,517,915 100.00 -.
INVESTMENTS
TRANSFERABLE SECURITIES ADMITTED TO AN OFFICIAL STOCK
EXCHANGE LISTING
SHARES
ISRAEL -
SARIN TECHNOLOGIES LTD 2,080000 SGD 688,177 2 5 0
SINGAPORE
BANYAN TREE HOLDINGS LTD
CITY DEVELOPMENTS LTO
FIRST ENGINEERING LTD
HO BEE INVESTMENT LTD
HOTEL PROPERTIES
HTL INTERN4TL HLDGS LTD
INTER-ROLLER ENGINEERING
LTD JARDINE CYCLE &CARRIAGE
LTD MEIBAN GROUP
MMI HOLDINGS LTD
MOBILEONE LTD
OSlM INTERNATIONAL LTD
OVERSEA-CHINESE BK CORP
SIA ENGINEERING CO LTD
SINGAPORE TELEClBOARD LOT 1000 STRAITS TRADING CO STCL
SUNNINGDALE TECH LTD
UTD OVERSEAS BANK :LOCAL
VENTURE CORPORATION LTD
WHEELOCK
PROPERT(SINGAP0RE) LTD WING TAI HLDS
YELLOW PAGES (SINGAPORE)
LTD
TOTAL SHARES
INVESTMENT COMPANIES
BERMUDA ISLANDS
MACQUARIE INTL
INFRASTRUCTURE
688.177 2.50
1142.000 SGD
173.000 SGD
615.000 SGD
4,229,000 SGD
981,000 SGD
1102.500 SGD
1.800,OOO SGD
94,000 SGD
1.700.000 SGD
1700.000 SGD
644.000 SGD
990,200 SGD
366.000 SGD
3ia.000 SGD
757.300 SGD
393 000 SGD
1,287 000 SGD
118,000 SGD
103,000 SGD
2,274,000 SGD
1,003.00U SGD
1.050.000 SGD
61 1,734
1 166.561
31 1.996
2,531 856
1,273 544
785,118
941 517
710 864
305.331
1,065.Y82
856,340
1.173 163
1 510.776
705,420
1 164.489
730.621
255,486
817 a72
1.212 125
2.565 201
1 194.649
694.794
2.22
4 24
1 1 3
9 21
4.64
2.85
3.42
2.58
1.11
3.87
3.1 1
4.26
5.50
2.56
4.23
2.66
0 93
4.40
2.97
9.33
4.34
2 52
22.585.439 82 08
23,273.616 84.58
3.300.000 SGD 1,975.674 7.18
TOTAL INVESTMENT COMPANIES 1,975,674 7.18
TOTAL TRANSFERABLE SECURITIES ADMITTED TO
AN OFFICIAL STOCK EXCHANGE LISTING 25,249,290 91.76
HSBC Global Investment Funds

_. ~-
Portfolio of Investments and Other Net Assets --
I
SINGAPORE EQUITY
Economic Division of Investment ._ -
(expressed as a percentage of net assets) .
Real estate companies Gastronomy Banks and financial institutions Mechanics: machinery News transmission Investment companies Other business houses Electronics and electrical equipment Forest products and paper industry Automobile industry Transport Graphic art and publishing Precious metals Non-ferrous metals
Other net assets less liabilities
17.79 16.19 9.90 8.40 7.34 7.18 6.92 3.90 2.85 2.58 2.56 2.52 2.50 1.13
8.24
Total Net Assets 100.00
HSBC Global Investment Funds -

. ..
Portfolio of Investments and Other Net Assets -~ ..
THAI EQUITY Statement of Investments as at 30 September 2006 (expressed in USD)
-. ._
Description Quantity Currency Evaluation
INVESTMENTS
TRANSFERABLE SECURITIES ADMITTED TO AN OFFICIAL STOCK
EXCHANGE LISTING
SHARES
SINGAPORE
BANYAN TREE HOLDINGS LTD 11.352 000 SGD 6,080.916
6,080,916
THAILAND
AAPICO HITECH PCL 'FOR REG 7 153 100 THE 3 161 848
AAPlCO HITECH PCL 'FOR REG 1,000 000 THB 442.025
ADVANCED IUFO SERV PUB
/FOR REG AIRPORTS O r THAILAND PUB
(FOR REG EANGCHAK PETROLEUM PCL
'FOR REG BANGKOK BANK PUBLIC /FOR REG BANGKOK EXPRESSWAY
:FOR REG BANPU PUBLIC CO LTD/FOR REG BK OF AYUDHYA PUBLIC
'FOR REG CENTRAL PATTANA PUBLIC CO LTD CHAROONG THA18WIREIFOR REG DELTA ELECTRONICS
PUB 'FOR REG HANA MICROELECTRONICS
/FOR REG HEMARAJ LAND DEVEL FOREIG REG ITALIAN THAI DEV PUB 'FOR
REG KASIKORNBANK
PUB COMP (FOR REG KRUNG THAI BANK 'FOR REG
LAGUNA RESORTS
&HOTELS!FOR REG LALIN PROPERTY PUBlFOREIGN REG LPN DEVELOPMENT
PUB /FOR REG LPN DEVELOlMENT
PUBLIC:NON-VOT /FOR REG MURAMOTO ELECTRON (THAI)
PLC/FOR REG PHATRA SEC PUBLIC CO LTD
/FOR REG PTT EXPL PROD PUBLIC
/FOR REG PTT PLC CO LTD 'FOR REG
2 822310
5 748 100
1.859 900
6,378 800
4 861.100
910 300
5.320 000
5,840 000
6 304,800
5,099 000
8 399 900
45,651,700
51,438.800
8 733.200
15 857.800
261 000
15,656.000
33 722,600
670 100
320,000
1,959.400
5 300,000
3.01 0,600
THE
THE
THB
THE
THE
THB
THB
THE
THB
THB
THB
THB
THE
THB
THE
THE
THE
THE
THB
THE
THE
THE
THE
6,763.698
8.877 504
433 347
18.604.01 5
2,692.381
3,538.Y62
2.436 569
2.985.744
1.250.737
2 430.775
6.206 913
1.069 740
7.730.875
16,045,708
4,856,007
549.043
1.967 71 1
4,400.030
87 433
1.661 587
2.1 13.084
14.959.610
17.315.9 10
QUALITY HOUSES PUBLIC 19,967 100 THE 584 052
/FOR REG
HSBC Global Investment Funds -
-.
% net assets
2.82
2 82
1.46
0 20
3 13
4 11
0.20
8.66
1.25
1.64
1.13
1.30
0.58
1 1 3
2.87
0.50
3 58
7 43
2.25
0.25
0 91
2 04
0 04
0.77
0 98
6 93
8 03
0.27
. . . .. . ..
Doscription Quantity Currency Evaluation % net assets
SlAM CEMENT PUBLIC
COlFOR REG SlAM CEMENT PUBLIC 'NVDR
SlAM CITY BK PUBLWFOR REG
SINO-THAI ENGIN 8 CONSIFOR REG SRlTHAl SUPERWARE
PUB 'FOR REG SUPALAI PUBLIC CO
LTDlFORElGN THAI AIRWAYS INTL'FOR REG
THAI CANE PAPER /FOR REG
THAI OIL PUBLIC COlFOR REG
THAI PLAST & CHEMIC PUB (FOR REG THE ERAWAN GROUP
:FOR REG TISCO BANK PUBL COINON-
VOT 'FOR REG TISCO FINANCE PUBLIC
:FOR REG TPI POLENE PUBLIC :FOR REG
TRUE CORP PUBLIC /FOR
REG WORKPOINT
ENTERTAINM PUB 'FOR
642.700
885,900
5 800 000
35,776,100
10.680,000
30.464 400
7 450.900
I O , 161.329
7 412.100
11 260,500
50,640,000
1,374,700
4.000 UOO
4 400 000
12,690.600
727.200
THB 4381.137
THB 5,614,359
THB 3073,404
THB 4,629.860
THB 2,260,877
THE 2.530963
THE 9304,587
THB 3.977.465
THE 11,842.164
THB 4677.576
THB 5,231.955
THB 816.303
THB 2,364,566
THB 1 136.483
THE 3.176.498
THE 437.624
2 03
2 60
1 42
2.14
105
1.17
4.35
1.84
5.48
2 17
2.42
0.38
1.10
0.53
1.47
0.20
TOTAL SHARES
INVESTMENT COMPANIES
THAILAND
198,790 009 92 07
204,870,925 94 89 ~- .. __
CPN RETAIL GROWTH 9,380.100 PROPERTY F D
THE 2,672574 1 2 4
TOTAL INVESTMENT COMPANIES
WARRANTS I EQUITY LINKED SECURITIES
THAILAND
2.672 574 124
2.672.574 1.24 - -
BANGCHAK PETR 03- 482.900
14.05.11WRT:FOR REG 18
THE 38.062 0 02
-. .
38.062 002
TOTAL WARRANTS I EQUITY LINKED SECURITIES 38.062 0.02
TOTAL TRANSFERABLE SECURITIES ADMlnED TO AN OFFICIAL STOCK EXCHANGE LISTING 207.581.561 2 6 . 1 5
TOTAL INVESTMENTS 207,581,561 --96.15
OTHER NET ASSETS LESS LIABILITIES 8.320.648 3.85
TOTAL NET ASSETS 215,902,209 100.00

..
Portfolio of Investments and Other Net Assets .-
THAI EQUITY
Economic Division of Investment
(expressed as a percentage of net assets)
-. -.. ~-
. __ -.
Banks and financial institutions Energy Construction, building materials Real estate companies Transport Electronics and electrical equipment News transmission Aerospace technology Gastronomy Chemicals Holding companies Forest products and paper industry Mechanics. machinery Public services Investment companies Consumer goods Tyres and rubber Graphic art and publishing
Other net assets less liabilities
Total Net Assets
%
20.89 20.66 10.35 8.23 5.60 5.35 4.60 4.1 1 3.07 2.70 2.46 1.84 1.66 I .64 1.24 1.05 0.50 0.20
3.85
100.00
~
HSBC Global Investment Funds -

~ - ...
Portfolio of Investments and Other Net Assets
UKEQUITY Statement of investments as at 30 September 2006 (expressed in GBP)
.. ..
Description Quantity Currency Evaluation
.. .
INVESTMENTS
TRANSFERABLE SECURITIES ADMITTED TO AN OFFICIAL STOCK
EXCHANGE LISTING
SHARES
GREAT BRITAIN
ALLIANCE 8 LEICESTER PLC
ANGLO AMERICAN PLC
ASTRAZENECAPLC
AVIVA PLC
BAE SYSTEMS PLC
BARCLAYS PLC
BBA GROUP PLC
BG GROUP PLC
BHP BILLITON PLC
BP PLC
BRIT INSURANCE HLD PLC
BRITISH AMERICAN TOBACCO
ET GROUP PLC
CENTRICA PLC
DAILY MAIL B GENERAL TR. -A-
DOMESTIC 8 GENERAL GROUP PLC ECONERGY INTERNATIONAL
PLC FKI PLC
GKN PLC
GLAXOSMITHKLINE PLC
HANSON PLC
HBOS PLC
HELPHIRE GROUP LONDON
HOMESERVE
HSBC HOLDINGS PLC
INCHCAPE FLC
JOHNSON MATTHEY PLC
LEGAL & GEUERAL GROUP PLC
LLOYDS TSB GROUP PLC
MARKS AND SPENCER
MEGGITT PLC
OMEGA UNDERWRITING
HLDGS PLC PEARSON PLC
RECKITT BENCKISER PLC
RENSBURGSHEPPARDSPLC
RESOLUTION PLC
REXAM PLC
ROYAL BK CF SCOTLAND PLC
ROYAL DUTCH SHELL -B-
ROYAL DUTCH SHELL PLC -A-
83.857 GBP
123.035 GBP
113,040 GBP
289,784 GBP
1.762.528 GBP
338.578 GBP
1 .I 11,878 GBP
371.315 GBP
235 163 GBP
2,196,453 GEP
227,690 GBP
102231 GBP
727325 GBP
383.670 GBP
521 716 GBP
233.009 GBP
248,900 GBP
1030632 GBP
1,647.485 GEF
462551 GBP
113.645 GBP
721.928 GBP
1.215.786 GBP
109.920 GBP
758.775 GBP
480368 GBP
122,494 GBP
1.728993 GBP
255844 GBP
341.453 GBP
213.532 GBP
1.672.109 GBP
161,255 GBP
55.142 GBP
71.506 GBP
618,874 GBP
168,381 GBP
367.276 GBP
272028 GBP
180,646 GBP
936,683
2,847,030
3.781 188
2254,520
7.024 908
2,295.559
2,352,036
2.455.400
2.215 235
12,913,168
686 485
1.489 506
1.943 776
1,249.805
3,177 250
2,248.537
231,477
927.569
4,893.030
6 559.465
854.975
7 697.589
4,770 647
1819.176
7 419.302
2,529 138
1,696.5A2
2.448 254
1,387 954
2 202.372
667.288
2 399.476
1 238.003
1.225.807
516 273
3,787,509
971.558
6,768.061
4,959.196
3,202,854
Yo net assets
0.62
1 .e7
2.49
1.48
4.62
1.51
1 Y4
1 6 2
1.46
8.51
0.45
0.98
1.28
0.82
2.09
1.48
0.15
0.61
3 22
4 32
0.56
5.08
3.14
1 20
4 88
1.66
1.12
1.61
0.91
1 45
0 44
1 58
0 81
0.81
0.34
2 49
0 64
4 45
3 26
2.11
. .
Descrlptlon Quantity Currency Evaluatlon 'h net assets
SCOTTISH POWER PLC
SEVERNTRENTPLC
SHIRE PLC
SIG PLC
STANDARDCHARTEREDPLC
TAYLOR WOODROW PLC
TESCO PLC
TRADING EMISSIONS PLC
UTD BUSINESS MEDIA
VODAFONE GROUP PLC
XSTRATA PLC
YELL GROUP PLC
31 GROUP PLC
150 862
45.397
291.949
63.870
54.056
398.006
199.Y79
1 386.861
404.475
2 175.928
52.689
220,000
355,574
GBP
GBP
GBP
GBP
GBP
GBP
GBP
GBP
GBP
GBP
GBP
GBP
GBP
985,129 0.65
613326 0.40
2.574.990 1 6 9
628,481 0 4 1
751.378 0 4 9
1.420 881 0 94
731.487 0.48
1,636.496 1.08
2.679.647 1.76
2,683.653 1.77
1.182 341 0.78
1,317,800 0.87
3,351 285 2.21
142,201,495 93 59 . .. - ~.
GUERNSEY
ALPHA PYRENEES TRUST LTD 901 979 GBP 847,860 0 56
RAVEN RUSSIA PLC 1 641.875 GBP I 740.388 I 14
2 588.248 1.70
TOTAL SHARES 144.789.743 95.29
TOTAL TRANSFERABLE SECURITIES ADMITTED TO AN OFFICIAL STOCK EXCHANGE LISTING 114,789,743 95.29
TRANSFERABLESECURlTlESTRADEDONANOTHERREGULATED MARKET
SHARES
GREAT BRITAIN
TRADING EMISSIONS PLC -C- 229.818 GBP 236.713 0.16
236,713 0.16
TOTAL SHARES 236,713 0.16
TOTAL TRANSFERABLE SECURITIES TRADED ON ANOTHERREGULATEOMARKET 236,713 0.16
OTHER TRANSFERABLE SECURITES
.. . -.
SHARES
GREAT BRITAIN
TI AUTOMOTIVE LTD -A- 100,000 GBP 0.00 0.00
0 00 0.00
TOTAL SHARES 0.00 0.00
TOTAL OTHER TRANSFERAELE SECURITIES 0.00 0.00
TOTALINVESTMENTS 145,026,456 95:4!
OTHER NET ASSETS LESS LIABILITIES 6,913x062. 4.55
TOTALNETASSETS 151,939,518 100.00
HSBC Global Investment Funds &.. .

-
Portfolio of Investments and Other Net Assets - _.
UKEQUITY
Economic Division of Investment __
(expressed as a percentage of net assets) .-
Yo
Banks and financial institutions Energy Pharmaceuticals and cosmetics Insurance Mechanics, machinery Aerospace technology Holding companies Public services Miscellaneous Graphic art and publishing News transmission Precious metals Retail trade, department stores Non-ferrous metals Other business houses Tobacco and spirits Construction, building materials Consumer goods Coal mines, heavy industries Package and container industry Electronics and electrical equipment Other services
Other net assets less liabilities
21.42 15.50 8.50 7.51 5.16 5.06 4.50 4.31 3.79 3.44 3.05 2.58 I .93
1.66 0.98 0.94 0.81 0.78 0.64 0.61 0.41
I .a7
4.55
Total Net Assets 100.00
HSBC Global Investment Funds ... - . -_ -.
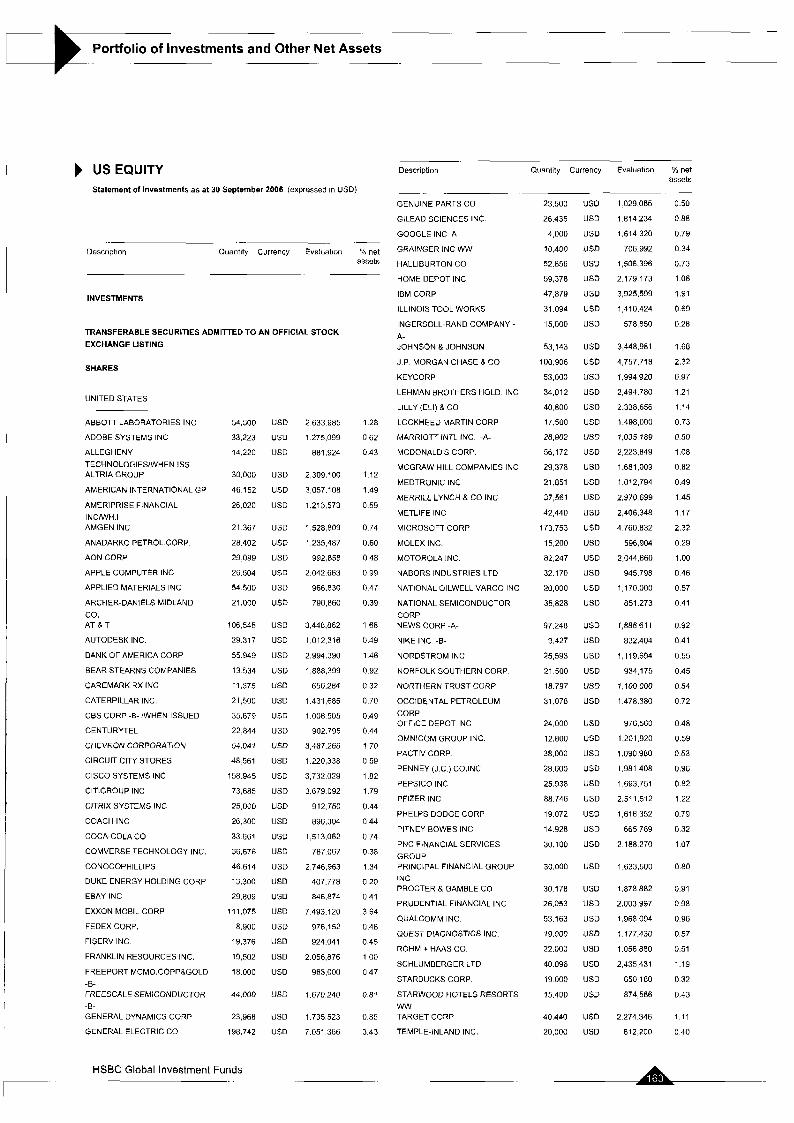
-
Portfolio of Investments and Other Net Assets
USEQUITY Statement of investments as at 30 September 2006 (expressed in USD)
-.
Description Ouantity Currency Evaluation
.-
INVESTMENTS
TRANSFERABLE SECURITIES ADMITTED TO AN OFFICIAL STOCK
EXCHANGE LISTING
SHARES
UNITED STATES
ABBOTT LABORATORIES INC
ADOBE SYSTEMS INC
ALLEGHENY
TECHNOLOGIES/WHEN ISS ALTRIA GROUP
AMERICAN INTERNATIONAL GP
AMERIPRISE FINANCIAL
INCIWH.1 AMGEN INC
ANADARKO PETROL.CORP.
AON CORP
APPLE COMPUTER INC
APPLIED MATERIALS INC
ARCHER-DANIELS MIDLAND
co. AT 8 T
AUTODESK INC.
BANK OF AMERICA CORP
BEAR STEARNS COMPANIES
CAREMARK ?X INC
CATERPILLAR INC.
CBS GORP -B- /WHEN ISSUED
CENTURYTEL
CHEVRON CORPORATION
CIRCUIT CITY STORES
CISCO SYSTEMS INC
ClTlGROUP INC
ClTRlX SYSTEMS INC
COACH INC
COCA-COLA CO
COMVERSE TECHNOLOGY INC.
CONOCOPHILLIPS
DUKE ENERGY HOLDING CORP
EBAY INC
EXXON MOBIL CORP
FEDEX CORP.
FISERV INC
FRANKLIN RESOURCES INC.
FREEPORT MCMO.COPP&GOLD -B- FREESCALE SEMICONDUCTOR
-E- GENERAL DYNAMICS CORP
GENERAL ELECTRIC CO
54,500 USD
33,223 US0
14220 US0
30000 USD
46 152 US0
26.020 US0
21 367 US0
28402 US0
29099 USD
26504 USD
54 500 USD
21.000 US0
106.545 US0
29.317 US0
55949 USD
13534 USD
11,575 US0
21,500 US0
35,679 USD
22844 USD
54.041 USD
48561 US0
158.945 US0
73.685 USD
25000 USD
26.300 USD
33661 USD
36,676 US0
46614 USD
13 300 USD
29.809 US0
111,075 US0
8.900 USD
19,376 USD
19,502 USD
18.000 US0
44000 USD
23,968 USD
198,742 US0
2 633.985
1275,099
881,924
2,309.100
3,057.1 08
1.213.573
1,528,809
1,235,487
992,858
2.042 663
966.830
790,860
3 448.862
1,012,316
2,994.390
1,888,399
650.284
1.431,685
1,006 505
902.795
3 487.266
1220,338
3,732.029
3.679 092
912.750
896,304
1,513,062
787 067
2,746,963
407.778
846.874
7 493.120
976,152
924.041
2 056.876
963,000
1.670 240
1735.523
7.051 366
“YO net assets __
I 28
0.62
0.43
1.12
1 49
0.59
0.74
0.60
0 48
0.99
0.47
0.39
1.68
0.49
1.46
0 92
0 32
0.70
0.49
0.44
1.70
0 59
1.82
1.79
n 44
0 44
0 74
0.38
1.34
0 20
0 41
3 64
0.48
0.45
1 00
0 47
0.81
0.85
3.43
Description Quantity Currency Evaluation YO net
.
GENUINE PARTS CO
GILEAD SCIENCES INC
GOOGLE INC A
GRAINGER INC WW
HALLIBURTON CO
HOME DEPOT INC
IBM CORP
ILLINOIS TOOL WORKS
INGERSOLL-RAND COMPANY -
A- JOHNSON&JOHNSON
J P MORGAN CHASE 8 CO
KEYCORP
LEHMAN BROTHERS HOLD INC
LlLLY (ELI) & CO
LOCKHEED MARTIN CORP
MARRIOTT INTL INC -A-
MCDONALD’S CORP
MCGRAW HILL COMPANIES INC
MEDTRONIC INC
MERRILL LYNCH 8 CO INC
METLIFE INC
MICROSOFT CORP
MOLEX INC
MOTOROLA INC
NABORS INDUSTRIES LTD
NATIONAL OILWELL VARCO INC
NATIONAL SEMICONDUCTOR CORP NEWS CORP -A-
NlKE INC -6-
NORDSTROM INC
NORFOLK SOUTHERN CORP
NORTHERNTRUSTCORP
OCCIDENTAL PETROLEUM
CORP OFFICE DEPOT INC
OMNICOM GROUP INC
PACTIV CORP
PENNEY (J C ) CO INC
PEPSICO INC
PFIZER INC
PHELPS DODGE CORP
PITNEY BOWES INC
PNC FINANCIAL SERVICES
GROUP PRINCIPAL FINANCIAL GROUP INC PROCTER a GAMBLE co PRUDENTIAL FINANCIAL INC
QUALCOMM INC
QUEST DIAGNOSTICS INC
ROHM + HAAS CO
SCHLUMBERGER LTD
STARBUCKS CORP
STARWOOD HOTELS RESORTS
ww TARGET CORP
TEMPLE-INLAND INC
23.500 US0
26435 US0
4000 USD
10,400 USD
52.856 US0
59,378 USD
47,879 US0
31.094 US0
15,000 USD
53,143 US0
100.906 US0
53,000 USD
34,012 USD
40.800 USD
17.500 US0
26,902 USD
56,172 US0
29.378 US0 21.851 US0
37,561 USD
42,440 USD
173.753 US0
15,200 US0
82247 USD
32.170 USD
20,000 US0
35,828 US0
97,248 USD
9.427 USD
25,593 USD
21 500 USD
18.797 USD 31.078 USD
24.000 US0
12,800 US0
38.000 US0
28.600 USD
25.938 USD
88.746 USD
19072 US0
14.928 USD
30.100 USD
30.000 USD
30 178 US0
26.053 USD
53,163 USD
19.000 USD
22.000 US0
40096 US0
19000 USD
15.400 USD
40.440 US0
20,000 USD
1.029.065
1.814,234
1.614 320
706.992
1,506,396
2,179.173
3,925,599
1410.424
578,850
3,448,981
4 757,718
1,994,920
2,494.780
2.338.656
1.498,OOO
1,035,189
2 223,849
1.681.009
1.012.794
2,970 699
2,406,348
4 760.832
596,904
2,044,660
945.798
1 170.000
851 273
1,886611
832.404
1,119.694
934 175
1,100 000
1.478.380
976.560
1,201.920
1.090,980
1.981 408
1 693.751
2.51 1.512
1,616 352
665 789
2 188.270
1.633,500
1.878 882
2,003,997
1.968 094
1 177.430
1.056,880
2,435,431
650 180
874 566
2 274.346
812,200
assets
0.50
0.88
0.79
0.34
0.73
1.06
1.91
0.69
0.28
1.68
2.32
0.97
121
1.14
0.73
0.50
1.08
0.82
0.49
1.45
1 1 7
2.32
0.29
1 .oo 0 46
0.57
0.41
0.92
0 41
0.55
0.45
0.54
0 72
0.48
0.59
0.53
0.96
0.82
1.22
0.79
0.32
1 07
0.80
0.91
0.98
0.96
0.57
0.51
1.19
0.32
0.43
1.11
0 40
-
HSBC Global Investment Funds

-
Portfolio of Investments and Other Net Assets -
__ Description
TEXAS INSTRUMENTS INC
TIME WARNER INC
TRANSOCEAN INC
UNITED HEALTH GROUP INC
UNITED TECHNOLOGIES CORP
UNlVlSlON COMMUNICAT INC
VALERO ENER CORP’WH ISSUED VERIZON COMMUNICATIONS
INC WACHOVIA CORP
WAL- MART STORES INC
WALT DISNEY !DISNEY SER
WASTE MANAGEMENT INC
WELLPOINT INC
WYETH
3M CO
Quantity Currency Evaluation % net assets
.
49215
137.755
25,000
30.815
37 876
29,000
22,820
.~
US0
USD
US0
US0
USD
USD
US0
1,667.896 0 81
2.507 141 1.22
1,799,000 0 88
1,524.110 0 74
2,411.186 1 1 7
996440 0.49
1.170210 0 5 7
71.297 USD 2 633,711 1.28
56.837 USD
35.726 US0
56.500 US0
20,800 USD
23086 USD
47.095 US0
26.266 USD -
3,162,411
1,779.512
1.747.545
773,760
1,768.849
2,367,466
1,959,444
194,672.829
1 54
0 07
0 85
0 38
0 86
1 1 5
0 95
94 78
TOTAL SHARES 194.672,a29 94-78
TOTAL TRANSFERABLE SECURITIES ADMITTED TO
AN OFFICIAL STOCK EXCHANGE LISTING 194,872,829 94.78
TOTAL INVESTMENTS 194,672,829 94.78
OTHER NET ASSETS LESS LIABILITIES 10.712.053 5.22
TOTAL NET ASSETS 205.384.882 100.00
HSBC Global Investment Funds ~. . .- -. .

..
Portfolio of Investments and Other Net Assets - ..
.. USEQUITY
Economic Division of Investment
(expressed as a percentage of net assets) .~ __ ..
%
Holding companies Energy Pharmaceuticals and cosmetics News transmission Banks and financial institutions Retail trade. department stores Internet Software Office equipment and computers Insurance Aerospace technology Graphic art and publishing Electronics and electrical equipment Gastronomy Food Chemicals Mechanics, machinery Healthcare, education and social services Tobacco and spirits Transport Package and container industry Miscellaneous Consumer goods Biotechnology Textile Non-ferrous metals Other services Automobile industry Precious metals Public services
Other net assets less liabilities
15.81 9.36 8.27 7.53 7.16 6.03 5.1 1 5.04 3.94 2.75 2.63 2.32 2.33 1.95 1.85 1.67 1.60 1.12 0.93 0.93 0.92 0.91 0.88 0.85 0.79 0.75 0.50 0.47 0.38
5.22
100.00 Total Net Assets
HSBC Global Investment Funds A- .-
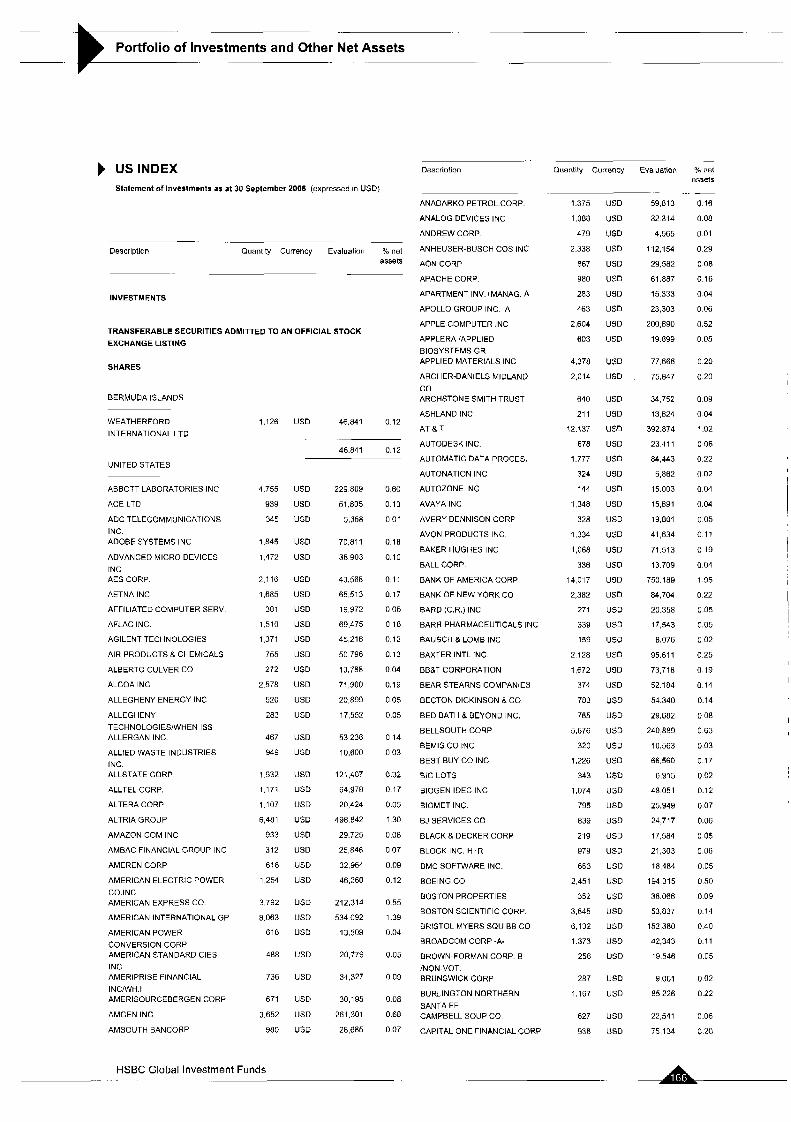
-
Portfolio of Investments and Other Net Assets -.
USINDEX Statement of Investments as at 30 September 2006 (expressed In USD)
~
Description Quantity Currency Evaluatian % net assets
INVESTMENTS
TRANSFERABLE SECURITIES ADMITTED TO AN OFFICIAL STOCK EXCHANGE LISTING
SHARES
BERMUDA ISLANDS
WEATHERFORD
INTERNATIONAL LTD
UNITED STATES
ABBOTT LABORATORIES INC
ACE LTD
ADC TELECOMMUNICATIONS INC ADOBE SYSTEMS INC
ADVANCED MICRO DEVICES
INC AES CORP
AETNA INC
AFFILIATED COMPUTER SERV.
AFLAC INC.
AGILENT TECHNOLOGIES
AIR PRODUCTS & CHEMICALS
ALBERT0 CULVER CO
ALCOA INC
ALLEGHENY ENERGY INC
ALLEGHENY
TECHNOLOGlESlWHEN ISS ALLERGAN INC.
ALLIED WASTE INDUSTRIES INC. ALLSTATE CORP
ALLTEL CORP.
ALTERA CORP
ALTRIA GROUP
AMAZON COM INC
AMBAC FINANCIAL GROUP INC
AMERENCORP
AMERICAN ELECTRIC POWER
CO.INC AMERICAN EXPRESS CO.
AMERICAN INTERNATIONAL GP
AMERICAN POWER
CONVERSION CORP AMERICAN STANDARD ClES
INC AMERIPRISE FINANCIAL
INCIWH.1 AMERISOURCEBERGENCORP
AMGEN INC
AMSOUTHBANCORP
1.126
4.755
939
345
1,845
1472
2,116
1,685
381
1510
1.371
755
272
2 578
520
283
467
949
1 932
1.171
1.107
6,481
933
312
618
1,254
3.792
8.063
618
488
736
671
3.652
980
US0
-
USD
US0
US0
USD
USD
US0
USD
US0
US0
USD
USD
USD
USD
US0
US0
US0
US0
USD
USD
USD
US0
US0
US0
USD
US0
US0
USD
USD
US0
US0
USD
USD
USD
46.841 0 12
46.841 0.12
229 809
51.805
5,358
70.81 1
36 903
43.568
65.513
19,972
69.475
45 216
50 796
13.788
71,900
20 899
17,552
53 238
10,600
121,407
64,979
20,424
498 a42
29.725
25,846
32 964
46.260
212,314
534 092
13,509
20,779
34.327
30,195
261.301
28 685
0.60
0 13
0 01
0.18
0.10
0.1 1
0.17
0.05
0 18
0.12
0.13
0.04
0.19
0 05
0.05
0 14
0 03
0.32 0.17
0.05
1.30
0.08
0.07
0 09
0 12
0 55
1.39
0.04
0.05
0.09
0 08
0 68
0.07
Description Quantity Currency
ANADARKO PETROL CORP
ANALOG DEVICES INC
ANDREW CORP
ANHEUSER-BUSCH COS INC
AON CORP
APACHE CORP
APARTMENT INV +MANAG A
APOLLO GROUP INC A
APPLE COMPUTER INC
APPLERA /APPLIED
BIOSYSTEMS GR APPLIED MATERIALS INC
ARCHER-DANIELS MIDLAND
co ARCHSTONE SMITH TRUST
ASHLAND INC
A T & T
AUTODESK INC
AUTOMATIC DATA PROCES
AUTONATION INC
AUTOZONE INC
AVAYA INC
AVERY DENNISON CORP
AVON PRODUCTS INC
BAKER HUGHES INC
BALL CORP
BANK OF AMERICA CORP
BANK OF NEW YORK CO
BARD (C R.) INC
BARR PHARMACEUTICALS INC
EAUSCH & LOME INC
BAXTER INTL INC
BBRT CORPORATION
BEAR STEARNS COMPANIES
BECTON DICKINSON R CO
BED BATH & BEYOND INC
BELLSOUTH CORP
BEMlS CO INC
BEST BUY CO INC
BIG LOTS
BIOGEN IDEC INC
BIOMET INC
BJ SERVICES CO
BLACK R DECKER CORP
BLOCK INC H+R
BMC SOFTWARE INC.
BOEING CO
BOSTON PROPERTIES
BOSTON SCIENTIFIC CORP
BRISTOL MYERS SQUIBB CO
BROADCOM CORP -A-
BROWN-FORMAN CORP a /NON-VOT BRUNSWICK CORP
BURLINGTON NORTHERN
SANTA FE CAMPBELL SOUP CO
CAPITAL ONE FINANCIAL CORP
1.375 USD
1,088 US0
479 USD
2.338 USD
867 US0
980 US0
283 USD
463 USD
2,604 USD
603 USD
4,378 USD
2,014 US0
640 USD
211 USD
12,137 US0
678 US0
1.777 US0
324 USD
144 USD
1,348 USD
328 US0
1,334 USD
1,068 USD
336 US0
14,017 USD
2,382 USD
271 USD
339 US0
159 US0
2 128 US0
1,672 USD
374 US0
783 USD
765 USD
5,676 USD
320 USD
1,226 US0
343 USD
1,074 USD
795 US0
839 USD
219 USD
979 USD
663 USD
2,451 US0
352 US0
3,645 USD
6,132 US0
1.373 USD
256 USD
287 USD
1,167 US0
627 US0
938 US0
Eva uation
- .-
59.813
32 314
4,565
112,154
29.582
61.887
15 333
23,303
200 690
19 899
77.666
75.847
34,752
13 624
392.874
23 41 1
84,443
6,862
15.003
15,691
ig,aoi
41,634
71.513
13.709
750.189
84,704
20.358
17,543
8.076
95.61 1
73.718
52.184
51.340
29,682
240 aag
10.563
66.560
6,915
48.051
25.949
24,717
17.584
21,303
18,484
194 315
36.066
53 837
152,380
42,343
19.5A6
9,061
a5 226
22 $41
75,134
...
- Oh net
assets
0.16
0.08
0.01
0.29
0.08
0.16
0.04
0.06
0.52
0 05
0 20
0.20
0.09
0.04
1.02
0 06
0.22
0.02
0.04
0.04
0.05
0 11
0 19
0.04
1.95
0.22
0.05
0.05
0 02
0.25
0.19
0.14
0.14
-
o oa 0 63
0.03
0 17
0 02
0.12
0.07
0.06
0 05
0 06
0.05
0 50
0.09
0.14
0.40
0.1 1
0.05
0 02
0 22
0.06
0 20
HSBC Global Investment Funds --

..-
Portfolio of Investments and Other Net Assets ...
..
Doscription Quantity Currency Evaluation % net assets
CARDINAL HEALTH INC
CAREMARK RX INC
CARNIVAL CORP
CATERPILL4R INC
CBS CORP -B- !WHEN ISSUED
CENTERPOINT ENERGY INC
CENTEX CORP
CENTURYT:L
CHARLES SCHWA6 CORP
CHESAPEAKEENERGY
CHEVRON CORPORATION
CHICAGO MERCANTILE
EX HLDGS-4- CHUBB CORP
CIENA CORP
ClGNA CORP
CINCINNATI FINANCIAL CORP
CINTAS
CIRCUIT CITY STORES
CISCO SYSTEMS INC
CIT GROUP INC
ClTlGROUP INC
CITIZENS COMMUNICATIONS
GO ClTRlX SYSTEMS INC
CLEAR CHANNEL COMMUNICATIONS CLOROX CO
CMS ENERGY CORP
COACH INC
COCA COLA ENTERPRISE
COCA-COLA CO
COLGATE-PALMOLIVE CO
COMCAST GORP,-A-
COMERICA INC
COMMERCE BANCORP
COMPASS BANCSHARES INC
COMPUTER ASSOCIATES INTL
INC COMPUTER SCIENCES CORP
COMPUWAqE CORP
COMVERSE TECHNOLOGY INC
CONAGRA -0ODS INC
CONOCOPHILLIPS
CONSOL ENERGY INC
CONSOLIDATED EDISON INC
CONSTELLATION BRAND -A-
CONSTELL4TION ENERGY
GROUP INC CONVERGYS CORP
COOPER INDUSTRIES LTD -A-
CORNING INC
COSTCO KHOLESALE CORP
COUNTRYWIDE FINANCIAL
CORP COVENTRY HEALTH CARE INC
CSX CORP
CUMMINS INC
CVS CORPORATION
1,265
1,352
1.403
2,075
2,304
915
337
353 3.098
1167
6 793
110
1.364
242
324
526
437
479
18.956
580
15.31 1
1175
468
1,464
479
697
1,148
964
6.339
1,543
6,545
529
565
377
1517
599
1,152
584
1612
5 168
565
734
622
500
426
283
4,649
1.450
1.886
480
1 348
1 32
2 430
USD
USD
US0
US0
US0
US0
USD
USD
USD
US0
US0
USD
USD
USD
USD
USD
USD
US0
USD
USD
USD
USD
USD
USD
USD
US0
USD
US0
USD
US0
US0
US0
USD
USD
USD
USD
USD
US0
US0
US0
US0
US0
US0
USD
USD
USD
USD
USD
USD
USD
USD
US0
US0
83 439
75.955
65 843
138.174
64,996
13.149
18.026
13,951
55 299
33 866
438.351
52,437
71,678
37 782
fi,4116
25 458
17.943
12.037
445,086
28,983
764 477
16 462
17,087
42.339
30 474
10 100
39.124
20,148
284,938
Y6.546
239,612
30,587
20.752
21,704
36 100
29,411
8,916
12 533
39 558
304.550
17 a60
34.278
17.945
29.8311
8.886
24.007
114,970
72.602
65 a03
24 312
44 053
15 895
78.440
0 22
0 20
0 17
I1 36
0 17
0 01
0 05
0 04
0 14
0 09
114
0 14
0 19
0 02
0 10
0 07
0 05
0 03
116
0 08
1 98
0.04
0 04
0 11
0 08
0 03
0 10
0 05
0 74 0 25
0 62
0 08
0 05
0 06
0 09
0.08
0 02
0 03
0 10
0 79
0 05
0 09
0 05
0 08
0 02
0 06
0 311
0 19
0 17
0 06
0 11
0 04
0 20
...
Description Quantily Currency
~.
DANAHER CORP
DARDEN RESTAURANTS
DEAN FOODS CO
DEERE & CO
DELL INC
DEVON ENERGY CORP (NEW)
DILLARDS INC A
DOLLAR GENERAL CORP
DOMINION RESOURCES INC
OONNELLEY AND SONS RR
DOVER CORP
DOW CHEMICAL CO
DOW JONES + CO INC
DR HORTON INC
DTE ENERGY COMPANY
DU FONT (E I ) D E NEMOURS
DUKE ENERGY HOLDING CORP
DYNEGYINC A
E TRADE FINANCIAL CORP
EASTMAN CHEMICAL CO
EASTMAN KODAK CO
EATON CORP
EBAY INC
ECOLAB INC
EDISON INTERNATIONAL
EL PAS0 ENERGY CORP
ELECTRONIC ARTS
ELECTRONIC DATA SYSTEMS
EMBARO CORP
EMC CORP
EMERSON ELECTRIC CO
ENTERGY CORP
EOGRESOURCESINC
EQUIFAX INC
EOUITY OFF PROPERTIES TRT
EQUITY RESIDENTIAL SEI
ESTEE LAUDER COS A
E W SCRIPPS CO A
EXELON CORP
EXPRESS SCRIPTS INC - A -
EXXON MOBIL CORP
FAMILY DOLLAR STORES INC
FANNIE MAE
FEDERATED
DEPARTM STORES FEDERATED INVESTORS INC
B FEDEX CORP
FIFTH THIRD BANCORP
FIRST DATA CORP
FIRST HORIZON NATL CORP
FIRSTENERGY CORP
FISERV INC
FISHER SCIENTIFIC INTL
FLUOR CORP (NEW)
FORD MOTOR CO
FOREST LABORATORIES
750 US0
433 US0
377 USD
676 USD
7.086 USD
1.403 USD
249 US0
817 US0
1.120 USD
652 USD
607 USD
2.925 USD
113 US0
904 USD
520 US0
2.788 US0
3,768 USD
1,000 USD
1.374 USD
234 USD
930 US0
433 US0
3.505 USD
580 US0
1021 US0
2,172 US0
942 US0
1.496 USD
465 USD
7 183 USD
1223 USD
640 US0
751 US0
407 US0
1,oaa USD
956 US0
383 US0
264 US0
2,086 US0
460 USD
18439 USD
501 USD
3,026 USD
1.607 USD
255 USD
950 USD
1,679 US0
2,252 US0
369 US0
1021 US0
536 US0
301 USD
249 US0
5.888 USD
990 US0
Evaluation net assets
51 345
18,662
15,906
162 a36
57,311
86,565
B 327
1 1 307
86.442
21,516
29 057
114,660
3 a22
22,238
21 700
120,916
115,527
5.580
32.729
12,730
21.120
30 431
99.577
25 068
43,454
30.082
52,592
36,637
22.539
85,262
102,781
50.893
48,365
14,998
43411
48 202
15661
12,619
127,872
I 243 a94
34,725
14.284
167217
73,131
8,645
104,196
64,692
94 089
14.446
57,717
25.562
29,897
19 457
48 046
49,936
0.13
n 05
0.04
0 15
0.42
0 22
0 02
0.03
0.22
0.06
0.08
0 30
0 01
0.06
0.06
0.31
0.30
0.01
0.08
0 03
0.05
0.08
0.26
0 07
0 11
0.08
0.14
0.10
0.06
0 22 0.27
0.13
0.13
0.04
0.11
0.13
0.04
0.03
0.33
0.09
3.24
0.04
0.43
I1 19
0 02
0.27
0 17
0 24
0.04
0.15
0 07 0.08
0.05
0.12
0.13
HSBC Global Investment Funds --L
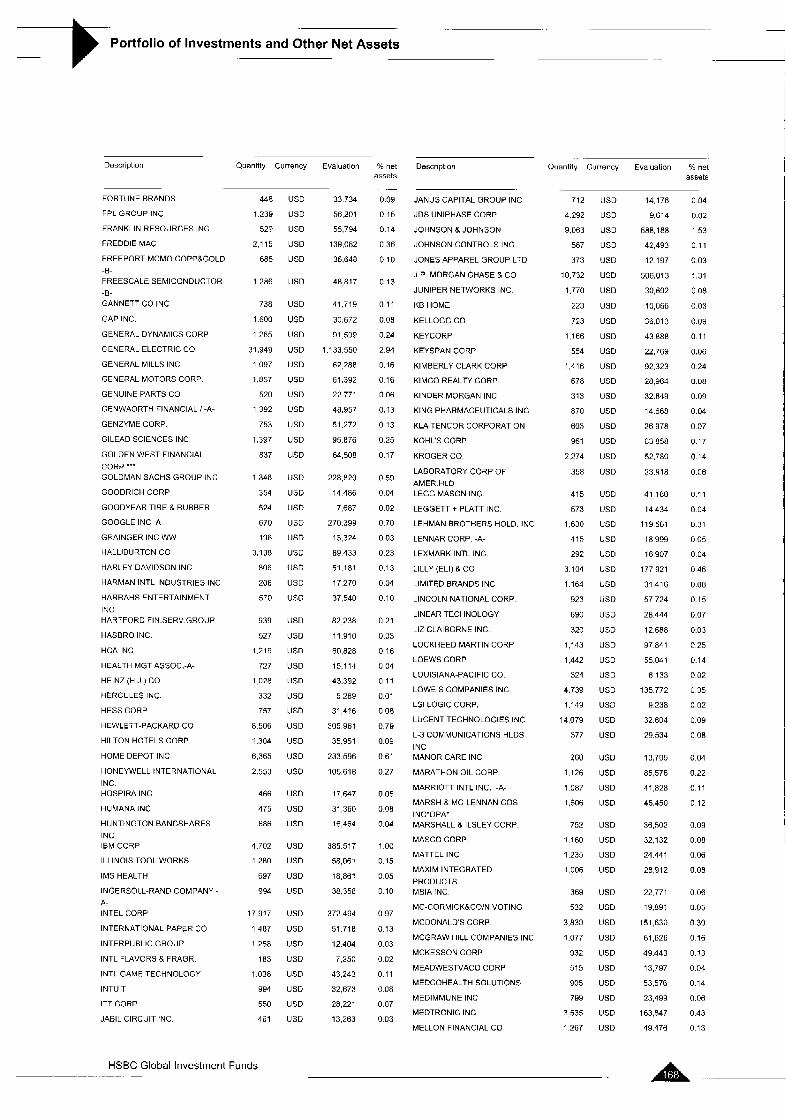
-
Portfolio of Investments and Other Net Assets ..
. .
Quantity Currency Evaluation "/, net Description Ouantity Currency Evaluation YO net assets assets
Description
FORTUNE BRANDS
FPL GROUP INC
FRANKLIN RESOURCES INC
FREDDIE MAC
FREEPORT MCMO COPP&GOLD
-8- FREESCALE SEMICONOUCTOR
-B- GANNETT CO INC
GAP INC
GENERAL DYNAMICS CORP
GENERAL ELECTRIC CO
GENERAL MILLS INC
GENERAL MOTORS CORP
GENUlhE PARTS CO
GENWAORTH FINANCIAL I -A-
GENZYME CORP
GILEAD SCIENCES INC
GOLDEN WEST FINANCIAL
CORP *.* GOLDMAN SACHS GROUP INC
GOODRICH CORP
GOODYEAR TIRE a RUBBER
GOOGLE INC A
GRAINGER INC WW
HALLIBURTON CO
HARLEY DAVIDSON INC
HARMAN INTL INDUSTRIES INC
HARRAHS ENTERTAINMENT
INC HARTFORD FIN SERV GROUP
HASBRO INC
HCA INC
HEALTH MGT ASSOC -A-
HEINZ (H J ) CO
HERCULES INC
HESS CORP
HEWLETT-PACKARD CO
HILTON HOTELS CORP
HOME DEPOT INC
HONEYWELL INTERNATIONAL
INC HOSPIRA INC
HUMANA INC
HUNTINGTON BANCSHARES
INC IBM CORP
ILLINOIS TOOL WORKS
IMS HEALTH
INGERSOLL-RAND COMPANY - A- INTEL CORP
INTERNATIONAL PAPER CO
INTERPUBLIC GROUP
INTL FLAVORS 8 FRAGR
INTL GAME TECHNOLOGY
INTUIT
ITT CORP
JABIL CIRCUIT INC
448 US0
1239 US0
529 USD
2115 US0
685 USD
1286 USD
738 USD
1600 US0
1265 US0
31,949 USD
1097 USD
1.857 US0 520 USD
1392 USD
753 US0
1397 USD
837 US0
1346 USD
354 USD
524 USD
670 USD
196 USD
3,138 USD
806 US0
208 US0
570 US0
939 USD
527 USD
1.219 US0
727 USD
1 (128 US0
332 USD
757 USD
8.506 US0
1.304 US0
6,365 USD
2553 us0
466 US0
475 USD
686 us0
4.702 USD
1280 USD
697 USD
994 USD
17917 USD
1,487 US0
1.258 USD
183 US0
1038 US0
994 US0
550 US0
461 US0
33 734
56,201
55.794
139,082
36.648
48.817
41,719
30,672
91 5Y9
1 .I 33.550 62 288
61,392
22.771
48,957
51.272
95.876
64,508
228,820
14 486
7,687
270.399
13,324
89 433
51.181
17 270
37,540
82 238
11,910
60.828
15,114
43.392
5 289
31,416
305 961
35.951
233.596
105,618
17,647
31,360
16,464
385.517
58,061
18 861
38.358
372.494
51.718
12.404
7,250
43.243
32,673
28.221
13,263
0.09
0.15
0.14
0.36
0 10
0 13
0.1 1
0.08
0.24
2.94
0.16
0 16
0 06
0.13
0.13
0.25
0.17
0 59
0 04
0 02
0 70
0 03
0 23
0.13
0.04
0.10
0 21
0.03
0.16
0 04
0.11
0.01
0.08
0.7Y
0.09
0.61
0.27
0.05
0.08
0.04
1 00
0.15
0 05
0 10
0.97
0.13
0.03
0.02
0.11
0.U8
0.07
0.03
JANUS CAPITAL GROUP INC
JDS UNIPHASE CORP
JOHNSON 8 JOHNSON
JOHNSON CONTROLS INC
JONES APPAREL GROUP LTD
J P MORGAN CHASE 8 CO
JUNIPER NETWORKS INC
KB HOME
KELLOGG CO
KEYCORP
KEYSPAN CORP
KIMBERLY CLARK CORP
KIMCO REALTY C O W
KINDER MORGAN INC
KING PHARMACEUTICALS INC
KLA TENCOR CORPORATION
KOHL'S CORP
KROGER CO
LABORATORY CORP OF AMER HLD LEGG MASON INC
LEGGETT + PLATT INC
LEHMAN BROTHERS HOLD. INC
LENNAR CORP -A-
LEXMARK INTL INC
LlLLY (ELI) 8 CO
LIMITED BRANDS INC
LINCOLN NATIONAL CORP
LINEAR TECHNOLOGY
LIZ CLAIBORNE INC
LOCKHEED MARTIN CORP
LOEWS CORP
LOUISIANA-PACIFIC CO
LOWE S COMPANIES INC
LSI LOGIC CORP.
LUCENT TECHNOLOGIES INC
L-3 COMMUNICATIONS HLDS
INC MANOR CARE INC
MARATHON OIL CORP
MARRIOTT INTL INC. -A-
MARSH a MC-LENNAN cos INTOPA' MARSHALL 8 ILSLEY CORP
MASCO CORP
MATTEL INC
MAXIM INTEGRATED
PRODUCTS MBlA INC
MC-CORMICKLCO!N VOTING
MCDONALDS CORP
MCGRAW HILL COMPANIES INC
MCKESSON CORP
MEADWESTVACO CORP
MEDCOHEALTH SOLUTIONS
MEDIMMUNE INC
MEDTRONIC INC
MELLON FINANCIAL CO
712 USD
4292 USD
9.063 USD
587 US0
373 US0
10.732 US0
1.770 USD
223 USD
723 USD
1,166 USD
554 USD
1,416 US0
678 US0
313 US0
870 USD
603 US0
961 USD
2.274 USD
358 USD
415 USD
573 US0
1.630 US0
415 US0
292 US0
3.104 US0
1164 US0
923 USD
890 USD
320 US0
1,143 USD
1.442 USD
324 USD
4.739 US0
1.149 US0
14,079 US0
377 US0
260 US0
1.126 US0
1087 USD
1,606 USD
752 USD
1.160 USD
1,235 USD
1,006 USD
369 US0
532 US0
3,833 US0
1.077 USD
932 US0
515 US0
905 USD
799 USD
3535 USD
1267 USD
14.176
9,614
588,188
42,493
12 197
506,013
30,692
10,066
36 013
43 888
22,769
92,323
28,964
32.849
14 668
26 978
63 858
52.780
23.918
41 180
14 434
119561
18.999
16 907
177921
31 416
57 724
28 444
12 688
97 841
55 041
6 133
135 772
9 238
32 804
29.534
13,705
85,576
41 828
45.450
36,502
32.132
24.441
28,912
22.771
19 891
151,630
61,626
49 443
13,797
53.576
23,499
163,847
49 476
0.04
0.02
153
0 1 1
0.03
1.31
0 08 0.03
0.0Y 0.11
0.06
0 24
0 08
0.09
0.04
0.07
0.17
0.14
0.06
0.1 1
0.04
0 31
0 05
0 04
0 46
0 08
0.15
0.07
0.03
0.25
0.14
0.02
0 35
0 02
0.09
0.08
0.04
0.22
0.11
0.12
0.09
0.08
0.06
0.08
0 06
0.05
0 39 0 16
0.13
0.04
0.14
0.06
0.43
0.13
HSBC Global Investment Funds ~~ . . - A ...

Portfolio of Investments and Other Net Assets --- :-
Description Quantity Currency Evaluation YO net assets
Onscription Quantity Currency Evaluation % net assets
MERCK 8 CO INC
MEREDITH CORP
MERRILL LYNCH a co INC
METLIFE INC
MGlC INVES-MENT CORP
MICRON TECHNOLOGY INC
MICROSOFT CORP
MILLIPORE CORP
MOLEX INC
MOLSON COORS BREW -6- INON-VOT MONSANTO CO
MONSTER WORLDWIDE INC
MOODY S CORP I WHEN
ISSUED MORGAN STANLEY
MOTOROLA NC
M8T BANK CORPORATION
MURPHY OIL CORP
MYLAN LABORATORIES INC
NABORS INDUSTRIES LTD
NATIONAL CITY CORP
NATIONAL OILWELL VARCO INC
NATIONAL SEMICONDUCTOR
CORP NAVISTAR lhTL CORP
NCR CORP
NETWORK APPLIANCE CORP
NEW YORK TIMES -A-
NEWELL RUBBERMAID INC
NEWMONT MINING CORP
NEWS CORP -A-
NICOR INC
NlKE INC -6-
NISOURCE INC
NOBLE CORP
NORDSTROM INC
NORFOLK SOUTHERN CORP
NORTH FOR<
BANCORPORATION INC NORTHERN TRUST CORP
NORTHROP GRUMMAN CORP
NOVELL INC
NOVELLUS SYSTEMS INC
NUCOR CORP
NVlDlA CORP
OCCIDENTA, PETROLEUM
CORP OFFICE DEPOT INC
OFFICEMAX INC
OMNICOM GROUP INC
ORACLE CO3P
PACCAR INC
PACTIV CORP
PALL CORP
PARAMETRIC TECHNOLOGY
CORP PARKER-HANNIFIN
PATTERSON COMPANIES INC
6.766
151
2.746
2,349
294
2.199
26,660
147
490
189
1,640
354
731
3,350
7.682
256
590
520
Yfi4
1 822
527
1 022
zon 558
1,126
437
870
1353
7.435
132
560
734
400
704
1257
1,407
543
1,076
1,152
336
949
1.145
2 600
834
264
52 0
12 577
734
448
373
321
392
420
US0
USD
US0
USD
USD
USD
US0
USD
US0
US0
US0
US0
USD
USD
USD
US0
US0
US0
US0
US0
USD
USD
US0
US0
US0
US0
US0
US0
USD
USD
USD
USD
USD
US0
USD
US0
US0
US0
US0
US0
USD
USD
USD
USD
USD
US0
US0
US0
US0
USD
US0
US0
USD
284 578
217, in i
7.476
133 188
17 672
38,351
730,483
9.099
19.242
12,901
78 310
1 2 , ~
46 031
244,in2
190,975
30,925
28 243
10.478
28.342
67,232
30.830
24.283
5 437
21 734
42,191
9 955
25,023
58.625
144,239
5 710
49.448
1 ~ 6 9
30,noo
25.292
54.617
40,634
31.776
73.394
7 062
9.400
47 051
33 858
123.682
33 935
i o , m
48 828
226.260
41,985
12.n62
11.522
5610
30 799
13.994
0.7.1
n 02
0.56
0.35
0.05
0.10
1.90
0 02
0 05
0.03
0.20
0.03
0 12
0.63
0.50
0 08
0 07
0 03
0 07
0.17
0.08
0.06
0.01
0 06
(1 11
0 03
0.06
0.15
0.37
0.01
0.13
0.04
0 07
0.08
0.14
0.11
0.08
0 19
0.02
0.02
0.12
0.09
0.32
0 09
0.03
0.13
0 59
0 11
(1 03
0 03
0.01
0.08
0 04
PAYCHEX INC
PENNEY (J C ) CO INC
PEOPLES ENERGY CORP
PEPS1 BOTTLING GROUP INC
PEPSICO INC
PERKINELMER INC
PFIZER INC
PGaE CORP (HOLDING CO)
PHELPS DODGE CORP
PINNACLE WEST CAP CORP
PITNEY BOWES INC
PLUM CREEK TIMBER CO INC
PMC-SIERRA INC
PNC FINANCIAL SERVICES
GROUP PPG INDUSTRIES INC
PPL CORP
PRAXAIR
PRINCIPAL FINANCIAL GROUP
INC PROCTER & GAMBLE CO
PROGRESS ENERGY INC
PROGRESSIVE CORP
PROLOGIS’SHS OF BENEF INT
PRUDENTIAL FINANCIAL INC
PUBLIC STORAGE INC
PUBL SERV ENTERPRISE
PULTE HOMES INC
a LOGIC CORP
QUALCOMM INC
QUEST DIAGNOSTICS INC
QWEST COMMUNICATIONS
INTL RADIOSHACK CORP
RAYTHEON COMPANY
REALOGY CORP
REGIONS FINANCIAL CORP
REYNOLDS AMERICAN INC
ROBERT HALF INTL INC
ROCKWELL AUTOMATION
ROCKWELL COLLINS
ROHM + HAAS CO
ROWAN COMPANIES INC
RYDER SYSTEM INC
SABRE HOLDINGS CORP
SAFECO CORP
SAFEWAY INC
SANDISK CORP
SANMINA-SCI CORP
SARA LEE CORP
SCHERING-PLOUGH CORP
SCHLUMBERGER LTD
SEALED AIR CORP (NEW)
SEARS HOLDINGS CORP
SEMPRA ENERGY
SHERWIN-WILLIAMS CO
SIGMA-ALDRICH CORP
957 USD
689 USD
113 USD
456 US0
5,150 US0
381 US0
22.528 USD
1039 USD
618 US0
272 USD
665 USD
584 US0
527 US0
896 US0
475 USD
1,205 USD
1.006 USD
a78 USD
9.815 US0
870 US0
2379 US0
701 USD
1,455 USD
404 USD
841 USD
678 USD
550 USD
5.166 US0
479 USD
4,767 US0
475 USD
1,329 USD
786 USD
1,416 USD
544 USD
512 USD
512 USD
565 USD
463 US0
317 US0
192 US0
411 US0
439 US0
1.284 US0
565 US0
1.551 USD
2,289 US0
4,590 USD
3.684 USD
249 US0
283 USD
a i 4 USD
369 US0
208 USD
35.687
47.734
4 577
16 247
336 295
7.228
637 541
43,742
52.376
12,430
29.659
20,084
3 188
65,139
32.343
40 114
59 978
47.807
61 1,081
39 489
59 475
39.908
111 919
34 724
51,831
22.272
10,357
191,245
29,6n4
41.616
9,096
63.765
18.275
52.548
34.141
17 608
29,420
30 866
22 243
9.881
i o , z i n
9,622
25 875
39.393
29.973
5,692
36 693
99,878
223 766
13,533
45.388
41.311
20.856
15 852
0.0y
0.12
0 01
0 04
0.87
0.02
1.66
0.1 1
0.14
n 03
0.08
0.05
0.01
0.17
0.08
0 10
0.16
0.12
1 59
0.10
0.15
0.10
0.29
0.09
0.13
0.06
0.03
0.50
0 08
0.1 1
0.02
0.17
0.05
0.14
0.09
0.05
0.08
0.08
0 06
0.03
0.03
0.02
0.07
0.10
0.08
0.01
0.10
0.26
0.58
0.04
0.12
0.11
0 05
0.04
HSBC Global Investment Funds

Portfolio of Investments and Other Net Assets = Description Quantity Currency Evaluation
SIMON PROPERTYlPAlRED SHS
SLM CORP
SNAP-ON INC
SOLECTRON CORP
SOUTHERNCO
SOUTHWEST AIRLINES CO
SOVEREIGN BANCORP INC
SPRINT NEXTEL CORPiFON
SER 1 ST JUDE MEDICAL INC
STANLEY WORKS
STAPLES INC
STARBUCKS CORP
STARWOOD HOTELS RESORTS
ww STATE STREET CORP
ST PAUL TRAVELERS COMP
STRYKER CORP
SUN MICROSYSTEMS
SUNOCO INC
SUNTRUST BANKS INC
SUPERVALU INC
SYMANTEC CORP
SYMBOL TECHNOLOGIES INC
SYNOVUS FINANCIAL CORP
SYSCO CORP
T ROWE PRICE GROUP INC
TARGET CORP
TECO ENERGY INC
TEKTRONIX INC
TELLAES INC
TEMPLE-INLAND INC
TENET HEALTHCARE CORP
TERADYNE INC
TEXAS INSTRUMENTS INC
TEXTRON INC
THEHERSEYCO
THERMO-ELECTRON CORP
TIFFANY 8 CO
TIME WARNER INC
TJX COS INC
TORCHMARK CORP
TRANSOCEAN INC
TRIBUNE CO
TRONOX INC I-8-WHEN ISSUED
TXU
TYCO INTL LTD (NEW)
TYSON FOODS INC -A-
UNION PACIFIC CORP
UNlSYS CORP
UNITED HEALTH GROUP INC
UNITED STATES STEEL
UNITED TECHNOLOGIES CORP
UNlVlSlON COMMUNICAT INC
UNUMPROVIDENT CORP.
US BANCORP
UST INC
659 US0
1,243 US0
174 US0
2.865 US0
2.236 US0
2.277 US0
1,194 US0
9233 US0
1,099 USD
245 USD
2219 USD
2,259 USD
647 USD
1.039 US0
2,101 USD
853 USD
11,025 US0
415 USD
1,091 USD
599 USD
3033 USD
712 US0
998 US0
1,904 US0
761 US0
2,658 US0
591 USD
275 USD
1502 USD
369 USD
1,389 USD
580 USD
4698 US0
372 US0
546 US0
486 US0
437 US0
12,581 USD
1475 USD
328 US0
994 US0
629 USD
1 USD
1.418 USD
6398 USD
623 USD
810 US0
998 US0
4.219 US0
459 US0
3151 US0
773 US0
1.085 USD
5.618 US0
494 US0
59,455
64.61 1
7.668
9 053
77.433
37 889
25.755
154,099
39.015
12,196
54.942
77,303
36,743
64.948
98.915
42,326
54 905
25.776
84.803
17.778
64,694
10,538
29,471
63,765
36 300
149.486
9.267
8,052
16,717
14 985
11,168
7.917
159,215
32 182
29 080
19.168
14.666
228,974
42,229
20 802
71.528
20.487
13
89.802
178.760
10 024
70,891
5 539
208 672
26.209
200.593
26,560
21 266
187,079
26,720
% net assets
0.1s
0 17
0 02
0.02
0 20
0.10
0.07
0.40
0.10
0.03
0 14
0.20
0 10
0.17
0.26
0 11
0.14
0.07
0 22
0 05
0.17
0.03
0.08
0.17
0.09
0.39
0.02
0.02
0 04
0 04
0.03
0 02
0.41
0.08
u 08
0.05
0.04
0.59
0.1 1
0.05
0.19
0.05
0.00
0 23
0.46
0.03
0.18
0.01
0.54
0.07
0 52
0.07
0.06
0 49
0.07
Description ...
auantlty Currency Evaluation % net assets
UTD PARCEL SERVICE INC "E"
VALERO ENER.
CORP/WH.lSSUED VERlSlGN INC
VERIZON COMMUNICATIONS
INC VF CORP
VIACOM INC
VORNADO REAL.TRUST/EEN.IN
VULCAN MATERIALS CO
WACHOVIA CORP
WAL- MART STORES INC
WALGREEN CO.
WALT DISNEY jDISNEY SER.
WASHINGTON MUTUAL INC
WASTE MANAGEMENT INC.
WATERS CORPORATION
WATSON PHARMACEUTICALS
INC. WELLPOINT INC
WELLS FARGO & CO
WENDY S INTERNATIONAL INC
WEYERHAEUSER CO
WHIRLPOOL CORP.
WHOLE FOODS MARKET INC.
WILLIAMS COMPANIES INC
WINDSTREAM CORP
WRIGLEY JR CO .WM
WYETH
WYNDHAM WORLDWIDE CORP
XCEL ENERGY INC
XEROX CORP
XlLlNX INC.
XL CAPITAL LTD -A-
XTO ENERGY INC
YAHOO INC
YUM BRANDS
ZIMMER HOLDINGS INC
ZIONS BANCORP
3M CO
3.366 USD
1 818 US0
791 US0
9003 US0
256 USD
2.270 US0
358 USD
305 USD
4954 USD
7.634 US0
3,176 USD
6.524 US0
2,865 US0
1.615 USD
279 US0
328 US0
1,933 US0
10,464 USD
339 US0
751 USD
224 US0
415 US0
1,807 US0
1,211 USD
627 US0
4.159 USD
629 USD
1.284 USD
2.925 USD
1111 USD
561 USD
1086 US0
3,779 US0
828 US0
768 USD
343 US0
2.381 US0
244 136
93.227
16,579
332 571
19,041
83,990
39 212
24 248
275,641
380,250
142 634
201 787
124 656
60.078
12,619
8,512
148.106
377,960
22 567
46.772
18.964
25.078
43.260
15,743
28.855
209 073
17,436
26.771
45 045
24,831
38,754
45.395
95 722
43,594
51.832
27,649
177,623
0.63
0.24
0 04
0.86
u 05
0 22
0.10
0.06
0.72
0.99
0 37
0 52
0 32
0.16
0.03
0.02
0.38
0.Y8
0.06
0.12
0.05
0 07
0.11
0.04
0.07
0.54
0.05
0.07
0 12
0.06
0.10
0 12
0 25
0.11
0 13
0.07
0.46
37,196,635 96.58
TOTAL SHARES
INDEX TRACKER
UNITED STATES
ISHARES TRUST/S&P 500 INDEX
FD
37,243,476 96.70
7,450 US0 998.226 2 5 9
TOTAL INDEX TRACKER
993.226 2 59
998,226 2.59
HSBC Global Investment Funds .. . . .

.-. r Portfolio of Investments and Other Net Assets
-.
Description Quantity Currency Evaluation % net assets
INVESTMENT COMPANIES
UNITED STATES
HUGOTON ROYALTY TRUST/UN.BENEF
1 US0 27 0.00
27 0.00
TOTAL INVESTMENT COMPANIES 27 0.00
TOTAL TRANSFERABLE SECURITIES ADMITTED TO AN OFFICIAL STOCK EXCHANGE LISTING
OTHER TRANSFERABLE SECURITES
SHARES
UNITED STATES . .~
SEAGATE TECHNOLOGY 147 (ESCROW)
TOTAL SHARES
TOTAL OTHER TRANSFERABLE SECURITIES
TOTAL INVESTMENTS
OTHER NET ASSETS LESS LIABILITIES
TOTAL NET ASSETS
30,241.729 ._=
USD 0 00 0.00
000 000
000 0 0 0
0.00 0.00
38?241,729 99.29
~
273,306 0.71
HSBC Global Investment Funds . .

-
Portfolio of Investments and Other Net Assets .. - - ~-
USINDEX
Economic Division of Investment
(expressed as a percentage of net assets) . -
Holding companies Pharmaceuticals and cosmetics Banks and financial institutions Energy News transmission Retail trade, department stores Office equipment and computers Internet Software Insurance Electronics and electrical equipment Public services Food Investment companies Consumer goods Aerospace technology Chemicals Tobacco and spirits Graphic art and publishing Transport Gastronomy Healthcare. education and social services Miscellaneous Mechanics, machinery Other services Real estate companies Automobile industry Biotechnology Forest products and paper industry Construction, building materials States, provinces and municipalities Textile Non-ferrous metals Precious metals Coal mines, heavy industries Package and container industry Other business houses Photography and optics Environmental services 8 recycling Tyres and rubber
Other net assets less liabilities
Total Net Assets
HSBC Global Investment Funds __ . .. .. ..
12.47 9.65 9.47 6.78 5.44 5.21 4.80 4.70 4.13 3.54 3.21 2.79 2.59 2.37 2.34 2.1 1 1.97 1.87 1.68 1.68 1.60 I .46 1.40 0.98 0.71 0.66 0.61 0.54 0.49 0.43 0.39 0.33 0.25 0.19 0.18 0.17 0.05 0.03 0.02
0.71
100.00
-
I
. L
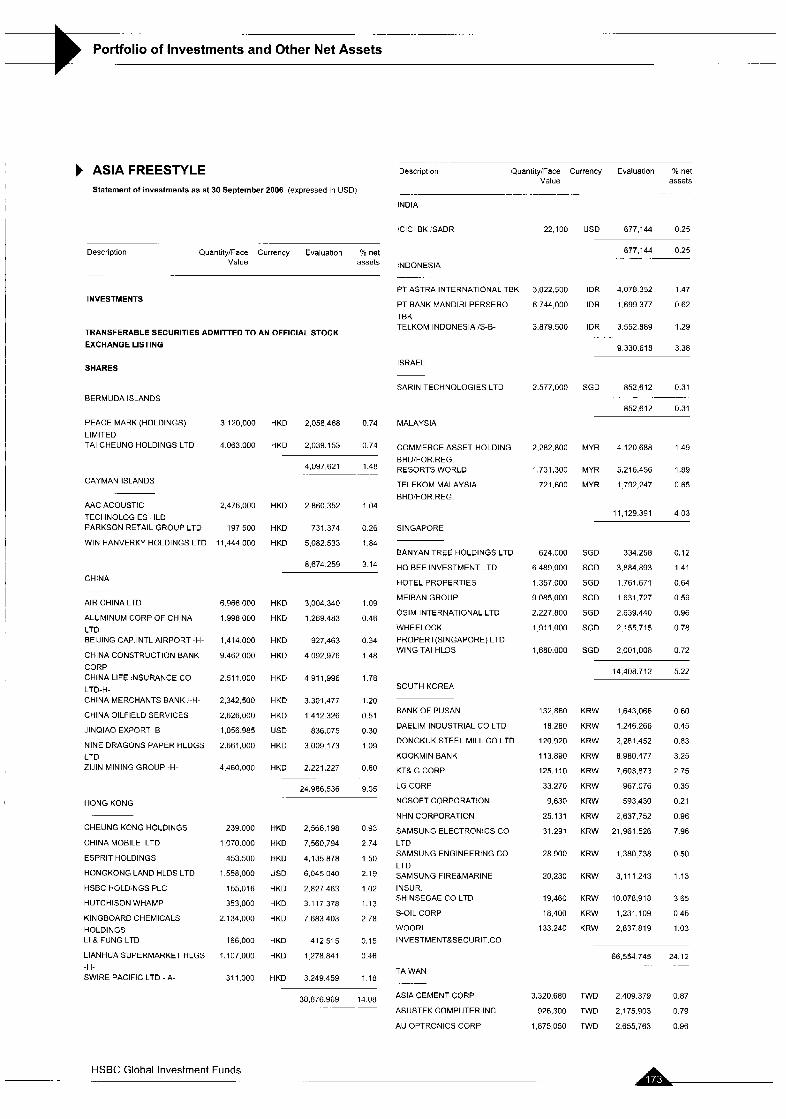
. _. ~ ..
Portfolio of Investments and Other Net Assets - __
ASIA FREESTYLE Statement of invnstments as at 30 September 2006 (expressed in USD)
Description QuanlilylFace Currency Evaluation ‘70 net Value assets
INDIA
IClCl BK :SADR
INDONESIA
22,100 USD 677.144 0 2 5
677,144 0 2 5 . .~
. _..
Description QuantityIFace Currency Evaluation % net Value assets
PT ASTRA INTERNATIONAL TBK
PT BANK MANDlRl PERSERO
TBK TELKOM INDONESIA 5 8 -
3,022,500 IDR 4.078352 1 4 7
6744.000 IDR 1.699377 0 6 2 INVESTMENTS
3.879 500 IDR 3.552.aa9 1.29
9.330618 3 3 8
TRANSFERABLE SECURITIES ADMITTED TO AN OFFICIAL STOCK
EXCHANGE LISTING
SHARES ISRAEL
SARIN TECHNOLOGIES LTD 2,577,000 SGD 852,612 0.31
852,612 0.31
.. BERMUDA ISLANDS
PEACE MARK (HOLDINGS)
LIMITED TAI CHEUNG HOLDINGS LTD
3.120,OOO
4,063,000
2,476,000
197,500
11,444,000
6,966,000
1.998.000
1.414.000
9.462.000
2 511.000
2,342,500
2,626,000
1,056 985
2,661,000
4,460.000
239 000
1,070.000
453.500
1 558.000
155,016
353.000
2,134,000
166,000
1.107.000
311.000
HKD 2.05a,468 0.74
HKD 2,039.153 0 74
MALAYSIA
COMMERCE ASSET-HOLDING
BHDiFOR.REG. RESORTS WORLD
TELEKOM MALAYSIA
BHD!FOR.REG.
2,282,800 MYR 4 120.688 1.49
4,097,621 1.48 1,731,300 MYR 5.216.456 1 .89
721.600 MYR 1792,247 0.65 CAYMAN ISLANDS
AAC ACOUSTIC
TECHNOLOGIES HLD PARKSON RETAIL GROUP LTD
WIN HANVERKY HOLDINGS LTD
HKD 2 860.352 1.04 11,129.391 4 03
HKD 731 374 0 2 6
HKD 5,082533 1 a4
a.674259 3 14
..
SINGAPORE
BANYAN TREE HOLDINGS LTD
HO BEE INVESTMENT LTD
HOTEL PROPERTIES
MEIBAN GROUP
OSlM INTERNATIONAL LTD
WHEELOCK
PROPERT(SINGAP0RE) LTD WING TAI HLDS
624,000 SGD 334,258 0.12
6 489.000 SGD 3.884.893 1.41
1.357.000 SGD 1.761,671 0.64
9085,000 SGD 1631.727 0.59
2.227.800 SGD 2.639.440 0.96
1911,000 SGD 2155.715 0 7 8
1 680.000 SGD 2,001,008 0 72
CHINA
AIR CHINA LTD
ALUMINUM CORP OF CHINA
LTO BElJlNG CAP.INTL AIRPORT -H-
CHINA CONSTRUCTION BANK
CORP CHINA LIFE :NSURANCE CO
LTO-H- CHINA MERCHANTS BANK i-H-
CHINA OILFIELD SERVICES
JlNOlAO EXPORT B
NINE DRAGONS PAPER HLDGS
LTD ZlJlN MINING GROUP -H-
HKD 3.004 340 1.09
HKD 1,269.4H3 0.46
HKD 927,463 0 3 4
HKD 4092.976 1 4 8
HKD 4 911 996 1 7 8 14,408.712 5.22
SOUTH KOREA
HKD 3301,477 1.20
HKD 1,412 326 0.51
USD 836,075 0.30
HKD 3.009 173 1.09
BANK OF PUSAN
DAELIM INDUSTRIAL CO LTD
DONGKUK STEEL MILL CO LTD
KOOKMIN BANK
KT& G CORP
LG CORP
NCSOFT CORPORATION
NHN CORPORATION
SAMSUNG ELECTRONICS CO LTD SAMSUNG ENGINEERING CO
LTD SAMSUNG FIREBMARINE
INSUR. SHINSEGAE CO LTD
S-OIL CORP
WOORI 1NVESTMENTBSECURIT.CO
132,860
1a.280
120.920
11 3.890
125.110
33.270
9,630
25 131
31 291
KRW
KRW
KRW
KRW
KRW
KRW
KRW
KRW
KRW
1,643,066
1.246 266
2,261,452
8 980.477
7,603,873
967.076
593,430
2,637,752
21 961 526
0 60
0 45
0.83
3 25
2 75
0 35
0.21
0 96
7 96
24,986,536 9.05
HONG KONG
CHEUNG KCNG HOLDINGS
CHINA MOBILE LTD
ESPRIT HOLDINGS
HONGKONG LAND HLDS LTD
HSBC HOLD NGS PLC
HUTCHISON WHAMP
KINGBOARD CHEMICALS
HOLDINGS LI a FUNG LTD
LIANHUA SUPERMARKET HLGS
-H- SWIRE PACIFIC LTD - A -
HKD 2,566,198 0 93
HKD 7,560,794 2 74
HKD 4,135878 1 5 0
USD 6,045,1140 2.19
HKD 2.827463 1.02
HKD 3 117.378 1.13
HKD 7.683.403 2.78
HKD 412,515 0.15
HKD 1 278.841 0.4fi
28900 KRW 1.380738 0.50
20,230 KRW 3,111,243 1.13
19.460 KRW 10078,918 3 6 5
18,400 KRW 1,231.109 0.45
133240 KRW 2.837819 1 0 3
66,554 745 24 12 ._
TAIWAN HKD 3249.459 1 1 8
ASIA CEMENT CORP
ASUSTEK COMPUTER INC
AU OPTRONICS CORP
38,876.969 14 08 3,320.6ao TWD 2,409379 o 87
926,300 TWO 2,175.903 0.79
1,875,050 TWO 2.6557fi3 0 9 6
HSBC Global Investment Funds ~. .

- i . .
Portfolio of Investments and Other Net Assets
-. .
Description QuantitylFace Currency Evaluation Yo net Value assets
Description Quanrity/Face Currency Evaluation % net Value assets
CATCHER TECHNOLOGY CO
LTD CATHAY FINANCIAL HOLDING
CHANG HWA COMMERCIAL
RANK CHI ME1 OPTOELECTRONIC
CORP FOXCONN TECHNOLOGY CO
LTD HIGH TECH COMPUTER CORP
HON HA1 PRECISION IND.CO
LTD KINSUS INTERCONNECT
TECHN.CORP MEDIA TEK INCORPORATION
NAN YA PCB
SHIN KONG FINANCIAL HLD CO
LTD SILICONWARE PRECISION
INDUSTR TAIWAN FERTILIZER CO LTD
TAIWAN SEMICONDUCTOR
MANUFACT TRIPOD TECHNOLOGY CO LTD
WISTRON CORP
293 376
1 464 178
3,626.000
700,000
11 3.850
93 000
1,462,850
306 934
325.200
271 000
1,919 828
1,275 000
1,162,000
3 996,095
710 150
1,497 888
3.221 300
7,803,100
5 453.000
TWD 2,518.893 0.91
TWD 2,934,771 1.06
TWD 2 ~ 6 , 9 4 4 0 7 9
TWD 774,544 0 2 8
TWD 1 025.690 0.37
TWD 2.462,941 0.89
TWO 8.911.313 3.24
TWO 904,725 0.33
TWO 3,087,074 1.12
TWO 1.876 168 0.68
TWO 1.767325 0.64
TWO 1,520,632 0.55
TWD i,nm,g72 0.68
TWD 7212,354 2 6 2
TWD 2 168,395 0 7 9
TWD 1.700.420 0.62
UBS LON 06-1.9.07 SHREE 130,000 USD 490,278 0.18
PRECOATEDSTEELS LTD -
8.458.589 3 06
INDIA
DEUTSCHE BANK AG 04- 50000 USD 2617.420 0 9 5
18 06 07 /ON BHARAT HEAVY
ELECTRICALS LTD 0 MERRILL LYNCH 04-17 03 09 86.556 USD 988699 0 3 6
/ON IBP CO LTD
3,606119 1 3 1
JERSEY -
JPM INTL 05-1 1 11 08 /GUJARAT 1 000 000 US0 2 510 000 0 91
2,510.000 0 91
NETHERLANDS
ABN AMRO 05-18 12 OGWRTIHCL 640 000 USD 2.02:,875 0 73
INF 0
2,021,675 0.73
TOTAL WARRANTS / EQUITY LINKED SECURITIES 16,595,583 6.01
TOTAL TRANSFERABLE SECURITIES ADMITTED TO
AN OFFICIAL STOCK EXCHANGE LISTING 255,665,649.. 9_!62
TRANSFERABLE SECURITIES TRADED ON ANOTHER REGULATED MARKET
50,183 206 18 19 ... -.
THAILAND
SlAM COMMERC.BANK
PUBLJFOR.REG
THE 5,146,607 1.86 SHARES
5 146,607 1.86 TAI'NAN
TOTAL SHARES
BONDS
234,918,420 85.11
US0 885995 0.32
WISTRON CORP /GDR 5,963 USD 67692 0.02
67.692 0.02 GREAT BRITAIN
TOTAL SHARES 67.692 0.02
TOTAL TRANSFERABLE SECURITIES TRADED ON ANOTHERREGULATEDMARKET 87,692. 0.02 OTHER TRANSFERABLE SECURITES
UBS LONDON 0% 05-15.12.06
RCON
885.995 0.32
TOTAL BONDS
INVESTMENT COMPANIES
866.995 0.32
SGD 3.264.651 1.18
SHARES
TAIWAN BERMUDA ISLANDS
I18000 TWD 692.071 0.25 SHIN ZU SHING CO LTD MACQUARIE INTL
INFRASTRUCTURE 692.071 0.25
3,264,651 1.18 TOTAL SHARES
BONDS
692,071 0.25
TOTAL INVESTMENT COMPANIES
WARRANTS / EQUITY LINKED SECURITIES
3.264.651 1.18
GREAT BRITAIN
GREAT BRITAIN UBS LON 0% 05- 19 12.06/REDDYS UBS LDN 0% 05-19.12.06ISTEEL
104 680 USD 1.686.981 0.61
135,095,200 US0 2,197,999 0.80 DT.BK LN 05- 70,000
19.8.08WRT:ASS.CEM 0 JP MORG DERlV -31.03.08 HCL 277.366
JP MORGAN INTERNATIONAL 4,896
DERIVATIVES LTD 04-23.03.07
/ON INFOSYS TECHNOLOGIES
LTD 0 MORGAN ST.06-18.5 09 143.740
WRT/TATA 0
PRY LTD
UBS LD 06.4.9.07 IVRCL INFR a 243.000
US0 1,512,359 0.55
USD 3.325.159 1.20
US0 197,182 0.07 3,884,980 1.41
JERSEY
JPM INTL DER.O%06- 19.1 .O9/RCVL
18053,700 US0 1335,974 0 4 8
USD 1,658,468 0.60
US0 1,275.143 0 4 6
1.335.974 0.48
TOTAL BONDS
TOTAL OTHER TRANSFERABLE SECURITIES
5,220.954 1.89
5,413,025 2.14
HSBC Global Investment Funds ....

.~ -~
Portfolio of Investments and Other Net Assets . .-.
Description PuantitylFace Curroncy Evaluation % net Value assets
_..
TOTAL INVESTMENTS 261546.366 94.78
OTHER NET ASSETS LESS LIABILITIES 14.408.209 5.22
TOTAL NET ASSETS 276,054,575 100.00
HSBC Global Investment Funds

~- _.
Portfolio of Investments and Other Net Assets .. - - -_ - __ -
I
ASIA FREESTYLE
Economic Division of Investment -.
(expressed as a percentage of net assets)
%
Electronics and electrical equipment Banks and financial institutions Holding companies Real estate companies News transmission Retail trade, department stores Gastronomy Textile Insurance Tobacco and spirits Office equipment and computers Coal mines, heavy industries Automobile industry Transport Construction, building materials Investment companies Internet Software Other business houses Forest products and paper industry Energy Miscellaneous Clock and watch-making industry Chemicals Mechanics, machinery Non-ferrous metals Pharmaceuticals and cosmetics Precious metals
Other net assets less liabilities
Total Net Assets
HSBC Global Investment Funds
24.38 18.19 7.77 5.25 4.68 4.37 3.43 3.34 2.91 2.75 2.32 1.63 1.47 1.43 1.32 1.18 1.17 1.11 1.09 0.96 0.90 0.74 0.68 0.59 0.46 0.35 0.31
5.22
100.00

Portfolio of Investments and Other Net Assets
ERIC FREESTYLE Statement of investments as at 30 September 2006 (expressed in USD)
. . .
Description QuantitylFace Currency Evaluation % ne1 Value assets
CHINA LIFE INSURANCE CO
LTD-H- CHINA NATL BLDING MATERIAL
-H- CHINA PETROLEUM 8 CHEM
CORP -H- CHINA SHENHUA ENERGY CO -
H- CHINA TELECOM CORP LTD -H-
DATANG INT POWER
GENERATION-H- DONGFENG MOTOR -H
JlANGXl COPPER CO LTD -H-
MINDRAY MEDICAL
INTERNATIONAL PETROCHINA CO LTD I-H
PlCC PROPERTY 8 CASUALTY
H- ZHEJIANG EXPRESSWAY CO
LTD -H- ZlJlN MINING GROUP -H-
50 398,000
27.n00,ooo
98,200,000
12 515.000
64.07D.000
17.214.000
43.158.000
33 850.000
28 200
76 920,000
50.000 000
40.000 000
39,000,000
2 485,550
380,745
606,909
917,184
600.000
113,742
950 410
656 435
19 237.193
22.1 11,500
11 078.000
10.000,000
597 600
20,000
384,816
1,908,200
253.343
93,475
159.958
577.064
685 000
396 101
200 000
720,849
HKD 98.588.123 3 2 6
HKD 12 996.349 0.43
HKD 61 007.492 2.02
HKD 20.144.418 0.67
HKD 23 191,570 0.77
HKD 12.925.995 0.43
HKD 17 505.508 0.58
HKD 32 239.545 1.07
USD 448.380 0.01
HKD 82.738.876 2.74
HKD 18,291,158 0.61
HKD 26,544,641 0.88
HKD 19,423.284 0.64
Descriollon Quantlty!Face Currency Evaluatlon X net Value assets
INVESTMENTS
TRANSFERABLE SECURITIES ADMlTrED TO AN OFFICIAL STOCK
EXCHANGE LISTING
SHARES
BERMUDA ISLANDS
CHINA YURJN FOOD GROUP
LTD GP INVESTMENTS LTD IBDR
I6 185.000
888,000
7 135.020
650.000
240 000
1,871,300
737,600
35,500
3.072.400
818,200
2 037.160
1 522.765
1,6Y1,700
2,219,435
312 100,000
154 000
4.064.400
1921,000
61 7.500
2,264.400
51 1,300
2.422.000
10731.000
HKD 13,462,138 0 4 5
BRL 15130549 0 5 0
484.321 512 16.03 28 592.687 0 95
FEDERATION OF RUSSIA BRAZIL
GAZPROM 0AO:SADR
JSC SURGUTNEFTEGAZ lSADR
JSC SURGUTNEFTEGAZ 'SADR
PFD LUKOIL SADR
MMC NORILSK NICKEL ISADR
NOVOLIPETSK STEEL GDR REGS RAO UNIFIED ENERGY
SYST !GDR TATNEFT rSADR REP 20 SHS
REG S TNK-BP HOLDING
US0 108 966,511
USD 25,243394
USD 53.884.537
3.61
0.84
1.78
2.34
2.52
0.117
2.35
1.90
1.59
17.00
.._..
5 17
0.79
0 28
ALL AMERICA LATINA :UNIT
AMBEV CIA DE BEBIDAS !ADR
BANCO BRADESCO SA !PREF
BANCO BRADESCO lSADR
BRADESPAR SA BRASlL :PREF.
BRASILAGRO
CIA VALE RIO DOCEEADR
CIA VALE R 0 DOCE/SADR(I ORDSH) CYRELA BRAZIL REALTY SA
DIAGNOST J A AMERICA SA BRL
DURATEX SA :PRIV.
ITAU HOLDING /PFD SHS!SADR
BRL 55,857,838
USD 29 737.500
BRL 7.990787
USD 62.445.281
BRL 24,588.922
BRL 17.982 955
USD 57.392 432
US0 17,452.206
BRL 33,979,235
BRL 28 050.001
BRL 19.460,581
US0 66,694.022
BRL 12,718,268
BRL 1.613.400
BRL 7.767.559
BRL 23 115.686
BRL 6,213,387
US0 169 399,764
US0 42,647.533
BRL 26.155.137
BRL 29,304,539
740.567 033
__ .. ..
1 85
0 98
0 26
2 07
0 81
0 60
1 90
0 58
1 1 2
0 93
0 64
2.21
0 42
0 05
0 26
0 77
(1 21
5 60
1 4 1
0 87
0 97
USD 70 623.168
US0 76 200.000
USD 2,206.595
US0 71 090668
US0 57 273.954
US0 47 900.61 1
513,389.438
HONG KONG LOJAS AMERICANAS SA iPRlV
LUPATECH SA
MARCOPOLO POMO 'PREF
NATURA COSMETICOS SA
PERDIGAO SA
PETROERAS Z A D R REP.1 SHS.
PETROLEO BRASlLElRO lSADR
ROSS1 RESlDENClAL ON
SADIA SAlPREF
CHINA MOBILE LTD
CHINA RESOURCES
ENTERPRISE LTD CNOOC LTD
HKD 156.243 462
HKD 24,002.702
HKD 8317663
188 563.827 6 24
INDIA
AMTEK AUTO LTD IDEMAT
ANANT RAJ INDUSTRIES
:DEMAT BAJAJ HINDUSTHAN LTD
BALRAMPUR CHIN1 MILLS
IDEMAT BANK OF INDIA,DEMAT
BF UTILITIES LTD 'DEMAT
BHARAT PETROL IDEMAT
BIOCON LTD 'DEMAT
BOMBAY DYEING 8 MANUFACTIDEMAT BRITANNIA INDUSTRIES
LTDIDEMAT CENTURY TEXTILES 8 IND I
DEMAT CESC LTD IDEMAT
INR 4.296726 0 14
INR 367.008 0 0 1
INR 2.714,sso n o 9
INR 4.222307 0 14
INR 898.908 0 0 3
INR 3,639,277 0.12
INR 1283.278 0 0 4
INR 4773.381 0 1 6
INR 11 333.912 0 3 8
INR 9613.894 0 3 2
INR 2214.023 0 0 7
INR 4825118 0 I 6
24.51
CAYMAN ISLANDS
CHINA MENGNIU DAIRY CO LTD 5,194 000
ENRIC ENERGY EQUIPMENT 15.544 D(10
SHUl ON LAND LTD 2,699.500
HKD 8,707.058
HKD 9,976062
HKD 1.853.802
20,536.922
0 29
0 33
0.06
0.68
0.46
0.99
0.47
0.00
CHINA
AIR CHINA LTD 32,358.000
BANK OF COMMUNICATIONS 42 489,000
CO LTD BElJlNG CAP INTL AIRPORT -H- 21,800,000
CHINA BLUECHEMICAL LTD -H- 276 000
HKD 13,955 560
HKD 29,941,612
HKD 14,298.936
HKD m o m
A_-. . .. HSBC Global Investment Funds
.-

- Portfolio of Investments and Other Net Assets
._
Description Quantitv/Face Currencv Evaluation % net Description
-. _.
DHAMPUR SUGAR MILLS LTD DEMAT OR REDDY S LABORATORIES
IDEMAT OR REDDY S LABORATORIESIADR DWARIKESH SUGAR IND LTD
ELECTROSTEEL CASTING
LTDlDEMAT EVRAZ GROUP SA ISGDR
REP REG-S GAMMON INDIA LTD /DEMAT
GRASIM INDUST lDEMAT
GREAT EASTERN
SHlPPlNGlDEMAT HCL INFOSYSTEMS LTD
lDEMAT HCL TECHNOLOGIES /DEMAT
HINDALCO IND IGDR 144A REG
HINDUJA TMT LTD lDEMAT
HINDUSTAN OIL
EXPLORAT /DEMAT HINDUSTAN PETR /DEMAT
HUTCHISON TELECOM INTL
/SADR HUTCHISON
TELECOMM INTERNAT IBP CO LTD /DEMAT
IClCl BK LTD rDEMAT
IClCl BK ISADR
INDIA CEMENTS LTDlDEMAT
INDIAN
PETROCHEM IDEMATERIALISE
D INDO RAMA SYNTHETICS
LTDlDEMAT INFOSYS TECH LTD /DEMAT
INFRASTRUCTURE DVPT
FIN/DEMAT IVRCL INFRASTRUCTURES AND
PROJ JAIPRAKASH ASSOCIATES LTD
JET AIRWAYS INDIA LTD
/DEMAT JINDAL IRONgSTEEL CO
LTD/DEMAT JINDAL STAINLESS LTD/DEMAT
JINDAL STEEL & POWER
/DEMAT J K CEMENT LTD
KEI INDUSTRIES LTD lDEMAT
LUPIN LIMITED /DEMAT
MAHINDRA UGINE STEEL
/DEMAT MAHINDRA&MAHINDRADEMAT
MARUTI UDYOG LTD lDEMAT
MATRIX
LABORATORlESlDEMAT MCDOWELL AND CO LTD
/DEMAT MICRO INKS LTD lDEMAT
NAGARJUNA CONSTRUCTION
/DEMAT NATL THERMAL POWER CORP
/DEMAT NESTLE INDIA lDEMAT
OILkNATURAL GAS/DEMAT
Value assets . .- .
415,500
1,251,430
142 000
820.971
540,000
182,000
754,615
502.333
623,588
Y64,652
1.400,OOO
300.000
352,424
1.451.892
566.802
56,800
9.718.000
300,000
1,674,239
93 500
1 449,054
300 000
1.341 457
101.280
4.767 005
2.200 000
127 679
340,000
1,842.033
1,000.000
243.162
2,944.678
600 000
25.187
2.316.587
442.000
86 000
700,000
245 179
633 372
1,750 484
4 000 000
25 492
1.216 950
INR 1.095.754
INR 19.943.230
USD 2.246.440
INR 2,140.040
INR 4.747.731
US0 4.258.800
INR 5.826.465
INR 27,577.526
INR 4,123.183
INR 3,048,989
INR 16,781,835
USD 1092,060
INR 4 173.332
INR 3.539.736
INR 3479.357
US0 1.460.328
HKD 17 189.072
INR 3.428.460
INR 25.660.808
US0 2.864840
INR 7,035,668
INR 2,022,791
INR 1.813.372
INR 4082.926
INR 7.040670
INR 12.202 270
INR 1.313922
INR 4774463
INR 11,588.141
INR 2,331.353
INR 9030.115
INR 12,563,551
INR 4.175538
INR 254.206
INR 5799.159
INR 6,536.336
INR 1.822439
INR 4,051,676
INR 3,314,312
INR 4,480.854
INR 6,058621
INR 11.328067
INR 582,711
INR 31.221.782
0.04
0.66
0.07
0.07
0.16
0.14
0.19
0.91
0 14
0 10
0.56
0.04
0.14
0.12
0 12
0.05
0.57
0.1 1
0.85
0.09
0.23
0.07
0.06
0.14
0.23
0.40
0.04
0.16
0.38
0 08
0 30
0 42
0.14
0.01
0 19
0.22
0.06
0.13
0.1 1
0.15
0.20
0.38
0.02
1.03
QuantitylFace Currency Evaluation Y not Value assets
ORCHID CHEMICALS PHARMA
/DEMAT PATNl COMPUTER SYSTEMS
IADR PATNl COMPUTERS SYSTEMS
LTD /DEMAT RAYMOND LTD IDEMAT
RELIANCE CAPITAL LTD
/DEMAT RELIANCE
COMM VENT(RCVL)IDEMAT RELIANCE
ENERGY/DEMATERIALISED RELIANCE NATURAL
RESOURCES/ DEMAT RlCO AUTO IND LTD
/DEMATERIAL STATE BK OF INDIA IGDR
(REGS) STEEL AUTHORITY OF
INDINDEMAT STERLITE INDUSTRIES LTD
/DEMAT TATA IRON & STEELDEMAT
TATA MOTORS LTD/DEMAT
TATA POWER CO /DEMAT
TATA TEA LTD I DEMAT
TORRENT PHARMACEUTICALS
LTD TRlVENl
ENGINEER INDUSTR/DEMAT TVS MOTOR COMPANY LTD / DEMAT UTV SOFTWARE COMM LTD
/DEMAT VISA STEEL LTD IDEMAT
WIPRO LTD IDEMAT
UNITED STATES .. . -
CTC MEDIA INC
TOTAL SHARES
BONDS
GREAT BRITAIN
JP MORG.INTL.0%06-27.1.09
NGCN
JERSEY
JPM.INTL DER.O% 06-2.3.09
IVRC
844,309
5.550
1 063,000
497 192
26,315
3 144.000
152.647
526,316
1 087,334
25.000
10 143,615
190.000
1,049 315
600 000
653 000
200 000
400.51 1
2.470.000
444.812
37.637
3 112.135
365.000
200,000
19.800,600
40 000 000
TOTAL BONDS
WARRANTS I EQUITY LINKED SECURITIES
BERMUDA ISLANDS
CLSA FIN.05- 59.675
27.09 lOWRT/GAMMON 0
INR 3,851,302
USD 104.840
INR 8.906.663
INR 4,880,576
INR 326.940
INR 23.816 630
INR 1,611,734
INR 258,925
INR 1,987,020
USD 1,390,000
INR 17,123,522
INR 1,814,428
INR 12.105.989
INR 11,247961
INR 7,988551
INR 3.284138
INR 1,594,145
INR 3,701,855
INR 1207.429
INR 149109
INR 2,587,857
INR 4,189.170
0.13
0.00
0.23
0.16
0.01
0.79
0.05
0.01
0.07
0.05
0.57
0.06
0.40
0.37
0.26
0.1 1
0.05
0.12
0.04
0 00
0.09
0 14
474 426,427 15 71
US0 4.008,OOO 0.13
4.008.000 0.13
2,454,405,846 81.25 ~. . . .. ..
USD 675,200 0.02
675.200 0.02
USD 2.188.000 0.07
2 188000 0.07
2,863,200 0.09
USD 459.798 0.02
459798 0 0 2
HSBC Global Investment Funds . ..

Portfolio of Investments and Other Net Assets .-
- Quantily/Face Currency Evaluation % net
Value assets Description
._
INDIA
Description QuantitylFace Currency Evaluation "/o net Value assets
.. . ..
GREAT BRITAIN
JP MORG DERIV:31.03.08 HCL
MORGAN ST.06-18.5.09
WRTmATA 0
100 000
500,000
734.500
160,000
27.656
154,052
190,000
5,018
100 000
285 386
546 479
532,834
637.500
50,000
169,618
928.767
51 350
USD 1.198835 0 0 4
USD 5 768.984 0.19
RIGHTS HINDUS OIL EXPL 424727 INR 332836 0.01
HOEC
332836 0.01
6,967,819 0 23 TOTAL SHARES 52,066,931 1.72
BONDS INDIA
DEUTSCHE BANK AG 04-
06.08 07 /ON HCL-
INFOSYSTEMS LTD DEUTSCHE BANK AG 04- 31.05.07 ION MAHINDRA & MAHINDRA LTD DEUTSCHE BANK AG 05- 29.04.08 ION BRITAIN INDUSTRIES LTD JP MORGAN INTERNATIONAL
DERIVATIVES LTD 04-03.12.07
/ON JINDAL IRON a STEEL co LTD JP MORGAN INTERNATIONAL
DERIVATIVES LTD 7.4.08 ION MAHINDRA MERRILL LYNCH INTL 05- 07.01.10/0N BRITANNIA
INDUSTRIES LTD MERRILL LYNCH INTL 04-
22.06.09 /ON AMTEK MERRILL LYNCH 04-17.03.09
/ON IBP CO LTD MERRILL LYNCH 04-22.01.07
/ON INDUS DVLP BANK OF
INDIA MERRILL LYNCH 05-08.01.10
/ON MAHINDRA UGINE STEEL
co MERR.L 04-13 3.09 PATNI
COMPUTER SYSTEMS LTD MORGAN STANLEY 05-13 06.08 /ON MAHINDRA MSDW ASIA 04-10.8.07 ION
HINDUSTAU PETROLEUM
US0
US0
US0
US0
US0
U S 0
US0
US0
US0
US0
US0
US0
US0
2 320,418
2,365,294
670 922
1429,603
2 808,787
121,734
71 8 648
3.259.865
992 219
1,339,003
5,340.090
739 154
1 040 708
0 08
0 08
0.02
0.05
0.09
0.uo
0.02
0.1 1
0.03
0.04
0.19
0.02
0.03
GREAT BRITAIN
UBS LO 096 05-15.12 OGRCVIJSW 19.295.600 US0 1,149.748 0 04
UBS LON 0% 05- 100.000 US0 1611,560 0 0 5
19.12.06IREDDYS UBS LN 0% 05-19.12 06 IJINDAL 4 590.000 US0 1 630,675 0 06
4,391.983 0.15
4.391.983 0.15 ~
TOTAL BONDS
WARRANTS I EQUITY LINKED SECURITIES
GERMANY
DT BK 06-2 2 11 WRT GAZPROM 147 US0 160,140.331 5 3 0
0 .... -
160,140,331 5.30
GREAT BRITAIN
UBS LON-2 3 06 PATNI CO 192000 US0 1612,627 006
UBS LN 05-21 12 06 10000 US0 114766 0.00 WRT/HINDUJA 0 UBS LN 06-20 2 07 MAHINDRA 5000 US0 12378 000
UBS LN 06-22 5 07 AMTEK 35,667 US0 254,958 0 0 1
1.994.729 0.07
TOTAL WARRANTS I EQUITY LINKED SECURITIES 162,135,060 5.37
TOTAL OTHER TRANSFERABLE SECURITIES 218,593,974 7.24
TOTAL INVESTMENTS . 2,709,372,965 89.69
OTHER NET ASSETS LESS LIABILITIES 311,369,800 10.31 23,146,445 0 76 ~
NETHERLANDS
TOTALNETASSETS ...... 3,020,742,785 100.00
ABN AMRC 05-18 12.06WRT/HCL
INF 0 US0 2934.142 010
2.934.142 0.10 __ UNITED STATES
JP MORG INT 05-28 07 08 US0 1,761 0 00
1.761 0.00
TOTAL WARRANTS I EQUITY LINKED SECURITIES 33,509,365 1-11
TOTAL TRANSFERABLE SECURITIES ADMITTED TO AN OFFICIAL STOCK EXCHANGE LISTING 2,490,779,011 82.45
OTHER TRANSFERABLE SECURITES
SHARES
FEDERATION OF RUSSIA
TRANSNEFT OJSC MOSCOW 27,889 USD 51.734 095 1.71
51 734.095 1.71
HSBC Global Investment Funds

I
1 Portfolio of Investments and Other Net Assets
I
BRlC FREESTYLE
Economic Division of Investment
(expressed as a percentage of net assets) _ - - - --.
%
Energy News transmission Holding companies Coal mines. heavy industries Transport States, provinces and municipalities Banks and financial institutions Insurance Non-ferrous metals Public services Construction, building materials Food Pharmaceuticals and cosmetics Other services Miscellaneous Real estate companies Automobile industry Tobacco and spirits Mechanics, machinery Internet Software Agriculture and fishing Electronics and electrical equipment Textile Retail trade, department stores Chemicals Office equipment and computers Other business houses
Other net assets less liabilities
Total Net Assets
HSBC Global Investment Funds
23.84
7.12 5.93 5.67 5.30 4.99 3.87 3.69 3.42 2.79 2.36 1.85 1.57 1.22 1.12 1-09 0.98 0.98 0.84 0.81 0.64 0.54 0.42 0.42 0.39 0.36
7.48
10.31
100.00
I

.. ._
Portfolio of Investments and Other Net Assets -.
GLOBAL EMERGING MARKETS EQUITY FREESTY LE Statement of Investments as at 30 September 2006 (expressed in USD)
Descriution QuanWFace Currencv Evaluation % net Value assets
USD 30414.615 2 3 3
USD 8,150,754 0 62
-
LUKOIL !SADR
MOBILE TELESYSTEMS
0JS:SADR RAO UNIFIED ENERGY
SYST./GDR
394.995
215 914
229 39 1
987.000
8,688.922
29,796.000
128,665
7,579,000
435,974
17.667 000
454,702
676.600
1,084.500
2.074.000
1,323.607
227.728
205.597
4 309.514
2,508.737
291.784
2336,408
229 322
841 510
1 255,267
545,400
41 242
2,536,354
USD 17.158.447 1.31 ~. .
Description QuantitylFace Currency Evaluation YO net Value assets
152,661,066 11 69
HONG KONG
INVESTMENTS
TRANSFERABLE SECURITIES ADMITTED TO AN OFFICIAL STOCK EXCHANGE LISTING
CHINA MOBILE LTD
CHINA NETCOM GROUP CORP
HK LTD DENWAY MOTORS LTD
HKD 6974303 0 5 3
HKD 15,591 913 1 1 9
HKD I0785329 0 8 3
33 351,545 2.55 .~
SHARES
HUNGARY
BRAZIL MOL MAGYAR I-A- HUF 11 739,154 090
ALL AMERICA LATINA ,UNIT
AMBEV CIA DE BEBIDAS lADR
CIAVALE RIO DOCEISADR
DIAGNOST DA AMERICA SA BRL
GERDAU SA; SADR PFD SHS
ITAU HOLDING /PFD SHSlSADR
LOCALIZA RENTA A CAR
PETROBRAS !SADR REP 1 SHS
PETROLEO BRASlLElRO /SADR
TELEMAR 4 lPFD SHS
VIVAX UNITS l l S H + 2 PFD SHS
1329,590
277,600
421.400
396,904
818.350
307,800
340.900
451 581
121,000
462.121
585,978
15.694 205
1,447,144
25,314,261
13.51 2,500
1.600,OOO
16,114.000
674,228
454,822
13.113
2,991.169
812 830
BRL 10.408 944 0.80
usn iz.700,zoo 0.97
usn 7,871.rs2 0.60
usn 11.080.459 0.85
BRL 7311.146 056
USD 9,249,390 0.71
BRL 7,268,554 0.56
usn 33,782 775 2.58
usn 10.092,610 0.77
BRL 9 725.499 0.74
BRL 9.390 756 0.72
11 739,154 0.90
INDIA
HUTCHISON
TELECOMM.INTERNAT IClCl BK !SADR
HKD 13405.637 1 0 3
usn 13358,243 1.02
26.763.880 2.05
INDONESIA
BANK RAKYAT INDONESIA
PT TELEKOM.INDONESIA ISP ADR
IDR 9,382.272 0 72
US0 16623905 127
26.006.177 1.39 128,882,085 9.8fi ISRAEL CAYMAN ISLANDS
- .
AAC ACOUSTIC
TECHNOLOGIES HLD KINGDOM HOTEL INV./SGDR
REGS
TEVA PHARMACEUTICAL.lADR HKD 18.130432 1.39
USD 11,866,581 0.91 23.044.996 1.76
MALAYSIA
29.997 013 2.30 GENTING BERHADiFOR.REG.
KUALA LUMPUR KEPONG BHD
TELEKOM MALAYSIA BHD/FOR.REG.
MYR 7,094,583 0 54
MYR 6,136426 0.47
MYR 3287,459 0 2 5
CHINA
ANGANG NEW STEEL CO LTD - H- CHINA SHENHUA ENERGY CO -
H- DONGFANG ELECTRICAL
MACH. H PETROCHINA CO LTD I-H-
HKD 20,113,249 1.54
HKD 21.750,015 1.66
HKD 2.784.877 0.21
16,518,468 1.26
MEXICO I
AMERICA MOVIL SA lADR WI-L.
CEMEX iADR
EMPRESAS ICA SA DE CV
GEO i-8-
GRUPO AEROPUERTO DEL
PAClFiADR GRUPO FAMSA SA DE CV -A-
GRUPO TELEVISA iGDS
US0 8883,669 068
US0 6 190,526 047
MXN 15485932 1 1 9
MXN 10.477223 080
USD 9862299 0 7 5
MXN 5,962,637 0 4 6
USD 4.845574 0 3 7
HKD 17332999 1.33
61.981 140 474
.. -
~- ~. CZECH REPUBLIC
CEZ CESKE ENERGETICKE
ZAVODY CZK 23.798.361 182
23,738,361 1.82
US0 25.083.433 1.92
EGYPT ~
ORASCOM TELECOM HLDiGDR(REG.S)
61.707 920 4.72
SOUTH AFRICA
25083,433 1.92 BARLOWORLD LTD
BIDVEST GROUP LTD
GOLD FIELDS SPONS ADR
IMPALA PLAT HOLDINGS
MURRAY AND ROBERTS HOLDINGS
ZAR 14.382.396 1.10
ZAR 18.669.885 1.43
US0 9,380,820 0.76
ZAR 7.180.571 0.55
ZAR 10591,641 0.81
FEDERATION OF RUSSIA
AKSBEREGATELNYBANK
SBERBANK GAZPROM OAO
GAZPROM OAOZADR
USD 28,848.600 2 21
USD 32,454 184 2.48
USD 35,634466 274
HSBC Global Investment Funds . . -_

_ _
Portfolio of Investments and Other Net Assets ._ ..
-
Description Quantity/Face Currency Evaluation Yo net Value assets
.......
Description OuantitylFace Currency Evaluation % net Value assets
TURKIYE GARANTI BANKASI 2.114 759 TRY 6,493,922 0.50
INOM. TURKIYE IS BANKASI AS C 1.575 845 TRY 8.573526 0 6 5
SASOL LTD 'REG
SOUTH KOREA
432.635 ZAR 14,647.371 1 12
75,452.684 5.77
21,351.966 1.63
AMORE PACIFIC CORP (NEW)
AMOREPACIFIC CORPORATION
DAEGU BANK
DAELIM INDUSTRIAL CO LTD
DAlSHlN SECURITIES CO LTD
HALLA CLIMATE CONTROL
CORP HlTE BREWERY CO LTD
HYUNDAI DEVELOPM CO-
ENG &CONS HYUNDAI MlPO DOCKYARD CO
LTD INDUSTRIAL BANK OF KOREA
KOOKMIN BANK /SADR
K f 8 G CORP
LOTTE CONFECTIONERY CO LTD POSCO (SAOR
SAMSUNG ELECTRONICS CO
LTD SHINSEGAE CO LTD
25,684
2.91 1
1,262,259
175 I 5 1
581,460
255 883
90.920
277,080
139 100
681,500
414.318
106.788
3,408
96.717
65 360
23,580
KRW 11 945115
KRW 398462
KRW 21,147 193
KRW 11.941 182
KRW 12,630,096
KRW 2,988,675
KRW 11,243 985
KRW 12,359,264
KRW 17,349 387
US0 11 669.597
US0 32 867.847
KRW 6490.308
KRW 4,157,003
US0 6,250,820
KRW 45,872 785
KRW 12.212 789
0.91
0.03
1.62
0.91
0.97
0.23
0.86
0.95
1.33
0.89
2.52
0.50
0.32
0.48
3.51
0.93
TOTAL SHARES 1,153,169,388 88.25
WARRANTS / EQUITY LINKED SECURITIES
GREAT BRITAIN
UBS LDN 06-22.06.07 BHARTI 752,755 USD 7.721 782 0.59
UBS LDN 06- 71,000 USD 4,010.066 0.31 2.7.07WRTiLARS&TOUE 0
OILBNATL 0 UBS LN 06-08.06 07WRT 198.516 USD 5,0~9,603 0.39
......
16,831,451 1.29
TOTAL WARRANTS I EQUITY LINKED SECURITIES 16.831.451 1.29
TOTAL TRANSFERABLE SECURITIES ADMITTED TO
AN OFFICIAL STOCK EXCHANGE LISTING 1,170,000,837 89.54
TRANSFERABLE SECURITIES TRADED ON ANOTHER REGULATED
MARKET
SHARES
EGYPT
221.524 508 16.96 ORASCOM CONSTR.IND./SGDR 212.643 US0 18 521,206 1 42
TAIWAN
18,521 206 142 .
SOUTH KOREA AU OPTRONICS CORP
CATCHER TECHNOLOGY CO
LTD CATHAY FINANCIAL HOLDING
CATHAY FIN HLD/GDR REG-S
CHI ME1 OPTOELECTRONIC
CORP FAREASTERNDEPARTMENT STORES FAR EASTERN TEXTILE LTD
FAR EASTONE TELECOM. CO
LTD HON HA1 PRECISION IND 'GDR
HON HA1 PRECISION IND CO
LTD TAIWAN CEMENT CORP
TAIWAN
SEMICONDUCT MANUFlSADR TAIWAN SEMICONDUCTOR
MANUFACT
7 102,000
2.026 056
TWO
TWO
10 059.054
17,395,490
0.77
1.33
INDUSTRIAL BANK OF KOREA 766 728 KRW 13 128,990 1 00 9,767.000
145.476
19.857 000
TWO
USD
TWO
19.576.795
2,924,066
21.971 596
1 S O
0.22
1.69
13,128,990 1.00
TAIWAN
CAPITAL SECURITIES CORP 26,645.220 TWO 10.270.613 0.79 3.314.520
20,938.820
4,678.000
TWO
TWO
TWO
1,588,242
15,540 700
5,070.097
0.12
1.19
0.39
10.270,613 0.79
TOTAL SHARES 41,920,809 3.21
TOTAL TRANSFERABLE SECURITIES TRADED ON 1,409,058
2.376 800
USD
TWO
TWD
USD
17,542,772
14.478 867
1.34
1.11 ANOTHERREGULATEDMARKET
OTHER TRANSFERABLE SECURITES
41,920,809 3.21
9,364,030
2,006,440
1717,724
7,020,715
19,382,210
3,100,235
0.54
1.48
0 24
SHARES
TWD FEDERATION OF RUSSIA .....
MAGNIT JSC 460873 USD 15.024460 1 15
15,024,460 1.15
155.650.841 11 92
THAILAND
TOTAL SHARES
BONDS
15.024.460 1.15 BANGKOK BK PUB.!NV
DEP.RECEIPT KASIKORNBANK
PUBL.COM.LTD'NVDR LAND AND HOUSE PUBLIC
lNVDR
9,375,600 THE 28,422,433 2 17
13,632.300 THE 24,321,059 1 H6
25.436.800 THB 4.910.651 0.38 GREAT BRITAIN
UBS LON 0% 05-19.12.061STEEL 425,936,800 USD 6.930.024 0.53
6 930.024 0.53
.... 57,654.149 4.41
TURKEY
TOTAL BONDS
TOTAL OTHER TRANSFERABLE SECURITIES
TOTAL INVESTMENTS
6,930,024 0.53
21.954.484 1.68
1,233,876,130 94.43
ClMSA CIMENTO SANAYI VE
TICAR. SABANCI HOLDING
26H3H6 TRY 1,558,718 0 12
1 323.224 TRY 4 725,800 0.36
HSBC Global Investment Funds ... ~

- -. ._
Portfolio of Investments and Other Net Assets -.
. .. ... ... .
Description QuantilyjFace Currency Evaluation YO net Value assets
OTHER NET ASSETS LESS LIABILITIES 72.829.123 5.57
TOTALNETASSETS 1.306.705.253 100.00
HSBC Global Investment Funds

._ . -_ -
Portfolio of Investments and Other Net Assets I i . -
GLOBAL EMERGING MARKETS EQUITY FREESTYLE
Economic Division of Investment - ..
(expressed as a percentage of net assets) ...
Banks and financial institutions Energy Electronics and electrical equipment News transmission Construction. building materials Holding companies Coal mines, heavy industries Public services Automobile industry Mechanics, machinery Tobacco and spirits Pharmaceuticals and cosmetics Real estate companies Other services Precious metals Textile Retail trade, department stores Chemicals Transport Gastronomy Agriculture and fishing Food
Other net assets less liabilities
Total Net Assets
%
17.95 14.25 13.07 9.71 6.79 5.14 5.13 3.13 3.05 2.48 2.33 1.76 1.71 1.31 1.31 1.19 1.05 0.94 0.80 0.54 0.47 0.32
5.57
100.00
HSBC Global Investment Funds . .. . .

_ -~ - -
Portfolio of Investments and Other Net Assets .-
Quantily Currency Evaluation % net assets
LATIN AMERICAN FREESTYLE Statement of investments as at 30 September 2006 (expressed in USO)
MEXICO
ALSEA SA DE CV MEXICO
AMERICA MOVIL SA /ADR WI-L-
COMERCI UNITS (1SH C + 3 SH
6) CORP.MOCTEZUMA SA DE CV
82 EMPRESAS ICA SA DE CV
GEO :-E-
GRUPO AEROPUERTO DEL
PAC1 FIADR GRUPO FAMSA SA DE CV -A-
GRUPO TELEVISA 'GDS
WAL-MART DE MEXICO -V-
73.365 MXN 300.066 1.56
24.310 US0 948.333 4.93
209,721 MXN 422,315 2.20
273.900 MXN 559,510 2.91
Description Quantity Currency Evaluation
INVESTMENTS
TRANSFERABLE SECURITIES ADMITTED TO AN OFFICIAL STOCK
EXCHANGE LISTING
SHARES
"h net assets
156.263 MXN 561,520 2.91
88,600 MXN 370020 1.93
14872 USD 502674 2.62
173,672 MXN 443,225 2.31
9.800 USD 207074 1.08
154000 MXN 521,650 2 7 1
4 836.387 25.16 BRAZIL
ALL AMERICA LATINA /UNIT
AMBEV CIA DE BEBIDAS IADR
BANCO BRADESCO iSADR
CIA DE CONCESSOES
RODOVIARIAS CIA VALE RIO
DOCE!SADR( IORDSH) CYRELA BRAZIL REALTY SA
DIAGNOST OA AMERICA SA BRL
DURATEX SA iPRlV
ITAU HOLDING 'PFD SHSiSADR
LOCALIZA RENTA A CAR
LOJAS AMERICANAS SA :PRIV
LOJASRENNERSA
LUPATECH SA
NATURA COSMETICOS SA
OBRASCON HUARTE LAIN
BRASIL SA PERDIGAO SA
PETROLEO BRASILEIRO 'SADR
TAM SA !SADR
PANAMA 78956 BRL
18500 USD
18.222 USD
47300 BRL
25.243 US0
13757 BRL
13000 BRL
20800 BRL
4600 US0
i 6 , m BRL
6900.000 BRL
5079 BRL
16.700 BRL
13.900 BRL
16.800 BRL
15900 BRL
17,304 US0
7.054 USD
618.122
846 375
608.068
457,426
538,433
229 463
239,466
239.274
138,230
351.307
281 179
294,472
174,960
167 261
190 165
159.988
1,443,327
229 467
3 22
4 40
3 16
2 38
2 80
1 1 9
1 2 5
1 2 5
0 72
1 8 3
1 46
1 5 3
0 91
o a7
0 99
0 83
7 52
1 1 9
COPA HOLDINGS -A 6,000 USD 203.460 1.06
203.460 1 0 6
PERU
BUENAVENTURA/ SADR (1SHS) 10,034 US0 276,336 1 4 4
276.336 1.44
TOTAL SHARES 15,303,655 79.64
TOTAL TRANSFERABLE SECURITIES ADMITTED TO AN OFFICIAL STOCK EXCHANGE LISTING 15,303,655 79.64
TRANSFERABLE SECURITIES TRADED ON ANOTHER REGULATED
MARKET
SHARES
CHILE -
INVERSIONES AGUAS/SADR - 32,236 USD 712,773 3 7 1
144A-
712.773 3.71
7.207 483 37 50 TOTAL SHARES 712.773 3 1 1
TOTAL TRANSFERABLE SECURITIES TRADED ON
ANOTHER REGULATED MARKET 712,773 3.71
TOTAL INVESTMENTS 16,016,428 83.35
CHILE
ANDINA ISADR (6 PREF. A )
BANCO SANTANDER /SADR.
EMPR.NAC EL./SP.ADR (30A)
31.598 US0 414,911 2 16
6500 US0 296.595 1 5 4
23758 USD 713.453 3 7 2
OTHER NET ASSETS LESS LIABILITIES 3.199.0A3 16.65 1.424 959 7.42
COLOMBIA TOTAL NET ASSETS 19,215,411 .!oO:OO
SURAMERICANA DE
INVERSIONES
96.431 COP 620746 3 2 3
620.746 3 2 3
GREAT BRITAIN
ANTOFAGASTAPLC 19,718 GBP 168.177 0.88
168.177 0.88
LUXEMBOURG
TENARIS !ADR 15.769 USD 566.107 2.95
566.107 2.95
-.. .
.
A .... . HSBC Global Investment Funds
. . .

-
Portfolio of Investments and Other Net Assets I " - I
LATIN AMERICAN FREESTYLE
Economic Division of Investment
(expressed as a percentage of net assets)
Retail trade, department stores Energy Transport News transmission Construction, building materials Coal mines, heavy industries Miscellaneous Other services Banks and financial institutions Tobacco and spirits Public services Insurance Real estate companies Holding companies Package and container industry Automobile industry Gastronomy Precious metals Other business houses Non-ferrous metals Pharmaceuticals and cosmetics Agriculture and fishing
Other net assets less liabilities
7.90 7.52 6.79 6.01 5.82 5.75 5.68 5.12 4.70 4.40 3.72 3.23 3.12 3.03 2.16 1.83 1.56 I .44 0.99 0.88 0.87 0.83
16.65
Total Net Assets 100.00
HSBC Global Investment Funds .-

. -. ...
Portfolio of Investments and Other Net Assets .~ _. .-. .. . .
UK FREESTYLE Statement of investments as at 30 September 2006 (expressed in GBP)
Description
Description Puanllly Currency Evaluation % net assets
-
TRANSFERABLESECURlTlESTRADEDONANOTHERREGULATED MARKET
SHARES
Quanlily Currency Evaluation YO net assets
GREAT BRITAIN
INVESTMENTS
TRANSFERABLE SECURITIES ADMITTED TO AN OFFICIAL STOCK EXCHANGE LISTING
SHARES
GREAT BRITAIN
BAE SYSTEMS PLC
BARCLAYS PLC
BBA GROUP PLC
BG GROUP PLC
BP PLC
DAILY MAIL & GENERAL TR. -A-
DOMESTIC & GENERAL GROUP
PLC GKN PLC
HBOS PLC
HELPHIRE GROUP LONDON
HOMESERdE
HSBC HOLDINGS PLC
INCHCAPE PLC
JOHNSON MATTHEY PLC
LEGAL 8 GENERAL GROUP PLC
RESOLUTION PLC
ROYAL BK OF SCOTLAND PLC
ROYAL DUTCH SHELL -6-
ROYAL DUTCH SHELL PLC -A-
SHIRE PLC
TAYLOR WOODROW PLC
UTD BUSINESS MEDIA
YELL GROUP PLC
31 GROUP PLC
GUERNSEY
ALPHAPYRENEESTRUSTLTD
208 912
35,750
121 230
54 706
152,024
83.602
41.314
175,703
72.301
180 682
14.720
34,850
86.609
39.729
375.424
80 992
31.574
2
13.357
50,900
87,300
77,651
45.000
44,000
312.923
GBP
GBP
GBP
GBP
GBP
GBP
GBP
GBP
GBP
GBP
GBP
GBP
GBP
GBP
GBP
GBP
GBP
GBP
GBP
GBP
GBP
GBP
GBP
GBP
832.661
242,385
321.866
361 755
893,763
509,136
398 680
521.838
770,913
708.982
243 616
340,763
455,996
550 247
531.600
495.671
581 837
36
236 820
448 938
311.661
514 438
269 550
414 700
6.86
2 00
2 66
2.98
7 38
4.20
3.29
4.31
6.36
5.85
2.01
2.81
3.76
4.54
4.39
4.09
4.80
0.00
1.95
3.70
2.57
4.24
2.22
3.42
GBP 294,148 2.43
TOTAL SHARES
294.148 2.43
11,252,000 92.8A -
TOTAL TRANSFERABLE SECURITIES ADMITTED TO
AN OFFICIAL STOCK EXCHANGE LISTING 11,252,000 92.84
TRADING EMISSIONS PLC -C- 417 520 GBP 430,046 3.55
430,046 3.55
~.
TOTAL SHARES 430,046 3.55
TOTAL TRANSFERABLE SECURITIES TRADED ON ANOTHER REGULATED MARKET 430,046 3.55
TOTALINVESTMENTS 11,682.046 96.39
OTHER NET ASSETS LESS LIABILITIES 437,606 3.61
TOTAL NET ASSETS 12,119,652 100.00
A HSBC Global Investment Funds . - . ..

I - ._
Portfolio of Investments and Other Net Assets . -.
I
UK FREESTYLE
Economic Division of Investment .- .-
.. (expressed as a percentage of net assets)
. ..-
Yo
Banks and financial institutions Energy Insurance Mechanics, machinery Aerospace technology Miscellaneous Graphic art and publishing Public services Precious metals Other business houses Pharmaceuticals and cosmetics Holding companies Construction, building materials
Other net assets less liabilities
21.82 12.31 11.77 6.97 6.88 6.63 6.46 5.56 4.54 3.76 3.70 3.42 2.57
3.61
Total Net Assets 100.00
HSBC Global Investment Funds . .. . .. . .

of Investments and Other Net Assets .- ~
BRAZILBOND b EURO CORPORATE BOND Statement of Investments as at 30 September 2006 (expressed in USO) Statement of investments as at 30 September 2006 (expressed in EUR)
Description _. . ..
Description Face Value Currency Evaluatian % net assets
._
Face Value Currency Evaluation "A, net assets
INVESTMENTS INVESTMENTS
TRANSFERABLE SECURITIES ADMITTED TO AN OFFICIAL STOCK
EXCHANGE LISTING
BONDS
TRANSFERABLE SECURITIES ADMITTED TO AN OFFICIAL STOCK EXCHANGE LISTING
BONDS
BRAZIL AUSTRALIA . .
TELSTRA CORP 396 05-28.6.10 BRASIL LETR FIN TV 01-15 11 06 830 BRL 1096982 1971
BRAZIL TV 03-20 06 07 40,700 BRL 537.954 9 6 7
1,634 936 29 38
~. . ~
100.000
155,000
125.000
400.000
120 000
250,000
150 000
260 000
250.000
200 000
500,000
170,000
150.000
150.000
210,000
400,000
120.000
50,000
350.000
EUR 96,327 0.19
96327 0 19 .-
AUSTRIA
TOTAL BONDS 1,634,936 29.38
TOTAL TRANSFERABLE SECURITIES ADMITTED TO TELEKOM F.3 3759; 05-10 EMTN EUR 151.430 0.29
AN OFFICIAL STOCK EXCHANGE LISTING
FINANCIAL INSTRUMENTS
1,634,936 29.38 151 430 0.29
BELGIUM -.
BARRY CALLEBAUT 9.25% 03.10
REG FORTIS BANK 4 625% 04-PERP.
COMMERCIAL PAPER EUR 133,125 0.26
EUR 399,942 0 7 8
533.067 1 0 4
~- BRAZIL
BANCO BRADESCO 06-28 5 07 CP BCO BNP BRAZIL 06-28 5 07 CP
BCO SANT BRASIL 06-28 5 07 CP ClTlBANK BRAZIL 06-04 6 07 CP
1.130
1,130
1.130
1,130
1100
1130
1,100
BRL 543,759 9 7 7 CAYMAN ISLANDS
BRL 544.001 9.77
BRL 544.292 9.78
BRL 541 739 9.73
BCP FIN 5 543% 04-
BE$ FIN 6 625% 02- EMTN
MIZUHO CAP 5 02%(TV) 06-
PERP MUFG CAP FIN2 4 85°/0(TV)06 PERP
EUR 126064 0.24
EUR 276,201 0.54
EUR 150,364 0.29
2.173 791 39.05 ~- . . .
EUR 256.369 050
808,998 1.57
CAYMAN ISLANDS
BCO ABN AMRO REAL06-28.5.07 CP
BRL 529,866 Y.52 DENMARK
DANSK NATURGAS N S 5.5%05- PERP DANSKE BANK 4.25% 03-20 6.16
EUR 252.079 0 4 9
EUR 201 229 0.39
529866 9.52
GREAT BRITAIN
HSBC 06-28 5.07 CP
PORTUGAL
BRL 544,123 9 7 8 453308 0 8 8
FINLAND
M-REAL TV 06-1 3 SEN.
/MULTICP NORDEA BK FIN.5 75%(TV) 02-
14 SAMPO OYJ 4.625%(TV)04-14
REG STORA ENS0 5.125% 04-23 6.14
EUR 486.138 0 9 5
EUR 177,223 0 3 4
EUR 151.746 0.29
EUR 155.373 0.30
970480 1 8 8
__
BANCO ITAU S.A.06-18.6.07 CP BRL 529,559 9.52
529559 9.52
~. ...
TOTAL COMMERCIAL PAPER
TOTAL FINANCIAL INSTRUMENTS
TOTALINVESTMENTS FRANCE
OTHER NET ASSETS LESS LIABILITIES
TOTAL NET ASSETS
AGF 4.625%(TV) OS-PERF
ALCATEL 6 375% 04-7.4.14
EMTN AXA SA 5.777"h(TV) 06- ... PERP
BOUYGUES 4.5% 06-24.5.13
CARREFOUR 4 375% 03-1 1 EMTN
153,091 2.75 EUR 204.806 0.40
EUR 422.416 0.82
EUR 125.483 0 2 4
EUR 50,752 0.10
EUR 355,943 0.69
5,565,366 100.00
HSBC Global Investment Funds

Description Face Value Currency Evaluation YO net assets
Description Face Value Currency Evaluation YO net assets
CIE ST GOBAIN 4.25%06-
31 05 11 CLF 4 3°/o(TV)OJ-PERP
CNCEP 5.25% 03 EMTN
CROWN EUR 6 25% 05-01 09.1 1
EUROPCAR GR 8 125% 06-14
REGS FRANCE TELECOM 7.25% 03-13
EMTN GIE PSA TRES.5.875%01-
27.09.11 GIE SUEZ ALLIANCE 4.25% 03-
10 LAFARGE 5 875"/001-06.11 .OR
LVMH 5% 03-29.4.10 EMTN
REMY COINTR 6.5% 03-1.7.10
RENAULT 6.125%02-26.06 09
SCHNEID ELECT.3.125%05-
THALES 4.375% 04-22 07 11
EMTN VALE0 3.75% US-24 06.13
VEOLIA ENV 6 125% 03-33 EMTN
VIVENDI 4.5% 06-3 10.13
i i.a.10
450.000 EUR
200,000 EUR
120000 EUR
280000 EUR
250,000 EUR
625.000 EUR
210,000 EUR
200,000 EUR
255,000 EUR
350.000 EUR
235,000 EUR
150,000 EUR
175000 EUR
150.000 EUR
150000 EUR
245.000 EUR
200,000 EUR
451,541
194,909
i25,49a
295.313
264.688
724.303
226,519
202,264
264,528
361,289
246,368
157 916
169 613
152.567
141,206
278.130
199.945
o ea
o 3a
0 24
0 57
0 51
1 42
0.44
0 39
0 51
0 70
0 48
0 31
0.33
0 30
0 27
0 54
0 39
CADBURY SCHW 4 25% 04-
30.06.09 COMPASS GR 6% 02-29.5.09
EMTN CORUS 7.5% 04-1.10.11 SENIOR
GALLAHER 4 625% 04-
10 6 11 EMTN HBOS CAP.4.939"/o(TV)06-PERP
IMP.TOBA.FIN.6 25%02-06 06.07
INEOS GROUP 7.875% 06-16 REG. MM02 6.375% 02-25 1.07 EMTN
NATIONAL GRID 5~~ 03-2.7 i a NORTH WEST WATER 4.875%
99-09 OTE PLC 5% 03-5.8.13 EMTN
RENTOKIL INITIAL 5 75% 02-07
TESCO PLC 3.875% 06-24.03.11
VODAF.AIR.4.25%03-27.05 09
125 000
120 000
340,000
250 000
550 000
335,000
600.000
235,000
200,000
450,000
255.000
125.000
150,000
600.000
200.000
250.000
150.000
120.000
550.000
200,000
300.000
550,000
135,000
160.000
180,000
200 no0
450,000
I.450.000
EUR 125688 0 2 4
EUR 125646 0 2 4
EUR 359,989 0 7 0
EUR 254885 0 4 9
EUR 557730 1.08
EUR 339958 0 6 6
EUR 564105 1 1 0
EUR 236867 0 4 6
EUR 204862 0 4 0
EUR 460397 089
EUR 261 594 0 5 1
EUR 126424 0 2 5
EUR 149354 0 2 9
EUR 604871 I i a
GREECE
PUBLIC POWER 6 25% 00 8 1 1 10
EUR 215.543 0.42
5,615 997 10.91 215543 042
GERMANY GUERNSEY
BAYER AG S%(TV) 05-29.7.2015
BERTELSMANN 3.625% 05- 06.1 0.1 5 BERTELSMANN 4 75% 06-
26.09.16 BMW FIN.3.875°/u 04-6.4.1 1
EMTN ESCADA 7.5'X 05-1.04.12 REGS
EWE AG 4.875% 04-14.10 19
GERLING LEBEN.6.75%(TW05-
PERP HENKEL 5.375 05-2104 STEP-UP
HORNBACH BAU 6.125% 04-14
REGS KABEL DEUTSCHL.10.75Yo 04-
14REG KLOECKNER PENTAPL.9.375'X
02-12 MTU AERO 8.25% 04-1.4 14 REGS-1 4.14 SNR MUNICH RE FIN.6.75%03-
21 06 23 PER1 5.625% 04-15.12.11 REGS
TCHIBO HLDG 4 570 04-13.10.14
TU1 5.125"/. 05-10.12 12 REG.S
VOLKSWAG.LEAS.4.125%06-
31.5.11
1 100,000 EUR
50000 EUR
130000 EUR
395.000 EUR
150,000 EUR
120,000 EUR
300.000 EUR
550000 EUR
100.000 EUR
230,000 EUR
230,000 EUR
330,000 EUR
200.000 EUR
275000 EUR
430,000 EUR
650.000 EUR
300,ooo EUR
9aa 278
46 323
130 432
394.216
160,696
124.117
333,951
517,157
103.431
257 a32
245 525
370,232
227.686
282.219
430.674
616.778
300 633
1 92
0.09
0.25
0 77
0 31
0 24
0 65
1 00
0 20
0 50
o 4a
0 72
0 44
0 55
o a4
1 20
0 58
ABB INT.FIN.6.5% 03-1 1 EMTN-
TERM NOTES 2
EUR 276244 0.54
276244 0.54
HONG KONG
HUTCHINSON WHAMPOA
F.5.875 7b 03-8.7.13 STD CHART.5.375% 99-6.5.09
EMTN
EUR 162.992 0.32
EUR 124,147 0.24
287,139 0 5 6
HUNGARY
BINA-ISTRA 8% 03-15.12.22
IRELAND
613.834 1.19
BK IRELAND 7 4CO1-PERP
MTNI
EUR 226.009 0 4 4
226.009 0.44
ITALY
AUTOSTRADE 5% 04-9 6 14
EMTN BCA INTESA 3 5% 06-24 02 11
ENEL 5 25% 04-20 05 24 EMTN
HERASPA4125%06-160216
MONTE PASCHI
S.4.5%(TV)24.9.15 TELE ITALIA 5 375% 04-19 EMTN
UNICREDITO 3 95% 06-1 2 16
EUR 311,313 0.60
EUR 541,290 1.06
EUR 146,220 028
EUR 157733 0 3 1
EUR 182,798 035
EUR 198300 0 3 9
EUR 429,291 0 8 3
5,530.180 10.74
GREAT BRITAIN
AI6 UK 2 5.1429',ITV) 06-PERP.
ANGLIAN WATER 4.625% 03-15
ANGLO AM CAP.3.625%03-
05.06.08 BAA 4.5% 04-30.9.14 EMTN
BARCLAYS 4 875% 04-PERP
BAT INTL FIN.5.125% 03-13
EMTN
310000 EUR 316.906 0 6 2
90000 EUR 92,400 0 18
150.000 EUR 149,243 0.29
1,966,945 3.82 125,000 EUR 125,573 0.24
2io.000 EUR 202.a57 0.39
250,000 EUR 260458 0.51
JERSEY
HSBC CAP FOG 5.3687%03-
PERP.
EUR 1,526.712 2.97
HSBC Global Investment Funds ~.
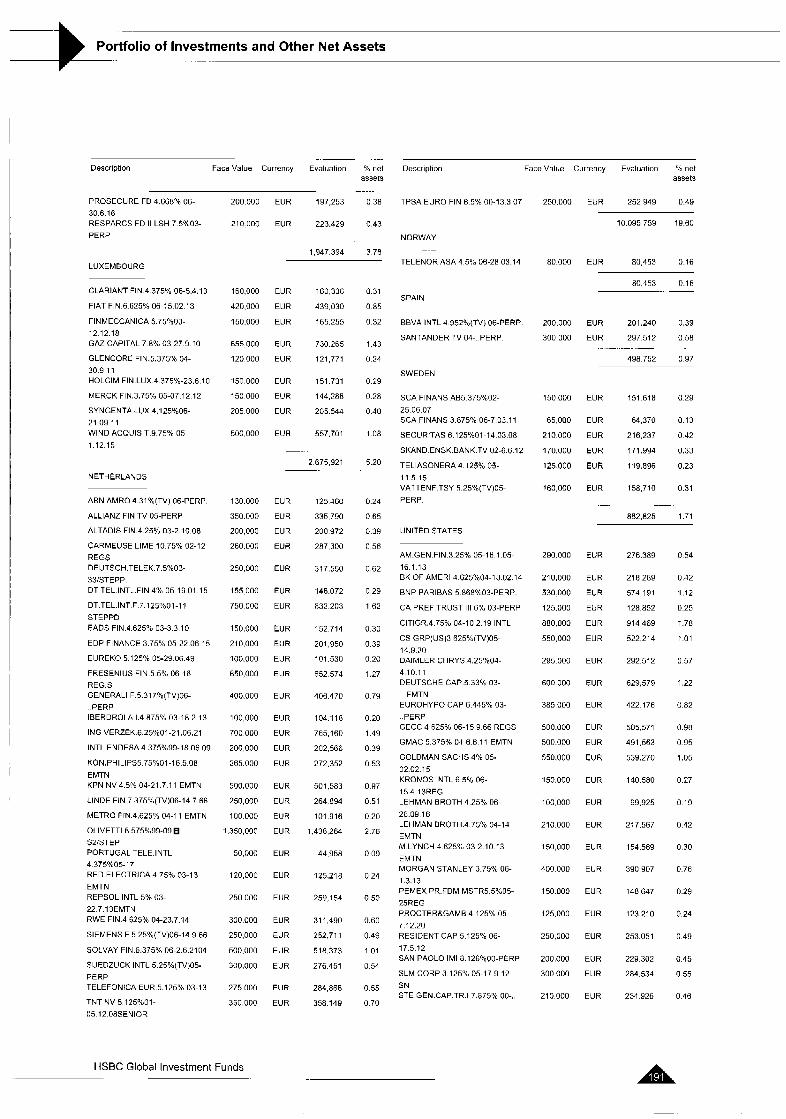
._
Portfolio of Investments and Other Net Assets - ..
. ~ ...
Description Face Value Currency Evaluation YO net assets ....
PROSECURE FD 4.668% 06-
3 0 6 16 RESPARCS FD II LSH 7.5%03-
PERP
LUXEMBOURG
CLARIANT =IN.4 375% 06-5.4.13
FIAT FIN.6.625% 06-15 02.13
FINMECCANICA 5.75%03-
12 12 18 GAZ CAPITAL 7 8% 03-27.9.10
GLENCORE FIN.5.375% 04-
3 0 9 1 1 HOLCIM FIN.LUX.4.375%-23.6.10
MERCK FIN.3.75% 05-07.12 12
SYNGENTP LUX 4.125%06-
21.09.11 WIND ACQUISIT.9.75% 05- 1.12.15
NETHERLAUDS
ABN AMRO 4.31%(TV) 06-PERF.
ALLIANZ FIN TV 05-PERP
ALTADIS FIY.4.25% U3-2 10.08
CARMEUSE LIME 10.75°/~ 02-12 REGS DEUTSCH.TELEK.7.5%03-
33ISTEPP. DT TEL INT-.FIN 4% 05-19 01.15
DT.TEL.INT F 7.125"'oOl-I1
STEPPD EADS FIN.4.625"'o 03-3 3 10
EDP FINANCE 3.75% 05-22.06 15
EUREKO 5.125% 05-29 06.49
FRESENIUS FIN.5.5% 06-16 REG.S GENERAL1 F 5.317%(TV)06-
PERP IEERDROLA 1.4.875% 03-18 2.13
ING VERZEK 6.25%01-21.06.21
INTL ENDESA 4 3750/~99-18.06 09
KON.PHlLIPS5.75°,~01 -16.5.08
EMTN KPN NV 4 5% 04-21.7.1 1 EMTN
LINDE FIN 7.375°/o(TV)06-14.7 66
METRO FIN 4.625% 04-1 1 EMTN
OLlVETTl 6.575%99-09
SZISTEP PORTUGAL TELE.INTL 4.375%05-17 RED ELECTRICA 4.75% 03-13
EMTN REPSOL INTL 5% 03- 22 7.13EMTU RWE FIN.4 625% 04-23.7 14
SIEMENS F 5 25%(TV)06-14.9.66
SOLVAY FIN.6.375"o 06-2.6.21 04
SUEDZUCK INTL 5 25°/~(TV)05- PERP TELEFONICA EUR.5.125"/0 03-13
TNT NV 5 125?/,01-
05 12.08SENIOR
200 000
2 1 0 I100
160,000
420.000
150,000
655 000
120 000
150 000
150 000
205 000
500.000
130 000
350 000
200.000
260.000
250.000
155 000
750 000
150 000
210.000
100.000
650,000
400.000
100,000
700 000
200,000
265.000
500.000
250,000
100 000
1,350,000
50,000
120,000
250 000
300 000
250.000
500.000
300.000
275 000
350,000
EUR 197,253 0 3 8
EUR 223.429 0.43
1,947394 3 7 8
EUR 160.336
EUR 439,030
EUR 165.255
EUR 730.265
EUR 121,771
EUR 151 731
EUR 144,288
EUR 205544
EUR 557,701
2 675,921
EUR
EUR
EUR
EUR
EUR
EUR
EUR
EUR
EUR
EUR
EUR
EUR
EUR
EUR
EUR
EUR
EUR
EUR
EUR
EUR
EUR
EUR
EUR
EUR
EUR
EUR
EUR
EUR
EUR
125 460
335,790
200 972
287.300
317,550
148 072
832.203
152 714
201,950
101.530
652.574
406.470
104 118
765,160
202.566
272,352
501.583
264 894
101.916
1.436.264
44,958
125.21 8
259,154
31 1,490
252.71 1
518.373
276.451
284,868
358 149
0.31
0 85
0 32
1 4 3
0.24
0.29
0.28
0.40
1.08
5.20
0.24
0.65
0.39
0.56
0.62
0 29
1 62
0.30
0 39
0 20
1.27
0 79
0.20
1.49
0.39
0 53
0 97
0.51
0.20
2.78
0.09
0.24
0.50
0.60
0 49
1 0 1
0 54
0.55
0.70
Description Face Value Currency Evaluation % net
TPSA EURO FIN 6 5% 00-13 3 07
NORWAY .. .-
TELENOR ASA 4 57" 06-28 03.14
SPAIN
BBVA INTL 4 952%(TV) 06-PERP
SANTANDER TV 04- PERP
SWEDEN
SCA FINANS AB5.375%02-
25 06 07 SCA FINANS 3 875% 06-7 03.1 1
SECURITAS 6.125%01-14.03.08
SKAND ENSK.EANK.TV 02-6.6 12
TELIASONERA 4.125% 05-
11.5.15 VATTENF.TSY 5.25?b(TV)05-
PERP.
UNITED STATES
AM.GEN.FIN.3.25% 05-16 1 US- 16.1.13 BK OF AMERI 4 6259004-18 02.14
BNP PARIBAS 5.868%03-PERP.
CA PREF TRUST 1 1 1 6% 03-PERP
ClTlGR.4.75'70 04-10 2.19 INTL
CS GRP(US)3 625"/o(TV)05-
14.9.20 DAIMLER CHRYS.4.25%04-
4 10.1 1 DEUTSCHE CAP.5.33% U3-
EUROHYPO CAP 6.445% 03-
..PERP GECC 4.625% 06-15 9 66 REGS
GMAC 5.375% 04-6 6 11 EMTN
GOLDMAN SACHS 4% 05. 02.02.15 KRONOS INTL 6 5% 06-
15.4.13REG LEHMAN BROTH 4 25% 06-
26.09 16 LEHMAN EROTH.4 759.b 04-14
EMTN M LYNCH 4 625% 03-2.10.13
EMTN MORGAN STANLEY 3.75% 06- 1.3.13 PEMEX PR.FDM MSTR5 5%05- 25REG PROCTERtGAMB.4.125°/. 05- 7.12.20 RESIDENT CAP 5.125% 06-
17.5.12 SAN PAOLO IMI 8 126%OO-PERP
SLM CORP 3.125"I. 05-17.9 12 SN STE GEN.CAP.TR.1 7 875% 00-..
.EMTN
250,000
80.000
200,000
300 000
150,000
65,000
210.000
170.000
125.000
160 000
290.000
210,000
530 000
125.000
880.000
550.000
295.000
600 000
385 000
500.000
500.000
550.000
150.000
100,000
210.000
1so,ooo
400 000
150 000
125.000
250,000
200,000
300 000
210 000
assets
EUR 252949 0.49
10.095 759 19.60
EUR 80453 0.16
80.453 0.16 ~
EUR 201.240 0.39
EUR 297512 0 5 8
498.752 0 9 7
EUR 151 618 0 2 9
EUR 64,370 0 13
EUR 216.237 0 4 2
EUR 171.994 0.33
EUR 119.896 0.23
EUR 158,710 0.31
-. -_ 682,825 1.71
EUR
EUR
EUR
EUR
EUR
EUR
EUR
EUR
EUR
EUR
EUR
EUR
EUR
EUR
EUR
EUR
EUR
EUR
EUR
EUR
EUR
EUR
EUR
276.389
218.289
574,191
128.852
914,469
522.214
292.512
629,579
422 176
505.571
491.563
539.270
140 580
99.925
217.567
154.589
390 907
148.647
123.210
253.051
229,302
284.534
234 926
0.54
0.42
1.12
0.25
1.78
1.01
0 57
1.22
0.82
0.98
0.95
1.05
0.27
0.19
0.42
0.30
0.76
0.29
0.24
0.49
0.45
0.55
0 46
HSBC Global Investment Funds ... Ilh

---1 .
Portfolio of Investments and Other Net Assets
I
-. _ Description Facevalue Currency Evaluation :Cnet EURO CREDIT BOND
assets Statement of Investments as at 30 September 2006 (expressed in EUR)
UBS PREF FD TV 05-PERP 210,000 EUR 206793 0 4 0
7,999,106 15 53
TOTAL BONDS 47,445,518 92 14
TOTAL TRANSFERABLE SECURITIES ADMITTED TO AN OFFICIAL STOCK EXCHANGE LISTING 47.445.518 92 14
TRANSFERAELESECURlTlESTRADEDONANOTHERREGULATED MARKET
... ~
Description QuantityIFace Currency Evaluatian % ne1 Value assets
INVESTMENTS
BONDS TRANSFERABLE SECURITIES ADMITTED TO AN OFFICIAL STOCK
EXCHANGE LISTING
BONDS
CAYMAN ISLANDS
BCM IRL FIN TV 06-
15.08.16REGS
250000 EUR 258.975 050
AUSTRIA 258.975 0 50
BK AUSTRIA 5 75% 01-22.2.13
EMTN
600000 EUR 659.380 1.35 TOTAL BONDS 256.975 0.50
TOTAL TRANSFERABLE SECURITIES TRADED ON ANOTHERREGULATEDMARKET 258,975 0.50 659,380 135
CAYMAN ISLANDS TOTAL INVESTMENTS 47,7g4,493 92.64
MIZUHO FIN 4 75% 04-
15.4.14REG SANTANDER C.HlSP.4.5%04-
l9EMTN
1,500,000 EUR 1,524,648 3 11
300 000 EUR 305568 0 63 OTHER NET ASSETS LESS LIABILITIES 3,791.730 7.36
TOTAL NET ASSETS 51,496,223 100.00 1,830,216 3 74
.- ~
FIN LAND
FORTUM OYJ 4.5% 06-20 06.16
SAMPO OYJ 4.625%(TV)04-14
REG
510,000 EUR 519.784 1.06
2.700.000 EUR 2,731,423 5 59
3,251,213 6.65
2.19
1.13
2.15
2.10
1.78
1.60
3.34
0 28
1 1 7
1.15
2.05
2.04
FRANCE
CNCEP 5 6% 99-5.11.2011
COFIROUTE 5.875% 01-9.10 16
CREDIT LOGEM.4.604%(TV)06-
PERP CRH 4.25% 03-25.10.14
FRANCE 3 25% 05-25.4 16 OAT
FRANCE 5.75% 01-25 10.32
BTAN FR.TELECOM 7% 02-23 12.09
EMTN FR.TELECOM 8 125%03-28.01 33
RFF 4.375% 06-2.6 22
SCOR ASSIST.G.l54%(TV)06-
PERP TOTAL CAPITAL 3.875% 06- 6.9 11 UNlBAlL HLD 4% 04-1 1 EMTN
1,000,000
500.000
1,050,000
1,000,000
900 000
600 000
1 500,000
100.000
550,000
550 000
1 .ooo.ooo
1 .ooo.ooo
EUR 1,072268
EUR 554.513
EUR 1,04a6a2
EUR 1,025270
EUR 869670
EUR 780.360
EUR 1633387
EUR 136200
EUR 571 601
EUR 563.604
EUR Y99.900
EUR 997.345
10,252,800 20 98 .- ~. .
GERMANY
BERTELSMANN 4.759L 06- 26.09.16 GERMANY 3 5% 05-04.01.16
HENKEL 5 375 05-2104 STEP-UP
550.000 EUR 551.826 1.13
1.000.000 EUR 988.700 2.02
aoo.ooo EUR 752,228 1.54
2,292.754 4.69 __ ~ .. GREAT BRITAIN
ANGLIAN WATER 4.625% 03-13 1,000,000 EUR 1,026,665 2.10
HSBC Global Investment Funds

.~ _.
Portfolio of Investments and Other Net Assets _. ~
Descriotion QuantitviFace Currency Evaluation 'IO net QuanlilylFace Currency Evaluation % net Value assets Value
500 000
1,000 000
600.000
600.000
1,400.000
400,000
500,000
900,000
750 000
1.000,000
500,000
1.400,OOO
750 000
700 000
1 .ooo,ooo
800 000
500,ooo
1.000,000
800 000
600,000
700,000
1,000.000
500.000
650 000
800,000
900.000
210.000
930.000
assets ....
SPAIN EUR 493790 1 0 1
EUR 965100 1.97
EUR 602.650 1.23
EUR 643.373 1.32
EUR 1351.697 2 7 7
BAA PLC 4 5% 06-15 2 18
BAT INTL FIN 3 625% 05-29 6 12
GALLAHER GRP 4 5% 06- 2 04 14 HSBC HLDS 5 375%02-20 12 12
VODAPHONE GRP 3 6259.05- 29 11 12
BBVA INTL A,952%(TV) OB-PERP 700,000 EUR 704.134 1.44
704 134 1 4 4
UNITED STATES
BNP PARIBAS 5 868%03-PERP.
CARGILL 4 375% 06-29 4 13
CL CAP.TRUST 1 CRYL.TV-
PERP COMMZBK CAP.5 012'o(TV)06-
PERP CS GRP(US)3 625%(TVj05-
14.9 20 LEHMAN BROTHERS 4% 06-
4.5.1 1 WACHOVIA CORP 4 375% 06- 1.8.16
500,000 EUR 541 690
350000 EUR 353,250
1,600.000 EUR 1815559
700.000 EUR 695951
700.000 EUR 664,636
1,070,000 EUR 1 068.229
700000 EUR 712.562
1 1 1
0 72
3 71
1 42
1 36
2.19
1.46
5,083.275 10 40
GREECE
GREECE 3 10% 05-20.04 10
GREECE 3.6% 06-20.7.16
EUR 392.560 0 8 0
EUR 485300 1 0 0
877.860 1.80
IRELAND
FlOlS RETAIL FIN TV06-11.05 09 EUR 910,040 1.86
910.040 1.86 5,851,877 11.97
ITALY TOTAL BONDS 47,633,245 97.45
TOTAL TRANSFERABLE SECURITIES ADMITTED TO
AN OFFICIAL STOCK EXCHANGE LISTING 47.633.245 97.45
TRANSFERABLE SECURITIES TRADED ON ANOTHER REGULATED
MARKET
ClRlNT 5 753; 04-16.12 2024
EDISON 5 125% 03-10.12.10
EMTN HERA SPA 4.125% 06-16.02.16
LOTTOMATICA SPA 4 8% 03- 22.12.08 TELECOM ITALIA 4.75O/.06-
19 5 14
EUR 707 726 1.45
EUR 1,040,660 2.13
EUR 492.915 1.01
EUR 1,420,365 2.90
EUR 738023 1.51
OPTIONS ON FUTURES
GERMANY
4,399 689 9.00 . .........
PUT EURO-BOBL 5YR 6% FUT 50 EUR 15.000 0 0 3
(EUX) 109 75 23111:2006
15.000 0 0 3
JAPAN
BK TOKYO MlTSUB.3.5% 05-15
SHlNSEl BK 3.75%06-
23.02.16/RG
EUR 683465 1.40
EUR 975771 1.99 TOTAL OPTIONS ON FUTURES 15,000 0.03
TOTAL TRANSFERABLE SECURITIES TRADED ON
ANOTHERREGULATEDMARKET 15,000 --O.Oj
TOTAL INVESTMENTS 47,648,245 97.48
1.659 236 3.39
JERSEY ~
AIG.SUN.III 4.75% 03-11.09.13
HSBC CAP.8.03% 00-
EUR 838696 1.72
EUR 592,544 1.21 OTHER NET ASSETS LESS LIABILITIES 1.231.641 2.52
1,431.240 2.93 TOTALNETASSETS ..... 48,aao,oa6 1oo.00
LUXEMBOURG
BANQUE DU LUXEMBOURG TV
02-PERP. MERCK FIN.3.75% 05-07.12 12
SOGERIM 74bO1-20.04 11
EUR 1,142,545 2.35
EUR 769 536 157
EUR 671 574 137
2.583 655 5.29
NETHERLANDS
DAIMLERCH.7%01-21.03 11
DT TEL INTL4.75% 06-18 EMTN
ELM BV 5.252"/o(lVj 06-PERP.
GENERAL1 F.5.317%(TV)06-
..PERP ING VERZ.3.5% 05-28 11 12
OLlVETTl FIN 7.25%02-24 04.12
SIEMENS F.5 25C(TVj06-14 9.66
URENCO FINANCE 3.375% 05-10
EUR 772668 158
EUR 997,681 2 0 4
EUR 506.235 1 0 4
EUR 660,514 135
EUR 780.192 1 6 0
EUR 1.007.060 2.06
EUR 212.277 0 4 3
EUR 909.249 1.86
5,845 876 11 .96
HSBC Global Investment Funds ......... A

.-..
Portfolio of Investments and Other Net Assets ..
EURO INVESTMENT GRADE BOND Statement of investments as at 30 September 2006 (expressed in EUR)
Description Face Value Currency Evaluation ?h net assets
GERMANY 4 75% 98-28
HENKEL 5.375 05-2104 STEP-UP
4.135.000
750,000
600 000
450.000
aoo ooo 800,000
4 400,000
700.000
19,100 000
4 500 000
300 000
500,000
400 000
700.000
600,000
650,000
800 000
900.000
925 000
700 000
fi00.000
680.000
500.000
350,000
400.000
340.000
1 000.000
EUR 4.663.040 2.65
EUR 705.214 0.40
26,153.626 14.89 .- Description
INVESTMENTS
Face Value Currency Evaluation "h net assets
GREAT BRITAIN
ANGLIAN WATER 4.625C 03-13
BAA PLC 4 5 % 06-15.2 18
BAT INTL FIN 3 625% 05-29.6.12
GALLAHER GRP 4 5% 06-
2.04.14 HBOS TRS.SERV.3.5% 04-
12 2.09 VODAPHONE GRP 3.625%5- 29.11.12
EUR 615,999 0.35
EUR 444.411 0.25
EUR 772,671 0.44
EUR 803.533 0.46 TRANSFERABLE SECURITIES ADMITTED TO AN OFFICIAL STOCK EXCHANGE LISTING
BONDS
EUR 4.380.733 2.50
EUR 675.849 0.38
7,693.196 4 38 . .
AUSTRIA
GREECE BK AUSTRIA 5.75% 01-22 2.13
EMTN REP.AUSTRIA 3.5% 05-15.9.21
5 ~100.000
5 900.000
900.000
400.000
500,000
900.000
4,500,000
350.000
4,300,000
500.000
600 000
5 500.000
14,u0o.ouo
1,150,000
5.390.000
1 000.000
300 000
2.000,000
500 000
4.400,OOO
370 000
400.000
8.000 000
11,400 000
EUR 5,494.833 3.13
EUR 5687.600 3 2 3 GREECE 3.6% 06-20 7 16 EUR 18,538460 10.55
11.182.433 6.36 IRELAND
CAYMAN ISLANDS
GEKM.POST.PE.3.75%06-
18 1.1011
EUR 4,504,123 2.56 MIZUHO FIN.4.75% 04-
15.4.14REG SANTANDER C HISP.4.5%04-
19EMTN
EUR 914.789 0 5 2
EUR 407.424 0 2 3 4,504.123 2.56
ITALY
1,322,213 0.75 ClRlNT 5.75% 04-16.12.2024
EDISON 5.125C 03-10.12.10
EMTN HERA SPA 4.125% 06-16.02.16
LOTTOMATICA SPA 4 8% 03- 22 12.08 TELECOM ITALIA 4.75%06-
19 5.14 TERNA SPA 4.9% 04-28.10.24
EUR 283.091 0.16
EUR 520.330 0.30
EUR 394.332 0.22
EUR 710.182 0.40
EUR 590,418 0.34
EUR 687.369 0.39
3.185.722 1.81
FIN LAND
FORTUM OYJ 4.5% 06-20.06.16
SAMPO OYJ 4.625%(TV)04-14
REG
EUR 509.592 0.29
EUR 910.476 0 5 2
1,420,068 0.81
FRANCE
CIE FIN FONC 2 375% 05-29.1 .UY
CIE FIN FONC 4 25% 04-29 1.14
CIF EUROMORTG.4.75%01-
29.10.08 CNCEP 5 6 % 99-5.1 1.201 1
CREDIT LOGEM.4.604%(TV)06-
PERP FRANCE 0% 91-19 OAT
FRANCE 5.25% 98-25.4.08 OAT
FRANCE 5.5% 98-2029 OAT
FRANCE 5.75% 01-25.10.32
BTAN RTE EDF TR 4.125% 06-27.9 16
SCOR ASSIST.6 154"/o(TV)06-
PERP. TOTAL CAPITAL 3.875% 06-
69.11 UNlBAlL HLD 4% 04-11 EMTN
VAUBAN MOB.4.5% 01-28.10.08
EUR 4,370.884 2 4 9
EUR 359.204 0 2 0
EUR 4.391.058 2.50
EUR 536.134 0 3 1
EUR 599.247 0 3 4
EUR 3.390.750 1.93
EUR 14,341.599 8 17
EUR 1426,230 0 8 1
EUR 7.010.234 4 00
EUR 1004.600 0.57
EUK 307,420 0.17
EUR 1,999,800 1.14
EUR 498673 0.28
EUR 4,461,537 2.54
44,697,370 25.45
~
JAPAN
BK TOKYO MITSUB 3 5% 05-15
SHINSEI BK 3 75%06-
23 02 16/RG
EUR 781.103 0.44
EUR 878.194 0.50
1 659.297 0.94
JERSEY .
AIG.SUN.111 4.75% 03-11.09 13
UBS JSY 4.125C(TV) 06-25.9.18
EUR 969742 0.55
EUR 702.170 0.40
1,671.912 0.95
LUXEMBOURG
BANQUE DU LUXEMBOURG TV
02-PERP. MERCK FIN.3 75% 05-07.12.12
EUR 685.527 0.39
EUR 654.106 0.37
1339633 0.76
NETHERLANDS GERMANY
DT TEL INTL 4.75% 06-16 EMTN
ELM BV 5.252%(TV) 06-PERP.
GENERAL1 F.5.317%(TV)06-
..PERP ING BK NV 3 5% 05-16.09.20
ING VERZ.3.5"h 05-28.11.12
EUR 498.840 0.28
EUR 354,365 0.20
EUR 406.470 0.23
BERTELSMANN 4 75% 06-
26.09.16 EWE AG 4.875% 04-14.10.19
GERMANY 3.75% 99-09
GERMANY 4.5% 03-4.1 13
EUR 371 229 0.21
EUR 413,724 0 2 4
EUR 8.038400 4 5 8
EUR 11.962019 6.81 EUR 323.070 0.18
EUR 975,240 0.56
HSBC Global Investment Funds -

.- .-
...
T i f o ' i . of Investments and Other Net Assets -.
.. ~~ .... .. . . . . .
Description Face Value Currency Evaluation 010 net EURO INVESTMENT GRADE CORPORATE assets BOND
Statement of investments as at 30 September 2006 (expressed In EUR) NEDERLD GASUNIE 4.25%6-
20.6 16 NETHERLANDS 3% 04-15.01 10
NETHERLANDS 4% 05-15.01.37
NETHERLANDS 5% 01-15.07.11
OLlVETTl FIN.7 25%02-24.04 12
SIEMENS F.5.25%(TV)06-14.9.66
URENCO FINANCE 3.375% 05-10
900,000
12 600 000
3,600,000
13 000,000
aoo ooo
600,ooo
160.000
400 000
300,000
4 000 000
1 ,I 00 000
500 000
800,000
350 no0
700 000
400 000
430 000
600 000
350 000
EUR 923.110 053
EUR 12.3a2020 705
EUR 13799,499 7 8 6
EUR 895,164 0 5 1
EUR 3,681.360 2 10
EUR 161.735 0.09
EUR 586.612 0 3 3
.- ~ ..
Description Face Value Currency Evaluation C net assets
INVESTMENTS
TRANSFERABLE SECURITIES ADMI'ITED TO AN OFFICIAL STOCK EXCHANGE LISTING
BONDS
NETHERLANDS ANTILLES
BTM CURACAO 3.5% 05-19.04.15 EUR 392.044 0 2 2
392,044 0.22
SPAIN AUSTRALIA
TELSTRA CORP 3% 05-28.6 10
AUSTRIA
BBVA INTL 4.952%(lV) 08-PERP.
CAJA BARCELONA 3.75%06-
1 3 9 1 1
EUR 301,772 0 1 7
EUR 3992,687 2 2 7
4,294.459 2.44
50,000
35.000
150 000
25,000
90 000
60 000
50.000
60.000
50 000
50.000
60,000
35,000
35,000
60,000
10,000
go,ooo
50 000
50.000
25 nu0
48,164 0.46
TELEKOM F.3.375% 05-10 EMTN
BELGIUM
UNITED STATES EUR 34.194 0.32
BANK AMERICA CORP 4% 05-15
CARGILL 4 375% 06-29 4 13
ClTlGROUP 5% 04-2 8 2019
COMMZBK CAP 5 012%(TV)06-
PERP CS GRP FIN(US)3 125% 05-12
HSBC FIN 3 75% 05-4 11 15
LEHMAN BROTHERS 4% 06- 4 5 1 1 MORG STAN CO 4 375%03-
01 03 10 WACHOVIA CORP 4 375% 06- 1 8 1 6
34 194 0.32 EUR 1.09a,571 0.63
EUR 504642 0.29
EUR 860,748 0.49
EUR 347.975 0.20 FORTIS BANK 4.62596 04-PERP.
CAYMAN ISLANDS
149,978 1.42 .. EUR 669,172 0 3 8
EUR 390334 0 2 2
EUR 429288 024 BCP FIN 5 543% 04-
BES FIN 6 625% 02-
BNP PARIBAS 6 625% 01-PERP
MIZUHO CAP 5 02Oh(TV) 06- PERP MUFG CAP FIN2 4 85%(TV)06-
PERP
EMTN
EUR 26,263 0.25
EUR 99,433 0.95
EUR 66.798 0.63
EUR 50,121 0.47
EUR 609 159 0 3 5
EUR 356281 0 2 0
5,266 170 3.00 EUR 59.162 0.56
TOTAL BONDS 168,308,211 95.79 301,777 2 8 6
-. TOTAL TRANSFERABLE SECURITIES ADMITTED TO AN OFFICIAL STOCK EXCHANGE LISTING 168,308,211 95.79
TOTALINVESTMENTS 168,308,211 95.79
OTHER NET ASSETS LESS LIABILITIES 7,391,648 4.21
TOTALNETASSETS 175,699,859 100.00
DENMARK
DANSK NATURGAS AIS 5.5%05-
PERP DANSKE BANK 4 25% 03-20.6 16
EUR 50.416 0.47
EUR 50,307 0 4 8
100,723 0 9 5 .
FINLAND .. -
NORDEA BK FIN.5.75%(TV) 02- 14 SAMPO OYJ 4 625%(TV)04-14
REG STORA ENS0 5 125% 04-23 6 14
EUR 62,550 0.59
EUR 35.407 0.34
EUR 36254 0.34
134.211 1.27 .~
FRANCE
AGF 4 6255L(TV) 05-PERP
AXASA6%01-18 06.13
CARREFOUR 4 375% 03-1 1
EMTN CIE ST GOBAIN 4 25%06-
31 05 11 CLF 4 3%1TV)05-PERP
CNCEP 5 25% 03- EMTN
EUR 58516 0 5 5
EUR 11,150 0.11
EUR 91,528 0.87
EUR 50 171 0 4 8
EUR 48.727 0.46
EUR 26,145 0.25
HSBC Global Investment Funds

-- . .
Portfolio of Investments and Other Net Assets ... -- .
I
.. . ... . . _- Description Face Value Currency Evaluation % net
assets Description Face Value Currency Evaluation % net
assets
FRANCE TELECOM 7.25% 02-13
EMTN
REGS FR TELECOM 7% 02-23 12.09
EMTN GIE PSA TRES.5.875U01-
27.09.1 1 GIE SUEZ ALLIANCE 4.25% 03- 10 LAFARGE 5.875%01-06.11 08
LVMH 5% 03-29.4.10 EMTN
RENAULT 6 125"'002-26.06.09
SCHNEID ELECT.3.1255b05-
FR TELECOM 6 7 5 ~ ~ 01.14.03 oa
I i.a.10 THALES 4.375% 04-22 07.1 1 EMTN VALE0 3 75% 05-24 06.13
VEOLIA ENV.5.375%03-18 CAT2
VEOLIA ENV.6.125% 03-33 EMTN
VIVENDI 4 5% 06-3.10 13
125 000
iao,ooo
70,000
55,000
45 000
65.000
90 000
35,000
50 000
35 000
35 000
15 000
55.000
50,000
115000
50 000
110 000
25,000
110000
115.000
105.000
80.000
mono a5 ooo 35 000
35.000
60 000
65 000
25 000
50 000
25 000
65.000
140 000
45 000
35,000
110000
65.000
35.000
50.000
170 000
EUR 144,861 1.37
EUR 187,004 1.78
EUR 76,225 0.72
EUR 59,326 0.56
EUR 45.509 0.43
EUR 67,429 0.64
EUR 92,903 0.88
EUR 36.847 0.35
EUR 48461 0.46
EUR 35599 0.34
EUR 32,948 0.31
EUR 16.022 0.15
EUR 62,437 0.59
EUR 49.919 0.47
GREECE
PUBLIC POWER 6.25% 00- 8.1 1.10
45 000
35,000
25,000
45.000
100.000
50 000
50 000
50.000
100,000
60 000
50.000
50,000
290 000
70 000
60,000
50,000
35,000
35 000
40 000
50,000
60.000
90,000
60.000
10,000
100,000
50,000
30 000
EUR 48,497 0.46
48.497 0.46
HONG KONG
HUTCHINSON WHAMPOA
STD CHART 5 375% 99-6 5 09
EMTN
F 5 875 06 03-8 7 13 EUR 38.031 0 3 6
EUR 25.864 0.25
63.895 0 6 1
EUR 50,852 0.48
IRELAND
BK IRELAND 7.4%01-PERP
MTN 1
ITALY
AUTOSTRADE 5% 04-9.6 14
EMTN ENEL 5 25% 04-20 05.24 EMTN
HERA SPA 4.125% 06-16.02.16
MONTE PASCHI
S.4 5%(TV)24 9 15 TELE.ITALIA 5.375% 04-19 EMTN
UNICREDITO ITAL. 4.5% 04-2019
UNlCREDlTO 3.95% 06-1.2.16
EUR 103.770 098
1,241 727 11.77 EUR 54,156 0 5 1
EUR 49,292 0.47
EUR 50 777 0 4 8
EUR 99,150 0 9 4
EUR 60.869 0 5 8
EUR 47.699 0.45
GERMANY
BAYER AG 5°6(TV) 05-29 7 2015
BERTELSMANN 3 625% 05- 06 10 15 BMWFIN3875°/004-6411
EMTN EWE AG 4 875% 04-14 10 19
HENKEL 5 375 05-2104 STEP-UP
MUNICH RE FIN 6 75"/003-
21 06 23 TCHIBO HLDG 4 5% 04-13 10 14
VOLKSWAG LEAS 4 125°/u06
31 511
EUR 103320 0.98
EUR 46323 0.44
EUR 109782 1.04
EUR 25858 0.25
EUR 103431 0.98
EUR 130.918 1.23
EUR 105,165 100
EUR 80.169 0.76
... . .
704,966 6 6 8
465,713 4 4 1
JAPAN
BK TOKYO MITSUB 3.5% 05-15 EUR 48819 0.46
JERSEY
HSBC CAP FOG 5 3687%03-
PERP
30 6 16 RESPARCS FD II LSH 7 5%03- PERP
PROSECURE FD 4 66a% 06-
EUR 305,342 2.90
EUR @9,039 0.65
EUR E3.837 0.60
GREAT BRITAIN
AIB UK 2 5 142%(TV) OB-PERP
ANGLIAN WATER 4 625% 03-13
ANGLO AM CAP 3 625%03-
05 06 08 BAA 4 5 % 04-30 9 14 EMTN
BARCLAYS 4 875% 04-PERP
BAT INTL FIN 5 125% 03-13 EMTN CADBURY SCHW 4 25% 04-
30 06 09 CARGILL INC 4 5%04-29 9 14
EMTN COMPASS GR 6% 02-29 5 09
EMTN GALLAHER 4 625% 04-
1061 iEMTN HBOS CAP 4 939%(TV)06-PERP
MM02 6 375% 02-25 1.07 EMTN
NATIONAL GRID 5% 03-2 7 18
NORTH WEST WATER 4 875%
99-09 OTE PLC 5% 03-5 8 13 EMTN
RENTOKIL INITIAL 5 75% 02-07
TESCO PLC 3.875% 06-24 03 11
VODAF AIR 4 259,03-27 05 09
EUR
EUR
EUR
EUR
EUR
EUR
EUR
EUR
EUR
EUR
EUR
EUR
EUR
EUR
EUR
EUR
EUR
EUR
51,114
87,267
34 a23
35 160
57,959
67,719
25 138
50.845
26,176
66,270
141,968
45.358
35.851
112,532
6 w a i
35,399
49 785
171 379
o 4a
0.83
0.33
0.33
0.55
0.64
0.24
0.48
0.25
0.63
1.35
0.43
0.34
1.07
0.63
0.34
0.47
1.62
LUXEMBOURG
CLARIANT FIN.4.375% 06-5.4.1 3
FINMECCANICA 5.75%03-
12.12.18 HOLCIM FIN.LUX.4.375%-23 6 10
MERCK FIN.3.75% 05-07.12.12
SYNGENTA LUX 4.125%06-
21.09.1 1
EUR 50,105 0 4 7
EUR 38,560 0.37
EUR 35.404 0 3 4
EUR 38.477 0 3 6
EUR 50,132 0.48
212,678 2 0 2
NETHERLANDS _.
ABN AMRO 4 31%(TV) 06-PERP
ALLIANZ FIN TV 05-PERP
ALLIANZ FIN II 6 125C02-
22EMTN ALLIANZ FIN 5 625% 02-29 11 12
ALTADIS FIN 4 25% 03-2 10 08
DEUTSCH TELEK 7 5"/c03-
33,STEPP DT TEL INTL FIN 4% 05-19 01 15
EUR 57.905 0.55
EUR 86,346 0.82
EUR E6.058 0.63
10,926 0.10 EUR
EUR 100.486 0.95
EUR 63,510 0.60
EUR 28.659 0.27 1161,434 11.01
HSBC Global Investment Funds ...... . .- - .... ... .. ..

._
Portfolio of Investments and Other Net Assets . - -
Description Face Value Currency Evaluatian >/. net assets
Description Face Value Currency Evaluation % net assets
DT.TEL.1NT.F 7.125%01-I 1 STEPPD EADS FIN.4.625% 03-3.3.10
EDP FINANCE 3 75% 05-22 06.15
EUREKO 5.125% 05-29.06 49
GENERAL1 F.5.317%(TV)06-
IBERDROLA 1.4.875% 03-18.2.13
ING BK NV 3.5% 05-16 09.20
ING VERZEK 6.25%01-21.06.21
INTL ENDESA 4.375%99-18 06.09
KON PHILIPS 6.125%01-I6 05.11
KPN NV 4.5% 04-21.7.11 EMTN
METRO FIN.4.625% 04-1 1 EMTN
OLlVETTl 6.575%99-09 B
S21STEP PORTUGAL TELE.INTL 4.375%05-17 RED ELECTRICA 4.75% 03-13
EMTN REPSOL INTL 5% 03-
22.7.1 3EMTN RWE FIN.4.625"/0 04-23 7 14
SIEMENS F.5.25%(TV)06-14.9.66
SOLVAY FIN.8.375"h 06-2.6.2104
ST GOB.NED 4.75%99-09.07.09
SUEDZUCK.INTL 5.25%(TV)05-
PERP TELEFONICA EUR 5.125% 03-13
TNT NV 5 125%01-
05.12.OBSENIOR
PERP
NORWAY
TELENOR ASA 4.5% 06-28 03.14
SPAIN
BBVA INTL 4 952Yu.(TV) 06-PERP
SANTANDER TV 04- PERP
TELEFONICA 3.75% 06-2 02 11
SWEDEN
SCA FINANS AB5.375%02-
25 06.07 SCANIA 6% 01-17 12.08 EMTN
SECURITAS 6 125%01-14 03.08
SKAND.ENSK.BANK.TV 02-6.6.12
TELIASONERA 4.125% 05-
11.5.15 VATTENF.TSY 5,25"/0(TV)05- PERP.
UNITED STATES
AM.GEN FIN 3 25% 05-16.1.05-
1 6 1 13 BK OF AMER1.4 625%04-18.02.14
BNP PARIBAS 5 868%03-PERP.
CA PREF.TRUST 111 6% 03-PERP
225.000
35.000
55 000
30 000
100 000
100,000
75.000
130,000
45 000
45 000
125,000
25,000
180.000
50.000
25,(100
70.000
90,000
50.000
100.000
70.000
30 000
35,000
90,000
50 000
100.000
100.000
50.000
35 000
5.000
55 000
20 000
35.000
70.000
70.000
60 000
90.000
25 000
HSBC Global Investment Funds
EUR
EUR
EUR
EUR
EUR
EUR
EUR
EUR
EUR
EUR
EUR
EUR
EUR
EUR
EUR
EUR
EUR
EUR
EUR
EUR
EUR
EUR
EUR
249.661
35.633
52.892
30.459
101 618
104 118
71,265
142,101
45.577
48.956
125 396
25.479
191,502
44,958
26.087
72.563
93 447
50 542
103,675
71,438
27.645
36 256
92 095
2,257 253
2.36
0.34
0.50
0.29
0.96
0.99
0.68
1.35
0.43
0.46
1.19
0.24
1.81
0.43
0.25
0.69
0 89
o 48
0 98
0 68
0 26
0.34
0.87
21.39
EUR 50283 0 4 8
50283 0 4 8
EUR lfl(1.5YU 0 96
EUR 99171 0 9 4
EUR 48970 0 4 6
248.731 2 3 6
EUR 35378 0.34
EUR 5,226 0.05
EUR 56.633 0.54
EUR 20.235 0.19
EUR 33,571 0.32
EUR 69.435 0.65
220.478 2 0 9
EUR 66.715 0 6 3
EUR 62.368 0.59
EUR 97504 0.92
EUR 25.770 0.24
ClTlGROUP 4 25% 05- 25 2 3OEMTN ClTlGR 4 75% 04-10 2 19 INTL
COMMZBK CAP 5 012%(TV)06-
PERP CS GRP(US)3 625°blTV)05-
14 9 20 DAIMLER CHRYS 4 25"'004-
4 10 11 DEUTSCHE CAP 5 33% 03-
EMTN
PERP
EUROHYPO CAP 6 445% 03-
GECC 4 625% 06-15 9 66 REGS
GOLOMAN SACHS 4"o 05- 02 02 15 LEHMAN BROTH 4 75% 04-14
EMTN M LYNCH 4 625% 03-2 10 13 EMTN MORGAN STANLEY 3 7546 06-
1 3 1 3 PEMEX PR FDM MSTR5 5x05-
25REG PROCTER&GAMB 4 125% 05-
7 12 20 SAN PAOLO IMI 8 126%00-PERP
SLM CORP 3 125% 05-17 9 12
SN STE GEN CAP TR I 7 875% 00.
UBS PREF FD TV 05-PERP
UNICRED ITAL 8 048"m 00-49
REGS
80.000
90,000
50.000
120.000
80.000
145.000
60.000
50,000
135,000
60.000
35.000
100,000
35.000
50.000
100 000
50 000
60 000
60.000
25 000
EUR
EUR
EUR
EUR
EUR
EUR
EUR
EUR
EUR
EUR
EUR
EUR
EUR
EUR
EUR
EUR
EUR
EUR
EUR
75,982
93 525
49.71 1
113.938
79,325
152,148
65.794
50 557
132.365
62 162
36.071
97 727
34 684
49 284
114651
47 422
67 122
59,084
28 525
0 72
0 89
0 47
1 08
0 75
1 44
0 62
0 48
1 2 5
0 59
0 34
0 93
0 33
0 47
1 09
0 45
0 64
0 56
0 27
1,662 434 15.75
TOTAL BONDS 9,645,025 91.40
TOTAL TRANSFERABLE SECURITIES ADMITTED TO AN OFFICIAL STOCK EXCHANGE LISTING 9,645,025 91.40
TOTALINVESTMENTS 9,645,025 91.40
OTHER NET ASSETS LESS LIABILITIES 907,713 8.60
TOTALNETASSETS 10.552.738 100.00

- - I
Portfolio of Investments and Other Net Assets I . .. ._ . ._
I
EURO HIGH YIELD BOND Statement of investments as at 30 September 2006 (expressed in EUR)
Description Face Value Currency Evaluation Yo net assets
DEGUSSA 5.125% 03-
10.12.13EMTN FLENDER HLDG 11% 03-1.8.10 REGS GERRESHEIMER 7.875% 05-15
REGS HENKEL 5.375 05-2104 STEP-UP
HORNEACH EAU 6 125% 04-14
REGS MTU AERO 8.25% 04-1.4.14
REGS-1.4 14 SNR PER1 5.625% 04-15.12.11 REGS
SGL CARBON 8.5% 04-1.2.12
EMTN TU1 AG 6.625% 04-16.05.11 REG.
1 .ooo.ooo
675.000
300,000
1,700.000
600.000
2.100,000
1,050.000
1.175,OOO
350,000
2 585.000
750.000
325,000
1,600 000
200.000
325.000
500,000
1,200 000
550.000
2 770.000
600,000
600,000
1.300 000
1,300 000
600.000
1,400.000
550.000
750.000
EUR 991,495 1.35
EUR 745.875 1.01
EUR 306.600 0.42 Face Value Currency Evaluation % net assets
EUR 1 598.484 2.17
EUR 620,588 0 8 4
EUR 2.356.021 3.20 INVESTMENTS
EUR 1,077,565 1.47
EUR 1.268,266 1.73
TRANSFERABLE SECURITIES ADMITTED TO AN OFFICIAL STOCK EXCHANGE LISTING
BONDS EUR 355,740 0.48
11,579,199 15.75 .~ . BELGIUM
-
BARRY CALLEBAUT 9 25% 03-10
REG TELENET COM.9% 03-15 12.13
REGS
GREAT BRITAIN
1,125,000
2.588 355
1 450,000
225,000
1.400,OOO
650,000
1,550,000
580,000
500,000
1.858,OOO
300,000
450 000
550.000
1.700 000
1 850.000
1,500,000
2,200.000
1,800.000
750,000
1,650.000
EUR 1,198.125 1.63
EUR 2,871 068 3.91
CORUS 7 5 % 04-1 10 11 SENIOR
ECO-BAT 10 125% 03-31 1 13 REGS INVENSYS 9 875% 04-15 3 11
NTL CABLE 8 75% 04-15 4 14
EUR 2,736972 3 7 3
EUR 831.563 1.13
EUR 362.232 0.49
EUR 1.679.680 2.28 4069,193 5 5 4
BERMUDA ISLANDS ~ .
CEN EURO MEDIA 8 25%05.
12REG S
5,610,447 7.63 EUR 1581,708 2 15 GREECE
1,581,708 2 15 FAGE DAIRY 7.5%05-15.1.15
REGS
EUR 196.500 0.27
186,500 0.27
CANADA
MECACHROME 9% 06-15 05.14 EUR 222.326 0.30 GUERNSEY
222 326 030 ~_ ABB INT.FIN.6.5% 03-11 EMTN-
TERM NOTES 2
EUR 359.117 0.49 DENMARK
359.117 0.49 DANSK NATURGAS AiS 5 5%05- PERP FS FUNDG 8.875% 06-15 5 16
REG ISS GLOBAL A/S 4 5% 04-14 EMTN NORDIC TEL 8 25%06-1 5 16
REGS TDC AS 6.5% 02-19.4.12
EUR 1.411 640 1 9 2
EUR 628846 0 8 6
EUR 1,320,891 1 8 0
EUR 627.270 0.85
EUR 524.714 0 7 1
IRELAND
JSG FUNDING 7 75% 05-1.4.15
ITALY
EUR 478906 0.65
478.906 0.65
I
ClRlNT 5.75% 04-16 12 2024
LUXEMBOURG
EUR 1 132,362 1.54
4,513,361 6 14 1 132 362 1 5 4
FRANCE
ALCATEL 6.375% 04-7.4.14
EMTN BELVEDERE TV06-15.5.13 REG
CROWN EUR 6.25% 05-01 09.11
EUROPCAR TV 06-15 5 13
REGS FG4 8.375% 05-30.4.15 REG S
KAUFMAN ET BR.8.75% 02-09
REGS RAY ACQ SCA 9.375% 05-15
REG S RHODIA 8% 03-1.6.10 SENIOR
VlNCl6.259'0 OB-PERP
EUR 1,962,122 2.67 CULLIGAN FIN.8% 04-1.10.14
REGS FIAT FIN.6.625% 06-15 02.13
GAZ CAPITAL 7.8% 03-27.9.10
HELLAS TEL.III 8 5%05-15 10.13
LIGHTHOUSE INTL 8% 04-14
REGS NELL AF 8.375% 05-15 REGS.
THlEL LOGIST.B% 04-
15 12.12REG WIND ACOUISIT.9.75% 05-
1.12.15
EUR 580,580 0.79
EUR 2,885,508 3.95
EUR 688,946 n g i
EUR 670554 0 9 1
EUR 1,407,608 1 91
EUR 305846 0 4 2
EUR 474609 065
EUR 564.575 0 7 7
EUR 1.938737 2 6 4
EUR 2.040.180 2 78 EUR 1.339.794 1.82
EUR 585,125 0.81
EUR 1,561.563 2.12
9.719 678 13.22
EUR 1,684.152 2 2 9
EUR 2,333,209 3.16
EUR 1,728,495 2.35
13.031 925 17.73 NETHERLANDS
GERMANY
ATU AUTO-TEILE TV 04-1.10 14
BAYER AG 5"h(TV) 05-29.7.2015
CARMEUSE LIME 10.75% 02-12
REGS COGNIS 9.5% 04-15.5.14 EMTN
EUR 607.750 0.83
EUR 796094 1.08
EUR 776.147 1 0 6
EUR 1482,418 2 0 2
HSBC Global Investment Funds . . . ._ . . . .... -_ . .
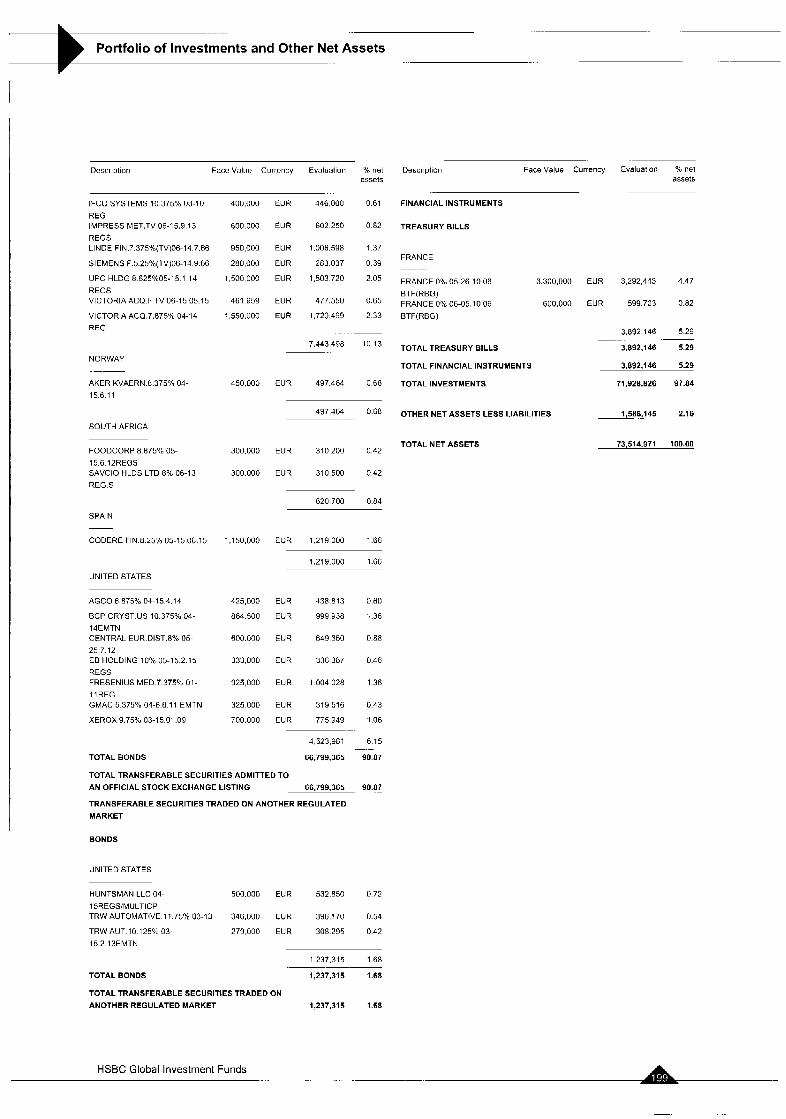
..- ......
Portfolio of Investments and Other Net Assets - -~
I
Description Face Value Currency Evaluation % net assets
IFCO SYSTEMS 10.375% 03-10
REG IMPRESS MET.TV 06-15.9.13
REGS LINDE FIN.7.375”/0(TV)O6-14.7.66
SIEMENS F.5.25%(TV)06-14 9 66
UPC HLDG 8.625%05-15 1 14
REGS VICTORIA ACQ I1 TV 06-15 05.15
VICTORIA ACQ.7.875”~ 04-14
REG
NORWAY
AKER KVAERN.8.375% 04
15.6.11
SOUTH AFRICA
FOODCORP 8 875% 05- 15.6.12REGS SAVCIO HLDS LTD 8% 06-13
REG.5
SPAIN
CODERE FIN.8.25% 05-15 06.15
UNITED STATES
AGCO 6 875% 04-15.4.14
BCP CRYST.US 10.375O/. 04-
14EMTN CENTRAL EUR.DIST.87b 05- 25 7 12 EB HOLDING 10% 05-15.2 15
REGS FRESENIUS MED 7.375% 01-
11 REG. GMAC 5 375% 04-6.6 11 EMTN
XEROX 9.75’70 03-15.01.09
400,000
600,000
950,000
280,000
1,500 000
461 959
1,550.000
450.000
300,000
300 000
1,150,000
425,000
E64 500
600.000
333 no0
925,000
325 000
700.000
EUR 446,000 0 6 1
EUR 602250 0.82
EUR 1.006.598 1.37
EUR 283,037 0.39
EUR 1,503 720 2.05
EUR 477.550 0.65
EUR 1,720,499 2.33
7,443,498 111 13
EUR 497.464 068
Descriptiori Face Value Currency Evnluarion “h net assets
FINANCIAL INSTRUMENTS
TREASURY BILLS
FRANCE
FRANCE 0% 05-26.10.06 3,300,000 BTF(RBG) FRANCE 0% 06-05.10 06 600,000
BTF(RBG)
EUR 3 292,443 4.47
EUR 599.703 0.82
TOTAL TREASURY BILLS
TOTAL FINANCIAL INSTRUMENTS
TOTAL INVESTMENTS
497,464 0.68 OTHER NET ASSETS LESS LIABILITIES
EUR 310200 0.42
EUR 310,500 0.42
TOTAL NET ASSETS
620 700 0.84
EUR 1.219 000 1.66
1,219.000 1.66
EUR 438,813 06[1
EUR 999938 1 3 6
EUR 649350 088
EUR 336387 0 4 6
EUR 1004028 1 3 6
EUR 319516 0 4 3
EUR 775949 1.06
TOTAL BONDS
4523,981 6 15
66,799,365 90 87 . -
TOTAL TRANSFERABLE SECURITIES ADMITTED TO
AN OFFICIAL STOCK EXCHANGE LISTING 66,799,365 9O.Er
TRANSFERABLESECURITIESTRADEDONANOTHERREGULATED MARKET
BONDS
UNITED STATES
HUNTSMAN LLC 04- 500.000 EUR 532.850 0.72 1 SREGSMULTICP TRW AUTOMATWE 11.75% 03-13 341iooo EUR 3~6,170 0.54
TRW AUT.10.12540 03- 279.000 EUR 308.295 0.42
15.2.1 3EMTN
1237,315 1 6 8
TOTAL BONDS 1,237,315 1.68
TOTAL TRANSFERABLE SECURITIES TRADED ON
ANOTHER REGULATED MARKET 1,237,315 1.68
3,892,146 5 29
3,892,146 5.29
3.892.146 5.29
71.928.826 97.64
.~
73.51A.971 100.00
HSBC Global Investment Funds .
-
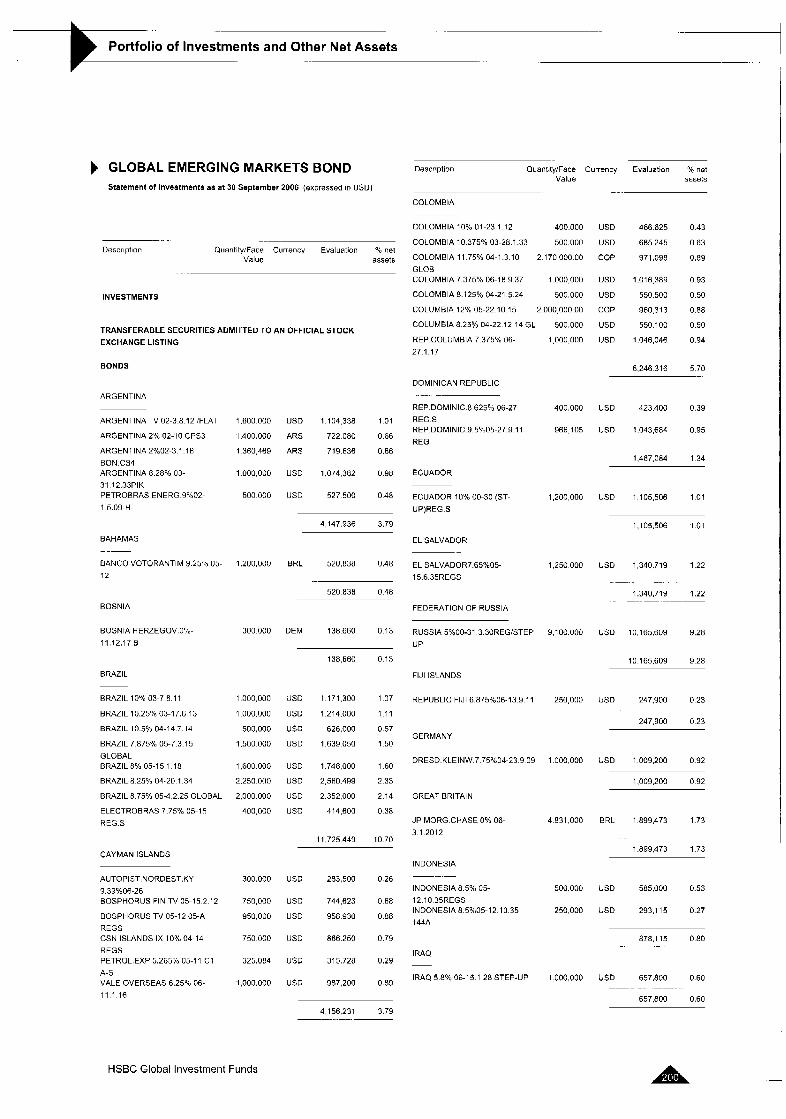
_ __
Portfolio of Investments and Other Net Assets . ___
I
GLOBAL EMERGING MARKETS BOND Statement of Investments as at 30 September 2006 (expressed in USD)
Description Quant1ty:Face C Value
Evaluation Yo net assets
urrency
USD
USD
COP
USD
USD
COP
COLOMBIA
COLOMBIA 10% 01-23 1 12
COLOMBIA 10 375% 03-28 1 33
COLOMBIA 11 75% 04-1 3 10
GLOB
400 000
500 000
2 170 000 00
COLOMBIA 7 375% 06-is 9 37 I ooo ooo COLOMBIA 8 125% 04-21 5 24
COLUMBIA 12% 05-22 10 15
500 000
2 000,000 00
466625 0 4 3
685245 0 6 3
971,098 0.89
,016389 093
550500 050
960313 0.88
.
Description QuantitylFace Currency Evaluation % net Valuc assets
1
INVESTMENTS
COLUMBIA 8 25% 04-22 12 14 GL
REP COLUMBIA 7 375% 06- 27 1 1 7
500000 USD 550100 050
1000000 US0 1.046,046 0 9 4
_.
6.246316 5 7 0
TRANSFERABLE SECURITIES ADMITTED TO AN OFFICIAL STOCK EXCHANGE LISTING
BONDS
DOMINICAN REPUBLIC
ARGENTINA REP DOMINIC 8 625% 06-27 REG S REP DOMINIC 9 5%05-27 9 11 REG
400,000 US0 423,400 0 3 9
966 105 US0 1,043,684 0.95 ARGENTINA TV 02-3.8 12 !FLAT
ARGENTINA 2% 02-10 CPS3
ARGENTINA 2%02-3.1.16 BON.CS4 ARGENTINA 8.28O/. 03- 31.12 33PIK PETROBRAS ENERG.9%02-
1 5.09-H-
1,600 000
1 400 000
1 360 469
1 000 000
500 000
1.2u0,ooo
300 000
1 000 000
1 000 000
5ou,ooo 1.500 000
1,600 000
2.2511 000
2.000 000
4uu 000
300 000
750,000
950 000
750 000
325 084
1,000 000
USD 1.1(14 338 101
ARS 722 080 0 6 6
ARS 719636 066
US0 1.074382 0 9 8
USD 527500 0 4 8
1.467.084 1 34
ECUADOR
ECUADOR 10% 00-30 (ST-
UPIREG.S 1,200,000 USD 1 105.506 1 0 1
4,147.936 3.79 1,105.506 1 0 1
BAHAMAS EL SALVADOR
BANCO VOTORANTIM Y.25% 05- 12
EL SALVADOR7.65°/.05-
15.6.35REGS
BRL 520,838 0.48 1,250000 US0 1340.719 1 2 2
.. - . . . .
1,340,719 1.22 .. __ __ ~
520 838 0.48
BOSNIA FEDERATION OF RUSSIA
RUSSIA 5%00-31 3 SOREGSTEP
UP
BOSNIA HERZEGOV.O%
11.12.17 B OEM 138660 0.13 9,100,000 US0 10,165,609 9.28
138660 0.13 10 165.609 9 28
BRAZIL FIJI ISLANDS
REPUBLIC FIJI 6.875%06-13.9.11 BRAZIL 10% 03-7.8.11
BRAZIL 10.25% 03-17.6.13
BRAZIL 10.5% U4-I4 7.14
BRAZIL 7 875% 05-7.3.15 GLOBAL BRAZIL 8% 05-15 1 18
BRAZIL a . 2 5 ~ 04-20 1.34
BRAZIL 8 75% 05-4 2 25 GLOBAL
ELECTROBRAS 7.75% 05-15 REGS
USD 1.171.300 1.07
USD 1.214.000 1.11
USD 626,000 0.57
US0 1.639050 1.50
250,003 US0 247,900 023
247.900 0 2 3
GERMANY
DRESD.KLEINW.7.75%04-23.9 09 1.000.000 US0 1009,200 0 9 2 US0 1,748,000 1.60
US0 2,560.499 2.33
US0 2,352,000 2.14
USD 414,600 0.38
1.009.200 0 92
GREAT BRITAIN
JP MORG CHASE 0% 06- 3.1.2012
4.831,OOO BRL 1899,473 1.73
11.725449 10.70 1.899.473 1 73
CAYMAN ISLANDS INDONESIA
AUT0PIST.NORDEST.KY
9.39%06-26 BOSPHORUS FIN TV 05-15 2.12
BOSPHORUS TV 05-12 05-A REGS CSN ISLANDS IX 04-14 REGS PETROL.EXP 5,265?0 05-11 C1 A-S VALE OVERSEAS 6.25% 06- 11.1.16
USD 283,500 0.26 INDONESIA 8.5% 05- 12.10 35REGS INDONESIA 8.5%05-12 10.35 144A
5oo.000 USD 585,000 0.53
250.000 USD 293,115 0.27 USD 744,623 0.68
US0 958930 0.88
US0 866.250 0.79 87a.115 o a o IRAQ
USD 315.728 0.29
IRAQ 5 8% 06-15.1 28 STEP-UP 1000,000 USD 657.800 060
657.800 060
_- . -. __ . USD 987,200 0.83
4,156231 3.79
HSBC Global Investment Funds .... .~ .. ...

._...
Portfolio of Investments and Other Net Assets .... - _._. . . .
-. .
Description Quantitylface Currency Evaluation 9; net Value assets
Description QuantityiFace Currency Evaluation % net Value assets
.. ..-
PHILIPPINES 9 87550 00-16 3 10 1,000.000
3 000.000
1 000.000
800 000
250.000
500 000
1,850.000
2,000 000
500 000
500 000
16.700.000
8.000.000
1,000 000
1 500,000
1 750.000
2.450 000
300 000
300 000
600.000
2.550 000
1 .ooo 000
1 000.000
1 ,000 no0
600,000
1.594.348
USD 1,117.500 1.02
6.562.450 5.99
~
JAMAICA
AIR JAMAICA 9.375% 05-15 200,000 US0 205000 0 1 9
REGS JAMAICA B 5% 06-28 2 36 300.00(1 USD 292,193 0 26
POLAND
POLOGNE 4 25OA05.24 5 11
PS0511
PLN 912.1A2 0.83 497 193 0 4 5
~ -. . . .~ LUXEMBOURG
912.142 0 8 3
GAZPROM 5 625% 05-22.7.13
REG OR-ICE 6.375% 05-
29 7.08SENIOR RUSS.AGRlC.7.175%06-
16.5.13REG RUSSIA INTL CARD 9.75% 04-09
TNK BP FIN 6.875% 06-18.07.11
TNK BP FIN.7.5"h 06-18 07 16
UBS LUX iVIMPELCOM)8% 05-
lOREG UBS SA 8 259: 06-23 05 16
REG S UBS(LUX)B 23%(TV) -11 02.15
VTB CAP.?5% 04-12.10 11 REGS
3,170,975
300 000
200 000
392.443
300 000
500.000
1 0oo.uuo
1 000.000
500,000
1,000 000
US0
USD
US0
dSD
US0
USD
US0
USD
USD
USD
3 149,412
303 000
207,480
407.709
306.862
519.000
1 022.800
1 012.900
502.600
1062,299
2 88
0 28
0 19
0 37
0 28
0 47
11 93
0 92
0 46
0 97
SOUTH AFRICA
SOUTH AFRICA 7 375% 02-
25.4.12
USD 1084.300 0 99
1.084.300 0.99
TURKEY
TURKEY 6.875% 06-17 3.36
TURKEY 7% 05-05.06 20
TURKEY 7.25% 04-15 3.15
TURKEY 7.375% 05-05 02.25
TURKEY 9% 04-30.6 11
TURKEY 9.5% 03-15 1.14
USD 730880 0 6 7
USD 2 4 2 , ~ s 0 2 2
USD 505100 0 4 6
USD 1,833440 167
USD 2 189800 2 0 0
USD 569400 0 5 2
6,071.245 5 54 8,494,062 7.75
UNITED STATES MALAYSIA
EDEL CAP SINEK 7 7%05- 03 08 15 GECC 9 5OIu 05-04 08 10
SENIORDIUM-TERM NO GECC 9 5% 05-11 12 14 SENIOR
PEMEX PR FDG 9 1255,Ol-
13 10 10 PEMEX PROJ FDG 6 625% 05-35
PEMEX PROJ 5 7500 05-15 12 15
USD 506 300 0 4 6
MXN 1,560,145 1.42
MXN 734810 0 6 7
US0 1.119000 1 0 2
US0 1483.556 135
US0 1704.850 157
SARAWAK INTL 5.5% 05- 03 08 15
1500000 USD 1459500 1 3 3
1459,500 1 3 3
MEXICO
JPM(SU CAS16 1"/006-25.9.35-
06U- TELEFONOS MEX.5.5% 05- 27 1.15
1,100000 MXN 380973 0 3 5
3.250000 USD 3.160950 288
7,108,661 6.49 3.541.923 3.23
URUGUAY NETHERLANDS
REP.URUGUAY 8% 05-18.1 1 22 USD 2,600675 2 3 7 ING BK NV 8 04% 06- 23.8.07REGS KAZKOMMERTS INT 7 875C04- 14REG KAZKOMMERTS 8% 05-3.11.15
REGS TURANAL-M FIN EV 8% 04-14
REGS
17484.000 RUB 651,460 0.59
500.000 USD 506.900 0 4 6
500000 USD 505.000 0 4 6
1.000.000 USD 1 000,000 0 92
2,600,675 2.37 . ~.
VENEZUELA
FERTINITRO FIN 8 29%98-20
144A PETROZUAIA 8 22% 97-17 -8- REGS VENEZUELA 5 375O. 03-7 8 10
VENEZUELA 5 75% 05- 26 2 16REGS VENEZUELA 7 65% - 21 04 25(RBG) VENEZUELA 8 5% 04-8 10 14 GLOB VENEZUELA 9 25% 97-27
VENEZUELA 9 375% 04-13 1 34
USD 244501 022
USD 291 900 0.27
USD 579,240 0.53
US0 2.340645 2.13
2 663.360 2 4 3
PANAMA
PANAMA 8.125% 04-28.4.34
REP.PANAMA 7 125% 05-29.1.26
1,000 000 USD 1.132 5011 1 114
400000 US0 419 969 0 3 8
1,552,469 1 4 2 ~-
US0 1.048.500 0.96
USD 1104.500 1 0 1
US0 1,218,400 I 11
USD 737400 0 6 7
7 565.086 6 90
PERU
PERU 5% 97-17 REG S STEP-UP
PERU 8.75% 03-21.11 33
1 200,0110 USD 1,182.307 1.08
400.000 US0 490.0011 0 4 5 VIETNAM
1,672,307 1.53 VIETNAM TV -2016 ST-UP USD 1.593 152 1 4 5
1.593152 1 4 5
__ PHILIPPINES
PHILIPPINES 7.75% 06-14 1 31
PHILIPPINES 8 375% 04-15.2.11
PHILIPPINES 8.875Vu 04-17 03 15
PHILIPPINES 9% 02-15 02 13
1500.000 USD 1,562,100 1.43
1,500000 USD 1,611 300 1.47
1.500000 USD 1,710,900 1.56
500,000 USD 560650 0.51
HSBC Global Investment Funds

. .
Portfolio of Investments and Other Net Assets ._ - ... .
Description QuanllIylFace Currency Evalualion % net Value assets
... .
YOUGOSLAVIA
..... .~
Descriplion QuantitylFace Currency Evaluation % nct Value assets
-
FINANCIAL INSTRUMENTS
REP SERBIA 3 75% 04-24 STEP- 1.750 000 US0 1.553 125 1 42
UP
1,553,125 1 4 2
TOTAL BONDS 100.638.486 91.84
WARRANTS / EQUITY LINKED SECURITIES
-
COLOMBIA
TRANSTEL INTERMEDIA S A 06- 1000 US0 000 000 1 6 I 6 S H S REG S
0 0 0 000
COMMERCIAL PAPER
GREAT BRITAIN ~ _-
STANDARD BK 0% 06-02 06 07 502 687 USD 502 991 o 46
. . CP
502991 0 4 6
TOTAL COMMERCIAL PAPER 502,991 0.46
TOTAL FINANCIAL INSTRUMENTS 502.991 0.46
TOTAL INVESTMENTS 103,753.301 94.66
TOTAL WARRANTS / EQUITY LINKED SECURITIES 0.00 0.00
TOTAL TRANSFERABLE SECURITIES A D M l n E D TO AN OFFICIAL STOCK EXCHANGE LISTING 100,636,466 91.64
TRANSFERABLE SECURITIES TRADED ON ANOTHER REGULATED
MARKET
BONDS
COLOMBIA
OTHER NET ASSETS LESS LIABILITIES 5,827,233 5.32
TOTALNETASSETS I O Q , ~ ~ O , ~ ~ O 1oo.00
TRANSGAS OCClD 9 79C95-10
144A
500.000 USD 298,296 0.27
ICELAND
HOUSING FIN FD 3 75%04-
15.2.24
5,000.000 ISK 68.142 0.06
68.142 0 0 6
INDONESIA
298.296 0.27
INDONESIA 6 875C06
09 3 17REGS
1,000 000 USD 1,018.600 0.93
1.018,600 0.93 . . .-
PERU
TEL PERU7 4E00 98-15 12 08 144A
458.333 USD 460,643 0.42
TOTAL BONDS
460643 0 4 2
1345,661 1.68 .-. -
TOTAL TRANSFERABLE SECURITIES TRADED ON ANOTHERREGULATEDMARKET 1,845,681 1,6j
OTHER TRANSFERABLE SECURITES
BONDS
BRAZIL
LIGHT SERV ELEC.TV 05- 588.000 US0 580,655 0.53
13REG-C-
580655 0.53
VENEZUELA
PETROZUATA 8.22% 97-17 B I90000 US0 185.488 0.17
144A
185.488 0 1 7
TOTAL BONDS 766,143 0.70
TOTAL OTHER TRANSFERABLE SECURITIES 766,143 0.70
HSBC Global Investment Funds

._ . -. . .
Portfolio of Investments and Other Net Assets
GLOBAL INVESTMENT GRADE BOND Statement of Investments as at 30 September 2006 (expressed in USD)
Description Face Value Currency Evaluation "h net assets
2,787 948 2.61
499,166 0.46
485.630 0 4 5
FRANCE 5 75% 01-25 10 32 BTAN FR TELECOM 4 625% 04-12 EMTN PINAULT PRINTEMPS 5% 03 23 1 09 REG
1,695,000 EUR
385.000 EUR
375000 EUR Descripticn Face Value Currency Evaluation YO net a S S R t S
6 644.189 6.19
GERMANY ..
BMW FIN.5% 03-6.8.18 EMTN
GERMANY 3.5% 05-04 01.16
INVESTMENTS
210,000 EUR
2325.000 EUR
283.170 0.26
2,912.971 2.72 TRANSFERABLE SECURITIES ADMITTED TO AN OFFICIAL STOCK EXCHANGE LISTING
BONDS
GERMANY 3 7500 04-04 01 15 90 000
GERMANY 5 625% 98-4 1 28 1,405,000
KFW 2 05Y 06-16 02 06 GLOBAL 92 000,000
MUNICH RE FIN 6 75O/.03- 450 000 21 06 23 RWE FIN 6 125% 02-26 10 12 200 000 EMTN
EUR 115.090 0.11
EUR 2225.212 2.08
JPY 764.756 0.71
EUR 648.813 0.60 ARGENTIYA
EUR 282.195 0.26 ARGENTIUA 2%02-3.1.16 BON.CS4
801,228
5,200.000
1,000,000
1 045.000
440.000
650.000
500,000
950.000
455.000
133,000 000
415.000
550.000
40 000
1 120.000
ARS 423.819 0 3 9
7.232 207 6.74 423,tllY 0.39
AUD 3.900.619 3.63
GREAT BRITAIN AUSTRALIA
BBC 5.0636% 03-10.08.2033 499,152
REG
STEP GREAT BRITAIN 4% 03-7.3 09 5,816,000 TSY STOCK GREAT BRITAIN 4.75% 03-7.9.15 800,000 TSY STOCK GREAT BRITAIN 5% 02-7.3 08 6,375,000 TSY STOCK JP MORG CHASE 0% 06- 1.908.000 3.1.2012
BRITISH TELEC.8.375% 00-10 500,ooo
GBP 968,794 0.90 AUSTRALIA 5.75% 98-1 1
US0 559400 0.52 3,900,619 3.63
AUSTRIA
AUSTRIA4.3% 03-15 7.14
GBP 10,688,108 9.95
GBP 1.522612 1.42
GBP 11,948,390 11.12
EUR 1 322.291 1.23
1,322,291 1.23
BELGIUM BRL 750,196 0.70
BELGIUM 5% 04-28.3.35 544 OLO
EUR 1.563.833 1.46 26.437.500 24.61
1,563 833 1.46 ICELAND
BRAZIL KAUPTH BK 7 125%06- 19 5.16REGS
590 000 USD 607 700 0 57
BRAZIL 11% 00-17 8 2040
CAYMAN ISLANDS
US0 571,692 0.53 607.700 0 57
571.692 0.53 IRELAND
DEPFAACS 1.65% 04-20 12.16 10,000.000 JPY 84,126 0.08 BCO ABN AM 15 8607%05- 13 12 07 BCP FIN 5 543% 04-
PREFERR TERM XXI TV 06- 38REG S
BRL 306.815 0.29 84.126 0 0 8
EUR 663.366 0.62
US0 850,000 0.88 ITALY
OLlVETTl FIN.6 5% 02-07 EMTN 525.000
1.920.181 1.79 675,153 0 6 3 .. . COLOMBIA
JAPAN
COLOMBIA 7 375% 06-18.9 37
EUROPEAN UNION
US0 462,457 0.43 DEV. BK JAPAN 1 05C 03-23
EMTN DEV.BK JAPAN 1.7% 02-20.9 22
JAPAN 1 496 02-20.3.12 N.238
JAPAN 2.3% 06-20.12.35 N 21
JAPAN 2 3% 98-2018 40-JUL
86,000.000
3,000.000
150,000.000
180,000.000
32,000,000
JPY 613.661 0.57
462457 0.43 JPY 24.065 0.02
JPY 1287.332 1.20
JPY 1,468,476 1.39
JPY 285,865 0.27
3,699,399 3.45
BE1 1.4% 05-20.06.17
FRANCE
JPY 1096.323 1 0 2
1,096,323 1.02
-.
LUXEMBOURG AVENTIS SA 4.25% 03-15.9.10
CASINO 5.875% 02-23 11.07 EMTN FRANCE 4.25% 03-25 4.19 OAT
FRANCE 5% 00-25.10.16 OAT
EUR 533,745 0.50
EUR 711.908 0.66 BANQUE DU LUXEMBOURG TV 450.000 02-PERP.
EUR 650.412 0.61
EUR 53.171 0.05
EUR 1572,621 1 4 6 650.412 0.61
1 HSBC Global Investment Funds .~ _-.
- -
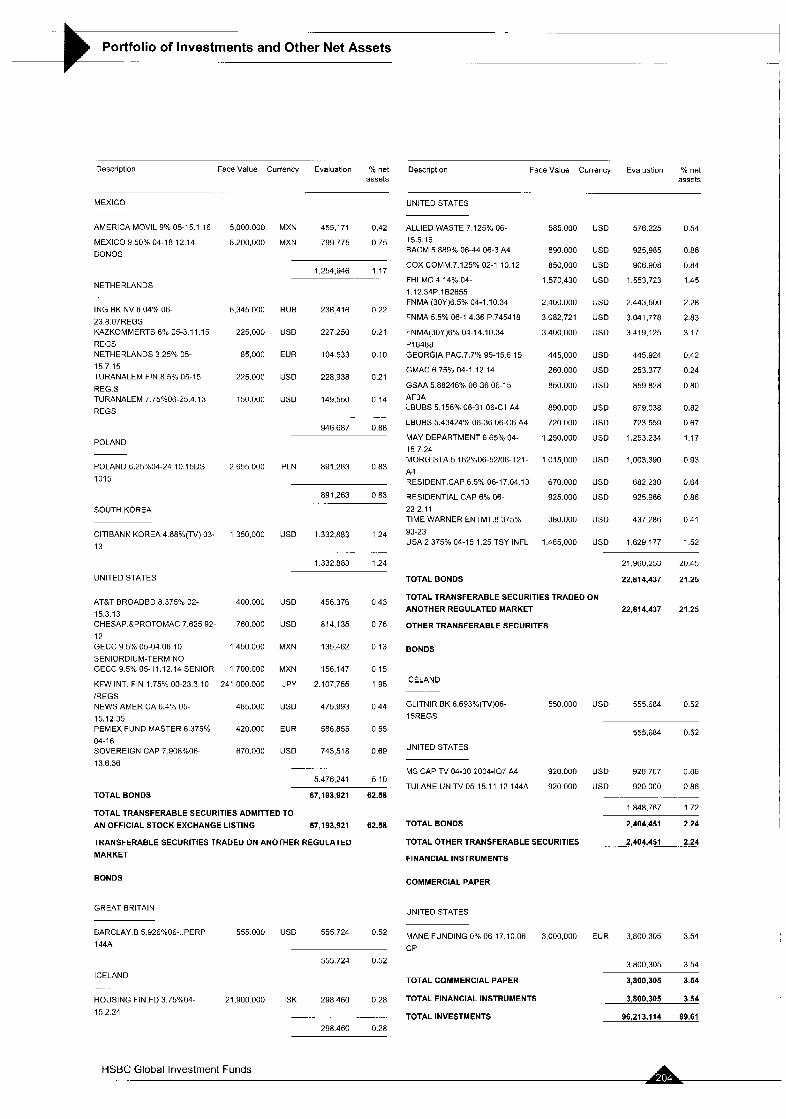
Portfolio of Investments and Other Net Assets - . -.
I
Descriwtion Face Value Currency Evaluation Yo net assets
Description Face Value Currency Evaluation Yo net assets
. .
MEXICO UNITED STATES
AMERICA MOVIL 9% 05-15 1 16
MEXICO (1 50% 04-18 12 14
BONOS
ALLIED WASTE 7 125% 06- 585 000 15.5.16 BACM 5 889% 06-44 06-3 A4 890.000
COX COMM 7 125% 02-1 10.12 850,000
FHLMC 4.14% 04- 1.570.430 1.12 34P.182655 FNMA (30Y)E.5% 04-1 10.34 2,400.000
FNMA 5.5% 06-1 4.36 P 745418 3 082,721
FNMA\30Y)6% 04-14.10.34 3 400.000
PI8488 GEORGIA PAC.7.7'Yo 95-15 6 15 445,000
GMAC 6.75% 04-1 12.14 260.000
GSAA 5 8824690 06-36 06-1 5 850.000 AF3A LBUBS 5.156% 06-31 06-CI A4 890,UOO
LBUBS 5.43424% 06-36 06-C6 A4 720 000
MAY DEPARTMENT 6 65% 04- 1,250.000 1 5 7 2 4 MORG.STA 5 162°/u06-52/06-T21- 1 015,000
A4 RESIDENT.CAP 6.5% 06-17 04.13 670 000
RESIDENTIAL CAP 6% 06- 925.000
222.11 TIME WARNER ENTMT.8.375% 380.000
93-23 USA 2 375% 04-1 5 1.25 TSY INFL 1.485 000
5,000 000
8 200,000
6.345 000
225.000
85.000
225.00U
150.000
2 655 000
1 350,000
400 000
760.000
1 450 000
1 700 000
MXN 455,171 0.42
MXN 799775 0.75
u50
u50
u50
u50
u50
u50
USD
USD
USD
u50
u50
USD
u50
USD
USD
USD
USD
USD
576.225
925.985
906.90n
1.553.723
2.443.500
3 041,778
3419,125
445,924
253.377
859.828
879.038
123 559
1,253.234
1,003,390
682 230
925.966
437.286
1.629 177
u 54
0.88
0.84
1.45
2.28
2.83
3.17
0.42
0.24
0.80
0.82
0.67
1.17
0.93
0.64
0.86
0.41
1.52
1,254,946 1.17
NETHERLANDS
ING BK NV 8 04% 06-
23 8 07REGS KAZKOMMERTS 8% 05-3 11 15
REGS NETHERLANDS 3 25% 05- 1 5 7 1 5 TURANALEM FIN 8 5% 05-15 REG S TURANALEM 7 75%06-25 4 13
REGS
RUB 236416 0 2 2
US0 227250 0 2 1
EUR 104533 0.10
US0 228,938 0.21
US0 149,550 0.14
.
946687 0 8 8
POLAND
POLAND 6.25'X04-24.10.15DS
1015
PLN 891.263 0 8 3
891,263 0.83
SOUTH KOREA
ClTlBANK KOREA 4.68%(TV) 03- 13
USD 1332,883 1 2 4
. .. -
1332,883 I .24 21 960,253 20.45
22.814.437 21.25 UNITED STATES TOTAL BONDS
TOTAL TRANSFERABLE SECURITIES TRADED ON ANOTHER REGULATED MARKET 22,814,437 21.25
OTHER TRANSFERABLE SECURITES
ATCT BROADBD 8 37570 02-
15.3.13 CHESAP.&PROTOMAC 7.625 92 12 GECC 9 5% 05-04.08.10
SENIORDIUM-TERM NO GECC 95%05-11.12.14SENlOR
USD 456.376 0 4 3
USD 814.135 0 7 6
MXN 135.462 0 13
MXN 156.147 0 1 5
BONDS
ICELAND KFW INT. FIN 1.75% 00-23.3.10 241.000.000 JPY 2.107.755 1 9 5
/REGS NEWS AMERICA 6.4% 05- 485.000 US0 475,993 0.44
15.12.35 PEMEX FUND MASTER 6 375% 420.000 EUR 586,855 0.55 04-1 6 SOVEREIGN CAP 7 90A9bO6- 670.000 US0 743,518 0.69
13.6 36 . .
5,476,241 5.10
GLlTNlR BK 6.693%(TV)06- 550.000 USD 555.684 0.52
15REGS
555.684 0.52
UNITED STATES
MS CAP TV 04-38 2004-107 A4 920000 USD 928767 0 8 6
TULANE UN.TV 05-15.11 12 144A 920 000 USD 920 000 0 86 TOTAL BONDS 67,193,921 62.58
TOTAL TRANSFERABLE SECURITIES ADMITTED TO AN OFFICIAL STOCK EXCHANGE LISTING 67,193,921 62.58
TRANSFERABLE SECURITIES TRADED ON ANOTHER REGULATED
MARKET
1 848.767 1.72
TOTAL BONDS 2,404,451 2 24
TOTAL OTHER TRANSFERABLE SECURITIES - 2,404.451- 2,24
FINANCIAL INSTRUMENTS
BONDS COMMERCIAL PAPER
GREAT BRITAIN UNITED STATES
MANE FUNDING 0% 06-17 10 06 3 000,000 EUK 3,800.305 3 54 CP
3 800.305 354
BARCLAY B 5.926%06-..PERP 555000 US0 555724 0.52
144A
555.724 0.52
ICELAND
HOUSING FIN.FD 3.75%04- 21,900000 ISK 298460 0.28
15 2.24 - .. .. ..
298.460 0.28
TOTAL COMMERCIAL PAPER 3,800,305 3.54
TOTAL FINANCIAL INSTRUMENTS 3,800,305 3.54
TOTAL INVESTMENTS 96,213,114 89.61
HSBC Global Investment Funds

...
Investments and Other Net Assets ....
Descrlptlol Faro Value currency Evaluation "'o net PAN-EUROPEAN GOVERNMENT BOND assets
-. ~
OTHER NET ASSETS LESS LIABILITIES 11,155,398 10.39
Statement of investments as at 30 September 2006 (expressed in EUR)
TOTALNETASSETS 107.368.512 100.00
Descrlptlon
.....
..........
QuantitylFace Currency Evaluation Yo ne1 Value assets
..... ...
INVESTMENTS
TRANSFERABLE SECURITIES ADMITTED TO AN OFFICIAL STOCK
EXCHANGE LISTING
BONDS
AUSTRIA
AUSTRIA 3 5% 05-15 07 15
AUSTRIA 4 3% 03-15 7 14
REP AUSTRIA 3 5% 05-15 9 21
CYPRUS -.
CYPRUS 5.5% 02-27 2.12EMTN
CZECH REPUBLIC ~. .
TCHEWE REP 4 125"/. 05 18 3 20
DENMARK
DENMARK 3% 03-15.1 1.06
(REG) DENMARK 4% 01-19.08.08
DENMARK G0,o 99-15.1 1 201 1
DENMARK 7% 95-07
EUROPEAN UNION
HSBC Global investment Funds ... .....
B El 4 25% 03-7 12 10 EMTN
B E I 5 375% 98-2021
B E I 6 25% 99-14
B E I 8 75Ob 95-17
FRANCE
ERAP 3.7596 03-25.04.10 EMTN
FRANCE 2 590 05-12.7 10 BTAN
FRANCE 3% 06-12 01 11 BTAN
FRANCE 3.5% 06-12 9.08 BTAN
FRANCE 4% 02-25 10.13 OAT
FRANCE 4.75% 04-25.4.35 OAT
FRANCE 5 5% 98-2029 OAT
FRANCE 5.75% 01-25.10 32 BTAN
2,120 000
4,970,000
1,185 000
1 392 000
155 000
2 300.000
9,000.000
6,000 000
2,300,000
340.000
1,322,000
925,000
609,000
410 000
1,580,000
1,340 000
7 020 000
1.088,OOO
2 895.000
390,000
4 923 250
EUR 2.096.044 1.37
EUR 5,187,189 3.41
EUR 1,142,340 0.75
8,425,573 5.53
EUR 1.510264 0 9 9
1510.264 0 9 9
EUR 156,674 0.10
. _- 156674 0.10
DKK 308.116 0 2 0
DKK 1,214.502 0.79
DKK 892.030 0.59
DKK 319,163 0.21
2,733,811 1.79
GBP 487.562 0 3 2
GBP 2,085,714 1.37
GBP 1,480,245 0.97
GBP 1,192,937 0.78
5,246,458 3.44
EUR
EUR
EUR
EUR
EUR
EUR
EUR
EUR
41 1,420
1.521 224
1,309,180
7.012.277
1 11 3.024
3.317.670
483,678
6.403 179
0.27
1 .oo 0.86
4.59
0.73
2 18
0 32
4.19
21,571,652 .~ 14.14

OuantitylFace Currency Evaluation ?& net Descriotion QuantityiFace Currency Evaluation Yo net Value assets
Description Value
2.880,OOO
5,400 000
1,400,000
590 000
1.510 000
1 840,000
500.000
540.000
400.000
1.830.000
1,430,000
345,000
1,320 000
2 090,000
1 so aoo 720.000
1,840.000
1,960.000
4,545,000
200,000
4,170.000
410,000
5.303.000
1.750.000
7,300,000
5.590.000
500,0~10
1,270 000
300.000
4,957,000
265 000
868,000
4.000.000
assets
EUR 2,714,400 1.79
EUR 5.234220 3 4 4
EUR 1,373,680 0.90
EUR 586106 0.38
EUR 1 498,373 0.98
EUR 1775,232 1.16
EUR 501.600 0.33
EUR 521.532 0.34
EUR 412,080 0 2 7
EUR 1.943,6*3 1.27
EUR 1,655940 1 0 9
EUR 457,229 fl.30
EUR 1.877.700 1.23
. .
GERMANY ITALY 0% 06-30 05.08 CTZ
ITALY 2.75% 05-15 06.10 BTP
ITALY 3% 05-15.1.10 BTP
ITALY 3.5% 06-15.03 11 BTP
ITALY 3.75% 05-01 08.15 BTP
ITALY 3 75% 06-01.08.21 BTP
ITALY 3 75% 06-15.6.06 BTP
ITALY 4% 05-1.2.37 BTP
ITALY 4.25% 04-1.2.15 BTP
ITALY 5% 01-1.2 12 BTP
ITALY 5.25% 98-29 BTP
ITALY 6.5% 97-2027 BTP
ITALY 7.25% 96-26 BTP
EUROHYPO 3.254'005- 400 oflo
26.10.15l2194 GEM.BDESLD 2.625%05- 5,000,000
7.10 10S22 GERMANY 4.25% 03-04 01.14 180.000
GERMANY 4 75% 98-08 300.000
GERMANY 5.625% 98-4 1.28 1 820 000
KFW 4.5% 02-7 12.06 250.000
KFW 4.8% 03-27.10.06 (REG) 721.0UO
KFW 5 375% 04-29.1.14 EMTN 290.000
KFW 5 375% 04-7.12.07 EMTN 300,000
KFW 5.5% 04-15 9 09 605 000
EUR
EUR
EUR
EUR
EUR
GBP
GBP
GBP
GBP
GBP
381,920
4 800,388
187.074
305,910
2 276.092
368.267
1 063.178
440 507
443 337
903.729
0 25
3 16
0 12
0 20
1 4 9
0.24
0 70
0.29
0 29
0.59
11 170.402 7.33 21 034.485 13.80
GREAT BRITAIN
EBRD 0% 98-2048 EMTN 8 000.000.00 ITL 538.819 0 35
LITHUANIA
LITHUANIA 4 5% 03-5.3.13 EMTN
NETHERLANDS
EUR 2 165.308 1.42 GREAT BRITAIN 4 25% 03-36
TSY STOCK GREAT BRITAIN 4 75% 03-7.9.15
TSY STOCK GREAT BRITAIN 4.75% 04-
7.12.38 TSY STOCK GREAT BRITAIN 5 75% 98-09
TSY STOCK GREAT BRITAIN 7 25% 97-07
TSY GREAT BRITAIN 8% 96-21 TSY
STOCK UK TSY 4 25% 05-7.3.1 1
1,446,000 GEP 2,205,418 1.45 2,165308 1 4 2
620,000 GEP 930617 0 6 1
2,492000 GBP 4.149594 2 7 2
350000 GBP 531.130 0 3 5
BNG 7.375%97-06.08.07
NETHERLANDS 3.25% 05- 15 7.15 NETHERLANDS 4% 05-15.01.37
GBP 240C65 016
EUR 698.804 0 4 6
EUR 1,881.584 1 2 3
2820,553 1 8 5
250.000 GBP 378.346 0.25
100,000 GBP 203,997 0.13
400.000 GBP 579865 0.38 POLAND
POLAND 3.625% 06-1.2.16
POLAND 3 875C 04-15.01 09
EMTN POLAND 4 5% 03-5.2.13 EMTN
POLAND 5 5% 01-14.2.1 1
POLAND 5.5% 02-12.3.12
POLOGNE 5% 02-24.10 13
DS1013 REP OF POLAND 4.2% 05-
15.4.20
EUR 1,892,184 1.24
EUR 4,557,726 2 9 8
EUR 206020 0 1 4
EUR 4.438 131 2.91
EUR 441,611 0 2 9
PLN 1,291.033 0 8 5
EUR 1,747.725 1 15
9,517.786 6.24
GREECE
GREECE 3.10% 05-20.04 10
GREECE 3 5 % 04-20.04 09
GREECE 3 6% 06-20.7.16
GREECE 3.7% 05-20.7.15 EMTN
GREECE 4.5% U4-20 05.14
GREECE 4.5% 05-20 9 37 (30Y)
GREECE 5.25% 02-18.5.2012
GREECE 5 90% 02-22.10.22
1,700 000
2,500.000
8 050.000
1 480.000
790 000
500,000
1.327,OOO
360,000
EUR
EUR
EUR
EUR
EUR
EUR
EUR
EUR -
-
1.09
163
5.13
0.96
0.54
0.34
0.93
0.29
1 668,380
2 4Y 1,250
7,813,330
1,458 244
823,970
521 350
1.425 331
435,492
16 637,347
14.574 430 9.56
PORTUGAL
PORTUGAL 3.2% 05-15.4.1 1
PORTUGAL 3.95% 99-09
PORTUGAL 5.15% 01-15 6.11
10.91 EUR 7.157 650 4.69
EUR 5,635.838 3.7[1
EUR 531,050 0.35
13,324,538 8.74
..
HUNGARY
HUNGARY 3.5% U6-18 7 16
HUNGARY 3 625% 04-28.10.11
HUNGARY 3.875% 05-24.02 20
HUNGARY 4 5% 03-6.2.13
HUNGARY 4.5% 04-29.1.14
HUNGARY 5.625% 01-11
HUNGARY 6.5O/. 05-12 8 08 S.E
300000 EUR 283,584
1,480 000 EUR 1.453 061
60.000 EUR 57314
1.000 ooo EUR I 022 820
670000 EUR 715.034
680000 EUR 695,924
346,000,000 HUF 1220.535
0.15
0.94
0.04
0.67
0 46
0.47
0.80
SLOVAKIA
SLOVAKIA 4% 06-26.3 21
SPAIN
EUR 1.261.526 0.83
1261.526 0.83
BCO SANT.CTR 4% 03-10 9 10
SPAIN 4 2% 03-30 7 13
SPAIN 4.2% 05-31.1.37
SPAIN 5% 02-30 7 12
5.448.272 3.57 EUR 302.495 0 2 0
EUR 5,125,537 3 36
EUR 278383 0 18
EUR 929,802 0 6 1
IRELAND
IRELAND 3 25% 03-18.4.09 1 015,000 EUR 1 006.982 0.66
1,006,982 0.66 6 636,217 4.35
ITALY SWEDEN
ITALY 0% 05-28.9.07 CTZ 500000 EUR 482.750 0.32 SWEDEN 3% 05-12 07.16 SEK A10.387 0.27
HSBC Global Investment Funds

Portfolio of Investments and Other Net Assets F . . -_
Doscription OuantityIFace Currency Evaluation net STERLING INVESTMENT GRADE BOND Statement of investments as at 30 September 2006 (expressed in GBP)
Value assets
SWEDEN 59'0 98-09 NR.1043 7000.000 SEK 782,139 0 5 1
SWEDEN 5.25% 00-15 03 11 2350.000 SEK 271,408 0 18
5.1045 SWEDEN 5.5% 02-8.10 12 2 170.000 SEK 258.401 0 17 TREAS.B[? SWEDEN 6 5% Y6-06 N.1038 6 000,000 SEK 649.408 0 43
(RBG) -. ..
2,371.743 1.56
UNITED STATES
Description Face Value Currency Evaluation % net assets
INVESTMENTS
TRANSFERABLE SECURITIES ADMITTED TO AN OFFICIAL STOCK EXCHANGE LISTING
BONDS
KFW INTL 5.375% 01- 800,000 GBP 1.202 724 0.79 7.12.11EMTN
1202,724 0 79
TOTAL BONDS 148,816,745 97.60
97.60
0.00
0.00
0.00
0 00
TOTAL TRANSFERABLE SECURITIES ADMITTED TO AN OFFICIAL STOCK EXCHANGE LISTING 14a,a16,745
TRANSFERABLE SECURITIES TRADED ON ANOTHER REGULATED MARKET
CAYMAN ISLANDS
AIG SUNAMER II 5 625% 02-12 EMTN LUNAR FD 6 442% 05- 18 9 32EMTN LUNAR FDG 5 75% 04-
18 10 33s 4 STH WATER SV 5%05- 31 3 21EMTN
600.000
95.000
140,000
420 000
350 000
270,000
520.000
300,000
320 000
750,000
850,000
300,000
330,000
750.000
150 000
41UOOO
170,000
1.7AO.000
2,106.000
1341,000
1 198.000
GBP 611.580 1.96
GBP 117,658 0.38 OPTIONS ON FUTURES
GBP 163.626 0.52
GBP 423,553 1.36 EUROPEAV UNION
CALL EURIBOR 3 MONTHS 96 50 (80) EUR (2000) 18/12/2006 CALL EUR'BOR 3 MONTHS (590) EUR (7.375) 96 625 1811212006 CALL EUR BOR 3 MONTH5 96.75 420 EUR 5 250 1811 2!2006
1,316417 4 2 2 -.
EUROPEAN UNION
BE1 5 5% 00-2025
BE1 5 625% 00-32
BE1 6% 98-2028 PARALLEL BDS
GBP 389.620 1 2 5
GBP 320.409 1.03
GBP 627.640 2.01 (4 125)
GERMANY 1.337 669 4.29
CALL EUR BOR (LIFFE) 96.375 250 EUR 18,750 0.01 1811 212006
FRANCE
BNP PARlB 5 945%fTV) 06- PERP BNP PAR 5 75Ob 02-24 1 22
EMTN SOC GEN 5 4% 03-30 1 18 EMTN
GBP 293.093 0.94 18.750 001
GEP 341,357 1.09 TOTAL OPTIONS ON FUTURES 14,625 0.01
TOTAL TRANSFERABLE SECURITIES TRADED ON
ANOTHERREGULATEDMARKET 2 , 6 2 5 .. 0.01
TOTAL INVESTMENTS 148,831,370 97.81
GBP 766.818 2.46
1,401.268 4.49
GERMANY OTHER NET ASSETS LESS LIABILITIES -. 3,644,532 . 2 3 9
KFW 5 5% 01-7 12 15
KREDIT WIEDER 5.625%01-
2 5 8 17
GBP 890,417 2.85
GBP 320.646 1.03 TOTALNETASSETS 152,475,902.- IOOf i
1.211.063 3.88
GREAT BRITAIN
ABBEY NATL 7.125% 00-PERP. REG.TR4 ABBEY NATL 7.5% 00-PERP TR.2 AMLIN 6.5%(TV) 06-19.12.26
BAA 5.75% 03-27.1 1 13 EMTN
BARCLAYS BK 5.75"/0 01-26
EMTN GREAT BRITAIN 4 75% 03-7.9.15
TSY STOCK GREAT BRITAIN 4 75% 04-
7.12 38 TSY STOCK GREAT BRITAIN 59h 01-7.3.12
TSY STOCK GREAT BRITAIN 6% 38-28 TSY
STOCK
GBP 406595 1 3 0
GBP 849.407 2.72
GBP 146888 0 4 7
GBP 405,432 1 3 0
GBP 184.065 0 59
GBP I 770,624 5 6 8
GBP 2377463 762
GBP 1,364,602 4.38
GBP 1504.209 4 8 2
HSBC Global Investment Funds -- A
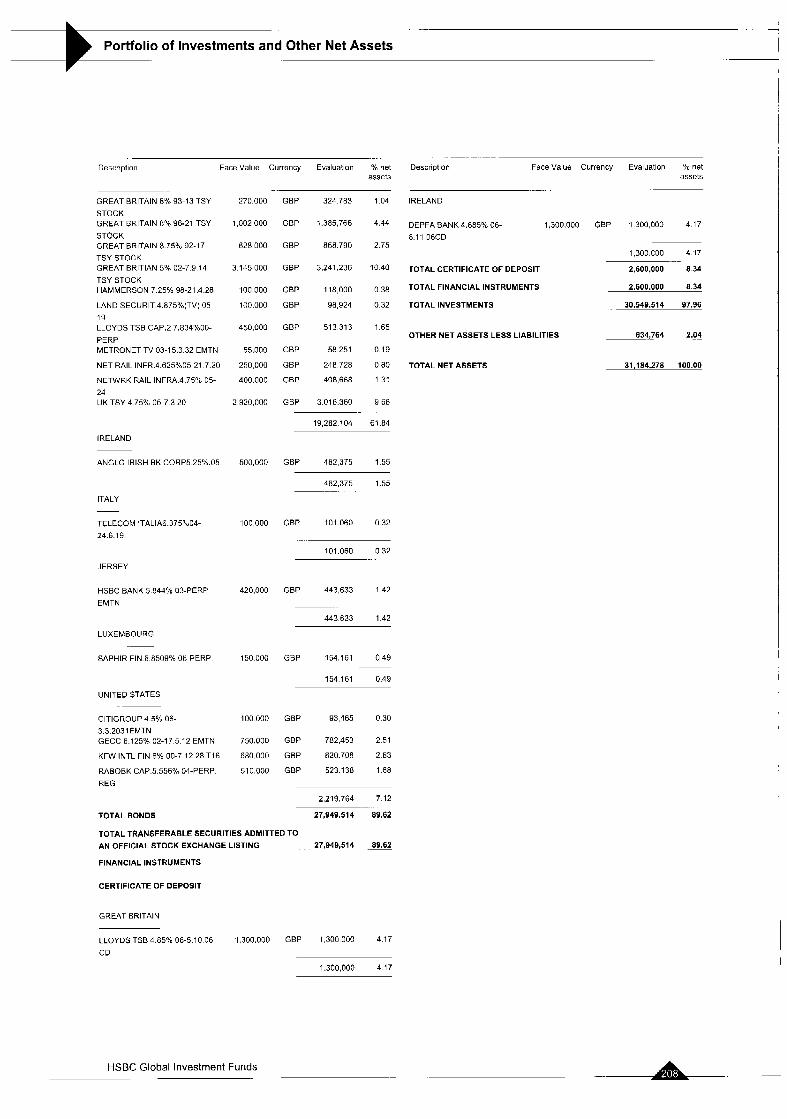
-- Portfolio of Investments and Other Net Assets I
I
Description Face Value Currency Evaluation % net assets
GREAT BRITAIN 8% 93-13 TSY
STOCK GREAT BRITAIN 8% 96-21 TSY
STOCK GREAT BRITAIN 8.75% 92-17
TSY STOCK GREAT BRlTlAN 5% 02-7 9 14
TSY STOCK HAMMERSON 7 25% 98-21.4.28
LAND SECURIT.4.875%(TV) 05- 19 LLOYDS TSB CAP.2 7.834%00-
PERP METRONET TV 03-15.3 32 EMTN
NET RAIL INFR.4.625%05-21 7.20
NETWRK RAIL INFRA.4.75Y 05- 24 UK TSY 4.75% 05-7.3 20
I RE LAND
ANGLO IRISH BK CORPS 25%.05
ITALY
TELECOM ITALIA6.375°~04- 24.6.19
JERSEY
HSBC BANK 5 844% 113-PERP
EMTN
LUXEMBOURG
SAPHIR FIN.6.8509% OB-PERP
UNITED STATES
ClTlGROUP 4.5% 06-
3.3.2031EMTN GECC 6.125% 02-17 5.12 EMTN
KFW INTL FIN 6% 00-7 12.28 T I 6
RABOBK CAP.5.556% OCPERP.
REG
270.000
1,002 000
628 000
3 145 000
100.000
100,000
450,000
55.000
250 000
400.000
2,920,000
500,000
100,000
420.000
150 000
100 000
750.000
680.000
510,OOU
GBP 324 783 1.04
GBP 1,385,766 4.44
GBP 858.790 2.75
GBP 3,241,236 1040
GBP 118,000 0 38
GBP 98,924 0 3 2
GBP 513313 1 6 5
GBP 58251 0 1 9
GBP 248728 0.80
GEP 408,668 1 3 1
GBP 3016.360 9 6 8
19,282 104 61.84
GBP 482375 1.55
482,375 1 5 5
GBP 101 060 0.32
101.060 032
GBP 443,633 1.42
443633 1.42
GBP 154.161 0 4 9
154161 0.49
GEP 93465 0.30
GBP 782.453 2.51
GBP 820.708 2 6 3
GBP 523 138 1.68
2,219.764 7 12
TOTAL BONDS 27,949,514 89.62
TOTAL TRANSFERABLE SECURITIES ADMITTED TO AN OFFICIAL STOCK EXCHANGE LISTING . . 27,949,514 -89.62 FINANCIAL INSTRUMENTS
CERTIFICATE OF DEPOSIT
GREAT BRITAIN
LLOYDS TSB4.85% 06-5.10 06 1,300.000 GBP 1.300 000 4.17
CD
1.300,OOO 4.17
Description Face Value Currency Evaluation 70 net assets
IRELAND
1,300.000 GBP 1 300,000 4 17 DEPFA BANK 4.885% 06- 6 11 06CD
1.300.COO 4 17
TOTAL CERTIFICATE OF DEPOSIT 2.600.000 6.34
TOTAL FINANCIAL INSTRUMENTS 2.600.000 8 34
TOTAL INVESTMENTS 30.549.514 97.96
834,764 2.04 OTHER NET ASSETS LESS LIABILITIES ~. ..
TOTALNETASSETS 31.184.276 100.00
HSBC Global Investment Funds -

.-
Portfolio of Investments and Other Net Assets .. .. .
US DOLLAR HIGH YIELD BOND Statement of Investments as at 30 September 2006 (expressed in USD)
. . .
Description Face Value Currency Evaluation Yo net
LUXEMBOURG
NELL AF 8.375% 05-15 8.15 144A
Description Face Value Currency Evaluation % net assots UNITED STATES
INVESTMENTS
TRANSFERABLE SECURITIES ADMITTED TO AN OFFICIAL STOCK EXCHANGE LISTING
BONDS
GREAT BRITAIN
NTL CABLE 9 125% 06-15 08.16
UNITED STATES
25,000 USD 25,876 0.48
25.876 0 4 8
CASE NEW HOLD 7.125% 06- 1.3.14 CHESAPEAKE EN.6 875% 03-16
COPANO ENERGY 8.125% 06- 1.3.16 EDUCATION MMT 10.25%06-16
144A FORD MO CR7 375%09GL.LAND
FORD MOTOR 7.375% 01-1 2 11
GIBRALTAR IND.8% 05-
ISlMUTLlCP GMAC 6.875% 02-28.8.12
MASSEY ENERGY 6.875% 06-13
MIRANT NTH.AM.7.375"h 06-13
PQ CORP 7 5"/0 05-15 2.13
TURNING STONE 9 125%06-I4
144A
50,000 US0
150.000 USD
20,000 US0
15.000 US0
100,000 USD
50.000 USD
150000 USD
250000 USD
150.000 US0
150,000 US0
50.000 USD
25000 USD
50 333
147,318
20 250
15,413
97 618
47.909
148.500
247,739
136,500
150.163
48 125
25,188
0 94
2.75
0.38
0.29
1 82
0.89
2 77
4.64
2 55
2.80
0 90
0 47
1,135.056 21 20
TOTAL BONDS 1.160.932 21.68
TOTAL TRANSFERABLE SECURITIES ADMITTED TO
AN OFFICIAL STOCK EXCHANGE LISTING 1,160,932 21.68
TRANSFERABLE SECURITIES TRADED ON ANOTHER REGULATED MARKET
BONDS
BAHAMAS
KERSZNER INT 6 75% 05-
01.10.15 150,000 US0 160,500 3.00
.. . -
160.500 3.00
CANADA __
COMPTON PET 7.625% 05- 01 12 13 JEAN COUTJ GR 8 5% 04-1 8 14
STONE CONT 7 375% 04- 15 07 14
150000 USD 144,515 2.70
i5o.000 USD 13n.750 2.59
25,000 US0 22.813 0.43
AK STEEL CORP 7 75% 02-
15 6.12 ALLIED WASTE 7 375% 114-
15.4.14 CABLEVISION 8% 05-15 4 12
SR.B CCM MERGER 8% 05-8.1.13
144A CENTENNIAL COM.lO'/c 05- 1 1 13 CINCINNATI BELL 8.375% 03-
1 4 6 CMS ENERGY 6.875% 05- 15.12.15 GEN MOTORS 7 125% 03-15.7 13
GEORGIA PAC.7.7" 95-15 6.15
GREEKTOWN HOG 10.75%05-
1 3:144A HERTZ CRP 8 875%05-
1,1.141lA4A ISLE OF CAPRI CAS.7"'o 04-14 WI
K2 7.375% 04-1 7 2014
LANDRY S REST.7.5"h 04-
15.12.14 LYONDELL CHEMICAL W.06- 15 9.14 LYONDELL CH 6 25% 06-15 9.16
MEDIACOM LLC 7 875% 99-1 1
MlLLENlUM AMER.Y 25%01-
1 5 6 0 8 OMNICARE 6 75% 05-15 12 13
FLY GEM IND.9"h 04-15.2.12
RURAL CELLUL.9.75% 02-
15.1.10 SOLO CUP 8 5% 04-15.2.14
STRIPE AC SU 10.6259005-
13:144A WILLIAMS 6.375%05-1 10.10
144A
. . . . . . .
200.000
150.000
250.000
250 000
200 000
200.000
250,000
250,000
25,000
100.000
150 000
150 000
150.000
91,000
150,000
5.000
5.000
250 000
25,000
150.000
100 000
50,000
150 000
150.000
50 000
assets
US0 200,188 3 7 4
USD
USD
USD
US0
US0
US0
USD
US0
USD
USD
US0
US0
USD
USD
USD
USD
USD
US0
US0
USD
US0
USD
US0
US0
200.188
147,386
247,833
253,777
191 750
202 300
252,966
253.125
21,926
100 208
157,500
157 440
143.531
88 957
142.673
5.084
5,072
247 338
25 979
146.438
79 833
50 300
131 125
159 750
49.719
3.74
2 75
4 63
4 75
3.58
3.78
4.72
4.73
0 41
187
2.94
2.94
2.68
1.66
2.66
0.09
0.09
4.62
0 49
2.73
1 49
0.94
2 45
2.98
0.93
TOTAL BONDS
TOTAL TRANSFERABLE SECURITIES TRADED ON ANOTHERREGULATEDMARKET
OTHERTRANSFERABLESECURITES
BONDS
UNITED STATES
3 262.010 60.91
EXOPAC 11 25% 06-1 2 14 REGS 50,000 US0
POKAGON 10.375%06-15.6.14 25,000 US0 144A RH DONNELLEY 6.875% 06-13 S 10,000 USD A2 SWIFT ENERGY 7 625Y 04- 25000 USD 15 7 11
3,928,776
3,928,776
51.249
26.687
9.067
25 167
73.37
73.37
0.96
0.50
0.17
0 47
306.078 5 7 2
HSBC Global Investment Funds .. . . . -.

Portfolio of Investments and Other Net Assets I . .
I
Description Face Value Cmency Evaluation % net US DOLLAR INVESTMENT GRADE BOND assets
. . Statement of investments as at 30 September 2006 (expressed In USD) .. . . ... .
WILLIAMS 7 5% 06-15.06.1 1 144A 25 000 US0 25.188 0.47
137,358 2.57
TOTAL BONDS 137,350 2.57 Descriplion Face Value Currency Evaluation YO net
TOTAL OTHER TRANSFERABLE SECURITIES . 137,35a . 2.57 assets
TOTALINVESTMENTS 5,227,066 97.62
INVESTMENTS OTHER NET ASSETS LESS LIABILITIES 127,264 2.36
5,354,350 ,oo~oo TRANSFERABLE SECURITIES ADMITTED TO AN OFFICIAL STOCK TOTALNETASSETS EXCHANGE LISTING
BONDS
ICELAND
KAUPTHING 7.125% 06-16 T1 144A LDSBK ISLANDS TV 06-29 144A
T2
UNITED STATES
AOL TIME 7.7% 02-1.5 32
CAP.ONE AUTO 5 53%6-09 06-8
A2 CHESAP.&PROTOMAC 7.625 92-
12 DAIMLERCHRY 4.05% 03-4.6.08
DUNKN 5.779%06-20.6.31 06-1
A2 FNMA 5% 05-01 07 35 P 825278
FORD MOTOR CR.5 8% 12 1 09
GE CMC 4.353%05-1 2 10/05C1
A2 INTL LEASE FIN.TV 06-11 7.11 Q
SLMA TV 03-15 12.15 SO3-12 A3
SOVEREIGN CAP 7.908%06-
13.6.36 USATSY 4.875% 06-15.8.16
USA TSY 5.5% 98-2028
USA TY 4.875%06-31.5.11 J-2011
USA 3.25% 03-15.8.08 S G-2008
USA 4 5% 06-15.02.16 S E-2016
USA 4 875% 06-15.05.09 TSY
USA 4.875% 06-31.05.08 V-2008
VERIZON PENN.5.65% 01- 15.11 11 XEROX CORP TV 06-18.12.09
550 000
650.000
550 000
300 000
600 000
725 000
360.000
1.296.478
600.000
340,000
600,000
980 794
550,000
975,000
950,000
415,000
750 000
80,000
2 900.000
4,400,000
500 000
300 000
USD 578.236 0.95
US0 651,164 1.06
USD
US0
USD
USD
USD
US0
USD
USD
US0
USD
US0
US0
USD
USD
USD
US0
US0
US0
US0
USD
614.566 1 0 1
300.389 0 4 9
642,738 1.05
707.745 1.16
365,998 0.60
1,248468 2 0 5
572700 0 94
332,325 0 5 4
602.383 0 9 9
982,327 1 6 1
61C351 100
995109 1 6 3
1,036,836 1 70
42@350 0 6 9
731.016 1.20
79,325 0 13
2919,031 4 7 8
4410312 7 2 3
50G,060 082
301 500 0 4 9
1,229.400 2 01
TOTAL BONDS
18,373.529 30.11
19,602,929 32.12 . .
TOTAL TRANSFERABLE SECURITIES A D M l n E D TO AN OFFICIAL STOCK EXCHANGE LISTING 19,602,929 32.12
HSBC Global Investment Funds - .- .-

Portfolio of Investments and Other Net Assets -~
Description Face Value Currency Evaluation "'0 net assets
~.
TRANSFERABLE SECURITIES TRADED ON ANOTHER REGULATED
MARKET
BONDS
GREAT BRITAIN
6ARCLAY.B 5.926%06-..PERP 144A
NETHERLANDS ~. . .
SIEMENS FIU.5.75% 06-16 - 144A-
UNITED STATES
ABFC 3.684% 05-33 03-AHL1 A1
AMCAR 2 98% 04-09 04-OF -A3-
ANADARKO PETRO 5 95%06-
15.9.16 BACM 5.889% 06-44 06-3 A4
BERKSH.HATH.4.85% 05- 15.01 . I5 BNSF FDG TR.6.613%05-
15.12.55 BURLINGTON 4.83% 05-01 15.23
CARAT 1.96% 03-09 2003-2 A4A
CARAT 5.03% 06-08 2006-1 A2A
CMLTI 4.92216 05-35 05-WF2 AF2
COLLEGE L.CORP 06-20/2006-1 A1 COMCASTG 5% 03-15.1.15
COX COMM.5.45C 04-15.12.14
CWHL 5.4139% 05-35 05-HYB8 2A1 CWL 5.804%06-25.10 36 0 6 4 4
A3 CWTH EDISON 5.95%06-16
5.104 FHLMC 4.14% 04-
1.1 2.34P.182655 FHLMC 5,125°,0 06-13 ROO4 AL
FHLMC 5.5% 05-1 5 11 2 3 2962
CJ FHLMC 6 582% 06-1.6.36
PlJ13130 FHLMC 8% 00-1.2 2030
FHLMC 8% co-1.4.30 POOL COO972 FNMA (30Y)6% 06-01.10.36 *TBA* FNMA (30\1)6.5% 06-01 10.36
FNMA 5.5% 05-1 7.35 P.255770
FNMA(3OYR)S 5% 06- 1 10.36'TBA' FNMA(30Y)5% 06-1 10.36 'TBA'
FREDDIE MAC 7.3% 99- 8.12.2014 GCCCFC 6.1101% 06-16 06-GG7
A4 GCCFC 4 305% 05-42 S05-GG3
A2 GENERAL ELEC CO 5% 03- 12.13 GMAC MTG 5 805%06-36/06.
HE3-A3
400 000
500,000
255 U11
1,090,713
300 000
400.000
1.225,OOO
700.000
652,531
271 217
719,078
273.052
1,200.000
750.000
650.000
640,154
570.000
650,000
843,379
742.942
857 455
1,117,141
253,112
115 190
1 700.000
1.500 000
1,963 309
3.600,OOO
2 120,000
2,500,000
550 000
650 000
1.000 000
480 000
U5D 400.522 0.66
..
400.522 0.66
USD 508.649 0.83
508,649 0.83
US0
USD
USD
US0
US0
US0
US0
USD
USD
USD
USD
US0
US0
US0
USD
USD
US0
U5D
USD
USD
USD
USD
US0
US0
USD
USD
U5D
US0
US0
USD
USD
US0
248,636
i.oao 147
303 643
416,173
1,190,525
706,171
648,851
269 013
717 954
270.495
1 . I 99,625
781,543
626.173
639.782
573.02a
659 954
a34 407
737.249
asa.731
1,132 582
265 768
120,949
1.708.766
1.527.891
1,937,233
3.552 187
2,041,493
2.509.1 27
576.464
635,296
9n9,2n9
483.600
0.41
1.77
0.50
0.68
1.95
1 1 6
1.06
0.44
1.18
0.44
1.97
1.28
1 0 3
1 0 5
0.94
1 .oa
1.37
1.21
1 4 1
1 .a6
0.44
0.20
2 80
2 50
3.17
5.81
3 35
4 11
0 94
1.04
1.62
0.79
Description Face Value Currency Evaluation YO net assets
GNMA(30Y) 6% 06-1.9 36 -TBA'
GSAA 5.aa2460in 06-36 06-15
J.DEERE OWN 5 3 a ~ ~ o 6 - 1 0 OE-A AF3A
A3 JPALT 6% 05-25 12.35 05-S1 2A9
LBUBS 5.156% 06-31 06-C1 A4
LBUBS 5 43424% 06-36 06-C6 A4
MAY DEPARTMENT 6.65% 04-
15 7.24 MORG.STA.5.162%06-52i06-T21- A4 M5M 5.91935% 06-36 06-3AR
2A3 NAA 5.515% 06-36 06-AP1 A2
PROGRESS ENGY W 0 5 - 14.1 1.08-A- SBC COMM 5 1% 04-3 11.14
GLOB. SPRINT CAP CORP.H.75% 02-32
TARGET CRED TV 02-1 1 2002.1 A TIME WARNER ENTMT.8.375Y
Y3-23 USA TSY NOTE5 4.75% 06-
31 3 1 1 USA TSY 4.25"%04-15.8.14/E-
2014 USA 4 5% 06-15.02 36
USA4 875% 06-31.07.11S.L-2011
VW AUTO LEA.2.84%04-07104-A- A3
570,000
470,000
a70,ooo
1,033 563
600 000
600 000
950,000
630.000
710,762
320.000
450.000
750.000
925,000
1.550 000
525 000
445,000
560.000
520,000
725 000
47.101
USD
USD
USD
USD
USD
USD
US0
US0
US0
US0
US0
USD
US0
USD
US0
US0
US0
US0
USD
USD
576502 0 9 4
475434 0 7 8
a71 oaa 1 4 3
1.030 773 169
592610 0 9 7
602.966 099
952,458 1.56
622.794 102
717,439 1 18
318,220 0 5 2
450682 0 74
719325 1 i a
1,133,905 1.86
1,551 453 2 5 4
604.146 0 9 9
448.338 0 7 3
547,400 0 90
499,119 0 8 2
734516 1 2 0
47042 008
TOTAL BONDS
43.738.955 71.68
44,640,126 73.17
TOTAL TRANSFERABLE SECURITIES TRADED ON
ANOTHER REGULATED MARKET 44,648.126 . . 73.17
OTHER TRANSFERABLE SECURITES
BONDS
CAYMAN ISLANDS
PREFERR.T.XXII TV 06-36 144A
UNITED STATE5
6oo.000 USD 6ooooo o g a
6ooooo 098
MORG.5T.5.779%06-42~06-lQl1 AM PUGET SOUND 6.274% 06-
15 03 37 TULANE UN.TV05-15.11 12 144A
UNION PAC 5 082% 05-1 2.29
WHIRLPOOL TV 06-15 06.09
550000 USD 56a.007 0.93
550,000 US0 560,245 0.92
aoo.ooo USD aooooo I 31
5oo.000 USD 507030 083
600,000 USD 601.127 0 9 9
3,036,409 4.98
TOTAL BONDS 3,636,409 5.96
TOTAL OTHER TRANSFERABLE SECURITIES 3.636.409 5.96
TOTAL INVESTMENTS 67,007,464 3 1 . 2 5
OTHER NET ASSETS LESS LIABILITIES (6,863,7-55 ---
TOTALNETASSETS 61,023.712 100.00
HSBC Global Investment Funds .

-_ -_
Portfolio of Investments and Other Net Assets i I
EURORESERVE Statement of investments as at 30 September 2006 (expressed in EUR)
- ..
Oescription Face Value Currency Evaluation % net assets
IRELAND
ANGLO IRISH BK 0%06- 1,500.000
12 12.06CP
CP
MATCHPOINT O Y ~ 06-25 i o 06 2 noo.ooo
EUR 1490.000 2 6 1
EUR 1995390 3 5 0 Description Face Value Currency Evaluation net assets
3,485,390 6.1 1
SWEDEN INVESTMENTS
TRANSFERABLE SECURITIES ADMITTED TO AN OFFICIAL STOCK
EXCHANGE LISTING
BONDS
SVENSKA HANDBK 0%06- 2,000.000
10 10.06CP
EUR 1,998.128 3.50
1,996,128 3.50
UNITED STATES
GENERAL ELEC 0% 06-13 12.06
CP
2 000,000 EUR 2.000,OOO 3.51
- .. ..
2,000.000 3.51
FRANCE
CCCIF TV 03-29 1 07 EMTN
SANOFI AVENTIS TV 05-30 05 07
1500000 EUR 1.500,750 2 6 3
500000 EUR 499761 0.88 TOTAL COMMERCIAL PAPER
CERTIFICATE OF DEPOSIT
21,853.1 34
1,999,999
1,500,000
2 000 000
1.000,000
1.500.000
1.soo,ooo
2,000.000
2 000.000
1 500 000
2,000 000
2.000 000
2 000,000
2 000 000
38.49
3.50
2 63
3 50
1 7 5
2.63
2.63
3.51
3.51
2.63
3 51
3.51
3.51
3.51
2 000,511 3 51
NETHEqLANDS FRANCE
KBC IFIMA TV 05-20.4.07
SPAIN
1,000.000 EUR 1 000,000 1 75 BFCM 0% 06-7.11.06 CD
BNP PARIBAS Oo/o 06-4.12.06 CD
BOE SOFINCO 0% 06-5.10 06 CD
BQ.SOLFEA 0% 06-20 7.07 CD
CALYON 0% 06-16.11 06 CD
CEPME 0% 06-19.2.2007 CD
CIC 0% 06-09.11 06 CD
C.MUT.BRETAGNE 0%06-
24.11.06CD CNEP 0% 06-03.10.06 CD
CREDIT FONCIER 09006-2 11 06 CD CR MUTUEL L AT 0% 06-
13 4.07CO DEXIA CLF 0% 06-17.10.06 CD
STE GEN SA 0% 06-11.10.06 CD
2 000.000
1 500,000
2 000,000
1,000 000
1,500 000
1,500,000
2 000 000
2 noo.ooo
1,500,000
2,000 000
2,000,000
2.000 no0
2.000 000
EUR
EUR
EUR
EUR
EUR
EUR
EUR
EUR
EUR
EUR
EUR
EUR
EUR
i.noo ooo 1 7 5
BANESTO BCO TV 04-
4.10 06;RBG) BBVA TV 05-28.09.07
2,000 000 EUR 1,999,979 3 SO
500,~100 EUR 499.912 0 8 8
2.499.891 4.38
.. .
TOTAL BONDS
TOTAL TRANSFERABLE SECURITIES ADMITTED TO
5,500,402 9.64
AN OFFICIAL STOCK EXCHANGE LISTING
FINANCIAL INSTRUMENTS
5,500,402 9.64
COMMERCIAL PAPER
AUSTRIA
OESTER.KONTRBK.O%OG- 1,800 000
08.1 1.06CP
- 40 33
2 63
22,999,999
GERMANY EUR 1,793,645 3.14
BAY.HYPOBK 0% 06-13 12.06 CD 1.500 000 EUR 1.500.000 1 793.645 3.14 I
1,500,000 2.63 FRANCE
TOTAL CERTIFICATE OF DEPOSIT
TOTAL FINANCIAL INSTRUMENTS
TOTAL INVESTMENTS
24,499,999 42.96
46,453,133 81.45
51,953,535 91.09
CARREFOUR SA 0% 06-09 10 06
CP HEXAGON FIN 0% 06-02 10 06 CP LMA 07" 06-10 10.06 CP
THESEE LTD 0% 06-23 10 06 CP
1 200 000
2.000 000
1,500 000
1,500.000
EUR 1,198,976 2.10
EUR 1,999,488 3.51
EUR 1498.593 2.63
EUR 1496,854 2 6 2 OTHER NET ASSETS LESS LIABILITIES 5.083.7AO 8.91
6.193 911 10.86 TOTALNETASSETS 57,037,275 -- 100.00
GREAT BRITAIN
ALLIANCE LEIC.0%06-2 11.06 CP 2,000,000
BRITANNIA BLDG 0%06-4 ',Z.U6 1 500,000
CP CANTABRIC FIN Oo.- 1.000,000
10.10.U6(RBG) NORTHERN ROCK O c ; 06- 2.000.000
12 10 C6CP
EUR 1.994116 3 5 0
EUR 1491 116 2.61
EUR 999.055 1 7 5
EUR 1.997 773 3.51
6,482.060 11.37
A- HSBC Global Investment Funds .. _ - _-

Portfolio of Investments and Other Net Assets -. --
US DOLLAR RESERVE Statement of Investments as at 30 September 2006 (expressed in USD)
Description Face Value Currencv Evaluation 70 net assets
INVESTMENTS
FINANCIAL INSTRUMENTS
COMMERCIAL PAPER
AUSTRALIA
GEORGE STREET 0% 06-
23.10.06CP TELSTRA CORP 0% 06-08 11.06
CP TELSTRA CORP 0% 06-21.11.06
CP
CANADA .-
ENP PAR.CANADA 0%06- 5.10.06CP
CAYMAN ISLANDS . -~
STARBIRD 0% 06-6 10 06 CP
GERMANY
HSBC Global Investment Funds
HANNOVER FOG 0% 06-17.10.06
CP
UNITED STATES
ADV ASSET MGT 0% 06-6.10.06
CP AGA CAPITA- 0% 06-18.10.06 CP
APRECO LLC Oo/u 06-15 11.06 CP
AUSTRA CORP 0% 06-20.10.06
CP
CP BEETHOVEN FUND.O%- 6.1 O.OG(RBG) CBA DELAWARE 0% 06-27 10 06
CP EAST FLEET FI 0% 06-
11.1006CP FAIRWAY FIN 0% 06-5.10.06 CP
GOLDEN FlSY 0% 06-23 10.06
CP ING FUNDING 0% 06-2 10.06 CP
LIBERTY STREET 0%06-6.10.06
CP LONG LANE MAST 0%06- 06.10.06CP MARKET FUNDING 0906- 11 10.06CP MAXlMlLlAN CAP.0%06-5.10.06
CP PARADIGM FDG 0% 06-6.10.06
CP
BAVARIA TRR 004 06-25.10.06
700.000
700.000
700,000
700.000
700,000
700.000
601,000
700.000
600.000
700 000
700,000
700.000
700,000
700 000
700 000
298.000
546,000
700.000
700.000
250 000
700,000
700.000
US0 697.540 3.45
US0 695.917 3 4 4
USD 694.569 3.44
2.088 026 10.33
US0 699.372 3 4 6
-
699.372 3.46
USD 699.284 3.46
699,284 3.46
USD fi98,149 345
698.149 3.45
Description Face Value Currency Evaluation % net assets
ROMULUS FUND 0% 06-17 10 06 700 000 CP SlMBA FUNDING 0% 06- 700,000 18 10 06CP SYDNEY CAP 0% 06-11 10 06 CP 560 000
TASMAN FDG 0% 06-20 10 06 CP 700 000
THAMES ASSET O0/. 06-26 10 06 700 000
CP UBS FINANCE 0% 08-10 10 06
CP WLD OMNl VEH 0% 06-27 10 06
CP
157,000
700 000
USD 698,152 3 4 5
USD 698049 3 4 5
USD 559018 2 7 7
USD 697.840 3 4 5
US0 697239 3 4 5
USD 156.748 0 7 8
US0 697,120 3 4 5
TOTAL COMMERCIAL PAPER
TOTAL FINANCIAL INSTRUMENTS
TOTAL INVESTMENTS
OTHER NET ASSETS LESS LIABILITIES
TOTALNETASSETS
14 177,522 70 13
18,362,353 90.83
18,362,353 90.83
18.362.353 90.83
1,854,750 9.17
20,217,103 100.00
US0
USD
USD
US0
US0
US0
us0
USD
USD
US0
USD
US0
USD
US0
US0
USD
600 385
698.057
595 872
697.840
697 321
699.103
697.147
698.768
699,386
296,947
545.762
699.268
699 285
249,563
699.369
699.283
2 97
3 45
2.95
3.45
3 45
3 46
3.45
3.46
3.45
1 4 7
2 70
3.46
3.46
1 2 3
3.46
3.46
A-

-- ~ .
Portfolio of Investments and Other Net Assets . .. . . .
TURKISH CONVERGENCE Statement of investments as at 30 September 2006 (expressed in EUR)
Description Qunntity'Face Currency Evaluamn % net Value assets
INVESTMENTS
TRANSFERABLE SECURITIES ADMITTED TO AN OFFICIAL STOCK
EXCHANGE LISTING
SHARES
TURKEY -
ADANA CIMENTO SANAYI A
AKBANK
AKCAhSA CIMENTO SANAYI VE
TIC AKSIGORTA
ALARKO GAYRIMENKUL
YATIRIM ALARKO HLD
ANADOLU CAM SANAYll AS
ANADOLU EFES ElRAClLlK VE
MALT AYAN ENERJI AS
BO1.U CIMENTO SANAYI AS
ClMSA CIMENTO SANAYI VE
TICAR DOGAN SIRKETLER GRUBU
HOLDINGS EFES SINAI YATIRIM HOLDING
A.S FINANSBANK
FORD OTOMOTIV SANAYI AS
MIGROS TURKEY T A S .
NORTEL NETWORKS NETAS
TELEKOM PETKIM PETROKIMYA HOLDING
AS TRAKYA CAN SANAYll AS
TUPRAS TURKIYE PETROL
RAFINEL TURK DEMlR DOKUM
TURK EKClNOMl BANKASI AS
IWRK TRAKTOR VE ZIRAAT
MAKINEL TURKCELL ILETlSlM HIZMET
TURKIYE GARANTI BANKASI
/NOM YAP1 KREDI BANKASA
TOTAL SHARES
BONDS
TURKEY
TURKEY TV US-17 2 10
TURKEY TV 05-18 8 10
TURKEY TV 06-02 07 OR 91R
TURKEY O'X 05-08.11 06 (RBGJ
34 622
350 000
23 000
60 000
55,373
275,000
30 000
40 005
3nn 000
150,000
37,672
1 uu 000
56 302
305 191
30 000
153 600
49 184
1uu,0uu
MI 000
30.000
100 (1110
112.661
50,000
80,000
600.000
20u 000
1 000 000
2.000,00u
22.600 000
150 000
TRY
TRY
TRY
TRY
TRY
TRY
TRY
TRY
TRY
TRY
TRY
TRY
TRY
TRY
TRY
TRY
TRY
TRY
TRY
TRY
TRY
TRY
TRY
TRY
TRY
TRY
177 611
1.445.606
88,341
176.788
786,637
567.1 Y3
81,291
789 329
358 310
225.720
172 445
313 061
361 406
963.463
157.057
1 204 175
808.698
268 338
165.002
366.203
705.0C5
800.239
368 307
317 797
1,452,182
277 809
0 35
2 82
0 17
0 34
1 53
1 1 1
0 16
1.54
0 70
0 44
0 34
0 61
0.70
1 ns 0 31
2 35
1 58
0 52
0 32
0 71
1 38
1 56
0 72
0 62
2 83
0 54
13,398,053 26.13
13.398.053 26.13
TRY 548.435 1 0 7
TRY 1,090030 2.13
TRY 11,965803 23.33
TRY 77.630 0.15
Doscription QuantityiFace Currency Value
TURKEY 0% 05-09 05.07 3,000.000 TRY
TURKEY 0% 05-24 1.07 500,000 TRY
TURKEY 0% 06-05 09.07 1.000,OOO TRY
TURKEY 0% 06-07.11.07 8,000,000 TRY
TURKEY 0% 06-13 06.07 TRY 2,500.000 TRY 100 TURKEY 0% 06-16.7.08 3,000.000 TRY
TURKEY 14% 06-19.01 11 2600.000 TRY
TURKEY 15'X 5-10.2.10 200.00U TRY
TURKEY 20% 04-17.10 07 5,800,000 TRY
Evaluation . ... ... - YO net
assets
1 423 487
249,786
439 617
3.381 650
1,148,409
1 105,695
1 135.533
9',752
3,055.452
2 78
0 49
0 86
6 59
2 24
2 16
2.22
0 18
5 96
25.713 279 50 16
TOTAL BONDS 25.713.279 50.16
TOTAL TRANSFERABLE SECURITIES ADMITTED TO
AN OFFICIAL STOCK EXCHANGE LISTING
FINANCIAL INSTRUMENTS
TREASURY BILLS
TURKEY -.
TURKEY 09: 05-04 10 06 TB
TURKEY O C 06-17 1 07 TB
500.000
11.000,000 (REG)
39,111,332 76.29
TRY 262 511 0 51
TRY 5.483601 1070
5,746,112 11.21
TOTAL TREASURY BILLS
TOTAL FINANCIAL INSTRUMENTS
TOTALINVESTMENTS
OTHER NET ASSETS LESS LIABILITIES
TOTALNETASSETS
5.746.112 11.21
5,746,112 1.1.21
44357.444 87.50
-. 8,407,959 12.50
51,285,403 100.00
HSEC Global Investment Funds

. .. .- . _
Portfolio of Investments and Other Net Assets - _- . -.
The detailed list of movements in the investment portfolio can be obtained free of charge upon request at the registered office of the Company. The current prospectus, the articles of association as well as the interim report and the audited annual report are available free of charge upon request from the German payment and information office.
HSBC Global Investment Funds .- - .

To help shareholders to calculate the performance of their individual investment, in the relevant reference currency, we have produced the following table. It shows the value of one US Dollar against various currencies (as at the given dates).
31 March 2006 30 September 2006
AUD
CAD HKD
JPY GBP
SGD CHF EUR
USD
1.3975
1.1619
7.7599
1 17.4349
0.5737 1.6181
1.2999
0.8238
USD
1.3370
1.1117
7.7906
117.9300
0.5342 1.5868
1.2499
0.7882
A - HSBC Global Investment Funds - _.

Dealing Day of the Fund __ .
Dealing for Shares of the Company will take place on any Business Day (a day on which banks are open for normal banking business in Luxembourg) other than days during a period of suspension of dealing in Shares provided that, for sub-funds materially invested in markets other than North or South American markets, such Business Day is a day where stock exchanges and regulated markets in countries where the sub-fund is materially invested are open for normal trading. For sub-funds materially invested in North or South American markets, dealing for Shares of the sub-fund will take place on any Business Day (other than days during a period of suspension of dealing in Shares) except a Business Day following the day where stock exchanges and regulated markets in such countries were closed for normal trading.
Shareholders who deal through the Company's local distributor or representative should note that there will be no dealing for the Shares of the Company in the jurisdiction in which such distributor or representative operates on a day which is not a business day in such jurisdiction.
The Company will determine the dealinglnon-dealing calendar according to the latest market information obtained by the Company from time to time. Shareholders can obtain the latest dealinglnon-dealing calendar of the Company from the registered office of the Company or from the Company's local distributor or representative.
HSBC Global Investment Funds ~ --A- -

Dealing Day of the Fund ..
FUND NON-DEALING DAYS FOR 2007
All HSBC Global Investment Funds sub-funds will have non-dealing days on the following days:
0 all Saturdays and Sundays
and
on the following dates:
0
0
0
0
0
0
0
0
0
0
1 January 6 April 9 April 01 May 17 May 28 May 15 August 01 November 25 December 26 December
(Luxembourg public holiday) (Luxembourg public holiday) (Luxembourg public holiday) (Luxembourg public holiday) (Luxembourg public holiday) (Luxembourg public holiday) (Luxembourg public holiday) (Luxembourg public holiday) (Luxembourg public holiday) (Luxembourg public holiday)
In addition the following sub-funds will have non-dealing days on the following dates (reason in brackets):
Asia ex Japan Equity, Asia ex Japan Equity Smaller Companies, Asia Freestyle (Public holiday in Hong Kong, Korea, and Taiwan)
19 February 20 February
0 28 February 0 01 March
05 April 24May 06June
0 19June 02 July 17 July
0 24 September 0 25 September
26 September 01 October
0 03 October I O October I 9 October
Hong Kong, Taiwan Hong Kong, Taiwan Taiwan Korea Hong Kong, Taiwan Hong Kong, Korea Korea Hong Kong, Taiwan Hong Kong Korea Korea Korea, Taiwan Hong Kong, Korea Hong Kong Korea Taiwan Hong Kong
Asia Pacific ex Japan Equity High Dividend (Public holiday in Hong Kong, Korea, Singapore, and Taiwan)
0 02January 0 19 February
20February 28February 01 March
0 05 April 0 24May
31 May 0 O6June 0 19June
Singapore Hong Kong, Singapore, Taiwan Hong Kong, Singapore, Taiwan Taiwan Korea Hong Kong, Taiwan Hong Kong, Korea Singapore Korea Hong Kong, Taiwan
HSBC Global Investment Funds .- -

-.
Dealing Day of the Fund (continued)
0
0
0
0
0
0
0
0
0
0
0
0
0
02 July 17 July 09 August 24 September 25 September 26 September 01 October 03 October 10 October I 9 October 24 October 08 November 20 December
Hong Kong Korea Singapore Korea Korea, Taiwan Hong Kong, Korea Hong Kong Korea Taiwan Hong Kong Singapore Singapore Singapore
Brazil Bond, Brazil Equity, Global Emerging Markets Bond (Public holiday in Brazil)
0 02January 26January
0 20February 0 21 February 0 02May 0 08June
10 July 10 September
0 15October 0 05November
16November 0 21 November
Brazil Brazil Brazil Brazil Brazil Brazil Brazil Brazil Brazil Brazil Brazil Brazil
BRlC Freestyle, ERIC Markets (Public holiday in Brazil, Hong Kong, India, Russia, and in the United States)
0 02January 0 03January 0 04January 0 05January 0 08January
16January 0 26January
19February 0 20February 0 21 February 0 23February 0 08March 0 09March
05 April 30 April 02May
0 09May 24May
0 08June 0 11 June 0 19June
02 July 05 July I O July 04 September I O September
Brazil, United States, Russia Russia Russia Russia Russia United States Brazil, India Hong Kong United States, Brazil, Hong Kong Brazil Russia Russia Russia Hong Kong Russia Brazil Russia Hong Kong Brazil Russia Hong Kong Hong Kong United States Brazil United States Brazil
HSBC Global Investment Funds . . . . . .. . . -. .. . . .-

-.
Dealing Day of the Fund (continued) -. ..
_ -
~-
26 September 02 October 01 October 15 October 19 October 05 November 16 November 21 November 23 November
Hong Kong India Hong Kong Brazil Hong Kong Brazil, Russia Brazil Brazil United States
Chinese Equity, Hong Kong Equity (Public holiday in Hong Kong)
19 February 20 February 05 April 24 May 19 June 02 July 26 September 01 October 19 October
Hong Kong Hong Kong Hong Kong Hong Kong Hong Kong Hong Kong Hong Kong Hong Kong Hong Kong
Emerging Europe Equity (Public holiday in Czech Republic, Hungary, and Poland)
15 March 03 May 08 May 07 June 05 July 06 July 20 August 28 September 23 October 24 December
Hungary Poland Czech Republic Poland Czech Republic Czech Republic Hungary Czech Republic Hungary Czech Republic
Euro Corporate Bond, Euro Investment Grade Corporate Bond, Euroland Equity, Euroland Value Creation (Public holiday in Germany, France and in the Netherlands)
0 30 April the Netherlands 08May France 03October Germany
Euro Credit Bond, Euro Investment Grade Bond, Pan-European Equity (Public holiday in Great Britain and in France)
e 07May Great Britain 08May France 27August Great Britain
Europe ex UK Equity (Public holiday in Germany and in France)
08May France 0 03October Germany
HSBC Global Investment Funds

Dealing Day of the Fund (continued) ..
Euro High Yield Bond, UK Equity, UK Freestyle (Public holiday in Great Britain)
07May Great Britain 27August Great Britain
Euroland Equity Smaller Companies (Public holiday in France, Germany, Italy and in the Netherlands)
0 06January Italy 25 April Italy 30 April the Netherlands
0 08May France O6June Italy 03October Germany
Global Emerging Markets Equity (Public holiday in Korea, Taiwan and in the United States)
02January 0 16 January e 19Febmary
20February 0 28February
01 March 05 April
0 24May 0 O6June
19June 05 July 17 July 04 September 24 September 25 September
0 26 September 03 October
e 10 October 23November
United States United States Taiwan Taiwan, United States Taiwan Korea Taiwan Korea Korea Taiwan United States Korea United States Korea Korea, Taiwan Korea Korea Taiwan United States
Global Emerging Markets Equity Freestyle (Public holiday in Korea, Great Britain, and in the United States)
02January 0 16 January 0 20February
01 March 07May
0 24May O6June 05 July 17 July 27August 04 September 24 September
0 25 September 26 September 03October
0 23November
United States United States United States Korea Great Britain Korea Korea United States Korea Great Britain United States Korea Korea Korea Korea United States
HSBC Global Investment Funds ... .

Dealing Day of the Fund (continued) L- -
Global Equity (Public holiday in Japan, and in the United States)
0 02January 08January 16 January 12 February 20February
0 21 March 30April 03May
0 04May 05 July 16 July 04 September 17 September 24 September 08October 23November
United States Japan United States Japan United States Japan Japan Japan Japan United States Japan United States Japan Japan Japan Japan, United States
Global Equity SRI, Global Ex Euroland Equity, US Dollar Reserve, US Equity, US Index (Public holiday in the United States)
02 January United States 16 January United States
0 20 February United States 05 July United States 04 September United States 23 November United States
Global Investment Grade Bond (Public holiday in Germany, Italy, Japan, France, Great Britain and in the United States)
02January O6January O8January 16January 12February
0 20February 21 March 25 April 30 April
0 03May 04May 07May 08May
0 O6June 05 July 16 July 27August
0 04 September 17 September 24 September 03 October 08 October 09October 13 November 23November
United States Italy Japan United States Japan United States Japan Italy Japan Japan Japan Great Britain France Italy United States Japan Great Britain United States Japan Japan Germany Japan United States United States Japan, United States
HSBC Global Investment Funds ~- -. . ._ - - . . _. - _ - -
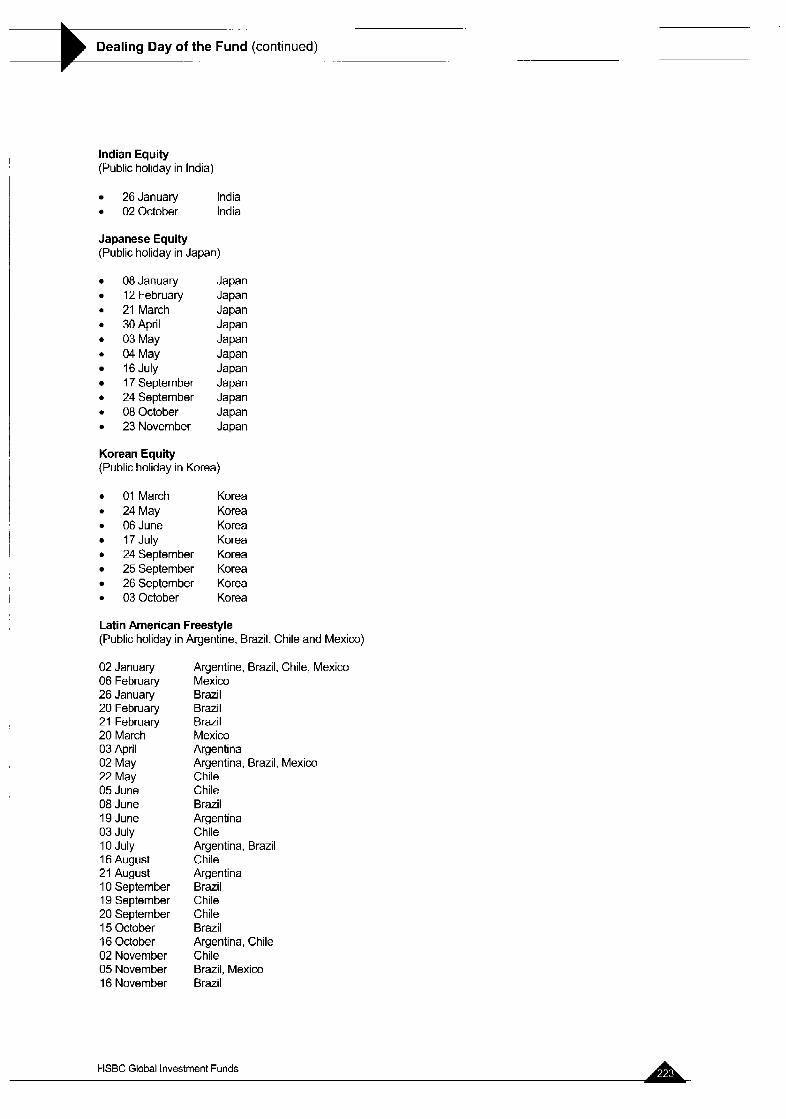
-- Dealing Day of the Fund - (continued)
Indian Equity (Public holiday in India)
26January India 0 02October India
Japanese Equity (Public holiday in Japan)
08January 12 February
0 21 March 0 30 April 0 03May 0 04May
16 July 17 September
0 24 September 0 08October 0 23November
Japan Japan Japan Japan Japan Japan Japan Japan Japan Japan Japan
Korean Equity (Public holiday in Korea)
0 01 March 0 24May 0 O6June
17 July 0 24 September
25 September 26 September
0 03October
Korea Korea Korea Korea Korea Korea Korea Korea
Latin American Freestyle (Public holiday in Argentine, Brazil, Chile and Mexico)
02 January 06 February 26 January 20 February 21 February 20 March 03 April 02 May 22 May 05 June 08 June I 9 June 03 July 10 July 16 August 21 August 10 September 19 September 20 September 15 October 16 October 02 November 05 November 16 November
Argentine, Brazil, Chile, Mexico Mexico Brazil Brazil Brazil Mexico Argentina Argentina, Brazil, Mexico Chile Chile Brazil Argentina Chile Argentina, Brazil Chile Argentina Brazil Chile Chile Brazil Argentina, Chile Chile Brazil, Mexico Brazil
HSBC Global Investment Funds

. .... .. .
Dealing Day of the Fund (continued) I . - ....
I
20 November Mexico 21 November Brazil 13 December Mexico
Pan-European Equity High Dividend (Public holiday Germany, France and Great Britain)
07May Great Britain 08May France 27August Great Britain 03October Germany
Singapore Equity (Public holiday in Singapore)
0 02January I 9 February 20February
0 31 May 0 09August 0 24October
08November 20December
Singapore Singapore Singapore Singapore Singapore Singapore Singapore Singapore
Sustainability Leaders (Public holiday in Germany, Switzerland, Great Britain and in France)
0 07May Great Britain 08May France 01 August Switzerland 27August Great Britain
0 03October Germany 0 24 December Switzerland
Thai Equity (Public holiday in Thailand)
13 April 16 April
0 17 April 02May 07May 02 July 23October 05December 10 December
Thailand Thailand Thailand Thailand Thailand Thailand Thailand Thailand Thailand
Turkish Convergence (Public holiday in Turkey)
02January 03January 23April 30August 12 October 29October 20December 21 December
Turkey Turkey Turkey Turkey Turkey Turkey Turkey Turkey
HSBC Global Investment Funds

Dealing Day of the Fund (continued) _ _ _. . . . _. ....
US Dollar High Yield Bond, US Dollar Investment Grade Bond (Public holiday in the United States)
02January 16 January
0 20February 05 July
0 04 September e 09October 0 13 November
23November
United States United States United States United States United States United States United States United States
HSBC Global Investment Funds