How Does the SF‐36 Perform in Healthy Populations? A Structured Review of Longitudinal Studies
19
Journal of Social, Behavioral, and Health Sciences 2010, Volume 4, Issue 1, Pages 30–48 ©Walden University, Minneapolis, MN DOI: 10.5590/JSBHS.2010.04.1.02 Please address queries to: Martin Cherniack, Division of Occupational and Environmental Medicine, University of Connecticut Health Center, Farmington, CT 060306210. Email: cherniack@nso.uchc.edu How Does the SF36 Perform in Healthy Populations? A Structured Review of Longitudinal Studies Chinekwu A. Obidoa University of Connecticut Susan L. Reisine University of Connecticut Martin Cherniack University of Connecticut This study examined the stability of the Medical Outcomes Study-Short Form (SF-36) in healthy populations. The researchers conducted a structured review of longitudinal studies that reported the use of SF-36 among people in their active working years ages 18 to 65. The cumulative sample size across selected studies comprised 29,868 participants. SF-36 mean scores were similar to published U.S. aggregate norms. Gender-specific changes in SF-36 scores also followed a normative trend, with women having greater declines in scores (poorer health) than men. The SF-36 was stable among healthy populations; however, its use among healthy people requires caution, particularly when considering the longitudinal effects of age. Keywords: SF-36, healthy populations, stability, aging Background The Medical Outcomes Study-Short Form (SF-36) questionnaire is widely used for measuring health- related quality of life (HRQL) in various settings. Applications of the SF-36 include health policy evaluations, clinical practice and research, health intervention evaluations, and a general population surveying (Hemingway, Stafford, Stansfeld, Shipley, & Marmot, 1997; Ware & Sherbourne, 1992). Studies have implied that the SF-36 is valid, reliable, and suitable for HRQL measurement (Ware, 2000; Abbott, Hobby, & Cotter, 2006). The SF-36 has been used in different countries, and similar conclusions about reliability, validity and stability have been reported (Hemingway et al., 1997; Hopman et al., 2006; Thumboo, Cheung, & Machin, 2005). Despite its widespread use among people with chronic and acute health conditions, there has been little documentation regarding the ways in which the SF-36 performs among healthy populations assessed prospectively (Hopman et al., 2004; Perneger, Etter, & Rougemont, 1997; Ware, Kosinski, & Gandek, 2005). As a consequence, understanding of the natural history of HRQL, as measured by the SF-36 (Hopman et al., 2004), has been limited. One result has been difficulty in estimating within-person changes that may be the consequence of natural aging or customary life events (Abbott et al., 2006).
Transcript of How Does the SF‐36 Perform in Healthy Populations? A Structured Review of Longitudinal Studies
Journal of Social, Behavioral, and Health Sciences 2010, Volume 4, Issue 1, Pages 30–48 ©Walden University, Minneapolis, MN DOI: 10.5590/JSBHS.2010.04.1.02
Please address queries to: Martin Cherniack, Division of Occupational and Environmental Medicine, University of Connecticut Health Center, Farmington, CT 06030-‐6210. Email: [email protected]
How Does the SF-‐36 Perform in Healthy Populations? A Structured Review of Longitudinal Studies
Chinekwu A. Obidoa University of Connecticut
Susan L. Reisine University of Connecticut
Martin Cherniack University of Connecticut
This study examined the stability of the Medical Outcomes Study-Short Form (SF-36) in healthy populations. The researchers conducted a structured review of longitudinal studies that reported the use of SF-36 among people in their active working years ages 18 to 65. The cumulative sample size across selected studies comprised 29,868 participants. SF-36 mean scores were similar to published U.S. aggregate norms. Gender-specific changes in SF-36 scores also followed a normative trend, with women having greater declines in scores (poorer health) than men. The SF-36 was stable among healthy populations; however, its use among healthy people requires caution, particularly when considering the longitudinal effects of age.
Keywords: SF-36, healthy populations, stability, aging
Background
The Medical Outcomes Study-Short Form (SF-36) questionnaire is widely used for measuring health-related quality of life (HRQL) in various settings. Applications of the SF-36 include health policy evaluations, clinical practice and research, health intervention evaluations, and a general population surveying (Hemingway, Stafford, Stansfeld, Shipley, & Marmot, 1997; Ware & Sherbourne, 1992). Studies have implied that the SF-36 is valid, reliable, and suitable for HRQL measurement (Ware, 2000; Abbott, Hobby, & Cotter, 2006). The SF-36 has been used in different countries, and similar conclusions about reliability, validity and stability have been reported (Hemingway et al., 1997; Hopman et al., 2006; Thumboo, Cheung, & Machin, 2005).
Despite its widespread use among people with chronic and acute health conditions, there has been little documentation regarding the ways in which the SF-36 performs among healthy populations assessed prospectively (Hopman et al., 2004; Perneger, Etter, & Rougemont, 1997; Ware, Kosinski, & Gandek, 2005). As a consequence, understanding of the natural history of HRQL, as measured by the SF-36 (Hopman et al., 2004), has been limited. One result has been difficulty in estimating within-person changes that may be the consequence of natural aging or customary life events (Abbott et al., 2006).
Obidoa, Reisine, & Cherniack, 2010
Journal of Social, Behavioral, and Health Sciences 31
This study sought to provide some insight into the stability of the SF-36 when used as a repeated measure in healthy populations. In this study, stability of the SF-36 is considered the consistent and continuous proportionality of all the components of the SF-36 in different subgroups over time. Simply stated, the researchers wanted to know whether this metric would record similar scores for all of its components when used over different periods. Using a structured literature review approach, the researchers examined the characteristics of change in SF-36 scores in studies where there has been retesting of a healthy cohort of adults. The researchers also examined changes in regard to gender and age.
The SF-‐36 Health Survey
The SF-36 questionnaire measures HRQL with eight subscales: Physical Functioning (PF), Physical Role (RP), Bodily Pain (BP), General Health (GH), Vitality (VT), Social Functioning (SF), Emotional Role (ER), and Mental Health (MH; Ware et al., 2005). Scores for each variable are summed and transformed into a Likert scale ranging from 0 (worst) to 100 (best; Jenkinson, Coulter, & Wright, 1993). The SF-36 was first developed and tested for the Medical Outcomes Study (MOS), a 2-year study of chronic medical conditions (Ware & Sherbourne, 1992). Its validity and reliability have been tested in various studies (McHorney, Ware, Lu, & Sherbourne, 1994; McHorney, Ware, Rogers, Raczek, & Lu, 1992; Ware & Sherbourne, 1992). It was developed for people above the age of 14 and can be administered by telephone, by self, or by a trained interviewer.
Methods
Strategy for Study Selection
The process of identifying articles was completed in five steps:
Step 1: Bibliographic databases were searched for studies using SF-36 as a measurement tool in longitudinal studies. Databases that were searched included Web of Science, Scopus, Pub Med, Scirus, Cochrane, Health and Wellness Resource Center, Sociological Abstracts, PsycInfo, Psychology and Behavioral Sciences Collection, ABI/INFORM Global, Academic Search Premier, PsycArticles, Psychology: A Sage Full-Text Collection, EBSCOhost, ECON LIT, POPLINE, ProQuest Dissertations & Theses, and the SF-36 database. Search key words were SF-36 AND longitudinal, SF-36 and prospective, SF-36 AND longitudinal AND prospective.
Step 2: A total of 35 potentially relevant abstracts were selected for further review based on the initial search.
Step 3: Identified abstracts were reviewed by all three researchers to determine articles to be included in a structured review based on the following inclusion criteria: (a) use of the SF-36 as a repeated measures instrument in a longitudinal or prospective study; (b)) studies carried out in healthy populations, not populations of patients or those with chronic or acute health conditions; and (c) studies carried out among people in their active working years of 18 to 65. Based on these criteria, 18 potentially suitable articles were identified.
Step 4: The 18 studies that met the inclusion criteria were retrieved and reviewed. Four studies were excluded because of failure to meet one or more inclusion criteria that were not appreciable from the abstract.
Step 5: Eight studies were removed for other reasons, such as the use of a form of treatment, an intervention, or other features resulting in noncomparability. The six remaining
Obidoa, Reisine, & Cherniack, 2010
Journal of Social, Behavioral, and Health Sciences 32
papers included two papers from one study that were reported at different follow-up points. The selected studies were entered into a data rubric.
Data Preparation and Analysis
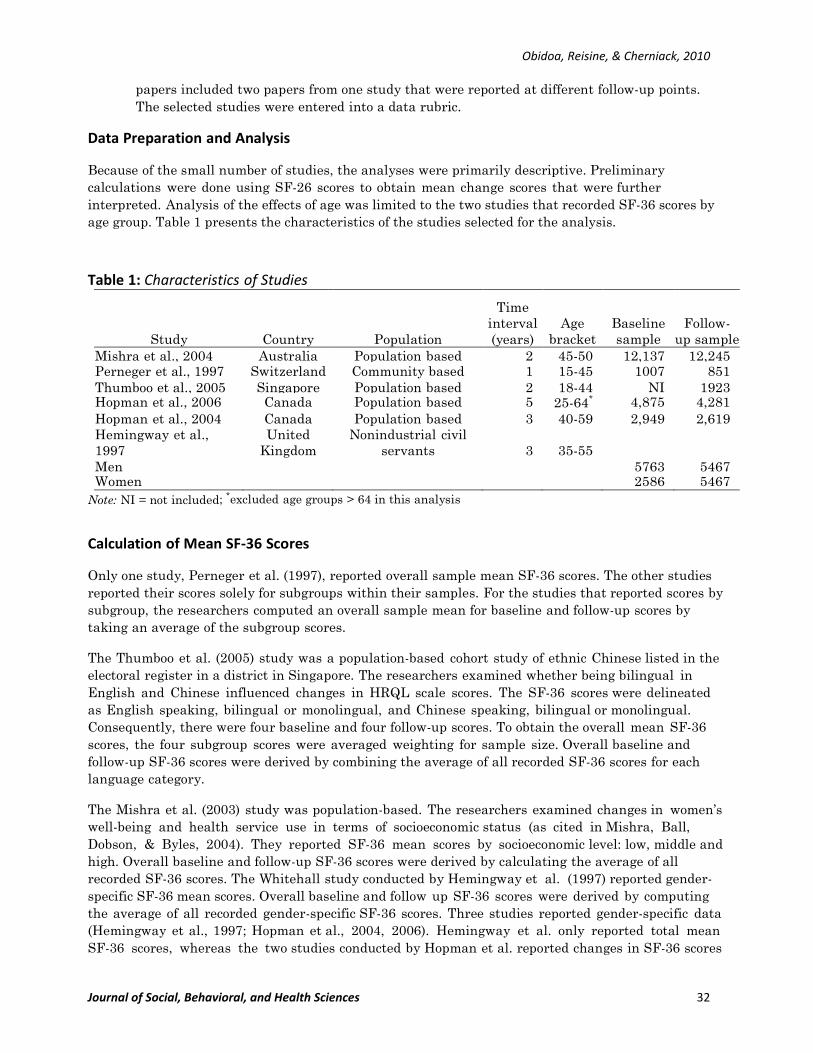
Because of the small number of studies, the analyses were primarily descriptive. Preliminary calculations were done using SF-26 scores to obtain mean change scores that were further interpreted. Analysis of the effects of age was limited to the two studies that recorded SF-36 scores by age group. Table 1 presents the characteristics of the studies selected for the analysis.
Table 1: Characteristics of Studies
Study Country Population
Time interval (years)
Age bracket
Baseline sample
Follow- up sample
Mishra et al., 2004 Australia Population based 2 45-50 12,137 12,245 Perneger et al., 1997 Switzerland Community based 1 15-45 1007 851 Thumboo et al., 2005 Singapore Population based 2 18-44 NI 1923 Hopman et al., 2006 Canada Population based 5 25-64* 4,875 4,281 Hopman et al., 2004 Canada Population based 3 40-59 2,949 2,619 Hemingway et al., 1997
United Kingdom
Nonindustrial civil servants 3 35-55
Men 5763 5467 Women 2586 5467
Note: NI = not included; *excluded age groups > 64 in this analysis
Calculation of Mean SF-‐36 Scores
Only one study, Perneger et al. (1997), reported overall sample mean SF-36 scores. The other studies reported their scores solely for subgroups within their samples. For the studies that reported scores by subgroup, the researchers computed an overall sample mean for baseline and follow-up scores by taking an average of the subgroup scores.
The Thumboo et al. (2005) study was a population-based cohort study of ethnic Chinese listed in the electoral register in a district in Singapore. The researchers examined whether being bilingual in English and Chinese influenced changes in HRQL scale scores. The SF-36 scores were delineated as English speaking, bilingual or monolingual, and Chinese speaking, bilingual or monolingual. Consequently, there were four baseline and four follow-up scores. To obtain the overall mean SF-36 scores, the four subgroup scores were averaged weighting for sample size. Overall baseline and follow-up SF-36 scores were derived by combining the average of all recorded SF-36 scores for each language category.
The Mishra et al. (2003) study was population-based. The researchers examined changes in women’s well-being and health service use in terms of socioeconomic status (as cited in Mishra, Ball, Dobson, & Byles, 2004). They reported SF-36 mean scores by socioeconomic level: low, middle and high. Overall baseline and follow-up SF-36 scores were derived by calculating the average of all recorded SF-36 scores. The Whitehall study conducted by Hemingway et al. (1997) reported gender-specific SF-36 mean scores. Overall baseline and follow up SF-36 scores were derived by computing the average of all recorded gender-specific SF-36 scores. Three studies reported gender-specific data (Hemingway et al., 1997; Hopman et al., 2004, 2006). Hemingway et al. only reported total mean SF-36 scores, whereas the two studies conducted by Hopman et al. reported changes in SF-36 scores
Obidoa, Reisine, & Cherniack, 2010
Journal of Social, Behavioral, and Health Sciences 33
only by subscale. For this manuscript, the researchers calculated average change in SF-36 scores for each subscale and by gender.
To examine how the SF-36 performed across age groups, average change in SF-36 was obtained by computing the mean of the change scores for each age group. Only two studies reported scores by age group. Scores were reported by major subscale. For comparison purposes, SF-36 scores were delineated by the following age brackets: < 44, 45 to 54, and 55 to 64. Data from the Whitehall Study (Hemingway et al., 1997) were presented as two separate studies because they had already been stratified by gender.
Results
Description of Quality of Life
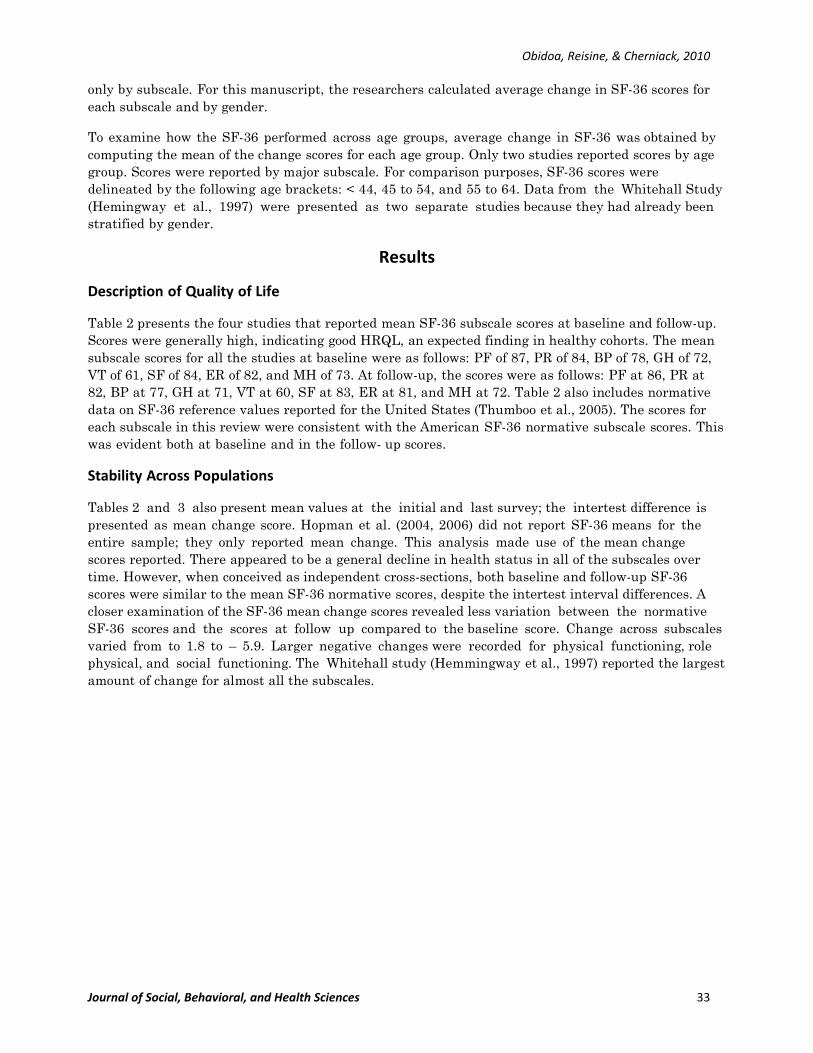
Table 2 presents the four studies that reported mean SF-36 subscale scores at baseline and follow-up. Scores were generally high, indicating good HRQL, an expected finding in healthy cohorts. The mean subscale scores for all the studies at baseline were as follows: PF of 87, PR of 84, BP of 78, GH of 72, VT of 61, SF of 84, ER of 82, and MH of 73. At follow-up, the scores were as follows: PF at 86, PR at 82, BP at 77, GH at 71, VT at 60, SF at 83, ER at 81, and MH at 72. Table 2 also includes normative data on SF-36 reference values reported for the United States (Thumboo et al., 2005). The scores for each subscale in this review were consistent with the American SF-36 normative subscale scores. This was evident both at baseline and in the follow- up scores.
Stability Across Populations
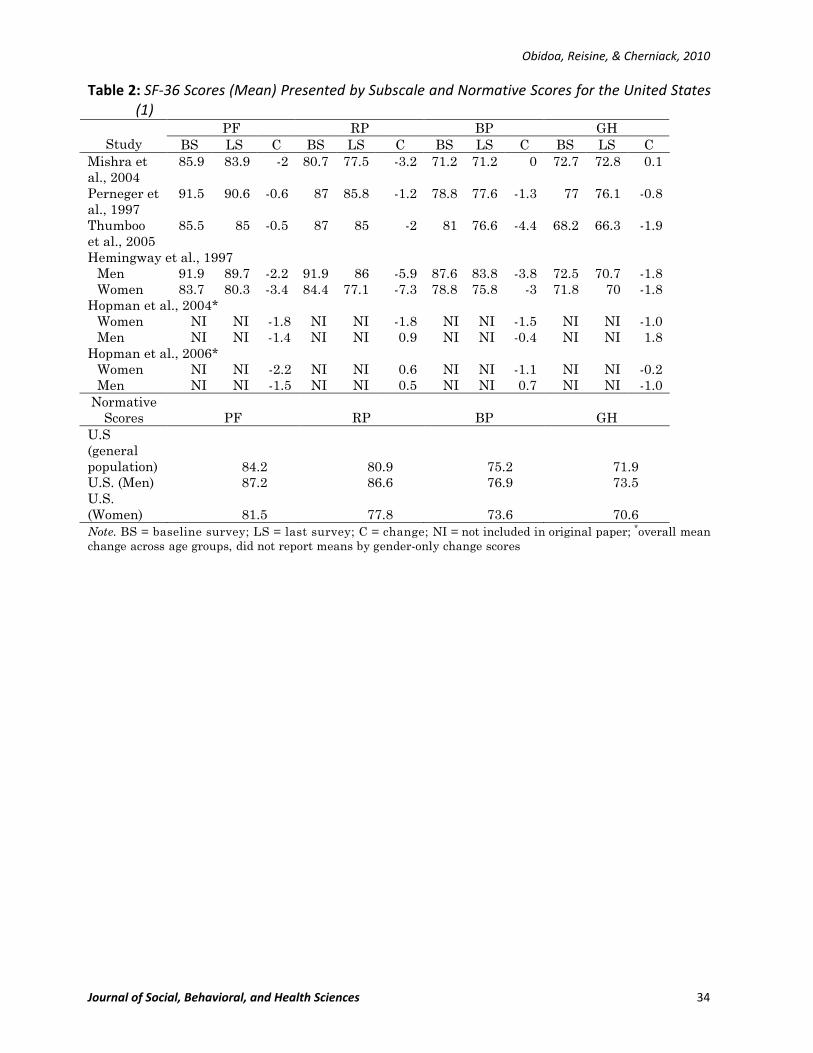
Tables 2 and 3 also present mean values at the initial and last survey; the intertest difference is presented as mean change score. Hopman et al. (2004, 2006) did not report SF-36 means for the entire sample; they only reported mean change. This analysis made use of the mean change scores reported. There appeared to be a general decline in health status in all of the subscales over time. However, when conceived as independent cross-sections, both baseline and follow-up SF-36 scores were similar to the mean SF-36 normative scores, despite the intertest interval differences. A closer examination of the SF-36 mean change scores revealed less variation between the normative SF-36 scores and the scores at follow up compared to the baseline score. Change across subscales varied from to 1.8 to – 5.9. Larger negative changes were recorded for physical functioning, role physical, and social functioning. The Whitehall study (Hemmingway et al., 1997) reported the largest amount of change for almost all the subscales.
Obidoa, Reisine, & Cherniack, 2010
Journal of Social, Behavioral, and Health Sciences 34
Table 2: SF-‐36 Scores (Mean) Presented by Subscale and Normative Scores for the United States (1)
PF RP BP GH Study BS LS C BS LS C BS LS C BS LS C
Mishra et al., 2004
85.9 83.9 -2 80.7 77.5 -3.2 71.2 71.2 0 72.7 72.8 0.1
Perneger et al., 1997
91.5 90.6 -0.6 87 85.8 -1.2 78.8 77.6 -1.3 77 76.1 -0.8
Thumboo et al., 2005
85.5 85 -0.5 87 85 -2 81 76.6 -4.4 68.2 66.3 -1.9
Hemingway et al., 1997 Men 91.9 89.7 -2.2 91.9 86 -5.9 87.6 83.8 -3.8 72.5 70.7 -1.8 Women 83.7 80.3 -3.4 84.4 77.1 -7.3 78.8 75.8 -3 71.8 70 -1.8
Hopman et al., 2004* Women NI NI -1.8 NI NI -1.8 NI NI -1.5 NI NI -1.0 Men NI NI -1.4 NI NI 0.9 NI NI -0.4 NI NI 1.8
Hopman et al., 2006* Women NI NI -2.2 NI NI 0.6 NI NI -1.1 NI NI -0.2 Men NI NI -1.5 NI NI 0.5 NI NI 0.7 NI NI -1.0
Normative Scores PF RP BP GH
U.S (general population) 84.2 80.9 75.2 71.9 U.S. (Men) 87.2 86.6 76.9 73.5 U.S. (Women) 81.5 77.8 73.6 70.6 Note. BS = baseline survey; LS = last survey; C = change; NI = not included in original paper; *overall mean change across age groups, did not report means by gender-only change scores
Obidoa, Reisine, & Cherniack, 2010
Journal of Social, Behavioral, and Health Sciences 35
Table 3: SF-‐36 Scores (Mean) Presented by Subscale and Normative Scores for the United States (2)
VT SF ER MH Study BS LS C BS LS C BS LS C BS LS C
Mishra et al., 2004
58.9 57.7 -1.2 82.6 82.1 -0.5 78.4 79.7 1.3 73.4 73.6 0.2
Perneger et al., 1997
65.2 65.1 -0.0 84.1 83.7 -0.5 77 79.2 2.2 69.3 69.2 -0.0
Thumboo et al., 2005
63 61.7 -1.3 84.2 81.4 -2.8 82.4 80.2 -2.2 72.1 70.6 -1.5
Hemingway et al., 1997 Men 63.8 61.5 -2.3 91.3 87.3 -4 89.7 86.1 -3.6 77 75.6 -1.4 Women 57.8 55.9 -1.9 82 81.4 -0.6 86 80.9 -5.1 73.6 72 -1.6
Hopman et al., 2004* Women NI NI -0.3 NI NI -0.1 NI NI -0.4 NI NI -0.1 Men NI NI 0.0 NI NI 1.7 NI NI 2.5 NI NI 0.7
Hopman et al., 2006* Women NI NI 0.5 NI NI 2.0 NI NI 3.0 NI NI 1.7 Men NI NI -1.1 NI NI 2.0 NI NI 3.0 NI NI 1.2 Normative
Scores VT SF ER MH U.S (general population) 60.9 83.3 81.3 74.7 U.S. (Men) 63.6 85.2 83.2 76.6 U.S. (Women) 58.4 81.5 79.5 73.3
Note. BS = baseline survey; LS = last survey; C = change; NI = not included in original paper; *overall mean change across age groups, did not report means by gender only change scores
Obidoa, Reisine, & Cherniack, 2010
Journal of Social, Behavioral, and Health Sciences 36
Is the SF-‐36 Equally Stable for Men and Women?
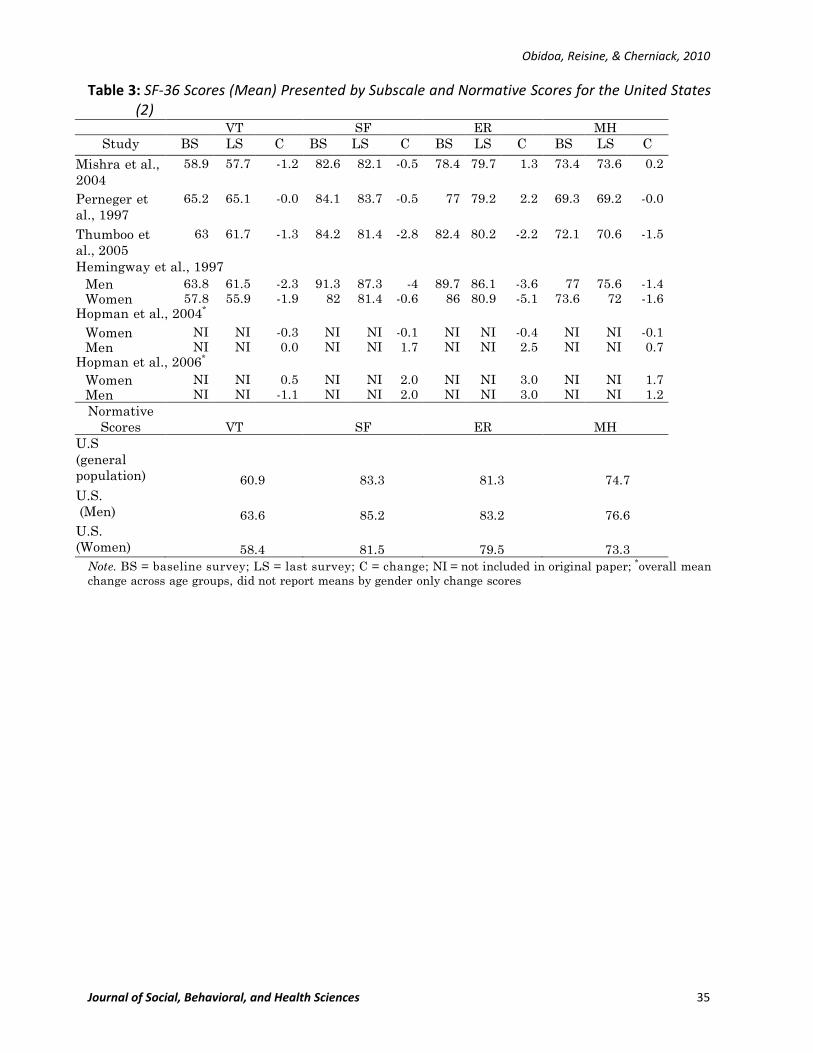
Data from the studies in this review facilitated a limited gender-specific analysis of the performance of the SF-36. As mentioned earlier, only three studies reported gender-specific data (Hemingway et al. 1997; Hopman et al., 2004, 2006). Only change scores were reported, and mean SF-36 scores were not included. Table 4 show mean subscale change scores separated by gender. For both men and women, the largest changes were physical functioning and physical role. Overall, the average change was larger (-1.2) in women than in men (-0.6).
How Does the SF-‐36 Perform in Different Age Groups?
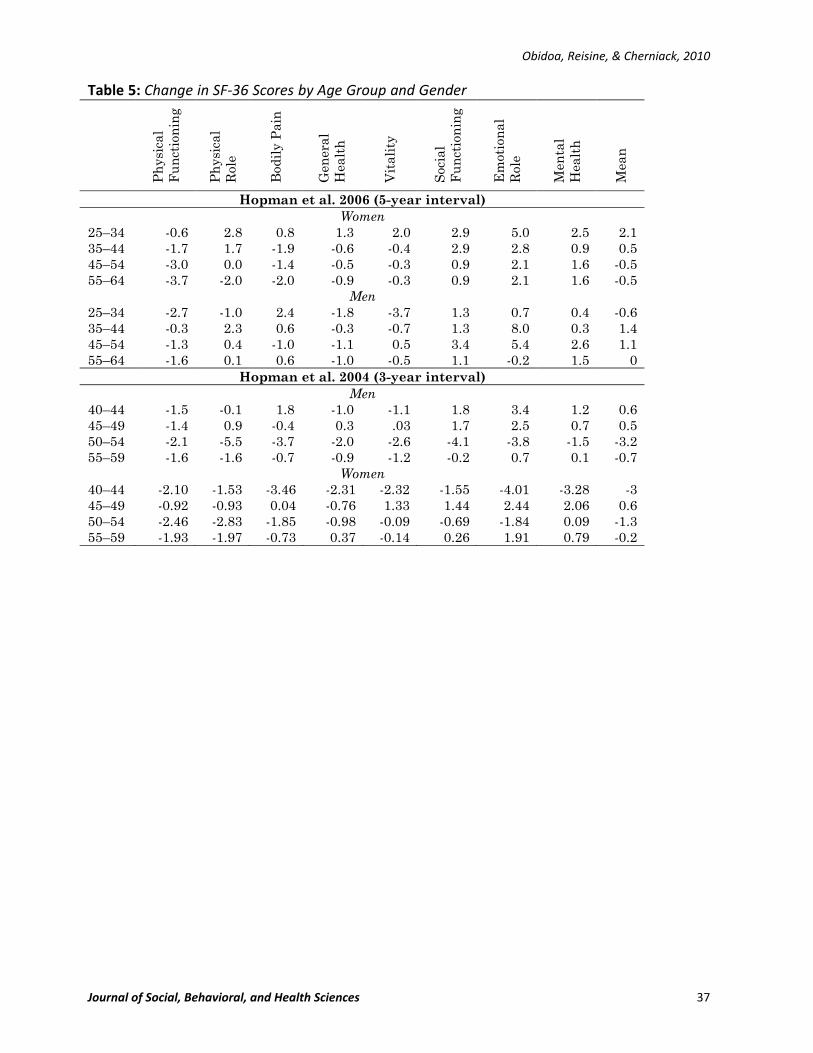
Only two articles recorded data by age (Hopman et al., 2004, 2006). These articles were based on the same study population, namely, middle-aged Canadians. The earlier study published in 2004 reported SF-36 scores for the following 5-year age intervals: 40-44, 45-49, 50-54, and 55-59. The later article published in 2006 reported scores as 10-year intervals: 25-34, 35- 44, 45-54, and 55-64. Subscale changes in the SF-36 were compared for each age group in order to examine whether the SF-36 was reliable and stable in measuring age-specific HRQL. Table 5 shows the average change in SF-36 scores by age group aggregated by gender for each of these studies.
Table 4: Change in SF-‐36 Scores by Gender
Ph
ysic
al
Fu
nct
ion
ing
Ph
ysic
al
Rol
e
Bod
ily
Pai
n
Gen
eral
H
ealt
h
Vit
alit
y
Soc
ial
Fu
nct
ion
ing
Em
otio
nal
R
ole
Men
tal
Hea
lth
Mea
n
Men Hopman et al., 2006
-1.5 -0.1 1.8 -1.0 -1.1 1.8 3.4 1.2 0.6
Hopman et al., 2004
-1.4 0.9 -0.4 0.3 .03 1.7 2.5 0.7 0.6
Hemingway et al., 1997
-2.1 -5.5 -3.7 -2.0 -2.6 -4.1 -3.8 -1.5 -3.1
Mean -1.6 -1.6 -0.7 -0.9 -1.2 -0.2 0.7 0.1 -0.6 Women
Hopman et al., 2006
-2.3 0.6 -1.1 -0.2 0.5 2.0 3.1 1.7 0.6
Hopman et al., 2004
-1.9 -1.8 -1.5 -0.9 -0.3 -0.1 -0.4 -0.1 -0.9
Hemingway et al., 1997
-3.0 -7.3 -2.5 -1.9 -1.7 -4.5 -4.5 -1.5 -3.4
Mean -2.4 -2.8 -1.7 -1.0 -0.5 -0.9 -0.6 .03 -1.2
Obidoa, Reisine, & Cherniack, 2010
Journal of Social, Behavioral, and Health Sciences 37
Table 5: Change in SF-‐36 Scores by Age Group and Gender
Ph
ysic
al
Fu
nct
ion
ing
Ph
ysic
al
Rol
e
Bod
ily
Pai
n
Gen
eral
H
ealt
h
Vit
alit
y
Soc
ial
Fu
nct
ion
ing
Em
otio
nal
R
ole
Men
tal
Hea
lth
Mea
n
Hopman et al. 2006 (5-year interval) Women
25–34 -0.6 2.8 0.8 1.3 2.0 2.9 5.0 2.5 2.1 35–44 -1.7 1.7 -1.9 -0.6 -0.4 2.9 2.8 0.9 0.5 45–54 -3.0 0.0 -1.4 -0.5 -0.3 0.9 2.1 1.6 -0.5 55–64 -3.7 -2.0 -2.0 -0.9 -0.3 0.9 2.1 1.6 -0.5
Men 25–34 -2.7 -1.0 2.4 -1.8 -3.7 1.3 0.7 0.4 -0.6 35–44 -0.3 2.3 0.6 -0.3 -0.7 1.3 8.0 0.3 1.4 45–54 -1.3 0.4 -1.0 -1.1 0.5 3.4 5.4 2.6 1.1 55–64 -1.6 0.1 0.6 -1.0 -0.5 1.1 -0.2 1.5 0
Hopman et al. 2004 (3-year interval) Men
40–44 -1.5 -0.1 1.8 -1.0 -1.1 1.8 3.4 1.2 0.6 45–49 -1.4 0.9 -0.4 0.3 .03 1.7 2.5 0.7 0.5 50–54 -2.1 -5.5 -3.7 -2.0 -2.6 -4.1 -3.8 -1.5 -3.2 55–59 -1.6 -1.6 -0.7 -0.9 -1.2 -0.2 0.7 0.1 -0.7
Women 40–44 -2.10 -1.53 -3.46 -2.31 -2.32 -1.55 -4.01 -3.28 -3 45–49 -0.92 -0.93 0.04 -0.76 1.33 1.44 2.44 2.06 0.6 50–54 -2.46 -2.83 -1.85 -0.98 -0.09 -0.69 -1.84 0.09 -1.3 55–59 -1.93 -1.97 -0.73 0.37 -0.14 0.26 1.91 0.79 -0.2
Obidoa, Reisine, & Cherniack, 2010
Journal of Social, Behavioral, and Health Sciences 38
A large change in midlife years (35-54 years) was recorded for mental health. The largest change in physical health also was recorded in the midlife years (35-54 age group), but this change was minimal. Change in HRQL for both mental health and physical health was the largest in midlife, although in opposite directions as defined by these studies.
Discussion and Implications of Findings
This systematic review was aimed at examining the stability and reliability of the SF-36 based on data from longitudinal studies in healthy populations. This review examined the performance of the SF-36 for different study populations and age groups, as well as for gender. The review provided some evidence that the SF-36 is a relatively stable metric when used as a repeated measure in the same healthy population over moderate time periods. However, it did not establish whether the secular decline in SF-36 scores represented significant change. There has been debate about the amount of change that is considered socially and clinically relevant (Abbott et al., 2006). Some researchers have argued for a minimum of 5 points (Ware, Snow, Kosinski, & Gandek, 1993), and some 10 points (Walters & Brazier, 2003; Panopalis et al., 2005).
Results from this study’s analyses of the selected studies show that based on these criteria, change recorded by the selected studies was not socially or clinically significant. More important, perhaps, was the disproportionate between-test changes for each age group. It suggested that apparent stability is chimerical. If the degree of change between tests varies so largely by broad age group, it is at least plausible that the between-test interval, if sufficiently long, may include two or more age groups that are noncongruent in their variability. There also are questions about the factors that influence observed changes between tests, however modest. Factors such as study population, time interval between surveys, and sample size may influence change scores.
Unfortunately, the published literature has not been sufficiently detailed to explore these issues. The individual SF-36 scores in each of the studies included in this review were not presented in the published manuscripts. Therefore, it is practically impossible to measure within- person differences over time. These potential changes are masked when the SF-36 is examined cross sectionally and at the group or population level. In an attempt to provide a better understanding of the reliability of the SF-36, within-person differences need to be further studied. Studying within-person differences in SF-36 scores also will provide better knowledge on how the SF-36 performs in different populations and age groups.
This study also examined the gender-specific performance of the SF-36. The SF-36 appears to be gender sensitive. Results from analyses showed that the women reported more negative change than the men did. This gender-specific difference in self-rated health has been identified by other researchers (Li, Lam, & Ho, 2006). Some of the results from the current study also corresponded to trends for working age adults in Britain (Jenkinson et al., 1993). These researchers found that except for general health perceptions, women reported poorer health than men. The normative scores from the United States for each gender also showed lower scores for women than men. Although this analysis was relatively simple, it provided information about the performance of the SF-36 in men and women, and suggested the consistency and stability of the SF-36 in measuring health status for both genders.
This review was limited by several shortcomings, such as the number of studies and the fact that data at the individual level were not available. The paucity of the data made an in-depth comparison of the studies difficult. These limitations affected the methods used for analysis and the ability to explore the research question in depth. Although the normative scores referenced in this study were population-based scores from the United States, none of the studies included in this analysis was
Obidoa, Reisine, & Cherniack, 2010
Journal of Social, Behavioral, and Health Sciences 39
conducted in the United States. Hence, research on the performance of the SF- 36 in healthy populations in the United States seems desirable.
The SF-36 is widely relied upon to capture important health-related outcomes in populations. Without an in-depth understanding of the performance of this measurement instrument in healthy populations, policy and intervention decisions based on SF-36 studies may not be properly informed. The findings and issues raised in this study may provide a better understanding of the use of the SF-36 in healthy populations. The findings, albeit simplistic, will add to the literature and the knowledge base regarding the stability of the SF-36 in general. Specifically, the major claim made in the findings is that the SF-36 is a relatively stable metric when used as a repeated measure in the same healthy population over moderate periods. It is hoped that this study will serve as a good starting point and a springboard for further research on the stability and reliability of the SF-36 measure.
References
Abbott, S., Hobby, L., & Cotter, S. (2006). What is the impact on individual health of services in general practice settings which offer welfare benefits advice? Health & Social Care in the Community, 14, 1–8. doi:10.1111/j.1365-2524.2005.00582
Hemingway, H., Stafford, M., Stansfeld, S., Shipley, M., & Marmot, M. (1997). Is the SF-36 a valid measure of change in population health? Results from the Whitehall II Study. British Medical Journal, 315, 1273–1279.
Hopman, W. M., Berger, C., Joseph, L., Towheed, T., VandenKerkhof, E., Anastassiades, T., & Papadimitropoulos, E. A. (2006). The natural progression of health-related quality of life: results of a five-year prospective study of SF-36 scores in a normative population. Quality of Life Research, 15, 527–536.
Hopman, W. M., Berger, C., Joseph, L., Towheed, T., Kerkhof, E., & Anastassiades, T. (2004). Stability of normative data for the SF-36: Results of a three-year prospective study in middle-aged Canadians. Canadian Journal of Public Health, 95, 387–391.
Jenkinson, C., Coulter, A., & Wright, L. (1993). Short-Form 36 (SF36) Health Survey questionnaire: Normative data for adults of working age. British Medical Journal, 306, 1437–1440. doi:10.1136/bmj.306.6890.1437
Li, Z. B., Lam, T. H., & Ho, S. Y. (2006). Age- versus time-comparative self-rated health in Hong Kong Chinese older adults. International Journal of Geriatric Psychiatry, 21, 729–739. doi:10.1002/gps.1553
McHorney, C. A., Ware, J. E., Lu, J. F. R., & Sherbourne, C. D. (1994). The MOS 36-item Short-Form Health Status Survey (SF-36): Tests of data quality, scaling assumptions, anti reliability across diverse patient groups. Medical Care, 32, 40–66. doi:10.1136/heart. 84.5.535
McHorney, C. A., Ware, J. E., Rogers, W., Raczek, A. B., & Lu, J. F. R. (1992). The validity and relative precision of MOS short-and long-form health status scales and Dartmouth COOP charts: Results from the medical outcomes study. Medical Care, 30, 253–265.
Mishra, G. D., Ball, K., Dobson, A. J., & Byles, J. E. (2004). Do socioeconomic gradients in women’s health widen over time and with age? Social Science & Medicine, 58, 1585–1595. doi:10.1016/S0277-9536(03)00368-X
Panopalis, P., Petri, M., Manzi, S., Isenberg, D. A., Gordon, C., Senecal, J. L., & Clarke, A. E. (2005). The Systemic Lupus Erythematosus Tri-Nation Study: Longitudinal changes in physical and mental well-being. Rheumatology, 44, 751–755. doi:10.1093/rheumatology/ keh580
Obidoa, Reisine, & Cherniack, 2010
Journal of Social, Behavioral, and Health Sciences 40
Perneger, T. V., Etter, J. F., & Rougemont, A. (1997). Prospective versus retrospective measurement of change in health status: A community-based study in Geneva, Switzerland. Journal of Epidemiology and Community Health, 51, 320–325. doi:10.1136/ jech.51.3.320
Thumboo, J., Cheung, Y., & Machin, D. (2005). Does being bilingual in English and Chinese influence changes in quality of life scale scores? Evidence from a prospective, population-based study. Quality of Life Research, 14, 529-538. doi:10.1007/s11136-004-4848-y
Walters, S. J., & Brazier, J. E. (2003). What is the relationship between the minimally important difference and health state utility values? The case of the SF-6D. Health and Quality of Life Outcomes, 1, 1-8. doi:10.1186/1477-7525-1–4
Ware, J. E. (2000). SF-36 health survey update. SPINE, 25, 3130–3139. doi:10.1177/1049731 507300152
Ware, J. E., & Sherbourne, C. D. (1992). The MOS 36-item Short-Form Health Survey (SF-36): Conceptual framework and item selection. Medical Care, 30, 473–83. doi:10.1177/14034948980260040401
Ware, J. E., Kosinski, M., & Gandek, B. (2005). SF-36 Health Survey: Manual and interpretation guide. Lincoln, RI: Quality Metric.
Ware, J. E., Snow, K. K., Kosinski, M., & Gandek, B. (1993). SF-36 Health Survey manual and interpretation guide. Boston, MA: Health Institute, New England Medical Center.
The Journal of Social, Behavioral, and Health Sciences is an open-‐access, peer-‐reviewed, online interdisciplinary journal focusing on research findings that address contemporary national and international issues. Its objectives are to (a) encourage dialogue between scholars and practitioners in the social, behavioral, and health sciences that fosters the integration of research with practice; (b) promote innovative models of interdisciplinary collaboration among the social, behavioral, and health sciences that address complex social problems; and (c) inform the relationship between practice and research in the social, behavioral, and health sciences. Walden University Publishing: http://www.publishing.waldenu.edu

Obidoa, Reisine, & Cherniack, 2010
Journal of Social, Behavioral, and Health Sciences 41
This page intentionally left blank
Obidoa, Reisine, & Cherniack, 2010
Journal of Social, Behavioral, and Health Sciences 42
This page intentionally left blank

Obidoa, Reisine, & Cherniack, 2010
Journal of Social, Behavioral, and Health Sciences 43
This page intentionally left blank
Obidoa, Reisine, & Cherniack, 2010
Journal of Social, Behavioral, and Health Sciences 44
This page intentionally left blank

Obidoa, Reisine, & Cherniack, 2010
Journal of Social, Behavioral, and Health Sciences 45
This page intentionally left blank
Obidoa, Reisine, & Cherniack, 2010
Journal of Social, Behavioral, and Health Sciences 46
This page intentionally left blank

Obidoa, Reisine, & Cherniack, 2010
Journal of Social, Behavioral, and Health Sciences 47
This page intentionally left blank

Obidoa, Reisine, & Cherniack, 2010
Journal of Social, Behavioral, and Health Sciences 48
This page intentionally left blank