
Mobilising pension assets for housing finance needs in Africa
Upload
khangminh22Category
view
2download
0
Town Planning Submitted to Knowle, Dorridge and Bentley Heath Neighbourhood Forum
Submitted by AECOM Aldgate Tower, 2 Leman Street, London E1 8FA
Housing Needs Assessment
Knowle Dorridge & Bentley Heath Neighbourhood Forum
February 2017 Final Report

AECOM 2
February 2017
Glossary of terms used in text ................................................................................................................................................... 5 Executive Summary .................................................................................................................................................................... 6 Introduction .................................................................................................................................................................................. 6 PPG-Based Assessment ............................................................................................................. Error! Bookmark not defined. Summary of Methodology .......................................................................................................................................................... 6 Gathering and Using a Range of Data ....................................................................................................................................... 7 Focus On Demand Rather Than Supply .................................................................................................................................... 7 Quantity and Characteristics of housing needed ..................................................................................................................... 7 Recommendations for next steps ............................................................................................................................................ 14 1 Context ................................................................................................................................................................................... 15
Local Area .................................................................................................................................................................................. 15 Local Planning Context ............................................................................................................................................................. 16 2 Approach ............................................................................................................................................................................... 18
Research Questions .................................................................................................................................................................. 18 Quantity ...................................................................................................................................................................................... 18 Size and Tenure ......................................................................................................................................................................... 18 Study Objectives ....................................................................................................................................................................... 19 3 Relevant Data ........................................................................................................................................................................ 20
Quantity ...................................................................................................................................................................................... 20 Tenure ......................................................................................................................................................................................... 23 Type and size ............................................................................................................................................................................. 32 Housing for older people .......................................................................................................................................................... 32 Market signals ............................................................................................................................................................................ 34 Employment trends ................................................................................................................................................................... 40
4 Conclusions ........................................................................................................................................................................... 43
Quantity of Housing Needed .................................................................................................................................................... 43 Characteristics of housing needed .......................................................................................................................................... 47 Recommendations for next steps ............................................................................................................................................ 50
Contents

AECOM 3
February 2017
Limitations
AECOM Infrastructure & Environment UK Limited (“AECOM”) has prepared this Report for the sole use of Knowle, Dorridge and Bentley Heath Neighbourhood Forum (“KDBHNF”) in accordance with the Agreement under which our services were performed. No other warranty, expressed or implied, is made as to the professional advice included in this Report or any other services provided by AECOM.
Where the conclusions and recommendations contained in this Report are based upon information provided by others it is upon the assumption that all relevant information has been provided by those parties from whom it has been requested and that such information is accurate. Information obtained by AECOM has not been independently verified by AECOM, unless otherwise stated in the Report.
The methodology adopted and the sources of information used by AECOM in providing its services are outlined in this Report. The work described in this Report was undertaken in the period November 2016 to February 2017 and is based on the conditions encountered and the information available during the said period of time. The scope of this Report and the services are accordingly factually limited by these circumstances.
Where assessments of works or costs identified in this Report are made, such assessments are based upon the information available at the time and where appropriate are subject to further investigations or information which may become available.
AECOM disclaim any undertaking or obligation to advise any person of any change in any matter affecting the Report, which may come or be brought to AECOM’s attention after the date of the Report.
Certain statements made in the Report that are not historical facts may constitute estimates, projections or other forward-looking statements and even though they are based on reasonable assumptions as of the date of the Report, such forward-looking statements by their nature involve risks and uncertainties that could cause actual results to differ materially from the results predicted. AECOM specifically does not guarantee or warrant any estimate or projections contained in this Report.
Where field investigations are carried out, these have been restricted to a level of detail required to meet the stated objectives of the services. The results of any measurements taken may vary spatially or with time and further confirmatory measurements should be made after any significant delay in issuing this Report.
Copyright
© This Report is the copyright of AECOM Infrastructure & Environment UK Limited. Any unauthorised reproduction or usage by any person other than the addressee is strictly prohibited.
AECOM 4
February 2017
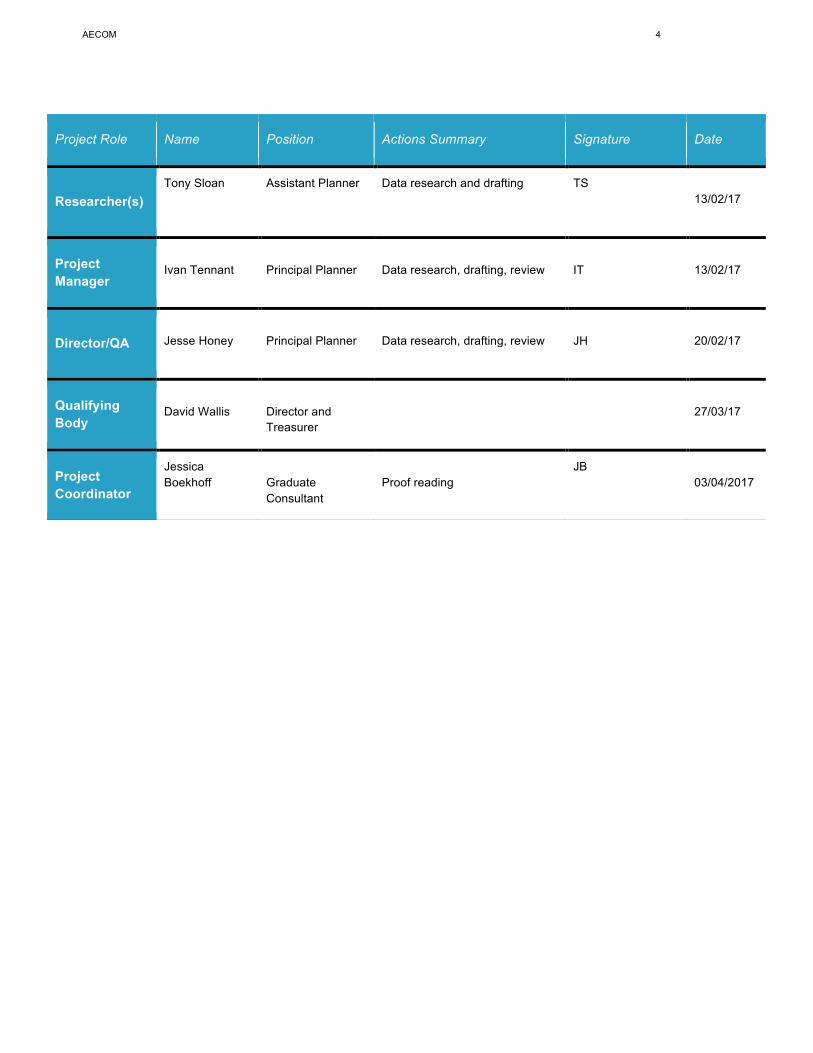
Project Role Name Position Actions Summary Signature Date
Researcher(s) Tony Sloan Assistant Planner Data research and drafting TS
13/02/17
Project Manager
Ivan Tennant
Principal Planner
Data research, drafting, review
IT
13/02/17
Director/QA Jesse Honey
Principal Planner
Data research, drafting, review
JH
20/02/17
Qualifying Body
David Wallis
Director and Treasurer
27/03/17
Project Coordinator
Jessica Boekhoff
Graduate Consultant
Proof reading
JB 03/04/2017
AECOM 5
February 2017
AH Affordable Housing (NPPF definition)
AMH Affordable Market Housing
AR Affordability Ratio
DCLG Department for Communities and Local Government
ESLP Emerging Solihull Local Plan
GBSLEP Greater Birmingham & Solihull Local Enterprise Partnership
GT Gypsy & Traveller
HMA Housing Market Area
HNA Housing Needs Assessment
KDBHNF Knowle, Dorridge and Bentley Heath Neighbourhood Forum
LPA Local Planning Authority
NDP Neighbourhood Development Plan
NP Neighbourhood Plan
NPPF National Planning Policy Framework
ONS Office for National Statistics
PPG Planning Practice Guidance
PRS Private Rented Sector
RTF Rural Town and Fringe
SHLAA Strategic Housing Land Availability Assessment
SHMA Strategic Housing Market Assessment
SMBC Solihull Metropolitan Borough Council
SLP Solihull Local Plan (adopted 2013)
SPD Supplementary Planning Document
Glossary of terms used in text
AECOM 6
February 2017
Executive Summary
Introduction
1. The 2011 Localism Act introduced neighbourhood planning, allowing parishes, town councils or neighbourhood forums across England to develop and adopt legally binding development plans for their neighbourhood area.
2. As more and more parishes, towns and forums seek to address housing growth, including tenure and type of new housing, it has become evident that developing policies need to be underpinned by robust, objectively assessed housing data.
3. In the words of the national Planning Practice Guidance (PPG), establishing future need for housing is not an exact science, and no single approach will provide a definitive answer. The process involves making balanced judgements, as well as drawing together evidence that is in proportion with its intended purpose. At a neighbourhood planning level, one important consideration is determining the extent to which the characteristics of the neighbourhood plan area (NPA), for example those provided by Census data, diverge from those of the local authority. These comparators are helpful to an HNA given that a single town or neighbourhood almost never constitutes a housing market on its own and must therefore be assessed in its wider context.
4. The guidance quoted above on housing needs assessment (HNA) is primarily aimed at local planning authorities preparing Strategic Housing Market Assessments (SHMAs), which are used to determine housing need at a local authority level. However, it helpfully states that those preparing neighbourhood plans can use the guidance to identify specific local needs that may be relevant to a neighbourhood, but that any assessment at such a local level should be proportionate.
5. Our brief was to advise on data at this more local level to help KDBHNF understand, among other matters, the type, tenure and ‘fair share’ of housing quantity needed to inform neighbourhood plan policies and supply considerations
Summary of Methodology
6. Housing Needs Assessment at neighbourhood plan level can be focused either on quantity of housing needed, type of housing need, or both. In most cases, there is a need to focus on quantity where the housing target for the settlement being assessed is unclear, for example where the local authority has not set a specific target for the settlement, or where there is no local plan in place.
7. In the case of KDBHNF, the current adopted Development Plan, the Solihull Local Plan (SLP), allocates 365 homes for the period unto 2028 whilst the new Draft SLP allocates a further 1050 homes to the plan area by way of two identified sites. The SLP is however under review, partly as a result of court proceedings challenging the evidence supporting its housing policies.

AECOM 7
February 2017
8. The SHMA, published in October 2016, provides part of the evidence base for the current review. This document does not however provide a clear recommended housing target for the neighbourhood plan area. The core purpose of this study is therefore to consider both quantity of housing needed, in light of the recently commissioned SHMA, as well as type, in accordance with the wishes of the Neighbourhood Forum.
9. The rationale for this recommended approach is that neighbourhood plans need to pass a number of Basic Conditions to be ‘made’ by the LPA. One of these, Basic Condition E, requires the Neighbourhood Plan to be in ‘general conformity with the strategic policies’ of the Local Plan, in this case the SLP. The Government’s Planning Practice Guidance indicates that the level of housing development is likely to count as a strategic policy.1
10. In terms of the types of housing needed, there is generally more flexibility on what neighbourhood plans can cover. In order to understand the types of housing needed in KDBH, we have gathered a wide range of local evidence and summarised it into policy recommendations designed to inform decisions on housing characteristics.
11. Data and materials gathered relevant to this HNA have been sourced and analysed in line with PPG2; besides statistical data, it includes a community survey provided by KDBHNF3 and interviews with local estate agents4. Together, they provide a balance of sources that capture a local perspective.
12. The housing projections set out in this HNA correspond with the Neighbourhood Plan period of 2017-2033; this in turn corresponds with the plan period for the Solihull’s draft Local Plan.
Focus On Demand Rather Than Supply
13. Our approach is to provide advice on the NPA’s fair share of housing required based on need and/or demand rather than supply. This is in line with the PPG, which states that ‘the assessment of development needs should be an objective assessment of need based on facts and unbiased evidence. Plan makers should not apply constraints to the overall assessment of need, such as limitations imposed by the supply of land for new development, historic under performance, viability, infrastructure or environmental constraints.’
14. For this reason, we advise that the conclusions of this report should be then be assessed against supply-side considerations (including, for example, factors such as transport infrastructure, landscape constraints, flood risk and so on) as a separate and follow-on study5.
Quantity and Characteristics of Housing Needed
15. Our assessment of a wide range of data sources identified five separate projections of dwelling numbers for KDBHNF between 2014 and 2033 based on:
1 See Planning Practice Guidance Paragraph: 006 Reference ID: 2a-006-20140306 2 See Planning Practice Guidance Paragraphs: 014 Reference ID: 2a-014-20140306 and 009 Reference ID: 2a-009-20140306 3 Knowle, Dorridge and Bentley Heath Neighbourhood Plan Residents’ Survey Results 2016 FINAL REPORT 4 David Hofton of Hunters, Kayleigh Montgomery of John Shepherd and Kate Ridley of Primus tookm part in the survey 5 Such an approach, clearly separating housing need assessment from home capacity assessment, was endorsed by the Government for calculating housing need at local authority level in the ministerial statement and press release ‘Councils must protect our precious green belt land’ (DCLG, 4 October 2014, available at https://www.gov.uk/government/news/councils-must-protect-our-precious-green-belt-land)
AECOM 8
February 2017
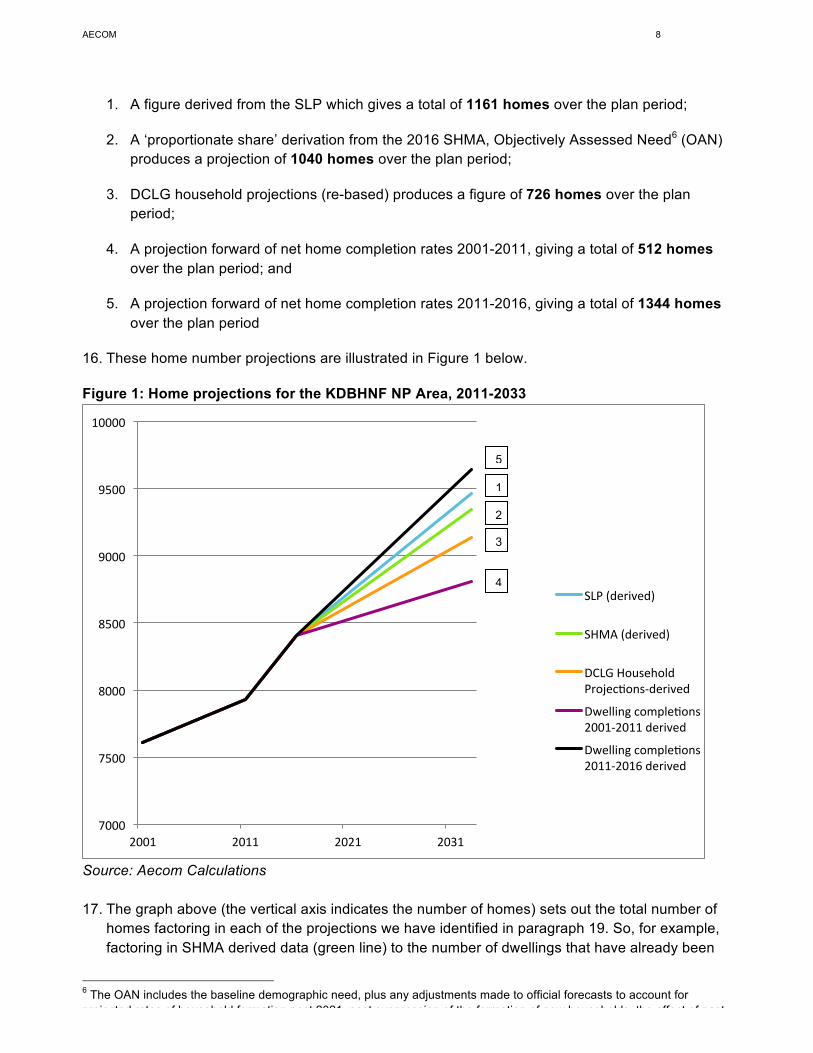
1. A figure derived from the SLP which gives a total of 1161 homes over the plan period;
2. A ‘proportionate share’ derivation from the 2016 SHMA, Objectively Assessed Need6 (OAN) produces a projection of 1040 homes over the plan period;
3. DCLG household projections (re-based) produces a figure of 726 homes over the plan period;
4. A projection forward of net home completion rates 2001-2011, giving a total of 512 homes over the plan period; and
5. A projection forward of net home completion rates 2011-2016, giving a total of 1344 homes over the plan period
16. These home number projections are illustrated in Figure 1 below.
Figure 1: Home projections for the KDBHNF NP Area, 2011-2033
Source: Aecom Calculations 17. The graph above (the vertical axis indicates the number of homes) sets out the total number of
homes factoring in each of the projections we have identified in paragraph 19. So, for example, factoring in SHMA derived data (green line) to the number of dwellings that have already been
6 The OAN includes the baseline demographic need, plus any adjustments made to official forecasts to account for projected rates of household formation post 2021, past suppression of the formation of new households, the effect of past under-supply, employment forecasts, market signals and affordable housing need (as set out in paragraph ID2a-004 of the NPPG).
7000
7500
8000
8500
9000
9500
10000
2001 2011 2021 2031
SLP(derived)
SHMA(derived)
DCLGHouseholdProjecAons-derived
DwellingcompleAons2001-2011derived
DwellingcompleAons2011-2016derived
1
2
3
4
5
AECOM 9
February 2017
built in the plan area between 2011 and 1st January 2016 (478) produces a total demand for 9341 homes over the plan period.
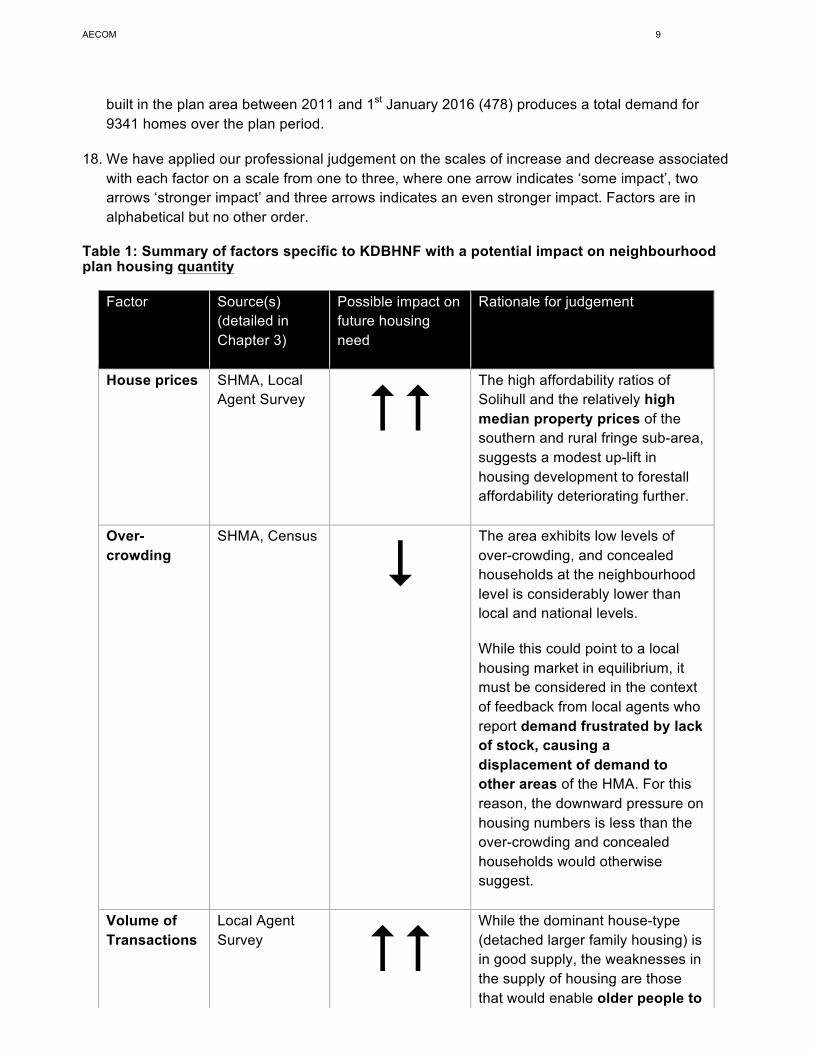
18. We have applied our professional judgement on the scales of increase and decrease associated with each factor on a scale from one to three, where one arrow indicates ‘some impact’, two arrows ‘stronger impact’ and three arrows indicates an even stronger impact. Factors are in alphabetical but no other order.
Table 1: Summary of factors specific to KDBHNF with a potential impact on neighbourhood plan housing quantity
Factor Source(s) (detailed in Chapter 3)
Possible impact on future housing need
Rationale for judgement
House prices SHMA, Local Agent Survey ##
The high affordability ratios of Solihull and the relatively high median property prices of the southern and rural fringe sub-area, suggests a modest up-lift in housing development to forestall affordability deteriorating further.
Over-crowding
SHMA, Census
$ The area exhibits low levels of over-crowding, and concealed households at the neighbourhood level is considerably lower than local and national levels.
While this could point to a local housing market in equilibrium, it must be considered in the context of feedback from local agents who report demand frustrated by lack of stock, causing a displacement of demand to other areas of the HMA. For this reason, the downward pressure on housing numbers is less than the over-crowding and concealed households would otherwise suggest.
Volume of Transactions
Local Agent Survey ##
While the dominant house-type (detached larger family housing) is in good supply, the weaknesses in the supply of housing are those that would enable older people to down-size and smaller family
AECOM 10
February 2017
Factor Source(s) (detailed in Chapter 3)
Possible impact on future housing need
Rationale for judgement
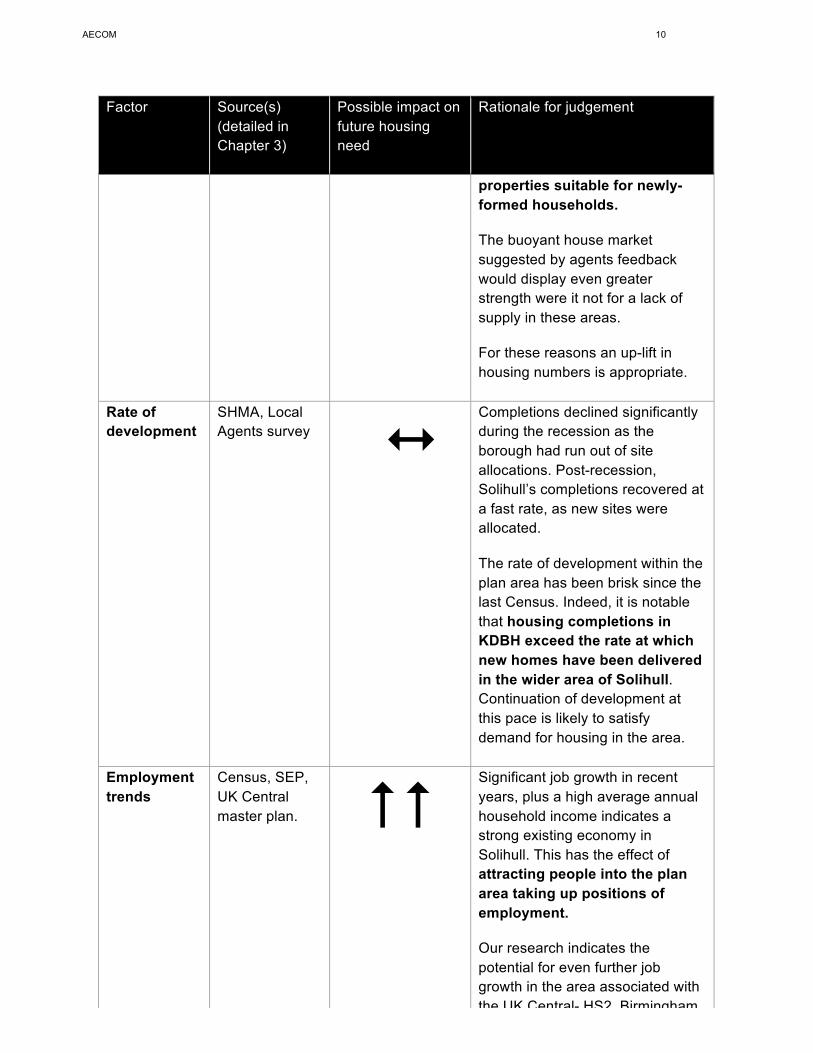
properties suitable for newly-formed households.
The buoyant house market suggested by agents feedback would display even greater strength were it not for a lack of supply in these areas.
For these reasons an up-lift in housing numbers is appropriate.
Rate of development
SHMA, Local Agents survey 1
Completions declined significantly during the recession as the borough had run out of site allocations. Post-recession, Solihull’s completions recovered at a fast rate, as new sites were allocated.
The rate of development within the plan area has been brisk since the last Census. Indeed, it is notable that housing completions in KDBH exceed the rate at which new homes have been delivered in the wider area of Solihull. Continuation of development at this pace is likely to satisfy demand for housing in the area.
Employment trends
Census, SEP, UK Central master plan. ##
Significant job growth in recent years, plus a high average annual household income indicates a strong existing economy in Solihull. This has the effect of attracting people into the plan area taking up positions of employment.
Our research indicates the potential for even further job growth in the area associated with the UK Central- HS2, Birmingham
AECOM 11
February 2017
Factor Source(s) (detailed in Chapter 3)
Possible impact on future housing need
Rationale for judgement
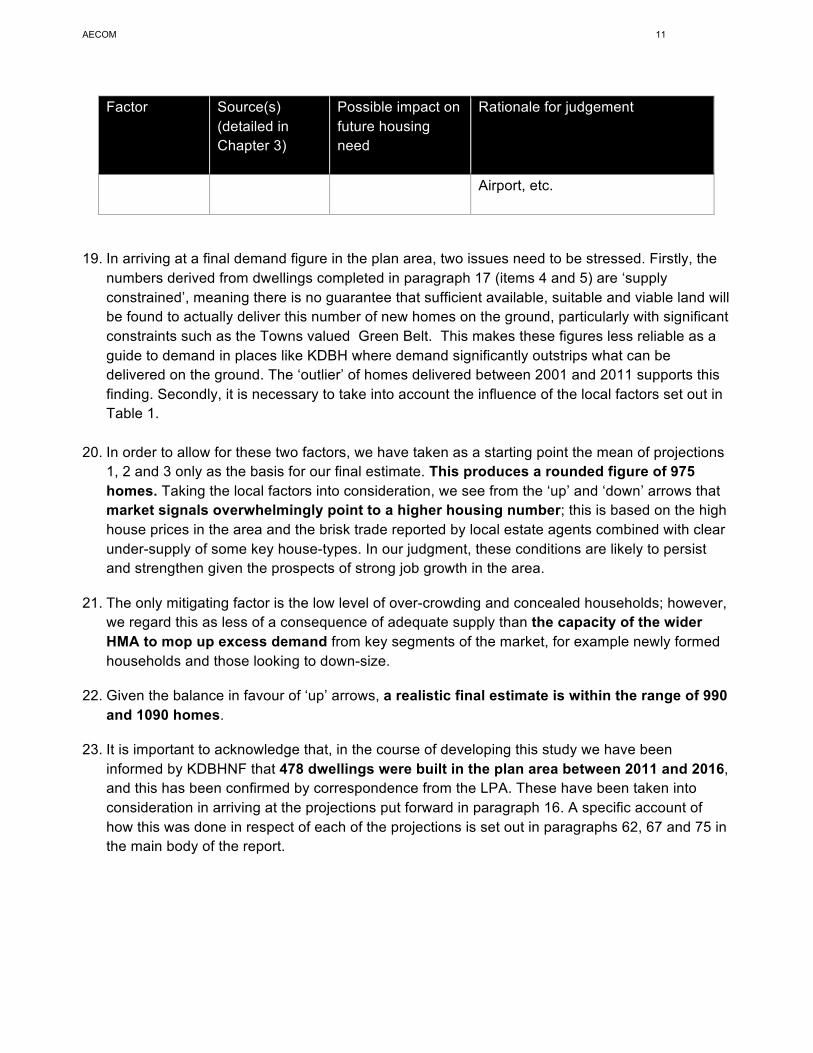
Airport, etc.
19. In arriving at a final demand figure in the plan area, two issues need to be stressed. Firstly, the numbers derived from dwellings completed in paragraph 17 (items 4 and 5) are ‘supply constrained’, meaning there is no guarantee that sufficient available, suitable and viable land will be found to actually deliver this number of new homes on the ground, particularly with significant constraints such as the Towns valued Green Belt. This makes these figures less reliable as a guide to demand in places like KDBH where demand significantly outstrips what can be delivered on the ground. The ‘outlier’ of homes delivered between 2001 and 2011 supports this finding. Secondly, it is necessary to take into account the influence of the local factors set out in Table 1.
20. In order to allow for these two factors, we have taken as a starting point the mean of projections 1, 2 and 3 only as the basis for our final estimate. This produces a rounded figure of 975 homes. Taking the local factors into consideration, we see from the ‘up’ and ‘down’ arrows that market signals overwhelmingly point to a higher housing number; this is based on the high house prices in the area and the brisk trade reported by local estate agents combined with clear under-supply of some key house-types. In our judgment, these conditions are likely to persist and strengthen given the prospects of strong job growth in the area.
21. The only mitigating factor is the low level of over-crowding and concealed households; however,
we regard this as less of a consequence of adequate supply than the capacity of the wider HMA to mop up excess demand from key segments of the market, for example newly formed households and those looking to down-size.
22. Given the balance in favour of ‘up’ arrows, a realistic final estimate is within the range of 990
and 1090 homes.
23. It is important to acknowledge that, in the course of developing this study we have been informed by KDBHNF that 478 dwellings were built in the plan area between 2011 and 2016, and this has been confirmed by correspondence from the LPA. These have been taken into consideration in arriving at the projections put forward in paragraph 16. A specific account of how this was done in respect of each of the projections is set out in paragraphs 62, 67 and 75 in the main body of the report.
AECOM 12
February 2017
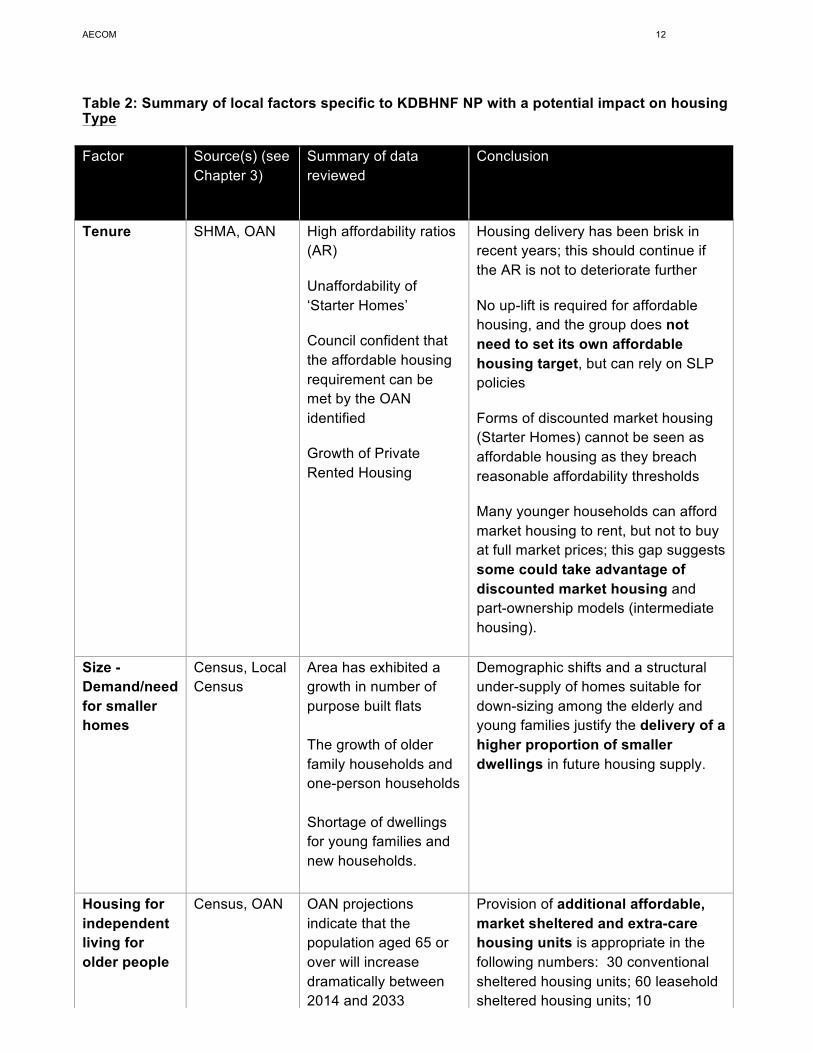
Table 2: Summary of local factors specific to KDBHNF NP with a potential impact on housing Type Factor Source(s) (see
Chapter 3) Summary of data reviewed
Conclusion
Tenure SHMA, OAN High affordability ratios (AR)
Unaffordability of ‘Starter Homes’
Council confident that the affordable housing requirement can be met by the OAN identified
Growth of Private Rented Housing
Housing delivery has been brisk in recent years; this should continue if the AR is not to deteriorate further
No up-lift is required for affordable housing, and the group does not need to set its own affordable housing target, but can rely on SLP policies
Forms of discounted market housing (Starter Homes) cannot be seen as affordable housing as they breach reasonable affordability thresholds
Many younger households can afford market housing to rent, but not to buy at full market prices; this gap suggests some could take advantage of discounted market housing and part-ownership models (intermediate housing).
Size - Demand/need for smaller homes
Census, Local Census
Area has exhibited a growth in number of purpose built flats The growth of older family households and one-person households Shortage of dwellings for young families and new households.
Demographic shifts and a structural under-supply of homes suitable for down-sizing among the elderly and young families justify the delivery of a higher proportion of smaller dwellings in future housing supply.
Housing for independent living for older people
Census, OAN OAN projections indicate that the population aged 65 or over will increase dramatically between 2014 and 2033
Provision of additional affordable, market sheltered and extra-care housing units is appropriate in the following numbers: 30 conventional sheltered housing units; 60 leasehold sheltered housing units; 10 ‘enhanced’ sheltered units; 8 extra

AECOM 13
February 2017
Factor Source(s) (see Chapter 3)
Summary of data reviewed
Conclusion
Within the plan area, the increase in the over 75s will be approximately 500 people.
care housing units for rent; 15 extra care housing units for rent and 3 specialist dementia care homes.
Traveller community
Local Plan sets out a need for 38 permanent pitches to 2027. None of the safeguarded sites or proposed allocations are located within this study area.
No additional sites required.
AECOM 14
February 2017
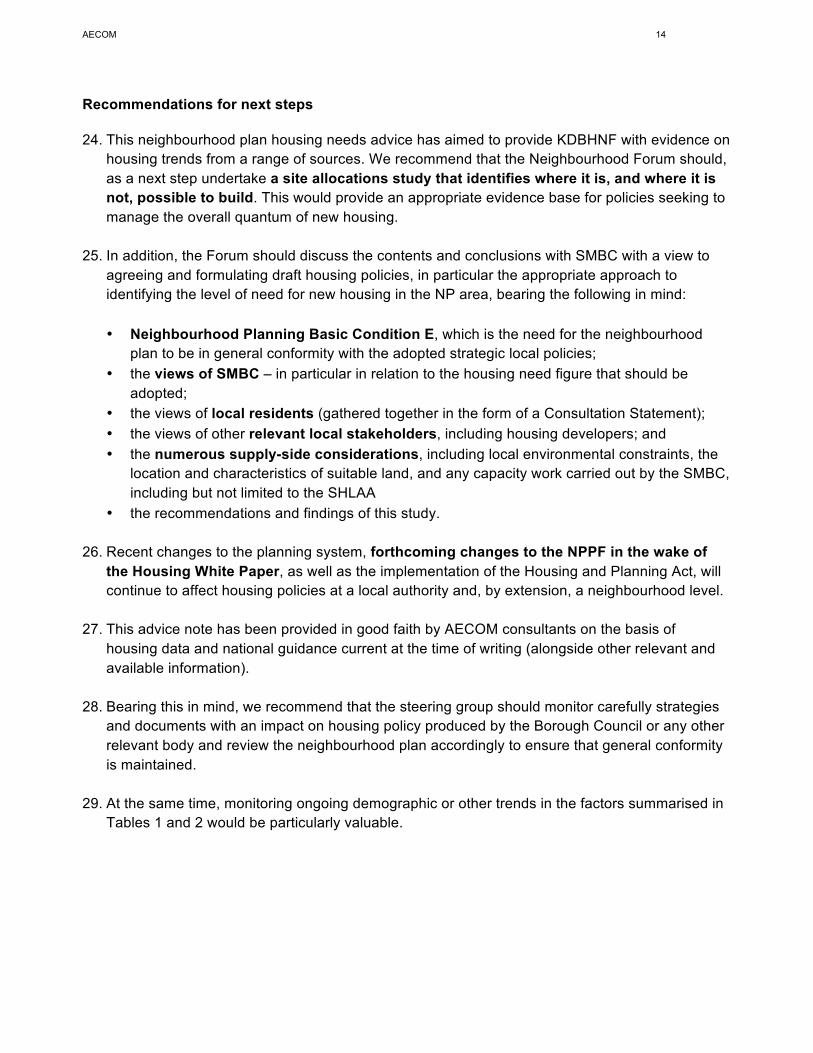
Recommendations for next steps
24. This neighbourhood plan housing needs advice has aimed to provide KDBHNF with evidence on housing trends from a range of sources. We recommend that the Neighbourhood Forum should, as a next step undertake a site allocations study that identifies where it is, and where it is not, possible to build. This would provide an appropriate evidence base for policies seeking to manage the overall quantum of new housing.
25. In addition, the Forum should discuss the contents and conclusions with SMBC with a view to agreeing and formulating draft housing policies, in particular the appropriate approach to identifying the level of need for new housing in the NP area, bearing the following in mind:
• Neighbourhood Planning Basic Condition E, which is the need for the neighbourhood
plan to be in general conformity with the adopted strategic local policies; • the views of SMBC – in particular in relation to the housing need figure that should be
adopted; • the views of local residents (gathered together in the form of a Consultation Statement); • the views of other relevant local stakeholders, including housing developers; and • the numerous supply-side considerations, including local environmental constraints, the
location and characteristics of suitable land, and any capacity work carried out by the SMBC, including but not limited to the SHLAA
• the recommendations and findings of this study. 26. Recent changes to the planning system, forthcoming changes to the NPPF in the wake of
the Housing White Paper, as well as the implementation of the Housing and Planning Act, will continue to affect housing policies at a local authority and, by extension, a neighbourhood level.
27. This advice note has been provided in good faith by AECOM consultants on the basis of
housing data and national guidance current at the time of writing (alongside other relevant and available information).
28. Bearing this in mind, we recommend that the steering group should monitor carefully strategies
and documents with an impact on housing policy produced by the Borough Council or any other relevant body and review the neighbourhood plan accordingly to ensure that general conformity is maintained.
29. At the same time, monitoring ongoing demographic or other trends in the factors summarised in
Tables 1 and 2 would be particularly valuable.
AECOM 15
February 2017
1 Context Local Area 30. Knowle, Dorridge and Bentley Heath lie within the Metropolitan Borough of Solihull in the West
Midlands. The area has a combined population of 190727. 31. Due to extensive post-war expansion there is no obvious settlement boundary between the
three settlements. For this reason, all three communities share needs and issues that should be addressed consistently, therefore the Neighbourhood Forum Area includes all three villages.
32. To the west, the M42 motorway runs along part of the Neighbourhood Plan boundary. This
section of the M42 connects the M40 with the M6, providing road connections to London, Birmingham and beyond.
33. Dorridge contains the only train station within the three communities. This station is the terminus
of many London Midland services from Kidderminster and beyond, via Birmingham Snow Hill. The nearest major airport is Birmingham Airport, approximately 5 miles north of Knowle. Birmingham Interchange, a planned HS2 station expected to open in 2026 will be located close to Birmingham Airport across the M42.
34. A Strategic Housing Market Assessment (SHMA) was produced for SMBC by Peter Brett
Associates in 2016, this assessment is relevant to this housing needs analysis and will be interrogated as appropriate.
35. For planning purposes, the Development Plan covering the area currently consists of the Solihull
Local Plan Shaping a Sustainable Future December 2013 (adopted December 2013). The Development Plan sets out the long-term spatial vision for the borough over the Plan period 2011-2028, replacing the saved policies from the previous development plan, the Solihull Unitary Development Plan, 2006.
36. Since the Local Plan was adopted, the following three issues have resulted in the need for an
early review:
• A successful legal challenge resulting in the overall housing requirement being deleted; • The examination of the Birmingham Development Plan making it clear that the City Council
is unable to meet its own housing need and that this shortfall will have to be met elsewhere within the Housing Market Area (HMA) (or other nearby areas) such as Solihull; and
• The arrival of HS2 to the Borough, and in particular the Interchange station.
37. The Draft Local Plan Review (December 2016) is currently in the consultation phase. In addition to the Local Plan, the council has also prepared a number of Supplementary Planning documents, the most relevant of these for this Assessment is Meeting Housing Needs (incl. Affordable Housing) SPD (2014).
38. This HNA report is limited to the demand side of housing rather than the supply side and
therefore it does not consider potential housing development sites. 7 Census, 2011

AECOM 16
February 2017
Local Planning Context
i. Solihull Local Plan Shaping a Sustainable Future December 2013 (Solihull Metropolitan Borough Council, December 2013)8
39. The current local plan, the Solihull Local Plan (SLP), was adopted in December 2013 and
covers the period 2011 to 2028. This Plan was subject to a High Court review challenging the Council’s decision to allocate two potential housing sites in Tidbury Green within the Green Belt. The judge said the full housing need required in Solihull had not been objectively assessed. This judgment had implications for Policy P5 of the Plan which establishes the scale of housing need. It is important to note that following the judgment most of the Plan remains unaffected and is still considered the adopted Development Plan for the Borough.
40. Policy P5 in the Adopted Local Plan 2013 stated the Council would allocate land in the Borough
for 3,960 net additional homes ensuring sufficient housing land supply to deliver 11,000 additional homes over 2006-2028, with a provisional target of 500 net additional homes per year. Following the High Court challenge, this housing target for net additional homes to satisfy the need to demonstrate a five year supply of housing was increased to 4,526 as a result of a requirement to use the DCLG (2011) household projections9 in the absence of an OAN.
41. Policy P6 Provision of Sites for Gypsies and Travellers, sets out a need for 38 permanent
pitches to 2027; the provision of pitches to meet this need was made through the Gypsy and Traveller Site Allocations Plan (December 2014)10. None of the safeguarded sites or proposed allocations are located within this study area.
ii. Reviewing the Plan for Solihull’s Future, Solihull Local Plan Review, Draft Local Plan
(Solihull Metropolitan Borough Council, November 2016)11 42. As well as the High Court Judgement, the review of the Local Plan also considered the findings
of the GBSLEP and Black Country Strategic Housing Needs Study (Peter Brett, August 2015)12 which indicated a shortfall across the whole Housing Market Area of some 37,500 homes over the period 2011-2031.
43. The review of the Local Plan states there is potential for Solihull to accommodate a further 2,000
homes to help address this shortfall, in addition to accommodating the Borough’s own needs. This has implications for Policy P5 of the Draft Local Plan Review which increases the original provisions set out in the 2013 Local Plan. The review states the Council will allocate land in the Borough for 6,522 net additional homes ensuring sufficient housing land supply to deliver 15,029 additional homes over 2014-2033, with a provisional target of 791 net additional homes per year.
44. Appendix C of the plan contains the Schedule of Allocated Housing Sites. The following sites
are located within this study area: 8 http://www.solihull.gov.uk/Portals/0/Planning/LDF/Local_Plan_Final.pdf 9 Solihull Local Plan , Policy P5 Position Statement June 2014 10 http://www.solihull.gov.uk/Portals/0/Planning/Gypsy/Gypsy_and_Traveller_Site_Allocations_Plan.pdf 11 http://www.solihull.gov.uk/Portals/0/Planning/LPR/Draft_Local_Plan_05.12.16.pdf 12 http://centreofenterprise.com/wp-content/uploads/2015/09/SHNS-Phase-3.pdf
AECOM 17
February 2017
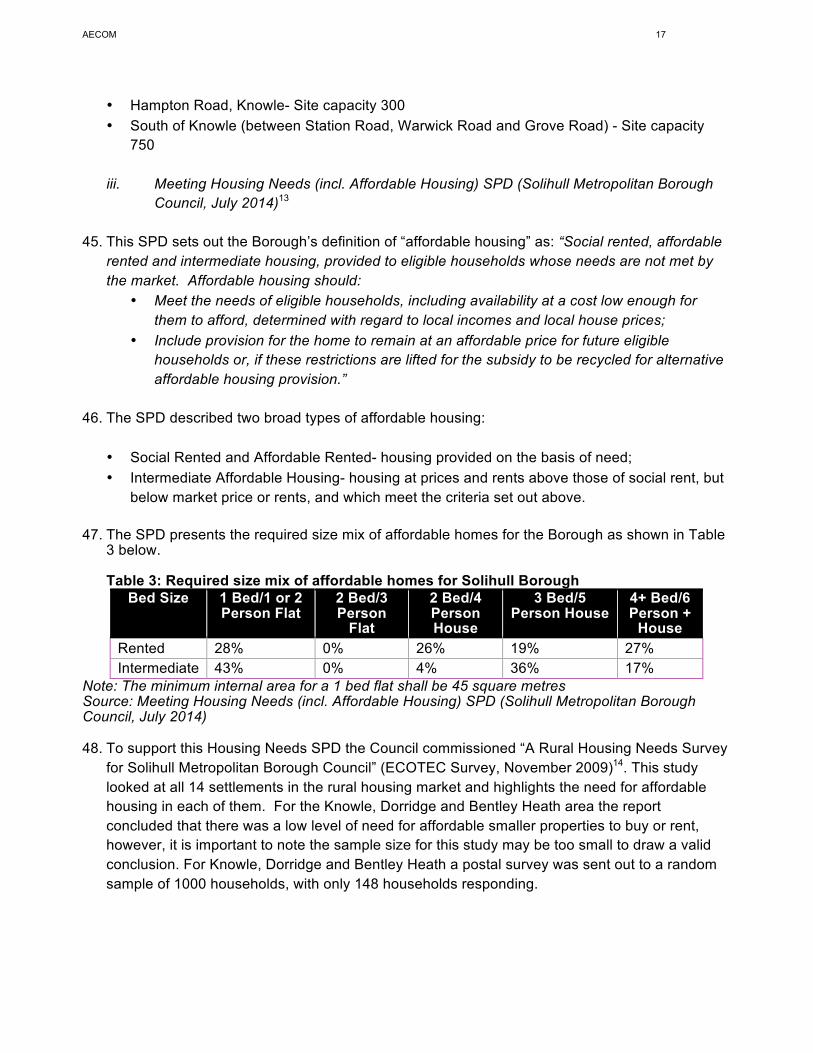
• Hampton Road, Knowle- Site capacity 300 • South of Knowle (between Station Road, Warwick Road and Grove Road) - Site capacity
750
iii. Meeting Housing Needs (incl. Affordable Housing) SPD (Solihull Metropolitan Borough Council, July 2014)13
45. This SPD sets out the Borough’s definition of “affordable housing” as: “Social rented, affordable
rented and intermediate housing, provided to eligible households whose needs are not met by the market. Affordable housing should:
• Meet the needs of eligible households, including availability at a cost low enough for them to afford, determined with regard to local incomes and local house prices;
• Include provision for the home to remain at an affordable price for future eligible households or, if these restrictions are lifted for the subsidy to be recycled for alternative affordable housing provision.”
46. The SPD described two broad types of affordable housing: • Social Rented and Affordable Rented- housing provided on the basis of need; • Intermediate Affordable Housing- housing at prices and rents above those of social rent, but
below market price or rents, and which meet the criteria set out above.
47. The SPD presents the required size mix of affordable homes for the Borough as shown in Table 3 below.
Table 3: Required size mix of affordable homes for Solihull Borough
Bed Size 1 Bed/1 or 2 Person Flat
2 Bed/3 Person
Flat
2 Bed/4 Person House
3 Bed/5 Person House
4+ Bed/6 Person +
House Rented 28% 0% 26% 19% 27% Intermediate 43% 0% 4% 36% 17%
Note: The minimum internal area for a 1 bed flat shall be 45 square metres Source: Meeting Housing Needs (incl. Affordable Housing) SPD (Solihull Metropolitan Borough Council, July 2014) 48. To support this Housing Needs SPD the Council commissioned “A Rural Housing Needs Survey
for Solihull Metropolitan Borough Council” (ECOTEC Survey, November 2009)14. This study looked at all 14 settlements in the rural housing market and highlights the need for affordable housing in each of them. For the Knowle, Dorridge and Bentley Heath area the report concluded that there was a low level of need for affordable smaller properties to buy or rent, however, it is important to note the sample size for this study may be too small to draw a valid conclusion. For Knowle, Dorridge and Bentley Heath a postal survey was sent out to a random sample of 1000 households, with only 148 households responding.
13 http://www.solihull.gov.uk/Portals/0/Planning/LDF/Meeting_Housing_Needs_SPD_Final.pdf 14 http://www.solihull.gov.uk/Portals/0/Planning/LDF/Solihull_Rural_Housing_Needs_Survey.pdf
AECOM 18
February 2017
2 Approach
Research Questions
49. Housing Needs Assessment at neighbourhood plan level can be focused either on quantity of housing needed, type of housing need, or both. In most cases, there is a need to focus on quantity where the housing target for the settlement being assessed is unclear, for example where the local authority has not set a specific target for the settlement, or where there is no local plan in place.
50. As we have seen, in the case of KDBH, the emerging Local Plan allocates two sites within the plan area, totalling 1050 homes; moreover, Solihull has undertaken to contribute 2000 homes over the Plan Period to address the shortfall in housing within the wider Birmingham HMA.
51. In addition, as part of the consultation process associated with the review of the Local Plan, the Neighbourhood Forum is keen to identify a suitable target (i.e. quantity) for housing within the plan area to inform their opinion as to the appropriateness of this amount of housing development so as to feed into Solihull’s consultation on the new Local Plan in a pro-active manner.
Quantity
52. It is therefore necessary to arrive at an estimate for the required housing growth relying on a number of reliable sources; these are,
1. A number derived from the Solihull Local Plan (adopted 2013)
2. SHMA - proportional share drawn from OAN
3. DCLG Household projections
4. Net home completion rates 2001-2011
5. Net home completion rates 2011-2015
Size and tenure
53. Size and tenure should form a focus of the study; in particular, KDBHNP have expressed an interest in
o Smaller AMH that will enable newly formed households to remain in the area
o Larger, high quality flats for the newly retired
o AH, in particular shared equity.

AECOM 19
February 2017
Study Objectives
54. The objectives of this report can be summarised as:
• Collation of a range of data with relevance to housing need in KDBH relative to SMBC
• Analysis of that data to respond to the Research Questions;
• Setting out recommendations based on our data analysis that can be used to inform the Neighbourhood Plan’s housing policies.
55. The remainder of this report is structured around the objectives set out above:
• Chapter 3 sets out the data gathered from all sources; and
• Chapter 4 sets out our conclusions and recommendations based on our data analysis that can be used to inform the Neighbourhood Plan’s housing policies.
AECOM 20
February 2017
3 Relevant Data 56. The PPG states that neighbourhood planners can refer to existing needs assessments prepared
by the local planning authority as a starting point. As KDBHNF is located within the Birmingham Housing Market Area, we therefore turned to the Solihull Strategic Housing Market Assessment (November 2016, henceforth SHMA) which covers the HMA and informs emerging housing policies at a local authority level, including affordable housing policy.
57. The SHMA draws upon a range of data including population projections, housing market transactions and employment scenarios to derive the objectively-assessed housing need. As such, it contains a number of points of relevance when determining the degree to which the housing needs context of KDBH itself differs from the authority-wide picture.
58. For the purposes of finer-grained analysis across such a large HMA, the SHMA divides the housing market area into a number of smaller local sub-markets. This includes the Southern and Rural Fringe (SRF); this encompasses the KDBH area and exhibits many of the same conditions and characteristics. For this reason the SHMA’s findings regarding are drawn out as appropriate in this study.
Quantity
59. We have estimated the quantity of housing needed in plan area according to four different sources; these are,
1. Solihull Local Plan (adopted 2013)
2. SHMA - proportional share drawn from OAN
3. DCLG Household projections
4. Net home completion rates 2001-2011
5. Net home completion rates 2011-2015
These calculations are set out below.
SLP
60. The SLP adopted in 2013 set a housing requirement for 11,000 for the borough over the Plan Period between 2011 and 2028. The proportional share may be calculated for the KDBH area based on the proportion of homes in the plan area. At the time of the last Census there were 7933 homes in the plan area, or 9% of all homes in the borough. Therefore, 909 homes (9% of 11,000) should be allocated as the ‘fair share’ of the borough target. As noted earlier, however, this projection is rendered invalid by the successful legal challenge to SLP post adoption.
61. As part of the current review of the Local Plan, the Council is seeking to substantially increase this number, both to address the borough’s revised housing needs and to shoulder its share of the Birmingham HMA’s shortfall stemming from the duty to co-operate.
62. As set out earlier, the Council is seeking 15,029 additional homes over the plan period of 2014 to 2033. The proportional share for the plan area is therefore 1353 dwellings (rounded). In
AECOM 21
February 2017
arriving at a final total for KDBH, it is important to take into consideration that 478 dwellings were built between 2011 and 2016 in the plan area. This equates to an average annual rate of 96 dwellings. Applying this to the two years that have elapsed since 2014 (2014/15 and 2015/16), generates a housing target for KDBH that is in conformity with emerging borough policy of 1161 dwellings (rounded) between 2017 and 2033 or 73 homes per year (rounded)
63. Draft Local Plan is not yet adopted policy; nevertheless, it should be taken into consideration when calculating the volume of housing that the NDP should seek to deliver given that it will become adopted policy in the short to medium term.
SHMA
64. It is important to remember that the SHMA presents a demand-side only, or ‘unconstrained’ assessment of need (often identified as Objectively Assessed Need, or OAN15), as opposed to a final housing target. The final housing target will take into account a number of other factors, including for example the availability of land, viability, infrastructure and environmental constraints and the results of consultation.
65. Nonetheless, the SHMA presents an appropriate starting point for deriving need at the NP level, because it is the most up-to-date evidence available, and importantly, because it takes into account the latest population and household projections, as set out in the 2014 Sub-National Population Projections on which the Household Projections are based, which the PPG guidance suggests should be taken as a ‘starting point’ in determining need at the local authority level.
66. The SHMA identifies two OANs for Solihull over the period 2014 - 3316, 14,278 and 13,094 homes. The higher number includes a further upward adjustment because Solihull has chosen to adopt a different base date for its new plan from its nearest and most relevant HMA neighbour (Birmingham)17. Both numbers are consistent with the Strategic Housing Needs Study for the Birmingham Housing Market Area, of which Solihull is part18 and taking into consideration market signals19. On account of the difficulty of disaggregating the complex data that underpins these numbers to a smaller geographical area, for the purposes of this study, we have used a ‘mid-point’ as our assumed OAN; this is 13,686, or 760 per year (rounded).
67. To calculate the plan area’s ‘fair share’ of this target, it is again possible to use KDBH’s proportion of all housing in the borough (9%). This produces a figure of 1232 dwellings (rounded). Furthermore, it is necessary to take into consideration homes built in the plan area in recent years; since 2011, as set out above, 478 dwellings have been built; this represents an annual rate of 96 dwellings (rounded). Taking the two years into account that have elapsed since the SMHA was published, 192 dwellings should be deducted, producing a final target of 1040 dwellings over the plan period, or 65 per year (rounded).
15 The OAN includes the baseline demographic need, plus any adjustments made to official forecasts to account for projected rates of household formation post 2021, past suppression of the formation of new households, the effect of past under-supply, employment forecasts, market signals and affordable housing need (as set out in paragraph ID2a-004 of the NPPG). This is sometimes described as ‘policy off’ because it does not take account of final policy responses as a result of taking into account capacity, environmental and infrastructure constraints. 16 SHMA, 12 17 SHMA, part 1, 52 18 SHMA, 3 19 SHMA, 34
AECOM 22
February 2017
DCLG Household Projections
68. The Department for Communities and Local Government (DCLG) periodically publishes household projections. The NPPG recommends that these household projections should form the starting point for the assessment of housing need.
69. The most recent (2014-based) household projections were published in July 201620, and extend to 2039. Although population projections are only available at a local authority level, a calculation of the share for the plan area is nevertheless possible for the household projections based on the plan area’s household numbers in the 2011 Census.
70. At the 2011 Census, Solihull had 86,056 households and the plan area 7755 households, or 9% of the total.
71. In the 2014-based household projections, the projection for 2033 is for 99,149 households in Solihull. Assuming it continues to form 9% of the district total, the plan area’s new total number of households would be 8923 (rounded); therefore 1168 new households form in the plan area between 2011 and 2033 (or a rate of growth of 53 households per year).
72. Number of households does not, however, equate precisely to number of homes, with the latter slightly higher in most places. The plan area is no exception; in the 2011 Census, there were 7755 households but 7611 homes. This gives a ratio of 0.98 households per home. In the case of plan area, then, a projection of (1168/.98) new households translates into a need for 1192 homes (rounded to the nearest whole number).
73. These figures are based on the assumption that 2014-based government projections as to household growth at the Local Authority level are accurate. As the annual mid-year population estimates have now been released for 2015, the 2014-based household projections may need to be ‘rebased’ for accuracy. The mid-2015 population estimates give the actual number of people in the plan area at that point, meaning the difference between the estimated and the previously projected number of households can to be taken into account in future projections.
74. The 2014-based household projections were based on the 2014-based Sub-National Population
Projections, which estimated that by 2015 there would be 210,763 people in Solihull. The mid-2015 Estimates show that based on the latest information there were estimated to be 210,445 people, which is higher than the projections by 318 people. Assuming average household sizes remain constant (in 2011 there were an average of 2.4 people per household, obtained by dividing population by number of households) this equates to 133 more households across Solihull (rounded).
75. Taking 99,282 (99,149 + 133) as our revised household number at 2033, this equates to 8,935 households in the plan area (rounded), producing a revised growth in the number of households between 2011 and 2033 of 1180. Taking into account the disparity between household numbers and dwelling numbers (1180/.98), this produces a figure of 1204 homes for the plan area. Furthermore, it is necessary to take into consideration homes built in the plan area since 2011; as set out above, 478 dwellings have been built, producing a final re-based household projections-derived dwellings of 726.
20 See 2014-based DCLG Household Projections live tables at https://www.gov.uk/government/statistical-data-sets/live-tables-on-household-projections
AECOM 23
February 2017
76. This projection is an entirely unconstrained, theoretical figure comprising a relative proportion of
the overall projected increase, and thus does not take into account political, economic, demographic or any other drivers that might have influenced, or may in future influence, the Local Plan distribution across the District and hence any difference between this figure and a future Local Plan-derived figure.
Home growth 2001 – 2011
77. Consideration of home growth 2001-2011 provides a projection based on the rate of delivery of net new homes between the two censuses. As we have seen, there was an increase of 322 homes in the NP area between these two dates, or an average annual rate of increase of 32 homes (rounded). Multiplying this annual figure by the number of years remaining of the plan period produces a gross need for 512 homes.
Home growth since 2011
78. It is also helpful to consider a projection based on the rate of delivery of net new homes since the last census (2011), using data gathered and monitored by the LPA. As we have seen, between 1st April 2011 and the 31st March 2016, 478 new dwellings were completed21. This equates to an annual rate of delivery of 96 homes (478 divided by 5, the number of years elapsed). If this rate of delivery was continued to 2033, this would equate to a projection of 1536 homes over the plan period of 2017-2033 (96 x 16, rounded to the nearest whole number). As before, it is necessary to deduct from this total two years’ worth of homes that have been built during 2014/15 and 2015/16. This produces a final total of 1344 dwellings over the plan period.
Tenure
79. The NPPG states that HNAs should investigate household tenure in the current stock and recent supply, and make an assessment, based on a reasonable interpretation of the evidence gathered, whether continuation of these trends would meet future needs or whether, on account of significant misalignments between supply of housing and local need/demand, policies should support a change to the profile of the plan area’s housing stock.
i. Current supply
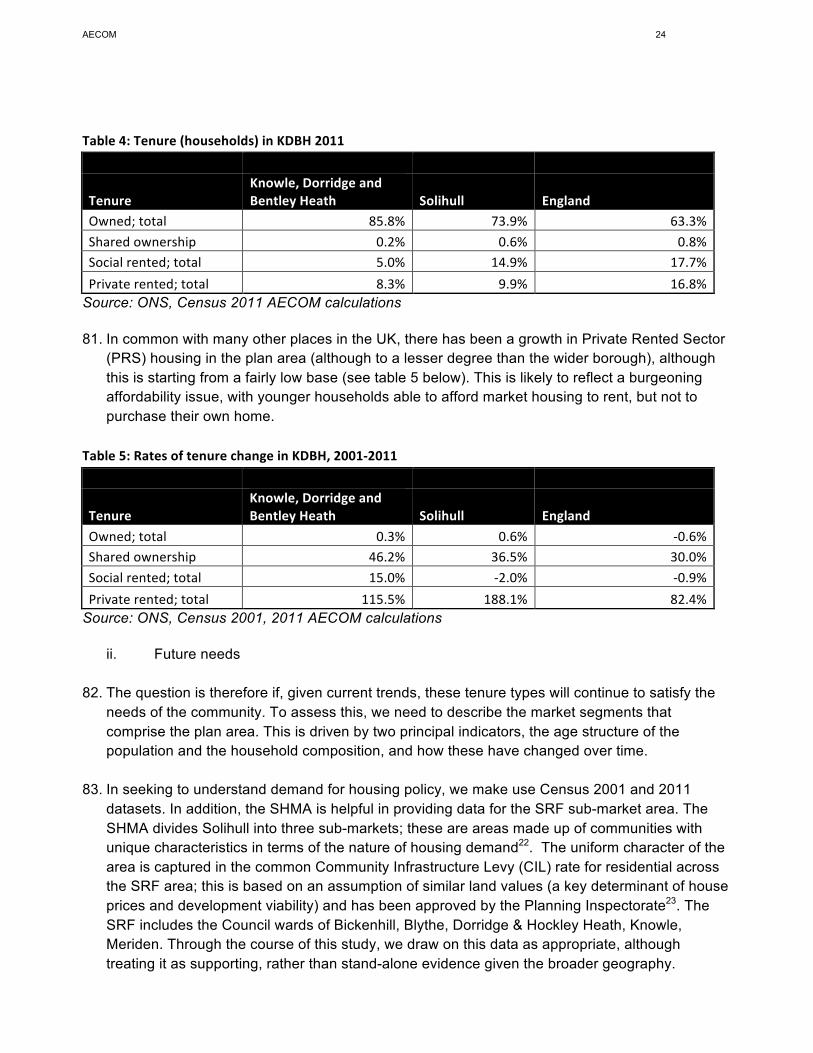
80. The stock of housing in the plan area reflects its wealthier demographic, with both a significantly higher proportion of homes in owner occupation than for either England or the wider local authority area and a comparatively very low proportion of socially rented homes (see table 4 below).
21 Email from Solihull Borough Council, 14/02/17
AECOM 24
February 2017
Table4:Tenure(households)inKDBH2011
TenureKnowle,DorridgeandBentleyHeath Solihull England
Owned;total 85.8% 73.9% 63.3%Sharedownership 0.2% 0.6% 0.8%Socialrented;total 5.0% 14.9% 17.7%Privaterented;total 8.3% 9.9% 16.8%
Source: ONS, Census 2011 AECOM calculations 81. In common with many other places in the UK, there has been a growth in Private Rented Sector
(PRS) housing in the plan area (although to a lesser degree than the wider borough), although this is starting from a fairly low base (see table 5 below). This is likely to reflect a burgeoning affordability issue, with younger households able to afford market housing to rent, but not to purchase their own home.
Table5:RatesoftenurechangeinKDBH,2001-2011
TenureKnowle,DorridgeandBentleyHeath Solihull England
Owned;total 0.3% 0.6% -0.6%Sharedownership 46.2% 36.5% 30.0%Socialrented;total 15.0% -2.0% -0.9%Privaterented;total 115.5% 188.1% 82.4%
Source: ONS, Census 2001, 2011 AECOM calculations
ii. Future needs 82. The question is therefore if, given current trends, these tenure types will continue to satisfy the
needs of the community. To assess this, we need to describe the market segments that comprise the plan area. This is driven by two principal indicators, the age structure of the population and the household composition, and how these have changed over time.
83. In seeking to understand demand for housing policy, we make use Census 2001 and 2011
datasets. In addition, the SHMA is helpful in providing data for the SRF sub-market area. The SHMA divides Solihull into three sub-markets; these are areas made up of communities with unique characteristics in terms of the nature of housing demand22. The uniform character of the area is captured in the common Community Infrastructure Levy (CIL) rate for residential across the SRF area; this is based on an assumption of similar land values (a key determinant of house prices and development viability) and has been approved by the Planning Inspectorate23. The SRF includes the Council wards of Bickenhill, Blythe, Dorridge & Hockley Heath, Knowle, Meriden. Through the course of this study, we draw on this data as appropriate, although treating it as supporting, rather than stand-alone evidence given the broader geography.
22 SHMA, part 2, 3 23 SHMA, part 2, 3
AECOM 25
February 2017
84. We also need to consider affordability issues to establish whether the current tenure is aligned to household income such that people are able to afford housing suited to their needs. Evidence of misalignments between need and available supply as determined by household income is demonstrated by the affordability ratio (the relationship between income and house-prices), over-crowding and a growing housing waiting list; we consider each of these questions in turn.
Table 6: Age Structure
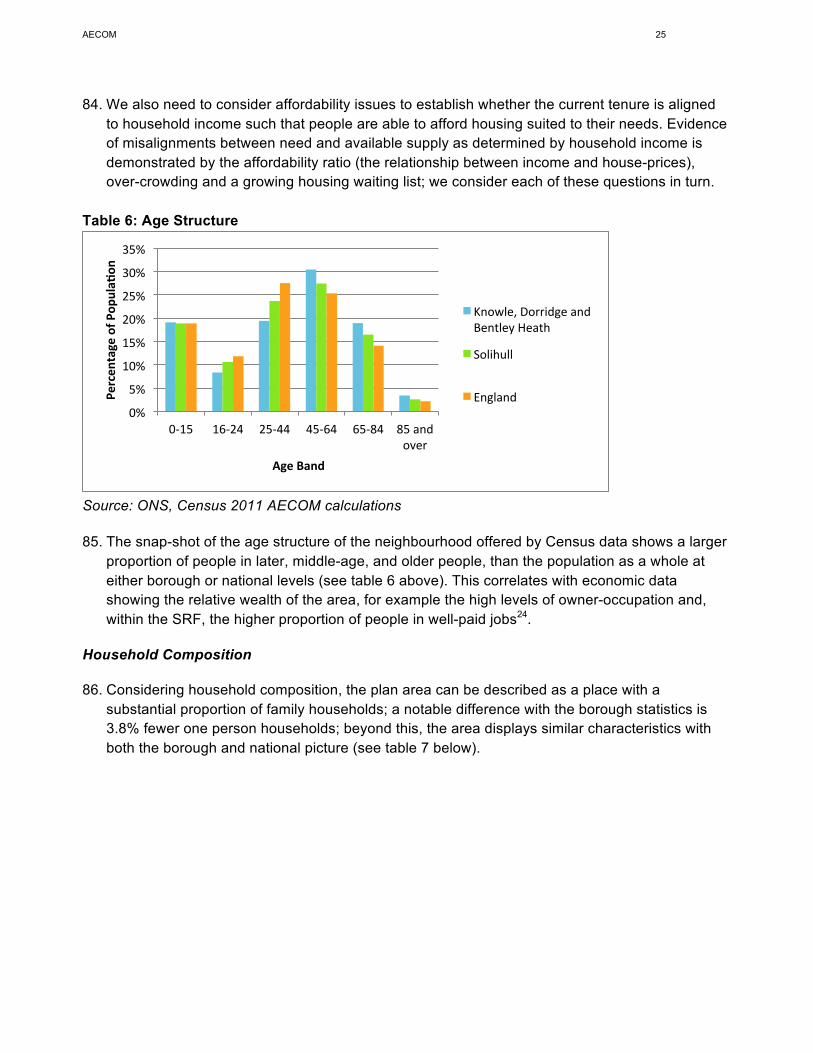
Source: ONS, Census 2011 AECOM calculations 85. The snap-shot of the age structure of the neighbourhood offered by Census data shows a larger
proportion of people in later, middle-age, and older people, than the population as a whole at either borough or national levels (see table 6 above). This correlates with economic data showing the relative wealth of the area, for example the high levels of owner-occupation and, within the SRF, the higher proportion of people in well-paid jobs24.
Household Composition
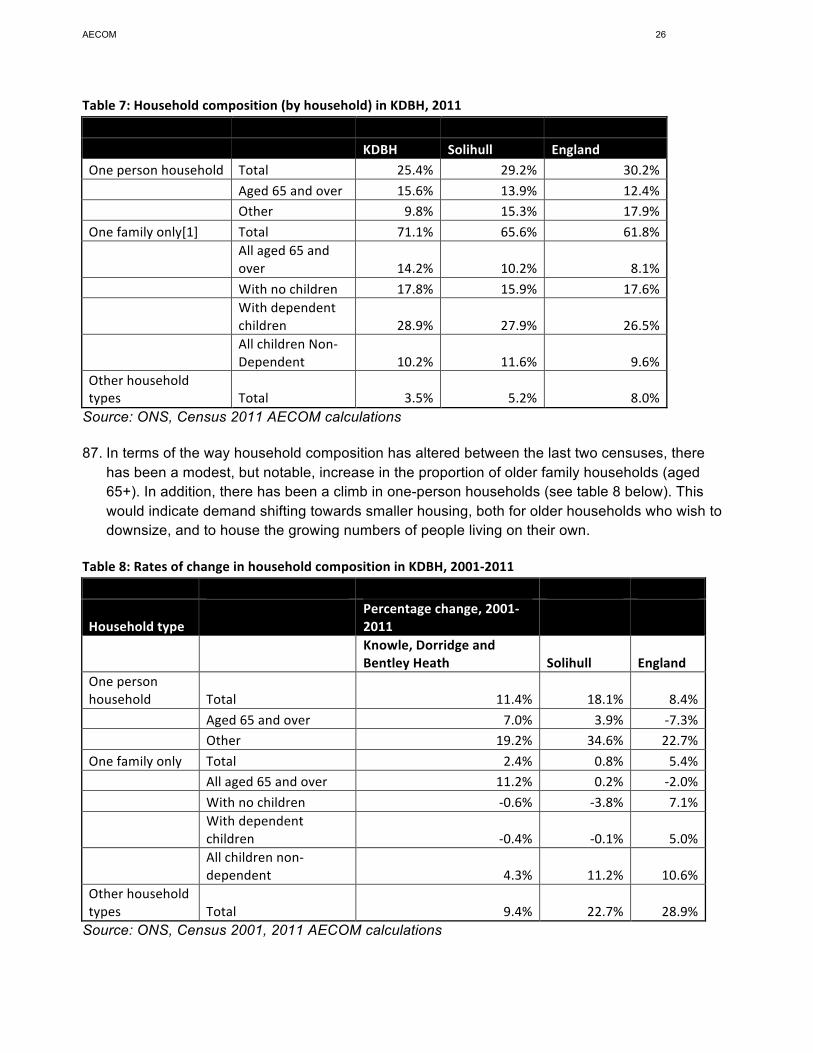
86. Considering household composition, the plan area can be described as a place with a substantial proportion of family households; a notable difference with the borough statistics is 3.8% fewer one person households; beyond this, the area displays similar characteristics with both the borough and national picture (see table 7 below).
24 SHMA, part 2, 12
0%
5%
10%
15%
20%
25%
30%
35%
0-15 16-24 25-44 45-64 65-84 85andover
Percen
tageofP
opulaH
on
AgeBand
Knowle,DorridgeandBentleyHeath
Solihull
England
AECOM 26
February 2017
Table7:Householdcomposition(byhousehold)inKDBH,2011
KDBH Solihull EnglandOnepersonhousehold Total 25.4% 29.2% 30.2% Aged65andover 15.6% 13.9% 12.4% Other 9.8% 15.3% 17.9%Onefamilyonly[1] Total 71.1% 65.6% 61.8%
Allaged65andover 14.2% 10.2% 8.1%
Withnochildren 17.8% 15.9% 17.6%
Withdependentchildren 28.9% 27.9% 26.5%
AllchildrenNon-Dependent 10.2% 11.6% 9.6%
Otherhouseholdtypes Total 3.5% 5.2% 8.0%
Source: ONS, Census 2011 AECOM calculations 87. In terms of the way household composition has altered between the last two censuses, there
has been a modest, but notable, increase in the proportion of older family households (aged 65+). In addition, there has been a climb in one-person households (see table 8 below). This would indicate demand shifting towards smaller housing, both for older households who wish to downsize, and to house the growing numbers of people living on their own.
Table8:RatesofchangeinhouseholdcompositioninKDBH,2001-2011
Householdtype Percentagechange,2001-2011
Knowle,DorridgeandBentleyHeath Solihull England
Onepersonhousehold Total 11.4% 18.1% 8.4% Aged65andover 7.0% 3.9% -7.3% Other 19.2% 34.6% 22.7%Onefamilyonly Total 2.4% 0.8% 5.4% Allaged65andover 11.2% 0.2% -2.0% Withnochildren -0.6% -3.8% 7.1%
Withdependentchildren -0.4% -0.1% 5.0%
Allchildrennon-dependent 4.3% 11.2% 10.6%
Otherhouseholdtypes Total 9.4% 22.7% 28.9%
Source: ONS, Census 2001, 2011 AECOM calculations
AECOM 27
February 2017
88. This requirement of properties suited to downsizing is supported by data showing significant under-occupancy of homes, with 84% showing ‘up to 0.5 persons’ for each bedroom. There is likely to be a strong correlation between this, and the high proportion of households that own their own property, with many possessing ample spare space. While this may be what the occupants want, there may be instances where people are caught in a bind: wishing to stay in the area to be close to family and friends, and established networks, but unable to move on account of the lack of suitable homes to move into. A classic example would, of course, be older people wishing to down-size. Findings from community consultation work find that 14% of those looking to move are seeking a smaller property25 appear to reinforce this finding.
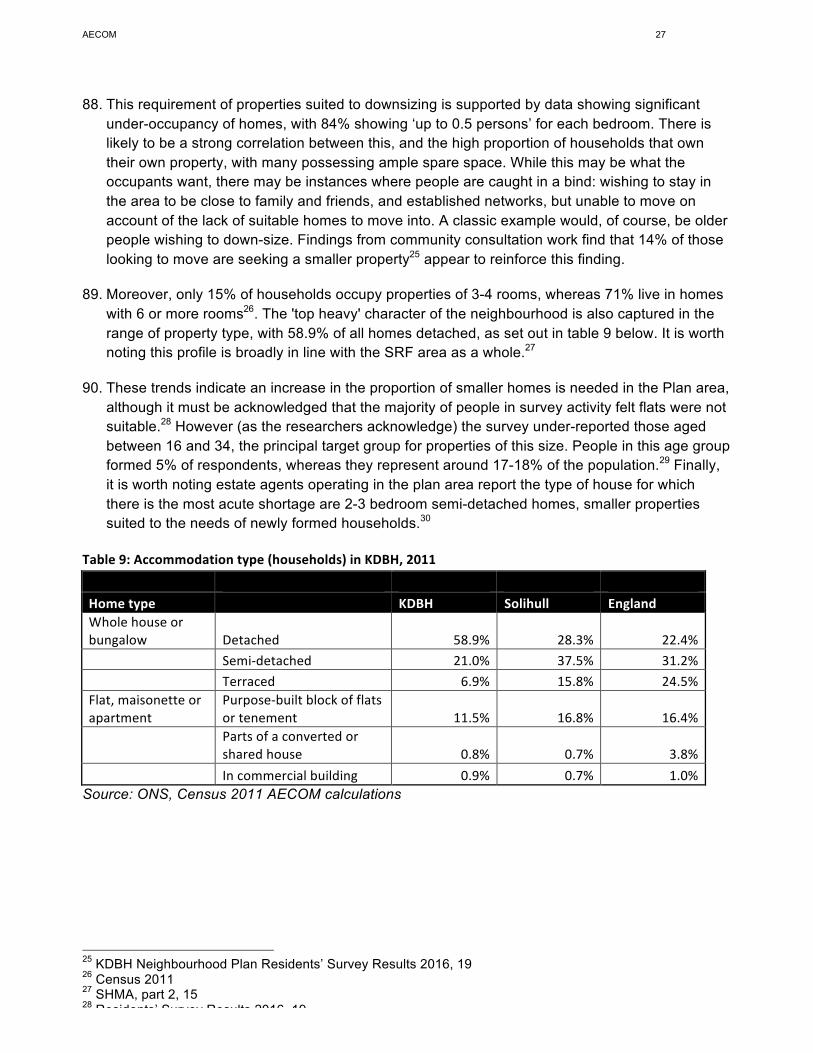
89. Moreover, only 15% of households occupy properties of 3-4 rooms, whereas 71% live in homes with 6 or more rooms26. The 'top heavy' character of the neighbourhood is also captured in the range of property type, with 58.9% of all homes detached, as set out in table 9 below. It is worth noting this profile is broadly in line with the SRF area as a whole.27
90. These trends indicate an increase in the proportion of smaller homes is needed in the Plan area, although it must be acknowledged that the majority of people in survey activity felt flats were not suitable.28 However (as the researchers acknowledge) the survey under-reported those aged between 16 and 34, the principal target group for properties of this size. People in this age group formed 5% of respondents, whereas they represent around 17-18% of the population.29 Finally, it is worth noting estate agents operating in the plan area report the type of house for which there is the most acute shortage are 2-3 bedroom semi-detached homes, smaller properties suited to the needs of newly formed households.30
Table9:Accommodationtype(households)inKDBH,2011
Hometype KDBH Solihull EnglandWholehouseorbungalow Detached 58.9% 28.3% 22.4% Semi-detached 21.0% 37.5% 31.2% Terraced 6.9% 15.8% 24.5%Flat,maisonetteorapartment
Purpose-builtblockofflatsortenement 11.5% 16.8% 16.4%
Partsofaconvertedorsharedhouse 0.8% 0.7% 3.8%
Incommercialbuilding 0.9% 0.7% 1.0%Source: ONS, Census 2011 AECOM calculations 25 KDBH Neighbourhood Plan Residents’ Survey Results 2016, 19 26 Census 2011 27 SHMA, part 2, 15 28 Residents’ Survey Results 2016, 19 29 Census 2011 30 Local Agent Survey
AECOM 28
February 2017
iii. Affordability
91. In understanding affordability, it is necessary to determine the relationship between the different tenures available and household income levels in the local area.
Affordability Ratio (AR)
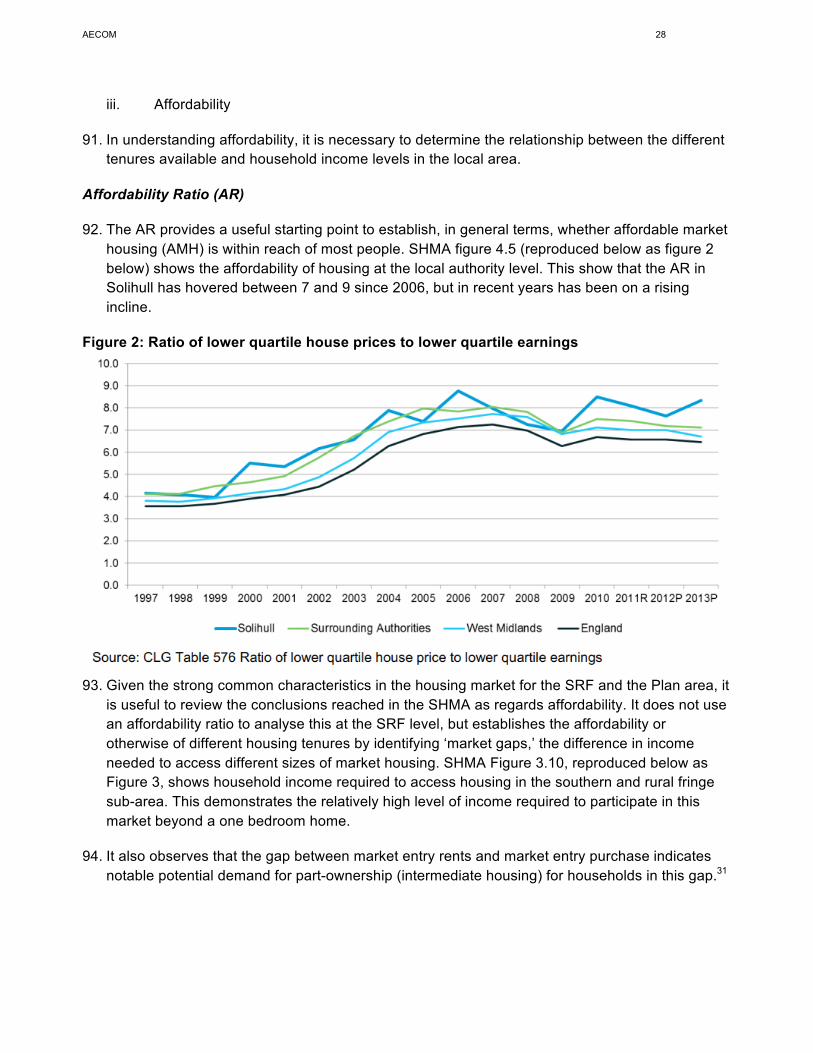
92. The AR provides a useful starting point to establish, in general terms, whether affordable market housing (AMH) is within reach of most people. SHMA figure 4.5 (reproduced below as figure 2 below) shows the affordability of housing at the local authority level. This show that the AR in Solihull has hovered between 7 and 9 since 2006, but in recent years has been on a rising incline.
Figure 2: Ratio of lower quartile house prices to lower quartile earnings
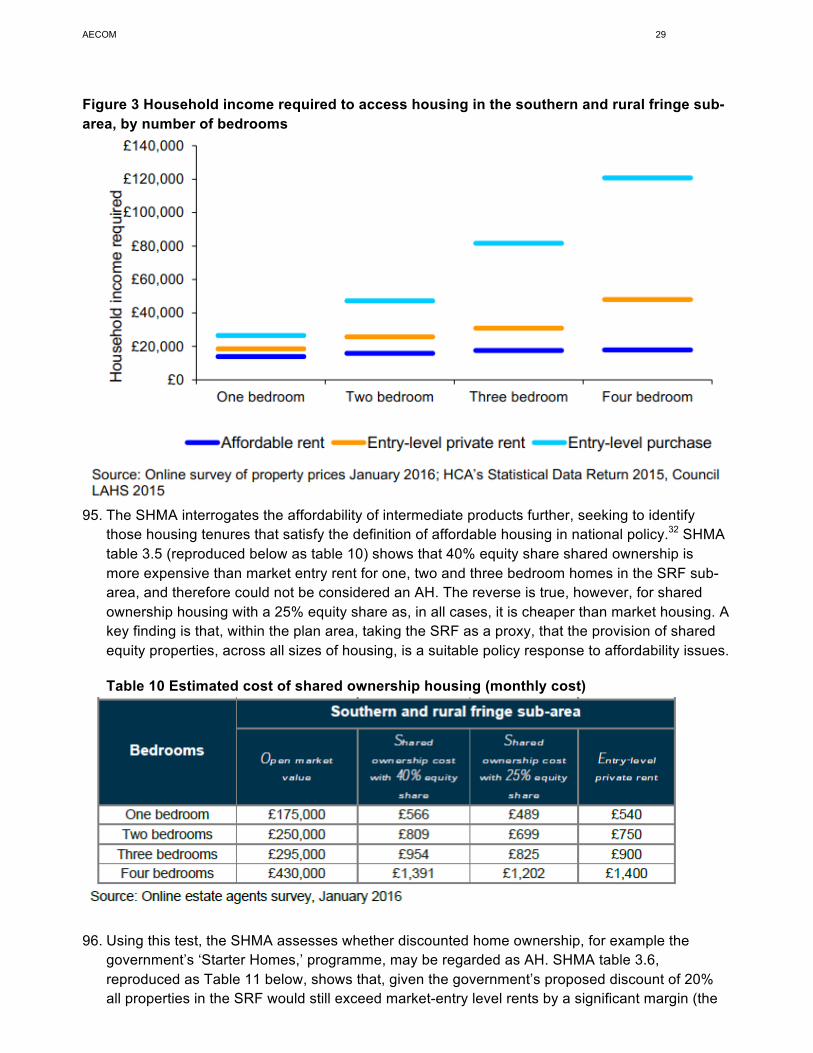
93. Given the strong common characteristics in the housing market for the SRF and the Plan area, it
is useful to review the conclusions reached in the SHMA as regards affordability. It does not use an affordability ratio to analyse this at the SRF level, but establishes the affordability or otherwise of different housing tenures by identifying ‘market gaps,’ the difference in income needed to access different sizes of market housing. SHMA Figure 3.10, reproduced below as Figure 3, shows household income required to access housing in the southern and rural fringe sub-area. This demonstrates the relatively high level of income required to participate in this market beyond a one bedroom home.
94. It also observes that the gap between market entry rents and market entry purchase indicates notable potential demand for part-ownership (intermediate housing) for households in this gap.31
31 SHMA, part 2, 28
AECOM 29
February 2017
Figure 3 Household income required to access housing in the southern and rural fringe sub-area, by number of bedrooms
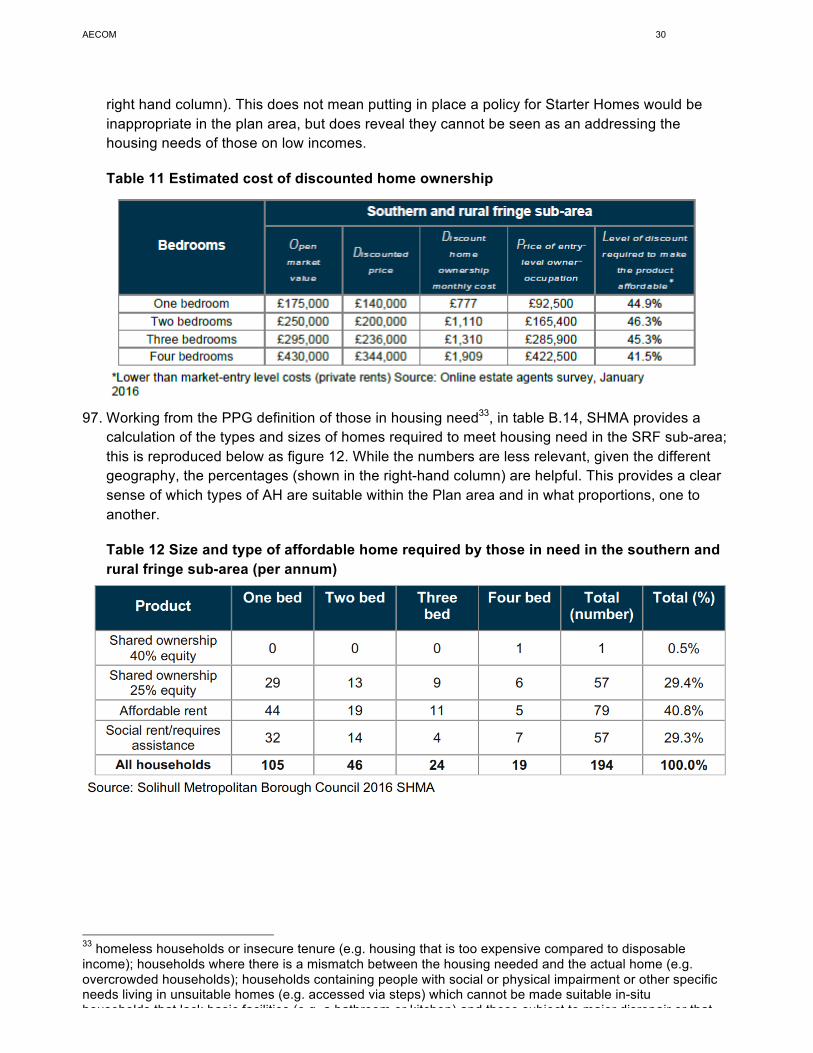
95. The SHMA interrogates the affordability of intermediate products further, seeking to identify
those housing tenures that satisfy the definition of affordable housing in national policy.32 SHMA table 3.5 (reproduced below as table 10) shows that 40% equity share shared ownership is more expensive than market entry rent for one, two and three bedroom homes in the SRF sub-area, and therefore could not be considered an AH. The reverse is true, however, for shared ownership housing with a 25% equity share as, in all cases, it is cheaper than market housing. A key finding is that, within the plan area, taking the SRF as a proxy, that the provision of shared equity properties, across all sizes of housing, is a suitable policy response to affordability issues.
Table 10 Estimated cost of shared ownership housing (monthly cost)
96. Using this test, the SHMA assesses whether discounted home ownership, for example the government’s ‘Starter Homes,’ programme, may be regarded as AH. SHMA table 3.6, reproduced as Table 11 below, shows that, given the government’s proposed discount of 20% all properties in the SRF would still exceed market-entry level rents by a significant margin (the
32 NFFP definitions
AECOM 30
February 2017
right hand column). This does not mean putting in place a policy for Starter Homes would be inappropriate in the plan area, but does reveal they cannot be seen as an addressing the housing needs of those on low incomes.
Table 11 Estimated cost of discounted home ownership
97. Working from the PPG definition of those in housing need33, in table B.14, SHMA provides a
calculation of the types and sizes of homes required to meet housing need in the SRF sub-area; this is reproduced below as figure 12. While the numbers are less relevant, given the different geography, the percentages (shown in the right-hand column) are helpful. This provides a clear sense of which types of AH are suitable within the Plan area and in what proportions, one to another.
Table 12 Size and type of affordable home required by those in need in the southern and rural fringe sub-area (per annum)
33 homeless households or insecure tenure (e.g. housing that is too expensive compared to disposable income); households where there is a mismatch between the housing needed and the actual home (e.g. overcrowded households); households containing people with social or physical impairment or other specific needs living in unsuitable homes (e.g. accessed via steps) which cannot be made suitable in-situ households that lack basic facilities (e.g. a bathroom or kitchen) and those subject to major disrepair or that are unfit for habitation; households containing people with particular social needs (e.g. escaping harassment) which cannot be resolved except through a move.
AECOM 31
February 2017
Housing Waiting List Data
98. SMBC has provided us with limited data as regards the housing waiting list. The list currently stands at 7,438, and those entries by people currently living the Plan area are as follows:
• With Dorridge & Hockley Heath Ward address: 70 • With Knowle Ward address: 79
99. The Council does not hold data on people in housing need looking to move to KDBH as they
operate a ‘choice based’ lettings scheme which does not require people to specify where they wish to live. Properties are advertised across the borough, and households can apply for these properties on an ad hoc basis.
100. Data is however available on the numbers of people who have taken social housing lets
living in the plan area; Social Housing lettings during the years 2013/14, 2014/15 & 2015/16 amounted to,
• Dorridge & Hockley Heath: 27 (20 Council; 7 Housing Association) • Knowle: 31 (16 Council; 15 Housing Association)
101. Given the large numbers of affordable housing across the borough, these are very small
numbers. As a proportion of all households on the register, the 149 households on the waiting list represent just 2% of all households. This reflects not only the affluence of the area, but also the limited availability of social housing.
Over-crowding
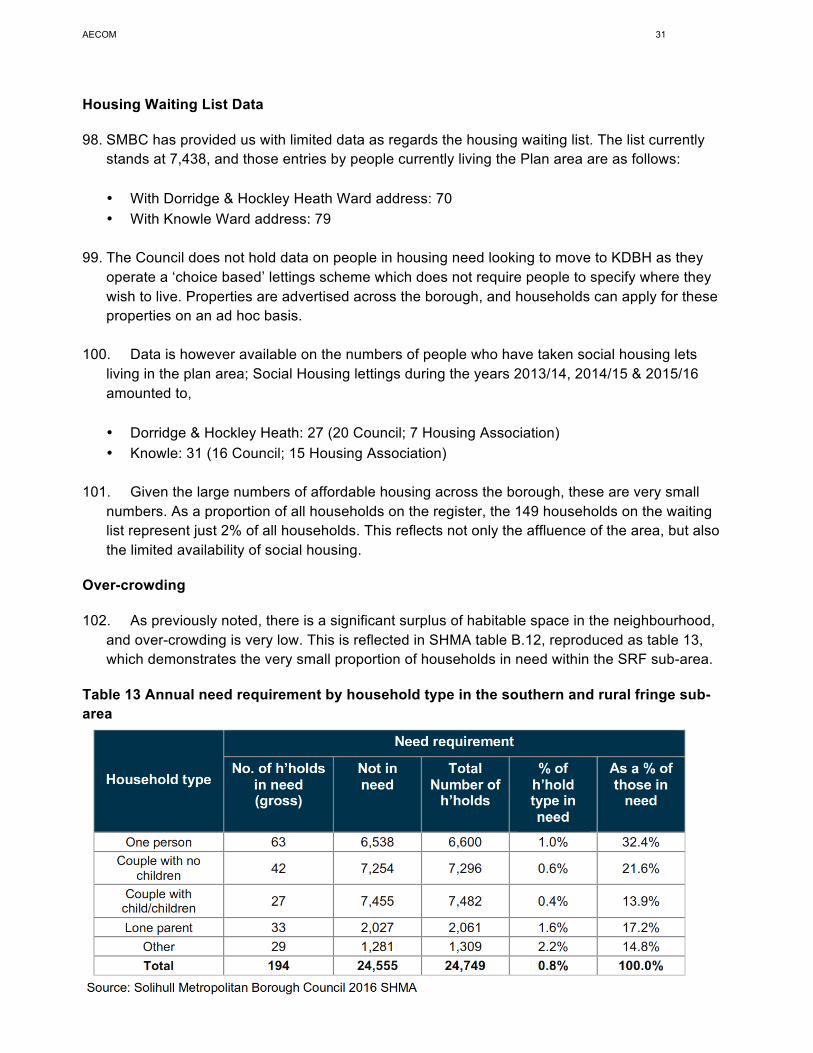
102. As previously noted, there is a significant surplus of habitable space in the neighbourhood, and over-crowding is very low. This is reflected in SHMA table B.12, reproduced as table 13, which demonstrates the very small proportion of households in need within the SRF sub-area.
Table 13 Annual need requirement by household type in the southern and rural fringe sub-area
AECOM 32
February 2017
103. The evidence available does not support the development of a separate target for affordable housing within the Neighbourhood Plan, but suggests reliance on policies set out at borough level will be adequate to deliver AH in accordance with the community’s needs.
104. So as to manage the presence of AH within the wider community, it is preferable for it not to be concentrated in one location, but pepper-potted in a 'tenure blind' manner across the neighbourhood.
Type and Size
105. Thus far, our research has revealed the family-oriented nature of the neighbourhood, approaching 30% of all households being families with children, and 71.1% falling into some form of family occupation. Feedback from local agents suggest that this category is relatively well catered for in terms of housing stock, and Census data backs up this picture.
106. As we have seen, there is however a large and growing proportion of older people in the population. In addition, the proportion of homes occupied by solo households is on the increase. This suggests an emerging mis-alignment between the types and sizes of homes available in the neighbourhood and the needs of the community. This second of these two groups reflects the trend, seen at the national level, towards people leaving marriage and starting a family later in life. There is a social argument in favour of developing policy that addresses the needs of this younger group. In line with KDBHNF’s stated thoughts on policy direction, a diversity of home types should be provided that allow people who wish to live alone to remain in the area; if they should then form a family and wish to live in KDBH, they would not need to up-root themselves and move back, as they would do if they had moved out, enabling them to preserve local family and friendship ties.
107. The question for policy is therefore the extent to which the community wishes to accommodate the needs of these groups, or feels this should be addressed elsewhere in the HMA. As we have seen, a bias towards smaller homes and making available forms of shared equity would offer a means of catering to their needs.
Housing for Older People
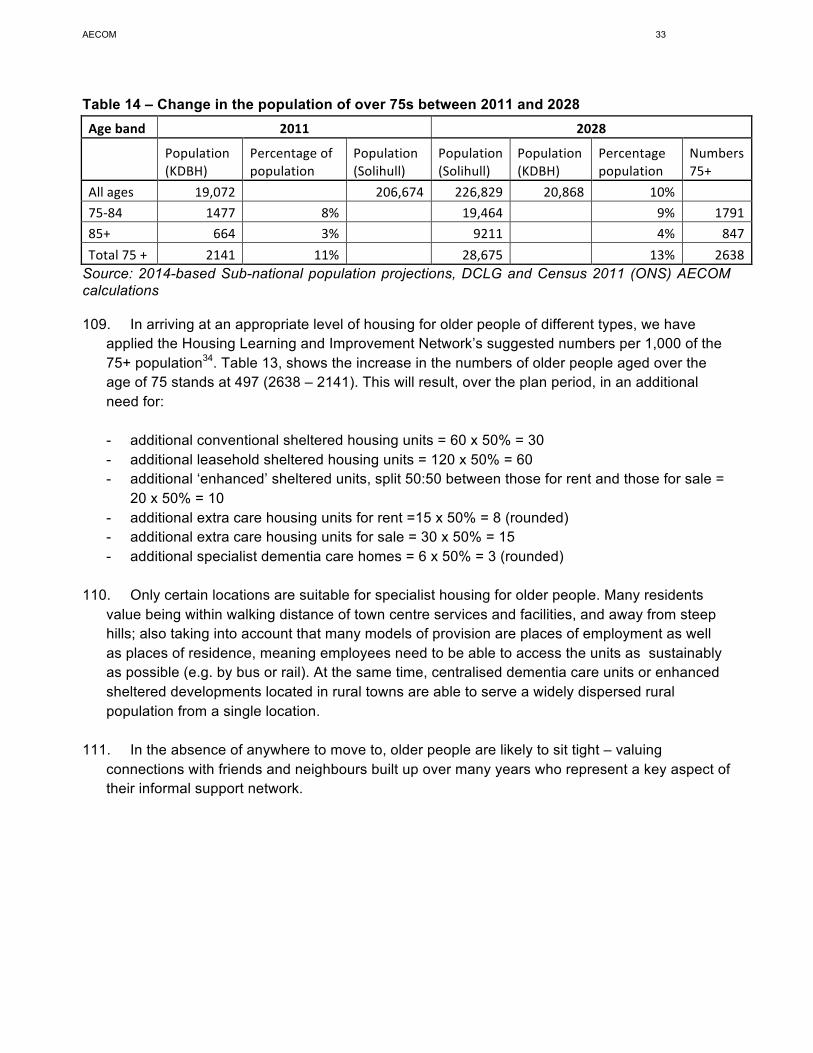
108. As we have seen, the current and emerging needs of older people are a priority for the plan area. It is therefore appropriate for policy to provide support for a significant quantum of sheltered and accessible housing as part and parcel of the delivery of new housing. This finding is supported by feedback from local agents who report significant demand for bungalows. Table 14 identifies the growth in the population of over 75s between 2011 and 2028.
AECOM 33
February 2017
Table 14 – Change in the population of over 75s between 2011 and 2028 Ageband 2011 2028
Population(KDBH)
Percentageofpopulation
Population(Solihull)
Population(Solihull)
Population(KDBH)
Percentagepopulation
Numbers75+
Allages 19,072 206,674 226,829 20,868 10% 75-84 1477 8% 19,464 9% 179185+ 664 3% 9211 4% 847Total75+ 2141 11% 28,675 13% 2638
Source: 2014-based Sub-national population projections, DCLG and Census 2011 (ONS) AECOM calculations 109. In arriving at an appropriate level of housing for older people of different types, we have
applied the Housing Learning and Improvement Network’s suggested numbers per 1,000 of the 75+ population34. Table 13, shows the increase in the numbers of older people aged over the age of 75 stands at 497 (2638 – 2141). This will result, over the plan period, in an additional need for:
- additional conventional sheltered housing units = 60 x 50% = 30 - additional leasehold sheltered housing units = 120 x 50% = 60 - additional ‘enhanced’ sheltered units, split 50:50 between those for rent and those for sale =
20 x 50% = 10 - additional extra care housing units for rent =15 x 50% = 8 (rounded) - additional extra care housing units for sale = 30 x 50% = 15 - additional specialist dementia care homes = 6 x 50% = 3 (rounded)
110. Only certain locations are suitable for specialist housing for older people. Many residents
value being within walking distance of town centre services and facilities, and away from steep hills; also taking into account that many models of provision are places of employment as well as places of residence, meaning employees need to be able to access the units as sustainably as possible (e.g. by bus or rail). At the same time, centralised dementia care units or enhanced sheltered developments located in rural towns are able to serve a widely dispersed rural population from a single location.
111. In the absence of anywhere to move to, older people are likely to sit tight – valuing
connections with friends and neighbours built up over many years who represent a key aspect of their informal support network.
34 Housing LIN (2011) Strategic Housing for Older People: Planning, designing and delivering housing that older people want, available online at: http://www.housinglin.org.uk/_library/Resources/Housing/SHOP/SHOPResourcePack.pdf
AECOM 34
February 2017
Market Signals
112. The PPG highlights the importance of taking market signals into account when assessing housing need, given they provide an indication of the balance between demand and supply. This is particularly important to consider given the significant and well-documented changes in the housing market over recent years, which were exacerbated by the economic downturn and subsequent issues in obtaining mortgage finance.
113. The PPG states: The housing need number suggested by household projections (the starting point) should be adjusted to reflect appropriate market signals, as well as other market indicators of the balance between the demand for and supply of homes. Prices rising faster than the national/local average may well indicate particular market undersupply relative to demand.35
114. These market signals relate to trends discernable within the housing market, and broader economic trends that have an impact on that market.
115. The PPG goes on to assert that where there is evidence of an imbalance in supply and
demand, an up-lift in planned housing numbers – compared to those derived solely from household projections – is required in order to increase the supply of housing to meet demand and tackle affordability issues:
This includes comparison with longer term trends (both in absolute levels and rates of change) in the: housing market area; similar demographic and economic areas; and nationally. A worsening trend in any of these indicators will require upward adjustment to planned housing numbers compared to ones based solely on household projections.
In areas where an upward adjustment is required, plan makers should set this adjustment at a level that is reasonable. The more significant the affordability constraints (as reflected in rising prices and rents, and worsening affordability ratio) and the stronger other indicators of high demand (e.g. the differential between land prices), the larger the improvement in affordability needed and, therefore, the larger the additional supply response should be.36
116. For the purposes of this study, we review the following market signals,
• Housing prices
• Volume of transactions
• Rate of development
• Over-crowding
• Employment trends
35 http://planningguidance.communities.gov.uk/blog/guidance/housing-and-economic-development-needs-assessments/methodology-assessing-housing-need/#paragraph_019 36 http://planningguidance.communities.gov.uk/blog/guidance/housing-and-economic-development-needs-assessments/methodology-assessing-housing-need/#paragraph_020
AECOM 35
February 2017
House prices
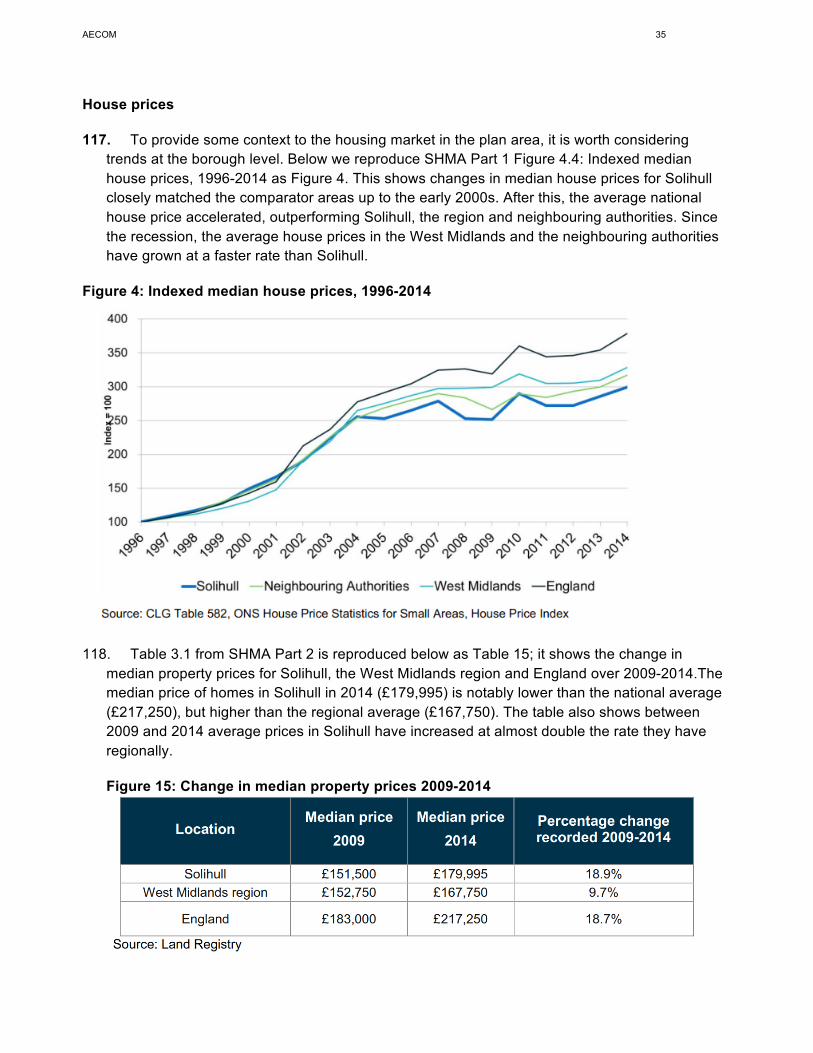
117. To provide some context to the housing market in the plan area, it is worth considering trends at the borough level. Below we reproduce SHMA Part 1 Figure 4.4: Indexed median house prices, 1996-2014 as Figure 4. This shows changes in median house prices for Solihull closely matched the comparator areas up to the early 2000s. After this, the average national house price accelerated, outperforming Solihull, the region and neighbouring authorities. Since the recession, the average house prices in the West Midlands and the neighbouring authorities have grown at a faster rate than Solihull.
Figure 4: Indexed median house prices, 1996-2014
118. Table 3.1 from SHMA Part 2 is reproduced below as Table 15; it shows the change in
median property prices for Solihull, the West Midlands region and England over 2009-2014.The median price of homes in Solihull in 2014 (£179,995) is notably lower than the national average (£217,250), but higher than the regional average (£167,750). The table also shows between 2009 and 2014 average prices in Solihull have increased at almost double the rate they have regionally.
Figure 15: Change in median property prices 2009-2014
AECOM 36
February 2017
119. From the data set out in the paragraphs above, we can conclude that the housing policy in the Plan area is being developed in the context of development pressure and high demand in the surrounding areas; this will in part explain the local authority has increased housing targets in the current review of the Local Plan.
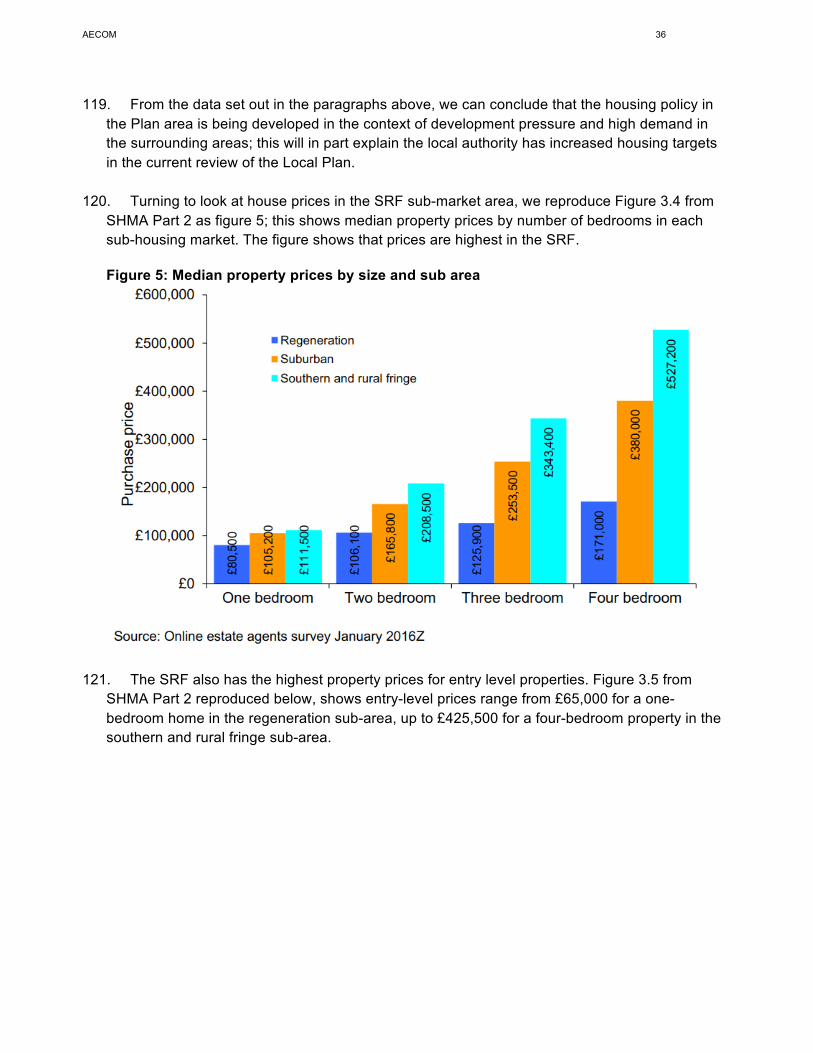
120. Turning to look at house prices in the SRF sub-market area, we reproduce Figure 3.4 from SHMA Part 2 as figure 5; this shows median property prices by number of bedrooms in each sub-housing market. The figure shows that prices are highest in the SRF.
Figure 5: Median property prices by size and sub area
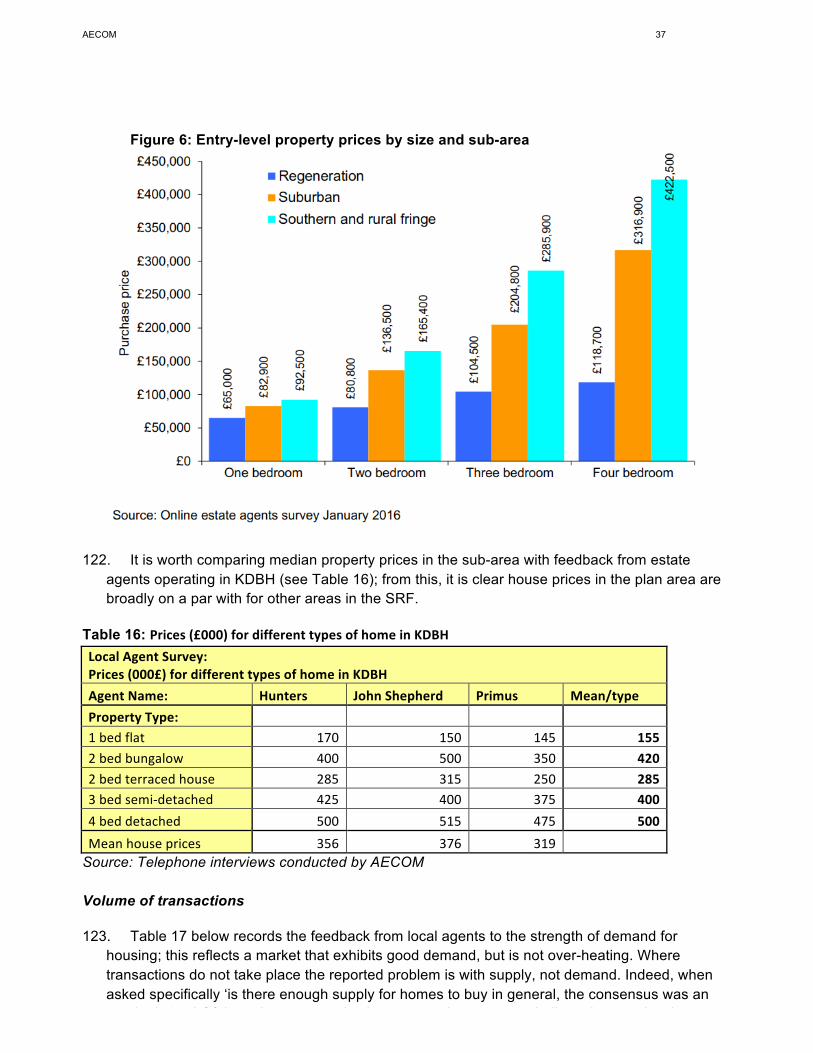
121. The SRF also has the highest property prices for entry level properties. Figure 3.5 from SHMA Part 2 reproduced below, shows entry-level prices range from £65,000 for a one-bedroom home in the regeneration sub-area, up to £425,500 for a four-bedroom property in the southern and rural fringe sub-area.
AECOM 37
February 2017
Figure 6: Entry-level property prices by size and sub-area
122. It is worth comparing median property prices in the sub-area with feedback from estate agents operating in KDBH (see Table 16); from this, it is clear house prices in the plan area are broadly on a par with for other areas in the SRF.
Table 16: Prices(£000)fordifferenttypesofhomeinKDBH LocalAgentSurvey:Prices(000£)fordifferenttypesofhomeinKDBHAgentName: Hunters JohnShepherd Primus Mean/typePropertyType: 1bedflat 170 150 145 1552bedbungalow 400 500 350 4202bedterracedhouse 285 315 250 2853bedsemi-detached 425 400 375 4004beddetached 500 515 475 500Meanhouseprices 356 376 319
Source: Telephone interviews conducted by AECOM Volume of transactions
123. Table 17 below records the feedback from local agents to the strength of demand for housing; this reflects a market that exhibits good demand, but is not over-heating. Where transactions do not take place the reported problem is with supply, not demand. Indeed, when asked specifically ‘is there enough supply for homes to buy in general, the consensus was an emphatic ‘no.’ Of those house-types in shortest supply, one agent indicated properties that
AECOM 38
February 2017
would enable older residents to down-size, such as bungalows and larger flats; the other two agents interviewed stated ‘2-3 bed semis’.
Table 17: Level of transactions in KDBH LocalAgentSurvey:HowhastheleveloftransactionsperformedinKDBHsince2014?Agentname: ResponseHunters Verysteady-12-15unitsamonth,neitherboomnorbustJohnShepherd Poorly-lackofstockPrimus Housingmarketisbuoyant;steadystreamoftransactions
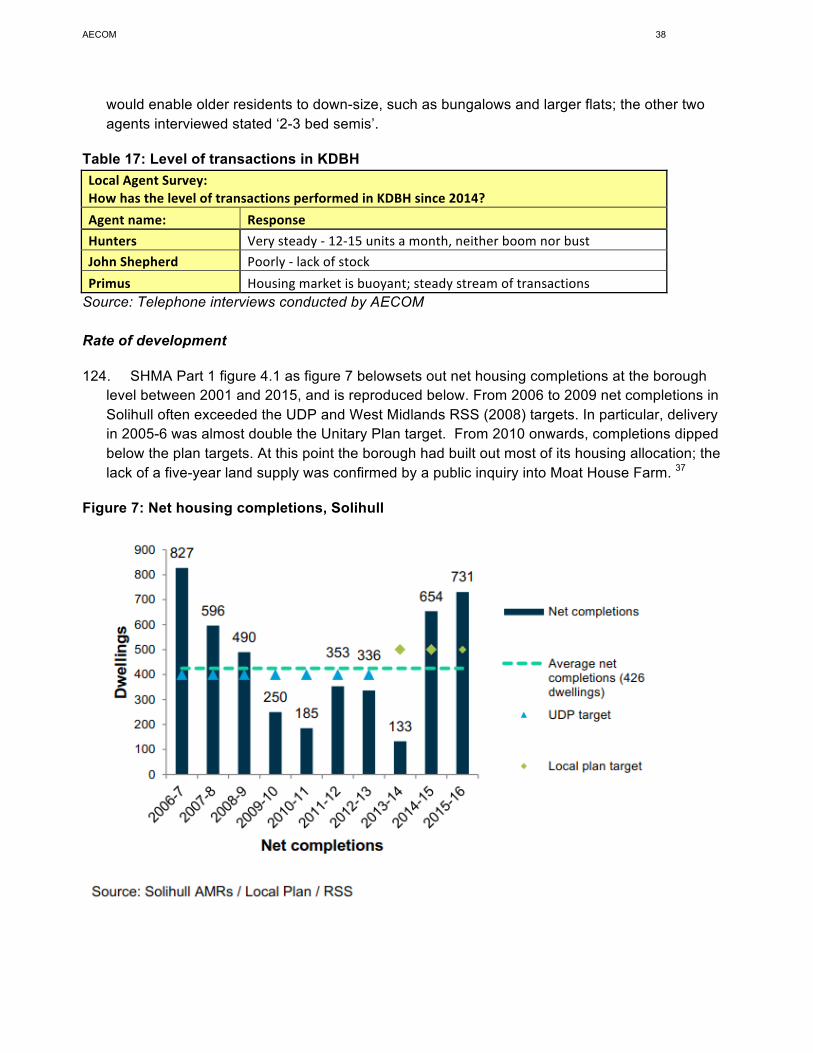
Source: Telephone interviews conducted by AECOM Rate of development
124. SHMA Part 1 figure 4.1 as figure 7 belowsets out net housing completions at the borough level between 2001 and 2015, and is reproduced below. From 2006 to 2009 net completions in Solihull often exceeded the UDP and West Midlands RSS (2008) targets. In particular, delivery in 2005-6 was almost double the Unitary Plan target. From 2010 onwards, completions dipped below the plan targets. At this point the borough had built out most of its housing allocation; the lack of a five-year land supply was confirmed by a public inquiry into Moat House Farm. 37
Figure 7: Net housing completions, Solihull
37 Planning Application reference: APP/Q4625/A/11/2157515
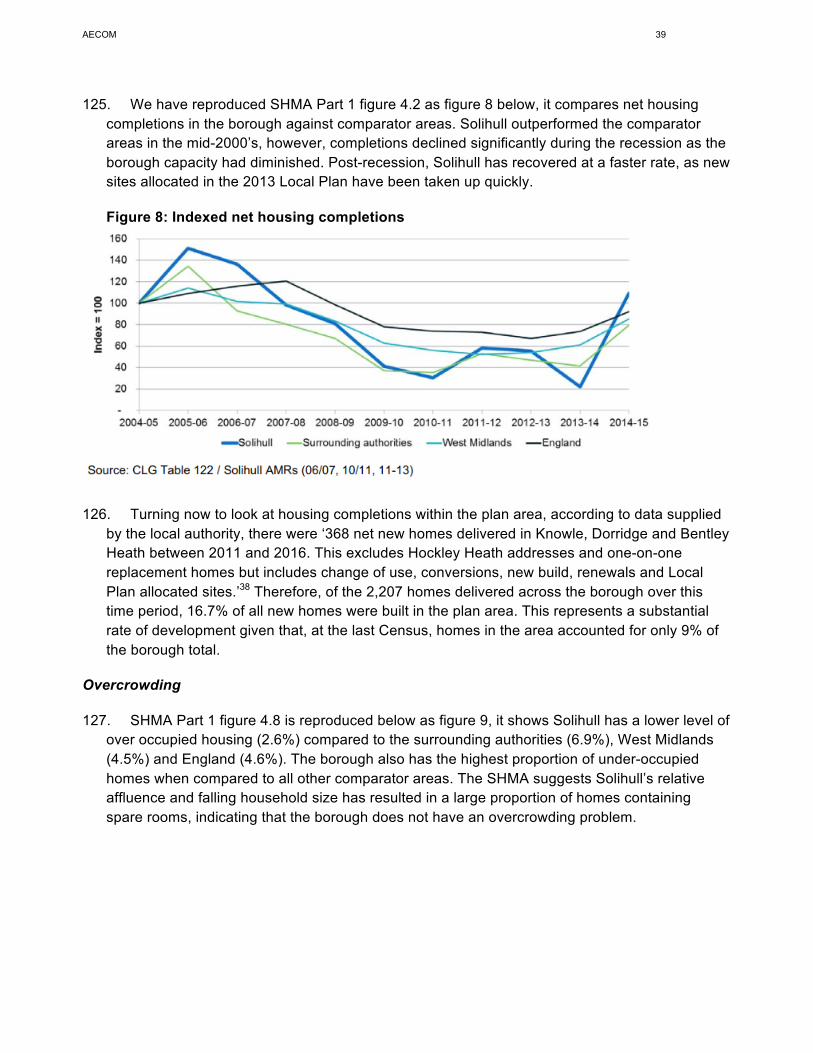
AECOM 39
February 2017
125. We have reproduced SHMA Part 1 figure 4.2 as figure 8 below, it compares net housing completions in the borough against comparator areas. Solihull outperformed the comparator areas in the mid-2000’s, however, completions declined significantly during the recession as the borough capacity had diminished. Post-recession, Solihull has recovered at a faster rate, as new sites allocated in the 2013 Local Plan have been taken up quickly.
Figure 8: Indexed net housing completions
126. Turning now to look at housing completions within the plan area, according to data supplied
by the local authority, there were ‘368 net new homes delivered in Knowle, Dorridge and Bentley Heath between 2011 and 2016. This excludes Hockley Heath addresses and one-on-one replacement homes but includes change of use, conversions, new build, renewals and Local Plan allocated sites.’38 Therefore, of the 2,207 homes delivered across the borough over this time period, 16.7% of all new homes were built in the plan area. This represents a substantial rate of development given that, at the last Census, homes in the area accounted for only 9% of the borough total.
Overcrowding
127. SHMA Part 1 figure 4.8 is reproduced below as figure 9, it shows Solihull has a lower level of over occupied housing (2.6%) compared to the surrounding authorities (6.9%), West Midlands (4.5%) and England (4.6%). The borough also has the highest proportion of under-occupied homes when compared to all other comparator areas. The SHMA suggests Solihull’s relative affluence and falling household size has resulted in a large proportion of homes containing spare rooms, indicating that the borough does not have an overcrowding problem.
38 Email, John Piltcher, Places Directorate, SMBC, email dated 13/02/17
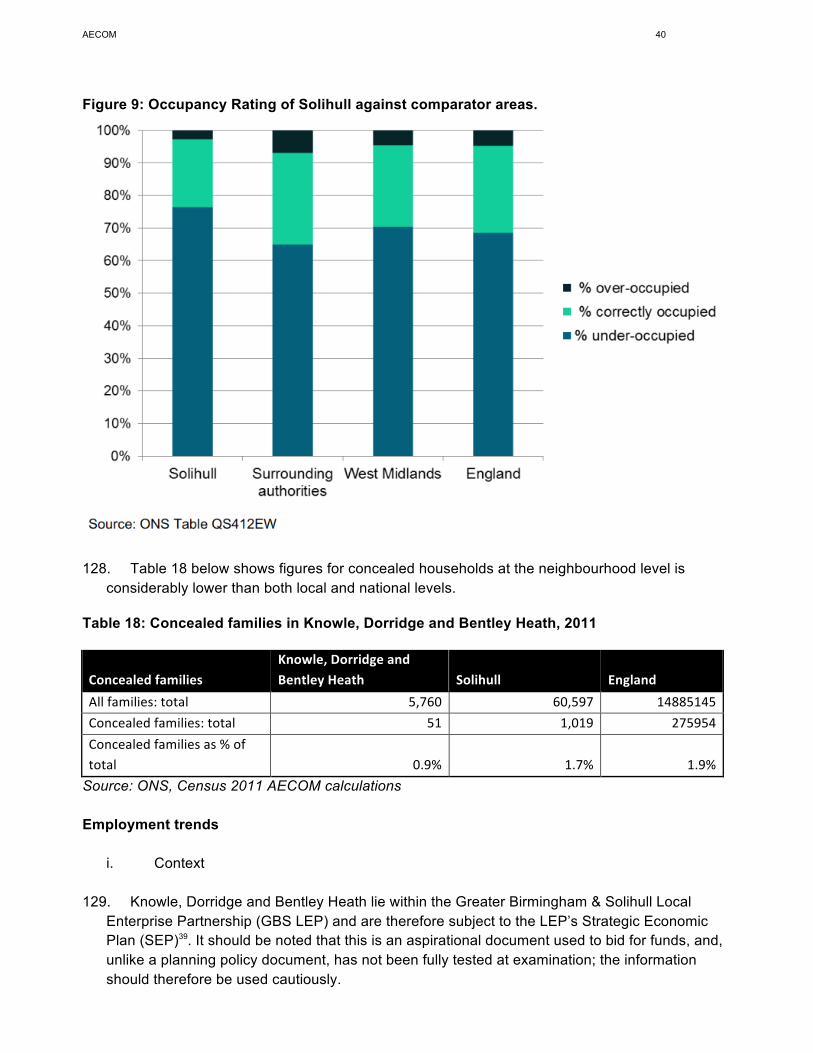
AECOM 40
February 2017
Figure 9: Occupancy Rating of Solihull against comparator areas.
128. Table 18 below shows figures for concealed households at the neighbourhood level is
considerably lower than both local and national levels.
Table 18: Concealed families in Knowle, Dorridge and Bentley Heath, 2011
ConcealedfamiliesKnowle,DorridgeandBentleyHeath Solihull England
Allfamilies:total 5,760 60,597 14885145Concealedfamilies:total 51 1,019 275954Concealedfamiliesas%oftotal 0.9% 1.7% 1.9%
Source: ONS, Census 2011 AECOM calculations Employment trends
i. Context
129. Knowle, Dorridge and Bentley Heath lie within the Greater Birmingham & Solihull Local Enterprise Partnership (GBS LEP) and are therefore subject to the LEP’s Strategic Economic Plan (SEP)39. It should be noted that this is an aspirational document used to bid for funds, and, unlike a planning policy document, has not been fully tested at examination; the information should therefore be used cautiously.
39 http://centreofenterprise.com/wp-content/uploads/2016/11/SEP-FINAL.pdf
AECOM 41
February 2017
130. The SEP 2016-2030 updates previous targets set in 2013. These new aims reflect the contribution that Greater Birmingham needs to make to achieve the ambitious goals set by the West Midlands Combined Authority (WMCA) for its three LEPs.
131. The aim of the SEP is create 250,000 jobs by 2030, growing economic output by £29 billion.
This SEP builds on a strong track record; earlier plans provided the basis for the delivery of the £275 million Enterprise Zone Investment Plan and the £379m Growth Deal, which funded a range of transport, housing and skills projects.
132. KDBH are also within an area known as UK Central (UKC). UKC contains a combination of
economic assets of national and regional importance including: Birmingham Airport, the NEC, Birmingham and Blythe Valley Business Parks, Jaguar Land Rover and Solihull Town Centre.
133. The area is connected nationally and internationally via important transport links such as
Birmingham Airport, Birmingham International rail station, Solihull rail station and the M42 motorway. Moreover, when HS2 is constructed, the area will be brought within a 40-minute journey time of central London.
134. UKC Masterplan showcases the development potential of the area up to 2040, outlining bold
measures to capitalise on the potential of the already successful gateway site. This includes delivering managed growth around four key locations; North Solihull, Solihull Town Centre, Blythe Valley Business Park; and The Hub – the epicenter of UKC which includes the NEC, airport, Birmingham Business Park and the proposed High Speed Rail station. All four of these locations are located within a 5 mile radius of the study area.
135. It’s estimated the UKC already supports 100,000 jobs region-wide, contributing £5.1 billion to
regional GDP. The masterplan predicts by 2040 that an additional 100,000 jobs could be created, boosting GDP by as much as £19.5 billion.
Local Economy 136. Part 2 of the Solihull SHMA40 provides a profile of the economic context of the area. The
report notes that Solihull has a higher job density than regional and national levels. In 2013, there were 0.87 jobs per working age person in Solihull, compared to 0.76 jobs per working age person across the West Midlands region, and 0.80 for England as a whole.
137. Solihull has also seen significant job growth in recent years. In 2014, there were 103,900
employee jobs in Solihull; this represented an increase of 12.9% from 2009. This increase compares to an increase of 4.8% for the region and an increase of 4.9% nationally over the same time period.
138. The 2011 census shows that of all Solihull residents in work (excluding those who are also
students), 62.6% are full-time employees, 22.9% are part-time employees and 14.5% are self-employed. Self-employment is most common in the SRF. In this sub-area, 17.8% of working residents are self-employed; this is higher than both the regional average of 14.2% and national equivalent of 15.7%. Solihull also has a low level of youth unemployment; 1.2% of 16-24 year
40http://www.solihull.gov.uk/Portals/0/Planning/LPR/SHMA_Part_2_Affordable_Housing_and_Housing_Mix_2016.pdf
AECOM 42
February 2017
olds in Solihull are unemployed compared to 1.4% at the regional level and 1.6% nationally. The level of long-term unemployed in Solihull is also low at 0.4%, compared to 0.7% in the West Midlands region and 0.4% for England.
139. The estimated mean gross annual household income in Solihull is £41,789, this is 23.9%
above the equivalent for the West Midlands metropolitan area (£31,792) and 12.7% above the national figure (£36,450). Households in the SRF are the most affluent in the whole of Solihull. This high mean household income could suggest a lower need for affordable housing. However rising incomes and a strong economy are frequently linked with an increase in house prices; this may actually result in unaffordability becoming a problem in the area.
140. In a recent housing and employment land availability assessment41, a number of local
property market agents and a representative from Solihull Council’s Strategic Land and Property division were consulted in order to obtain an informed understanding of the local housing and employment market across the Borough. A large disparity between sites to the north or south of the A45 was noted, the report states: “Settlements in the north of the Borough (i.e. Chemlsey Wood, Kingshurt and Smithswood) are more deprived and less desirable than settlements in the south (i.e. Solihull, Shirley, Knowle and Dorridge), where there is expected to be a high level of interest when sites are brought to the market.”
41 Solihull Strategic Housing and Employment Land Availability Assessment 2016 Volume A: Main Report (Peter Brett Associates, November 2016) http://www.solihull.gov.uk/Portals/0/Planning/LPR/Strategic_Housing_and_Employment_Land_Availability_Assessment_Vol_A.pdf
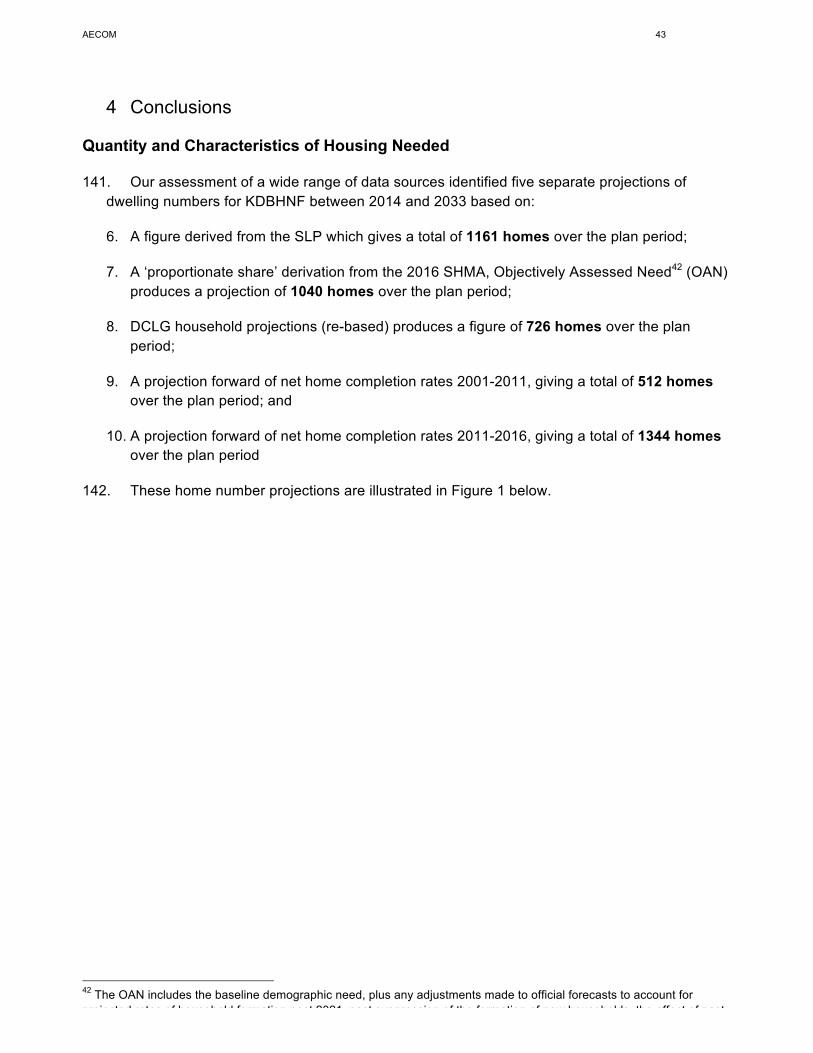
AECOM 43
February 2017
4 Conclusions
Quantity and Characteristics of Housing Needed
141. Our assessment of a wide range of data sources identified five separate projections of dwelling numbers for KDBHNF between 2014 and 2033 based on:
6. A figure derived from the SLP which gives a total of 1161 homes over the plan period;
7. A ‘proportionate share’ derivation from the 2016 SHMA, Objectively Assessed Need42 (OAN) produces a projection of 1040 homes over the plan period;
8. DCLG household projections (re-based) produces a figure of 726 homes over the plan period;
9. A projection forward of net home completion rates 2001-2011, giving a total of 512 homes over the plan period; and
10. A projection forward of net home completion rates 2011-2016, giving a total of 1344 homes over the plan period
142. These home number projections are illustrated in Figure 1 below.
42 The OAN includes the baseline demographic need, plus any adjustments made to official forecasts to account for projected rates of household formation post 2021, past suppression of the formation of new households, the effect of past under-supply, employment forecasts, market signals and affordable housing need (as set out in paragraph ID2a-004 of the NPPG).
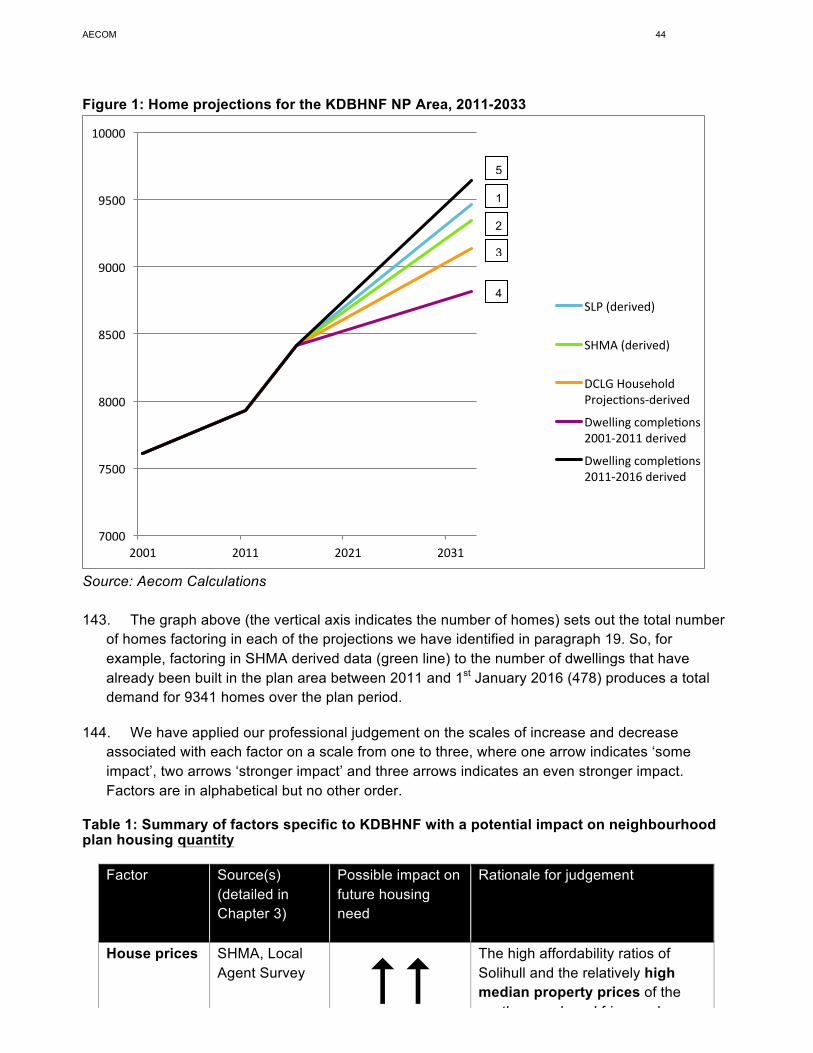
AECOM 44
February 2017
Figure 1: Home projections for the KDBHNF NP Area, 2011-2033
Source: Aecom Calculations 143. The graph above (the vertical axis indicates the number of homes) sets out the total number
of homes factoring in each of the projections we have identified in paragraph 19. So, for example, factoring in SHMA derived data (green line) to the number of dwellings that have already been built in the plan area between 2011 and 1st January 2016 (478) produces a total demand for 9341 homes over the plan period.
144. We have applied our professional judgement on the scales of increase and decrease associated with each factor on a scale from one to three, where one arrow indicates ‘some impact’, two arrows ‘stronger impact’ and three arrows indicates an even stronger impact. Factors are in alphabetical but no other order.
Table 1: Summary of factors specific to KDBHNF with a potential impact on neighbourhood plan housing quantity
Factor Source(s) (detailed in Chapter 3)
Possible impact on future housing need
Rationale for judgement
House prices SHMA, Local Agent Survey ##
The high affordability ratios of Solihull and the relatively high median property prices of the southern and rural fringe sub-area, suggests a modest up-lift in
7000
7500
8000
8500
9000
9500
10000
2001 2011 2021 2031
SLP(derived)
SHMA(derived)
DCLGHouseholdProjecAons-derived
DwellingcompleAons2001-2011derived
DwellingcompleAons2011-2016derived
1
2
3
4
5
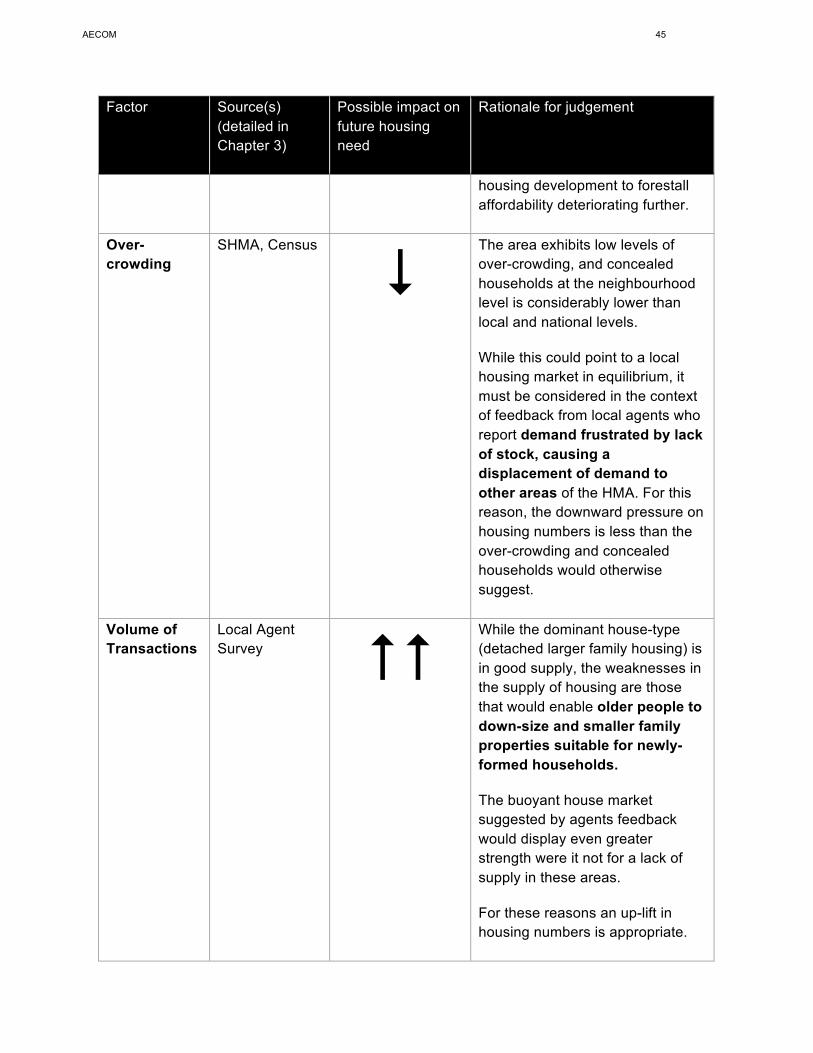
AECOM 45
February 2017
Factor Source(s) (detailed in Chapter 3)
Possible impact on future housing need
Rationale for judgement
housing development to forestall affordability deteriorating further.
Over-crowding
SHMA, Census
$ The area exhibits low levels of over-crowding, and concealed households at the neighbourhood level is considerably lower than local and national levels.
While this could point to a local housing market in equilibrium, it must be considered in the context of feedback from local agents who report demand frustrated by lack of stock, causing a displacement of demand to other areas of the HMA. For this reason, the downward pressure on housing numbers is less than the over-crowding and concealed households would otherwise suggest.
Volume of Transactions
Local Agent Survey ##
While the dominant house-type (detached larger family housing) is in good supply, the weaknesses in the supply of housing are those that would enable older people to down-size and smaller family properties suitable for newly-formed households.
The buoyant house market suggested by agents feedback would display even greater strength were it not for a lack of supply in these areas.
For these reasons an up-lift in housing numbers is appropriate.
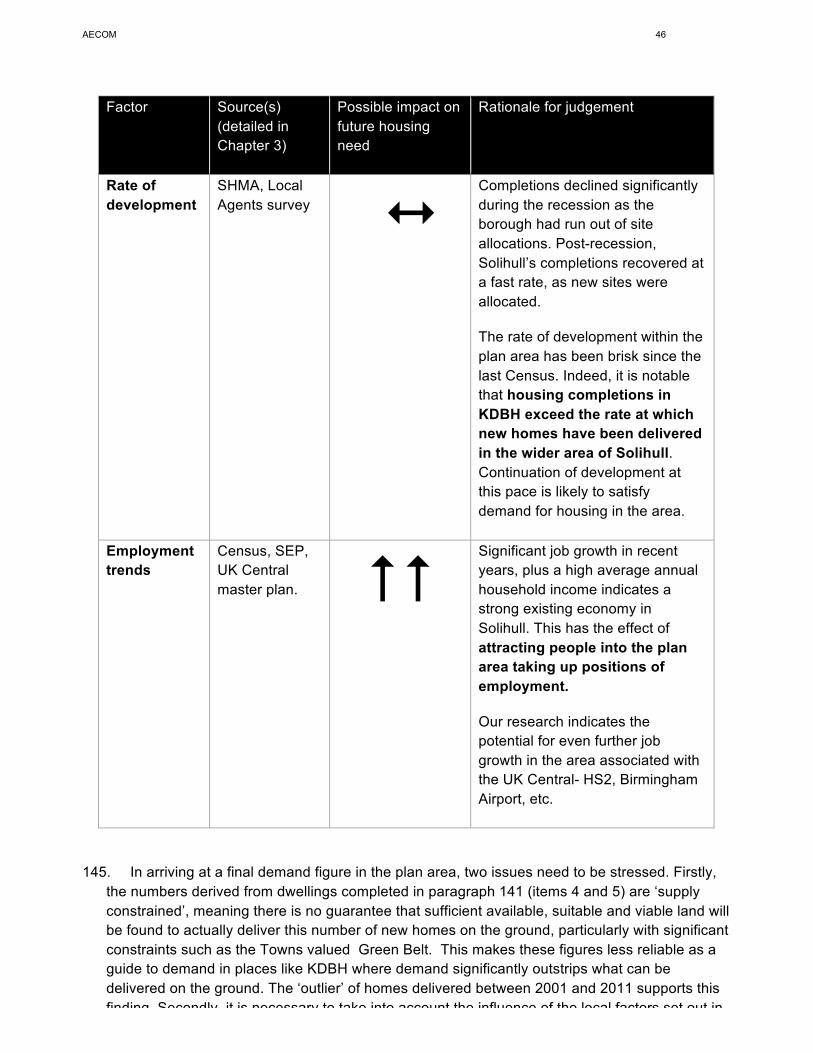
AECOM 46
February 2017
Factor Source(s) (detailed in Chapter 3)
Possible impact on future housing need
Rationale for judgement
Rate of development
SHMA, Local Agents survey 1
Completions declined significantly during the recession as the borough had run out of site allocations. Post-recession, Solihull’s completions recovered at a fast rate, as new sites were allocated.
The rate of development within the plan area has been brisk since the last Census. Indeed, it is notable that housing completions in KDBH exceed the rate at which new homes have been delivered in the wider area of Solihull. Continuation of development at this pace is likely to satisfy demand for housing in the area.
Employment trends
Census, SEP, UK Central master plan. ##
Significant job growth in recent years, plus a high average annual household income indicates a strong existing economy in Solihull. This has the effect of attracting people into the plan area taking up positions of employment.
Our research indicates the potential for even further job growth in the area associated with the UK Central- HS2, Birmingham Airport, etc.
145. In arriving at a final demand figure in the plan area, two issues need to be stressed. Firstly, the numbers derived from dwellings completed in paragraph 141 (items 4 and 5) are ‘supply constrained’, meaning there is no guarantee that sufficient available, suitable and viable land will be found to actually deliver this number of new homes on the ground, particularly with significant constraints such as the Towns valued Green Belt. This makes these figures less reliable as a guide to demand in places like KDBH where demand significantly outstrips what can be delivered on the ground. The ‘outlier’ of homes delivered between 2001 and 2011 supports this finding. Secondly, it is necessary to take into account the influence of the local factors set out in Table 1.
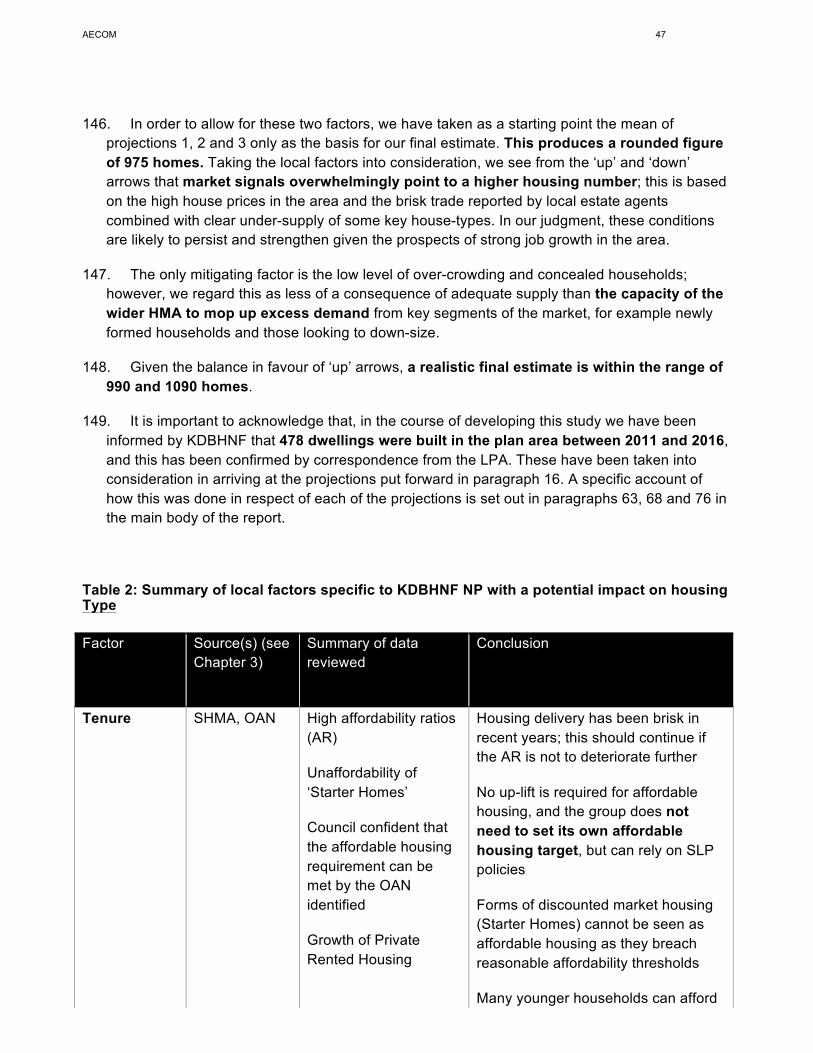
AECOM 47
February 2017
146. In order to allow for these two factors, we have taken as a starting point the mean of
projections 1, 2 and 3 only as the basis for our final estimate. This produces a rounded figure of 975 homes. Taking the local factors into consideration, we see from the ‘up’ and ‘down’ arrows that market signals overwhelmingly point to a higher housing number; this is based on the high house prices in the area and the brisk trade reported by local estate agents combined with clear under-supply of some key house-types. In our judgment, these conditions are likely to persist and strengthen given the prospects of strong job growth in the area.
147. The only mitigating factor is the low level of over-crowding and concealed households;
however, we regard this as less of a consequence of adequate supply than the capacity of the wider HMA to mop up excess demand from key segments of the market, for example newly formed households and those looking to down-size.
148. Given the balance in favour of ‘up’ arrows, a realistic final estimate is within the range of
990 and 1090 homes.
149. It is important to acknowledge that, in the course of developing this study we have been informed by KDBHNF that 478 dwellings were built in the plan area between 2011 and 2016, and this has been confirmed by correspondence from the LPA. These have been taken into consideration in arriving at the projections put forward in paragraph 16. A specific account of how this was done in respect of each of the projections is set out in paragraphs 63, 68 and 76 in the main body of the report.
Table 2: Summary of local factors specific to KDBHNF NP with a potential impact on housing Type Factor Source(s) (see
Chapter 3) Summary of data reviewed
Conclusion
Tenure SHMA, OAN High affordability ratios (AR)
Unaffordability of ‘Starter Homes’
Council confident that the affordable housing requirement can be met by the OAN identified
Growth of Private Rented Housing
Housing delivery has been brisk in recent years; this should continue if the AR is not to deteriorate further
No up-lift is required for affordable housing, and the group does not need to set its own affordable housing target, but can rely on SLP policies
Forms of discounted market housing (Starter Homes) cannot be seen as affordable housing as they breach reasonable affordability thresholds
Many younger households can afford market housing to rent, but not to buy
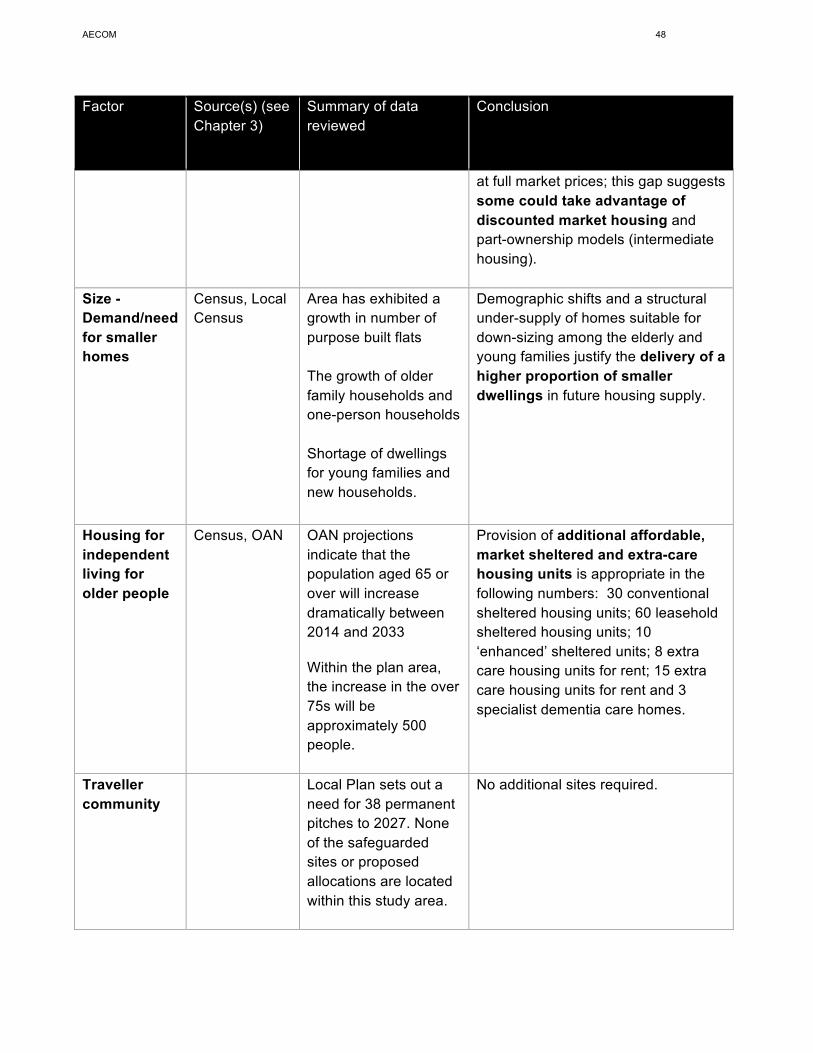
AECOM 48
February 2017
Factor Source(s) (see Chapter 3)
Summary of data reviewed
Conclusion
at full market prices; this gap suggests some could take advantage of discounted market housing and part-ownership models (intermediate housing).
Size - Demand/need for smaller homes
Census, Local Census
Area has exhibited a growth in number of purpose built flats The growth of older family households and one-person households Shortage of dwellings for young families and new households.
Demographic shifts and a structural under-supply of homes suitable for down-sizing among the elderly and young families justify the delivery of a higher proportion of smaller dwellings in future housing supply.
Housing for independent living for older people
Census, OAN OAN projections indicate that the population aged 65 or over will increase dramatically between 2014 and 2033
Within the plan area, the increase in the over 75s will be approximately 500 people.
Provision of additional affordable, market sheltered and extra-care housing units is appropriate in the following numbers: 30 conventional sheltered housing units; 60 leasehold sheltered housing units; 10 ‘enhanced’ sheltered units; 8 extra care housing units for rent; 15 extra care housing units for rent and 3 specialist dementia care homes.
Traveller community
Local Plan sets out a need for 38 permanent pitches to 2027. None of the safeguarded sites or proposed allocations are located within this study area.
No additional sites required.
AECOM 49
February 2017
Recommendations for next steps
150. This neighbourhood plan housing needs advice has aimed to provide KDBHNF with evidence on housing trends from a range of sources. We recommend that the Neighbourhood Forum should, as a next step undertake a site allocations study that identifies where it is, and where it is not, possible to build. This would provide an appropriate evidence base for policies seeking to manage the overall quantum of new housing.,
151. In addition, the Forum should discuss the contents and conclusions with SMBC with a view to agreeing and formulating draft housing policies, in particular the appropriate approach to identifying the level of need for new housing in the NP area, bearing the following in mind:
• Neighbourhood Planning Basic Condition E, which is the need for the neighbourhood plan to
be in general conformity with the adopted strategic local policies; • the views of SMBC – in particular in relation to the housing need figure that should be adopted; • the views of local residents (gathered together in the form of a Consultation Statement); • the views of other relevant local stakeholders, including housing developers; and • the numerous supply-side considerations, including local environmental constraints, the
location and characteristics of suitable land, and any capacity work carried out by the SMBC, including but not limited to the SHLAA
• the recommendations and findings of this study. 152. Recent changes to the planning system, forthcoming changes to the NPPF in the wake of
the Housing White Paper, as well as the implementation of the Housing and Planning Act, will continue to affect housing policies at a local authority and, by extension, a neighbourhood level.
153. This advice note has been provided in good faith by AECOM consultants on the basis of
housing data and national guidance current at the time of writing (alongside other relevant and available information).
154. Bearing this in mind, we recommend that the steering group should monitor carefully strategies
and documents with an impact on housing policy produced by the Borough Council or any other relevant body and review the neighbourhood plan accordingly to ensure that general conformity is maintained.
155. At the same time, monitoring ongoing demographic or other trends in the factors summarised in
Tables 1 and 2 would be particularly valuable.

AECOM (NYSE: ACM) is a global provider of professional technical and management support services to a broad range of markets, including transportation, facilities, environmental, energy, water and government. With approximately 45,000 employees around the world, AECOM is a leader in all of the key markets that it serves. AECOM provides a blend of global reach, local knowledge, innovation, and collaborative technical excellence in delivering solutions that enhance and sustain the world’s built, natural, and social environments. A Fortune 500 company, AECOM serves KDBHNFs in more than 100 countries and has annual revenue in excess of $6 billion. More information on AECOM and its services can be found at www.aecom.com.
Aldgate Tower, 2 Leman Street, London E1 8FA, United Kingdom T +44-207-798-5000
Copyright © 2022 FDOKUMEN