
Hot workability analysis of extruded AZ magnesium alloys with processing maps
10
Materials Science and Engineering A 527 (2010) 735–744 Contents lists available at ScienceDirect Materials Science and Engineering A journal homepage: www.elsevier.com/locate/msea Hot workability analysis of extruded AZ magnesium alloys with processing maps F.A. Slooff ∗ , J.S. Dzwonczyk, J. Zhou, J. Duszczyk, L. Katgerman Department of Materials Science and Engineering, Delft University of Technology, Mekelweg 2, 2628 CD Delft, The Netherlands article info Article history: Received 18 January 2009 Received in revised form 21 August 2009 Accepted 26 August 2009 Keywords: Hot working Processing maps Magnesium alloy Hot deformation Compression testing Dynamic recrystallization abstract The processing conditions applied to deform wrought magnesium alloys greatly affect their final microstructure and mechanical properties. Defining an applicable processing window in terms of the ranges of temperatures and strain rates to achieve a homogeneous microstructure is a prerequisite for process optimization, since magnesium alloys show a peculiar deformation behaviour. By using trustwor- thy input data from uniaxial hot compression tests, processing maps were constructed for the alloys AZ41, AZ61 and AZ80. These maps clearly indicate the conditions leading to dynamically recrystallized homo- geneous microstructures after hot deformation, as verified by analysing the microstructures after hot deformation under different conditions. It is found that a strain rate of 5 s −1 and a temperature of 375 ◦ C for AZ41 and 325 ◦ C for both AZ61 and AZ80 would result in dynamically recrystallized homogeneous microstructures. © 2009 Elsevier B.V. All rights reserved. 1. Introduction The combination of low density and moderate strength makes wrought magnesium alloys well suited for applications where weight is of critical importance. Several attempts have been made to search for optimum deformation conditions for wrought magne- sium alloys [1–5], since the unfavourable deformation behaviour of magnesium at ambient temperature causes difficulties as a result of its hexagonal close packed crystal structure, leading to limited slip systems. Processing magnesium alloys at elevated tempera- tures enables the activation of non-basal slip systems. Coupling the processing conditions such as deformation rate and temperature to a desired microstructure is a valuable approach to deformation process optimization and this can be achieved by using processing maps. Processing maps have been proven to be a useful tool for the optimization of hot working processes for a wide range of met- als and their alloys [6–8], or for the design of process parameters for new materials. It is helpful in identifying different deformation mechanisms within different domains. As a product of the dynamic materials model [9], it combines the efficiency of power dissipation and the instability of deformation. The dissipated power is related to the rate of internal entropy production due to the metallurgical processes involved and the partitioning of the total power between that due to the temperature rise and that due to microstructural ∗ Corresponding author. Tel.: +31 6 1805 0603; fax: +31 1 5278 6730. E-mail address: [email protected] (F.A. Slooff). changes. Strain rate sensitivity is considered a power partitioning factor [10]. The efficiency of power dissipation with respect to the linear dissipator is given by: = 2m m + 1 (1) in which m is the strain rate sensitivity. Plotting the efficiency (in %) against temperature and strain rate at different strains results in the power dissipation maps, which can be seen as 3D surfaces; an increase of efficiency will result in the development of a hill. Above a threshold of efficiency, the area can be denoted as “safe” and such mechanisms as dynamic recrystallization, dynamic recov- ery or super plastic deformation may operate. The verification of this area needs to be done using optical microscopy. On the other hand, the valleys represent “damaging” microstructural changes, such as void formation, wedge cracking, intercrystalline cracking and other types of cracking. The instability map is developed on the basis of an instability criterion and given by a dimensionless parameter : = ∂(ln(m/m + 1) ∂ ln ˙ ¯ ε + m ≤ 0. (2) When turns negative under specific temperature and strain rate conditions, flow instabilities like adiabatic shear bands or flow localization can be observed in the microstructure. The physical meaning of Eq. (2) is that if the system is unable to generate entropy at a rate that at least matches with the imposed rate, it will localize the flow and cause flow instability. Superimposing an instability map on a power dissipation effi- ciency map produces a processing map. The instability map shows 0921-5093/$ – see front matter © 2009 Elsevier B.V. All rights reserved. doi:10.1016/j.msea.2009.08.070
-
Upload
independent -
Category
Documents
-
view
0 -
download
0
Transcript of Hot workability analysis of extruded AZ magnesium alloys with processing maps

H
FD
a
ARRA
KHPMHCD
1
wwtsmostptpm
oafmmatpt
0d
Materials Science and Engineering A 527 (2010) 735–744
Contents lists available at ScienceDirect
Materials Science and Engineering A
journa l homepage: www.e lsev ier .com/ locate /msea
ot workability analysis of extruded AZ magnesium alloys with processing maps
.A. Slooff ∗, J.S. Dzwonczyk, J. Zhou, J. Duszczyk, L. Katgermanepartment of Materials Science and Engineering, Delft University of Technology, Mekelweg 2, 2628 CD Delft, The Netherlands
r t i c l e i n f o
rticle history:eceived 18 January 2009eceived in revised form 21 August 2009ccepted 26 August 2009
a b s t r a c t
The processing conditions applied to deform wrought magnesium alloys greatly affect their finalmicrostructure and mechanical properties. Defining an applicable processing window in terms of theranges of temperatures and strain rates to achieve a homogeneous microstructure is a prerequisite forprocess optimization, since magnesium alloys show a peculiar deformation behaviour. By using trustwor-thy input data from uniaxial hot compression tests, processing maps were constructed for the alloys AZ41,
eywords:ot workingrocessing mapsagnesium alloyot deformation
AZ61 and AZ80. These maps clearly indicate the conditions leading to dynamically recrystallized homo-geneous microstructures after hot deformation, as verified by analysing the microstructures after hotdeformation under different conditions. It is found that a strain rate of 5 s−1 and a temperature of 375 ◦Cfor AZ41 and 325 ◦C for both AZ61 and AZ80 would result in dynamically recrystallized homogeneousmicrostructures.
ompression testingynamic recrystallization
. Introduction
The combination of low density and moderate strength makesrought magnesium alloys well suited for applications whereeight is of critical importance. Several attempts have been made
o search for optimum deformation conditions for wrought magne-ium alloys [1–5], since the unfavourable deformation behaviour ofagnesium at ambient temperature causes difficulties as a result
f its hexagonal close packed crystal structure, leading to limitedlip systems. Processing magnesium alloys at elevated tempera-ures enables the activation of non-basal slip systems. Coupling therocessing conditions such as deformation rate and temperatureo a desired microstructure is a valuable approach to deformationrocess optimization and this can be achieved by using processingaps.Processing maps have been proven to be a useful tool for the
ptimization of hot working processes for a wide range of met-ls and their alloys [6–8], or for the design of process parametersor new materials. It is helpful in identifying different deformation
echanisms within different domains. As a product of the dynamicaterials model [9], it combines the efficiency of power dissipation
nd the instability of deformation. The dissipated power is relatedo the rate of internal entropy production due to the metallurgicalrocesses involved and the partitioning of the total power betweenhat due to the temperature rise and that due to microstructural
∗ Corresponding author. Tel.: +31 6 1805 0603; fax: +31 1 5278 6730.E-mail address: [email protected] (F.A. Slooff).
921-5093/$ – see front matter © 2009 Elsevier B.V. All rights reserved.oi:10.1016/j.msea.2009.08.070
© 2009 Elsevier B.V. All rights reserved.
changes. Strain rate sensitivity is considered a power partitioningfactor [10]. The efficiency of power dissipation � with respect to thelinear dissipator is given by:
� = 2m
m + 1(1)
in which m is the strain rate sensitivity. Plotting the efficiency (in%) against temperature and strain rate at different strains resultsin the power dissipation maps, which can be seen as 3D surfaces;an increase of efficiency will result in the development of a hill.Above a threshold of efficiency, the area can be denoted as “safe”and such mechanisms as dynamic recrystallization, dynamic recov-ery or super plastic deformation may operate. The verification ofthis area needs to be done using optical microscopy. On the otherhand, the valleys represent “damaging” microstructural changes,such as void formation, wedge cracking, intercrystalline crackingand other types of cracking.
The instability map is developed on the basis of an instabilitycriterion and given by a dimensionless parameter �:
� = ∂(ln(m/m + 1)
∂ ln ˙ε+ m ≤ 0. (2)
When � turns negative under specific temperature and strain rateconditions, flow instabilities like adiabatic shear bands or flowlocalization can be observed in the microstructure. The physical
meaning of Eq. (2) is that if the system is unable to generate entropyat a rate that at least matches with the imposed rate, it will localizethe flow and cause flow instability.Superimposing an instability map on a power dissipation effi-ciency map produces a processing map. The instability map shows

7 and Engineering A 527 (2010) 735–744
tsTmItaw
oasdsTva0tSstp[vhwmflmat
wtttomwAur
ocTasTi(at
2
sMXApbet
Table 1Chemical compositions of the alloys (wt.%) investigated.
Al Zn Mn Si Mg
men and the cylindrical tungsten carbide anvils to minimize frictionduring the test. The specimen was resistance-heated at a rate of10 ◦C/s and soaked at a preset temperature for 75–90 s to allowtemperature to equalize. Fig. 1 shows the test chamber of the ther-momechanical simulator prior to testing.
36 F.A. Slooff et al. / Materials Science
he areas that will cause flow instability, whereas the power dis-ipation map shows the most efficient power dissipation areas.herefore, the combined areas (or domains) represent variousicrostructural changes, which can be safe, damaging or transitory.
n the case of a transitory area, the term bifurcation is generally usedo describe it. It is not linked to any specific domain but representsqualitative change in the system dynamics, which is associatedith a change in the topology of a processing map.
The processing maps constructed for magnesium alloys in mostf the current literature concern specific alloys and cover onlylimited range of strains [11]. In the case of wrought magne-
ium alloys, strain is significant for reliable hot workability analysisue to the occurrence of dynamic recrystallization (DRX), whichtrongly influences the mechanical response to deformation [12].he processing maps developed by Sivakesavam [3] and Srini-asan [7], for example, were based on the flow stress data of ZM21nd magnesium alloys containing 3 wt.% Al at a strain of 0.4 and.5, respectively. At these strains and strain rates beyond 10 s−1,he flow stresses are not fully in the steady state. Furthermore,rinivasan used isothermal compression tests without furtherpecification. While others did specify their methods for (adiabatic)emperature correction, the methods are inferior to the point-to-oint (PPI) temperature correction method described elsewhere13]. This accuracy is of importance, because at moderately ele-ated temperatures the temperature rise during deformation atigh strain rates can exceed 80 ◦C and this temperature increaseill lower the measured flow stress and the conventional linearethod for temperature correction will overestimate the corrected
ow stress. Correcting the measured flow stress to obtain isother-al flow stress data according to the PPI method leads to more
ccurate constitutive constants and activation energy for deforma-ion in constitutive equations.
The Mg–Al–Zn alloy system is the most widely investigated one,ith emphasis on the alloy having 3 wt% Al and 1 wt% Zn. Expanding
he research to alloys having higher alloying contents will con-ribute to the overall knowledge of the deformation behaviour ofhis promising alloy system. In previous investigations [11,14–15]n the workability of wrought magnesium alloys in this system,ainly alloys with relatively low alloying contents such as AZ31ere analysed. The preceding research on the processing map forZ31 concerned the as-cast alloy hot-compressed at strain ratesp to 100 s−1 [11] and the extruded alloy hot-compressed at strainates up to 10 s−1 [15].
In the present research, three alloys with increasing amountsf Al up to 8 wt% Al were subjected to investigation in order tolarify the influence of the alloying content on the hot workability.he alloys were in the as-extruded condition and the strain ratespplied were up to 100 s−1 as may be locally encountered in extru-ion. Comparisons with the processing maps of AZ31 were made.he objectives of the present research were to obtain the process-ng maps for selected wrought magnesium alloys in the AZ groupAl and Zn containing) at different strains, using reliable input data,nd to determine optimum windows for the forming processing ofhese alloys.
. Experimental details
Three wrought magnesium alloys subjected to hot compres-ion tests were Mg–Al4–Zn1 (AZ41), Mg–Al6–Zn1 (AZ61) andg–Al8–Zn0.5 (AZ80). Their compositions were determined using-ray fluorescence spectrometry and are given in Table 1. Although
Z80 has a reduced Zn content compared to the other two alloys,revious research [16] indicates that variation of the Zn contentelow 1 wt.% will not significantly influence the mechanical prop-rties and the difference in the Zn content between the alloys canherefore be neglected. The alloys were supplied in the form ofMg–Al4–Zn1 (AZ41) 4.76 0.85 0.32 0.01 Bal.Mg–Al6–Zn1 (AZ61) 5.6 0.81 0.18 0.08 Bal.Mg–Al8–Zn0.5 (AZ80) 7.81 0.44 0.23 0.03 Bal.
cylindrically shaped cast ingots by Dead Sea Magnesium, Israel.These ingots were machined from a diameter of 74 mm to a diame-ter of 48 mm and cut to a length of 200 mm for extrusion. Extrusionwas carried out at a ram speed of 1.5 mm/s using a 2.5 MN extrusionpress with the container and die both preheated to 350 ◦C. Prior toextrusion, billets were preheated to 400 ◦C for 1 h. The die havingan orifice diameter of 15.8 mm led to a reduction of 10:1 and tothe dimensions of an extruded bar suitable for making hot com-pression specimens. Moreover, the extrusion process brought thematerials to the same as-extruded metallurgical state. The cylindri-cal specimens used for compression testing were machined fromthe extruded bar to a height of 12 mm and a diameter of 10 mm. Thetesting temperature for AZ41 was varied between 250 and 500 ◦Cwith an interval of 50 ◦C. For AZ61, the temperature range was from250 to 450 ◦C with an interval of 50 ◦C, while for AZ80 the tem-perature range was between 300 and 375 ◦C with an interval of25 ◦C. The reason for these differences will be clarified later. For allthe alloys, the strain rate was varied over a range of 0.01–100 s−1,with increment by one order of magnitude. Compression tests werecarried out up to a true strain of 1.0.
For hot uniaxial compression tests, a Gleeble 3800 thermome-chanical simulator was used. The specimen chamber was twiceevacuated to 1013 mbar below ambient pressure and flushed withnitrogen prior to heating and kept at a reduced pressure of 169 mbarbelow ambient pressure to limit the oxidation of the specimen dur-ing the test. A thermocouple was welded on the surface of thespecimen at the mid height for temperature control. A graphitesheet and nickel-containing paste were applied between the speci-
Fig. 1. Close-up view of the testing chamber with the specimen (1) put in place bythe specimen holder (2), which retracts prior to testing. Before testing, the anvils (3)clamp the specimen and the thermocouples (4) are used for temperature control.After testing, the nozzles (5) located on both sides of the main axis allow quenchingusing forced air.

and E
rirtsm(wat
bodIoa
msc3auebEm
A
nn
F.A. Slooff et al. / Materials Science
After deformation, the specimen was quenched by forced air tooom temperature and removed from the test chamber. The spec-men was cleaned with compressed air and the thermocouple isemoved by cutting. As the thermocouple was unable to measurehe instantaneous temperatures of the specimen correctly at hightrain rates in order to regulate the heating power input, the ther-al control was switched off during high-speed deformation tests
>1 s−1) and the actual specimen temperatures during the testsere calculated using the method developed by Goetz and Semi-
tin [17]. The high rate deformation was essentially adiabatic, sincehere was little heat dissipation from the specimen [14].
As the quality of input data is of crucial importance for the relia-ility of the processing maps, care was taken to gain high accuracyf the data measured during hot compression tests. The flow stressata obtained were corrected for adiabatic temperature deviations.
sothermal stress–strain data were used in the constitutive analysisf the alloys employing a strain-dependent method developed [18]nd then for constructing processing maps.
Microstructural examination was performed using an opticalicroscope, following a regular preparation procedure for magne-
ium alloys. Samples were cut using a Struers Secotom 10 precisionut-off machine and cold mounted in a resin matrix (Demotec-0). After being ground at 1200 grit, the samples were polishedt sequential steps (3 and 1 �m). The final polishing step was takensing a colloidal silica polishing medium (OPS). A picric acid-basedtchant was applied on the polished surface for 3–5 s, followedy rinsing with 99% ethanol [19]. A circle method represented byq. (3) was employed to calculate the average grain sizes of theaterials investigated [20]:
A0 · 106 A0 · 1062
√
¯ =V2 · z=
V2 · (0.67nR + n)[�m ], d = A [�m], (3)
where A is the average grain area, A0 the circle area, V the mag-ification, nR the number of the grains crossed by the circle, n theumber of the grains within the circle and d the average grain size.
Fig. 2. Representative microstructures of the materials in the as-extruded co
ngineering A 527 (2010) 735–744 737
For each average value, more than 1000 grains were counted toobtain statistically reliable results.
3. Results and discussion
3.1. The as-extruded microstructure
The representative microstructures of the AZ alloys in the as-extruded condition are shown in Fig. 2. All the materials exhibit arelatively large, well-developed grain structure. Most of the grainsare equiaxed; however, some grains are elongated in the extrusiondirection, which increases material inhomogeneity. The ˇ-phaseprecipitates present in the materials with higher aluminium con-tents (6 and 8 wt%) are oriented in the extrusion direction, formingstringers. In addition, the elongated grains in the AZ61 and AZ80alloys were less observed than in AZ41 as these were retarded bylarger volume fractions of the ˇ-phase in AZ61 and AZ80. Corre-spondingly, the grain sizes of AZ61 and AZ80 are smaller than thoseof AZ41.
3.2. Stress–strain curves
In general, the stress peak occurs slightly over a strain of 0.2 andthe steady state at a strain of 0.7, while at the highest strain ratesof 100 s−1, the steady state is attained at a larger strain (0.9). Themain difference between these alloys lies in the range of tempera-tures where all the strain rates could be applied successfully. Withan increase in Al content, the maximum testing temperature per-mitted was reduced. As a consequence, while AZ41 could be testedat 500 ◦C, the temperature for AZ61 was limited to 450 ◦C and that
for AZ80 to 375 ◦C due to the local melting of the ˇ-phase resultingfrom temperature increases caused by rapid deformation duringhot compression. Furthermore, AZ80 specimens cracked at temper-atures below 300 ◦C and therefore this alloy was tested at 300, 325,350 and 375 ◦C to obtain a sufficient number of data over the appli-ndition, before hot compression tests: (a) AZ41, (b) AZ61 and (c) AZ80.

738 F.A. Slooff et al. / Materials Science and Engineering A 527 (2010) 735–744
Z61 an
clcoc
pos8AAwwbAt
Fig. 3. Flow stress/strain curves of (a) AZ41, (b) A
able strain rate range. Reducing the strain rate would improve theow- and high-temperature deformation characteristics, but in theurrent investigation only the temperatures which could be usedver the complete range of strain rates for these three alloys wereonsidered viable.
In all the cases, the flow stress values obtained from the com-ression tests increase with increasing strain rate. The flow stressesf the alloys investigated at 350 ◦C and different strain rates arehown in Fig. 3. It can be seen that the alloys containing 6 andwt% Al display similar response to temperature and strain rate;Z61 and AZ80 exhibit more pronounced work hardening thanZ41. This may be a result of the influence of ˇ-phase particles
hose volume fraction increases with the amount of Al added. Theork hardening process after reaching the stress peak is followedy softening, which is also more distinct in the alloys with higherl content. At low strain rates applied, the stress flow curves take
he form of a steady-state.
Fig. 4. Variation of flow stress with temperature a
d (c) AZ80 at 350 ◦C and at different strain rates.
Fig. 4 compares AZ41 and AZ61 flow stress values at differenttemperatures and strain rates at 0.4 strain. (For AZ80, the range ofthe temperatures applied was too narrow and thus their data arenot shown in Fig. 4.) It is clear that at high strain rates, with tem-perature increasing, the flow stress decreases significantly, whileat low strain rates the differences in the flow stress between differ-ent temperatures are much smaller as the steady-state deformationbecomes dominant. Increasing the testing temperature leads to areduction of the flow stress and to a reduction of the peak stress,especially at higher strain rates. It can also be noted that AZ61exhibits higher stress values at the highest strain rate applied thanAZ41.
The shape of the flow stress curves can be indicative ofmicrostructural changes that material undergoes during deforma-tion [21,22]. The initial work hardening is usually an indication oftwinning, while the softening after the flow stress is an indica-tion of the onset of DRX. These microstructural mechanisms are
t different strain rates and at a strain of 0.4.

F.A. Slooff et al. / Materials Science and Engineering A 527 (2010) 735–744 739
F straint
assr(aFedm
3
awar(toAA
pdtcabv3lratoif
tadlf
upi
ig. 5. Microstructures of AZ41 during deformation at a temperature of 350 ◦C and ahe peak stress at a strain of 0.3 (b), a DRX structure is developing.
lso observed in the wrought magnesium alloys investigated. Fig. 5hows the microstructures of AZ41 just before and after the peaktress during deformation at a temperature of 350 ◦C and a strainate of 10 s−1. Fig. 5a shows that at a strain of 0.2 the grain structurewith recognizable twins) is in the process of recrystallization. Atstrain of 0.3, a more developed DRX structure is clearly visible inig 5b, while some parent grains remain. To determine the influ-nce of microstructural changes on the shape of the flow curves,etailed microstructural examination, as shown later in this com-unication, is a must.
.3. Processing maps
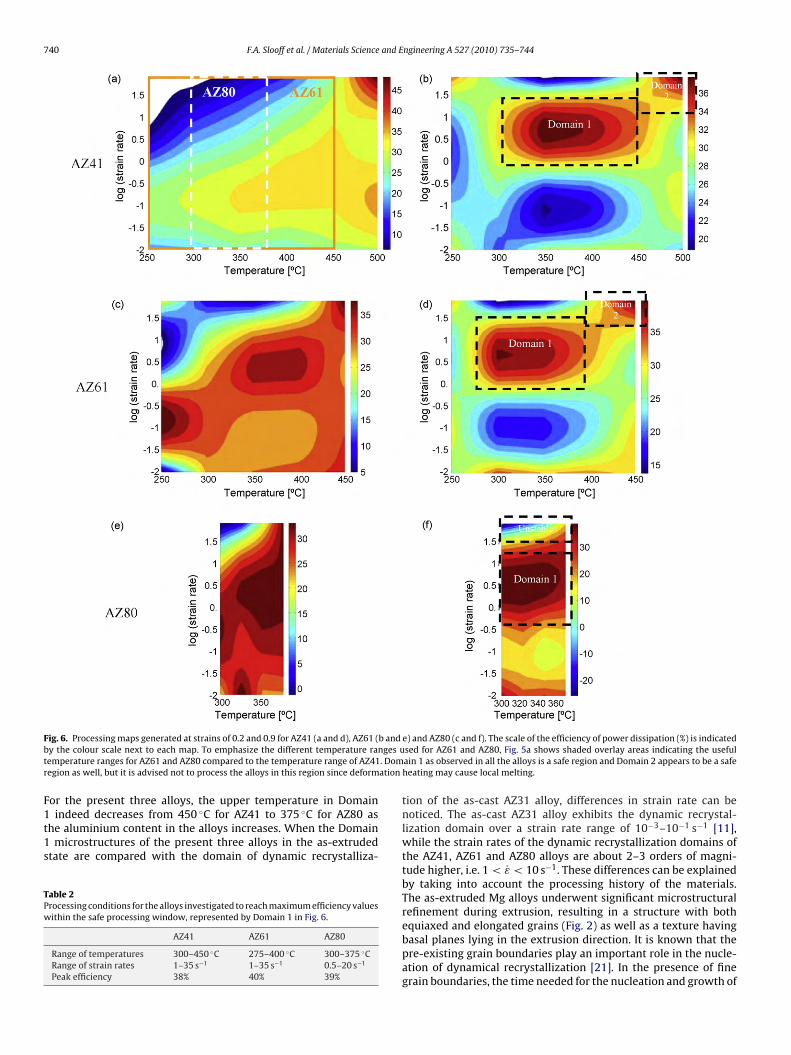
The processing maps constructed for the AZ alloys investigatedt strains of 0.2 and 0.9 are shown in Fig. 6 for comparison purposes,hile detailed analysis is undertaken for the processing maps atstrain of 0.9. It should be noted that the applied temperature
anges are not the same for the three alloys. The maps of AZ61Fig. 6b and e) and AZ80 (Fig. 6c and f) were made to be consis-ent on the scale with those of AZ41 (Fig. 6a and d). In Fig. 6averlays are shown to clarify the testing temperature ranges forZ61 and AZ80 compared to the testing temperature range forZ41.
Different domains are indicated by rectangular overlays in therocessing maps at a strain of 0.9 for each alloy (Figs. 6d–f). Theseomains represent a high efficiency of energy dissipation. Sincehese are 2D representations of 3D topographic maps, the domainsorrespond to hills or maximums in the efficiency and the contoursre analogue to the lines of equal height along the hill. The transitionetween safe and unsafe is not given by an exact number, but aalley as observed at a strain rate of 0.1 s−1 and a temperature of00 ◦C in AZ41 (Fig. 6d) is considered less safe and therefore of
ess interest. In general, the efficiency values of 30% and higher areegarded as safe and Domain 1 as shown in Fig. 6d–f for the threelloys appears to be a safe domain. The processing conditions andhe maximum efficiency values are given in Table 2. The occurrencef the closed contour lines indicates that there is a gradual decreasen the efficiency when processing parameters are changed awayrom the optimum values.
The area identified as Domain 2 (Fig. 6d and e) also appearso be a safe domain. However, since it is in the high temperaturend high strain rate regime, one must be cautious; the influence ofeformation heating should not be neglected and this may cause
ocal melting. Domain 2 is therefore not a recommended domain
or processing the alloys investigated.The processing map of AZ80 is the only map showing a clearnstable domain, which is found at high strain rates and at tem-eratures below 355 ◦C (Fig. 6f). The other two alloys have no
nstabilities according to the instability maps, being in agreement
rate of 10 s−1. Before the peak stress at a strain of 0.2 (a), twins are observed. After
with the findings of Prasad and Rao [15] in the case of extrudedAZ31.
Comparison between the processing maps developed gives aninteresting result. The processing maps appear to be similar toeach other. It indicates that reducing the Al content reduces theefficiency and requires a higher deformation temperature. More-over, the development of the domains as a function of strain can beclearly observed. The contours of efficiency of power dissipationbecome closer together as the amount of deformation increases.This is obvious when the processing map of AZ61 at a strain of 0.2(Fig. 6b) is compared to the processing map of the same alloy at astrain of 0.9 (Fig. 6e). AZ80 shows similar behaviour, although it isless pronounced at a lower strain (Fig. 6c) when compared to AZ61.At a strain of 0.9, all the three alloys (Fig. 6d–f) appear to behavesimilarly.
The processing maps of AZ41 and AZ61 are quite consistentwith the processing map of extruded AZ31 [15]. In making compar-isons, it is important to note the differences in the ranges of strainrates applied and the strain selected for these processing maps. InFig. 6d–f, another domain would appear if the range of strain ratesapplied in the present research was broadened down to 10−3 s−1.It would also be likely that Domain 1 of these two alloys would notbe closed, if the range of strain rates was narrowed down to 10 s−1
as found in the research of Prasad and Rao [15].To compare the efficiency of power dissipation more closely
between the alloys, the plots of the efficiency values of AZ41, AZ61and AZ80 against different temperatures but at the same deforma-tion rate of 10 s−1 were made (Fig. 7). It is clear that the highestefficiency is about 38% at 350 ◦C for all the alloys tested. Only AZ61displays a marginally higher deformation efficiency value (38.2%)at a lower temperature (300 ◦C).
3.3.1. Microstructure characterization of domainsFor all the three alloys, the processing maps obtained at a strain
of 0.9 have one principal domain—entirely closed in the case ofAZ41 and AZ61. In the case of AZ80, however, the domain is notclosed, but extended over the testing temperatures (300–375 ◦C).Overlaying the processing map of AZ80 (Fig. 6f) on the top of themap of, for instance, AZ61 (Fig. 6e), shows similarities. The region ofthe processing map of AZ80 representing Domain 1 (Fig. 6d) mightclose at temperatures lower than those investigated in this work.The microstructures of the three alloys within the Domain 1 areshown in Fig. 8. Fine, dynamically recrystallized grains character-istic of this domain can be seen in this image. Therefore, it is clear
that Domain 1 represents DRX for these three magnesium alloys.The occurrence of dynamic recrystallization in Domain 1 to thethree alloys is in agreement with the observation of Prasad and Rao[15], although in the case of extruded AZ31 the temperature rangewhere dynamic recrystallization occurs is wider (up to 530 ◦C).
740 F.A. Slooff et al. / Materials Science and Engineering A 527 (2010) 735–744
F b andb nges ut . Domr ation
F1t1s
TPw
ig. 6. Processing maps generated at strains of 0.2 and 0.9 for AZ41 (a and d), AZ61 (y the colour scale next to each map. To emphasize the different temperature raemperature ranges for AZ61 and AZ80 compared to the temperature range of AZ41egion as well, but it is advised not to process the alloys in this region since deform
or the present three alloys, the upper temperature in Domain
indeed decreases from 450 ◦C for AZ41 to 375 ◦C for AZ80 ashe aluminium content in the alloys increases. When the Domainmicrostructures of the present three alloys in the as-extruded
tate are compared with the domain of dynamic recrystalliza-
able 2rocessing conditions for the alloys investigated to reach maximum efficiency valuesithin the safe processing window, represented by Domain 1 in Fig. 6.
AZ41 AZ61 AZ80
Range of temperatures 300–450 ◦C 275–400 ◦C 300–375 ◦CRange of strain rates 1–35 s−1 1–35 s−1 0.5–20 s−1
Peak efficiency 38% 40% 39%
e) and AZ80 (c and f). The scale of the efficiency of power dissipation (%) is indicatedsed for AZ61 and AZ80, Fig. 5a shows shaded overlay areas indicating the usefulain 1 as observed in all the alloys is a safe region and Domain 2 appears to be a safeheating may cause local melting.
tion of the as-cast AZ31 alloy, differences in strain rate can benoticed. The as-cast AZ31 alloy exhibits the dynamic recrystal-lization domain over a strain rate range of 10−3–10−1 s−1 [11],while the strain rates of the dynamic recrystallization domains ofthe AZ41, AZ61 and AZ80 alloys are about 2–3 orders of magni-tude higher, i.e. 1 < ε < 10 s−1. These differences can be explainedby taking into account the processing history of the materials.The as-extruded Mg alloys underwent significant microstructuralrefinement during extrusion, resulting in a structure with both
equiaxed and elongated grains (Fig. 2) as well as a texture havingbasal planes lying in the extrusion direction. It is known that thepre-existing grain boundaries play an important role in the nucle-ation of dynamical recrystallization [21]. In the presence of finegrain boundaries, the time needed for the nucleation and growth of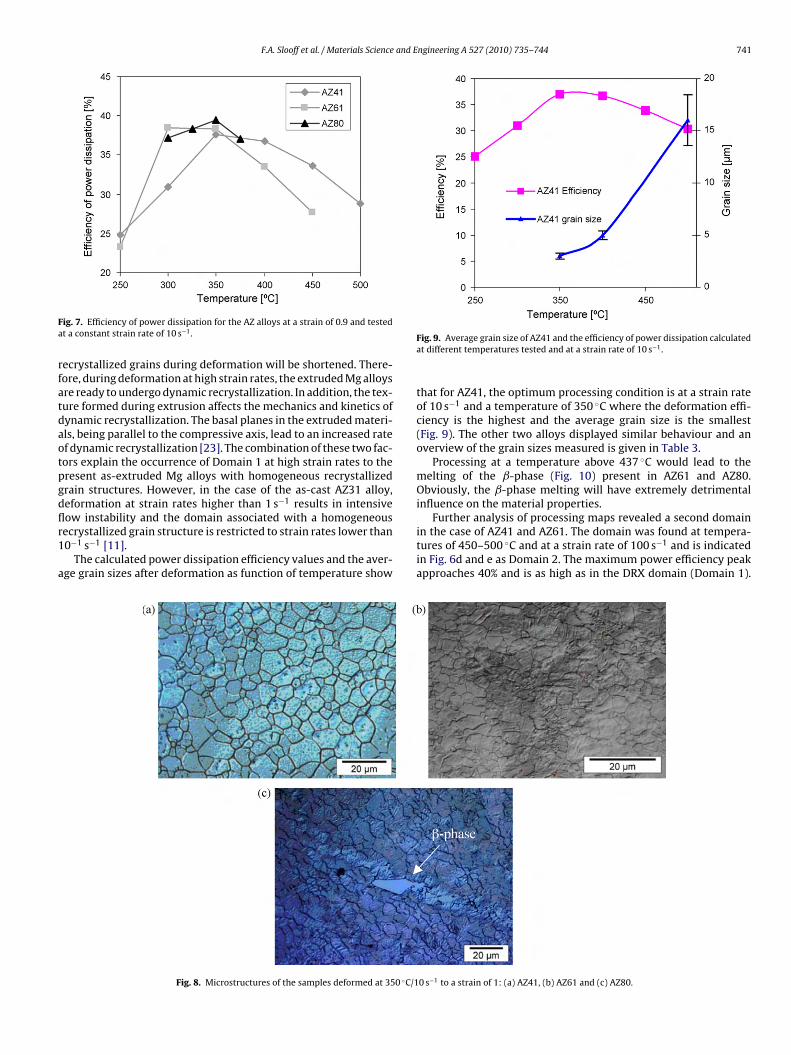
F.A. Slooff et al. / Materials Science and Engineering A 527 (2010) 735–744 741
Fa
rfatdaotpgdflr1
a
ig. 7. Efficiency of power dissipation for the AZ alloys at a strain of 0.9 and testedt a constant strain rate of 10 s−1.
ecrystallized grains during deformation will be shortened. There-ore, during deformation at high strain rates, the extruded Mg alloysre ready to undergo dynamic recrystallization. In addition, the tex-ure formed during extrusion affects the mechanics and kinetics ofynamic recrystallization. The basal planes in the extruded materi-ls, being parallel to the compressive axis, lead to an increased ratef dynamic recrystallization [23]. The combination of these two fac-ors explain the occurrence of Domain 1 at high strain rates to theresent as-extruded Mg alloys with homogeneous recrystallizedrain structures. However, in the case of the as-cast AZ31 alloy,eformation at strain rates higher than 1 s−1 results in intensive
ow instability and the domain associated with a homogeneousecrystallized grain structure is restricted to strain rates lower than0−1 s−1 [11].The calculated power dissipation efficiency values and the aver-ge grain sizes after deformation as function of temperature show
Fig. 8. Microstructures of the samples deformed at 350 ◦C/1
Fig. 9. Average grain size of AZ41 and the efficiency of power dissipation calculatedat different temperatures tested and at a strain rate of 10 s−1.
that for AZ41, the optimum processing condition is at a strain rateof 10 s−1 and a temperature of 350 ◦C where the deformation effi-ciency is the highest and the average grain size is the smallest(Fig. 9). The other two alloys displayed similar behaviour and anoverview of the grain sizes measured is given in Table 3.
Processing at a temperature above 437 ◦C would lead to themelting of the ˇ-phase (Fig. 10) present in AZ61 and AZ80.Obviously, the ˇ-phase melting will have extremely detrimentalinfluence on the material properties.
Further analysis of processing maps revealed a second domain
in the case of AZ41 and AZ61. The domain was found at tempera-tures of 450–500 ◦C and at a strain rate of 100 s−1 and is indicatedin Fig. 6d and e as Domain 2. The maximum power efficiency peakapproaches 40% and is as high as in the DRX domain (Domain 1).0 s−1 to a strain of 1: (a) AZ41, (b) AZ61 and (c) AZ80.

742 F.A. Slooff et al. / Materials Science and Engineering A 527 (2010) 735–744
Table 3Grain sizes of the alloys deformed at different temperatures and strain rates to astrain of 1.
Temperature [◦C] Strain rate [s−1] AZ41 [�m] AZ61 [�m] AZ80 [�m]
250 10 xa 2 ± 0.24350 0.01 7 ± 0.54 8 ± 0.24350 10 3 ± 0.29 3 ± 0.39 2 ± 0.13350 100 5 ± 1.8 3 ± 0.15400 10 5 ± 0.41450 10 7 ± 0.67b
500 10 16 ± 2.46b
r
NptFtdaef
3
hpr
Fr
a The microstructure did not allow an average grain size to be determined accu-ately.
b Maximum temperatures at which the alloys could be tested.
o ˇ-phase melting or cracking could be detected in AZ41, but thishase was detected in AZ61 as shown in Fig. 10. Fig. 11 illustrateshe microstructural state of AZ41 within Domain 2 indicated inig. 6d. The coarse grains with heavily deformed interior containingwins and substructures indicate an unsteady deformation con-ition. Moreover, intercrystalline cracking is observed. Therefore,lthough suggested as a domain of high efficiency of deformationnergy dissipation, Domain 2 is unstable and should be avoided inurther processing.
.3.2. Deformation instabilities
An interesting observation of the processing maps was thatardly any instabilities could be found over the ranges of tem-eratures and strain rates applied, even though the highest strainate applied was as high as 100 s−1. Only for AZ80 at moder-
ig. 10. Microstructure of the AZ61 specimen deformed at 450 ◦C/100 s−1 showinge-solidification as a result of ˇ-phase melting during the hot compression test.
Fig. 11. Microstructure of the AZ41 specimen deformed at 450 ◦C/100 s−1.
Fig. 12. Microstructure of AZ41 deformed at 400 ◦C/0.01 s−1 containing coarse andinhomogeneous grains, characteristic of bifurcation.
ately elevated temperatures (<330 ◦C) and the high strain rates of70–100 s−1 instabilities could be observed in the processing map,as indicated in Fig. 6f. Furthermore, the three processing maps at astrain of 0.9 (Fig. 5d–f) indicated an extended region of bifurcation.Bifurcation represents microstructural changes within the mate-rial, which cannot be clearly classified as a single microstructuralmechanism and is associated with a change in the topology of aprocessing map. The microstructure will display a mixture of com-peting microstructural changes and can be found anywhere outsidethe domain area.
Fig. 12 illustrates a microstructure of AZ41 in the region of bifur-cation, which represents the microstructure of the material at alltesting temperatures and strain rates below 0.1 s−1. Within thisbifurcation region, the microstructure contains coarse grains andhave an inhomogeneous grain size distribution, indicating unsta-ble flow. Comparing this micrograph with Fig. 8a, one can see thedifference in microstructure between the inside and outside of theDomain 1; the microstructure inside the domain is clearly morehomogeneous.
3.4. Apparent activation energy maps
In addition to the processing maps, maps of the apparent acti-vation energy have been developed. It is common to designate Q asthe activation energy for deformation in a common form of consti-tutive equation to describe the thermo-viscoplastic behaviour of ametallic material during hot deformation:
Z = A[sinh ˛�]n = ε exp(
Q
RT
), (4)
where Z is the Zener–Hollomon parameter, A a material parame-ter, n the stress exponent, ˛ the stress multiplier, ε the strain rate,R the universal gas constant and T the absolute temperature. Toobtain the activation energy for deformation and the constitutiveconstants in this relationship, flow stresses as a function of strainrate and temperature may be obtained from hot working tests suchas hot compression, torsion or tensile tests. The activation energyin Eq. (4) is defined as [24]:
Q = R
[∂ ln sinh(˛�)
∂(1/T)
]ε
[∂ ln ε
∂ ln sinh(˛�)
]T
. (5)
The stress multiplier ˛ in Eq. (4) can be adjusted to bring ˛�
into a range to make constant T curves in ln ε against ln sinh(˛�)plots linear and parallel [25]. Since the flow stresses of the wroughtmagnesium alloys investigated are dependent on the strain, dif-ferent values of Q can be obtained at different strains. When acomplete range of the flow stresses in the steady state or at the
F.A. Slooff et al. / Materials Science and Engineering A 527 (2010) 735–744 743
F ap d( nergym
sareetatoaawa8fcetvmrwtitar
bmdtea
TCaai
ig. 13. (a) Apparent activation energy map and (b) the corresponding processing m%) is indicated by the colour scale next to each map, while the apparent activation e
ap indicates an apparent activation energy of 130 kJ mol−1.
tress peak are used for calculating Q, a single value of Q is obtained,lthough it actually changes as a function of temperature and strainate. This single value of the activation energy is the activationnergy for deformation, while the maps of the apparent activationnergy provide a better insight into the change of Q during deforma-ion processes. The apparent activation energy is the energy whichppears to be required for the deformation under specific condi-ions. Fig. 13 shows the maps of the apparent activation energyf the alloy AZ41 at a strain of 0.9. This map can also be seens a 2D representation of a 3D topography, having the same axess the processing map (strain rate and temperature). The domain,hich is considered efficient in the processing map, coincides withregion in the apparent activation energy map having values of
0–190 kJ mol−1 which are around the values of activation energyor deformation often found in the literature (135 kJ mol−1) [1]. Theurved black line running from the top to the bottom in the appar-nt activation energy map and the small triangle-shaped line inhe bottom left corner represents the constant 130 kJ mol−1 acti-ation energy. The area in the lower left quarter of the processingap (Fig. 13b) coincides with the ranges of temperatures and strain
ates which are frequently used for hot workability analysis ofrought magnesium alloys [26] and it appears that in this region
he variation of the apparent activation energy for deformations quite limited. The value of the activation energy for deforma-ion,135 kJ mol−1, matches well with the value of the apparentctivation energy of approximately 130 kJ mol−1 obtained in thisegion.
For constitutive analysis a novel strain-dependent method haseen used and the details can be found elsewhere [27]. In thisethod, the parameter A in Eq. (1) is modified to be a strain-
ependent parameter A� to accommodate the flow softening afterhe stress peak, as shown in Fig. 3. The obtained apparent activationnergy Q, stress multiplier ˛ and the stress exponent n for the threelloys are given in Table 4. It was found in the as-cast Mg–3Sn–1Ca
able 4onstitutive parameters used for the kinetic analysis of the alloys investigated. Thectivation energy is a result of analysing the apparent activation energy in relation tostrain-dependent constitutive equation and can be used as the activation energy,
f used correctly.
Q [kJ mol−1] ˛ [MPa−1] n
AZ41 130 0.01 4.1AZ61 115 0.004 5.3AZ80 105 0.004 5.3
eveloped at a strain of 0.9 for AZ41. The scale of the efficiency of power dissipationwas calculated in J mol−1. The black contour line in the apparent activation energy
alloy and as-extruded AZ31 alloy, over a wide range of strain rates,unique values of stress exponent n and apparent activation energyQ obtained only corresponded to a specific domain in the processingmap [4,15]. The current strain-dependent method appears to allowunique values of these parameters over the entire ranges of tem-peratures and strain rates, thus simplifying the description of theconstitutive behaviour. Although the apparent activation energychanges as a function of strain rate, temperature and strain, using130 kJ mol−1 as the activation energy for AZ41 will not create anyproblem if the strain-dependent parameter A� and invariable val-ues of other constitutive constants are used, as shown elsewhere[13]. The other alloys displayed similar behaviour, although theactivation energy reduced with increasing alloying content.
The activation energy of AZ41 is calculated to be 130 kJ mol−1,using all the data of temperatures and strain rates, which isclose to that for lattice self diffusion in magnesium, being135 kJ mol−1 [5,14,28]. As for AZ31, the values of activation energyof deformation between 130 and 133 kJ mol−1 have been reported[5,14,17,29]. The other two alloys (AZ61 and AZ80) appear to havelower activation energy values, which are between the value forlattice self diffusion and that for grain boundary self diffusion(92 kJ mol−1) [30].
4. Conclusions
Processing maps and apparent activation energy maps havebeen developed for three wrought magnesium alloys in the AZ alloysystem: AZ41, AZ61 and AZ80, based on the data obtained fromcompression tests over wide ranges of strain rates and tempera-tures. The following conclusions have been drawn.
1. The processing maps constructed for these alloys appeared tobe quite similar to each other, although the useful tempera-ture ranges for hot deformation reduced with increasing alloyingcontent.
2. The processing maps of AZ41 and AZ61 show two domains ofhigh efficiency energy dissipation, of which one domain wasconfirmed by microstructural observation to be a safe domainwhere dynamic recrystallization occurred. For AZ80 only a sin-
gle domain of high efficiency energy dissipation was observed,which also was confirmed to be safe.3. For AZ41, a closed DRX domain was found within a range of tem-peratures from 300 to 450 ◦C and strain rates from 1 to 35 s−1. InAZ61 the DRX domain was also closed in the temperature range

744 F.A. Slooff et al. / Materials Science and E
Table 5Optimum conditions for further deformation process-ing of the magnesium alloys in the AZ alloy system.
Optimal condition
4
5
6
A
tu
R
[[
[
[[[[
[[
[[[[[[[[
87–94.
AZ41 370 ◦C/5 s−1
AZ61 325 ◦C/5 s−1
AZ80 325 ◦C/5 s−1
of 275–400 ◦C and between strain rates 1 and 35 s−1. For AZ80, aDRX domain was found at all temperatures applied (300–375 ◦C)and between strain rates 0.5 and 20 s−1. Deforming the alloyswithin these processing conditions will result in homogeneousDRX microstructures.
. The instability region was only found in AZ80 at high strain rates(>70 s−1) and low temperatures (<330 ◦C).
. In all the alloys tested, a bifurcation region was found, which isnot recommended as optimum processing conditions.
. Table 5 summarizes optimum deformation conditions for theselected AZ alloys. AZ61 and AZ80 are best deformed with thesame parameters and they differ from AZ41 only in temperature.
cknowledgement
The work presented in this paper was financially supported byhe Innovatieve Onderzoeksprogramma (IOP) in the Netherlands,nder project code IOT 3003.
eferences
[1] Y.V.R.K. Prasad, K.P. Rao, Mater. Sci. Eng. A 487 (2007) 316–327.[2] M.R. Barnett, A.G. Beer, D. Atwell, A. Oudin, Scripta Mater. 51 (2004) 19–24.
[[[
[
ngineering A 527 (2010) 735–744
[3] O. Sivakesavam, Y.V.R.K. Prasad, Mater. Sci. Eng. A 362 (2003) 118–124.[4] Y.V.R.K. Prasad, K.P. Rao, N. Hort, K.U. Kainer, Mater. Lett. 62 (2008) 4207–4209.[5] A. Mwembela, E.B. Konopleva, H.J. McQueen, Scripta Mater. 37 (1997)
1789–1795.[6] C.Y. Wang, X.J. Wang, H. Chang, K. Wu, M.Y. Zheng, Mater. Sci. Eng. A 464 (2007)
52–58.[7] N. Srinivasan, Y.V.R.K. Prasad, K.P. Rao, Mater. Sci. Eng. A 476 (2008) 146–156.[8] Y.V.R.K. Prasad, S. Sasidhara, in: Y.V.R.K. Prasad, S. Sasidhara (Eds.), Hot Working
Guide—A Compendium of Processing Maps, ASM International, Materials Park,OH, 1997.
[9] Y.V.R.K. Prasad, J. Mater. Eng. Perform. 12 (2003) 638–645.10] Y.V.R.K. Prasad, T. Seshacharyulu, Int. Mater. Rev. 43 (1998) 243–258.11] J. Dzwonczyk, Y.V.R.K. Prasad, N. Hort, K.U. Kainer, Adv. Eng. Mater. 8 (2006)
966–973.12] F.A. Slooff, J. Zhou, J. Duszczyk, L. Katgerman, in: R.S. Beals, A.A. Luo, R. Nee-
lameggham, M.O. Pekguleryuz (Eds.), Proceedings of Magnesium Technology,TMS, 2007, pp. 363–368.
13] F.A. Slooff, J. Zhou, J. Duszczyk, L. Katgerman, Scripta Mater. 57 (2007) 759–762.14] L. Li, J. Zhou, J. Duszczyk, J. Mater. Process. Technol. 172 (2006) 372–380.15] Y.V.R.K. Prasad, K.P. Rao, Adv. Eng. Mater. 9 (2007) 558–565.16] Z. Yang, J.P. Li, J.X. Zhang, G.W. Lorimer, J. Robson, Acta Metall. Sin. 21 (2008)
313–328.17] R.L. Goetz, S.L. Semiatin, J. Mater. Eng. Perform. 10 (2001) 710–717.18] F.A. Slooff, J.P. Boomsma, J. Zhou, J. Duszczyk, L. Katgerman, in: K.U. Kainer (Ed.),
Magnesium, Wiley-VCH, Weinheim, 2006, pp. 324–329.19] V. Kree, J. Bohlen, D. Letzig, K.U. Kainer, Prakt. Metallogr. 41 (2004) 233.20] D.J. Willis, J.S.H. Lake, Scripta Metall. 21 (1978) 1733–1736.21] S.E. Ion, F.J. Humphreys, S.H. White, Acta Metall. 30 (1982) 1909–1919.22] M.R. Barnett, J. Light Metals 1 (2001) 167–178.23] R. Kaibyshev, B. Sokolov, A. Galiyev, Texture Microstruct. 32 (1999) 47–63.24] H.T. Zhou, et al., Mater. Sci. Technol. 20 (1997) 397–1402.25] H.J. McQueen, N.D. Ryan, Mater. Sci. Eng. A 322 (2002) 43–63.26] C. Bruni, L. Donati, M. El Mehtedi, M. Simoncini, Key Eng. Mater. 367 (2008)
27] F.A. Slooff, J. Zhou, J. Duszczyk, L. Katgerman, J. Mater. Sci. 43 (2008) 7165–7170.28] Q. Guo, H.G. Yan, H. Zang, Mater. Sci. Technol. 21 (2005) 1349.29] A. Mwembela, H.J. McQueen, Recent Developments in Light Metals, Canadian
Institute of Mining, Metallurgy and Petroleum, Montreal, 1994, pp. 365–373.30] A. Galiyev, R. Kaibyshev, G. Gottstein, Acta Metall. 49 (2001) 119.