Fundamental Investigation of Magnesium Corrosion Using ...
135
Brigham Young University Brigham Young University BYU ScholarsArchive BYU ScholarsArchive Theses and Dissertations 2018-07-01 Fundamental Investigation of Magnesium Corrosion Using Fundamental Investigation of Magnesium Corrosion Using Experiments and Simulation Experiments and Simulation Dila Ram Banjade Brigham Young University Follow this and additional works at: https://scholarsarchive.byu.edu/etd Part of the Engineering Commons BYU ScholarsArchive Citation BYU ScholarsArchive Citation Banjade, Dila Ram, "Fundamental Investigation of Magnesium Corrosion Using Experiments and Simulation" (2018). Theses and Dissertations. 7564. https://scholarsarchive.byu.edu/etd/7564 This Dissertation is brought to you for free and open access by BYU ScholarsArchive. It has been accepted for inclusion in Theses and Dissertations by an authorized administrator of BYU ScholarsArchive. For more information, please contact [email protected], [email protected].
-
Upload
khangminh22 -
Category
Documents
-
view
1 -
download
0
Transcript of Fundamental Investigation of Magnesium Corrosion Using ...

Brigham Young University Brigham Young University
BYU ScholarsArchive BYU ScholarsArchive
Theses and Dissertations
2018-07-01
Fundamental Investigation of Magnesium Corrosion Using Fundamental Investigation of Magnesium Corrosion Using
Experiments and Simulation Experiments and Simulation
Dila Ram Banjade Brigham Young University
Follow this and additional works at: https://scholarsarchive.byu.edu/etd
Part of the Engineering Commons
BYU ScholarsArchive Citation BYU ScholarsArchive Citation Banjade, Dila Ram, "Fundamental Investigation of Magnesium Corrosion Using Experiments and Simulation" (2018). Theses and Dissertations. 7564. https://scholarsarchive.byu.edu/etd/7564
This Dissertation is brought to you for free and open access by BYU ScholarsArchive. It has been accepted for inclusion in Theses and Dissertations by an authorized administrator of BYU ScholarsArchive. For more information, please contact [email protected], [email protected].

Fundamental Investigation of Magnesium Corrosion Using
Experiments and Simulation
Dila Ram Banjade
A dissertation submitted to the faculty of
Brigham Young University
in partial fulfillment of the requirements for the degree of
Doctor of Philosophy
John N. Harb, Chair
Dean R. Wheeler
W. Vincent Wilding
Bradley C. Bundy
Morris D. Argyle
Department of Chemical Engineering
Brigham Young University
Copyright © 2018 Dila Ram Banjade
All Rights Reserved

ABSTRACT
Fundamental Investigation of Magnesium Corrosion Using
Experiments and Simulation
Dila Ram Banjade
Department of Chemical Engineering, BYU
Doctor of Philosophy
Magnesium (Mg) is the lightest of all structural metals and has tremendous potential for
applications in the lightweight industry. However, the corrosion of Mg is a significant barrier
towards its wider use. Despite years of research, the fundamental understanding of Mg corrosion
still remains short. The enhanced hydrogen evolution reaction (HER) with anodic polarization,
the modeling of galvanic corrosion and the impact of hydrogen bubbles for galvanically coupled
Mg are important aspects of Mg corrosion that need to be understood before any mitigation
measures can be taken. The results presented in this work provide a key step in that direction.
In the first part of the project, we explored how the kinetics of reactions involved in the Mg
corrosion was influenced by surface changes. A significant difference in Tafel kinetics between a
polished Mg surface and a pre-corroded Mg surface was seen. It was also shown that when the
concurrent Mg dissolution was accounted for during the cathodic polarization, the absolute value
of Tafel slope decreased by a factor of ~2. The enhanced HER on Mg during high anodic
dissolution rate was also investigated. The Mg samples were first pre-corroded at different rates
until entire Mg surface was corroded. It was found that the surface roughness decreased with an
increased rate of corrosion and therefore did not have any influence in enhancing HER at the Mg
surface during the anodic dissolution. In order to observe the catalytic effect of anodic
dissolution, the potential was immediately dropped to a constant cathodic potential following the
pre-corrosion and the current was observed with the time. A peak current, proportional to the
prior dissolution rate, was observed. At longer times, the current decayed and converged to
similar values irrespective of the prior pre-corrosion rate providing a strong evidence that the
enhanced HER is caused due to the catalytic effect provided by the anodic dissolution. Our
results provide new mechanistic insights into the current understanding of enhanced HER.
In the second part of the project, a numerical simulation was developed to predict the galvanic
corrosion rates of Mg coupled to steel. The simulation showed that the kinetics of HER estimated
from the cathodic polarization (where significant anodic dissolution rates were absent)
underpredicted the experimental HER rates by two orders of magnitude signifying the catalytic
effect of anodic dissolution. The simulation allowed us to independently fit the HER kinetics.
The simulation also predicted the galvanic current densities and the corrosion potential within
14% error which is a significant improvement of model precision reported previously for
galvanic corrosion of Mg corrosion. For the first time, the influence of HER during galvanic
corrosion of Mg was reported. Despite substantial hydrogen evolution observed during the
experiment, the influence of hydrogen evolution was found to be only 8-9%.
Keywords: magnesium, corrosion, galvanic, enhanced HER, NDE, Mg kinetics, HER kinetics

ACKNOWLEDGEMENTS
First of all, I would like to thank and express my deepest appreciation to my advisor,
Professor John N. Harb, who mentored and guided me throughout this project. I truly appreciate
his patience, willingness to help, thoughtful feedback and positive attitude that have helped me
become a better researcher and an engineer. I am also grateful for my committee members,
Professor Dean R. Wheeler, Professor W. Vincent Wilding, Bradley C. Bundy and Morris D.
Argyle for their valuable feedback to my work. I would also like to thank my undergraduate
students, Steven D. Porter, Brian M. McMullan and KC Maughan for their input and hard work
into this project. I am thankful for the Department of Chemical Engineering (BYU) for providing
incredible quality of education that I could implement in my research.
I am very grateful towards my family and friends, who have been very supportive
throughout this journey. I am thankful for my wife, Mahima Joshi, who has been my biggest
supporter. I would not have accomplished this, without her love and support. I am grateful for
my parents, Dak Prasad and Durpata, who continue to provide unconditional love and
encouragement to me on a daily basis.
Lastly, but certainly not the least, this work would not have been possible without the
generous funding of CD-adapco and BYU graduate studies.

iv
TABLE OF CONTENTS
LIST OF TABLES ....................................................................................................................... viii
LIST OF FIGURES ....................................................................................................................... ix
1 Introduction ............................................................................................................................. 1
1.1 Objectives of the project .................................................................................................. 4
1.2 Organization of contents in this document ....................................................................... 6
2 Background and literature review ............................................................................................ 7
2.1 Fundamentals of Mg corrosion ........................................................................................ 7
2.2 Kinetics and transport relationships (governing equations) ............................................. 8
2.3 Ohmic drop and compensating for IR when using a rotating disk electrode ................. 11
2.4 Hydrogen evolution on Mg surfaces .............................................................................. 12
2.4.1 The role of enriched surface impurities .................................................................. 15
2.4.2 The role of surface films ......................................................................................... 16
2.4.3 The role of anodic sites ........................................................................................... 17
2.4.4 Opportunity for contribution ................................................................................... 18
2.5 Galvanic corrosion of Mg .............................................................................................. 19
2.5.1 Review of our previously published galvanic corrosion work ............................... 21
2.6 Numerical simulation of Mg corrosion .......................................................................... 22
2.7 Determination of reaction kinetics involved in Mg corrosion ....................................... 25

v
2.8 Hydrogen evolution and its influence ............................................................................ 26
2.9 Summary ........................................................................................................................ 27
3 The kinetics of reactions involved in Mg corrosion .............................................................. 29
3.1 Introduction .................................................................................................................... 29
3.2 Experimental methods .................................................................................................... 30
3.3 Results and discussions .................................................................................................. 32
3.3.1 Influence of hydrogen bubbles................................................................................ 32
3.3.2 The polarization behavior observed for polished and pre-corroded surface ........... 33
3.3.3 Determination of Tafel kinetics of hydrogen evolution reaction on Mg surface .... 38
3.3.4 Determination of Tafel kinetics for Mg dissolution reaction.................................. 40
3.4 Conclusions .................................................................................................................... 41
4 The influence of surface roughness and anodic dissolution on the hydrogen evolution
at the mg surface ........................................................................................................................... 43
4.1 Introduction .................................................................................................................... 43
4.2 Experimental methods .................................................................................................... 46
4.3 Results and discussion .................................................................................................... 47
4.3.1 The impact of anodic dissolution on the HER determined potentiostatically ........ 47
4.3.2 Comparison of polarization curves ......................................................................... 62
4.3.3 Implications for increased HER at the Mg surface ................................................. 64
4.4 Possible mechanism ....................................................................................................... 68

vi
4.5 Conclusions .................................................................................................................... 69
5 Numerical simulation of the galvanic corrosion of Mg ......................................................... 71
5.1 Introduction .................................................................................................................... 71
5.2 Model development ........................................................................................................ 73
5.2.1 Summary of previous experimental work ............................................................... 73
5.2.2 Governing equations and boundary conditions ....................................................... 74
5.2.3 Conditions for comparison of experimental and simulation results ....................... 81
5.3 Results and discussion .................................................................................................... 82
5.3.1 Current and potential distributions.......................................................................... 82
5.3.2 Current due to the hydrogen evolution at the Mg surface ...................................... 83
5.3.3 Similarities between numerical simulation and experimental results ..................... 88
5.3.4 Implications for the enhanced HER at the Mg surface ........................................... 94
5.3.5 Implications for the simulation work ...................................................................... 95
5.4 Conclusions .................................................................................................................... 96
6 Influence of hydrogen bubbles during The galvanic corrosion of Mg .................................. 98
6.1 Introduction .................................................................................................................... 98
6.1.1 Methods................................................................................................................... 99
6.2 Results .......................................................................................................................... 105
6.3 Conclusions .................................................................................................................. 108
7 Conclusions and future work ............................................................................................... 110

vii
7.1 Conclusions .................................................................................................................. 110
7.2 Future work .................................................................................................................. 113

viii
LIST OF TABLES
Table 4-1: Fraction of total surface corroded for Mg surface mentioned in Figure 4-3 ............... 52
Table 5-1: Summary of mesh resolution ....................................................................................... 77
Table 5-2: Kinetic parameters for the reactions used in the simulation. Note that the
superscripts represent the reference from which the values were taken. ............................... 78
Table 5-3: Summary of exchange current densities (io) of Mg dissolution .................................. 80
Table 6-1: Summary of estimated hydrogen volume fraction above electrode surfaces ............ 103
Table 6-2: Solution conductivity (S/m) for each region ............................................................. 105
Table 6-3: Galvanic current densities (A/m2) with and without the effect of hydrogen
bubbles ................................................................................................................................. 106
Table 6-4: Total current densities (A/m2) with and without the effect of hydrogen bubbles ..... 106

ix
LIST OF FIGURES
Figure 1-1: Weight reduction potential of Mg in an automobile10, 13. ............................................ 2
Figure 2-1: Potential-current curves for anodic and cathodic reactions involved in
Mg corrosion. Figure adapted from [48]. .............................................................................. 10
Figure 2-2: Schematic of a rotating disk electrode (RDE). .......................................................... 12
Figure 2-3: Illustration of negative difference effect (NDE) during Mg corrosion.
Figure adapted from [48]. ...................................................................................................... 13
Figure 2-4: Schematic diagram of Mg galvanically coupled to steel. .......................................... 20
Figure 2-5: Schematic of cross section of experimental set up used by Jia et al.27
ZRA stands for zero resistance ammeter. .............................................................................. 23
Figure 3-1: Image of Mg surface after polishing with a) 600 grit sandpaper
b) 3 micron diamond paste and c) 1 micron diamond paste. ................................................. 31
Figure 3-2: Schematic of experimental set up and electrodes configuration. ............................... 31
Figure 3-3: Impact of hydrogen bubbles at low rotating speeds. .................................................. 33
Figure 3-4: Pre-corroded Mg surface obtained by applying 1981A/m2 for a) 20 sec
b) 50 sec and c) 77 sec. .......................................................................................................... 34
Figure 3-5: Polarization behavior of polished and corroded Mg surface. .................................... 34
Figure 3-6: Surface of Mg electrode at the initiation of corrosion acceleration near
the potential of 1.6 V (vs SCE) in the anodic curve of Figure 3-5. ....................................... 35
Figure 3-7: Thick film observed on the Mg surface at high anodic overpotentials. ..................... 37
Figure 3-8: Current behavior with time for applied potential. ...................................................... 38
Figure 3-9: Tafel plot of hydrogen evolution reaction on pre-corroded Mg surface.
Both the plots are IR corrected. ............................................................................................. 39

x
Figure 3-10: Potential behavior with charge passed for an applied anodic constant
current (14 mA). .................................................................................................................... 41
Figure 4-1: Potential observed in response to anodic current applied to Mg samples. ................ 47
Figure 4-2: Current behavior observed at constant cathodic potential (-1.7 Vsce )
immediately following the anodic dissolution for samples pre-corroded at different
rates. Note that the negative sign represents the cathodic current densities. ......................... 49
Figure 4-3: Top row - Optical images of Mg surface after pre-corrosion at different rates.
Middle row- Optical images of Mg surface after pre-corrosion and 10 minutes
of cathodic polarization at -1.7 Vsce at different rates. Bottom row- Optical
images of Mg surface after pre-corrosion at different rates and removal of dark
film. For each row from left to right, the images are in increasing rates of
pre-corrosion; a/a1/a3 at 283 A/m2, b/b1/b3 at 1132 A/m2 and c/c1/c3 at 1981 A/m2. ......... 51
Figure 4-4: Top row - SEM images of Mg surface after pre-corrosion at different rates.
Middle row- SEM images of Mg surface after pre-corrosion and 10 minutes of
cathodic polarization at -1.7 Vsce at different rates. Bottom row- SEM images of
Mg surface after pre-corrosion at different rates and removal of dark film. For
each row from left to right, the images are in increasing rates of pre-corrosion;
a/a1/a3 at 283 A/m2, b/b1/b3 at 1132 A/m2 and c/c1/c3 at 1981 A/m2. ................................. 53
Figure 4-5: 3D images of Mg surface after pre-corrosion at different rates. Middle
row- 3D images of Mg surface after pre-corrosion and 10 minutes of cathodic
polarization at -1.7 Vsce at different rates. Bottom row- 3D images of Mg surface
after pre-corrosion at different rates and removal of dark film. For each row from

xi
left to right, the images are in increasing rates of pre-corrosion; a/a1/a3 at 283 A/m2,
b/b1/b3 at 1132 A/m2 and c/c1/c3 at 1981 A/m2. .................................................................. 54
Figure 4-6: Surface roughness along a 900 µm line scan of Mg surface after
a) pre-corrosion at different rates b) pre-corrosion at different rates and
10 minutes of cathodic polarization at -1.7 Vsce c) pre-corrosion at different rates
and removal of dark film. Only one legend is shown as it is the same for all the plots. ....... 56
Figure 4-7: Average step height measurement along a line scan for samples
pre-corroded at different rates. The error bars represent the standard deviation. .................. 57
Figure 4-8: Polarization curves of Mg sample pre-corroded at different rates but
with the surface film. Potentials are corrected for IR drop. .................................................. 58
Figure 4-9: Current behavior observed at constant cathodic potential (-2.7 Vsce)
immediately after anodic dissolution for three different samples. Note that the
negative sign represents the cathodic current densities. ........................................................ 59
Figure 4-10: Polarization curve for Mg samples pre-corroded at different rates
and the film removed. ............................................................................................................ 61
Figure 4-11: Comparison of polarization curves for Mg sample with different surface
morphologies. ........................................................................................................................ 63
Figure 4-12: Relationship between the applied current density and the peak current
density observed immediately following pre-corrosion at a) -1.7 V (SCE) and
b) -2.7 V (SCE). ..................................................................................................................... 64
Figure 4-13: Polarization behavior for samples with and without the film. ................................. 66
Figure 5-1: a) Schematic of experimental set up b) configuration of electrodes cast
in an epoxy............................................................................................................................. 74

xii
Figure 5-2: Computational Domain and governing equations. ..................................................... 76
Figure 5-3: a) 3D view of the mesh geometry created in STAR CCM+ and
b) zoomed view of the electrode surfaces from a). ................................................................ 78
Figure 5-4: Potential response to constant positive current applied to Mg sample. ..................... 80
Figure 5-5: Galvanic current density distribution for a 12 mm sample, a) 3D view and
b) zoomed view. .................................................................................................................... 82
Figure 5-6: Potential distribution in a 12 mm sample, a) 3D and b) 2D axisymmetric view. ...... 83
Figure 5-7: Comparison of current densities due to HER at the Mg surface
b) expanded view of current densities due to HER at the Mg surface calculated from
the simulation. ....................................................................................................................... 84
Figure 5-8: a) Numerical galvanic current density before and after fitting the hydrogen
current on Mg to the experimental values and b) Numerical corrosion potential
before and after fitting the hydrogen current to the experimental values. ............................. 87
Figure 5-9: Relationship between total anodic dissolution rate and exchange current
density of HER on Mg. .......................................................................................................... 87
Figure 5-10: Distribution of a) galvanic current distribution obtained from the
simulation b) hydrogen evolution observed during experiments for 12 mm sample. ........... 88
Figure 5-11: Comparison of distribution of total current density using a) experiments
and b) numerical simulation for 12 mm sample. ................................................................... 89
Figure 5-12: 2D axisymmetric view of potential distribution in the simulation. Note
that the scale is positive because we referenced metal potential to be 0. .............................. 90
Figure 5-13: Comparison of corrosion potential measured by numerical and
experimental methods. ........................................................................................................... 91

xiii
Figure 5-14: Comparison of experimental and numerical galvanic current density
for different samples. Error bars represent the standard deviation from the mean. .............. 92
Figure 5-15: Comparison of total current density between simulation and experiment
a) without considering HER at Mg surface and b) with considering HER at Mg. ................ 95
Figure 6-1: Hydrogen bubbles seen with Mg coupled to 12 mm steel. ........................................ 99
Figure 6-2: Current distribution calculated from the simulation on a 2 dimensional
plane for three different sample size. The negative values of current density
indicate cathodic nature of the current. ............................................................................... 100
Figure 6-3: Hydrogen current distribution estimated from the simulation at the Mg
surface for three different electrodes. The negative values of current density
indicate cathodic nature of the current. ............................................................................... 101
Figure 6-4: Distribution of solution conductivities for a 12 mm sample. Outside
diameter of region a = 1.5 mm, b = 1.9 mm, c = 2.9 mm, d = 6 mm and e = 15 mm.
Note that region (e) is circular and only part of it is shown in the figure. ........................... 104
Figure 6-5: Potential field distribution in a 12 mm sample in a 2D axisymmetric view. ........... 107
Figure 6-6: Potential field along a vertical line starting at the center of the electrode. .............. 108

1
1 INTRODUCTION
Magnesium (Mg) is the lightest of all structural metals and therefore of great interest in
industries where weight reduction is desired. Mg (1.75 g/cm3) is much lighter than other widely
used structural metals such as aluminum (2.7 g/cm3) and steel (7.86 g/cm3) 1-8. It is also one of
the most abundantly found metals. The majority of Mg is found in seawater in the form of
magnesium chloride (MgCl2). A cubic meter of seawater contains roughly 1.3 kg of Mg 1, 2. Mg
also has good ductility, high strength to weight ratio, and excellent castability. In addition, it has
better noise and vibration dampening characteristics than aluminum 1-4.
New United States regulations for future vehicles require increased fuel economy. The
Environmental Protection Agency (EPA) and the National Highway Traffic Safety
Administration (NHTSA) have set the following standards for vehicles model years 2017-20259:
- Achieve an average industry fleet-wide level of 163 g/mile of CO2 in the model year
2025. This is equivalent to 54.5 miles per gallon if achieved only through fuel economy
improvement
- Reduce 6 billion metric tons of greenhouse gases (GHG) over the lifetime of vehicles
sold in model years 2017-2025
- Save families more than $1.7 trillion in fuel costs
- Reduce America’s dependence on oil by more than 2 million barrels per day in 2025

2
As a result, the demand for lightweight vehicles is greater than ever before. Although there are
various design aspects (seen with hybrid vehicles) and engine performance improvement
techniques that may reduce fuel consumption, reducing the vehicle weight is perhaps the most
effective single step. For example, the weight reduction of the 2013 Ford Fusion baseline vehicle
(also called Mach I) by 23.3% led to improved fuel economy by 6 miles per gallon and reduced
CO2 emissions by 16%10. The use of Mg in automobile and aerospace applications is likely to
increase as auto companies like Honda and Chrysler have plans to use more magnesium in their
future vehicles11, 12.
One example of the weight reduction potential of Mg in an automobile is shown in Figure 1-1.
Due to its high corrosion susceptibility, discussed below, Mg applications will likely be limited
to the interior of a vehicle such as an engine block, steering wheels, door panels and seat frames.
Figure 1-1: Weight reduction potential of Mg in an automobile10, 13.

3
Despite the enormous weight reduction potential of Mg, its current use is very limited. The
average North American vehicle (the model year 2013) only used 0.5 wt% of Mg4. The main
obstacle to the wider use of Mg is its corrosion susceptibility5, 6, 14. Mg ranks highly anodic in the
electrochemical series of structural metals and is thus susceptible to corrosion. For this reason,
Mg is often used as a sacrificial anode to prevent the corrosion of other metals such as steel. Poor
design, surface contamination, poor surface treatment (polishing and protection) and the
presence of galvanic couples all serve to increase corrosion problems 1, 3. Mitigation efforts to
address Mg corrosion involve poisoning the reaction pathway15-17, alloying7, 15, 18-23, surface
coating24-26, and the design of optimum structures27, 28 that can withstand corrosion.
The corrosion of Mg is an electrochemical process and consists of anodic (oxidation) and
cathodic (reduction) reactions. The anodic reaction is the oxidation of Mg and the dominant
cathodic reaction is the reduction of water (evolution of hydrogen gas). Typically, for an
electrochemical process, when the potential is applied in a positive direction, the anodic reaction
increases and the cathodic reaction decreases. In the case of Mg, it has been found that both the
Mg dissolution rate (anodic reaction) and the hydrogen evolution rate on Mg (cathodic reaction)
increase with potential. This is true for Mg when the anodic dissolution rate is increased by
applying a positive potential or by galvanic coupling. The hydrogen evolution on Mg surfaces
has been examined by a number of investigators in the recent literature29-36. However, the
mechanistic cause of the observed behavior is still unclear. In this work, we investigated the
cause of the increased hydrogen evolution rate on Mg surface that has been observed at high Mg
dissolution rates29, 31, 37, 38.
An ideal structural metal needs to be compatible with other structural metals since different
metals are often used together in a structure. However, Mg forms galvanic couples with other

4
metals in presence of a conductive electrolyte. Under such conditions, Mg corrodes
preferentially. The coupled metal provides additional area and likely improved kinetics for
hydrogen evolution. There is increased interest among scientists to understand the mechanism of
Mg corrosion. Studies involve both experimental and numerical simulation work. In a recent
technical review meeting (April 2016) held by US DOE at Oakridge National Laboratory, it was
generally recognized that modeling has the potential to provide a better understanding of Mg
corrosion that may lead to optimized automobile designs10. Numerical simulations can also
provide predictive capabilities that may be of great importance in corrosion studies. A precise
numerical model can be used to understand and predict the processes that control corrosion
including the surface chemistry, electrochemical properties, geometry, etc. Therefore, a
numerical model can play an important role in helping to develop measures to mitigate Mg
corrosion. However, the development of such a model for Mg corrosion is still a work in
progress. Some of the challenges related to modeling Mg corrosion include a lack of
fundamental understanding and an inability to quantitatively describe the roles of surface
changes, corrosion products, hydrogen evolution and reaction kinetics. In particular, it is
important to understand how the reaction rates are influenced by Mg surface changes and the Mg
dissolution rate.
1.1 Objectives of the project
The overall objective of this project is to enhance our understanding of Mg corrosion using
numerical model and creative experimental designs. In order to complete this objective, we
focused on four different areas: 1) the influence of surface changes on the kinetic behavior of
reactions involved in Mg corrosion, 2) the cause of enhanced hydrogen evolution on Mg surfaces

5
at more positive potentials, 3) development of a model to study the corrosion of galvanically
coupled Mg and 4) the influence of hydrogen bubbles on the galvanic corrosion of Mg.
First, we investigated the kinetics of reactions involved in Mg corrosion. Significant surface
changes occur during the corrosion of Mg. Some of the changes that occur involve enrichment of
impurities, deposition of corrosion products and changes in the apparent area due to surface
roughness. It is important to understand how these changes affect the kinetics of Mg dissolution
and hydrogen evolution. Accurate kinetics are essential for the development of numerical
models of Mg corrosion. In this work, we have reported how surface changes impact Mg
dissolution and hydrogen evolution kinetics.
Secondly, we investigated the cause of enhanced hydrogen evolution at more anodic potentials.
As mentioned earlier, this aspect of Mg corrosion has been examined extensively in the
literature; however, a fundamental understanding is still lacking. Understanding what causes the
hydrogen evolution rate to increase at more anodic potentials is a key step in developing any
mitigation measures.
Next, we developed a numerical model that can predict our previously obtained experimental
results. We used the simulation to look at the factors that influence the current density and,
hence, the corrosion rate. In our previous work, Mg was galvanically coupled to steel at a high
cathode-to-anode area ratio. Therefore, a high corrosion rate was observed. In fact, the corrosion
rate was at least an order of magnitude higher than that reported in any of the previous studies by
others39-44. It is important to develop a simulation that can predict such high corrosion rates. A
precise numerical simulation can be expanded to study the influence of geometry and
environmental conditions. Such simulations are expected to play an important role in the design
of optimum Mg structures that minimize the impact of corrosion. Moreover, simulations can help

6
predict the future state of such structures so that appropriate measures can be taken upfront to
enhance their durability.
Lastly, the effect of hydrogen bubbles has not been closely examined for galvanic corrosion of
Mg. Previous numerical simulations were based on the secondary current distribution where only
electrode kinetics were considered. Seemingly large amounts of hydrogen bubbles are seen for
galvanically coupled Mg. Bubbles decrease the solution conductivity and resist the movement of
ions in the solution. Therefore, the significant amount of bubbles in the solution could decrease
the rate of corrosion. In this work, we have used both experiments and simulation to study the
influence of the significant amounts of hydrogen bubbles observed for galvanically coupled Mg.
1.2 Organization of contents in this document
This document contains seven major Chapters. I have provided background information and
discussion on important terms involved with this research in Chapter 2. In Chapter 3, I reported
the kinetic behavior of reactions involved in Mg corrosion and how they vary with surface
changes. In Chapter 4, the enhanced HER at the Mg surface observed with increased anodic
dissolution rate has been discussed. In Chapter 5, I have reported the results of numerical
modeling of our galvanic corrosion experiments. In Chapter 6, the influence of the hydrogen
evolution rate on the corrosion rates of galvanically coupled Mg has been reported. Finally, in
Chapter 7, the highlights of this work have been summarized and the future work that may
follow this project has been outlined.

7
2 BACKGROUND AND LITERATURE REVIEW
2.1 Fundamentals of Mg corrosion
With a standard potential of -2.37 V, Mg is highly anodic45 and oxidizes easily. The standard
potential is the potential relative to a standard hydrogen electrode (SHE, 0 V), and measures the
tendency of an element to be reduced or oxidized. A positive standard potential with respect to
SHE means that an element is likely to be reduced, and a negative standard potential means it is
likely to be oxidized when coupled to other respective half reaction. The lower the standard
potential, the greater the thermodynamic driving force for oxidation.
As a result, Mg oxidizes easily in aqueous conditions. Under atmospheric conditions, the natural
oxide layer (MgO) protects the Mg surface from corrosion. Under immersed conditions and in
presence of an aqueous electrolyte that contains Cl-, the oxide layer is easily penetrated and Mg
corrodes freely 1. The electrons released from Mg react with water to evolve hydrogen. The
resulting overall reaction of Mg corrosion is shown below.
Anodic Reaction: Mg Mg2+ + 2e-
Cathodic Reaction: 2H2O + 2e- H2 + 2OH-
Overall Reaction: Mg + 2H2O H2 + Mg2+ + 2OH-
Mg2+ and OH- are the products of the corrosion reaction and can further react to form aqueous
Mg(OH)2, the concentration of which becomes significant as the pH increases. Mg (OH) 2 is
only slightly soluble and readily precipitates out of solution. It can either precipitate out on the

8
surface as part of a film or in the solution. In our previous studies, a surface film appeared on the
Mg surface within the first 3 minutes of Mg-steel galvanic corrosion37, which further indicates
that the corrosion products have low solubility. For experiments that were run for 10 minutes,
ICP-MS analysis showed that the fraction of corroded Mg in the film was approximately 30% on
average. The rest of the Mg dissolved in the solution and precipitated37. The corroded surface of
Mg has been shown to have an inner thin film (thickness in nanometer range) of MgO and an
outer thick film of Mg(OH)246, 47. In immersed situations, it has been shown that the cathodic
(hydrogen evolution) reaction is the limiting reaction and that it controls the rate of anodic
dissolution of Mg during free corrosion15-17.
2.2 Kinetics and transport relationships (governing equations)
For a single reversible reaction in an electrochemical system, the driving force for the anodic or
cathodic reaction is the electrode surface overpotential (ƞs). This is the difference between
applied potential (E) and the equilibrium potential (U) relative to the same reference electrode.
ƞ𝑠 = 𝐸 − 𝑈 (1)
When the applied potential is greater than the equilibrium potential, the oxidation reaction
dominates at the electrode surface and the electrode is said to be anodically polarized relative to
U. Similarly, when the applied potential is lower than the equilibrium potential, the reduction
reaction dominates at the electrode surface and the electrode is said to be cathodically polarized
relative to U. For a single reaction that is kinetically controlled, the relationship between current
density and potential is given by the Butler-Volmer (BV) equation below:
𝑖𝑛𝑒𝑡 = 𝑖𝑎𝑛𝑜𝑑𝑖𝑐 + 𝑖𝑐𝑎𝑡ℎ𝑜𝑑𝑖𝑐 = 𝑖0 [exp (𝛼𝑎𝐹η𝑠
𝑅𝑇) − exp (
−𝛼𝑐𝐹η𝑠
𝑅𝑇)] (2)

9
where, 𝑖0 is the exchange current density, 𝛼𝑎 is the anodic charge transfer coefficient, 𝛼𝑐 is the
cathodic charge transfer coefficient, F is the Faraday’s constant, R is the universal gas constant
and T is the temperature.
In Equation 2, if ƞs >> 0, the anodic term dominates and the equation can be approximated as:
𝑖 = 𝑖0exp (𝛼𝑎𝐹η𝑠
𝑅𝑇) (3)
Similarly, if ƞs << 0, the cathodic term dominates and the equation can be approximated as:
𝑖 = −𝑖0exp (−𝛼𝑐𝐹η𝑠
𝑅𝑇) (4)
These approximations are also called Tafel equations. Tafel equations are often used in corrosion
systems. In corrosion systems, multiple anodic and cathodic reactions may occur at a single
surface. To illustrate, let’s take the reactions involved in Mg corrosion (see Section 2.1). In
Figure 2-1, Ua and Uc represent the equilibrium potentials of Mg/Mg2+ and H2O/H2 reactions,
respectively48. During the corrosion of Mg, the rate of the cathodic reaction (represented by
curve below Uc) and the rate of the anodic reaction (represented by curve above Ua) are equal at
a potential in between Uc and Ua. This potential is called the corrosion potential (Ecorr)48. The
current associated with the corrosion potential is called the corrosion current (icorr). At the
corrosion potential, the anodic reaction is occurring well above Ua. In other words, the
magnitude of anodic overpotential is large and positive. Therefore, Equation 3 can be used to
relate the potential and the current. Similarly, at the same potential, the cathodic reaction is
occurring well below Uc. In other words, the magnitude of cathodic overpotential is large and
negative.

10
Therefore, Equation 4 can be used to relate the potential and current. Thus, the reaction rates of
the cathodic and anodic reactions can be approximated using Tafel equations. The Tafel
equations (Equations 3 and 4) can be re-written as the following.
Anodic reaction: η𝑠 =𝑅𝑇
𝛼𝑎𝐹ln 𝑖 −
𝑅𝑇
𝛼𝑎𝐹ln 𝑖0 (5)
Cathodic reaction: η𝑠 = −𝑅𝑇
𝛼𝑐𝐹ln|𝑖| +
𝑅𝑇
𝛼𝑐𝐹ln 𝑖0 (6)
When η𝑠 is plotted as a function of ln|i|, a linear relationship is obtained. The kinetic parameters
of anodic reaction (𝛼𝑎, 𝑖0) can be approximated from the slope and intercept of the η𝑠 vs ln|i| plot
in Equation 5. Similarly, the kinetic parameters of cathodic reaction (𝛼𝑐, 𝑖0) can be approximated
Uc (-0.4 V)
Ua (-2.4 V)
2H2O + 2e- H2 +2OH-
Mg Mg2+ +
2e-
Current magnitude, | i |
Potential, E
Mg Mg2+ + 2e-
Figure 2-1: Potential-current curves for anodic and cathodic reactions involved in Mg corrosion.
Figure adapted from [48].

11
from the slope and intercept of the η𝑠 vs ln|i| plot in Equation 6. Note that the kinetic parameters
(𝛼𝑎, 𝛼𝑐, 𝑖0) vary with the type of reaction and the type of electrode surface upon which the
reaction is occurring. It should be recognized that the basic BV equation (see Equation 2) upon
which Tafel expressions are based may itself be an approximation but commonly used for
corrosion studies.
2.3 Ohmic drop and compensating for IR when using a rotating disk electrode
For some of our experiments, a three-electrode (working, reference and counter) configuration
was be used. Since high anodic dissolution rates of Mg are going to be studied, it is important to
talk about the ohmic drop. The potential of the working electrode (WE) is measured with respect
to a reference electrode (RE). However, the true potential of the WE can be influenced by the
location of the RE in the solution. The resistance to the current flow in the solution is given by
Ohm’s law (𝑉 = 𝐼𝑅𝑜ℎ𝑚), where V is the potential, I is the current and 𝑅𝑜ℎ𝑚 is the solution
resistance. The problem is that the measured potential can be influenced by the ohmic drop in
solution. This can occur when the current densities are high and/or the solution has a low
conductivity.
One resolution to the problem is to place the RE close to the WE in order to try to minimize the
ohmic drop between the electrodes. However, it is possible that the RE can interfere with the
current and potential distributions. To overcome this, a small Luggin capillary reference
electrode is sometimes used. While this method can reduce the ohmic drop between the WE and
RE, the experimental setup can be tedious.
Another relatively easy resolution to accurately measure the potential of WE without interfering
with the current and potential distribution is the use of a rotating disk electrode (RDE). As shown

12
in Figure 2-2, the RDE is a small round electrode where the planar circular end is exposed to the
solution.
The solution resistance at a distance far from the electrode is given by Equation 7 below49,
𝑅𝑜ℎ𝑚 =1
4𝑘𝑎 (7)
where k is the electrolyte conductivity and “α” is the radius of the disk electrode. Since the
ohmic resistance depends on the conductivity of the solution and the disk radius, the precise
placement of the reference electrode does not matter as long as it is at least ~10𝑟 away from the
WE.
The use of an RDE also has other advantages. The rotation of the electrode can be controlled. At
a proper rotation speed, stability is obtained quickly and the measurements can be made with
high precision50.
2.4 Hydrogen evolution on Mg surfaces
According to Tafel equation, the rate of anodic reaction increases with increasing potential and
the rate of cathodic reaction increases with decreasing potential. The Mg dissolution reaction and
the HER reaction at the steel surface follow standard Tafel behavior. However, the cathodic
Metal contact for WE
Insulator
WE exposed to the solution
Figure 2-2: Schematic of a rotating disk electrode (RDE).

13
reaction on a Mg surface (HER at the Mg surface) does not follow the standard Tafel behavior
upon anodic polarization with respect to Ecorr. This is illustrated in Figure 2-3 below.
IMg, Ihe and Iho represent the current curves for Mg dissolution, expected hydrogen evolution and
the observed hydrogen evolution, respectively. At Ecorr, the current density associated with
hydrogen evolution is icorr. When a potential higher than Ecorr is applied, the potential shifts in
the anodic direction. Let’s say that this potential is E1. According to the Tafel behavior, the
current density associated with hydrogen evolution should decrease and be equal to ih1e at this
potential. However, the observed current associated with hydrogen evolution at this potential is
E1
Ecorr
ih1e icorr ih1o
Ihe
IMg
Iho
Current magnitude, | i |
Potential, E
Figure 2-3: Illustration of negative difference effect (NDE) during Mg corrosion. Figure adapted
from [48].

14
higher than the value at Ecorr and is equal to ih1o. The increased rate of both the cathodic and
anodic reactions with the applied potential is widely known as the negative difference effect
(NDE)51-53. The term NDE is defined as the difference (icorr – ih1o) between the hydrogen
evolution rate on an electrode surface at the corrosion potential and during anodic polarization
relative to the corrosion potential54. This difference is negative since the hydrogen evolution rate
increases with the anodic polarization. A similar effect is observed when Mg is coupled to more
noble metal such as steel or Al. From a practical perspective, Mg is subjected to a higher
potential (relative to its free corrosion potential) when it is coupled. Therefore, it is anodically
polarized (relative to its free corrosion potential) when coupled with another metal. The HER is
accelerated on the more noble metal due to the increased surface area and the faster HER
kinetics. However, the HER rate on Mg surface is also observed to increase, showing NDE
behavior.
Despite research efforts to date, a fundamental understanding of what causes the rate of HER to
increase with potential is still lacking29-36, 38, 54-67. It is important to investigate and understand the
cause of the enhanced hydrogen evolution on Mg in order to develop mitigation measures for Mg
corrosion.
Several explanations have been offered for the increased rate of HER on Mg surfaces. These
explanations can be grouped into three main areas38, 54: 1) role of enriched surface impurities 2)
the role of surface films and 3) the role of anodic regions. Each of these topics is discussed
below.

15
2.4.1 The role of enriched surface impurities
It is a fact that the noble impurities found in Mg, such as Fe, Al, Zn, and Mn, are concentrated on
the surface during the anodic dissolution of Mg30, 68. Once exposed, the areas (on the surface of
Mg) containing these impurities can act as cathodic sites to sustain HER60. Transmission electron
microscopy (TEM) analysis of Mg surfaces has shown Fe-rich particles at the corroded regions30.
Other methods to analyze surface impurities, such as Rutherford backscattering spectroscopy and
X-ray spectroscopy (EDXS), have also shown enrichment of noble impurities in the corroded
regions30, 68. Williams et al. used a scanning vibrating electrode technique (SVET) and reported
that the net cathodic sites are present in the dark regions left behind by the anodic dissolution,
consistent with the claim that surface enrichment of noble impurities occurs in the corroded
regions60. In order to address the role of impurities towards enhancing the HER, Hoche et al.
suggested that the impurities such as Fe dissolve into the solution during the anodic dissolution62.
The dissolved Fe redeposits on the Mg surface and acts as cathodic sites, leading to increased
hydrogen evolution rate 62. The role of noble impurities was reported by Birbilis et al. as well. In
their study, Birbilis et al. applied anodic in the form of galvanostatic steps (constant current) of
increasing magnitude to dissolve Mg29. Each step was 2 minutes in duration. Between each step,
a current was measured at a constant cathodic overpotential for 1 min. They found that the
current response at this fixed overpotential following the anodic dissolution step was
proportional to the prior anodic current applied. Upon examining the surface with an optical
microscope, it was found that the sample corroded at a higher current density had larger areas of
dark regions. This suggested that the sample corroded at a higher rate had higher enrichment of
surface impurities and therefore the current observed at cathodic potential was proportional to
the prior applied anodic current. They concluded that the enhanced cathodic activity on Mg

16
surface was likely catalyzed by the increase of noble impurities by the anodic dissolution as
higher dissolution rate would cause faster enrichment of impurities on the Mg surface.
Researchers agree that the surface impurities enhance the HER at the Mg surface. However, the
extent of the contribution made by the surface impurities towards the enhanced HER has been a
subject of investigation. Lysne et. al and Cain et. al tested the efficiency of Fe enrichment in
sustaining the HER30, 32. Lysne et al. found that the Fe enrichment efficiency was poor and was
unable to explain the large amounts of HER seen with Mg dissolution. Similarly, Cain et al. used
Rutherford Backscattering Spectroscopy and found that the concentration of enriched Fe in the
corroded region was far below 1 at% (atomic percent), which suggests that the enriched
impurities alone may not be responsible for the enhanced rate of HER seen during the anodic
dissolution of Mg30. Recently, Fajardo et al. found enhanced hydrogen evolution (HE) even
when using an ultra-high purity (99.9999%) Mg38, 54, supporting the theory that impurities alone
may not be responsible for the enhanced HE rate.
2.4.2 The role of surface films
The corroded areas of Mg show a dark film that is composed of a thin inner layer of MgO and a
thick outer layer of Mg(OH)234, 46, 47, 69-75. It has been shown in previous studies that the
hydrogen evolution on Mg surfaces occurs principally from these dark corroded areas36, 76, 77.
Many studies have reported that the enhanced rate of HER at the Mg surface is catalyzed by the
outer surface film, mainly Mg(OH)2. Salleh et al. proposed that at high pH, the OH- ions are
depleted rather rapidly from the solution due to Mg(OH)2 precipitation33. This disrupts the water
dissociation reaction and the H+ ions are reduced by the electrons (available from Mg oxidation)
and evolve hydrogen33. In another study, Cain et al. reported the that the enhanced rate of HER

17
was only seen in Cl- containing solutions and in presence of a Mg(OH)2 film57. They measured
the rate of HER on Mg immersed in different types of electrolytes; 0.6 M NaCl, 0.6M NaCl
saturated with Mg(OH)2, 0.1M MgCl2, 0.1M Na2SO4 and 0.1 M TRIS (Tris hydroxymethyl
aminomethane hydrochloride) buffer. They found that enhanced hydrogen evolution was seen
with a solution containing Cl- where Mg(OH)2 was formed on the surface. They mentioned that
slight enhancement of the HER was also seen with Na2SO4 along with Mg(OH)2 on the surface.
However, they did not see enhanced HER in the TRIS buffer solution. This was accompanied
with the fact that the film did not form on the Mg surface in a TRIS buffer. They concluded that
the surface film is mainly Mg(OH)2, and that Cl- ions in the solution are responsible for the
enhanced rates of the HER at the Mg surface. This result was contradictory to a study by Fajardo
et al. which is discussed in the next section.
2.4.3 The role of anodic sites
Finally, the role of anodic dissolution itself has been a subject of study among some researchers.
As mentioned above, Williams et al. reported using SVET that the cathodic activity is seen on
the corroded regions60. Frankel et al. proposed that the exchange current density of hydrogen
evolution on Mg surface increases with the Mg dissolution rate31. In their work, they measured
the hydrogen evolution rate on Mg at different applied potentials. They converted the hydrogen
evolution rate vs potential to a polarization curve (log(i) vs potential). The Tafel slope was
calculated based on the cathodic part (relative to the corrosion potential) of this polarization
curve. They found a rather high value of Tafel slope for cathodic reaction (-0.75 V/dec), but they
did not have an explanation for this behavior. Assuming that the Tafel slope was constant, the
increased rate of the HER was attributed to the increased exchange current density of HER on
Mg (see Tafel equation in section 2.2). In fact, their analysis showed that when an applied anodic

18
current is increased by 10 times, the exchange current density for the HER on a Mg surface
increased by close to 2 orders of magnitude. Fajardo et al. studied the effect of impurities on the
corrosion of high purity (99.98%) and ultra-high purity (99.9999 %) magnesium54. They found
that, while the rate of the HER increased with impurity concentration, the impurities alone did
not explain the enhanced HE rate because high rates of hydrogen evolution were also seen with
ultra-high purity Mg. In another study, Fajardo et al. subjected Mg of ultra-high purity to a net
charge of 6 C/cm2 at different anodic current densities38. During this process, they directly
measured the rate of hydrogen evolution at the Mg surface. Given that the Mg samples were of
ultra-high purity, they reported that the effect of impurities was low. They verified the low
contribution of impurities from polarization experiments in a separate study54. However, the
magnitude of hydrogen volume measured was substantial. They concluded that the cause of
increased HER at the Mg surface is primarily associated with the regions dominated by the
anodic dissolution reaction.
2.4.4 Opportunity for contribution
It can be deduced from the above literature review that the cause of enhanced HER at the Mg
surface during anodic dissolution is still not clear. Even for the proposed causes of enhanced
HER in the literature, there is a disagreement between the role of film (Mg(OH)2)57 and the
anodic regions38, 54, 55. In this work, we used polarization experiments and microscopic analysis
to differentiate and quantify the role of surface films and anodic dissolution in enhancing the rate
of HER at the Mg surface.
Another important area that has not been looked into is the changes in surface roughness that can
occur during the corrosion of Mg. The effect of surface roughness can be quite important in

19
corrosion. In the past, it has been shown that surfaces with low roughness have better resistance
to the corrosion of a Mg alloy (AZ91D)78. Moreover, surface roughness can change the true area
of the electrode and can impact the actual current densities. Mg corrodes at a high rate and
changes in surface roughness can occur rather quickly. It is possible that changes in the surface
roughness with anodic dissolution impact the rate of HER at the Mg surface. Therefore, its
influence must be analyzed in order to better understand the increased HER on Mg surfaces that
accompanies anodic dissolution.
2.5 Galvanic corrosion of Mg
Galvanic corrosion occurs when two dissimilar metals are in contact with the same electrolyte
and are electrically connected. One example of galvanic corrosion is shown in Figure 2-4 below.
Mg is the anode and steel is the cathode. Significant hydrogen evolution (cathodic reaction)
occurs on the steel surface in addition to H2 evolution on the Mg surface. The current flowing
between steel and Mg electrodes is called the galvanic current. In addition to the current flowing
between steel electrode and the Mg electrode (due to HER evolution on the steel electrode), there
is also corrosion of the magnesium associated with hydrogen evolution on the Mg surface itself,
which is sometimes called self-corrosion in the literature41, 42, 79. In general, we have avoided the
use of the term self-corrosion, and refer explicitly to hydrogen evolution rate on the Mg surface
to denote this aspect of the corrosion. Electrical connection was made outside of the solution in
this study in order to enable measurement of the current flowing between the electrodes
(galvanic current). The electrolyte provides an ionic path for current flow while the electrical
connection enables the flow of electrons between the metals.

20
Galvanic corrosion is found to be concentrated near the interface of the anode and cathode
metals. This is because the potential field is highest near the interface and it decreases due to an
ohmic drop in solution as we move farther away from the interface. For example, in a study by
Jia et al., a steel rod (10-30mm diameter) was inserted in a Mg plate (11 cm x 12 cm)41 and
factors that influence the galvanic corrosion were reported. Corrosion of the Mg electrode was
confined mostly to a 1 - 2 cm radial distance from the interface between the Mg and the steel.
Some corrosion was also reported at random locations and was associated with localized
hydrogen evolution on the Mg surface. In another study, Jia et al. found that galvanic corrosion
increased with increasing cathode/anode area, but decreased with the distance between the anode
and the cathode that were electrically connected42, 79. They also found that the galvanic corrosion
was influenced by the relative positioning of coupling cathode metal, the geometry of the
Current due to
the HER at the
Mg surface
Galvanic
current
Total Current
corrosion
Hydrogen
bubbles
Steel Mg
Electrical connection
Electrolyte
Figure 2-4: Schematic diagram of Mg galvanically coupled to steel.

21
electrodes, the depth of the electrolyte solution and accumulation of corrosion products on the
surface.
2.5.1 Review of our previously published galvanic corrosion work
The simulation work (discussed later) in this project follows directly from our previously
published experimental work37. Therefore, it is important to review the experimental work in
order to clearly understand the simulation work later.
In our previously published work, the role of hydrogen evolution during the corrosion of a
galvanically coupled Mg disk (3 mm diameter) to a concentric steel cathode (outer diameter of 8
mm, 12 mm or 16 mm) was examined. In particular, the importance of hydrogen evolution at the
Mg surface was evaluated and quantified. Mg coupled to steel at high cathode-to-anode area
ratios resulted in high corrosion rates at moderate potentials. High rates of HE on the Mg surface
were observed. Specifically, the observed rate of the HER on the Mg surface for coupled Mg
was, on average, one-third of the total corrosion rate for all three of the cathode sizes tested. This
rate varied with time and was found to reach values in excess of 50%. On average, the rate of the
HER on the Mg surface increased with increasing cathode size and, therefore, with increasing
rate of anodic dissolution. This increase in the HER with cathode size was in spite of the fact that
the measured corrosion potential was higher for the larger cathodes.
The surface morphology observed during galvanic corrosion was dramatically different from the
filiform structures associated with free corrosion, which were observed in uncoupled
experiments with our samples, and are consistent with previous studies done on Mg under
similar conditions29. The lack of severe cathodic limitations, avoided with the use of relatively
large steel cathodes, was responsible for this difference in morphology. The morphology

22
observed for galvanically coupled corrosion was also different from the filiform corrosion
observed for freely corroding samples. In contrast, similarities were observed between the
morphology of coupled samples and that seen for uncoupled samples that were anodically
polarized. Our results complemented previous studies of anodically polarized samples while
providing additional insights from a system corroding under more practical conditions.
The fraction of surface corroded was tracked with time and it was observed that the entire Mg
surface was corroded after approximately 1-minute. Measured values of the current and
potential, the galvanic corrosion rate, corrosion due to the HER on the Mg surface and
observations of hydrogen bubbles on the electrode surfaces were be used for comparison to
results from the mathematical model developed in this study.
2.6 Numerical simulation of Mg corrosion
Numerical simulations have the potential to provide predictive capabilities that may be of great
importance in corrosion studies. A precise numerical model can be used to understand the
surface chemistry, current, and potential distribution. Numerical modeling of galvanically
coupled Mg has been done previously to predict the rate of galvanic corrosion39-42. Lacroix et al.
used COMSOL to study the galvanic corrosion of Mg coupled to Al in a weakly conductive
sodium sulfate solution80. Current and potential distributions were obtained from their
simulations. Their results showed that the Mg dissolution rate increased due to the effect of
galvanic coupling.
Jia et al. implemented the Boundary Element Method (BEM) and used a measured polarization
curve to compare numerical and experimental results for the corrosion of a Mg alloy (AZ91D)
galvanically coupled to steel41. They used a rather creative experimental setup (see Figure 2-5) to

23
study the influence of cathode-to-anode area ratios, solution depth, and the distance between the
anode and the cathode. For instance, the galvanic connection between steel-1 and AZ91D-1
provided a smaller distance between the anode and the cathode in the solution than the galvanic
connection of steel-1 and AZ91D-2. Similarly, the connection was configured in different ways
to vary cathode-to-anode area ratios. Thus, with a single sample, they were able to study the
effect of many geometrical factors.
Using both the experimental work and numerical simulation, they observed that the galvanic
corrosion rate increased with increasing cathode-to-anode area ratios. They also observed that a
decreased solution depth and an increased distance between anode and cathode decreased the
corrosion rate. The model underpredicted the experimental results by more than 50% in some
instances, which authors interpreted as evidence for corrosion due to hydrogen evolution on the
Mg surface42.
Figure 2-5: Schematic of cross section of experimental set up used by Jia et al.27 ZRA stands for
zero resistance ammeter.

24
Deshpande et al. also studied the influence of distance between the anode and the cathode and
solution depth using experimental and simulation results40. Their results were similar to those of
Jia et al. where the galvanic corrosion was found to increase with increasing cathode-to-anode
area ratios, decreased solution depth and decreased distance between the anode and the cathode.
In another study, Deshpande et al. used experimental results and numerical simulation to predict
the corrosion rates of Mg galvanically coupled with either steel or aluminum39. They found that
the corrosion rate of a Mg-steel galvanic couple was significantly higher than that of a Mg-Al
galvanic couple. Their model introduced a moving boundary and the ability to track the position
of the corroding Mg surface with time. However, the results showed that the corrosion rates
obtained from the numerical model underpredicted the measurements from immersion
experiments by 20% and 47% for the AE44-mild steel and the AE44-AA6063 couples,
respectively. All of the simulation studies mentioned above used measured polarization curves to
predict the corrosion rates. Therefore, the simulation did not account for the kinetics of the HER
on the Mg surface. It is likely that the inclusion of the HER on the Mg surface in the simulation
will improve the model accuracy, and this was be explored in our simulation work.
Hoche et al. used a time-dependent simulation to study the impact of corrosion products on the
corrosion of Mg coupled to Al. Multiple experiments were performed in an electrolyte layer with
a thickness of 0.4 mm -10 mm. They studied the film (Mg(OH)2) growth rate and its impact on
the Mg dissolution. In the simulation. the film was characterized with respect to its porosity,
tortuosity, surface coverage and electrical resistance. The model was validated quantitatively by
comparing the electrical resistance of the film obtained from the simulation to that obtained from
experimental impedance studies. The film thickness with respect to time along with current and
potential distribution was estimated using the simulation. It was found from the simulation that

25
Mg dissolution was dependent on the surface coverage of Mg by the film, as well as on the
porosity of the film. The film growth depended mainly on the solubility product constant of the
corrosion product43, which was shown to change with Cl- concentration by Williams et al.
previously60. The model did not consider critical issues such as the influence of Cl- on the local
corrosion rates. The influence of hydrogen bubbles was also assumed to be negligible, but its
significance was emphasized. In our study, we quantified the influence of hydrogen bubbles
during the corrosion of Mg coupled with steel.
2.7 Determination of reaction kinetics involved in Mg corrosion
Corrosion is an electrochemical reaction whose rate is controlled by the reactions occurring at
the electrode surface. Corrosion occurs at the potential where the rate of the anodic reaction is
equal to that of the cathodic reaction(s). When performing a simulation, the cathodic reaction (H2
evolution) on both the anode and cathode surface must be defined in order to capture the
influence of the HER on the Mg surface. Experimentally, it is difficult to obtain precise kinetics
for the HER on the Mg surface because the cathodic reaction occurs simultaneously with the
anodic dissolution. The fundamental assumption of determining Tafel kinetics is that the rate of
the reaction is dependent on the surface overpotential. Another assumption of Tafel kinetics is
that the anodic and cathodic reactions are independent of each other. This presents challenges in
determining the reaction kinetics for Mg corrosion. As discussed previously, the anodic and
cathodic reactions of Mg corrosion are oxidation of Mg and reduction of water, respectively. The
equilibrium potential of Mg dissolution is -2.37 VSHE, which means that the anodic reaction will
likely occur at all potentials above this value. Similarly, the equilibrium potential of water
reduction is -0.63 V (at pH 10.6) which means that the cathodic reaction will likely occur at all
the potentials below -0.63 V. Therefore, in order to separate the anodic and cathodic reactions,

26
an overpotential (with respect to the equilibrium potential) in excess of 1.7 V has to be applied.
The overpotential here refers to any potential in excess of an equilibrium potential (see Chapter
Section 2.2) At these high overpotentials, the ability to measure the Tafel kinetics may be easily
influenced by hydrogen bubbles, mass transfer effects and ohmic (IR) drop.
One solution to the problem is to measure the data around the corrosion potential instead of the
equilibrium potential. In general, the anodic reaction is higher than the cathodic reaction at
potentials above the corrosion potential. Similarly, the cathodic reaction is higher than the anodic
reaction at potentials below the corrosion potential. However, one cannot measure a total anodic
or cathodic reaction rate by measuring the current because of the concurrent Mg dissolution.
Therefore, in this work, the rate of reaction was obtained by analyzing the total dissolved Mg
using ICP-MS. We then used the kinetic parameters measured with polarization experiments
(where anodic dissolution rates are low) in our simulation to determine their ability to predict the
rate of HE during the high-rate Mg dissolution observed for our galvanically coupled samples.
2.8 Hydrogen evolution and its influence
As mentioned previously, when Mg is coupled to another metal such as steel, a higher rate of
hydrogen evolution is seen due to the increased cathodic area and possibly faster hydrogen
kinetics on the coupled metal. The substantial presence of gas bubbles in the solution, especially
near the electrode surface, can decrease the corrosion rate (relative to that during the absence of
bubbles) by reducing the solution conductivity. The influence of bubbles during the free
corrosion of Mg is not very significant because the anodic and cathodic reactions occur on the
same surface. During galvanic corrosion, the anode and cathode are separated and the solution
conductivity affects the movement of ions. Therefore, the impact of hydrogen bubbles is more

27
prominent when Mg is coupled to another metal. However, the influence of hydrogen bubbles on
the solution conductivity and corrosion rates has not been studied in detail. The solution
conductivity is dependent on the volume fraction of hydrogen bubbles in the solution as shown
by the Bruggeman equation below81,
𝑘𝑒 = 𝑘(1 − 𝑓𝑔)3
2 (9)
where, 𝑘𝑒= effective conductivity, 𝑘 is the conductivity of the solution in absence of bubbles,
and 𝑓𝑔 is the fraction of gas bubbles. Inclusion of the effect of hydrogen bubbles in the
simulation will lead to more precise numerical models. It will also help us to understand the
factors that control galvanic corrosion of Mg.
2.9 Summary
From the literature review, it is apparent that the fundamental understanding of Mg corrosion
remains short. In this work, we have reported the influence of surface changes on the kinetics of
the reactions involved in the Mg corrosion. The kinetics of HER at the Mg surface is determined
using the concurrent Mg dissolution at the cathodic potentials. The importance of including
concurrent Mg dissolution in determining the HER kinetics on Mg is highlighted.
We have also studied the enhanced HER seen at the Mg surface during the high anodic
dissolution rates. The role of surface roughness is presented. We have used creative experiments
to quantify the role of film and impurities towards the enhanced HER at the Mg surface. The role
of anodic dissolution itself in catalyzing the HER at the Mg surface is also reported.
The work also uses numerical simulation to predict the galvanic corrosion of Mg. The
shortcomings of previous models are recognized and improvements are made to increase the

28
model precision. Moreover, the kinetics of HER during high anodic dissolution is further
explored using the simulation. For the first time, the influence of hydrogen evolution during the
corrosion of galvanically coupled Mg is analyzed and reported.

29
3 THE KINETICS OF REACTIONS INVOLVED IN MG CORROSION
3.1 Introduction
Corrosion is an electrochemical process whose rate is controlled by the reactions occurring at the
electrode surface. Therefore, understanding the reaction kinetics are key to understanding the
corrosion mechanism and the factors that may control the corrosion process. Moreover, accurate
reaction kinetics are key to developing precise numerical models.
Experimentally, it is difficult to obtain precise kinetics for the HER on the Mg surface because
the cathodic reaction occurs simultaneously with the anodic dissolution31, 55. As discussed in
Chapter 2, the fundamental assumption of determining Tafel kinetics is that the rate of the
reaction is dependent on the surface overpotential (see Chapter 2, Section 2.2). Another
assumption of Tafel kinetics is that the anodic and cathodic reactions are independent of each
other. This presents challenges in determining the reaction kinetics for Mg corrosion because
high overpotential (1.7 V with respect to equilibrium potential) has to be applied to separate the
anodic and cathodic reactions. The overpotential here refers to any potential in excess of an
equilibrium potential (see Chapter 2, Section 2.2). At these high overpotentials, the ability to
estimate the Tafel kinetics may be easily impacted by hydrogen bubbles, mass transfer effects
and ohmic (IR) drop. One solution to the problem is to measure the data around the corrosion
potential instead of the equilibrium potential. In general, the anodic reaction is higher than the
cathodic reaction at potentials above the corrosion potential. Similarly, the cathodic reaction is

30
higher than the anodic reaction at potentials below the corrosion potential. However, one cannot
measure a total anodic or cathodic reaction rate by measuring the current because of the
concurrent Mg dissolution. Therefore, in this work, the rate of reaction was obtained by
analyzing the total dissolved Mg using ICP-MS.
Previously, the rate of the HER at the Mg surface has been shown to be higher in the corroded
areas than in the non-corroded areas34, 76. Such observations are critical because the surface
changes can occur during the measurement of kinetics and influence the results. In order to
counter such effects, the samples were pre-corroded prior to kinetics measurement in this work.
The influence of surface changes and hydrogen bubbles on the kinetics of Mg reactions are also
discussed.
3.2 Experimental methods
A Mg rod (Solution Materials LLC), with a diameter of 3 mm, was used as a rotating disk
electrode (RDE). The main impurities in the Mg were Zn (0.005%), Mn (0.005%), Si (0.004%),
Fe (0.003%), Ca (0.003%) and Al (0.002%). All experiments were performed using a rotating
disk apparatus (Pine Instruments) and a potentiostat (263A, Princeton Applied Research). In
order to obtain a polished surface, the Mg surface was first polished with a 600 grit sandpaper
using a Buehler Ecomet 2 polishing wheel (240 rpm) and an Automet 2 rotator head (120 rpm) in
a clockwise direction. The surface was subsequently polished using 3-micron and 1-micron
diamond paste (Ted Pella) on a polishing cloth (Buehler) with both the wheel and head rotating
at 120 rpm in a counterclockwise direction. The pressure used in each step of polishing was 10
psi. The images of the Mg surface after each polishing step are shown in Figure 3-1 below.

31
In order to represent severe corrosion environment, experiments were done in 5 wt% NaCl
electrolyte41 with a starting pH of ~10.6. The conductivity of the solution was approximately
7.95 S/m. The experimental set up is shown in Figure 3-2.
The working electrode was placed between the reference and the counter electrodes. The
reference electrode was exactly 2.5 cm away from the working electrode, which facilitated the
Computer
Rotator
Pt counter electrode
Mg working electrode
SCE ref. electrode
5 wt. % NaCl electrolyte
Potentiostat
Figure 3-2: Schematic of experimental set up and electrodes configuration.
Figure 3-1: Image of Mg surface after polishing with a) 600 grit sandpaper b) 3 micron
diamond paste and c) 1 micron diamond paste.
a)
)
b) c)

32
calculation of the IR drop associated with the potential measurements. This distance was 20
times the radius of the working electrode. All experiments were conducted at 1000 rpm rotating
clockwise. Polarization experiments were conducted from a lower potential towards a higher
potential with a scan rate of 1 mV/s. A Saturated Calomel reference electrode (SCE, BioLogic)
was used. A 10% chromic acid was used to remove films formed on corroded samples. Chromic
acid corrodes Mg at a very low rate and is often used to remove corrosion products from Mg
without significantly attacking the substrate metal3, 57. Images were taken with optical
microscopes (Axio Vertical A1 - Zeiss and Zeta 20 - Zeta Instruments).
3.3 Results and discussions
Experiments were designed to study the effect of surface changes on the reaction kinetics of Mg
corrosion. Experiments were also designed to estimate the kinetics of the hydrogen evolution
reaction on Mg surface. The challenges of hydrogen bubbles sticking to the surface of Mg are
also discussed.
3.3.1 Influence of hydrogen bubbles
At a lower rotation speed (<1000 rpm) of the RDE, occasionally bubbles were seen (with the
naked eye) sticking to the surface of the electrode for multiple experiments. Because of this,
experiments were not repeatable at speeds below 1000 rpm. Marco et al. observed similar
behavior for Mg electrodes 82. We observed good repeatability at 1000 rpm or higher. Therefore,
a rotation speed of 1000 rpm was chosen to do the experiments. Figure 3-3 shows the impact of
bubbles sticking to the surface of a Mg electrode. Note that the “i” in the x-axis represents the
current densities.

33
The noise seen in Figure 3-3 is due to the bubbles accumulating at the Mg surface. The bubbles
that stick to the surface of the electrode resist the flow of current and noise similar to that in
Figure 3-3 is often seen. Most of the time, the bubbles were seen (with the naked eye) sticking to
the surface of Mg at the high cathodic and anodic overpotentials. After increasing the speed of
the RDE to 1000 rpm or above, the bubbles did not stick to the Mg surface and the polarization
curve did not show any noise (see Figure 3-3).
3.3.2 The polarization behavior observed for polished and pre-corroded surface
The polished sample was obtained using the methods described in Section 3.2. In order to pre-
corrode the Mg surface, a constant anodic current was applied for a specific amount of time until
all of the Mg surface was corroded. An entirely corroded Mg surface was achieved by trial and
error. Some of the images of the Mg surface during the trial and error process are shown in
-2.4
-2.2
-2
-1.8
-1.6
-1.4
-1.2
0.001 0.01 0.1 1 10 100 1000
Pote
nti
al (
Vsc
e)
log (i), A/m2
at RPM below 1000
at RPM greater than or
equal to 1000
Figure 3-3: Impact of hydrogen bubbles at low rotating speeds.

34
Figure 3-4. The polished Mg surface is shown in Figure 3-1 and an entirely corroded Mg surface
is shown in Figure 3-4c below.
In order to observe the effect of pre-corrosion, polarization experiments for a polished Mg
surface and a pre-corroded Mg surface were performed. The polarization experiment was run as
described in section 3.2 and the results obtained for polished and corroded Mg electrodes are
shown in Figure 3-5 below.
Figure 3-5: Polarization behavior of polished and corroded Mg surface.
Figure 3-4: Pre-corroded Mg surface obtained by applying 1981A/m2 for a) 20 sec b) 50 sec and c)
77 sec.
200 µm
a) b) c)
-2.6
-2.1
-1.6
-1.1
0.001 0.01 0.1 1 10 100 1000
Pote
nti
al, (V
sce)
log(i), A/m2
IR-corrected Polished Mg surfaceIR-corrected Corroded Mg surfacePolished Mg surface 1Corroded Mg surface 1Polished Mg surface 2Corroded Mg surface 2

35
As shown in Figure 3-5, excellent repeatability was observed during the experiments. The actual
Mg dissolution rate was higher due to the Mg dissolution associated with hydrogen evolution on
the Mg surface itself, which dissolution is not included in the current measured by the
potentiostat. For a polished Mg electrode, there was a unique behavior in the anodic region. After
the corrosion potential, the anodic current increased as expected. However, further acceleration
of the corrosion rate was seen at a potential of approximately -1.6 V (vs SCE). Similar behavior
was observed in some of the previous studies23, 82-84 but this has not been discussed in detail for
pure Mg. For an alloy (AZ91), Shi et al. reported that such potential where the rate of corrosion
accelerates is called the pitting potential and the behavior can be caused by the accelerated
micro-galvanic corrosion near the matrix of the base metal and the alloyed metal83. In another
study, it is reported that the pitting potential is close to the corrosion potential for a Mg alloy
(AZ31 and AZ91) and therefore, is not visible in the polarization plots. In order to analyze the
surface changes that occur at this potential, the Mg electrode was taken out of the solution as
soon as the current started to increase (see polarization curve of polished Mg in Figure 3-5) and
analyzed under an optical microscope. The image of the Mg surface right at the start of the
increased current is shown in Figure 3-6 below.
Figure 3-6: Surface of Mg electrode at the initiation of corrosion acceleration near the potential
of 1.6 V (vs SCE) in the anodic curve of Figure 3-5.

36
It can be seen from the Figure 3-6 that the corrosion pits had just initiated. A polished Mg
surface is protected by a natural oxide. The oxide breaks down with anodic polarization and also
in a solution containing Cl-. The breakdown of oxide increases the rate of Mg corrosion.
Therefore, the accelerated corrosion of polished Mg surface at 1.6 V (vs SCE) is likely a pitting
potential for Mg where the protective natural oxide completely breaks down and the rate of
corrosion increases substantially. This behavior was not observed for pre-corroded Mg electrodes
because the oxide film was not present in those samples. After the pitting potential, the anodic
curve of a polished surface had similar Tafel slope as compared to that of the pre-corroded
samples. The Tafel slope in the anodic region was found to be ~0.11 V/dec which is close to data
found in previous studies85. The influence of the concurrent Mg dissolution is not considered in
the polarization measurements.
In the cathodic region, the HER kinetics of a polished Mg surface and a pre-corroded Mg surface
were very different. Both Tafel slope and corrosion potential for a pre-corroded Mg surface are
substantially different than those for a polished surface. The cathodic Tafel slope is observed to
be higher for a polished surface (-0.47 V/dec) than for a pre-corroded surface (-0.2 V/dec). A
lower Tafel slope on a pre-corroded Mg surface means that the kinetics of hydrogen evolution on
a pre-corroded Mg surface is higher than that on a polished Mg surface. Moreover, the corrosion
potential of a polished (-1.8 Vsce) surface is much lower than that of the corroded surface (-1.6
Vsce). A corrosion potential reflects the balance between the anodic and the cathodic reactions. A
negative shift in corrosion potential (as seen for a polished surface) suggests an increase in the
rate of an anodic reaction or a decrease in the rate of a cathodic reaction. Similarly, a positive
shift in corrosion potential (as seen for pre-corroded samples) suggests an increase in the rate of
a cathodic reaction or a decrease in the rate of an anodic reaction. Therefore, the kinetics of

37
hydrogen evolution on a pre-corroded Mg surface is higher. This observation supports previous
studies where higher rates of HER were seen in the corroded regions of Mg surface29, 30, 33-36, 60,
76, 86.
Figure 3-5 shows the effect of an IR-drop as well. Despite using a small electrode (diameter = 3
mm) and an electrolyte with high conductivity (7.95 S/m), there was a noticeable influence of an
IR drop in anodic curves for both a polished and corroded Mg electrode. In the cathodic region,
there was no significant effect of an IR drop for the polished surface since the current densities
are lower as compared to those for the pre-corroded surface. For the corroded surface, the
influence was noticeable only at high cathodic potentials.
At the high anodic potentials, the current densities remained relatively constant with increased
potentials. Upon examination of the Mg surface at a high potential, it was seen that the Mg
surface was covered with a thick white film as shown in Figure 3-7.
Such films have been reported to passivate the surface and decrease the corrosion rate of Mg37, 46,
47, 59. Kim et al. suggested that such film resists the diffusion of Cl- ions through the film which
results in a passivation effect18. This is the likely reason for the small change in current densities
400 µm
Figure 3-7: Thick film observed on the Mg surface at high anodic overpotentials.

38
at high anodic potentials. Overall, the results here show that the kinetics of Mg corrosion are
influenced by the surface changes and the measurement of such kinetics are likely impacted by
the IR drop at high overpotentials.
3.3.3 Determination of Tafel kinetics of hydrogen evolution reaction on Mg surface
In previous studies, in order to obtain the kinetics of the HER at the Mg surface, the polarization
was measured in the cathodic region with respect to the corrosion potential of Mg39, 41, 42. The
kinetics extracted from a typical polarization curve does not factor into account the additional
current due to the concurrent Mg dissolution. In this study, the effect of the concurrent Mg
dissolution is considered. The Tafel kinetic parameters for a hydrogen evolution reaction on a
pre-corroded Mg surface were determined. The pre-corroded Mg electrode was cathodically
polarized with respect to the corrosion potential. Three different constant potentials were applied
for three minutes and the current behavior with time was monitored. The current vs. time
behavior for different applied potentials is shown in Figure 3-8 below.
0
5
10
15
20
25
30
35
0 50 100 150 200
Curr
ent
den
sity
(A
/m2)
Time (sec)
-1.79 V
-1.73V
-1.68 V
Figure 3-8: Current behavior with time for applied potential.

39
Figure 3-8 shows the current densities measured in response to the potential that was applied. In
general, the current densities stayed constant with time. The current density due to the concurrent
Mg dissolution is not reflected in the above plots. In order to account for the current density due
to the concurrent Mg dissolution, the solution was analyzed using ICP-MS and the amount of Mg
corroded was estimated. Using Faraday’s law, the current densities due to the concurrent Mg
dissolution were calculated and added to the average current densities obtained from the
potentiostat (see Figure 3-8). Using the average current for an applied potential, the Tafel plot as
shown in Figure 3-9 was generated.
In Figure 3-9, the line with a triangle represents the plot of current densities obtained from the
potentiostat for given applied potentials. This plot does not include any current density due to the
Figure 3-9: Tafel plot of hydrogen evolution reaction on pre-corroded Mg surface. Both the plots
are IR corrected.
-1.8
-1.78
-1.76
-1.74
-1.72
-1.7
-1.68
-1.66
1 10 100
Pote
nti
al (
Vsc
e)
Current density (A/m2)
With concurrent Mg
dissolution
Without concurrent Mg
dissolution

40
concurrent Mg dissolution. The line with a circle represents the plot with total current densities.
The excel line fit provided an R2 value of more than 0.99 for all the plots. The slopes of the line
with and without the consideration of the concurrent Mg dissolution were 0.14 V/dec, and 0.27
V/dec, respectively.
In the literature20, 31, 87, 88, Tafel slopes for polished Mg surfaces obtained from typical
polarization experiments without the correction for concurrent Mg are in the range of -0.032
V/dec to -0.583 V/dec. However, the Tafel slopes for pre-corroded Mg electrode are not
available. Here it is shown that the Tafel slope is significantly lower for a pre-corroded Mg
electrode. Moreover, it is also shown that the impact of the concurrent Mg dissolution must be
taken into effect for precise calculations of Tafel kinetics. The actual value of Tafel slope
decreases by a factor of 2 upon adding the current due to independent hydrogen evolution. This
is despite the fact that the data was obtained below the corrosion potential of Mg where the rate
of the concurrent Mg dissolution is low.
3.3.4 Determination of Tafel kinetics for Mg dissolution reaction
In order to determine the Tafel kinetics for a Mg dissolution, a similar approach to the one
described in Section 3.5 was taken. The samples were pre-corroded by applying a constant
current and the potential was monitored with the amount of charge passed. The behavior of
potential with charge for a constant applied anodic current is shown in Figure 3-10 below. It can
be seen in Figure 3-10 that the potential observed at a constant current increased substantially
with the amount of charge passed. This was due to the accumulation of corrosion products (dark
film in this case) on the Mg surface that increased the overpotential required to further dissolve

41
the Mg38. A dark film associated with Mg corrosion is commonly seen34, 38, 54 and is also shown
for our sample in Figure 3-4c.
The difference in maximum and minimum potential measured was more than 120 mV. This is a
significant change in potential observed in response to the applied constant current. Therefore,
determining the Tafel kinetics of the Mg dissolution reaction by this method will likely result in
significant errors. Hence, the use of this method to determine the kinetics of the Mg dissolution
reaction is not recommended.
3.4 Conclusions
In this chapter, it is shown that various factors can affect the reaction kinetics of the Mg
dissolution. The surface changes, IR drop, and the concurrent Mg dissolution on Mg surface can
all impact our ability to precisely measure the reaction kinetics. The Tafel slope of the HER at
the pre-corroded Mg surface was substantially lower (0.27 mV/dec) than at the polished Mg
Figure 3-10: Potential behavior with charge passed for an applied anodic constant current (14 mA).
-1.45
-1.4
-1.35
-1.3
-1.25
-1.2
-1.15
-1.1
-1.05
-1
0 0.2 0.4 0.6 0.8 1 1.2
Pote
nti
al (
Vsc
e)
Charge applied (C)

42
surface (0.47 mV/dec). The influence of an IR drop was shown to be significant at high current
densities (>100 A/m2). The effect of the concurrent Mg dissolution on the HER kinetics at the
Mg surface (using ICP-MS) were also found to be significant. When the concurrent Mg
dissolution was considered, the actual value of the Tafel slope was found to be ~2 times lower
than the value determined without accounting for the concurrent Mg dissolution. It is
recommended that the effect of the concurrent Mg dissolution and the IR drop be taken into
effect to obtain precise Tafel kinetics. Doing so will reduce errors associated with models where
Tafel kinetics are used to predict the Mg corrosion rates.
The work in this Chapter closely relates to the subsequent Chapters. The experimental methods
discussed in this chapter are used to represent the work of the next Chapter (Chapter 4). The
kinetics of the HER at the Mg surface determined in this Chapter is used in the simulation in
Chapter 5 and Chapter 6.

43
4 THE INFLUENCE OF SURFACE ROUGHNESS AND ANODIC DISSOLUTION
ON THE HYDROGEN EVOLUTION AT THE MG SURFACE
4.1 Introduction
In Section 2.4 of Chapter 2, we reviewed the literature on the enhanced hydrogen evolution
reaction (HER) on Mg surfaces29-36, 57, 59, 60, 68, 86. A short summary of the review is presented
here. Contrary to the standard electrochemical kinetics, the cathodic reaction at the Mg surface
(i.e. the HER) increases with the increasing anodic potential. Several theories have been
proposed to explain this behavior. The proposed theories in the literature can be narrowed down
to three key areas: 1) surface impurities 2) surface films and 3) anodic regions.
During the corrosion of Mg, impurities get exposed on the surface as the base metal dissolves30,
34. These impurities, which are more noble than Mg, can act as cathodic sites and sustain the
HER. Although enrichment of surface impurities can be seen on the corroded regions of the Mg
surface, its ability to sustain enhanced HER during the anodic dissolution has been shown to be
poor54. Moreover, enhanced HER was also seen with ultra-high purity (99.9999 wt.%) Mg where
the role of impurities was found to be minimal38, 54. Several studies have attributed enhancement
of the HER to a film (Mg(OH)2)57. However, a study by Fajardo et al. showed that the film
(along with the impurities) makes only a small contribution towards the enhanced HER at the
Mg surface38. In their study, the Mg samples were corroded at different current densities. The
amount of charge passed to each sample was constant. A scanning vibrating electrode technique
(SVET) was used to obtain local current densities. They reported that the corrosion started with

44
net anodic local sites. As the net anodic sites progressed across the Mg surface, regions
dominated by net cathodic activity were left behind. It was shown that the anodic regions
increased with increased anodic dissolution rate. Therefore, they attributed the enhanced HER
during the increased anodic dissolution to be associated with the anodic regions. However, their
analysis of the contribution of the film towards the enhanced HER may not be entirely
accurate57.
In order to analyze the contribution of the film, they measured the cathodic polarization of the
samples after the pre-corrosion at the different rates. Although they mentioned that the cathodic
polarization was measured immediately following the anodic dissolution, they started the
cathodic polarization in a fresh solution. Therefore, it is likely that a few minutes had elapsed
(although the exact time was not provided) between the anodic dissolution and the cathodic
polarization. It is possible that the behavior of film is different during the anodic dissolution as
compared to that during the cathodic polarization (where a high rate of anodic dissolution is
absent). Moreover, the surface of the Mg sample in their study was only partially corroded. The
fraction of the surface that corroded varied despite the equal amount of charge passed on to each
sample. The HER kinetics are shown to be higher in the corroded areas. Therefore, it is
important to control the sample surface as much as possible in order to study the impact of
impurities and film. Their study also did not present any kind of quantitative image analysis of
the surface film seen for samples during the various anodic dissolution rates or during the
cathodic polarization that may have provided additional insights about the role of surface films.
In this work, we have used creative experiments to analyze the behavior of HER at the Mg
surface immediately following anodic dissolution. The samples are first pre-corroded at different
rates until the entire Mg surface was corroded. The charge passed on each sample was equal.

45
Immediately following pre-corrosion at anodic potentials, the HER current was observed at a
constant cathodic potential (with respect to the corrosion potential). The time for the switch from
anodic potential to cathodic potential was less than 2 seconds and the sample was never taken out
of the solution. The aim of this step was to observe any residual effect of the anodic dissolution
on the behavior at the cathodic overpotential. This behavior was then compared with the
cathodic polarization measurements performed some time after the pre-corrosion. Our results
clarify the contribution of film and impurities extrapolated from the cathodic polarization (where
high anodic dissolution is absent) are representative of that during the high anodic dissolution
rates. Optical and SEM images were used to examine the film morphology at various times
during the experiments.
Another important area that has not been looked into is the changes in surface roughness that can
occur during the corrosion of Mg. In the above-mentioned study by Fajardo et al., the samples
showed variation in the fraction of the surface corroded despite applying the equal charge.
However, the influence of surface roughness was not reported. The surface roughness effect can
be quite important in corrosion. In the past, it has been shown that surfaces with low roughness
have better resistance to the corrosion of a Mg alloy (AZ91D)78. Moreover, surface roughness
can change the true area of the electrode and can impact the actual current densities. Mg corrodes
at a high rate and the changes in surface roughness can occur rather quickly. Therefore, in this
work, the influence of surface roughness is analyzed in order to better understand the increased
HER at the Mg surface with increased anodic dissolution.

46
4.2 Experimental methods
The experimental methods, including details about solution concentration and pH, were
described in Section 3.2 of Chapter 3. The surface roughness was analyzed using an optical
profilometer (Zeta 20, Zeta instruments). The instrument uses light wave properties and
compares the path difference between a test surface and a reference surface. Using constructive
and destructive interferences between the light wave reflected from the test surface and the
reference surface, the height difference from a plane is calculated. The Scanning Electron
Microscopy (SEM) images in this chapter were taken with FEI Helios NanoLab 600.
One of the purposes of designing the polarization experiments was to study the influence of
surface roughness on the increased HER observed during the anodic dissolution of the Mg. As
mentioned in Chapter 2, the HER at the Mg surface may be influenced by film formation and by
impurities. Therefore, it was important to control the surface as much as possible in order to
independently analyze the effect of surface roughness and anodic dissolution. In order to do this,
the Mg samples were pre-corroded at three different rates until the entire Mg surface was
corroded. As described in Chapter 3, this was determined by trial and error. The three different
galvanostatic current densities applied to pre-corrode a 3 mm (diameter) Mg were 283 A/m2,
1132 A/m2, and 1981 A/m2. For each sample, the total charge applied was constant (1.08 C). It
should be noted that there is additional corrosion associated with the HER on the Mg surface that
was not accounted for in the measurement of the charge passed. ICP-MS analysis of the total
dissolved Mg in the solution showed that for a current density of 19801 A/m2, the fraction of the
total corrosion caused by the additional HER at the Mg surface was roughly 16%. This
represents a reasonable estimate of the potential error, which would underpredict the amount of
charge associated with Mg corrosion by about 16%. Immediately following anodic dissolution at

47
different rates, the behavior of the current was observed at a constant cathodic potential (with
respect to corrosion potential or the equilibrium potential of Mg) for 10 minutes. The goal of this
step was to observe any residual effects of the anodic dissolution immediately following the
corrosion of the sample at different rates. The experiments were also run for different amounts
of time to observe the Mg surface under an optical and electron microscope. The surface
roughness was quantified as well.
4.3 Results and discussion
4.3.1 The impact of anodic dissolution on the HER determined potentiostatically
For each of three applied current densities, the potential behavior was recorded during anodic
dissolution. Please refer to the previous section and Chapter 3 for details on the experimental
procedure. The potential behavior as a function of the amount of charge passed is shown for each
sample in Figure 4-1. A replicate for each rate is shown to demonstrate the repeatability of the
experiments.
Figure 4-1: Potential observed in response to anodic current applied to Mg samples.
-1.7
-1.6
-1.5
-1.4
-1.3
-1.2
-1.1
-1
0 0.2 0.4 0.6 0.8 1 1.2
Pote
nti
al (
Vsc
e)
Charge applied (C)
283 A/m² (1) 283 A/m² (2)
1132 A/m² (1) 1132 A/m² (2)
1981 A/m² (1) 1981 A/m² (2)

48
As shown in Figure 4-1, good repeatability was observed for each experiment. For each rate, it
was seen that the potential observed at constant current increased with the amount of charge
passed. This was due to the accumulation of corrosion products (dark film in this case) on the
Mg surface that increased the overpotential required to further dissolve the Mg38. A dark film
associated with Mg corrosion is commonly seen34, 38, 54. We refer to the galvanostatic dissolution
of the Mg at the relatively high rates shown in Figure 4-1 as pre-corrosion. The pre-corrosion
step was performed for a length of time sufficient to corrode the entire surface of the sample,
which is an important aspect of these experiments.
Immediately after pre-corroding the Mg electrodes, a constant cathodic potential (-1.7 Vsce) was
applied and the current behavior was observed. As discussed earlier, at the cathodic potential, the
rate of the HER may be influenced by factors such as the concentration of impurities and film
formation that took place as the result of anodic dissolution during the pre-corrosion step. By
immediately dropping the potential from the anodic (pre-corrosion) value to a value below the
corrosion potential, it should be possible to observe any residual effect of the pre-corrosion on
the HER. The residual effect here refers to any catalytic role of anodic dissolution that leads to
enhancement of the HER at cathodic potential upon immediately switching from the anodic to
cathodic potential. Please note that the time required to make the switch was less than 2 seconds,
and the samples were never taken out of solution. The current density recorded at -1.7 Vsce after
pre-corrosion at constant current is shown in Figure 4-2 as a function of time for each of the
three pre-corrosion current densities.

49
In Figure 4-2, as the potential transitions from anodic to cathodic (with respect to corrosion
potential), the cathodic current density quickly reaches a peak current and then decreases with
time. The peak current is proportional to the magnitude of current density at which the sample
was pre-corroded. At longer times, the current densities decrease for all samples, and all samples
converge to a similar value at long times. One could argue that the decrease in the current
densities during this cathodic polarization is typical of electrochemical systems where mass
transfer effects are important. However, such effects are not present in this scenario as the
electrode used is a RDE. Moreover, the mass transfer effects for hydrogen evolution (due to
water reduction) are not important due to the adequate presence of water in the solution.
The fact that the current densities for all three samples converge to a similar value at long times
is important because it is a strong indication that the peak current is caused by the residual effect
of prior anodic dissolution rate. Another key observation is that the behavior of a cathodic
Figure 4-2: Current behavior observed at constant cathodic potential (-1.7 Vsce ) immediately
following the anodic dissolution for samples pre-corroded at different rates. Note that the negative
sign represents the cathodic current densities.
-200
-180
-160
-140
-120
-100
-80
-60
-40
-20
0
0 100 200 300 400 500 600
Curr
ent
Den
sity
(A
/m2)
Time (sec)
283 A/m²
1132 A/m²
1981 A/m²

50
polarization of the Mg sample immediately following an anodic dissolution is different from the
one measured after some time. Therefore, the analysis done by Fajardo et al. to quantify the role
of the surface film may not be entirely accurate.
In order to truly confirm that the peak current was caused by the residual effect of prior anodic
dissolution itself, it was important to separate the effects of surface changes that occur during the
pre-corrosion and cathodic polarization. For example, in Figure 4-2, it is important to know if the
surface at the start of cathodic polarization (at t=0 sec) and at the end of the cathodic
polarization(t=600 sec) are different. The properties of the surface provide insight into the
mechanism by which the peak current was influenced by anodic dissolution, an influence that
remained throughout the initial times of cathodic polarization. It was also important to
understand the influence of the dark film on hydrogen activity. The optical images of the Mg
surface at various times during the experiments are shown in Figure 4-3.
In Figure 4-3, a dark film was seen on the surface of the Mg after pre-corrosion at all rates. The
film remained intact through the 10 minutes of cathodic polarization. Upon removal of the film,
large pits were seen on the surface of the sample corroded at the lowest rate. Although the
applied charge on each sample was equal, the sample corroded at a lower rate showed more non-
corroded areas. A similar observation was made in previous studies, although those studies
showed corrosion on a much smaller fraction of the surface38, 54. One explanation is that the HER
at the Mg surface increases with the anodic dissolution rate. This would mean that the sample
pre-corroded at a higher rate would have a higher total corrosion rate in spite of the equal charge
applied. Moreover, the surface roughness (discussed later) could also be different.

51
The fraction of total surface corroded was quantified using Matlab imaging (described
elsewhere37) and the results are reported in Table 4-1.
Figure 4-3: Top row - Optical images of Mg surface after pre-corrosion at different rates. Middle
row- Optical images of Mg surface after pre-corrosion and 10 minutes of cathodic polarization at -
1.7 Vsce at different rates. Bottom row- Optical images of Mg surface after pre-corrosion at
different rates and removal of dark film. For each row from left to right, the images are in
increasing rates of pre-corrosion; a/a1/a3 at 283 A/m2, b/b1/b3 at 1132 A/m2 and c/c1/c3 at 1981
A/m2.
a) c) b)
150 µm 150 µm 150 µm
150 µm 150 µm 150 µm
a1) b1) c1)
a3) b3) c3)

52
Table 4-1: Fraction of total surface corroded for Mg surface mentioned in Figure 4-3
283 A/m² 1132 A/m² 1981 A/m²
After pre-corrosion 95.1% 99.6% 99.8%
After pre-corrosion and 10 minutes of cathodic polarization
97.9% 99.0% 99.2%
After pre-corrosion and film removal
96.6% 99.5% 99.1%
It can be seen from Table 4-1 that the sample corroded at the lowest rate had the least fraction of
total surface corroded. There was not an appreciable difference in the fraction of surface
corroded for the samples pre-corroded at higher rates. A slight increase in the fraction of surface
corroded was seen during the 10 minutes of cathodic polarization for the sample pre-corroded at
the lowest rate. However, such a trend was not seen for the other two samples as they were
already completed corroded. Please note that some sample-to-sample variation is expected since
the sample “after pre-corrosion” is not the same sample “after pre-corrosion and 10 minutes of
cathodic polarization” or “after pre-corrosion and film removal”.
SEM images were also used to gain further insight into the different morphology of the surfaces.
These images are shown in Figure 4-4. In Figure 4-4, for the samples with the film, there is not
an appreciable difference in morphology evident from the images. The images with the film are
similar to those obtained for Mg corrosion products in earlier studies by others62, 89. The samples
without the film differ from those with the film; however, no appreciable morphological
difference between the samples after film removal was apparent from the SEM images.

53
In order to quantify the surface roughness of each sample, the 3D view of the surface was
generated using Zeta-20 optical profilometer. The results are shown in Figure 4-5.
Figure 4-4: Top row - SEM images of Mg surface after pre-corrosion at different rates. Middle
row- SEM images of Mg surface after pre-corrosion and 10 minutes of cathodic polarization at -1.7
Vsce at different rates. Bottom row- SEM images of Mg surface after pre-corrosion at different rates
and removal of dark film. For each row from left to right, the images are in increasing rates of pre-
corrosion; a/a1/a3 at 283 A/m2, b/b1/b3 at 1132 A/m2 and c/c1/c3 at 1981 A/m2.
a) c) b)
a1) b1) c1)
a3) b3) c3)

54
In Figure 4-5, all of the X, Y and Z scales are the same in order to facilitate comparison. The XY
plane represents the dimensions of the surfaces shown in Figure 4-3. This is same for each
sample because equal magnification was used to take these images. The Z height is set manually
for each sample and it consists of a range within which the bottom and top focal point of the
images are included. The 3D image is then formed between the bottom focal point of the image
a) b) c)
a1) b1) c1)
a2) b2) c2)
Figure 4-5: 3D images of Mg surface after pre-corrosion at different rates. Middle row- 3D images
of Mg surface after pre-corrosion and 10 minutes of cathodic polarization at -1.7 Vsce at different
rates. Bottom row- 3D images of Mg surface after pre-corrosion at different rates and removal of
dark film. For each row from left to right, the images are in increasing rates of pre-corrosion;
a/a1/a3 at 283 A/m2, b/b1/b3 at 1132 A/m2 and c/c1/c3 at 1981 A/m2.

55
to the top focal point of the image. For each image, the Z range was set to ~360 µm for
comparison. The 3D images show that in general, the roughness of the sample decreases with the
increased rate of pre-corrosion. The surface roughness was quantified using a line scan on the
images shown in Figure 4-5. The results are shown in Figure 4-6. In Figure 4-6, please note that
the plots show an equal X and Y scale for all the line scans. Several line scans were taken along
the surface to make sure that the results were repeatable. It can be seen that the average
difference in Z height decreased with the increasing rate of corrosion. In addition, the roughness
was quantified by taking an average of 10 different step heights in a 900 µm line scan for each
image shown in Figure 4-5. It was assumed that the step height corresponded to the surface
roughness. The results are shown in Figure 4-7. It can be seen from Figure 4-7 again that the
surface roughness decreased with the increased corrosion rate. There is no statistical difference
in surface roughness between the samples after the pre-corrosion and those after the pre-
corrosion and 10 minutes of cathodic polarization. The surface roughness, however, decreased
after the removal of the film for all samples. This indicates that the film may also contribute to
the surface roughness of samples with the film. It is clear from the 3D images and surface
roughness analysis, that the surface roughness decreased with an increased pre-corrosion rate.
Assuming that the surface roughness increases the active area for the HER, the trends in the peak
current densities observed in Figure 4-2 cannot be explained by surface roughness. In fact, the
trend is quite the opposite, as a higher roughness is seen for the sample pre-corroded at a lower
rate. However, the peak current density increased with the rate of pre-corrosion.

56
0
50
100
150
200
250
300
350
0 200 400 600 800 1000 1200
Ran
ge
of
focu
s (µ
m)
Distance along the length of line scan (µm)
283 A/m²
1132 A/m²
1981 A/m²
0
50
100
150
200
250
300
350
0 200 400 600 800 1000 1200
Ran
ge
of
focu
s (µ
m)
Distance along the length of line scan (µm)
0
50
100
150
200
250
300
350
0 200 400 600 800 1000
Ran
ge
of
focu
s (µ
m)
Distance along the length of line scan (µm)
a)
b)
c)
Figure 4-6: Surface roughness along a 900 µm line scan of Mg surface after a) pre-corrosion at
different rates b) pre-corrosion at different rates and 10 minutes of cathodic polarization at -1.7
Vsce c) pre-corrosion at different rates and removal of dark film. Only one legend is shown as it is
the same for all the plots.

57
Figure 4-7: Average step height measurement along a line scan for samples pre-corroded at
different rates. The error bars represent the standard deviation.
Next, the potentiodynamic polarization (following pre-corrosion; ~30 min later in a fresh
solution) was measured for the samples shown in Figure 4-3a-c to observe if the change in
surface morphology influenced the polarization behavior for samples corroded at different rates.
The scan rate was 1 mV/s from a lower potential towards a higher potential. Figure 4-8 shows
the polarization data measured for samples after they were pre-corroded (i.e. at t =0 sec in Figure
4-2).
0.0
20.0
40.0
60.0
80.0
100.0
120.0
140.0
160.0
283 A/m² 1132 A/m² 1981 A/m²
Ste
p h
eight
(µm
)
Pre-corrosion rate (A/m2)
After pre-corrosion
After precorrosion and 10 minutes of cathodic polarization
After pre-corrosion and film removal

58
It can be seen from the Figure 4-8 that there was no apparent difference in polarization behavior
among the three samples. Fajardo et al. reported a similar observation for Mg samples where the
equal charge was passed38. It should be noted that the Mg surface was not entirely corroded in
their study. The surface of the Mg in our experiments was almost entirely corroded (>95%). The
fraction of surface corroded in our experiments increased with increased corrosion rate.
Generally, one would expect the polarization curves to be different for samples with a different
fraction of surface corroded, especially in the cathodic region, since the HER at the Mg surface
increases in the corroded areas. It is possible that the higher roughness with samples pre-
corroded at a lower rate increases the surface area and increases the HER at the Mg surface.
In Figure 4-2, although the cathodic polarization (-1.7 Vsce) is shown below the corrosion
potential, the potential is still above the equilibrium potential of Mg in the experimental solution
(-2.12 Vsce). This means that some corrosion can still occur during cathodic polarization,
Figure 4-8: Polarization curves of Mg sample pre-corroded at different rates but with the surface
film. Potentials are corrected for IR drop.
-2.6
-2.4
-2.2
-2
-1.8
-1.6
-1.4
-1.2
-1
-0.8
0.001 0.1 10 1000
Pote
nti
al, V
(vs
SC
E)
Current density, A/m2
283 A/m² 1132 A/m² 1981 A/m²

59
potentially causing additional changes to the surface. Keeping in mind the influence of this
corrosion during cathodic polarization, the experiment was modified so that the cathodic
polarization was done below the equilibrium potential of Mg (i.e. at UMg of -2.7 Vsce). This
potential is approximately 600 mV below the UMg and any corrosion of Mg at this potential is
thermodynamically unfavorable. The results are shown in Figure 4-9.
In Figure 4-9, the peak current is again seen immediately following the pre-corrosion. More
importantly, the magnitude of the peak current is proportional to the prior pre-corrosion rate,
similar to the observation in Figure 4-2. Again, at longer times the current densities reach similar
values. However, the behavior of the plot in Figure 4-9 is quite different than that in Figure 4-2.
In Figure 4-2, the peak current density was not observed immediately upon dropping the
Figure 4-9: Current behavior observed at constant cathodic potential (-2.7 Vsce) immediately after
anodic dissolution for three different samples. Note that the negative sign represents the cathodic
current densities.
-5000
-4000
-3000
-2000
-1000
0
1000
2000
3000
0 100 200 300 400 500 600
Curr
ent
Den
sity
(A
/m2)
Time(s)
283 A/m²
1132 A/m²
1981 A/m²

60
potential below the corrosion potential and it took ~14 seconds to reach the peak current density.
However, in Figure 4-9, the peak current was seen immediately upon dropping the potential in
the cathodic region. Another observation is that in Figure 4-2, the decay of the three different
curves took >600 seconds to reach a similar current density; however, this occurred rather
quickly in Figure 4-9 as the curves reached their final value in <270 seconds. Another difference
between these plots is that the HER current densities in Figure 4-9 are much higher than that in
Figure 4-2. This is due to the higher overpotential available for HER at -2.7 Vsce. It has to be
noted, however, that the conditions at which the plots in Figure 4-2 and Figure 4-9 were
measured were quite different. In Figure 4-2, the cathodic potential at which the current densities
were observed was -1.7 Vsce. Although this potential is below the corrosion potential of Mg, it is
still above the equilibrium potential of Mg. Therefore, some corrosion of the Mg was still
occurring at this potential. However, in Figure 4-9, the cathodic potential at which the current
densities were observed was -2.7 Vsce. Any corrosion of Mg at this potential is
thermodynamically unfavorable. Moreover, the overpotential for HER at the Mg surface was 1V
larger at -2.7 Vsce as compared to that at -1.7 Vsce. These factors attributed to the difference in
behavior of the plots shown in Figure 4-2 and Figure 4-9. Nonetheless, both figures strongly
indicate that the enhanced HER rates are the result of precorrosion. The surface of all the
samples were entirely corroded. Yet, the peak current density depends substantially on the pre-
corrosion rate. Moreover, all the plots converge to similar current densities values at long times.
Therefore, the fraction of surface corroded or the role of impurities does not seem to have a
significant role. Rather, the enhanced HER at the Mg surface seems to depend on the actual rate
of anodic dissolution.

61
Although anodic dissolution clearly influences hydrogen evolution at the Mg surface, it is still
important to understand the role of the surface film. Optical and SEM images do not show an
appreciable difference in the morphology of samples pre-corroded at different rates or those after
10 minutes of cathodic polarization. Another observation is that despite different roughness, all
pre-corroded samples showed similar potentiodynamic behavior (see Figure 4-8). Therefore, it is
likely that the surface film plays some role.
In order to understand the role of the surface film, 10 wt.% chromic acid was used to remove the
film after the pre-corrosion. The samples were then rinsed with DI water. Chromic acid is widely
used to remove the corrosion products of magnesium3, 37. The surface after the removal of the
film is shown in Figure 4-3a3-c3. Next, the potentiodynamic polarization experiments for these
samples were performed to see if the removal of the film changed the current-voltage behavior.
The results of this polarization are shown in Figure 4-10 below.
Figure 4-10: Polarization curve for Mg samples pre-corroded at different rates and the film
removed.
-2.6
-2.4
-2.2
-2
-1.8
-1.6
-1.4
-1.2
-1
-0.8
-1.5 -0.5 0.5 1.5 2.5 3.5
Pote
nti
al, V
(vs
SC
E)
log(i), A/m2
283 A/m² 1132 A/m² 1981 A/m²

62
Figure 4-10 shows that in the anodic region, no substantial difference was seen between the
samples after film removal. In the cathodic region, the slopes of the lines were roughly similar
for all the samples. However, there was a substantial difference in the current densities observed
at a given cathodic potential among the pre-corroded samples after film removal. It was observed
that at a given cathodic potential, the current density was higher for the sample corroded at a
lower rate. Another important observation is that at a given cathodic potential, the difference in
current density between the samples pre-corroded at 283 A/m2 and 1132 A/m2 is higher than that
between the samples pre-corroded at 1132 A/m2 and 1981 A/m2. This corresponds directly to the
surface roughness data shown in Figure 4-7, where the roughness difference between the samples
pre-corroded at 283 A/m2 and 1132 A/m2 is higher than that between the samples pre-corroded at
1132 A/m2 and 1981 A/m2. Next, the difference in polarization between samples with film and
without the film is discussed.
4.3.2 Comparison of polarization curves
The polarization curves for samples with and without the film are shown in Figure 4-11. Please
note that the samples with the film had the same behavior and therefore only one curve is shown.
In the anodic region, the Tafel slopes of film-free samples were the same but were found to be
lower than the samples with the film. The lower Tafel slope for film free samples indicates
improved Mg dissolution kinetics. The SEM images in Figure 4-4 show that the Mg surface is
covered with film and the film likely provides additional resistance for the dissolution of Mg.
Therefore, the Mg dissolution kinetics are better for the film-free samples. This phenomenon was
also seen while the Mg samples were being pre-corroded (see Figure 4-1). As the samples
developed a surface film, it became more difficult to dissolve Mg as indicated by an increase of
potential with time in Figure 4-1.
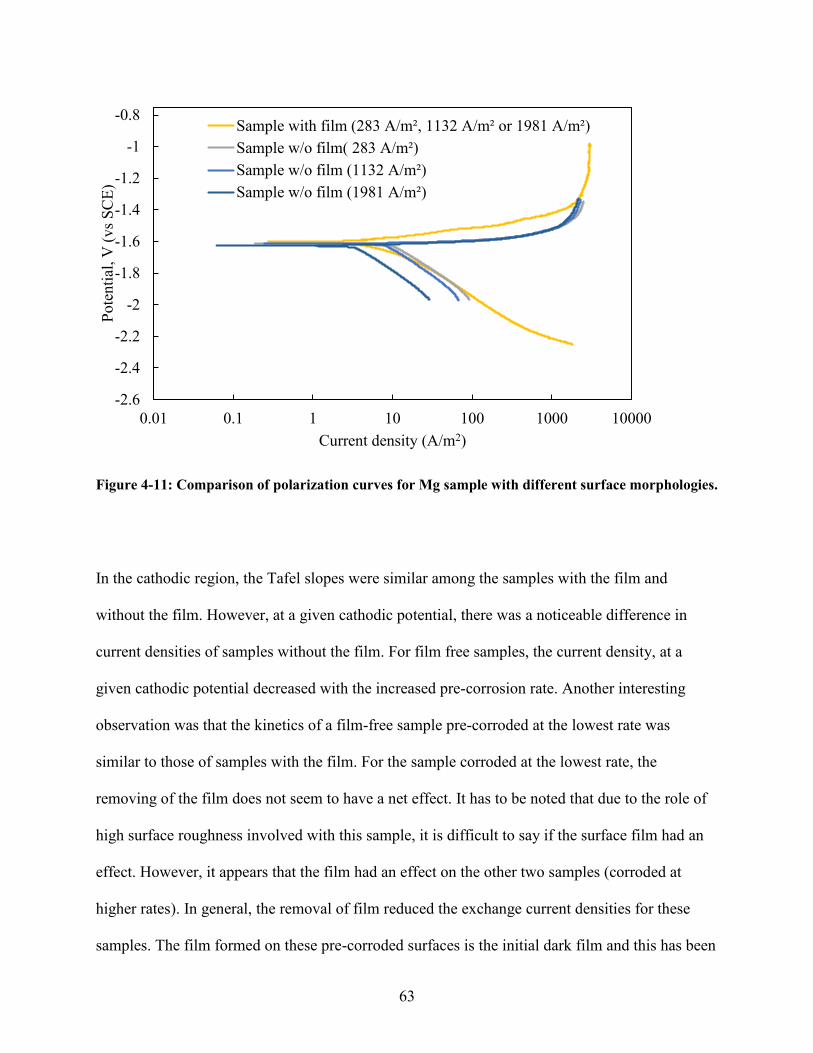
63
In the cathodic region, the Tafel slopes were similar among the samples with the film and
without the film. However, at a given cathodic potential, there was a noticeable difference in
current densities of samples without the film. For film free samples, the current density, at a
given cathodic potential decreased with the increased pre-corrosion rate. Another interesting
observation was that the kinetics of a film-free sample pre-corroded at the lowest rate was
similar to those of samples with the film. For the sample corroded at the lowest rate, the
removing of the film does not seem to have a net effect. It has to be noted that due to the role of
high surface roughness involved with this sample, it is difficult to say if the surface film had an
effect. However, it appears that the film had an effect on the other two samples (corroded at
higher rates). In general, the removal of film reduced the exchange current densities for these
samples. The film formed on these pre-corroded surfaces is the initial dark film and this has been
Figure 4-11: Comparison of polarization curves for Mg sample with different surface morphologies.
-2.6
-2.4
-2.2
-2
-1.8
-1.6
-1.4
-1.2
-1
-0.8
0.01 0.1 1 10 100 1000 10000
Pote
nti
al, V
(vs
SC
E)
Current density (A/m2)
Sample with film (283 A/m², 1132 A/m² or 1981 A/m²)
Sample w/o film( 283 A/m²)
Sample w/o film (1132 A/m²)
Sample w/o film (1981 A/m²)

64
shown to support the HER36, 76, 77. This is likely the reason for the samples with a film showing
higher current density for a given cathodic potential.
4.3.3 Implications for increased HER at the Mg surface
4.3.3.1 Implications from the polarization data
We have shown that the peak cathodic current density (observed at a constant cathodic potential
(-1.7 Vsce or -2.7 Vsce) immediately following the anodic dissolution is proportional to the rate of
prior dissolution, and that the cathodic current decreases and reaches a similar value for all the
samples pre-corroded at different rates. The relationship between the peak current density and
the applied current density is shown in Figure 4-12 below.
0
50
100
150
200
283 1132 1981
Pea
k C
urr
ent
Den
sity
(A
/m2)
Applied Current Density (A/m2)
-1.7 V (SCE)
0
1000
2000
3000
4000
5000
283 1132 1981
Pea
k C
urr
ent
Den
sity
(A
/m2)
Applied Current Density (A/m2)
-2.7 V (SCE)
a) b)
Figure 4-12: Relationship between the applied current density and the peak current density
observed immediately following pre-corrosion at a) -1.7 V (SCE) and b) -2.7 V (SCE).

65
It can be seen that the peak current density increased linearly with the applied current density at -
2.7 Vsce. However, at -1.7 Vsce, the relationship between the peak current density and the applied
current density was non-linear relative to that observed at -2.7 Vsce.
During separate polarization experiments for the pre-corroded samples, it was also seen that the
current observed for all the samples in response to applied potential was the same (see Figure
4-8). The current density observed at the end of constant cathodic polarization (at -1.7 Vsce) in
Figure 4-2 was ~33 A/m2 while the current density observed at -1.7 Vsce in Figure 4-8 is ~ 15
A/m2. One would expect these values to be similar since they were measured at the same
cathodic potentials. However, it has to be noted that the current densities in Figure 4-2 are still
decreasing and given sufficient time may have decreased further to 15 A/m2. One key
observation here is that the current densities converge to similar values at long times. This is a
strong evidence that simultaneous anodic dissolution at high rates enables enhanced rates of
hydrogen evolution, and that the influence persists temporarily at low potentials before decaying.
Such observation provides new insights in analyzing the cause of the enhanced HER and our
results provide different perspectives towards the current understanding in the literature30, 38, 54, 57.
The convergence of curves with time also suggests that the role of impurities and film (by
themselves) is not important. However, to what extent their role is catalyzed by the anodic
dissolution is a subject of future study.
4.3.3.2 Implications from the surface morphology and surface roughness results
Surface morphology observed using SEM for samples pre-corroded at different rates does not
show appreciable differences. However, the nature of the film during the anodic dissolution is
not known57. The surface roughness increased with a decreased rate of pre-corrosion for the
samples with and without the film. For samples with the film, the exchange current density of the

66
HER was similar for all the samples. However, upon removing the film, the sample pre-corroded
at the lowest rate showed the highest exchange current density for the HER. Assuming that the
active area for the HER increases with the roughness, the trend seen for the film-free sample was
valid. The key finding here is that the surface roughness actually supports the HER for the
samples pre-corroded at a lower rate. Therefore, there is strong evidence that the cause of
increased HER during anodic dissolution is not due to the roughness of the Mg surface.
4.3.3.3 Implications for the role of film and impurities
The results of this work allow for quantification of the role of film and the impurities following
the anodic dissolution of Mg. Let’s take Figure 4-11 again and draw a straight line through the
potential of -1.7 Vsce. This is shown in Figure 4-13 below.
-2.6
-2.4
-2.2
-2
-1.8
-1.6
-1.4
-1.2
-1
-0.8
0.01 0.1 1 10 100 1000 10000
Pote
nti
al, V
(vs
SC
E)
Current density (A/m2)
Sample with film (283 A/m², 1132 A/m² or 1981 A/m²)
Sample w/o film( 283 A/m²)
Sample w/o film (1132 A/m²)
Sample w/o film (1981 A/m²)
Figure 4-13: Polarization behavior for samples with and without the film.

67
For the sample with the film, the current density observed at -1.7 Vsce is ~14.4 A/m2. For the
sample without the film, the minimum current density observed at this potential is ~5.5 A/m2.
Assuming that this current density is due to the enrichment of surface impurities, the maximum
contribution from the film is ~9 A/m2. The analysis shown here is done on a separate
polarization experiment performed some time (30 min) after the pre-corrosion. Therefore, it has
to be noted that the film and impurities may behave differently during the high anodic
dissolution of Mg.
In earlier sections, it was reported that the peak current densities observed at -1.7 Vsce
immediately following the anodic dissolution are in the range of 75-170 A/m2. The peak current
is assumed to be a residual effect from the prior anodic dissolution. If that is true, then the actual
current densities due to the HER could be much higher at high anodic dissolution rates. The peak
current densities (measured immediately following the pre-corrosion) are at least an order of
magnitude higher than the current densities contributed by film or the surface enrichment of
impurities (quantified from polarization curve at a later time). It has to be mentioned that the role
of surface film and the impurities was quantified long after the pre-corrosion. Therefore, this
may not explain the actual behavior of the impurities and film during the anodic dissolution as
peak current observed immediately following the anodic dissolution were substantially high.
Nevertheless, this study provides clear evidence that the anodic dissolution catalyzes the HER at
the Mg surface. The catalytic effect anodic dissolution towards the enhanced HER may be from
the Mg surface, impurities, or the film. The results provide new insights into the role of film30, 38,
54, 57 and anodic dissolution in enhancing HER during the anodic dissolution.

68
4.4 Possible mechanism
The corrosion of Mg is accompanied by a MgO/Mg(OH)2 film as discussed in the Background
Section 2.1. The presence or absence of enhanced HER is reported to be dependent on the
stability of the film57, 90. The stability here refers to how easily the film ruptures and exposes the
Mg surface to the solution. The presence of Cl- ions in the solution as well as an anodic current
can both rupture the film57, 90. Cain et al. observed enhanced HER in Cl- containing solutions
where the surface film was less stable57. Yang et al. hypothesized that a “remote” anodic current
was necessary to induce film rupture90. The “remote” anodic current in their work refers to the
relatively small anodic current present at some distance from the corrosion front90. The enhanced
HER was observed in places where Mg was directly exposed to the solution90.
For our experiments, the samples were pre-corroded by passing an equal amount of charge.
However, the rate of pre-corrosion was different. Song et al. reported that the MgO/Mg(OH)2
film becomes less stable and the porosity of the film increases as the anodic potential91 (or
anodic current) is increased. Therefore, it is possible that the stability of the film decreased with
increasing pre-corrosion rate for our samples. Assuming that the fraction of the Mg surface that
is directly exposed to the solution increases with the rate of anodic current (pre-corrosion rate),
the rate of HER would increase with an increased anodic dissolution rate. This would explain the
increased peak current density that was observed at a cathodic potential immediately following
the pre-corrosion. During cathodic polarization (as in Figure 4-2) where high dissolution rates
are absent, the surface film likely gradually repairs and the fraction of Mg surface directly
exposed to the solution also gradually decreases. As a result, the peak current densities decrease
and converge with time. However, further work is needed to refine and test this hypothesis.

69
4.5 Conclusions
1) The cathodic current observed at a constant cathodic potential (-1.7 Vsce or -2.7 Vsce)
immediately following anodic dissolution is proportional to the dissolution rate. A peak
current is seen immediately when the polarization is switched from anodic to cathodic.
However, at longer times, the current decreases and converges to similar values
irrespective of prior dissolution rate. This strongly suggests that the increased hydrogen
evolution at the Mg surface is due to a catalytic effect associated with the anodic
dissolution itself. This observation adds new perspective to current understanding of
enhanced HER in the literature.
2) In general, the surface roughness of a sample decreased with an increased rate of pre-
corrosion. For samples with the film, the roughness showed no effect on the measured
polarization curves. For film-free samples, the current density observed at a cathodic
potential decreased with an increased rate of pre-corrosion. Therefore, the surface
roughness does not contribute to increased HER during anodic dissolution.
3) Analysis shows that the contributions of the surface film and impurities towards
enhancement of the HER during anodic dissolution are minimal for polarization
experiments performed some time (30 min) after pre-corrosion. However, the fact that
their role could be different during the anodic dissolution is highlighted in this work.
4) The HER rate is not persistent at low anodic dissolution rates or cathodic potentials. The
HER rate peaks upon rapid switch from anodic to cathodic potential and the peak current
density is proportional to the pre-corrosion rate. However, the current densities decay to
similar values irrespective of the pre-corrosion rate. Therefore, the effect of surface
impurities is likely insignificant. There is clear evidence that simultaneous anodic

70
dissolution provides a catalytic effect that enhances hydrogen evolution at the Mg
surface. This catalytic effect may come from the Mg surface or from the film behaving
differently during high rates of anodic dissolution. Further study is needed to understand
the mechanism of how anodic dissolution provides this catalytic effect. Nevertheless, this
study provides a key step in that direction.

71
5 NUMERICAL SIMULATION OF THE GALVANIC CORROSION OF MG
5.1 Introduction
In this chapter, numerical simulation of the galvanic corrosion of Mg is discussed. The
experimental part of this work was previously published37 and is summarized in Chapter 2. As
discussed earlier, in a recent technical review meeting (April 2016) held by US DOE at Oakridge
National Laboratory, it was generally recognized that modeling has the potential to provide a
better understanding of Mg corrosion that may lead to optimized automobile design and
mitigation of corrosion effects10. Numerical simulations can also provide predictive capabilities
that may be of great importance in corrosion studies. A precise numerical model can be used to
understand surface chemistry, electrochemical properties and so on. Numerical modeling of
galvanically coupled Mg has been done previously to predict the rate of galvanic corrosion39-42,
44, 79, 80, 92-95 and a summary of those studies was provided in the Background section (Chapter 2).
The purpose of the simulation work here is to: 1) develop a model that can predict Mg corrosion
at high rates, 2) explore the kinetics of the HER on the Mg surface during high anodic
dissolution rates, and 3) quantify the role of hydrogen bubbles during the galvanic corrosion of
Mg. The first two issues are discussed in this chapter and the last issue is discussed in the
subsequent chapter.
Previous models of the galvanic corrosion of Mg have shown significant errors39, 41. The work by
Jia et al. underpredicted the experimental results by more than 50% in some instances, which

72
they interpreted as evidence for enhanced hydrogen evolution on the Mg surface42. In another
study, Deshpande et al. used experimental results and numerical simulation to predict the
corrosion rates of Mg galvanically coupled with either steel or aluminum39. They found that the
corrosion rate of the Mg-steel galvanic couple was significantly higher than that of the Mg-Al
galvanic couple. Their model introduced a moving boundary and the ability to track the position
of the corroding Mg surface with time. However, the results showed that the corrosion rates
obtained from the numerical model underpredicted the measurements from immersion
experiments by 20% and 47% for the AE44-mild steel and the AE44-AA6063 couples,
respectively. Therefore, improving the overall precision of a numerical model is a first step
towards benefiting from the other advantages of a model.
One important commonality with all of the previous simulations was that they used measured
polarization curves to predict the corrosion rates. In order to obtain the kinetics of the HER at the
Mg surface, the polarization is done in the cathodic region with respect to the corrosion potential
of Mg. However, the cathodic potentials (where HER kinetics are estimated) are still above the
equilibrium potential of Mg and below the equilibrium potential of the HER. This means that
there will be additional current due to hydrogen evolution on the Mg surface that cannot be
measured through the external circuit. HER kinetics extracted from a typical polarization curve
does not factor into account the additional current due to hydrogen evolution that is associated
with dissolution of the Mg. The influence of this effect was shown in Chapter 3 where the Tafel
slope of the HER on Mg increased by a factor of ~2 upon considering the effect of additional
hydrogen evolution at the Mg surface. It is possible that the inclusion of this additional hydrogen
evolution in the simulation will improve model accuracy. In the simulation, the cathodic reaction

73
(H2 evolution) on both the anode (Mg) and cathode (coupled metal) surfaces can be defined to
capture the physics of the galvanic corrosion.
In Chapter 4, it was observed that the current density at the cathodic potential immediately
following an anodic dissolution was proportional to the prior dissolution rate. Such observations
strongly imply that the HER kinetics on the Mg surface depends on the dissolution rate of Mg.
Based on results from Chapter 4, it is expected that the HER kinetics obtained from the cathodic
polarization data will underpredict the experimental hydrogen current density on the Mg surface.
In that case, the model is further explored to estimate the kinetics of the HER at high anodic
dissolution rates by fitting the simulation results to the experimental data.
5.2 Model development
The numerical model was developed based on our published previously experimental work 37,
the summary of which is provided in the next section.
5.2.1 Summary of previous experimental work
The Mg sample (Solution Materials LLC) in rod shape (3 mm diameter) was electrically
insulated using a heat shrink (0.4 mm thick) with an exposed end for an electrical connection.
The sample was inserted in a mild steel electrode with an inner diameter of 3.8 mm and an outer
diameter of 8 mm, 12 mm or 16 mm. The inner diameter was just enough to accommodate the
insulated Mg rod. This geometry was chosen to study the influence of varying cathodic (but
fixed anodic) area on the galvanic corrosion rate of Mg. Figure 5-1 shows the schematic of
experimental set up and the configuration of electrodes for our galvanic corrosion experiments.

74
In order to represent a severe corrosive environment, 5 wt% NaCl electrolyte with a conductivity
of 7.95 S/m was used41. The precipitate in the solution was dissolved using 1.2 M hydrochloric
acid and the film was dissolved using 10 wt% chromic acid. The total corrosion was
approximated by using ICP-MS to analyze Mg dissolved during the experiment (in the solution,
precipitate and surface film). The galvanic corrosion was measured as a function of time. The
difference between the total corrosion and the galvanic corrosion provided the amount of
corrosion due to HER at the Mg surface.
5.2.2 Governing equations and boundary conditions
In order to develop the numerical model, the following assumptions were made.
i) The solution is electrically neutral and incompressible
ii) Concentration gradients are not present in the solution
iii) The cathodic reaction (HER) occurs on both the Mg and steel surfaces at different
rates
Computer ZRA
Ref. electrode (SCE)
NaCl Soln.
Mg wire
Mild steel Epoxy
a) Steel
surface Mg Surface
Epoxy
Steel
Insulato
r Mg
b)
Figure 5-1: a) Schematic of experimental set up b) configuration of electrodes cast in an epoxy.

75
iv) The entire Mg surface is actively corroding
With the above assumptions, the potential (ɸ) distribution is represented by the Laplace
equation,
𝛻2ɸ = 0 (1)
A solution of above equation requires boundary conditions. For walls and non-conductive
surfaces, the following boundary conditions were applied.
𝛻⊥ɸ = 0 (2)
For electrode surfaces, Tafel kinetics were assumed. There are two principal reactions involved
in Mg corrosion:
1) Mg Mg2+ + 2e-
2) H2O + 2e- H2 + 2OH-
Reaction 1 represents oxidation of the Mg electrode and Reaction 2 takes place at both the Mg
and steel electrodes. Therefore, two Tafel expressions at Mg surface and one expression at steel
surface were defined.
At the Mg surface,
Tafel expression for Mg dissolution: 𝑖 = 𝑖0𝑀𝑔exp (𝑎𝑎𝑀𝑔𝐹
𝑅𝑇(𝐸 − 𝑈𝑀𝑔)) (3)
Tafel Expression for the HER: 𝑖 = −𝑖0𝐻𝑀exp (−𝑎𝑐ℎ𝑚
𝐹
𝑅𝑇(𝐸 − 𝑈𝐻𝐸𝑅)) (4)
At the steel surface,
Tafel Expression for the HER: 𝑖 = −𝑖0𝐻𝑆exp (−𝑎𝑐ℎ𝑠
𝐹
𝑅𝑇(𝐸 − 𝑈𝐻𝐸𝑅)) (5)

76
The secondary current distribution was calculated, which includes both the solution resistance
(due to hydrogen bubbles) and electrode kinetics. The concentration gradients were assumed to
be negligible (i.e. concentration at the bulk equals that at the surface) given the solution mixing
provided by the vigorous hydrogen bubbles at the electrode surface. The current due to
convection was zero since charge neutrality is assumed. The adequate presence of water near the
Mg electrode provided the needed cathodic reactant. The computational domain along with
governing equations and boundary conditions are illustrated in Figure 5-2.
Figure 5-2: Computational Domain and governing equations.

77
Numerical simulation was performed with the electrochemical package available in STAR
CCM+. The influence of mesh resolution was examined by starting with a base mesh size of 2.4
mm. The mesh size was decreased by half until the current density between the subsequent mesh
sizes did not change by more than 0.5%. The results of the mesh resolution study are given
below.
Table 5-1: Summary of mesh resolution
Mesh Base
size (mm)
Calculated galvanic
current density from
simulation (A/m2)
Time to residual
values of 10-10 (sec)
% diff in current
densities from the
previous base size
0.15 1960 180 0.14
0.3 1957 58 0.53
0.6 1947 18 0.88
1.2 1930 15 1.18
2.4 1908 12 -
As shown in Table 5-1, changing the mesh base size from 0.0003 m to 0.00015 m changed the
current density by only 0.14%. Therefore, we chose to perform the simulation with a mesh base
size of 0.3 mm. The convergence time of the model was only 58 seconds, even with such a fine
mesh. The meshed geometry (with a base size of 0.0003 m) corresponding to Figure 5-2 is
shown in Figure 5-3 below.

78
The parameters used in Tafel expressions are shown in Table 5-2
Table 5-2: Kinetic parameters for the reactions used in the simulation. Note that the superscripts
represent the reference from which the values were taken.
USHE(V) α io (A/m2)
HER on Steel -0.63 0.5396 0.00596
Mg dissolution -2.49 0.6685 1.6×10⁻⁹
HER on Mg -0.63 0.22 0.016
The equilibrium potential (U) of Mg was corrected for our solution from its standard potential (-
2.37 VSHE)45 and was found to be -2.49 VSHE as shown in Table 5-2. The U value for the HER
was calculated from a pH measurement of the solution (U = -0.059×pH). This value, in reality,
assumes a hydrogen partial pressure of 1 bar. Correction for the hydrogen partial pressure and
change in solution concentrations that occurred during the experiment does not change the
potential appreciably (<0.4%). Therefore, the U value for the HER was assumed to be constant
for our experiments. The charge transfer coefficient (α) and the exchange current density (io) for
Figure 5-3: a) 3D view of the mesh geometry created in STAR CCM+ and b) zoomed view of the
electrode surfaces from a).
Steel
surface Mg
surface
Insulator
b) a)
Electrodes
Solution
domain

79
the HER on steel were taken from the literature96. The Mg dissolution kinetics reported by
different sources are not consistent in the literature and are shown to vary with NaCl
concentration in the electrolyte85. We used the Tafel slope provided by King et al. for Mg in 1M
NaCl solution,58 which is close to the 5 wt% NaCl solution (0.86 M) used in our experiments.
The 𝑖0𝑀𝑔 changes with the experimental conditions. Therefore, it was calculated using 𝑎𝑎𝑀𝑔
(mentioned in Table 5-2 ) and the current (i)-voltage (E) relationship at our experimental
conditions using Equation 3. For an applied current, the measured potential was not constant (see
Figure 5-4). Therefore estimation of 𝑎𝑎𝑀𝑔 from such data would not be precise. Hence, we
estimated the 𝑎𝑎𝑀𝑔 from the Tafel slope provided in the literature at conditions that
approximated our experimental conditions85.
Since the simulation assumes that the entire Mg surface is active, 𝑖0𝑀𝑔 for Mg dissolution was
estimated for an entirely corroded Mg surface. The Mg samples were pre-corroded by applying
current densities in the range of values obtained experimentally during the galvanic corrosion.
For example, the total current densities obtained for galvanic samples were in the range of 2000-
3400 A/m2. Therefore, we pre-corroded the samples at upper and lower limit of these current
densities. However, the amount of charge passed onto the sample was the same (1.06 C). Figure
5-4 shows the potential response to the applied current densities (also reported in Chapter 4).

80
The surface of the Mg samples was entirely corroded at the endpoint of the plots shown in Figure
5-4 above. The current-voltage relationship at the end of the plot (where entire Mg surface was
corroded) was used along with the above-mentioned α value to calculate the io. The current
density consisted of current due to the HER evolution at the Mg surface in addition to the applied
anodic current shown in Figure 5-4. The io for Mg dissolution used in the simulation was average
of the io values obtained for the two curves shown in Figure 5-4 above. A summary of io values
for Mg dissolution is shown in Table 5-3.
Table 5-3: Summary of exchange current densities (io) of Mg dissolution
io for 1981 A/m2 1.7×10⁻⁹ A/m2
io for 3961 A/m2 1.5×10⁻⁹ A/m2
Average io 1.6×10⁻⁹ A/m2
Figure 5-4: Potential response to constant positive current applied to Mg sample.
-1.8
-1.7
-1.6
-1.5
-1.4
-1.3
-1.2
0 20 40 60 80
Pote
nti
al (
Vsc
e)
Time (sec)
1981 A/m² 3961 A/m²

81
Kinetic parameters for the HER at the Mg surface were estimated in Chapter 3 and are used in
our initial simulations. However, these parameters were measured at potentials below the
corrosion potential where the rates of Mg dissolution were much lower than those present during
galvanic corrosion. As our results indicate that the dissolution rate has a significant impact on the
HER, these parameters are not likely to be accurate for the conditions that we are modeling.
Therefore, the HER rate at the Mg surface is calculated using the simulation and the kinetics of
HER is be explored.
5.2.3 Conditions for comparison of experimental and simulation results
In our experimental work, it was seen that the corrosion starts with little disks that expand and
grow in number until the entire surface is actively corroding37. The corroded areas initially show
a dark film (see Chapter 2) that is known to sustain an enhanced rate of hydrogen evolution33, 35,
60, 76 relative to the uncorroded surface. At later times, a thick white passivating film was
formed37. The experimental conditions and the electrode surface do not remain steady during Mg
corrosion. Therefore, it was necessary to choose a time where assumptions made with numerical
simulation would adequately represent the experimental conditions. For that reason,
experimental results at a time where most of Mg surface was corroding without formation of the
white passivating film were chosen to be compared with the numerical simulation. As mentioned
above, the experimental results showed that the initial corrosion was accompanied by a dark film
(see Chapter 2). Therefore, the kinetics used in the simulation were measured on the surface
consisting of this dark film (see Chapter 3). In our experimental work37, the fraction of the Mg
surface corroded was tracked with time. At various time intervals, a Mg sample was taken out of
solution and observed under the microscope. It was found that almost all of the Mg surface was
actively corroding after the first minute of galvanic corrosion. Therefore, numerical simulation

82
results were compared with experimental results obtained after corroding the sample for 1
minute.
5.3 Results and discussion
5.3.1 Current and potential distributions
The simulation was run until the residual of electric potential was 10-10. After a converged
solution was obtained (to Laplace’s equation), the distribution of galvanic current density was
obtained from the simulation and is shown in Figure 5-5 below for a 12 mm sample. Please note
that the distributions for other samples were similar. The boundary specific electric current
density refers to the local galvanic current density.
In Figure 5-5, dark blue regions represent the highest galvanic current densities on the anode
(Mg) and the dark red regions represent the highest galvanic current densities on the cathode
(steel). It is seen in Figure 5-5, that the local galvanic current densities are the highest in the
Figure 5-5: Galvanic current density distribution for a 12 mm sample, a) 3D view and b) zoomed
view.
a
)
b
)
Steel 1
surfac
e
Mg
Steel 2
Insulator
surface

83
regions where Mg and steel electrodes are closest to each other. Note the sign of the current
densities on steel and Mg surface are opposite to each other signifying the net cathodic and
anodic nature of the current densities, respectively. Also, note that the current densities at the
insulator surface are zero because no reaction is occurring in that area.
The potential distribution for a 12 mm sample is shown in Figure 5-6. The distributions for other
samples are similar.
Figure 5-6 shows potential distribution in a solution. The metal potential was constant and was
fixed arbitrarily at zero. The potential distribution shows that the highest potential in the solution
is near the center of the Mg electrode. The potential decreases as we move farther from the
center of the electrode (in all direction).
5.3.2 Current due to the hydrogen evolution at the Mg surface
As mentioned in Chapter 2, significant hydrogen evolution at the Mg surface was seen
experimentally for galvanically coupled Mg. The current densities due to HER at the Mg surface
Figure 5-6: Potential distribution in a 12 mm sample, a) 3D and b) 2D axisymmetric view.
a
)
b
)

84
were determined experimentally using the methods described in Section 5.2. These values were
the average current densities. However, the simulation predicts the instantaneous values. In order
to find the instantaneous current due to the HER at the Mg surface, the fraction of Mg surface
dissolved was tracked with time37. It was found that the fraction of surface corroded changed
linearly with time and the total time it took to fully corrode the Mg surface was roughly 1 minute
for all the samples. Assuming that the current density due to the HER at the Mg surface was
proportional to the fraction of surface corroded, the instantaneous value would be twice the
average value that was obtained for entire 1-minute time using ICP-MS. The current densities
due to the HER at the Mg surface were estimated at that time. A comparison of current densities
due to the HER at the Mg surface obtained from simulation and experiments is shown in Figure
5-7.
A key observation, in Figure 5-7, is that the numerical simulation underpredicted the current
density due to hydrogen evolution at the Mg surface by more than two orders of magnitude. The
Figure 5-7: Comparison of current densities due to HER at the Mg surface b) expanded view of
current densities due to HER at the Mg surface calculated from the simulation.
0
200
400
600
800
1000
1200
8 mm 12 mm 16 mm
Curr
ent
den
sity
due
to H
ER
at
the
Mg s
urf
ace
(A/m
2)
Cathode size
Experimental Numerical
0
5
10
15
20
25
8 mm 12 mm 16 mm
Curr
ent
den
sity
due
to H
ER
at
the
Mg s
urf
ace
from
sim
ula
tion
(A/m
2)
Cathode Size
a) b)

85
HER current densities estimated from the numerical simulation were ~11 A/m2 for all three
samples while the current densities measured experimentally increased with cathode size (and
anodic dissolution) and were in the range of 954 -1071 A/m2. The major factor contributing to
this discrepancy is the use of inaccurate kinetics of HER on the Mg surface in the simulation.
The Tafel kinetics of the HER on Mg, used in the simulation, was measured below the corrosion
potential but above the equilibrium potential of Mg. The corrosion rate of Mg at these potentials
was very low. However, the experimental current densities due to HER at the Mg surface were
obtained when the corrosion of Mg is substantially higher. In Chapter 4, we showed that the rate
of HER at the Mg surface was proportional to the prior anodic dissolution rate of Mg. depends
on the anodic dissolution rate of Mg. Therefore, the measured kinetics for HER on Mg must be
revisited.
The equilibrium potential (U) of HER on Mg depends on the solution pH and was calculated
using the pH of the solution at which the experiments were performed (pH = 10.6). The
corrosion product (Mg(OH)2 has a low solubility product. During the experiment, a film
(containing Mg(OH)2) was observed at the Mg surface. Therefore, the solution was likely
saturated by Mg2+ and OH- ions and the pH remains stable. Therefore, the discrepancy between
simulation and experiments in Figure 5-7 is not due to the equilibrium potential of HER on Mg.
It is also assumed that the Tafel slope does not cause the discrepancy between the simulation and
the experiment. A change in Tafel slope is usually attributed to a change in the reaction
mechanism, such as a change in the limiting step of a multistep reaction31. As a first
approximation, this study assumes that the Tafel slope for the HER remains constant and that
changes in the kinetics are manifest in the exchange current density, which depends on the
reaction conditions. This assumption is consistent with assumptions made previously by

86
others31. Comparison of the simulated results with the experimental data for high rates of
galvanic corrosion provides a great opportunity to explore the kinetic parameters for the HER at
high dissolution rates. Consequently, the exchange current density of the HER at the Mg surface
was changed to fit the current densities (due to hydrogen evolution at the Mg surface) from the
experiment to those from the simulation. After fitting the current density from the simulation to
that of the experiment, we found that the exchange current density for HER on Mg surface was
1.55 A/m2, 1.8 A/m2 and 1.85 A/m2 for the 8 mm, 12 mm and 16 mm samples, respectively. The
corresponding current densities associated with Mg dissolution were 2462 A/m2, 2978 A/m2 and
3424 A/m2, respectively.
In order to fit the current densities due to the HER at the Mg surface, the exchange current
density had to be increased by roughly two orders of magnitude (relative to that obtained from
the polarization measurements). This result is significant because the HER kinetics here are
found to be substantially higher during the high rates of corrosion. However, such a large change
in the HER kinetics may impact the galvanic current densities and the corrosion potential. Figure
5-8 below shows the galvanic current densities and the corrosion potential before and after the fit.
As shown in the figure, when the exchange current density of the HER on Mg was changed by
two orders of magnitude, the potential values changed by less than 5 mV and the galvanic
current density changed by <5.2%. The galvanic current density is a strong function of potential.
Since the HER at the Mg surface does not have a significant impact on the potential, the galvanic
current density does not change substantially. Therefore, the exchange current density could be
varied independently in order to fit the values from the experiment to those from the numerical
simulation.

87
Figure 5-9 shows the relationship between the fitted exchange current density of HER and the
anodic dissolution rate of Mg.
1.5
1.55
1.6
1.65
1.7
1.75
1.8
1.85
1.9
0 1000 2000 3000 4000Fit
ted e
xch
ange
curr
ent
den
sity
of
HE
R o
n M
g (
A/m
2)
Total current density due to Mg dissolution (A/m2)
Figure 5-9: Relationship between total anodic dissolution rate and exchange current density of
HER on Mg.
0
500
1000
1500
2000
2500
8 mm 12 mm 16 mm
Gal
van
ic c
urr
ent
den
sity
(A/m
2)
Cathode size
Before fitting After fitting -1.44
-1.42
-1.4
-1.38
-1.36
-1.34
-1.32
-1.3
-1.28
8 mm 12 mm 16 mm
Co
rro
sio
n p
ote
nti
al (
Vsc
e)
Cathode size
Before fitting
After fitting
a) b)
Figure 5-8: a) Numerical galvanic current density before and after fitting the hydrogen current on
Mg to the experimental values and b) Numerical corrosion potential before and after fitting the
hydrogen current to the experimental values.

88
From Figure 5-9, it can be seen that the exchange current density of the HER on the Mg surface
needed to fit the experimental results increased with increasing anodic dissolution rate. While it
is recognized that these data only cover a somewhat narrow range of current densities, an
increase in the exchange current density with the anodic dissolution rate is clearly evident,
consistent with expectations from the kinetic experiments described in the previous chapter. The
use of experiments and numerical simulation in tandem has, for the first time, enabled
determination of the exchange current density at these high rates.
5.3.3 Similarities between numerical simulation and experimental results
After the HER kinetics at the Mg surface were fit to the experimental results, the simulation was
explored to qualitatively compare the current and potential distributions.
5.3.3.1 Current distribution
Figure 5-10a and Figure 5-10b show the distribution of galvanic current density for a 12 mm
sample obtained by simulation and experiments, respectively. The distributions for other samples
were similar (i.e. the maximum current densities were at the steel surface adjacent to the Mg
electrode).
b) a)
Figure 5-10: Distribution of a) galvanic current distribution obtained from the simulation b) hydrogen
evolution observed during experiments for 12 mm sample.

89
During experiments, it was observed that the hydrogen evolution was highest on the steel surface
that was closest to the Mg surface, as seen in Figure 5-10b above. The distribution of hydrogen
evolved on the steel electrode is qualitatively similar to the distribution of the galvanic current
density obtained by simulation.
Next, the distribution of the estimated Mg current density from the simulation was compared
with the experimental results. Note that the total current density corresponds to the total
corrosion rate. The comparison of current distribution is shown in Figure 5-11.
Figure 5-11: Comparison of distribution of total current density using a) experiments and b)
numerical simulation for 12 mm sample.
a)
Edge of Mg
electrode adjacent
to steel surface
b)
0
1000
2000
3000
4000
0 0.0005 0.001 0.0015 0.002
Tota
l cu
rren
t den
sity
(A
/m2)
Distance from the center (m)
Center of the
Mg electrode

90
Experimentally, it was observed that the Mg surface near the steel electrode had a higher rate of
corrosion. Figure 5-11a shows the cross-section of a corroded sample. It can be seen that the
edge of the Mg electrode has a higher depth of corrosion than the center. The behavior observed
in the simulation is similar, as we can see that the total current density is highest near the edge of
the Mg surface (see Figure 5-11b).
5.3.3.2 Comparison of corrosion potential
The calculated potential distribution is shown in Figure 5-12.
In Figure 5-12, it can be seen that the potential of the solution decreased with the increasing
distance from the center of the Mg electrode. The distribution was radially symmetric as
expected in this case for the round electrodes. Experimentally, the corrosion potential was
measured with a potentiostat. The reference electrode was placed far from the electrode surface.
Since most of the ohmic drop is near the electrode, placing the reference electrode far away from
Figure 5-12: 2D axisymmetric view of potential distribution in the simulation. Note that the scale is
positive because we referenced metal potential to be 0.
VSHE = 1.11,
VSCE = 1.36

91
the electrode made sure that the precise position of reference electrode did not affect the results.
Positioning the reference electrode far from the electrode surface also allowed us to compare the
potential values obtained from the simulation to those obtained from the experiments. The
potential values measured experimentally were with respect to the SCE reference electrode (U =
0.244 VSHE). However, the potential values from the simulation were with respect to SHE (U = 0
VSHE). Therefore, the equilibrium potential of SCE had to be added to the values from the
simulation to compare to the experimental values. As demonstrated in Figure 5-12, in order to
compare the values of corrosion potential to the values from the experiment, the potential value
that was farthest from the electrode surface was chosen. The comparison of corrosion potential
between simulation and experiment is shown in Figure 5-13. Results were obtained after fitting
the numerical current densities due to HER at the Mg surface to those obtained experimentally.
In Figure 5-13, the actual values of corrosion potential predicted by the simulation were off from
the mean experimental values by 2-22 mV. The trend in increasing corrosion potential with the
Figure 5-13: Comparison of corrosion potential measured by numerical and experimental methods.
-1.5
-1.45
-1.4
-1.35
-1.3
-1.25
-1.2
8 mm 12 mm 16 mm
Corr
osi
on
Pote
nti
al (
Vsc
e)
Cathode size
Experimental
Numerical

92
increased cathode size was well predicted by the simulation. The change in experimental values
are more pronounced than that seen with the simulation values. Although the corrosion potential
increases with cathode size, the difference in corrosion potential between the 8 mm and 12 mm
(70 mV) samples is higher than that between the 12 mm and 16 mm (30 mV) samples.
Moreover, the lower corrosion potential for a smaller cathode size means that the hydrogen
overpotential (see Chapter 2) for a larger cathode size is lower than that for smaller cathode size.
Yet, significantly higher hydrogen evolution is seen for a larger cathode size due to the increased
surface area available for hydrogen evolution. The trend is likely to continue with increased
cathode size until ohmic resistance completely dominates, and a further increase in cathode size
will not affect increase the hydrogen evolution rate or the corrosion potential.
5.3.3.3 Comparison of galvanic current densities
The average galvanic current density on the Mg surface was measured experimentally using a
potentiostat in a zero resistance ammeter (ZRA) mode. The galvanic current densities were taken
at the end of the experiment that was run for 1 minute. The galvanic current densities obtained
experimentally and from the numerical simulations are shown in Figure 5-14.
Figure 5-14: Comparison of experimental and numerical galvanic current density for different
samples. Error bars represent the standard deviation from the mean.
0
500
1000
1500
2000
2500
8 mm 12 mm 16 mm
Gal
van
ic c
urr
ent
den
sity
(A/m
2)
Cathode size
Experimental Numerical

93
Both experiments and simulation showed that the galvanic current densities increase with
increased cathode size. This trend is due to the availability of higher surface area for the HER on
the larger cathode size sample. The absolute errors between the simulation and the experiment
were 5.1%, 8.3% and 12.5% for the 8 mm, 12 mm and 16 mm samples, respectively. The
experimental results show that the difference in current densities between the 8 mm and the 12
mm samples is higher (353 Am-2) than the difference in current densities between the 12 mm and
the 16 mm samples (220 Am-2). The simulation also shows that the difference in current densities
between the 8 mm and 12 mm samples was higher (220 Am-2) than the difference in current
densities between 12 mm and 16 mm samples (128 Am-2). The trend is due to the increased
influence of ohmic resistance as the cathode size increases. However, the difference in current
densities seen experimentally is twice the value seen with the simulation. The reason for this
behavior could be due to the difference in the impact of ohmic resistance on the current densities
during the experiments and the simulation. If the impact of ohmic resistance for the experiment
was lower than that calculated in the simulation, then the difference in current densities between
subsequent cathode sizes would be higher during the experiments than in the simulation.
Another observation is that the current densities from this study are higher than any of the results
obtained previously for the galvanic corrosion of Mg. Current density values <100 A/m2 are
typically seen in galvanic corrosion studies39-42, 44, 80 and the factors that influence the corrosion
rates have been discussed3, 40, 79, 92. According to the literature, corrosion rates increase with
increasing cathode-to-anode area ratios and with the depth of the electrolyte solution used, but
decrease with increasing distance between the anode and cathode. In our experiments, we use
high cathode-to-anode area ratios (6:1 to 27:1) and a thin insulator (0.4 mm) between anode and

94
cathode. This is the reason that the galvanic current densities in our study were significantly
higher, with magnitudes ranging from 1500 to 2150 A/m2.
The fact that such high current densities can be obtained with simple coupling is very significant.
Even at these high current densities, the galvanic current density continues to increase (as seen
with simulation and experiments in Figure 5-14) with cathode size demonstrating the severe
cathodic limitation of Mg corrosion. The effect of coupling is significant on the corrosion
potential as well. For instance, the free corrosion potential of our Mg sample was roughly -1.66
Vsce. Upon coupling, the corrosion potential increased up -1.31 Vsce, an increase of roughly 350
mV. This means that the Mg sample is anodically polarized by the effect of coupling. As
discussed in Chapter 4, the enhanced HER at the Mg surface is studied on an anodically
polarized Mg surface. Using galvanic couples to polarize a Mg sample may provide a more
natural way to study the enhanced HER at the Mg surface.
5.3.4 Implications for the enhanced HER at the Mg surface
The results here further validate the work presented in Chapter 4. The kinetics of HER measured
at the cathodic overpotential underpredict the current due to hydrogen evolution at the Mg
surface by two orders of magnitude. In order to fit the hydrogen current at the Mg surface, the
exchange current density obtained experimentally at the cathodic overpotential had to be
increased by two orders of magnitude. In Chapter 4, we reported that the peak current was
observed at cathodic potential immediately following the anodic dissolution. At a constant
cathodic potential where high anodic dissolution rates were absent, the peak current decreased by
an order of magnitude within 10 minutes. The peak current was the residual effect of anodic
dissolution. The result from Chapter 4 closely relates to simulation results in this chapter as the

95
HER kinetics estimated from the polarization measurement (where high rates of anodic
dissolution are absent) underpredict the HER current densities at the Mg surface by two orders of
magnitude. Therefore, both numerical simulation and the experimental results show the HER on
Mg surfaces is indeed catalyzed at a higher rate of anodic dissolution. Moreover, we have shown
that the simulation can be used as a tool to estimate the kinetics of HER at the Mg surface during
high anodic dissolution rates. As recognized in the literature31, 38, 55, this is a huge step forward in
determining how the kinetics may behave at different anodic dissolution rates.
5.3.5 Implications for the simulation work
First of all, the inclusion of current densities due to hydrogen evolution at the Mg surface is very
important in the simulation. This is especially true at high anodic dissolution rates as the rate of
the HER increases. Figure 5-15 below shows a comparison of the total current density observed
experimentally from the measurement of the magnesium corrosion product with that calculated
both with and without the inclusion of high rates of hydrogen evolution on the Mg surface.
a)
Figure 5-15: Comparison of total current density between simulation and experiment a) without
considering HER at Mg surface and b) with considering HER at Mg.
0
500
1000
1500
2000
2500
3000
3500
4000
8 mm 12 mm 16 mm
Tota
l cu
rren
t den
sity
(A
/m2)
Cathode size
Numerical Experimental
0
500
1000
1500
2000
2500
3000
3500
4000
8 mm 12 mm 16 mm
Tota
l cu
rren
t den
sity
(A
/m2)
Cathode size
Numerical Experimental
b) a)
96
In Figure 5-15b, the total current density (simulation) was obtained by adding the current density
due to HER (obtained by independently fitting the HER current from the experiment; see 5.3.2)
and the galvanic current density obtained from the simulation. It can be seen from Figure 5-15
that failure to include the HER on the Mg surface, even for galvanically coupled Mg, will lead to
errors (between simulation and experiments) in excess of 35%. Overall, the contribution of the
HER (at the Mg surface) towards the corrosion of Mg was greater than 30% for the geometry
and conditions examined in this study. Deshpande et al. reported a discrepancy between
simulation and experiments of more than 50%. In work by Jia et al., a discrepancy of up to 50%
was reported between the numerical simulation and the experimental results. In both of those
studies, the current due to the HER at the Mg surface was not considered likely resulting in
errors mentioned above.
Secondly, the kinetics of the HER on Mg surfaces depends on the rate of anodic dissolution. As
shown with our work, the kinetics measured from the polarization experiments below the
corrosion potential do not predict the current densities of the HER on Mg at high anodic
dissolution rates. Therefore, using the kinetics measured from the polarization experiments result
in a substantial error in the simulation.
5.4 Conclusions
In this chapter, we developed a numerical model to predict the corrosion rate of Mg galvanically
coupled to steel. After the numerical HER current densities at Mg surface were fit to those from
the experiment, the model predicted the experimental results, with a maximum error of about
14%. The fitting of HER current densities was valid because that did not affect the potential or
the galvanic corrosion rates substantially. Calculations were based on the secondary current

97
distribution. High rates of galvanic corrosion were possible due to high cathode-to-anode area
ratios and a minimal distance between the anode and cathode, where the electrical connection
between the two coupled electrodes was made outside of the cell. The ohmic drop due to bubbles
in solution as the result of hydrogen evolution was accounted for in the solution conductivity. It
is also shown that the exchange current density of the HER on Mg (0.016 A/m2) obtained
experimentally from the polarization data below the corrosion potential underpredicted the
hydrogen current on Mg at high dissolution rates by more than two orders of magnitude. In order
to fit the numerical HER current densities to those from the experiments, the exchange current
density of HER on Mg had to be increased by the same magnitude. The exchange current density
for the HER on Mg surface was different for each sample and increased with increasing rates of
anodic dissolution. Its value was estimated to be 1.55 Am-2, 1.80 Am-2, and 1.85 Am-2 for the 8
mm, 12 mm and 16 mm samples, respectively. It is shown that the exchange current density of
HER at the Mg surface depends strongly on the rate of anodic dissolution. The work further
validates the results presented in Chapter 4 where the rate of HER at the Mg surface was shown
to increase with the anodic dissolution rates. Moreover, the work supports the idea that the
enhanced rate of HER at Mg surfaces is catalyzed by the anodic dissolution of Mg. The HER on
Mg must be considered during the galvanic corrosion of Mg and the use of proper kinetics of
HER is needed in order to develop a precise numerical model.

98
6 INFLUENCE OF HYDROGEN BUBBLES DURING THE GALVANIC
CORROSION OF MG
6.1 Introduction
The work presented in this Chapter is a continuation of simulation work presented in Chapter 5.
Experimentally, it was observed that there was a substantial amount of hydrogen evolution from
the electrode surfaces during the galvanic corrosion of Mg37. The bubbles are not conductive and
their volume fraction reduces the apparent conductivity of the solution. This hinders the
movement of ions between the electrodes and affects the overall corrosion process. For free
corrosion of Mg (not coupled to another metal), the influence is minimal because both the
cathodic and the anodic reactions occur on the same surface. For galvanically coupled Mg, the
influence can be significant because the ions move in solution between the anode and the
cathode. The impact may be significant if the bubbles are present at a sufficient volume fraction
near the electrode surfaces. Therefore, for galvanically coupled Mg, the role of hydrogen
evolution should be studied. There are no previous studies that report the influence of hydrogen
bubbles on the corrosion of galvanically coupled Mg. However, it was previously recognized
that its role could be important for galvanic corrosion of Mg43.

99
6.1.1 Methods
The bubbles can significantly influence the solution conductivity. According to the Bruggeman
equation, if the bubbles occupy the solution volume of 10%, the conductivity can decrease by
15%. Previously, during the galvanic corrosion of Mg, an immersed camera was used to monitor
hydrogen evolution at the Mg surface. Figure 6-1 provides a snapshot of the hydrogen evolution
observed during the experiments.
Substantial hydrogen evolution was observed especially near the interface between the Mg and
steel electrodes. As shown in Figure 6-1, hydrogen evolution was not uniform across the
electrode surfaces. Therefore, assuming a uniform conductivity across the electrode surfaces in
the simulation would not be accurate. It was important to recognize the regions where substantial
hydrogen evolution was occurring and assign the appropriate conductivity. In order to do so, the
electrode surfaces were divided into 4 major regions and the measured hydrogen evolution was
distributed among these regions. These regions are as follows:
i) Steel surface - The distribution of hydrogen on the steel electrode surface was estimated
using both the experimental observations and the simulations. Experimentally, it was
Figure 6-1: Hydrogen bubbles seen with Mg coupled to 12 mm steel.

100
observed that the steel surface close to Mg showed substantially higher hydrogen
evolution rate than the surface that was farther away. This was also observed with the
simulation as the galvanic current density near the Mg electrode was substantially higher
(see Figure 6-2). Therefore, the steel surface was divided into two regions: steel 1 – the
area 1 mm away from the insulator and steel 2 - rest of the steel surface.
Figure 6-2: Current distribution calculated from the simulation on a 2 dimensional plane for three
different sample size. The negative values of current density indicate cathodic nature of the current.
-800
-700
-600
-500
-400
-300
-200
-100
0
0 2 4 6 8 10
Gal
van
ic c
urr
ent
den
sity
(A
/m2)
Distance from the center (mm)
Steel Surface 2
Mg Surface
Insulator
Bulk
Steel Surface 1

101
ii) Mg surface – The Mg electrode was roughly 3 mm in diameter. The distribution of
hydrogen at the Mg electrode was difficult to observe experimentally. However, the
hydrogen current distribution obtained from the simulation was relatively uniform when
compared to the distribution at the steel surface (see Figure 6-2 and Figure 6-3 for
comparison). Therefore, the hydrogen evolution rate on the Mg surface was assumed to
be uniform.
iii) Insulator surface – Technically, there is no hydrogen evolution in this region, which is the
thin insulator between the steel and the Mg. Given the thickness (0.4mm), the solution
conductivity above insulator surface was assumed to be an average of the solution
conductivities above the Mg and steel 1 regions.
-1200
-1000
-800
-600
-400
-200
0
0 0.5 1 1.5 2
Curr
ent
den
sity
due
to t
he
HE
R a
t th
e
Mg s
urf
ace
(A/m
2)
Distance from the center (mm)
8 mm
12 mm
16 mm
Figure 6-3: Hydrogen current distribution estimated from the simulation at the Mg surface for
three different electrodes. The negative values of current density indicate cathodic nature of the
current.

102
iv) Bulk (area outside of electrodes, see Figure 6-3) – This region did not have any hydrogen
evolution. Therefore, the conductivity of this region was taken as that of 5 wt% NaCl
solution (7.95 S/m).
The effective conductivity was calculated using the Bruggeman equation defined in Chapter 2,
Section 2.8. In order to find the effective conductivity, it was essential to know the volume
fraction of hydrogen bubbles above each region. The volumetric flow rate of the gas was
estimated from the total dissolved Mg measured experimentally using ICP-MS. In addition,
hydrogen volume was measured directly and found to be in close agreement with the values
estimated from ICP-MS. It was found that the average rate of hydrogen evolution was 0.125
mL/min, 0.15 mL/min and 0.17 mL/min for the 8 mm, 12 mm and 16 mm samples, respectively.
The standard deviation was in the range of 0.006 mL/min - 0.01 mL/min. The total hydrogen
evolution rate obtained experimentally was distributed between the Mg and the steel electrodes.
The fraction of the galvanic current and the HER current at the Mg surface (measured
experimentally) provided the fraction of hydrogen evolution rate at the steel surface and at the
Mg surface, respectively. However, it was not possible to distribute hydrogen evolving on the
steel into steel 1 and steel 2 regions using experimental observation. Therefore, using the
galvanic current distribution calculated from the simulation, the volumetric flow rate of
hydrogen at the steel surface was further distributed between steel 1 and steel 2 regions. The
volume fraction of the hydrogen bubbles (𝑓𝑔) was estimated with use of Equation 1 below97
𝑓𝑔 =𝑣𝑠
𝑣𝑡 (1)
where, 𝑣𝑠 is the superficial velocity and is defined as the ratio of the volumetric flow rate (V) of
the gas to the cross sectional area (𝐴𝑐) of the flow (see Figure 6-2 for the cross-section of
electrode surfaces) as shown in the Equation 2 below:

103
𝑣𝑠 = V𝐴𝑐−1
(2)
The terminal velocity (𝑣𝑡) of a bubble that is less than 0.7 mm in diameter is given by Stokes’
law as shown in Equation 3 below97
𝑣𝑡 =𝑔𝑑𝑏
2∆𝜌
18𝜇 (3)
where g is the acceleration due to the gravity, 𝑑𝑏 is the bubble diameter, ∆𝜌 is the difference in
density of bubble and the solution, and 𝜇 is the dynamic viscosity of the solution. The diameter
of a bubble97 in our experiment was assumed to be 50 µm. The calculated volume fraction of
hydrogen at the electrode surfaces is summarized in Table 6-1.
Table 6-1: Summary of estimated hydrogen volume fraction above electrode surfaces
Mg Steel 1 Steel 2
8 mm 9% 3.4% 2.2%
12 mm 9.9% 2.4% 1.1%
16 mm 10.1% 2.2% 1.4%
The estimation of the local conductivities in this study is approximate in nature. Nevertheless,
the influence of hydrogen bubbles on the galvanic corrosion of Mg is being reported for the first
time. As mentioned above, the current distribution calculated from the simulation was used to
calculate the fraction of galvanic current in each steel region. The hydrogen evolution was then
distributed in the two steel regions proportional to the galvanic current density. The simulation
was run and the process was manually repeated until further iteration did not change the current
distribution (and the solution conductivity) in each region mentioned above and shown in Figure

104
6-4. The iterative process was necessary because the H2 evolution is influenced by the
conductivity and vice versa.
Figure 6-4 shows the final conductivity profile for the 12 mm sample.
A summary of the solution conductivity values above the electrode surface for the different
regions is given in Table 6-2.
(c) (a) (d) (b) (e)
Figure 6-4: Distribution of solution conductivities for a 12 mm sample. Outside diameter of
region a = 1.5 mm, b = 1.9 mm, c = 2.9 mm, d = 6 mm and e = 15 mm. Note that region (e) is
circular and only part of it is shown in the figure.

105
The conductivity of solution above Mg surface decreased slightly with increasing cathode size.
This is due to an increased rate of hydrogen evolution at the Mg surface for the larger cathode.
The conductivity of the solution above the insulator surface was relatively constant. The solution
conductivity above steel surface 1 and steel surface 2 increased with cathode size. It has to be
noted that the regions of different conductivity, shown in Figure 6-4 and Table 6-2, represent
upright concentric cylinders above the electrode surface. The hydrogen bubbles eventually
coalesce at some vertical distance from the electrode surface. In the next section, we discuss
whether or not the coalescence of bubbles influences our approximation of the conductivities.
6.2 Results
The effect of gas bubbles was introduced in the simulation in terms of decreased solution
conductivity as explained in the previous section. Using the simulation, the galvanic current
densities were estimated with and without the consideration of hydrogen bubbles. The results are
shown in Table 6-3.
Sample Mg (a) Insulator (b) Steel surface 1 (c) Steel surface 2 (d) Rest (e)
8 mm 6.90 7.23 7.55 7.69 7.95
12 mm 6.82 7.23 7.67 7.78 7.95
16 mm 6.80 7.25 7.69 7.81 7.95
Table 6-2: Solution conductivity (S/m) for each region

106
Table 6-3: Galvanic current densities (A/m2) with and without the effect of hydrogen bubbles
Sample With HER consideration Without HER consideration % difference
8 mm 1736 1880 8.3%
12 mm 1957 2135 9.1%
16 mm 2086 2278 9.2%
The hydrogen bubbles decreased the galvanic current densities by ~8-9%. It can be seen that the
influence of hydrogen bubbles slightly increased with the cathode size. This is due to higher rate
of hydrogen evolution as the cathode size increases.
The influence of hydrogen bubbles on the current densities due to HER at the Mg surface was
minimal. This was expected because both the anodic and cathodic reactions occur at the same
surface and therefore the impact of solution conductivity is less significant. The hydrogen
evolution does change the galvanic current densities which slightly changes the solution
potentials near the Mg electrode. However, the impact on HER current at the Mg surface was not
significant. Next, using the simulation, the total current densities were estimated with and
without the consideration of the effect of hydrogen evolution on the conductivity. The results are
shown in Table 6-4 below.
Table 6-4: Total current densities (A/m2) with and without the effect of hydrogen bubbles
Sample With HER consideration Without HER consideration % difference
8 mm 2688 2827 5.2%
12 mm 3007 3162 5.1%
16 mm 3159 3317 5.0%

107
It is seen from Table 6-4 that the total current densities decrease by only ~5% due to the
hydrogen bubbles. In general, despite the significant hydrogen evolution observed during the
experiment, calculations indicate that there is not a strong influence of hydrogen evolution on the
current densities. The hydrogen bubbles were distributed in the solution above the electrode
surfaces. The bubbles rise vertically and coalesce at some distance from the electrode. That
coalescence was not accounted for in this study. Instead, it was assumed that the hydrogen
bubbles moved directly upward from the electrode surface. We now look at the potential field
distribution to see if this assumption influenced our results. A 2D axisymmetric view of the
potential field in a 12 mm sample is shown in Figure 6-5 below. Please note that the potential
field distributions for the other two samples were similar.
From Figure 6-5, it can be seen that gradients are limited to a region very close to the electrode
surface. Next, the distribution of potential field along a vertical line starting from the center of
the electrode was plotted. This is shown in Figure 6-6 below.
Figure 6-5: Potential field distribution in a 12 mm sample in a 2D axisymmetric view.

108
From Figure 6-6, it is seen that within a vertical distance of 3 mm from the center of the
electrode, more than 88% of the total drop in potential occurs. It is in this region where the
conductivity will have an impact. The result was similar for other samples as well. It is seen that
there is not a substantial potential field present at vertical distances of >3mm from the electrode
surface. Therefore, our assumption that the conductivity is important only near the electrode
surface is valid. It is the reason why the influence of hydrogen evolution on galvanic corrosion of
Mg is only 8-9% despite a substantial amount of hydrogen observed during the experiments.
6.3 Conclusions
The influence of hydrogen evolution on the galvanic corrosion of Mg is presented for the first
time. It was observed that hydrogen evolution decreases galvanic current densities by 8-9% and
decreases the total current densities by ~5%. Further analysis shows that the strength of electric
field and potential remains close to surface. In fact, close to 88% of the drop in strength of
1
1.05
1.1
1.15
1.2
1.25
1.3
1.35
1.4
1.45
0 3 6 9 12 15 18 21
Corr
osi
on P
ote
nti
al (
Vsc
e)
Vertical distance from the center of the
electrode (mm)
Figure 6-6: Potential field along a vertical line starting at the center of the electrode.

109
electric field occurs within a vertical distance of 3 mm from the electrode surface. Therefore, our
assumption that the bubble move directly upward near the electrode surface is valid.

110
7 CONCLUSIONS AND FUTURE WORK
7.1 Conclusions
This work investigates important areas related to the Mg corrosion, as recognized in the literature
review (in Chapter 2). In Chapter 3, the reaction kinetics of Mg corrosion were discussed. In
particular, the influence of Mg surface changes on the HER kinetics was analyzed. HER kinetics
on a pre-corroded Mg was found to be substantially higher than that for a polished Mg surface.
In our study, it was shown that the Tafel slope for pre-corroded Mg (0.27 mV/dec) was
significantly lower than that for polished Mg (0.47 mV/dec). This is in contrast to the literature
where the exchange current density of HER on pre-corroded Mg was shown to be higher, but the
Tafel slope was reported to be similar34, 38, 54. Note that the lower Tafel slope is consistent with a
reaction that increases more rapidly with potential. Kinetic measurements in this study included
the effect of concurrent Mg dissolution, which was significant even below the corrosion potential
of Mg. In fact, it was found that inclusion of the concurrent Mg dissolution was responsible for
the lower Tafel slope. In contrast, the entire current is not measured when estimating HER
kinetics from polarization measurements as is commonly done. It is, therefore, recommended
that the current due to concurrent Mg dissolution be considered in order to get the precise
kinetics.
In Chapter 4, the enhanced rate of the HER at the Mg surface was investigated. The samples
were pre-corroded at different rates (but with equal charge) until the entire Mg surface was

111
corroded. For the first time, the influence of surface roughness was studied. For the samples that
were pre-corroded, it was found that the surface roughness decreased with increased pre-
corrosion rates. Polarization experiments showed that the surface roughness did not have an
effect on the samples with an intact film. Upon removal of the film, the hydrogen current at a
given potential was the highest for the sample corroded at the lowest rate, which also had the
highest surface roughness.
In order to study the influence of Mg dissolution rate on the HER, the potential was immediately
dropped in the cathodic region following the pre-corrosion. The cathodic current densities
observed at a constant cathodic potential (-1.7 Vsce or -2.4 Vsce) immediately following anodic
dissolution were proportional to the prior pre-corrosion rates. The peak current densities were
seen immediately when the polarization was switched from anodic to cathodic. However, at
longer times, the current densities decreased and converged to similar values, irrespective of the
prior pre-corrosion rate. In another experiment, when the polarization was performed at a later
time after the pre-corrosion, all samples had identical behavior. This explained the convergence
of current densities observed with peak current at long times following the pre-corrosion. For
polarization that was measured at a later time following the anodic dissolution, the maximum
contribution towards the current density from the film was found to be ~9 A/m2 and the
maximum contribution from the enrichment of impurities was found to be ~5.5 A/m2 at -1.7 Vsce.
The peak current density observed (immediately following the pre-corrosion) was at least an
order of magnitude higher than that observed during the cathodic polarization at the same
cathodic potential (-1.7 Vsce). It was seen that the contribution of film and impurities towards the
enhanced HER in absence of high anodic dissolution rates was minimal. Although the
contribution of film and impurities towards enhanced HER is found to be insignificant in the

112
absence of high anodic dissolution rates, their contribution could be significant in presence of
anodic dissolution rates. There is clear evidence that simultaneous anodic dissolution provides a
catalytic effect that enhances hydrogen evolution at the Mg surface. Such observation is
supported by both our experiments and the numerical model (discussed below). The catalytic
effect may come from the Mg surface, impurities, or from the film behaving differently during
high rates of anodic dissolution.
In Chapter 5, a numerical model was developed to predict the galvanic corrosion rates of Mg
coupled to steel. From the simulation, it was seen that the current and the potential field
distributions were highest in the regions where the Mg and the steel electrodes were closest to
each other. Initial results showed the HER kinetics estimated from the measured polarization
(where anodic dissolution rate is low) significantly underpredicted the experimental HER current
densities at the Mg surface (where anodic dissolution is high). When the exchange current
density (0.016 A/m2) of the HER on Mg estimated from the measured polarization was changed
to fit the experimental current densities, it had to be increased by roughly two orders of
magnitude. The exchange current density of HER on Mg was seen to increase with the increased
anodic dissolution rates. The fact that these values are significantly higher than those obtained
from the cathodic polarization speak to the extent of the catalytic effect caused likely due to the
high anodic dissolution rate. While the actual mechanism of this catalytic effect is not within the
scope of this study, the work herein establishes the importance of the HER at the Mg surface
(even for galvanically coupled Mg) and the need for selection of the proper HER kinetics. The
fitting process did not affect the potential and the galvanic current densities significantly. The
model predicted the experimental galvanic current densities within 11% error. Similarly, the
values of corrosion potential predicted by the simulation were off from the mean experimental

113
values by only 10-40 mV. The model is an improvement from the previous studies39, 41 where
significant errors between the simulation and experimental results were reported. The
consideration of HER kinetics on Mg in the model likely is one of the factors contributing to
improved model precision.
The work in Chapter 6 was a continuation of the simulation study in Chapter 5. The influence of
hydrogen bubbles on the solution conductivity was accounted for by estimating the volume
fraction of bubbles in the solution above the electrodes. It was assumed that the bubbles move in
an upward direction near the electrode surface. The effect of such bubbles on the galvanic
corrosion rate was presented for the first time. During the galvanic corrosion experiments, a
significant amount of hydrogen bubbles was seen above the electrode surfaces. However, the
simulation showed that the hydrogen evolution decreased the galvanic current densities by ~8-
9% and the total current densities by ~5%. Using the simulation, the potential field distribution
was examined and it was found that the strength of potential field dropped by 88% within a
vertical distance of 3 mm from the electrode surface. Therefore, the conductivity is only
important close to the surface where the direct upward movement of bubbles are most likely to
be valid.
7.2 Future work
There are several opportunities for future work that build on our study, some of which are
discussed below.
Mechanism of enhanced HER – In Chapter 4, we demonstrated that the rate of HER at the Mg
surface is enhanced by the rate of anodic dissolution. However, the mechanism of catalytic effect
provided by the anodic dissolution is still up for further investigation. In particular, it is

114
important to recognize the sites of hydrogen evolution and how they change with anodic
dissolution. In such regard, using an in situ apparatus with high magnification and resolution
where hydrogen evolution can be observed in presence of anodic dissolution may provide
valuable insight. We have previously shown for our galvanically coupled samples that the rate of
Mg corrosion can be controlled using different cathode-anode-area ratios37. If the electrical
connection between the anode and the cathode can be controlled remotely, then the rate of
corrosion can be controlled in a sample in situ. Such study may provide specific insights into the
localized HER. Moreover, the role of films and impurities could be observed as well.
Improvement in the model – In this work, a numerical model was developed to predict galvanic
corrosion rates of pre-corroded Mg surface. Our work provides important insights into the
reaction kinetics of Mg corrosion and the role of hydrogen bubbles. However, the model did not
consider the role of corrosion products, temperature effects, and Cl- that could have a significant
impact43. More complex geometries that depict the practical interaction of Mg structure with
multiple other structural metals could be explored. Moreover, a model that can predict the rate of
corrosion with time could provide predictive capabilities towards Mg structure stability.
A study in more practical environmental conditions - Studying Mg corrosion under a thin
electrolyte film is of particular interest due to its practical significance98-101. In most of the real
world applications, the corrosion of Mg takes place under an electrolyte film. The cathodic
reaction of Mg corrosion is H2 evolution; however, the change in electrolyte thickness may affect
the processes such as the mass transport of dissolved oxygen, pH changes59 and accumulation of
corrosion products102. Under a thin film electrolyte, oxygen consumption may compete with
hydrogen evolution62, 98, 100. It is, therefore, possible that oxygen may play a role for thin
electrolyte film. Exploring the role of oxygen for Mg corrosion under for thin electrolyte film is

115
significant because it may change the cathodic reaction. From a practical scenario, thin
electrolyte films are important to study because most applications of Mg are exposed to such
films caused by rainwater and atmospheric moisture.

116
REFERENCES
1. E. Ghali, W. Dietzel and K. Kainer, Journal of Materials Engineering and Performance, 13,
7 (2004).
2. M. K. Kulekci, The International Journal of Advanced Manufacturing Technology, 39, 851
(2007).
3. G. Song and A. Atrens, Advanced Engineering Materials, 1, 11 (1999).
4. A. A. Luo, JOM, 42 (2002).
5. E. Ghali, W. Dietzel and K. Kainer, ASM International, 13, 517 (2004).
6. E. Ghali, General, Galvanic, and Localized Corrosion of Magnesium and Its Alloys, John
Wiley & Sons, Inc. (2010).
7. B. A. Shaw, ASM International, 13A, 692 (2003).
8. J. Hanawalt, C. Nelson and J. Peloubet, Trans. AIME, 147, 273 (1942).
9. Regulations for Greenhouse Gas Emissions from Passenger Cars and Trucks, in, United
States Environmental Protection Agency.
10. M. Brady, W. Joost and C. Warren, Corrosion The Journal of Science and Engineering
(2016).
11. J. Huetter, 2017 Chrysler Pacifica takes top safety honor; learn more about mixed-material
minivan, in, Repair Driven News, www.repairerdrivennews.com (2016).
12. J. Huetter, 2018 Odyssey uses steel-magnesium-aluminum body combo; 95% likely to have
autobraking, in, Repairer Driven News, www.repairerdrivennews.com (2017).
13. T. Skszek, Demonstration Project for Multi-Material Lightweight Prototype Vehicle as Part
of the Clean Energy Dialogue with Canada—Vehma International of America, Inc. and
Ford Motor Company, in, p. 238, U.S. DOE, FY 2014 Annual Progress Report-
Lightweight Materials R&D (2015).
14. M. F. Montemore, Physical Sciences Review, 1 (2016).
15. N. Birbilis, G. Williams, K. Gusieva, A. Samaniego, M. A. Gibson and H. N. McMurray,
Electrochemistry Communications, 34, 295 (2013).
16. D. Eaves, G. Williams and H. N. McMurray, Electrochimica Acta, 79, 1 (2012).

117
17. G. Williams, H. N. McMurray and R. Grace, Electrochimica Acta, 55, 7824 (2010).
18. H. S. Kim, G. H. Kim, H. Kim and W. J. Kim, Corrosion Science, 74, 139 (2013).
19. A. Pardo, M. C. Merino, A. E. Coy, R. Arrabal, F. Viejo and E. Matykina, Corrosion
Science, 50, 823 (2008).
20. Y. Feng, R. C. Wang, C. Q. Peng, K. Qiu, C. Zhang and J. P. Zhang, Corrosion Science, 52,
3474 (2010).
21. R.-c. Zeng, J. Zhang, W.-j. Huang, W. Dietzel, K. U. Kainer, C. Blawert and W. Ke,
Transactions of Nonferrous Metals Society of China, 16, s763 (2006).
22. T. Takenaka, T. Ono, Y. Narazaki, Y. Naka and M. Kawakami, Electrochimica Acta, 53,
117 (2007).
23. W. Liu, F. Cao, L. Chang, Z. Zhang and J. Zhang, Corrosion Science, 51, 1334 (2009).
24. G. Sahu and B. Patel, International Journal for Innovative Research in Science &
Technology, 1, 157 (2015).
25. H. M. Wong, K. W. Yeung, K. O. Lam, V. Tam, P. K. Chu, K. D. Luk and K. M. Cheung,
Biomaterials, 31, 2084 (2010).
26. J. E. Gray and B. Luan, Journal of Alloys and Compounds, 336, 88 (2001).
27. Y. Kojima, Materials Science Forum, 350-351, 3 (2000).
28. H. Furuya, N. Kogiso, S. Matunaga and K. Senda, Materials Science Forum, 350-351, 341
(2000).
29. N. Birbilis, A. D. King, S. Thomas, G. S. Frankel and J. R. Scully, Electrochimica Acta,
132, 277 (2014).
30. T. Cain, S. B. Madden, N. Birbilis and J. R. Scully, Journal of the Electrochemical Society,
162, C228 (2015).
31. G. S. Frankel, A. Samaniego and N. Birbilis, Corrosion Science, 70, 104 (2013).
32. D. Lysne, S. Thomas, M. F. Hurley and N. Birbilis, Journal of the Electrochemical Society,
162, C396 (2015).
33. S. H. Salleh, S. Thomas, J. A. Yuwono, K. Venkatesan and N. Birbilis, Electrochimica Acta,
161, 144 (2015).

118
34. M. Taheri, J. R. Kish, N. Birbilis, M. Danaie, E. A. McNally and J. R. McDermid,
Electrochimica Acta, 116, 396 (2014).
35. S. Thomas, N. V. Medhekar, G. S. Frankel and N. Birbilis, Current Opinion in Solid State
and Materials Science, 19, 85 (2015).
36. G. Williams, N. Birbilis and H. N. McMurray, Electrochemistry Communications, 36, 1
(2013).
37. D. R. Banjade, S. D. Porter, B. M. McMullan and J. N. Harb, Journal of The
Electrochemical Society, 163, C116 (2016).
38. S. Fajardo, C. F. Glover, G. Williams and G. S. Frankel, Electrochimica Acta, 212, 510
(2016).
39. K. B. Deshpande, Corrosion Science, 52, 3514 (2010).
40. K. B. Deshpande, Corrosion Science, 62, 184 (2012).
41. J. X. Jia, A. Atrens, G. Song and T. H. Muster, Materials and Corrosion, 56, 468 (2005).
42. J. X. Jia, G. Song and A. Atrens, Advanced Engineering Materials, 9, 65 (2007).
43. D. Hoche, Journal of Electrochemical Society, 162, C1 (2015).
44. D. Trinh, P. Dauphin Ducharme, U. Mengesha Tefashe, J. R. Kish and J. Mauzeroll, Anal
Chem, 84, 9899 (2012).
45. P. Vanysek, (2000).
46. N. Hara, Y. Kobayashi, D. Kagaya and N. Akao, Corrosion Science, 49, 166 (2007).
47. M. Santamaria, F. Di Quarto, S. Zanna and P. Marcus, Electrochimica Acta, 53, 1314
(2007).
48. N. Sato, in Green Corrosion Chemistry and Engineering: Opportunities and Challenges, S.
K. Sharma Editor, Wiley-VCH Verlag GmbH & Co. KGaA, Weinheim, Germany (2011).
49. A. J. Bard, Electrochemical Methods: Fundamentals and Applications, John Wiley & Sons,
INC (2001).
50. L. H. Mendoza-Huizar, C. A. Galand-Vidal and C. H. Rios Reyes, Advances in Technology
of Materials and Materials Processing Journal, 38 (2006).

119
51. G. Song, A. Atrens, D. S. John, X. WU and J. Nairn, Corrosion Science, 39, 1981 (1997).
52. S. Bender, J. Goellner, A. Heyn and S. Schmigalla, Materials and Corrosion, n/a (2011).
53. A. Atrens and W. Dietzel, Advanced Engineering Materials, 9, 292 (2007).
54. S. Fajardo and G. S. Frankel, Electrochimica Acta, 165, 255 (2015).
55. S. Fajardo and G. S. Frankel, Electrochemistry Communications, 84, 36 (2017).
56. S. Fajardo and G. S. Frankel, Journal of The Electrochemical Society, 162, C693 (2015).
57. T. W. Cain, I. Gonzalez-Afanador, N. Birbilis and J. R. Scully, Journal of The
Electrochemical Society, 164, C300 (2017).
58. A. D. King, N. Birbilis and J. R. Scully, Electrochimica Acta, 121, 394 (2014).
59. L. Rossrucker, A. Samaniego, J. P. Grote, A. M. Mingers, C. A. Laska, N. Birbilis, G. S.
Frankel and K. J. J. Mayrhofer, Journal of the Electrochemical Society, 162, C333
(2015).
60. G. Williams, N. Birbilis and H. N. McMurray, Faraday discussions (2015).
61. S. Lebouil, A. Duboin, F. Monti, P. Tabeling, P. Volovitch and K. Ogle, Electrochimica
Acta, 124, 176 (2014).
62. D. Hoche, C. Blawert, S. V. Lamaka, N. Scharnagl, C. Mendis and M. L. Zheludkevich,
Phys Chem Chem Phys, 18, 1279 (2015).
63. K. S. Williams, V. R. Santiago and J. W. Andzelm, Electrochimica Acta, 210 (2016).
64. J. A. Yuwono, N. Birbilis, K. S. williams and N. V. Medhekar, The Journal of Physical
Chemistry C, 120 (2016).
65. K. Limmer, K. Williams, J. Labukas and J. Andzelm, Corrosion, 73 (2017).
66. K. S. Williams, J. P. Labukas, V. R. Santiago and J. Andzelm, Corrosion, 71 (2015).
67. C. D. Taylor, The Journal of Electrochemical Society, 163 (2016).
68. N. Birbilis, T. Cain, J. S. Laird, J. Xia, J. R. Scully and A. E. Hughes, ECS Electrochemistry
Letters, 4 (2015).
69. M. Taheri, M. Danaie and J. R. Kish, Journal of Electrochemical Society, 161 (2014).

120
70. M. Taheri, R. C. Phillips, J. R. Kish and G. A. Botton, Corrosion Science, 59 (2012).
71. R. C. Phillips and J. R. Kish, Corrosion, 69 (2013).
72. K. A. Unocic, H. H. Elsentriecy, M. P. Brady, H. M. Meyer III, G. L. Song, M. Fayek, R. A.
Meisner and B. Davis, Journal of Electrochemical Society, 161 (2014).
73. M. P. Brady, G. Rother, L. M. Anovitz, K. C. Littrell, K. A. Unocic, H. H. Elsentriecy, G. L.
Song, J. K. Thomson, N. C. Gallego and B. Davis, Journal of Electrochemical Society,
162 (2015).
74. Z. P. Cano, M. Danaie, J. R. Kish, J. R. McDermid, G. A. Botton and G. Williams,
Corrosion, 71 (2014).
75. Z. Cano, J. R. McDermid and J. R. Kish, Journal of Electrochemical Society, 162 (2015).
76. M. Curioni, Electrochimica Acta, 120, 284 (2014).
77. G. Williams and H. Neil McMurray, Journal of The Electrochemical Society, 155, C340
(2008).
78. R. Walter and M. B. Kannan, Materials & Design, 32, 2350 (2011).
79. J. X. Jia, G. Song and A. Atrens, Corrosion Science, 48, 2133 (2006).
80. L. c. Lacroix, C. Blanc, N. Pebere, B. Tribollet and V. Vivier, Journal of The
Electrochemical Society, 156, C259 (2009).
81. D. A. G. Bruggeman, Ann. Phys., 24, 636 (1935).
82. I. Marco and O. Van der Biest, Corrosion Science, 102, 384 (2016).
83. Z. Shi, M. Liu and A. Atrens, Corrosion Science, 52, 579 (2010).
84. E. Zhang, L. Yang, J. Xu and H. Chen, Acta Biomater, 6, 1756 (2010).
85. L. G. Bland, A. D. King, N. Birbilis and J. R. Scully, Corrosion, 71, 128 (2015).
86. L. Rossrucker, K. J. J. Mayrhofer, G. S. Frankel and N. Birbilis, Journal of the
Electrochemical Society, 161, C115 (2014).
87. Z. Qiao, Z. Shi, N. Hort, N. I. Zainal Abidin and A. Atrens, Corrosion Science, 61, 185
(2012).

121
88. M. C. Turhan, Q. Li, H. Jha, R. F. Singer and S. Virtanen, Electrochimica Acta, 56, 7141
(2011).
89. P. Volovitch, C. Allely and K. Ogle, Corrosion Science, 51, 1251 (2009).
90. Y. Yang, F. Scenini and M. Curioni, Electrochimica Acta, 198, 174 (2016).
91. G.-L. Song and K. A. Unocic, Corrosion Science, 98, 758 (2015).
92. G. Song, B. Johannesson, S. Hapugoda and D. StJohn, Corrosion Science, 46, 955 (2004).
93. K. B. Deshpande, Electrochimica Acta, 56, 1737 (2011).
94. N. C. Bosch, D. Hoche, A. Mittelbach and K. Kainer, Euro Hybrid Materials and Structures
(2014).
95. W. Sun, G. Liu, L. Wang, T. Wu and Y. Liu, Journal of Solid State Electrochemistry, 17,
829 (2012).
96. E. R. Gonzalez, L. A. Avaca, A. Carubelli, A. A. Tanaka and G. Tremiliosi-Filho,
International Journal of Hydrogen Energy, 9, 689 (1984).
97. T. F. Fuller and J. N. Harb, Electrochemical Engineering, WILEY (2018).
98. Y. L. Cheng, Z. Zhang, F. H. Cao, J. F. Li, J. Q. Zhang, J. M. Wang and C. N. Cao,
Corrosion Science, 46, 1649 (2004).
99. W. Liu, F. Cao, A. Chen, L. Chang, J. Zhang and C. Cao, Corrosion Science, 52, 627
(2010).
100. T. Zhang, C. Chen, Y. Shao, G. Meng, F. Wang, X. Li and C. Dong, Electrochimica Acta,
53, 7921 (2008).
101. T. Prosek, A. Nazarov, U. Bexell, D. Thierry and J. Serak, Corrosion Science, 50, 2216
(2008).
102. M. Jönsson, D. Persson and D. Thierry, Corrosion Science, 49, 1540 (2007).