Helioseismic line shape estimation given stochastic excitation
Upload
independentCategory
view
4download
0
JOURNAL OF RAMAN SPECTROSCOPY, VOL. 20, 191-202 (1989)
Highly Resolved Depolarization Dispersion and Excitation Profiles of Raman Fundamentals of Protoporphyrin IX in a Cytochrome c Matrix
U. Bobinger, R. Schweitzer-Stenner and W. Dreybrodt* University of Bremen, Physics Department, FB1,2800 Bremen 33, FRG
New experimental data for depolarization dispersion (DPD) and excitation profiles (EP) with high spectral resolution (20 cm- ') are provided for Raman fundamentals of protoporphyrin IX in ferrocytochrome c between 17000 and 22500 cm-', covering the resonant region of the Q-bands and the pre-resonant region of the B-bands. Both DPD and EPs of the lines at 1312 and 1585 cm-' (Azs), at 1363 cm-' (Als) and at 1621 cm-' (B,#) exhibit sharp structures. These result from multi-mode contributions of vibrations which give intensity to the vibronic sideband of the Q-absorption. On the basis of these highly resolved new data we have shown that the Raman tensor can be formulated in terms of Loudon's strictly timedependent perturbation formulation to third order augmented by a fifth-order term representing the multi-mode effects. From the EPs, which were measured in absolute units, we obtained values of vibronic coupling parameters for the Raman fundamentals which are consistent with the optical absorption spectra and show that vibronic coupling is weak for this type of molecule.
INTRODUCGON Resonance Raman scattering has been used extensively to study vibronic coupling in the excited states of porphyrin molecules. In this class of molecule, the lowest singlet excited states are located in the visible region and are therefore easily accessible to the mea- surement of excitation profiles (EP) and depolarization ratio dispersion (DPD) by tunable dye lasers. Under D,, symmetry, as is approximately the case for octaethylporphyrin for instance, the depolarization ratio (DPR) of the A', , B, , , A,, and B,, Raman funda- mentals is independent of the exciting laser frequency.' A,, modes exhibit a value of 1/8, B1, and B2, modes a value of 3 14 and A', modes a value of infinity.
Experimental results on porphyrins, which are subject to symmetry-lowering perturbations, show, however, strong dispersion of their depolarization ratio with exciting wavelength. Symmetry-lowering perturbations are either asymmetric side-chains on the porphyrin ring skeleton' or interactions of the porphyrin molecule with the protein matrix in which it is Conse- quently, intense theoretical work has been carried out to elucidate Raman EPs and depolarization ratios in pure D,, symmetry' and in environments of low sym- metry.1,6-8 This work has led to a good understanding of vibronic couplings that determine the features exhibited by the Raman data, in both the weak and the strong coupling limits.
Zgierski and Pawlikowski' have given a systematic treatment of the influence of asymmetric perturbations of electronic and vibronic origin on the EPs and DPD of metalloporphyrins and metallophthalocyanines by exact diagonalization of the corresponding energy matrix, which contains both the electronic and the vib-
* Author to whom correspondence should be addressed.
ronic Hamiltonian in D,, symmetry and also the symmetry-lowering environmental perturbations. The matrix is diagonalized in a basis set of products of har- monic oscillator functions and the I Qxo), I Q y o ) , I B x o ) and I B y o ) electronic states, composed of equal parts of the electronic configurations (uiu, &, e,') and (&, a:, , e,') in the four-orbital Gouterman model.' Although this theory gives a good understanding of the essential features of the EPs and DPR of the Raman fundamentals, it cannot easily be used for a fitting pro- cedure for experimental data because of its numerical complexity. In view of the many parameters involved in the vibronic coupling and symmetry-lowering inter- actions, an analytical expression for the Raman tensor would be more appropriate for a fitting procedure. Such an expression was proposed by us3 in order to extract parameters of haeme-apoprotein interactions of proto- porphyrin IX embedded in haemoglobin or cytochrome c.,,~-' In this case of biologically important porphy- rins, vibronic coupling is weak.5 Therefore, the Raman tensor was formulated3 by using strict time-dependent theory as given by Loudon." In third order this expres- sion was also formulated by Peticolas et ~ 1 . ' ~ In order to account for multi-mode effects due to vibrations transferring oscillator strength into the vibronic Q and B side-bands, the formulation was expanded to fifth order, taking into consideration the creation and sub- sequent annihilation of a second representative vibra- tion with frequency Reff not necessarily identical with the observed Raman vibration with frequency, R, . This theory proved successful in extracting parameters of environmental perturbations from the Raman data of oxyhaemoglobin and cytochrome c by a fitting pro- cedure, which could be related to the biological proper- ties of the mole~u le .~~~* ' '
For oxyhaemoglobin, for example, pH-dependent variations of EPs and DPD have been ~btained.~." These were analysed in terms of symmetry-lowering dis-
Receiued January 1988 Accepted (revised) I 1 November 1988
0377486/89/03019 1-1 2 $06.00 0 1989 by John Wiley & Sons, Ltd
192 U. BOBINGER, R. SCHWEITZER-STENNER AND W. DREYBRODT
tortions of the haeme group due to conformational changes of the protein matrix caused by protonation of distinct titratable amino acid side-chains for which the pK values were determined. These thermodynamic parameters were used to explain the pH dependence of the fourth Adair constant and the respective kinetic constants of HbCO and HbO, binding, thus providing a relationship among structural (haeme distortions) and functional (binding constants of the ligand) data. Further, Brunzel et uL9 measured small pH-dependent variations of the absorption coefficients in the Q- and B-bands of oxyhaemoglobin, which were interpreted in terms of the same set of pK values required to explain the pH dependence of the Raman data. These examples show that the investigation of resonant Raman scat- tering can serve as a powerful tool for monitoring haeme-apoprotein interaction in many biologically rele- vant molecules.
Recently, Zgierski' has reported a general criticism of our model. In his opinion our interpretation is unsatisfactory since it does not account simultaneously for EPs, DPD and the absorption spectra. Zgierski reached this conclusion by inserting the coupling parameters obtained from our analysis3 of cytochrome c and oxyhaemoglobin Raman data into the formalism of his theory, which led to physically unacceptable results. By fitting his theory augmented by multi-mode effects (second vibration) to these earlier experimental data3 he provided EPs and DPD which are in crude agreement, but fail to exhibit the sharp structures evident in the experimental data. However, the param- eters used to obtain these results are physically accept- able.
To clarify the question of the applicability of our for- mulation we have measured DPD and polarized EPs of four ferrocytochrome lines at 1312 cm-' (A2g), 1363 cm-' (Alg), 1585 cm-' (Az9) and 1621 cm-' (Big) with high spectral resolution in the entire pre-resonant and resonant region of the Q-bands, by using an excimer laser pumped dye laser. To obtain absolute values of the coupling parameters, the Raman inten- sities were measured in absolute units by comparing them with the 980cm-' line of SO:- ions present in the solution as an internal standard. In this way a much more reliable set of data is obtained, in contrast to our earlier work where the data were taken only for argon laser lines. Vibronic coupling parameters were obtained by fitting our theoretical expression to these data. All these coupling parameters are now given in absolute units, in contrast to our earlier work3 where only those of the second phonon (vibration) could be obtained in energy units, whereas the coupling parameters of the Raman vibration were expressed in relative units.
We shall demonstrate that the application of our theory to Raman scattering in cytochrome c yields excellent agreement with the experimental data with physically acceptable parameters, contrary to the criti- cism of Zgierski. ''
THEORETICAL BACKGROUND
In the formulation of our t h e ~ r y , ~ we have used Loudon's time-dependent perturbation expression12
acting on the Hamiltonian
A = A, + Ai A, = A,, + I?, + Avib ( 1 )
I?i = vib + r
tii represents the interaction operator, fie, is the elec- tronic Hamiltonian for nuclear coordinates fixed at equilibrium, A, is the Hamiltonian of the electromag- netic radiation fields and Hvib describes the vibrations of the molecule. The vibronic interaction is represented by fie,, vib. He,, denotes the electron-photon inter- action. In Loudon's approach one uses as a set of basis functions the product of the_eigenfunctions which are solutions of He,, A v i b and H, separately. The lowest order contribution to vibrational Raman scatteeng in this approach results from third-order terms in Hi and has been calculated by Peticolas et ul.,' who obtained the following expression for the polarizability tensor :
x [ ( C e + RR - 5 , + iye)(ijs - C L + iy")] -' + MFHtsMY
x [(Ge - 5 , + iye)(5, + RR - ?L + iy")] ' (2)
where M T , M:g are dipole transition matrix elements connecting the electronic ground state 1s) and the excited electronic state I e ) , I s ) (p, (T = x, y , z label the polarization state of the transition), MF = ( g I R , I e); Hts is t_he matrix element of the vibronic coupling oper- ator 8H/dQm, connecting two excited electronic states I e ) and I s) according to the norm_al coordinate QR of the Raman vibration, Hts = (e I 8H/8QR 1 s ) ; 5 e , 5 , are the energies of the electronic levels, 5 , is the energy of the incident radiation and 0, the energy of the Raman phonon and ye, ys denote half-widths of the electronic levels.
If one considers in the Hamiltonian of Eqn (1) not only the Raman-active mode but also all the other vibrations of the molecule simultaneously, multi-mode contributions to Raman scattering result from the fifth- order terms in Loudon's expan~ion.~ These account for contributions to the Raman intensity resulting from the oscillator strength visible in the vibronic side-bands of the Q and B absorption. Correspondingly, seventh- order contributions in Loudon's formulation describe scattering intensity due to sidebands where two vibra- tions are excited. Since these, however, are not present in the absorption spectra of protoporphyrin IX, we con- clude that also in Raman scattering seventh-order con- tributions are negligible.
The fifth-order contribution to the polarizability can be written3 as

PROTOPORPHYRIN IX IN A CYTOCHROME c MATRIX 193
with 9 , ( 3 , , 8, , 3, , 3, = [(S, - 3, + if)(?, + RR - 3, + i f )
x ( f t + R, + Q, - f,, + if)(?, + RR - ?, + i f ) ] - '
x (fs + Q, + RR - 3, + if)(?, + RR - f, + iye)]-' + [(3, - I, + iy")(3, + RR - fL + i f )
9,(fe, fs, f,, 3,) = [(3, - 3L + if)(;, + R, - f, + if) x (a, + R R + R, - f L + if)(;, + R R - 3, + iy")] - + [(f, - f, + iy"X3, + R, - fL + i f ) x (is + RR + R, - 0, + if)(?, + RR - 3, + iye)]-l
F3(3,, a,, 3 , , a,) = [(3, - 3, + ire)(?, + R, - f, + i f )
+ [(3, - 3, + iy"X3, + R, - f, + if) x (3 , - 3, + if)(?, + R R - O, + iy")-'
x (fs - fL + if)(?, + RR - 3, + ire)] - The summation p runs over all modes of the A , , , Blg, A,, and B , representation with corresponding fre- quencies R, including also the Raman mode under con- sideration with frequency RR. In the case of the porphyrins we restrict the summation over the elec- tronic states u, e, s and t to the lowest excited e levels, i.e. the states Q, , Q , , B, and By of the molecule.
In the next step we include symmetry-lowering per- turbations by splitting the electronic Hamiltonian into
A,, = c 6:; (4) r'
where the h:,' are due to symmetry-classified pertur- bations of the environment transforming as the A,, , B,, , A,, or B,, representation. Thus 62, represents the Hamiltonian in pure D4h symmetry whereas Q,' for I" # A,, represent the corresponding symmetry lower- ing perturbations. The states le), Is), I t ) and l u ) in Eqns (2) and (3) are then the solutions of the perturbed electronic Hamiltonian.
The vibronic coupling Hamiltonian fie,, vib is written3 as
(bp+ + b , - ) (5 ) where b,' and b,- denote the creation and annihilation operators, respectively. The first part represents vibronic coupling of the Raman vibration of representation rp(Alg, B,,, A,,, B,,). The second part results from a symmetry-lowering perturbation of representation r', which distorts the molecule by a static normal distor- tion of race I" with amplitude 6Qr'(r' = B, , , B?,, A?,). Using these definitions one obtains3 the polarizability tensor as
The summarion over all modes p, however, renders the expression intractable numerically. Therefore, we restrict it to one 'helping mode.' The consequences of replacing the summation by a formal contribution of one effective mode, the frequency Reff of which will then be treated as a fitting parameter, is discussed later. In an earlier paper3 we called this effective mode second phonon. The tensors Tr are the McClain tensors related to the A,, , B,, , A,,and B,,Raman-active vibrations.
To compare our parameters C:ip with those of Zgierski" and Zgierski and Pawlikowski,' we have to express the perturbed electronic wave functions I e), I s), It) and l u ) in terms of the Gouterman unperturbed 50 : 50 states 1 Qxo) , I Q y o ) , I B X o ) and I Byo) .
The coupling matrix within this manifold is expressed"' as follows:
The matrix elements denoted by 6,. are due to one- electron interactions, whereas those denoted by 5:' are due to two-electron configurational interactions. da,, gives the splitting between the a,, and a,, one-electron HOMOS in the D4h symmetry. In protoporphyrin IX embedded in cytochrome c we assume the contributions due to 8;'g to be negligible for both the Q- and B-states. Therefore, ordinary non-degenerate perturbation theory can be employed to obtain the perturbed electronic wave functions le), Is), It ) and l u ) subject to a sym- metry lowering distortion of type r'. They are given to first order for weak electronic coupling as
+ (Ba' I ~LI' I Qyo>(Qyo I f for
194 U. BOBINGER, R. SCHWEITZER-STENNER AND W. DREYBRODT
Using Eqns (8) and (5), the matrix elements ( e I fiel, vib I s> can be expressed as
1 ( Q u I f i e ] , vib I Q p > = ( Q u o I fie], vib - L\E
I B x o > ( B x o I vib
+ C; I B y o > ( B y o I fie], vib} I Q p o >
1 ( Q p O I fie], vib -
I B x o > < B x o I vib
6:; I B y o > ( B y o I fie], vib} I Quo>
1 (9a)
( B u I fiel, vib I B f l > = <Buo I vib +
X {G I Q x o > < Q x o I fie], vib
& I Q y o > ( Q y o I f ie l , vib} I Bpo> 1
+ ( B p o I
X {K I Q x o > ( Q x o I f ie l , vib
+ K I Q y o > ( Q y o I f i e ] , vib) I Buo>
vib + L\E
(9b)
o &r' X {fiel , vibl Q x o > ( Q x I el
+ f i e ] , vib I Qyo><Qyo I K } I Bpo>
+ ( B p o I &el, vib - L\E 1
o fir, { f i e l , v ib l B x o > ( B x I el
f ie l , vib I B y o > ( B y o I E;} I Quo> (9C)
Further, fiel, vib can be written in Zgierski's'' notation as
vib = &,,, p + &r' (10) r'
The matrix elements of these operators are defined by Zgierski as KFp, t:,, and A: for &,,, and as KF,,r*, q:,,, r, and A:,,, rz for the perturged part XF'r., where r' denotes the representation of the external perturbation. Note by comparison with Eqn ( 5 ) the correspondence of the derivatives of fie, to Zgierski's parameters. Thus, e.g., we have
I t should be noted that in our notation da,, is given formally by
where 8 Q A 1 y is the distortion away from a configuration, where Ealu = EaZu, i.e. the two upper HOMOS are acci- dently degenerated.
Equations (9) show that a direct comparison as per- formed by Zgierski" between our parameter C:; and those defined in Ref. 2 is not possible. Having estab- lished a formal correspondence between our parameters and those used by Zgierski, we are now able to compare the results of these two different models.
EXPERIMENTAL
Preparation
Cytochrome c from horse heart was obtained com- mercially in a lyophilized form (Sigma) and was used without further purification. The material was dissolved in a 1 M ammonium sulphate solution. The pH was adjusted at 7.5 by dialysing against 0.1 M Bis-Tris buffer. Ferrocytochrome c was obtained by addition of small amounts of Na2S20, to ferricytochrome c in a buffer solution. The reduced form was maintained during the experiment by keeping the sample under anaerobic conditions. The concentration of the probe was determined by measuring the optical absorbance.
Experimental arrangement
The exciting radiation was obtained from an excimer pumped dye laser from Lambda Physics. The laser beam was polarized perpendicularly to the scattering plane, filtered by two pin holes (stray light suppression) and focused by a cylindrical lens on to the sample, which was situated in a copper block for cooling (ca. 6°C). The Raman radiation was measured in back- scattering geometry. A polarization analyser between the sample and entrance slit enabled us to measure the intensity of the two components perpendicular (IL) and parallel (III) to the scattering plane (DPR = ZJZI,). A polarization scrambler was used to avoid different transmissions of the spectrometer for the different polarizations. The spectrum was detected using a diode array camera from Spectroscopy Instruments. This enables one to add up a large number of spectra from the same sample in order to improve the signal-to-noise ratio even at low excitation power. The collected data were stored on a disc of an IBM-AT computer for analysis. The observed experimental data cover the region between 23 000 and 17 OOO cm- ' excitation wavenumber.
The differential cross-section of the investigated Raman lines in absolute units was found by adopting the following protocol: 1. The correct height of the Raman lines were com-
puted by a program which subtracts the fluorescence background and decomposes the comparatively complex spectra into distinct Lorentz profiles of defined width and height.16
2. The cytochrome c was dissolved in an aqueous solu- tion of 1 M (NH,),SO, and the SO:- Raman line at 980 cm-' was used as an intensity standard.
PROTOPORPHYRIN IX IN A CYTOCHROME c MATRIX 195
3. This procedure cannot be carried out in the resonant region between 19 400 and 17 800 cm-' because of a strong overlap of the SO;- line with the resonant enhanced ferrocytochrome c line at 975 cm-'.I7 Therefore, we performed parallel measurements of the respective SO;-/ferricytochrome spectrum which does not exhibit such an overlap. The thus obtained intensity of the SO:- line has to be corrected for the difference in the molar absorptivities of ferri- and fer- rocytochrome at the same concentration.16
4. The differential cross-section do/dQ of the 980 cm-' SO:- Raman line is known to be 3 x cm2 sr-' molecule-' at 413 nm excitation wa~e1ength.l~ In order to calculate the respective differential cross- sections in the wavenumber region covered by our experiments, we compared the intensities of the SO:- Raman line with the known scattering cross- sections of benzene" at different excitation wave- numbers in the pre-resonant region between the Soret and Q-bands. We obtained a constant ratio do/dQ(SO:-)/do/dR(benzene) = 0.35. Therefore, the Raman scattering tensor of SO:- is independent of the exciting frequency and only the V4 corrections must be carried out to obtain the correct respective differential cross-section. The excitation profiles E(?,) of the investigated Raman line can now be calculated in units of m2 sr-' molecule-' cm', by
where Zferro(VL) is the intensity of the Raman mode and Zso42-(?L) that of the SO;- line, both measured in arbitrary units.
RESULTS
We measured the DPD and the corresponding pol- arized EPs of the following ferrocytochrome Raman
RR = 1312cm-'(A,,)
lo' 7
10 ' 170 182 19L M b l c r n ' 4 O 3 1 7 3 0
EXCITATON WAYENUMBER
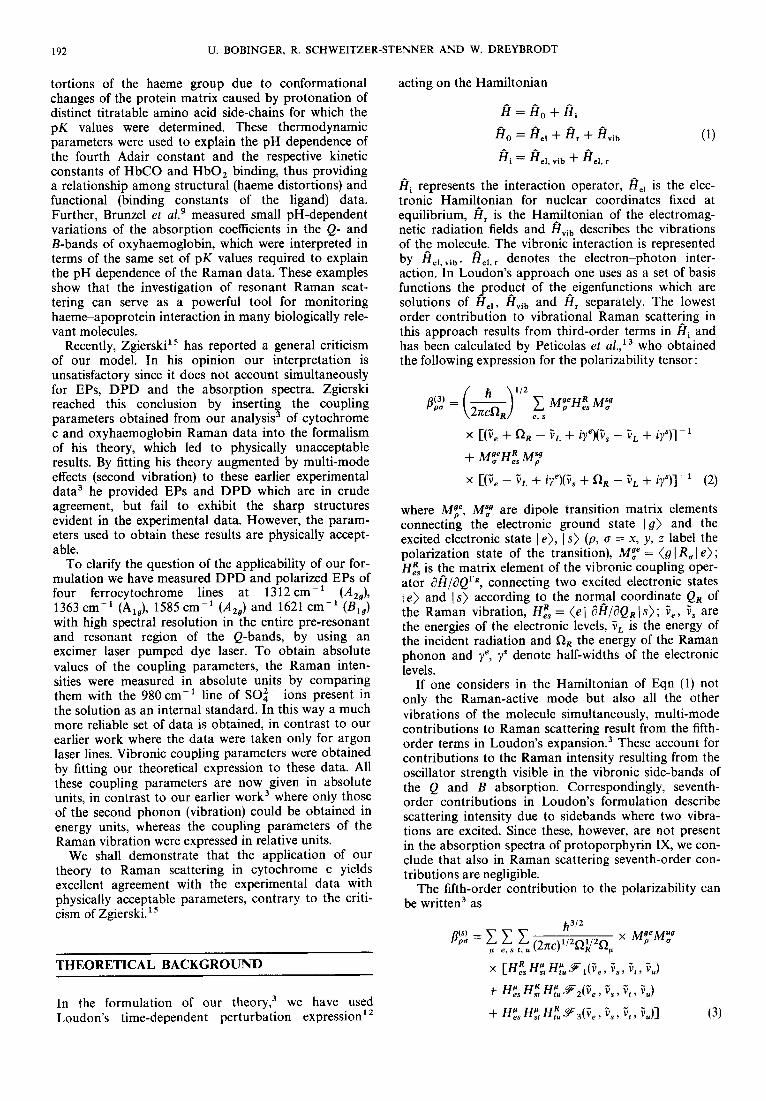
lines: 1312 cm-' (A2#), 1363 cm-' (Alg), 1584 cm-' (A,J and 1621 cm-l (Big). Figures 1-4 display the DPD and EPs of these lines. The resonance positions in the Q-band region are marked as follows: Qoo is the position of the u-band, Qol and Qlo denote the posi- tions of the resonance of the effective vibration and the Raman vibration, respectively, and Qll relates to the energy of both vibrations excited simultaneously. In order to avoid illegibility the respective averages of three adjacent data points were drawn into the figures.
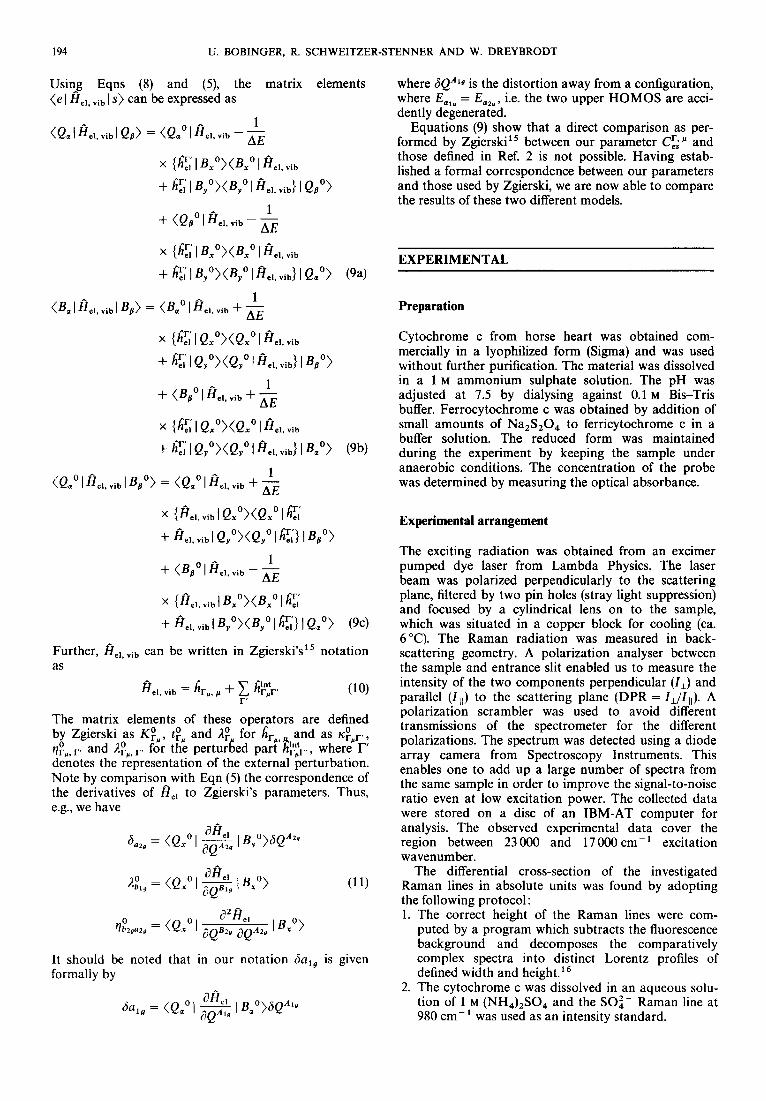
The special features of the DPD can be characterized as follows: (a) The 1363 cm-' Raman line (Al, mode in D4,
symmetry) exhibits a normal polarization in the region between the Qo and Q, band. The DPD curve shown in Fig. 1 has a broad and anti- symmetric maximum at 19000 cm-'. A further maximum exists at 20 500 cm- ', thus situated near the Q l r resonance energy. A comparatively sharp maximum, the existence of which was predicted by Schweitzer-Stenner and Dreybr~d t ,~ was observed at 19400 cm-l. These special features have been reproduced by several independent experiments.
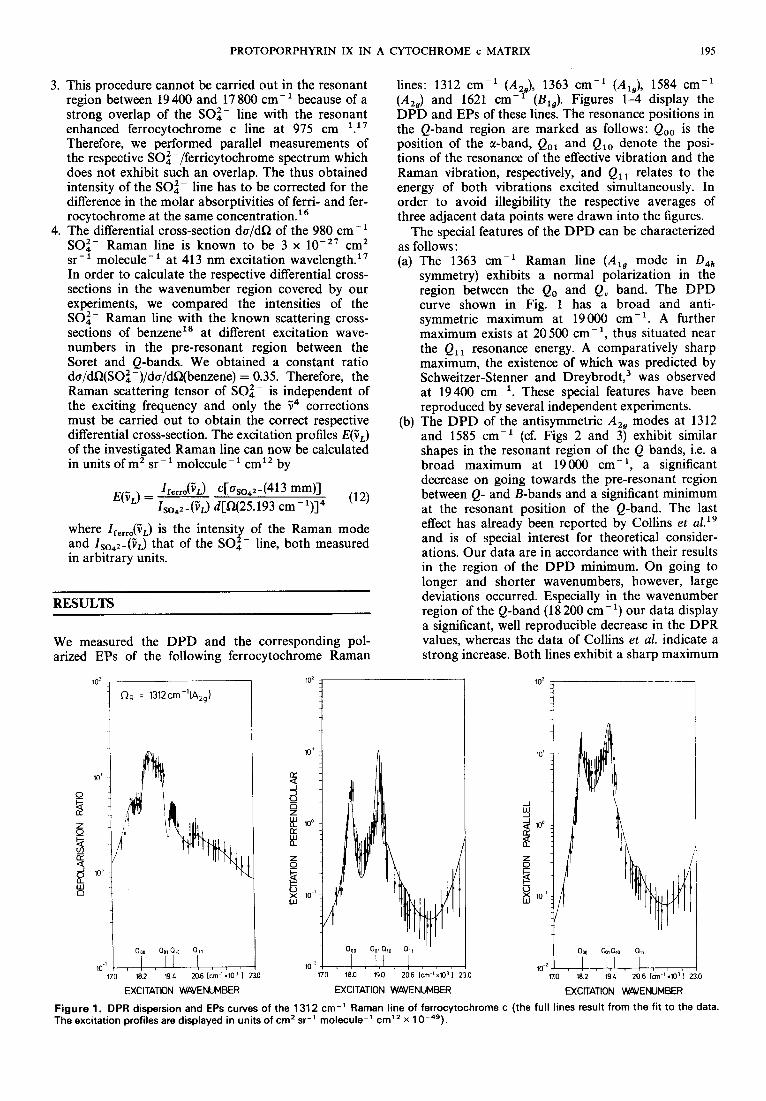
(b) The DPD of the antisymmetric A,, modes at 1312 and 1585 cm-' (cf. Figs 2 and 3) exhibit similar shapes in the resonant region of the Q bands, i.e. a broad maximum at 19000 cm-', a significant decrease on going towards the pre-resonant region between Q- and B-bands and a significant minimum at the resonant position of the Q-band. The last effect has already been reported by Collins et ~ 1 . ' ~ and is of special interest for theoretical consider- ations. Our data are in accordance with their results in the region of the DPD minimum. On going to longer and shorter wavenumbers, however, large deviations occurred. Especially in the wavenumber region of the Q-band (18 200 cm-') our data display a significant, well reproducible decrease in the DPR values, whereas the data of Collins et al. indicate a strong increase. Both lines exhibit a sharp maximum
10
%
k! 100
J 3
0 z [L w
z c-
0
a
0
x lo-' g W
10'
J
Y a 100 i? a
z Q
u z lo-'
EXCITATION WAVENUMBER EXCITATION WNENUMBER 0
Figure 1. DPR dispersion and EPs curves of the 1312 cm-' Raman line of ferrocytochrome c (the full lines result from the fit to the data. The excitation profiles are displayed in units of cmz sr-l molecule-' cm" x

196 U. BOBINGER, R. SCHWEITZER-STENNER AND W. DREYBRODT
f2, = 1363cm1(Al91
10' 1
aoo no? al0 a,, 10' , I , I , I , I , , , ,
170 182 l9L 2 O 6 I c m ' ~ 1 O J 1 ~
EXCITATION WAVENUMBER
aoa no) aia a,, L
182 191 206 Icm-'x1031 ;
EXCITATION WAVENUMBER
I
000 oar~to a!, 10' , ! , I , I , I , , , ,
170 182 191 2061cm'x1031230
EXCITATION WAMNUMBER
Figure 2. DPR dispersion and EPs curves of the 1363 cm-1 Raman line of ferrocytochrome c (the full lines result from the fit to the data. The excitation profiles are displayed in units of cm2 sr-' molecule-' cml' x 1 O-49).
nR = 1585~m-'IA,~l
lo2 r 10' 4
10 no 182 194 2 0 6 l c m - ' x K ) ' l ;
EXCITATION WAVENUMBER
I
EXCITATION M W B W 0
Figure 3. DPR dispersion and EPs curves of the 1585 cm-' Raman line of ferrocytochrome c (the full lines result from the fit to the data. The excitation profiles are displayed in units of cmZ sr-l molecule-' cml' x
between the positions of the Qol and Q,, reson- ances, similar to the result we obtained for the 1363 cm-' fundamental.
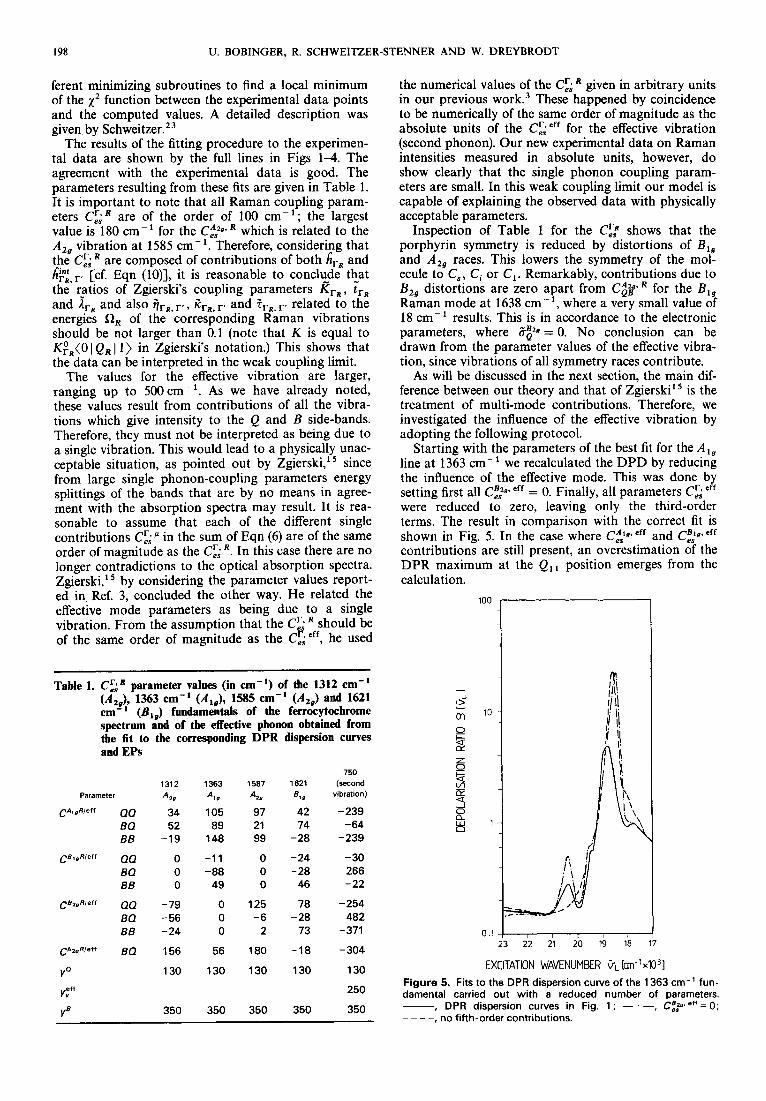
(c) The most striking features are displayed by the DPD curve of the 1621 cm-' fundamental, the mode of which transforms like B, , in ideal D,, sym- metry. It shows two minima at 18500 and 19400 cm-' and sharp maxima between these wavenum- ber positions, as shown in Fig. 4.
The excitation profiles are also displayed in Figs 1-4. They exhibit the expected features, i.e. strong maxima at the resonant positions Qoo and Qol/Qlo, respectively. Small shoulders exist in the pre-resonant region
between the Soret and QY bands displaying the Q l l res- onance position.
It should be noted that these data are in accordance with the results obtained from earlier experiments by Schweitzer-Stenner and Dreybrodt3 and Kubitscheck et al." Two deviations, however, should be noted, as follows. Reference 3 indicates that the 1585 cm-' funda- mental exhibits a DPR of nearly 100 at an excitation wavenumber of 18941 cm-'; this could not be repro- duced in our new experiment. The 1363 cm-' funda- mental shows a small but significant minimum at 20 800 cm-' in the data set in Ref. 2; even though some of our new data also indicate its existence, it cannot be estab-

PROTOPORPHYRIN IX IN A CYTOCHROME c MATRIX 197
10'
i3 5 100
4 8
v, [r
W n
lo-'
I I 10-2
170 18.2 19L 20.6 [cm~'xlO'l 2 18.2 1 9 ~ 20.6[cm-'.TI11 230
EXCITATION WAYENUMBER EXCITATION
, ay , a\: Qr , oi, , , , , 1 182 19L 206 [cm ' ~ 1 0 ' 1 230
EXCITATION WAVENUMBER
Figure 4. DPR dispersion and EPs curves of the 1621 cm-' Raman line of ferrocytochrome c (the full lines result from the fit to the data. The excitation profiles are displayed in units of cmz sr-' molecule-' crn" x
lished unambiguously. Therefore, it has been omitted from Fig. 3.
Fitting procedure and results
To fit the theoretical expressions of the Raman EPs and DPD to the experimental results we used the Raman tensor components formulated in Eqn (6).
To calculate the electronic dipole matrix elements the electronic perturbations da,, , 6bl,, 6bzg , da,, must be known. Zgierski' has estimated these values. From the ratio of the dipole matrix elements in the Q- and B-bands MQIMB = 0.16," using EQ, - E,, = 5950 cm-' one obtains da,, = 900 cm-'. From circular dichroism measurements" it is known that the Q-state of ferrocytochrome c is split by 120 cm-' with the intensity of the upper level being higher by 20%. To account for this splitting into nearly equally intense components, a diagonal B,, perturbation of , 5 2 9 = ,5pJ = - 5 5 cm-I and an off-diagonal A,, perturbation of da,, = -230 cm-' are appropriate. In accordance with Zgierski we used these values to calculate the dipole matrix elements in Eqn (6). In the energies of the electronic states, given by I,, Ie in Eqn (3), splitting of the Q and B levels was taken into account. It should be noted, however, that other sets of electronic parameters can be derived which are also consistent with the fea- tures of the optical spectrum.
The parameters C;iP, p = R, eff, were used as free parameters in a procedure to fit the EPs and the DPD simultaneously. R relates to the Raman mode and eff to the effective mode replacing the summation in Eqn (6). It should be noted that for A,, symmetry only three independent parameters exist :
C,ASl@' P = C*l@. P = CiY$ P exsx
e, s = Q, I3 (134
Correspondingly for the other representations sym- metry requires :
(13b)
( 134
(134
All other parameters are zero by symmetry.'.' Further, the half-width of the electronic states yQ, y B
were adjusted to 130 and 350 cm-' in accordance with the optical absorption spectrum. Finally, the frequency Qeff of the effective vibration was allowed to vary in the range between 700 and lo00 ax-'. One should bear in mind that the vibronic side-bands arise from coupling of different vibrations of A, , , Blg, A,, and B,, sym- metries, which in our formulation are condensed into one effective mode. In reality the matrix elements C!; eff
are composed of contributions of each of all these vibra- tions. Each of these contributions is characterized by the corresponding energy denominator with the corre- sponding frequency of the vibration contributing. When averaging to the representative Cf; eff it is therefore rea- sonable to take also an average frequency Qeff and half- width y:ff in the representative energy denominator. These two values were used as fitting constants. This averaging of all vibrations contributing to intensity in the absorption band yields effective matrix elements larger than the C;iR, which are truely due to a single Raman-active vibration. Therefore, one has to take care not to interpret the values of ,tieff as being due to one vibration, as was done by Zgier~ki.'~ Both the Crier' parameters and the half-width y:ff turned out to be identical for each fundamental in~estigated.~ This is what one would expect from Eqn 6, since the summa- tion p is identical, independent of the observed funda- mental mode.
For the computer fit a program of the CERN library called MINUITL was used,22 which contains three dif-
CBl,.P = CB19.P = -chg P
CBZs. P = CBZe. P = c:y. P
Qi Qx$ Q$X
es exsx
es exsy Y X
CAi . P = CAZ P = - c A i P
198 U. BOBINGER, R. SCHWEITZER-STENNER AND W. DREYBRODT
ferent minimizing subroutines to find a local minimum of the x2 function between the experimental data points and the computed values. A detailed description was given by S~hweitzer.,~
The results of the fitting procedure to the experimen- tal data are shown by the full lines in Figs 1-4. The agreement with the experimental data is good. The parameters resulting from these fits are given in Table 1. It is important to note that all Raman coupling param- eters C:iR are of the order of 100 cm-'; the largest value is 180 cm-' for the C,As2"vR which is related to the A,, vibration at 1585 cm- '. Therefore, considering that the C:; are composed of contributions of both LrR and pt rR,rf [cf. Eqn (lo)], it is reasonable to conclude that the r_atios of Zgierski's coupling parameters R r R , trR and A,, and also ijrR, rr, ZrR, re and ?rR, r, related to the energies QR of the corresponding Raman vibrations should be not larger than 0.1 (note that K is equal to KFR(O 1 Q R I 1) in Zgierski's notation.) This shows that the data can be interpreted in the weak coupling limit.
The values for the effective vibration are larger, ranging up to 500m-'. As we have already noted, these values result from contributions of all the vibra- tions which give intensity to the Q and B side-bands. Therefore, they must not be interpreted as being due to a single vibration. This would lead to a physically unac- ceptable situation, as pointed out by Zgierski," since from large single phonon-coupling parameters energy splittings of the bands that are by no means in agree- ment with the absorption spectra may result. It is rea- sonable to assume that each of the different single contributions Cc; in the sum of Eqn (6) are of the same order of magnitude as the Cr; '. In this case there are no longer contradictions to the optical absorption spectra. Zgierski," by considering the parameter values report- ed in Ref. 3, concluded the other way. He related the effective mode parameters as being due to a single vibration. From the assumption that the C:; should be of the same order of magnitude as the C:ieff, he used
~
Table 1. C:iR parameter values (in cm-') of the 1312 cm-' (Azg;, 1363 cm-' (Alg), 1585 cm-' (Azg) and 1621 cm- (B,J fundamentals of the ferrocytochrome spectrum and of the effective phonon obtained from the fit to the corresponding DPR dispersion curves and EPs
750 1312 1363 1587 1621 (second
4, 4 9 vibration)
CA1oRleff QQ 34 105 97 42 -239 BQ 52 89 21 74 -64 BB -19 148 99 -28 -239
~ 8 1 , R l e f f QQ 0 -11 0 -24 -30 BQ 0 -88 0 -28 266 BB 0 49 0 46 - 22
C8ZsRle f+ QQ -79 0 125 78 -254 BQ -56 0 -6 -28 482 BB -24 0 2 73 -371
CAzoflleff BQ 156 56 180 -18 -304
Parameter ,420 4 I7
V" 130 130 130 130 130
Y,eff 250
YE 350 350 350 350 350
the numerical values of the C:; given in arbitrary units in our previous work.3 These happened by coincidence to be numerically of the same order of magnitude as the absolute units of the C:ieff for the effective vibration (second phonon). Our new experimental data on Raman intensities measured in absolute units, however, do show clearly that the single phonon coupling param- eters are small. In this weak coupling limit our model is capable of explaining the observed data with physically acceptable parameters.
Inspection of Table 1 for the C:: shows that the porphyrin symmetry is reduced by distortions of B , , and A,, races. This lowers the symmetry of the mol- ecule to C , , Ci or C, . Remarkably, contributions due to B,, distortions are zero apart from C$#*" for the B, , Raman mode at 1638 cm-', where a very small value of 18 cm-' results. This is in accordance to the electronic parameters, where 8 9 = 0. No conclusion can be drawn from the parameter values of the effective vibra- tion, since vibrations of all symmetry races contribute.
As will be discussed in the next section, the main dif- ference between our theory and that of Zgierski" is the treatment of multi-mode contributions. Therefore, we investigated the influence of the effective vibration by adopting the following protocol.
Starting with the parameters of the best fit for the A,, line at 1363 cm-' we recalculated the DPD by reducing the influence of the effective mode. This was done by setting first all C:?, eff = 0. Finally, all parameters Cc; eff
were reduced to zero, leaving only the third-order terms. The result in comparison with the correct fit is shown in Fig. 5. In the case where C:;#* eff and Ct;g. eff
contributions are still present, an overestimation of the DPR maximum at the Q l l position emerges from the calculation.
'"" 1
0.1 I 23 22 21 20 19 18 7
EXCITATION WAVENUMBER 91- [CN' ~ 1 0 ~ 1 Figure 5. Fits to the DPR dispersion curve of the 1363 em-' fun- damental carried out with a reduced number of parameters. -, DPR dispersion curves in Fig. 1 ; - -, Cfpeff = 0; _ - _ _ , no fifth-order contributions.

PROTOPORPHYRIN IX IN A CYTOCHROME c MATRIX 199
If all C!; eff are omitted, a broad structure without minima and maxima is obtained. This stresses the influ- ence of the multi-mode effects. They are essential for the explanation of the sharp structures observed experimen- tally.
DISCUSSION
One aim of this work was to resolve the controversy about the applicability of the different theoretical for- mulations of Zgierski and Pawlikowski' and Zgierski" in contrast to our model in the light of a set of reliable experimental data, measured in absolute units. Figure 6 shows Zgierski's fit of DPD and polarized EPs" by using the vibration at 1314 cm-' as 'second phonon' to our earlier experimental data on the line at 1363 cm-'.3 We have now applied our fitting procedure to Zgierski's theoretical curve (dashed curve). To do so in accordance with Zgierski we considered only A,, and A,, vibronic contributions. The parameters for the electronic pertur- bation are those as in Zgierski's work. This is also the case for the electronic half-widths yQ and yB. We then allowed all the other parameters to vary freely to obtain a fit to Zgierski's theoretical curves. The results are shown as full lines in Fig. 6. As one can see, there is close agreement between the corresponding curves. Compared with the data shown by the new results in Fig. 1 no sharp structures are exhibited. This raises the suspicion that the contributions due to multi-mode effects are underestimated. This is supported by the values of the corresponding C;; eff resulting from our fit to Zgierski's theoretical data, which are low in compari- son with those obtained from our fits of Fig. 1 (cf. Table 1).
To obtain information on their contribution, we recalculated the DPD and EPs in Fig. 6 by setting all
RR = 1363cm-'(Alg)
10'
1 0 II
0 I- 6 rY
Z 0 I- Q v, 100 [r
0 a 5 #
lo-!
Ct; eff = 0 and leaving the other parameters as in Table 2(A). The result is a curve which is so close to the curve in Fig. 6 (full line) that it is indistinguishable and there- fore is not drawn. We conclude from this that Zgierski's approach underestimates the multi-mode contributions as it considers only the contribution of one arbitrarily chosen mode to the Raman intensities. In Table 2 we have also listed (B) the parameters C:iR resulting from Zgierski's parameters" by inserting these into Eqns (9). It is interesting that apart from C $ f R they are almost identical. Omission of this contribution causes only slight changes in the DPR and EPs on the low-energy side of the a-band, as illustrated by dash-dotted lines in Fig. 6. There is only some contribution of B, , type on the low-energy side of the DPD and EPs. Further, we find that the electronic half-widths from our fit to Zgierski's theoretical curves are identical with those found by Zgierski. Hence our third-order approach describes the curves obtained by Zgierski with an
Table 2. List of the C:;" parameter values (in cm-') obtained (A) from our fit to Zgierski's DPR dispersion curve and the corresponding EPs of the 1363 cm- ' Raman line and (B) from the respective parameter values of Zgierski's fit (Figs 1 and 2 in Ref. 15 by employing Eqns (9a-c)
Parameter A B
CA1.R eS QQ - 29 - 28 BQ 157 149 BB 96 91
BQ - 50 0 BB 3 3
CA2. 05 BQ 69 66
nef' 1314 1314
Cti98 00 -3 -3
0 0 o o
EXCITATION WAVENUMBER EXCITATION WAVENUMBER 170 182 19L 20.6 Icm-'r1031 2
EXCTATION WAVENUMBER 0
Figure 6. DPR dispersion curve and EPs (--x-) resulting from Zgierski's fit to the data set of the 1363 cm-' fundamental reported in Ref. 13 (open circles). Our fit to Zgierski's theoretical curve is shown by a full line for CZ#= 0. If CZ# is equal to zero one obtains some slight changes in the DPR and EPs on the low-energy side of the Q,, resonance illustrated by dashed-dotted lines.
200 U. BOBINGER, R. SCHWEITZER-STENNER AND W. DREYBRODT
almost identical set of parameters. It should be noted that this set of parameters (listed in Table 2) should not be compared with the corresponding set in Table 1, because it refers to an approach that neglects multi- mode effects and to a different data set from our earlier work.
The decisive difference between the two formulations is due to the fifth-order terms representing the 'second phonon.' Although multi-mode effects were also taken into account by Zgierski they were represented only as a single vibration. To account for all vibrations giving intensities in the vibrational side-bands, a summation over many phonons is necessary, which would render Zgierski's formulation intractable.' In our formulation these contributions are replaced with an effective vibra- tion with representative coupling parameters and fre- quency. This, however, has to be paid for by sacrificing the interpretability of the C!; eff parameters.
Siebrand and Z g i e r ~ k i ~ ~ stated that the PNSF approach to formulating the Raman tensor is valuable only if the shift in nuclear equilibrium positions in the excited electronic states is small. If this is not the case, failure of convergence at resonance can occur, although the application of the equation will lead to reproduction of the experimental data. According to Siebrand and Zgierski, this leads to fitting parameters which are not in accordance with the absorption spectrum. Especially an unphysically large value of the half-width has to be employed to substitute for the missing displacement parameter.
This is not so with our results. We obtain half-widths of the electronic states and coupling parameters which are in agreement with the optical absorption data, as far as the Raman vibration itself is concerned. There is a problem with the coupling parameters of the second phonon. These are too large if they are interpreted, as was done by Zgierski, as a contribution of a single vibration. This assumption, however, is unphysical in view of the many vibrations that contribute.
Our results confirm that the weak coupling limit applies to protoporphyrin IX embedded in the protein matrix of cytochrome c. In this case all the different approaches to describing the Raman tensor, such as the adiabatic approximation by A l b r e ~ h t ~ ~ and Tang and Albrecht,26 its non-adiabatic improvement by Mingardi and Siebrand2' and the PNSF form~lation, '~ and its improved form by Johnson et ~ l . , ~ ' converge towards each other if the conditions are met that the diagonal coupling elements for the Raman vibration are small, i.e.
and
hQR 6 E , - E , ( 14b) Inspection of Table 1 shows that condition (14a) is SUE- ciently well fulfilled. Condition (14b), however, is not met. In this case non-adiabatic contributions become important and the theory of Mingardi and Siebrand, the PNSF approach and also its improved version by Johnson et al., become equivalent if the vibration fre- quencies in the ground and in the excited states are equal. 8*2
Recently, Okamoto3' derived a formulation of the Raman tensor by using non-adiabatically expanded vib-
ronic wavefunctions in the basis set I e,) I ue) , where I e , ) represents the electronic state for the equilibrium molecular geometry and I u,) is a vibrational harmonic oscillator wavefunction in the electronic state I e). Thus, the vibronic wavefunction to first order reads
I eu> = I e ~ > I 0,)
Although formally identical with a Herzberg-Teller expansion, this represents a non-adiabatic wavefunc- tion, which is entirely different.31 Using this type of vibronic wavefunction, by insertion into the Kramers- Heisenberg-Dirac formulation of the scattering tensor, one obtains in first order a formulation analogous to the A and B terms of Albre~ht.~' The A term is exactly the same as in Albrechts fo rm~la t ion .~~ The B term is a non-adiabatic expression. It can be shown that it is equal to the corresponding expression of Johnson et d2' apart from a factor (Es, - Ee, J / (ES , - E , ,), which becomes equal to 1 if the energy difference between the levels (s, 0) and (e, 0) for the equilibrium geometry and the real vibronic states (s, j ) and (e, 0) are identical. Thus, for the conditions of weak coupling, Eqn (14a), all these non-adiabatic formu- l a t i o n ~ ' ~ , ~ ~ * ~ ~ , ~ ~ should lead to approximately equal results.
Now, in the weak coupling limit, the vibronic wave- functions, which result from Zgierski and Pawli- kowski'sl diagonalization procedure to first order become equal to the first-order expansion of Eqn (13). This implies also that in the weak coupling limit our formulation in third order and that of Zgietski become equivalent. In the strong coupling limit, however, our model breaks down, whereas Zgierski's theory is still valid. This is corroborated by Shelnutt,' who inter- preted the Raman EPs of metalloporphyrins in the weak coupling limit by applying the non-adiabatic expansion of Eqn (15) to the four-orbital model in the case of D,, symmetry. As a result of this work he stated that in the limits of this model the EPs of most of the biologically relevant porphyrin molecules can be inter- preted.
A fundamental test of the consistency of the vibronic coupling parameters resulting from our fits to the Raman data is that these parameters also must cor- rectly describe the vibronic side-bands in the absorption spectrum. Since, however, all Raman-active vibrations contribute intensity to these bands, an exact calculation would need an analysis of all Raman lines to obtain their vibronic coupling parameters. To discuss this problem we have to outline the theoretical expression for the absorption constants.
We use the familiar expression
where e represents the Q and B states and i3/ represents the vibronic product function of all Raman-active vibra- tions contributing.
Introducing the first-order expansion of Eqn (15) into this expression, Shelnutts derived an expression [Eqn
PROTOPORPHYRIN IX IN A CYTOCHROME c MATRIX 201
(12) in his paper] which we have used to calculate E.
Each vibration contributes a Lorentzian peak located at the energy of the purely electronic transition (0,O) plus the energy of the vibration.
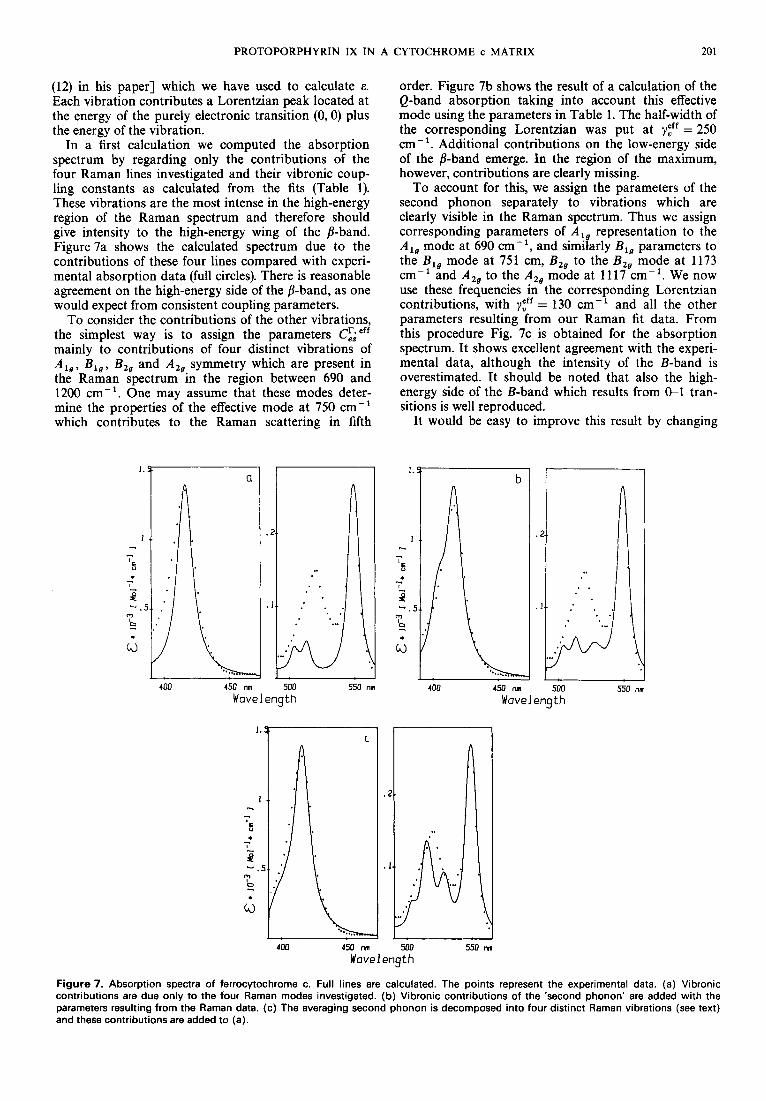
In a first calculation we computed the absorption spectrum by regarding only the contributions of the four Raman lines investigated and their vibronic coup- ling constants as calculated from the fits (Table 1). These vibrations are the most intense in the high-energy region of the Raman spectrum and therefore should give intensity to the high-energy wing of the /3-band. Figure 7a shows the calculated spectrum due to the contributions of these four lines compared with experi- mental absorption data (full circles). There is reasonable agreement on the high-energy side of the 8-band, as one would expect from consistent coupling parameters.
To consider the contributions of the other vibrations, the simplest way is to assign the parameters C!;'" mainly to contributions of four distinct vibrations of A,,, Blg, B,, and A,, symmetry which are present in the Raman spectrum in the region between 690 and 1200 cm-'. One may assume that these modes deter- mine the properties of the effective mode at 750 cm- ' which contributes to the Raman scattering in fifth
order. Figure 7b shows the result of a calculation of the Q-band absorption taking into account this effective mode using the parameters in Table 1. The half-width of the corresponding Lorentzian was put at yZff = 250 cm- '. Additional contributions on the low-energy side of the /&band emerge. In the region of the maximum, however, contributions are clearly missing.
To account for this, we assign the parameters of the second phonon separately to vibrations which are clearly visible in the Raman spectrum. Thus we assign corresponding parameters of A,, representation to the Al, mode at 690 cm-', and similarly B,, parameters to the B mode at 751 cm, B,, to the B,, mode at 1173 cm-";nd A,, to the A,, mode at 1117 cm-'. We now use these frequencies in the corresponding Lorentzian contributions, with yZff = 130 cm-' and all the other parameters resulting from our Raman fit data. From this procedure Fig. 7c is obtained for the absorption spectrum. It shows excellent agreement with the experi- mental data, although the intensity of the B-band is overestimated. It should be noted that also the high- energy side of the B-band which results from &1 tran- sitions is well reproduced.
It would be easy to improve this result by changing
400 450 nm Wavelength
I. C
b
Wavelength
400 450 MI son 550 nm
Wavelength
Figure 7. Absorption spectra of ferrocytochrome c. Full lines are calculated. The points represent the experimental data. (a) Vibronic contributions are due only to the four Raman modes investigated. (b) Vibronic contributions of the 'second phonon' are added with the parameters resulting from the Raman data. (c) The averaging second phonon is decomposed into four distinct Raman vibrations (see text) and these contributions are added to (a).

202 U. BOBINGER, R. SCHWEITZER-STENNER AND W. DREYBRODT
only a few parameters by less than 30%, which is approximately the accuracy resulting from the Raman fits.
As a result of the satisfactory agreement of the absorption spectra with those calculated from our data, we should stress that the fifth-order contributions in our Raman formulation can be well interpreted as resulting from the simultaneous action of several phonons which are condensed into one effective set of parameters. Therefore this formulation turns out to be fairly effec- tive in simulating multimode contributions.
CONCLUSION ___ ~
We have provided new experimental data for the DPD and EPs of several porphyrin Raman lines of cyto- chrome c, covering the region from 17O00 to 22500 m-' for the exciting light with a spectral resolution of up to 20 m-'. Both EPs and DPD exhibit rich struc- tures which result from multi-mode contributions of vibrations to the vibronic absorption side-bands. On the basis of our new data we have shown that these structures can be reproduced by a theoretical model, based on Loudon's'' formulation of the scattering tensor for the case of weak vibronic coupling. To account for the sharp structures a fifth-order term has to be introduced which contributes multi-mode effects, which cannot be derived from the third-order PNSF theory.
We have shown that our third-order formulation is equivalent to the theoretical model of Zgierski," which seems to underestimate the many multi-mode contribu-
tions by restricting them to a single arbitrarily chosen vibration.
Hence we are convinced that in the weak coupling limit this constitutes the essential difference between the two formulations, which should become entirely equiva- lent ..if similarly to our formulation multi-mode effects are taken into account. In the strong coupling limit our formulations break down, whereas those of Zgierski and Pawlikowski' still remain valid. The advantage of our model, valid only for weak coupling, is its formulation in analytical expressions which render it suitable for numerical fitting procedures to obtain relevant coupling parameters from the highly coded experimental data. This is of utmost importance where resonance Raman spectroscopy is used to probe the environmental effects on the porphyrin excited states in biological systems such as haeme proteins. In this case an interpretation of the coupling parameters in terms of vibronic inter- actions on the Gouterman basis is not a rationale for investigation. It is the change in the coupling param- eters C:; depending on external conditions, such as the pH of the solution or other chemical parameters, which provides information on porphyrin-protein inter- a c t i o n ~ . ~ In our opinion the formulation of the Raman tensor by our model supplies a reasonable theoretical basis for this type of examination.
Acknowledgements
We express our sincere thanks to Dr M. Z. Zgierski for his criticism of our work and for providing a copy of his paper prior to publication. We are greatly obliged to Dr W. Siebrand for valuable and enlighten- ing discussions. We also thank Mr G Ankele for technical assistance and Mrs C. Niemeyer for typing the manuscript.
REFERENCES
1. M. Z. Zgierski and M. Pawlikowski, J. Chem. Phys. 65, 335
2. M. Gouterman, J. Chem. Phys. 30. 11 39 (1 959). 3. R. Schweitzer-Stenner and W. Dreybrodt, J. Raman Spec-
4. R. Schweitzer-Stenner, D. Wedekind and W. Dreybrodt,
5. J. A. Shelnutt, J. Chem. Phys. 74, 6644 (1 981 ). 6. J. A. Shelnutt, J. Chem. Phys. 72,3948 (1 980). 7. J. A. Shelnun and D. C. O'Shea, J. Chem. Phys. 69, 3387
8. J. A. Shelnutt, L. D. Cheung, R. C. C. Chang, N. T. Yu and R.
9. U. Brunzel, W. Dreybrodt and R. Schweitzer-Stenner,
10. D. Wedekind, R. Schweitzer-Stenner and W. Dreybrodt,
11. U. Kubitschek, W. Dreybrodt and R. Schweitzer-Stenner,
12. R. Loudon, Quantum Theory of Light. Clarendon Press,
13. W. L. Peticolas, L. Nafie, P. Stein and B. Falconi, J. Chem.
14. R. Schweitzer-Stenner. D. Wedekind and W. Dreybrodt,
15. M. Z. Zgierski, J. Raman Spectrosc. 19, 23 (1 988).
(1 982).
frosc. 16, 1 1 1 (1 985).
Biophys. J. 49,1077 (1 986).
(1977).
H. Felton, J. Chem. Phys. 66, 3387 (1977).
Biophys. J. 49,1069 (1986).
Biochim. Biophys. Acfa 830,224 (1 985).
Spectrosc. Len. 19,681 (1 986).
Oxford (1 979).
Phys. 52,1576 (1 970).
Biophys. J., in press.
16. U. Bobinger, Diplorn Thesis, Bremen (1 987). 17. T. G. Spiro, in Iron Porphyrins, Part 11, edited by A. B. P. Lever
18. M. 0. Trulson and R. A. Mathies, J. Chem. Phys. 84, 2068
19. D. W. Collins, P. M. Champion and D. B. Fitchen, Chem.
20. M . C. Hsu and R. W. Woody, J. Am. Chem. SOC. 93, 3515
21. J. C. Sutherland and M. P. Klein, J. Chem. Phys. 51, 760
22. F. James and M. Roos, Comput. Phys. Commun. 10, 343
23. R. Schweitzer, Doctoral Thesis, Brernen (1 983). 24. W. Siebrand and M. 2. Zgierski, in Excited States. edited by E.
C. Stein, Vol. 4. Academic Press, New York p. 1 (1 979). 25. A. C. Albrecht, J. Chem. Phys. 34. 1476 (1960). 26. J. Tang and A. C. Albrecht, J. Chem. Phys. 49,1144 (1 968). 27. M. Mingardi and W. Siebrand, J. Chem. Phys. 62, 1074
(1975). 28. B. B. Johnson, L. A. Nafie and W. L. Peticolas, J. Chem. Phys.
19,303 (1 977). 29. M. Garozzo and F. Galluzzi, J. Chem. Phys. 64, 1720 (1978). 30. H. 0karnoto.J. Raman Spectrosc. 19,255 (1988). 31. G. Fisher, Vibronic Coupling. Academic Press, London
and H. B. Gray. Addison-Wesley p. 89 (1983).
(1 986).
Phys. Letf. 40, 416 (1976).
(1971).
(1972).
(1975).
(1 984).
Copyright © 2022 FDOKUMEN