High-resolution genetic mapping using the mouse diversity outbred population
13
MOUSE GENETIC RESOURCES High-Resolution Genetic Mapping Using the Mouse Diversity Outbred Population Karen L. Svenson,* ,1 Daniel M. Gatti,* William Valdar, † Catherine E. Welsh, ‡ Riyan Cheng, § Elissa J. Chesler,* Abraham A. Palmer,** Leonard McMillan, ‡ and Gary A. Churchill* *The Jackson Laboratory, Bar Harbor, Maine 04609, † Department of Genetics, University of North Carolina, Chapel Hill, North Carolina 27599, ‡ Department of Computer Science, University of North Carolina, Chapel Hill, North Carolina 27599, § Department of Human Genetics, University of Chicago, Chicago, Illinois 60637, and **Department of Psychiatry and Behavioral Neuroscience, University of Chicago, Chicago, Illinois 60637 ABSTRACT The JAX Diversity Outbred population is a new mouse resource derived from partially inbred Collaborative Cross strains and maintained by randomized outcrossing. As such, it segregates the same allelic variants as the Collaborative Cross but embeds these in a distinct population architecture in which each animal has a high degree of heterozygosity and carries a unique combination of alleles. Phenotypic diversity is striking and often divergent from phenotypes seen in the founder strains of the Collaborative Cross. Allele frequencies and recombination density in early generations of Diversity Outbred mice are consistent with expectations based on simulations of the mating design. We describe analytical methods for genetic mapping using this resource and demonstrate the power and high mapping resolution achieved with this population by mapping a serum cholesterol trait to a 2-Mb region on chromosome 3 containing only 11 genes. Analysis of the estimated allele effects in conjunction with complete genome sequence data of the founder strains reduced the pool of candidate polymorphisms to seven SNPs, five of which are located in an intergenic region upstream of the Foxo1 gene. G ENETICALLY defined mouse models provide a powerful experimental system for mapping and functional anal- ysis of genetic variants in the context of a complex, living organism (Peters et al. 2007). It is widely recognized that most medically important traits are genetically complex. However, experimental strategies for complex trait analyses in the mouse have not kept pace with rapid developments in human genetic studies. To advance our understanding of complex genetic traits, new strategies for using model or- ganisms are needed. The Diversity Outbred (DO) is a newly developed mouse population derived from progenitor lines of the Collabora- tive Cross (Collaborative Cross Consortium 2012). Animals from incipient CC lines at early stages of inbreeding were used to establish the DO population, which is maintained by a randomized outbreeding strategy. Thus the DO and CC populations capture the same set of natural allelic variants derived from a common set of eight founder strains. There are approximately 45 million segregating SNPs—four times the number found in classical laboratory mouse strains (Yang et al. 2011). This genetic variation is maintained in two distinct population structures. Whereas each CC inbred strain represents a fixed and reproducible genotype, each DO animal is a unique individual with one of an effectively limitless combination of the segregating alleles. The DO is an ideal resource for high-resolution genetic mapping. The CC can provide predictive validation of mapping results obtained with the DO, as well as a source of reproducible genotypes for mechanistic studies. The potential applica- tions of these resources have yet to be fully realized and their utility is likely to expand further when considered in combination with other newly developed tools for mouse genetics, such as the comprehensive knockout mouse re- source (Skarnes et al. 2011). The DO offers a number of advantages over classical approaches to mouse genetics. The DO can provide high mapping resolution that will continue to improve as out- breeding progresses. High-resolution mapping in the mouse has, until recently, proven to be impractical due to limited Copyright © 2012 by the Genetics Society of America doi: 10.1534/genetics.111.132597 Manuscript received July 11, 2011; accepted for publication October 6, 2011 Supporting information is available online at http://www.genetics.org/lookup/suppl/ doi:10.1534/genetics.111.132597/-/DC1. 1 Corresponding author: The Jackson Laboratory, 600 Main St., Bar Harbor, ME 04609. E-mail: [email protected] Genetics, Vol. 190, 437–447 February 2012 437
-
Upload
independent -
Category
Documents
-
view
0 -
download
0
Transcript of High-resolution genetic mapping using the mouse diversity outbred population

MOUSE GENETIC RESOURCES
High-Resolution Genetic Mapping Using the MouseDiversity Outbred Population
Karen L. Svenson,*,1 Daniel M. Gatti,* William Valdar,† Catherine E. Welsh,‡ Riyan Cheng,§
Elissa J. Chesler,* Abraham A. Palmer,** Leonard McMillan,‡ and Gary A. Churchill**The Jackson Laboratory, Bar Harbor, Maine 04609, †Department of Genetics, University of North Carolina, Chapel Hill, North
Carolina 27599, ‡Department of Computer Science, University of North Carolina, Chapel Hill, North Carolina 27599,§Department of Human Genetics, University of Chicago, Chicago, Illinois 60637, and **Department of Psychiatry
and Behavioral Neuroscience, University of Chicago, Chicago, Illinois 60637
ABSTRACT The JAX Diversity Outbred population is a new mouse resource derived from partially inbred Collaborative Cross strainsand maintained by randomized outcrossing. As such, it segregates the same allelic variants as the Collaborative Cross but embedsthese in a distinct population architecture in which each animal has a high degree of heterozygosity and carries a unique combinationof alleles. Phenotypic diversity is striking and often divergent from phenotypes seen in the founder strains of the Collaborative Cross.Allele frequencies and recombination density in early generations of Diversity Outbred mice are consistent with expectations based onsimulations of the mating design. We describe analytical methods for genetic mapping using this resource and demonstrate the powerand high mapping resolution achieved with this population by mapping a serum cholesterol trait to a 2-Mb region on chromosome 3containing only 11 genes. Analysis of the estimated allele effects in conjunction with complete genome sequence data of the founderstrains reduced the pool of candidate polymorphisms to seven SNPs, five of which are located in an intergenic region upstream of theFoxo1 gene.
GENETICALLY defined mouse models provide a powerfulexperimental system for mapping and functional anal-
ysis of genetic variants in the context of a complex, livingorganism (Peters et al. 2007). It is widely recognized thatmost medically important traits are genetically complex.However, experimental strategies for complex trait analysesin the mouse have not kept pace with rapid developments inhuman genetic studies. To advance our understanding ofcomplex genetic traits, new strategies for using model or-ganisms are needed.
The Diversity Outbred (DO) is a newly developed mousepopulation derived from progenitor lines of the Collabora-tive Cross (Collaborative Cross Consortium 2012). Animalsfrom incipient CC lines at early stages of inbreeding wereused to establish the DO population, which is maintained bya randomized outbreeding strategy. Thus the DO and CC
populations capture the same set of natural allelic variantsderived from a common set of eight founder strains. Thereare approximately 45 million segregating SNPs—four timesthe number found in classical laboratory mouse strains(Yang et al. 2011). This genetic variation is maintained intwo distinct population structures. Whereas each CC inbredstrain represents a fixed and reproducible genotype, eachDO animal is a unique individual with one of an effectivelylimitless combination of the segregating alleles. The DO isan ideal resource for high-resolution genetic mapping. TheCC can provide predictive validation of mapping resultsobtained with the DO, as well as a source of reproduciblegenotypes for mechanistic studies. The potential applica-tions of these resources have yet to be fully realized andtheir utility is likely to expand further when considered incombination with other newly developed tools for mousegenetics, such as the comprehensive knockout mouse re-source (Skarnes et al. 2011).
The DO offers a number of advantages over classicalapproaches to mouse genetics. The DO can provide highmapping resolution that will continue to improve as out-breeding progresses. High-resolution mapping in the mousehas, until recently, proven to be impractical due to limited
Copyright © 2012 by the Genetics Society of Americadoi: 10.1534/genetics.111.132597Manuscript received July 11, 2011; accepted for publication October 6, 2011Supporting information is available online at http://www.genetics.org/lookup/suppl/doi:10.1534/genetics.111.132597/-/DC1.1Corresponding author: The Jackson Laboratory, 600 Main St., Bar Harbor, ME 04609.E-mail: [email protected]
Genetics, Vol. 190, 437–447 February 2012 437

density of markers and the high cost of genotyping.However, the situation has changed with the developmentof high-density, low-cost genotyping platforms (Yang et al.2009; Collaborative Cross Consortium 2012). DO mice areoutbred. Complete inbreeding is an unusual genetic state fora mammal that does not accurately reflect the human ge-netic makeup. Inbred animals lack the natural bufferingeffects of heterozygosity, are prone to both early and late-life recessive allelic effects, and are noticeably less vigorousthan their outbred counterparts. The genetic diversity of theDO is derived from naturally occurring allelic variants, un-like transgenic mouse models, which often represent ex-treme perturbations such as complete loss of function ofa targeted gene. Recent studies of human diseases suggestthat subtle variations, such as those affecting patterns ofgene expression or conservative changes in polypeptides,are major contributors to phenotypic diversity (Strangeret al. 2011). Genetic variation in the DO is uniformly dis-tributed with multiple allelic variants in the coding or reg-ulatory regions of essentially all known genes. This is incontrast to classical inbred strains of mice, which have lim-ited genetic diversity and large blind spots that are effec-tively devoid of variation (Yang et al. 2011). Thus, the DOprovides an opportunity to study medically relevant traits ina powerful model system that more closely reflects the ge-netic mechanisms of human disease.
In this article we describe the breeding design of the DOand compare its properties to simulations. We describephenotypic diversity in the DO and use genome-wide SNPdata to examine allele frequencies and the distribution ofrecombination events. We describe analytical approaches formapping complex trait loci in the DO and demonstrate thathigh-resolution mapping can be achieved with moderatenumbers of DO mice.
Materials and Methods
Breeding strategy
The founders of the DO were obtained in late 2008 throughearly 2009 from breeding lines of the Collaborative Cross atOak Ridge National Laboratory (Chesler et al. 2008). The144 partially inbred CC lines that contributed to the DOwere at generations ranging from F4 to F12 of inbreeding(Figure 1). This strategy allowed us to capture recombina-tion events that occurred in the early generations of CCbreeding to effectively jump-start recombination density inthe DO population. The first randomized outcrosses werecarried out in a quarantine facility at The Jackson Labora-tory (JAX). From these matings, four to six female and oneto two male progeny, depending on availability, were trans-ferred to the JAX importation facility for gamete harvest,in vitro fertilization (IVF), and embryo transfer. Progenyfrom IVF were brought across the specific pathogen-free(SPF) barrier into a production facility. The progeny of theIVF matings were designated as DO generation G1. Due tothe bottleneck involved in the in vitro step, the production
colony was initialized in three waves of 84, 55, and 28matings each to achieve 167 breeding pairs. Each matingpair contributes one female pup and one male pup, selectedat random from the first litter, to establish the next genera-tion. The colony was expanded slightly and is now beingmaintained as a panel of 175 breeding pairs with three tofour synchronized generations per year. This breedingstrategy minimizes the effects of both drift and positive se-lection. Mating pairs that will produce the next generationare determined by randomization, with avoidance of sibmating. If a mating produces no offspring or produces off-spring of only one sex, an alternative animal is selected atrandom from the available population.
Animals and phenotyping
A pilot study was conducted using 150 early generation DOanimals. Fourth (G4; n ¼ 100; 50 females, 50 males)- andfifth (G5; n ¼ 50; 25 females, 25 males)-generation DO ani-mals were obtained from The Jackson Laboratory (Bar Harbor,ME). Animals were received at wean age (3 weeks old) anddistributed into cages at a density of five same-sex animals percage. Animals were housed in pressurized, individually venti-lated cages (Thoren Caging Systems, Hazelton, PA) with pinebedding (Crobb Box, Ellsworth, ME) and had free access tostandard rodent chow containing 6% fat by weight (LabDiet5K52, LabDiet, Scott Distributing, Hudson, NH) and acidifiedwater. Mice were subject to a 12 hr:12 hr light:dark cyclebeginning at 06:00. Some DO mice (n ¼ 50 G4; 25 females,25 males) were fed a high-fat (HF) diet containing 22% fat byweight (TD.08811, Harlan Laboratories, Madison, WI) fromwean age throughout the the study. All animal procedureswere approved by the Animal Care and Use Committee atThe Jackson Laboratory.
Blood was obtained from the retro-orbital sinus afteradministration of a topical anesthetic (tetracaine HCl) usinga heparin-coated microcapillary tube and collected intoa 1.5-ml eppendorf tube. To measure plasma components,approximately 150ml whole blood was collected into a tubecontaining 2ml of 10% sodium heparin, and plasma was sep-arated by centrifugation at 10,000 rpm for 10 min at 4� and
Figure 1 Distribution of inbreeding generation number among the 144partially inbred CC founder lines that contributed to the DO.
438 K. L. Svenson et al.

removed into a clean eppendorf tube. Plasma components(total cholesterol, HDL cholesterol, glucose, triglycerides)were measured using the Beckman Synchron DXC600ProClinical chemistry analyzer. For whole-blood analysis approx-imately 200 ml blood was collected into a tube containing2 ml of 10% sodium EDTA. Hematological parameters weremeasured using the Siemens Advia 2120 haematology ana-lyzer. Blood was collected in the morning; blood for plasmachemistry analysis was drawn after food was removed fora 4-hr period beginning at 07:00. Blood collections were sep-arated by a period of 2 weeks to allow animals to fully recoverblood volume and components. Plasma measurements werefrom animals at 8 weeks and 19 weeks of age and wholeblood was analyzed from 10-week-old mice.
Body composition was assessed when mice were 12 weeksof age by dual energy X-ray absorptiometry (DEXA) using aLunar PIXImus densitometer (GE Medical Systems) after micewere anesthetized intraperitoneally with tribromoethanol(0.2 ml 2% solution/10 g body weight). The skull is omittedfrom the DEXA analysis because it is so bone dense. Micewere weighed on an Ohaus Navigator scale with InCalcalibration to accommodate animal movement.
Analysis of phenotype data
Phenotypes observed in the DO were compared to similarphenotypes measured among inbred strains. Data for inbredstrains was obtained from the Mouse Phenome Database(MPD) using project data sets titled Naggert1 (Naggertet al. 2003), Peters1 (Peters and Barker 2001), and Paigen2(Paigen et al. 2002). In these studies, baseline measurementswere obtained from the inbred strains while they consumedstandard chow, prior to being fed a HF diet. Because the HFdiet fed to the inbred strains in the MPD projects differs incomposition from that fed to the DO in this study, only meas-urements obtained from inbred mice on the chow diet werecompared. Mice in the MPD projects were fed the identicalstandard chow as were the DO. Additionally, comparisongroups are age matched.
Simulations of the DO breeding design
We used simulation to investigate the expected geneticcomposition of the DO population. For comparison weperformed analogous simulations of CC and F2 breedingdesigns. Statistics were collected on 360 simulated trials perdesign. We simulated the autosomal mouse genome on thebasis of the parameter of the standard mouse genetic map(Cox et al. 2009). Founders contributed distinct alleles ateach (octa-allelic) marker such that descent in nonfoundergenerations was implied by genotypic state. Recombinationwas simulated as a continuous Poisson process following theHaldane model (Lynch and Walsh 1997). We simulated par-tially inbred CC mice following the funnel breeding design(Churchill et al. 2004) with randomized order of eightfounders. Each simulated CC population was composed of150 distinct CC funnels. We generated simulated DO mice intwo steps starting from 150 sister–brother pairs of partially
inbred CC lines at generation G2F6, i.e., with five genera-tions of inbreeding. We then simulated rounds of mating inwhich mates were paired at random with the constraint thatsib-matings are prohibited. The number of offspring per pairwas constant at two. Intercross (F2) animals were simulatedas in, for example, Valdar et al. (2006), also with a popula-tion size of 150.
Genotyping
DNA was prepared by standard methods from tail biopsiesand genotyping was outsourced to GeneSeek (http://www.neogen.com/GeneSeek) for analysis using a Mouse Univer-sal Genotyping Array (MUGA), a 7851 SNP array built onthe Illumina Infinium platform. Markers on the MUGA aredistributed genome-wide with an average spacing of 325 kband standard deviation of 191 kb. The markers were se-lected such that they could uniquely identify any of the CCfounders within a window of four to five SNPs. This givesthe MUGA an average effective sampling sensitivity of justover 1 Mb. Thus, recombination segments smaller than 1 Mbmay go undetected. After accounting for animals that didnot complete the study and eliminating failed genotypes,a total of 141 genotypes were used for mapping and haplo-type reconstruction.
Haplotype reconstruction
Haplotype reconstruction was based on Illumina’s normal-ized MUGA intensity values rather than genotype calls. Thisis predicated from our observation that the allele clustersseen in a genotyping probe set can often be further subclus-tered according to the eight founders and the 28 possibleF1s. This transforms the standard 3-state genotyping classi-fication problem to one with 36 states for our population.The distributions of each genotype state at each markerwere estimated using a combination of biological and tech-nical replicates of each of the CC founders and F1s. Thesedistributions are used as reference templates. We estimatethe likelihood that a sample matches a particular templateas a function of its 2D distance from each of the template’smodel. These probabilities were combined with a transitionprobability between genomically adjacent markers usinga hidden Markov model (HMM). The transition probabilityparameters were selected so that evidence from approxi-mately four sequential markers is necessary to change founderstate. Moreover, the transition penalty varies depending onwhether the current state and next state share a commonfounder or not. A dynamic programming algorithm was thenutilized to calculate the maximum-likelihood founder assign-ment for each chromosome.
QTL mapping analysis
The genotyping HMM produced a matrix of 36 genotypestate probabilities for each sample at each SNP. This matrixwas condensed to produce an eight-founder state probabilitymatrix by summing the probabilities contributed by eachfounder at each SNP. The eight-founder probabilities were
Diversity Outbred Population 439

used to fit a linear model, with sex and diet as additivecovariates and variance components that account for geneticrelatedness using QTLRel (http://www.palmerlab.org/software)(Cheng et al. 2011). Each phenotype was analyzed in thismanner following a rank z-score transformation. The modelwas
yi 5 sibs 1 dibd 1X7
j51
gijbj1 gi 1 e;
where yi is the phenotype value for animal i, bs is the effectof sex, si is the sex of animal i, bd is the effect of diet, di is thediet for animal i, bj is the effect of founder allele j, gij is thefounder probability for founder j in animal i, and gi is a ran-dom effect representing the polygenic influence of animal i.
The mapping statistic was the log of the odds ratio (LOD)from the linear model. Significance thresholds were deter-mined by performing 100 permutations and fitting an extremevalue distribution to the maximum LOD values (Dudbridgeand Koeleman 2004). When this procedure indicated a signif-icant result, we performed 1000 permutations using the aboveequation but without accounting for relatedness (Cheng et al.2011).
Availability
The JAX:DO are available from The Jackson Laboratory (BarHarbor, ME), as JAXMice stock number 009376. Siblinginformation at each generation is tracked and made avail-able upon request. All data described in this report are availableat http://cgd.jax.org/datasets/phenotype/SvensonDO.shtml.Please cite this article in any use of these data.
Results
Phenotypes
Plasma components (total cholesterol, HDL cholesterol, glu-cose, triglycerides) and body composition parameters (weight,percentage body fat) were measured for 100 DO mice fromoutcross generations G4 (n ¼ 50; 25 females, 25 males) andG5 (n ¼ 50; 25 females, 25 males) fed a standard chow diet(Table 1). Two measurements of body composition weremade during the study: the first was made at 12 weeks ofage and the second at 21 weeks of age. While females andmales gained an average of 3.5 and 4.8 g, respectively, duringthe 9-week period between body composition measurements,data for both sexes reveals that some mice lost weight andsome mice lost body fat, as reflected in minimum values forweight change and percentage body fat change, respectively.However, changes in weight were usually not associated withchanges in body fat. Among females, only one animal lostweight (loss of 2.0 g) but gained 2.2% body fat (data notshown). All other females gained from 0.5 to 11.6 g of weightand showed wide variation (20.6–9.8%) in the proportion ofbody fat gained (or lost) over the 9-week period betweenmeasurements (data not shown). Among males, only one an-
imal lost weight, and this was accompanied by a loss in bodyfat. All other males gained weight, but 16/44 males lost bodyfat (loss of 0.1–7.9%) in the 9-week period (data not shown).Hematologic parameters were also measured for the same 100mice (Table 2). Among females there is a 1.2- to 5.1-folddifference in minimum and maximum values for each trait,and among males there is 1.5- to 14.7-fold variation in min-imum and maximum values for each trait. The wide range ofphenotype values in this relatively small sample of animalsillustrates the extent of phenotypic diversity in the DOpopulation.
Observation of early DO generations has revealed di-versity in social behavior, use of bedding materials, and foodhandling. Home-cage behavior ranges from docile to highlyaggressive. While both females and males show wildnessbehaviors and must be carefully handled to maintain con-tainment in home cages, severe aggression with fighting wasobserved in only a few males. Of 75 males phenotyped,initially housed in pens of five animals each, one male fromeach of six pens was separated and housed individually dueto aggressive behavior toward pen mates. Animals showdiversity in use of bedding and compressed paper-enrichmentmaterials, with some animals seemingly uninterested in thematerial and others shredding it and hiding under it. Someanimals grind pelleted food from hoppers and pile it ina clean corner of the cage.
Coat colors in the DO are largely variations of agouti,with black and white appearing at expected proportions onthe basis of the alleles of the CC founder strains. (A/J andNOD/ShiLtJ are albino. C57BL/6J and A/J both carry therecessive black allele at the agouti locus, but it is masked byalbino in A/J.) The characteristic white forehead spotoriginating from CC founder strain WSB/EiJ is seen on the
Table 1 Plasma lipids, glucose, and body composition in fourth-and fifth-generation DO mice fed standard chow
Females Males
Phenotype Mean 6 SE Min Max Mean 6 SE Min Max
CHOL (mg/dl) 77 6 3 43 119 103 6 3 62 163HDL (mg/dl) 60 6 2 32 97 78 6 2 51 124TG (mg/dl) 112 6 6 35 219 167 6 10 64 415GLU (mg/dl) 160 6 4 74 248 193 6 4 125 279WT 1 (g) 24.2 6 0.5 18.5 36.8 31.8 6 0.7 22.1 45.2WT 2 (g) 27.8 6 0.7 19.1 42.6 36.4 6 0.8 25.7 53.4Change in WT (g) 3.5 6 0.4 22 11.6 4.8 6 0.5 23.3 13% Fat 1 21.8 6 0.6 15.1 31.1 19.5 6 0.6 11.7 29.3% Fat 2 24.0 6 0.8 14 37.7 20.9 6 0.8 13.3 31.8Change in % Fat 2.1 6 0.5 24.6 9.8 1.2 6 0.7 27.9 10.3
Values shown are means 6 SE. Min, minimum value within a group for trait mea-sured; Max, maximum value within a group for trait measured. CHOL, total plasmacholesterol; HDL, high-density lipoprotein cholesterol; TG, triglycerides; GLU, glu-cose. CHOL, HDL, TG, and GLU were obtained after food was removed from micefor 4 hr in the morning. WT 1, % Fat 1, body weight and % body fat at age 12weeks; WT 2, % Fat 2, body weight and % fat at age 21 weeks. % Fat wasobtained by dual-energy X-ray absorptiometry. Changes in weight and % fat werederived by subtracting value 1 from value 2 and are expressed as grams (g) and %,respectively. n ¼ 50 females and 50 males for all measurements except WT 2, % Fat2, change in WT and change in %Fat, for which n ¼ 48 females and 44 males.
440 K. L. Svenson et al.

various agouti shades as well as on black fur. Skeletaldysmorphology is occasionally seen in the DO, notablya hunched back suggesting spinal aberration, and rarelyDO mice show limb abnormalities, including completeabsence of one limb.
Breeding in the DO is robust, suggesting little or nooutcrossing depression in this population, a phenomenonthat would be expected if allele incompatibilities werecausing a decrease in fitness (Lynch and Walsh 1997). Thereis a small sex ratio bias toward the production of male prog-eny. At generation G4 of outcrossing, first litters averaged7.5 pups/litter, producing 48% females and 52% males.Second G4 litters produced an average of 9 pups each, pro-ducing 47% females and 53% males. At generation G5 ofoutcrossing, first litters averaged 7.0 pups/litter, producing47% females and 53% males. Second G5 litters averaged8.0 pups/litter, producing 46% females and 54% males.
Comparison to phenome panels
We examined how phenotypic variation among the rela-tively small number of DO mice presented in this reportcompared to that among the eight founder strains of the CCfor similar phenotypic measurements (Figure 2). Inbredstrain data were downloaded from the Mouse Phenome Da-tabase (http://www.jax.org/phenome) and includes meas-urements from 10 to 20 animals per sex per strain,comprising 215 individual animals. Only 100 of the 150DO animals that we phenotyped were used in this analysisbecause they were fed the same standard chow diet as theinbred strains at the time of data collection. For most traitsanalyzed, average trait values are similar between DO andfounders.
Maintenance of allelic diversity
The mating strategy used to produce the DO is key tomaintaining genetic diversity in a small population. Allowingonly two offspring to be contributed by each mating pair tothe next generation doubles the effective population size. Theexpected time to loss (or fixation) of a private allele (initialfrequency 1/8) is 898 generations in the DO compared to 448for random mating. The median time to fixation approx-imates the point at which we expect 50% of private alleles tobe lost (or fixed). We estimated this to be 469 and 238generations in the DO and random mating populations,
respectively. These generational times far exceed the practicallifetime of a mouse colony. However, over the first 100generations allelic loss is expected at 5% of loci in the DOcompared to 22% in a random mating population of the samesize. In both mating schemes allelic loss is minimal in the first20 generations, but by 30 generations the random populationwill have lost 1% of private alleles. The DO reaches 1% loss at60 generations, at which time the random population isexpected to have lost 10% of private alleles. At smallerpopulation sizes these differences are shifted proportionatelytoward earlier generation times. Considering that a numberof outbred colonies have been maintained for more than 60generations, with small and fluctuating population sizes, lossor fixation of alleles present in the founders is expected tooccur at a substantial proportion of loci. The large andconstant number of mating pairs used to maintain the DOpopulation is critical to avoiding allelic loss and inbreeding.
Genotypes
We obtained genotypes at 7851 SNPs for 141 DO animalsfrom outbreeding generations G4 (n ¼ 94) and G5 (n ¼ 47)using the MUGA platform. On average there are 30.3 SNPsbetween any pair of adjacent recombination events in theG4 and 28.9 SNPs in the G5 (Table 3). The observed dis-tance between recombination events is 5.9 cM in G4 and5.6 cM in G5 (Table 3), which is consistent with simulatedresults of 5.5 cM in G4 and 5.0 cM in G5 (Table 4). Evenat early generations, this recombination spacing exceedsthe average simulated spacing in F2 (22.6 cM) and CC(10.3 cM) breeding designs. The distance between recombi-nations is expected to decrease further to 3.5 cM in G10,providing even greater mapping resolution (Table 4).
The number of informative recombination events per DOsample is expected to increase linearly by approximately28 per generation. We observed an increase in averageevents per animal from 223.8 in G4 to 235 in G5 (Table 3).This is somewhat lower than the number of recombinationsper sample found by simulation (234.5 in G4, 258.5 in G5,Table 4, Figure 3). The distribution of distances betweenrecombination events shows an approximate exponentialdistribution with many small segments, a few large segments,and a coefficient of variation near 1 (Figure 4B and Table 3).However, segments of less than 1 Mb appear to be underrep-resented. The average distance between SNPs on the MUGA is
Table 2 Hematological parameters in fourth- and fifth-generation DO mice fed standard chow
Females Males
Phenotype Mean 6 SE Min Max Mean 6 SE Min Max
WBC (·103/ml) 9.1 6 0.4 3.5 17.6 9.1 6 0.4 5.2 18.1RBC (·103/ml) 11.2 6 0.09 9.4 12.4 10.7 6 0.12 8 12.1HCT (%) 54.5 6 0.3 47.9 58.8 53 6 0.6 39.8 60.2PLT (·103/ml) 1264 6 43 677 2042 1441 6 32 925 1867LYM (%) 82.5 6 0.8 65.2 90.7 75.1 6 1.3 48.2 87.9No. Retic (109 cells/liter) 2.73 6 0.11 0.98 5.01 3.25 6 0.22 0.65 9.55
Values shown are averages 6 SE. Min, minimum value within a group for trait measured; Max, maximum value within a group for trait measured. WBC, white blood cells;RBC, red blood cells; HCT, hematocrit; PLT, platelets; LYM, lymphocytes; Retic, reticulocytes. n ¼ 50 females and 50 males.
Diversity Outbred Population 441

325 Kb, and the HMM requires several informative SNPs todetect a change of genotype state. Therefore, segments of lessthan 1 Mb are near the detection limit of the array and arelikely to be present in the population but remain undetected.This explains the decrease in number of recombinations persample from the simulations, which count all recombinations,and the observed data, which undercounts closely located re-combination events. In future studies of the DO, which willnecessarily employ later generations, a higher density geno-typing platform may be required.
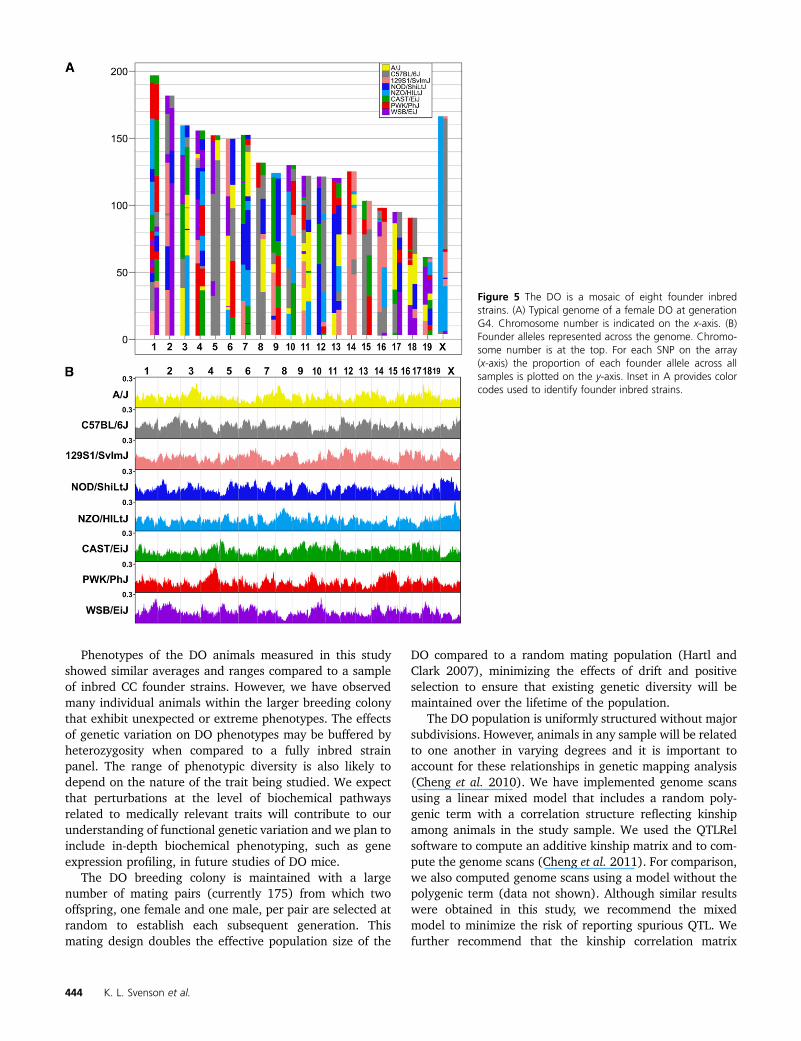
The typical DO genome at generation G4 is a mosaic ofthe eight founders of the CC and all eight founder alleles arerepresented across the entire genome (Figure 5A). The av-erage heterozygosity, based on founder haplotypes, is about90%, slightly higher in this sample than the expected 87.5%.Heterozygosity at the level of MUGA SNPs is about 40%(Table 3). Overall, the contribution from each of the founderstrains ranged from 11.3 to 13.8%. The proportion of eachfounder allele varies somewhat across the genome (Figure5B). Some of this variation is expected by chance, due to thesmall sample of genotyped animals, but some of the devia-tions are consistent with those seen in the CC population(Collaborative Cross Consortium 2012). These include anexcess of WSB alleles on chromosome (chr) 2, an excess of
PWK alleles on chr 4, a deficit of WSB alleles on chr 5, anda deficit of CAST alleles on chr X. In the future, with largersamples spanning multiple generations, it should be possibleto confirm these deviations and observe trends in allele fre-quencies over time.
Mapping
We performed QTL analysis by pooling the available animalsacross sexes and two dietary conditions. Sex, diet, anda random polygenic effect were included as covariates in theQTL analysis. We generated 113 phenotypes, some of whichwere calculated change between values measured at twotime points in the phenotyping protocol. The number ofanimals with complete information varied across traits from87 to 141. We identified significant QTL (genome-wideadjusted P , 0.05) for 11 traits, including 7 for hematolog-ical parameters, 2 for body composition, 1 for cardiac func-tion, and 1 for plasma chemistries. These results representan interim analysis of an ongoing study with a target samplesize of 600 DO animals.
As a proof of principle, we mapped two coat color traits,albino and black. We coded each as binary traits and analyzedusing linear regression as described above. We did not useany prior knowledge about their mode of inheritance. The
Figure 2 Comparisons of like phenotypes in CC founderinbred strains and 100 DO mice. Plasma parameters are(A) glucose and (B) HDL cholesterol, measured after a 4-hrperiod of food removal. Whole blood parameters are (C)white blood cells (WBC) and (D) lymphocytes. Lympho-cytes are presented as percentage of total number of leu-kocytes. Data are separated by sex for each group(F, female; M, male). DO, Diversity Outbred (n ¼ 100;50 female, 50 male). IS, Inbred Strain founders of theCollaborative Cross (n ¼ 215) collective inbred strain indi-viduals: 109 females, 106 males. All mice consumed thesame chow diet and are age matched.
Table 3 Statistical analysis of autosomal haplotype reconstructions for 141 DO samples
G4 (n ¼ 94) G5 (n ¼ 47)
Mean Median SD Mean Median SD
% homozygosity (identity by state) 60.5 60.2 1.6 61.1 60.9 1.6% heterozygosity (identity by state) 39.5 39.8 1.6 38.9 39.1 1.6% homozygosity (identity by founder) 9.3 9.2 1.8 10.2 10.2 2.1% heterozygosity (identity by founder) 90.7 90.8 1.8 89.8 89.8 2.1Deviation of founder balance (%) 2.3 1.9 1.7 2.4 2.0 1.8Proportion of each state (%) 2.8 2.6 1.7 2.8 2.5 1.8Recombinations per sample 223.8 223.0 14.5 235.0 234.5 19.5Distance between recomb. (Mb) 9.9 6.6 10.2 9.5 6.4 9.7Distance between recomb. (cM) 5.9 4.1 5.7 5.6 4.0 5.4SNPs between recomb. 30.3 20.0 31.2 28.9 19.0 29.7
Samples have been divided into generations 4 and 5. Rows to be compared with the simulation results in Table 4 are set in bolded italics.
442 K. L. Svenson et al.

albino trait is caused by a recessive allele in tyrosinase (Tyr)on mouse chr 7 (Russell and Russell 1948). We mapped al-bino to chr 7: 88–96 Mb (P, 0.001; Supporting Information,Figure S1A). Tyr lies at 94.6 Mb and falls within a two-LODsupport interval. As expected, the effect plot (Figure S1B)shows that the two albino founders, A/J and NOD/ShiLtJ,have positive coefficients. The black trait is caused by a re-cessive allele in the nonagouti (a) gene on chr 2 (Markert andSilvers 1956). It mapped it to chr2: 152–160 Mb (P , 0.001;Figure S1D). The a gene lies at 154.7 Mb and falls within thetwo-LOD support interval. The effect plot (Figure S1E) showsthat A/J and C57BL/6J both have positive coefficients. Al-though A/J is an albino mouse, if it did not carry the Tyrc
mutation, it would be a black mouse. It is known that albinois epistatic to black and that both traits are recessive (Silvers1979). The correct model to jointly map these loci shouldinclude dominance effects and allow for epistatic interactions.However, even though we fit a linear model without interac-tions between loci and only �10% of the mice exhibited eachcoat color trait, we were able to map both traits to the correctchromosomal location at high levels of statistical significance.
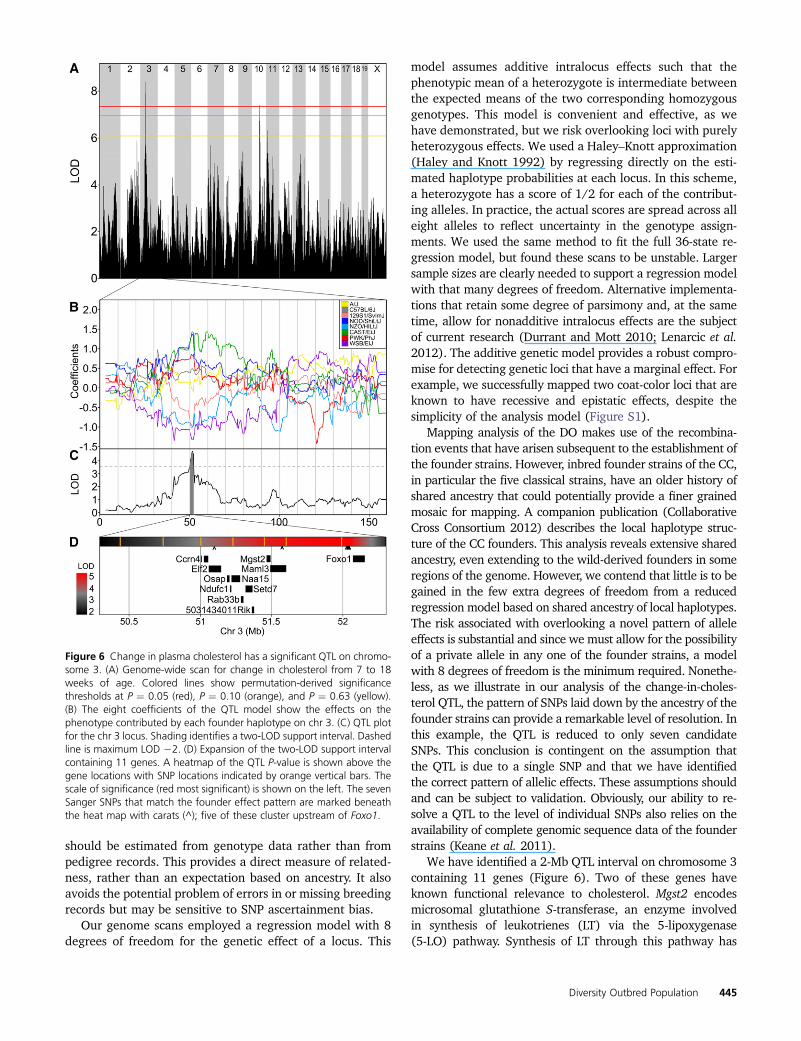
Among the clinical traits mapped in this study, we selectedchange in total plasma cholesterol from age 8 to 19 weeks toillustrate the potential precision of QTL mapping with theDO. A total of 91 DO animals had complete data for this trait.The genome-wide LOD profile identified a significant associ-ation on chromosome 3 (P ¼ 0.014; Figure 6A). The allele
effects plot (Figure 6B) indicates that founder haplotypesfrom strains 129Sv/ImJ, WSB/EiJ, and NZO/H1Lt/J are as-sociated with a decrease in total plasma cholesterol over time.A two-LOD support interval identifies this QTL target regionto be at 50.3–52.3 Mb (Figure 6C) spanning a region thatcontains 11 protein coding genes (Figure 6D). The 2-Mbregions encompasses 32,196 SNPs (Keane et al. 2011) ofwhich only 7 are consistent with the allele effect patternand, of these, 5 are located in the intergenic region upstreamof Foxo1.
Discussion
The Diversity Outbred captures a vast background of allelicvariants in a highly recombinant population. Each DO animal isunique and not reproducible, which precludes the use of certainstudy designs. However, the same allelic variants that arepresented in the DO are also captured in the reproduciblerecombinant inbred strains of the Collaborative Cross. Weanticipate that combined use of these two complementarypopulations will deliver the experimental power of inbredstrain studies together with an unlimited diversity of alleliccombinations and high precision mapping that are currently theexclusive domain of human genome-wide association studies.
Table 4 Distance between recombination events and number ofrecombinations per sample from simulations in F2, CC and DOpopulations
Distance between Recombinations (cM)Population F2 CC DO:G4 DO:G5 DO:G10 DO:G20Mean 22.6 10.3 5.5 5.0 3.5 2.2Median 18.5 6.9 3.7 3.4 2.4 1.5SD 17.8 10.6 5.5 5.0 3.5 2.2
Recombinations per samplePopulation F2 CC DO:G4 DO:G5 DO:G10 DO:G20Mean 27.6 191.2 234.5 258.5 378.3 617.1Median 27.0 191.0 234.0 258.0 378.0 617.0SD 5.3 22.3 15.9 16.5 19.7 25.1
DO:G4 refers to the diversity outbred cross after four generations of outbreedingsubsequent to initial mixing.
Figure 3 Number of recombinations per mouse estimated by simulationfor F2, CC, and DO mice at G4, G5, G10, and G20. G4 indicates fourgenerations of outbreeding.
Figure 4 Recombination in the DO. (A) Distribution of the number ofrecombinations per DO sample. The generation plot is normalized bypopulation size. Shaded bars are G4 (n ¼ 94); solid bars are G5 (n ¼47). (B) Distribution of recombination segment size among the DO. Insetdetails the distribution of segments #20 Mb.
Diversity Outbred Population 443
Phenotypes of the DO animals measured in this studyshowed similar averages and ranges compared to a sampleof inbred CC founder strains. However, we have observedmany individual animals within the larger breeding colonythat exhibit unexpected or extreme phenotypes. The effectsof genetic variation on DO phenotypes may be buffered byheterozygosity when compared to a fully inbred strainpanel. The range of phenotypic diversity is also likely todepend on the nature of the trait being studied. We expectthat perturbations at the level of biochemical pathwaysrelated to medically relevant traits will contribute to ourunderstanding of functional genetic variation and we plan toinclude in-depth biochemical phenotyping, such as geneexpression profiling, in future studies of DO mice.
The DO breeding colony is maintained with a largenumber of mating pairs (currently 175) from which twooffspring, one female and one male, per pair are selected atrandom to establish each subsequent generation. Thismating design doubles the effective population size of the
DO compared to a random mating population (Hartl andClark 2007), minimizing the effects of drift and positiveselection to ensure that existing genetic diversity will bemaintained over the lifetime of the population.
The DO population is uniformly structured without majorsubdivisions. However, animals in any sample will be relatedto one another in varying degrees and it is important toaccount for these relationships in genetic mapping analysis(Cheng et al. 2010). We have implemented genome scansusing a linear mixed model that includes a random poly-genic term with a correlation structure reflecting kinshipamong animals in the study sample. We used the QTLRelsoftware to compute an additive kinship matrix and to com-pute the genome scans (Cheng et al. 2011). For comparison,we also computed genome scans using a model without thepolygenic term (data not shown). Although similar resultswere obtained in this study, we recommend the mixedmodel to minimize the risk of reporting spurious QTL. Wefurther recommend that the kinship correlation matrix
Figure 5 The DO is a mosaic of eight founder inbredstrains. (A) Typical genome of a female DO at generationG4. Chromosome number is indicated on the x-axis. (B)Founder alleles represented across the genome. Chromo-some number is at the top. For each SNP on the array(x-axis) the proportion of each founder allele across allsamples is plotted on the y-axis. Inset in A provides colorcodes used to identify founder inbred strains.
444 K. L. Svenson et al.
should be estimated from genotype data rather than frompedigree records. This provides a direct measure of related-ness, rather than an expectation based on ancestry. It alsoavoids the potential problem of errors in or missing breedingrecords but may be sensitive to SNP ascertainment bias.
Our genome scans employed a regression model with 8degrees of freedom for the genetic effect of a locus. This
model assumes additive intralocus effects such that thephenotypic mean of a heterozygote is intermediate betweenthe expected means of the two corresponding homozygousgenotypes. This model is convenient and effective, as wehave demonstrated, but we risk overlooking loci with purelyheterozygous effects. We used a Haley–Knott approximation(Haley and Knott 1992) by regressing directly on the esti-mated haplotype probabilities at each locus. In this scheme,a heterozygote has a score of 1/2 for each of the contribut-ing alleles. In practice, the actual scores are spread across alleight alleles to reflect uncertainty in the genotype assign-ments. We used the same method to fit the full 36-state re-gression model, but found these scans to be unstable. Largersample sizes are clearly needed to support a regression modelwith that many degrees of freedom. Alternative implementa-tions that retain some degree of parsimony and, at the sametime, allow for nonadditive intralocus effects are the subjectof current research (Durrant and Mott 2010; Lenarcic et al.2012). The additive genetic model provides a robust compro-mise for detecting genetic loci that have a marginal effect. Forexample, we successfully mapped two coat-color loci that areknown to have recessive and epistatic effects, despite thesimplicity of the analysis model (Figure S1).
Mapping analysis of the DO makes use of the recombina-tion events that have arisen subsequent to the establishment ofthe founder strains. However, inbred founder strains of the CC,in particular the five classical strains, have an older history ofshared ancestry that could potentially provide a finer grainedmosaic for mapping. A companion publication (CollaborativeCross Consortium 2012) describes the local haplotype struc-ture of the CC founders. This analysis reveals extensive sharedancestry, even extending to the wild-derived founders in someregions of the genome. However, we contend that little is to begained in the few extra degrees of freedom from a reducedregression model based on shared ancestry of local haplotypes.The risk associated with overlooking a novel pattern of alleleeffects is substantial and since we must allow for the possibilityof a private allele in any one of the founder strains, a modelwith 8 degrees of freedom is the minimum required. Nonethe-less, as we illustrate in our analysis of the change-in-choles-terol QTL, the pattern of SNPs laid down by the ancestry of thefounder strains can provide a remarkable level of resolution. Inthis example, the QTL is reduced to only seven candidateSNPs. This conclusion is contingent on the assumption thatthe QTL is due to a single SNP and that we have identifiedthe correct pattern of allelic effects. These assumptions shouldand can be subject to validation. Obviously, our ability to re-solve a QTL to the level of individual SNPs also relies on theavailability of complete genomic sequence data of the founderstrains (Keane et al. 2011).
We have identified a 2-Mb QTL interval on chromosome 3containing 11 genes (Figure 6). Two of these genes haveknown functional relevance to cholesterol. Mgst2 encodesmicrosomal glutathione S-transferase, an enzyme involvedin synthesis of leukotrienes (LT) via the 5-lipoxygenase(5-LO) pathway. Synthesis of LT through this pathway has
Figure 6 Change in plasma cholesterol has a significant QTL on chromo-some 3. (A) Genome-wide scan for change in cholesterol from 7 to 18weeks of age. Colored lines show permutation-derived significancethresholds at P ¼ 0.05 (red), P ¼ 0.10 (orange), and P ¼ 0.63 (yellow).(B) The eight coefficients of the QTL model show the effects on thephenotype contributed by each founder haplotype on chr 3. (C) QTL plotfor the chr 3 locus. Shading identifies a two-LOD support interval. Dashedline is maximum LOD 22. (D) Expansion of the two-LOD support intervalcontaining 11 genes. A heatmap of the QTL P-value is shown above thegene locations with SNP locations indicated by orange vertical bars. Thescale of significance (red most significant) is shown on the left. The sevenSanger SNPs that match the founder effect pattern are marked beneaththe heat map with carats (^); five of these cluster upstream of Foxo1.
Diversity Outbred Population 445

been shown to be inhibited by cholesterol (Zagryagskaya et al.2008). Foxo1 encodes forkhead box transcription factor O1(FoxO1), a key regulator in bile acid biosynthesis and hencelikely to affect subsequent catabolism of cholesterol (Li et al.2009). Li and colleagues observed increased nuclear accumu-lation of FoxO1 and elevated plasma cholesterol in mice feda HF diet similar to that used in the present study, suggestingan indirect role for FoxO1 in regulating cholesterol via its effecton bile acid synthesis. A QTL for coincident plasma cholesteroland HDL cholesterol (Chldq2) has been mapped near this chro-mosome 3 locus (Srivastava et al. 2006; Wergedal et al. 2007),supporting the likelihood that variants within this locus in-fluence plasma cholesterol. Additional DO animals from ourongoing study will provide the opportunity to further refinethe QTL location, to investigate potential interactions withdiet, and to confirm the allele effects pattern that lead tothe identification of candidate SNPs.
HDL cholesterol was among the traits examined in ourstudy. A polymorphism in Apoa2 (chr 1, 173.155926 Mb)has been previously associated with elevated HDL levels inseveral mouse crosses. Specifically, a C to T transition resultsin the replacement of alanine with valine in the proteinproduct (Wang et al. 2004). Among the eight CC founderstrains, only 129S1/SvImJ (129S1) carries the T allele ofthis polymorphism. Therefore, we would expect that DOmice with the 129S1 genotype at this locus would havehigher HDL levels. The homozygous 129S1 genotype oc-curred at this locus in only one DO animal from our study.However, we identified 37 animals that were heterozygousfor the 129S1 allele. At the marker nearest the Apoa2 poly-morphism (UNC010361641, chr 1, 173343908), we per-formed a Student’s t-test and found a significant increasein HDL levels among strains containing the 129S1 allele(P ¼ 0.022, one-sided test, unequal variance). However,due to the small number of homozygote 129S1 individualsin our study sample, this association was not significant inthe genome-wide QTL scans. We expect that increased sam-ple size would improve our prospects for rediscovery of thislocus. The importance of the Apoa2 locus has been estab-lished in the literature. The DO provides an opportunity todiscover new genes that affect HDL and numerous othertraits that have been studied in classical mouse QTL crosses.
We envision many potential applications for DO mice thatdo not necessarily entail genetic mapping. Pharmaceuticaldevelopment comes with a cost of approximately 800 milliondollars and as long as 10 years to bring a product to market.Most of these drugs are well tolerated by the majority ofpatients. However, a small number of patients may experi-ence unpredictable injury while taking a therapeutic dose andthis can lead to removal of the drug from the market, thusdenying the drug’s benefit to the vast majority of patients. Ithas been hypothesized that genetic causes underlie many ofthese idiosyncratic adverse drug reactions (Wilke et al. 2007).If this is the case, then perhaps initial screening with a genet-ically diverse and heterogeneous model, such as DO mice,could allow for more realistic assessments of the risk of ad-
verse effects and provide a more reliable route for general-ization of findings from mouse to human populations.
The DO is a newly developed mouse resource that, even inearly generations, is proving to be a robust tool for high-resolution mapping of complex traits. At outbreeding gen-erations G4 and G5, using fewer than 150 mice, the mappingresolution was sufficient to identify QTL intervals of 2–8 Mb.We present the mapping of two Mendelian coat color traits toregions including genes known to regulate coat color anda complex metabolic trait to a region in which highly plausi-ble candidate genes reside. These initial results demonstratethe utility of the DO and when used in concert with theCollaborative Cross these new coordinated resources will ac-celerate our discovery of the genetic basis for disease.
Acknowledgments
We thank Darla Miller for managing the production andtransfer of partially inbred CC strains. We are especiallygrateful to Lisa Somes, Biomedical Technologist, and to theImportation Service at The Jackson Laboratory, for carefuland competent management of specific breeding strategiesto develop this population in its early phases. We thankMarge Strobel and Adam O’Neill at The Jackson Laboratoryfor continued dedication to current maintenance of the DOpopulation. We thank Steven Ciciotte for preparing DNA.Finally, we thank our anonymous reviewers for commentsthat lead to improvements in the content and presentationof the manuscript. This work was supported by The JacksonLaboratory and National Institutes of Health (NIH) grantsGM076468 and GM070683 to G.A.C., and by NIH grantsR01DA021336, R21DA024845, and R01MH079103 anda Grant from the Schweppe Foundation to A.A.P.
Literature Cited
Cheng, R., J. E. Lim, K. E. Samocha, G. Sokoloff, M. Abney et al.,2010 Genome-wide association studies and the problem of re-latedness among advanced intercross lines and other highly re-combinant populations. Genetics 185: 1033–1044.
Cheng, R., M. Abney, A. A. Palmer, and A. Skol, 2011 QTLRel: anR package for genome-wide association studies in which relat-edness is a concern. BMC Genet. 12: 66.
Chesler, E. J., D. R. Miller, L. R. Branstetter, L. D. Galloway, B. L.Jackson et al., 2008 The Collaborative Cross at Oak RidgeNational Laboratory: developing a powerful resource for sys-tems genetics. Mamm. Genome 19: 382–389.
Churchill, G. A., D. C. Airey, H. Allayee, J. M. Angel, A. D. Attie et al.,2004 The Collaborative Cross, a community resource for thegenetic analysis of complex traits. Nat. Genet. 36: 1133–1137.
Collaborative Cross Consortium, 2012 The genome architectureof the Collaborative Cross mouse genetic reference population.Genetics 190: 389–401.
Cox, A., C. L. Ackert-Bicknell, B. L. Dumont, Y. Ding, J. T. Bell et al.,2009 A new standard genetic map for the laboratory mouse.Genetics 182: 1335–1344.
Dudbridge, F., and B. P. Koeleman, 2004 Efficient computation ofsignificance levels for multiple associations in large studies ofcorrelated data, including genomewide association studies. Am.J. Hum. Genet. 75: 424–435.
446 K. L. Svenson et al.

Durrant, C., and R. Mott, 2010 Bayesian quantitative trait locusmapping using inferred haplotypes. Genetics 184: 839–852.
Haley, C. S., and S. A. Knott, 1992 A simple regression method formapping quantitative trait loci in line crosses using flankingmarkers. Heredity 69: 315–324.
Hartl, D.L, and A. G. Clark, 2007 Principles of Population Genet-ics. Sinauer Associates, Sunderland, MA.
Keane, T. M., L. Goodstadt, P. Danecek, M. A. White, K. Wong et al.,2011 Mouse genomic variation and its effect on phenotypesand gene regulation. Nature 477: 289–294.
Lenarcic, A. B., K. L. Svenson, G. A. Churchill, and W. Valdar,2012 A general Bayesian approach to analyzing diallel crossesof inbred strains. Genetics 190: 413–435.
Li, T., H. Ma, Y. J. Park, Y. K. Lee, S. Strom et al., 2009 Forkhead boxtranscription factor O1 inhibits cholesterol 7alpha-hydroxylasein human hepatocytes and in high fat diet-fed mice. Biochim.Biophys. Acta 1791: 991–996.
Lynch, M., and B. Walsh, 1997 Genetics and Analysis of Quantita-tive Traits, Sinauer Associates. Sunderland, MA.
Markert, C. L., and W. K. Silvers, 1956 The effects of genotypeand cell environment on melanoblast differentiation in thehouse mouse. Genetics 41: 429–450.
Naggert, J. K., K. L. Svenson, R. V. Smith, B. Paigen, and L. L.Peters, 2003 Diet effects on bone mineral density and content,body composition, and plasma glucose, leptin, and insulin lev-els. MPD:143, Mouse Phenome Database Website, The JacksonLaboratory, Bar Harbor, ME. (http://phenome.jax.org/).
Paigen, B., K. L. Svenson, and L. L. Peters, 2002 Diet effects onplasma lipids and susceptibility to atherosclerosis (pathogen-freeconditions). MPD:99, Mouse Phenome Database Website, TheJackson Laboratory, Bar Harbor, ME (http://phenome.jax.org/).
Peters, L. L., and J. E. Barker, 2001 Hematology, clotting, andthrombosis MPD:62, Mouse Phenome Database Website, TheJackson Laboratory, Bar Harbor ME (http://phenome.jax.org/).
Peters, L. L., R. F. Robledo, C. J. Bult, G. A. Churchill, B. J. Paigenet al., 2007 The mouse as a model for human biology: a resourceguide for complex trait analysis. Nat. Rev. Genet. 8: 58–69.
Russell, L. B., and W. L. Russell, 1948 A study of the physiologicalgenetics of coat color in the mouse by means of the dopa re-action in frozen sections of skin. Genetics 33: 237–262.
Silvers, W. K., 1979 The Coat Colors of Mice. Springer Verlag, NewYork.
Skarnes, W. C., B. Rosen, A. P. West, M. Koutsourakis, W. Bushellet al., 2011 A conditional knockout resource for the genome-wide study of mouse gene function. Nature 474: 337–342.
Srivastava, A. K., S. Mohan, G. L. Masinde, H. Yu, and D. J. Baylink,2006 Identification of quantitative trait loci that regulate obe-sity and serum lipid levels in MRL/MpJ · SJL/J inbred mice. J.Lipid Res. 47: 123–133.
Stranger, B. E., E. A. Stahl, and T. Raj, 2011 Progress and promiseof genome-wide association studies for human complex traitgenetics. Genetics 187: 367–383.
Valdar, W., L. C. Solberg, D. Gauguier, S. Burnett, P. Klenermanet al., 2006 Genome-wide genetic association of complex traitsin heterogeneous stock mice. Nat. Genet. 38: 879–887.
Wang, X., R. Korstanje, D. Higgins, and B. Paigen, 2004 Haplotypeanalysis in multiple crosses to identify a QTL gene. Genome Res.14: 1767–1772.
Wergedal, J. E., C. L. Ackert-Bicknell, W. G. Beamer, S. Mohan, D. J.Baylink et al., 2007 Mapping genetic loci that regulate lipidlevels in a NZB/B1NJxRF/J intercross and a combined inter-cross involving NZB/B1NJ, RF/J, MRL/MpJ, and SJL/J mousestrains. J. Lipid Res. 48: 1724–1734.
Wilke, R. A., D. W. Lin, D. M. Roden, P. B. Watkins, D. Flockhartet al., 2007 Identifying genetic risk factors for serious adversedrug reactions: current progress and challenges. Nat. Rev. DrugDiscov. 6: 904–916.
Yang, H., Y. Ding, L. N. Hutchins, J. Szatkiewicz, T. A. Bell et al.,2009 A customized and versatile high-density genotyping ar-ray for the mouse. Nat. Methods 6: 663–666.
Yang, H., J. R. Wang, J. P. Didion, R. J. Buus, T. A. Bell et al.,2011 Subspecific origin and haplotype diversity in the labora-tory mouse. Nat. Genet. 43: 648–655.
Zagryagskaya, A. N., D. A. Aleksandrov, M. A. Pushkareva, S. I.Galkina, Z. V. Grishina et al., 2008 Biosynthesis of leukotrieneB4 in human polymorphonuclear leukocytes: regulation by cho-lesterol and other lipids. J. Immunotoxicol. 5: 347–352.
Edited by Lauren M. McIntyre, Dirk-Jan de Koning,and 4 dedicated Associate Editors
Diversity Outbred Population 447

GENETICSSupporting Information
http://www.genetics.org/lookup/suppl/doi:10.1534/genetics.111.132597/-/DC1
High-Resolution Genetic Mapping Using the MouseDiversity Outbred Population
Karen L. Svenson, Daniel M. Gatti, William Valdar, Catherine E. Welsh, Riyan Cheng,Elissa J. Chesler, Abraham A. Palmer, Leonard McMillan, and Gary A. Churchill
Copyright © 2012 by the Genetics Society of AmericaDOI: 10.1534/genetics.111.132597