
First Flight of Scaled Electric Solar Powered UAV ... - CiteSeerX

lable at ScienceDirect
Journal of Structural Geology 69 (2014) 163e178
Contents lists avai
Journal of Structural Geology
journal homepage: www.elsevier .com/locate/ jsg
Review article
Ground-based and UAV-Based photogrammetry: A multi-scale, high-resolution mapping tool for structural geology and paleoseismology
Sean P. Bemis a, *, Steven Micklethwaite b, Darren Turner c, Mike R. James d, Sinan Akciz e,Sam T. Thiele b, Hasnain Ali Bangash b
a Department of Earth and Environmental Sciences, University of Kentucky, 101 Slone Research Building, Lexington, KY 40506, USAb CET (M006), School of Earth and Environment, The University of Western Australia, 35 Stirling Highway, Crawley, WA 6009, Australiac School of Land and Food, University of Tasmania, Hobart, Tasmania 7001, Australiad Lancaster Environment Centre, Lancaster University, Lancaster LA1 4YQ, UKe Department of Earth, Planetary, and Space Sciences, University of California, Los Angeles, Los Angeles, CA 90095, USA
a r t i c l e i n f o
Article history:Received 21 May 2014Received in revised form13 October 2014Accepted 14 October 2014Available online 27 October 2014
Keywords:PhotogrammetryStructural geologyNeotectonics3D surface modellingUAVsStructure-from-Motion
* Corresponding author.E-mail address: [email protected] (S.P. Bemis).
http://dx.doi.org/10.1016/j.jsg.2014.10.0070191-8141/© 2014 Elsevier Ltd. All rights reserved.
a b s t r a c t
This contribution reviews the use of modern 3D photo-based surface reconstruction techniques for highfidelity surveys of trenches, rock exposures and hand specimens to highlight their potential for paleo-seismology and structural geology. We outline the general approach to data acquisition and processingusing ground-based photographs acquired from standard DSLR cameras, and illustrate the use of similarprocessing approaches on imagery from Unmanned Aerial Vehicles (UAVs). It is shown that digital mapand trench data can be acquired at ultra-high resolution and in much shorter time intervals than wouldbe normally achievable through conventional grid mapping. The resulting point clouds and texturedmodels are inherently multidimensional (x, y, z, point orientation, colour, texture), archival and easilytransformed into orthorectified photomosaics or digital elevation models (DEMs). We provide someexamples for the use of such techniques in structural geology and paleoseismology while pointing theinterested reader to free and commercial software packages for data processing, visualization and 3Dinterpretation. Photogrammetric models serve to act as an ideal electronic repository for critical outcropsand observations, similar to the electronic lab book approach employed in the biosciences. This paperalso highlights future possibilities for rapid semi-automatic to automatic interpretation of the data andadvances in technology.
© 2014 Elsevier Ltd. All rights reserved.
1. Introduction
High-resolution three dimensional (3D) data capture is requiredat all scales in the geosciences, from hand specimen to landscapes,and a range of tools are available for addressing different portionsof the scale spectrum (e.g., McCaffrey et al., 2005). In particular,recent advances in high-resolution digital 3D data collection aredominated by active source sensors, predominantly based uponlaser scanning technologies (e.g., LiDAR), which measure distanceto a target based upon the travel time of reflected light (e.g.,Hodgetts, 2013). However, a new development in high-resolution3D data collection exploits a very common and widely accessiblepassive imaging source e digital photography. Geoscientists havelong utilized the 3D information available through
photogrammetric techniques; most notably the ability to visualizethe Earth's surface and extract topographic data from stereo aerialphotographs (e.g., Birdseye, 1940; Eardley, 1942). With the funda-mental principles of photogrammetry now combined with robustalgorithms from the computer vision community, collections ofoverlapping photographs can be automatically processed to rapidlyextract the relative 3D coordinates of millions of surface points(Lowe, 2004; Snavely et al., 2008a, 2008b, 2006). Therefore, theonly specialized resource required for acquisition of 3D datathrough photogrammetric techniques is access to suitable softwarewhich depending on computer skills and requirements, is availablethrough both commercial and open-source options (Table 1).
The limited infrastructure requirements of modern photo-grammetric techniques present a wide range of opportunities forgeoscience research and education. In the most basic form, the rawdata consist of only digital photographs, which can be collectedwith any commonly available digital camera, including those onsmartphones and tablets. As such, the technique facilitates rapid

Table 1Examples of open source and commercial software for photo-based 3d reconstruction.
Software Url (valid on 17 May, 2014) Notes
Freely availableBundler PhotogrammetryPackagea,b
http://blog.neonascent.net/archives/bundler-photogrammetry-package/
Used in James and Robson (2012). Script-based, no graphical user interface(GUI). Windows OS only.
SFMToolkita,b http://www.visual-experiments.com/demos/sfmtoolkit/ Similar software to above.Python PhotogrammetryToolbox (PPT)a,b
http://code.google.com/p/osm-bundler/ Formerly OSM-bundler. Python-driven GUI and scripts, with a Linuxdistribution.
VisualSFMb http://www.cs.washington.edu/homes/ccwu/vsfm/ Advanced GUI withWindows, Linux and Mac. OSX versions. Georeferencingoptions, but camera model is more restricted than that used in Bundler.
3DF Samantha http://www.3dflow.net/technology/samantha-structure-from-motion/
SfM only, but withmore advanced cameramodels than all above (Farenzenaet al., 2009). Provides output compatible with several dense matchingalgorithms.
Web sites and servicesPhotosynth http://photosynth.net/ Evolved from Bundler. SfM only, no dense reconstruction. Can incorporate a
very wide variety of images, but does so at the cost of reconstructionaccuracy.
Arc3D http://www.arc3d.be/ Vergauwen and Van Gool [2006]CMP SfM Web servicea http://ptak.felk.cvut.cz/sfmservice/Autodesk 123D Catch http://www.123dapp.com/catch/Pix4D http://pix4d.com/ Also available as standalone software.My3DScanner http://www.my3dscanner.com/
CommercialPhotoScan http://www.agisoft.ru/products/photoscan/ Full SfM-MVS-based commercial package.Acute3D http://www.acute3d.com/PhotoModeler http://www.photomodeler.com/ Software, originally based on close-range photogrammetry, now also
implements SfM.3DF Zephyr Pro http://www.3dflow.net/ Underlying SfM engine is 3DF Samantha
Note: Table modified from http://www.lancaster.ac.uk/staff/jamesm/research/sfm.htm.SfM ¼ Structure from Motion; MVS ¼ Multi-View Stereo.
a Uses Bundler (http://phototour.cs.washington.edu/bundler/) to compute structure from motion.b Uses PMVS2 (http://grail.cs.washington.edu/software/pmvs/) as a dense multi-view matcher.
S.P. Bemis et al. / Journal of Structural Geology 69 (2014) 163e178164
collection of large amounts of data in remote settings whereportability and efficiency may be critical. Because the source dataare photographs, the derivative 3D data can readily be coloured ordrapedwith the source photography to produce realistic 3Dmodelsof the feature of interest, which can then be exported to 3D visu-alization environments for analysis. In addition, with free viewersfor many 3D formats (including the ubiquitous Adobe Reader for 3DPDFs), models can be widely shared for exploration and enhancedunderstanding of the 3D nature of many geoscience examples. 3Dphotogrammetric models and their accompanying digital photo-graphs are inherently archival, easily shared and provide a recordthat is faithful to the primary observations, thereby allowing futuregenerations of geoscientists to extract additional 3D and orienteddata, or reinterpret the outcrop/samples.
The purpose of this review is to introduce these easy to usephotogrammetric techniques to the general structural geology andpaleoseismology communities while illustrating a range of appli-cations. A variety of 3D data collection tools are nowavailable to thegeoscientist, including a range of laser scanning options andtraditional surveying methods, and each method has different ad-vantages/disadvantages in terms of resolution, scalability, porta-bility, and computer processing requirements. Photo-based 3Dreconstruction techniques can provide a comparable resolution tolaser scanning tools with a significant reduction in cost, infra-structure, and processing requirements. To assist with adoption ofsuch techniques, we provide an overview of the technical basisalong with workflows and discussion of best practices for photo-graph collection that will provide optimal results.
2. Photogrammetry in the geosciences
For most of the 20th century, photogrammetry principlesimplemented through stereoscopic instruments were the primarymeans of the construction of topographic maps (e.g., Birdseye,1940) e a critical element of traditional field-based geologic
studies. Furthermore, photogrammetry has been directly employedfor many years in the geosciences through stereoscopic viewingand analysis of overlapping pairs of aerial photographs (e.g.,Eardley, 1942; Pillmore, 1964). This stereoscopic viewing providesthe researcher with the ability to visualize and map a study arearemotely and from a perspective that is impossible to attain in thefield. These photogrammetric techniques were adapted for workingat the outcrop scale for simple visualization purposes by takingphoto pairs of the outcrop of interest for later viewing through amirror stereoscope (Kuenen, 1950). This approach is valuable for amore representative visualization of a site once the researcherreturns to the office, but requires tedious procedures to enableextraction of data that are fully 3D and oriented (Hagan, 1980).
With the advent of modern digital camera technology, re-strictions around the number of photos that can be collected havebeen relaxed and picture quality can be quickly and easily assessedin the field. Now, the greater limitation lies in achieving optimalcamera positioning relative to the object of interest, whether due tovegetation, topography, objective hazards, etc. However, even thislimitation is being reduced through the use of digital photographyfrom balloons, kites, and UAVs, enabling drastically improvedsynoptic views from overhead (e.g., Smith et al., 2009; Niethammeret al., 2012; Stumpf et al., 2013).
3. Principles and capability of photo-based 3D reconstruction
3.1. Basic principles
New methods of photo-based 3D reconstruction reflect theevolution of photogrammetry from a highly specialized technique,requiring expensive software and restrictive image collection re-quirements, to a user-friendly and scalable methodology. Funda-mentally, photogrammetry works on the basis that, from twooverlapping photographs, it is possible to calculate the uniquethree-dimensional (3D) location of a set of given points shared in

Establish control points or scale
Collect photographs
Mask non-stationary portions of images
Pixel grid based matching
Build mesh/ interpolate surface
Feature detection, bundle adjustment,
and 3D scene reconstruction
Dense point cloud
Sparse point cloud
Fieldwork
SfM
MVS
S.P. Bemis et al. / Journal of Structural Geology 69 (2014) 163e178 165
both photographs, relative to the cameras (Fig. 1). The unknownscomprise a ‘camera model’ that describes how the camera repre-sents the 3D world as a 2D image, the relative camera positions andpointing directions, and the 3D point coordinates. In ‘conventional’photogrammetry, which has evolved through the surveying, engi-neering and remote sensing communities, initial estimates aregenerally derived by providing additional control data, such as thepositions of known control points within images, prior to pro-cessing. This approach allows error estimates (e.g., the accuracy ofthe control measurements) and a real-world coordinate system tobe embedded from the outset. Processing then consists of refiningparameters through a ‘bundle adjustment’ (Granshaw,1980), whichsimultaneously optimizes all variables to produce a self-consistent3D model, with minimized overall residual error. Such softwareenables a highly rigorous approach and provides accurate results inwhich error estimates are widely visible. However, the softwareoften has complexities and error intolerance that can present dif-ficulties for inexperienced users, and the requirements for collec-tion of suitable imagery and control data can be arduous.
Over the last decade, parallel advances in an area of computervision research called ‘structure from motion’ (SfM) has beendriven by a different rationale e to enable automated model pro-duction from unconstrained imagery, for which metric accuracy isnot the primary goal. Some of the most significant advances in SfMhave arisen from the development of image feature descriptors thatare tolerant to changes in view point (e.g., Lowe, 2004), and robustmatching algorithms that can identify and reject errors when theyoccur (e.g., Fischler and Bolles, 1981). With these, bundle adjust-ment can be initialized from automated image measurementsalone. For example, to work efficiently, coarse estimates for cameramodel parameters are also required, e.g., focal length, but mostsoftware will just automatically extract appropriate values fromimage file metadata. Thus, 3Dmodels can be effectively constructedfrom a wide variety of imagery, with no user intervention (e.g.,Snavely et al., 2008a, 2008b, 2006). However, the results of such a3D reconstruction will be in an arbitrary coordinate system so, toreference to a real-world system, the model needs to be trans-formed through the use of some control data. The control re-quirements are usually significantly less arduous than for‘conventional’ photogrammetry, but control data are not neces-sarily incorporated throughout model construction and their errorestimates are more weakly integrated.
The ongoing convergence of photogrammetry- and computervision-based workflows is now providing powerful tools for geo-science use (Favalli et al., 2012), enabling automated model pro-duction from flexible image input and with increasing access to
targ
et s
urfa
ce
camerapositions camera
field of view
Fig. 1. Basic principles of photogrammetry for 3D reconstruction. Two overlappingphotographs taken from different positions allow each feature in the overlapping areato be defined by a unique 3D position. Dashed lines illustrate convergent views ofdiscrete features from overlapping photographs.
integrated georeferencing and error analysis. The rapidly wideningavailability of such software is themotivation for this paper. On thatbasis, a typical photo-based reconstruction workflow is describedbelow and summarized in Fig. 2.
3.2. Workflow for high precision data collection
3.2.1. Image acquisitionImages can be collected with almost any digital camera, and
there are few limitations in number or types of digital cameras usedfor a single set. As expected, a higher quality model output isfacilitated by higher quality input images. Additional data collec-tion flexibility derives from the ability of SfM algorithms to matchimages taken at varying scales and perspectives, provided thephotos still produce sufficient overlap. Stereoscopic aerial
Georeferencing and scale
Texture mapping Reprojection
DEM generation
orthomosaicphoto-
realistic model
Fig. 2. General workflow illustrating the photo-based 3D reconstruction process.Diamond fields indicate potential output products at different stages during recon-struction. MVS (Multi-view Stereo) and SfM (Structure-from-Motion) illustrate theportions of the workflow that specifically related to these processes described in text.

S.P. Bemis et al. / Journal of Structural Geology 69 (2014) 163e178166
photography is typically collected with 50e60% overlap betweenadjacent images, under near-parallel viewing conditions (e.g.,Krauss, 1993; Abdullah et al., 2013). SfM-based 3D reconstructionmethods also require overlapping images but, because they canoperate on unordered collections of photographs, the overlaprequirement is best considered in terms of coverage and angularchange between overlapping images. In terms of coverage, everysurface that will be reconstructed needs to be covered by at least 2images taken from different positions, and preferably more (Fig. 3).Increasing angles of convergence between overlapping images willtend to increase reconstruction accuracy up to a point, but willeventually prevent matching due to the surface texture appearingtoo dissimilar in images from different directions. Moreels andPerona (2007) found that popular feature detectors used for auto-mated image matching did not perform well with angular changesgreater than 25e30� between images. Thus, while angular changesbetween photos can increase the accuracy of reconstructed 3Dsurfaces, differences should be limited to 10e20� for overlappingphotos.
The simplest approach for image acquisition over relativelyplanar surfaces mimics the approach of collecting traditional ste-reoscopic aerial photographs where images are collected in acontinuous line with a camera position orthogonal to the surface ofinterest and with a frequency to produce image overlap >60%(Fig. 3). However, the scale and layout of the target surface willfrequently necessitate adjustments to this simple approach.Furthermore, James and Robson (2014) document systematic errorsthat can be introduced across models derived from image collec-tions where all photos are collected with parallel viewing di-rections. This error is manifest in the axis parallel to the image viewdirection, for example producing broad-scale elevation error fromimages collected with a vertical orientation. James and Robson(2014) demonstrate that one approach to mitigate this systematicerror by combining additional images with a view direction that isinclined relative to the view direction of the rest of the imagecollection (Fig. 3).
In addition to image coverage, the other key consideration in theplanning of any survey is how the texture of the target will resolvein individual photographs. Automated feature matching relies uponthe ability of computer algorithms to identify unique
portion of surface resolvable by
Fig. 3. Representation of simple image acquisition for photo-based 3D reconstruction. Grdarkness of the triangles corresponds with the number of camera positions that the surfacepoint cloud because more features should be resolvable, leading to a higher resolution modseparation, inclination, and the distance to the surface is illustrated by the size of the areaspositions are not required, they are recommended for reducing possible systematic errors
corresponding features in overlapping photos. For good results, anyeffects that reduce textural variability within images or increasefeature variability between images should be minimized duringacquisition. Common issues preventing algorithms from resolvingcoincident points include homogeneous surface texture, changes inthe target, and changes in illumination. The latter two have thesame effect of making a unique feature appear differently betweenimages, although both require different strategies for reducing thedeleterious effect on model construction. Poor or variable imagetexture is often due to surface reflections, flat surfaces with littletextural variation, and the occurrence of deep shadows. The targetitself may appear to change between images due to wind shiftingvegetation, or the movement of people and vehicles. Changes inillumination can result from accidental shading by the photogra-pher, changes in the sun position, or filtering by clouds. Strategiesfor circumnavigating these issues in structural studies are outlinedfurther in Section 5.2.
3.2.2. Scale and coordinatesThe scaling and georeferencing requirements for the target
surface will vary with the intended use of the 3D data/model andshould be considered prior to image acquisition. An object or sur-face can be fully reconstructed in 3D without any scale or positioninformation but, to extract oriented and scaled data, additionalcontrol data must be provided. Scale can be added to a modelsimply by knowing the distance between two points on an inputimage or on the model. These distance measurements for scale arebest taken over the width of the target area rather than smaller,isolated lengths. Greater accuracy in scale and full georeferencingto local or geographic coordinates requires three or more groundcontrol points, usually collected with survey-grade, carrier phasedifferential GPS or total station surveying. These ground controlpoints should be distributed widely across the target area, notneglecting the margins. An alternate option for georeferencing isthe use of high-precision camera locations for the input images, butcurrent GPS units in hand-held cameras are insufficient for thetypical accuracy requirements of high resolution structural map-ping and paleoseismology projects conducted over a few hundredmeters or less.
photo-based reconstructions
ey triangles represent the field of view for each camera position and the increasingis visible from. A greater number of overlapping images is likely to produce a denserel for that portion of the reconstruction. The sensitivity of image overlap to the imagevisible from 3 or more camera positions (darkest grey). Although the inclined cameradue to camera calibration error (James and Robson, 2014).
S.P. Bemis et al. / Journal of Structural Geology 69 (2014) 163e178 167
3.2.3. Determining the imaging geometry: structure from motionThe first stage of a SfM-based 3D reconstruction involves the
analysis of the individual images for distinct image features thatcan be matched to their corresponding features in other imageswithin the collection (e.g., Fig. 1). The SfM process then uses theresulting network of matched points to establish the relative lo-cations of each camera and simultaneously determines the cameraparameters for each image, the collection position and orientationfor each input image, and the 3D coordinates for each matchedfeature e commonly referred to as the bundle adjustment. Algo-rithms typically adopt an incremental approach where bundleadjustment of an initial image pair is sequentially repeated, withmore images incorporated at each iteration. The matched featuresthus constitute a sparse 3D point cloud that represents the struc-ture of the target surface, defined within a local coordinate system.This point cloud is limited in precision and point density because itis derived from robust feature matching, which has lesser accuracy(e.g., ~0.5 pixel) than some other matching approaches(Remondino, 2006; Barazzetti et al., 2010).
3.2.4. Densifying the measurements: multi-view stereoWith known camera models and orientations, a multi-view
stereo algorithm will produce a dense point cloud representationof the surface. Typically, this technique will be implemented as asystematic search over a pixel grid to identify best matches be-tween images, with the results providing significantly more 3Dpoints, having greater precision than the feature matching of theinitial SfM step. Multi-view stereo is particularly intensivecomputationally if the full image collection is processed simulta-neously. However, most photo-based 3D reconstruction programsand algorithms have the option to subset image collections (e.g.,Furukawa et al., 2010) or to adjust the grid-cell size at which multi-view stereo is performed so as to manage the resolution and timerequired to produce the resultant dense point cloud.
3.2.5. 3D model and orthophoto generationFor many applications within structural geology and paleo-
seismology, 3D models and orthophotos are useful for high reso-lution mapping of outcrop, rock faces or trenches. Usingtriangulation or grid interpolation, it is relatively straightforward togenerate a digital elevation model (DEM) and ortho-rectified pho-tomosaics for any selected orientation from the dense, georefer-enced point cloud. True 2D orthophotos of any portion of the 3Dmodel can then be derived, with the known 3D model and imaginggeometry, allowing correction for the viewing characteristics of theinput images and the images providing the texture for the ortho-photo mosaic. Furthermore, depending on the software used, the3D model itself can be textured and exported in common 3Dvisualization formats (e.g.,.obj,.ply,.pdf, etc.) for visualization andinteractivity.
3.3. Precision and applicability
In general terms, the accuracy of a photo-based model dependsupon the scale and resolution of the input images, the distributionand accuracy of control data (whether ground control points, scalemeasurements or camera positions), the precision and distributionof matched image points, and the network geometry, which in-cludes the number of photos, how much they overlap and howconvergent the views are. In close-range photogrammetry (e.g., asoften used for high accuracy engineering applications), where im-age networks are usually multi-image and highly convergent, thestrength of a network can be described by its relative networkprecision, which is a ratio of the mean 3D point uncertainty esti-mate to the longest dimension of the network. For a given image
measurement precision, a stereo image pair with only two near-parallel images would represent a weaker network than a conver-gent multi-image arrangement. For projects using digital SLR im-agery covering sub-meter to kilometer scales processed with anSfM-based approach, James and Robson (2012) estimated relativeprecision ratios of ~1:1000 or greater. These ratios were shown tobe similar to those of theoretical estimates for stereo photogram-metry, but approximately an order of magnitude poorer thanequivalent theoretical estimates for close-range (convergent)networks.
In most structural geology and neotectonic applications, we areinterested in a bare surface model. In areas of light to densevegetation, this preference for bare surfaces becomes the primarydisadvantage to photo-based 3D reconstruction relative to activesource 3D data collection tools. LiDAR collects a 3D point locationwith a single pulse of light, thus is capable of collecting groundsurface points wherever the pulse of light is able to penetrate thevegetation, reflect off the ground surface, and return to the in-strument. The requirement in photo-based 3D reconstructions formultiple images collected from different perspectives for 3D pointgeometry reconstruction dramatically reduces the number ofresolvable ground surface points due to the occlusion of the groundsurface by vegetation when moving from one camera position tothe next. However, because the SfM process creates a point cloud,as long as the vegetation is sparse enough to allow a sufficientnumber of ground features to be identified and matched, some ofthe approaches developed for classification of LiDAR data can beapplied to SfM-derived point clouds. Furthermore, one of thepopular commercial photo-based 3D reconstruction packages(Table 1), Agisoft PhotoScan, has implemented a point cloud clas-sification scheme for classification of ground surface points andvegetation (http://www.agisoft.ru/tutorials/photoscan/08).
4. Applications to paleoseismology and neotectonics
Major advances in the ability to collect, process, and visualizehigh resolution 3D topographic data in the form of LiDAR hasrevolutionized paleoseismology and neotectonics research over thepast ~15 years (e.g., Haugerud et al., 2003; Hudnut et al., 2002). Theability to visualize bare-earth topography on a regional scale withsub-meter resolution in awide variety of landscapes using airbornelaser scanning (ALS) is currently unparallelled. ALS has beenimplemented in neotectonic studies for fault mapping (e.g.,Arrowsmith and Zielke, 2009; Bevis et al., 2005; Oskin et al., 2007),measurement of geomorphic offsets (e.g., Zielke et al., 2010), andmeasurement of coseismic surface displacements (e.g., Borsa andMinster, 2012; Duffy et al., 2013; Nissen et al., 2012; Oskin et al.,2012). Terrestrial laser scanning (TLS) provides a higher resolu-tion data collection (sub-decimeter), but usually over morerestricted distances due to the limited range of most instrumentsand the reduced visibility from working near ground-level. Thistechnique has been similarly used to measure geomorphic offsets,determine coseismic surface displacements (Gold et al., 2012), andscan paleoseismic excavations (Haddad et al., 2012). The high-resolution capability of photo-based 3D reconstruction accommo-dates many of the same applications as ALS and TLS surveying, butalso presents several site-specific and technical advantages in itsimplementation due to portability, low power consumption, rapiddata collection, and low cost (Morelan et al., 2010; Johnson et al.,2014). We provide some examples illustrating these advantages.
4.1. Neotectonics applications
One of the critical roles for geoscientists following a majorsurface-rupturing earthquake is the systematic measurement of
S.P. Bemis et al. / Journal of Structural Geology 69 (2014) 163e178168
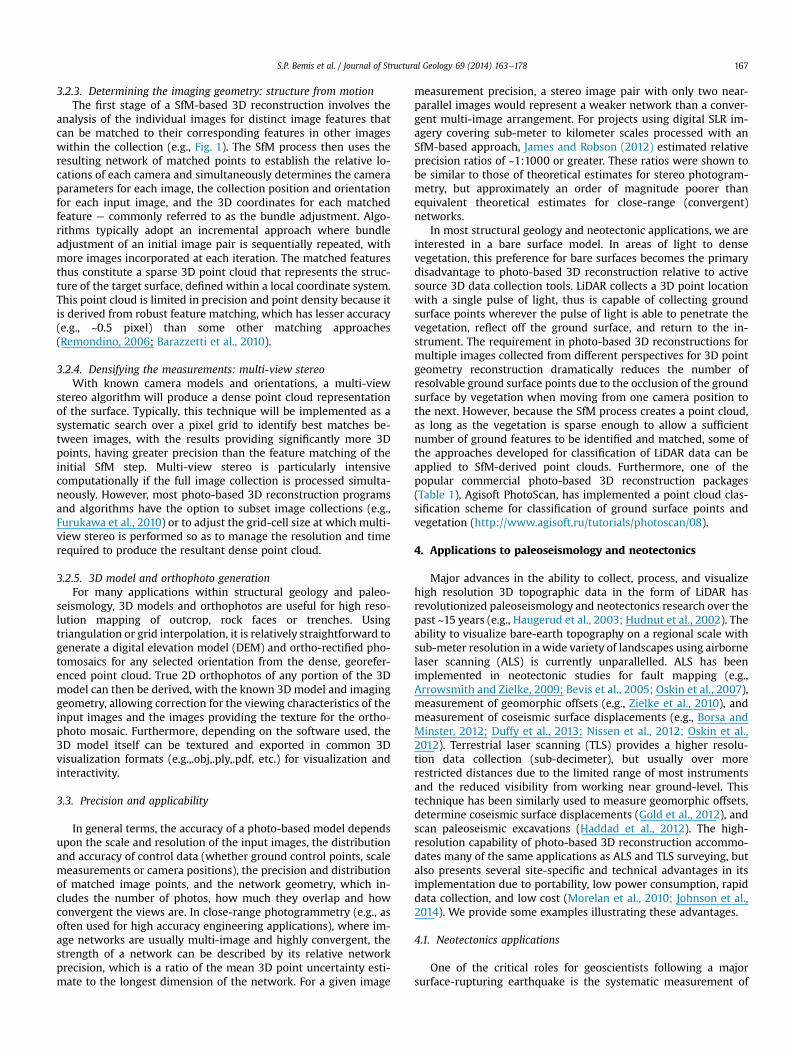
offset features along the length of the surface rupture. Even thoughthese measurements may underestimate total coseismic displace-ment due to distributed deformation off the main fault trace (Dolanand Haravitch, 2014), these offset measurements provide criticalinformation about the earthquake rupture and provide markers forassessment of post-seismic processes such as afterslip, which is theincreasing displacement that occurs after the primary earthquake.Althoughmany landforms that are used to record slip over multipleearthquake cycles are persistent in the landscape, most targets thatwould uniquely record the offset during a single earthquake aretransient features, including the fault scarp itself, broken and offsettrees, channel margins in active floodplains and, in the case of the2002 M7.9 Denali fault earthquake sequence, offset glacial cre-vasses (Fig. 4; Haeussler et al., 2004). Some of these features couldbe adequately documented with a post-earthquake ALS survey, butothers require site-by-site documentation because of the scale ofthe offset. Traditionally, field measurements are collected withstandard geologic field equipmente tapemeasures and compasses,but we propose that each coseismic offset be photographed for 3Dreconstruction so as to archive the offset feature and to facilitatefurther analysis, such as automated slip-vector calculation (Goldet al., 2012). Because coseismic offsets are a relative displacementmeasurement, georeferencing is not required but scale is critical.Scale is provided through introducing scale bars into the scene orphysically measuring and recording the distance between featureswithin the scene. The number of photographs required dependsupon the nature of the offset feature and the magnitude of theoffset, although a minimum of 18 photos should be considered to
Fig. 4. Examples of extremely short-lived geomorphic markers of coseismic fault displacemDenali fault in south-central Alaska. Tremendous effort was invested in capturing these offsbased 3D reconstruction techniques would not require more than a few extra minutes per sseparation of a fault scarp that is expressed as an offset glacier surface across the Susitna Glaa tree that was broken and offset across the Denali fault. (d) Peter Haeussler attempts toimmediately after the earthquake in November 2002 increased to 6.6 m by July 2003 (Hae(http://earthquake.usgs.gov/earthquakes/eqinthenews/2002/uslbbl/photos/pr071102/).
capture the offset feature from all directions (360� with 20� rota-tion between individual photographs) and additional photographsfrom higher and lower perspectives will reduce shadowing andimprove the model geometry. Fig. 5 shows an example of a photo-based 3D reconstruction for an ephemeral stream channel offset6.6 m during the 1857 Fort Tejon earthquake on the San Andreasfault (a fully interactive 3D model of this offset is provided in theSupplemental Materials). The figure illustrates both the digitalelevation model fromwhich morphological and displacement datacan be extracted, and the fully textured model that preserves anatural visual depiction of the site. With simple scaling re-quirements and rapid photograph collection, the additional workrequired for photo-based 3D reconstructions of individual coseis-mic offset measurements is nominal and will add to the robustnessof the overall coseismic slip distribution dataset. Furthermore, asobserved following the 2014 M6.0 Napa, California, earthquake,afterslip processes contributed to increasing surface displacementsduring the days following the earthquake (Brooks, 2014). The easeof collecting data for photo-based 3D reconstruction of individualoffsets could accommodate high spatial and temporal resolutionmonitoring of afterslip following future earthquakes.
In regions of sparse vegetation, photo-based 3D reconstructionsfrom aerial platforms can produce topographic surface models withcomparable accuracy to ALS surveys (e.g., Fonstad et al., 2013;James and Robson, 2012; Johnson et al., 2014; Westoby et al.,2012). Although spatial coverage of ALS-derived topographic datais expanding, the availability is concentrated in relatively fewcountries and regions. Therefore, in regions where ALS-derived
ent from the November 3rd, 2002, M7.9 Denali fault earthquake sequence in on theets, many of which disappeared by the following summer. Image collection for photo-ite and preserve a richer record of the fault offset. (a) Patty Burns measures the verticalcier fault. (b) A 5.5 m offset of an active stream bank. (c) Measuring the displacement ofmeasure the displacement of a glacial crevasse. The 5.5 m offset documented in (b)ussler et al., 2004). Photos (a), (b), and (d) are courtesy of the U.S. Geological Survey

Fig. 5. Offset channel on the Carrizo Plain, California, from the 1857 Fort Tejon earthquake on the San Andreas fault. Photos were collected with a GoPro camera mounted on a longpole and held overhead. This model is derived from 56 photos with (a) showing an oblique view of the resulting shaded relief surface model and (b) showing the identical obliqueview with the mosaicked image texture. This is channel offset ZA10543 from Zielke et al. (2010) who documented an offset of 6.6 m (þ0.5/�1.0). Black arrows illustrate the offset ofthe channel thalweg and point in the downstream direction. View is looking north. The 3D model these images are derived from is provided as a 3D PDF in the SupplementaryMaterial.
Fig. 6. Example of photomosaic production within Agisoft PhotoScan. Blue rectangleswith black normal vectors (labelled with the image file name) represent the camerapositions and orientations determined from the SfM process. The background image isthe orthorectified photomosaic that was exported to create Fig. 7.
S.P. Bemis et al. / Journal of Structural Geology 69 (2014) 163e178 169
topographic data is not available, photo-based 3D reconstructiontechniques can accommodate many of the innovative neotectonicanalyses being performed with ALS-derived topography (e.g., Akçizet al., 2010; Hilley et al., 2010; Nissen et al., 2012). Evenwhere ALS-or TLS-derived topographic data already exist, photo-based 3Dreconstruction techniques can add to the temporal dimension ofthe topographic data by enabling more frequent surveys whenrepeat ALS or TLS surveys would be cost-prohibitive or logisticallydifficult. Analyses of pre- and post-earthquake ALS topographicdata for synthetic earthquakes (Borsa andMinster, 2012) and actualearthquake ruptures (Duffy et al., 2013; Nissen et al., 2012; Oskinet al., 2012) demonstrate the ability to extract 3D displacementsfrom high-resolution topography, and Krishnan et al. (2012) pre-sent methods for registration of photo-based reconstruction sur-face models with ALS topography to enable similar analyses withdata derived from different methods.
4.2. Photo-based 3D reconstruction in paleoseismic investigations
A fundamental product of any paleoseismic investigation is arepresentation of the exposed stratigraphy and faulting e essen-tially producing a geologic map (the so-called “trench log”) of theexposure. Early methods for producing the trench log relied uponsurveying or measurement from a reference grid to points alongcontacts and faults and transferring this information onto a sheet ofgraph paper (McCalpin, 2009). To complete the logs in the field,lines are visually interpolated on the log between measured points,and characteristics of mapped units sketched in and described. Toincrease the information contained and communicated by a trenchlog, many paleoseismologists produce photomosaics for the expo-sure, map directly onto these photos in the field, and create finalpublication-quality logs. Using photographs as a base map capturesthe rich tonal and textural information, but the traditionalapproach to photomosaic production required time-intensive ad-hoc rectification of individual photos. This rectification processrequires having a complete system of measured grid lines estab-lished on the trench walls at a scale that allows individual photos tocapture ideally all four margins of a grid rectangle. The rectificationis performed by manually warping and distorting the image torestore the reference grid lines within the photos to vertical andhorizontal, and then these individual photos are cropped andassembled into the photomosaic. This manual rectification andmosaicking process is hindered by holes in the trench wall, clastsand other features that protrude from the wall, and places wherethe reference grid is not flush with the trench wall surface. Because
these photos are often taken at close range with wide angle cameralenses, surface irregularities on the margins of the photo areparticularly problematic, potentially introducing positional errorsof several cm or more during manual rectification and obscuringstratigraphic relationships. The resulting photomosaic then re-quires adjustment of tonal and lightness characteristics foradjoining photos to provide even colour and contrast across the fullphotomosaic.
This complex and time-consuming approach to constructing 2Dphotomosaics for paleoseismology can be largely circumventedthrough photo-based 3D reconstruction techniques. A properlyplanned collection of photographs from a trench wall will facilitatethe full 3D reconstruction of the topography of that surface, whichin turn accommodates the precise and automated orthor-ectification of the input photographs. For a planar trench wall, wehave achieved consistently high-quality results by taking photo-graphs in a similar fashion as traditional photomosaics, butincreasing photograph overlap so that ~3 times more photos arecollected (Fig. 6). In this case, rather than just photographing eachmeasured grid cell, the image coverage is increased by collecting anintermediate photograph centered on the gridlines between eachgrid cell e horizontally and vertically. This approach includes tak-ing additional photos of the trench margins recognizing that thesemarginal photos will only partially cover portions of the trenchwall. Most photographs should be taken orthogonal to the wall to
S.P. Bemis et al. / Journal of Structural Geology 69 (2014) 163e178170
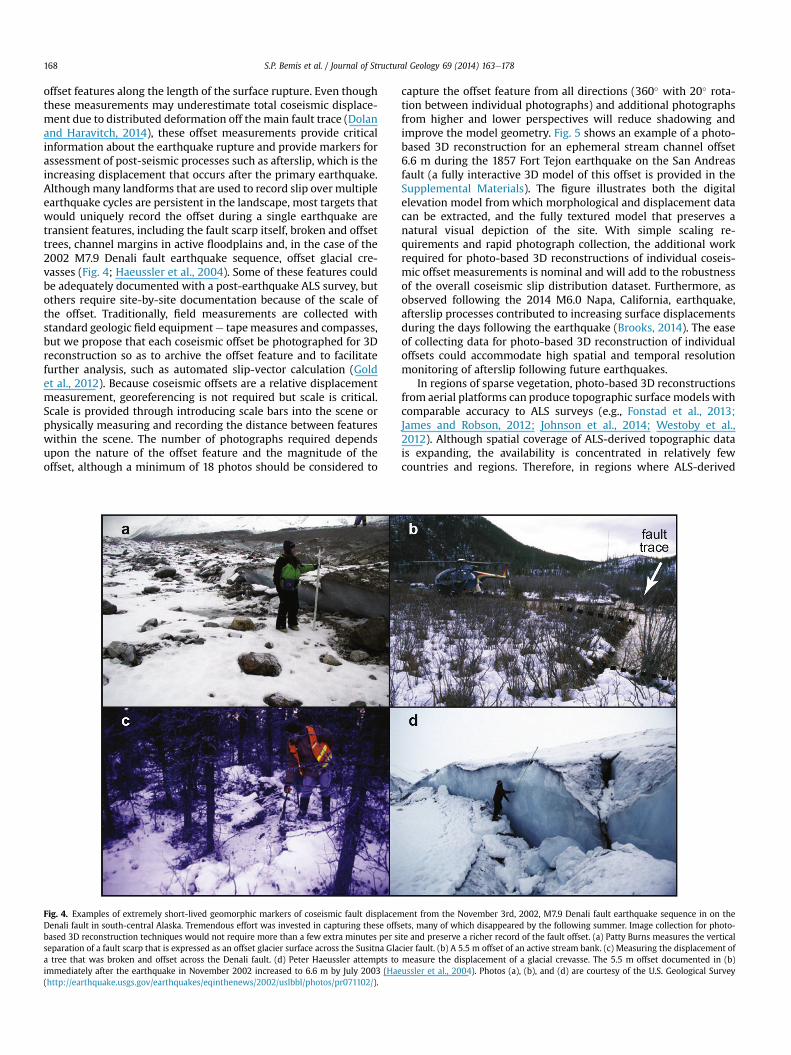
ensure that complete wall coverage by photographs is attained andto provide a systematic angular change between overlappingphotographs. Additionally, a few photographs should be collectedoblique to the trench wall to reduce possible error from broad-scalewarping of the reconstructed surface (e.g., James and Robson,2014). An example of a photomosaic produced by this process isshown in Fig. 7 (with the source 3D model provided inSupplementary Materials) for a paleoseismic trench at a newpaleoseismic site on the Mojave section of the southern SanAndreas fault near Elizabeth Lake, California. For this photo-basedreconstruction, we collected 191 photographs with a Tokina11e16 mm f/2.8 AT-X 116 Pro DX lens on a Nikon D7000 DSLR overthe span of 29 min, covering one wall of the 17 m long, up to 4 mdeep, and ~1 mwide trench following the photo spacing illustratedin Fig. 6. We imported this image collection into Agisoft PhotoScanand used the masking tools to hide non-stationary objects andfeatures that lie in the distant background outside of the trenchwall. The 3D reconstruction of these photographs took ~1 h totalusing low resolution processing settings on a desktop computerwith a 2.8 GHz processor and 12 GB RAM. Lower resolution pro-cessing may reduce the resolution of the 3D reconstruction of thewall surface but does not impact the resolution of an outputphotomosaic. The output photomosaic resolution is controlled bythe quality of the input photographs and resolution parameters setat the time of export. However, lower resolution processing mayimpact the accuracy of the photomosaic on the scale of several mmif the resolution of the trench wall surface model is insufficient forproper orthorectification of input images. Some photo-based 3Dreconstruction software packages perform automatic colour andcontrast matching across the mosaicked images to produce anorthomosaic with consistent tone and colour spectrum. In ourexperience, we find this capability has the relatively minor disad-vantage of reducing overall contrast, and possibly clipping or flat-tening portions of the colour spectrum. This disadvantage is faroutweighed by the ability to manually enhance contrast, colour,saturation, etc. evenly across the entire photomosaic withouthaving to perform these adjustments individually for photos withinthe photomosaic.
Producing a 2D photomosaic from more complex trench-wallconfigurations simply requires strategic photograph collection toensure capture of the full range of angles required to prevent oc-clusion of portions of the trench wall. A particular example may bepaleoseismic trenches that are constructed of benched walls due totheir depth or unstable substrate, such that vertical faces are up to~1.5 m tall and separated by a bench to the set-back higher wall
Fig. 7. Orthorectified photomosaic created with photo-based 3D reconstruction techniques uorthomosaic production except for rotation and downsampling. The even tone and contrast adetailed mapping in the field and more completely preserves these characteristics for archivLake paleoseismic site on the Mojave section of the southern San Andreas fault, California (vThe 3D model this image is derived from is provided as a 3D PDF in the Supplementary M
face. Nonetheless, in one instance, we were able to revisit photo-graphs collected in 2006 from a paleoseismic investigation on thesouthern San Andreas fault near Coachella, California, that utilizeda 7 m deep trench with benched walls to expose a section ofalternating lacustrine and aeolian deposits spanning the past ~1000years (Philibosian et al., 2009). Using just 15 photographs takenfrom the opposite side of the trench, we rapidly reconstructed thegeometry of a portion of the benched trench wall in 3D (Fig. 8a;Supplementary Material). Although mapping the stratigraphy hashistorically been done on a 2D representation of the trench wall,compiling this mapping onto the 3D reconstruction provides amore complete model for fault geometry and along-strike (cross-trench) variation.
In addition to the trench wall orthophotos, establishing the full3D geometry of a trench facilitates robust structural and strati-graphic analysis while avoiding the time-consuming process ofsurveying each fault and stratigraphic contact. Fig. 8 shows twoexamples where we used a relatively small collection of photo-graphs to reconstruct the geometry of an entire trench or complextrench wall (Fully interactive 3D models provided inSupplementary Material). A small reconnaissance trench (3 m long,1.5 m deep, and ~1 m wide) on the Denali fault, near Cantwell,Alaska, was fully captured by 13 photographs taken while standingon the ground surface outside the trench (Fig. 8b). The trench ge-ometry was properly reconstructed in 3D from this small, highlyoblique, photograph collection. Additional photographs takenorthogonal to the walls would improve resolution of the stratig-raphy but are not critical for reconstructing trench geometry.Although detailed surveying of contacts and gridlines are notnecessary when photo-based 3D reconstructions are utilized, wesuggest that all paleoseismic studies should utilize high-precisionsurveying instruments (e.g., total station or differential GPS) tolocate the 3D model in real world coordinates and provide preciserelative positioning between successive excavations and for futureexaminations of the site.
An advantage for structural studies in paleoseismology vs. hard-rock structural geology is the ability in many paleoseismic studiesto easily modify the target exposure. If faulting and/or stratigraphicrelationships are not clear in an exposure, the trenchwall can be cutback to expose a new viewwith the hope that the relationships willbecome clearer. Furthermore, this strategy can be implemented in aprogressive fashion where the trench wall is cut back incremen-tally, with structure and stratigraphy documented on each freshface for tracking changes in fault geometry and stratigraphic re-lationships in the 3rd dimension. Unfortunately this destructive
tilizing Agisoft Photoscan. No additional image adjustments were performed followingcross the photomosaic along with the accurate spatial geometry improves the quality ofing and publication. This image is the east wall of one of the trenches at the Elizabethiew is looking to the southeast). The black box shows the area of photomosaic in Fig. 6.aterial.

Fig. 8. Examples of geometric reconstructions from small collections of overview photographs. (a) oblique views of a section of an ~7 m tall, benched trench wall across thesouthern San Andreas fault near Coachella, California. Blue rectangles and black vectors indicate the position and orientation of the photographs used to build this model. Althoughthese photos were not collected with photogrammetry in mind, there was sufficient overlap to reconstruct a detailed 3D model. Reed Burgette kneeling on the bottom bench forscale. (b) A small (3 m wide, 1.5 m deep, 1 m wide) reconnaissance trench across the Denali fault near Cantwell, Alaska. As illustrated, this model was reconstructed from just 13pictures taken from above the trench, but even with this highly oblique photography, the stratigraphy near the base of the trench resolves well. In particular, note how thestratigraphy drapes over the boulder protruding from the trench wall. The 3D model these images are derived from is provided as a 3D PDF in the Supplementary Material.
S.P. Bemis et al. / Journal of Structural Geology 69 (2014) 163e178 171
technique obliterates the original stratigraphy and prevents the re-examination of the stratigraphic record in the field. An importantpositive outcome is that the photo-based 3D reconstruction pro-vides a solution for rapid and complete archival documentation ofeach face created during a progressive excavation. After the face iscut, cleaned, and prepared, the face is photographed with eitherfixed reference points outside the zone of excavation or referencepoints that are surveyed on each face. The faces are then recon-structed individually and compiled into a 3Dmodel that records theremoved stratigraphy. This 3D model enables the detailed inter-pretation of the 3D geometry of faults and stratigraphic horizons, aswell as preserving the original tonal and textural information forfuture investigations. A 3D archive of recent stratigraphy andstructure may prove to be a powerful tool for researchers of othergeologic subdisciplines or for paleoseismologists to re-interpret asite using new insights that develop during later research.
5. Applications to structural geology
5.1. High-resolution mapping using UAV surveys
High-resolution fault, vein and fracture maps are routinelycreated in structural geology to constrain, amongst other things,the nucleation, growth, mechanics and scaling properties of frac-tures (e.g. Shipton and Cowie, 2001; Wilson et al., 2009; Nixonet al., 2011) and the permeability characteristics and sealing capa-bilities of fault systems (e.g., Willemse et al., 1997; Peacock et al.,1998; Antonellini et al., 2008). Combinations of grid mapping, in-terpretations from overlapping outcrop photographs, aerial pho-tographs and detailed sketches are employed. More recently, digitaltechniques such as terrestrial LiDAR scans are increasingly used,linked to satellite imagery and field observations (e.g., Pringle et al.,2006; Wilson et al., 2009).
Conventional, high-resolution grid-mapping techniques sufferfrom time constraints and are either impractical to collect data atcm-scale resolutions over significant areas or take weeks to ach-ieve. The results are also limited because the final product remainsa map interpretation that can only be verified by further visits tothe study site. Photogrammetric datasets derived from UAV plat-forms (Fig. 9) offer a cost-effective, ultra-high resolution alternativewith a rapid acquisition time. They have the added advantage ofproviding access to vertical or unstable exposures, while deliveringvisual data in digital form that can be shared and reanalysedwithout need to revisit the outcrop.
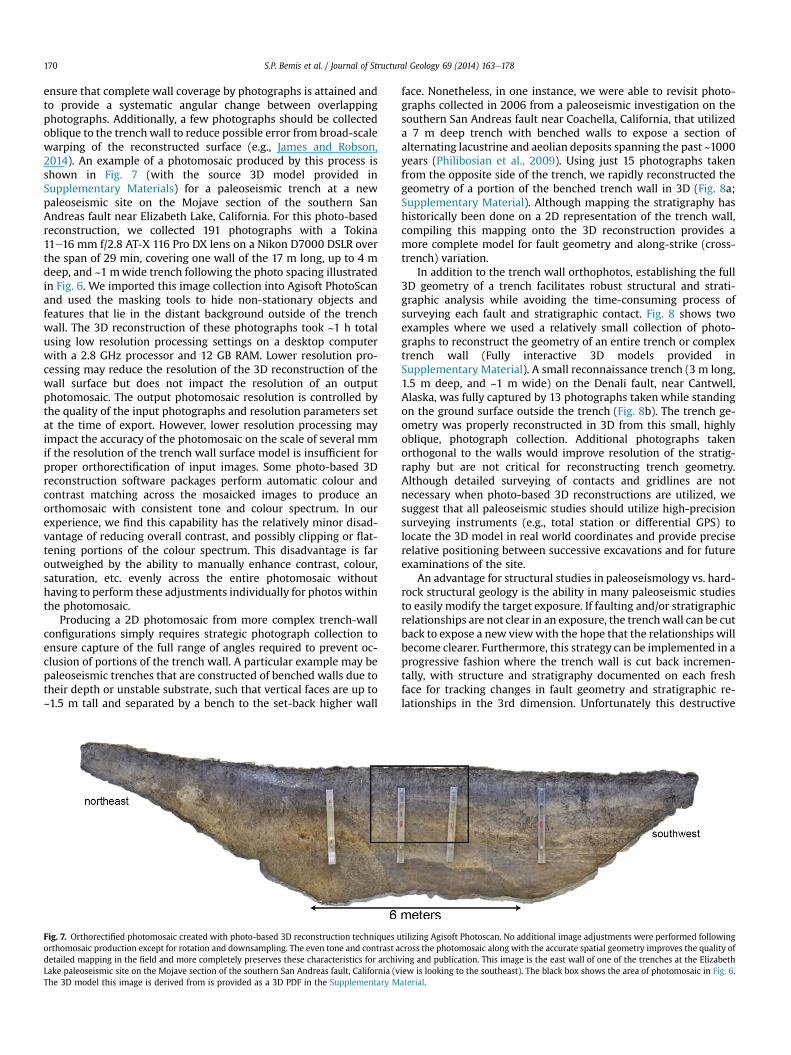
Fig. 10 is a rendering and interpretation of coastal outcrop fromPiccaninny Point on the northeast coast of Tasmania, Australia,which exposes a spectacular series of strike-slip faults. These faultscomprise a damage zone of intersecting structures, crosscutting asubvertical succession of metasedimentary sandstones and silt-stones, belonging to the Mathinna Group (Banks, 1962; Gee andGroves, 1971; Groves et al., 1977). We deployed an eight-rotorOktokopter (Fig. 9) with a small format digital camera (Canon550D 15 Megapixel, DSLR with Canon EF-S 18e55 mm F/3.5-5.6 ISlens). An onboard, navigation grade GPS receiver is integrated witha Mikrokopter Flight Controller ME V2.0 and these permit anautonomous flight dictated by programmed waypoints. During thisparticular deployment, wind gusts reached speeds of 35 km/h,requiring manual control of the UAV. Nevertheless, the strong windconditions encountered demonstrated the robustness of the surveymethod. Approximately 140 outcrop photographs were collectedby the UAV. An area 100 � 100 m was covered in <5 min, at alti-tudes of 30e40 m, which produced high resolution imagery (1pixel z 10 mm). Even lower altitudes of 15e20 m allow sub-cmresolutions, although the advantage of this increase is counteredby larger photographic datasets and associated increases in data-processing time. In contrast, the best resolution available from

Fig. 9. (a) Oktokopter UAV undergoing a test flight. A DSLR is suspended on a gimbleand can be rotated in flight. (bec) SfM-derived point cloud of Piccaninny Point, viewedfrom the southeast and above, respectively. The outcrop is 100 m long in this scene. Awavecut rock platform is captured. Vegetation and a vehicle are present as noise.
S.P. Bemis et al. / Journal of Structural Geology 69 (2014) 163e178172
manned aircraft or satellites is typically 100e500 mm/pixel (e.g.Nixon et al., 2011).
As with the paleoseismic studies, the workflow that followedacquisition of the photographs began with manual selection of themost appropriate photos from the dataset. In this example, theimages were processed using the Bundler software (Snavely, 2010).Processing of the imagery was a semi-automated task, takingaround 6 h to complete on a high-end desktop computer. Initiallythe SIFTalgorithm (Lowe, 2004) is used to detect features across theimages, and these features are then matched between overlappingimages. Bundler then used these matching features to complete abundle adjustment and to align the images using an arbitrary co-ordinate system. An output file was generated that listed thecalculated position of each camera and each matched feature in theBundler arbitrary coordinate system. The result was a sparse pointcloud in which the x, y, z position of each matched feature is listedalong with its RGB colour from the original imagery. The pointcloud was densified by use of the Patch-based Multview Stereosoftware (PMVS2; Furukawa and Ponce, 2009) to produce a point
cloud containing many millions of points (Fig. 9bec). A real-worldcoordinate system was derived for the output using the directgeoreferencing technique described in Turner et al. (2012). Thedirect georeferencing technique links the timestamp of eachphotograph to both the GPS position logged onboard at the time ofexposure and elevation as provided by the OktoKopter's barometricaltimeter (accuracies of ± 1 m during UAV flight), which derivescamera coordinates for each photograph. These coordinates arethen matched to the computed (Bundler) coordinates to solve forthe Helmert transformation parameters (3 translations, 3 rotations,1 scale parameter). The derived transform is subsequently appliedto the sparse point cloud, resulting in thousands of real-world co-ordinates linked to points in each image and allowing the images tobe orthorectified using a Delaunay triangulation. Turner et al.(2012) report the absolute accuracy of the orthorectified imagesproduced from this method is typically < 400 mm. Using this directgeoreferencing technique, absolute accuracies are dominated bythe navigation grade GPS errors, estimation of the camera focallength and interior/exterior orientation parameters and imprecisesynchronization between the GPS receiver and camera (Turneret al., 2013). This series of steps is now largely implemented inoff-the-shelf software products such as Photoscan (Table 1).
Once georeferenced point cloud data are derived, obtainingrenderings is straightforward for direct use in structural geology,such as textured wireframe models, orthorectified photomosaicsand DEMs. For example, the Piccaninny Point data were convertedto these datasets and rapidly digitized in a GIS environment(Fig. 10), revealing a complex damage zone around an eroded faultcore (Buckley, 2013), which is the subject of ongoing research at TheUniversity of Western Australia. The high-resolution nature of theimagery, in combination with the intense layering of the outcrop,allowed fault offset directions to be detected (Fig. 10d) and dis-placementelength profiles to be calculated for each damage zonestructure. The pixel resolutions of 10 mm in the photomosaic and20 mm in the DEM allowed for offsets greater than ~20e50 mm tobe identified with certainty over the 10,000 m2 outcrop area.
In cases where absolute location or improved accuracies arerequired, real-world coordinates of Ground Control Points (GCPs)can be established within the scene (James and Robson, 2012;Turner et al., 2012). Typically, painted target markers are placedin the area and surveyed using dual frequency differential GPS(horizontal accuracies of 20 mm and vertical accuracies of 40 mm)or total station techniques (<10 mm accuracies). For such anoutcome, 10e15 markers placed throughout the area would besufficient. When scale alone is required, only control distancesacross the scene are required (James and Robson, 2012). Otherimportant considerations to minimise error include using a highquality pre-calibrated camera (i.e. DSLR) with fixed optics, collect-ing slightly convergent imagery (Wackrow and Chandler, 2011;James and Robson, 2014), and surveying the outcrop using flightlines from 2 orthogonal directions (P. Kovesi pers comm.). Recently,Turner et al. (2013) obtained large improvements to the absoluteaccuracy of the direct georeferencing technique with modificationsto the onboard GPS receiver, synchronization between the GPSreceiver and camera and corrections between the GPS antenna andcamera position. Absolute accuracies of 100e200 mm were ach-ieved (Turner et al., 2013). Similar improvements are only likely toaccelerate in the next few years, and the need for GCPs may well beeliminated in the near future at the point where direct georefer-encing techniques achieve similar accuracies to GCP studies con-strained by differential GPS. Nonetheless, GCPs will continue to beuseful where outcrop studies require ground-based verification orsub-cm accuracy (e.g. using total station surveys).
As a result of these developments, UAVs are likely to be acommonly utilized tool by structural geologists in the near-future.
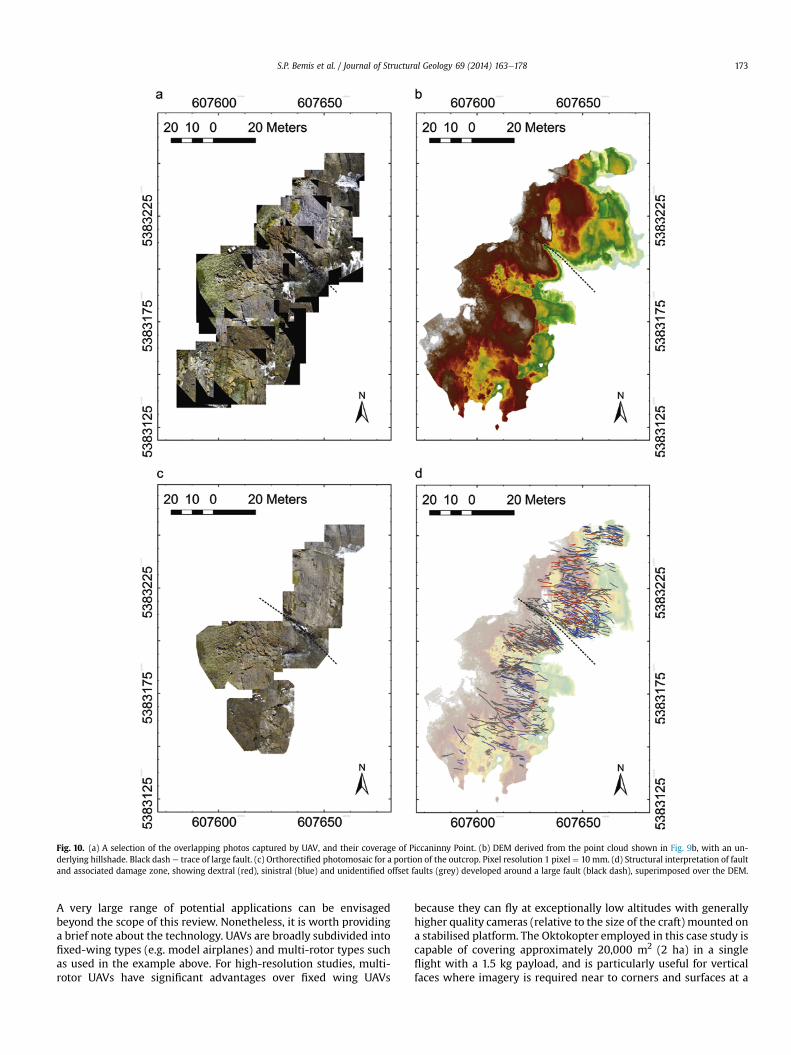
Fig. 10. (a) A selection of the overlapping photos captured by UAV, and their coverage of Piccaninny Point. (b) DEM derived from the point cloud shown in Fig. 9b, with an un-derlying hillshade. Black dash e trace of large fault. (c) Orthorectified photomosaic for a portion of the outcrop. Pixel resolution 1 pixel ¼ 10 mm. (d) Structural interpretation of faultand associated damage zone, showing dextral (red), sinistral (blue) and unidentified offset faults (grey) developed around a large fault (black dash), superimposed over the DEM.
S.P. Bemis et al. / Journal of Structural Geology 69 (2014) 163e178 173
A very large range of potential applications can be envisagedbeyond the scope of this review. Nonetheless, it is worth providinga brief note about the technology. UAVs are broadly subdivided intofixed-wing types (e.g. model airplanes) and multi-rotor types suchas used in the example above. For high-resolution studies, multi-rotor UAVs have significant advantages over fixed wing UAVs
because they can fly at exceptionally low altitudes with generallyhigher quality cameras (relative to the size of the craft) mounted ona stabilised platform. The Oktokopter employed in this case study iscapable of covering approximately 20,000 m2 (2 ha) in a singleflight with a 1.5 kg payload, and is particularly useful for verticalfaces where imagery is required near to corners and surfaces at a

Fig. 11. (a) High fidelity textured photogrammetric model of a hand specimen from theCape Liptrap Formation, Wilsons Promontory, Victoria, Australia. The front and rearfaces of the specimen show that 6 en-echelon sigmoidal veins link and develop into 3planar en-echelon veins. The top and lower thirds of the hand specimen have beendigitally removed. (b) Orthorectified photomosaic of the front face. Geological fabricsand geometries are reproduced in fine detail, with limited distortion in 2 spatiallyrestricted domains. (c) Photogrammetric model. The left-hand third of the model istextured, the other two-thirds reveal the underlying wireframe with such high reso-lution that individual triangular elements are not discernible. Pressure solution seams(red), calcite veins (green) and calcite vein fibre trajectories (white) were mapped in3D using the open-source Blender graphics environment. The 3D model these imagesare derived from is provided as a 3D PDF in the Supplementary Material.
S.P. Bemis et al. / Journal of Structural Geology 69 (2014) 163e178174
range of angles. On the other hand, fixed wing UAVs cover far largerareas of ground in a smaller timeframe, and are less power hungry.The main restrictions on the use of UAVs are from national regu-latory frameworks, which vary widely from country to country. InAustralia for example, UAV use is governed by the Civil AviationSafety Authority (CASA; http://www.casa.gov.au/), which stipulatesthat research use of UAVs requires controller's and operators cer-tification to fly. This certification requires general aviation knowl-edge in line with a pilot's licence. The UAV can fly no more than120 m above ground unless special approval is provided, mustremain within line-of-sight, and must be flown over unpopulatedareas and outside controlled airspace.
5.2. Ground-based outcrop and open pit surveys
With the advent of SfM and its implementation in off-the-shelfproducts (Table 1), photogrammetry is now an ideal tool forground-based structural studies because it generates digital 3Dmodels of natural outcrop, quarries/mine sites and hand specimens(Fig. 11; Supplementary Material). Rock textures and fabrics can beproduced with high fidelity, using processing and visualizationtools such as Agisoft Photoscan™, which perform well in both theground-based studies discussed here and UAV-based studies(Turner et al., 2013). Photo-based models also compare favourablywith laser scanning techniques when used to identify joints, dis-continuities and orientations (e.g. Coggan et al., 2007), possiblybecause photogrammetric data points inherently contain colour aswell as location and it is easier to derive information on surfacesfrom multiple orientations using a hand-held DSLR rather than atripod-mounted scanner. It should be noted that laser-scanningtechniques are advancing as rapidly as photogrammetry so that anumber of these issues are now avoided (Hodgetts, 2013).
The vein array shown in Fig. 11 is a photo-based model of an en-echelon sigmoidal vein array, which changes into planar en-echelon veins on the alternate side of the hand specimen(Fig. 11a). In this example, an ultra-high resolution model wasrequired and 100 photographs were collected under diffuse light,using a 100 mm fixed focal length lens and Canon EOS-5 mark IIIDSLR. Several different models were generated from the datasetand it was found models with the best texture actually used lessthan the full complement of 100 photographs. Fig. 11 was con-structed from 51 photographs, which generated a densified pointcloud of 2,442,780 points and a wireframe with 493,195 elements.The model was processed in ~4 h on a laptop with Intel i7 CPU and8 Gb RAM.
The model faithfully reproduces the trajectories of individualcalcite vein fibres, sets of parallel, closely spaced microveins andpressure solution seams, with only minor distortion present in theorthorectified photomosaic of the front face (Fig. 11b). Photo-grammetric datasets such as these are being used to refine ourexisting kinematic and mechanical models for vein formation (e.g.Beach, 1975; Olson and Pollard, 1991; Bons et al., 2012). As with theUAV-based models of Piccaninny Point, hand specimens and out-crops derived from ground-based studies can be georeferenced andconverted to DEM and orthorectified photomosaics for mappingand analysis in a GIS environment. In addition, the open source 3D-graphics package Blender (www.blender.org), allows true 3Dmapping to be carried out and projected onto the surface of thephoto-based reconstruction (Fig. 11c). Spatial informationdescribing vein geometry and the orientation of features such asvein surfaces or internal crystal fibres can be extracted. Given theimagery, we have since been able to generate super high-resolutionmodels of individual veins and their fibres using overlapping im-ages captured through bifocal microscopes.
S.P. Bemis et al. / Journal of Structural Geology 69 (2014) 163e178 175
For lower resolution models, the same sample was digitallyreproduced using just 30 photographs, captured by a compactCanon S95 digital camera (i.e., not a DSLR). The photos were pro-cessed in <1 h on a laptop, and even in this case, individual calcitefibres are visible. As such, the application of photogrammetry forpedagogical purposes is self-evident, because it is now being rela-tively easy to build a virtual library of useful hand specimens.Furthermore, these models may be printed in 3D using inexpensiveweb-based providers (e.g. http://www.shapeways.com/), whichallows precious or fragile samples to be reproduced for lab-basedexercises.
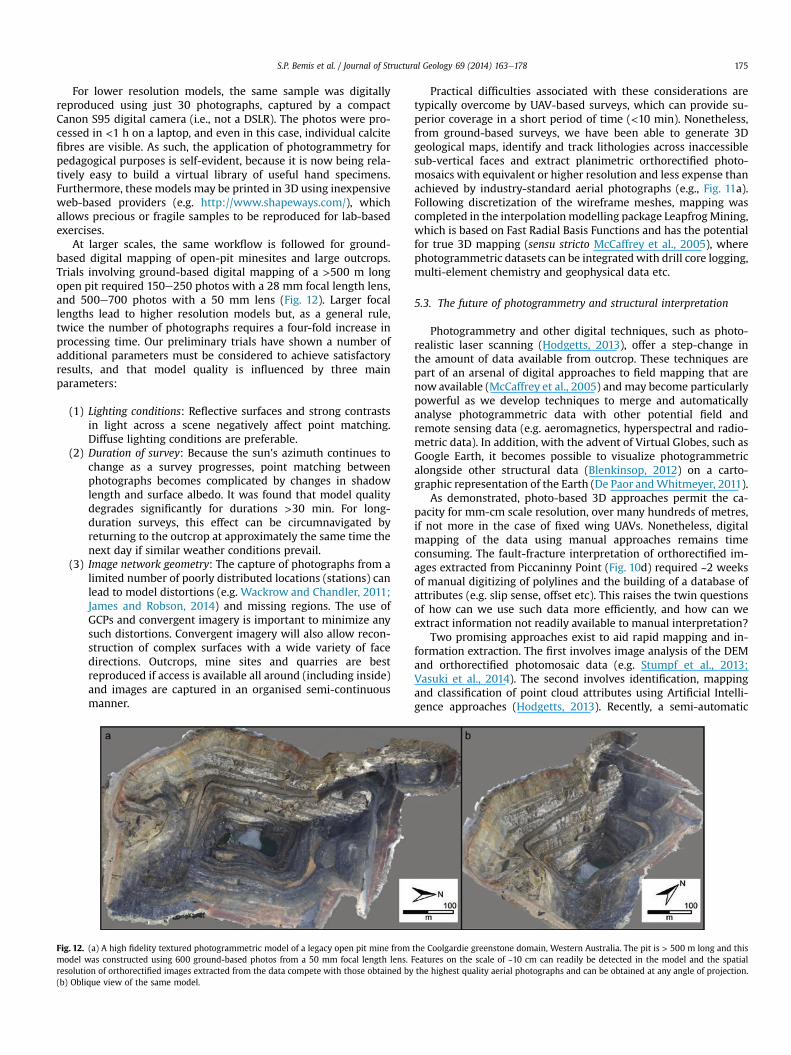
At larger scales, the same workflow is followed for ground-based digital mapping of open-pit minesites and large outcrops.Trials involving ground-based digital mapping of a >500 m longopen pit required 150e250 photos with a 28 mm focal length lens,and 500e700 photos with a 50 mm lens (Fig. 12). Larger focallengths lead to higher resolution models but, as a general rule,twice the number of photographs requires a four-fold increase inprocessing time. Our preliminary trials have shown a number ofadditional parameters must be considered to achieve satisfactoryresults, and that model quality is influenced by three mainparameters:
(1) Lighting conditions: Reflective surfaces and strong contrastsin light across a scene negatively affect point matching.Diffuse lighting conditions are preferable.
(2) Duration of survey: Because the sun's azimuth continues tochange as a survey progresses, point matching betweenphotographs becomes complicated by changes in shadowlength and surface albedo. It was found that model qualitydegrades significantly for durations >30 min. For long-duration surveys, this effect can be circumnavigated byreturning to the outcrop at approximately the same time thenext day if similar weather conditions prevail.
(3) Image network geometry: The capture of photographs from alimited number of poorly distributed locations (stations) canlead to model distortions (e.g. Wackrow and Chandler, 2011;James and Robson, 2014) and missing regions. The use ofGCPs and convergent imagery is important to minimize anysuch distortions. Convergent imagery will also allow recon-struction of complex surfaces with a wide variety of facedirections. Outcrops, mine sites and quarries are bestreproduced if access is available all around (including inside)and images are captured in an organised semi-continuousmanner.
Fig. 12. (a) A high fidelity textured photogrammetric model of a legacy open pit mine frommodel was constructed using 600 ground-based photos from a 50 mm focal length lens. Fresolution of orthorectified images extracted from the data compete with those obtained by(b) Oblique view of the same model.
Practical difficulties associated with these considerations aretypically overcome by UAV-based surveys, which can provide su-perior coverage in a short period of time (<10 min). Nonetheless,from ground-based surveys, we have been able to generate 3Dgeological maps, identify and track lithologies across inaccessiblesub-vertical faces and extract planimetric orthorectified photo-mosaics with equivalent or higher resolution and less expense thanachieved by industry-standard aerial photographs (e.g., Fig. 11a).Following discretization of the wireframe meshes, mapping wascompleted in the interpolationmodelling package LeapfrogMining,which is based on Fast Radial Basis Functions and has the potentialfor true 3D mapping (sensu stricto McCaffrey et al., 2005), wherephotogrammetric datasets can be integrated with drill core logging,multi-element chemistry and geophysical data etc.
5.3. The future of photogrammetry and structural interpretation
Photogrammetry and other digital techniques, such as photo-realistic laser scanning (Hodgetts, 2013), offer a step-change inthe amount of data available from outcrop. These techniques arepart of an arsenal of digital approaches to field mapping that arenow available (McCaffrey et al., 2005) and may become particularlypowerful as we develop techniques to merge and automaticallyanalyse photogrammetric data with other potential field andremote sensing data (e.g. aeromagnetics, hyperspectral and radio-metric data). In addition, with the advent of Virtual Globes, such asGoogle Earth, it becomes possible to visualize photogrammetricalongside other structural data (Blenkinsop, 2012) on a carto-graphic representation of the Earth (De Paor andWhitmeyer, 2011).
As demonstrated, photo-based 3D approaches permit the ca-pacity for mm-cm scale resolution, over many hundreds of metres,if not more in the case of fixed wing UAVs. Nonetheless, digitalmapping of the data using manual approaches remains timeconsuming. The fault-fracture interpretation of orthorectified im-ages extracted from Piccaninny Point (Fig. 10d) required ~2 weeksof manual digitizing of polylines and the building of a database ofattributes (e.g. slip sense, offset etc). This raises the twin questionsof how can we use such data more efficiently, and how can weextract information not readily available to manual interpretation?
Two promising approaches exist to aid rapid mapping and in-formation extraction. The first involves image analysis of the DEMand orthorectified photomosaic data (e.g. Stumpf et al., 2013;Vasuki et al., 2014). The second involves identification, mappingand classification of point cloud attributes using Artificial Intelli-gence approaches (Hodgetts, 2013). Recently, a semi-automatic
the Coolgardie greenstone domain, Western Australia. The pit is > 500 m long and thiseatures on the scale of ~10 cm can readily be detected in the model and the spatialthe highest quality aerial photographs and can be obtained at any angle of projection.

Fig. 13. (a) A sketch map of the approximate locations of faults in an orthorectifiedimage, using a limited number of clicks (approximately 10 min interpretation). (b) Asemi-automatic fault map constructed by matching the user defined approximate faultlocations with automatically detected edges, to construct realistic fault geometry,segmentation and lengths. (c) Comparison between the semi-automatic fault map anda manually digitized map derived in a standard GIS-environment. Dark blue e semi-automatically identified discontinuities; red e manually digitized faults; light blue e
manually digitized joints; green e manually digitized extension fractures. The semi-automatically mapped faults have the same geometry and approximate lengths asthe manually digitized counterparts, without false positives. Finer detail would havebeen possible with slightly longer user interaction.
S.P. Bemis et al. / Journal of Structural Geology 69 (2014) 163e178176
method for the rapid mapping of discontinuities like faults wasdeveloped using phase congruency and phase symmetry as edgedetection methods (Micklethwaite et al., 2012; Vasuki et al., 2013,2014) and user interaction to guide the process. Fig. 13 showsstages in the process and a comparison with a manually digitizedfault map. A user rapidly defines the broad location and length offaults in the outcrop (Fig. 13a), then edges detected in the data areused to construct the true geometry of the faults (Fig. 13bec). In theexample shown, the user-guided interpretation was completed in10 min, while manual digitizing took approximately 7 h, repre-senting a significant increase in efficiency when interpreting thedata. In a later stage (not shown), the detected fault traces werecombined with the point cloud data to extract orientation datasystematically along the faults (Vasuki et al., 2014) using theRANSAC algorithm (Fischler and Bolles, 1981) to best-fit planesthrough points lying along the fault. Simple triangulation or tensoranalysis approaches can also be used to identify surface orienta-tions of faults, fractures or bedding surfaces (Feng et al., 2001;Fern�andez, 2005).
Secondly, as highlighted by Hodgetts (2013 and referencestherein) analysis of the attributes of point cloud data can emphasisepatterns and textures not obvious at first inspection. Artificial In-telligence approaches such as Neural Networks, Fuzzy Logic andEvolutionary Algorithms allow the automatic classification of pointcloud data, aiding the identification of varying stratigraphy (vanLanen et al., 2009; Rarity et al., 2013) or the extraction andupscaling of fault and fracture populations (e.g. Gillespie et al.,2010; Seers and Hodgetts, 2013), especially when combined withfield observations. The approach is implemented in Virtual RealityGeological Studio (VRGS; developed in-house at the University ofManchester), and has been applied mostly to laser scan data(Hodgetts, 2013) but is directly applicable to photogrammetricpoint clouds.
6. Discussion and conclusions
With a variety of software implementations of photo-based 3Dreconstruction, including open-source options (Table 1), thesetechniques represent the ‘democratization’ of high-resolution 3Dgeospatial data collection by making the collection of these dataavailable to anyone with a computer and a digital camera.
� Photo-based 3D reconstruction techniques have a broad spec-trum of applications in structural geology and neotectonics dueto the ability to collect vast quantities of high-resolution 3Dgeospatial data across multiple spatial scales. The limitedinfrastructure requirements that increase portability anddecrease cost may allow photo-based 3D reconstruction tech-niques to supersede other common high-resolution surfacemodeling techniques in many research settings. Photo-based 3Dreconstruction provides an opportunity for archiving andsharing of high fidelity imagery and 3D geometry from criticalrock exposures and sediments. It is made particularly powerfulbecause of its ability to easily collect data from inaccessible orunsafe exposures, or to record a time series of data such as whenpaleoseismic trenches are successively cut back.
� Resolution and accuracy during 3D reconstruction is dependentupon a number of parameters. Nonetheless, it is relativelystraightforward to design a survey and processing routine thatsuits the resolution needs of the project. The relative precisionratio described by James and Robson (2012) is a useful guidewhen designing a data collection routine by illustrating theexpected order of measurement precision relative to theobservation distance based upon observed capabilities of photo-based 3D reconstruction software. For example, with this ratio
S.P. Bemis et al. / Journal of Structural Geology 69 (2014) 163e178 177
generally exceeding 1:1000 (James and Robson, 2012), a studythat requires mm-scale precision will require photographs to becollected within several meters of the target in addition to therequirements for well-distributed camera positions and groundcontrol.
� Future directions in structural geology and paleoseismologyusing photo-based 3D reconstruction derive from the richdataset that includes complete tonal and textural informationcombined with a high-resolution 3D model. Novel image anal-ysis methods are becoming available to rapidly generate mapsfrom the large geospatial datasets, without spending days toweeks manually digitizing (e.g. Vasuki et al., 2014). Further-more, Artificial Intelligence-type algorithms provide new waysto extract meaningful sedimentological and stratigraphic pa-rameters from exposures using the combined 3D geometry andimage information (Hodgetts, 2013).�Finally, photo-based 3D models offer the ability to build virtualarchives of geoscientific data with relatively low cost or exper-tise required. In the realm of the communication of scientificresults in Structural Geology and Paleoseismology, this abilityought to lead to the development of electronic archives of crit-ical outcrop or hand-specimen observations to accompanypublications. Such a process would be analogous to electroniclab-books common to the biosciences. Secondly, there areobvious pedagogical applications. Many students find difficultyin visualizing the 3D nature of geological features when theseare shown as standard photographs. 3D models of outcrops andhand specimens, which can be manipulated individually bystudents, would help to overcome this hurdle in visualizationand learning. Rather than replacing field trips, these interactivemodels could allow students to revisit key exposures as newconcepts are discussed in order to layer the concepts and rein-force the connections between the concepts and real worldexamples.
Acknowledgements
Cees Passchier is thanked for his ideas and encouragement tosubmit this paper. David Hodgetts hosted and introduced SM toVRGS and its application for photogrammetric data. Tom Blenkin-sop and an anonymous reviewer are thanked for reviews thatcontributed to the clarity of the paper. Southern California Earth-quake Center award #13136 to SB supported the work at ElizabethLake, CA, presented here. SM was supported by the Hammond-Nisbet Endowment during this work.
Appendix A. Supplementary data
Supplementary data related to this article can be found at http://dx.doi.org/10.1016/j.jsg.2014.10.007.
References
Abdullah, Q., Bethel, J., Hussain, M., Munjy, R., 2013. Photogrammetric project andmission planning. In: McGlone, J.C. (Ed.), Manual of Photogrammetry. AmericanSociety for Photogrammetry and Remote Sensing, pp. 1187e1220.
Akçiz, S.O., Ludwig, L.G., Arrowsmith, J.R., Zielke, O., 2010. Century-long averagetime intervals between earthquake ruptures of the San Andreas fault in theCarrizo Plain, California. Geology 38, 787e790. http://dx.doi.org/10.1130/G30995.1.
Antonellini, M., Tondi, E., Agosta, F., Aydin, A., Cello, G., 2008. Failure modes in deep-water carbonates and the impact for fault development: Majella Mountain,Central Apennines, Italy. Mar. Pet. Geol. 25, 1074e1096.
Arrowsmith, J.R., Zielke, O., 2009. Tectonic geomorphology of the San Andreas faultzone from high resolution topography: an example from the cholame segment.Geomorphology 113, 70e81. http://dx.doi.org/10.1016/j.geomorph.2009.01.002.
Banks, M.R., 1962. The Silurian and Devonian systems. J. Geol. Soc. Aust. 9, 177e188.
Barazzetti, L., Remondino, F., Scaioni, M., 2010. Automation in 3D Reconstruction:Results on Different Kinds of Close-Range Blocks. IAPRS&SIS.
Beach, A., 1975. The geometry of en-echelon vein arrays. Tectonophysics 28,245e263.
Bevis, M., Hudnut, K., Sanchez, R., Toth, C., Grejner-Brzezinska, D., Kendrick, E.,Caccamise, D., Raleigh, D., Zhou, H., Shan, S., Shindle, W., Yong, A., Harvey, J.,Borsa, A., Ayoub, F., Shrestha, R., Carter, B., Sartori, M., Phillips, D., Coloma, F.,2005. The B4 Project: Scanning the San Andreas and San Jacinto Fault Zones.AGU Fall Meet. Abstr. 34, 01.
Birdseye, C.H., 1940. Stereoscopic Phototopographic mapping. Ann. Assoc. Am.Geogr. 30, 1e24. http://dx.doi.org/10.1080/00045604009357193.
Blenkinsop, T.G., 2012. Visualizing structural geology: from Excel to google earth.Comput. Geosci. 45, 52e56.
Bons, P.D., Elburg, M.A., Gomez-Rivas, E., 2012. A review of the formation of tectonicveins and their microstructures. J. Struct. Geol. 43, 33e62.
Borsa, A., Minster, J.-B., 2012. Rapid determination of Near-Fault earthquakedeformation using differential LiDAR. Bull. Seismol. Soc. Am. 102, 1335e1347.http://dx.doi.org/10.1785/0120110159.
Brooks, B.A., 2014. Briefing on the M6.0 south Napa earthquake. In: Southern Cal-ifornia Earthquake Center Annual Meeting, September 6-10, 2014. Palm Springs,California.
Buckley, D., 2013. An Analysis of Fault Damage at Piccaninny Point, North-EastTasmania. Unpublished Hons thesis. University of Western Australia.
Coggan, J.S., Wetherelt, A., Gwynn, X.P., Flynn, Z., 2007. Comparison of hand-mapping with remote data capture systems for effective rock mass character-isation. In: Proceedings of 11th Congress of the International Society for RockMechanics - the Second Half Century of Rock Mechanics, vol. 1, pp. 201e205.
De Paor, D.G., Whitmeyer, S.J., 2011. Geological and geophysical modeling on virtualglobes using KML, COLLADA, and Javascript. Comput. Geosci. 37, 100e110.
Dolan, J.F., Haravitch, B.D., 2014. How well do surface slip measurements track slipat depth in large strike-slip earthquakes? the importance of fault structuralmaturity in controlling on-fault slip versus off-fault surface deformation. EarthPlanet. Sci. Lett. 388, 38e47. http://dx.doi.org/10.1016/j.epsl.2013.11.043.
Duffy, B., Quigley, M., Barrell, D.J.A., Dissen, R.V., Stahl, T., Leprince, S., McInnes, C.,Bilderback, E., 2013. Fault kinematics and surface deformation across a releasingbend during the 2010 MW 7.1 Darfield, New Zealand, earthquake revealed bydifferential LiDAR and cadastral surveying. Geol. Soc. Am. Bull. 125, 420e431.http://dx.doi.org/10.1130/B30753.1.
Eardley, A.J., 1942. Aerial Photographs: Their Use and Interpretation. Harper andBrothers, New York.
Farenzena, M., Fusiello, A., Gherardi, R., 2009. Structure-and-motion pipeline on ahierarchical cluster tree, In: 2009 IEEE 12th International Conference onComputer Vision Workshops (ICCV Workshops). In: Presented at the 2009 IEEE12th International Conference on Computer Vision Workshops (ICCV Work-shops), pp. 1489e1496. http://dx.doi.org/10.1109/ICCVW.2009.5457435.
Favalli, M., Fornaciai, A., Isola, I., Tarquini, S., Nannipieri, L., 2012. Multiview 3Dreconstruction in geosciences. Comput. Geosci. 44, 168e176. http://dx.doi.org/10.1016/j.cageo.2011.09.012.
Feng, Q., Sj€ogren, P., Stephansson, O., Jing, L., 2001. Measuring fracture orientation atexposed rock faces by using a non-reflector total station. Eng. Geol. 59,133e146.
Fern�andez, O., 2005. Obtaining a best fitting plane through 3D georeferenced data.J. Struct. Geol. 27, 855e858.
Fischler, M.A., Bolles, R.C., 1981. Random sample consensus: a paradigm for modelfitting with applications to image analysis and automated cartography. Com-mun. ACM 24, 381e395.
Fonstad, M.A., Dietrich, J.T., Courville, B.C., Jensen, J.L., Carbonneau, P.E., 2013.Topographic structure from motion: a new development in photogrammetricmeasurement. Earth Surf. Process. Landf. 38, 421e430. http://dx.doi.org/10.1002/esp.3366.
Furukawa, Y., Ponce, J., 2009. Accurate, dense, and robust multi-view stereopsis.IEEE Trans. Pattern Anal. Mach. Intell. 32, 1362e1376.
Furukawa, Y., Curless, B., Seitz, S.M., Szeliski, R., 2010. Towards Internet-scale multi-view stereo. In: 2010 IEEE Conference on Computer Vision and PatternRecognition (CVPR), pp. 1434e1441. http://dx.doi.org/10.1109/CVPR.2010.5539802. Presented at the 2010 IEEE Conference on ComputerVision and Pattern Recognition (CVPR).
Gee, R.D., Groves, D.I., 1971. Structural features and mode of emplacement ofpart of the Blue Tier Batholith in Northeast Tasmania. J. Geol. Soc. Aust. 18,41e56.
Gillespie, P., Monsen, E., Maerten, L., Hunt, D., Thurmond, J., Tuck, D., 2010. Fracturesin carbonates: from digital outcrops to mechanical models. In: Martinsen, O.J.,Pulham, A.J., Haughton, P., Sullivan, M.D. (Eds.), Outcrops Revitalized: Tools,Techniques and Applications. SEPM (Society for Sedimentary Geology).
Gold, P.O., Cowgill, E., Kreylos, O., Gold, R.D., 2012. A terrestrial lidar-based work-flow for determining Threeedimensional slip vectors and associated un-certainties. Geosphere 8, 431e442. http://dx.doi.org/10.1130/GES00714.1.
Granshaw, S.I., 1980. Bundle adjustment methods in engineering photogrammetry.Photogramm. Rec. 10, 181e207.
Groves, D.I., Cocker, J.D., Jennings, D.J., 1977. The geology, geochemistry and min-eralisation of the Blue Tier Batholith. Geol. Surv. Tasman. Bull. 55, 7e116.
Haddad, D.E., Akçiz, S.O., Arrowsmith, J.R., Rhodes, D.D., Oldow, J.S., Zielke, O.,Tok�e, N.A., Haddad, A.G., Mauer, J., Shilpakar, P., 2012. Applications of airborneand terrestrial laser scanning to paleoseismology. Geosphere 8, 771e786.http://dx.doi.org/10.1130/GES00701.1.

S.P. Bemis et al. / Journal of Structural Geology 69 (2014) 163e178178
Haeussler, P.J., Schwartz, D.P., Dawson, T.E., Stenner, H.D., Lienkaemper, J.J.,Sherrod, B., Cinti, F.R., Montone, P., Craw, P.A., Crone, A.J., Personius, S.F., 2004.Surface rupture and slip distribution of the denali and Totschunda faults in the3 november 2002 M 7.9 earthquake, Alaska. Bull. Seismol. Soc. Am. 94,S23eS52. http://dx.doi.org/10.1785/0120040626.
Hagan, T.O., 1980. A case for terrestrial photogrammetry in deep-mine rock struc-ture studies. Int. J. Rock Mech. Min. Sci. Geomech. Abstr. 17, 191e198. http://dx.doi.org/10.1016/0148-9062(80)91085-2.
Haugerud, R.A., Harding, D.J., Johnson, S.Y., Harless, J.L., Weaver, C.S., Sherrod, B.L.,2003. High-resolution lidar topography of the Puget Lowland, Washington - abonanza for earth science. GSA Today 13, 4e10.
Hilley, G.E., DeLong, S., Prentice, C., Blisniuk, K., Arrowsmith, J., 2010. Morphologicdating of fault scarps using airborne laser swath mapping (ALSM) data. Geo-phys. Res. Lett. 37, L04301. http://dx.doi.org/10.1029/2009GL042044.
Hodgetts, D., 2013. Laser scanning and digital outcrop geology in the petroleumindustry: a review. Mar. Pet. Geol. 46, 335e354. http://dx.doi.org/10.1016/j.marpetgeo.2013.02.014.
Hudnut, K.W., Borsa, A., Glennie, C., Minster, J.-B., 2002. High-resolution topographyalong surface rupture of the 16 October 1999 Hector mine, California, earth-quake (Mw 7.1) from airborne laser swath mapping. Bull. Seismol. Soc. Am. 92,1570e1576. http://dx.doi.org/10.1785/0120000934.
James, M.R., Robson, S., 2012. Straightforward reconstruction of 3D surfaces andtopography with a camera: accuracy and geoscience application. J. Geophys.Res. 117, F03017. http://dx.doi.org/10.1029/2011JF002289.
James, M.R., Robson, S., 2014. Mitigating systematic error in topographic modelsderived from UAV and ground-based image networks. Earth Surf. Process.Landf. 39, 1413e1420. http://dx.doi.org/10.1002/esp.3609.
Johnson, K., Nissen, E., Saripalli, S., Arrowsmith, J.R., McGarey, P., Scharer, K.,Williams, P., Blisniuk, K., 2014. Rapid mapping of ultrafine fault zone topog-raphy with structure from motion. Geosphere. http://dx.doi.org/10.1130/GES01017.1. GES01017.1.
Krauss, K., 1993. Photogrammetry. In: Fundamentals and Standard Processes, vol. 1.Dümmlers.
Krishnan, A.K., Saripalli, S., Nissen, E., Arrowsmith, R., 2012. 3D change detectionusing low cost aerial imagery. In: 2012 IEEE International Symposium on Safety,Security, and Rescue Robotics (SSRR), pp. 1e6. http://dx.doi.org/10.1109/SSRR.2012.6523892. Presented at the 2012 IEEE International Symposium onSafety, Security, and Rescue Robotics (SSRR).
Kuenen, P.H., 1950. Stereoscopic projection for demonstration in geology, geo-morphology, and other natural sciences. J. Geol. 58, 49e54. http://dx.doi.org/10.1086/625694.
Lowe, D.G., 2004. Distinctive image features from scale-invariant keypoints. Int. J.Comput. Vis. 60, 91e110. http://dx.doi.org/10.1023/B: VISI.0000029664.99615.94.
McCaffrey, K.J.W., Jones, R.R., Holdsworth, R.E., Wilson, R.W., Clegg, P., Imber, J.,Holliman, N., Trinks, I., 2005. Unlocking the spatial dimension: digital tech-nologies and the future of geosciences fieldwork. J. Geol. Soc. Lond. 162,927e938.
McCalpin, J., 2009. Paleoseismology, second ed. In: International Geophysics Aca-demic Press.
Micklethwaite, S., Turner, D., Vasuki, Y., Kovesi, P., Holden, E.-J., Lucieer, A., 2012.Mapping from an Armchair: rapid, high-resolution mapping using UAV andcomputer vision technology. Struct. Geol. Resour. 130e133.
Moreels, P., Perona, P., 2007. Evaluation of features detectors and descriptors basedon 3D objects. Int. J. Comput. Vis. 73, 263e284. http://dx.doi.org/10.1007/s11263-006-9967-1.
Morelan, A.E., Stock, J.M., Hudnut, K.W., Akciz, S.O., 2010. Using photogrammetry toproduce high-resolution DEMs of the El Mayor-Cucapah surface rupture. In:Southern California Earthquake Center Annual Meeting, September, 2010. PalmSprings, California.
Niethammer, U., James, M.R., Rothmund, S., Travelletti, J., Joswig, M., 2012. UAV-based remote sensing of the Super-Sauze landslide: evaluation and results. Eng.Geol., Integration Technol. Landslide Monit. Quant. Hazard Assess. 128, 2e11.http://dx.doi.org/10.1016/j.enggeo.2011.03.012.
Nissen, E., Krishnan, A.K., Arrowsmith, J.R., Saripalli, S., 2012. Three-dimensionalsurface displacements and rotations from differencing pre- and post-earthquake LiDAR point clouds. Geophys. Res. Lett. 39, n/aen/a. http://dx.doi.org/10.1029/2012GL052460.
Nixon, C.W., Sanderson, D.J., Bull, J.M., 2011. Deformation within a strike-slip faultnetwork at Westward Ho!, Devon U.K.: domino vs conjugate faulting. J. Struct.Geol. 33, 833e843.
Olson, J.E., Pollard, D.D., 1991. The initiation and growth of en �echelon veins.J. Struct. Geol. 13, 595e608.
Oskin, M.E., Le, K., Strane, M.D., 2007. Quantifying fault-zone activity in arid envi-ronments with high-resolution topography. Geophys. Res. Lett. 34, L23S05.http://dx.doi.org/10.1029/2007GL031295.
Oskin, M.E., Arrowsmith, J.R., Corona, A.H., Elliott, A.J., Fletcher, J.M., Fielding, E.J.,Gold, P.O., Garcia, J.J.G., Hudnut, K.W., Liu-Zeng, J., Teran, O.J., 2012. Near-fielddeformation from the El MayoreCucapah earthquake revealed by differentialLIDAR. Science 335, 702e705. http://dx.doi.org/10.1126/science.1213778.
Peacock, D.C.P., Fisher, Q.J., Willemse, E.J.M., Aydin, A., 1998. The relationship be-tween faults and pressure solution seams in carbonate rocks and implicationsfor fluid flow. Geol. Soc. Lond. Special Publ. 147, 105e115.
Philibosian, B., Fumal, T.E., Weldon, R.J., Kendrick, K.J., Scharer, K.M., Bemis, S.P.,Burgette, R.J., Wisely, B.A., 2009. Photomosaics and Logs of Trenches on the SanAndreas Fault Near Coachella. California (Open-File Report No. 2009-1039). U.S.Geological Survey.
Pillmore, C.L., 1964. Application of high-order stereoscopic plotting instruments tophotogeologic studies. In: Procedures and Studies in Photogeology, GeologicalSurvey Bulletin 1043-B. U.S. Department of the Interior, Geological Survey,Washington, D.C, pp. 22e34.
Pringle, J.K., Howell, J.A., Hodgetts, D., Westerman, A.R., Hodgson, D.M., 2006. Vir-tual outcrop models of petroleum reservoir analogues: a review of the currentstate-of-the-art. First Break 24, 33e42.
Rarity, F., van Lanen, X.M.T., Hodgetts, D., Gawthorpe, R.L., Wilson, P., Fabuel-Perez, I., Redfern, J., 2013. LiDAR-based Digital Outcrops for SedimentologicalAnalysis: Workflows and Techniques. In: Geological Society of London SpecialPublications 387. http://dx.doi.org/10.1144/SP387.5.
Remondino, F., 2006. Detectors and descriptors for photogrammetric applications.In: F€orstner, W., Steffen, R. (Eds.), International Archives of the Photogram-metry, Remote Sensing and Spatial Information Sciences: Symposium of ISPRSCommission III Photogrammetric Computer Vision PCV ' 06, pp. 49e54. Bonn,Germany.
Seers, T., Hodgetts, D., 2013. Comparison of Digital Outcrop and Conventional DataCollection Approaches for the Characterization of Naturally Fractured ReservoirAnalogues. In: Geological Society of London Special Publication 374. http://dx.doi.org/10.1144/SP374.13.
Shipton, Z.K., Cowie, P.A., 2001. Damage zone and slip-surface evolution over um tokm scales in high-porosity Navajo sandstone, Utah. J. Struct. Geol. 23,1825e1844.
Smith, M.J., Chandler, J., Rose, J., 2009. High spatial resolution data acquisition forthe geosciences: kite aerial photography. Earth Surf. Process. Landforms 34,155e161. http://dx.doi.org/10.1002/esp.1702.
Snavely, N., 2010. Bundler: Structure from Motion for Unordered Image Collections.http://phototour.cs.washington.edu/bundler/.
Snavely, N., Seitz, S.M., Szeliski, R., 2006. Photo tourism: exploring photo collectionsin 3D. In: ACM SIGGRAPH 2006 Papers, SIGGRAPH ’06. ACM, New York, NY, USA,pp. 835e846. http://dx.doi.org/10.1145/1179352.1141964.
Snavely, N., Garg, R., Seitz, S.M., Szeliski, R., 2008a. Finding paths through theWorld's photos. In: ACM SIGGRAPH 2008 Papers, SIGGRAPH '08. ACM, NewYork, NY, USA, pp. 15:1e15:11. http://dx.doi.org/10.1145/1399504.1360614.
Snavely, N., Seitz, S.M., Szeliski, R., 2008b. Modeling the world from internet photocollections. Int. J. Comput. Vis. 80, 189e210. http://dx.doi.org/10.1007/s11263-007-0107-3.
Stumpf, A., Malet, J.-P., Kerle, N., Niethammer, U., Rothmund, S., 2013. Image-basedmapping of surface fissures for the investigation of landslide dynamics. Geo-morphology 186, 12e27. http://dx.doi.org/10.1016/j.geomorph.2012.12.010.
Turner, D., Lucieer, A., Watson, C., 2012. An automated technique for generatinggeorectified mosaics from ultra-high resolution unmanned aerial vehicle (UAV)imagery, based on structure from motion (SfM) Point clouds. Remote Sens. 4,1392e1410.
Turner, D., Lucieer, A., Wallace, L., 2013. Direct georeferencing of ultrahigh-resolution UAV imagery. IEEE Transactions on Geoscience and RemoteSensing 52, 2738e2745. http://dx.doi.org/10.1109/TGRS.2013.2265295.
van Lanen, X.M.T., Hodgetts, D., Redfern, J., Fabuel-Perez, I., 2009. Applications ofdigital outcrop models: two fluvial case studies from the Triassic Wolfville Fm.,Canada and Oukaimeden Sandstone Fm., Morocco. Geol. J. 44, 742e760. http://dx.doi.org/10.1002/gj.1196.
Vasuki, Y., Holden, E.-J., Kovesi, P., Micklethwaite, S., 2013. A geological structuremapping tool using photogrammetric data. In: ASEGExtendedAbstracts, pp.1e4.
Vasuki, Y., Holden, E.-J., Kovesi, P., Micklethwaite, S., 2014. Semi-automatic mappingof geological Structures using UAV-based photogrammetric data: an imageanalysis approach. Comput. Geosci. 69, 22e32. http://dx.doi.org/10.1016/j.cageo.2014.04.012.
Wackrow, R., Chandler, J.H., 2011. Minimising systematic error surfaces in digitalelevation models using oblique convergent imagery. Photogramm. Rec. 26,16e31.
Westoby, M.J., Brasington, J., Glasser, N.F., Hambrey, M.J., Reynolds, J.M., 2012.“Structure-from-Motion” photogrammetry: a low-cost, effective tool for geo-science applications. Geomorphology 179, 300e314. http://dx.doi.org/10.1016/j.geomorph.2012.08.021.
Willemse, E.J.M., Peacock, D.C.P., Aydin, A., 1997. Nucleation and growth of strike-slip faults in limestones from Somerset, U.K. J. Struct. Geol. 19, 1461e1477.
Wilson, P., Gawthorpe, R.L., Hodgetts, D., Rarity, F., Sharp, I.R., 2009. Geometry andarchitecture of faults in a syn-rift normal fault array: the Nukhul half-graben,Suez rift, Egypt. J. Struct. Geol. 31, 759e775.
Zielke, O., Arrowsmith, J.R., Ludwig, L.G., Akçiz, S.O., 2010. Slip in the 1857 andearlier large earthquakes along the carrizo Plain, San Andreas fault. Science 327,1119e1122. http://dx.doi.org/10.1126/science.1182781.
Copyright © 2022 FDOKUMEN