High Purge Volume Sampling-A New Paradigm for Subslab Soil Gas Monitoring
13
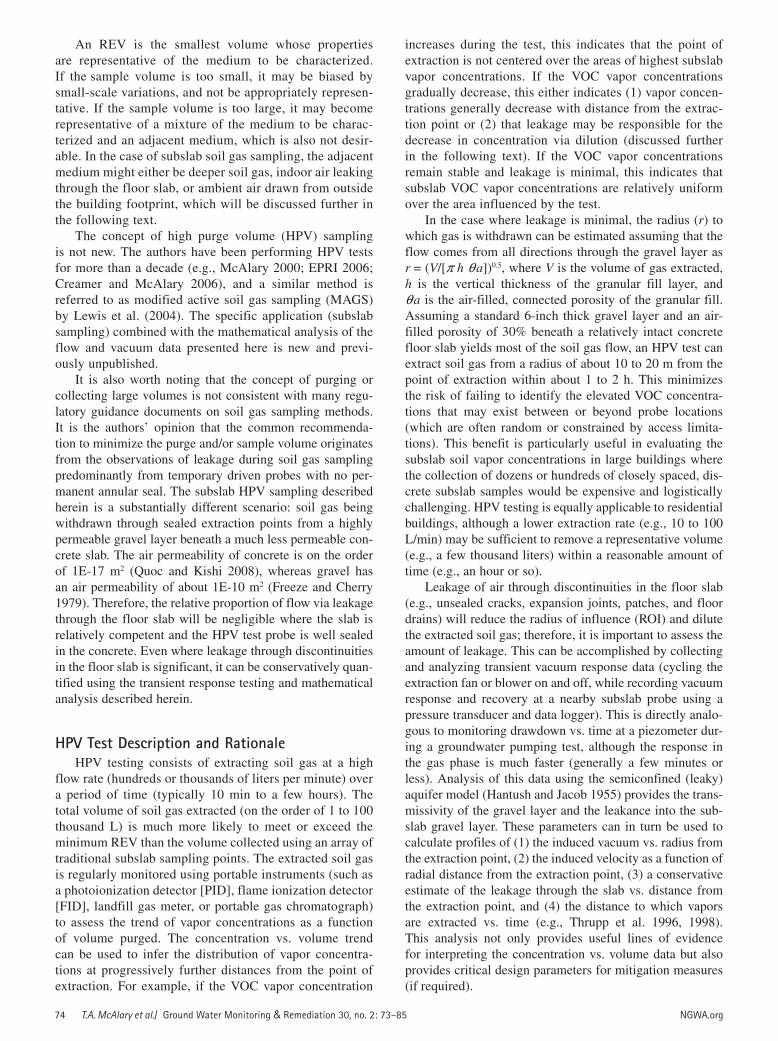
NGWA.org Ground Water Monitoring & Remediation 30, no. 2/ Spring 2010/pages 73–85 73 Copyright © 2010 The Author(s) Journal compilation © 2010 National Ground Water Association. doi: 10.1111/j1745–6592.2010.001278.x High Purge Volume Sampling—A New Paradigm for Subslab Soil Gas Monitoring by Todd A. McAlary, Paul J. Nicholson, Lee K. Yik, David M. Bertrand, and Gordon Thrupp Abstract Subslab soil gas sampling and analysis is a common line of evidence for assessing human health risks associated with subsurface vapor intrusion to indoor air for volatile organic compounds; however, conventional subslab sampling methods have generated data that show substantial spatial and temporal variability, which often makes the interpretation difficult. A new method of monitoring has been developed and tested that is based on a concept of integrating samples over a large volume of soil gas extracted from beneath the floor slab of a building to provide a spatially averaged subslab concentration. Regular field screening is also conducted to assess the trend of concentration as a function of the volume removed to provide insight into the spatial distribution of vapors at progressive distances away from the point of extraction. This approach minimizes the risk of failing to identify the areas of elevated soil vapor concentrations that may exist between discrete sample locations, and can provide information covering large buildings with fewer holes drilled through the floor. The new method also involves monitoring the extraction flow rate and transient vacuum response for mathematical analysis to help interpret the vapor con- centration data and to support an optimal design for any subslab venting system that may be needed. Introduction Indoor air sampling alone seldom provides an unambig- uous assessment of the potential for risks attributable to soil vapor intrusion, because indoor air often contains detectable concentrations of vapors from sources inside and/or outside the building. Several common volatile organic compounds (VOCs) have average background levels that are near or above their respective risk-based target indoor air concentra- tions (Dawson and McAlary 2009). Many regulatory guid- ance documents recommend the collection of subslab soil gas samples as an additional line of evidence when assess- ing vapor intrusion (U.S. EPA 2002; Interstate Technology and Regulatory Council 2006; New York State Department of Health 2006; New Jersey Department of Environmental Protection [NJDEP] 2005; and many others). Where vapor intrusion is occurring there should be a correlation between subslab and indoor air concentrations and subslab soil gas concentrations should be higher than indoor air concentra- tions (by typically 2 to 4 orders of magnitude) because of attenuation across the building slab and dilution attributable to the building ventilation. Empirical data collected to date, however, show con- siderable spatial and temporal variations in subslab soil gas concentrations (McDonald and Wertz 2007; Luo et al. 2009; McAlary 2008; U.S. EPA 2006). This variability raises questions about the number, frequency, and spacing of samples required to characterize subslab vapor concen- trations and has caused some to question whether sub- slab sampling is worthwhile at all (Johnson 2008). From a practical perspective, the cost of collecting sufficient discrete subslab soil gas samples to support a statistical analysis of the subslab vapor concentrations is prohibitive in most cases. Therefore, alternative approaches are worth considering. Subslab samples are typically collected using the meth- ods similar to those described by the U.S. EPA (2006), in which a whole-gas sample is collected in a passivated stain- less steel canister (e.g., Summa™ canister) with minimal purging prior to sample collection. Laboratories seldom require more than about 1 L of sample to achieve analyti- cal reporting limits lower than regulatory screening levels and most guidance documents recommend minimal purging prior to sample collection to reduce the risks of sample bias. For context, the rate of soil gas flow into residential build- ings is typically in the range of 0.1 to 10 L/min (Johnson 2002), which equates to about 10 6 to 10 8 million L over the 30-year exposure scenario for which human health risk is typically assessed. This raises the question of whether a conventional subslab soil gas sample constitutes a represen- tative elemental volume (REV), a concept that was origi- nally defined by Bear (1979).
-
Upload
independent -
Category
Documents
-
view
7 -
download
0
Transcript of High Purge Volume Sampling-A New Paradigm for Subslab Soil Gas Monitoring
NGWA.org Ground Water Monitoring & Remediation 30, no. 2/ Spring 2010/pages 73–85 73
Copyright © 2010 The Author(s)Journal compilation © 2010 National Ground Water Association.doi: 10.1111/j1745–6592.2010.001278.x
High Purge Volume Sampling—A New Paradigm for Subslab Soil Gas Monitoring
by Todd A. McAlary, Paul J. Nicholson, Lee K. Yik, David M. Bertrand, and Gordon Thrupp
AbstractSubslab soil gas sampling and analysis is a common line of evidence for assessing human health risks associated with
subsurface vapor intrusion to indoor air for volatile organic compounds; however, conventional subslab sampling methods have generated data that show substantial spatial and temporal variability, which often makes the interpretation difficult. A new method of monitoring has been developed and tested that is based on a concept of integrating samples over a large volume of soil gas extracted from beneath the floor slab of a building to provide a spatially averaged subslab concentration. Regular field screening is also conducted to assess the trend of concentration as a function of the volume removed to provide insight into the spatial distribution of vapors at progressive distances away from the point of extraction. This approach minimizes the risk of failing to identify the areas of elevated soil vapor concentrations that may exist between discrete sample locations, and can provide information covering large buildings with fewer holes drilled through the floor. The new method also involves monitoring the extraction flow rate and transient vacuum response for mathematical analysis to help interpret the vapor con-centration data and to support an optimal design for any subslab venting system that may be needed.
IntroductionIndoor air sampling alone seldom provides an unambig-
uous assessment of the potential for risks attributable to soil vapor intrusion, because indoor air often contains detectable concentrations of vapors from sources inside and/or outside the building. Several common volatile organic compounds (VOCs) have average background levels that are near or above their respective risk-based target indoor air concentra-tions (Dawson and McAlary 2009). Many regulatory guid-ance documents recommend the collection of subslab soil gas samples as an additional line of evidence when assess-ing vapor intrusion (U.S. EPA 2002; Interstate Technology and Regulatory Council 2006; New York State Department of Health 2006; New Jersey Department of Environmental Protection [NJDEP] 2005; and many others). Where vapor intrusion is occurring there should be a correlation between subslab and indoor air concentrations and subslab soil gas concentrations should be higher than indoor air concentra-tions (by typically 2 to 4 orders of magnitude) because of attenuation across the building slab and dilution attributable to the building ventilation.
Empirical data collected to date, however, show con-siderable spatial and temporal variations in subslab soil
gas concentrations (McDonald and Wertz 2007; Luo et al. 2009; McAlary 2008; U.S. EPA 2006). This variability raises questions about the number, frequency, and spacing of samples required to characterize subslab vapor concen-trations and has caused some to question whether sub-slab sampling is worthwhile at all (Johnson 2008). From a practical perspective, the cost of collecting sufficient discrete subslab soil gas samples to support a statistical analysis of the subslab vapor concentrations is prohibitive in most cases. Therefore, alternative approaches are worth considering.
Subslab samples are typically collected using the meth-ods similar to those described by the U.S. EPA (2006), in which a whole-gas sample is collected in a passivated stain-less steel canister (e.g., Summa™ canister) with minimal purging prior to sample collection. Laboratories seldom require more than about 1 L of sample to achieve analyti-cal reporting limits lower than regulatory screening levels and most guidance documents recommend minimal purging prior to sample collection to reduce the risks of sample bias. For context, the rate of soil gas flow into residential build-ings is typically in the range of 0.1 to 10 L/min (Johnson 2002), which equates to about 106 to 108 million L over the 30-year exposure scenario for which human health risk is typically assessed. This raises the question of whether a conventional subslab soil gas sample constitutes a represen-tative elemental volume (REV), a concept that was origi-nally defined by Bear (1979).
74 T.A. McAlary et al./ Ground Water Monitoring & Remediation 30, no. 2: 73–85 NGWA.org
An REV is the smallest volume whose properties are representative of the medium to be characterized. If the sample volume is too small, it may be biased by small-scale variations, and not be appropriately represen-tative. If the sample volume is too large, it may become representative of a mixture of the medium to be charac-terized and an adjacent medium, which is also not desir-able. In the case of subslab soil gas sampling, the adjacent medium might either be deeper soil gas, indoor air leaking through the floor slab, or ambient air drawn from outside the building footprint, which will be discussed further in the following text.
The concept of high purge volume (HPV) sampling is not new. The authors have been performing HPV tests for more than a decade (e.g., McAlary 2000; EPRI 2006; Creamer and McAlary 2006), and a similar method is referred to as modified active soil gas sampling (MAGS) by Lewis et al. (2004). The specific application (subslab sampling) combined with the mathematical analysis of the flow and vacuum data presented here is new and previ-ously unpublished.
It is also worth noting that the concept of purging or collecting large volumes is not consistent with many regu-latory guidance documents on soil gas sampling methods. It is the authors’ opinion that the common recommenda-tion to minimize the purge and/or sample volume originates from the observations of leakage during soil gas sampling predominantly from temporary driven probes with no per-manent annular seal. The subslab HPV sampling described herein is a substantially different scenario: soil gas being withdrawn through sealed extraction points from a highly permeable gravel layer beneath a much less permeable con-crete slab. The air permeability of concrete is on the order of 1E-17 m2 (Quoc and Kishi 2008), whereas gravel has an air permeability of about 1E-10 m2 (Freeze and Cherry 1979). Therefore, the relative proportion of flow via leakage through the floor slab will be negligible where the slab is relatively competent and the HPV test probe is well sealed in the concrete. Even where leakage through discontinuities in the floor slab is significant, it can be conservatively quan-tified using the transient response testing and mathematical analysis described herein.
HPV Test Description and RationaleHPV testing consists of extracting soil gas at a high
flow rate (hundreds or thousands of liters per minute) over a period of time (typically 10 min to a few hours). The total volume of soil gas extracted (on the order of 1 to 100 thousand L) is much more likely to meet or exceed the minimum REV than the volume collected using an array of traditional subslab sampling points. The extracted soil gas is regularly monitored using portable instruments (such as a photoionization detector [PID], flame ionization detector [FID], landfill gas meter, or portable gas chromatograph) to assess the trend of vapor concentrations as a function of volume purged. The concentration vs. volume trend can be used to infer the distribution of vapor concentra-tions at progressively further distances from the point of extraction. For example, if the VOC vapor concentration
increases during the test, this indicates that the point of extraction is not centered over the areas of highest subslab vapor concentrations. If the VOC vapor concentrations gradually decrease, this either indicates (1) vapor concen-trations generally decrease with distance from the extrac-tion point or (2) that leakage may be responsible for the decrease in concentration via dilution (discussed further in the following text). If the VOC vapor concentrations remain stable and leakage is minimal, this indicates that subslab VOC vapor concentrations are relatively uniform over the area influenced by the test.
In the case where leakage is minimal, the radius (r) to which gas is withdrawn can be estimated assuming that the flow comes from all directions through the gravel layer as r = (V/[p h q a])0.5, where V is the volume of gas extracted, h is the vertical thickness of the granular fill layer, and q a is the air-filled, connected porosity of the granular fill. Assuming a standard 6-inch thick gravel layer and an air-filled porosity of 30% beneath a relatively intact concrete floor slab yields most of the soil gas flow, an HPV test can extract soil gas from a radius of about 10 to 20 m from the point of extraction within about 1 to 2 h. This minimizes the risk of failing to identify the elevated VOC concentra-tions that may exist between or beyond probe locations (which are often random or constrained by access limita-tions). This benefit is particularly useful in evaluating the subslab soil vapor concentrations in large buildings where the collection of dozens or hundreds of closely spaced, dis-crete subslab samples would be expensive and logistically challenging. HPV testing is equally applicable to residential buildings, although a lower extraction rate (e.g., 10 to 100 L/min) may be sufficient to remove a representative volume (e.g., a few thousand liters) within a reasonable amount of time (e.g., an hour or so).
Leakage of air through discontinuities in the floor slab (e.g., unsealed cracks, expansion joints, patches, and floor drains) will reduce the radius of influence (ROI) and dilute the extracted soil gas; therefore, it is important to assess the amount of leakage. This can be accomplished by collecting and analyzing transient vacuum response data (cycling the extraction fan or blower on and off, while recording vacuum response and recovery at a nearby subslab probe using a pressure transducer and data logger). This is directly analo-gous to monitoring drawdown vs. time at a piezometer dur-ing a groundwater pumping test, although the response in the gas phase is much faster (generally a few minutes or less). Analysis of this data using the semiconfined (leaky) aquifer model (Hantush and Jacob 1955) provides the trans-missivity of the gravel layer and the leakance into the sub-slab gravel layer. These parameters can in turn be used to calculate profiles of (1) the induced vacuum vs. radius from the extraction point, (2) the induced velocity as a function of radial distance from the extraction point, (3) a conservative estimate of the leakage through the slab vs. distance from the extraction point, and (4) the distance to which vapors are extracted vs. time (e.g., Thrupp et al. 1996, 1998). This analysis not only provides useful lines of evidence for interpreting the concentration vs. volume data but also provides critical design parameters for mitigation measures (if required).
NGWA.org T.A. McAlary et al./ Ground Water Monitoring & Remediation 30, no. 2: 73–85 75
The Hantush-Jacob model assumes that the aquifer has an impermeable bottom, which in this case would require that the native soil is much less permeable than the granular fill beneath the floor slab. Native soils can have permeabili-ties that span many orders of magnitude (1E-7 to 1E-19 m2 according to Freeze and Cherry 1979). Most soils are con-siderably less permeable than the engineered fill materials typically used beneath concrete floor slabs; therefore, this assumption is a reasonable first approximation. However, it should be noted that competent or well-sealed concrete slabs would contribute less leakage than moderate to high permeability soils; therefore, if all the leakage is attributed to downward leakage through the floor slab, this would result in a conservative (health-protective) design for any subslab venting system. Furthermore, if the native soils have a very high permeability, the equation used to estimate the radial distance (r) from which vapors are extracted after extract-ing a volume (V) of gas may need to be revised either to consider a cylinder with a vertical dimension equal to the thickness of the permeable layer, or the depth to the water table (an impermeable boundary for gas flow), or perhaps a semispherical approximation (r = cubed root of 3V/2np). Regardless, the extracted gas will still provide information regarding the integrated average concentrations that might eventually enter the building over a period of time and, therefore, yield useful information for a vapor intrusion assessment.
The Hantush-Jacob model also assumes radial sym-metry, and real world conditions will generally show some degree of anisotropy. The model also assumes an infinite lateral extent, whereas all buildings have a finite size. The significance of these assumptions can be addressed by using an appropriate number and location of monitoring points and assessing the range of possible results, which is shown in the case study that follows.
Samples may also be collected for laboratory analysis to provide very low reporting limits and individual compound concentrations to supplement the field-screening data. This can be accomplished in several ways: (1) a composite whole-gas sample (discrete portions or aliquots collected intermittently during the test), (2) a slip-stream sample (a continuous flow drawn as a small fraction of the extracted gas throughout the test), or (3) a passive sample (perme-ation sampler in a flow-through cell collected continuously throughout the test).
Apparatus and MethodsHPV testing is suitable for buildings with a concrete
floor slab underlain by a layer of granular fill material that is porous, highly permeable, and well drained (e.g., granular A or ¾-inch Crusher Run), which is a common construc-tion practice. The floor slab should be relatively intact and it is best to avoid areas with excessive cracks, expansion joints, and utility penetrations or apply a sealant before test-ing where practical. Experience has shown that a moderate amount of leakage can be tolerated and the influence on the data can be quantified.
Each HPV test requires an extraction point located centrally in the building footprint, which can be drilled or
cored through the floor. For large buildings, it is often pref-erable to core a hole of about 2 inches diameter to avoid flow restrictions attributable to frictional losses, but for typical residences, a 1-inch drilled hole generally provides sufficient flow (10 to 100 L/min) and is less disruptive. Removing granular fill material from beneath the cored or drilled hole is also desirable, where practical. At least one monitoring point is also needed—typically in the range of 3 to 10 m from the extraction point. The monitoring point can be a small-diameter drilled hole, which penetrates the slab and the gravel layer, and allows a tube to be sealed into the floor with an air-tight seal of swelling cement or modeling clay. Additional monitoring points at various dis-tances (e.g., 1, 3, and 10 m) are valuable for an independent line of evidence to verify the mathematical model. It may also be beneficial to install monitoring points in different directions from the point of extraction to assess whether the response to vapor extraction is symmetrical or is influenced by barriers (e.g., footings), preferential pathways (e.g., util-ity lines), or other heterogeneities in the subslab domain. In some cases, field-screening readings over time from moni-toring points surrounding the extraction point will indicate the direction from which elevated vapor concentrations are being drawn.
The main components of the HPV test apparatus are similar to those currently used for conventional subslab depressurization (SSD) diagnostic testing and include the following:
1. A high-flow/low-vacuum blower or fan capable of a sus-tainable flow rate of 100 to 1000 standard L/min against a vacuum of 5 to 50 inches of water column (in-H
2O).
A high-vacuum Radon fan or large Shop-Vac™ will usu-ally suffice. An air bleed valve should be included upstream of the extraction fan or blower and opened if necessary to prevent the motor from overheating.
2. A length of pipe equal to nine times the diameter to pro-mote linear flow with minimal turbulence for measure-ment of the extracted air flow velocity (EPA Method 1) with a thermal digital anemometer, which is multiplied by the inner diameter of the pipe to calculate the flow rate (other options may also be considered for measuring the flow rate).
3. A valve to serve as a sample collection and wellhead vacuum monitoring port, located as close as possible to the extraction point. Samples can be collected for field screening using a vacuum chamber (a.k.a. “lung box”) and Tedlar™ bag or laboratory analysis using a Summa canister or equivalent.
4. A vacuum gauge for monitoring the extraction point vacuum.
5. A digital micromanometer with data-logging capabilities to record transient vacuum response at the monitoring point.
6. An optional inline flow-through cell, which can be used to house a permeation-style diffusive sampler as an alter-native to collecting a sample via Summa canister.
7. A discharge hose to carry the extracted soil gas to a loca-tion outside of the building. The discharge can also potentially be treated via activated carbon filtration.

76 T.A. McAlary et al./ Ground Water Monitoring & Remediation 30, no. 2: 73–85 NGWA.org
Data collection during HPV tests consists of the following:
1. Monitoring the flow rate and vacuum at the extraction point. These parameters tend to remain relatively steady throughout a test, so a few measurements of each param-eter at the beginning, middle, and end of the test are usu-ally sufficient.
2. Regular field-screening readings taken at regular inter-vals throughout the duration of the test with a PID, FID, portable gas chromatography (GC), or other cost- effective portable instruments suitable for the site-specific com-pounds and concentrations of concern, fixed gases, or tracers that may be used.
3. Collection of one integrated sample for laboratory analy-sis. A sample may be collected by connecting a Summa canister to the sample port through a flow controller cali-brated to fill the canister over the duration of the test or at segmented intervals, or by placing a permeation-style passive sampler in the optional flow-through cell for the duration of the test.
4. Monitoring transient vacuum response at one or more monitoring points. Generally, a data logger should be set to capture vacuum readings about every second, and it is preferable to collect this data through at least two cycles of drawdown and recovery to verify reproducibility and help to reduce the risk that baseline drift causes a bias in the drawdown or recovery data.
Mathematical AnalysisThe transient (drawdown and recovery) vacuum
response data can be analyzed using the Hantush and Jacob (1955) leaky aquifer model to calculate the horizon-tal pneumatic transmissivity of the granular fill beneath the floor slab and the vertical leakage factor for air flow-ing into the gravel layer from above or below. A concep-tual sketch of the model assumptions is shown in Figure 1. The model assumes that the gravel layer below the slab
transmits gas readily (i.e., acts as an aquifer), the floor slab above the gravel allows a restricted but finite recharge of vertical flow (i.e., acts as a “leaky aquitard”), and the native soil below the gravel layer is much less permeable than the gravel layer. If the native soil has a high perme-ability, the analysis may overestimate the leakage through the slab, which is considered conservative in the context of assessing the potential for subsurface vapor intrusion. The leaky aquifer model has been used in similar situa-tions for analysis of transient vacuum response during soil vapor extraction (SVE) and landfill gas extraction pilot tests (e.g., Beckett and Huntley 1994; Thrupp et al. 1996, 1998). Transmissivity (T) and leakage (B, or sometimes l) values are adjusted to obtain the best fit between the leaky model type curves and the transient vacuum response (drawdown and recovery) data.The leakage factor (B) is defined as follows:
BTb
K= ′
′1 (1)
with T = transmissivity of the zone of extraction (L2/T), b′ = thickness of the semiconfining zone (L), and K′ = vertical pneumatic conductivity of the semiconfining zone (L/T).
The greater the value of B, the lower the leakage. An approximation of the leaky aquifer solution for
steady-state flow conditions is a useful tool for estimating the subsurface pressure drawdown (i.e., vacuum) as a func-tion of distance from a well (Bear 1979):
S rQ
TK r BW
o( ) ( )=2π
/ (2)
where B is the leakage factor as defined above (Equation 1), and S(r) = (vacuum) in units of air column, r = distance from extraction point (L), Q
W = discharge from the extrac-
tion point (L3/T), T = transmissivity of the zone of extr action (L2/T), and K
o = modified Bessel function of the second kind
of order zero of (r/B) (dimensionless).
Figure 1. Conceptualization of the Hantush-Jacob leaky aquifer model—for application to HPV transient vacuum data, the “semi-pervious layer” represents the floor slab, “aquifer” represents the granular fill layer beneath the slab, and native soil is present below the bottom of the aquifer layer.
NGWA.org T.A. McAlary et al./ Ground Water Monitoring & Remediation 30, no. 2: 73–85 77
Equation 2 can be used to calculate the profile of vac-uum vs. distance after the T and B values are derived from the Hantush-Jacob model analysis. It should be noted that for different probes with equal discharge from the extrac-tion point, transmissivity and radial distance; higher leakage (lower B) results in lower vacuum. Where multiple moni-toring points were installed, the calculated vacuum vs. dis-tance profile can be independently verified by comparison to the steady-state observations of vacuum vs. distance. This analysis provides a unique insight into the ROI of a subslab depressurization system, which is discussed further in the following text.
The proportion of gas withdrawn from the subsurface Q(r) as a function of the radius from which the vapors were drawn can be calculated using Equation 3.
Q r Qr
BK r BW( ) / ( )= 1 / (3)
where r, B, and QW are as defined above, and Q(r) is flow
through the zone of extraction at distance r from extraction well (L3/T) and K
1 = modified Bessel function of the second
kind of order one of (r/B) (dimensionless).This calculation can be used to evaluate the influence
of leakage on the reduction in concentration that may be observed in the field screening of concentrations as a func-tion of volume purged, and make a semiquantitative adjust-ment to the results of laboratory analysis for comparison to risk-based screening levels. For example, within a radial distance of 2 times the leakage factor (2B), 75% of the air flow through the system originates as leakage of atmo-spheric air inside this distance, and 25% of the extracted gas comes from the subsurface at radial distances greater than 2B. This can be used to adjust the concentrations measured at various stages of the HPV test for dilution caused by leakage.
Case StudyA vapor intrusion investigation was conducted at a
manufacturing facility that has historically used chlori-nated solvents in their process, predominantly trichloro-ethene (TCE) and tetrachloroethene (PCE). The building is approximately 80 m by 120 m (9600 m2 footprint). The building was constructed in stages (or “blocks”) with bear-ing walls between the blocks. The construction, relatively recent, and the build quality are generally good. High per-meability material was encountered beneath the floor slab in all locations, demonstrated by measured flow and vac-uum at each probe (~10 L/min/in-H
2O). Where visible, the
floor slab was in good condition and drill holes indicated a relatively uniform thickness between 10 and 15 cm. A sus-pected solvent release area was identified in block F (for-mer vapor degreaser). If the subslab soil gas was assessed using the approach suggested by the U.S. EPA (2006), one sample would be required for every 220 square feet (20 m2), a total of up to 480 samples. NJDEP (2005) recommends one sample for every 1500 square feet (139 m2), which would equate to 69 samples. Many vapor intrusion guid-ance documents consider less frequent sampling for larger
buildings, but none provide specific details. Regardless of conventional subslab sampling for a building, this size would either require a large number of samples (which can be expensive, time consuming, and disruptive to any ongo-ing operations) or run a risk of failing to identify the areas of elevated concentrations that may exist between a small number of sparsely distributed sampling locations.
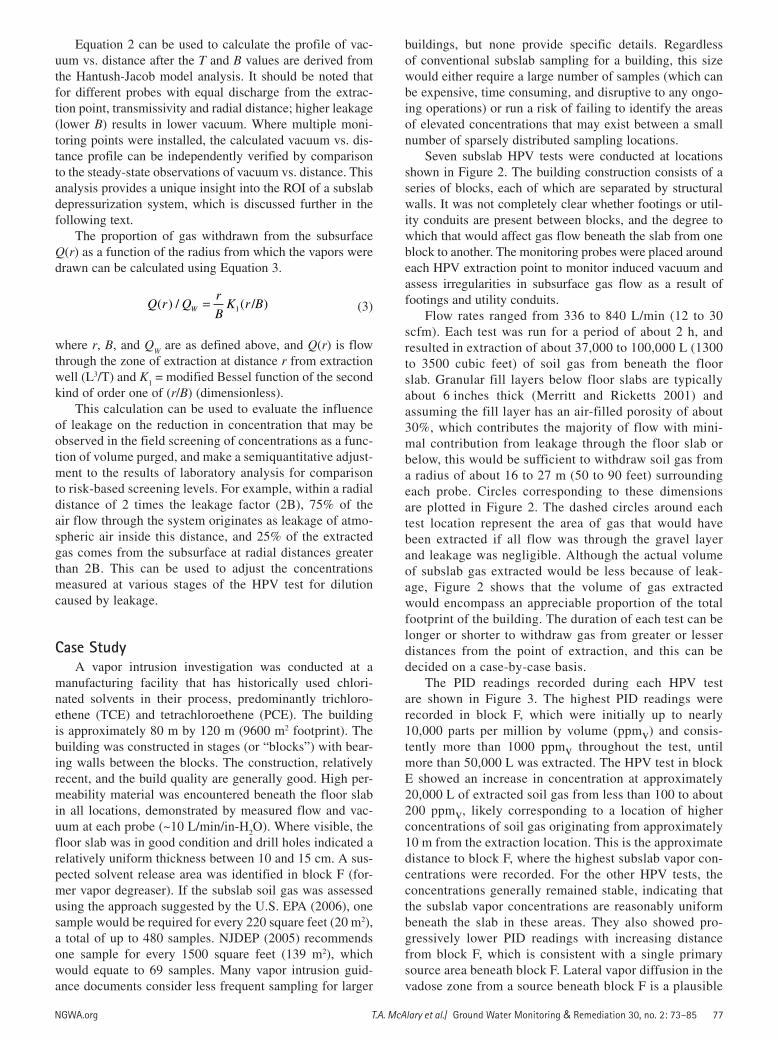
Seven subslab HPV tests were conducted at locations shown in Figure 2. The building construction consists of a series of blocks, each of which are separated by structural walls. It was not completely clear whether footings or util-ity conduits are present between blocks, and the degree to which that would affect gas flow beneath the slab from one block to another. The monitoring probes were placed around each HPV extraction point to monitor induced vacuum and assess irregularities in subsurface gas flow as a result of footings and utility conduits.
Flow rates ranged from 336 to 840 L/min (12 to 30 scfm). Each test was run for a period of about 2 h, and resulted in extraction of about 37,000 to 100,000 L (1300 to 3500 cubic feet) of soil gas from beneath the floor slab. Granular fill layers below floor slabs are typically about 6 inches thick (Merritt and Ricketts 2001) and assuming the fill layer has an air-filled porosity of about 30%, which contributes the majority of flow with mini-mal contribution from leakage through the floor slab or below, this would be sufficient to withdraw soil gas from a radius of about 16 to 27 m (50 to 90 feet) surrounding each probe. Circles corresponding to these dimensions are plotted in Figure 2. The dashed circles around each test location represent the area of gas that would have been extracted if all flow was through the gravel layer and leakage was negligible. Although the actual volume of subslab gas extracted would be less because of leak-age, Figure 2 shows that the volume of gas extracted would encompass an appreciable proportion of the total footprint of the building. The duration of each test can be longer or shorter to withdraw gas from greater or lesser distances from the point of extraction, and this can be decided on a case-by-case basis.
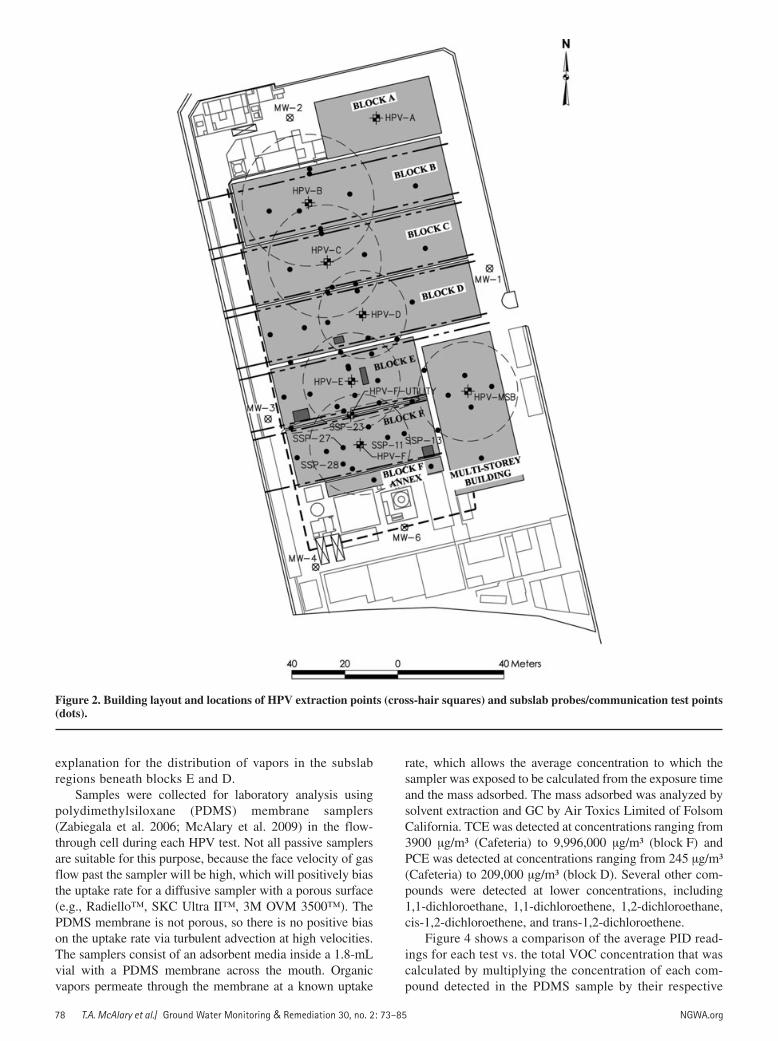
The PID readings recorded during each HPV test are shown in Figure 3. The highest PID readings were recorded in block F, which were initially up to nearly 10,000 parts per million by volume (ppmv) and consis-tently more than 1000 ppmv throughout the test, until more than 50,000 L was extracted. The HPV test in block E showed an increase in concentration at approximately 20,000 L of extracted soil gas from less than 100 to about 200 ppmv, likely corresponding to a location of higher concentrations of soil gas originating from approximately 10 m from the extraction location. This is the approximate distance to block F, where the highest subslab vapor con-centrations were recorded. For the other HPV tests, the concentrations generally remained stable, indicating that the subslab vapor concentrations are reasonably uniform beneath the slab in these areas. They also showed pro-gressively lower PID readings with increasing distance from block F, which is consistent with a single primary source area beneath block F. Lateral vapor diffusion in the vadose zone from a source beneath block F is a plausible
78 T.A. McAlary et al./ Ground Water Monitoring & Remediation 30, no. 2: 73–85 NGWA.org
explanation for the distribution of vapors in the subslab regions beneath blocks E and D.
Samples were collected for laboratory analysis using polydimethylsiloxane (PDMS) membrane samplers (Zabiegala et al. 2006; McAlary et al. 2009) in the flow-through cell during each HPV test. Not all passive samplers are suitable for this purpose, because the face velocity of gas flow past the sampler will be high, which will positively bias the uptake rate for a diffusive sampler with a porous surface (e.g., Radiello™, SKC Ultra II™, 3M OVM 3500™). The PDMS membrane is not porous, so there is no positive bias on the uptake rate via turbulent advection at high velocities. The samplers consist of an adsorbent media inside a 1.8-mL vial with a PDMS membrane across the mouth. Organic vapors permeate through the membrane at a known uptake
rate, which allows the average concentration to which the sampler was exposed to be calculated from the exposure time and the mass adsorbed. The mass adsorbed was analyzed by solvent extraction and GC by Air Toxics Limited of Folsom California. TCE was detected at concentrations ranging from 3900 µg/m³ (Cafeteria) to 9,996,000 µg/m³ (block F) and PCE was detected at concentrations ranging from 245 µg/m³ (Cafeteria) to 209,000 µg/m³ (block D). Several other com-pounds were detected at lower concentrations, including 1,1-dichloroethane, 1,1-dichloroethene, 1,2-dichloroethane, cis-1,2-dichloroethene, and trans-1,2-dichloroethene.
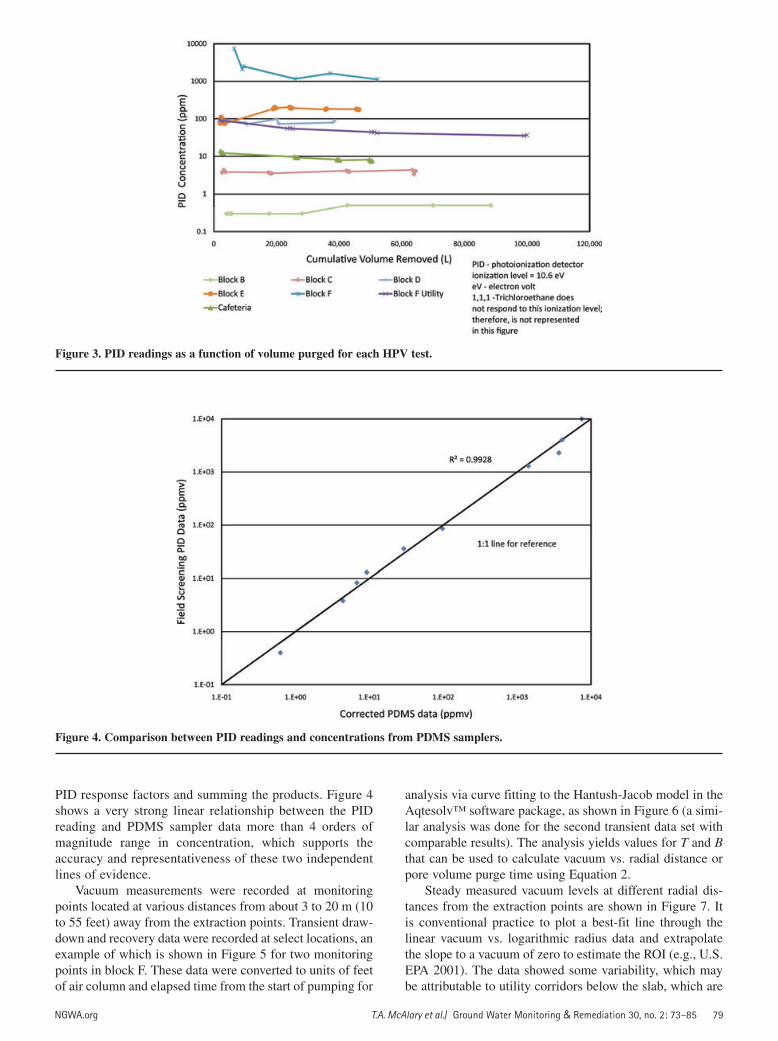
Figure 4 shows a comparison of the average PID read-ings for each test vs. the total VOC concentration that was calculated by multiplying the concentration of each com-pound detected in the PDMS sample by their respective
Figure 2. Building layout and locations of HPV extraction points (cross-hair squares) and subslab probes/communication test points (dots).
NGWA.org T.A. McAlary et al./ Ground Water Monitoring & Remediation 30, no. 2: 73–85 79
PID response factors and summing the products. Figure 4 shows a very strong linear relationship between the PID reading and PDMS sampler data more than 4 orders of magnitude range in concentration, which supports the accuracy and representativeness of these two independent lines of evidence.
Vacuum measurements were recorded at monitoring points located at various distances from about 3 to 20 m (10 to 55 feet) away from the extraction points. Transient draw-down and recovery data were recorded at select locations, an example of which is shown in Figure 5 for two monitoring points in block F. These data were converted to units of feet of air column and elapsed time from the start of pumping for
analysis via curve fitting to the Hantush-Jacob model in the Aqtesolv™ software package, as shown in Figure 6 (a simi-lar analysis was done for the second transient data set with comparable results). The analysis yields values for T and B that can be used to calculate vacuum vs. radial distance or pore volume purge time using Equation 2.
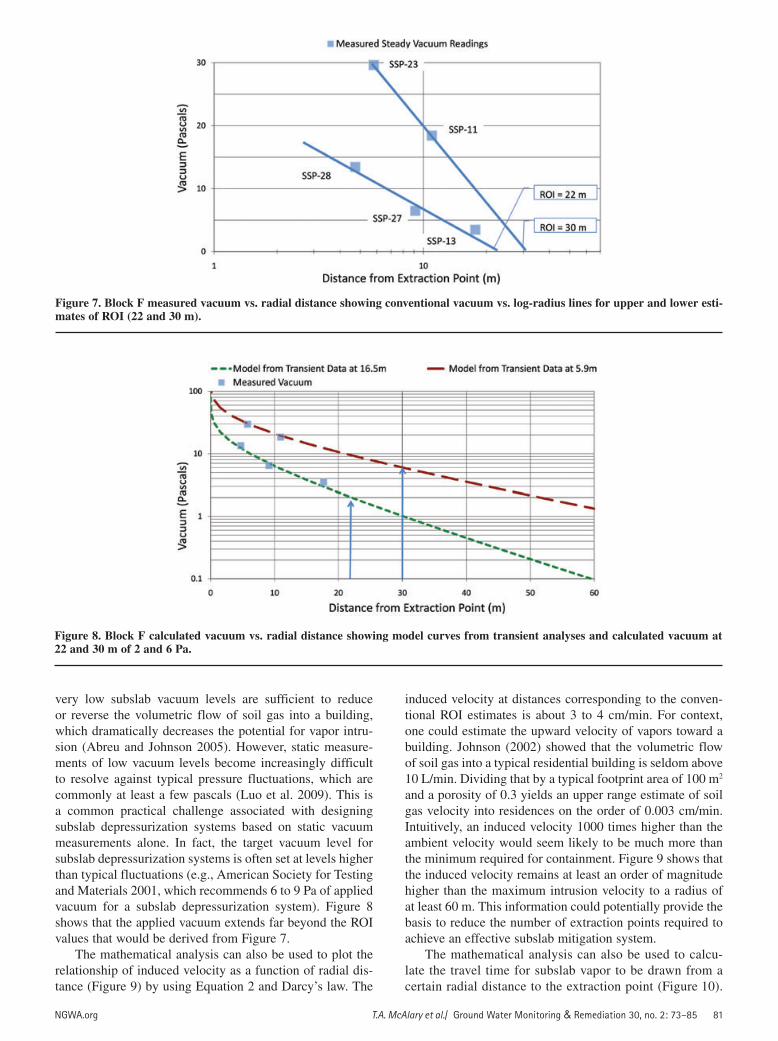
Steady measured vacuum levels at different radial dis-tances from the extraction points are shown in Figure 7. It is conventional practice to plot a best-fit line through the linear vacuum vs. logarithmic radius data and extrapolate the slope to a vacuum of zero to estimate the ROI (e.g., U.S. EPA 2001). The data showed some variability, which may be attributable to utility corridors below the slab, which are
Figure 4. Comparison between PID readings and concentrations from PDMS samplers.
Figure 3. PID readings as a function of volume purged for each HPV test.

80 T.A. McAlary et al./ Ground Water Monitoring & Remediation 30, no. 2: 73–85 NGWA.org
known to be much more permeable. To address this potential variability, Figure 7 shows two best-fit lines, and Figures 8 though 10 reflect conditions at both corresponding ROI val-ues (22 and 30 m, shown as vertical arrows).
An alternative way to view the vacuum vs. distance relationship is with the vacuum shown on a logarithmic scale and the distance on an arithmetic scale. Figure 8 shows the vacuum/distance profiles calculated using Equation 2 and the T and B values calculated from the Hantush-Jacob analysis of the two transient data sets in Figure 5. The agreement between the vacuum measurements and the mathematical model curves in Figure 8 is very good, which
supports the representativeness and accuracy of both inde-pendent lines of evidence (measured vacuum vs. model). The model curves show that an induced vacuum of 2 to 6 Pa (1 Pa = 0.004 in-H
2O) would be expected to occur at
radial distance corresponding to the ROI values derived from the simplistic graphical method in Figure 7. In other words, the mathematical analysis calculates a finite vacuum level at the same radius where the simple empirical semi-log plot would be extrapolated to a vacuum of zero. Note, however, that true zero vacuum would never be attained for the limiting case of no leakage (fully confined flow) and infinite slab dimensions. This is significant because even
Figure 6. Curve fitting to derive transmissivity and leakance values from a monitoring probe 16.9 m east of the block F HPV extrac-tion point.
Figure 5. Block F transient recovery and drawdown data at two monitoring probes (16.9 and 5.9 m from the block F HPV test point, respectively).
NGWA.org T.A. McAlary et al./ Ground Water Monitoring & Remediation 30, no. 2: 73–85 81
very low subslab vacuum levels are sufficient to reduce or reverse the volumetric flow of soil gas into a building, which dramatically decreases the potential for vapor intru-sion (Abreu and Johnson 2005). However, static measure-ments of low vacuum levels become increasingly difficult to resolve against typical pressure fluctuations, which are commonly at least a few pascals (Luo et al. 2009). This is a common practical challenge associated with designing subslab depressurization systems based on static vacuum measurements alone. In fact, the target vacuum level for subslab depressurization systems is often set at levels higher than typical fluctuations (e.g., American Society for Testing and Materials 2001, which recommends 6 to 9 Pa of applied vacuum for a subslab depressurization system). Figure 8 shows that the applied vacuum extends far beyond the ROI values that would be derived from Figure 7.
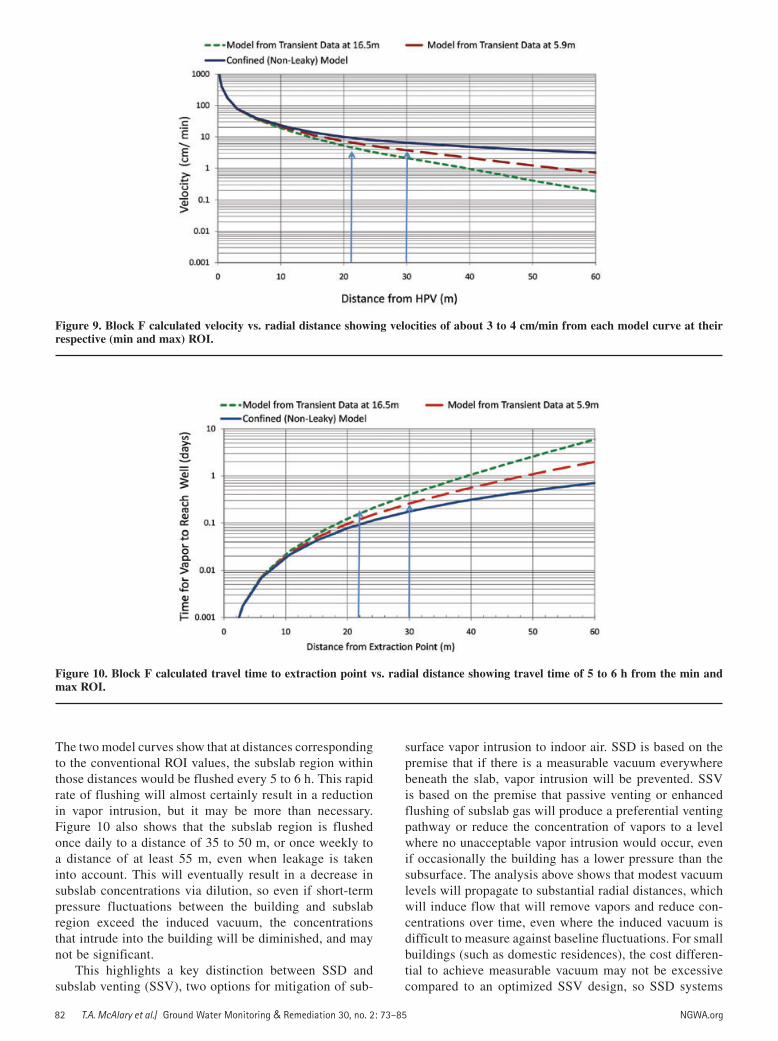
The mathematical analysis can also be used to plot the relationship of induced velocity as a function of radial dis-tance (Figure 9) by using Equation 2 and Darcy’s law. The
Figure 7. Block F measured vacuum vs. radial distance showing conventional vacuum vs. log-radius lines for upper and lower esti-mates of ROI (22 and 30 m).
Figure 8. Block F calculated vacuum vs. radial distance showing model curves from transient analyses and calculated vacuum at 22 and 30 m of 2 and 6 Pa.
induced velocity at distances corresponding to the conven-tional ROI estimates is about 3 to 4 cm/min. For context, one could estimate the upward velocity of vapors toward a building. Johnson (2002) showed that the volumetric flow of soil gas into a typical residential building is seldom above 10 L/min. Dividing that by a typical footprint area of 100 m2 and a porosity of 0.3 yields an upper range estimate of soil gas velocity into residences on the order of 0.003 cm/min. Intuitively, an induced velocity 1000 times higher than the ambient velocity would seem likely to be much more than the minimum required for containment. Figure 9 shows that the induced velocity remains at least an order of magnitude higher than the maximum intrusion velocity to a radius of at least 60 m. This information could potentially provide the basis to reduce the number of extraction points required to achieve an effective subslab mitigation system.
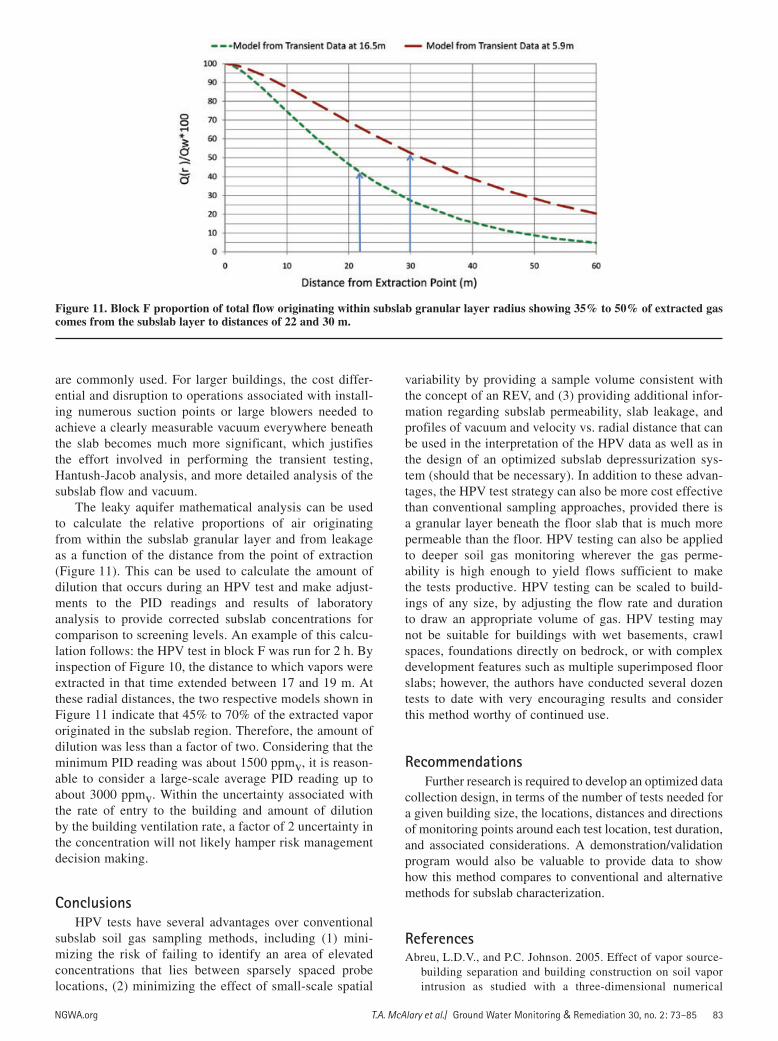
The mathematical analysis can also be used to calcu-late the travel time for subslab vapor to be drawn from a certain radial distance to the extraction point (Figure 10).
82 T.A. McAlary et al./ Ground Water Monitoring & Remediation 30, no. 2: 73–85 NGWA.org
Figure 9. Block F calculated velocity vs. radial distance showing velocities of about 3 to 4 cm/min from each model curve at their respective (min and max) ROI.
Figure 10. Block F calculated travel time to extraction point vs. radial distance showing travel time of 5 to 6 h from the min and max ROI.
The two model curves show that at distances corresponding to the conventional ROI values, the subslab region within those distances would be flushed every 5 to 6 h. This rapid rate of flushing will almost certainly result in a reduction in vapor intrusion, but it may be more than necessary. Figure 10 also shows that the subslab region is flushed once daily to a distance of 35 to 50 m, or once weekly to a distance of at least 55 m, even when leakage is taken into account. This will eventually result in a decrease in subslab concentrations via dilution, so even if short-term pressure fluctuations between the building and subslab region exceed the induced vacuum, the concentrations that intrude into the building will be diminished, and may not be significant.
This highlights a key distinction between SSD and subslab venting (SSV), two options for mitigation of sub-
surface vapor intrusion to indoor air. SSD is based on the premise that if there is a measurable vacuum everywhere beneath the slab, vapor intrusion will be prevented. SSV is based on the premise that passive venting or enhanced flushing of subslab gas will produce a preferential venting pathway or reduce the concentration of vapors to a level where no unacceptable vapor intrusion would occur, even if occasionally the building has a lower pressure than the subsurface. The analysis above shows that modest vacuum levels will propagate to substantial radial distances, which will induce flow that will remove vapors and reduce con-centrations over time, even where the induced vacuum is difficult to measure against baseline fluctuations. For small buildings (such as domestic residences), the cost differen-tial to achieve measurable vacuum may not be excessive compared to an optimized SSV design, so SSD systems
NGWA.org T.A. McAlary et al./ Ground Water Monitoring & Remediation 30, no. 2: 73–85 83
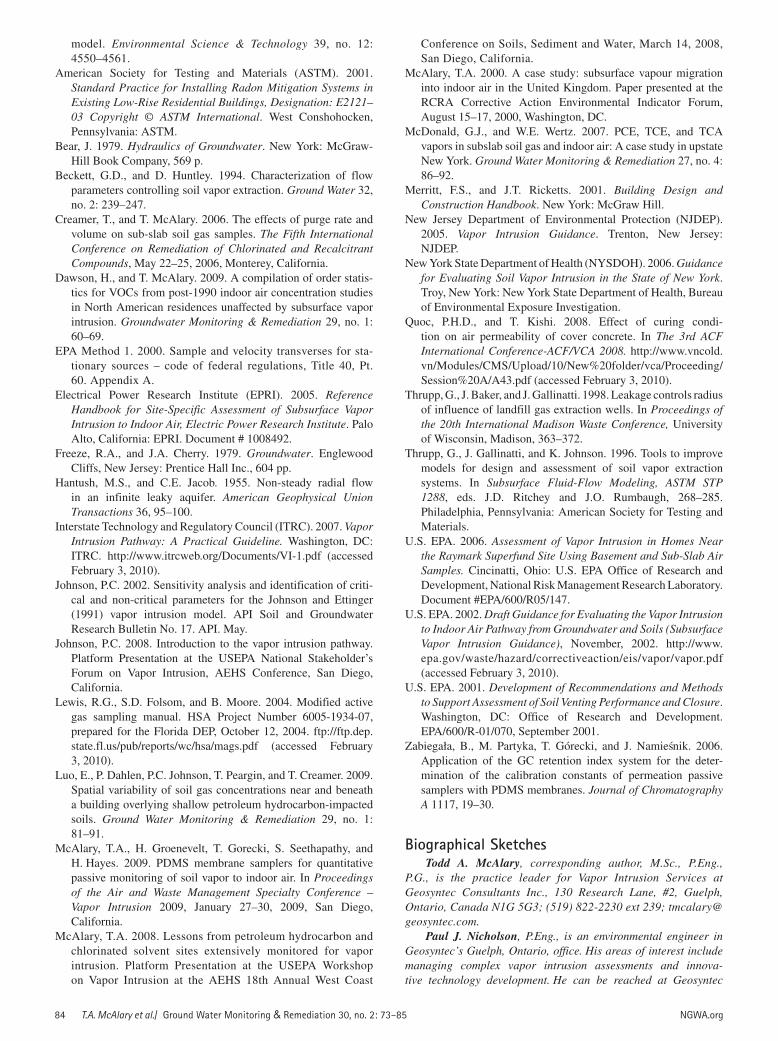
Figure 11. Block F proportion of total flow originating within subslab granular layer radius showing 35% to 50% of extracted gas comes from the subslab layer to distances of 22 and 30 m.
are commonly used. For larger buildings, the cost differ-ential and disruption to operations associated with install-ing numerous suction points or large blowers needed to achieve a clearly measurable vacuum everywhere beneath the slab becomes much more significant, which justifies the effort involved in performing the transient testing, Hantush-Jacob analysis, and more detailed analysis of the subslab flow and vacuum.
The leaky aquifer mathematical analysis can be used to calculate the relative proportions of air originating from within the subslab granular layer and from leakage as a function of the distance from the point of extraction (Figure 11). This can be used to calculate the amount of dilution that occurs during an HPV test and make adjust-ments to the PID readings and results of laboratory analysis to provide corrected subslab concentrations for comparison to screening levels. An example of this calcu-lation follows: the HPV test in block F was run for 2 h. By inspection of Figure 10, the distance to which vapors were extracted in that time extended between 17 and 19 m. At these radial distances, the two respective models shown in Figure 11 indicate that 45% to 70% of the extracted vapor originated in the subslab region. Therefore, the amount of dilution was less than a factor of two. Considering that the minimum PID reading was about 1500 ppmv, it is reason-able to consider a large-scale average PID reading up to about 3000 ppmv. Within the uncertainty associated with the rate of entry to the building and amount of dilution by the building ventilation rate, a factor of 2 uncertainty in the concentration will not likely hamper risk management decision making.
ConclusionsHPV tests have several advantages over conventional
subslab soil gas sampling methods, including (1) mini-mizing the risk of failing to identify an area of elevated concentrations that lies between sparsely spaced probe locations, (2) minimizing the effect of small-scale spatial
variability by providing a sample volume consistent with the concept of an REV, and (3) providing additional infor-mation regarding subslab permeability, slab leakage, and profiles of vacuum and velocity vs. radial distance that can be used in the interpretation of the HPV data as well as in the design of an optimized subslab depressurization sys-tem (should that be necessary). In addition to these advan-tages, the HPV test strategy can also be more cost effective than conventional sampling approaches, provided there is a granular layer beneath the floor slab that is much more permeable than the floor. HPV testing can also be applied to deeper soil gas monitoring wherever the gas perme-ability is high enough to yield flows sufficient to make the tests productive. HPV testing can be scaled to build-ings of any size, by adjusting the flow rate and duration to draw an appropriate volume of gas. HPV testing may not be suitable for buildings with wet basements, crawl spaces, foundations directly on bedrock, or with complex development features such as multiple superimposed floor slabs; however, the authors have conducted several dozen tests to date with very encouraging results and consider this method worthy of continued use.
RecommendationsFurther research is required to develop an optimized data
collection design, in terms of the number of tests needed for a given building size, the locations, distances and directions of monitoring points around each test location, test duration, and associated considerations. A demonstration/validation program would also be valuable to provide data to show how this method compares to conventional and alternative methods for subslab characterization.
ReferencesAbreu, L.D.V., and P.C. Johnson. 2005. Effect of vapor source-
building separation and building construction on soil vapor intrusion as studied with a three-dimensional numerical
84 T.A. McAlary et al./ Ground Water Monitoring & Remediation 30, no. 2: 73–85 NGWA.org
model. Environmental Science & Technology 39, no. 12: 4550–4561.
American Society for Testing and Materials (ASTM). 2001. Standard Practice for Installing Radon Mitigation Systems in Existing Low-Rise Residential Buildings, Designation: E2121–03 Copyright © ASTM International. West Conshohocken, Pennsylvania: ASTM.
Bear, J. 1979. Hydraulics of Groundwater. New York: McGraw-Hill Book Company, 569 p.
Beckett, G.D., and D. Huntley. 1994. Characterization of flow parameters controlling soil vapor extraction. Ground Water 32, no. 2: 239–247.
Creamer, T., and T. McAlary. 2006. The effects of purge rate and volume on sub-slab soil gas samples. The Fifth International Conference on Remediation of Chlorinated and Recalcitrant Compounds, May 22–25, 2006, Monterey, California.
Dawson, H., and T. McAlary. 2009. A compilation of order statis-tics for VOCs from post-1990 indoor air concentration studies in North American residences unaffected by subsurface vapor intrusion. Groundwater Monitoring & Remediation 29, no. 1: 60–69.
EPA Method 1. 2000. Sample and velocity transverses for sta-tionary sources – code of federal regulations, Title 40, Pt. 60. Appendix A.
Electrical Power Research Institute (EPRI). 2005. Reference Handbook for Site-Specific Assessment of Subsurface Vapor Intrusion to Indoor Air, Electric Power Research Institute. Palo Alto, California: EPRI. Document # 1008492.
Freeze, R.A., and J.A. Cherry. 1979. Groundwater. Englewood Cliffs, New Jersey: Prentice Hall Inc., 604 pp.
Hantush, M.S., and C.E. Jacob. 1955. Non-steady radial flow in an infinite leaky aquifer. American Geophysical Union Transactions 36, 95–100.
Interstate Technology and Regulatory Council (ITRC). 2007. Vapor Intrusion Pathway: A Practical Guideline. Washington, DC: ITRC. http://www.itrcweb.org/Documents/VI-1.pdf (accessed February 3, 2010).
Johnson, P.C. 2002. Sensitivity analysis and identification of criti-cal and non-critical parameters for the Johnson and Ettinger (1991) vapor intrusion model. API Soil and Groundwater Research Bulletin No. 17. API. May.
Johnson, P.C. 2008. Introduction to the vapor intrusion pathway. Platform Presentation at the USEPA National Stakeholder’s Forum on Vapor Intrusion, AEHS Conference, San Diego, California.
Lewis, R.G., S.D. Folsom, and B. Moore. 2004. Modified active gas sampling manual. HSA Project Number 6005-1934-07, prepared for the Florida DEP, October 12, 2004. ftp://ftp.dep.state.fl.us/pub/reports/wc/hsa/mags.pdf (accessed February 3, 2010).
Luo, E., P. Dahlen, P.C. Johnson, T. Peargin, and T. Creamer. 2009. Spatial variability of soil gas concentrations near and beneath a building overlying shallow petroleum hydrocarbon-impacted soils. Ground Water Monitoring & Remediation 29, no. 1: 81–91.
McAlary, T.A., H. Groenevelt, T. Gorecki, S. Seethapathy, and H. Hayes. 2009. PDMS membrane samplers for quantitative passive monitoring of soil vapor to indoor air. In Proceedings of the Air and Waste Management Specialty Conference – Vapor Intrusion 2009, January 27–30, 2009, San Diego, California.
McAlary, T.A. 2008. Lessons from petroleum hydrocarbon and chlorinated solvent sites extensively monitored for vapor intrusion. Platform Presentation at the USEPA Workshop on Vapor Intrusion at the AEHS 18th Annual West Coast
Conference on Soils, Sediment and Water, March 14, 2008, San Diego, California.
McAlary, T.A. 2000. A case study: subsurface vapour migration into indoor air in the United Kingdom. Paper presented at the RCRA Corrective Action Environmental Indicator Forum, August 15–17, 2000, Washington, DC.
McDonald, G.J., and W.E. Wertz. 2007. PCE, TCE, and TCA vapors in subslab soil gas and indoor air: A case study in upstate New York. Ground Water Monitoring & Remediation 27, no. 4: 86–92.
Merritt, F.S., and J.T. Ricketts. 2001. Building Design and Construction Handbook. New York: McGraw Hill.
New Jersey Department of Environmental Protection (NJDEP). 2005. Vapor Intrusion Guidance. Trenton, New Jersey: NJDEP.
New York State Department of Health (NYSDOH). 2006. Guidance for Evaluating Soil Vapor Intrusion in the State of New York. Troy, New York: New York State Department of Health, Bureau of Environmental Exposure Investigation.
Quoc, P.H.D., and T. Kishi. 2008. Effect of curing condi-tion on air permeability of cover concrete. In The 3rd ACF International Conference-ACF/VCA 2008. http://www.vncold.vn/Modules/CMS/Upload/10/New%20folder/vca/Proceeding/Session%20A/A43.pdf (accessed February 3, 2010).
Thrupp, G., J. Baker, and J. Gallinatti. 1998. Leakage controls radius of influence of landfill gas extraction wells. In Proceedings of the 20th International Madison Waste Conference, University of Wisconsin, Madison, 363–372.
Thrupp, G., J. Gallinatti, and K. Johnson. 1996. Tools to improve models for design and assessment of soil vapor extraction systems. In Subsurface Fluid-Flow Modeling, ASTM STP 1288, eds. J.D. Ritchey and J.O. Rumbaugh, 268–285. Philadelphia, Pennsylvania: American Society for Testing and Materials.
U.S. EPA. 2006. Assessment of Vapor Intrusion in Homes Near the Raymark Superfund Site Using Basement and Sub-Slab Air Samples. Cincinatti, Ohio: U.S. EPA Office of Research and Development, National Risk Management Research Laboratory. Document #EPA/600/R05/147.
U.S. EPA. 2002. Draft Guidance for Evaluating the Vapor Intrusion to Indoor Air Pathway from Groundwater and Soils (Subsurface Vapor Intrusion Guidance), November, 2002. http://www.epa.gov/waste/hazard/correctiveaction/eis/vapor/vapor.pdf (accessed February 3, 2010).
U.S. EPA. 2001. Development of Recommendations and Methods to Support Assessment of Soil Venting Performance and Closure. Washington, DC: Office of Research and Development. EPA/600/R-01/070, September 2001.
Zabiegała, B., M. Partyka, T. Górecki, and J. Namiesnik. 2006. Application of the GC retention index system for the deter-mination of the calibration constants of permeation passive samplers with PDMS membranes. Journal of Chromatography A 1117, 19–30.
Biographical SketchesTodd A. McAlary, corresponding author, M.Sc., P.Eng.,
P.G., is the practice leader for Vapor Intrusion Services at Geosyntec Consultants Inc., 130 Research Lane, #2, Guelph, Ontario, Canada N1G 5G3; (519) 822-2230 ext 239; [email protected].
Paul J. Nicholson, P.Eng., is an environmental engineer in Geosyntec’s Guelph, Ontario, office. His areas of interest include managing complex vapor intrusion assessments and innova-tive technology development. He can be reached at Geosyntec

NGWA.org T.A. McAlary et al./ Ground Water Monitoring & Remediation 30, no. 2: 73–85 85
Consultants Inc., 130 Research Lane, #2, Guelph, Ontario, Canada N1G 5G3; [email protected].
Lee Kim Yik is a senior staff engineer with GSM Consultancy (a wholly owned subsidiary of Geosyntec Consultants) in Kuala Lumpur, Malaysia. He can be reached at GSM Consultancy (M), Sdn. Bhd., Phileo Damansara 1, Kuala Lumpur, Malaysia; [email protected].
David M. Bertrand, B.Sc., P.Geo., is a hydrogeologist in Geosyntec’s Guelph, Ontario office. His areas of interest include
vapor intrusion assessment and mitigation. He can be reached at Geosyntec Consultants Inc., 130 Research Lane, #2, Guelph, Ontario, Canada N1G 5G3; [email protected].
Gordon Thrupp, Ph.D., P.G., C.H.G., is an associate hydro-geologist in Geosyntec’s Oakland, California, office. His areas of specialization include mathematical modeling of subsurface flow and contaminant transport. He can be reached at Geosyntec Consultants Inc., 475 14th Street, Suite 400, Oakland, California 94612; [email protected].
Recognize your fellow groundwater colleagues who have made a difference through their leadership, accomplishments, insights, and support of the groundwater industry.
Nominations accepted for each of the following categories:
Nomination forms are available at www.ngwa.org or call Rachel at 800 551.7379 (614 898.7791).
NGWA Awards of ExcellenceRoss L. Oliver Award, M. King Hubbert Award, Robert Storm Interdivisional Cooperation Award, Technology Award, Honorary Member Award, Life Member Award, Safety Advocate Award, and Equipment Design Award
Outstanding Ground Water Project AwardsRemediation, Supply, and Protection
NGWA Divisional AwardsJohn Hem Award, Keith E. Anderson Award, Manufacturers Division Special Recognition Award, and NGWA Supplier of the Year
Honor a Leader in the Groundwater Community. Submit Your Award Nomination Today.
— NOMINATIONS FOR ALL AWARDS MUST BE SUBMITTED BY AUGUST 1, 2010 —