Hierarchical cluster classification of Iranian food ...
14
J Food Safe & Hyg; Vol 4 No. 1-2 Winter & Spring 2018 Hierarchical cluster classification of Iranian food manufacturing and processing industries Malek Hassanpour Department of Environmental science, UCS, Osmania University, Telangana State, India ARTICLEINFO ABSTRACT Article history: Received 17 Feb. 2018 Received in revised form 28 May. 2018 Accepted 07 Jun. 2018 Keywords: Hierarchical cluster; Food manufacturing; Industries Clustering is a recognized data mining practice, which comprises the devising of a set of objects into a suitable classification of compatible cases. Current cluster study of Iranian food manufacturing industries encompassed food manufacturing and processing practices regarding the number of employees, energy consumed, input and output materials streams, flow-diagram of processes and also the land area used individually. It was used SPSS Software along with Delphi Fuzzy set theory (incorporated with simple additive weighting) to classify about 57 Food Manufacturing and Processing Industries (FMPI) as a hierarchical cluster. According to the t-test analysis, there is no significant difference among 57 FMPI and their criteria such as employees, power, water, land, and fuel. The obtained results were revealed the ranks values (weights) around 2.17, 3.95, 1.64, 2.26 and 4.98 for employees, power, water, fuel, and land criteria extracted from both Kendall's W and Friedman tests respectively. Also, it was found values around 180.749 and 0.793 for Chi-square and Kendall's Coefficient of Concordance in the Friedman and Kendall's W tests respectively. Mean Cronbach's Alpha based on the mean Eigenvalue was acquired about α=1. Pearson correlation analysis had shown the highest correlation between both factors of land and employees about 0.798. Finally, a hierarchical cluster classification was developed for the 57 FMPI. Citation: Hassanpour M. Hierarchical cluster classification of Iranian food manufacturing and processing industries. J Food Safe & Hyg 2018; 4(1-2): 27-40 1. Introduction The food industry is one of the prominent processing industries that is undergoing major developmental stages in food processing practices and technologies. It always needs to ensure the safety and quality of the food products. Various factors are involved in buying food products and attracting customers to purchase and maintain market prosperity. These factors play a significant role in all stages of food generation, encompassing processing, handling and maintaining its safety. Available data for FMPI is not sufficient in terms of water, fuel, power, consumptions, as well as a land area used, input and output materials streams. The FMPI are important for human survival and are also the main consumers of * Corresponding author. Tel: +98918978811723 E-mail address: [email protected] energy. According to recent studies over 66% of global freshwater exploitation is taken into account for FMPI. Many studies revealed that the global population growth is predicted to rise by 33% between 2011 and 2050, consequently comes into view over 9 billion inhabitants. The demand for food is expected to rise around 60% (Based on the recent report published by the United Nations World Water Assessment Program, 2016) (1). Nowadays, food manufacturing modernized, developed and focused on employing high levels of technology for generation and also logistics strategies to escalate efficiencies or design innovative food products. This is while our knowledge even is not sufficient about running FMPI technologies (2). The food industry has an important impact on consumption
-
Upload
khangminh22 -
Category
Documents
-
view
6 -
download
0
Transcript of Hierarchical cluster classification of Iranian food ...

J Food Safe & Hyg; Vol 4 No. 1-2 Winter & Spring 2018
Hierarchical cluster classification of Iranian food manufacturing and processing industries
Malek Hassanpour
Department of Environmental science, UCS, Osmania University, Telangana State, India
ARTICLEINFO ABSTRACT
Article history:
Received 17 Feb. 2018 Received in revised form 28 May. 2018
Accepted 07 Jun. 2018
Keywords: Hierarchical cluster;Food manufacturing;Industries
Clustering is a recognized data mining practice, which comprises the devising of a set of objects into
a suitable classification of compatible cases. Current cluster study of Iranian food manufacturing
industries encompassed food manufacturing and processing practices regarding the number of
employees, energy consumed, input and output materials streams, flow-diagram of processes and
also the land area used individually. It was used SPSS Software along with Delphi Fuzzy set theory
(incorporated with simple additive weighting) to classify about 57 Food Manufacturing and
Processing Industries (FMPI) as a hierarchical cluster. According to the t-test analysis, there is no
significant difference among 57 FMPI and their criteria such as employees, power, water, land, and
fuel. The obtained results were revealed the ranks values (weights) around 2.17, 3.95, 1.64, 2.26 and
4.98 for employees, power, water, fuel, and land criteria extracted from both Kendall's W and
Friedman tests respectively. Also, it was found values around 180.749 and 0.793 for Chi-square and Kendall's Coefficient of Concordance in the Friedman and Kendall's W tests respectively. Mean
Cronbach's Alpha based on the mean Eigenvalue was acquired about α=1. Pearson correlation
analysis had shown the highest correlation between both factors of land and employees about 0.798.
Finally, a hierarchical cluster classification was developed for the 57 FMPI.
Citation: Hassanpour M. Hierarchical cluster classification of Iranian food manufacturing and processing industries. J
Food Safe & Hyg 2018; 4(1-2): 27-40
1. IntroductionThe food industry is one of the prominent
processing industries that is undergoing major developmental stages in food processing practices and technologies. It always needs to ensure the safety and quality of the food products. Various factors are involved in buying food products and attracting customers to purchase and maintain market prosperity.
These factors play a significant role in all stages of food generation, encompassing processing, handling and maintaining its safety. Available data for FMPI is not sufficient in terms of water, fuel, power, consumptions, as well as a land area used, input and output materials streams. The FMPI are important for human survival and are also the main consumers of
* Corresponding author. Tel: +98918978811723 E-mail address: [email protected]
energy. According to recent studies over 66% of global freshwater exploitation is taken into account for FMPI. Many studies revealed that the global population growth is predicted to rise by 33% between 2011 and 2050, consequently comes into view over 9 billion inhabitants. The demand for food is expected to rise around 60% (Based on the recent report published by the United Nations World Water Assessment Program, 2016) (1).
Nowadays, food manufacturing modernized, developed and focused on employing high levels of technology for generation and also logistics strategies to escalate efficiencies or design innovative food products. This is while our knowledge even is not sufficient about running FMPI technologies (2). The food industry has an important impact on consumption
28Hierarchical cluster classification of Iranian food manufacturing/ J Food Safe & Hyg 4(1-2): 27-40
http://jfsh.tums.ac.ir
patterns and assigns relevant technologies to convert raw products to fresh food for human demand. Variety of pathways and channels posed to mature, in which fresh foods can be generated (1). One-off production: This practice is employed when the customer orders a food item in his or her own will and favor like a birthday cake (2). Batch production: In this method, the market inventory for this type of food is ambiguous, and only in certain circumstances or in a particular production line, it is possible to order or procure this product. A determined amount of the identical commodities will be generated to compose a batch (3). Mass production: it takes into consideration a mass market or a heavy demand for huge amounts of same products which must undergo multiple lines of generation processes. For instance, various chocolates, ready meals and canned products (4). Just-in-time production: It is a type of food provision is seen as a common situation in small units like restaurants. All compounds of the food are accessible wherever we seek and the clients select whatever they need as prepared in a kitchen, or in front of the buyers (3,4).
Delphi Fuzzy methods help us to make the decision about available options when we have lots of criteria and factors. Different Multi-Criteria Decision-Making (MCDM) methods are utilized various computational levels and processes for data processing practices so depending on the diversity of data, various outcomes will be derived and released. In order to use a particular method, knowledge, and experience of specialists and decision makers play a key role to conduct and assign a proper pattern. In most real ambient, factors or criteria and their constraints are not definitive and cannot be realized especially; they are called uncertain or Fuzzy criteria. To employ a proper MCDM procedure under a Fuzzy situation, present research investigated and statistically ranked the FMPI base on 5 criteria such as fuel, water, and power consumptions values, number of employees and the land area used for around 57 FMPI as a certain cluster (5). Also, the current study comprised enough information about input and output material streams and full flow-diagrams of FMPI. The current research comprised the raw data calculated by Iranian evaluator team from both Iranian Industries Organization (IIO) and Iranian environmental protection Agency (IEPA). In this research, the data were processed in order to classify the industries. Halim lim et al. (2017) Hoffmann (2010)Rahimi et al. (2013) and Banaeian et al. (2018) haveperformed studies about food manufacturing industries using statistical and Delphi fuzzy procedures (6-9).
2. Materials and methods2.1. Source of data, Kendall's W and Friedman tests
Current cluster study comprised the data of about 57 FMPI. Data related to FMPI were collected from database published by IIO in the national language. Our data are the findings of the evaluator team of both IIO and IEPA once before the establishment of each industry. IBM SPSS Statistic 20 software was used to analyze the sub-criteria of industries.
In the Friedman test analysis, data appear as a matrix of [Xij] n×k. It is a matrix containing n rows and k columns that investigates the ranks within each block with a single result. In the matrix of [rij] n×k the entry rij is the rank of Xij within block i according to equations 1 to 5. The test statistic is calculated by equation 5.
Kendall's W calculates and manages the outcomes
regardless of the probability distribution and linearly
regarding the average value of the Spearman's rank
correlation coefficients among discovered ranks. By the
way, each object of I, is included the rank of rij for total
n objects and m values. The following equations of 6 to
9, were applied to compute the ranks values. In
equation 8, S is the sum of squared deviations. In order
to normalize and review the agreement between the
results of the Friedman test, Kendall W test is used. In
concluding the agreement, the result is presented with
W, as zero (full agreement) and one (lack of agreement).
The equation 9 is used to calculate the value of W by
SPSS software (10).
2.2. Fuzzy set theory
The weighing system was set based on, ∑ Wj𝑛𝑗 . Wij,
(j=0-1). Wij is the existing values in the matrix after the normalization process individually. Table 1 denotes the Fuzzy set.
Then, Fuzzy numbers were assigned to evaluate the existing values. Ultimately, equation 10 was employed to prioritize existing options in the present study. It needs to explain that by present research, the Fuzzy numbers were used to prioritize industries via Simple Additive Weighting (SAW) method. Data were arranged according to the Likert system and were normalized based on fuzzy numbers and obtained special vector from the Friedman test, was introduced to collect the weights according to equation 10 (11,12).

Hassanpour M./ J Food Safe & Hyg 4(1-2): 27-4029
http://jfsh.tums.ac.ir
ȓ. j =1
n ∑ 𝑟𝑖𝑗
𝑛
𝑖=1
(1)
ȓ =1
nk ∑ ∑ 𝑟𝑖𝑗
𝑘
𝑗=1
𝑛
𝑖=1
(2)
SSt = n ∑(ȓ. 𝑗 − ȓ)2
.
𝑗=1
(3)
SSe =1
n(k − 1) ∑ ∑(𝑟𝑖𝑗 − ȓ)2
𝑘
𝑗=1
𝑛
𝑖=1
(4)
Q =SSt
SSe (5)
Ri = n ∑(𝑟𝑖, 𝑗, . . )
𝑚
𝑗=1
(6)
Rave = 1/n ∑ Ri
𝑛
𝑖=1
(7)
S = ∑(Ri − Rave)2
𝑛
𝑖=1
(8)
W =12 S
m2(𝑛3 − 𝑛) (9)
A = ∑(𝑊𝑗. 𝑊𝑖𝑗)
𝑗
(10)
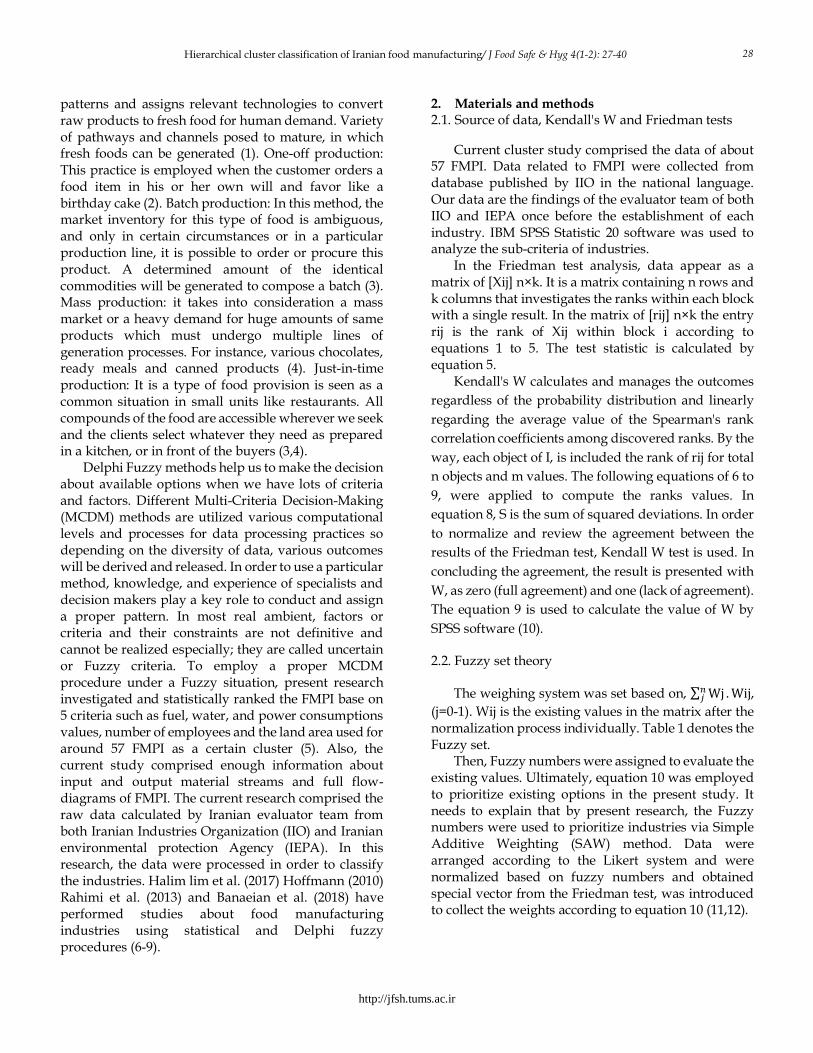
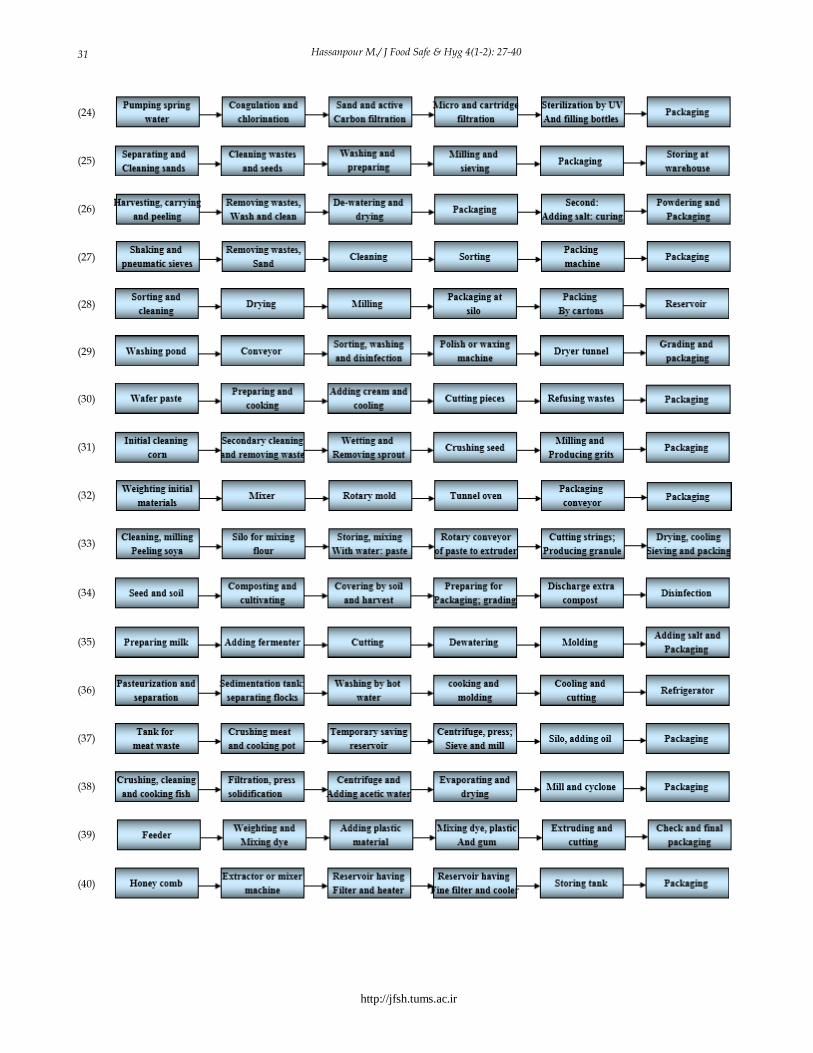
3. ResultsFigure 1 and Table 2 show FMP practices in Iranian
industries and input materials introduced into Iranian FMPI. Table 3 displays FMPI, number of staff, land area used and energy consumptions.
In this study, the Friedman test was used to evaluate 5 independent criteria based on real data, by which weighting style for the columns containing the large, medium and small values follow the same pattern. It means that the column containing large values produce large weight value and vice versa. Therefore, the results can be used as a weighing system for ranking options. But for future industrial development goals, Entropy Shannon's weighing system has had excellent results with negative and positive criteria. The obtained results were revealed the rank (weights) values around land (4.98)> power (3.95) > fuel (2.26) > employees (2.17) > water (1.64) from both Kendall's W and Friedman tests respectively. Therefore, the vector of weights (WJ) was determined based on the obtained values. Tables 4 and 5 display criteria/symbols versus factors based on Likert spectrum and decision matrix set in the fuzzy system respectively.
Table 1. Delphi Fuzzy set
(1)
(2)
(3)
(4)
(5)
(6)
Symbol VL L SL M SH H VH
Verbal words Very low Low Slightly low Medium Slightly high High Very high
Real value (0.09,0, 0.1) (0.2, 0.1, 0.1) (0.3, 0.1, 0.2) (0.5, 0.1, 0.1) (0.6, 0.1, 0.2) (0.8, 0.1, 0.1) (0.85, 0.1, 0)
Fuzzy number 0.1362 0.2272 0.3695 0.5 0.6304 0.7727 0.8636

Hierarchical cluster classification of Iranian food manufacturing/ J Food Safe & Hyg 4(1-2): 27-40 30
http://jfsh.tums.ac.ir
(7)
(8)
(9)
(10)
(11)
(12)
(13)
(14)
(15)
(16)
(17)
(18)
(19)
(20)
(21)
(22)
(23)
Hassanpour M./ J Food Safe & Hyg 4(1-2): 27-4031
http://jfsh.tums.ac.ir
(24)
(25)
(26)
(27)
(28)
(29)
(30)
(31)
(32)
(33)
(34)
(35)
(36)
(37)
(38)
(39)
(40)

Hierarchical cluster classification of Iranian food manufacturing/ J Food Safe & Hyg 4(1-2): 27-40 32
http://jfsh.tums.ac.ir
(41)
(42)
(43)
(44)
(45)
(46)
(47)
(48)
(49)
(50)
(51)
(52)
(53)
(54)
(55)
(56)

Hassanpour M./ J Food Safe & Hyg 4(1-2): 27-4033
http://jfsh.tums.ac.ir
(57)
Up to down; Non alcoholic beer (1), Cake and muffins (2), Canned Beans and Caviar Eggplant (3), Canned fish (tuna) (4), Canned
meat (5), Canned mushrooms (6), Compote (7), Concentrated fructose syrup of corn sugar (8), Corn Flakes (9), Industrial Bread (10), Marine food (11), Glucose from starch (12), Hamburger (13), Margarine (14), Milk, yogurt and pasteurized cream (15), Date sap (16), Potatoe based foods (17), Poultry slaughterhouse (18), Iodinized salt (19), Starch from wheat (20), Treating fish (21), Waffer chocolate
(22), Alcohol from beet molasses (23), Mineral water (24), Wheat flour (25), Pistachio packaging (26), Packing grains; peeling off barley (27), Spice Packing (28), Fruit packaging (29), Wafer biscuits (30), Corn grits (31), Biscuit (32), Soya protein (33), Mushroom cultivation
(34), Cheese from fresh milk (35), Pizza Cheese (36), Meat and Olive Industrial Powder (37), Fish powder (38), Artificial sausage and sausage coating (39), Preparation; packaging of honey (40), Purification and packaging of salt (41), Cream dye (42), Dates and liquid
sugar (43), Smoked fish (44), Tomato paste (45), Flour string (46), Olive oil (47), Oil Seeds from Vegetable Seeds (except soya ; olive) (48), Drying oils (49), Dried vegetables (50), Soya sauce (51), Ketchup (52), Food sauces (53), Raisin Packaging (54), Dates packaging (55), Sausage (56), Ice (57).
Figure 1. Food manufacturing and processing practices in Iranian industries [This study]
Table 2. Input materials introduced into Iranian FMPI [This study]
Industry Initial materials
(1) Concentrated malt juice (410t); Sugar (700t); Bottles labels (30.5 millions); Glass bottles of 330 ml (30.2 millions)
(2) Flour (254500 kg); Eggs (35600 No); Sugar (139200); Milk (45450 kg); Oil (45400 kg); Baking powder (6 kg); Flavors (4 kg); Cellophane (1575.6 No); Carton (226931 No): Gum (1000 kg)
(3) Pinto beans (512t); Tomato paste (153t); Salt (2t); Oil (20.5); Cans (3700 No); Carton (2840 No); Tomato (263t) (4) Fish (2820t); Cans with capacity of 200 g (11220 No); Salt (90t); Oil (393t); Paper labels (11000 No); Packaging cartons (229200 No)
(5) Meat (1950t); Salt and NO2 (34.5t); Cans with capacity of 200 g (6825 No); Paper labels (6825 No); Packaging cartons 20*33*30 cm3 (142543 No); Oil (101.5t)
(6) Agaricus mushrooms (778t); Salt (31t); Cans with capacity of 500 g (2800 No); Paper labels (2800 No); Cardboard (58500 No)
(7) Various fruits (2037t); Pure sugar (335t); Acid acetic (4 No); Cans, 0.5 kg (8320000 No); Labels (8400000 No); Packaging carton containing 48 empty spaces (165000 kg); Vitamin C (126 No)
(8) Corn starch (7200t)
(9) Corn (561t); Sugar (95.5t); Salt (11.1t); Liquid sugar cube (14t); Glycerol Mono Stearates (2.2t); Malt juice (5t); Banana juice (2.4 t): Pre-mixed vitamin of 7 types (1.7t); Packaging plastic with width of 43 and 61 cm (38400 and 120000 No); Cardboards of 30*16*5, 38*25*5,
50*32*24 and 50*50*38 cm3 (1600, 400000, 80000 and 20000 No) (10) Flour (750t); Salt (17t); Sugar (30t): Cooking oil (20t); Fermentation powder (8.75t); Additives (6t); Eggs (15t)
(11) Cereal flour (2400t); Fish powder (3000t); Starch (1800t); Soya powder (840t); Grain (2400t); Sugar beet molasses (840t); Fat (720t)
(12) Starch (2181600 kg); HCL (15196 kg); NaCO3 (4527 kg); Perlite soil (32562 kg); Active carbon (9769 kg); Filter cloth (910 m); Barrels
(1206 No)
(13) Meat (504000 kg); Soya (72000 kg); Guillotine (80000 kg); Onion (150000 kg); Salt (20000 kg); Spice (10000 kg); Toasted flour (92000 kg); Waxy paper (20000 kg); Packaging carton (50000 kg); Cooking oil (50000 kg)
(14) Vegetable oil (9600t); Salt 2-3% (360t); Additives (24t); Beta carotene (12t); Emulsifier (36t); Clay soil (50t); Sorbic acid (18t); Anti- oxidant (550 kg); Filtration materials (8t); Catalyst (5t); Packaging materials (300000 No)
(15) Milk (8400t); NaOH (30t); HNO3 (21t); Sodium hypochlorite (1t); Al sheets (12.8t); Glass bottles (2000 No); Plastic bags (56t); Boxes holding 20 and 60 empty spaces (100 and 35 No)
(16) Date (2000t); Plastic gallon, 200 kg (6000 No); Lime, package of 50 kg (20t); Active charcoal, package of 50 kg (3t)
(17) Potato (900t); Liquid oil (61.2t); Salt (21t); Spice (8.5t); Cellophane 15*24 and 20*25 cm2 (2000 and 4000 No); Cardboard boxes containing dimension of aound 15*15*20 cm3 (2000 No); Cardboard cartons containing dimension of around 75*75*40 cm3 (40000
No); LDHP containing dimension of around 20*30 and 100*40 cm2 (40000 and 1800 No);
(18) PE plastic, 5 g for each hen (18900 No); Carton (378000 No); Disinfectant (CL2), (550 kg); FeCl3 (2650 kg); Poly-electrolyte (275 kg);
Caustic soda (570 kg) (19) Salt stone 97% (12000t); KI (550 kg); Sodium thiosulfate (105t); CO3 (21t); LDPE (25.2t); HDPE (38.5t) (20) Wheat containing moisture of 14% (1600t); PP and plastic sacks, 40 kg (0.96 and 2.92t); Cartons (27200 No)
(21) Fish (1350t); Ice (1000t); NH3, capsules of 60 kg (5 No); Additives (130 kg); PE packaging materials (150 No); Cartons (8920 No); Plastic wrap (1300 kg); Disposable tableware (41200 No); PE film (1050 kg); PE boxes, 60 kg (200 No)
(22) Flour (195.75t); Oil (90.5t); Sugar 99.8% (126.25t); Chocolate (85.25t); Dry milk (6.5t); Lecithin (4t); Baking soda (500 kg); Ammonium bicarbonate (750 kg); HNO3 (500 kg); Freshener (250 kg); NaCl (500 kg); Al foil (30.75 kg); Boxes with size of 8*8.4*14 cm3 (842500
No); Cartons of 20 kg (25250 No)
(23) Beet molasses, 45-50% sugar (5400t); Yeast (2900 kg); Types of Ammonium Salt (14100 kg); H2SO4, 98% (37800 kg); Sugar (7800 kg); Anti foam (4000 L); Bottles of 600 cm3 (1417 No); Label (1390 No); Cartons having 12 empty spaces (114750 No); Tape (2500 No)
(24) Spring water (12000 m3); Cl2 (135 kg); Active carbon (80 kg); Plastic containers (12000 pieces)
(25) Wheat containing moisture of 10-14% (100t)
(26) Raw pistachio (1500t); Salt 99.21% (45t); Starch (15t); Citric acid (35t); Cellophane (12t); N2 (15t); Cardboard carton (30t); Packaging
glue (300 kg); Methyl bromide (900 kg) (27) Grains (1251.5t); Barley (1373t); Cellophane (22624 kg); Carton (230500); Tablets (1700 No)

Hierarchical cluster classification of Iranian food manufacturing/ J Food Safe & Hyg 4(1-2): 27-40 34
http://jfsh.tums.ac.ir
(28) Cinnamon, 13% moisture (31.5t); Turmeric,10% moisture (84t); Red pepper, 13% moisture (31.5t); Black pepper, 12% moisture (42t); Ginger, 12.5% moisture (21t); Cardamom, 13% moisture (21t); White pepper, 15% moisture (31.5t); Packaging materials (6562 kg)
(29) Especial boxes (505000 No); Cardboard boxes (404000 No); Perchlorine and methyl (1005 kg); Paraffin materials for polishing (5025 kg); Waxy paper (7575 kg)
(30) Dry milk (1.3t); Lecithin (1.02t); Freshener (2t); Ammonium bicarbonate (2t); Citric acid (2t); Al foil (2.06t); Wheat flour (486t); Sugar (310t); Vegetable oil (224t); Sodium Bicarbonate (1.03t); Carton in dimension of 18*24*45 cm3 (2.04t)
(31) Corn, 2-10% moisture and 37% carbohydrate (6000t); Plastic sack, sizes of 50*80 cm2, capacity of 50 kg made of PP (120000 No)
(32) Flour (683.4t); Sugar (122.4t); Vegetable oil (112.2t); Glucose (60.6t); Freshener (1010 kg); Cellophane for packaging (3800 kg); Carton (188700 No); Dry milk (20200 kg); Sodium Bicarbonate (14140 kg); Salt (5050 kg)
(33) Soybean meal, containing 36.7% protein (2470t); Pocket (115000 No)
(34) Straw (375t); Fertilizer (185t); Seed (15t); Urea (15t); Sugar beet molasses (15t); Hydrated plaster (28t); Toxicant (1000 L); Plastic dishes
0.5 and 1 kg (100000 and 50000 No); Cellophane (3750 No); Label (150000 No)
(35) Cow milk, containing 3.5% fat (7500000 kg); Cheese fermentative powder (20 kg); Calcium chloride (30 kg); Lactic materials (2000 kg); NaCl (60000 kg); Washing materials (6000 kg); Cans, 17 kg (18000 No); Tin (500 kg)
(36) Milk (324.111 kg); Vegetable oil (23058 kg); Cheese (3240 kg); Sodium citrate (651 kg); Cheese fermentative powder (32.4 kg); Cellophane (1515 kg); Carton (5100 kg); Plastic covers (15150 kg); Disinfectant (136 kg)
(37) Meat wastage (1575000 kg); Salt (9500 kg); Anti-oxidant (125 kg); Packaging bag (10000 No); Packaging barrels (284 No) (38) Fish (2500t); printed bags for packaging targets (10000 No)
(39) Poly amid-11 (74t); LDEP (123t); Bonding agent (25.5t); Dye (25.5t); Cardboard boxes of about 20*20*30 cm3 (85050 No); Carton with sizes of 30*40*60 cm3 (14884 No)
(40) Honey (458.28t); PE plates of 50 and 100 g (4582600 and 2291300 No); Al covers (2000 kg); Empty cartons, with sizes of 20*20*15 cm3
(91600 No)
(41) Salt (23700t); PE sacks of 40 kg (42600 kg); LDPE salt bags, 2-5 kg (13650 kg); LDPE cans of 700 g (3150000 No); Cartons of 24 empty
spaces and 25*25*30 cm3 in dimension (131250 No); Gum (480 No)
(42) Milk (1610t); Rlu 120 oil (14000 L); Plastic bags (3.5t); Chemical dye (30.8t); Natural dye (5.5t); Washing liquid (28t); Sedimentation
materials (28t); Salt (56t); PP sacks as roll (0.75t)
(43) Date grades of 1; 2-3 (3000; 6000t); Perlite (210t); Moss powder (25t); Cao (40t); Asbestos (4200 m); Acid acetic 20% (11t); Alkaline solution, 40% (600t); HCl, 35% (700t)
(44) Fish (180t); Salt (90t); Ice (225t); PE nylon (3t); Chip and dirt (410t); Carton (7575t)
(45) Tomato (7500t); Salt (50t); HClO (2t); NaOH (4t); Label (2500 No); Liquid gum (10000 No); Cans of 0.5 kg (765 and 1530 No); Cartons of 24 empty spaces (64000 No)
(46) Wheat flour, moisture 12% (262592 kg); Soya sauce (236736 kg); Salt 98% (47347.20 kg); Cooking oil (800 kg); Dried vegetables (80
kg); Monosodium (20 kg); Sugar (23673.60 kg); Spice (15 kg); Pepper sap (5 kg)
(47) Olive (352.5t); Bottles of 1000 cc (72000 No); Three layers cartons of 25*35*45 cm3 (3000 No); Labels (74300 No); Al caps of d= 30 mm (74300 No)
(48) Sunflower seeds, 40% oil and 12% moisture (4550t); Cotton seed, 20% oil and 15% moisture (4550t); PE bags, 50 kg (112000 No); Filter facilities (2700 kg)
(49) Oily seed (1500t); NaOH, purity of 99% (8t); H2SO4, 98% (60t); Activated bentonite (4t); Cans of 20 L (27000 No); PE bags, 50 kg (20000 No)
(50) Broad leafy vegetables (2400t); Perchlorine (2400 L); Cardboard boxes of around 17*25*3 cm3 (1470000 No); Reprinted carton of around 25*36*34 cm3 (64167 No); Cellophane (2125 No)
(51) Soy bean powder (100000 kg); Wheat (60000 kg); Salt (8000 kg); Water (98000 m3); Flavoring materials (80 kg)
(52) Ketchup (25000t); Sugar (660t); Salt (44t); Vinegar (130t); Spice (22t); Containers and accessories (13250 No); Packaging cartons with 24 empty spaces (552000 No); Preservatives (13.25t)
(53)
Vinegar 4% (97350 kg); Ketchup (211750 kg); Sugar (97350 kg); Onion (39655 kg); Oil (646800 kg); Starch (102850 kg); Eggs (68 062 No); Glasses of 300 g (50750000 No); Glass caps (50750000 No); Labels (50750000 No); Cartons of 24 empty spaces (211459 No); Glasses
of 120 g (1312500 No); Cartons of 60 empty spaces (21875 No); Plastic caps (1312500 No); Mustard powder (66000 kg); Mayonnaise sauce (114400 kg)
(54) Raisin (1100000 kg); Carton (113625 No); Sulfur (1333.2 kg); Tape (170437.5 m); Polishing oil (10710 kg); Waxy paper (590 kg) ;
Cellophane for packaging, 250 g (10200 kg) (55) Date (5000t); Methyl bromide (40t); Plastic bags, 5-20 kg (200000 No); Boxes (1500 No)
(56) Meat (550000 kg); Casein (10000 kg); Flour (30000 kg); Soya (21000 kg); Dried milk (40000 kg); Starch (60000 kg); Phosphate (5000 kg); Ascorbic acid (900 kg); Nitrate and sodium nitrite (150 kg); Salt (25000 kg); Spice (23000 kg); Additives (30000 kg); Eggs (150 kg); Garlic (5100 kg); Sausage PE cover (1500000 m); PE sausage cover (1430000 m); Vacuum packing cover (500 kg); Oil (140000 kg)
(57) Industrial grade salt, purity of 85% (2000 kg); NH3 (24 capsules)
HDPE=High density polyethylene, LDPE=Low density polyethylene, PE= Polyethylene, PP= Polypropylene
Table 3. FMPI, number of staff, land area used and energy consumptions [This study]
)2Land (m Fuel (Gj) )3Water (mPower (kw)EmployeesNominal capacity (t)Industry
9800 83 95 161 82 30000000 No (1) 3100231111833650(2)
8100 31 37 13645 3700 No (3)

Hassanpour M./ J Food Safe & Hyg 4(1-2): 27-4035
http://jfsh.tums.ac.ir
7200 102 145 193 75 11000 No+1056t(4) 6100 38 24 8228 2800000 No (6)
5200 68 35 30739 6500000 No (5) 11900 46 81 13368 8000000 No (7)
36005771312400(8) 7100481513829600(9)
160055 95 141000000(10) 340019 5 1749 1712000(11) 46006726199292160(12)
22003767161000(13)
8600217 23320 51 12000(14) 720026130306268255(15) 71003723174242000(16)
7900373921631800(17) 6400 10 15 196 39 3780000 No (18)
570082272292410000(19) 53001911175501580(20)
2400427217331000 (21) 24001249221500(22) 7100 241 50 132 41 1500000 No (23)
550097912412000(24) 71002415013241 27000(25)
27004877291269.5(26) 29002591172430(27)
1700 646413250(28) 46004151 122 3910000(29) 3400201587191000(30)
9700123 31301495800 (31) 3400201587191000(32)
50009916292261900(33) 7700472113326600(34)
80006333164141500(35) 3000213375191500(36) 300020812016545.5(37)
30003719 173 23500(38) 310042925835243(39)
3000 19 5 60 13 24000 No (40)
10200 10305092821600(41)
2380014587807124 1400 (42) 1610010340524 64 4680(43) 2400415671915(44)
5800119224411500(45) 4800 7 10 49 44 24192 No (46)
3400625526919280 (47) 360060360 10128338000(48)
20008915213221500(49) 3600 69 27 13833 1412000 No (50) 10700 17 13 828 45 60000 barrels+72000 bottles (51)
1040050113443616000(52)
4500 35 17 213 44 4451998 (bottles 300 g)+1250000
(bottles 120g)(53)
7600815 107311000(54) 25003419316400(55)
29003622177191000000(56) 21003542521812920(57)
Table 4. Criteria/symbols versus factors based on Likert Scale
Criteria /symbols Employees Power (kw) Water (m3) Fuel (Gj) Land (m2) Symbol
Very high 121-140 1001-1800 96-145 + 250 16501-24000 VH
High 101-120 601-1000 56-95 201-250 12501-16500 H Slightly high 81-100 401-600 41-55 101-200 10001-12500 SH Medium 61-80 301-400 31-40 76-100 7501-10000 M
Slightly low 41-60 201-300 21-30 51-75 5001-7500 SL

Hierarchical cluster classification of Iranian food manufacturing/ J Food Safe & Hyg 4(1-2): 27-40 36
http://jfsh.tums.ac.ir
Low 21-40 101-200 11-20 26-50 2501-5000 L Very low 0-20 0-100 0-10 0-25 0-2500 VL
Table 5. Decision matrix set in the fuzzy system (This study)
Because of limited space, the column of Nominal capacity was ignored to appear in this table.
Table 5 displays the hierarchical cluster classification of 57 FMPI based on obtained values and
5 criteria including the number of employees, power, water and fuel consumptions and land area values. A
Weights Land Fuel Water Power Employees Industry
7.152636 M(0.5) M(0.5) H(0.7727) L(0.2272) SH(.6304) (1)
3.20234 L(0.2272) VL(0.1362) L(0.2272) L(0.2272) L(0.2272) (2)
5.522727 M(0.5) L(0.2272) M(0.5) L(0.2272) SL(0.3695) (3)
6.663558 SL(0.3695) SH(.6304) VH(0.8636) L(0.2272) M(0.5) (4)
5.963204 SL(0.3695) SL(0.3695) M(0.5) M(0.5) L(0.2272) (5)
3.990576 SL(0.3695) L(0.2272) SL(0.3695) VL(0.1362) L(0.2272) (6)
6.902532 SH(.6304) L(0.2272) H(0.7727) L(0.2272) M(0.5) (7)
2.69365 L(0.2272) VL(0.1362) VL(0.1362) VL(0.1362) L(0.2272) (8)
4.116654 SL(0.3695) L(0.2272) L(0.2272) L(0.2272) L(0.2272) (9)
2.043 VL(0.1362) VL(0.1362) VL(0.1362) VL(0.1362) VL(0.1362) (10)
5.36941 L(0.2272) VL(0.1362) VL(0.1362) VH(0.8636) VL(0.1362) (11)
3.96297 L(0.2272) SL(0.3695) SL(0.3695) L(0.2272) L(0.2272) (12)
2.043 VL(0.1362) VL(0.1362) VL(0.1362) VL(0.1362) VL(0.1362) (13)
7.619097 M(0.5) H(0.7727) SL(0.3695) M(0.5) SL(0.3695) (14)
6.23791 SL(0.3695) L(0.2272) VH(0.8636) M(0.5) L(0.2272) (15)
4.350026 SL(0.3695) L(0.2272) SL(0.3695) L(0.2272) L(0.2272) (16)
5.776021 M(0.5) L(0.2272) M(0.5) SL(0.3695) L(0.2272) (17)
3.910994 SL(0.3695) VL(0.1362) L(0.2272) L(0.2272) L(0.2272) (18)
5.528639 SL(0.3695) M(0.5) SL(0.3695) SL(0.3695) L(0.2272) (19)
4.219785 SL(0.3695) VL(0.1362) L(0.2272) L(0.2272) SL(0.3695) (20)
3.544617 VL(0.1362) VL(0.1362) SL(0.3695) SL(0.3695) L(0.2272) (21)
2.24047 VL(0.1362) VL(0.1362) VL(0.1362) VL(0.1362) L(0.2272) (22)
6.319523 SL(0.3695) H(0.7727) SH(.6304) L(0.2272) SL(0.3695) (23)
3.402304 SL(0.3695) VL(0.1362) VL(0.1362) VL(0.1362) L(0.2272) (24)
6.319523 SL(0.3695) H(0.7727) SH(.6304) L(0.2272) SL(0.3695) (25)
2.69365 L(0.2272) VL(0.1362) VL(0.1362) VL(0.1362) L(0.2272) (26)
2.49618 L(0.2272) VL(0.1362) VL(0.1362) VL(0.1362) VL(0.1362) (27)
2.043 VL(0.1362) VL(0.1362) VL(0.1362) VL(0.1362) VL(0.1362) (28)
4.069248 L(0.2272) L(0.2272) SH(0.6304) L(0.2272) L(0.2272) (29)
2.64542 L(0.2272) VL(0.1362) L(0.2272) VL(0.1362) VL(0.1362) (30)
7.511519 M(0.5) SH(0.6304) M(0.5) M(0.5) SL(0.3695) (31)
2.64542 L(0.2272) VL(0.1362) L(0.2272) VL(0.1362) VL(0.1362) (32)
4.586613 L(0.2272) M(0.5) L(0.2272) SL(0.3695) L(0.2272) (33)
4.999916 M(0.5) L(0.2272) SL(0.3695) L(0.2272) L(0.2272) (34)
5.338064 M(0.5) SL(0.3695) M(0.5) L(0.2272) VL(0.1362) (35)
3.092812 L(0.2272) VL(0.1362) M(0.5) VL(0.1362) VL(0.1362) (36)
2.85563 L(0.2272) VL(0.1362) VL(0.1362) L(0.2272) VL(0.1362) (37)
3.408 L(0.2272) L(0.2272) L(0.2272) L(0.2272) L(0.2272) (38)
3.997797 L(0.2272) VL(0.1362) SL(0.3695) SL(0.3695) L(0.2272) (39)
2.49618 L(0.2272) VL(0.1362) VL(0.1362) VL(0.1362) VL(0.1362) (40)
7.036288 SH(.6304) VL(0.1362) SL(0.3695) SH(.6304) L(0.2272) (41)
11.918837 VH(0.8636) SH(0.6304) H(0.7727) H(0.7727) VH(0.8636) (42)
9.881686 H(0.7727) SH(.6304) SH(.6304) SH(.6304) M(0.5) (43)
2.19224 VL(0.1362) VL(0.1362) L(0.2272) VL(0.1362) VL(0.1362) (44)
4.63263 SL(0.3695) VL(0.1362) VL(0.1362) SL(0.3695) SL(0.3695) (45)
3.002441 L(0.2272) VL(0.1362) VL(0.1362) VL(0.1362) SL(0.3695) (46)
4.755461 L(0.2272) SL(0.3695) SH(.6304) SL(0.3695) VL(0.1362) (47)
4.697024 L(0.2272) VH(0.8636) VL(0.1362) L(0.2272) L(0.2272) (48)
4.133433 VL(0.1362) M(0.5) L(0.2272) SL(0.3695) L(0.2272) (49)
3.96297 L(0.2272) SL(0.3695) SL(0.3695) L(0.2272) L(0.2272) (50)
7.673792 SH(.6304) VL(0.1362) L(0.2272) H(0.7727) SL(0.3695) (51)
6.493496 SH(.6304) L(0.2272) L(0.2272) M(0.5) L(0.2272) (52)
4.278876 L(0.2272) L(0.2272) L(0.2272) SL(0.3695) SL(0.3695) (53)
4.560884 M(0.5) VL(0.1362) L(0.2272) L(0.2272) L(0.2272) (54)
2.40245 VL(0.1362) VL(0.1362) VL(0.1362) L(0.2272) VL(0.1362) (55)
3.641372 L(0.2272) L(0.2272) SL(0.3695) L(0.2272) L(0.2272) (56)
3.775023 VL(0.1362) VL(0.1362) SH(.6304) SL(0.3695) VL(0.1362) (57)

Hassanpour M./ J Food Safe & Hyg 4(1-2): 27-4037
http://jfsh.tums.ac.ir
hierarchical cluster classification was developed for FMPI according to Table 5 as Cream dyed (42) > Dates and liquid sugar (43) > Soya sauce (51) > Margarine (14) > Corn grits (31) > Non-alcoholic Beer (1) > Purification and packaging of salt (41) > Compote (7) > Canned fish (tuna) (4) > Ketchup (52) > Alcohol from beet molasses (23) = Wheat flour (25) > Milk, yogurt and pasteurized cream (15) > Canned meat (5) > Potato based foods (17) > Iodinized salt (19) > Canned Beans and Caviar Eggplant (3) > Fish food (11) > Cheese from fresh milk (35) > Mushroom cultivation (34) > Olive oil (47) > Oil Seeds from Vegetable Seeds (except soya; olive) (48) > Tomato paste (45) > Soya protein (33) > Raisin Packaging (54) > Date sap (16) > Food sauces (53) > Starch from wheat (20) > Drying oils (49) > Corn Flakes (9) > Fruit packaging (29) > Artificial sausage and sausage coating (39) > Canned mushrooms (6) > Glucose from starch (12) = Dried vegetables (50) > Poultry slaughterhouse (18) > Ice (57) > Sausage (56) > Treating fish (21) > Fish powder (38) > Mineral water (24) > Cake and muffins (2) > Pizza Cheese (36) > Flour string (46) > Meat and Olive Industrial Powder (37) > Concentrated fructose syrup of corn sugar (8) = Pistachio packaging (26) > Wafer biscuits (30) > Biscuit (32) > Packing grains; peeling off barley (27) > Preparation; packaging of honey (40) > Dates packaging (55) > Wafer chocolate (22) > Smoked fish (44) > Industrial Bread (10) = Hamburger (13) = Spice Packing (28). Tables 6 and 7 represent the Kendall's W and Friedman tests results and model summary of Mean Cronbach's Alpha respectively.
The distributions of employees, power, water, fuel, and land values were obtained normally with mean and standard deviation of around 33.40 and 19.56, 225.88 and 257.47, 28.53 and 29.27, 1105.46 and 7988.8, 5740.35 and 3875.65 by Null Hypothesis respectively. The t-test analysis had shown no significant difference among criteria. In the following, present values were obtained around 0.119 (Null hypothesis was retained), 0.001, 0.020, 0.000 (Null hypothesis was rejected for these three values) and 0.163 (Null hypothesis was retained) respectively. The sequence of values defined by employees, power, water, fuel, and land criteria was reported to be about ≤ 29, 164, 19, 31 and 4800 as the values higher than aforementioned amounts, were random respectively. Therefore, the one sample runs tests were offered the amounts around 0.516, 0.230, 0.142, 0.895 and 0.690 for employees, power, water, fuel, and land by Null Hypothesis respectively. As a result, the Null Hypothesis was retained. The related samples of Friedman's Two-way analysis of variance by ranks were revealed no significant difference among
criteria pertaining on the Null Hypothesis while the distributions of employees, power, water, fuel and land criteria were obtained same. Therefore, the Null Hypothesis was rejected.
4. DiscussionFigure 2, Tables 2 and 3 were included the flow-
diagram of existing and running technologies, input materials stream and the number of staff, land area used and energy consumption for each industry. It has a worth to mention that classification and aggregation of manufacturing data are vital for analyzing economic activity and totally sustainable development purposes. Iranian industries are encouraging to select practices and approaches to decline production outlays, promote products quality and escalate productivity etc. By the way, we can notice to some prominent practical applications of present research such as possibility of display the spectrum of existing and potential growth rates via data envelopment analysis, feasibility in compare Iranian industries availability with industries of other nations, employing available data as a universal reference in this regard, paving the way for simplicity in economic estimation practices of industries and providing the energy resources consumptions (water, electricity, and fossil fuel). The difficulties posed in developing industrial ecology refer to both materials and energy stream networks and bereavement of a useful database to design and execute materials and energy stream networks among industries. Our data were collected from the initial screening of the evaluator team of both IIO and IEPA once before the establishment of each industry. The studies associated with questionnaire methods need to figure out the compatibility of data. Hence, using a special vector, the natural attribution of the data incompatibility can be calculated via equation 11 in the matrix.
ƛmax (The biggest eigenvalue of the pairwise comparison) for an invertible matrix is always greater than or equal to the criteria number (m), and this value will be equal to m for a matrix. In this way ƛ max-m is a reasonable measure of incompatibility degree of a matrix. Saaty (1980) compared the Consistency Index (CI) with a Random Index (RI) and then revealed that RI for various quantities of m; generated based on random matrices of A and by computing the average of CI within the matrices. RI is the random index obtained from a table designed by Saaty for a matrix with rows going from 1 to 10. According to the description of the Saaty if CR ≤ 0.1; (equation 12) the matrix compatibility is accepted (11).

Hierarchical cluster classification of Iranian food manufacturing/ J Food Safe & Hyg 4(1-2): 27-40 38
http://jfsh.tums.ac.ir
CI =ƛ max − 𝑚
𝑚 − 1 (11)
CR =CI
RI (12)
Table 6. Kendall's W and Friedman tests results
N 57
Kendall's Wa .793
Chi-Square 180.749
df 4
Asymp. Sig. .000
Mean Ranks
Employee 2.17
Power 3.95
Water 1.64
Fuel 2.26
Land 4.98
a. Kendall's Coefficient of Concordance
The SAW method supported by the Friedman test (Table 5) has resulted in a simple classification of FMPI according to Table 5. By the way, the Likert scale (in Table 4) was used to set up the decision matrix in the Fuzzy system and then it was finalized by weighing values.
Table 7. Model summary of Mean Cronbach's Alpha
Dimension Cronbach's
Alpha
Variance Accounted For
Total
(Eigenvalue) Inertia
% of
Variance
1 1.000 5.000 1.000 99.999
2 1.000 4.996 .999 99.929
Total 9.996 1.999
Mean 1.000a 4.998 1.000 99.964
a. Mean Cronbach's Alpha is based on the mean Eigenvalue.
The reliability of the questionnaire depends on a statistical test that results in a coefficient called the Cronbach's Alpha. To figure out the reliability of existing values was used the Mean Cronbach's Alpha according to Table 7. Cronbach's Alpha rule of thumb is defined as α ≥ 0.9 (excellent), 0.8 ≤ α <0.9 (good), 0.7 ≤ α < 0.8 (acceptable), 0.6 ≤ α < 0.7 (questionable), 0.5 ≤ α < 0.6 (poor), α < 0.5 (unacceptable). The Mean Cronbach's Alpha based on the mean Eigenvalue was obtained about 1.
In our previous study revealed the significant differences between power-water and fuel-land; among parameters such as initial feed, employees, power, water, fuel, and land for 6 types of Iranian recycling industries (p≤0.016 and 0.023) using SPSS analysis respectively (13). Tash and Nasrabadi (14) achieved to classify and rank the Iranian monopolistic
industries via SPSS analysis. Shaverdi et al. (15)accomplished a Fuzzy Analytical Hierarchy Process (AHP) to develop and mature sustainability for the publishing industry. So, it was acquired ranking values among factors. Shaverdi et al (16) developed a ranking classification based on Fuzzy AHP approach among Iranian petrochemical sectors in order to evaluate financial performance. Hourali et al (17) used Minitab and SPSS Soft-wares to assess 45 Iranian Small and Medium Enterprises (SMEs) to develop a model for E-Readiness. Obtained values resulted in weighting indicators. Hosseininia and Ramezani (18) used SPSS analysis to assess the sustainable performance of around 12 SMEs by participating 130 managers in Iranian food industries which resulted to place both factors of social and environmental in the highest level. Behrouzi et al (19) classified and ranked the options and obtained average weights to lean supply chain performance measurement of SMEs among 133 automotive industries using Fuzzy Multi Attribute Decision Making along with SPSS analysis. Dadashpoor and Allan (20) performed a study to Intra-metropolitan supply linkages, industrial clustering and driving forces in the Iranian automotive sector by SPSS analysis. So obtained results lead to figuring out the weak evidence of industrial clustering. Salehi and Hematfar (21) found significant relationships between accounting variables of industrial chemical companies listed on the Tehran Stock Exchange in 10 models using SPSS analysis from 2005 to 2010. Kavousi and Salamzadeh (22) weighted and prioritized indicators influencing the success of a strategic planning process among National Iranian Copper Industries, via Cochran formula plus Shannon's method and Topsis technique. Yunus et al. (23) in order to evaluate statistical process control towards process efficiency, used the SPSS analysis among Iranian food industries. By the way, results revealed a relevant quality improvement, food safety, and security at an open global market. Radfar and Ebrahimi (24) found the priority in order to invest, methods in technology transfer by Fuzzy MCDM among Iranian shipping industries. Obtained results presented that both joint venture and the subsidiary companies were the highest and lowest priorities, respectively. Moghimi et al. (25) assigned Fuzzy MCDM approach to do asurvey based on financial performance among 8 Iranian cement companies listed in the Tehran Stock Exchange. By the way, it was found that the performance ranking of Sabhan, Sarab, Sedasht, Safar, Sekaroun, Sakarma, Sanir and Sahrmoz companies with priority scores of around 0.55, 0.51, 0.50, 0.49, 0.42, 0.37, 0.36 and 0.33 respectively. Fekri et al (26)

Hassanpour M./ J Food Safe & Hyg 4(1-2): 27-4039
http://jfsh.tums.ac.ir
studied main items affecting the agile new product process and the connections between them by Fuzzy cognitive map procedure among Iranian manufacturing enterprises. So, they have classified and sorted into 6 main groups and the connections tabulated.
5. ConclusionPresent study collected all information associated
with the input materials stream introduced into industries, the amounts of output products and energy consumed etc at FMPI. The industries were ranked and prioritized based on 5 factors and for each industry was depicted running flow-diagrams individually.The existing data can be exploited in further studies.
Conflict of interest There is no conflict of interest.
Acknowledgements
This research was conducted as part of corresponding author PhD research work.
References 1. Feili H, Molaee Aghaee E, Jahed Khaniki Gh, et al.
Applying fuzzy quality function deployment and fuzzy
analytical hierarchy process approach in industrial bread
production. J Food Safe & Hyg 2015; 1:53-58.
2. Ruth SMV, Huisman W, Luning PA. Food fraudvulnerability and its key factors. Trends in Food Sci &Technol 2017; 67:70-75.
3. Compton M, Willis S, Rezaie B, et al. Food processing
industry energy and water consumption in the Pacific
northwest. Innov Food Sci & Emerg Technol 2018; 47:
371–83.
4. Jonidi JA, Hassanpour M, Nemati S. Nanotechnology
and Environmental Health. 1thed. Ebadi Far Publication.
Tehran; 2013.
5. Ghorabaee MK, Amiri M, Zavadskas EK, et al. A new
hybrid fuzzy MCDM approach for evaluation of
construction equipment with sustainability
considerations. Arch Civil & Mech Engin 2018; 18:32-
49.
6. Halim Lim SA, Antony J, Albliwi NAS. A systematic
review of statistical process control implementation in
the food manufacturing industry. J Total Qual Manage
& Busin Excell 2017; 28:1-14.
7. Hoffmann J. Identification of spatial agglomerations in
the German food processing industry. The 116th EAAE
seminar "spatial dynamics in AGRI-food systems:
implications for sustainability and consumer welfare".
Parma, Italy, 2010.8. Rahimi I, Behmanesh R, Yusuff RM. A hybrid method
for prediction and assessment efficiency of decision
making Units (Real case study: Iranian poultry farms).
Int J Dec Supp Sys Technol 2013; 5:1-14.
9. Banaeian N, Mobli H, Fahimnia B, et al. Green supplier
selection using fuzzy group decision making methods: A
case study from the agri-food industry. Comput &
Operat Res 2018; 89:337-47.10. Eisinga R, Heskes T, Pelzer B, et al. Exact p-values for
pairwise comparison of Friedman rank sums, with
application to comparing classifiers. BMC Bioinform.
2017; 18:2-18.
11. Shirazia F, Kazemipoor H, Tavakkoli-Moghaddam R.
Fuzzy decision analysis for project scope change
management. Dec Sci Lett 2017; 6:395-06.
12. Hassanpour M. Projects Management Addressed to
Iranian Government (A case study). J Proceed Busin &
Econom Stud 2018; 1:1-15.
13. Hassanpour M. Evaluation of Iranian recycling
industries. J Wast Recycl 2017; 2:1-7.14. Tash MNS, Nasrabadi H. Ranking Iran's Monopolistic
Industry Based on Fuzzy TOPSIS Method. Iran J
Econom Stud 2013; 2:103-22.
15. Shaverdi M, Heshmati MR, Eskandaripour E, et al.
Developing sustainable SCM evaluation model using
fuzzy AHP in publishing industry. Proced Comput Sci
2013; 17:340-49.
16. Shaverdi M, Heshmati MR, Ramezani I. Application of
Fuzzy AHP Approach for Financial Performance
Evaluation of Iranian Petrochemical Sector. Proced
Comput Sci 2014; 31:995-1004.17. Hourali M, Fathian M, Montazeri A, et al. A Model for
E-Readiness Assessment of Iranian Small and Medium
Enterprises. J Facul Engin 2008; 41:969-85.
18. Hosseininia G, Ramezani A. Factors Influencing
Sustainable Entrepreneurship in Small and Medium-
Sized Enterprises in Iran: A Case Study of Food
Industry. Sustain 2016; 8:1-20.
19. Behrouzi F, Wong KY, Behrouzi F. A Study on Lean
Supply Chain Performance Measures of SMEs in the
Automotive Industry. Proceedings of the IEEE IEEM.
Singapore, Singapore. 2011.
20. Dadashpoor H, Allan A. Industrial Clustering,Innovation and Competitive Advantage in the
Metropolitan Regions: Evidence from the Auto-parts
Cluster within the Tehran Metropolitan Region. Int J
Human 2010; 17:19-46.
21. Salehi M, Hematfar M. Comparing linear and non-linear
relationships between accounting variables and
dividend: Evidence of Iranian chemical industries. Afric
J Busin Manage 2012; 6:2143-51.
22. Kavousi S, Salamzadeh Y. Identifying and Prioritizing
Factors Influencing Success of a Strategic Planning
Process: A Study on National Iranian Copper IndustriesCompany. 2016; 12:230-44.
23. Yunus MFM, Taib CA, Iteng R. A Preliminary Study on
the Application of Statistical Process Control (SPC)

Hierarchical cluster classification of Iranian food manufacturing/ J Food Safe & Hyg 4(1-2): 27-40 40
http://jfsh.tums.ac.ir
Towards Process Efficiency: Case Study in Food
Industries. Rosman Iteng/ Sains Human 2016; 8:25-31.
24. Radfar R, Ebrahimi L. Fuzzy Multi Criteria Decision
Making Model for Prioritizing the Investment Methods
in Technology Transfer in Shipping Industries.
Proceedings of the 2012 International Conference onIndustrial Engineering and Operations Management
Istanbul, Turkey, July 3-6, 2012.
25. Moghimi R, Anvari A, Amoozesh N, et al. An inte-
grated fuzzy MCDM approach, and analysis, to the
evaluation of the financial performance of Iranian
cement companies. Int J Adv Manufac Technol 2014;
71:685-98.
26. Fekri R, Aliahmadi A, Fathian M. Predicting a model foragile NPD process with fuzzy cognitive map: the caseof Iranian manufacturing enterprises. Int J AdvManufac Technol 2009; 41:1240-60.