Heterogeneity of Breast Cancer Associations with Five Susceptibility Loci by Clinical and...
10
Heterogeneity of Breast Cancer Associations with Five Susceptibility Loci by Clinical and Pathological Characteristics Montserrat Garcia-Closas 1 *, Per Hall 2 , Heli Nevanlinna 3 , Karen Pooley 4 , Jonathan Morrison 4 , Douglas A. Richesson 1 , Stig E. Bojesen 5,6 , Børge G. Nordestgaard 5 , Christen K. Axelsson 7 , Jose I. Arias 8,9 , Roger L. Milne 8 , Gloria Ribas 8 , Anna Gonza ´ lez-Neira 8 , Javier Benı´tez 8 , Pilar Zamora 10 , Hiltrud Brauch 11 , Christina Justenhoven 11 , Ute Hamann 12 , Yon-Dschun Ko 13 , Thomas Bruening 14 , Susanne Haas 15 , Thilo Do ¨ rk 16 , Peter Schu ¨ rmann 16 , Peter Hillemanns 16 , Natalia Bogdanova 16,17 , Michael Bremer 17 , Johann Hinrich Karstens 17 , Rainer Fagerholm 3 , Kirsimari Aaltonen 3,18 , Kristiina Aittoma ¨ ki 19 , Karl von Smitten 20 , Carl Blomqvist 18 , Arto Mannermaa 21,22 , Matti Uusitupa 23 , Matti Eskelinen 24 , Maria Tengstro ¨m 25,26 , Veli-Matti Kosma 21,22 , Vesa Kataja 25,26 , Georgia Chenevix-Trench 27 , Amanda B. Spurdle 27 , Jonathan Beesley 27 , Xiaoqing Chen 27 , Australian Ovarian Cancer Management Group 27,28 , The Kathleen Cuningham Foundation Consortium for Research into Familial Breast Cancer 28 , Peter Devilee 29 , Christi J. van Asperen 30 , Catharina E. Jacobi 31 , Rob A. E. M. Tollenaar 32 , Petra E.A. Huijts 33 , Jan G. M. Klijn 33 , Jenny Chang-Claude 34 , Silke Kropp 34 , Tracy Slanger 34 , Dieter Flesch-Janys 35 , Elke Mutschelknauss 35 , Ramona Salazar 36 , Shan Wang-Gohrke 37 , Fergus Couch 38 , Ellen L. Goode 38 , Janet E. Olson 38 , Celine Vachon 38 , Zachary S. Fredericksen 38 , Graham G. Giles 39 , Laura Baglietto 39 , Gianluca Severi 39 , John L. Hopper 40 , Dallas R. English 40 , Melissa C. Southey 41 , Christopher A. Haiman 42 , Brian E. Henderson 42 , Laurence N. Kolonel 43 , Loic Le Marchand 43 , Daniel O. Stram 44 , David J. Hunter 45,46 , Susan E. Hankinson 46 , David G. Cox 46,47 , Rulla Tamimi 46 , Peter Kraft 47 , Mark E. Sherman 1 , Stephen J. Chanock 48 , Jolanta Lissowska 49 , Louise A. Brinton 1 , Beata Peplonska 50 , Jan G. M. Klijn 51 , Maartje J. Hooning 51 , Han Meijers-Heijboer 52 , J. Margriet Collee 52 , Ans van den Ouweland 52 , Andre G. Uitterlinden 53 , Jianjun Liu 54 , Low Yen Lin 54 , Li Yuqing 54 , Keith Humphreys 2 , Kamila Czene 2 , Angela Cox 55 , Sabapathy P. Balasubramanian 56 , Simon S. Cross 57 , Malcolm W. R. Reed 56 , Fiona Blows 4 , Kristy Driver 4 , Alison Dunning 4 , Jonathan Tyrer 4 , Bruce A. J. Ponder 58 , Suleeporn Sangrajrang 59 , Paul Brennan 60 , James McKay 60 , Fabrice Odefrey 60 , Valerie Gabrieau 60 , Alice Sigurdson 1 , Michele Doody 1 , Jeffrey P. Struewing 61 , Bruce Alexander 62 , Douglas F. Easton 4 , Paul D. Pharoah 4 1 Division of Cancer Epidemiology and Genetics, National Cancer Institute, Rockville, Marylan, United States of America, 2 Department of Medical Epidemiology and Biostatistics, Karolinska Institute, Stockholm, Sweden, 3 Department of Obstetrics and Gynaecology, Helsinki University Central Hospital, Helsinki, Finland, 4 Department of Oncology, University of Cambridge, Cambridge, United Kingdom, 5 Department of Clinical Biochemistry, Herlev and Bispebjerg University Hospitals, University of Copenhagen, Denmark, 6 Department of Bispebjerg University Hospitals, University of Copenhagen, Denmark, 7 Department of Breast Surgery, Herlev University Hospital, University of Copenhagen, Denmark, 8 Spanish National Cancer Centre, Madrid, Spain, 9 Monte Naranco Hospital, Oviedo, Spain, 10 La Paz Hospital, Madrid, Spain, 11 Dr. Margarete Fischer-Bosch Institute of Clinical Pharmacology, Stuttgart and University of Tu ¨ bingen, Tu ¨ bingen, Germany, 12 Deutsches Krebsforschungszentrum Heidelberg, Heidelberg, Germany, 13 Evangelische Kliniken Bonn gGmhH Johanniter Krankenhaus, Bonn, Germany, 14 Berufsgenossenschaftliches Forschungsinstitut fu ¨r Arbeitsmedizin, Ruhr University Bochum, Germany, 15 Institute fu ¨ r Pathology, University Bonn, Bonn, Germany, 16 Department of Gynecology and Obstetrics, Hannover Medical School, Hannover, Germany, 17 Department of Radiation Oncology, Hannover Medical School, Hannover, Germany, 18 Department of Oncology, Helsinki University Central Hospital, Helsinki, Finland, 19 Department of Clinical Genetics, Helsinki University Central Hospital, Helsinki, Finland, 20 Department of Surgery, Helsinki University Central Hospital, Helsinki, Finland, 21 Institute of Clinical Medicine, Pathology and Forensic Medicine, Biocenter Kuopio, University of Kuopio, Kuopio, Finland, 22 Department of Pathology, Kuopio University Hospital, Kuopio, Finland, 23 Department of Public Health and Clinical Nutrition, Biocenter Kuopio, University of Kuopio, Kuopio, Finland, 24 Department of Surgery, Kuopio University Hospital, Kuopio, Finland, 25 Department of Oncology, Kuopio University Hospital, Kuopio, Finland, 26 Department of Oncology, Vaasa Central Hospital, Vaasa, Finland, 27 The Queensland Institute of Medical Research Post Office, Royal Brisbane Hospital, Herston, Queensland, Australia, 28 Peter MacCallum Cancer Institute, East Melbourne, Victoria, Australia, 29 Departments of Human Genetics and Pathology, Leiden University Medical Center, Leiden, The Netherlands, 30 Department of Clinical Genetics, Leiden University Medical Center, Leiden, The Netherlands, 31 Department of Medical Decision Making, Leiden University Medical Center, Leiden, The Netherlands, 32 Department of Surgery, Leiden University Medical Center, Leiden, The Netherlands, 33 Department of Medical Oncology, Family Cancer Clinic, Erasmus MC-Daniel den Hoed Cancer Center, Rotterdam, The Netherlands, 34 Division of Cancer Epidemiology, German Cancer Research Center, Heidelberg, Germany, 35 Institute for Medical Biometrics and Epidemiology, University Clinic Hamburg-Eppendorf, Hamburg, Germany, 36 Bioglobe GmbH, Hamburg, Germany, 37 Molecular Biology Laboratory, Department of Obstetrics and Gynecology, University of Ulm, Ulm, Germany, 38 Mayo Clinic College of Medicine, Rochester, Minnesota, United States of America, 39 Cancer Epidemiology Centre, The Cancer Council Victoria, Melbourne, Victoria, Australia, 40 Centre for MEGA Epidemiology, The University of Melbourne, Melbourne, Victoria, Australia, 41 Genetic Epidemiology Laboratory, Department of Pathology, The University of Melbourne, Melbourne, Victoria, Australia, 42 Department of Preventive Medicine, Keck School of Medicine, University of Southern California, Los Angeles, California, United States of America, 43 Epidemiology Program, Cancer Research Center of Hawaii, University of Hawaii, Honolulu, Hawaii, United States of America, 44 Department of Preventive Medicine, Keck School of Medicine, University of Southern California, Los Angeles, California, United States of America, 45 Program in Molecular and Genetic Epidemiology, Harvard School of Public Health, Boston, Massachusetts, United States of America, 46 Channing Laboratory, Brigham and Women’s PLoS Genetics | www.plosgenetics.org 1 April 2008 | Volume 4 | Issue 4 | e1000054
-
Upload
independent -
Category
Documents
-
view
2 -
download
0
Transcript of Heterogeneity of Breast Cancer Associations with Five Susceptibility Loci by Clinical and...

Heterogeneity of Breast Cancer Associations with FiveSusceptibility Loci by Clinical and PathologicalCharacteristicsMontserrat Garcia-Closas1*, Per Hall2, Heli Nevanlinna3, Karen Pooley4, Jonathan Morrison4, Douglas A.
Richesson1, Stig E. Bojesen5,6 , Børge G. Nordestgaard5, Christen K. Axelsson7, Jose I. Arias8,9, Roger L.
Milne8, Gloria Ribas8, Anna Gonzalez-Neira8, Javier Benıtez8, Pilar Zamora10, Hiltrud Brauch11, Christina
Justenhoven11, Ute Hamann12, Yon-Dschun Ko13, Thomas Bruening14, Susanne Haas15, Thilo Dork16,
Peter Schurmann16, Peter Hillemanns16, Natalia Bogdanova16,17, Michael Bremer17, Johann Hinrich
Karstens17, Rainer Fagerholm3, Kirsimari Aaltonen3,18, Kristiina Aittomaki19, Karl von Smitten20, Carl
Blomqvist18, Arto Mannermaa21,22, Matti Uusitupa23, Matti Eskelinen24, Maria Tengstrom25,26, Veli-Matti
Kosma21,22, Vesa Kataja25,26, Georgia Chenevix-Trench27, Amanda B. Spurdle27, Jonathan Beesley27,
Xiaoqing Chen27, Australian Ovarian Cancer Management Group27,28, The Kathleen Cuningham
Foundation Consortium for Research into Familial Breast Cancer28, Peter Devilee29, Christi J. van
Asperen30, Catharina E. Jacobi31, Rob A. E. M. Tollenaar32, Petra E.A. Huijts33, Jan G. M. Klijn33, Jenny
Chang-Claude34, Silke Kropp34, Tracy Slanger34, Dieter Flesch-Janys35, Elke Mutschelknauss35, Ramona
Salazar36, Shan Wang-Gohrke37, Fergus Couch38, Ellen L. Goode38, Janet E. Olson38, Celine Vachon38,
Zachary S. Fredericksen38, Graham G. Giles39, Laura Baglietto39, Gianluca Severi39, John L. Hopper40,
Dallas R. English40, Melissa C. Southey41, Christopher A. Haiman42, Brian E. Henderson42, Laurence N.
Kolonel43, Loic Le Marchand43, Daniel O. Stram44, David J. Hunter45,46, Susan E. Hankinson46, David G.
Cox46,47, Rulla Tamimi46, Peter Kraft47, Mark E. Sherman1, Stephen J. Chanock48, Jolanta Lissowska49,
Louise A. Brinton1, Beata Peplonska50, Jan G. M. Klijn51, Maartje J. Hooning51, Han Meijers-Heijboer52, J.
Margriet Collee52, Ans van den Ouweland52, Andre G. Uitterlinden53, Jianjun Liu54, Low Yen Lin54, Li
Yuqing54, Keith Humphreys2, Kamila Czene2, Angela Cox55, Sabapathy P. Balasubramanian56, Simon S.
Cross57, Malcolm W. R. Reed56, Fiona Blows4, Kristy Driver4, Alison Dunning4, Jonathan Tyrer4, Bruce A. J.
Ponder58, Suleeporn Sangrajrang59, Paul Brennan60, James McKay60, Fabrice Odefrey60, Valerie
Gabrieau60, Alice Sigurdson1, Michele Doody1, Jeffrey P. Struewing61, Bruce Alexander62, Douglas F.
Easton4, Paul D. Pharoah4
1 Division of Cancer Epidemiology and Genetics, National Cancer Institute, Rockville, Marylan, United States of America, 2 Department of Medical Epidemiology and
Biostatistics, Karolinska Institute, Stockholm, Sweden, 3 Department of Obstetrics and Gynaecology, Helsinki University Central Hospital, Helsinki, Finland, 4 Department of
Oncology, University of Cambridge, Cambridge, United Kingdom, 5 Department of Clinical Biochemistry, Herlev and Bispebjerg University Hospitals, University of
Copenhagen, Denmark, 6 Department of Bispebjerg University Hospitals, University of Copenhagen, Denmark, 7 Department of Breast Surgery, Herlev University Hospital,
University of Copenhagen, Denmark, 8 Spanish National Cancer Centre, Madrid, Spain, 9 Monte Naranco Hospital, Oviedo, Spain, 10 La Paz Hospital, Madrid, Spain, 11 Dr.
Margarete Fischer-Bosch Institute of Clinical Pharmacology, Stuttgart and University of Tubingen, Tubingen, Germany, 12 Deutsches Krebsforschungszentrum Heidelberg,
Heidelberg, Germany, 13 Evangelische Kliniken Bonn gGmhH Johanniter Krankenhaus, Bonn, Germany, 14 Berufsgenossenschaftliches Forschungsinstitut fur
Arbeitsmedizin, Ruhr University Bochum, Germany, 15 Institute fur Pathology, University Bonn, Bonn, Germany, 16 Department of Gynecology and Obstetrics,
Hannover Medical School, Hannover, Germany, 17 Department of Radiation Oncology, Hannover Medical School, Hannover, Germany, 18 Department of Oncology,
Helsinki University Central Hospital, Helsinki, Finland, 19 Department of Clinical Genetics, Helsinki University Central Hospital, Helsinki, Finland, 20 Department of Surgery,
Helsinki University Central Hospital, Helsinki, Finland, 21 Institute of Clinical Medicine, Pathology and Forensic Medicine, Biocenter Kuopio, University of Kuopio, Kuopio,
Finland, 22 Department of Pathology, Kuopio University Hospital, Kuopio, Finland, 23 Department of Public Health and Clinical Nutrition, Biocenter Kuopio, University of
Kuopio, Kuopio, Finland, 24 Department of Surgery, Kuopio University Hospital, Kuopio, Finland, 25 Department of Oncology, Kuopio University Hospital, Kuopio, Finland,
26 Department of Oncology, Vaasa Central Hospital, Vaasa, Finland, 27 The Queensland Institute of Medical Research Post Office, Royal Brisbane Hospital, Herston,
Queensland, Australia, 28 Peter MacCallum Cancer Institute, East Melbourne, Victoria, Australia, 29 Departments of Human Genetics and Pathology, Leiden University
Medical Center, Leiden, The Netherlands, 30 Department of Clinical Genetics, Leiden University Medical Center, Leiden, The Netherlands, 31 Department of Medical
Decision Making, Leiden University Medical Center, Leiden, The Netherlands, 32 Department of Surgery, Leiden University Medical Center, Leiden, The Netherlands,
33 Department of Medical Oncology, Family Cancer Clinic, Erasmus MC-Daniel den Hoed Cancer Center, Rotterdam, The Netherlands, 34 Division of Cancer Epidemiology,
German Cancer Research Center, Heidelberg, Germany, 35 Institute for Medical Biometrics and Epidemiology, University Clinic Hamburg-Eppendorf, Hamburg, Germany,
36 Bioglobe GmbH, Hamburg, Germany, 37 Molecular Biology Laboratory, Department of Obstetrics and Gynecology, University of Ulm, Ulm, Germany, 38 Mayo Clinic
College of Medicine, Rochester, Minnesota, United States of America, 39 Cancer Epidemiology Centre, The Cancer Council Victoria, Melbourne, Victoria, Australia,
40 Centre for MEGA Epidemiology, The University of Melbourne, Melbourne, Victoria, Australia, 41 Genetic Epidemiology Laboratory, Department of Pathology, The
University of Melbourne, Melbourne, Victoria, Australia, 42 Department of Preventive Medicine, Keck School of Medicine, University of Southern California, Los Angeles,
California, United States of America, 43 Epidemiology Program, Cancer Research Center of Hawaii, University of Hawaii, Honolulu, Hawaii, United States of America,
44 Department of Preventive Medicine, Keck School of Medicine, University of Southern California, Los Angeles, California, United States of America, 45 Program in
Molecular and Genetic Epidemiology, Harvard School of Public Health, Boston, Massachusetts, United States of America, 46 Channing Laboratory, Brigham and Women’s
PLoS Genetics | www.plosgenetics.org 1 April 2008 | Volume 4 | Issue 4 | e1000054

Hospital and Harvard Medical School, Boston, Massachusetts, United States of America, 47 Program in Molecular and Genetic Epidemiology, Harvard School of Public
Health, Boston, Massachusetts, United States of America, 48 Advanced Technology Center, National Cancer Institute, Gaithersburg, Maryland, United States of America,
49 Department of Cancer Epidemiology and Prevention, Cancer Center and M. Sklodowska-Curie Institute of Oncology, Warsaw, Poland, 50 Nofer Institute of
Occupational Medicine, Lodz, Poland, 51 Daniel den Hoed Cancer Center, Erasmus Medical Center, Department of Medical Oncology, Rotterdam, The Netherlands,
52 Department of Clinical Genetics, Erasmus Medical Center, Rotterdam, The Netherlands, 53 Department of Internal Medicine, Erasmus Medical Center, Rotterdam, The
Netherlands, 54 Human Genetics, Genome Institute of Singapore, Singapore, 55 Institute for Cancer Studies, Sheffield University Medical School, Sheffield, United
Kingdom, 56 Academic Unit of Surgical Oncology, Sheffield University Medical School, Sheffield, United Kingdom, 57 Academic Unit of Pathology, Sheffield University
Medical School, Sheffield, United Kingdom, 58 Cancer Research UK, Cambridge Research Institute, Cambridge, United Kingdom, 59 Molecular Epidemiology Unit, National
Cancer Institute, Ratchathewi, Bangkok, Thailand, 60 International Agency for Research on Cancer, Lyon, France, 61 Office of Population Genomics, National Human
Genome Research Institute, Bethesda, Maryland, United Stated of America, 62 Environmental Health Sciences, University of Minnesota, Minneapolis, Minnesota, United
States of America
Abstract
A three-stage genome-wide association study recently identified single nucleotide polymorphisms (SNPs) in five loci(fibroblast growth receptor 2 (FGFR2), trinucleotide repeat containing 9 (TNRC9), mitogen-activated protein kinase 3 K1(MAP3K1), 8q24, and lymphocyte-specific protein 1 (LSP1)) associated with breast cancer risk. We investigated whether theassociations between these SNPs and breast cancer risk varied by clinically important tumor characteristics in up to 23,039invasive breast cancer cases and 26,273 controls from 20 studies. We also evaluated their influence on overall survival in13,527 cases from 13 studies. All participants were of European or Asian origin. rs2981582 in FGFR2 was more stronglyrelated to ER-positive (per-allele OR (95%CI) = 1.31 (1.27–1.36)) than ER-negative (1.08 (1.03–1.14)) disease (P forheterogeneity = 10213). This SNP was also more strongly related to PR-positive, low grade and node positive tumors(P = 1025, 1028, 0.013, respectively). The association for rs13281615 in 8q24 was stronger for ER-positive, PR-positive, andlow grade tumors (P = 0.001, 0.011 and 1024, respectively). The differences in the associations between SNPs in FGFR2 and8q24 and risk by ER and grade remained significant after permutation adjustment for multiple comparisons and afteradjustment for other tumor characteristics. Three SNPs (rs2981582, rs3803662, and rs889312) showed weak but significantassociations with ER-negative disease, the strongest association being for rs3803662 in TNRC9 (1.14 (1.09–1.21)). rs13281615in 8q24 was associated with an improvement in survival after diagnosis (per-allele HR = 0.90 (0.83–0.97). The association wasattenuated and non-significant after adjusting for known prognostic factors. Our findings show that common geneticvariants influence the pathological subtype of breast cancer and provide further support for the hypothesis that ER-positiveand ER-negative disease are biologically distinct. Understanding the etiologic heterogeneity of breast cancer may ultimatelyresult in improvements in prevention, early detection, and treatment.
Citation: Garcia-Closas M, Hall P, Nevanlinna H, Pooley K, Morrison J, et al. (2008) Heterogeneity of Breast Cancer Associations with Five Susceptibility Loci byClinical and Pathological Characteristics. PLoS Genet 4(4): e1000054. doi:10.1371/journal.pgen.1000054
Editor: Suzanne M. Leal, Baylor College of Medicine, United States of America
Received August 16, 2007; Accepted March 18, 2008; Published April 25, 2008
This is an open-access article distributed under the terms of the Creative Commons Public Domain declaration which stipulates that, once placed in the publicdomain, this work may be freely reproduced, distributed, transmitted, modified, built upon, or otherwise used by anyone for any lawful purpose.
Funding: This work was funded by The Copenhagen Breast Cancer Study and The Copenhagen General Population Study were supported by Chief PhysicianJohan Boserup and Lise Boserup Fund, the Danish Medical Research Council, Copenhagen County and Herlev University Hospital. The CNIO Spanish Breast CancerStudy was supported by the Genome Spain Foundation and the Marato Foundation. The GENICA study was supported by the German Human Genome Projectand funded by the Federal Ministry of Education and Research (BMBF) Germany grants 01KW9975/5, 01KW9976/8, 01KW9977/0 and 01KW0114. Genotypinganalyses were supported by Robert Bosch Foundation of Medical Research, Stuttgart, Germany. The Mayo Breast Cancer Study is supported by NIH/NCI BreastCancer SPORE P50 CA116201, NIH R01 CA122340 and the U.S. Army Medical Research and Materiel Command breast cancer IDEA award W81XWH-04-1-0588. ThekConFab Clinical Follow Up Study is funded by NHMRC grants 145684 and 288704. kConFab is supported by grants from the National Breast Cancer Foundation,the National Health and Medical Research Council (NHMRC) and by the Queensland Cancer Fund, the Cancer Councils of New South Wales, Victoria, Tasmania andSouth Australia, and the Cancer Foundation of Western Australia. GCT and ABS are NHMRC Senior Principal Research Fellow and Career Award Developmentawardees respectively. The Sheffield Breast Cancer Study was supported by Yorkshire Cancer Research and the Breast Cancer Campaign. The RBCS was supportedby the Dutch Cancer Genomics Center (CGC). The MARIE study is supported by the Deutsche Krebshilfe e.V. (Project number 70-2892-Br I). Ellen L. Goode wassupported by a Fraternal Order of Eagles Cancer Research Fellowship. The Singapore and Swedish Breast Cancer Study (SASBAC) was supported by funding fromthe Agency for Science, Technology and Research of Singapore (A*STAR), the US National Institute of Health (NIH) and the Susan G. Komen Breast CancerFoundation. KBCP is supported by grants from EVO funds of Kuopio University Hospital and the Finnish Cancer Foundation. The USRT study was supported byIntramural Research Funds from the Division of Cancer Epidemiology and Genetics, NCI, NIH, DHHS. The Polish Breast Cancer Study was funded by IntramuralResearch Funds of the US National Cancer Institute. HEBCS was supported by the Academy of Finland (110663), Finnish Cancer Society, Helsinki University CentralHospital Research Fund, and the Sigrid Juselius Fund. Genotyping for BCAC funded by Cancer Research UK, SEARCH is funded by a programme grant from CR-U,PDPP is a Senior Clinical Research Fellow and DFE is Principal Research Fellow of CR-UK.
Competing Interests: The authors have declared that no competing interests exist.
* E-mail: [email protected]
Introduction
Breast cancers vary greatly in clinical behavior, morphological
appearance, and molecular alterations. Accumulating epidemio-
logic data also suggest that different types of breast cancers
have different risk factor profiles and thus might result from
different etiologic pathways (which might be shared by different
tumor types or be type specific). Notably, age-specific incidence
rates [1] and the strength of the associations with knownrisk factors for breast cancer [2–4] differ by clinically importanttumor characteristics. Evidence that genetic factors can also
influence tumor type is provided by the fact that carriers ofhighly penetrant mutations in BRCA1 are more likely to bediagnosed with basal breast tumors which are estrogen receptor(ER) negative, progesterone receptor (PR) negative and
HER2 negative [5]. This raises the possibility that other
Breast Cancer Susceptibility and Pathology
PLoS Genetics | www.plosgenetics.org 2 April 2008 | Volume 4 | Issue 4 | e1000054

susceptibility loci may also be associated with specific subtypes ofbreast cancer.
We recently performed a two-stage genome-wide association
study (GWAS) in 4,398 breast cancer cases and 4,316 controls,
followed by a third stage in 21,860 cases and 22,578 controls from
22 studies, identifying single nucleotide polymorphisms (SNPs) in 5
loci associated with breast cancer risk [6]. Of the five loci
identified, 4 were within genes or linkage disequilibrium (LD)
blocks containing genes, including: 1) rs2981582 in the FGFR2
gene coding for a receptor tyrosine kinase that plays an important
role in mammary gland development [7], has been implicated in
carcinogenesis [8], and is amplified [9–11] or over-expressed [12]
in up to 10% of breast tumors; 2) rs3803662 in a LD block
containing TNRC9 (also known TOX3) and the hypothetical gene
LOC643714; 3) rs889312 in a LD block containing MAP3K1 and
two hypothetical genes (MGC33648 and mesoderm induction early
response 1, family member 3 (MIER3)); and 4) rs3817198 in the
LSP1 gene. The fifth SNP (rs13281615) lies on a region of 8q24
that does not contain known genes, but has multiple independent
variants associated with prostate [13,14] and colorectal [15–18]
cancer risk. Two additional genome wide association studies also
recently identified SNPs in FGFR2 [19] and TNRC9 [20] as breast
cancer susceptibility loci.
We used the large data resource provided by the Breast Cancer
Association Consortium (BCAC) to evaluate the hypothesis that
tumor characteristics modify the association between breast cancer
risk and the low penetrant susceptibility loci recently identified [6].
Determining whether breast cancer risk factors are linked to tumors
with specific clinical presentations, pathologic characteristics or
mechanisms of development may provide a gateway for developing
tailored prevention and early detection strategies. In addition, we
evaluated whether these genetic factors affect overall survival after
diagnosis of breast cancer, either independently or through their
association with tumor characteristics of clinical importance.
Materials and Methods
Study PopulationsCases and controls were identified through 21 case-control
studies in Europe, North America, South-East Asia and Australia,
participating in the BCAC (see Table S1 for description of study
populations). All of these studies, except for two Germany studies
(Mammary Carcinoma Risk Factor Investogation (MARIE),
Genetic Epidemiology Study of Breast Cancer by Age 50
(GESBC)), were included in our previous publication [6] (the
ORIGO study was previously referred to as LUMCBCS), and
provided information on disease status, age at diagnosis/
enrollment, ethnic group (European, Asian, other), first degree
family history of breast cancer and bilaterality of breast cancer.
Twenty studies with a total of 23,839 invasive breast cancer cases
and 26,928 controls also provided data on tumor characteristics
(i.e. histopathologic subtype, ER and PR receptor status, tumor
size, grade, nodal involvement or stage; see Table S2 for data
sources). Of these, 800 cases and 655 controls were excluded from
analyses because of failures in genotyping quality control (see
details under Genotyping) or because they belonged to ‘‘other’’
ethnic groups with few subjects. Data on survival after diagnosis
was available for 13,527 cases participating in 13 studies (after
excluding failures in genotype QC and ‘‘other’’ ethnicities),
including the USRT study, which lacked data on tumor
characteristics (Table S4). Overall, 95.6% of cases and 96.7% of
controls were of European origin. The mean ages were 56 years
for cases and 57 years for controls.
The distribution of tumor characteristics by study among the
23,039 ( = 23839-800) cases from 20 studies with pathology
information is shown in Table S4. Data pertaining to the first
tumor detected were used for women with bilateral disease. Data
related to histological subtype was available for 86% of the cases
(18 studies), ER status for 74% (20 studies), PR status for 62% (18
studies), tumor grade of differentiation for 70% (17 studies), nodal
involvement for 65% (17 studies), tumor size for 35% (9 studies),
and stage at diagnosis for 68% (11 studies). A total of 1,487 of the
23,039 cases were excluded because they had missing information
on all tumor characteristics, leaving 21,552 cases and 26,273
controls of European or Asian origin available for analyses by
tumor characteristics. The actual number of cases and controls
included in each analysis, after excluding missing genotype data, is
shown in the tables.
GenotypingGenotyping procedures have previously been described [6]. All
studies genotyped for the five SNPs with the exception of
rs3803662 that was not genotyped in the KConFab study, and
rs13281615 that was not genotyped in KConFab and MARIE
studies. Any sample that could not be scored on 20 percent of the
SNPs attempted was excluded from analysis. We also removed
data for any center/SNP combination for which the call rate was
less than 90 percent. In any instances where the call rate was 90–
95 percent, the clustering of genotype calls was re-evaluated by an
independent observer to determine whether the clustering was
sufficiently clear for inclusion. We also eliminated all of the data
for a given SNP/center where the reproducibility in duplicate
samples was ,97 percent, or where there was marked deviation
from Hardy-Weinberg equilibrium in the controls (p,.00001).
Statistical AnalysesPolytomous logistic regression was used to estimate adjusted
odds ratios (OR) and associated 95 percent confidence intervals
(CI) as measures of association between genotypes and risk of
breast cancer subtypes (comparing case subtypes to all controls).
All models included terms for study (dummy variables). Further
adjustment for age at diagnosis/enrollment did not substantially
influence OR estimates (data not shown). We estimated the
association for each SNP in terms of genotype-specific ORs and
Author Summary
This report from the Breast Cancer Association Consortiumevaluates whether common variants in five recentlyidentified breast cancer susceptibility loci (FGFR2, TNRC9,MAP3K1, 8q24, and LSP1) influence the clinical presentationof breast cancer and survival after diagnosis. We studiedthese susceptibility loci in relation to clinically importanttumor characteristics in up to 23,039 invasive breast cancercases and 26,273 controls of European or Asian origin from20 studies. The association, with overall survival, wasevaluated in 13,527 cases from 13 studies. The most notablefindings were that the genetic variants in the fibroblastgrowth factor receptor 2 (FGFR2) gene and the 8q24 regionwere more strongly related to ER-positive than ER-negativedisease, and to low rather than high grade tumors. The locidid not significantly influence survival after accounting forknown prognostic factors. Analyses indicated that commongenetic variants influence the pathological subtype of breastcancer and provide further support for the hypothesis thatER-positive and ER-negative diseases are biologically distincttumors. Understanding the etiologic heterogeneity of breastcancer may ultimately result in improvements in prevention,early detection, and treatment.
Breast Cancer Susceptibility and Pathology
PLoS Genetics | www.plosgenetics.org 3 April 2008 | Volume 4 | Issue 4 | e1000054

per-allele ORs (assuming a log-additive model). Heterogeneity
between genotype odds ratios for different tumor subtypes was
assessed using logistic regression analyses restricted to cases (case-
only analyses) with the tumor characteristic as the outcome
variable. For tumor subtypes with more than two levels (i.e. grade,
size, stage), we used a polytomous logistic regression model
constraining the effect size to increase linearly across levels (e.g. the
parameter for grade 3 vs grade1 = 2*grade2 vs grade1). To
evaluate which of several correlated tumor features was most
important in determining genotype associations, we fitted logistic
regression models with one of the tumor features as the outcome
and the genotype and other tumor features as explanatory
variables.
Survival analyses were based on 13,527 breast cancer cases from
13 studies with available follow-up data. Univariate analyses for
each SNP were carried out by estimating Kaplan-Meier survival
curves stratified by genotypes, and by fitting Cox proportional
hazards regression models adjusting for study and left-truncating
at date of blood draw to allow for inclusion of prevalent cases. This
provides an unbiased estimate of the hazard ratio provided that
the proportional hazards assumption holds. The assumption of
proportional hazards was tested by visual inspection of standard
log-log plots and analytically using Schoenfeld residuals. Time at
risk was calculated from the date of blood sample draw to date of
death or last follow-up, whichever date came first. Follow-up for
all cases was censored at 10 years after the initial diagnosis because
the number of cases with longer time of follow-up was relatively
small, and they are likely to be a selected group of patients due to
lost to follow up. A total of 1,584 deaths occurred during eligible
follow-up. We also carried out analyses adjusting for other
determinants of survival (age at diagnosis (continuous), ER and
PR status (each dichotomous), grade (ordinal), tumor size
(continuous) and nodal involvement (dichotomous)). Survival
analyses were conducted for all cases combined, and separately
for ER-positive and ER-negative cases. Data were analyzed using
STATA v.9. for Windows (College Station, TX).
The main conclusions from our analyses are based on
comparisons of five SNPs with seven correlated tumor character-
istics (i.e. ER, PR, grade, nodes, size, histology and stage at
diagnosis) and survival after diagnosis. We have used a
permutation adjustment procedure [21] to correct P values for
these 40 hypothesis tests. The tumor characteristics were permuted
in a group with respect to the SNPs. In this procedure, the
outcomes (i.e. tumor characteristics) were randomly assigned
against the SNPs while retaining the correlation structure of the
outcomes. We performed 1000 permutations to obtain the
empirical distribution of P values under the null hypothesis of no
association. Multiple-comparisons-permutation-adjusted P values
for each of the 40 tests were calculated as the proportion of P
values equal or smaller than the observed P value.
Entrez Gene Accession NumbersGFR2: 2263
TNRC9 or TOX3: 27324
MAP3K1: 4214
MIER3: 166968
LSP1: 4046
v-myc myelocytomatosis viral oncogene homolog (avian) (MYC): 4609
Table 1. Per-allele odds ratios for breast cancer risk by estrogen receptor status.
Locus ER-positive cases ER-negative cases Observed Adjusted
SNP Genotype Controls N OR* 95% CI N OR* 95% CI P** P***
FGFR2 GG 10,056 4,043 1.00 1,378 1.00
rs2981582 AG 12,255 6,390 1.28 1.22–1.35 1,828 1.08 1.00–1.16
AA 3,747 2,636 1.74 1.63–1.85 607 1.18 1.06–1.30
per allele 1.31 1.27–1.36 1.08 1.03–1.14 10213 ,0.001
TNRC9 GG 13,295 5,970 1.00 1,789 1.00
rs3803662 AG 9,705 5,553 1.25 1.19–1.31 1,579 1.16 1.08–1.25
AA 2,026 1,451 1.48 1.37–1.60 397 1.28 1.13–1.45
per allele 1.23 1.19–1.27 1.14 1.09–1.21 0.015 0.43
MAP3K1 TT 13,447 6,352 1.00 1,912 1.00
rs889312 GT 10,480 5,474 1.12 1.07–1.17 1,539 1.03 0.96–1.11
GG 2,154 1,271 1.26 1.17–1.36 370 1.20 1.06–1.36
per allele 1.12 1.09–1.16 1.07 1.01–1.13 0.11 0.99
8q24 AA 7,650 3,721 1.00 1,158 1.00
rs13281615 AG 10,682 5,681 1.11 1.06–1.17 1,603 0.99 0.91–1.07
GG 3,773 2,298 1.29 1.21–1.38 623 1.09 0.98–1.21
per allele 1.13 1.10–1.17 1.03 0.98–1.09 0.001 0.038
LSP1 AA 12,695 6,304 1.00 1,867 1.00
rs381798 AG 10,995 5,485 1.04 0.99–1.09 1,587 1.01 0.94–1.09
GG 2,322 1,281 1.19 1.10–1.28 363 1.13 1.00–1.27
per allele 1.07 1.04–1.11 1.04 0.99–1.10 0.31 1.00
*ORs adjusted for study.**P for heterogeneity calculated from case-only analyses adjusted for study.***Permutation adjusted P for heterogeneitydoi:10.1371/journal.pgen.1000054.t001
Breast Cancer Susceptibility and Pathology
PLoS Genetics | www.plosgenetics.org 4 April 2008 | Volume 4 | Issue 4 | e1000054

Results
Association between SNPs and Breast Cancer Risk byTumor Subtypes
Minor allele frequencies and estimates for the association
between the five SNPs evaluated and overall breast cancer risk are
shown in Table S5. Stratification of tumors by ER status indicated
that rs2981582 in FGFR2 had a stronger association with ER-
positive (per-allele OR (95% CI) = 1.31 (1.27–1.36)) than ER-
negative tumors (1.08 (1.03–1.14); P for heterogeneity of
ORs = 10213; Table 1; Figure 1 panel A; see Table S6 for
estimates by ethnicity). Women with the homozygous variant
genotype (present in 14% of controls) had a risk of ER-positive
tumors 1.74 (95%CI = 1.63–1.85) times higher than those with the
common homozygous genotype (present in 39% of controls)
(Table 1). The difference in ORs between ER-positive and ER-
negative tumors is consistent across studies (Figure 1 panel A), and
it is highly significant even after permutation adjustment for
multiple comparisons (P,0.001). The rs2981582 association was
also stronger for other tumor characteristics associated with ER
status, i.e. PR expression (P = 1025) and lower grade (P = 1028;
Table 2; Tables S7, S8). The associations of rs2981582 with ER,
PR and grade were significant after permutation adjustment for
multiple comparisons (P#0.001). The modification by ER status
remained statistically significant after adjustment for PR status and
grade (P = 0.002) based on data from those studies with information
on all three tumor characteristics (16 studies including 10,951 cases).
On the other hand, the evidence for associations with PR status
became non-significant after adjustment for ER status (P = 0.45).
The association with grade (Table 2) remained statistically significant
after adjustment by ER status (P = 0.003), and after further
adjustment for PR status (P = 0.030). Grouping tumors as ER and
PR negative versus ER and/or PR positive tumors did not result in
further discrimination of risks (data not shown).
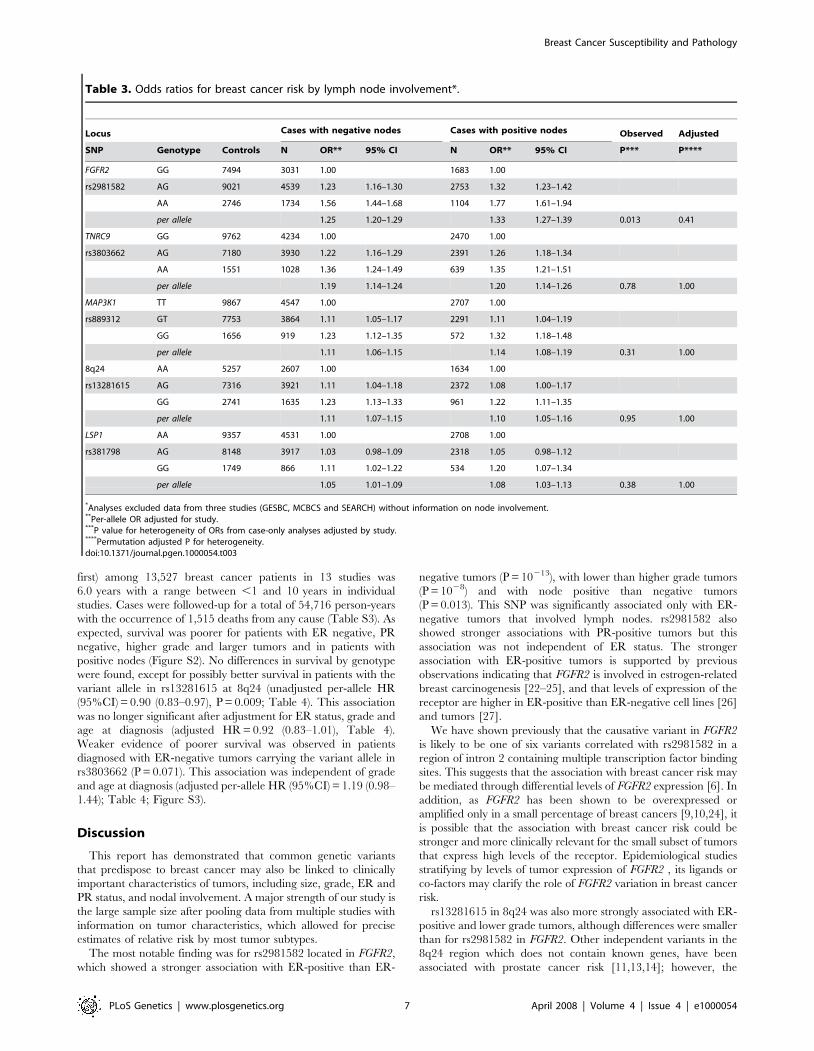
The association of rs2981582 with breast cancer risk tended to
be stronger for patients with positive (per-allele OR (95%
CI) = 1.33 (1.27–1.39)) compared to negative (1.25 (1.20–1.29))
nodal involvement (P = 0.013; Table 3; see Table S9 for estimates
by ethnicity). Although differences were small and not significant
after permutation adjustment for multiple comparisons (P = 0.41),
they were consistent across studies (Figure 1, panel B). Nodal
involvement was correlated with tumor grade and size, and the
association between nodal involvement and rs2981582 among
cases remained significant (P = 0.010) after adjustment for these
Figure 1. Per-allele odds ratios (ORs) and 95% confidence intervals (CIs) for the association between FGFR2 (rs2981582) and breastcancer by study. A. stratified by ER status, B. stratified by axillary node involvement. Studies are weighted and ranked according to the inverse ofthe variance of the log OR estimate for ER-positive (A) or node positive (B) tumors. P for study heterogeneity were 0.84 and 0.96, for the associationwith ER-positive and negative disease, respectively; and 0.64 and 0.97 for node positive and negative diseases, respectively. See Table S1 fordescription of the studies and acronyms.doi:10.1371/journal.pgen.1000054.g001
Breast Cancer Susceptibility and Pathology
PLoS Genetics | www.plosgenetics.org 5 April 2008 | Volume 4 | Issue 4 | e1000054
tumor characteristics in 9 studies with 6,204 cases. Nodal
involvement and ER status were independently associated with
rs2981582 in 12,374 cases from 17 studies with data on these two
factors (P value for node association with rs2981582 adjusted by
ER = 0.022; P = 0.75 after adjusting for multiple testing).
rs2981582 showed the strongest association with node positive
ER-positive tumors (29% of all tumors; per-allele OR (95%
CI) = 1.37 (1.29–1.44)), followed by node negative ER-positive
tumors (48% of all tumors; 1.30 (1.25–1.36)) and node positive
ER-negative tumors (10% of all tumors; 1.18 (1.09–1.29) (Table
S10). No increase in risk was observed for node negative ER-
negative tumors (13% of tumors; 1.05 (0.97–1.13).
The association of rs13281615 in 8q24 with risk was also
stronger for ER-positive compared to ER-negative tumors
(P = 0.001; Table 1; Figure S1). This SNP also showed a stronger
association with PR-positive than negative tumors (P = 0.011;
Table S7) and lower tumor grade (P = 1024; Table S8). Only the
associations of rs13281615 with ER and grade, but not with PR,
were significant after permutation adjustment for multiple
comparisons (P = 0.037, 0.016, 0.35, respectively). The associa-
tions with ER and grade were significant after adjustment for each
other (P = 0.029 for ER adjusted for grade and 0.035 for grade
adjusted for ER in 15 studies with 11,419 cases with data on ER
and grade), while the association with PR was not significant after
ER adjustment (P = 0.31). The association of rs3803662 in TNRC9
and breast cancer was also significantly modified by ER status
(P = 0.015; Table 1)) and grade (P = 0.018; Table 2). However,
these differences were not significant after permutation adjustment
for multiple comparisons (P = 0.42 for ER, 0.50 for grade), or
when adjusted for each other in 16 studies with 13,075 cases with
data on ER and grade (P = 0.11 for ER adjusted by grade, and
P = 0.37 for grade adjusted by ER).
Three SNPs (rs2981582 in FGFR2, rs3803662 in TNRC9 and
rs889312 in MAP3K1) were associated with significant increases in
risk of ER-negative tumors (Table 1), although to a lesser extent
than ER-positive tumors. Of these SNPs, rs3803662 showed the
strongest association with ER-negative tumors: women with the
homozygous variant genotype (present in 8% of controls) had a
1.28 (95%CI = 1.13–1.45) higher risk of developing ER-negative
disease than women with the common homozygous genotype
(present in 53% of controls) (Table 1).
No significant modification of the ORs was observed for stage at
initial diagnosis for any of the 5 loci (Table S13). Of note,
rs889312 in MAP3K1 and rs3817198 in LSP1 were not associated
with any of the tumor characteristics (Tables S6, S7, S8, S9 and
S11, S12, S13). Modification of ORs by tumor characteristics
generally followed similar patterns for Europeans and Asians,
although the number of Asians was substantially smaller, and thus
most differences by tumor type were not statistically significant. An
exception was the presence of stronger associations with larger
tumors for rs889312 in MAP3K1 (P = 0.015; Table S11) in Asian
but not in European populations.
Survival AnalysesThe average time at risk (i.e. date of blood sample draw to date
of death, last follow-up or censored time, whichever date came
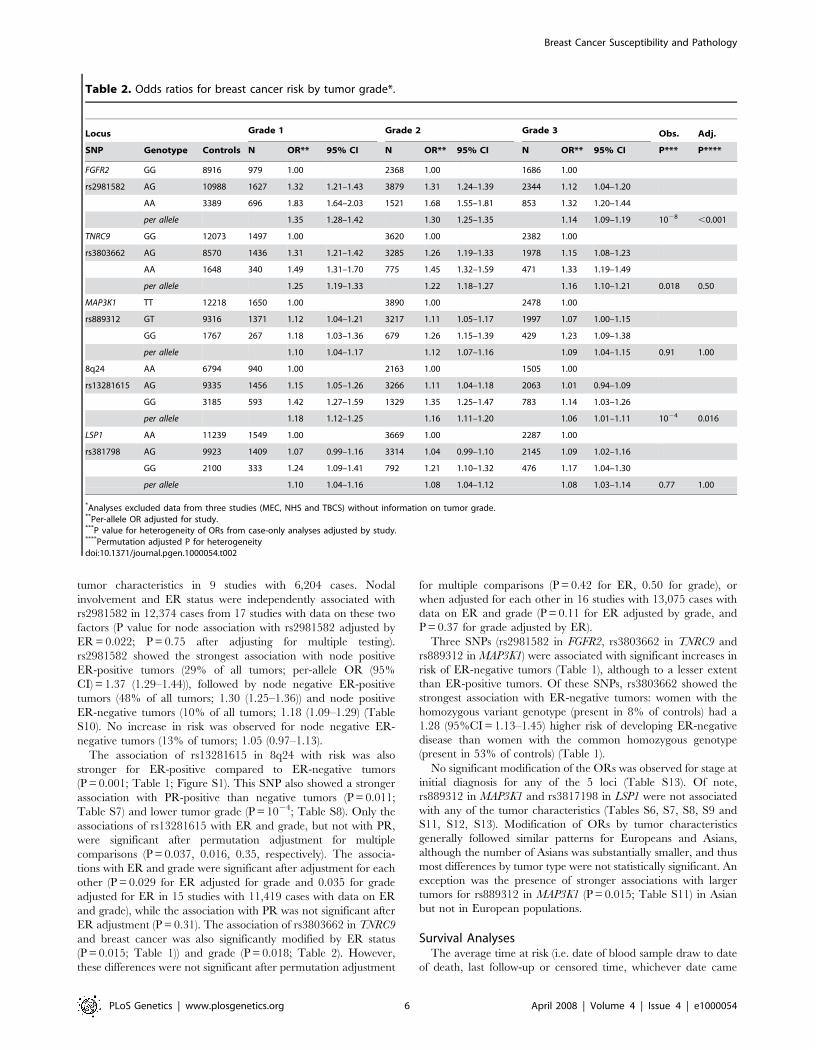
Table 2. Odds ratios for breast cancer risk by tumor grade*.
Locus Grade 1 Grade 2 Grade 3 Obs. Adj.
SNP Genotype Controls N OR** 95% CI N OR** 95% CI N OR** 95% CI P*** P****
FGFR2 GG 8916 979 1.00 2368 1.00 1686 1.00
rs2981582 AG 10988 1627 1.32 1.21–1.43 3879 1.31 1.24–1.39 2344 1.12 1.04–1.20
AA 3389 696 1.83 1.64–2.03 1521 1.68 1.55–1.81 853 1.32 1.20–1.44
per allele 1.35 1.28–1.42 1.30 1.25–1.35 1.14 1.09–1.19 1028 ,0.001
TNRC9 GG 12073 1497 1.00 3620 1.00 2382 1.00
rs3803662 AG 8570 1436 1.31 1.21–1.42 3285 1.26 1.19–1.33 1978 1.15 1.08–1.23
AA 1648 340 1.49 1.31–1.70 775 1.45 1.32–1.59 471 1.33 1.19–1.49
per allele 1.25 1.19–1.33 1.22 1.18–1.27 1.16 1.10–1.21 0.018 0.50
MAP3K1 TT 12218 1650 1.00 3890 1.00 2478 1.00
rs889312 GT 9316 1371 1.12 1.04–1.21 3217 1.11 1.05–1.17 1997 1.07 1.00–1.15
GG 1767 267 1.18 1.03–1.36 679 1.26 1.15–1.39 429 1.23 1.09–1.38
per allele 1.10 1.04–1.17 1.12 1.07–1.16 1.09 1.04–1.15 0.91 1.00
8q24 AA 6794 940 1.00 2163 1.00 1505 1.00
rs13281615 AG 9335 1456 1.15 1.05–1.26 3266 1.11 1.04–1.18 2063 1.01 0.94–1.09
GG 3185 593 1.42 1.27–1.59 1329 1.35 1.25–1.47 783 1.14 1.03–1.26
per allele 1.18 1.12–1.25 1.16 1.11–1.20 1.06 1.01–1.11 1024 0.016
LSP1 AA 11239 1549 1.00 3669 1.00 2287 1.00
rs381798 AG 9923 1409 1.07 0.99–1.16 3314 1.04 0.99–1.10 2145 1.09 1.02–1.16
GG 2100 333 1.24 1.09–1.41 792 1.21 1.10–1.32 476 1.17 1.04–1.30
per allele 1.10 1.04–1.16 1.08 1.04–1.12 1.08 1.03–1.14 0.77 1.00
*Analyses excluded data from three studies (MEC, NHS and TBCS) without information on tumor grade.**Per-allele OR adjusted for study.***P value for heterogeneity of ORs from case-only analyses adjusted by study.****Permutation adjusted P for heterogeneitydoi:10.1371/journal.pgen.1000054.t002
Breast Cancer Susceptibility and Pathology
PLoS Genetics | www.plosgenetics.org 6 April 2008 | Volume 4 | Issue 4 | e1000054
first) among 13,527 breast cancer patients in 13 studies was
6.0 years with a range between ,1 and 10 years in individual
studies. Cases were followed-up for a total of 54,716 person-years
with the occurrence of 1,515 deaths from any cause (Table S3). As
expected, survival was poorer for patients with ER negative, PR
negative, higher grade and larger tumors and in patients with
positive nodes (Figure S2). No differences in survival by genotype
were found, except for possibly better survival in patients with the
variant allele in rs13281615 at 8q24 (unadjusted per-allele HR
(95%CI) = 0.90 (0.83–0.97), P = 0.009; Table 4). This association
was no longer significant after adjustment for ER status, grade and
age at diagnosis (adjusted HR = 0.92 (0.83–1.01), Table 4).
Weaker evidence of poorer survival was observed in patients
diagnosed with ER-negative tumors carrying the variant allele in
rs3803662 (P = 0.071). This association was independent of grade
and age at diagnosis (adjusted per-allele HR (95%CI) = 1.19 (0.98–
1.44); Table 4; Figure S3).
Discussion
This report has demonstrated that common genetic variants
that predispose to breast cancer may also be linked to clinically
important characteristics of tumors, including size, grade, ER and
PR status, and nodal involvement. A major strength of our study is
the large sample size after pooling data from multiple studies with
information on tumor characteristics, which allowed for precise
estimates of relative risk by most tumor subtypes.
The most notable finding was for rs2981582 located in FGFR2,
which showed a stronger association with ER-positive than ER-
negative tumors (P = 10213), with lower than higher grade tumors
(P = 1028) and with node positive than negative tumors
(P = 0.013). This SNP was significantly associated only with ER-
negative tumors that involved lymph nodes. rs2981582 also
showed stronger associations with PR-positive tumors but this
association was not independent of ER status. The stronger
association with ER-positive tumors is supported by previous
observations indicating that FGFR2 is involved in estrogen-related
breast carcinogenesis [22–25], and that levels of expression of the
receptor are higher in ER-positive than ER-negative cell lines [26]
and tumors [27].
We have shown previously that the causative variant in FGFR2
is likely to be one of six variants correlated with rs2981582 in a
region of intron 2 containing multiple transcription factor binding
sites. This suggests that the association with breast cancer risk may
be mediated through differential levels of FGFR2 expression [6]. In
addition, as FGFR2 has been shown to be overexpressed or
amplified only in a small percentage of breast cancers [9,10,24], it
is possible that the association with breast cancer risk could be
stronger and more clinically relevant for the small subset of tumors
that express high levels of the receptor. Epidemiological studies
stratifying by levels of tumor expression of FGFR2 , its ligands or
co-factors may clarify the role of FGFR2 variation in breast cancer
risk.
rs13281615 in 8q24 was also more strongly associated with ER-
positive and lower grade tumors, although differences were smaller
than for rs2981582 in FGFR2. Other independent variants in the
8q24 region which does not contain known genes, have been
associated with prostate cancer risk [11,13,14]; however, the
Table 3. Odds ratios for breast cancer risk by lymph node involvement*.
Locus Cases with negative nodes Cases with positive nodes Observed Adjusted
SNP Genotype Controls N OR** 95% CI N OR** 95% CI P*** P****
FGFR2 GG 7494 3031 1.00 1683 1.00
rs2981582 AG 9021 4539 1.23 1.16–1.30 2753 1.32 1.23–1.42
AA 2746 1734 1.56 1.44–1.68 1104 1.77 1.61–1.94
per allele 1.25 1.20–1.29 1.33 1.27–1.39 0.013 0.41
TNRC9 GG 9762 4234 1.00 2470 1.00
rs3803662 AG 7180 3930 1.22 1.16–1.29 2391 1.26 1.18–1.34
AA 1551 1028 1.36 1.24–1.49 639 1.35 1.21–1.51
per allele 1.19 1.14–1.24 1.20 1.14–1.26 0.78 1.00
MAP3K1 TT 9867 4547 1.00 2707 1.00
rs889312 GT 7753 3864 1.11 1.05–1.17 2291 1.11 1.04–1.19
GG 1656 919 1.23 1.12–1.35 572 1.32 1.18–1.48
per allele 1.11 1.06–1.15 1.14 1.08–1.19 0.31 1.00
8q24 AA 5257 2607 1.00 1634 1.00
rs13281615 AG 7316 3921 1.11 1.04–1.18 2372 1.08 1.00–1.17
GG 2741 1635 1.23 1.13–1.33 961 1.22 1.11–1.35
per allele 1.11 1.07–1.15 1.10 1.05–1.16 0.95 1.00
LSP1 AA 9357 4531 1.00 2708 1.00
rs381798 AG 8148 3917 1.03 0.98–1.09 2318 1.05 0.98–1.12
GG 1749 866 1.11 1.02–1.22 534 1.20 1.07–1.34
per allele 1.05 1.01–1.09 1.08 1.03–1.13 0.38 1.00
*Analyses excluded data from three studies (GESBC, MCBCS and SEARCH) without information on node involvement.**Per-allele OR adjusted for study.***P value for heterogeneity of ORs from case-only analyses adjusted by study.****Permutation adjusted P for heterogeneity.doi:10.1371/journal.pgen.1000054.t003
Breast Cancer Susceptibility and Pathology
PLoS Genetics | www.plosgenetics.org 7 April 2008 | Volume 4 | Issue 4 | e1000054

mechanisms for the associations with these cancers are unknown.
A recent GWAS comprising five studies with 4,533 cases and
17,513 controls (including samples from the MEC study in this
report) showed the risk from rs3803662 in TNRC9 to be significantly
greater in ER-positive tumors [20]. Our data also showed a stronger
association with ER-positive than ER-negative tumors, but the
difference was smaller and not statistically significant based on the
analysis of 12,832 cases and 22,356 controls from 18 studies.
Moreover, this SNP showed the strongest association with ER-
negative disease among the five evaluated. Future studies might
reveal stronger associations between these SNPs and tumor subtypes
defined by different markers, or perhaps molecular subtypes
previously defined by gene expression profiling [28,29].
It is possible that our study preferentially detected SNPs
associated with ER-positive rather than ER-negative disease, since
the majority of breast cancer cases in the initial GWAS were ER
positive. This raises the possibility that genome-wide association
studies focusing on the less common breast tumor subtypes may
identify different risk loci. Of particular importance might be SNPs
identified in studies of basal tumor subtypes since they are often
clinically aggressive and difficult to treat effectively, and have been
associated with germline mutations in BRCA1 [5,28].
Differences in the design, source of information on tumor
characteristics and criteria to classify tumors across studies could
lead to heterogeneity of findings by study, which limits the ability
to detect modification of genotype associations by tumor
characteristics. However, findings were generally consistent across
studies (Figure 1 and Figure S1), particularly for the FGFR2
(rs2981582) association by ER status, arguing for the robustness of
our results. Genotype associations with risk of breast cancer were
similar for subjects with and without information on tumor
characteristics (data not shown), indicating that missing informa-
tion is unlikely to substantially affect our results.
None of the five SNPs included in this report had a significant
association with overall survival independent of their associations
with known prognostic factors. Only rs13281615 in 8q24 was
significantly associated with survival in unadjusted analyses.
Adjustment for ER status and grade resulted in a weaker, non-
significant association with survival, suggesting that the increased
survival is partially mediated through the higher probability of
developing tumors with favorable prognostic characteristics. Any
SNP effect on overall survival, if mediated through known
prognostic tumor characteristics, would be expected to be small
because of the small magnitude of risk differences by tumor
subtypes; thus the power to detect a difference in survival would be
low. For instance, at a type I error rate of 0.01, the power to detect
alleles with minor allele frequency (MAF) = 0.3 that confer a per-
allele HR of 1.1 is only 40%. Another limitation of the survival
Table 4. Multivariate Cox proportional hazards analysis of genetic polymorphisms in relation to overall survival following breastcancer diagnosis, by ER status*.
Unadjusted** Adjusted****
Locus SNP HR**95%CI
ObsP Adj P*** HR** 95% CI Obs P
All tumors
FGFR2 rs2981582 0.98 0.91–1.05 0.56 1.00 1.01 0.92–1.11 0.82
TNRC9 rs3803662 1.05 0.96–1.15 0.26 1.00 1.06 0.95–1.19 0.31
MAP3K1 rs889312 1.02 0.95–1.11 0.54 1.00 1.03 0.93–1.15 0.52
8q24 rs13281615 0.90 0.83–0.97 0.009 0.32 0.92 0.83–1.01 0.084
LSP1 rs381798 0.99 0.92–1.07 0.88 1.00 1.03 0.93–1.14 0.55
ER positive tumors
FGFR2 rs2981582 1.00 0.90–1.11 0.98 1.03 0.92–1.16 0.62
TNRC9 rs3803662 1.02 0.89–1.16 0.82 1.00 0.86–1.15 0.97
MAP3K1 rs889312 0.99 0.88–1.11 0.82 0.99 0.87–1.13 0.91
8q24 rs13281615 0.88 0.78–0.99 0.039 0.89 0.78–1.01 0.068
LSP1 rs381798 1.09 0.98–1.23 0.12 1.07 0.94–1.21 0.32
ER negative tumors
FGFR2 rs2981582 0.99 0.85–1.15 0.87 0.98 0.84–1.14 0.78
TNRC9 rs3803662 1.19 0.99–1.43 0.071 1.19 0.98–1.44 0.076
MAP3K1 rs889312 1.15 0.98–1.35 0.08 1.11 0.94–1.32 0.22
8q24 rs13281615 0.95 0.81–1.11 0.48 0.96 0.82–1.13 0.64
LSP1 rs381798 0.95 0.81–1.11 0.49 0.97 0.82–1.15 0.74
*Analyses by ER status included data from 12 studies with information on vital status and ER status (CGPS, CNIO-BCS, HABCS, HEBCS, KBCP, kConFab, LUMCBCS, MCCS,PBCS, SASBCS, SBCS, SEARCH).
**Per-allele hazard ratios (HR) and observed P values are adjusted for study. Allele changes are (common.rare based on frequencies in European populations): G.A forrs2981582; G.A for rs3803662; T.G for rs889312; A.G for rs13281615 and A.G for rs381798.
***Permutation adjusted P values.****Per-allele hazard ratios (HR) and observed P values are adjusted for study, age at diagnosis (continuous), ER status and grade (continuous). Analyses limited to 11
studies with ER and grade information (CGPS, CNIO-BCS, HABCS, HEBCS, KBCP, LUMCBCS, MCCS, PBCS, SASBCS, SBCS, SEARCH).The P values for the interaction between ER status and genotype adjusted for study, grade and age at diagnosis are: 0.60, 0.15, 0.29, 0.45, 0.38 for rs2981582, rs3803662,rs889312, rs13281615, rs381798, respectively.doi:10.1371/journal.pgen.1000054.t004
Breast Cancer Susceptibility and Pathology
PLoS Genetics | www.plosgenetics.org 8 April 2008 | Volume 4 | Issue 4 | e1000054

analyses is that relapse or disease-specific mortality data were not
available for most studies and use of all cause mortality as the end
point may further reduce power. Finally, any impact of SNPs on
survival may interact with treatment, particularly adjuvant
chemotherapy, or other determinants of survival such obesity.
However, this could not be evaluated since information on
treatment or other factors affecting survival was not available.
We have shown that there is heterogeneity in the risk of
different tumor types for common breast cancer susceptibility
alleles, with the clearest difference being in the relative risk of ER-
positive and ER-negative tumors for the variant in FGRF2. Other
differences were observed, however, the weight of evidence was
weaker and needs further confirmation in additional studies. These
findings provide further support for the notion that ER-negative
and ER-positive tumors result from different etiologic pathways,
rather than different stages of tumor evolution within a common
carcinogenic pathway [30]. The magnitude of the observed
differences is small, and by themselves these findings are unlikely
to have any immediate clinical implications. However, the
observed differences provide clues to the biological mechanisms
that underpin tumor heterogeneity, which may ultimately lead to
improved treatment and prevention.
Supporting Information
Figure S1 Per-allele odds ratios (ORs) and 95% confidence
intervals (CIs) for the association between SNPs and breast cancer
by study, stratified by ER status. Studies are weighted and ranked
according to the inverse of the variance of the log OR estimate for
ER-positive tumors. P for study heterogeneity for the association
with ER-positive/ER-negative disease, respectively, were 0.77/
0.99 for rs3803662; 0.72/0.29 rs889312; 0.55/0.31 for
rs13281615; and 0.55/0.46 for rs3817198. See Table S1 for
description of the studies and acronyms.
Found at: doi:10.1371/journal.pgen.1000054.s001 (0.30 MB
DOC)
Figure S2 Kaplan-Meier plot showing survival after stratifying
for estrogen and progesterone receptor status, histological grade,
tumor size, nodal status, and histopathology.
Found at: doi:10.1371/journal.pgen.1000054.s002 (0.15 MB
DOC)
Figure S3 Kaplan-Meier plots showing survival in different
genotypes of (A.) rs3803662 inTNRC9 and (B.) rs13281615 in
8q24 among cases diagnosed with ER-positive and ER-negative
tumors.
Found at: doi:10.1371/journal.pgen.1000054.s003 (0.14 MB
DOC)
Table S1 Summary of the 21 breast cancer case studies used in
the analyses for tumor characteristics and survival.
Found at: doi:10.1371/journal.pgen.1000054.s004 (0.13 MB
DOC)
Table S2 Information content, sources of information for tumor
characteristics and survival data, and relevant publications for the
21 participating studies.
Found at: doi:10.1371/journal.pgen.1000054.s005 (0.08 MB
DOC)
Table S3 Number of cases, person-years at risk, number of
deaths, mortality rate (MR), and 95 percent confidence intervals
(95%CI) in the 13 studies with follow-up information.
Found at: doi:10.1371/journal.pgen.1000054.s006 (0.05 MB
DOC)
Table S4 Distribution of tumor characteristics among 23,039
invasive breast cancer cases in the 20 participating studies with
information on tumor.
Found at: doi:10.1371/journal.pgen.1000054.s007 (0.03 MB
DOC)
Table S5 Per-allele odds ratios for the association between SNPs
and invasive breast cancer risk in 20 studies included in the
assessment of tumor characteristics in this report.
Found at: doi:10.1371/journal.pgen.1000054.s008 (0.05 MB
DOC)
Table S6 Per-allele odds ratios for breast cancer risk by estrogen
receptor status, stratified by ethnicity.
Found at: doi:10.1371/journal.pgen.1000054.s009 (0.07 MB
DOC)
Table S7 Per-allele odds ratios for breast cancer risk by
progesterone receptor status, stratified by ethnicity.
Found at: doi:10.1371/journal.pgen.1000054.s010 (0.07 MB
DOC)
Table S8 Per-allele odds ratios for breast cancer risk by grade,
stratified by ethnicity.
Found at: doi:10.1371/journal.pgen.1000054.s011 (0.07 MB
DOC)
Table S9 Per-allele odds ratios for breast cancer risk by nodal
status, stratified by ethnicity.
Found at: doi:10.1371/journal.pgen.1000054.s012 (0.07 MB
DOC)
Table S10 Per-allele odds ratios for the association between
FGFR2 rs2981582 and breast cancer risk by ER and nodal status.
Found at: doi:10.1371/journal.pgen.1000054.s013 (0.03 MB
DOC)
Table S11 Per-allele odds ratios for breast cancer risk by tumor
size, stratified by ethnicity.
Found at: doi:10.1371/journal.pgen.1000054.s014 (0.09 MB
DOC)
Table S12 Per-allele odds ratios for breast cancer risk by
histopathogic subtypes, stratified by ethnicity.
Found at: doi:10.1371/journal.pgen.1000054.s015 (0.06 MB
DOC)
Table S13 Per-allele odds ratios for breast cancer risk by stage at
diagnosis, stratified by ethnicity.
Found at: doi:10.1371/journal.pgen.1000054.s016 (0.08 MB
DOC)
Acknowledgments
We would like to thank to Guillermo Pita, JM San Roman and the Instituto
Palacios for their contributions to this study. We thank Marcia Brumm and
Kathleen Merkle for sample and data collection. We wish to thank Heather
Thorne, Eveline Niedermayr, all the kConFab research nurses and staff,
the heads and staff of the Family Cancer Clinics, and the Clinical Follow
Up Study for their contributions to this resource, and the many families
who contribute to kConFab. For Australian Breast Cancer Family Study
control data, we thank John Hopper, Margaret McCredie, Graham Giles
and Melissa Southey, and for Australian Ovarian Cancer Study control
data, we thank the AOCS Management group of David Bowtell, Adele
Green, Penny Webb, Dorota Gertig, and Anna deFaxio. We would like to
thank Helen Cramp, Sue Higham, Dan Connley, Ian Brock, Gordon
Macpherson and Mark Meuth for their contributions to this study. The
ORIGO team wishes to thank E. Krol-Warmerdam and J. Blom for data-
management and patient-inclusion. We thank Ursula Eilber and Belinda
Kaspereit for excellent technical support. We wish to thank patients
participating in this study, and Drs. Hannaleena Eerola and Paivi Heikkila
Breast Cancer Susceptibility and Pathology
PLoS Genetics | www.plosgenetics.org 9 April 2008 | Volume 4 | Issue 4 | e1000054

for their help in sample and data collection. We are thankful to Helena
Kemilainen, Aija Parkkinen and Kirsi Alisalo for their contribution to
Kuopio Breast Cancer Project. The authors thank N. Szeszenia-
Dabrowska of the Nofer Institute of Occupational Medicine and W.
Zatonski of the Department of Cancer Epidemiology and Prevention,
Cancer Center and M. Sklodowska-Curie Institute of Oncology, 02-781
Warsaw, Poland for their contribution to the Polish Breast Cancer Study.
Finnish Cancer Registry is gratefully acknowledged for cancer data. Apart
from the general thanking of all study participants, we thank the SEARCH
team and the Eastern Registration and Cancer Intelligence Unit. We thank
William Anderson from the Division of Cancer Epidemiology and
Genetics, National Cancer Institute, USA, for his comments to the paper.
Author Contributions
Conceived and designed the experiments: M. Garcia-Closas, P. Hall, S.
Bojesen, B. Nordestgaard, C. Axelsson, T. Dork, J. Chang-Claude, D.
Flesch-Janys, D. Hunter, S. Hankinson, D. Cox, R. Tamimi, P. Kraft, P.
Brennan, J. McKay, D. Easton, P. Pharoah. Performed the experiments:
K. Pooley, R. Milne, G. Ribas, A. Gonzalez-Neira, J. Benıtez, H. Brauch,
C. Justenhoven, T. Dork, P. Schurmann, N. Bogdanova, A. Mannermaa,
J. Beesley, X. Chen, J. Chang-Claude, R. Salazar, S. Wang-Gohrke, F.
Couch, M. Southey, D. Hunter, D. Cox, S. Chanock, J. Liu, A. Dunning,
F. Odefrey, J. Struewing. Analyzed the data: M. Garcia-Closas, D.
Richesson, T. Dork, M. Tengstrom, V. Kataja, P. Huijts, S. Kropp, D.
Flesch-Janys, P. Kraft, J. Tyrer, V. Gabrieau. Contributed reagents/
materials/analysis tools: M. Garcia-Closas, P. Hall, H. Nevanlinna, K.
Pooley, J. Morrison, S. Bojesen, B. Nordestgaard, C. Axelsson, H. Brauch,
P. Hillemanns, M. Bremer, J. Karstens, R. Fagerholm, K. Aaltonen, K.
Aittomaki, K. von Smitten, C. Blomqvist, M. Uusitupa, M. Eskelinen, V.
Kosma, G. Chenevix-Trench, A. Spurdle, Australian Ovarian Cancer
Management Group, The Kathleen Cuningham Foundation Consortium
for Research into Familial Breast Cancer, P. Devilee, C. van Asperen, R.
Tollenaar, J. Chang-Claude, D. Flesch-Janys, F. Couch, J. Olson, G. Giles,
C. Haiman, B. Henderson, L. Kolonel, L. Le Marchand, D. Stram, A.
Uitterlinden, J. Liu, K. Humphreys, K. Czene, J. Struewing. Wrote the
paper: M. Garcia-Closas, P. Hall, H. Nevanlinna, P. Pharoah. Study
design/data collection: M. Garcia-Closas, P. Hall, H. Nevanlinna, J.
Morrison, J. Arias, P. Zamora, H. Brauch, C. Justenhoven, U. Hamann, Y.
Ko, T. Bruening, S. Haas, R. Fagerholm, K. Aaltonen, A. Mannermaa, M.
Uusitupa, M. Eskelinen, M. Tengstrom, V. Kosma, V. Kataja, G.
Chenevix-Trench, A. Spurdle, C. van Asperen, C. Jacobi, R. Tollenaar, J.
Klijn, T. Slanger, E. Mutschelknauss, F. Couch, E. Goode, J. Olson, C.
Vachon, Z. Fredericksen, G. Giles, L. Baglietto, G. Severi, J. Hopper, D.
English, M. Southey, C. Haiman, B. Henderson, L. Kolonel, L. Le
Marchand, D. Stram, D. Hunter, S. Hankinson, R. Tamimi, M. Sherman,
J. Lissowska, L. Brinton, B. Peplonska, J. Klijn, M. Hooning, H. Meijers-
Heijboer, J. Collee, A. Ouweland, J. Liu, L. Lin, L. Yuqing, A. Cox, S.
Balasubramanian, M. Reed, F. Blows, K. Driver, A. Dunning, B. Ponder,
S. Sangrajrang, A. Sigurdson, M. Doody, B. Alexander, D. Easton, P.
Pharoah. Pathology review: J. Arias, P. Zamora, S. Haas, M. Bremer, V.
Kosma, M. Sherman, S. Cross, F. Blows, K. Driver.
References
1. Anderson WF, Jatoi I, Devesa SS (2005) Distinct breast cancer incidence and
prognostic patterns in the NCI’s SEER program: suggesting a possible linkbetween etiology and outcome. Breast Cancer ResTreat 90: 127–137.
2. Ma H, Bernstein L, Pike MC, Ursin G (2006) Reproductive factors and breastcancer risk according to joint estrogen and progesterone receptor status: a meta-
analysis of epidemiological studies. Breast Cancer Res 8: R43.3. Reeves GK, Beral V, Green J, Gathani T, Bull D (2006) Hormonal therapy for
menopause and breast-cancer risk by histological type: a cohort study and meta-
analysis. Lancet Oncol 7: 910–918.4. Althuis MD, Fergenbaum JH, Garcia-Closas M, Brinton LA, Madigan MP, et
al. (2004) Etiology of hormone receptor-defined breast cancer: a systematicreview of the literature. Cancer EpidemiolBiomarkers Prev 13: 1558–1568.
5. Sorlie T, Tibshirani R, Parker J, Hastie T, Marron JS, et al. (2003) Repeated
observation of breast tumor subtypes in independent gene expression data sets.ProcNatlAcadSciUSA 100: 8418–8423.
6. Easton DF, Pooley KA, Dunning AM, Pharoah PD, Thompson D, et al. (2007)Genome-wide association study identifies novel breast cancer susceptibility loci.
Nature 447: 1087–1093.7. Dillon C, Spencer-Dene B, Dickson C (2004) A crucial role for fibroblast growth
factor s ignal ing in embryonic mammary g land development .
J MammaryGlandBiol Neoplasia 9: 207–215.8. Grose R, Dickson C (2005) Fibroblast growth factor signaling in tumorigenesis.
Cytokine Growth Factor Rev 16: 179–186.9. Heiskanen M, Kononen J, Barlund M, Torhorst J, Sauter G, et al. (2001) CGH,
cDNA and tissue microarray analyses implicate FGFR2 amplification in a small
subset of breast tumors. AnalCell Pathol 22: 229–234.10. Adnane J, Gaudray P, Dionne CA, Crumley G, Jaye M, et al. (1991) BEK and
FLG, two receptors to members of the FGF family, are amplified in subsets ofhuman breast cancers. Oncogene 6: 659–663.
11. Gudmundsson J, Sulem P, Manolescu A, Amundadottir LT, Gudbjartsson D, et
al. (2007) Genome-wide association study identifies a second prostate cancersusceptibility variant at 8q24. NatGenet 39: 631–637.
12. Penault-Llorca F, Bertucci F, Adelaide J, Parc P, Coulier F, et al. (1995)Expression of FGF and FGF receptor genes in human breast cancer. Int J Cancer
61: 170–176.13. Yeager M, Orr N, Hayes RB, Jacobs KB, Kraft P, et al. (2007) Genome-wide
association study of prostate cancer identifies a second risk locus at 8q24.
NatGenet 39: 645–649.14. Haiman CA, Patterson N, Freedman ML, Myers SR, Pike MC, et al. (2007)
Multiple regions within 8q24 independently affect risk for prostate cancer.NatGenet 39: 638–644.
15. Zanke BW, Greenwood CM, Rangrej J, Kustra R, Tenesa A, et al. (2007)
Genome-wide association scan identifies a colorectal cancer susceptibility locuson chromosome 8q24. Nat Genet 39: 989–994.
16. Haiman CA, Le Marchand L, Yamamato J, Stram DO, Sheng X, et al. (2007) A
common genetic risk factor for colorectal and prostate cancer. Nat Genet 39:954–956.
17. Tomlinson I, Webb E, Carvajal-Carmona L, Broderick P, Kemp Z, et al. (2007)A genome-wide association scan of tag SNPs identifies a susceptibility variant for
colorectal cancer at 8q24.21. Nat Genet 39: 984–988.18. Gruber SB, Moreno V, Rozek LS, Rennert HS, Lejbkowicz F, et al. (2007)
Genetic Variation in 8q24 Associated with Risk of Colorectal Cancer. Cancer
Biol Ther 6.19. Hunter DJ, Kraft P, Jacobs KB, Cox DG, Yeager M, et al. (2007) A genome-
wide association study identifies alleles in FGFR2 associated with risk of sporadicpostmenopausal breast cancer. Nat Genet 39: 870–874.
20. Stacey SN, Manolescu A, Sulem P, Rafnar T, Gudmundsson J, et al. (2007)
Common variants on chromosomes 2q35 and 16q12 confer susceptibility toestrogen receptor-positive breast cancer. Nat Genet 39: 865–869.
21. Westfall P, Young S (1993) Resampling based multiple testing. New York (NY):John Wiley & Sons, Inc.
22. Zhang Y, Sugimoto Y, Kulp SK, Farrar WB, Brueggemeier RW, et al. (1998)Estrogen-induced keratinocyte growth factor mRNA expression in normal and
cancerous human breast cells. OncolRep 5: 577–583.
23. Zhang Y, Kulp SK, Sugimoto Y, Farrar WB, Brueggemeier RW, et al. (1998)Keratinocyte growth factor (KGF) induces aromatase activity in cultured MCF-7
human breast cancer cells. Anticancer Res 18: 2541–2546.24. Hishikawa Y, Tamaru N, Ejima K, Hayashi T, Koji T (2004) Expression of
keratinocyte growth factor and its receptor in human breast cancer: its inhibitory
role in the induction of apoptosis possibly through the overexpression of Bcl-2.ArchHistolCytol 67: 455–464.
25. Tamaru N, Hishikawa Y, Ejima K, Nagasue N, Inoue S, et al. (2004) Estrogenreceptor-associated expression of keratinocyte growth factor and its possible role
in the inhibition of apoptosis in human breast cancer. Lab Invest 84: 1460–1471.
26. Zang XP, Pento JT (2000) Keratinocyte growth factor-induced motility of breastcancer cells. ClinExpMetastasis 18: 573–580.
27. Luqmani YA, Graham M, Coombes RC (1992) Expression of basic fibroblastgrowth factor, FGFR1 and FGFR2 in normal and malignant human breast, and
comparison with other normal tissues. BrJ Cancer 66: 273–280.28. Sorlie T, Perou CM, Tibshirani R, Aas T, Geisler S, et al. (2001) Gene
expression patterns of breast carcinomas distinguish tumor subclasses with
clinical implications. ProcNatlAcadSciUSA 98: 10869–10874.29. van’ Veer LJ, Dai H, van de Vijver MJ, He YD, Hart AA, et al. (2002) Gene
expression profiling predicts clinical outcome of breast cancer. Nature 415:530–536.
30. Allred DC, Brown P, Medina D (2004) The origins of estrogen receptor alpha-
positive and estrogen receptor alpha-negative human breast cancer. BreastCancer Res 6: 240–245.
Breast Cancer Susceptibility and Pathology
PLoS Genetics | www.plosgenetics.org 10 April 2008 | Volume 4 | Issue 4 | e1000054