Emergence of Heterogeneity in Acute Leukemias
19
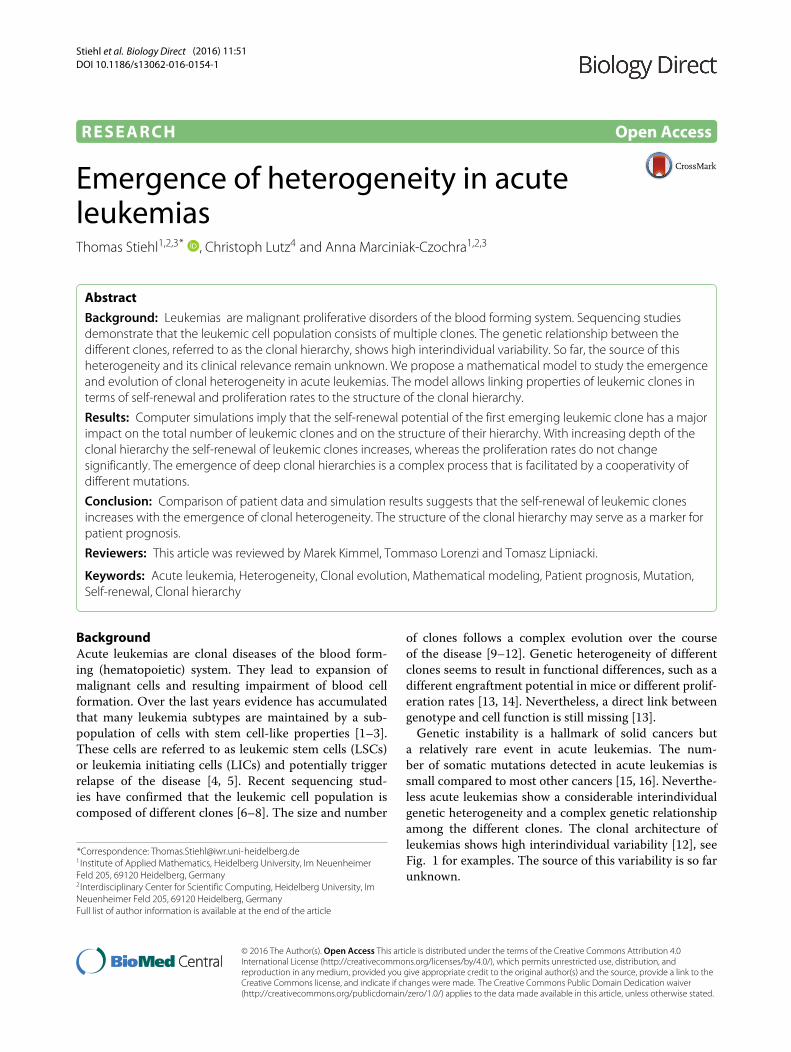
Stiehl et al. Biology Direct (2016) 11:51 DOI 10.1186/s13062-016-0154-1 RESEARCH Open Access Emergence of heterogeneity in acute leukemias Thomas Stiehl 1,2,3* , Christoph Lutz 4 and Anna Marciniak-Czochra 1,2,3 Abstract Background: Leukemias are malignant proliferative disorders of the blood forming system. Sequencing studies demonstrate that the leukemic cell population consists of multiple clones. The genetic relationship between the different clones, referred to as the clonal hierarchy, shows high interindividual variability. So far, the source of this heterogeneity and its clinical relevance remain unknown. We propose a mathematical model to study the emergence and evolution of clonal heterogeneity in acute leukemias. The model allows linking properties of leukemic clones in terms of self-renewal and proliferation rates to the structure of the clonal hierarchy. Results: Computer simulations imply that the self-renewal potential of the first emerging leukemic clone has a major impact on the total number of leukemic clones and on the structure of their hierarchy. With increasing depth of the clonal hierarchy the self-renewal of leukemic clones increases, whereas the proliferation rates do not change significantly. The emergence of deep clonal hierarchies is a complex process that is facilitated by a cooperativity of different mutations. Conclusion: Comparison of patient data and simulation results suggests that the self-renewal of leukemic clones increases with the emergence of clonal heterogeneity. The structure of the clonal hierarchy may serve as a marker for patient prognosis. Reviewers: This article was reviewed by Marek Kimmel, Tommaso Lorenzi and Tomasz Lipniacki. Keywords: Acute leukemia, Heterogeneity, Clonal evolution, Mathematical modeling, Patient prognosis, Mutation, Self-renewal, Clonal hierarchy Background Acute leukemias are clonal diseases of the blood form- ing (hematopoietic) system. They lead to expansion of malignant cells and resulting impairment of blood cell formation. Over the last years evidence has accumulated that many leukemia subtypes are maintained by a sub- population of cells with stem cell-like properties [1–3]. These cells are referred to as leukemic stem cells (LSCs) or leukemia initiating cells (LICs) and potentially trigger relapse of the disease [4, 5]. Recent sequencing stud- ies have confirmed that the leukemic cell population is composed of different clones [6–8]. The size and number *Correspondence: [email protected] 1 Institute of Applied Mathematics, Heidelberg University, Im Neuenheimer Feld 205, 69120 Heidelberg, Germany 2 Interdisciplinary Center for Scientific Computing, Heidelberg University, Im Neuenheimer Feld 205, 69120 Heidelberg, Germany Full list of author information is available at the end of the article of clones follows a complex evolution over the course of the disease [9–12]. Genetic heterogeneity of different clones seems to result in functional differences, such as a different engraftment potential in mice or different prolif- eration rates [13, 14]. Nevertheless, a direct link between genotype and cell function is still missing [13]. Genetic instability is a hallmark of solid cancers but a relatively rare event in acute leukemias. The num- ber of somatic mutations detected in acute leukemias is small compared to most other cancers [15, 16]. Neverthe- less acute leukemias show a considerable interindividual genetic heterogeneity and a complex genetic relationship among the different clones. The clonal architecture of leukemias shows high interindividual variability [12], see Fig. 1 for examples. The source of this variability is so far unknown. © 2016 The Author(s). Open Access This article is distributed under the terms of the Creative Commons Attribution 4.0 International License (http://creativecommons.org/licenses/by/4.0/), which permits unrestricted use, distribution, and reproduction in any medium, provided you give appropriate credit to the original author(s) and the source, provide a link to the Creative Commons license, and indicate if changes were made. The Creative Commons Public Domain Dedication waiver (http://creativecommons.org/publicdomain/zero/1.0/) applies to the data made available in this article, unless otherwise stated.
-
Upload
khangminh22 -
Category
Documents
-
view
0 -
download
0
Transcript of Emergence of Heterogeneity in Acute Leukemias
Stiehl et al. Biology Direct (2016) 11:51 DOI 10.1186/s13062-016-0154-1
RESEARCH Open Access
Emergence of heterogeneity in acuteleukemiasThomas Stiehl1,2,3* , Christoph Lutz4 and Anna Marciniak-Czochra1,2,3
Abstract
Background: Leukemias are malignant proliferative disorders of the blood forming system. Sequencing studiesdemonstrate that the leukemic cell population consists of multiple clones. The genetic relationship between thedifferent clones, referred to as the clonal hierarchy, shows high interindividual variability. So far, the source of thisheterogeneity and its clinical relevance remain unknown. We propose a mathematical model to study the emergenceand evolution of clonal heterogeneity in acute leukemias. The model allows linking properties of leukemic clones interms of self-renewal and proliferation rates to the structure of the clonal hierarchy.
Results: Computer simulations imply that the self-renewal potential of the first emerging leukemic clone has a majorimpact on the total number of leukemic clones and on the structure of their hierarchy. With increasing depth of theclonal hierarchy the self-renewal of leukemic clones increases, whereas the proliferation rates do not changesignificantly. The emergence of deep clonal hierarchies is a complex process that is facilitated by a cooperativity ofdifferent mutations.
Conclusion: Comparison of patient data and simulation results suggests that the self-renewal of leukemic clonesincreases with the emergence of clonal heterogeneity. The structure of the clonal hierarchy may serve as a marker forpatient prognosis.
Reviewers: This article was reviewed by Marek Kimmel, Tommaso Lorenzi and Tomasz Lipniacki.
Keywords: Acute leukemia, Heterogeneity, Clonal evolution, Mathematical modeling, Patient prognosis, Mutation,Self-renewal, Clonal hierarchy
BackgroundAcute leukemias are clonal diseases of the blood form-ing (hematopoietic) system. They lead to expansion ofmalignant cells and resulting impairment of blood cellformation. Over the last years evidence has accumulatedthat many leukemia subtypes are maintained by a sub-population of cells with stem cell-like properties [1–3].These cells are referred to as leukemic stem cells (LSCs)or leukemia initiating cells (LICs) and potentially triggerrelapse of the disease [4, 5]. Recent sequencing stud-ies have confirmed that the leukemic cell population iscomposed of different clones [6–8]. The size and number
*Correspondence: [email protected] of Applied Mathematics, Heidelberg University, Im NeuenheimerFeld 205, 69120 Heidelberg, Germany2Interdisciplinary Center for Scientific Computing, Heidelberg University, ImNeuenheimer Feld 205, 69120 Heidelberg, GermanyFull list of author information is available at the end of the article
of clones follows a complex evolution over the courseof the disease [9–12]. Genetic heterogeneity of differentclones seems to result in functional differences, such as adifferent engraftment potential in mice or different prolif-eration rates [13, 14]. Nevertheless, a direct link betweengenotype and cell function is still missing [13].Genetic instability is a hallmark of solid cancers but
a relatively rare event in acute leukemias. The num-ber of somatic mutations detected in acute leukemias issmall compared to most other cancers [15, 16]. Neverthe-less acute leukemias show a considerable interindividualgenetic heterogeneity and a complex genetic relationshipamong the different clones. The clonal architecture ofleukemias shows high interindividual variability [12], seeFig. 1 for examples. The source of this variability is so farunknown.
© 2016 The Author(s). Open Access This article is distributed under the terms of the Creative Commons Attribution 4.0International License (http://creativecommons.org/licenses/by/4.0/), which permits unrestricted use, distribution, andreproduction in any medium, provided you give appropriate credit to the original author(s) and the source, provide a link to theCreative Commons license, and indicate if changes were made. The Creative Commons Public Domain Dedication waiver(http://creativecommons.org/publicdomain/zero/1.0/) applies to the data made available in this article, unless otherwise stated.

Stiehl et al. Biology Direct (2016) 11:51 Page 2 of 19
Fig. 1 Examples of the clonal architecture detected in leukemicpatients. Each tree corresponds to one patient. The cell at the topcorresponds to the leukemic founder cell which acquires additionalmutations and gives rise to multiple leukemic clones. The examplesare taken from [12]. Reconstruction of the clonal architecture fromgenetic measurements is not always unique. In case of ambiguityonly one possibility is shown in the figure
Clonal evolution in leukemias is a complex process.Hematopoiesis is known to be a tightly regulated pro-cess subject to several nonlinear feedback mechanisms[17]. Leukemic cells of many patients have the potentialto interact with hematopoietic feedback signals [18, 19].This may include leukemic cell stimulation by hematopoi-etic factors as well as alteration of the concentration offeedback signals by leukemic cells. Experiments furthersuggest the interaction of leukemic cells with the bonemarrow microenvironment [20, 21]. Nonlinear interac-tions between hematopoiesis and the leukemic cell expan-sion on one hand and the limited bone marrow space onthe other may influence clonal selection [22]. The factthat important cell parameters such as proliferation ratesor self-renewal probability cannot be measured in vivofurther limits our understanding of leukemia evolution.Especially the following questions are so far unresolved:
• What is the source of interindividual differences ofthe clonal hierarchy of leukemias?
• What is the functional difference in terms ofself-renewal and proliferation rates between cells atthe top of the hierarchy and their descendants whichhave acquired additional mutations?
• How do clones that appear early during the diseasediffer from clones that appear later?
• How do properties of leukemic cells present at onepoint in time influence the structure of the clonalhierarchy in the future?
• How do mutation rates influence the structure of theclonal hierarchy?
These questions are of clinical relevance, since prop-erties of the leukemic stem cells are important deter-minants of disease dynamics, therapy resistance andrelapse [14, 22, 23]. Deciphering of the clonal archi-tecture using genomic methods has become more effi-cient and less expensive in recent years. Prediction of
patient prognosis based on genetic markers alone isnot straightforward, since leukemogenetic hits vary con-siderably among patients and the interplay of the dif-ferent detected mutations is complex and only par-tially understood [24, 25]. Therefore, the questionarises if the structure of the clonal architecture pro-vides additional insights into cell properties and patientprognosis.We propose a mathematical modeling approach to pro-
vide potential answers to these questions. Mathematicalmodels allow to systematically study the impact of cellparameters such as mutation rates, proliferation ratesand self-renewal probability on the clonal hierarchy ofcells. Simulation of the clonal selection process provideshints about which cell properties are linked to selectiveadvantage and how these properties evolve over time.The modeling approach allows linking the position of aclone within the hierarchy to functional properties, suchas self-renewal and proliferation rates, and to compareit to functional properties of clones located at differentpositions in the hierarchy. The structure of the clonalarchitecture obtained in model simulations is comparedto experimental data from the literature and thus allowslinking observations at the level of population dynamics tothe cell function in terms of self-renewal and proliferationrates.Different mathematical concepts have been proposed
to model mutations. Depending on the focus of inter-est, different approaches can be applied. Moran process[26, 27] is used to describe populations with size that isconstant in time. Branching processes are used to describeacquisition of mutations in growing populations. Exam-ples include the accumulation of passenger and drivermutations, interaction among driver mutations or accu-mulation of mutations during DNA copying [28–31]. Incase of a large population and a continuous trait space,diffusion [32, 33] or integral kernels [34–36] have beenused to describe the effect of mutations. A rigorous rela-tionship between processes at the level of single cellsand limit descriptions in terms of deterministic or prob-abilistic equations is provided in ref. [37]. Examples fordeterministic approaches to study mutations in discreteor continuously structured population models are givenin ref. [38–40]. Computer simulations of individual-basedmodels and cellular automata provide a framework tostudy the impact of cellular processes on the whole pop-ulation. Examples for individual-based cancer models canbe found in ref. [41, 42].This work is structured as follows. In the “Methods”
section, we introduce the mathematical model. In the“Results” section, we present simulation results and theirbiological interpretation. The “Discussion” section con-cludes with a discussion of clinical implications of theresults obtained.

Stiehl et al. Biology Direct (2016) 11:51 Page 3 of 19
We adhere to the following terminology. Clonal archi-tecture (clonal hierarchy) is understood as the geneticrelationship between different clones. We represent theclonal architecture as a tree. Progeny of a node hasacquired one additional mutation compared to its mothernode. As a clone we understand all genetically identicalstem and non-stem cells. A clone consisting of at least 1 %of the total cell mass is denoted as a significant clone. Thethreshold of 1 % has been chosen based on the sensitivityof sequencing methods [43].
MethodsThe model is defined as a system of nonlinear ordi-nary differential equations describing time evolution ofhematopoietic cells and leukemic clones. Experimentaldata imply that hematopoietic and leukemic cells inter-act, e.g., through feedback signals or the bone marrowmicroenvironment [18–21]. Therefore, the model takesinto account both healthy and leukemic cells. The pre-sented model is an extension of the models of healthyhematopoiesis [44–46] and acute leukemias [22, 23, 47].The main novelty lies in considering a time dependentnumber of leukemic clones and in tracking the structureof the clonal hierarchies. During the course of the dis-ease new clones arise due to mutations which are acquiredby leukemic cells. Properties of new clones are chosenfrom random distributions that depend on the propertiesof the cells that give rise to them. To model stochasticextinction of clones with favorable properties, we take intoaccount their extinction probabilities using the theory ofbranching processes. Compared to the work presentedin [40], which focuses on neutral mutations in non-stemcells without feedback regulation or competition, we areinterested in the evolution of non-neutral stem cell muta-tions under competitive pressure of a nonlinear feedbackmechanism. An overview of the model is provided inFig. 2a.
Model structureBased on the classical understanding of the hematopoi-etic system [48] blood cell formation is consideredas a stepwise process, with cells sequentially travers-ing an ordered sequence of discrete maturation states(compartments). We treat each compartment as a“well-mixed tank” and describe its evolution usingan ordinary differential equation. The large countof cells in the hematopoietic system justifies thisapproach [48].Since most leukemias are diseases of the white blood
cells, we only consider the white cell lineage of the healthyhematopoietic system. The model describes the interac-tion of the healthy cell lineage with an arbitrary numberof leukemic clones. We assume that each lineage or cloneconsists of two different cell types, namely cells that are
able to divide (stem and progenitor cells) and cells thathave lost the ability to divide (mature cells or post-mitoticleukemic blasts). Each cell type is characterized by thefollowing cell properties:
• Proliferation rate, describing the frequency of celldivisions per unit of time. In case of post-mitotic cellsthe proliferation rate is considered equal to zero.
• Fraction of self-renewal (self-renewal rate),describing the fraction of progeny cells returning tothe compartment occupied by the parent cells thatgave rise to them.
• Death rate, describing the fraction of cells dying perunit of time. For simplicity, we assume that dividingcells do not die and that non-dividing cells die atconstant rates.
We denote the compartment of dividing healthy cells asc1 and that of mature cells as c2. We count the leukemicclones starting from 1. The respective compartments ofthe ith leukemic clone are denoted as li1 and li2 resp. Theproliferation rate of the healthy cells is denoted as pc andthat of the mitotic cells of the ith leukemic clone pil. Therespective fractions of self-renewal are denoted ac andail. Death rates of the non-dividing compartments are dcand dli .
Feedback regulation of healthy hematopoiesisFormation of healthy blood cells is subject to a tight regu-lation, mediated by a system of lineage- and stage-specificcytokines. If there is a need for more blood cells of a cer-tain type, the concentration of cytokines increases andstimulates formation of mature cells [17, 49]. For sim-plicity, we consider only one feedback loop. We denotes(t) the value of the feedback signal at time t. We sets(t) = 1
1+kc2(t) , where k is a positive constant depend-ing on production and elimination of cytokines [44]. Thisexpression can be derived from cytokine kinetics [44]. Ittakes into account that the concentrations of importantcytokines such as EPO and G-CSF depend on the concen-tration of mature cells [49]. The feedback signal assumesvalues between 0 and 1.On the basis of our earlier work and compatibility
with clinical data [44, 46], we assume feedback inhibi-tion of the fraction of self-renewal by mature cells. Thefraction of self-renewal of the healthy cells is assumedto be equal to ac(t) = acs(t) and that of leukemiccells of clone i to ail(t) = ails(t). The parameters acand ail can be interpreted as the maximal possible frac-tion of self-renewal. Numerical solutions of the model ofhematopoiesis subject to this feedback were validated onthe basis of clinical observations and show good agree-ment with patient data upon recovery from bone marrowtransplantation [46].

Stiehl et al. Biology Direct (2016) 11:51 Page 4 of 19
Fig. 2 Overview of the mathematical model. aModel structure: The model includes one hematopoietic cell line and an arbitrary number ofleukemic clones. Leukemic and healthy cells interact by feedback signals. Due to mutations new clones with different properties arise. Mutationrates of leukemic and healthy cells are denoted as ν and γ resp. b Example simulation: The panel shows the time course of mitotic leukemic cells.The horizontal axis shows the time since appearance of the first leukemic cell. The simulation ends when the mature healthy cell count is below 5 %of its steady state value. This corresponds to the death of the patient. Each color represents one clone
Model equations for the hematopoietic systemThe flux to mitosis of healthy cells at time t equals pcc1(t).During mitosis, a parent cell is replaced by two progenycells. The outflux from mitosis at time t equals 2pcc1(t),of which the fraction 2acs(t)pcc1(t) stays in compart-ment 1 (process referred to as self-renewal). The fraction2
(1 − acs(t)
)pcc1(t) moves to compartment 2 (process
referred to as differentiation).We obtain the following system of ordinary differential
equationsddt
c1(t) = (2acs(t) − 1
)pcc1(t)
ddt
c2(t) = 2(1 − acs(t)
)pcc1(t) − dcc2(t)
s(t) = 11 + kc2(t)
with the initial conditions c1(0), c2(0) given.
Model of leukemiaWe assume that healthy and leukemic cells respondto the same feedback signals. This assumption is sup-ported by the finding that leukemic cells express receptorsfor hematopoietic cytokines [18] and that they interactwith the bone marrow microenvironment [20, 21]. Dueto cytokine clearance by receptor mediated endocytosis[17, 49] leukemic cells contribute to the cytokine clear-ance. In the presence of leukemic cells, the feedback signalis given by
s(t) = 11 + kc2 + k
∑n(t)i=1 l
i2(t)
.
Here, n(t) denotes the number of leukemic clonespresent at time t. This expression has been derived inref. [47] for the special case of one leukemic clone. The
proposed feedback mechanism has been validated basedon clinical data [23]. Model simulations suggest that thechoice of individual k values for each leukemic clones, i.e.,modeling the signal as s(t) = 1
1+kc2+∑n(t)i=1 kil
i2(t)
has no sig-nificant impact on the quantities considered in this study.For n leukemic clones we obtain the following system ofequations:
ddt
c1(t) = (2acs(t) − 1
)pcc1(t)
ddt
c2(t) = 2(1 − acs(t)
)pcc1(t) − dcc2(t)
ddt
l11(t) = (2a1l s(t) − 1
)p1l l
11(t)
ddt
l12(t) = 2(1 − a1l s(t)
)p1l l
11(t) − d1l l
12(t)
.........
ddt
ln1(t) = (2anl s(t) − 1
)pnl l
n1(t)
ddt
ln2(t) = 2(1 − anl s(t)
)pnl l
n1(t) − dnl l
n2(t)
s(t) = 11 + kc2(t) + k
∑ni=1 li2
with the initial conditions c1(0), . . . , ln2(0) given.
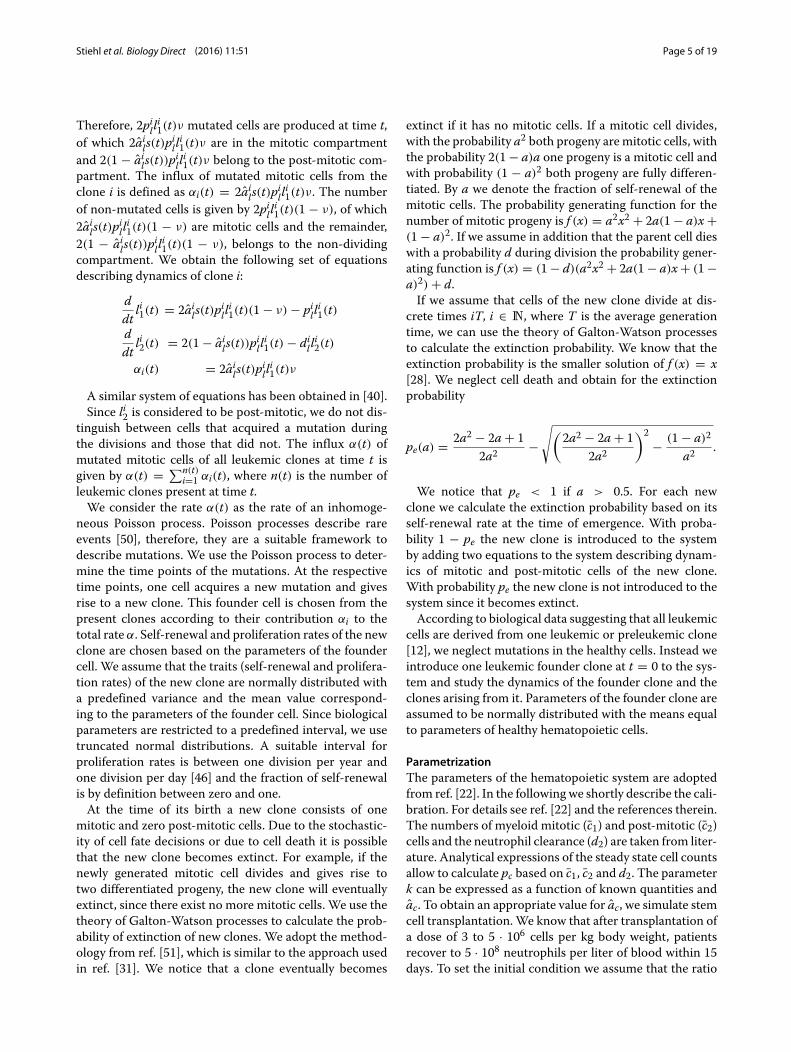
MutationsWe assume that mutations occur during genome replica-tion which takes place beforemitosis.We consider the rateto be identical for all clones and constant in time. Thisis supported by the fact that genomic instability is a rela-tively rare event in leukemias [15, 16]. The flux to mitosisof leukemic clone i at time t is given as pill
i1(t). We assume
that a fraction ν of the produced progeny has a mutation.
Stiehl et al. Biology Direct (2016) 11:51 Page 5 of 19
Therefore, 2pilli1(t)ν mutated cells are produced at time t,
of which 2ails(t)pilli1(t)ν are in the mitotic compartment
and 2(1 − ails(t))pilli1(t)ν belong to the post-mitotic com-
partment. The influx of mutated mitotic cells from theclone i is defined as αi(t) = 2ails(t)p
illi1(t)ν. The number
of non-mutated cells is given by 2pilli1(t)(1 − ν), of which
2ails(t)pilli1(t)(1 − ν) are mitotic cells and the remainder,
2(1 − ails(t))pilli1(t)(1 − ν), belongs to the non-dividing
compartment. We obtain the following set of equationsdescribing dynamics of clone i:
ddt
li1(t) = 2ails(t)pilli1(t)(1 − ν) − pill
i1(t)
ddt
li2(t) = 2(1 − ails(t))pilli1(t) − dill
i2(t)
αi(t) = 2ails(t)pilli1(t)ν
A similar system of equations has been obtained in [40].Since li2 is considered to be post-mitotic, we do not dis-
tinguish between cells that acquired a mutation duringthe divisions and those that did not. The influx α(t) ofmutated mitotic cells of all leukemic clones at time t isgiven by α(t) = ∑n(t)
i=1 αi(t), where n(t) is the number ofleukemic clones present at time t.We consider the rate α(t) as the rate of an inhomoge-
neous Poisson process. Poisson processes describe rareevents [50], therefore, they are a suitable framework todescribe mutations. We use the Poisson process to deter-mine the time points of the mutations. At the respectivetime points, one cell acquires a new mutation and givesrise to a new clone. This founder cell is chosen from thepresent clones according to their contribution αi to thetotal rate α. Self-renewal and proliferation rates of the newclone are chosen based on the parameters of the foundercell. We assume that the traits (self-renewal and prolifera-tion rates) of the new clone are normally distributed witha predefined variance and the mean value correspond-ing to the parameters of the founder cell. Since biologicalparameters are restricted to a predefined interval, we usetruncated normal distributions. A suitable interval forproliferation rates is between one division per year andone division per day [46] and the fraction of self-renewalis by definition between zero and one.At the time of its birth a new clone consists of one
mitotic and zero post-mitotic cells. Due to the stochastic-ity of cell fate decisions or due to cell death it is possiblethat the new clone becomes extinct. For example, if thenewly generated mitotic cell divides and gives rise totwo differentiated progeny, the new clone will eventuallyextinct, since there exist no more mitotic cells. We use thetheory of Galton-Watson processes to calculate the prob-ability of extinction of new clones. We adopt the method-ology from ref. [51], which is similar to the approach usedin ref. [31]. We notice that a clone eventually becomes
extinct if it has no mitotic cells. If a mitotic cell divides,with the probability a2 both progeny aremitotic cells, withthe probability 2(1− a)a one progeny is a mitotic cell andwith probability (1 − a)2 both progeny are fully differen-tiated. By a we denote the fraction of self-renewal of themitotic cells. The probability generating function for thenumber of mitotic progeny is f (x) = a2x2 + 2a(1 − a)x +(1 − a)2. If we assume in addition that the parent cell dieswith a probability d during division the probability gener-ating function is f (x) = (1− d)(a2x2 + 2a(1− a)x+ (1−a)2) + d.If we assume that cells of the new clone divide at dis-
crete times iT, i ∈ N, where T is the average generationtime, we can use the theory of Galton-Watson processesto calculate the extinction probability. We know that theextinction probability is the smaller solution of f (x) = x[28]. We neglect cell death and obtain for the extinctionprobability
pe(a) = 2a2 − 2a + 12a2
−√(
2a2 − 2a + 12a2
)2− (1 − a)2
a2.
We notice that pe < 1 if a > 0.5. For each newclone we calculate the extinction probability based on itsself-renewal rate at the time of emergence. With proba-bility 1 − pe the new clone is introduced to the systemby adding two equations to the system describing dynam-ics of mitotic and post-mitotic cells of the new clone.With probability pe the new clone is not introduced to thesystem since it becomes extinct.According to biological data suggesting that all leukemic
cells are derived from one leukemic or preleukemic clone[12], we neglect mutations in the healthy cells. Instead weintroduce one leukemic founder clone at t = 0 to the sys-tem and study the dynamics of the founder clone and theclones arising from it. Parameters of the founder clone areassumed to be normally distributed with the means equalto parameters of healthy hematopoietic cells.
ParametrizationThe parameters of the hematopoietic system are adoptedfrom ref. [22]. In the following we shortly describe the cali-bration. For details see ref. [22] and the references therein.The numbers of myeloid mitotic (c1) and post-mitotic (c2)cells and the neutrophil clearance (d2) are taken from liter-ature. Analytical expressions of the steady state cell countsallow to calculate pc based on c1, c2 and d2. The parameterk can be expressed as a function of known quantities andac. To obtain an appropriate value for ac, we simulate stemcell transplantation.We know that after transplantation ofa dose of 3 to 5 · 106 cells per kg body weight, patientsrecover to 5 · 108 neutrophils per liter of blood within 15days. To set the initial condition we assume that the ratio

Stiehl et al. Biology Direct (2016) 11:51 Page 6 of 19
of myeloid to erythroid cells in the transplant is as in thehealthy marrow between 2:1 and 4:1. We choose a1 suchthat we observe recovery after 2-3 weeks. This results inthe following parameters: ac = 0.87, pc = 0.45/day, dc =2.3/day, k = 1.85 · 10−9, dl = 0.5/day. These parametersrefer to healthy cells. Parameters of the leukemic cells arechosen randomly according to normal distributions.For the simulations the rate ν is varied between 5 · 10−8
and 10−11. Standard deviations for the normal distribu-tions are varied between 0.001 and 0.1. The standarddeviations and mutation rates used to obtain the figuresare specified in the figure captions. Stopping criteria forsimulations are either decline of healthy blood cells to lessthan 5 % of the healthy steady state value or a simulatedtime span that exceeds 100 years of age for a given patient.An example simulation is depicted in Fig. 2b.
ResultsSimulations over wide parameter ranges, including varia-tion of mutation rates over several orders of magnitude,show that the phenomena presented below are robust withrespect to the parameter choice.
Self-renewal rate of significant clones increases during thecourse of the diseaseWe first ask how cell properties evolve during the courseof the disease. For this purpose, we compare self-renewaland proliferation rates of the significant clones of 600 sim-ulated patients. The significant clones emerge at differenttime points due to mutations. We count the significantclones in the order of the time of their emergence. Simu-lation results imply that in more than 95 % of patients theself-renewal rate of the second emerging significant cloneis larger than the self-renewal rate of the first emergingsignificant clone. The self-renewal rate of the third sig-nificant clone is larger than the self-renewal rate of thesecond significant clone and so forth. Interestingly, prolif-eration rates do not differ significantly among significantclones. This finding confirms that high self-renewal rateis beneficial for expansion of clones. Previous simulationstudies have shown that high self-renewal rate might berelated to poor prognosis and high resistance to ther-apy [22, 23]. Simulation results imply that clones becomemore aggressive during the course of the disease. In theremaining 5 % of simulated patients, the following phe-nomena have been observed: (i) in very rare cases (lessthan 1 %) a slight reduction in the self-renewal rate iscompensated by an increase in proliferation rate, (ii) twonew clones emerge within a short time span, the self-renewal rate of both clones is larger than the self-renewalrate of the parent clones, but one of the emerging cloneshas a slightly reduced self-renewal rate compared to theother. In this case both new clones have growth advan-tage at the time of their origin and, therefore, grow to
a significant size. The increasing self-renewal of clonesover time is the result of a selection process. The selec-tion was studied numerically in [22] and proved in [52]for a multi-clonal system in absence of mutations. Whena new clone arises due to a mutation, its self-renewal andproliferation rates can be larger or smaller than the cor-responding rates of the parent clone. They are chosenaccording to normal distributions with constant stan-dard deviation and means equal to the parameter valuesof the parent clone. It is not straightforward to predictwhether progeny clones with higher self-renewal, higherproliferation or both have more competitive advantages.Simulation results show that among the newly arisingclones with random proliferation and self-renewal valuesthose with high self-renewal are more competitive thanthose with high proliferation. The results are depicted inFig. 3.
Properties of the first clone determine if there is nooutbreak of the disease, a monoclonal disease, or clonaldiversityThe number of significant clones varies among thepatients [12]. We compared self-renewal and prolifera-tion rates of the significant clones in simulated patientsto investigate how these properties impact the total num-ber of significant clones per patient. As mentioned above,we suppose that all leukemic clones originate from a sin-gle founder clone which itself is derived from healthyhematopoietic cells. Simulation results imply that the self-renewal rate of the founder clone has a major impact onthe total number of significant clones emerging duringthe course of the disease. If the founder clone has a highself-renewal rate it has the ability to expand fast. Thisfast expansion leads to a clinical disease and potentialdeath of the patient before additional significant clonescan emerge. In case of very small self-renewal rate, thefounder clone expands slowly and the disease does notbecome significant throughout the life span. In case ofintermediate self-renewal rate of the founder clone, multi-ple significant clones arise. If the founder clone gives riseto a clone that grows to a significant size over time, theself-renewal rate of this second significant clone deter-mines whether a third significant clone will arise. If theself-renewal rate of the second significant clone is high,fast expansion and progression of the disease follow. Theremaining life time of the patient is too short for emer-gence of additional significant clones. If the self-renewalrate of the second significant clone has intermediate val-ues, disease progression is slow and more significantclones can emerge. This principle is extended to a highernumber of leukemic clones: If the self-renewal rate ofthe first n significant clones is intermediate, the proba-bility is high that additional clones will emerge. If oneclone among the first n significant clones has a high

Stiehl et al. Biology Direct (2016) 11:51 Page 7 of 19
Fig. 3 Self-renewal rate of significant clones increases during the course of the disease. The figure is based on 600 simulated patients. a Timeevolution of one simulated patient who developed 4 clones during the course of the disease. The first, second, third and fourth significant clone aredepicted using different colors. b Self-renewal rates of the first, second, third and fourth significant leukemic clone of the subgroup of patientsharboring 4 significant clones at the end of the simulation (reduction of healthy cell count by 95 %). The self-renewal rates differ significantly(p < 0.05 in t-test) between first and second, second and third, third and fourth clone. c Self-renewal rates of the first, second and third significantleukemic clone of the subgroup of patients harboring 3 clones at the end of simulations. The self-renewal rates differ significantly between theclones (p < 0.05 in t-test). d Proliferation rates of the first, second and third significant leukemic clone of the subgroup of patients harboring 3clones at the end of simulation. The proliferation rates do not differ significantly between the clones (p > 0.05 in t-test). Parameters: mutation rateν = 5 · 10−9, self-renewal and proliferation rates of the new clones are normally distributed with the means of the distributions equal toproliferation and self-renewal rates of the parent clone and standard deviation equal to 0.005. The central mark is the median, the edges of the boxare the 25th and 75th percentiles, points are drawn as outliers if they are larger than q3 + 1.5(q3 − q1) or smaller than q1 − 1.5(q3 − q1), where q1and q3 are the 25th and 75th percentiles, respectively
self-renewal rate, progression is fast and no more clonesemerge. Clones with small self-renewal rate never growto a significant size. Proliferation rates of the clones donot have a significant impact on the total number ofclones. Simulations show that if we restrict self-renewalrate of the leukemic founder clone to intermediate val-ues, e.g., between 0.872 and 0.875, the number of clonesper patient increases. The results are summarized inFig. 4.
Self-renewal rate increases with an increasing depth ofclonesIn leukemia patients, clonal hierarchies show considerableinterindividual variations [12]. We ask how the proper-ties of clones influence the depth of the clonal hierarchy.We assume that the founder clone has depth 1. Clonesthat have acquired k additional mutations in compari-son to the founder clone have depth 1 + k. Depth of aclonal hierarchy is understood as the maximal depth of its

Stiehl et al. Biology Direct (2016) 11:51 Page 8 of 19
Fig. 4 Impact of self-renewal rate on the total number of significant clones. Data from 600 simulated patients. a Overview over panels (b)–(d). bWecompare self-renewal rate of the first significant clone in two patient groups. Group 1: patients harboring only one significant clone throughout thedisease. Group 2: patients harboring more than one significant clone. The self-renewal rate of the first significant clone is significantly higher ingroup 1. Leftmost plot in (b): If the self-renewal rate of leukemic clones is close to the self-renewal rate of healthy cells, no significant clones emerge.cWe compare the self-renewal rate of the second significant clone in two patient groups. Group 1: patients harboring two significant clonesthroughout the disease. Group 2: patients harboring more than two significant clones. The self-renewal rate of the second significant clone issignificantly higher in group 1. dWe compare the self-renewal rates of the third emerging significant clone in two patient groups. Group 1: patientsharboring three significant clones throughout the disease. Group 2: patients harboring more than three significant clones. The self-renewal rate ofthe third significant clone is significantly higher in group 1. e Explanation of data in (b)–(d): Clones with high self-renewal rates lead to fastprogression of the disease and death before new significant clones can emerge. Clones with small self-renewal rates never grow to a significant size.Clones with intermediate self-renewal rates grow with moderate speed and their offspring have enough time to grow to a significant size.Proliferation rates do not differ significantly between all considered groups. Parameters: mutation rate ν = 5 · 10−9, self-renewal and proliferationrates of the new clones are normally distributed with the mean of the distributions equal to proliferation and self-renewal rates of the parent cloneand standard deviation equal to 0.005. Significance: p < 0.05 in t-test

Stiehl et al. Biology Direct (2016) 11:51 Page 9 of 19
clones. Simulations indicate that the self-renewal rate ofthe clones increases with their depths. This is plausible:To be able to give rise to new clones, a given clone hasto achieve a critical mass of cells. Only then it is proba-ble that cells of this clone mutate and give rise to offspringclones. To achieve the critical mass, a clone needs prop-erties favorable for efficient expansion. This occurs if andonly if its self-renewal rate is increased compared to itsmother clone, since otherwise the mother clone outgrowsits offspring.Simulations show that a deep clonal hierarchy requires
a step-wise increase of self-renewal rate with eachmutation. The step size determines how deep thehierarchy will be. If the step size is too small, offspringclones grow slowly and it takes long time until they andtheir offspring grow to a significant size. In this case theparent clone remains dominant in size and is responsiblefor disease progression. If the step size is large, the off-spring clones grow fast and the patient dies before poten-tial new offspring achieve a significant size. In both casesthe hierarchy is flat. Only if self-renewal rate increases bysteps of intermediate size, deep hierarchies are observed.In this case, the offspring clones have a sufficient growthadvantage compared to their parents but they grow slowenough for their offspring to achieve a significant size andto give rise to new clones.Self-renewal rate of the significant clone which appears
first has a major impact on the depth of the hierarchy.If it has a high self-renewal rate, the disease progressesfast and the patient dies before offspring achieve a criticalmass. In case of small self-renewal rate of the first clone,deep hierarchies can emerge, supposed that it gives riseto offspring with higher self-renewal rates. Analogouslythe properties of a clone of depth 2 determine whether aclone of depth 3 can emerge. The proliferation rate has noimpact on the depth of the hierarchy.High self-renewal rate is potentially linked to poor prog-
nosis and fast progression of the disease [22, 23]. If weconsider the maximum of self-renewal capacity over allsignificant clones, the simulations imply that it increasessignificantly with the depth of the clonal hierarchy. There-fore, our study suggests that the depth of the clonalhierarchy could be considered a prognostic parameter.Since in our simulations deep hierarchies are linked tohigh self-renewal rates, our results suggest that deep hier-archies could be linked to poor prognosis. Interestingly,there is no correlation between the total number of sig-nificant clones and the maximal self-renewal rates of thesignificant clones. The results are summarized in Fig. 5.
Cooperativity of mutations might explain emergence ofdeep hierarchiesIn the patients investigated in ref. [12], hierarchies ofdepths between 3 and 5 have been detected. Due to the
findings described in the previous paragraph, emergenceof such hierarchies requires a coordinated increase of theself-renewal rate with each acquired mutation. Appear-ance of clones with too high self-renewal rates leads tofast progression and death before deep hierarchies canbe established. Therefore, the existence of deep hierar-chies is not compatible with mutations that lead to largechanges of cell properties. Indeed, if we assume that traitsof mutated clones are uniformly distributed in the traitspace, deep hierarchies are never observed in simulations.This observation raises the question which probabil-
ity distributions are suitable choices to model the effectof mutation in the trait space. We have investigated theassumption that the traits of the new clone follow nor-mal distributions with means equal to the traits of thecell that gave rise to the new clone. Depending on theassumed standard deviations of the normal distributionswe can observe hierarchies of varying depths. If the stan-dard deviations are too large, the hierarchies remain flat,since aggressive clones that lead to fast progression anddeath emerge early in the disease. If the standard devia-tions are too small, the traits of the offspring clones arevery close to the traits of the parent clones. Therefore, theoffspring clones have little growth advantage compared totheir parent clones and consequently need long time togrow to a significant size and to produce offspring growingto a significant size. In these cases the hierarchy of signif-icant clones remains flat. Only if the standard deviation iswithin a limited range, a considerable number of patientswith deep hierarchies is observed in the simulations. Inacute leukemias, where genetic instability is rare, gener-ation of large numbers of mutated cells and selection ofthose which exactly fit the properties required to establishdeep hierarchies is not a realistic scenario, since muta-tion rates are relatively low, compared to other cancers.Leukemias show high interindividual genetic variability.The assumption that all described mutations will lead toexactly those changes in the self-renewal rates that arerequired to establish deep hierarchies seems also improb-able.If we assume that the standard deviation of the normal
distribution according to which the traits of the offspringare chosen increases with each mutation, deep hierarchiesbecome a more frequent event. This is plausible sincesmall standard deviations for the first mutation avoidemergence of clones that show fast expansion and sub-sequent death of the patient. Step-wise increase of stan-dard deviation with each mutation allows the offspring togain sufficient growth advantage compared to the parentclones that they can grow to a significant size. At the sametime large jumps leading to aggressive clones remain rare.The assumption that jump sizes in the trait space
increase with the number of mutated genes in a cell seemsplausible from a biological point of view. Cells are known

Stiehl et al. Biology Direct (2016) 11:51 Page 10 of 19
Fig. 5 Impact of the self-renewal rate on the depth of the hierarchy. The figure is based on 600 simulated patients. a Examples for hierarchies ofdifferent depths. Colors are used to visualize clones of different depths. b Self-renewal rate of significant clones increases significantly (p < 0.05 int-test) with the depth of the clones in hierarchies. Considered are only patients with clonal hierarchies of depth 3. c Properties of the first clone inthe hierarchy decides about the depth of the hierarchy. Only if self-renewal rate of the first clone is small enough deep hierarchies emerge. Ifself-renewal rate of the first clone is high, disease progression and death occur before deep hierarchies can establish. d Comparison of self-renewalrates of significant and insignificant clones of depth 2. Self-renewal rates of insignificant clones is significantly smaller than self-renewal rates ofsignificant clones. This demonstrates that clones do not become significant if their self-renewal rate is too small. Some of the insignificant clonesshow high self-renewal rates. These clones have originated late during the disease and could not grow to a significant size before death of thepatients. If proliferation rate is very slow, clones with high self-renewal cannot grow to a significant size. Proliferation rate has no impact on thedepth of the hierarchy. Parameters: mutation rate ν = 5 · 10−9, self-renewal and proliferation rates of the new clones are normally distributed withthe mean of the distributions equal to proliferation and self-renewal rates of the parent clone and standard deviation equal to 0.005
to have redundant pathways for regulation of importantfunctions. Perturbation of one pathway by a mutationmight therefore lead to only small jumps in the trait space,whereas subsequent perturbation of multiple pathwaysmay lead to larger jumps in the trait space. This meansthat the presence of a mutation facilitates the occurrenceof large effects due to an additional mutation. In this sensethe different mutations are cooperative.The importance of cooperativity is underlined by the
following simulation experiment: We assume that the
probability of large jumps in the trait space increases withthe number of accumulated mutations. We model theseeffect using normal distributions with increasing standarddeviations σ1 < σ2 < σ3 . . ., i.e., the size of the jumpin the trait space due to the first mutation is given by anormal distribution with standard deviation σ1, the jumpdue to the second mutation by a normal distribution withstandard deviation σ2 etc. We simulate the emergence ofclonal hierarchies under these assumptions. We repeatsimulations under modified assumptions, for example, we

Stiehl et al. Biology Direct (2016) 11:51 Page 11 of 19
assume that for all mutations the size of the jump in thetrait space is given by a normal distribution with stan-dard deviation equal to σ1 or equal to σ2 etc. We runsimulations for all possible permutations of σ1, σ2, σ3 . . ..Comparison of simulation results shows that the num-ber of patients harboring hierarchies of depth 4 or moreis maximized if standard deviations increase from onemutation to another. The results are depicted in Fig. 6.
Impact of the mutation rates and probability distributionson the clonal hierarchiesWe studied the architecture of clonal hierarchies for sev-eral mutation rates. For increased mutation rates the totalnumber of clones increases. Interestingly, the number ofsignificant clones increases only moderately if the muta-tion rates are varied over several orders of magnitude; forexample, if the rate increases from 5 · 10−10 to 5 · 10−9,the mean number of all clones increases by a factor of 8,whereas the mean number of significant clones increasesonly by 1. In all cases the number of significant clones wassmaller than 15 and for 80 % of the patients smaller than10. This is in line with the observation of clone numbers
in experimental studies [11, 12]. This finding underlinesthe role of competition between the different clones. Thecompetition selects among an increasing total number ofclones always a small number of significant clones.Simulation results imply that patients with less aggres-
sive clones and without disease outbreak are over-represented in case of small mutation rates. Patients withhighly aggressive clones and fast disease progression areover-represented in case of high mutation rates. This isplausible: The higher the mutation rate, the more clonesare generated per unit of time. The probability that atleast one clone per patient has favorable growth propertiesincreases with the number of generated clones. Similarlythe probability that highly aggressive clones and fast dis-ease progression occur increases with increasingmutationrate. For all mutation rates we observed that clonal hierar-chies are flat in case of fast disease progression and in caseof very slow disease progression compared to cases withintermediate disease progression.Increased mutation rates act in favor of deep hierar-
chies. Nevertheless this effect is mild and the mean depthincreases by 1 if the mutation rate increases by a factor of
Fig. 6 Impact of cooperativity between mutations on depth of the hierarchy. The figure is based on 100 simulated patients. The number of patientsharboring a clonal hierarchy of depth 4 or more is maximized, if the jumps in the trait spaces increase with the number of mutations. Parameters:Self-renewal and proliferation rates of the leukemic founder clone are drawn from normal distributions with mean values equal to proliferation andself-renewal rates of healthy cells and standard deviation σ1 = 0.0014. First mutation: self-renewal and proliferation rates of the new clone arenormally distributed with the means of the distributions equal to proliferation and self-renewal rates of the founder clone and standard deviationσ2 = 5 · σ1. Second mutation: self-renewal and proliferation rates of the new clone are normally distributed with the means of the distributionsequal to proliferation and self-renewal rates of the parent clone and standard deviation σ3 = 20 · σ1. Third and higher mutations: self-renewal andproliferation rates of the new clone are normally distributed with the means of the distributions equal to proliferation and self-renewal rates of theparent clone and standard deviation σ3 = 100 · σ1. Mutation rate ν = 5 · 10−9
Stiehl et al. Biology Direct (2016) 11:51 Page 12 of 19
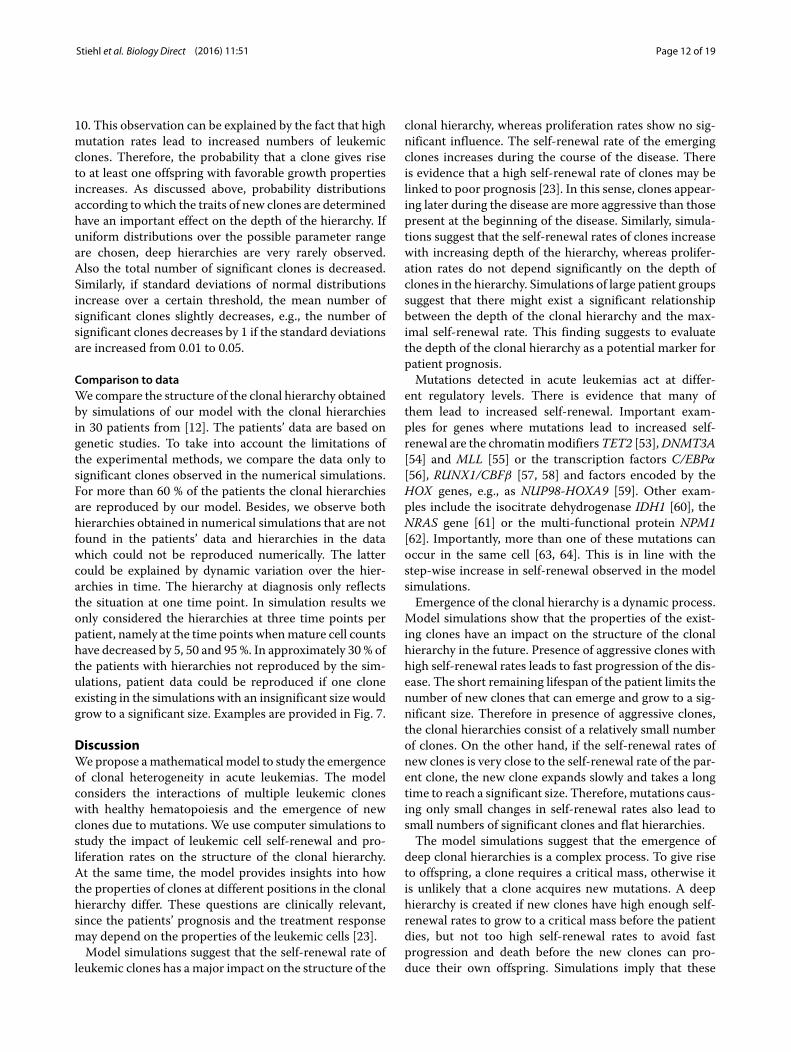
10. This observation can be explained by the fact that highmutation rates lead to increased numbers of leukemicclones. Therefore, the probability that a clone gives riseto at least one offspring with favorable growth propertiesincreases. As discussed above, probability distributionsaccording to which the traits of new clones are determinedhave an important effect on the depth of the hierarchy. Ifuniform distributions over the possible parameter rangeare chosen, deep hierarchies are very rarely observed.Also the total number of significant clones is decreased.Similarly, if standard deviations of normal distributionsincrease over a certain threshold, the mean number ofsignificant clones slightly decreases, e.g., the number ofsignificant clones decreases by 1 if the standard deviationsare increased from 0.01 to 0.05.
Comparison to dataWe compare the structure of the clonal hierarchy obtainedby simulations of our model with the clonal hierarchiesin 30 patients from [12]. The patients’ data are based ongenetic studies. To take into account the limitations ofthe experimental methods, we compare the data only tosignificant clones observed in the numerical simulations.For more than 60 % of the patients the clonal hierarchiesare reproduced by our model. Besides, we observe bothhierarchies obtained in numerical simulations that are notfound in the patients’ data and hierarchies in the datawhich could not be reproduced numerically. The lattercould be explained by dynamic variation over the hier-archies in time. The hierarchy at diagnosis only reflectsthe situation at one time point. In simulation results weonly considered the hierarchies at three time points perpatient, namely at the time points whenmature cell countshave decreased by 5, 50 and 95 %. In approximately 30 % ofthe patients with hierarchies not reproduced by the sim-ulations, patient data could be reproduced if one cloneexisting in the simulations with an insignificant size wouldgrow to a significant size. Examples are provided in Fig. 7.
DiscussionWepropose amathematical model to study the emergenceof clonal heterogeneity in acute leukemias. The modelconsiders the interactions of multiple leukemic cloneswith healthy hematopoiesis and the emergence of newclones due to mutations. We use computer simulations tostudy the impact of leukemic cell self-renewal and pro-liferation rates on the structure of the clonal hierarchy.At the same time, the model provides insights into howthe properties of clones at different positions in the clonalhierarchy differ. These questions are clinically relevant,since the patients’ prognosis and the treatment responsemay depend on the properties of the leukemic cells [23].Model simulations suggest that the self-renewal rate of
leukemic clones has a major impact on the structure of the
clonal hierarchy, whereas proliferation rates show no sig-nificant influence. The self-renewal rate of the emergingclones increases during the course of the disease. Thereis evidence that a high self-renewal rate of clones may belinked to poor prognosis [23]. In this sense, clones appear-ing later during the disease are more aggressive than thosepresent at the beginning of the disease. Similarly, simula-tions suggest that the self-renewal rates of clones increasewith increasing depth of the hierarchy, whereas prolifer-ation rates do not depend significantly on the depth ofclones in the hierarchy. Simulations of large patient groupssuggest that there might exist a significant relationshipbetween the depth of the clonal hierarchy and the max-imal self-renewal rate. This finding suggests to evaluatethe depth of the clonal hierarchy as a potential marker forpatient prognosis.Mutations detected in acute leukemias act at differ-
ent regulatory levels. There is evidence that many ofthem lead to increased self-renewal. Important exam-ples for genes where mutations lead to increased self-renewal are the chromatinmodifiersTET2 [53],DNMT3A[54] and MLL [55] or the transcription factors C/EBPα
[56], RUNX1/CBFβ [57, 58] and factors encoded by theHOX genes, e.g., as NUP98-HOXA9 [59]. Other exam-ples include the isocitrate dehydrogenase IDH1 [60], theNRAS gene [61] or the multi-functional protein NPM1[62]. Importantly, more than one of these mutations canoccur in the same cell [63, 64]. This is in line with thestep-wise increase in self-renewal observed in the modelsimulations.Emergence of the clonal hierarchy is a dynamic process.
Model simulations show that the properties of the exist-ing clones have an impact on the structure of the clonalhierarchy in the future. Presence of aggressive clones withhigh self-renewal rates leads to fast progression of the dis-ease. The short remaining lifespan of the patient limits thenumber of new clones that can emerge and grow to a sig-nificant size. Therefore in presence of aggressive clones,the clonal hierarchies consist of a relatively small numberof clones. On the other hand, if the self-renewal rates ofnew clones is very close to the self-renewal rate of the par-ent clone, the new clone expands slowly and takes a longtime to reach a significant size. Therefore, mutations caus-ing only small changes in self-renewal rates also lead tosmall numbers of significant clones and flat hierarchies.The model simulations suggest that the emergence of
deep clonal hierarchies is a complex process. To give riseto offspring, a clone requires a critical mass, otherwise itis unlikely that a clone acquires new mutations. A deephierarchy is created if new clones have high enough self-renewal rates to grow to a critical mass before the patientdies, but not too high self-renewal rates to avoid fastprogression and death before the new clones can pro-duce their own offspring. Simulations imply that these

Stiehl et al. Biology Direct (2016) 11:51 Page 13 of 19
Fig. 7 Examples for the clonal architecture detected in leukemic patients and simulations. Each tree corresponds to one patient. a Clonal hierarchiesdetected in patients from [12] and in simulations. b Clonal hierarchies detected in simulations but not in patients from [12]. c Clonal hierarchiesdetected in patients from [12] but not in simulations. The reconstruction of the clonal architecture from genetic measurements is not alwaysunique. In case of ambiguity only one possibility is shown in the figure. Parameters were set as specified in the caption of Fig. 6
constraints are rarely met if one assumes that differ-ent mutations act independently, i.e., the properties ofa new clone compared to the parent clone follow thesame random distribution for each mutation. This lim-itation can be overcome if cooperativity of mutationsis assumed, i.e., if the probability that a new muta-tion leads to large changes of cell properties increaseswith the number of mutations that the cell has experi-enced in the past. Since deep hierarchies are frequentlyobserved in patients (ref. [12]) it seems very plausi-ble that cooperativity of mutations plays a role duringevolution of the acute leukemias. In the presence of coop-erativity we observe a significant increase in the emer-gence of deep hierarchies and also in the interindividualheterogeneity of clonal hierarchies. Assuming cooper-ativity allows to reproduce many of the clonal hier-archies detected in patients from ref. [12] by modelsimulations.Computer simulations of the proposed model suggest
that increasing mutation rates have only a limited impacton the number of significant clones. Although the totalnumber of clones increases with increasing mutationrates, the number of significant clones remains approxi-mately constant. This observation can be explained by thestrong competition among leukemic clones. This is in linewith experimental studies [11, 12] which report similarnumbers of clones in different patients.
Genetic and epigenetic mechanisms are closely inter-twined in leukemogenesis. Genes involved in epigeneticencoding are often mutated in leukemias [65, 66]. In addi-tion, epigenetic changes can be driven bymutations whichare not directly linked to the epigenetic machinery such asIDH1/2 or several transcription factors [67]. In principle,epigenetic mechanisms can be included in the proposedmodeling framework. It has to be clarified whether epige-netic effects can be modeled similar to mutations as ran-dom, independent, discrete jumps in the trait space. Thismay be true for epigenetic changes that mimic geneticmutations such as in the case of DNMT3A [68]. In othercases it might be more appropriate to model epigeneticmodifications as drift or diffusion in a continuous traitspace as done in [33]. Plasticity and potential reversibilityare important hallmarks of epigenetic changes. The possi-bility that clones readopt the traits of their ancestors canbe included easily into the model. The same holds for thepotentially different time scales of genetic and epigeneticmodifications.Mathematical modeling of clonal hierarchies can be a
helpful tool, since it allows to link cell properties to aposition in the clonal hierarchy. This may have a clin-ical relevance. Model simulations imply that the clonalhierarchy allows drawing conclusions about the course ofthe disease, even if the latter is known only at one timepoint. This work has the following clinical implications

Stiehl et al. Biology Direct (2016) 11:51 Page 14 of 19
which could be discussed and evaluated in clinical trials:(i) A small number of clones detected at diagnosis mayargue in favor of a rapidly progressing disease with aggres-sive clones. These patients may have poor prognosis andpotentially a rapid progression after standard treatmentor a poor treatment response. (ii) Deep hierarchies e.g., oforder 5 or more, may argue for a long course of the dis-ease before diagnosis. The probability for the presence ofaggressive clones is high, which may limit prognosis. Nev-ertheless clones at the top of the hierarchy may respondto the treatment. (iii) Hierarchies of intermediate depth,e.g., 3 or 4 may argue in favor of long courses and limitedaggressiveness of the clones. Patients with good prognosismay be over-represented in this group.
ConclusionEmergence of heterogeneity in acute leukemias is a com-plex process. Multi-clonality and deep hierarchies emergeonly from leukemic clones with intermediate self-renewal.Emergence of deep hierarchies is facilitated by a coop-erativity of different mutations. There is no correlationbetween the position of a clone within the hierarchy andits proliferation rate. Self-renewal rates of leukemic clonesincrease with the depth of mutation hierarchy. Therefore,the structure of the hierarchy may serve as a marker forpatient prognosis.
Reviewers’ commentsReviewer’s report 1: Marek Kimmel, Rice University,Houston, TX, USAReviewer summary:The paper is focused on modeling the clonal structureof driver mutations in leukemias. It is based on a pre-vious model by the same group, which is augmented bynew mutations appearing at random. The topology of theresulting clonal pedigrees is compared to literature data,notably ref. [12]. The results are plausible in that the col-lection of structures generated by the model matches thatin ref. [12]. I enjoyed reading the paper, which is certainlysufficiently novel to be published.
Reviewer recommendations to authors:1. The main difficulty I see at the current stage of develop-ment of the model is that the simulated mutations are notidentified with any particular “real” drivers. At least somecomments on the subject will be helpful.Authors’ Response: We provide an overview of leukemic
(driver) mutations that lead to increased self-renewalrates. Serial acquisition of such mutations could explainthe step-wise increase in self-renewal rates observed in themodel. We added the following paragraph to the discussion(p. 14, lines 23–34): Mutations detected in acute leukemias
act at different regulatory levels. There is evidence thatmany of them lead to increased self-renewal. Importantexamples for genes where mutations lead to increased self-renewal are the chromatin modifiers TET2 [53], DNMT3A[54] and MLL [55] or the transcription factors C/EBPα
[56], RUNX1/CBFβ [57, 58] and factors encoded by theHOX genes, e.g., as NUP98-HOXA9 [59]. Other exam-ples include the isocitrate dehydrogenase IDH1 [60], theNRAS gene [61] or the multi-functional protein NPM1[62]. Importantly, more than one of these mutations canoccur in the same cell [63, 64]. This is in line with thestep-wise increase in self-renewal observed in the modelsimulations.2. The authors identified a plausible mechanism of
selection of clones by assuming that faster clones are notseen in the patient population, since they lead to a soonerdeath, while on the other hand the slowest clones do notshow since the patient may die of competing risks beforehe/she is diagnosed. It would be nice to see the sensitiv-ity of this mechanism to changes in clone mutation ratedistribution, for example.Authors’ Response: We run simulations for different
mutation rates. The simulations imply that this mecha-nism is preserved. We added a paragraph to the Resultssection (p. 12 line 53 - p. 13 line 9): Simulation resultsimply that patients with less aggressive clones and with-out disease outbreak are over-represented in case of smallmutation rates. Patients with highly aggressive clones andfast disease progression are over-represented in case ofhigh mutation rates. This is plausible: The higher themutation rate, the more clones are generated per unit oftime. The probability that at least one clone per patienthas favorable growth properties increases with the num-ber of generated clones. Similarly the probability thathighly aggressive clones and fast disease progression occurincreases with increasing mutation rate. For all mutationrates we observed that clonal hierarchies are flat in caseof fast disease progression and in case of very slow diseaseprogression compared to cases with intermediate diseaseprogression.3. I understand that once a mutation (= driver muta-
tion?) arises, the clone it initiates survives. This is ofcourse true only of some of the clones. The problem canbe fixed by adjusting the rate of the Poisson process bythe probability of non-extinction of the clone, as it wasdone for example in the models in Bozic et al. (2010)or Kimmel and Corey (2013). It would be interesting toknow how such adjustment might change the effectivemutation rates.Authors’ Response: We have adopted the approach
described in Kimmel and Corey (2013) to take into accountextinction probabilities. The introduction of extinctionprobabilities leaves our main results (increase of self-renewal over time, increase of self-renewal with increasing

Stiehl et al. Biology Direct (2016) 11:51 Page 15 of 19
depth of the hierarchy) unchanged. Effective mutationrates decrease if the extinction of clones is modeled.This leads to a later disease outbreak. The frequencyof deep hierarchies is reduced in the model with extinc-tion probabilities. This can be explained by the factthat the extinction probability is higher if self-renewal ofthe new clone is small. Therefore clones with high self-renewal probability which lead to a fast course of thedisease and patient death are favored. Correspondingexplanations have been added to the Methods section onpage 7 (lines 25–63).
Reviewer’s report 2: Tommaso Lorenzi, University of StAndrews, Scotland, UKReviewer summary:Stiehl et al. present an in silico study of possible mech-anisms which underpin the emergence and evolution ofclonal heterogeneity in acute leukaemia. In line with pre-vious work by the same authors, this study relies ona mathematical model consisting of a system of ordi-nary differential equations describing the evolution ofhematopoietic cells and leukemic clones. From the mod-elling point of view, the main novelty lies in the factthat the authors incorporate here the effects of mutationsoccurring during genome replication. The manuscript iswell organised and the results are presented in a clearand well-structured way. The work is based on computersimulations alone as the structure of the model wouldmake it very hard to perform any qualitative analyses. Thenumerical results obtained are interesting and potentiallyrelevant for the cancer research community. In partic-ular, the comparison of numerical results with clinicaldata presented by Anderson et al. [Nature 469, 356-361,2011] shades light on possible connections between clonalheterogeneity and the disease progression of leukaemia.
Reviewer recommendations to authors:1. I would recommend that the authors discuss in moredetail the originality of their model compared with themodels presented in ref. [Werner et al., J. R. Soc. Inter-face 10, 20130349, 2013] and in the appendix of ref. [Stiehlet al., J. Royal Society Interface 11, 20140079, 2014].Authors’ Response: The model presented in Werner
studies dynamics of mutations in non-stem cells. It isassumed that cell properties are identical for all cells car-rying the same number of mutations. Most results of thework refer to neutral mutations that do not change the phe-notype of the cells. The work neglects competition betweenthe different mutated cells and feedback mechanisms reg-ulating the number of healthy cells. The model proposedin our work is a more elaborated version of the modelproposed in the Appendix of [Stiehl et al., J. Royal Soci-ety Interface 11, 20140079, 2014]. The implementation ofour previous model did not allow to keep track of the
clonal hierarchies. The assumption that traits of the newclones follow normal distributions may be more realisticthan the uniform distributions used in our previous mod-els. An additional new feature of the model presented inthis manuscript is consideration of stochastic extinctionof new clones. We added the following sentences to the“Methods” section:
• Page 3, lines 61–63: The main novelty lies inconsidering a time dependent number of leukemicclones and in tracking the structure of the clonalhierarchies.
• Page 4, lines 8–15: To model stochastic extinction ofclones with favorable properties, we take into accounttheir extinction probabilities using the theory ofbranching processes. Compared to the workpresented in [40], which focuses on neutral mutationsin non-stem cells without feedback regulation orcompetition, we are interested in the evolution ofnon-neutral stem cell mutations under competitivepressure of a nonlinear feedback mechanism.
2. Although I agree that a careful description of themodel parametrisation is presented in ref. [22] of themanuscript, I think it would be worthwhile to justify inmore detail the choice of the parameter values in thesubsection ‘Parametrization’.Authors’ Response: We added an additional paragraph
to the section describing parametrization (p. 8, lines 15–33): In the following we shortly describe the calibration. Fordetails see ref. [22] and the references therein. The numbersof myeloid mitotic (c1) and post-mitotic (c2) cells and theneutrophil clearance (d2) are taken from literature. Ana-lytical expressions of the steady state cell counts allow tocalculate p1 based on c1, c2 and d2. The parameter k canbe expressed as a function of known quantities and a1. Toobtain an appropriate value for a1, we simulate stem celltransplantation. We know that after transplantation of adose of 3 to 5 · 106 cells per kg body weight, patients recoverto 5·108 neutrophils per liter of blood within 15 days. To setthe initial condition we assume that the ratio of myeloid toerythroid cells in the transplant is as in the healthy marrowbetween 2:1 and 4:1. We choose a1 such that we observerecovery after 2–3 weeks.3. I would suggest that Section 5 is removed with con-
tents moved to Section 4; accordingly, I propose renamingSection 3 ‘Results and Discussion’ and Section 4 ‘Conclu-sions’.Authors’ Response: The titles of the sections are pre-
scribed by the journal.4. I would recommend the authors indicate foreseeable
extensions of the present work and future research per-spectives. For instance, as recent experimental evidencesuggests that epigenetic mechanisms can be implicated

Stiehl et al. Biology Direct (2016) 11:51 Page 16 of 19
in the development of acute myeloid leukaemia [e.g., Jostet al., Leukemia 28, 1227-1234, 2014], the authors maywant to discuss possible ways of extending their model toinclude the effects of epimutations.Authors’ Response: We added a paragraph to the Dis-
cussion (p. 15, lines 24–41): Genetic and epigenetic mech-anisms are closely intertwined in leukemogenesis. Genesinvolved in epigenetic encoding are often mutated inleukemias [65, 66]. In addition, epigenetic changes canbe driven by mutations which are not directly linked tothe epigenetic machinery such as IDH1/2 or several tran-scription factors [67]. In principle, epigenetic mechanismscan be included in the proposed modeling framework. Ithas to be clarified whether epigenetic effects can be mod-eled similar to mutations as random, independent, discretejumps in the trait space. This may be true for epigeneticchanges that mimic genetic mutations such as in the caseof DNMT3A [68]. In other cases it might be more appropri-ate to model epigenetic modifications as drift or diffusionin a continuous trait space as done in [33]. Plasticity andpotential reversibility are important hallmarks of epige-netic changes. The possibility that clones readopt the traitsof their ancestors can be included easily into the model.The same holds for the potentially different time scales ofgenetic and epigenetic modifications.
Reviewer’s report 3: Tomasz Lipniacki, Institute ofFundamental Technological Research, Polish Academy ofSciences,Warsaw, PolandReviewer summary:Thomas Stiehl et al. propose a simple model ofhematopoiesis of healthy and leukemic cell populations.The novelty is in inclusion of mutations that lead to timevarying number of leukemic clones. The aim is to link thenumber of mutations that characterize a given clone withthe self-renewal rate (fraction of divisions that do not leadto differentiation). Overall this is a nice study worth pub-lishing, however some aspects require some clarificationor more direct formulation.
Reviewer recommendations to authors:1. The authors found that the self-renewal rate depend ofthe depth of clone in the hierarchy. It is not clear whetherit is a simple consequence of assumption that clones passself-renewal rate to the new clone emerging due to muta-tion. If so the clones with higher self-renewal rate thatare more abundant have higher chance to give rise to newclones, and these clones will be characterized with higherself-renewal rate. The Authors write that traits of the newclone are normally or uniformly distributed (page 7), butno details are given.Authors’ Response: The increasing self-renewal of clones
is the result of a selection process. We added an explana-tory paragraph to the Results section (p. 9, lines 200–33):
The increasing self-renewal of clones over time is the resultof a selection process. The selection was studied numeri-cally in [22] and proved in [52] for a multi-clonal systemin absence of mutations. When a new clone arises due toa mutation, its self-renewal and proliferation rates can belarger or smaller than the corresponding rates of the parentclone. They are chosen according to normal distributionswith constant standard deviation and means equal to theparameter values of the parent clone. It is not straight-forward to predict whether progeny clones with higherself-renewal, higher proliferation or both have more com-petitive advantages. Simulation results show that amongthe newly arising clones with random proliferation andself-renewal values those with high self-renewal are morecompetitive than those with high proliferation. We haveclarified the choice of parameters for the new clones in the“Methods” section:
• Page 7, lines 15–19: We assume that the traits(self-renewal and proliferation rates) of the new cloneare normally distributed with a predefined varianceand the mean value corresponding to the parametersof the founder cell.
• Page 8, lines 37–39: Standard deviations for thenormal distributions are varied between 0.001 and 0.1.The standard deviations and mutation rates used toobtain the figures are specified in the figure captions.
2. In “Parametrization” subsection Authors write thatac = 0.87 (I think that authors mean ac since ac dependsto the strength of the negative feedback i.e. numberof cells), then they write that for Fig. 4 self-renewal isbetween 0.872 and 0.875?Authors’ Response:We corrected the notation. The max-
imal self-renewal of 0.87 refers to the self-renewal ofhealthy cells. We have clearly indicated this in the revisedversion. The range of self-renewal between 0.872 and 0.875refers to self-renewal of leukemic cells. We added the fol-lowing sentences:
• Page 8, lines 31–33: ac = 0.87, pc = 0.45/day,dc = 2.3/day, k = 1.85 · 10−9, dl = 0.5/day. Theseparameters refer to healthy cells. Parameters of theleukemic cells are chosen randomly according tonormal distributions
• Page 10, line 12: Simulations show that if we restrictself-renewal rate of the leukemic founder clone tointermediate values, e.g., between 0.872 and 0.875,the number of clones per patient increases.
3. It is not clear how long are the simulations? Whenself-renewal rate multiplied by feedback strength s(t) islarger than 1/2, the cell sub-populations are growing. Itis not clear whether the authors run the simulations longenough to reach the constant population size limit. A

Stiehl et al. Biology Direct (2016) 11:51 Page 17 of 19
figure showing number of cells in each clone would behelpful.Authors’ Response:We added a panel showing an exam-
ple for the time course of the leukemic clones to Fig. 2. Asshown in [22, 52], the cell count in each clone convergesasymptotically to an equilibrium, which is nonzero onlyin the case of clones with maximal fitness, i.e., the largestself-renewal. In clinical scenarios, patients die before theequilibrium is reached. Allowing mutations with increas-ing self-renewal not approaching one would lead to adynamics that does not converge to an equilibrium. Thelatter is however an artificial example as far as biologicalapplications are concerned.4. Since the clone starts from single founder cell, in the
beginning of each clone ODE formalism is not adequate –some comment is needed here.Authors’ Response: Following the advice of Reviewer 1
(point 3.) we extended the model to take into accountextinction probabilities of newly generated clones. For eachnew clone we calculate the extinction probability basedon the theory of Galton-Watson Processes. The probabilitythat a new clone is introduced to the system is equal to itsprobability of non-extinction.5. The conclusion in abstract that “clonal heterogeneity
might impact the course of the disease” is very vogue.Authors’ Response: We have replaced this formulation
by a more specific statement: Comparison of patient dataand simulation results suggests that the self-renewal ofleukemic clones increases with the emergence of clonalheterogeneity.6. Technical: Page 5 “Model equations for hematopoietic
system” there is once pc once pc – I think it denotes thesame thing.Authors’ Response: Thank you. We corrected it.
AbbreviationResp.: Respectively
AcknowledgementsNot applicable.
FundingThis work was funded by research funding from the German ResearchFoundation DFG (SFB 873; subprojects A13 to C.L and B08 to A.M.-C. and T.S.)
Availability of data andmaterialsNot applicable.
Authors’ contributionsTS, CL and AM-C planned the research and designed the model. TS run thesimulations and compared them to the data. TS and AM-C prepared themanuscript. All authors read and approved the manuscript.
Authors’ informationNot applicable.
Competing interestsThe authors declare that they have no competing interests.
Consent for publicationNot applicable.
Ethics approval and consent to participateNot applicable.
Author details1Institute of Applied Mathematics, Heidelberg University, Im NeuenheimerFeld 205, 69120 Heidelberg, Germany. 2Interdisciplinary Center for ScientificComputing, Heidelberg University, Im Neuenheimer Feld 205, 69120Heidelberg, Germany. 3Bioquant Center, Heidelberg University, ImNeuenheimer Feld 297, 69120 Heidelberg, Germany. 4Department ofMedicine V, Heidelberg University, Im Neuenheimer Feld 410, 69120Heidelberg, Germany.
Received: 21 June 2016 Accepted: 29 September 2016
References1. Bonnet D, Dick J. Human acute myeloid leukemia is organised as a
hierarchy that originates from a primitive hematopoietic cell. Nat Med.1997;3:730–7.
2. Hope K, Jin L, Dick J. Acute myeloid leukemia originates from a hierarchyof leukemic stem cell classes that differ in self-renewal capacity. NatImmunol. 2004;5:738–43.
3. Lang F, Wojcik B, MA R. Stem cell hierarchy and clonal evolution in acutelymphoblastic leukemia. Stem Cells Int. 2015;2015:137164.
4. Lutz C, Hoang V, Ho A. Identifying leukemia stem cells - is it feasible anddoes it matter? Cancer Lett. 2013;338:10–14.
5. Parkin B, Ouillette P, Li Y, Keller J, Lam C, Roulston D, Li C, Shedden K,Malek S. Clonal evolution and devolution after chemotherapy in adultacute myelogenous leukemia. Blood. 2013;121:369–77.
6. Ley T, Mardis E, Ding L, Fulton B, McLellan M, Chen K, Dooling D,Dunford-Shore B, McGrath S, Hickenbotham Cook L, Abbott R, LarsonD, Koboldt D, Pohl C, Smith S, Hawkins A, Abbott S, Locke D, Hillier L,Miner T, Fulton L, Magrini V, Wylie T, Glasscock J, Conyers J, Sander N,Shi X, Osborne J, Minx P, Gordon D, Chinwalla A, Zhao Y, Ries R,Payton J, Westervelt P, Tomasson M, Watson M, Baty J, Ivanovich J,Heath S, Shannon W, Nagarajan R, Walter M, Link D, Graubert T,DiPersio J, Wilson R. Dna sequencing of a cytogenetically normal acutemyeloid leukaemia genome. Nature. 2008;456:66–72.
7. Paguirigan A, Smith J, Meshinchi S, Carroll M, Maley C, Radich J.Single-cell genotyping demonstrates complex clonal diversity in acutemyeloid leukemia. Sci Transl Med. 2015;7:281–2.
8. Garg M, Nagata Y, Kanojia D, Mayakonda A, Yoshida K, Haridas Keloth S,Zang Z, Okuno Y, Shiraishi Y, Chiba K, Tanaka H, Miyano S, Ding L,Alpermann T, Sun Q, Lin D, Chien W, Madan V, Liu L, Tan K, Sampath A,Venkatesan S, Inokuchi K, Wakita S, Yamaguchi H, Chng W, Kham S,Yeoh A, Sanada M, Schiller J, Kreuzer K, Kornblau S, Kantarjian H,Haferlach T, Lill M, Kuo M, Shih L, Blau I, Blau O, Yang H, Ogawa S,Koeffler H. Single-cell genotyping demonstrates complex clonal diversityin acute myeloid leukemia. Blood. 2015;126:2491–501.
9. Kim T, Yoshida K, Kim Y, Tyndel M, Park H, Choi S, Ahn J, Jung S, YangD, Lee J, Kim H, Kong G, Ogawa S, Zhang Z, Kim H, Kim D. Clonaldynamics in a single aml case tracked for 9 years reveals the complexityof leukemia progression. Leukemia. 2016;30:295–302.
10. Welch J, Ley T, Link D, Miller C, Larson D, Koboldt D, Wartman L,Lamprecht T, Liu F, Xia J, Kandoth C, Fulton R, McLellan M, Dooling D,Wallis J, Chen K, Harris C, Schmidt H, Kalicki-Veizer J, Lu C, Zhang Q, LinL, O’Laughlin M, McMichael J, Delehaunty K, Fulton L, Magrini V,McGrath S, Demeter R, Vickery T, Hundal J, Cook L, Swift G, Reed J,Alldredge P, Wylie T, Walker J, Watson M, Heath S, Shannon W,Varghese N, Nagarajan R, Payton J, Baty J, Kulkarni S, Klco J, TomassonM, Westervelt P, Walter M, Graubert T, DiPersio J, Ding L, Mardis E,Wilson R. The origin and evolution of mutations in acute myeloidleukemia. Cell. 2012;150:264–78.
11. Ding L, Ley T, Larson D, Miller C, Koboldt D, Welch J, Ritchey J, YoungM, Lamprecht T, McLellan M, McMichael J, Wallis J, Lu C, Shen D, HarrisC, Dooling D, Fulton R, Fulton L, Chen K, Schmidt H, Kalicki-Veizer J,Magrini V, Cook L, McGrath S, Vickery T, Wendl M, Heath S, Watson M,

Stiehl et al. Biology Direct (2016) 11:51 Page 18 of 19
Link D, Tomasson M, Shannon W, Payton J, Kulkarni S, Westervelt P,Walter M, Graubert T, Mardis E, Wilson R, DiPersio J. Clonal evolution inrelapsed acute myeloid leukaemia revealed by whole-genomesequencing. Nature. 2012;481:506–10.
12. Anderson K, Lutz C, van Delft F, Bateman C, Guo Y, Colman S, KempskiH, Moorman A, Titley I, Swansbury J, Kearney L, Enver T, Greaves M.Genetic variegation of clonal architecture and propagating cells inleukaemia. Nature. 2011;469:356–61.
13. Klco J, Spencer D, Miller C, Griffith M, Lamprecht T, O’Laughlin M,Fronick C, Magrini V, Demeter R, Fulton R, Eades W, Link D, Graubert T,Walter M, Mardis E, Dipersio J, Wilson R, Ley T. Functional heterogeneityof genetically defined subclones in acute myeloid leukemia. Cancer Cell.2014;25:379–92.
14. Shlush L, Chapal-Ilani N, Adar R, Pery N, Maruvka Y, Spiro A, Shouval R,Rowe J, Tzukerman M, Bercovich D, Izraeli S, Marcucci G, Bloomfield C,Zuckerman T, Skorecki K, Shapiro E. Cell lineage analysis of acuteleukemia relapse uncovers the role of replication-rate heterogeneity andmicrosatellite instability. Blood. 2012;120:603–12.
15. Vogelstein B, Papadopoulos N, Velculescu V, Zhou S, Diaz LJ, Kinzler K.Cancer genome landscapes. Science. 2013;339:1546–1558.
16. Alexandrov L, Nik-Zainal S, Wedge D, Aparicio S, Behjati S, Biankin A,Bignell G, Bolli N, Borg A, Borresen-Dale A, Boyault S, Burkhardt B,Butler A, Caldas C, Davies H, Desmedt C, Eils R, Eyfjord J, Foekens J,Greaves M, Hosoda F, Hutter B, Ilicic T, Imbeaud S, Imielinski M, Jager N,Jones D, Jones D, Knappskog S, Kool M, Lakhani S, Lopez-Otin C,Martin S, Munshi N, Nakamura H, Northcott P, Pajic M, PapaemmanuilE, Paradiso A, Pearson J, Puente X, Raine K, Ramakrishna M, RichardsonA, Richter J, Rosenstiel P, Schlesner M, Schumacher T, Span P, Teague J,Totoki Y, Tutt A, Valdes-Mas R, van Buuren M, van ’t Veer L,Vincent-Salomon A, Waddell N, Yates L, Zucman-Rossi J, Futreal P,McDermott U, Lichter P, Meyerson M, Grimmond S, Siebert R, Campo E,Shibata T, Pfister S, Campbell P, Stratton M. Signatures of mutationalprocesses in human cancer. Nature. 2013;500:415–21.
17. Metcalf D. Hematopoietic cytokines. Blood. 2008;111:485–91.18. Shinjo K, Takeshita A, Ohnishi K, Ohno R. Granulocyte colony-stimulating
factor receptor at various differentiation stages of normal and leukemichematopoietic cells. Leuk Lymphoma. 1997;25:37–46.
19. Kondo S, Okamura S, Asano Y, Harada M, Niho Y. Human granulocytecolony-stimulating factor receptors in acute myelogenous leukemia. Eur JHaematol. 1991;46:223–30.
20. Cogle C, Goldman D, Madlambayan G, Leon R, Al Masri A, Clark H,Asbaghi S, Tyner J, Dunlap J, Fan G, Kovacsovics T, Liu Q, Meacham A,Hamlin K, Hromas R, Scott E, Fleming W. Functional integration of acutemyeloid leukemia into the vascular niche. Leukemia. 2014;28:1978–1987.
21. Krause D, Fulzele K, Catic A, Sun C, Dombkowski D, Hurley M, Lezeau S,Attar E, Wu J, Lin H, Divieti-Pajevic P, Hasserjian R, Schipani E, Van EttenR, Scadden D. Differential regulation of myeloid leukemias by the bonemarrow microenvironment. Nat Med. 2013;19:1513–1517.
22. Stiehl T, Baran N, Ho A, Marciniak-Czochra A. Clonal selection andtherapy resistance in acute leukaemias: mathematical modelling explainsdifferent proliferation patterns at diagnosis and relapse. J R Soc Interface.2014;11:20140079.
23. Stiehl T, Baran N, Ho A, Marciniak-Czochra A. Cell division patterns inacute myeloid leukemia stem-like cells determine clinical course: a modelto predict patient survival. Cancer Res. 2015;75:940–9.
24. Jan M, Majeti R. Clonal evolution of acute leukemia genomes. Oncogene.2013;32:135–40.
25. Estey E. Acute myeloid leukemia: 2013 update on risk-stratification andmanagement. Am J Hematol. 2013;88:318–27.
26. Jilkine A, Gutenkunst R. Effect of dedifferentiation on time to mutationacquisition in stem cell-driven cancers. PLoS Comput Biol. 2014;10:1003481.
27. Shahriyari L, Komarova N. Symmetric vs. asymmetric stem cell divisions:an adaptation against cancer? PLoS ONE. 2013;8:76195.
28. Kimmel M, Axelrod D. Branching processes in biology. New York:Springer; 2002.
29. Bauer B, Siebert R, Traulsen A. Cancer initiation with epistatic interactionsbetween driver and passenger mutations. J Theor Biol. 2014;358:52–60.
30. Durrett R. Population genetics of neutral mutations in exponentiallygrowing cancer cell populations. Ann Appl Probab. 2013;23:230–50.
31. Bozic I, Antal T, Ohtsuki H, Carter H, Kim D, Chen S, Karchin R, Kinzler K,Vogelstein B, Nowak M. Accumulation of driver and passenger mutationsduring tumor progression. PNAS. 2010;107:18545–50.
32. Chisholm R, Lorenzi T, Lorz A, Larsen A, Neves de Almeida L, EscargueilA, Clairambault J. Emergence of drug tolerance in cancer cellpopulations: an evolutionary outcome of selection, non-geneticinstability and stress-induced adaptation. Cancer Res. 2015;75:930–9.
33. Lorenzi T, Chisholm R, Desvillettes L, Hughes B. Dissecting the dynamicsof epigenetic changes in phenotype-structured populations exposed tofluctuating environments. J Theoret Biol. 2015;386:166–76.
34. Lorz A, Lorenzi T, Hochberg M, Clairambault J, Perthame B. Populationaladaptive evolution, chemotherapeutic resistance and multipleanti-cancer therapies. ESAIM Math Model Numer Anal. 2013;47:377–99.
35. Delitala M, Lorenzi T. A mathematical model for the dynamics of cancerhepatocytes under therapeutic actions. J Theoret Biol. 2012;297:88–102.
36. Buerger A. The mathematical theory of selection, recombination, andmutation. Chinchester: Wiley; 2000.
37. Champagnat N, Ferriere R, Meleard S. Unifying evolutionary dynamics:from individual stochastic processes to macroscopic models. Theor PopulBiol. 2006;69:297–321.
38. Ashkenazi R, Gentry S, Jackson T. Pathways to tumorigenesis – modelingmutation acquisition in stem cells and their progeny. Neoplasia. 2008;10:1170–82.
39. Gentry S, Ashkenazi R, Jackson T. A maturity-structured mathematicalmodel of mutation acquisition in the absence of homeostatic regulation.Math Model Nat Phenom. 2009;4:156–82.
40. Werner B, Dingli D, Traulsen A. A deterministic model for the occurrenceand dynamics of multiple mutations in hierarchically organised tissues.J R Soc Interface. 2013;10:20130349.
41. Poleszczuk J, Hahnfeldt P, Enderling H. Evolution and phenotypicselection of cancer stem cells. PLoS Comput Biol. 2015;11:1004025.
42. Wang Z, Butner J, Kerketta R, Cristini V, Deisboeck T. Simulating cancergrowth with multiscale agent-based modeling. Semin Cancer Biol.2015;30:70–8.
43. Meyer J, Wang J, Hogan L, Yang J, Dandekar S, Patel J, Tang Z, ZumboP, Li S, Zavadil J, Levine R, Cardozo T, Hunger S, Raetz E, Evans W,Morrison D, Mason C, Carroll W. Relapse-specific mutations in nt5c2 inchildhood acute lymphoblastic leukemia. Nat Genet. 2013;45:290–4.
44. Marciniak-Czochra A, Stiehl T, Jäger W, Ho A, Wagner W. Modeling ofasymmetric cell division in hematopoietic stem cells – regulation ofself-renewal is essential for efficient repopulation. Stem Cells Dev.2009;18:377–85.
45. Stiehl T, Marciniak-Czochra A. Characterization of stem cells usingmathematical models of multistage cell lineages. Math Comput Model.2011;53:1505–1517.
46. Stiehl T, Ho A, Marciniak-Czochra A. The impact of cd34+ cell dose onengraftment after stem cell transplantations: Personalised estimatesbased onmathematical modeling. BoneMarrow Transplant. 2014;49:30–7.
47. Stiehl T, Marciniak-Czochra A. Mathematical modelling ofleukemogenesis and cancer stem cell dynamics. Math Mod NaturalPhenomena. 2012;7:166–202.
48. Jandl J. Blood cell formation In: Jandl J, editor. Textbook of Hematology.Boston: Littel Brown and Company; 1996. p. 1–69.
49. Layton J, Hockman H, Sheridan W, Morstyn G. Evidence for a novel invivo control mechanism of granulopoiesis: mature cell-related control ofa regulatory growth factor. Blood. 1989;74:1303–1307.
50. Ross S. Stochastic processes. New York: Wiley; 1996.51. Kimmel M, Corey S. Stochastic hypothesis of transition from inborn
neutropenia to aml: Interactions of cell population dynamics andpopulation genetics. Front Oncol. 2013;3:89.
52. Busse J, Gwiazda P, Marciniak-Czochra A. Mass concentration in anonlocal model of clonal selection. J Math Biol. 2016;73:1001–33.
53. Moran-Crusio K, Reavie L, Shih A, Abdel-Wahab O, Ndiaye-Lobry D,Lobry C, Figueroa M, Vasanthakumar A, Patel J, Zhao X, Perna F,Pandey S, Madzo J, Song C, Dai Q, He C, Ibrahim S, Beran M, Zavadil J,Nimer S, Melnick A, Godley L, Aifantis I, Levine R. Tet2 loss leads toincreased hematopoietic stem cell self-renewal and myeloidtransformation. Cancer Cell. 2011;20:11–24.
54. Challen G, Sun D, Jeong M, Luo M, Jelinek J, Berg J, Bock C,Vasanthakumar A, Gu H, Xi Y, Liang S, Lu Y, Darlington G, Meissner A,Issa J, Godley L, Li W, Goodell M. Human acute myeloid leukemia is

Stiehl et al. Biology Direct (2016) 11:51 Page 19 of 19
organised as a hierarchy that originates from a primitive hematopoieticcell. Nat Genet. 2011;44:23–31.
55. Neff T, Armstrong S. Recent progress toward epigenetic therapies: theexample of mixed lineage leukemia. Blood. 2013;121:4847–853.
56. Schepers H, Wierenga A, van Gosliga D, Eggen B, Vellenga E, SchuringaJ. Reintroduction of c/ebpalpha in leukemic cd34+ stem/progenitor cellsimpairs self-renewal and partially restores myelopoiesis. Blood. 2007;110:1317–25.
57. Rhoades K, Hetherington C, Harakawa N, Yergeau D, Zhou L, Liu L, LittleM, Tenen D, Zhang D. Analysis of the role of aml1-eto in leukemogenesis,using an inducible transgenic mouse model. Blood. 2000;96:2108–015.
58. Engel M, Hiebert S. Proleukemic runx1 and cbfbeta mutations in thepathogenesis of acute leukemia. Cancer Treat Res. 2010;145:127–47.
59. Pineault N, Abramovich C, Humphries R. Transplantable cell linesgenerated with nup98-hox fusion genes undergo leukemic progressionby meis1 independent of its binding to dna. Leukemia. 2005;19:636–43.
60. Sasaki M, Knobbe C, Munger J, Lind E, Brenner D, Bruestle A, Harris I,Holmes R, Wakeham A, Haight J, You-Ten A, Li W, Schalm S, Su S,Virtanen C, Reifenberger G, Ohashi P, Barber D, Figueroa M, Melnick A,Zuniga-Pfluecker J, Mak T. Idh1(r132h) mutation increases murinehaematopoietic progenitors and alters epigenetics. Nature. 2012;488:656–9.
61. Sachs Z, LaRue R, Nguyen H, Sachs K, Noble K, Mohd Hassan N, Diaz-Flores E, Rathe S, Sarver A, Bendall S, Ha N, Diers M, Nolan G, ShannonK, Largaespada D. Nrasg12v oncogene facilitates self-renewal in a murinemodel of acute myelogenous leukemia. Blood. 2014;124:3274–283.
62. Vassiliou G, Cooper J, Rad R, Li J, Rice S, Uren A, Rad L, Ellis P, AndrewsR, Banerjee R, Grove C, Wang W, Liu P, Wright P, Arends M, Bradley A.Mutant nucleophosmin and cooperating pathways drive leukemiainitiation and progression in mice. Nat Genet. 2011;43:470–5.
63. Naoe T, Kiyoi H. Gene mutations of acute myeloid leukemia in thegenome era. Int J Hematol. 2013;97:165–74.
64. Pui C, Yang J, Hunger S, Pieters R, Schrappe M, Biondi A, Vora A,Baruchel A, Silverman L, Schmiegelow K, Escherich G, Horibe K, BenoitY, Izraeli S, Yeoh A, Liang D, Downing J, Evans W, Relling M, MullighanC. Childhood acute lymphoblastic leukemia: Progress throughcollaboration. J Clin Oncol. 2015;33:2938–948.
65. Chan S, Majeti R. Role of dnmt3a, tet2, and idh1/2 mutations inpre-leukemic stem cells in acute myeloid leukemia. Int J Hematol.2013;98:648–57.
66. Greenblatt S, Nimer S. Chromatin modifiers and the promise ofepigenetic therapy in acute leukemia. Leukemia. 2014;28:1396–1406.
67. Wouters B, Delwel R. Epigenetics and approaches to targeted epigenetictherapy in acute myeloid leukemia. Blood. 2016;127:42–52.
68. Jost E, Lin Q, Weidner C, Wilop S, Hoffmann M, Walenda T, SchemionekM, Herrmann O, Zenke M, Bruemmendorf T, Koschmieder S, Wagner W.Epimutations mimic genomic mutations of dnmt3a in acute myeloidleukemia. Leukemia. 2014;28:1227–1234.
• We accept pre-submission inquiries
• Our selector tool helps you to find the most relevant journal
• We provide round the clock customer support
• Convenient online submission
• Thorough peer review
• Inclusion in PubMed and all major indexing services
• Maximum visibility for your research
Submit your manuscript atwww.biomedcentral.com/submit
Submit your next manuscript to BioMed Central and we will help you at every step: