Proteasome Inhibitors Trigger NOXA-Mediated Apoptosis in Melanoma and Myeloma Cells
Upload
independentCategory
view
0download
0
381
Leukemias, Myeloma, and Other Lymph o ret icu I a r N eo pl asm s Jost! A. Hernindez, M.D.,* Kevin 1. Land, B.S.,t and Robert W. McKenna, M.D.”
Background. The purpose of this study was to assess the occurrence of various morphologic types of leukemia and myeloma within patient demographic groups and to correlate findings with data-reporting periods and other variables, such as 5-year relative survival.
Miethods. Data from 31,850 cases of multiple sub- groups of acute and chronic leukemia, 12,237 cases of my- eloma. and 321 cases of “other” lymphoreticular neo- plasms were collected by the National Cancer Institute’s Surveillance, Epidemiology, and End Results (SEER) pro- gram. The data were examined by age, sex, race, age-spe- cific and age-adjusted incidence rate, and patient 5-year relative survival during three reporting periods: 1973- 1977,1978-1982, and 1983-1987.
Results. The age-adjusted incidence rate for all cate- gories of leukemia combined has been constant, but there has been an increase in the relative frequency (percent- age) of acute lymphoid leukemia (ALL) in the general pop- ulation and a rising incidence rate of myeloid leukemia in the black population. The increase of ALL is offset by a decline of acute myeloid leukemias (AMLs) and acute leukemia, not otherwise specified. The age-adjusted rate of ALL in whites, 1.5 per 100,000 per year, is twice that of blacks, 0.8. The rates for each of the major categories of leukemia are considerably higher in males than in fe- males. Five-year survival rates changed very little for leukemias over the 15 years of the study except for ALL, in which there was a marked improvement between the first (1973-1977) (39.1%) and second (1978-1982) (51.3%) reporting period.
The SEER data confirm that multiple myeloma is pre- dominantly a disease of late adulthood and occurs more frequently in blacks and males. The incidence rate of multiple myeloma has not changed during the 15 years surveyed. The 5-year relative survival rate has remained nearly constant for multiple myeloma. There is a marked difference in 5-year relative survival rates for patients
~~
From the *Hematopathology Section, Department of Pathology,
t Medical student, postsophomore pathology fellow. Address for reprints: Jos& A. Hernindez, M.D., Department of
Pathology, University of Texas Southwestern Medical Center, 5323 Harry Hines Boulevard, Dallas, TX 75235-9072.
University of Texas Southwestern Medical Center, Dallas, Texas.
Received August 22, 1994; accepted September 20, 1994.
with plasmacytoma of bone marrow (45.7%), multiple myeloma (25.9%), and plasma cell leukemia (13.0%).
Conclusions. Shifts in the relative frequencies of leu- kemia types may have been affected by changes in classi- fication criteria, changes in the use of histologic terms over time, and the expanded use of immunophenotyping and other technology to characterize acute leukemias. In- cidence rates and 5-year relative survival rates for my- eloma have remained stable. Cancer 1995; 75:381-94.
Key words: acute leukemia, chronic leukemia, acute my- eloid leukemia, acute lymphoid leukemia, chronic my- eloid leukemia, chronic lymphoid leukemia, multiple myeloma, plasmacytoma, plasma cell leukemia, SEER.
The purpose of this study was to assess the occurrence of morphologic types of leukemia and myeloma within patient groups, to identify shifts in occurrence over time, and to correlate these findings with other vari- ables, such as patient 5-year relative survival. Although changes in nomenclature and its uses and the use of immunophenotyping in classifying leukemias have changed the way in which leukemias are classified, we thought it important to examine the 15 years of data from the SEER program, because these data are consis- tent over the period of study.
Materials and Methods
The study was based on data collected by the National Cancer Institute’s Surveillance, Epidemiology, and End Results (SEER) program. The details of the materials and methods of data collection are described in the monograph introduction.’ Data were examined by age, sex, race, age-specific and age-adjusted rate, and patient 5-year relative survival during three reporting periods; 1973-1977,1978-1982, and 1983-1987. Five-year rel- ative survival rates were also determined for the period 1978-1986. Male-to-female ratios were calculated as age-adjusted ratios. Incidence rates are reported as cases per 100,000 population per year. Throughout the
382 CANCER Supplement January 1,1995, Volume 75, No. 1
text, age-specific incidence rates are for the most recent reporting period (1983-1987) unless otherwise speci- fied. Ninety-five percent of the leukemias, 92% of my- elomas, and 97% of other lymphoreticular neoplasms reported to SEER were histologically confirmed. This analysis is based only on cases that were histologically confirmed.
The leukemias were divided into four major groups: myeloid, monocytic, lymphoid, and other leukemias. Each of these morphologic groups were further divided, resulting in more than 30 categories. The frequencies and percent distribution by histologic type and race for the leukemias in the period 1973-1987 are shown in Table 1. The analysis of trends focuses on the acute and chronic myeloid and lymphoid leukemias. These four categories constitute 81.3% of all leukemias reported. The remaining categories of leukemia constitute a large and heterogeneous list. Only categories with data from 60 patients or more will be discussed.
The myelomas encompass three categories: multiple myeloma, malignant plasmacytoma, and plasma cell leukemia. The plasma cell leukemias are in- cluded with the leukemias in Table 1. The frequencies and percent distribution by histologic type and race for the period 1973-1987 for multiple myeloma and malig- nant plasmacytoma are shown in Table 2. Note that be- fore 1986, a diagnosis of plasmacytoma not specifically stated to be malignant (plasmacytoma, not otherwise specified [NOS]) was not reportable to the SEER pro- gram. However, beginning in 1986, a diagnosis of plas- macytoma NOS was aisumed to be malignant and, therefore, reportable to SEER. This resulted in a sharp increase in this category during the last period of the study (see the fbotnote in Table 2).
The other lymphoreticular neoplasms are divided into several categories. With the exception of malignant histiocytosis, each of these categories includes a rela- tively small number of patients. The frequencies and percent distribution by histologic type and sex for other lymphoreticular neoplasms are shown in Table 3 .
Results
General Trends of the Leukemias
There were data on 31,850 patients with all types of leukemia. The age-adjusted male-to-female ratio was approximately 1.7:l. Racial groups were whites (88.7% of patients), blacks (6.7%), and various ethnic groups identified as "others" (4.6%). The median patient age at diagnosis was 66 years.
The age-adjusted incidence rate of all categories of leukemia combined for the entire population decreased
slightly during the 15 years of data collection, from 10.1 to 9.6 per 100,000 (10.4 to 9.8 for whites and 8.8 to 8.6 for blacks). This apparent downward trend was ob- served for all types of leukemia except myeloid leuke- mias in the black population, especially black males, and acute lymphoid leukemia in the general popula- tion. In the 1983-1987 reporting period, the age-ad- justed incidence rate was much higher for white and black males (13.0 and 11.2 per 100,000) than for white and black females (7.5 and 6.8 per 100,000).
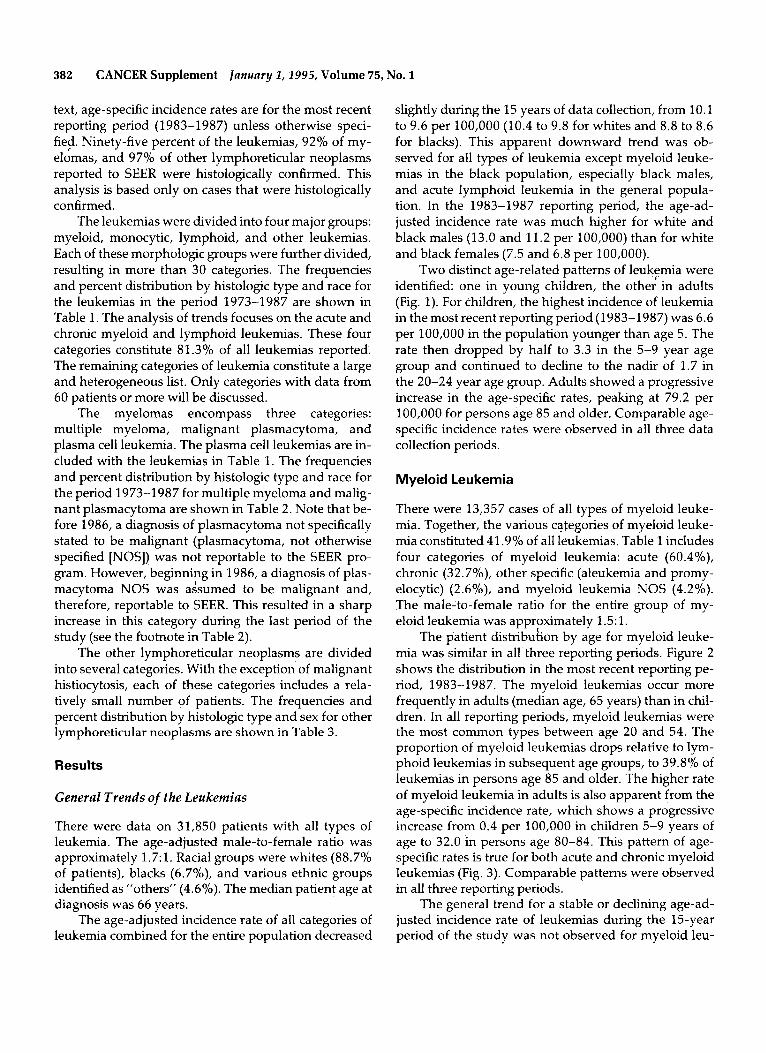
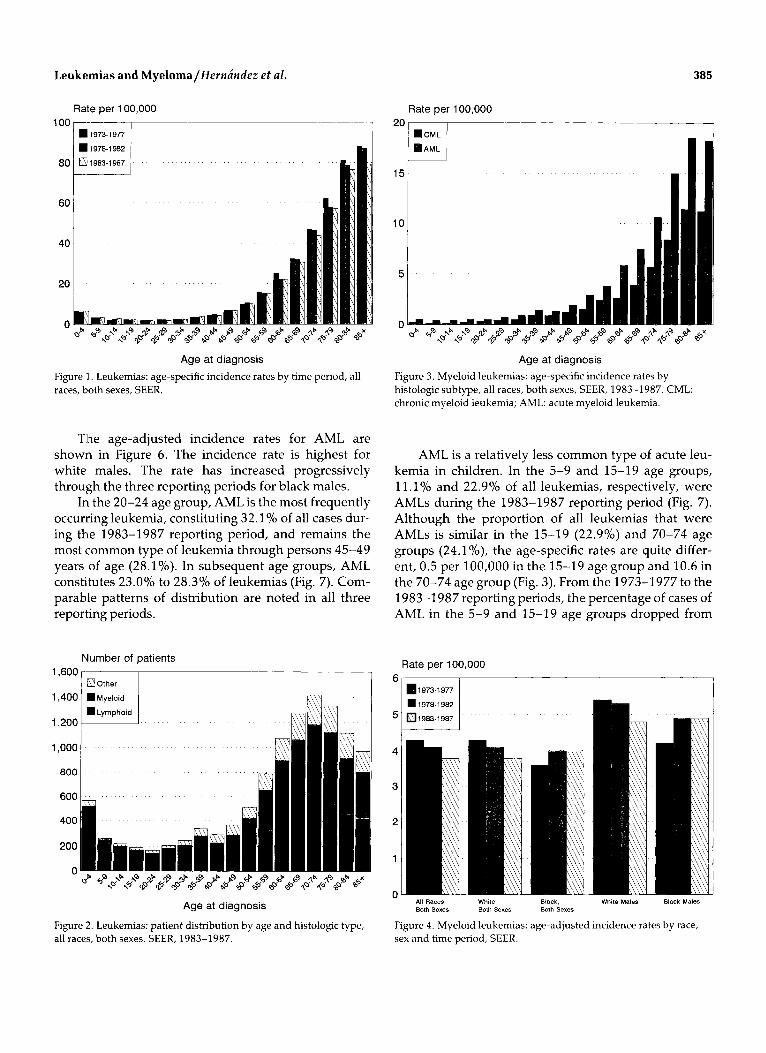
Two distinct age-related patterns of leukemia were identified: one in young children, the othe; in adults (Fig. 1). For children, the highest incidence of leukemia in the most recent reporting period (1983-1987) was 6.6 per 100,000 in the population younger than age 5. The rate then dropped by half to 3.3 in the 5-9 year age group and continued to decline to the nadir of 1.7 in the 20-24 year age group. Adults showed a progressive increase in the age-specific rates, peaking at 79.2 per 100,000 for persons age 85 and older. Comparable age- specific incidence rates were observed in all three data collection periods.
Myeloid Leukemia
There were 13,357 cases of all types of myeloid leuke- mia. Together, the various Categories of myeloid leuke- mia constituted 41.9% of all leukemias. Table 1 includes four categories of myeloid leukemia: acute (60.4%), chronic (32.7%), other specific (aleukemia and promy- elocytic) (2.6%), and myeloid leukemia NOS (4.2%). The male-to-female ratio for the entire group of my- eloid leukemia was approximately 1.5: 1.
The patient distribution by age for myeloid leuke- mia was similar in all three reporting periods. Figure 2 shows the distribution in the most recent reporting pe- riod, 1983-1987. The myeloid leukemias occur more frequently in adults (median age, 65 years) than in chil- dren. In all reporting periods, myeloid leukemias were the most common types between age 20 and 54. The proportion of myeloid leukemias drops relative to lym- phoid leukemias in subsequent age groups, to 39.8% of leukemias in persons age 85 and older. The higher rate of myeloid leukemia in adults is also apparent from the age-specific incidence rate, which shows a progressive increase from 0.4 per 100,000 in children 5-9 years of age to 32.0 in persons age 80-84. This pattern of age- specific rates is true for both acute and chronic myeloid leukemias (Fig. 3) . Comparable patterns were observed in all three reporting periods.
The general trend for a stable or declining age-ad- justed incidence rate of leukemias during the 15-year period of the study was not observed for myeloid leu-

Leukemias and Myeloma/Hernhndez et al. 383
Table 1.. Leukemias (M-9800-9949): Frequencies and Percent Distribution by Histology and Race, Both Sexes, Microscopically Confirmed Cases, SEER 1973-87
All races White Black
Histology* Frequency Yo Frequency % Frequency YO
Leukemias Lymphoid
Acute (9821,9822) Chronic (9823) Other specific
Prolymphocytic (9825)t Aleukemic (9824)
Lymphoid leukemia, NOS (9820) Myeloicl (Granulocytic) (Myelogenous)
Acute (9861,9862,9867) Chronic (9863, 9868) Other specific (aleukemic, promyelocytict)
(9864,9866) Myeloid leukemia, NOS (9860)
Acute (9891,9892) Chronic (9893) Aleultemic (9894) Monocytoid leukemia, NOS (9890)
Other acute leukemias
Monocytic
Other leukemias
Acute erythremia (9841) Acute panmyelosis (9931)$ Acute leukemia, NOS (9801,9802,9932)
Chronic erythremia (9842) Chronic leukemia, NOS (9803)
Other specific types of leukemia Aleukemic, NOS (9804) Compound (9810) Plasma cell (9830) Erythroleukemia, NOS (9840) Basophylic (9870) Ensinophilic (9880) Lymphosarcoma cell leukemia (9850) Neutrophilic (9865)t Mast cell leukemia (9900) Megakaryoblastic (9910, 9920) Hairy cell leukemia (9940)t Myeloid sarcoma (9930)
Other chronic leukemias
Leukemia, NOS (9800)
31,850 13,880 3,735 9,737
102 76 26
306 13,357
8,076 4,368
350
563 823 666
63 6
88 3,790 1,672
136 1
1,535 73
6 67
1,537 83
7 61
379 4
17 207
4 0
64 657
54 508
100.0 43.6 11.7 30.6
0.3 0.2 0.1 1.0
41.9 25.4 13.7
1.1
1.8 2.6 2.1 0.2 0.0 0.3
11.9 5.2 0.4 0.0 4.8 0.2 0.0 0.2 4.8 0.3 0.0 0.2 1.2 0.0 0.1 0.6 0.0
0.2 2.1 0.2 1.6
-
28,271 12,512 3,182 8,967
93 70 23
270 11,636
7,070 3,768
305
493 728 589
57 5
77 3,395 1,506
123 1
1,382 66
5 61
1,372 76 5
54 324
3 13
180 3 0
51 61 7
46 45 1
100.0 2,129 44.3 840 11.3 227 31.7 583
0.3 4 0.2 2 0.1 2 1.0 26
41.2 992 25.0 530 13.3 390 1.1 30
1.7 42 2.6 55 2.1 41 0.2 4 0.0 1 0.3 9
12.0 242 5.3 101 0.4 5 0.0 0 4.9 96 0.2 5 0.0 1 0.2 4 4.9 99 0.3 5 0.0 2 0.2 7 1.1 36 0.0 1 0.0 3 0.6 15 0.0 1
0 0.2 4 2.2 19 0.2 6 1.6 37
-
100.0 39.5 10.7 27.4 0.2 0.1 0.1 1.2
46.6 24.9 18.3
1.4
2.0 2.6 1.9 0.2 0.0 0.4
11.4 4.7 0.2
4.5 0.2 0.0 0.2 4.7 0.2 0.1 0.3 1.7 0.0 0.1 0.7 0.0
0.2 0.9 0.3 1.7
-
-
SEER Surveillance, Epidemiology, and End Results. * Contents of groups are based on ICD-0. Numbers in parentheses are ICD-0 histology codes. t Before 1977, incorporated in Leukemia, NOS (9800). $ Before 1986, not reportable except when designated as malignant.
kemia in the black population. For the total black pop- ulation, there was a small increase in the age-adjusted incidence rate, from 3.6 per 100,000 in 1973-1977 to 4.0 in 1978-1982 and 1983-1987 (Fig. 4), mostly due to
an increase in acute myeloid leukemias. Concurrently, there was a decrease from 4.3 per 100,000 to 3.8 in the general population. The largest increase was observed in black males, for whom the age-adjusted incidence

384 CANCER Supplement January 2,2995, Volume 75, No. 1
Table 2. Myeloma (M-9730-9731): Frequencies and Percent Distribution by Histology and Race, Both Sexes, Microscopically Confirmed Cases, SEER 1973-87
All races White Black
Histology* Frequency YO Frequency YO Frequency %
Myeloma 12,237 100.0 9,947 100.0 1,771 100.0
Plasmacytoma, NOS (9731)t 259 2.1 227 2.3 21 1.2 Buccal cavity 17 0.1 16 0.2 1 0.1 Digestive tract 13 0.1 12 0.1 1 0.1 Respiratory 12 0.1 11 0.1 0
Multiple myeloma (9730) 11,978 97.9 9,720 97.7 1,750 98.8
- Bone marrow and other hematopoietic 123 1.0 100 1.0 16 0.9 Bones 61 0.5 57 0.6 3 0.2 Soft tissues 15 0.1 15 0.2 0 Other sites 18 0.1 16 0.2 0
-
-
SEER: Surveillance, Epidemiology, and End Results. * Contents of groups are based on ICD-0. Numbers in parentheses are ICD-0 histology codes. t Before 1986, not reportable except when designated as maglinant.
rate rose from 4.2 per 100,000 to 4.9, while there was a decline from 5.4 per 100,000 to 4.8 for white males. The age-adjusted incidence rates for white and black males in the most recent reporting period (1983-1987) were similar, 4.8 and 4.9, respectively.
The age-specific incidence rates of myeloid leuke- mia in the white male population showed a progressive increase with each age group. They were similar in the three reporting periods; the rates for 1983-1987 are shown in Figure 5. For black males, the age-specific rates of myeloid leukemia were more variable during the three reporting periods (Fig. 5). There was an in- creased incidence rate of myeloid leukemia in black
males in the most recent reporting period (1983-1987), primarily in the geriatric population. Despite this in- crease, the rate for all leukemias combined has declined slightly for the total black population, from the first to the most recent reporting period, 8.8 to 8.6 per 100,000.
Acute Myeloid Leukemia
There were 8076 cases of acute myeloid leukemia (AML), which constituted 25.3% of all leukemias and 60.4% of myeloid leukemia. The male-to-female ratio was approximately 1.5:l. The median age at diagnosis was 65 years.
Table 3. Other Lymphoreticular Neoplasms (M-9720-9723,9740-9741,9950-9970): Frequencies and Percent Distribution by Histology and Sex, All Races, Microscopically Confirmed Cases, SEER 1973-87
Both sexes Male Female
Histology* Frequency % Frequency % Frequency %
Other lymphoreticular neoplasms 321 100.0 178 100.0 143 100.0 Miscellaneous reticuloendothelial
neoplasms 264 82.2 147 82.6 117 81.8 Malignant histiocytosis (9720,9721) 240 74.8 131 73.6 109 76.2 Letterer-Siwe’s disease (9722) 24 7.5 16 9.0 8 5.6
Mast cell tumors (9740-9741) 20 6.2 10 5.6 10 7.0
Other sites 18 5.6 8 4.5 10 7.0
- 0 - 0 - True histiocytic lymphoma (9723) 0
Bone marrow and other hematopoietic 2 0.6 2 1.1 0 -
Malignant myeloproliferative and lymphoproliferative disorders (9950-9970) 37 11.5 21 11.8 16 11.2
SEER: Surveillance, Epidemiology, and End Results. * Contents of erouus are based on ICD-0. Numbers in Darentheses are ICD-0 histolow codes
Leukemias and MyelomalHernhndez et al.
Rat(e per 100,000
1973-1 977
1978-1 982
Age at diagnosis
Figure 1. Leukemias: age-specific incidence rates by time period, all races, both sexes, SEER.
Tlhe age-adjusted incidence rates for AML are shown in Figure 6. The incidence rate is highest for white males. The rate has increased progressively through the three reporting periods for black males.
Irt the 20-24 age group, AML is the most frequently occurring leukemia, constituting 32.19'0 of all cases dur- ing the 1983-1987 reporting period, and remains the most common type of leukemia through persons 45-49 years of age (28.1%). In subsequent age groups, AML constitutes 23.0% to 28.3% of leukemias (Fig. 7). Com- parable patterns of distribution are noted in all three reporting periods.
Number of patients
Other
=Lymphoid
1,600
1,200
Age at diagnosis
Figure 2. Leukemias: patient distribution by age and histologic type, all races, both sexes, SEER, 1983-1987.
Rate per 100,000 2or 15
i
385
Age at diagnosis Figure 3. Myeloid leukemias: age-specific incidence rates by histologic subtype, all races, both sexes, SEER, 1983-1987. CML: chronic myeloid leukemia; AML: acute myeloid leukemia.
AML is a relatively less common type of acute leu- kemia in children. In the 5-9 and 15-19 age groups, 11.1% and 22.9% of all leukemias, respectively, were AMLs during the 1983-1987 reporting period (Fig. 7). Although the proportion of all leukemias that were AMLs is similar in the 15-19 (22.9%) and 70-74 age groups (24.1%), the age-specific rates are quite differ- ent, 0.5 per 100,000 in the 15-19 age group and 10.6 in the 70-74 age group (Fig. 3). From the 1973-1977 to the 1983-1987 reporting periods, the percentage of cases of AML in the 5-9 and 15-19 age groups dropped from
Rate per 100,000
1973-1 977
1978-1 982
1983-1987
All Races, White, Black, White Males Black Males Both Sexes Both Sexes Both Sexes
Figure 4. Myeloid leukemias: age-adjusted incidence rates by race, sex and time period, SEER.

386 CANCER Supplement January 1,1995, Volume 75, No. 1
Rate per 100,000 70
UBlack 1973-1977
60 mBlack 1978-1982
BBIack 1983-1987
40
Age at diagnosis Figure 5. Myeloid leukemias: age-specific incidence rates by race and time period, male, SEER.
14.3% to 11.1% and 30.3% to 22.9%, respectively. This explains much of the overall decrease in the proportion of AML between these reporting periods from 26% to 24.7% of total leukemias in the general population.
The 5-year relative survival rate for AML was poor and improved only slightly, from 6.1% in 1973-1977 to 9.4% in 1983-1987.
Chronic Myeloid Leukemia
There were 4368 cases of chronic myeloid leukemia (CLL), constituting 13.7% of all leukemias and 32.7%
Rate per 100,000
Percent
'ALL 1973-1977
*ALL 1983-1987
* AML 1973-1 977
AML 1983-1 987
V A L , NOS 1973-1977
+AL. NOS 1983.1987
Age at diagnosis Figure 7. Leukemias: percentage of all leukemias for acute lymphoid leukemia (ALL), acute myeloid leukemia (AML), and acute leukemia NOS (AL, NOS) by age and time period, all races, both sexes, SEER.
of myeloid leukemias. The male-to-female ratio was ap- proximately 1.7: 1. The median age at diagnosis was 65 years.
The age-adjusted incidence rates for CML are shown in Figure 8. The rates have remained relatively stable during the three reporting periods. They are slightly higher for blacks than for whites and consider- ably higher for males than for females.
The age distribution of the CML patient population is similar to the pattern for the entire group of myeloid leukemias. Adults predominate, as illustrated in Figures
Rate per 100,000 2
1.5
1
0.5
n All Rams. White. Black. All Racsr, White Males Black Males Both Sexes Both Sex#* Both Sexes Male
Figure 6 . Acute myeloid leukemia: age-adjusted incidence rates by
- All Races, White. Black. All Races, All Races. Both Sexes Both Sexes Both Sexes Male Female
Figure 8. Chronic mveloid leukemia: age-adjusted incidence rates by Y - ,
race, sex and time period, SEER. race, sex and time period, SEER.

Leukemias and Myeloma/Hernandez et al. 387
Percent
* CLL 1983-1 987
+CML 1983-1987
Age at diagnosis Figure 9 Leukemias: percentage of all leukemias for chronic lymphoid leukemia (CLL) and chronic myeloid leukemia (CML) by age and time period, all races, both sexes, SEER.
3 and 9, which show the percentage of all leukemias that are CMLs and the age-specific incidence rates. For clarity, only the first (1973-1977) and the most recent (1983-1987) reporting periods are shown in Figure 9; the age distribution is similar for the 1978-1982 report- ing period. In 1983-1987, the 45-49 age group was the youngest in which the age-specific incidence rate for CML exceeded 1.0 per 100,000; CML constituted 18.6% of all lleukemias reported in this group. The age groups that follow show an incremental increase in the age- specific rate, progressing to a maximum rate of 11.4 per 100,000 in the 80-84 age group.
The 5-year relative survival rate for patients with CML was 21.3-25.6% during the three reporting peri- ods.
Other Specific Myeloid Leukemias: Aleukemic and Prom yelocytic
In this category, 350 cases were reported, representing 1.1% of all leukemias and 2.6% of myeloid leukemia. The median age at diagnosis was 57 years. The patients were predominantly adults. The first recorded age-spe- cific incidence rate above 0.1 per 100,000 was in the 30- 34 age group (0.2). The highest rate, 0.5, was in the 80- 84 group. Because of the scarcity of patients in this cat- egory, data for the 5-year relative survival rate is rele- vant only to the white population. An improvement in the 5-year relative survival rate was observed in whites, both sexes, from 9.5% in 1978-1982 to 24.3% in 1983- 1987.
Myeloid Leukemia NOS
There were 563 cases of myeloid leukemia NOS, repre- senting 1.8% of all leukemias and 4.2% of myeloid leu- kemia. The median age was 73 years, and the 5-year relative survival rate was 9.5% (1978-1986 period). These data most closely approximate those for AML.
Monocytic Leukemia
There were 823 cases in this cytologic group of leuke- mias, which constituted 2.6% of all leukemias; most were acute monocytic leukemias. The male-to-female ratio was approximately 1.7: 1. The median age at diag- nosis was 66 years.
The monocytic leukemias were divided into four categories: acute (8l%), chronic (7.6%), aleukemic (0.7%), and monocytic leukemia NOS (10.6%). The small number of patients in the latter three categories negated further analysis.
There were 666 cases of acute monocytic leukemia, representing 2.1% of all leukemias and 80.9% of the monocytic leukemias. The male-to-female ratio was ap- proximately 1.6: 1. The median age at diagnosis was 65 years. During the 1983-1987 reporting period, the age- adjusted incidence rate for both sexes, all races, was 0.2 per 100,000; 0.2 for males and 0.2 for females. There was no notable difference in the rates by race. The age- specific incidence rates were low in all age groups. The highest rate, 2.0 per 100,000, was in the 80-84 age group. Age-specific incidence rates increased with age, similar to the rates for AML. The 5-year relative survival rate was 7.2% for the 1983-1987 reporting period.
Lymphoid Leukemia
There were 13,880 cases of lymphoid leukemia, which comprised four categories: acute (27%), chronic (70%), other specific (prolymphocytic and aleukemic) (0.7%), and lymphoid leukemia NOS (2.2%) (Table 1). The lymphoid leukemias constituted 43.6% of all leuke- mias. The male-to-female ratio was approximately 1.8: 1. The median age at diagnosis was 66 years. There was a marked difference in the age distribution of acute lym- phoid leukemia (median age, 10 years) and chronic lymphoid leukemia (median age, 70 years) (Fig. 10).
Acute Lymphoid Leukemia
There were 3735 cases of acute lymphoid leukemia (ALL), constituting 11.7% of all leukemias and 26.9% of lymphoid leukemias. The male-to-female ratio was 1.4: 1. The median age at diagnosis was 10 years.

388 CANCER Supplement January 2,2995, Volume 75, No. 1
Rate per 100,000
25
Age at diagnosis
Figure 10. Lymphoid leukemias: age-specific incidence rates by histologic subtype, all races, both sexes, SEER, 1983-1987. CLL: chronic lymphoid leukemia; ALL: acute lymphoid leukemia.
The age-adjusted incidence rate among the black population was approximately half that of the white population in all three reporting periods. In the most recent period, 1983-1987, the age-adjusted rate was 0.8 per 100,000 for blacks and 1.5 for whites (Fig. 11). There was a slight increase in the age-adjusted inci- dence rates of ALL in each progressive reporting period: 1.2 per 100,000 in 1973-1977, 1.3 in 1978-1982, and 1.4 in 1983-1987. This progressive increase parallels an overall increase in the percentage of total leukemias that are ALLs. The proportion of ALL cases rose form the
Rate per 100,000 2 ,
1973-1 977
1978-1 982
1983-1 987
Both SU., Both Sex.. Both S.X.. L I d S
Figure 11. Acute lymphoid leukemia: age-adjusted incidence rates by race, sex and time period. SEER.
Rate per 100,000
1973-1 977
1978-1 982
[Ty 1983-1987
All Races, White, Black, All Races, All Racer, Both Sexes Both Sexes Both Sexes Male Female
Figure 12. Chronic lymphoid leukemia: age-adjusted incidence rates by race, sex and time period, SEER.
1973-1977 to the 1983-1987 reporting period in the 5- 9, 15-19, and 20-24 age groups, from 69.2%, 44.570, and 20.0% to 8l.6%, 55.3%0, and 31.5%, respectively (Fig. 7).
In the 1983-1987 reporting period, 63.8% of cases of ALL were in patients younger than 19 years of age. The age-specific incidence rate in children younger than age 5 was 5.3 per 100,000, the highest rate of ALL for any age group (Fig. 10). The age-specific rate drops to 0.5 in the 20-24 age group and remains below 1.0 until the 65-69 age group, then increases with age to 2.3 per 100,000 for persons 80-84 years of age. Despite the in- creased incidence rate in very old persons, ALL is still a relatively rare disorder in this age group, representing only 3.2% of all leukemias. There was minor variability in the age-specific incidence rates in the three reporting periods, but the age distribution remained relatively constant.
The 5-year relative survival for patients with ALL increased from 39.1% (1973-1977) to 51.3% (1978- 1982) and 49.7% (1983-1987).
Chronic Lymphoid Leukemia
There were 9737 cases of chronic lymphoid leukemia (CLL), constituting 30.6% of all leukemias and 70.2% of lymphoid leukemias. The male-to-female ratio was approximately 1.7: 1. The median age at diagnosis was 70 years.
There was a progressive decrease in incidence rate of CLL over the three reporting periods. The age-ad- justed rates are shown in Figure 12. The rate for males,

Leukemias and Myeloma/Hernhfez et al . 389
all races, in the three reporting periods was 4.4-3.9 per 100,000, which is twice that for females, 2.2-1.9.
Chronic lymphoid leukemia was the most preva- lent chronic leukemia in persons older than 40 years (Fig. 3). The predilection for older adults is reflected in the graph on age-specific incidence rates shown in Fig- ure 10. The earliest recording of CLL in the 1983-1987 reporting period is in the 35-39 age group, in which the incidence rate is 0.3 per 100,000. The age groups that follow show a progressive increase in incidence. In the 45-49 age group, the rate increases to 1.3, then more than doubles for the 50-54 age group to 2.9 and contin- ues to increase to 30.6 per 100,000 in persons older than 85 years of age. The pattern for the age-specific inci- dence of CLL is similar in all three reporting periods. In 1983-1987, cases of CLL increased from 2.09'0 of all leukemias in the 30-34 age group to 41.2% in the 70- 74 age group (Fig. 3).
The 5-year relative survival rate remained stable during the time of the study, 66.7% in 1973-1977 and 64.7% in each of the two most recent reporting periods.
Other Leukemias
There were 3790 cases of "other" leukemias, constitut- ing 11.9% of all leukemias reported. The male-to-fe- male ratio was 2: 1. The other leukemias are subdivided into four groups with the number of patients in each group given in parentheses: other acute leukemias (1672), other chronic leukemias (73), other specific types of leukemia (1537), and leukemia NOS (508).
Other Acute Leukemias
There were 1672 patients in this group, representing 5.2% of all leukemias. Other acute leukemias was di- vided into three categories: acute erythremia (136 pa- tients), acute panmyelosis (1 patient), and acute leuke- mia NOS (1535 patients).'
Acute erythremia. The 136 cases of acute erythre- mia accounted for 8.1% of other acute leukemias and 0.4% of all leukemias. The median age at diagnosis was 69 years. The age, race, and survival data for acute erythremia approximate those of AML.
Acute leukemia NOS. The 1535 cases diagnosed as acute leukemia NOS amounted to 91.8% of other acute leukemias and 4.8% of all leukemias. The male- to-fem.ale ratio was 1.8: 1. The median age at diagnosis was 67 years. The age-adjusted incidence rate for all races, both sexes, increased from 0.4 to 0.6 per 100,000 over the period of study. There was no notable differ- ence in the rates by race; the rate was higher for males than for females.
There was a steady increase in the total number and percentage of all leukemias that were designated acute leukemia NOS by reporting period: 377 (3.9%) in 1973- 1977, 479 (4.5%)in 1978-1982, and 679 (6%) in 1983- 1987. There was a concomitant decline in the number and percentage of pediatric patients (younger than 19 years of age) with acute leukemia NOS (Fig. 7). During the 1973-1977period, 199of 1153(10.3%)casesofleu- kemia in pediatric patients were diagnosed as acute leu- kemia NOS, whereas in the 1983-1987 reporting pe- riod, only 39 of 1234 (3.2%) pediatric leukemias were acute leukemia NOS.
The 5-year relative survival rate for this group de- clined in each progressive reporting period, from 19.9%
1987). (1973-1977) to 9.5% (1978-1982) to 8.4% (1983-
Other Chronic Leukemias
This group included 73 patients and represented 0.2% of all leukemias. It is subdivided into two categories: chronic leukemia NOS (67 patients) and chronic erythremia (6 patients). Only chronic leukemia NOS will be briefly commented on.
The chronic leukemia NOS category included only 0.2% of all leukemias. The median age at diagnosis was 74 years. The 5-year relative survival was 51.6% (1978- 1986). The data for chronic leukemia NOS most closely approximate those for CLL, in which the median age was 70 years and the relative survival rate was 64.7%; the data are distinct enough, however, to suggest that chronic leukemia NOS is a subgroup of CLL or a het- erogeneous group of chronic leukemias.
Other Specific Types of Leukemia
This group included 1537 cases and represented 4.8% of all leukemias. It is subdivided into 12 categories. Only categories with 60 or more patients will be men- tioned briefly. Plasma cell leukemia, which was in- cluded in this group, is discussed below with myeloma.
Aleukemia NOS. There were 83 cases in this cate- gory, representing 0.3% of all leukemias. The median age at diagnosis was 77 years. The 5-year relative sur- vivalrate was 4.5% (1978-1986). These figures aremost consistent with a variant of AML.
Erythroleukemia, NOS. There were 379 cases of erythroleukemia NOS, representing 1.2% of all leuke- mias. The median age was 69 years at diagnosis; the 5- year relative survival rate was 9.7% (1978-1986). These data are similar to those for AML.
Lymphosarcoma cell leukemia. There were 207 cases designated as lymphosarcoma cell leukemia, ac-

390 CANCER Supplement Junuury 1,1995, Volume 75, No. 1
Rate per 100,000 .-
1973.1 977
1978-1 982
8 [TY1983-1987 1 6
" All Races. All Raoea, Whits Males While Females Black Males 8lask Females Male Female
Figure 13. Multiple myeloma: age-adjusted incidence rates by race, sex and time period, SEER.
counting for 0.6% of all leukemias. The median age at diagnosis was 66 years. The 5-year relative survival rate was 27.5% (1978-1986). The number of cases reported as lymphosarcoma cell leukemia declined form 125 in 1973-1977 to 54 in 1978-1982 to 28 in 1983-1987.
Megakaryoblastic. Sixty-four cases were diag- nosed as megakaryoblastic leukemia which comprised 0.2% of all leukemias. The median age at diagnosis was 65 years. The 5-year relative survival rate was 44.8%
Hairy cell leukemia. There were 657 patients with hairy cell leukemia, 2.1 % of all leukemias. The male-to- female ratio was approximately 3.3:l; 72.6% of patients were white males, whereas 2.3% were black males. The median age at diagnosis was 59 years. The age-adjusted incidence rate for all races, both sexes, in the 1983-1987 reportingperiod was 0.2 per 100,000: 0.3 for whites, 0.1 for blacks, 0.4 for males, and 0.1 for females. The age- specific incidence rate was less than 0.1 in all age groups younger than 40; in persons age 40 and older, the rate ranged from 0.1 (age 40-44) to 0.5 (age 85+). The 5- year relative survival rate was 67.8% (1978-1986).
(1978-86).
Leukemia NOS
There were 508 cases designated as leukemia NOS, constituting 1.6% of all leukemias. The median age was 71 years, and the 5-year relative survival rate was 23.7% (1 9 78- 19 86).
Myeloma
The myeloma group comprised multiple myeloma (97.9%), malignant plasmacytoma (2.1%), and plasma
cell leukemia (0.5%). The male-to-female ratio for the entire group was approximately 1.4:l. Whites ac- counted for 8l.2%, blacks 14.4%, and others, 4.4% of patients. The frequency and percent distribution by his- tologic site and race in the period 1973-1987 for multiple myeloma and plasmacytoma are shown in Ta- ble 2. The data for plasma cell leukemia are provided in Table 1.
Multiple Myeloma
There were 11,978 patients with multiple myeloma. The male-to-female ratio was approximately 1.4:l. The median age at diagnosis was 69 years. The age-adjusted incidence rate of multiple myeloma was relatively sta- ble during the 15 years of the study, except for a slight increase among black males, as illustrated in Figure 13.' The incidence rate in the black population, both sexes, was between 7.6 and 7.8 per 100,000 in the three re- porting periods, which was more than twice that in whites, which was 3.3-3.4 per 100,000. This difference among racial groups was observed in all three reporting periods for males and females. There is a markedly higher incidence rate for males than for females, which prevails in all three reporting periods for the black and white populations.
More than 93% of patients were 50 years of age or older. In the most recent reporting period (1983-1987), the age-specific incidence rate increased progressively, from 0.2 per 100,000 in the 30-34 age group to 32.5 in the 80-84 age group (Fig. 14). Only six cases were reported in persons younger than age 25 during the 15
Rate per 100,000 35 I
25
20
15
10
5
n
Age at diagnosis
Figure 14. Multiple myeloma: age-specific incidence rates by time period, all races, both sexes, SEER.
Leukemias and Myeloma/Herna’ndez et al. 391
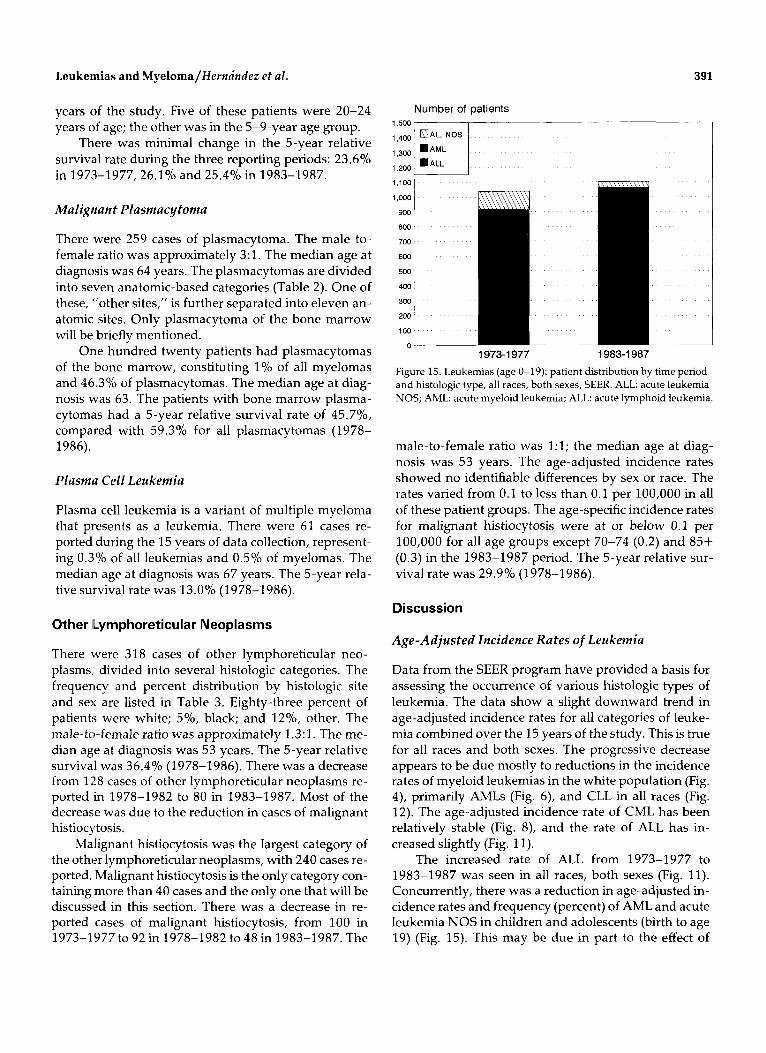
years of the study. Five of these patients were 20-24 years of age; the other was in the 5-9-year age group.
There was minimal change in the 5-year relative survival rate during the three reporting periods: 23.6% in 1973-1977, 26.1% and 25.4% in 1983-1987.
Malignant Plasmacytoma
There were 259 cases of plasmacytoma. The male-to- female ratio was approximately 3:l. The median age at diagnosis was 64 years. The plasmacytomas are divided into seven anatomic-based categories (Table 2). One of these, “other sites,” is further separated into eleven an- atomic sites. Only plasmacytoma of the bone marrow will be briefly mentioned.
One hundred twenty patients had plasmacytomas of the bone marrow, constituting 1% of all myelomas and 46.3% of plasmacytomas. The median age at diag- nosis was 63. The patients with bone marrow plasma- cytomas had a 5-year relative survival rate of 45.7%, compared with 59.3% for all plasmacytomas (1978- 1986).
Plasma Cell Leukemia
Plasma cell leukemia is a variant of multiple myeloma that prlesents as a leukemia. There were 61 cases re- ported during the 15 years of data collection, represent- ing 0.3% of all leukemias and 0.5% of myelomas. The median age at diagnosis was 67 years. The 5-year rela- tive survival rate was 13.0% (1978-1986).
Other llymphoreticular Neoplasms
There were 318 cases of other lymphoreticular neo- plasms, divided into several histologic categories. The frequency and percent distribution by histologic site and sex are listed in Table 3. Eighty-three percent of patients were white; 5’30, black; and 12%, other. The male-to-female ratio was approximately 1.3: 1. The me- dian age at diagnosis was 53 years. The 5-year relative survival was 36.4% (1978-1986). There was a decrease from 128 cases of other lymphoreticular neoplasms re- ported in 1978-1982 to 80 in 1983-1987. Most of the decrease was due to the reduction in cases of malignant histiocytosis.
Malignant histiocytosis was the largest category of the other lymphoreticular neoplasms, with 240 cases re- ported. Malignant histiocytosis is the only category con- taining more than 40 cases and the only one that will be discussled in this section. There was a decrease in re- ported cases of malignant histiocytosis, from 100 in 1973-1977 to 92 in 1978-1982 to 48 in 1983-1987. The
Number of patients 1,500
1,400
1,300
1,200
1,100
1,000
900
800
7 w
600
500
400
300
ZOO
1w 0
1973-1 977 1983-1 987 Figure 15. Leukemias (age 0-19): patient distribution by time period and histologic type, all races, both sexes, SEER ALL acute leukemia NOS; AML: acute myeloid leukemia; ALL: acute lymphoid leukemia
male-to-female ratio was 1:l; the median age at diag- nosis was 5 3 years. The age-adjusted incidence rates showed no identifiable differences by sex or race. The rates varied from 0.1 to less than 0.1 per 100,000 in all of these patient groups. The age-specific incidence rates for malignant histiocytosis were at or below 0.1 per 100,000 for all age groups except 70-74 (0.2) and 85+ (0.3) in the 1983-1987 period. The 5-year relative sur- vival rate was 29.9% (1978-1986).
Discussion
Age-Adjusted Incidence Rates of Leukemia
Data from the SEER program have provided a basis for assessing the occurrence of various histologic types of leukemia. The data show a slight downward trend in age-adjusted incidence rates for all categories of leuke- mia combined over the 15 years of the study. This is true for all races and both sexes. The progressive decrease appears to be due mostly to reductions in the incidence rates of myeloid leukemias in the white population (Fig. 4), primarily AMLs (Fig. 6), and CLL in all races (Fig. 12). The age-adjusted incidence rate of CML has been relatively stable (Fig. 8), and the rate of ALL has in- creased slightly (Fig. 11).
The increased rate of ALL from 1973-1977 to 1983-1987 was seen in all races, both sexes (Fig. 11). Concurrently, there was a reduction in age-adjusted in- cidence rates and frequency (percent) of AML and acute leukemia NOS in children and adolescents (birth to age 19) (Fig. 15). This may be due in part to the effect of

392 CANCER Supplement January 1,1995, Volume 75, No. 1
newer technologies on the classification of acute leuke- m i a ~ . ~ , ~ The availability of new techniques for charac- terization of poorly differentiated acute leukemias (e.g., immunophenotyping) has increased in the most recent reporting period^.^,^ The refinements in diagnostic ca- pabilities may have improved recognition of cases of ALL that would have been classified differently (e.g., acute leukemia NOS) in earlier reporting periods.
The age adjusted male-to-female ratio for all leuke- mias combined was approximately 1.7:l. It varied for the major groups from 1.7:l for CLL and CML to 1.5: 1 for AML and 1.4:l for ALL. The most striking male prevalence was in hairy cell leukemia; 77.6% of patients were male. The age adjusted male-to-female ratio was 3.3:l overall but was 4:l in the two most recent report- ing periods. The age-adjusted incidence rate of all cate- gories combined and for each of the major categories of leukemia was much higher for males than for females. The difference was most impressive for CLL, in which the age-adjusted incidence rate for males was approxi- mately twice that for females in all reporting periods (Fig. 12).
There are a few notable differences in the incidence rates of leukemias between blacks and whites. One of these is the age-adjusted incidence rate of all leukemias combined, whites having a higher incidence rate in all three data collection periods. There was a marked difference in the age-adjusted incidence rates of ALL, with whites having nearly twice the rate of blacks (1.5 vs. 0.8 per 100,000) (Fig. 11). The difference was most impressive among males. The incidence rate of CLL is only slightly higher in the white population. There was a slight decrease in the rates of both AML and CML in whites during the span of the study and an increase in AML among blacks, particularly among black males (Fig. 6). A distinct difference in incidence rates between races was identified in the first reporting period for AML (1973-1977), but the rates nearly equalized in the most recent period (1 983-1 987).
Age-Specific Rates of Leukemia
The data from the SEER program have confirmed sev- eral widely held concepts about the age-specific inci- dence rates of leukemia. There are two distinct age-re- lated peaks for all categories of leukemia combined (Fig. 1). The first peak is in children younger than 5 years of age, after which the incidence rate progressively de- clines to a nadir in the 20-24 age group. This early peak is due to the relatively high age-specific incidence rate of ALL in children (Fig. 10). The second peak for all leukemias combined is in adults; it begins in the middle
30s age group and increases progressively through the 85+ group.
The age-specific incidence rate of AML is relatively low in the young age groups, showing little change through age 19. The chronic leukemias, particularly CLL, have very low rates in the first two decades of life. A steady progressive increase in age-specific incidence rate begins in the late 30s or early 40s for AML, CML (Fig. 3), and CLL (Fig. 10) and continues through the 80-84 age group. ALL also shows a rise in age-specific rates in the later decades after a steady rate from age 20-60.
Five-Year Relative Survival for Leukemias
The 5-year relative survival rate for ALL showed marked improvement from 1973-1977 to 1978-1982, increasing from 39.1% to 51%; it remained stable at 49.7% in 1983-1987. More effective chemotherapy treatment protocols, improved supportive therapy, and possibly expanded use of bone marrow transplantation for high risk cases have contributed to the increased survival rate.6
The 5-year relative survival rate data do not show impressive improvement for AML, CML, and CLL. However, newer therapeutic approaches have clearly affected the survival of select categories of patients within these major groups of leukemias in recent year^.^,^
The decline in the 5-year relative survival rate for patients with acute leukemia NOS, from 19.9% in 1973-1977 to 8.4% in 1983-1987, may relate to the cor- responding decrease in frequency (percent) of young patients in this category and to better methods of iden- tifying cases of ALL that may have been reported as acute leukemia NOS in the earliest reporting period (Fig. 15).
Factors Affecting Interpretation of SEER Data on Leukemia
The interpretations of the SEER data on leukemias are limited because of new classifications that have evolved during the time frame of the study and changes that have occurred in the use of some of the terminology. The morphologic classifications of leukemias used in the SEER program were mostly derived from the World Health Organization's International Histological Classi- fication of Tumors.* This classification scheme for leuke- mias is no longer widely used and has been largely re- placed by the French-American-British (FAB) Coopera- tive Group classifi~ations.~-'~
Several types of leukemias listed as separate cate-
Leukemias and Myeloma/Hernindez e t al. 393
gories in the SEER data would be classified as AML ac- cording to the FAB classification, including the follow- ing: acute monocytic, erythroleukemia, promyelocytic, and some of the cases in the categories of myeloid leu- kemias NOS, monocytic leukemia NOS, other acute leukemias, megakaryoblastic, and aleukemic. Cases that are included in these groups that would be classi- fied as AMLs by FAB criteria would, conservatively, in- crease the total number of AMLs by S-lO%. This figure, added to the 25.3% of leukemias that are designated AML in Table 1, provides an estimate of approximately 35% of the total leukemias that would be AML by FAB criteria. An approximation of the overall age-adjusted incidence rate using the FAB definition of AML can be obtained by adding the rates of the appropriate subcat- egories,.
The increased use of the designation "myelodys- plastic syndrome" has also affected data on leukemia in the more recent years of case rep~rting. '~ Some cases reported as AML with relatively low numbers of bone marrow myeloblasts in the early years of the study would now be considered myelodysplastic syndromes. This is also true of many cases of erythremia and pan- myelosis. The increased frequency in which the term "myelodysplastic syndrome" is used may partly explain the slight downward trend of the age-adjusted inci- dence rate of AML and leukemia in general from the 1973-3,977 to the 1983-1987 reporting periods (Fig. 6).
A similar explanation may be applied to the declin- ing age-adjusted incidence rate of CLL. Several recently describled chronic lymphoproliferative disorders were probably included with the CLLs in the early years of the SEER program.12
Finally, changes have occurred in how some histo- logic designations were used during the 15 years of data collection (1973-1987). These changes may have had a minor effect on the results. For example, the term "aleu- kemic" is no longer used to describe a specific category of leukemia but is a presenting manifestation of several types of acute leukemia. The term "prolymphocytic leu- kemia" was used at one time to describe a form of acute lymphocytic leukemia and is now used for a type of chronic lymphoproliferative d i s ~ r d e r . ~ , ' ~ , ~ ~ The desig- nation "lymphosarcoma cell leukemia" has largely been abandoned; cases formally classified as such would now be included in various other categories of leukemia or lymphoma.16 This is reflected by a prog- ressive decrease in cases reported as lymphosarcoma cell leukemia during the course of the study.
Myeloma
The SEER data largely confirm commonly held concepts about inultiple myeloma. The population distribution
of multiple myeloma corroborates well established pat- t e r n ~ . ' ~ , ' ~ The disease primarily afflicts older adults (Fig. 14). There has been a consistent age-specific frequency and percent distribution of cases. Greater than 90% of patients are older than age 50 at diagnosis (median age, 69 years). Age-adjusted rates show that there has not been a change in the incidence of multiple myeloma in the general population over the 15-year time period studied (Fig. 13). The rate among the black population, however, is more than twice that of whites for both males and females, and black males have experienced a slight increase in age-adjusted incidence rate. The rate is also markedly higher in males than in females.
There has not been a change in the 5-year relative survival rate of patients with multiple myeloma during the 15 years of the study. Most of the recent innovations in treatment that show promise to improve 5-year sur- vival were not used during the study time frame.19f20 The difference in relative 5-year survival for plasmacy- toma of bone marrow (45.7%), multiple myeloma (25.9%), and plasma cell leukemia 13% reflect the rec- ognized difference in aggressiveness and tumor load at presentation in these three manifestations of plasma cell neoplasms.
Because registry data cannot show how multiple myeloma and plasmacytoma in bone marrow were dis- tinguished by the hematopathologist, plasmacytoma of bone marrow might include both solitary plasmacy- toma of bone and focal lesions of disseminated my- eloma. However, the markedly better relative 5-year survival for plasmacytoma suggests that most cases in this category were localized (solitary) plasmacytomas at presentation. In most instances, solitary plasmacytoma of bone is an early manifestation of a neoplastic plasma cell dyscrasia that later progresses to multiple my- eloma.''
Other Lymphoreticular Neoplasms
Little can be said about the group of other lymphoretic- ular neoplasms. Only the category of malignant histio- cytosis contained more than 100 cases. Even the data on malignant histiocytosis is difficult to interpret in light of current views about the disorder. The validity of a diagnostic category of malignant histiocytosis is contro- versial. In recent years, many of the neoplasms that would have been designated "malignant histiocytosis" have been proven to be other disorders, such as ana- plastic large cell lymphoma and infection-associated hemophagocytic The more restrictive criteria for malignant histiocytosis are responsible for the sequential decrease in reported cases through the three reporting periods.

394 CANCER Supplement January 1,1995, Volume 7 5 , No. 1
References
1. Percy C. Introduction. Cancer 1994; 75:140-6. 2. Bitler MA, Beau MM, Rowly JD, Larson RA, Golomb HM, Var-
diman JW. Associations between morphology, karyotype, and clinical features in myeloid leukemias. Hum Pathol 1987; 18:
3. Second MIC Cooperative Study Group. Morphologic, immuno- logic and cytogenetic (MIC) working classification of acute my- eloid leukemias. Cancer Genet Cytogenet 1988;30(1):1-15. McKenna RW. A multifaceted approach to diagnosis and classi- fication of acute leukemia. Arch Pathol Lab Med 1991;115:328- 30.
5. Schumacher HR, Shrit MA, Kowal-Vern A, Dizikes G, Raduany RM, LeBean MM. Acute leukemia and related entities. Arch Pa- tho1 Lab Med 1991;115:331-7.
6. Forman SJ, Blume KG. Allogeneic bone marrow transplantation for acute leukemia. Hematol Oncol Clrn North Am 1990;4:517- 33. Snyder DS, McGlave PV. Treatment of chronic myelogenous leukemia with bone marrow transplantation. Hematol Oncol Clin North Am 1990;4:535-57.
8. Math; G, Rappaport H. Histological and cytological typing of neoplastic diseases of haematopoietic and lymphoid tissues. In- ternational Histological Classification of Tumors No. 14. Ge- neva: World Health Organization, 1976.
9. Bennett JM, Catovsky D, Daniel MT, Flandin G, Galton DA, Gralnick HR, et al. The morphological classification of acute lymphoblastic leukemia: concordance among observers and clinical correlations. Br J Haematol 1981;47:553-61.
10. Bennett JM, Catovsky D, Daniel MT, Flandin G, Galton DA, Gralnick HR, et al. Proposed revised cnteria for the classification of AML. Ann Zntern Med 1985; 103:620-5. Stanley M, McKenna RW, Ellinger G, Brunning RD. Classifica- tion of 358 cases of acute myeloid leukemia by FAB criteria: anal- ysis of clinical and morphologic features. In: Bloomfield CD, ed- itor. Chronic and acute leukemias in adults. Boston: Martinus Nijhoff, 1985: 147-74.
12. Bennett JM, Catovsky D, Daniel MT, Flandin G, Galton DA,
211-25.
4.
7.
11.
13.
14.
15.
16.
17.
18.
19.
20.
21.
22.
23.
24.
Gralnick HR, et al. Proposals for the classification of chronic (mature) B and T lymphoid leukemias. J Clin Pathol 1989;42:
Bennett JM, Catovsky D, Daniel M-T, Flandin G, Galton DA, Gralnick HR, et al. Proposals for the classification of the myelo- dysplastic syndromes. BY J Haematol1982;51:189-99. Math& G, Pouillart P, Sterescu M, Amiel JL, Schwarzenberg L, Schneider M, et al. Subdivision of classical varieties of acute leu- kemia: a correlation with prognosis and cure expectancy. Euro J Clin Biol Res 1971; 16:554-61. Galton DAG, Goldman JM, Wiltshaw E, Catovsky D, Henry K, Goldenberg GJ. Prolymphocytic leukemia. Br J Haematol
Schwartz DL, Pierre RV, Scheerer PP, Reed EC, Linman JW. Lymphosarcoma cell leukemia. Am J Med 1965; 38:778-86. Foerster J. Multiple myeloma. In: Lee GR, Bithell TC, Foerster J, Athens JW, Lukens JN, editors. Wintrobe’s clinical hematology. 9th ed. Philadelphia: Lea and Febiger, 1993: 2219-49. Riedel DA, Pottern LM. The epidemiology of multiple myeloma. Hematol Oncol Clin North Am 1992;6:225-47. Kyle RA. Newer approaches to the therapy of multiple myeloma editorial]. Blood 1990;76:1678-9. Gahrton G, Tura S, Ljungman P, Belanger C, Brandt L, Cavo M, et al. Allogeneic bone &arrow transplantation in multiple my- eloma. European Group for Bone Marrow Transplantatiok N EnglJ Med 1991; 325:1267-73. Dimopoulos MA, M O U ~ O ~ O L ~ O S A, Delasalle K, Alexanian R. Sol- itary plasmacytoma of bone and asymptomatic multiple my- eloma. Hematol Oncol Clin North Am 1991;6:359-69. Risdall RJ, McKenna RW, Nesbit ME, Krivit W, Balfour HH Jr., Simmons RL, et al. Virus as$ociated hemophagocytic syndrome: a benign histiocytic proliferation distinct from malignant histio- cytosis. Cancer 1979; 44:923-1002. Kaneko Y, Frizzera G, Edamura S, Maseki N, Sakurai M, Ko- mada, et al. A novel translocation t(2;5) (p23;q35) in childhood phagocytic large T cell lymphoma mimicking malignant histio- cytoses. Blood 1989; 73:806-13. Weiss LM. Histiocytic and dendritic cell proliferations. In: Knowles DM, editor, Neoplastic hematopathology. Baltimore: Williams & Wilkins, 1992: 1478-80.
567-84.
1974; 27~7-23.
Copyright © 2022 FDOKUMEN