Addressing the heterogeneity in liver diseases using ...
16
‡ Simon Lam and Stephen Doran are PhD students at King’s College London supervised by Professor Adil Mardinoglu. They are interested in the multi-omics modelling of neurodegenerative and cardiovascular diseases, respectively. Simon Lam Centre for Host-Microbiome Interactions, Faculty of Dentistry, Oral & Craniofacial Sciences, King’s College London, London, SE1 9RT, United Kingdom. Stephen Doran Centre for Host-Microbiome Interactions, Faculty of Dentistry, Oral & Craniofacial Sciences, King’s College London, London, SE1 9RT, United Kingdom. Hatice Hilal Yuksel Science for Life Laboratory, KTH - Royal Institute of Technology, Stockholm, SE-17121, Sweden. Ozlem Altay Science for Life Laboratory, KTH - Royal Institute of Technology, Stockholm, SE-17121, Sweden. Hasan Turkez Department of Medical Biology, Faculty of Medicine, Atatürk University, Erzurum, 25240, Turkey. Jens Nielsen Department of Biology and Biological Engineering, Chalmers University of Technology, SE-41296, Gothenburg, Sweden. Jan Boren Department of Molecular and Clinical Medicine, University of Gothenburg, The Wallenberg Laboratory, Sahlgrenska University Hospital, Gothenburg, Sweden. Mathias Uhlen Science for Life Laboratory, KTH - Royal Institute of Technology, Stockholm, SE-17121, Sweden. Adil Mardinoglu Centre for Host-Microbiome Interactions, Faculty of Dentistry, Oral & Craniofacial Sciences, King’s College London, London, SE1 9RT, United Kingdom; Science for Life Laboratory, KTH - Royal Institute of Technology, Stockholm, SE-17121, Sweden. Submitted: 15 October 2019; Received (in revised form): 28 November 2019 © The Author(s) 2020. Published by Oxford University Press. This is an Open Access article distributed under the terms of the Creative Commons Attribution License (http://creativecommons.org/licenses/by/4.0/), which permits unrestricted reuse, distribution, and reproduction in any medium, provided the original work is properly cited. 1751 Briefings in Bioinformatics, 22(2), 2021, 1751–1766 doi: 10.1093/bib/bbaa002 Advance Access Publication Date: 23 March 2020 Review Article Addressing the heterogeneity in liver diseases using biological networks Simon Lam † , Stephen Doran † , Hatice Hilal Yuksel, Ozlem Altay, Hasan Turkez, Jens Nielsen, Jan Boren, Mathias Uhlen and Adil Mardinoglu Corresponding author: Adil Mardinoglu, Centre for Host-Microbiome Interactions, Faculty of Dentistry, Oral & Craniofacial Sciences, King’s College London, London, SE1 9RT, United Kingdom; Science for Life Laboratory, KTH - Royal Institute of Technology, Stockholm, SE-17121, Sweden. Email: [email protected] † These authors contribute equally to this work. Abstract The abnormalities in human metabolism have been implicated in the progression of several complex human diseases, including certain cancers. Hence, deciphering the underlying molecular mechanisms associated with metabolic reprogramming in a disease state can greatly assist in elucidating the disease aetiology.An invaluable tool for establishing connections between global metabolic reprogramming and disease development is the genome-scale metabolic model (GEM). Here, we review recent work on the reconstruction of cell/tissue-type and cancer-specific GEMs and their use in identifying metabolic changes occurring in response to liver disease development, stratification of the heterogeneous disease population and discovery of novel drug targets and biomarkers.We also discuss how GEMs can be integrated with other biological networks for generating more comprehensive cell/tissue models. In addition, we review the various biological network analyses that have been employed for the development of efficient treatment strategies. Finally, we present three case studies in which independent studies converged on conclusions underlying liver disease. Key words: Systems biology; Computational biology; Liver metabolism; Genome-scale metabolic model; Integrated network; Omics integration Downloaded from https://academic.oup.com/bib/article/22/2/1751/5810888 by guest on 26 March 2022
-
Upload
khangminh22 -
Category
Documents
-
view
1 -
download
0
Transcript of Addressing the heterogeneity in liver diseases using ...
‡Simon Lam and Stephen Doran are PhD students at King’s College London supervised by Professor Adil Mardinoglu. They are interested in the multi-omicsmodelling of neurodegenerative and cardiovascular diseases, respectively.
Simon Lam Centre for Host-Microbiome Interactions, Faculty of Dentistry, Oral & Craniofacial Sciences, King’s College London, London, SE1 9RT, UnitedKingdom.Stephen Doran Centre for Host-Microbiome Interactions, Faculty of Dentistry, Oral & Craniofacial Sciences, King’s College London, London, SE1 9RT, UnitedKingdom.Hatice Hilal Yuksel Science for Life Laboratory, KTH - Royal Institute of Technology, Stockholm, SE-17121, Sweden.Ozlem Altay Science for Life Laboratory, KTH - Royal Institute of Technology, Stockholm, SE-17121, Sweden.Hasan Turkez Department of Medical Biology, Faculty of Medicine, Atatürk University, Erzurum, 25240, Turkey.Jens Nielsen Department of Biology and Biological Engineering, Chalmers University of Technology, SE-41296, Gothenburg, Sweden.Jan Boren Department of Molecular and Clinical Medicine, University of Gothenburg, The Wallenberg Laboratory, Sahlgrenska University Hospital,Gothenburg, Sweden.Mathias Uhlen Science for Life Laboratory, KTH - Royal Institute of Technology, Stockholm, SE-17121, Sweden.Adil Mardinoglu Centre for Host-Microbiome Interactions, Faculty of Dentistry, Oral & Craniofacial Sciences, King’s College London, London, SE1 9RT, UnitedKingdom; Science for Life Laboratory, KTH - Royal Institute of Technology, Stockholm, SE-17121, Sweden.Submitted: 15 October 2019; Received (in revised form): 28 November 2019
© The Author(s) 2020. Published by Oxford University Press.This is an Open Access article distributed under the terms of the Creative Commons Attribution License (http://creativecommons.org/licenses/by/4.0/),which permits unrestricted reuse, distribution, and reproduction in any medium, provided the original work is properly cited.
1751
Briefings in Bioinformatics, 22(2), 2021, 1751–1766
doi: 10.1093/bib/bbaa002Advance Access Publication Date: 23 March 2020Review Article
Addressing the heterogeneity in liver diseases usingbiological networks
Simon Lam†, Stephen Doran†, Hatice Hilal Yuksel, Ozlem Altay,Hasan Turkez, Jens Nielsen, Jan Boren, Mathias Uhlen and Adil Mardinoglu
Corresponding author: Adil Mardinoglu, Centre for Host-Microbiome Interactions, Faculty of Dentistry, Oral & Craniofacial Sciences, King’s CollegeLondon, London, SE1 9RT, United Kingdom; Science for Life Laboratory, KTH - Royal Institute of Technology, Stockholm, SE-17121, Sweden.Email: [email protected]†These authors contribute equally to this work.
Abstract
The abnormalities in human metabolism have been implicated in the progression of several complex human diseases,including certain cancers. Hence, deciphering the underlying molecular mechanisms associated with metabolicreprogramming in a disease state can greatly assist in elucidating the disease aetiology. An invaluable tool for establishingconnections between global metabolic reprogramming and disease development is the genome-scale metabolic model(GEM). Here, we review recent work on the reconstruction of cell/tissue-type and cancer-specific GEMs and their use inidentifying metabolic changes occurring in response to liver disease development, stratification of the heterogeneousdisease population and discovery of novel drug targets and biomarkers. We also discuss how GEMs can be integrated withother biological networks for generating more comprehensive cell/tissue models. In addition, we review the variousbiological network analyses that have been employed for the development of efficient treatment strategies. Finally, wepresent three case studies in which independent studies converged on conclusions underlying liver disease.
Key words: Systems biology; Computational biology; Liver metabolism; Genome-scale metabolic model; Integratednetwork; Omics integration
Dow
nloaded from https://academ
ic.oup.com/bib/article/22/2/1751/5810888 by guest on 26 M
arch 2022

1752 Lam et al.
IntroductionThe global burden of complex diseases is rising and such dis-eases cause millions of deaths each year worldwide, provingto be a widespread issue for not only individuals and health-care systems but also researchers and clinicians alike. Liverdiseases, including non-alcoholic fatty liver disease (NAFLD),non-alcoholic steatohepatitis (NASH), liver cirrhosis and hepato-cellular carcinoma (HCC), account for over 3 million deaths peryear worldwide, with 1.3 billion adults currently overweight witha 25% lifetime risk of NAFLD [1]. To date, there is no universaltherapy for NAFLD and NASH. Instead, patients reduce personalrisk factors by implementing lifestyle changes, such as dietingand exercise, or therapeutic solutions, such as insulin sensitisers(e.g. metformin), antioxidants (e.g. vitamin E) and cholesterol-lowering agents (e.g. statins) [2]. Although somewhat successful,the underlying mechanisms of action of many of these ther-apeutics and potential ramifications of their use continue tobe poorly understood, especially on the molecular and cellularlevels.
HCC patients display genetic, transcriptomic, proteomic,metabolomic, fluxomic and/or metagenomic heterogeneity—that is to say, no two cases are identical. However, all casesare broadly classified as HCC. This heterogeneity in complexdiseases thus implies that personalised therapies are notonly desirable, but necessary to effectively treat HCC whileminimising side-effects.
As reviewed elsewhere [3], systems biology approaches havebeen successfully employed to study interactions in complexdisease on multi-omics levels. It has already proven invaluablefor the discovery of biomarkers for the stratification of patientsof complex diseases as well as to identify prognostic markersand potential therapeutic targets [4–6], and has thus informedpersonalised therapy for the patients of heterogeneous diseases.The advent of the falling cost of multi-omics profiling has meantthat investigators today have a wealth of biological and clinicaldata available to them for the generation of both general [7]and personalised [8, 9] biological networks. This, along withgrowing computational power and libraries of multi-omic tools,means that investigators are now able to perform more in silicoperturbations and simulations to obtain a global, systems-leveloverview of complex diseases.
Systems medicine has demonstrated concordance withpreviously published findings and can be used as a platformfor in silico simulation, hypothesis generation and rationaldrug development (Figure 1). One of the goals of systemsmedicine is to identify biomarkers for stratification and per-stratum or personalised treatment. In this article, we assessthe readiness of the liver disease field to allow for personalisedtreatment regimes. We then review systems-based approachescurrently in use to overcome the challenges with heterogeneityin complex diseases, namely, genome-scale metabolic models(GEMs) and integrated networks (INs), and discuss their valueto the scientific community. Finally, we review the collectivesuccesses afforded by diverse systems biology methods inrevealing common themes implicated in the progression of liverdiseases including NASH/NAFLD and HCC, namely differentialexpression of pyruvate kinase muscle-type (PKM) isoformtranscripts, differential acetate utilisation and differentialregulation of redox metabolism. We therefore propose systemsbiology to be the best approach towards personalised treat-ment of complex liver diseases and believe that identifyingstratifying and treatment markers will aid greatly in thispursuit.
Liver disease and metabolismThe altered metabolism in liver diseases
Common metabolic disorders are often complex in nature,involving strong multigene components, and containing manydifferent underlying mechanisms that result in the same grossphenotype. These metabolic disorders often play a critical role inthe pathogenesis of disease—for example, obesity has adverseeffects on health and is associated with certain types of cancer[10], in addition to being strongly linked to NAFLD.
Other known traditional risk factors involved in the develop-ment of NAFLD include age, high blood pressure, high choles-terol, diagnosis of type II diabetes (T2D) and metabolic syn-drome. NAFLD has also been diagnosed in people without anyof the risk factors. A recent study focused on NAFLD patientsand characterised patients according to liver fat content (highhepatic steatosis (HS) was defined as >5.5% liver fat percentage;low HS was defined as <5.5% liver fat percentage) and was ableto suggest alternative treatment strategies for NAFLD patients[11], namely dietary supplementation of serine, L-carnitine, N-acetyl L-cysteine (NAC) and nicotinamide riboside (NR). Thesestrategies were verified to positively improve the disease state inmice and humans [12]. The abnormalities in serine metabolismhave also been previously reported based on the integration ofproteomics and transcriptomics data in NAFLD patients [13].
The role of diet in NAFLD progression has previously beeninvestigated in attempts to improve liver fat metabolism inNAFLD patients. Recently, an isocaloric low-carbohydrate dietwas found to be beneficial for NAFLD patients [14]. Thisdisease results in excessive release of free fatty acids into thebloodstream, which is associated with metabolic syndrome.The intervention with an isocaloric carbohydrate-restricteddiet was found to induce improved fatty acid oxidation, inaddition to inducing decreased glycolytic and tricarboxylic acid(TCA) fluxes, which in turn would lead to reduced fatty acidbiosynthesis (FAB). Previous studies have also suggested thatthe supplementation of the diet with natural substances maylead to a decrease in the level of the fat accumulated in the liver(e.g. L-carnitine can activate fatty acid uptake) and hence beused for the treatment of NAFLD [14].
Classically, patients with risk of liver disease may mitigatetheir personal risk through lifestyle changes such as exerciseand weight loss over extended periods of time. Interestingly, alongitudinal study in weight gain and loss in insulin-resistant(IR) and insulin-sensitive (IS) individuals revealed health impli-cations of weight gain that were immediately reversed or notimmediately reversed after weight loss [15]. For example, genesassociated with inflammatory response and dilated cardiomy-opathy were activated following weight gain, but only inflam-matory response genes decreased back to baseline with weightloss.
The high metabolic activity of the gut microbiome has to beconsidered when investigating food intake by the human body inhealth and disease states. For example, gut microbiota has beenfound to affect host amino acid metabolism, with substantialmodifications in glutathione metabolism occurring in the liverand other metabolically active tissues [16]. Previous associationshave also been identified between the composition of thegut microbiota and development of various complex diseases,including NAFLD and various cancers [17]. Furthermore, recentmetagenomic studies have provided additional novel insightsinto metabolic diseases and are able to identify possible ther-apeutic targets [18]. These findings should be able to facilitate
Dow
nloaded from https://academ
ic.oup.com/bib/article/22/2/1751/5810888 by guest on 26 M
arch 2022

Addressing the heterogeneity in liver diseases using biological networks 1753
Figure 1. Iterative computational biology workflow. Data are gathered by experimentation, from the literature or from publicly accessible databases. Computational
models describing biological knowledge are generated and refined. Models are used for in silico simulation, re-refinement of the model and hypothesis generation.
Findings are validated experimentally, feeding into new data for the next iteration of the cycle.
personalised interventions based on metagenomics analysis.The aforementioned longitudinal study also revealed diseasecase—specific changes in the microbiome—in particular,it was found that following weight gain, the level of themucin-degrading bacterium Akkermansia muciniphila increasedsignificantly in the stool samples of IS individuals, but not IR.This finding is consistent with previous animal-based studiessuggesting that the bacterium confers protective propertiesagainst insulin resistance [19, 20].
Modulation of liver metabolism usingnatural substances
With the motivation of addressing specific metabolic disorders,natural substances have been shown to restore normal hepaticlipid metabolism and reduce HS in NAFLD patients. Asreviewed recently [12], a three-step strategy involving increasedmitochondrial fatty acid uptake, increased mitochondrialfatty acid oxidation and increased availability of glutathione(GSH) was predicted to correct liver metabolism altered inNAFLD, in particular identifying the metabolic cofactors serine,carnitine, NAC and NR by using network modelling [11].Such natural substances can form the basis of per-stratumor personalised therapies for patient groups identified bystratification. Several therapies using natural substances havebeen used in clinical trials for the treatment of NASH/NAFLD andHCC as presented in Table 1, and select examples are describedbelow.
Vitamin A metabolism in NAFLD and its putative role in theprogression of liver disease have recently been reviewed [21].Vitamin A is required for a number of important physiologicalprocesses, ranging from cell proliferation and differentiation to
immune regulation, in addition to glucose and lipid metabolism.The liver plays a key role in the metabolism of vitamin A andharbours the largest body supply of vitamin A in hepatic stellatecells (HSCs), mostly as retinyl esters. Liver diseases, particularlythose resulting in fibrosis and cirrhosis, have a profound impacton vitamin A storage and metabolism. An impaired liver triggersHSCs to activate and transdifferentiate to myofibroblasts, lead-ing to a loss of hepatic vitamin A stores and thereby causingdysregulated lipid metabolism. Hence, vitamin A metabolitesare key co-regulators of hepatic lipid metabolism and thera-pies have been targeted at re-establishing proper levels of vita-min A that may restore order to hepatic lipid metabolism inNAFLD [22].
Furthermore, vitamin E has been proposed as a treatment forNAFLD owing to its status as a potent antioxidant that has theability to reduce oxidative stress in NAFLD, which is believed toplay a crucial role in producing the lethal hepatocyte injury thatis associated with NAFLD [23]. This is in part due to reactive oxy-gen species inducing the peroxidation of hepatic triglycerides(TGs) with the subsequent release of reactive aldehydes dam-aging mitochondrial components [24]. Oxidative stress has alsobeen identified as a factor that disturbs endoplasmic reticulum(ER) folding capacity and increasing amounts of accumulatingdata have implicated the disruption of ER homeostasis in NASHdevelopment [25]. Hence, there is a need to focus on the ther-apeutic efficacy of vitamin E in NAFLD/NASH. However, clinicaltrials involving vitamin E administration have only shown mod-est improvement in liver biochemistries so far: results includemodestly reduced alanine transaminase (ALT) levels in chil-dren with NAFLD [26], reduced ALT and aspartate transaminase(AST) levels in NASH [27], and reduced ALT, AST and γ -glutamyltranspeptidase (GGT) when combined with ursodeoxycholic acid(UDCA) [28].
Dow
nloaded from https://academ
ic.oup.com/bib/article/22/2/1751/5810888 by guest on 26 M
arch 2022

1754 Lam et al.
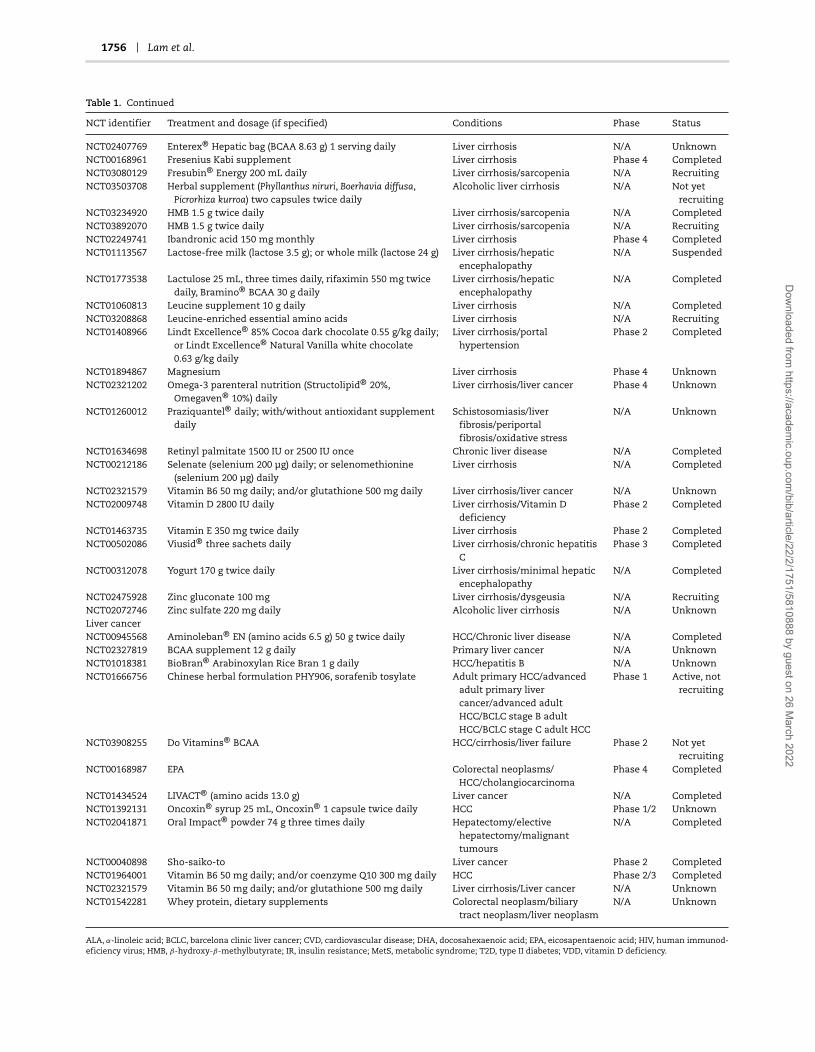
Table 1. Survey of current and completed clinical trials using natural substances to treat liver diseases
NCT identifier Treatment and dosage (if specified) Conditions Phase Status
NAFLD/NASHNCT03073343 Betaine 2 g or 4 g twice daily NAFLD/T2D N/A RecruitingNCT01016418 Bovine colostrum powder 600 mg three times NAFLD/NASH Phase 1/2 CompletedNCT02929901 Caffeine 200 mg daily; and/or chlorogenic acid 200 mg daily NAFLD/T2D Phase 2/3 CompletedNCT02458586 Canola oil 50 g daily NAFLD/obesity/prediabetes/
dyslipoproteinemiaN/A Unknown
NCT01707914 Chinese bayberry juice 250 mL twice daily NAFLD N/A CompletedNCT03375580 Compound zhenzhu tiaozhi 4 tablets three times daily; or
metformin 0.5 g three times daily; or simvastin 20 mgdaily
NAFLD N/A Recruiting
NCT02908152 Curcumin 1500 mg daily NAFLD/T2D Phase 2/3 UnknownNCT01934777 DHA 250 mg, vitamin E 39 UI, choline 201 mg daily NAFLD/fibrosis/obesity/
MetSPhase 3 Completed
NCT00820651 Diamel® 660 mg every 8 h NASH/IR Phase 3 CompletedNCT01936779 EPA/DHA 4 g daily NAFLD N/A CompletedNCT03260543 Fermented ginseng powder 125 mg or 500 mg daily NAFLD N/A CompletedNCT00681408 Fish oil 3 g daily NAFLD/NASH Phase 2/3 CompletedNCT00230113 Fish oil 4 g daily; or safflower oil 4 g daily NAFLD Phase 2 CompletedNCT01547910 Fish oil 400–1200 mg NAFLD Phase 2 CompletedNCT02395900 Flaxseed powder 30 g NASH Phase 2/3 CompletedNCT03625284 FucoVital® (microalgae fucoxanthin extract) NAFLD N/A Not yet
recruitingNCT02535195 Ginger supplement (ginger 500 mg) 2 capsules twice daily NAFLD Phase 2/3 CompletedNCT01553500 Glucomannan 5 g daily MetS/NAFLD/IR Phase 2 CompletedNCT03801577 Hepaxa® (EPA/DHA) 4 capsules daily NAFLD/NASH N/A Not yet
recruitingNCT03377140 Hesperidin 2 capsules NASH N/A UnknownNCT03377153 Hesperidin 2 capsules, flaxseed 30 g NAFLD/NASH N/A UnknownNCT03734510 Hesperidin supplement 2 capsules; and/or flaxseed 30 g NAFLD/NASH N/A RecruitingNCT00816465 Hoodia gordonii extract 1 tablet daily NAFLD Phase 1 CompletedNCT02992470 Hydrolysed oyster extract 250 mg three times daily NAFLD N/A UnknownNCT03914495 Inulin 10–40 g daily NAFLD N/A RecruitingNCT02642172 Inulin-type fructan (inulin/oligofructose 75/25) 16 g daily NAFLD/MetS N/A RecruitingNCT00586885 L-Alanine 6 g one to three times daily NASH N/A CompletedNCT03439917 L-Carnitine tartrate 2 g, Slimfast® 325 ml twice daily NAFLD/IR N/A RecruitingNCT03463967 Lycopene-enriched tomato juice 100 g daily NAFLD N/A RecruitingNCT03135873 Mastiha 2.1 g daily NAFLD Phase 1 RecruitingNCT02647294 Maxicor® n-3 PUFA 3.6 g daily NAFLD N/A Active, not
recruitingNCT01940263 Medox® anthocyanin 320 mg daily NAFLD/NASH Early
Phase 1Completed
NCT03864783 Meriva® curcumin supplement 1000 mg twice daily NAFLD/obesity/IR/glucosetolerance impaired
N/A Not yetrecruiting
NCT00063635 Metformin 500 mg daily; or vitamin E 400 IU twice daily NAFLD Phase 3 CompletedNCT03942822 Milled chia seeds 25 g daily NAFLD N/A CompletedNCT01056133 n-3 PUFA 1.0 g (EPA/DHA 0.82/0.44 g) daily NASH/NAFLD Phase 2 CompletedNCT01285362 n-3 PUFA 4.0 g (EPA/DHA 465/375 mg per 1 g capsule) daily NAFLD N/A CompletedNCT02117700 NAC 600 mg once or twice daily NAFLD/obesity/CVD Phase 2 UnknownNCT03850886 Nature’s Life® niacinamide supplement 1000 mg daily NAFLD Phase 2 RecruitingNCT02307344 Nigella sativa 1 g twice daily NASH N/A UnknownNCT03838822 NR 1 g, L-carnitine 3 g, serine 20 g, NAC 5 g Healthy Early
Phase 1Completed
NCT02369536 Nutraceutical mixture [fish oil (DHA 70%),phosphatidylcholine, silymarin, choline bitartrate,curcumin, D-α-tocopherol; choline 82.5 mg] 1600 mg daily
NAFLD N/A Completed
NCT02923804 Omega-3 supplement 3 g daily NAFLD N/A CompletedNCT02201160 Omega-3 supplement 4 capsules daily NAFLD Phase 1/2 UnknownNCT03132662 Optifast® (0.35 g linolenic acid) 1 serving, four times daily;
or Oceano3® Krill Oil (EPA 150 mg, DHA 90 mg) 1000 mgthree times daily
Obesity/NAFLD/NASH N/A Not yetrecruiting
NCT01875978 Phytosterols 1.8 g daily NAFLD N/A CompletedNCT01002547 Pioglitazone 30–45 mg daily, vitamin E 400 IU twice daily; or
vitamin E 400 IU twice dailyNASH Phase 4 Completed
Continued
Dow
nloaded from https://academ
ic.oup.com/bib/article/22/2/1751/5810888 by guest on 26 M
arch 2022

Addressing the heterogeneity in liver diseases using biological networks 1755
Table 1. Continued
NCT identifier Treatment and dosage (if specified) Conditions Phase Status
NCT03627819 Plant sterols 3 g daily; or plant stanols 3 g daily NAFLD N/A RecruitingNCT00977730 Protandim 1675 mg daily NASH N/A CompletedNCT00870077 ProWHEY® 94 CFM/SponserR® 20 g three times daily NAFLD/obesity N/A CompletedNCT03047668 PUFA T2D/NAFLD/obesity/
dyslipidemia/hypertension/MetS
N/A Unknown
NCT01992809 PUFA (ALA 64%, EPA 16%, DHA 21%) 945 mg three timesdaily
NAFLD Phase 3 Completed
NCT00819338 PUFA 5 g daily NAFLD Phase 2 CompletedNCT02030977 Resveratrol 1 capsule daily NAFLD Phase 2/3 CompletedNCT01446276 Resveratrol 500 mg three times daily NAFLD/Obesity N/A CompletedNCT01464801 Resveratrol 500 mg three times daily NAFLD N/A CompletedNCT02216552 ResVida® resveratrol 75 mg twice daily NAFLD/T2D/MetS Phase 2/3 CompletedNCT02568787 Rice bran arabinoxylan compound 1 g twice daily NAFLD N/A CompletedNCT02599038 Serine daily NAFLD/NASH Phase 1/2 CompletedNCT01650181 Siliphos® 140 mg, selenium 15 μg, methionine 3 μg, α-lipoic
acid 200 mg twice dailyNAFLD/NASH Phase 4 Completed
NCT03749070 Silymarin 700 mg, vitamin E 8 mg, phosphatidylcholine50 mg daily
NAFLD N/A Recruiting
NCT03319199 Slim Water® (L-carnitine 2000 mg, magnesium 150 mg) 1serving daily
NAFLD/NASH N/A Not yetrecruiting
NCT01956825 Slim Water® (magnesium lactate 150 mg, L-carnitine2000 mg)
NAFLD/NASH Phase 4 Unknown
NCT03664596 Sublimated mare milk 1 sachet three times daily;with/without UDCA capsule 250 mg two or three timesdaily
NASH N/A Recruiting
NCT03738358 Trehalose 5 g daily NAFLD N/A CompletedNCT01511523 Vitamin C/silymarin/carnitine 3 capsules twice daily NAFLD/NASH N/A UnknownNCT03084328 Vitamin D 2000 IU daily NAFLD N/A CompletedNCT01623024 Vitamin D 20000 IU weekly NAFLD Phase 3 UnknownNCT02132442 Vitamin D 50000 IU weekly T2D/NAFLD/Vitamin D
deficiencyPhase 3 Completed
NCT01571063 Vitamin D3 2100 IU daily NASH Phase 2 CompletedNCT02962297 Vitamin E 100 mg three times daily NASH N/A Active, not
recruitingNCT01792115 Vitamin E 200 IU or 400 IU or 800 IU daily NAFLD Phase 2 CompletedNCT00063622 Vitamin E 30 mg daily; or pioglitazone 800 IU daily NASH Phase 3 CompletedNCT02690792 Vitamin E 400 IU twice daily NAFLD/NASH N/A CompletedNCT00655018 Vitamin E 600 IU, vitamin C 500 mg daily NAFLD/inflammation/
fibrosis/IRPhase 2/3 Completed
NCT03669133 Vitamin E 800 IU daily NAFLD/NASH/HIV Phase 2 RecruitingNCT03988725 Vitamin E 800 IU daily NASH/HIV mono-infection N/A CompletedNCT00509418 Viusid 1 sachet three times daily NASH Phase 3 CompletedNCT02983669 Zataria multif lora Boiss. 350 mg twice daily NAFLD N/A CompletedNCT02178839 β-Glucan oat supplement 8.5 g daily NAFLD/NASH N/A UnknownLiver cirrhosisNCT03285217 Abbott Nutrition® 1 serving, vitamin D 160 IU twice daily Liver cirrhosis/sarcopeni-
a/malnutritionN/A Active, not
recruitingNCT02132962 Amino acid infusion Liver cirrhosis N/A CompletedNCT02023229 BCAA Liver cirrhosis Phase 4 CompletedNCT00931060 BCAA 0.45 g/kg daily Liver cirrhosis/hepatic
encephalopathy/hepaticinsufficiency
N/A Completed
NCT00955500 BCAA 30 g (leucine 13.5 g, isoleucine 9 g, valine 7.5 g) daily Liver cirrhosis/hepaticencephalopathy
Phase 4 Completed
NCT03339232 Bulk Supplements® BCAA powder (L-leucine 50%,isoleucine 25%, valine 25%) 1788 mg seven times daily
Liver cirrhosis N/A Recruiting
NCT03605147 Calcium-HMB 1.5 g twice daily Liver cirrhosis/sarcopenia N/A RecruitingNCT03354299 Coconut milk 50 mL daily Liver
cirrhosis/malnutritionN/A Completed
NCT03908255 Do Vitamins® BCAA supplement Liver cirrhosis/liverfailure/HCC
Phase 2 Not yetrecruiting
NCT02650245 EAS Myoplex® protein drink, lactulose 10 g Liver cirrhosis N/A Completed
Continued
Dow
nloaded from https://academ
ic.oup.com/bib/article/22/2/1751/5810888 by guest on 26 M
arch 2022
1756 Lam et al.
Table 1. Continued
NCT identifier Treatment and dosage (if specified) Conditions Phase Status
NCT02407769 Enterex® Hepatic bag (BCAA 8.63 g) 1 serving daily Liver cirrhosis N/A UnknownNCT00168961 Fresenius Kabi supplement Liver cirrhosis Phase 4 CompletedNCT03080129 Fresubin® Energy 200 mL daily Liver cirrhosis/sarcopenia N/A RecruitingNCT03503708 Herbal supplement (Phyllanthus niruri, Boerhavia diffusa,
Picrorhiza kurroa) two capsules twice dailyAlcoholic liver cirrhosis N/A Not yet
recruitingNCT03234920 HMB 1.5 g twice daily Liver cirrhosis/sarcopenia N/A CompletedNCT03892070 HMB 1.5 g twice daily Liver cirrhosis/sarcopenia N/A RecruitingNCT02249741 Ibandronic acid 150 mg monthly Liver cirrhosis Phase 4 CompletedNCT01113567 Lactose-free milk (lactose 3.5 g); or whole milk (lactose 24 g) Liver cirrhosis/hepatic
encephalopathyN/A Suspended
NCT01773538 Lactulose 25 mL, three times daily, rifaximin 550 mg twicedaily, Bramino® BCAA 30 g daily
Liver cirrhosis/hepaticencephalopathy
N/A Completed
NCT01060813 Leucine supplement 10 g daily Liver cirrhosis N/A CompletedNCT03208868 Leucine-enriched essential amino acids Liver cirrhosis N/A RecruitingNCT01408966 Lindt Excellence® 85% Cocoa dark chocolate 0.55 g/kg daily;
or Lindt Excellence® Natural Vanilla white chocolate0.63 g/kg daily
Liver cirrhosis/portalhypertension
Phase 2 Completed
NCT01894867 Magnesium Liver cirrhosis Phase 4 UnknownNCT02321202 Omega-3 parenteral nutrition (Structolipid® 20%,
Omegaven® 10%) dailyLiver cirrhosis/liver cancer Phase 4 Unknown
NCT01260012 Praziquantel® daily; with/without antioxidant supplementdaily
Schistosomiasis/liverfibrosis/periportalfibrosis/oxidative stress
N/A Unknown
NCT01634698 Retinyl palmitate 1500 IU or 2500 IU once Chronic liver disease N/A CompletedNCT00212186 Selenate (selenium 200 μg) daily; or selenomethionine
(selenium 200 μg) dailyLiver cirrhosis N/A Completed
NCT02321579 Vitamin B6 50 mg daily; and/or glutathione 500 mg daily Liver cirrhosis/liver cancer N/A UnknownNCT02009748 Vitamin D 2800 IU daily Liver cirrhosis/Vitamin D
deficiencyPhase 2 Completed
NCT01463735 Vitamin E 350 mg twice daily Liver cirrhosis Phase 2 CompletedNCT00502086 Viusid® three sachets daily Liver cirrhosis/chronic hepatitis
CPhase 3 Completed
NCT00312078 Yogurt 170 g twice daily Liver cirrhosis/minimal hepaticencephalopathy
N/A Completed
NCT02475928 Zinc gluconate 100 mg Liver cirrhosis/dysgeusia N/A RecruitingNCT02072746 Zinc sulfate 220 mg daily Alcoholic liver cirrhosis N/A UnknownLiver cancerNCT00945568 Aminoleban® EN (amino acids 6.5 g) 50 g twice daily HCC/Chronic liver disease N/A CompletedNCT02327819 BCAA supplement 12 g daily Primary liver cancer N/A UnknownNCT01018381 BioBran® Arabinoxylan Rice Bran 1 g daily HCC/hepatitis B N/A UnknownNCT01666756 Chinese herbal formulation PHY906, sorafenib tosylate Adult primary HCC/advanced
adult primary livercancer/advanced adultHCC/BCLC stage B adultHCC/BCLC stage C adult HCC
Phase 1 Active, notrecruiting
NCT03908255 Do Vitamins® BCAA HCC/cirrhosis/liver failure Phase 2 Not yetrecruiting
NCT00168987 EPA Colorectal neoplasms/HCC/cholangiocarcinoma
Phase 4 Completed
NCT01434524 LIVACT® (amino acids 13.0 g) Liver cancer N/A CompletedNCT01392131 Oncoxin® syrup 25 mL, Oncoxin® 1 capsule twice daily HCC Phase 1/2 UnknownNCT02041871 Oral Impact® powder 74 g three times daily Hepatectomy/elective
hepatectomy/malignanttumours
N/A Completed
NCT00040898 Sho-saiko-to Liver cancer Phase 2 CompletedNCT01964001 Vitamin B6 50 mg daily; and/or coenzyme Q10 300 mg daily HCC Phase 2/3 CompletedNCT02321579 Vitamin B6 50 mg daily; and/or glutathione 500 mg daily Liver cirrhosis/Liver cancer N/A UnknownNCT01542281 Whey protein, dietary supplements Colorectal neoplasm/biliary
tract neoplasm/liver neoplasmN/A Unknown
ALA, α-linoleic acid; BCLC, barcelona clinic liver cancer; CVD, cardiovascular disease; DHA, docosahexaenoic acid; EPA, eicosapentaenoic acid; HIV, human immunod-eficiency virus; HMB, β-hydroxy-β-methylbutyrate; IR, insulin resistance; MetS, metabolic syndrome; T2D, type II diabetes; VDD, vitamin D deficiency.
Dow
nloaded from https://academ
ic.oup.com/bib/article/22/2/1751/5810888 by guest on 26 M
arch 2022

Addressing the heterogeneity in liver diseases using biological networks 1757
Studies also indicate the potential benefit of omega-3 sup-plementation for NAFLD patients and show an association withmetabolic disorders [29]. For instance, long-term daily adminis-tration of n-3 polyunsaturated fatty acid (PUFA)-enriched oliveoil can decrease AST, ALT, GGT, TG and fasting glucose levels[30], in addition to markedly enhancing adiponectin levels com-pared with control [31]. When used to supplement an Ameri-can Heart Association (AHA)-recommended diet, long-term dailyPUFA supplements can decrease ALT, TG and serum tumournecrosis factor α (TNFα) levels, as well as liver fat content com-pared with an AHA-recommended diet alone [32]. In NAFLDassociated with hyperlipidemia, daily intake of seal oil-derivedPUFA can result in decreased ALT, TG and low-density lipoprotein(LDL) compared with control [33]. These observations indicatethat the supplementation of the diet with omega-3 fatty acidscan improve liver biochemical features in NAFLD patients andcan be used in combination with recommended dietary changes.
Other studied supplements include carnitine: twice-dailysupplementation with a recommended diet has been associatedwith biochemical amelioration such as in ALT, AST, GGT, high-density lipoprotein, LDL, total cholesterol and TG levels in NASHcompared with diet alone [34]; serine: associated with decreasedALT, AST, TG and alkaline phosphatase in NAFLD [11]; NAC:twice-daily dosage has been associated with decreased ALT inNAFLD compared with the twice-daily dosage of vitamin C [35];and branched-chain amino acids (BCAAs): long-term oral intakehas been linked with preventing progression to liver failure inadvanced cirrhosis patients compared with lactoalbumin andmaltodextrins [36], and increased serum albumin as well asgeneral health perception scores in decompensated cirrhosiscompared with diet therapy alone [37].
Finally, within alternative therapies, one example of noteis silymarin, an herbal remedy derived from milk thistle seedknown for its antioxidant properties [38]. NAFLD patients receiv-ing silymarin in combination with vitamin E displayed nor-malised ALT, AST and GGT levels over a course of 12 months[39]. Given that vitamin E therapy alone has resulted in onlymodest benefits, this study demonstrates that alternative ther-apies could potentiate the therapeutic benefits of mainstreammedicine. Indeed, several clinical trials involving natural andalternative substances, such as fish oil, Chinese bayberry juiceand oyster extract, are ongoing or completed (Table 1).
Taken together, it is clear that potential therapies are abun-dant, demonstrating the readiness of the field to prescribe singleor multiple natural substances to liver disease patients in apersonalised manner. However, since the therapy space for com-binatorial treatments is impossible to be explored exhaustivelyin the clinic, systematic consideration of human metabolism asa model is now clearly required.
Genome-scale modelling of liver metabolismThe shift in focus to human metabolism and its regulationwhen determining the molecular mechanisms of these complexdiseases requires reconstruction of functional human metabolicmodels using a systems medicine approach. GEMs are verysuitable for understanding mechanistic relationships betweengenotypes and phenotypes in addition to revealing the underly-ing mechanisms that may be responsible for a complex disease[40]. These models generally encompass different parts ofmetabolism and associated enzymes, thus enabling the study ofsuch interactions in a holistic manner. This can prove extremelyuseful when targeting enzymes for disease treatment or
identifying biomarkers for diagnosis through changes inmetabolite concentrations [41].
Reconstruction of a GEM involves integrating the substratesand products, respective stoichiometric coefficients, direction-alities, and compartmentalisation of every biochemical reactioncatalysed by every enzyme in the cell or tissue type in question,followed by flux balance analysis (FBA) and definition of a biolog-ical objective function, such as maximising biomass productionor minimising ATP consumption [42]. A number of computa-tional tools for the development and application of GEMs, suchas Metabolic Adjustment by Differential Expression (MADE) [43],Toolbox for Integrating Genome-scale metabolism, Expression,and Regulation [44] and Relative Metabolic Differences (RMetD2)[45], are publicly available.
The most comprehensive global reconstruction effortsof human metabolism are currently Recon3D and HumanMetabolic Reaction database version 2.0 (HMR2)—these generichuman GEMs containing more reactions, metabolites andgenes than previously reconstructed [41, 46]. Hence, it isoften employed to build cell/tissue-type GEMs using a task-driven model reconstruction (tINIT) algorithm [8], whichcombines cell-type-specific transcriptomics and proteomicswith defined metabolic tasks that the generated model shouldbe able to perform. An example of a cell/tissue-type GEM isiHepatocytes2322, a consensus functional GEM for hepatocytes,which was reconstructed manually by integrating the contentsof previously published human hepatocyte GEMs [13]. Itextends previous models of the liver by incorporating extensiveinformation about lipid metabolism, which is necessary forstudying the effects of excess lipids on the underlying molecularmechanism of NAFLD. The iHepatocytes2322 GEM has beenutilised to analyse transcriptomics data from NAFLD patientsidentifying new potential biomarkers and therapeutic markers[13]. More recently, this GEM has been used in conjunctionwith FBA to generate personalised, simulation-ready GEMs forNAFLD patients. This approach identified altered GSH and NAD+metabolism as a prevailing feature in NAFLD and suggesteda potential treatment strategy for NAFLD patients based onincreased synthesis of GSH and increased oxidation of fat [11].
Aside from cell/tissue-type GEMs, cancer-specific GEMs, suchas the HCC-specific GEM, have been reconstructed using HMR2and the tINIT algorithm, thus providing insights about tumourprogression and discovering anti-cancer drug targets throughthe use of personalised HCC models [8]. This study identified46 antimetabolites (chemicals which disrupt metabolism byinhibiting the use of a metabolite) which were specific toindividual patients and hence emphasises the need to stratifypatients according to different metabolic profiles.
The mapping of high throughput datasets onto reconstructedGEMs allows for the analysis of metabolic conditions betweentwo different conditions. An invaluable tool used in this mappingprocess is RMetD2, which has successfully integrated relativetranscriptomics data into GEMs in several cases. RMetD2 dif-fers from other tools as it sets gradient constraints, allowingexpression changes to be evaluated over several steps ratherthan considering only the overall change in expression as inMADE. RMetD2 can also be applied without an objective function,allowing for modelling where no clear objective is defined. Toillustrate one example, transcriptomics data obtained beforeand after a carbon-restricted dietary study were integrated intoiHepatocytes2322 to determine the metabolic differences thatoccurred in the liver over the course of the study [14]. Thereaction associated with the triacylglycerol pool generation, andthus indicates the accumulation of liver fat, was among the
Dow
nloaded from https://academ
ic.oup.com/bib/article/22/2/1751/5810888 by guest on 26 M
arch 2022

1758 Lam et al.
reactions that were significantly downregulated. Furthermore,transcriptomics data have been integrated into the HepG2 GEMwhen investigating the metabolic differences between wild-typeand pyruvate kinase liver and red blood cell (PKLR) inhibited livercancer cell line, using constraints and differentially expressedgenes (DEGs) from a recent study [47]. RMetD2 suggested thatthe glycolytic reaction that converts glucose 6-phosphate tofructose 6-phosphate is classified as downregulated in the PKLR-inhibited HepG2 cell line. This suggests a decreased glucoseconsumption at the beginning of the glycolytic pathway, and asexpected, a decreased glucose consumption in PKLR-inhibitedcells was observed in the experimental validation.
INs for liver metabolismFurther integration of biological knowledge into GEMs can beachieved through integration of GEMs with other biologicalnetworks, including transcriptional regulatory networks (TRNs),protein–protein interaction networks (PPINs) and signallingnetworks (Figure 2A). This integrative approach results in theformation of INs, which are necessary in order to cover theentire range of biological functions of cells and tissues in aholistic manner (GEMs cover only ∼15–20% of all biologicalfunctions). Hence, these INs should enable a better predictionof the cell phenotype and may lead to a better understandingof how metabolic processes are altered when a certain enzymeis activated or inhibited. The Minimum Network EnrichmentAnalysis framework can also be applied to GEMs to generateall feasible alternative minimal networks, each of whichcorresponding to a distinct metabolic subsystem that cansynthesise a target metabolite. This approach has previouslybeen applied to investigate the deregulation of metabolic tasksin NAFLD and identified key regulators in different NAFLDphenotypes using transcriptomics data from liver samples [48].
The first attempt at generating an IN involved merging GEMs,TRNs and PPINs to generate cell-specific INs for hepatocytes,myocytes and adipocytes of lean and obese subjects [49]. Thisintegration is performed by first combining sets of interactionsin the TRN and PPIN, and then considering the enzyme-codinggenes which overlap with GEMs. Network topologies provided bythe cell-specific INs could then be employed to perform a co-regulation analysis for each metabolic pathway in the healthyand obese subjects. This approach was able to identify the dys-regulation of fructose and mannose metabolism in obese sub-jects including plasma mannose levels increasing in response toobesity. Further associations were also found between plasmamannose levels and insulin resistance leading to the conclusionthat mannose could be used to explain the variance in obesity-independent insulin resistance. Hence, this novel strategy ofemploying cell-specific INs had proven to be successful in iden-tifying the dysregulation of biological functions in response to adisease, which in turn revealed the consequences on relevantmetabolites in plasma and eventually led to the proposal ofnew candidate disease biomarkers. These findings promptedfurther studies [50] that also found elevated plasma mannoselevels to be strong biomarkers for predicting future risk of sev-eral chronic diseases, including T2D, cardiovascular disease andalbuminuria.
More recently, GEM, PPIN and TRN were merged to generatean IN for HepG2 cells, which could then be used to modelthe effect of inhibition of PKLR in these cells [47]. The find-ings suggested a global metabolic response to PKLR inhibition,including a decrease in glycolytic flux and FAB, both of whichwere experimentally validated, as later discussed in this review.
Overlap of INs with gene co-expression networks (CNs)can reveal tissue-specific functional and physical interactions,which can then be used to determine metabolic pathways thatare regulated specifically in the tissue of interest (Figure 2B).An example of such an application includes the integration ofTRNs, PPINs and CNs to identify liver-specific co-expressionclusters, from which FASN–co-expressed genes (PKLR, PNPLA3,PCSK9) were identified as potential therapeutic targets fortreating liver disease [51]. The database of tissue- and cancer-specific biological networks also employs a similar approachand has emerged as an invaluable tool towards gaining detailedinsight into disease mechanisms, which in turn will lead tothe development of efficient treatment strategies [52]. HumanCNs were generated for 46 normal tissues and 17 cancers,and tissue-specific INs were generated for liver, muscle andadipose tissues through the integration of metabolic networks,TRNs and PPINs. Consequently, the overlap between functionaland physical interactions provided by CNs and INs couldbe investigated, including functional relationships betweengenes and their relationships with biological functions. Thecomparative analysis of these networks may lead to theidentification of tissue-specific targets that can be used todevelop drugs that have minimum toxic effect on other tissues.
A top-down systems approach considering the interplay ofinteractions on many omics levels is preferred to gain a fullerinsight into the global ramifications of perturbing a node incomplex disease. A significant example was demonstrated inthe HepG2 cell line, commonly used for the study of HCC. PKLR,a gene previously proposed by network analysis as a potentialtarget for drug development [51], was inhibited in silico using anHepG2-specific IN reconstructed from an HepG2-specific TRN,GEM and PPIN [47] as well as RMetD2 for predictions in changesof fluxes. Simulations predicted the downregulation of path-ways, including the TCA cycle, oxidative phosphorylation, FABand fatty acid β-oxidation (FAO). In addition to these changes,the NADPH-generating folate cycle was predicted to be down-regulated and the pentose phosphate pathway was predictedto be upregulated, in a metabolic flux shift away from the firsthalf of glycolysis (glucose to fructose 6-phosphate (F6P) steps), tocompensate for the depletion of NADPH. Interestingly, inhibitionof PKLR was predicted to lead to increased flux in the second halfof glycolysis [F6P to phosphoenolpyruvate (PEP) steps] despitePKLR itself being the enzyme responsible to convert PEP intopyruvate. Nonetheless, the simulated decreases in the first halfof glycolysis and in FAB were validated by siRNA knockdownof PKLR in HepG2 cells. The knockdown experiments showedsignificant decreases in glucose uptake (down 40% comparedwith control) and adjusted total TG levels (down 15% comparedwith control). This study clearly demonstrates the benefits ofnetwork-based investigations in providing a deeper insight intothe metabolic flux changes occurring in biological systems aswell as directing hypothesis-driven research in the laboratory.
For various metabolic diseases, comprehensive collections ofintegrated clinical chemistry, anthropometric, plasma protein,metabolite and gut microbiome data have been generated ina number of longitudinal and cross-sectional studies [15, 53,54]. Recent investigations that have integrated such omics datainclude an isocaloric low-carbon diet being found to be beneficialfor NAFLD patients [14] and a novel glycine and serine deficiencyphenotype being found in patients with NAFLD [11]. Hence, thereis a need for resources and databases to investigate the associa-tions between different types of omics data. In this context, theinteractive database of multi-omics biological networks (MOBNs)[55] was created to provide a better framework to facilitate these
Dow
nloaded from https://academ
ic.oup.com/bib/article/22/2/1751/5810888 by guest on 26 M
arch 2022

Addressing the heterogeneity in liver diseases using biological networks 1759
Figure 2. IN construction. The formation of INs and their overlap with CNs can reveal metabolic pathways that are regulated specifically in a tissue of interest. A,
Formation of an IN through the integration of GEMs with other biological networks, including regulatory networks, PPINs and signalling networks. INs are necessary
in order to cover the entire biological functions of cells and tissues in a holistic manner and should enable a better prediction of the cell phenotype. Arrows with
barbed heads, activatory relationships; arrows with bars, inhibitory relationships; dotted lines, physical interactions; and arrows with filled heads, integration of data.
B, Overlap of an IN with a CN can reveal tissue-specific functional and physical interactions, which can then be used to determine BPs that are uniquely regulated in a
tissue of interest.
types of investigations. It is highly expected that the integra-tion of multiple omics data through the MOBN tool and otheralternative tools may offer novel insights and provide a moreextensive understanding of biological functions in the humanbody.
Systems biology case studies for stratifyingliver disease patients
Traditional efforts to treat disease through the developmentof drugs are generally directed by a small number of links
Dow
nloaded from https://academ
ic.oup.com/bib/article/22/2/1751/5810888 by guest on 26 M
arch 2022

1760 Lam et al.
associating the drug target with disease on the molecular orgenetic level. Although useful for treating less complex medicalcomplaints, these simple, single-layer associations are insuffi-cient in explaining complex diseases, which require stratifica-tion into subclasses of disease. Biological networks have beeninvaluable in identifying underlying mechanisms driving sub-classes of complex disease. Due to the global overview possibleonly by these systems-levels investigations, common funda-mental pathways, genes and analytes have been identified forthe stratification of patients or therapeutic targeting in multipleindependent investigations. This, along with existing knowledgeof the factors involved, demonstrate more confidently the accu-racy of the results emerging from systems approaches for thegeneration of hypotheses to be tested at the bench or for rationaldrug development. Here, we summarise the corroborating find-ings of recent systems-level investigations involving identifica-tion of strata of disease, implicating network topology, acetateutilisation, isoforms and alternative splice products of PKM,and redox metabolism as important players in heterogeneousHCC.
Stratification of HCC patients based onnetwork topology
Networks integrating multi-omics data have also shown to bemore effective than DEGs alone in stratifying individuals ofcomplex disease into clusters with distinct biological or clin-ical profiles. It has been demonstrated that by generation ofpersonalised functional gene-gene networks (fGGNs) for 369individuals with HCC and 50 matched non-cancer individuals,fGGNs corresponding to HCC could be clustered to the exclusionof the non-cancer samples, a result not recapitulated whenconsidering gene expression data alone due to the large het-erogeneity among the HCC patients [56]. Integration of patient-specific transcriptomic data and an HCC-specific GEM was allthat was required to elucidate the clustering, leading to thecharacterisation of the three proposed GEMs as described above(iHCC1, iHCC2 and iHCC3).
Identifying stratifying genes or therapeutic targets basedon network characteristics is an exciting emerging strandof systems biology that has already proven highly useful toresearchers. By using network controllability theory, minimumdriver set (MDS) nodes—those nodes required to achievefull control over a network [57]—and indispensable nodes—those nodes whose removal from the network increases theMDS [58]—can be identified. In a proof-of-concept study [59],personalised GEMs were constructed, and biomass productionand ATP consumption were defined as objective functions forHCC GEMs and adjacent non-cancer GEMs, respectively, andfunctionality was determined based on whether the modelscould perform 57 and 56 previously documented metabolictasks [8], respectively. Based on in silico gene silencing withinthese parallel models, eight genes were found to inhibitgrowth in all HCC GEMs, while at the same time inducingno change in non-cancer GEMs. Furthermore, three of thesegenes [protein kinase cAMP-activated catalytic subunit alpha(PRKACA), phosphatidylglycerophosphate synthase 1 (PGS1) andcardiolipin synthase 1 (CRLS1)] were identified as MDS nodes inHCC networks but not in non-cancer networks, indicating thatinhibition of these genes would not be toxic to normal cells.Indeed, siRNA knockdown of these three genes in HepG2 andHepB3 cells led to promising reductions in cell growth by up to35% in at least one cell line.
Stratification of HCC patients based onacetate utilisation
Several studies employing multi-omics network analysisapproaches have been congruent in identifying major pathwayscontributing to liver disease. For instance, the genes encodingthe enzymes catalysing the conversion of acetate to acetyl-CoA—namely mitochondrial enzymes ACSS1 and ACSS3, andcytosolic enzyme ACSS2—have been identified as stratifyinggenes in two independent network analysis studies (Figure 3).
In the first study [6], a reconstructed GEM for HCC, known asiHCC2578, predicted an unusually tightly regulated FAB pathwayin a background of poorly or deregulated metabolic pathways,as normally expected in cancer. On the basis that the ACSSenzymes can generate acetyl-CoA to be used as a substrate forFAB, the authors stratified 361 HCC tumours by ACSS1 and ACSS2expression level, separately, and found that high ACSS1 expres-sion was linked to hypoxia, suppression of fatty acid oxidation,co-expression with the proliferation-specific transcription fac-tor (TF) Forkhead box M1 (FOXM1) and centromere protein F(CENPF)—the implications of both of which in HCC are alreadyestablished [60, 61]—and a poor prognosis for the patient. Incontrast, no such associations were drawn between high ACSS2expression and FOXM1 or CENPF, and in fact, a negative correla-tion could be drawn between high ACSS2 and hypoxic response(Figure 3A).
A more recent study [56] has also enabled tumour stratifica-tion by classifying personalised HCC GEMs into one of three HCCsubtypes (iHCC1, iHCC2 and iHCC3)—each of which have distinctgene expression, biological process (BP) and clinical survivalcharacteristics. The reconstruction of cancer GEMs differs fromnon-cancer GEMs of the same cell/tissue type by having the for-mation of biomass as an additional metabolic task to ensure cellgrowth. The study stratified 369 HCC tumours into three clusterson the basis of an fGGN for HCC and patient transcriptomicdata: iHCC1, indicating the most favourable survival; iHCC2, indi-cating intermediate survival; and iHCC3, indicating the leastfavourable survival [56]. In agreement with the prognostic char-acteristics of the ACSS1 and ACSS2 enzymes as described above,it was seen in HCC subtype-specific GEMs that iHCC1 tumoursfavourably expressed ACSS2, iHCC2 tumours ACSS3, whereasiHCC3 tumours ACSS1 for acetate utilisation (Figure 3B). Thisconcordance between independent studies highlights acetateutilisation as a key area of interest for the stratification andpossibly treatment of patients suffering from HCC.
Pyruvate kinase isoform expression profiles caninform cancer survival rates
PKM expression has been strongly associated with cancer sur-vival, but the direction of the correlation is contradictory amongdifferent tissues of the human body [62]. To illustrate this point,high expression is an unfavourable prognostic marker for liverHCC, pancreatic adenocarcinoma, head and neck squamous cellcarcinoma and lung adenocarcinoma; however, it is a favourableprognostic marker for other cancers such as kidney renal clear-cell carcinoma (KIRC), skin cutaneous melanoma, stomach ade-nocarcinoma and thyroid carcinoma. This heterogeneity can inpart be explained by the fact that alternative splicing results in14 isoforms of PKM, the major isoforms being PKM1 and PKM2,which differ by mutually exclusive exons 9 and 10 [63]. Therefore,contradictory treatment in the activation and inhibition of PKMhas been suggested according to the type of cancer a patient hasbeen diagnosed with.
Dow
nloaded from https://academ
ic.oup.com/bib/article/22/2/1751/5810888 by guest on 26 M
arch 2022

Addressing the heterogeneity in liver diseases using biological networks 1761
Figure 3. Independent studies highlight convergent conclusions in acetate utilisation in HCC heterogeneity. Separate investigations associated increased expression of
ACSS1 with poor survival outcome. A, Stratification of tumours based on ACSS1 and ACSS2 expression led to the identification of poor prognosis markers in tumours
expressing ACSS1 at a high level [6]. B, Clustering of tumours on the basis of fGGN and transcriptomic data resulted in the characterisation of three HCC subtypes, of
which the subtype conferring the least favourable survival was found to preferentially express ACSS1 for acetate utilisation [56].
To further investigate PKM transcripts at the functionallevel, the top and bottom quartiles of gene expression foreach transcript in all cancers were compared in order to findDEGs, and this was followed by gene ontology (GO) enrichmentanalysis. The DEG/GO analysis identified two transcripts(ENST00000335181 and ENST00000561609), which includes thetranscript for PKM2, associated with favourable survival in TCGAKIRC datasets. Two further transcripts (ENST00000389093 andENST00000568883), associated with unfavourable survival, werealso found. These opposite prognostic effects between the setsof transcripts were validated using an independent JapaneseKIRC cohort of 100 patients [64]. This previous study confirmedthat the former transcripts were associated with favourablesurvival, whereas high expression of the latter transcriptswas associated with unfavourable survival. Thus, there was
agreement between this independent KIRC cohort and the TCGAKIRC cohort.
In an attempt to explain the differing survival rates betweenthe sets of transcripts, the protein products of the prognostictranscripts were characterised and aligned with a templatestructure for PKM (Figure 4A). Amino acid sequence analysisrevealed large deletions in the unfavourable survival transcripts,with ENST00000389093 and ENST00000568883 having deletionsin the A1 and B domains (Figure 4B), which may impededimerisation [65]. The amino acid alignment of translations ofuncharacterised transcripts also revealed that ENST00000561609had deletions in the C-terminal region, which may impedetetramerisation. Moreover, the region at residue range 389–433more closely resembles PKM1 rather than PKM2 for isoformsENST00000561609 and ENST00000568883. In this region, fructose
Dow
nloaded from https://academ
ic.oup.com/bib/article/22/2/1751/5810888 by guest on 26 M
arch 2022

1762 Lam et al.
Figure 4. Alternative splice isoforms of PKM. Homology modelling and structure alignment can reveal functionally important sites and identify functionally significant
deletions that occur in different PKM isoforms [62]. A, The template structure for PKM consists of four domains. The A-domain participates in the formation of dimers
and the C-domain mediates the interactions between dimers that allow them to form tetramers. The active site (K270) and FBP binding site (K433) are shown. B, The
alternatively spliced forms of PKM reveal large deletions corresponding to the ADP binding site in isoforms ENST00000389093 and ENST00000568883, which may impede
dimerisation. In TGCA KIRC datasets, these transcripts are associated with unfavourable survival.
1,6-bisphosphate binds K433 (present in PKM2 but not PKM1),activating tetramer formation in PKM2 [66]. In contrast, PKM1exists as a stable tetramer that has high constitutive activity[67].
Homology modelling and structure alignment with PKM1 andPKM2 revealed that ENST00000389093 lacked the catalytic sitefor ADP binding at residues 59–132 as a number of key contactresidues within this range were missing. A newly ordered loopwas found in place of the ADP binding site and it is unknownwhether this loop can bind ADP in place of the active site. Mean-while, ENST00000568883 had deletions in the A and B domainsas well as the entire N-terminal domain, compared with PKM1structure. Hence, the large deletions in the unfavourable survivaltranscripts corresponded to the ADP binding site, but it is stillunknown whether these isoforms can bind ADP.
A further example of pyruvate kinase isoforms informingon cancer survival rates includes the aforementioned study onthe fGGN-assisted stratification of HCC patients. Here, it wasrevealed that the gene expression in the poor-survival iHCC3cluster was enriched for genes associated with cancer hallmarkscompared with the good- and intermediate-survival iHCC1 andiHCC2 clusters [56]. In particular, PKM was identified as a poten-tial stratifying gene for iHCC3: this cluster being associated withpoor prognosis of HCC. Interestingly, it was seen that iHCC1 andiHCC2 cluster tumours use liver-specific PKLR for the utilisa-tion of pyruvate rather than the muscle isoform PKM, signify-ing metabolic dysregulation on multiple pathways, indicative ofmore advanced or aggressive cancer.
Dysregulated redox metabolism and hypoxia ashallmarks of HCC
It is known that imbalances in redox metabolism influence pro-liferation and tumourigenesis, thus making redox metabolism
a potential target for cancer treatment. Hence, several recentefforts have targeted redox metabolism in cancer [68, 69].In addition, a systematic examination of redox behaviourin HCC has been performed [70], which has allowed for agreater understanding of redox behaviour in HCC and itsrelationship with metabolism, signalling and patient clinicaldata.
This recent study stratified 360 HCC patients based onthe expression of 132 redox metabolism genes identified twodistinct clusters of redox genes. These two groupings, namedthe glucose 6-phosphate dehydrogenase (G6PD) cluster and thealdehyde dehydrogenase 2 (ALDH2) cluster based on the keygenes existing in each, were found to be positively co-expressedwith genes in the same cluster but negatively co-expressed withgenes in the opposite cluster. ALDH2 cluster genes were enrichedfor GO BP terms such as lipid oxidation and metabolism,amino acid metabolism and biosynthesis and carbohydratemetabolism; however, G6PD cluster genes were associated withhallmarks of cancer-related functions [71] such as inflammation,morphogenesis and hypoxia. From the generation of cluster-specific GEMs for HCC, a four-gene signature consisting of PKM,folate metabolism gene MTHFS, G6PD and hypoxia-induciblefactor 1 alpha (HIF1A) was proposed, indicating the activation ofhypoxia response genes and the regulation of redox metabolismas targets of interest for the stratification and/or treatment ofHCC patients (Figure 5A). HIF1A affects glycolytic genes, suchas PKM, enabling them to cope with reductions in oxygenavailability and consumption [72]. Enhanced expression of suchglycolytic enzymes results in high rates of glycolysis. In cancercell subpopulations, however, enhanced glycolytic flux andreduced oxidative phosphorylation can be achieved even inaerobic conditions [71], resulting in a change in metabolismknown as aerobic glycolysis, or the Warburg effect [73], furthercontributing to cellular redox imbalance.
Dow
nloaded from https://academ
ic.oup.com/bib/article/22/2/1751/5810888 by guest on 26 M
arch 2022

Addressing the heterogeneity in liver diseases using biological networks 1763
Figure 5. Independent studies reveal redox metabolism as a commonly dysregulated cellular function in heterogeneous HCC. Three separate investigations identified
common redox metabolism genes (shown in red) as being associated with poor favourable survival of HCC. A, Stratification by antagonistic clusters of co-expressing
redox metabolism genes reveals that the cluster associated with the least favourable survival is enriched for genes associated with inflammation, morphogenesis and
hypoxia [70]. B, Differential expression between iHCC3 and iHCC1/iHCC2 tumours also identified elevated G6PD and PKM expression [56]. C, Differential expression of
high ACSS1 HCC versus low ACSS1 HCC also revealed increased PKM and HIF1A [6].
The fGGN-based HCC stratification study [56] showed thatthe differentially upregulated genes in iHCC3 also included themammalian target of rapamycin (mTOR), the oncogene Myc,genes involved in the G-to-M–phase progression of the cellcycle and genes involved in the epithelium-to-mesenchymaltransition. In particular, redox metabolism genes were onceagain identified as potential stratifying genes for iHCC3: theseincluded the aforementioned G6PD and PKM, as well as ALDOA(aldolase, fructose bisphosphate A), thus strengthening theassociation between redox metabolism and poor prognosis ofHCC (Figure 5B).
In the differential expression analysis between high- andlow-expressing ACSS1 HCC tumours [6], it was seen that highACSS1 was associated with the suppression of FAO and increased
PKM, a combination that has been previously linked to hypoxiaand de-differentiation in HCC [74]. This, taken with the factthat HIF1A was found to be significantly positively co-expressedwith ACSS1, suggests malignant growth under hypoxic responseand a strong Warburg effect in cells highly expressing ACSS1(Figure 5C).
Using diverse systems methods, three independent studieshave separately converged to a conclusion implicating dys-regulated redox metabolism and hypoxia as active hallmarksof cancer in subsets of HCC. Given that we have alreadyhighlighted similarities in the acetate utilisation of high ACSS1tumours and iHCC3 tumours, it is not inconceivable thatthese three independent subsets of HCC may not be mutuallyexclusive.
Dow
nloaded from https://academ
ic.oup.com/bib/article/22/2/1751/5810888 by guest on 26 M
arch 2022
1764 Lam et al.
ConclusionThe heterogeneity in complex diseases strongly indicates thatpersonalised therapies are required for treatment throughthe stratification of the heterogeneous disease population.We highlight the recent progress made in context-dependentanalysis of high-throughput data through reconstructed GEMsand give examples of how this approach has greatly contributedtowards addressing the heterogeneity in liver diseases. Thefocus of our chosen examples revolves around the applicationof cancer-specific GEMs and biological networks in identifyingkey genes for stratifying and treating HCC. Namely, we identifyacetate utilisation, PKM isoform expression and dysregulatedredox metabolism as sources of HCC heterogeneity, identifiedacross several independent systems-level studies. Hence, futurestudies should employ similar biological network analyses toidentify additional sources of disease heterogeneity for thedevelopment of efficient stratification and treatment strategiesfor complex disease. In this effort, we illustrate the power ofGEMs for modelling energy metabolism, INs for the integration ofmulti-omics data and utilising patient data (e.g., patient-specifictranscriptomes) for the personalised treatment of HCC. Finally,novel methods for simulating the whole body functions shouldbe developed analogous to a recent study that applied multi-scale, whole-systems models of liver metabolic adaptation tosugar and fat in NAFLD [75].
With 9.4 million patients with neurological disorders in2015 [76] over 200 million patients with chronic kidney disease[76], and cardiovascular disease—the leading cause of deathsglobally—causing over 17 million deaths each year worldwide[77], it is clearly of utmost significance to researchers tostudy more intensively the underlying causes of complex non-communicable diseases. Similar tools and methods have beensuccessfully applied for the development of efficient treatmentstrategies for liver and other diseases, and the current growinglibrary of natural therapeutic substances shows that the liverdisease field is ready for personalised medicine.
Key Points• Integrated multi-omics networks have been used to
identify potential biomarkers and treatment strategiesfor the patients of complex liver diseases.
• Independent systems-level studies have yielded resultsthat are consistent with one another as well as withprevious knowledge.
• Systems biology could aid with hypothesis generationfor the study of other complex diseases.
Funding
This work was supported by the Knut and Alice WallenbergFoundation (grant number: 2017.0303).
Author contributions
SL and SD wrote the manuscript and all authors wereinvolved in the editing and reviewing of the manuscript.
Conflicts of interest
The authors declare no competing interests.
References1. Williams R. Hepatology through the crystal ball. Hepatol Int
2019;13:403–6.2. Singh S, Osna NA, Kharbanda KK. Treatment options for
alcoholic and non-alcoholic fatty liver disease: a review.World J Gastroenterol 2017;23:6549–70.
3. Mardinoglu A, Boren J, Smith U, et al. Systems biology in hep-atology: approaches and applications. Nat Rev GastroenterolHepatol 2018;15:365–77.
4. Uhlen M, Zhang C, Lee S, et al. A pathology atlas of the humancancer transcriptome. Science 2017;357:eaan2507.
5. Gatto F, Volpi N, Nilsson H, et al. Glycosaminoglycan pro-filing in patients’ plasma and urine predicts the occur-rence of metastatic clear cell renal cell carcinoma. Cell Rep2016;15:1822–36.
6. Björnson E, Mukhopadhyay B, Asplund A, et al. Stratificationof hepatocellular carcinoma patients based on acetate uti-lization. Cell Rep 2015;13:2014–26.
7. Yizhak K, Chaneton B, Gottlieb E, et al. Modeling cancermetabolism on a genome scale. Mol Syst Biol 2015;11:817.
8. Agren R, Mardinoglu A, Asplund A, et al. Identification ofanticancer drugs for hepatocellular carcinoma through per-sonalized genome-scale metabolic modeling. Mol Syst Biol2014;10:721.
9. Senft D, Leiserson MDM, Ruppin E, et al. Precision oncology:the road ahead. Trends Mol Med 2017;23:874–98.
10. Loos RJF, Bouchard C. Obesity - is it a genetic disorder? J InternMed 2003;254:401–25.
11. Mardinoglu A, Bjornson E, Zhang C, et al. Personal model-assisted identification of NAD+ and glutathione metabolismas intervention target in NAFLD. Mol Syst Biol 2017;13:916.
12. Mardinoglu A, Ural D, Zeybel M, et al. The potential useof metabolic cofactors in treatment of NAFLD. Nutrients2019;11:1578.
13. Mardinoglu A, Agren R, Kampf C, et al. Genome-scalemetabolic modelling of hepatocytes reveals serine defi-ciency in patients with non-alcoholic fatty liver disease. NatCommun 2014;5:3083.
14. Mardinoglu A, Wu H, Bjornson E, et al. An integrated under-standing of the rapid metabolic benefits of a carbohydrate-restricted diet on hepatic Steatosis in humans. Cell Metab2018;27:559–571.e5.
15. Piening BD, Zhou W, Contrepois K, et al. Integrative personalOmics profiles during periods of weight gain and loss. CellSyst 2018;6:157–170.e8.
16. Mardinoglu A, Shoaie S, Bergentall M, et al. The gutmicrobiota modulates host amino acid and glutathionemetabolism in mice. Mol Syst Biol 2015;11:834.
17. Shoaie S, Nielsen J. Elucidating the interactions betweenthe human gut microbiota and its host through metabolicmodeling. Front Genet 2014;5:86.
18. Arora T, Bäckhed F. The gut microbiota and metabolic dis-ease: current understanding and future perspectives. J InternMed 2016;280:339–49.
19. Everard A, Belzer C, Geurts L, et al. Cross-talk between Akker-mansia muciniphila and intestinal epithelium controls diet-induced obesity. Proc Natl Acad Sci U S A 2013;110:9066–71.
20. Roopchand DE, Carmody RN, Kuhn P, et al. Dietary polyphe-nols promote growth of the gut bacterium akkermansia
Dow
nloaded from https://academ
ic.oup.com/bib/article/22/2/1751/5810888 by guest on 26 M
arch 2022
Addressing the heterogeneity in liver diseases using biological networks 1765
muciniphila and attenuate high-fat diet-induced metabolicsyndrome. Diabetes 2015;64:2847–58.
21. Saeed A, Dullaart RPF, Schreuder TCMA, et al. Disturbedvitamin A metabolism in non-alcoholic fatty liver disease(NAFLD). Nutrients 2018;10(29).
22. Rotman Y, Sanyal AJ. Current and upcoming pharmacother-apy for non-alcoholic fatty liver disease. Gut 2017;66:180–90.
23. El Hadi H, Vettor R, Rossato M. Vitamin E as a treatment fornonalcoholic fatty liver disease: reality or myth? Antioxidants2018;7:12.
24. Demeilliers C, Maisonneuve C, Grodet A, et al. Impairedadaptive resynthesis and prolonged depletion of hepaticmitochondrial DNA after repeated alcohol binges in mice.Gastroenterology 2002;123:1278–90.
25. Dara L, Ji C, Kaplowitz N. The contribution of endo-plasmic reticulum stress to liver diseases. Hepatology2011;53:1752–63.
26. Lavine JE, Schwimmer JB, Van Natta ML, et al. Effect of vita-min E or metformin for treatment of nonalcoholic fatty liverdisease in children and adolescents the tonic randomizedcontrolled trial. JAMA - JAMA 2011;305:1659–68.
27. Sanyal AJ, Chalasani N, Kowdley KV, et al. Pioglitazone, vita-min E, or placebo for nonalcoholic steatohepatitis. N Engl JMed 2010;362:1675–85.
28. Pietu F, Guillaud O, Walter T, et al. Ursodeoxycholic acidwith vitamin E in patients with nonalcoholic steato-hepatitis: long-term results. Clin Res Hepatol Gastroenterol2012;36:146–55.
29. Chalasani N, Younossi Z, Lavine JE, et al. The diagnosis andmanagement of nonalcoholic fatty liver disease: practiceguidance from the American Association for the Study ofLiver Diseases. Hepatology 2018;67:328–57.
30. Capanni M, Calella F, Biagini MR, et al. Prolonged n-3 polyun-saturated fatty acid supplementation ameliorates hepaticsteatosis in patients with non-alcoholic fatty liver disease:a pilot study. Aliment Pharmacol Ther 2006;23:1143–51.
31. Sofi F, Giangrandi I, Cesari F, et al. Effects of a 1-year dietaryintervention with n-3 polyunsaturated fatty acid-enrichedolive oil on non-alcoholic fatty liver disease patients: a pre-liminary study. Int J Food Sci Nutr 2010;61:792–802.
32. Spadaro L, Magliocco O, Spampinato D, et al. Effects of n-3polyunsaturated fatty acids in subjects with nonalcoholicfatty liver disease. Dig Liver Dis 2008;40:194–9.
33. Zhu FS, Liu S, Chen XM, et al. Effects of n-3 polyunsatu-rated fatty acids from seal oils on nonalcoholic fatty liverdisease associated with hyperlipidemia. World J Gastroenterol2008;14:6395–400.
34. Malaguarnera M, Gargante MP, Russo C, et al. L-carnitinesupplementation to diet: a new tool in treatment of nonal-coholic steatohepatitisa randomized and controlled clinicaltrial. Am J Gastroenterol 2010;105:1338–45.
35. Khoshbaten M, Aliasgarzadeh A, Masnadi K, et al. N-acetylcysteine improves liver function in patients with non-alcoholic fatty liver disease. Hepat Mon 2010;10:12–6.
36. Marchesini G, Bianchi G, Merli M, et al. Nutritional supple-mentation with branched-chain amino acids in advancedcirrhosis: a double-blind, randomized trial. Gastroenterology2003;124:1792–801.
37. Muto Y, Sato S, Watanabe A, et al. Effects of oral branched-chain amino acid granules on event-free survival in patientswith liver cirrhosis. Clin Gastroenterol Hepatol 2005;3:705–13.
38. Surai PF. Silymarin as a natural antioxidant: an overviewof the current evidence and perspectives. Antioxidants2015;4:204–47.
39. Loguercio C, Andreone P, Brisc C, et al. Silybin combinedwith phosphatidylcholine and vitamin e in patients withnonalcoholic fatty liver disease: a randomized controlledtrial. Free Radic Biol Med 2012;52:1658–65.
40. Mardinoglu A, Nielsen J. Systems medicine and metabolicmodelling. J Intern Med 2012;271:142–54.
41. Mardinoglu A, Nielsen J. New paradigms for metabolic mod-eling of human cells. Curr Opin Biotechnol 2015;34:91–7.
42. Rejc Z, Magdevska L, Trselic T, et al. Computational mod-elling of genome-scale metabolic networks and its applica-tion to CHO cell cultures. Comput Biol Med 2017;88:150–60.
43. Jensen PA, Papin JA. Functional integration of a metabolicnetwork model and expression data without arbitrarythresholding. Bioinformatics 2011;27:541–7.
44. Jensen PA, Lutz KA, Papin JA. TIGER: toolbox for integrat-ing genome-scale metabolic models, expression data, andtranscriptional regulatory networks. BMC Syst Biol 2011;5:147.
45. Zhang C, Lee S, Bidkhori G, et al. RMetD2: a tool for inte-gration of relative transcriptomics data into genome-scalemetabolic models. bioRxiv 2019;663096.
46. Brunk E, Sahoo S, Zielinski DC, et al. Recon3D enables a three-dimensional view of gene variation in human metabolism.Nat Biotechnol 2018;36:272–81.
47. Liu Z, Zhang C, Lee S, et al. Pyruvate kinase L/R is a regulatorof lipid metabolism and mitochondrial function. Metab Eng2019;52:263–72.
48. Pandey V, Hatzimanikatis V. Investigating the deregula-tion of metabolic tasks via minimum network enrichmentanalysis (MiNEA) as applied to nonalcoholic fatty liver dis-ease using mouse and human omics data. PLoS Comput Biol2019;15:e1006760.
49. Lee S, Zhang C, Kilicarslan M, et al. Integrated network anal-ysis reveals an association between plasma mannose levelsand insulin resistance. Cell Metab 2016;24:172–84.
50. Mardinoglu A, Stancáková A, Lotta LA, et al. Plasma mannoselevels are associated with incident type 2 diabetes and car-diovascular disease. Cell Metab 2017;26:281–3.
51. Lee S, Zhang C, Liu Z, et al. Network analyses identifyliver-specific targets for treating liver diseases. Mol Syst Biol2017;13:938.
52. Lee S, Zhang C, Arif M, et al. TCSBN: a database of tissueand cancer specific biological networks. Nucleic Acids Res2018;46:D595–600.
53. Bergström G, Berglund G, Blomberg A, et al. The SwedishCArdioPulmonary BioImage study: objectives and design. JIntern Med 2015;278:645–59.
54. Price ND, Magis AT, Earls JC, et al. A wellness study of 108individuals using personal, dense, dynamic data clouds. NatBiotechnol 2017;35:747–56.
55. Zhang C, Arif M, Li X, et al. MOBN: an interactive database ofmulti-omics biological networks. bioRxiv 2019;662502.
56. Bidkhori G, Benfeitas R, Klevstig M, et al. Metabolic network-based stratification of hepatocellular carcinoma revealsthree distinct tumor subtypes. Proc Natl Acad Sci U S A2018;115:E11874–83.
57. Yuan Z, Zhao C, Di Z, et al. Exact controllability of complexnetworks. Nat Commun 2013;4:2447.
58. Vinayagam A, Gibson TE, Lee HJ, et al. Controllability analysisof the directed human protein interaction network identifiesdisease genes and drug targets. Proc Natl Acad Sci U S A2016;113:4976–81.
59. Bidkhori G, Benfeitas R, Elmas E, et al. Metabolic network-based identification and prioritization of anticancer targets
Dow
nloaded from https://academ
ic.oup.com/bib/article/22/2/1751/5810888 by guest on 26 M
arch 2022

1766 Lam et al.
based on expression data in hepatocellular carcinoma. FrontPhysiol 2018;9:916.
60. Luo D, Wang Z, Wu J, et al. The role of hypoxia induciblefactor-1 in hepatocellular carcinoma. Biomed Res Int2014;409272:2014.
61. Dai Y, Liu L, Zeng T, et al. Characterization of the oncogenicfunction of centromere protein F in hepatocellular carci-noma. Biochem Biophys Res Commun 2013;436:711–8.
62. Li X, Zhang C, Kim W, et al. Discovery of functional alter-natively spliced PKM transcripts in human cancers. NatCommun 2019.
63. Dayton TL, Jacks T, Vander Heiden MG. PKM2, cancermetabolism, and the road ahead. EMBO Rep 2016;17:1721–30.
64. Sato Y, Yoshizato T, Shiraishi Y, et al. Integrated molec-ular analysis of clear-cell renal cell carcinoma. Nat Genet2013;45:860–7.
65. Wu S, Le H. Dual roles of PKM2 in cancer metabolism. ActaBiochim Biophys Sin (Shanghai) 2013;45:27–35.
66. Ashizawa K, Willingham MC, Liang CM, et al. In vivoregulation of monomer-tetramer conversion of pyruvatekinase subtype M2 by glucose is mediated via fructose 1,6-bisphosphate. J Biol Chem 1991;266:16842–6.
67. Israelsen WJ, Vander Heiden MG. Pyruvate kinase: func-tion regulation and role in cancer. Semin Cell Dev Biol2015;43:43–51.
68. Luo M, Wicha MS. Targeting cancer stem cell redoxmetabolism to enhance therapy responses. Semin RadiatOncol 2019;29:42–54.
69. Wang K, Jiang J, Lei Y, et al. Targeting metabolic–redoxcircuits for cancer therapy. Trends Biochem Sci 2019;44:401–14.
70. Benfeitas R, Bidkhori G, Mukhopadhyay B, et al. Character-ization of heterogeneous redox responses in hepatocellu-lar carcinoma patients using network analysis. EBioMedicine2019;40:471–87.
71. Hanahan D, Weinberg RA. Hallmarks of cancer: the nextgeneration. Cell 2011;144:646–74.
72. Masoud GN, Li W. HIF-1α pathway: role, regulation andintervention for cancer therapy. Acta Pharm Sin B 2015;5:378–89.
73. Vander Heiden MG, Cantley LC, Thompson CB. Understand-ing the Warburg effect: the metabolic requirements of cellproliferation. Science 2009;324:1029–33.
74. Tanaka M, Masaki Y, Tanaka K, et al. Reduction of fattyacid oxidation and responses to hypoxia correlate withthe progression of de-differentiation in HCC. Mol Med Rep2013;7:365–70.
75. Maldonado EM, Fisher CP, Mazzatti DJ, et al. Multi-scale,whole-system models of liver metabolic adaptation to fatand sugar in non-alcoholic fatty liver disease. NPJ Syst BiolAppl 2018;4:33.
76. Jager KJ, Fraser SDS. The ascending rank of chronic kidneydisease in the global burden of disease study. Nephrol DialTransplant 2017;32:ii121–8.
77. Moodie DS. The global burden of cardiovascular disease.Congenit Heart Dis 2016;11:213.
Dow
nloaded from https://academ
ic.oup.com/bib/article/22/2/1751/5810888 by guest on 26 M
arch 2022