Heavy Metals in Marine Sediments from the Mar Piccolo of Taranto (Ionian Sea, Southern Italy
15
Annali di Chimica, 96, 2006, by Società Chimica Italiana 727 HEAVY METALS IN MARINE SEDIMENTS FROM THE MAR PICCOLO OF TARANTO (IONIAN SEA, SOUTHERN ITALY) Nicola CARDELLICCHIO (°)1 , Alessandro BUCCOLIERI 2 , Antonella DI LEO 1 , Lucia SPADA 3 1 C.N.R. - Istituto per l’Ambiente Marino Costiero, via Roma 3, 74100 Taranto, Italy 2 Dipartimento di Scienza dei Materiali, Università degli Studi di Lecce, via per Monteroni, 73100 Lecce, Italy 3 Dipartimento di Chimica, Università degli Studi di Bari, via Orabona 4, 70126 Bari, Italy Summary – Heavy metals concentrations (Cd, Cu, Hg, Pb, Sn and Zn) have been determined monthly in surface sediments from the Mar Piccolo in Taranto (Ionian Sea, Southern Italy. a semi-enclosed marine basin very important from a mussel- culture point of view. In sediments, sulphides, percentage of organic carbon and redox potential were also determined to show possible correlations between metals levels and redox characteristics of marine sediments. Analytical results, elaborated by multivariate statistical techniques, confirm that sediments collected in the first inlet of Mar Piccolo, where shipbuilding activities are present, have a contamination level greater than those collected in the second inlet. For each metal, the geoaccumulation index (I geo ) has been calculated as criterion to evaluate both pollution levels and metals enrichment in examined sediments: I geo values confirm that the first inlet is an moderately polluted area from Hg and Pb. In any case, high sulphide concentrations and negative values of redox potentials bring to a conclusion that metals are present in sediments, mainly as insoluble sulphides and then as not bioavailable compounds for filter feeders organisms such as mussels. INTRODUCTION Anthropogenic activities, during the last few decades, have introduced significant amounts of pollutants metals into the marine environment. Many contaminants, such as heavy metals, are removed from sea water by physical-chemical and biological processes, including scavenging by sinking particulate or organic matter and are incorporated into sediments of the sea-bottom. In fact, numerous studies have demonstrated that sediments from coastal area near large industrial and urban centres are very often highly contaminated by heavy metals. 1 The benthic sediments contain metals at concentrations that often exceed those of the overlying water column by several orders of (°) Corresponding author; fax: (+39)-099-4542215; e-mail: [email protected]
-
Upload
independent -
Category
Documents
-
view
0 -
download
0
Transcript of Heavy Metals in Marine Sediments from the Mar Piccolo of Taranto (Ionian Sea, Southern Italy

Annali di Chimica, 96, 2006, by Società Chimica Italiana 727
HEAVY METALS IN MARINE SEDIMENTS FROM THE MAR PICCOLO
OF TARANTO (IONIAN SEA, SOUTHERN ITALY)
Nicola CARDELLICCHIO(°)1, Alessandro BUCCOLIERI2, Antonella DI LEO1, Lucia SPADA3
1 C.N.R. - Istituto per l’Ambiente Marino Costiero, via Roma 3, 74100 Taranto,
Italy 2 Dipartimento di Scienza dei Materiali, Università degli Studi di Lecce, via per
Monteroni, 73100 Lecce, Italy 3 Dipartimento di Chimica, Università degli Studi di Bari, via Orabona 4, 70126
Bari, Italy
Summary – Heavy metals concentrations (Cd, Cu, Hg, Pb, Sn and Zn) have been determined monthly in surface sediments from the Mar Piccolo in Taranto (Ionian Sea, Southern Italy. a semi-enclosed marine basin very important from a mussel-culture point of view. In sediments, sulphides, percentage of organic carbon and redox potential were also determined to show possible correlations between metals levels and redox characteristics of marine sediments. Analytical results, elaborated by multivariate statistical techniques, confirm that sediments collected in the first inlet of Mar Piccolo, where shipbuilding activities are present, have a contamination level greater than those collected in the second inlet. For each metal, the geoaccumulation index (Igeo) has been calculated as criterion to evaluate both pollution levels and metals enrichment in examined sediments: Igeo values confirm that the first inlet is an moderately polluted area from Hg and Pb. In any case, high sulphide concentrations and negative values of redox potentials bring to a conclusion that metals are present in sediments, mainly as insoluble sulphides and then as not bioavailable compounds for filter feeders organisms such as mussels.
INTRODUCTION
Anthropogenic activities, during the last few decades, have introduced significant amounts of
pollutants metals into the marine environment. Many contaminants, such as heavy metals, are removed from sea water by physical-chemical and biological processes, including scavenging by sinking particulate or organic matter and are incorporated into sediments of the sea-bottom. In fact, numerous studies have demonstrated that sediments from coastal area near large industrial and urban centres are very often highly contaminated by heavy metals.1 The benthic sediments contain metals at concentrations that often exceed those of the overlying water column by several orders of
(°) Corresponding author; fax: (+39)-099-4542215; e-mail: [email protected]

CARDELLICCHIO and coworkers 728
magnitude.2 In such situation, the contaminated sediments can represent a significant, long-term source of trace metals to the overlying water column and the aquatic organisms. The importance of sediments in terms of total load of trace metals in aquatic ecosystems has been recently recognised.3
Besides, heavy metals content in the sediment can have natural or anthropogenic origin and is influenced by mineralogical composition, reduction or oxidation processes, adsorption and/or desorption, sediment texture and physical transport. The result of these conditions changes the metals concentration in sediments in term of time, space and bioavailability.4-8 Mar Piccolo in Taranto is a typical polluted semi-enclosed basin of the Mediterranean Sea characterized by scarce water circulation: this condition encourages organic matter sedimentation that plays an important role in the transport and accumulation of metals in sediments. Mar Piccolo is an example of Mediterranean coastal marine ecosystem whose biological balances have been modified: in fact, the basin is constantly under considerable environmental stress, due to development of great metallurgical industry in the coastal area of Taranto, to maritime traffic (commercial and military) and discharge of urban waste-waters. Besides, this intense pollution situation represents a serious risk since the Mar Piccolo is one of the most important mussels farming areas in Italy. In particular, the mussel cultivated is Mytilus galloprovincialis (Lamark, 1819) an invasive warm water species that has been introduced to many parts of the world. Mytilus g. is a filter feeder and a strong “bioaccumulator” organism, that is a good indicator of the water quality. In this work, heavy metals concentrations (Cd, Cu, Hg, Pb, Sn and Zn) have been determined monthly in sediments collected from six sites in the Mar Piccolo, in order to evaluate metals levels and their spatial and temporal variation. Additionally, concentration of sulphides, organic carbon percentage and redox potential have been determined in order to show possible correlations between metals distribution and reduction/oxidation processes. Analytical data have been elaborated by multivariate statistical techniques. Finally, the geoaccumulation index has been calculated as a criterion to evaluate contamination levels of analyzed sediments.9
FIGURE 1 - Map of the sampling stations in the Mar Piccolo of Taranto.
Heavy Metals in Sediments from Mar Piccolo 729
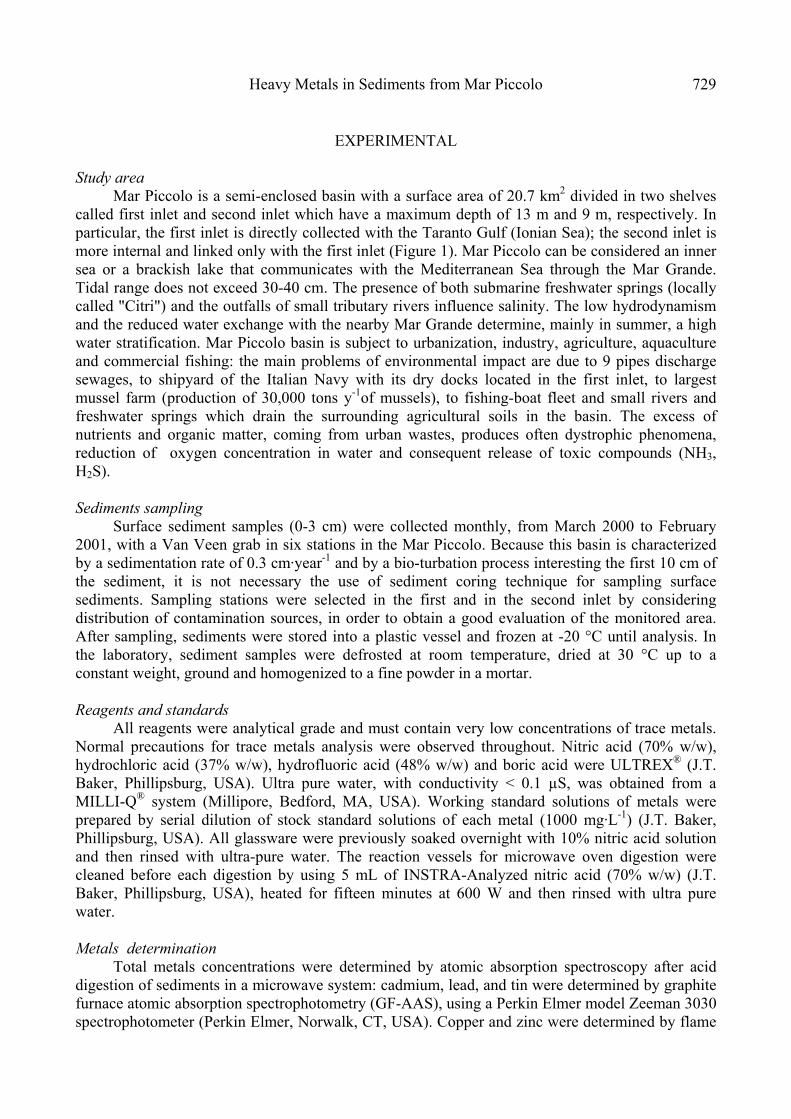
EXPERIMENTAL
Study area Mar Piccolo is a semi-enclosed basin with a surface area of 20.7 km2 divided in two shelves
called first inlet and second inlet which have a maximum depth of 13 m and 9 m, respectively. In particular, the first inlet is directly collected with the Taranto Gulf (Ionian Sea); the second inlet is more internal and linked only with the first inlet (Figure 1). Mar Piccolo can be considered an inner sea or a brackish lake that communicates with the Mediterranean Sea through the Mar Grande. Tidal range does not exceed 30-40 cm. The presence of both submarine freshwater springs (locally called "Citri") and the outfalls of small tributary rivers influence salinity. The low hydrodynamism and the reduced water exchange with the nearby Mar Grande determine, mainly in summer, a high water stratification. Mar Piccolo basin is subject to urbanization, industry, agriculture, aquaculture and commercial fishing: the main problems of environmental impact are due to 9 pipes discharge sewages, to shipyard of the Italian Navy with its dry docks located in the first inlet, to largest mussel farm (production of 30,000 tons y-1of mussels), to fishing-boat fleet and small rivers and freshwater springs which drain the surrounding agricultural soils in the basin. The excess of nutrients and organic matter, coming from urban wastes, produces often dystrophic phenomena, reduction of oxygen concentration in water and consequent release of toxic compounds (NH3, H2S). Sediments sampling
Surface sediment samples (0-3 cm) were collected monthly, from March 2000 to February 2001, with a Van Veen grab in six stations in the Mar Piccolo. Because this basin is characterized by a sedimentation rate of 0.3 cm·year-1 and by a bio-turbation process interesting the first 10 cm of the sediment, it is not necessary the use of sediment coring technique for sampling surface sediments. Sampling stations were selected in the first and in the second inlet by considering distribution of contamination sources, in order to obtain a good evaluation of the monitored area. After sampling, sediments were stored into a plastic vessel and frozen at -20 °C until analysis. In the laboratory, sediment samples were defrosted at room temperature, dried at 30 °C up to a constant weight, ground and homogenized to a fine powder in a mortar. Reagents and standards
All reagents were analytical grade and must contain very low concentrations of trace metals. Normal precautions for trace metals analysis were observed throughout. Nitric acid (70% w/w), hydrochloric acid (37% w/w), hydrofluoric acid (48% w/w) and boric acid were ULTREX® (J.T. Baker, Phillipsburg, USA). Ultra pure water, with conductivity < 0.1 µS, was obtained from a MILLI-Q® system (Millipore, Bedford, MA, USA). Working standard solutions of metals were prepared by serial dilution of stock standard solutions of each metal (1000 mg·L-1) (J.T. Baker, Phillipsburg, USA). All glassware were previously soaked overnight with 10% nitric acid solution and then rinsed with ultra-pure water. The reaction vessels for microwave oven digestion were cleaned before each digestion by using 5 mL of INSTRA-Analyzed nitric acid (70% w/w) (J.T. Baker, Phillipsburg, USA), heated for fifteen minutes at 600 W and then rinsed with ultra pure water. Metals determination
Total metals concentrations were determined by atomic absorption spectroscopy after acid digestion of sediments in a microwave system: cadmium, lead, and tin were determined by graphite furnace atomic absorption spectrophotometry (GF-AAS), using a Perkin Elmer model Zeeman 3030 spectrophotometer (Perkin Elmer, Norwalk, CT, USA). Copper and zinc were determined by flame

CARDELLICCHIO and coworkers 730
atomic absorption spectrophotometry (FAAS) using a Perkin Elmer model 1100 B spectrophotometer. Total Hg was determined by Advanced Mercury Analyzer AMA 254 (LECO Corporation, St. Joseph, MI) on to dried sediment sample without pre-treatment. A microwave oven CEM model MARSX (CEM Corporation, Matthews, NC) was used to accomplish sediments digestion.10-11
For samples digestion, 0.2 g of dried sediment was put into a PTFE vessel with 4 mL of nitric acid, 2 mL of hydrochloric acid and 2 mL of hydrofluoric acid. For each digestion program, a blank sample was prepared with the same amount of acids. The digestion program for microwave system was the following: temperature and pressure rise respectively to 160 °C and 130 PSI in 20 minutes and remain at 160 °C for 30 minutes. After digestion, samples were diluted with 20 mL of boric acid, to permit elimination of fluoride in excess by complexation. Each sample was filtered, diluted to 50 mL with ultra-pure water and analyzed.12-13 The accuracy and precision of the analytical procedures have been checked by analysing a certified reference marine sediment IAEA-356.14-15 Analytical results indicate a good agreement between certified and found values (Table 1).
TABLE 1 - Metals concentrations (µg⋅g-1 dry weight) for the certified marine sediment IAEA-356.
Element
Certified value
Certified range
Found value
Cd 4.47 4.32 ÷ 4.77 4.27 ± 0.20
Cu 365 351 ÷ 375 358 ± 13
Hg 7.62 6.74 ÷ 7.98 7.50 ± 0.26
Pb 347 301 ÷ 365 352 ± 25
Sn 52.5 43.6 ÷ 62.2 58.4 ± 10.1
Zn 977 936 ÷ 1019 941 ± 15
Sulphides, organic carbon and redox potential determination
The sulphides were determined according to method proposed by Allen et al., 1993.16 This procedure included a sample acid treatment step, under nitrogen inert atmosphere, in order to promote metallic sulfides dissociation. In this acid medium (6 mol L-1 HCl), H2S was formed: it was carried out by nitrogen gas and was absorbed in a sodium hydroxide solution (purge and trap technique). The concentration of sulphides was then determined by colorimetric method using p-phenilene diamine as chromogenic reagent (methylene blue method).
Total organic carbon was determined using the loss-on-ignition method:17 1 g of wet sediment was transferred to a pre-weighed crucible and dried at 100 °C for 24 hours. The sample was weighed and heated at 500 °C for one hour. Total organic carbon content was calculated by difference between the weight of the sediment dry at 100 °C and the weight after 500 °C heating. Redox potential was determined by a platinum redox electrode Crison (Crison Instruments, Spain). Statistical analysis
Experimental data have been elaborated by multivariate statistical analysis to evaluate the possibility of differentiate sampling stations.18-20 Multivariate statistical analysis was performed by

Heavy Metals in Sediments from Mar Piccolo 731
using the computer software package STATISTICA® (StatSoft Inc., Tulsa, OK, USA). The statistical techniques were: Principal Component Analysis (PCA) and Hierarchical Clustering Analysis (HCA).21.22
RESULTS AND DISCUSSION
Table 2 shows annual mean (n=12), standard deviation, minimum and maximum values of metals concentrations, sulphides, organic carbon percentage and redox potential in analysed sediments. Table 3 and Table 4 summarize mean, minimum, maximum values and standard deviation of determined parameters for the first and the second inlet, respectively. Concerning mean values of metals, for both inlets, Zn shows the highest concentrations. Mean Pb concentrations are higher than Cu, Sn, Hg and Cd concentrations for the first inlet, while for the second inlet mean Cu concentrations are higher than Pb, Sn, Hg and Cd ones. Besides Cu, Hg, Pb, Sn and Zn mean concentrations are higher in sediments collected from the first inlet than those collected from the second inlet, while Cd mean concentration is similar between two areas in the Mar Piccolo. This results, in agreement with those found by Calace et al., 2005 23, show that the two inlets of the Mar Piccolo are different from the environmental impact point of view: the first inlet, in fact, is more contaminated by metals, both for waters coming from the Mar Grande (influenced from industrial waste waters), and, above all, for the presence of shipbuilding activities of the Italian Navy base. Concerning to this last activity, the greater concentration of metals, such as Sn and Cu, in the first inlet is justified with the use of these elements in antifouling paints, even if organotin compounds are actually banned like additives in paints for marine use.
Figure 2 shows monthly variation of some important metals concentrations (Hg, Pb and Zn) in two inlets. It is easy to observe that metal concentrations are higher in the sediments collected in the first inlet than in the second inlet. In general, in the first inlet, highest concentrations for Pb and Hg have been observed mainly in the spring in touch with phytoplankton development and organic matter sedimentation on the bottom. Seasonal variations in metals concentration can be explained both with various inputs of waters in the basin (various flows from submarine springs, etc.), and the cycle of organic matter and primary production. Usually, phytoplankton development shows two maximums: one in spring, the other to the end of the autumn ,when it breaks off the waters stratification and bottom waters, rich of nutrients, go up in surface. In these cases the high phytoplankton concentration and the high sedimentation rate of organic substance are responsible for metals accumulation on the bottom.24 In the second inlet, monthly variations on metal concentrations are more complex because there are different factors that influence metal concentrations in sediments.
Tables 2-4 show that sulphides concentration is rather high. Because of reduced hydrodynamic of the basin, it’s often possible to find anoxic conditions on the bottom. Sulphides concentration reaches a maximum value (864 µg g-1 d.w.) in station 4 (second inlet) in November and February, while it reaches the least value (65 µg g-1 d.w.) in station 5 in May. The second inlet is the inner part of the basin and it is subject to a slower waters exchange. The phenomena of waters stratification, slow down the oxygen diffusion on the bottom: therefore, the organic substance undergoes anaerobic degradation with high hydrogen sulphide production.
Annual mean values of organic carbon, determined in the six stations, was relatively high, ranging from 3.7 to 5.0%. Organic carbon content has the higher value in the second inlet (9,7%) because of smaller hydrodinamism of the waters and discharge of urban waste waters. These phenomena produce organic matter sedimentation on the bottom. But it has not been found any significant correlation between sulphides concentration and organic carbon percentage.

CARDELLICCHIO and coworkers 732
Besides, the content of organic matter plays an important role in the transport and adsorption of metals in marine sediments, especially in the investigated area characterized by reduced marine currents. This situation produces consumption of dissolved oxygen in the waters. In fact, a considerable fraction of organic matter on the bottom undergoes anaerobic degradation processes with the production of hydrogen sulphide. It causes pH decrease in the interstitial water, with dissolution of metals bound to carbonates and precipitation of insoluble metal sulphides, that confer the blackish characteristic colour to sediments. The redox potential, in fact, shows always negative values.
Redox conditions can influence trace metal behaviour in benthic sediments either directly or indirectly through a change in the oxidation state of a ligand, capable of complexing the metal. Change in redox conditions can also cause the decomposition of mineral species that may sorb trace metals. At Eh values less than approximately -120 mV, sediment can be considered anoxic and reduction of SO4
2- to H2S occurs.25 In strongly anoxic sediments, such as those in Mar Piccolo, sulphide production via bacterial sulphate would be expected to buffer pore-water metal concentrations to very low levels, via precipitation-dissolution of sulphide mineral.26 Several researches have shown that the ratio of acid-volatile sulphide (AVS) to simultaneously extracted metals (SEM) largely dictates metal bioavailability and thus toxicity in anoxic sediments.27-30
Table 5 and Table 6 summarize the correlation coefficients among the determined parameters for the first inlet and the second inlet, respectively. Highly significant correlation coefficients (p < 0.001) are in boldface. For the first inlet, the most noticeable correlations were found between the pairs Zn-Pb (R = 0.86), Pb-Hg (R = 0.69) and Zn-Sn (R = 0.62), while for the second inlet, the most noticeable correlations were found between the pairs Sn-Pb (R = 0.89), Zn-Sn (R = 0.85), Zn-Pb (R = 0.76), Cu-Pb (R = 0.74) and Sn-Cu (R = 0.67). This suggested that the correlated metals may have a similar origin and the investigated sediments were contaminated simultaneously by these heavy metals. Other authors found similar correlations among these metals.23,31
Experimental data were processed by multivariate statistical analysis to evaluate the possibility of distinguishing samples in relation to different sampling site and/or to different pollution sources. Hierarchical clustering analysis (HCA) and principal component analysis (PCA) were applied on a data set of seventy-two sediments and nine variables (Cd, Cu, Hg, Sn, Pb, Zn, sulphides, percentage of organic carbon and redox potential) by using the software package STATISTICA® (StatSoft Inc., Tulsa, OK, USA).

Heavy Metals in Sediments from Mar Piccolo 733
TABLE 2 - Annual mean, standard deviation, minimum and maximum values of metals (µg·g-1 dry weight), sulphides (mg·kg-1), organic carbon (g %) and redox potential (mV) in sediments of six stations.
Station 1 Station 2 Station 3 Station 4 Station 5 Station 6
Cd 0.62±0.26 a 0.35/1.05 b
0.64±0.21 0.28/0.99
0.67±0.26 0.28/1.07
0.64±0.24 0.15/1.14
0.78±0.47 0.25/2.04
0.43±0.19 0.27/0.85
Cu 100±24 64/140
81±36 49/188
70±25 35/126
53±12 36/75
46±9 33/60
35±10 20/50
Hg 3.09±0.75 2.27/4.90
3.17±1.04 1.69/5.72
1.61±0.79 1.07/3.97
0.77±0.46 0.35/1.96
0.74±0.77 0.03/2.48
0.36±0.27 0.06/0.95
Pb 134±29 78/191
116±14 96/141
82±24 42/125
55±13 30/78
47±13 27/69
29±6 18/36
Sn 7.2±2.3 3.9/11.0
5.9±2.0 2.7/9.4
3.6±1.0 2.2/5.7
2.6±0.9 0.8/4.4
2.0±0.9 0.8/4.1
1.0±0.3 0.6/1.6
Zn 264±40 202/322
250±37 202/310
208 ±51 137/308
211±58 147/367
175±70 79/338
108±21 76/139
S2- 369±162 76/604
325±114 188/618
378±151 176/612
566±251 122/864
368±226 54/724
425±242 78/864
%OC 5.0±1.2 2.3/6.8
3.7±1.2 2.4/6.8
5.0±1.5 2.5/8.3
4.1±1.0 2.0/5.6
3.7±0.8 2.2/4.9
4.5±2.1 1.4/9.7
Eh -235±82 -416/-130
-251±68 -396/-125
-230±86 -388/-65
-290±55 -392/-220
-248±80 -381/-103
-211± 68 -310/-78
a Mean value ± standard deviation. b Minimum/maximum value.
TABLE 3 - Mean, minimum, maximum annual values and standard deviation for the first inlet (n=36).
Mean Minimum Maximum Std. Dev.
Cd (µg·g-1) 0.64 0.28 1.07 0.24
Cu (µg·g-1) 84 35 188 31
Hg (µg·g-1) 2.62 1.07 5.72 1.11
Pb (µg·g-1) 111 42 191 31
Sn (µg·g-1) 5.6 2.2 11.0 2.3
Zn (µg·g-1) 241 137 322 48
S2- (mg ·kg-1) 357 76 618 142
% OC (g %) 4.5 2.3 8.3 1.4
Eh (mV) -191 -416 -65 164

CARDELLICCHIO and coworkers 734
TABLE 4 - Mean, minimum, maximum annual values and standard deviation for the second inlet (n=36).
Mean Minimum Maximum Std. Dev.
Cd (µg·g-1) 0.62 0.15 2.04 0.35 Cu (µg·g-1) 45 20 75 12 Hg (µg·g-1) 0.66 0.03 2.48 0.56 Pb (µg·g-1) 44 18 78 16 Sn (µg·g-1) 1.9 0.6 4.4 1.0 Zn (µg·g-1) 165 76 367 68
S2- (mg ·kg-1) 453 54 864 248 % OC (g %) 4.1 1.4 9.7 1.4
Eh (mV) -249 -392 -78 74
TABLE 5 - Linear correlation coefficients among determined parameters in the first inlet (n=36).
Cd Hg Pb Cu Sn Zn S2- %OC Eh
Cd 1.00 Hg 0.25 1.00 Pb 0.25 0.69 1.00 Cu 0.18 0.28 0.51 1.00 Sn -0.17 0.22 0.57 0.52 1.00 Zn 0.30 0.57 0.86 0.49 0.62 1.00 S2- 0.23 -0.11 0.08 0.23 0.14 0.15 1.00
% OC 0.12 -0.25 -0.06 0.08 -0.07 0.04 0.06 1.00 Eh 0.26 -0.16 -0.19 -0.16 -0.17 -0.04 0.18 -0.01 1.00
TABLE 6 - Linear correlation coefficients among determined parameters in the second inlet (n = 36).
Cd Hg Pb Cu Sn Zn S2- %OC Eh
Cd 1.00 Hg 0.17 1.00 Pb 0.24 0.32 1.00 Cu -0.00 -0.03 0.74 1.00 Sn 0.19 0.37 0.89 0.67 1.00 Zn 0.22 0.52 0.76 0.49 0.85 1.00 S2- -0.32 -0.43 0.23 0.43 0.28 0.00 1.00
% OC -0.19 -0.26 -0.10 0.10 0.03 -0.13 0.40 1.00 Eh -0.14 -0.02 -0.39 -0.46 -0.29 -0.11 -0.32 0.04 1.00

Heavy Metals in Sediments from Mar Piccolo 735
FIGURE 2 - Monthly variations of Hg (a), Pb (b) and Zn (c) for the first and the second inlet.

CARDELLICCHIO and coworkers 736
Hierarchical clustering analysis was carried out using the Complete Linkage procedure applied on Euclidean Distances. The resultant dendrogram (Figure 3) shows that sediments are divided into three clusters which can be identified as follows: the first includes three sediments sampled from first inlet, the second includes sediments sampled from second inlet (except nine samples) and the third includes sediments sampled from first inlet (except fourteen samples). These assemblages confirm that the sediments collected in the first inlet have a chemical composition different from those collected in the second inlet.
For principal component analysis, five principal components have been extracted by covering 89.6 % of the cumulative variance. The variance of the five principal components is 44.4 %, 15.5 %, 11.6 %, 9.9 % and 8.3 % respectively. The loading of the variables on the first two principal components (Figure 4) shows that Pb, Sn, Zn, Hg and Cu are the dominant variables on the PC1, while sulphides and organic carbon are the dominant variables on the PC2. The scatter plot of the scores on the first two principal components PC1 and PC2 (Figure 5) shows that all samples collected from first inlet (except seven sediments sampled from station n. 3) have a negative score on the PC1. On the contrary, all samples collected from the second inlet, except two (one sediments sampled from station n. 4 and one sampled from station n. 5), have a positive score on the same component. This distinction is reasonable by considering that the greater number of the sediments collected from first inlet has metals concentration higher than the samples collected from second inlet.
FIGURE 3 - Hierarchical clustering dendrogram of the investigated sediments. Geoaccumulation index has been calculated, for each metal, in order to evaluate metals
contamination in the Mar Piccolo. Geoaccumulation index was originally defined by Müller in order to determine metals contamination in sediments by comparing current concentrations with pre-industrial levels.32 Geoaccumulation index (Igeo) can be calculated by the equation (1):
Igeo = log2 [Cn/(1.5·Bn)] (1)

Heavy Metals in Sediments from Mar Piccolo 737
where Cn is the measured concentration of an examined metal “n” in the sediment and Bn is the geochemical background concentration of the metal “n”. The factor 1.5 is used since of possible variations of background values for a given metal in the environment, as well as very small anthropogenic influences.
Müller has distinguished seven classes of sediments: unpolluted (Igeo ≤ 0), from unpolluted to moderately polluted (0 < Igeo < 1), moderately polluted (1 < Igeo < 2), from moderately to strongly polluted (2 < Igeo < 3), strongly polluted (3 < Igeo < 4), from strongly to extremely polluted (4 < Igeo < 5), extremely polluted (Igeo > 5).33
Several authors have described that is very difficult to establish Bn values mainly for sediments of the Mediterranean Sea, owing to geochemical variability of various areas and different anthropogenic impact. However, in this work, geoaccumulation index has been calculated by using both background values calculated from global average shale34 and background values for Ionian Sea sediments calculated, for some metals, by Buccolieri et al.35 (Table 7). Our choice appears reasonable by comparing geochemical background values with data exhibited from other authors for different areas of the Mediterranean Sea.36-39 The comparison of the background values is often difficult because metals concentrations were determined in different sediment fractions and by using different digestion procedures.
Results of geoaccumulation index (Table 8) allow discriminating the sediments collected from two inlets and, in particular, those collected from stations n. 1 and n. 2 from those collected from station n. 6. Sediments collected from station n. 6 are unpolluted. For Cu and Zn, the stations n. 1 and n. 2 are from unpolluted to moderately polluted. For Sn, all the samples are unpolluted. With respect to mercury, highest contaminations were found in stations n. 1 and n. 2 of the first inlet, even if the value of Igeo differs between the stations according to two different background levels considered.
FIGURE 4 - Loading of the variables on the first two principal components.

CARDELLICCHIO and coworkers 738
Hence, especially Hg concentrations are worrying by considering the activities of mussels farming present in Mar Piccolo, indeed, the accumulation of toxic elements throughout the food chain, leads to serious human health risks.40 However, sulphide concentrations and negative values of redox potentials in the sediment may us suppose that mercury is present in the sediments mainly as insoluble sulphide and then not bioavailable: however this hypothesis should be confirmed by speciation analysis.
Contamination in stations n. 1 and n. 2 is probably related to the presence of the Italian Base Navy shipyard in the Southern part of the basin. Concerning lead, the higher values of Igeo were calculated for stations n. 1 and n. 2 if we consider the Bn value by Turekian and Wedepohl.34 Differently, considering the Buccolieri et al. values 35, background levels are lower, so changing the background levels, we can change the evaluations of the contamination state in the sediments too. For this reason, the choice of background levels represents a crucial phase for an environmental correct evaluation of metal pollution.
FIGURE 5 - Scatter plot of the scores for the first two principal components.

Heavy Metals in Sediments from Mar Piccolo 739
TABLE 7 - Comparison between the geochemical background values (Bn) for metals in sediments (µg·g-1 d.w.)
Element Bn by using average shale 34 Bn by using Ionian Sea values 35
Cd 0.3 not determined
Cu 45 47
Hg 0.4 0.07
Pb 20 59
Sn 6 not determined
Zn 95 97
TABLE 8 - Results of the geoacumulation index. Station Igeo Igeo
Cd Cu Hg Pb Sn Zn Cu Hg Pb Zn
1 0.46 0.57 2.36 2.16 -0.33 0.89 0.51 4.88 0.59 0.86
2 0.51 0.27 2.40 1.95 -0.61 0.81 0.21 4.92 0.38 0.78
3 0.57 0.04 1.42 1.46 -1.31 0.55 -0.02 3.94 -0.10 0.52
4 0.51 -0.36 0.36 0.88 -1.80 0.57 -0.42 2.87 -0.68 0.54
5 0.79 -0.57 0.30 0.65 -2.17 0.30 -0.63 2.82 -0.91 0.27
6 -0.07 -0.93 -0.74 -0.05 -3.21 -0.40 -1.00 1.78 -1.61 -0.43
Obtained by using Bn values from Turekian and Wedepohl, 196134
Obtained by using Bn values from Buccolieri et al., 2006 35
CONCLUSIONS
This work has allowed to determine metals concentrations, sulphides, organic carbon percentage and redox potential in one of the most important Italian areas devoted to mussel farming. This study has permitted to obtain information about toxic metal levels in a basin of the Mediterranean Sea, where euthrophication phenomena are often present. The use of multivariate statistical techniques and the geoaccumulation index determination permit distinguishing sampling stations of the two inlets in the Mar Piccolo. The obtained results show a higher contamination, especially by Hg and Pb, in the first inlet, where ship-building activities and mussel culture are present. The high concentration of sulphides found in two inlets, is an indication of organic matter anaerobic degradation on the bottom. Therefore, metals are found as insoluble sulphides and they are not bioavailable, even if speciation analysis has not been effected. The scarce metal bioavailability reduces metals bioaccumulation in filter-feeders organisms, such as the mussels cultured in the basin. Igeo determination has demonstrated the importance of this index in order to identify contaminated areas. The obtained indexes have shown that the first inlet is a contaminated area and therefore it represents an ecotoxicological risk area for marine organisms. This methodological approach is a simple and powerful tool for the study of metal pollution in coastal

CARDELLICCHIO and coworkers 740
marine areas, because it is possible to characterize the accumulation sites and evaluate the possible pollution sources.
Received March 30th, 2006
Acknowledgements - The Authors thank Cristina Annicchiarico, Santina Giandomenico and
Stefania Santoro for their contribution to data collection and analyses.
REFERENCES
1) R. Zonta, L. Zaggia, E. Argese, The Science of the Total Environment, 151, 19 (1994). 2) G.W. Bryan, and W.J. Langston, Environmental Pollution, 76, 89 (1992). 3) ANZECC/ARMCANZ, Australian and New Zealand Guidelines for Fresh and Marine
Waters Quality. Australian and New Zealand Environment and Conservation Council and Agriculture and Resource Management Council of Australian and New Zealand, (2000).
4) W. Solomons and U. Förstner, Metals in the Hydrocycle, Springer Verlag, Berlin, 349, (1984). 5) P. Puig, A. Palanques, J. Sanchez-Cabeza, P. Masqué, Marine Chemistry, 63, 311 (1999). 6) S.E. Manahan, Environmental Chemistry - Seventh Edition, Lewis Publishers, CRC Press LLC,
898, (2000). 7) L.G. Bellucci, M. Frignani, D. Paolucci, M. Ravanelli, The Science of the Total Environment,
295, 35 (2002). 8) J. Wainwrlght and J.B. Thornes, Environmental Issue in the Mediterranean. Processes and
perspectives from the past and present, Routledge Editor, London and New York, 479, (2004).
9) K. Loska, J. Cebula, J. Pelczar, D. Wiechula, J. Kwapulinski, Water, Air and Soil Pollution, 93, 347 (1997).
10) SW-846 EPA Method 3051A, Microwave assisted acid digestion of sediments, sludges, soils and oils in: Test Methods for Evaluating Solid Waste, 3rd edition, 3rd update. U. S. Environmental Protection Agency (USEPA), Washington, DC, 25 (1998).
11) V. Sandroni, C.M.M. Smith, A. Donovan, Talanta, 60, 715 (2003). 12) C. Minoia, M. Bettinelli, E. Sabbioni, Applicazioni dell’ICP-AES nel laboratorio chimico e
tossicologico. Morgan Edizioni Tecniche, Milan, Italy, 860 (1993). 13) M. Bettinelli, G.M. Beone, S. Spezia, C. Baffi, Analytica Chimica Acta, 424, 289 (2000). 14) M. Coquery, F.P. Carvalho, S. Azemard, M. Horvat, The Science of the Total Environment,
237/238, 501 (1999). 15) A. Buccolieri, G. Buccolieri, N. Cardellicchio, A. Dell'Atti, A. Di Leo, A. Maci, B.M.
Petronio, Annali di Chimica, 94(7-8), 469 (2004). 16) H.E. Allen, G. Fu, B. Deng, Environ. Toxicol. Chem., 12, 1441 (1993). 17) W.J. King, J.G. Queen, R. Wright, Inorganic and organic characterization of dredged
sediments from the proposed Quonset Point Channel in Narragansett Bay, University of Rhode Island, URITC PROJECT, N. 536143 (2003).
18) D.L. Massart, B.G.M. Vandegiste, S.N. Deming, Y. Michotte, L. Kaufman, Chemometrics: a textbook, Elsevier Science Publ. B.V., Amsterdam, The Netherlands, 154 (1988).
19) I.E. Frank and R. Todeschini, The data analysis handbook, Elsevier Science Publ. B.V., Amsterdam, The Netherlands, 339 (1994).
20) M. Defernez and E.K. Kemsley, Trends in Analytical Chemistry, 16, 216 (1997). 21) P.K.S. Shin and W.K.C. Lam, Environmental Pollution, 113, 281 (2001). 22) K. Loska and D. Wiechula, Chemosphere, 51, 723 (2003).

Heavy Metals in Sediments from Mar Piccolo 741
23) N. Calace, S. Ciardullo, B.M. Petronio, M. Pietrantonio, F. Abbondanzi, T. Campisi, N. Cardellicchio, Microchemical Journal, 79, 243 (2005).
24) C. Caroppo and N. Cardellicchio, Oebalia, International Journal of Marine Biology and Oceanography, XX1, 61 (1995).
25) R.J. Bartlet, Characterising soil redox behaviour. In Soil Physical Chemistry, 2nd ed. D.L. Sparks (Ed) CRC Press, Boca Raton, Fl. (1999).
26) S.L. Simpson, L. Rochford and G.F. Birch, Mar. Fresh Water Res., 53, 9 (2002). 27) W.J. Berry, D.J. Hansen, J.D. Mahony, D.L. Robson, D.M. Di Toro, B.P. Shipley, B. Rogers,
J.M. Corbin and W.S. Boothman, Environ. Toxicol Chem.,15, 2067 (1996). 28) W. Calmano, J. Hong, U. Forstner, Wat. Sci. Technol, 28, 223 (1993). 29) D.M. Di Toro, J.D. Mahoney, D.J. Hansen, K.J. Scott, A.R. Carlson, and G.T. Ankley,
Environmental Science and Technology 26(1), 96 (1992). 30) D.M. Di Toro, C.S. Zarba, D.J. Hansen, W.J. Berry, R.C. Swartz, C.E. Cowan, S.P. Pavlou,
H.E. Allen, N.A. Thomas and P.R. Paquin (1991). Environmental Toxicology and Chemistry 10, 1541 (1991).
31) M. Salizzato, B. Pavoni, A. Volpi Ghirardini, P.F. Ghetti, Chemosphere, 36, 2949 (1998). 32) G. Müller, Umschan, 79, 778 (1979). 33) G. Müller, Chemical Zeitung, 105, 157(1981). 34) K.K. Turekian and K.H. Wedepohl, Bull. Geol. Soc. Am., 72, 175 (1961). 35) A. Buccolieri, G. Buccolieri, N. Cardellicchio, A. Dell’Atti, A. Di Leo, A. Maci, Marine
Chemistry, 99, 227 (2006). 36) R. Donazzolo, O.H. Merlin, L. Menegazzo Vitturi, A.A. Orio, B. Pavoni, G. Perin, S. Rabitti,
Marine Pollution Bulletin, 12, 417 (1981). 37) A. Karageorgis, C. Anagnostou, A. Sioulas, G. Chronis, E. Papathanassiou, Journal of Marine
Systems, 16, 269 (1998). 38) B. Rubio, M.A. Nombela, F. Vilas, Marine Pollution Bulletin, 40, 968 (2000). 39) F. Ruiz, Marine Pollution Bulletin, 42, 482 (2001). 40) M. Nendza, Chemosphere, 48, 865 (2002).