The presynaptic glycine transporter GlyT2 is regulated by the ...
Upload
independentCategory
view
0download
0
Genomewide Association for Major Depressive Disorder: Apossible role for the presynaptic protein Piccolo
Patrick F. Sullivan, MD,University of North Carolina, Chapel Hill [email protected]
Eco J.C. de Geus, PhD,VU University Amsterdam [email protected]
Gonneke Willemsen, PhD,VU University Amsterdam [email protected]
Michael R. James, PhD,Queensland Institute for Medical Research [email protected]
Jan H. Smit, PhD,VU University Medical Center Amsterdam [email protected]
Tim Zandbelt, MSc,VU University Medical Center Amsterdam [email protected]
Volker Arolt, MD,University of Münster [email protected]
Bernhard T. Baune, MD MPH,James Cook University Queensland [email protected]
Correspond with Dr. Sullivan, Dept. of Genetics, CB#7264, 4109D Neurosciences Research Building, Univ. of North Carolina,Chapel Hill, NC, 27599-7264, USA. Voice: +919-966-3358, FAX: +919-966-3630. E-mail: [email protected]..†These authors contributed equally.
Financial Disclosures (Prior 3 Years)Dr. Baune has received honoraria for educational training of psychiatrists and general practitioners from Lundbeck, Astra Zeneca andPfizer Pharmaceuticals and travel grants from Astra Zeneca, Bristol-Meyer Squibb, Janssen and Pfizer Pharmaceuticals. Dr. Fava hasreceived: research support from Abbott Laboratories, Alkermes, Aspect Medical Systems, Astra-Zeneca, Bristol-Myers SquibbCompany, Cephalon, Eli Lilly & Company, Forest Pharmaceuticals Inc., GlaxoSmithkline, J & J Pharmaceuticals, Lichtwer PharmaGmbH, Lorex Pharmaceuticals, Novartis, Organon Inc., PamLab, LLC, Pfizer Inc, Pharmavite, Roche, Sanofi-Aventis, SolvayPharmaceuticals, Inc., Synthelabo, Wyeth-Ayerst Laboratories; advisory/consulting fees from Abbott Laboratories, Amarin, AspectMedical Systems, Astra-Zeneca, Auspex Pharmaceuticals, Bayer AG, Best Practice Project Management, Inc., BiovailPharmaceuticals, Inc., BrainCells, Inc. Bristol-Myers Squibb Company, Cephalon, CNS Response, Compellis, CypressPharmaceuticals, Dov Pharmaceuticals, Eli Lilly & Company, EPIX Pharmaceuticals, Fabre-Kramer Pharmaceuticals, Inc., ForestPharmaceuticals Inc., GlaxoSmithkline, Grunenthal GmBH, Janssen Pharmaceutica, Jazz Pharmaceuticals, J & J Pharmaceuticals,Knoll Pharmaceutical Company, Lorex Pharmaceuticals, Lundbeck, MedAvante, Inc., Merck, Neuronetics, Novartis, Nutrition 21,Organon Inc., PamLab, LLC, Pfizer Inc, PharmaStar, Pharmavite, Precision Human Biolaboratory, Roche, Sanofi-Aventis, Sepracor,Solvay Pharmaceuticals, Inc., Somaxon, Somerset Pharmaceuticals, Synthelabo, Takeda, Tetragenex, Transcept Pharmaceuticals,Vanda Pharmaceuticals Inc, Wyeth-Ayerst Laboratories; speaking fees from Astra-Zeneca, Boehringer-Ingelheim, Bristol-MyersSquibb Company, Cephalon, Eli Lilly & Company, Forest Pharmaceuticals Inc., GlaxoSmithkline, Novartis, Organon Inc., Pfizer Inc,PharmaStar, Primedia, Reed-Elsevier, Wyeth-Ayerst Laboratories; has equity holdings inCompellis, MedAvante; and has royalty/patent, other income for patent applications for SPCD and for a combination of azapirones and bupropion in MDD, copyright royaltiesfor the MGH CPFQ, DESS, and SAFER. Dr. Nolen has received: speaking fees from Astra Zeneca, Eli Lilly, Pfizer, Servier, Wyeth;unrestricted research funding from Astra Zeneca, Eli Lilly, GlaxoSmithKline, Wyeth; and served on advisory boards for Astra Zeneca,Cyberonics, Eli Lilly, GlaxoSmithKline, Pfizer, Servier. Dr. Perlis has received consulting fees or honoraria from AstraZeneca, BristolMyers-Squibb, Eli Lilly, GlaxoSmithKline, Pfizer, and Proteus; he is a stockholder in Concordant Rater Systems, LLC, and the holderof a patent related to the monitoring of raters in clinical trials. Dr. Smoller has consulted to Eli Lilly, received honoraria fromHoffman-La Roche, Inc, Enterprise Analysis Corp. and MPM Capital, and has served on an advisory board for Roche DiagnosticsCorporation. Dr. Sullivan has received unrestricted research support from Eli Lilly.
NIH Public AccessAuthor ManuscriptMol Psychiatry. Author manuscript; available in PMC 2009 October 1.
Published in final edited form as:Mol Psychiatry. 2009 April ; 14(4): 359–375. doi:10.1038/mp.2008.125.
NIH
-PA Author Manuscript
NIH
-PA Author Manuscript
NIH
-PA Author Manuscript

Douglas Blackwood, MD,University of Edinburgh [email protected]
Sven Cichon, PhD,University of Bonn [email protected]
William L. Coventry,University of New England [email protected]
Katharina Domschke, MD MA,University of Münster [email protected]
Anne Farmer, MD PhD,Institute of Psychiatry [email protected]
Maurizio Fava, MD,Harvard Medical School [email protected]
Scott D. Gordon,Queensland Institute for Medical Research [email protected]
Qianchuan He,University of North Carolina, Chapel Hill [email protected]
Andrew Heath, PhD,Washington University, St. Louis [email protected]
Peter Heutink, PhD,VU University Medical Center Amsterdam [email protected]
Florian Holsboer, MD PhD,Max-Planck Institute of Psychiatry [email protected]
Witte J. Hoogendijk, MD PhD,VU University Medical Center Amsterdam [email protected]
Jouke Jan Hottenga, PhD,VU University Amsterdam [email protected]
Yijuan Hu,University of North Carolina, Chapel Hill [email protected]
Martin Kohli, MSc,Max-Planck Institute of Psychiatry [email protected]
Danyu Lin, PhD,University of North Carolina, Chapel Hill [email protected]
Suzanne Lucae, MD PhD,Max-Planck Institute of Psychiatry [email protected]
Donald J. MacIntyre, MRCPsych,Royal Edinburgh Hospital [email protected]
Wolfgang Maier, MD,University of Bonn [email protected]
Kevin A. McGhee, PhD,University of Edinburgh [email protected]
Peter McGuffin, MD PhD,Institute of Psychiatry [email protected]
Sullivan et al. Page 2
Mol Psychiatry. Author manuscript; available in PMC 2009 October 1.
NIH
-PA Author Manuscript
NIH
-PA Author Manuscript
NIH
-PA Author Manuscript

Grant Montgomery, PhD,Queensland Institute for Medical Research [email protected]
Walter J. Muir, FRCPsych,University of Edinburgh [email protected]
Willem Nolen, MD,University Medical Center Groningen [email protected]
Markus M. Nöthen, MD,University of Bonn [email protected]
Roy H. Perlis, MD MSc,Harvard Medical School [email protected]
Katrina Pirlo,Institute of Psychiatry [email protected]
Danielle Posthuma, PhD,VU University Amsterdam [email protected]
Marcella Rietschel, MD PhD,University of Heidelberg [email protected]
Patizia Rizzu, PhD,VU University Medical Center Amsterdam [email protected]
Alexandra Schosser, MD,Institute of Psychiatry [email protected]
August B. Smit, PhD,VU University Amsterdam [email protected]
Jordan W. Smoller, MD ScD,Harvard Medical School [email protected]
Jung-Ying Tzeng, PhD,North Carolina State University [email protected]
Richard van Dyck, MD PhD,VU University Medical Center Amsterdam [email protected]
Matthijs Verhage, PhD,VU University Amsterdam [email protected]
Frans G. Zitman, MD PhD,Leiden University Medical Center [email protected]
Nicholas G. Martin, PhD,Queensland Institute for Medical Research [email protected]
Naomi R. Wray, PhD,Queensland Institute for Medical Research [email protected]
Dorret I. Boomsma, PhD†, andVU University Amsterdam [email protected]
Brenda W.J.H. Penninx, PhD†
VU University Medical Center Amsterdam [email protected]
Abstract
Sullivan et al. Page 3
Mol Psychiatry. Author manuscript; available in PMC 2009 October 1.
NIH
-PA Author Manuscript
NIH
-PA Author Manuscript
NIH
-PA Author Manuscript

Major depressive disorder (MDD) is a common complex trait with enormous public healthsignificance. As part of the Genetic Association Information Network (GAIN) initiative of the USFoundation for the National Institutes of Health, we conducted a genomewide association study of435,291 SNPs genotyped in 1,738 MDD cases and 1,802 controls selected to be at low liability forMDD. Eleven of the top 200 signals localized to a 167 kb region overlapping the gene piccolo(PCLO, whose protein product localizes to the cytomatrix of the presynaptic active zone and playsan important role in monoaminergic neurotransmission in the brain) with p-values of 7.7×10⁻⁷ forrs2715148 and 1.2×10⁻⁶ for rs2522833. We undertook replication of SNPs in this region in 5independent samples (6,079 MDD independent cases and 5,893 controls) but no SNP exceeded thereplication significance threshold when all replication samples were analyzed together. However,there was heterogeneity in the replication samples, and secondary analysis of the original samplewith the sample of greatest similarity yielded p=6.4×10⁻⁸ for the non-synonymous SNPrs2522833 that gives rise to a serine to alanine substitution near a C2 calcium-binding-domain ofthe PCLO protein. With the integrated replication effort, we present a specific hypothesis forfurther studies.
Keywordsmajor depressive disorder; genome-wide association; Netherlands Study of Depression andAnxiety; Netherlands Twin Registry
IntroductionThe defining features of major depressive disorder (MDD) are marked and persistentdysphoria plus additional cognitive signs and symptoms (anhedonia, sleep disturbance,weight/appetite changes, motor agitation/retardation, anergia, excessive guilt orworthlessness, poor concentration or indecisiveness, and recurrent thoughts of death orsuicide) (1). MDD is distinct from normal sadness by its persistence (i.e., ≥2 weeks),additional signs and symptoms, and substantial associated impairment. The definition ofMDD excludes other conditions typified by substantial depressive symptoms (otherpsychiatric disorders, drug/alcohol dependence, and somatic diseases). The lifetimeprevalence of MDD is ∼15% (2-4) and is twofold higher in women (5) with a coursetypified by recurrence of illness (6). It is associated with considerable morbidity (7-9),excess mortality from suicide and other causes (10-13), and substantial direct and indirectcosts (14). A WHO study projected MDD to be the second leading cause of disabilityworldwide by 2020 (15).
Although there is a considerable corpus of research on the epidemiology and biologicalcorrelates of MDD, little is known for certain about its etiology. An important etiologicalclue may be the familial tendency of MDD and its heritability of 31-42% (16). This clue ledto a number of genomewide linkage studies (Supplemental Methods) and studies of >100theoretical or positional candidate genes. As for the use of these study designs with otherbiomedical disorders, their application to MDD has not been as successful as had beenhoped.
It is now clear that genomewide association studies (GWAS) can be a successful tool in thegenetic dissection of complex biomedical disorders (17,18). The goal of this report is todescribe a GWAS for MDD that was systematically designed to remediate a set ofmethodological issues common to genetic studies of MDD. Examples of these issues includesmall sample sizes, inhomogeneous samples in terms of ancestry and phenotyping,convenience sampling, and controls that are unaffected but not at low liability for MDD.Moreover, large-scale replication was integral to our design.
Sullivan et al. Page 4
Mol Psychiatry. Author manuscript; available in PMC 2009 October 1.
NIH
-PA Author Manuscript
NIH
-PA Author Manuscript
NIH
-PA Author Manuscript

MethodsThis GWAS was one of the six initial Genetic Association Information Network (GAIN)studies sponsored by the Foundation for the NIH (19). Individual phenotype and genotypedata are available to researchers via application to the dbGaP repository (20). We haveattempted to follow published guidelines for GWAS (21, Box 1).
SubjectsThe parent projects that supplied subjects for this GWAS are longitudinal studies, theNetherlands Study of Depression and Anxiety (NESDA, http://www.nesda.nl) (22) and theNetherlands Twin Registry (NTR, http://www.tweelingenregister.org) (23). Sampling anddata collection characteristics of the GAIN-MDD study have been described in detailelsewhere (24).
MDD cases were mainly from NESDA, a longitudinal cohort study designed to berepresentative of individuals with depressive and/or anxiety disorders. Recruitment ofparticipants for NESDA took place from 09/2004-02/2007, and ascertainment was fromoutpatient specialist mental health facilities and via primary care screening. Additional caseswere from the population-based cohorts NEMESIS (25), ARIADNE (26), and the NTR.Regardless of recruitment setting, similar inclusion and exclusion criteria were used to selectMDD cases. Inclusion criteria were a lifetime diagnosis of DSM-IV MDD (1) as diagnosedvia the Composite International Diagnostic Interview psychiatric interview (27), age 18-65years, and self-reported western European ancestry. Persons who were not fluent in Dutchand those with a primary diagnosis of schizophrenia or schizoaffective disorder, obsessivecompulsive disorder, bipolar disorder, or severe substance use dependence were excluded(the etiology of MDD in these subjects may be distinct). The 1,862 cases included in GAINwere recruited from mental health care organizations (N=785), primary care (N=603), andcommunity samples (NEMESIS N=218, ARIADNE N=96 and NTR N=160).
Control subjects were mainly from the NTR, which has collected longitudinal data fromtwins and their families since 1991 (total cohort of ∼22,000 participants from 5,546families). The majority of families were recruited when the twins were adolescents or youngadults through city council registrations along with alternative efforts to recruit older twins.Longitudinal phenotyping includes assessment of depressive symptoms (via multipleinstruments), anxiety, neuroticism, and other personality measures. Inclusion requiredavailability of both survey data and biological samples, no report of MDD at anymeasurement occasion, and low genetic liability for MDD. No report of MDD wasdetermined by specific queries about medication use or whether the subject had ever soughttreatment for depression symptoms and/or via the CIDI interview. Low genetic liability forMDD was determined by the use of a factor score derived from longitudinal measures ofneuroticism, anxiety, and depressive symptoms (28) (mean 0, std 0.7); controls wererequired never to have scored highly (≥0.65) on this factor score. Finally, controls and theirparents were required to have been born in the Netherlands or western Europe. Only onecontrol per family was selected. There were N=1,703 controls from the NTR and additionalcontrols from NESDA (N=133 from general practice, N=24 from ARIADNE). NESDAcontrols had no lifetime diagnosis of MDD or an anxiety disorder as assessed by the CIDIand reported low depressive symptoms at baseline (K-10 score <16 and Inventory ofDepressive Symptoms score <4) (29,30).
Sullivan et al. Page 5
Mol Psychiatry. Author manuscript; available in PMC 2009 October 1.
NIH
-PA Author Manuscript
NIH
-PA Author Manuscript
NIH
-PA Author Manuscript

Case-Control MatchingIf there were multiple eligible NTR controls in a family, we first matched on sex and age,and used the highest number of completed questionnaires as an additional criterion. Again,only one control per family was included.
DNA SamplingBefore the start of the NESDA and NTR biological sample collection, processing, andstorage protocols were harmonized and DNA extraction was conducted concurrently in thesame laboratory. For NESDA, blood sampling for the NESDA participants took placeduring the baseline visit (between 0830-0930) and DNA was isolated using the FlexiGeneDNA AGF3000 kit (Qiagen, Valencia, CA, USA) on an AutoGenFlex 3000 workstation(Autogen, Holliston, MA, USA). For NTR, biological samples were taken in the subject'shome (between 0700-1000) and DNA was extracted using the Puregene DNA isolation kit(Gentra, Minneapolis, MN, USA) for frozen whole blood samples. DNA concentrationswere determined using the PicoGreen dsDNA Quantitation kit (Invitrogen Corporation,Carlsbad, CA, USA). All procedures were performed according to the manufacturer'sprotocols.
Ethical IssuesThe NESDA and NTR studies were approved by the Central Ethics Committee on ResearchInvolving Human Subjects of the VU University Medical Center, Amsterdam, anInstitutional Review Board certified by the US Office of Human Research Protections (IRBnumber IRB-2991 under Federal wide Assurance-3703; IRB/institute codes, NESDA03-183; NTR 03-180). All subjects provided written informed consent. As part of the GAINapplication process, consent forms were specifically re-reviewed for suitability for thedeposit of de-identified phenotype and genotype data into the controlled-access dbGaPrepository (20). NESDA and NTR subjects were informed of participation in GAIN vianewsletters. Only 22 NESDA respondents refused informed consent for genetic research(1.7% of all respondents approached).
GWAS GenotypingIndividual genotyping was conducted by Perlegen Sciences (Mountain View, CA, USA)using a set of four proprietary, high-density oligonucleotide arrays. The SNPs on thesearrays were selected to tag common variation in the HapMap European and Asian panelsusing previously described genotype data (31), tagging approach (32), and methodology(33). At the beginning of GAIN, all HapMap (34) samples were genotyped with thePerlegen GWAS platform. Independent review of these data by the GAIN analysis group(19) showed 99.8% agreement with prior HapMap genotypes and the mean maximum r2
between the Perlegen SNPs and HapMap phase II SNPs (31) was 0.89 for single and 0.96for multi-marker analyses. The genotyping procedures and genotyping calling algorithms aredescribed in the Supplemental Methods and in prior reports (35,36). Briefly, 40 × 96-wellplates were sent to Perlegen for GWAS genotyping. Genotyping was conducted blind tocase-control status. Cases and controls were randomly allocated to plates and to positionswithin plates. Each plate contained DNA samples from 93 Dutch subjects plus 3 qualitycontrol samples. The three quality control samples included: two parents of one control onthat plate (40 complete trios in total); and half the plates contained the same HapMap CEUsample (used for quality control in all GAIN projects) and half had a randomly-selectedduplicate case sample. The total number of samples was 3,840 (=40 plates × 96 samples perplate) or 1,860 cases + 1,860 controls + 80 parents + 20 duplicate samples + 20 HapMapsamples.
Sullivan et al. Page 6
Mol Psychiatry. Author manuscript; available in PMC 2009 October 1.
NIH
-PA Author Manuscript
NIH
-PA Author Manuscript
NIH
-PA Author Manuscript

Quality Control – SubjectsOf the 3,820 Dutch samples sent to Perlegen (excluding the 20 HapMap internal controlsamples), genotypes were delivered for 3,761 samples. Fifty-nine samples did not haveGWAS data: 39 samples with uncertain linkage between genotype and phenotype records, 7samples with evidence of contamination, 6 samples that failed genotyping, and 7miscellaneous failures (2 of these were excluded as chrX and chrY genotyping data wereconsistent with the presence of XO and XXY sex chromosome status). After furtheranalysis, 8 subjects were removed for excessive missing genotype data (>25%), 1 case forhigh genomewide homozygosity (∼75%), 38 subjects whose genomewide IBS estimateswere consistent with first- or second-degree relationships, and 57 additional subjects whoseancestry diverged from the remainder of the sample (see Supplemental Methods for details).After these exclusions (N=104) and removing duplicated and trio quality control sample,there were 3,540 subjects in the final analysis dataset including 1,738 cases and 1,802controls. The principal reason for fewer cases than controls was the higher prevalence ofsubstantial non-European ancestry. The list of subjects in the final analyses dataset isincluded as a Supplemental File (“mddC.fam”).
Quality Control – SNPsThe unfiltered dataset obtained from dbGaP contained 599,156 unique SNPs. The Perlegengenotyping algorithm yielded a quality score for each individual genotype, and a morestringent quality score cutoff (≥ 10) than that used by Perlegen was applied. The SNPquality control process is described in detail in the Supplemental Methods. Briefly, to beincluded in the final analysis dataset, SNPs were required not to have any of the followingfeatures: gross mapping problem (37), ≥2 genotype disagreements in 40 duplicated samples,≥2 Mendelian inheritance errors in 38 complete trio samples, minor allele frequency <0.01,or >0.05 missing genotypes in either cases or controls. A Hardy-Weinberg filter was notused as lack of fit to Hardy-Weinberg expectations can occur for valid reasons (e.g., a trueassociation) (38) and given that 95.6% (=51,592/53,994) of SNPs with p<0.00001 from anexact test of Hardy-Weinberg equilibrium (39) in controls were already flagged forexclusion. A total of 435,291 SNPs met these criteria and were included in the final analysisdataset (included as a Supplemental File, “mddC.bim”). Additional quality control checksare described in the Supplemental Methods). Thirteen controls were genotyped in a differentstudy using the Illumina 317K platform and, of the 82,636 SNPs common to both platforms,the genotype agreement was 99.94%.
Single Marker Statistical AnalysesThere were three classes of SNPs – those that could be heterozygous in all subjects (chr1-22and chrX/PAR1), those that were heterozygous in females (non-PAR chrX), and those thatwere hemizygous in males (non-PAR chrX and chrY). All SNPs that passed quality controlchecks were tested for association with MDD using 1 df Cochran-Armitage trend tests. Forcomplex traits, it is widely believed that the contributions of individual SNPs to disease riskare often roughly additive (40) . The Cochran-Armitage trend test can be used to detect sucheffects. This test is usually recommended due to its robustness to the violation of the HWEassumption (41): P-values from females and males for non-PAR chrX were combined usingFisher's method (42).
Population stratification artifacts were assessed in two ways. As described elsewhere (36),including principal components as covariates in a logistic regression model can robustlycontrol stratification effects. To do this, we identified a set of 127,688 SNPs in linkageequilibrium (43) and used the “smartpca” program in EigenSoft (44) to compute 10 principalcomponents for each subject that were included as covariates in logistic regression models
Sullivan et al. Page 7
Mol Psychiatry. Author manuscript; available in PMC 2009 October 1.
NIH
-PA Author Manuscript
NIH
-PA Author Manuscript
NIH
-PA Author Manuscript

(case/control status ∼ SNPi + PC1 + PC2 + … + PC10). We also used a stratified Cochran-Mantel-Haenszel test in PLINK (43) as a complementary approach.
For noteworthy associations, there were additional checks to ensure that an association wasnot due to experimental bias. These checks included: manual inspection of SNP cluster plotsto ensure reasonable performance of the genotyping calling algorithm; evaluation ofconformation to Hardy-Weinberg equilibrium in controls, cases, and overall (discussed inthe Supplemental Methods); the checks for population stratification described above;evaluation of plate-specific association results to ensure that the overall association was notdriven by one or a few plates; comparison of control MAFs to the HapMap EUR panel; andevaluation of the characteristics of a SNP in high linkage disequilibrium (“proxyassociation”) as a similar association with such a SNP decreases the chance of some formsof method artifacts.
Control of False DiscoveriesGiven the 105-107 statistical comparisons in a GWAS, small p-values are expected bychance. To control the risk of false discoveries, q-values (45,46) were computed for all p-values for single-marker tests of association. A q-value is an estimate of the proportion offalse discoveries among all significant markers, or the false discovery rate (FDR) for thecorresponding p-value. The use of q-values is preferable to more traditional multiple testingcontrols because q-values provide a better balance between the competing goals of findingtrue positives versus controlling false discoveries, allow more similar comparisons acrossstudies because proportions of false discoveries are much less dependent on the number oftests conducted and are relatively robust against the effects of correlated tests (45,47-54).The q-value threshold for declaring significance was 0.10 (i.e., the top 10% of thesignificant findings are, on average, allowed to be false discoveries) (50,55). FDR thresholds<0.10 result in a disproportionate drop in power to detect true effects.
ImputationWe used two imputation approaches, the SNPMStat method of Lin et al. (56) to impute 246additional SNPs in the PCLO region and Abecasis' MACH (v1) to impute 2,037,829autosomal SNPs with R2 ≥ 0.5 (a cutoff that removes ∼90% of SNPs with unreliableimputation results while sacrificing 2-3% of reliably imputed SNPs). Both SNPMStat andMACH gave similar results in the PCLO region. Imputed genotypes were used in secondaryanalyses. The HapMap2 EUR panel (31,34) was used as reference.
Statistical PowerQuanto (57,58) was used to approximate statistical power given the following assumptions:two-tailed α=1×10⁻⁷ (=0.05/500,000), 1,738 cases and 1,802 controls, lifetime morbid riskof MDD of 0.15, and a log additive genetic model. For statistical power of 0.80 (β=0.20),the minimum detectable genotypic relative risks are 1.59, 1.40, and 1.35 for minor allelefrequencies of 0.10, 0.25, and 0.40.
SoftwarePLINK (v1.0) (43), SAS (v9.1.3) (59), R (v2.6.1) (60), HAPSTAT (v3) (61-63), MACH1,SNPMStat (56), HaploView (64), and JMP (v6) (65) were used for data management,quality control, statistical analyses, and graphics.
BioinformaticsAll genomic locations are per NCBI Build 35 (66) (UCSC hg17) (67). Pseudo-autosomalregion 1 (PAR1) is assumed to be located on chrX:1-2,692,881 and chrY:1-2,692,881 and
Sullivan et al. Page 8
Mol Psychiatry. Author manuscript; available in PMC 2009 October 1.
NIH
-PA Author Manuscript
NIH
-PA Author Manuscript
NIH
-PA Author Manuscript

PAR2 on chrX:154,494,747-154,824,264 and chrY:57,372,174-57,701,691 (68). SNPannotations were per TAMAL (37) based chiefly on UCSC genome browser files (67),HapMap (34), and dbSNP (66).
ResultsSample Description
Table 1 presents descriptive data for cases and controls. Controls had a higher proportion ofmales and were slightly older (and thus were farther through the period of risk for MDD).Consistent with known correlates of MDD, cases had a significantly lower educational level,less often had a partner, were more often smokers, and scored much higher on the NEO-FFIneuroticism scale.
SNP DescriptionThe analysis SNP set had 435,291 SNPs including 427,049 autosomal SNPs, 7.988 SNPs onthe non-PAR portions of chrX, 239 SNPs on chrXY/PAR1, 15 SNPs on chrY, and 0 SNPson PAR2. The median SNP missingness was 0.00339 (inter-quartile range 0.00113-0.0105)and the median minor allele frequency was 0.2422 (inter-quartile range 0.1375-0.3646) withsimilar estimates in cases and controls. The average marker density over the genome was 1SNP every 7,069 bases (=3,077,088,087 bases / 435,291 SNPs). The median inter-markerdistance was 2,911 bases with interquartile range 966-7,374 bases and a 99th percentile of50.1 kb.
Single Marker Association TestsWe used the Cochran-Armitage trend test to test for association of the 435,291 SNPs in theGWAS dataset with case/control status. The estimated lambda (69) was 1.046 (similar p-value minima and lambdas were obtained using logistic regression with 10 principalcomponents and using a stratified Cochran-Mantel-Haenszel tests based on identity-by-stateclusters) (43,44). The minimum q-value was 0.28 (i.e., if these tests were called significant,over the long-term, a minimum false discovery rate of ∼28% would be incurred). As the pre-specified q-value threshold was 0.10, no SNP reached genomewide significance. Theproportion of all SNPs without true effects (p0) (54) was conservatively estimated to bep0=0.9999954, consistent with the presence of ∼2 SNPs with true effects in these GWASdata. The results of this MDD GWAS are included as a Supplemental File (“results.txt”) tofacilitate comparisons with other studies.
Panel a of Figure 1 depicts the quantile-quantile plots (40) for these analyses. The observedp-values do not strongly depart from the p-value distribution expected by chance. Panel b ofFigure 1 shows a plot of –log10(ptrend) by genomic location.
Table 2 presents the findings for the top 25 SNPs. The quality control metrics – SNPmissingness, agreement with HWE, and similarity of the control MAFs to the HapMap EURpanel – for the top 25 SNPs are generally acceptable. Four of the top 25 associations are inthe presynaptic cytomatrix protein piccolo (PCLO). Table 3 depicts the top 25 multi-SNPclusters (i.e., for an index SNP with association p<0.001, these clusters are additional SNPswithin 250 kb of the index SNP with with r2 ≥ 0.50). The full version of this table isincluded as a Supplemental File (“Table3_full.xls”). PCLO is present in the top 25 clustersalong with two additional multi-SNP clusters in the top 200. Other notable SNP clustersoccurred in GRM7 (rank 51), DGKH (rank 83, a candidate gene for bipolar disorder) (70),DAOA (rank 124), and DRD2 (rank 226).
Sullivan et al. Page 9
Mol Psychiatry. Author manuscript; available in PMC 2009 October 1.
NIH
-PA Author Manuscript
NIH
-PA Author Manuscript
NIH
-PA Author Manuscript

Focusing on Piccolo (PCLO)Although no association met genomewide significance, there were clusters of SNPs inPCLO (Figure 2). Notably, 11 of the 200 smallest p-values localized to a 167 kb segmentoverlapping PCLO. Interest in PCLO was increased given its expression in brain,localization to the presynaptic active zone (71), and involvement in monoamineneurotransmission, a venerable hypothesis of the etiology of MDD (72). Moreover, the thirdmost significant SNP (rs2522833) codes for a non-synonymous amino acid change(ala-4814-ser) in PCLO near its C2A calcium binding domain (73).
We investigated possible causes of spurious associations in the PCLO region(chr7:82,032,093-82,436,848). First, these findings were not due to plate effects asinspection of plate-specific association data for these SNPs did not show any markedoutliers or systematic biases. Second, review of allelic intensity cluster plots on whichgenotype calls were based revealed adequate performance of the Perlegen genotype callingalgorithm. Third, inspection of additional quality control metrics did not suggest systematicproblems with SNPs in this region. Fourth, inspection of LD matrices excluded very highLD as the sole explanation for the results (Supplemental Figure 10), and none of thegenotyped SNPs had strong LD (r2 ≥ 0.8) with rs2715148 (the SNP with the smallest p-value in the PCLO region). Fifth, population stratification can cause false positive findingsbut this did not appear to explain the PCLO association: (a) the same 11 SNPs had p-valuesamong the top 200 associations in unadjusted analyses as well as with adjustment viaprincipal components and stratified analyses; and (b) for the 57 SNPs in the PCLO region,the p-values across these three types of analyses were consistent (the Spearman correlationsbetween p-values from trend tests, logistic regression, and stratified analyses were all>0.962). Sixth, the minor allele frequencies in the control group in the PCLO region wereusually quite similar to available EUR control groups suggesting that the PCLO findingswere not due to an artifact of the control selection process (see below). Finally,bioinformatic investigation did not suggest that this is a problematic region to genotype asthe PCLO region is not known to be under positive selection in humans (74), to containsegmental duplications (67), or common copy number variants (search of the Database ofGenomic Variants yielded two rare CNVs with control frequencies of 0.12% and 0.89%)(75, 76 , 77).
We conducted additional analyses to attempt to localize the association depicted in Figure 2.Imputation (56) supported the directly typed SNP associations but did not yield anassociation p-value markedly more significant than any directly genotyped SNP (although22 of the 25 most significant imputed associations in the genome were in this region).Haplotype analysis using 3-SNP sliding windows did not improve localization. Secondaryanalyses by sex, case ascertainment setting, and recurrent early-onset MDD (reoMDD,arguably the most heritable form of MDD) (16,78) suggested that most of the signal wasfrom females and from subjects with reoMDD (Supplemental Table 11). The findings forreoMDD were often stronger than the primary analyses, particularly for the most significantSNP (rs2715148) where the p-value decreased by 1.2 orders of magnitude to 9.5×10⁻⁸.
PCLO ReplicationAlthough no finding met genomewide significance, the presence of multiple possible signalsin PCLO and the plausibility of a role for PCLO in the etiology of MDD led us to attemptreplication in external samples. We assembled a collection of 11,972 independent subjects(6,079 MDD cases and 5,893 controls) from seven different groups and a total of six case-control replication samples (two German samples were combined, see SupplementalMethods). As with NESDA cases, all replication cases were adults of European ancestry onwhom a structured clinical interview was used to substantiate the lifetime diagnosis of
Sullivan et al. Page 10
Mol Psychiatry. Author manuscript; available in PMC 2009 October 1.
NIH
-PA Author Manuscript
NIH
-PA Author Manuscript
NIH
-PA Author Manuscript

DSM-IV MDD (1), and all studies excluded common MDD phenocopies (e.g., depressivesymptoms due to another psychiatric disorder or a general medical condition). As with NTRcontrols, all replication controls were adults of European ancestry ascertained from thepopulation, and individuals reporting MDD symptoms were excluded. We estimatedstatistical power using Quanto (57) (assumptions: log-additive genetic model, MDD lifetimerisk 0.15, MAF=0.45 (similar to rs2522833), a genotypic relative risk of 1.14 (“shrunk”down from the observed GRR of 1.26 for rs2522833 to account for the “Winner's Curse”phenomenon) (79), and a conservative two-tailed type 1 error rate of 0.00167 (=0.05/30replication SNPs). Statistical power was 97.2% for replication for the two SNPs genotypedin all samples (N=11,972) and 90.4% for the remaining SNPs (N=9,278). Five replicationsamples were genotyped for 30 SNPs using the same Sequenom iPlex SNP pool (15 SNPswere in the primary GWAS and 15 were selected to tag common variation in Europeans)(80) and one sample was successfully genotyped for two SNPs using TaqMan. The SNPselection strategy effectively cast a broad net over the region showing association in Figure2. For the NESDA/NTR samples, agreement between the initial Perlegen genotypes in thisregion and independent re-genotyping was high (0.9987).
The single SNP results for MDD are depicted in Figure 3 and Table 4a. Our analytic plandictated the combined analysis of all replication samples with the use of a one-taileddirectional test. No association in the replication sample reached statistical significance aftercorrection for multiple comparisons and SNP non-independence due to LD (ninth column inTable 4a). Similarly, haplotype analyses did not reveal significantly associated regions(Supplemental Figure 16). There were four p-values <0.05 in the replication sample but onlyrs10954694 also had Z-scores of the same sign in both samples. Table 4b shows the resultsfor reoMDD, and no single SNP was significant after correction for multiple comparisons.When we repeated the MDD analyses restricted to female subjects, the observedsignificance levels did not become markedly stronger in any of the replication samples incontrast to the initial NESDA/NTR sample. Thus, results from analyses of all replicationsamples did not reach the a priori criterion for replication evidence for the involvement ofPCLO in the etiology of MDD.
Unanticipated heterogeneity in casesHowever, we observed, a posteriori, that there was potentially important heterogeneity in thereplication samples for eight SNPs that were strongly associated in the original sample(I2≥0.4, ninth column in Table 4a). In investigating this further (Supplemental Methods), wedetermined that there was little evidence for genetic heterogeneity in the genotyped regionfor controls but, unexpectedly, there was significant heterogeneity in the cases. Principalcomponents analysis and inspection of Table 4a and the forest plots in Figure 3 indicatedthat the outlier was the Australian QIMR sample. Notably, the original and QIMR sampleswere particularly similar in that both studies included population-based cases and controlswere selected to be at low liability for MDD based on longitudinal assessments. Of the nineSNPs with p<0.05 in the QIMR sample, eight had both low p-values and Z-scores with thesame sign as in the NESDA/NTR sample. As an exploratory analysis, we analyzed theoriginal and QIMR samples jointly, and the minimum p-value was 6.4×10⁻⁸ at the non-synonymous SNP rs2522833 that gives rise to a serine to alanine substitution near the C2Acalcium-binding-domain of the PCLO protein.
Secondary analysesWe conducted additional analyses of the NESDA/NTR GWAS dataset that were specified apriori but which should be considered exploratory.
Sullivan et al. Page 11
Mol Psychiatry. Author manuscript; available in PMC 2009 October 1.
NIH
-PA Author Manuscript
NIH
-PA Author Manuscript
NIH
-PA Author Manuscript

(a) The network of proteins with which PCLO interacts in its role at the presynapticcytoskeletal matrix is relatively well-characterized, and we reasoned that genes encodingthese proteins might harbor risk or protective variants. We assessed this hypothesis bytesting for association conditioning on the PCLO nsSNP rs2522833 (i.e., investigatingwhether controlling statistically for the effect of rs2522833 increases the salience of otherSNP associations), assessing the minimum p-value per gene, and then comparing this list toa list of 54 genes that make proteins that interact with PCLO. This analysis did not revealany SNPs or genes whose significance was markedly lower than without includingrs2522833 in the logistic regression model. Moreover, no known PCLO interacting proteinwas notable on this list.
(b) We imputed genotypes for 2,037,829 autosomal SNPs using MACH with reference toHapMap CEU genotypes. The resulting lambda was 1.048, and the minimum p-value was1.21×10−7. As noted above, 22 of the 25 most significant imputed associations were in thePCLO region. Investigation of SNP clustering that accounted for LD yielded results similarto those shown in Table 3.
(c) We assembled a list of 103 candidate genes that had been studied for association withMDD in the literature (81). Nineteen of these genes had no SNPs within its transcript andanother 9 genes had inadequate coverage (>1 SNP/15 kb; Supplemental Table 17). Of theremaining 75 genes, only NOS1 (neuronal nitric oxide synthase, p=0.0006) had p<0.001.However, NOS1 (as with most genes in Supplemental Table 16) is quite large and chance isa prominent potential influence on these results.
(d) We compared the GWAS association results to a meta-analysis of gene expression datafrom 12 studies of post-mortem brain tissue in MDD cases compared with controls (10frontal cortex and 2 cerebellum studies). These data are available via the Stanley Foundation(http://www.stanleygenomic.org). There were five genes with GWAS p<0.05 (all had geneexpression changes significant at p 0.0004 – 0.007). The genes were: SGCG (sarcoglycan),CALD1 (caldesmon 1), EEF1A1 (eukaryotic translation elongation factor 1 alpha 1),CFLAR (CASP8 and FADD-like apoptosis regulator), and TP73L (tumor protein p73-like).There is no overlap of this list with the PCLO interactors or MDD candidate genes from theliterature.
(d) Alternative models, filters, and phenotypes. (i) For reoMDD, the minimum p-value overall GWAS SNPs was at the PCLO region SNP rs2715148 (8.4×10⁻⁸) which ranked secondof all SNPs using the trend test (Table 2). (ii) rs2715148 also had the smallest p-value undera dominant model of SNP action (6.2×10⁻⁶). (iii) Given the female predominance in MDD,we analyzed data from females and males separately. For female cases and controls,rs2715148 had the smallest p-value (4.0×10⁻⁷) and multiple other PCLO SNPs had p-valuesin the 10−5 – 10−6 range. For males, most PCLO SNPs had p > 0.05 and the minimum wasin the SLC9A9 SNP rs4839627 (9.1×10⁻⁷). (iv) Again, given sex differences in MDDprevalence, we investigated SNPs on chrX and chrY more closely. The minimum p-value inchrX pseudo-autosomal region 1 was 0.02. For the non-PAR regions of chrX in females, theSNPs with the smallest p-values were rs11094388 (p=0.0003, intergenic), rs5971108(p=0.0003, PTCHD1), rs5930667 (p=0.0004, intergenic), rs4618863 (p=0.0005, intergenic),rs2207796 (p=0.0005, in the very large gene DMD), and rs5936428 (p=0.0009, FMR2). Formales, the minimum p-value on chrX was at rs10521594 (p=5.4×10⁻⁵, intergenic) and 0.22on chrY.
Sullivan et al. Page 12
Mol Psychiatry. Author manuscript; available in PMC 2009 October 1.
NIH
-PA Author Manuscript
NIH
-PA Author Manuscript
NIH
-PA Author Manuscript

DiscussionOverview
Major depressive disorder (MDD) is a common complex trait of enormous public healthsignificance. As part of the GAIN initiative of the US Foundation for the NIH (19), weconducted a genomewide association study of 435,291 SNPs genotyped in 1,738 MDDcases and 1,802 controls selected to be at low liability for MDD. Our study had numerouspositive attributes including its historically large sample size, its largely population-basedand longitudinal design, and relatively unbiased and dense genomewide genotypingdesigned to capture common variation in subjects of European ancestry.
According to our primary analysis plan, no SNP-MDD phenotype association reachedgenomewide significance as the minimum q-value was 0.28, greater than the pre-defined q-value threshold of 0.10. This result was not unexpected. For example, type 2 diabetesmellitus has arguably reaped the greatest harvest from GWAS (82) and yet two of the initialT2DM GWAS were unremarkable when analyzed independently (83,84). One of the keylessons of the GWAS era is the importance of meta-analysis where its application to theprimary GWAS can uncover positive findings that replicate well across studies (18,85).
Is PCLO a causal risk factor for MDD?Although no locus exceeded the genomewide threshold after correction for multiplecomparisons, 11 of the top 200 signals localized to a 167 kb region overlapping the genepiccolo (PCLO). The protein product of PCLO localizes to the presynaptic active zone andplays an important role in brain monoaminergic neurotransmission (86), clearly intersectingwith a venerable hypothesis of the etiology of mood disorders (87). Moreover, the third mostsignificant association was a common non-synonymous SNP near its critical C2A bindingdomain in PCLO (88,89). Although it is an obvious candidate gene, we are not aware of anyprior association studies of PCLO and mood disorders (PCLO is in a region of 7q implicatedby linkage in autism and one autism association study has been published) (90).
We judged the intersection of this GWAS result with prior knowledge sufficient to trigger alarge-scale replication effort by genotyping PCLO SNPs in 6,079 MDD independent casesand 5,893 controls. Statistical power to replicate exceeded 90% even after accounting for(79) the “Winner's Curse” phenomenon (a form of regression to the mean whereby the truegenotypic relative risk is over-estimated in the initial study) (91,92). However, in spite of theapparent a priori strength of a hypothesis of genetic variation in PCLO in the etiology ofMDD, no SNP analyzed in the replication sample met appropriately rigorous criteria forreplication (21). Therefore, unlike GWAS for many non-psychiatric biomedical disorders,our GWAS and replication efforts did not yield “proof beyond a reasonable doubt” level ofevidence for an association between genetic variation in PCLO and MDD.
Investigation of the sources of heterogeneity in the replication samples indicated thatcontrols were genetically similar to the original sample in the PCLO region but that caseswere dissimilar. We observed, a posteriori, that both principal components derived fromPCLO region genotypes in QIMR cases and effect size estimates in the QIMR replicationsample tended to be similar to the original sample. This is notable because, of all thereplication samples, ascertainment of QIMR subjects was most similar to the primaryNESDA/NTR sample in that cases were identified from population-based sources (100% forQIMR and 60% for NESDA) rather than tertiary sources as for the other replication samples.MDD cases from clinical samples may differ from population-based cases due to selectionbias (93), Berkson's bias (94,95), differing referral filters (96), or even a different geneticbasis (97) with respect to genetic variation in the PCLO region.
Sullivan et al. Page 13
Mol Psychiatry. Author manuscript; available in PMC 2009 October 1.
NIH
-PA Author Manuscript
NIH
-PA Author Manuscript
NIH
-PA Author Manuscript

Joint analysis of the NESDA/NTR and QIMR samples yielded p=6.4x10⁻⁸ (uncorrected formultiple hypothesis testing) for the non-synonymous SNP rs2522833. This result suggests aspecific hypothesis for future studies: an association between genetic variation in PCLO andMDD may be detected only in population-based cases. Thus, it would be premature toexclude PCLO from a role in the etiology of some forms of MDD.
The Heterogeneous Nature of MDDInterpretation of the PCLO replication efforts is consistent with two broad possibilities. Thefirst possibility is that genetic variation in PCLO is truly not associated with MDD. Thisinterpretation is supported by the replication analyses (specified a priori) in which no SNPwas significantly associated after correction for multiple comparisons and SNP dependencedue to LD. This strict interpretation is generally viewed as “best practice” in human genetics(21) but implicitly assumes etiological homogeneity for MDD in the PCLO region. Thesecond possibility invokes a less parsimonious model involving heterogeneity, that geneticvariation in PCLO is etiologically causal to some subtypes of MDD. This interpretation is ana posteriori hypothesis consistent with the empirical results particularly in the notabledifferences in associations between samples, case ascertainment strategies, and indicationsfrom principal components analysis that NESDA and QIMR cases are more similar than theclinically ascertained subjects. It is notable that the control samples from each site wereconsiderably more similar than cases from the same sites.
The tension between null a priori results and plausible a posteriori hypotheses is a core issuein psychiatric genetics. Important phenotypes like MDD are defined reliably and withreference to diagnostic schema developed principally for clinical purposes. Heterogeneousetiology of MDD is widely suspected but there are no proven ways to index heterogeneity(indeed, a prominent rationale for genetics studies is improve differential diagnosis).
Our results are consistent with prior observations of the heterogeneous nature of MDD,particularly with regard to ascertainment. Individuals who meet MDD criteria fromcommunity or primary care sources may have a more inclusive and less comorbid form ofMDD (98) whereas tertiary ascertainment may yield subjects with greater comorbidity andperhaps distinctive etiology (99). In particular, it is formally possible (but unproven) that thePCLO results are accurate – genetic variation in PCLO might be causal to the types of MDDseen in community samples but other loci contribute to a distinctive type of MDD seen intertiary care samples.
Other hypothesesThere were two MDD cases who may have had unrecognized genomic disorders (100)(possible Turner's and Klinefelter's syndromes). We speculate that small numbers of caseswith MDD will have CNV-related genomic disorders that are plausibly causal to MDD.Clarification of the role of such rare variants will require larger samples.
Most of the additional exploratory analyses were unrevealing, including examination ofproteins known to interact with PCLO, genotype imputation, comparison of GWAS findingswith MDD candidate genes from the literature and gene expression changes in the brain incases with MDD, and alternative genetic models, phenotype definitions, and sex-specificanalyses.
We searched the SLEP compendium of psychiatric genetics findings (101) to attempt todiscover overlap of our findings with those reported in the literature. First, with reference toa meta-analysis of microarray studies on the Stanley brain bank MDD and control samples,expression of CFLAR and MARCH3 were increased and LST1 and HLA-B were decreasedin MDD post-mortem frontal cortex. These regions ranked 9, 232, 267, and 432 in the
Sullivan et al. Page 14
Mol Psychiatry. Author manuscript; available in PMC 2009 October 1.
NIH
-PA Author Manuscript
NIH
-PA Author Manuscript
NIH
-PA Author Manuscript

NESDA/NTR GWAS. Second, we looked for convergence of our findings with otherGWAS of psychiatric disorders. Notable genomic locations of overlap of the top 480 regionsin the present GWAS were found with GWAS for ADHD (ITIH1, S Faraone, personalcommunication), the WTCCC GWAS for bipolar disorder (SHFM1 and UGT2B4) (102),and a bipolar GWAS that used DNA pooling (GRM7 and DGKH) (70). Third, we looked atthe minimum p-values in our study for genes that met or nearly achieved genomewidesignificance: the minimum p-values in our study for MAMDC1 (103) was 0.004, 0.03 forZNF804A (104), 0.002 in ANK3 (105), and 0.03 in CACNA1C (105). These overlaps areintriguing (although the play of chance cannot be excluded), and will be formallyinvestigated as part of our participation in the Psychiatric GWAS Consortium analyses (18).
Limitations(a) Although statistical power has been systematically underestimated in psychiatricgenetics, when we began this study in Q3 2006, it was believed that statistical power wouldbe reasonable to detect realistic genetic effects. However, the definition of “realistic” hasshifted considerably since 2006 and it may be important to design studies that can detectgenotypic relative risks <1.10. (b) When this study began, the coverage and performance ofthe Perlegen GWAS platform were among the better options available (19). The technologyand pricing have evolved rapidly and superior platforms are now available. A key limitationof the Perlegen platform is its inability to assess copy number variation (106) that may beparticularly salient for psychiatric disorders (107,108). More generally, the GWAS platformmight not be sufficiently “genomewide” and unbiased: the platform may have hadinadequate coverage in an etiologically important region of the genome, SNPs are only onetype of genetic variation, and important non-SNP genetic variation might not have beensufficiently well captured. (c) There was an imbalance in the proportion of males in casesand controls. Although it is unclear whether and how this might bias the results, it may havelead to some degree of bias. (d) Finally, GWAS are predicated upon the crucial assumptionthat the predominant diagnostic criteria are valid with respect to the fundamentalarchitecture of the disorder.
ConclusionsWe describe here a large effort to identify DNA sequence variation fundamental to MDD.Although our initial GWAS results for the PCLO region were intriguing, this highlyplausible hypothesis did not find support in a large-scale replication attempt. Our hypothesisabout a role of genetic variation in PCLO for MDD in population but not clinical settingsemphasizes the importance of knowing the epidemiological sampling frame for a study.Finally, we hope that the model we used in this study – a cooperative international effort –will be adopted by groups studying other psychiatric disorders in order to maximizeprogress.
Supplementary MaterialRefer to Web version on PubMed Central for supplementary material.
AcknowledgmentsWe acknowledge support from NWO: genetic basis of anxiety and depression (904-61-090); resolving cause andeffect in the association between exercise and well-being (904-61-193); twin-family database for behaviorgenomics studies (480-04-004); twin research focusing on behavior (400-05-717), Center for Medical SystemsBiology (NWO Genomics); Spinozapremie (SPI 56-464-14192); Centre for Neurogenomics and CognitiveResearch (CNCR-VU); genomewide analyses of European twin and population cohorts (EU/QLRT-2001-01254);genome scan for neuroticism (NIMH R01 MH059160); Geestkracht program of ZonMW (10-000-1002); matchingfunds from universities and mental health care institutes involved in NESDA (GGZ Buitenamstel-Geestgronden,Rivierduinen, University Medical Center Groningen, GGZ Lentis, GGZ Friesland, GGZ Drenthe). Genotyping was
Sullivan et al. Page 15
Mol Psychiatry. Author manuscript; available in PMC 2009 October 1.
NIH
-PA Author Manuscript
NIH
-PA Author Manuscript
NIH
-PA Author Manuscript

funded by the Genetic Association Information Network (GAIN) of the Foundation for the US National Institutes ofHealth, and analysis was supported by grants from GAIN and the NIMH (MH081802). Genotype data wereobtained from dbGaP (http://www.ncbi.nlm.nih.gov/dbgap, accession number phs000020.v1.p1). Statisticalanalyses were carried out on the Genetic Cluster Computer (http://www.geneticcluster.org) which is financiallysupported by the NWO (480-05-003). Dr. Sullivan was also supported by R01s MH074027 and MH077139. Dr.Schosser was supported by an Austrian Science Fund Erwin-Schrödinger-Fellowship. We would like to express ourthanks to: the GAIN Genotyping group (Dr. Gonçalo Abecasis, chair) for help with quality control; Drs. GonçaloAbecasis and Jun Li for assistance with MACH; Dr. Shaun Purcell for PLINK; Troy Dumenil (QIMR) for expertassistance with the replication genotyping; Dr. Dina Ruano (Portuguese Foundation for Science and Technology,SFRH/BPD/28725/2006); and Drs. Pam Madden (DA012854) and Richard Todd (AA013320) for supplying someof the phenotypes used in the Australian sample. Replication genotyping of the STAR*D samples was supported bya grant from the Bowman Family Foundation and the Sidney R. Baer, Jr. Foundation. We gratefully acknowledgeNARSAD for funding the PCLO follow-up genotyping.
References1. American Psychiatric Association. Diagnostic and Statistical Manual of Mental Disorders. Fourth
Edition ed.. American Psychiatric Association; Washington, DC: 1994.
2. Kessler RC, McGonagle KA, Zhao S, Nelson CB, Hughes M, Eshleman S, Wittchen H-U, KendlerKS. Lifetime and 12-month prevalence of DSM-III-R psychiatric disorders in the United States:results from the National Comorbidity Survey. Archives of General Psychiatry. 1994; 51:8–19.[PubMed: 8279933]
3. Kessler RC, Berglund P, Demler O, Jin R, Koretz D, Merikangas KR, Rush AJ, Walters EE, WangPS. The epidemiology of major depressive disorder: results from the National Comorbidity SurveyReplication (NCS-R). Jama. 2003; 289(23):3095–105. [PubMed: 12813115]
4. Kessler RC, Ustun TB. The World Mental Health (WMH) Survey Initiative Version of the WorldHealth Organization (WHO) Composite International Diagnostic Interview (CIDI). Int J MethodsPsychiatr Res. 2004; 13(2):93–121. [PubMed: 15297906]
5. Weissman MM, Bland R, Joyce PR, Newman S, Wells JE. Wittchen H-U. Sex differences in ratesof depression: cross-national perspectives. Journal of Affective Disorders. 1993; 29:77–84.[PubMed: 8300980]
6. Piccinelli M, Wilkinson G. Outcome of depression in psychiatric settings. British Journal ofPsychiatry. 1994; 164:297–304. [PubMed: 8199782]
7. Wells KB, Stewart A, Hays RD, Burnam MA, Rogers W, Daniels M, Berry S, Greenfield S, Ware J.The functioning and well-being of depressed patients: results from the Medical Outcomes Study.Journal of the American Medical Association. 1989; 262:914–919. [PubMed: 2754791]
8. Broadhead WE, Blazer DG, George LK, Tse CK. Depression, disability days, and days lost fromwork in a prospective epidemiologic survey. Journal of the American Medical Association. 1990;264:2524–2528. [PubMed: 2146410]
9. Judd LL, Paulus MP, Wells KB, Rapaport MN. Socioeconomic burden of subsyndromal depressivesymptoms and major depression in a sample of the general population. American Journal ofPsychiatry. 1996; 153:1411–1417. [PubMed: 8890673]
10. Tsuang MT, Woolson RF. Excess mortality in schizophrenia and affective disorders. Archives ofGeneral Psychiatry. 1978; 35:1181–1185. [PubMed: 697536]
11. Berglund M, Nilsson K. Mortality in severe depression: a prospective study including 103 suicides.Acta Psychiatrica Scandinavica. 1987; 76:372–380. [PubMed: 3425363]
12. Black DW, Winokur G, Nasrallah A. Is death from natural causes still excessive in psychiatricpatients? Journal of Nervous and Mental Disease. 1987; 175:674–680. [PubMed: 3681278]
13. Zilber N, Schufman N, Lerner Y. Mortality among psychiatric patients - the groups at risk. ActaPsychiatrica Scandinavica. 1989; 79:248–256. [PubMed: 2711851]
14. Greenberg PE, Stiglin LE, Finkelstein SN, Berndt ER. The economic burden of depression in1990. Journal of Clinical Psychiatry. 1993; 54:405–418. [PubMed: 8270583]
15. Murray CJL, Lopez AD. Evidence-based health policy: lessons from the Global Burden of DiseaseStudy. Science. 1996; 274:740–743. [PubMed: 8966556]
16. Sullivan PF, Neale MC, Kendler KS. Genetic epidemiology of major depression: review and meta-analysis. American Journal of Psychiatry. 2000; 157:1552–1562. [PubMed: 11007705]
Sullivan et al. Page 16
Mol Psychiatry. Author manuscript; available in PMC 2009 October 1.
NIH
-PA Author Manuscript
NIH
-PA Author Manuscript
NIH
-PA Author Manuscript

17. Altshuler D, Daly M. Guilt beyond a reasonable doubt. Nat Genet. 2007; 39(7):813–5. [PubMed:17597768]
18. Psychiatric GWAS Consortium. A framework for interpreting genomewide association studies ofpsychiatric disorders. Submitted.
19. Manolio TA, Rodriguez LL, Brooks L, Abecasis G, Ballinger D, Daly M, Donnelly P, Faraone SV,Frazer K, Gabriel S, Gejman P, Guttmacher A, Harris EL, Insel T, Kelsoe JR, Lander E, McCowinN, Mailman MD, Nabel E, Ostell J, Pugh E, Sherry S, Sullivan PF, Thompson JF, Warram J,Wholley D, Milos PM, Collins FS. New models of collaboration in genome-wide associationstudies: the Genetic Association Information Network. Nat Genet. 2007; 39(9):1045–1051.[PubMed: 17728769]
20. Mailman MD, Feolo M, Jin Y, Kimura M, Tryka K, Bagoutdinov R, Hao L, Kiang A, Paschall J,Phan L, Popova N, Pretel S, Ziyabari L, Lee M, Shao Y, Wang ZY, Sirotkin K, Ward M,Kholodov M, Zbicz K, Beck J, Kimelman M, Shevelev S, Preuss D, Yaschenko E, Graeff A,Ostell J, Sherry ST. The NCBI dbGaP database of genotypes and phenotypes. Nat Genet. 2007;39(10):1181–6. [PubMed: 17898773]
21. Chanock SJ, Manolio T, Boehnke M, Boerwinkle E, Hunter DJ, Thomas G, Hirschhorn JN,Abecasis G, Altshuler D, Bailey-Wilson JE, Brooks LD, Cardon LR, Daly M, Donnelly P,Fraumeni JF Jr. Freimer NB, Gerhard DS, Gunter C, Guttmacher AE, Guyer MS, Harris EL, HohJ, Hoover R, Kong CA, Merikangas KR, Morton CC, Palmer LJ, Phimister EG, Rice JP, Roberts J,Rotimi C, Tucker MA, Vogan KJ, Wacholder S, Wijsman EM, Winn DM, Collins FS. Replicatinggenotype-phenotype associations. Nature. 2007; 447(7145):655–60. [PubMed: 17554299]
22. Penninx B, Beekman A, Smit J. The Netherlands Study of Depression and Anxiety (NESDA):Rationales, Objectives and Methods. International Journal of Methods in Psychiatric Research.2008; 17:121–40. [PubMed: 18763692]
23. Boomsma DI, de Geus EJ, Vink JM, Stubbe JH, Distel MA, Hottenga JJ, Posthuma D, vanBeijsterveldt TC, Hudziak JJ, Bartels M, Willemsen G. Netherlands Twin Register: from twins totwin families. Twin Res Hum Genet. 2006; 9(6):849–57. [PubMed: 17254420]
24. Boomsma DI, Willemsen G, Sullivan PF, Heutnik P, Meijer P, Sondervan D, Kluft C, Smit G,Nolen WA, Zitman FG, Smit JH, Hoogendijk WJ, van Dyck R, de Geus EJC, Penninx BWJH.Genome-wide association of major depression: Description of samples for the GAIN majordepressive disorder study: NTR and NESDA Biobank Projects. In press.
25. Bijl RV, van Zessen G, Ravelli A, de Rijk C, Langendoen Y. The Netherlands Mental HealthSurvey and Incidence Study (NEMESIS): objectives and design. Soc Psychiatry PsychiatrEpidemiol. 1998; 33(12):581–6. [PubMed: 9857790]
26. Landman-Peeters KM, Hartman CA, van der Pompe G, den Boer JA, Minderaa RB, Ormel J.Gender differences in the relation between social support, problems in parent-offspringcommunication, and depression and anxiety. Soc Sci Med. 2005; 60(11):2549–59. [PubMed:15814180]
27. World Health Organization. Composite International Diagnostic Interview (CIDI), Version 2.1.World Health Organization; Geneva, Switzerland: 1997.
28. Boomsma DI, Beem AL, van den Berg M, Dolan CV, Koopmans JR, Vink JM, de Geus EJ,Slagboom PE. Netherlands twin family study of anxious depression (NETSAD). Twin Res. 2000;3(4):323–34. [PubMed: 11463154]
29. Kessler RC, Barker PR, Colpe LJ, Epstein JF, Gfroerer JC, Hiripi E, Howes MJ, Normand SL,Manderscheid RW, Walters EE, Zaslavsky AM. Screening for serious mental illness in the generalpopulation. Arch Gen Psychiatry. 2003; 60(2):184–9. [PubMed: 12578436]
30. Rush AJ, Gullion CM, Basco MR, Jarrett RB, Trivedi MH. The Inventory of DepressiveSymptomatology (IDS): psychometric properties. Psychol Med. 1996; 26(3):477–86. [PubMed:8733206]
31. Frazer KA, Ballinger DG, Cox DR, Hinds DA, Stuve LL, Gibbs RA, Belmont JW, Boudreau A,Hardenbol P, Leal SM, Pasternak S, Wheeler DA, Willis TD, Yu F, Yang H, Zeng C, Gao Y, HuH, Hu W, Li C, Lin W, Liu S, Pan H, Tang X, Wang J, Wang W, Yu J, Zhang B, Zhang Q, ZhaoH, Zhou J, Gabriel SB, Barry R, Blumenstiel B, Camargo A, Defelice M, Faggart M, Goyette M,Gupta S, Moore J, Nguyen H, Onofrio RC, Parkin M, Roy J, Stahl E, Winchester E, Ziaugra L,Altshuler D, Shen Y, Yao Z, Huang W, Chu X, He Y, Jin L, Liu Y, Sun W, Wang H, Wang Y,
Sullivan et al. Page 17
Mol Psychiatry. Author manuscript; available in PMC 2009 October 1.
NIH
-PA Author Manuscript
NIH
-PA Author Manuscript
NIH
-PA Author Manuscript

Xiong X, Xu L, Waye MM, Tsui SK, Xue H, Wong JT, Galver LM, Fan JB, Gunderson K,Murray SS, Oliphant AR, Chee MS, Montpetit A, Chagnon F, Ferretti V, Leboeuf M, Olivier JF,Phillips MS, Roumy S, Sallee C, Verner A, Hudson TJ, Kwok PY, Cai D, Koboldt DC, Miller RD,Pawlikowska L, Taillon-Miller P, Xiao M, Tsui LC, Mak W, Song YQ, Tam PK, Nakamura Y,Kawaguchi T, Kitamoto T, Morizono T, Nagashima A, Ohnishi Y, Sekine A, Tanaka T, TsunodaT, Deloukas P, Bird CP, Delgado M, Dermitzakis ET, Gwilliam R, Hunt S, Morrison J, Powell D,Stranger BE, Whittaker P, Bentley DR, Daly MJ, de Bakker PI, Barrett J, Chretien YR, Maller J,McCarroll S, Patterson N, Pe'er I, Price A, Purcell S, Richter DJ, Sabeti P, Saxena R, SchaffnerSF, Sham PC, Varilly P, Stein LD, Krishnan L, Smith AV, Tello-Ruiz MK, Thorisson GA,Chakravarti A, Chen PE, Cutler DJ, Kashuk CS, Lin S, Abecasis GR, Guan W, Li Y, Munro HM,Qin ZS, Thomas DJ, McVean G, Auton A, Bottolo L, Cardin N, Eyheramendy S, Freeman C,Marchini J, Myers S, Spencer C, Stephens M, Donnelly P, Cardon LR, Clarke G, Evans DM,Morris AP, Weir BS, Mullikin JC, Sherry ST, Feolo M, Skol A, Zhang H, Matsuda I, FukushimaY, Macer DR, Suda E, Rotimi CN, Adebamowo CA, Ajayi I, Aniagwu T, Marshall PA,Nkwodimmah C, Royal CD, Leppert MF, Dixon M, Peiffer A, Qiu R, Kent A, Kato K, Niikawa N,Adewole IF, Knoppers BM, Foster MW, Clayton EW, Watkin J, Muzny D, Nazareth L, SodergrenE, Weinstock GM, Yakub I, Birren BW, Wilson RK, Fulton LL, Rogers J, Burton J, Carter NP,Clee CM, Griffiths M, Jones MC, McLay K, Plumb RW, Ross MT, Sims SK, Willey DL, Chen Z,Han H, Kang L, Godbout M, Wallenburg JC, L'Archeveque P, Bellemare G, Saeki K, An D, Fu H,Li Q, Wang Z, Wang R, Holden AL, Brooks LD, McEwen JE, Guyer MS, Wang VO, Peterson JL,Shi M, Spiegel J, Sung LM, Zacharia LF, Collins FS, Kennedy K, Jamieson R, Stewart J. Asecond generation human haplotype map of over 3.1 million SNPs. Nature. 2007; 449(7164):851–61. [PubMed: 17943122]
32. Hinds DA, Stuve LL, Nilsen GB, Halperin E, Eskin E, Ballinger DG, Frazer KA, Cox DR. Whole-genome patterns of common DNA variation in three human populations. Science. 2005;307(5712):1072–9. [PubMed: 15718463]
33. Carlson CS, Eberle MA, Rieder MJ, Yi Q, Kruglyak L, Nickerson DA. Selecting a maximallyinformative set of single-nucleotide polymorphisms for association analyses using linkagedisequilibrium. Am J Hum Genet. 2004; 74(1):106–20. [PubMed: 14681826]
34. Altshuler D, Brooks LD, Chakravarti A, Collins FS, Daly MJ, Donnelly P. A haplotype map of thehuman genome. Nature. 2005; 437(7063):1299–320. [PubMed: 16255080]
35. Bierut LJ, Madden PA, Breslau N, Johnson EO, Hatsukami D, Pomerleau OF, Swan GE, Rutter J,Bertelsen S, Fox L, Fugman D, Goate AM, Hinrichs AL, Konvicka K, Martin NG, MontgomeryGW, Saccone NL, Saccone SF, Wang JC, Chase GA, Rice JP, Ballinger DG. Novel genesidentified in a high-density genome wide association study for nicotine dependence. Hum MolGenet. 2007; 16(1):24–35. [PubMed: 17158188]
36. Sullivan PF, Lin D, Tzeng JY, van den Oord EJCG, Perkins D, Stroup TS, Wagner M, Lee S,Wright FA, Zou F, Liu W, Downing AM, Lieberman JA, Close SL. Genomewide association forschizophrenia in the CATIE study: Results of Stage 1. Molecular Psychiatry. 2008; 13:570–84.[PubMed: 18347602]
37. Hemminger BM, Saelim B, Sullivan PF. TAMAL: An integrated approach to choosing SNPs forgenetic studies of human complex traits. Bioinformatics. 2006; 22:626–7. [PubMed: 16418238]
38. Wittke-Thompson JK, Pluzhnikov A, Cox NJ. Rational inferences about departures from Hardy-Weinberg equilibrium. Am J Hum Genet. 2005; 76(6):967–86. [PubMed: 15834813]
39. Wigginton JE, Cutler DJ, Abecasis GR. A note on exact tests of Hardy-Weinberg equilibrium. AmJ Hum Genet. 2005; 76(5):887–3. [PubMed: 15789306]
40. Balding DJ. A tutorial on statistical methods for population association studies. Nat Rev Genet.2006; 7(10):781–91. [PubMed: 16983374]
41. Sasieni PD. From genotypes to genes: doubling the sample size. Biometrics. 1997; 53:1253–1261.[PubMed: 9423247]
42. Fisher, RA. Statistical Methods for Reesearch Workers. 11th edition. Oliver and Boyd; London:1950.
43. Purcell S, Neale B, Todd-Brown K, Thomas L, Ferreira M, Bender D, Maller J, de Bakker P, DalyM, Sham P. PLINK: a toolset for whole-genome association and population-based linkageanalysis. American Journal of Human Genetics. 2007; 81:559–75. [PubMed: 17701901]
Sullivan et al. Page 18
Mol Psychiatry. Author manuscript; available in PMC 2009 October 1.
NIH
-PA Author Manuscript
NIH
-PA Author Manuscript
NIH
-PA Author Manuscript

44. Price AL, Patterson NJ, Plenge RM, Weinblatt ME, Shadick NA, Reich D. Principal componentsanalysis corrects for stratification in genome-wide association studies. Nature Genetics. 2006;38:904–9. [PubMed: 16862161]
45. Storey JD. The positive false discovery rate: a Bayesian interpretation and the q-value. Annals ofStatistics. 2003; 31:2013–35.
46. Storey JD, Tibshirani R. Statistical significance for genomewide studies. Proc Natl Acad Sci U SA. 2003; 100(16):9440–5. [PubMed: 12883005]
47. Benjamini Y, Hochberg Y. Controlling the false discovery rate: a practical and powerful approachto multiple testing. Journal of the Royal Statistical Society (Series B). 1995; 57:289–300.
48. Brown BW, Russell K. Methods of correcting for multiple testing: operating characteristics. StatMed. 1997; 16(22):2511–28. [PubMed: 9403953]
49. Fernando RL, Nettleton D, Southey BR, Dekkers JC, Rothschild MF, Soller M. Controlling theproportion of false positives in multiple dependent tests. Genetics. 2004; 166(1):611–9. [PubMed:15020448]
50. van den Oord EJ, Sullivan PF. A framework for controlling false discovery rates and minimizingthe amount of genotyping in the search for disease mutations. Hum Hered. 2003; 56(4):188–99.[PubMed: 15031620]
51. Tsai CA, Hsueh HM, Chen JJ. Estimation of false discovery rates in multiple testing: application togene microarray data. Biometrics. 2003; 59(4):1071–81. [PubMed: 14969487]
52. van den Oord EJ. Controlling false discoveries in candidate gene studies. Mol Psychiatry. 2005;10(3):230–1. [PubMed: 15738930]
53. Sabatti C, Service S, Freimer N. False discovery rate in linkage and association genome screens forcomplex disorders. Genetics. 2003; 164(2):829–33. [PubMed: 12807801]
54. Meinhausen N, Rice J. Estimating the proportion of false null hypotheses among a large number ofindependently tested hypotheses. Annals of Statistics. 2006; 34:373–93.
55. van den Oord EJ, Sullivan PF. False discoveries and models for gene discovery. Trends Genet.2003; 19(10):537–42. [PubMed: 14550627]
56. Lin DY, Hu Y, Huang BE. Simple and efficient analysis of disease association with missinggenotype data. American Journal of Human Genetics. 2008; 82:444–452. [PubMed: 18252224]
57. Gauderman WJ. Sample size requirements for association studies of gene-gene interaction. Am JEpidemiol. 2002; 155(5):478–84. [PubMed: 11867360]
58. Gauderman WJ. Sample size requirements for matched case-control studies of gene-environmentinteraction. Stat Med. 2002; 21(1):35–50. [PubMed: 11782049]
59. SAS Institute Inc. SAS/STAT® Software: Version 9. SAS Institute, Inc.; Cary, NC: 2004.
60. R Development Core Team. R: A Language and Environment for Statistical Computing. RFoundation for Statistical Computing; Vienna, Austria: 2007.
61. Lin DY, Zeng D, Millikan R. Maximum likelihood estimation of haplotype effects and haplotype-environment interactions in association studies. Genet Epidemiol. 2005; 29(4):299–312. [PubMed:16240443]
62. Zeng D, Lin DY, Avery CL, North KE, Bray MS. Efficient semiparametric estimation ofhaplotype-disease associations in case-cohort and nested case-control studies. Biostatistics. 2006;7(3):486–502. [PubMed: 16500923]
63. Huang B, Amos C, Lin D. Detecting haplotype effects in genomewide association studies. GeneticEpidemiology. 2007; 31:803–12. [PubMed: 17549762]
64. Barrett JC, Fry B, Maller J, Daly MJ. Haploview: analysis and visualization of LD and haplotypemaps. Bioinformatics. 2005; 21:263–5. [PubMed: 15297300]
65. SAS Institute Inc. JMP User's Guide (Version 6). SAS Institute, Inc.; Cary, NC: 2005.
66. Wheeler DL, Barrett T, Benson DA, Bryant SH, Canese K, Chetvernin V, Church DM, DiCuccioM, Edgar R, Federhen S, Geer LY, Helmberg W, Kapustin Y, Kenton DL, Khovayko O, LipmanDJ, Madden TL, Maglott DR, Ostell J, Pruitt KD, Schuler GD, Schriml LM, Sequeira E, SherryST, Sirotkin K, Souvorov A, Starchenko G, Suzek TO, Tatusov R, Tatusova TA, Wagner L,Yaschenko E. Database resources of the National Center for Biotechnology Information. NucleicAcids Res. 2006; 34(Database issue):D173–80. [PubMed: 16381840]
Sullivan et al. Page 19
Mol Psychiatry. Author manuscript; available in PMC 2009 October 1.
NIH
-PA Author Manuscript
NIH
-PA Author Manuscript
NIH
-PA Author Manuscript

67. Hinrichs AS, Karolchik D, Baertsch R, Barber GP, Bejerano G, Clawson H, Diekhans M, FureyTS, Harte RA, Hsu F, Hillman-Jackson J, Kuhn RM, Pedersen JS, Pohl A, Raney BJ, RosenbloomKR, Siepel A, Smith KE, Sugnet CW, Sultan-Qurraie A, Thomas DJ, Trumbower H, Weber RJ,Weirauch M, Zweig AS, Haussler D, Kent WJ. The UCSC Genome Browser Database: update2006. Nucleic Acids Res. 2006; 34(Database issue):D590–8. [PubMed: 16381938]
68. Blaschke RJ, Rappold G. The pseudoautosomal regions, SHOX and disease. Curr Opin Genet Dev.2006; 16(3):233–9. [PubMed: 16650979]
69. Devlin B, Roeder K. Genomic control for association studies. Biometrics. 1999; 55:997–1004.[PubMed: 11315092]
70. Baum AE, Akula N, Cabanero M, Cardona I, Corona W, Klemens B, Schulze TG, Cichon S,Rietschel M, Nothen MM, Georgi A, Schumacher J, Schwarz M, Abou Jamra R, Hofels S,Propping P, Satagopan J, Detera-Wadleigh SD, Hardy J, McMahon FJ. A genome-wideassociation study implicates diacylglycerol kinase eta (DGKH) and several other genes in theetiology of bipolar disorder. Mol Psychiatry. 2007
71. Phillips GR, Huang JK, Wang Y, Tanaka H, Shapiro L, Zhang W, Shan WS, Arndt K, Frank M,Gordon RE, Gawinowicz MA, Zhao Y, Colman DR. The presynaptic particle web: ultrastructure,composition, dissolution, and reconstitution. Neuron. 2001; 32(1):63–77. [PubMed: 11604139]
72. Schildkraut JJ. The catecholamine hypothesis of affective disorders: a review of supportingevidence. Am J Psychiatry. 1965; 122(5):509–22. [PubMed: 5319766]
73. Wang X, Kibschull M, Laue MM, Lichte B, Petrasch-Parwez E, Kilimann MW. Aczonin, a 550-kD putative scaffolding protein of presynaptic active zones, shares homology regions with Rimand Bassoon and binds profilin. J Cell Biol. 1999; 147(1):151–62. [PubMed: 10508862]
74. Sabeti PC, Varilly P, Fry B, Lohmueller J, Hostetter E, Cotsapas C, Xie X, Byrne EH, McCarrollSA, Gaudet R, Schaffner SF, Lander ES, Frazer KA, Ballinger DG, Cox DR, Hinds DA, Stuve LL,Gibbs RA, Belmont JW, Boudreau A, Hardenbol P, Leal SM, Pasternak S, Wheeler DA, WillisTD, Yu F, Yang H, Zeng C, Gao Y, Hu H, Hu W, Li C, Lin W, Liu S, Pan H, Tang X, Wang J,Wang W, Yu J, Zhang B, Zhang Q, Zhao H, Zhou J, Gabriel SB, Barry R, Blumenstiel B,Camargo A, Defelice M, Faggart M, Goyette M, Gupta S, Moore J, Nguyen H, Onofrio RC,Parkin M, Roy J, Stahl E, Winchester E, Ziaugra L, Altshuler D, Shen Y, Yao Z, Huang W, ChuX, He Y, Jin L, Liu Y, Sun W, Wang H, Wang Y, Xiong X, Xu L, Waye MM, Tsui SK, Xue H,Wong JT, Galver LM, Fan JB, Gunderson K, Murray SS, Oliphant AR, Chee MS, Montpetit A,Chagnon F, Ferretti V, Leboeuf M, Olivier JF, Phillips MS, Roumy S, Sallee C, Verner A, HudsonTJ, Kwok PY, Cai D, Koboldt DC, Miller RD, Pawlikowska L, Taillon-Miller P, Xiao M, TsuiLC, Mak W, Song YQ, Tam PK, Nakamura Y, Kawaguchi T, Kitamoto T, Morizono T,Nagashima A, Ohnishi Y, Sekine A, Tanaka T, Tsunoda T, Deloukas P, Bird CP, Delgado M,Dermitzakis ET, Gwilliam R, Hunt S, Morrison J, Powell D, Stranger BE, Whittaker P, BentleyDR, Daly MJ, de Bakker PI, Barrett J, Chretien YR, Maller J, McCarroll S, Patterson N, Pe'er I,Price A, Purcell S, Richter DJ, Sabeti P, Saxena R, Sham PC, Stein LD, Krishnan L, Smith AV,Tello-Ruiz MK, Thorisson GA, Chakravarti A, Chen PE, Cutler DJ, Kashuk CS, Lin S, AbecasisGR, Guan W, Li Y, Munro HM, Qin ZS, Thomas DJ, McVean G, Auton A, Bottolo L, Cardin N,Eyheramendy S, Freeman C, Marchini J, Myers S, Spencer C, Stephens M, Donnelly P, CardonLR, Clarke G, Evans DM, Morris AP, Weir BS, Johnson TA, Mullikin JC, Sherry ST, Feolo M,Skol A, Zhang H, Matsuda I, Fukushima Y, Macer DR, Suda E, Rotimi CN, Adebamowo CA,Ajayi I, Aniagwu T, Marshall PA, Nkwodimmah C, Royal CD, Leppert MF, Dixon M, Peiffer A,Qiu R, Kent A, Kato K, Niikawa N, Adewole IF, Knoppers BM, Foster MW, Clayton EW, WatkinJ, Muzny D, Nazareth L, Sodergren E, Weinstock GM, Yakub I, Birren BW, Wilson RK, FultonLL, Rogers J, Burton J, Carter NP, Clee CM, Griffiths M, Jones MC, McLay K, Plumb RW, RossMT, Sims SK, Willey DL, Chen Z, Han H, Kang L, Godbout M, Wallenburg JC, L'Archeveque P,Bellemare G, Saeki K, An D, Fu H, Li Q, Wang Z, Wang R, Holden AL, Brooks LD, McEwen JE,Guyer MS, Wang VO, Peterson JL, Shi M, Spiegel J, Sung LM, Zacharia LF, Collins FS, KennedyK, Jamieson R, Stewart J. Genome-wide detection and characterization of positive selection inhuman populations. Nature. 2007; 449(7164):913–8. [PubMed: 17943131]
75. Iafrate AJ, Feuk L, Rivera MN, Listewnik ML, Donahoe PK, Qi Y, Scherer SW, Lee C. Detectionof large-scale variation in the human genome. Nat Genet. 2004; 36(9):949–51. [PubMed:15286789]
Sullivan et al. Page 20
Mol Psychiatry. Author manuscript; available in PMC 2009 October 1.
NIH
-PA Author Manuscript
NIH
-PA Author Manuscript
NIH
-PA Author Manuscript

76. Pinto D, Marshall C, Feuk L, Scherer SW. Copy-number variation in control population cohorts.Hum Mol Genet. 2007; 16(Spec No. 2):R168–73. [PubMed: 17911159]
77. Wang K, Li M, Hadley D, Liu R, Glessner J, Grant SF, Hakonarson H, Bucan M. PennCNV: anintegrated hidden Markov model designed for high-resolution copy number variation detection inwhole-genome SNP genotyping data. Genome Res. 2007; 17(11):1665–74. [PubMed: 17921354]
78. Levinson DF, Zubenko GS, Crowe RR, DePaulo RJ, Scheftner WS, Weissman MM, Holmans P,Zubenko WN, Boutelle S, Murphy-Eberenz K, MacKinnon D, McInnis MG, Marta DH, Adams P,Sassoon S, Knowles JA, Thomas J, Chellis J. Genetics of recurrent early-onset depression(GenRED): design and preliminary clinical characteristics of a repository sample for geneticlinkage studies. Am J Med Genet B Neuropsychiatr Genet. 2003; 119(1):118–30. [PubMed:12707949]
79. Sun L, Bull S. Reduction of selection bias in genomewide genetic studies by resampling. GeneticEpidemiology. 2005; 28:352–67. [PubMed: 15761913]
80. de Bakker PI, Yelensky R, Pe'er I, Gabriel SB, Daly MJ, Altshuler D. Efficiency and power ingenetic association studies. Nat Genet. 2005; 37(11):1217–23. [PubMed: 16244653]
81. Lopez-Leon S, Janssens AC, Gonzalez-Zuloeta Ladd AM, Del-Favero J, Claes SJ, Oostra BA, vanDuijn CM. Meta-analyses of genetic studies on major depressive disorder. Mol Psychiatry. 2007
82. Frayling TM. Genome-wide association studies provide new insights into type 2 diabetesaetiology. Nature Reviews Genetics. 2007; 8(9):657–62.
83. Scott LJ, Mohlke KL, Bonnycastle LL, Willer CJ, Li Y, Duren WL, Erdos MR, Stringham HM,Chines PS, Jackson AU, Prokunina-Olsson L, Ding CJ, Swift AJ, Narisu N, Hu T, Pruim R, XiaoR, Li XY, Conneely KN, Riebow NL, Sprau AG, Tong M, White PP, Hetrick KN, Barnhart MW,Bark CW, Goldstein JL, Watkins L, Xiang F, Saramies J, Buchanan TA, Watanabe RM, Valle TT,Kinnunen L, Abecasis GR, Pugh EW, Doheny KF, Bergman RN, Tuomilehto J, Collins FS,Boehnke M. A Genome-Wide Association Study of Type 2 Diabetes in Finns Detects MultipleSusceptibility Variants. Science. 2007; 316:1341–5. [PubMed: 17463248]
84. Saxena R, Voight BF, Lyssenko V, Burtt NP, de Bakker PI, Chen H, Roix JJ, Kathiresan S,Hirschhorn JN, Daly MJ, Hughes TE, Groop L, Altshuler D, Almgren P, Florez JC, Meyer J,Ardlie K, Bengtsson K, Isomaa B, Lettre G, Lindblad U, Lyon HN, Melander O, Newton-Cheh C,Nilsson P, Orho-Melander M, Rastam L, Speliotes EK, Taskinen MR, Tuomi T, Guiducci C,Berglund A, Carlson J, Gianniny L, Hackett R, Hall L, Holmkvist J, Laurila E, Sjogren M, SternerM, Surti A, Svensson M, Tewhey R, Blumenstiel B, Parkin M, Defelice M, Barry R, Brodeur W,Camarata J, Chia N, Fava M, Gibbons J, Handsaker B, Healy C, Nguyen K, Gates C, Sougnez C,Gage D, Nizzari M, Gabriel SB, Chirn GW, Ma Q, Parikh H, Richardson D, Ricke D, Purcell S.Genome-Wide Association Analysis Identifies Loci for Type 2 Diabetes and Triglyceride Levels.Science. 2007; 316:1331–6. [PubMed: 17463246]
85. Zeggini E, Scott LJ, Saxena R, Voight BF, Marchini JL, Hu T, de Bakker PI, Abecasis GR,Almgren P, Andersen G, Ardlie K, Bostrom KB, Bergman RN, Bonnycastle LL, Borch-JohnsenK, Burtt NP, Chen H, Chines PS, Daly MJ, Deodhar P, Ding CJ, Doney AS, Duren WL, ElliottKS, Erdos MR, Frayling TM, Freathy RM, Gianniny L, Grallert H, Grarup N, Groves CJ,Guiducci C, Hansen T, Herder C, Hitman GA, Hughes TE, Isomaa B, Jackson AU, Jorgensen T,Kong A, Kubalanza K, Kuruvilla FG, Kuusisto J, Langenberg C, Lango H, Lauritzen T, Li Y,Lindgren CM, Lyssenko V, Marvelle AF, Meisinger C, Midthjell K, Mohlke KL, Morken MA,Morris AD, Narisu N, Nilsson P, Owen KR, Palmer CN, Payne F, Perry JR, Pettersen E, Platou C,Prokopenko I, Qi L, Qin L, Rayner NW, Rees M, Roix JJ, Sandbaek A, Shields B, Sjogren M,Steinthorsdottir V, Stringham HM, Swift AJ, Thorleifsson G, Thorsteinsdottir U, Timpson NJ,Tuomi T, Tuomilehto J, Walker M, Watanabe RM, Weedon MN, Willer CJ, Illig T, Hveem K, HuFB, Laakso M, Stefansson K, Pedersen O, Wareham NJ, Barroso I, Hattersley AT, Collins FS,Groop L, McCarthy MI, Boehnke M, Altshuler D. Meta-analysis of genome-wide association dataand large-scale replication identifies additional susceptibility loci for type 2 diabetes. Nat Genet.2008; 40(5):638–45. [PubMed: 18372903]
86. Sudhof TC. Neurotransmitter release. Handb Exp Pharmacol. 2008; (184):1–21.
87. Shildkraut JJ. The catecholamine hypothesis of affective disorders: a review of the supportingevidence. American Journal of Psychiatry. 1965; 122:509–522. [PubMed: 5319766]
Sullivan et al. Page 21
Mol Psychiatry. Author manuscript; available in PMC 2009 October 1.
NIH
-PA Author Manuscript
NIH
-PA Author Manuscript
NIH
-PA Author Manuscript

88. Garcia J, Gerber SH, Sugita S, Sudhof TC, Rizo J. A conformational switch in the Piccolo C2Adomain regulated by alternative splicing. Nat Struct Mol Biol. 2004; 11(1):45–53. [PubMed:14718922]
89. Gerber SH, Garcia J, Rizo J, Sudhof TC. An unusual C(2)-domain in the active-zone proteinpiccolo: implications for Ca(2+) regulation of neurotransmitter release. Embo J. 2001; 20(7):1605–19. [PubMed: 11285225]
90. Nabi R, Zhong H, Serajee FJ, Huq AH. No association between single nucleotide polymorphismsin DLX6 and Piccolo genes at 7q21-q22 and autism. Am J Med Genet B Neuropsychiatr Genet.2003; 119B(1):98–101. [PubMed: 12707945]
91. Zollner S, Pritchard JK. Overcoming the winner's curse: estimating penetrance parameters fromcase-control data. Am J Hum Genet. 2007; 80(4):605–15. [PubMed: 17357068]
92. Ghosh A, Zou F, Wright FA. Estimating odds ratios in genome scans: an approximate conditionallikelihood approach. Am J Hum Genet. 2008; 82(5):1064–74. [PubMed: 18423522]
93. Patten SB. Selection bias in studies of major depression using clinical subjects. J Clin Epidemiol.2000; 53(4):351–7. [PubMed: 10785565]
94. Galbaud du Fort G, Newman SC, Bland RC. Psychiatric comorbidity and treatment seeking.Sources of selection bias in the study of clinical populations. J Nerv Ment Dis. 1993; 181(8):467–74. [PubMed: 8360638]
95. Berkson J. Limitations of the application of fourfold table analysis to hospital data. BiometicsBulletin. 1946; 2:47–53.
96. Sullivan PF, Joyce PR. Effects of exclusion criteria in depression treatment studies. Journal ofAffective Disorders. 1994; 32:21–26. [PubMed: 7798463]
97. Sullivan PF, Wells JE, Joyce PR, Bushnell JA, Mulder RT, Oakley-Browne MA. Family history ofdepression in clinic and community samples. Journal of Affective Disorders. 1996; 40:159–168.[PubMed: 8897115]
98. Kendler KS, Neale MC, Kessler RC, Heath AC, Eaves LJ. The lifetime history of major depressionin women: reliability of diagnosis and heritability. Archives of General Psychiatry. 1993; 50:863–870. [PubMed: 8215812]
99. McGuffin P, Katz R, Watkins S, Rutherford J. A hospital-based twin register of the heritability ofDSM-IV unipolar depression. Archives of General Psychiatry. 1996; 53:129–136. [PubMed:8629888]
100. Shaw CJ, Lupski JR. Implications of human genome architecture for rearrangement-baseddisorders: the genomic basis of disease. Hum Mol Genet. 2004; 13(Spec No 1):R57–64.[PubMed: 14764619]
101. Konneker T, Barnes T, Furberg H, Losh M, Bulik CM, Sullivan PF. A searchable database ofgenetic evidence for psychiatric disorders. American Journal of Medical Genetics(Neuropsychiatric Genetics). 2008; 147:671–5.
102. WTCCC. Genome-wide association study of 14,000 cases of seven common diseases and 3,000shared controls. Nature. 2007; 447(7145):661–78. [PubMed: 17554300]
103. van den Oord EJ, Kuo PH, Hartmann AM, Webb BT, Moller HJ, Hettema JM, Giegling I,Bukszar J, Rujescu D. Genomewide association analysis followed by a replication studyimplicates a novel candidate gene for neuroticism. Arch Gen Psychiatry. 2008; 65(9):1062–71.[PubMed: 18762592]
104. O'Donovan M, Craddock N, Norton N, Williams H, Peirce T, Moskvina V, Nikolov I, HamshereM, Carroll L, Georgieva L, Dwyer S, Holmans P, Marchini J, Spencer C, Howie B, Leung H-T,Hartmann A, Möller H-J, Morris D, Shi Y, Feng G, Hoffmann P, Propping P, Vasilescu C, MaierW, Rieschel M, Zammit S, Schumacher J, Quinn E, Schulze T, Williams N, Giegling I, Iwata N,Ikeda M, Darvasi A, Shifman S, He L, Duan J, Sanders A, Levinson D, Gejman P, Cichon S,Nöthen M, Gill M, Corvin A, Rujescu D, Kirov G, Owen M. Identification of novelschizophrenia loci by genome-wide association and follow-up. Nature Genetics. 2008
105. Ferreira M, O'Donovan M, Meng Y, Jones I, Ruderfer D, Jones L, Fan J, Kirov G, Perlis R, GreenE, Smoller J, Grozeva D, Stone J, Nikolov I, Chambert K, Hamshere M, Nimgaonkar V,Moskvina V, Thase M, Caesar S, Sachs G, Franklin J, Gordon-Smith K, Ardlie K, Gabriel S,Fraser C, Blumenstiel B, Defelice M, Breen G, Gill M, Morris D, Elkin A, Muir W, McGhee K,
Sullivan et al. Page 22
Mol Psychiatry. Author manuscript; available in PMC 2009 October 1.
NIH
-PA Author Manuscript
NIH
-PA Author Manuscript
NIH
-PA Author Manuscript

Williamson R, MacIntyre D, McLean A, St Clair D, VanBeck M, Pereira A, Kandaswamy R,McQuillin A, Collier D, Bass N, Young A, Lawrence J, Ferrier I, Anjorin A, Farmer A, Curtis D,Scolnick E, McGuffin P, Daly M, Corvin A, Holmans P, Blackwood D, Gurling H, Owen M,Purcell S, Sklar P, Craddock N. Collaborative genome-wide association analysis of 10,596individuals supports a role for Ankyrin-G (ANK3) and the alpha-1C subunit of the L-typevoltage-gated calcium channel (CACNA1C) in bipolar disorder. Nature Genetics. 2008
106. Sebat J, Lakshmi B, Troge J, Alexander J, Young J, Lundin P, Maner S, Massa H, Walker M, ChiM, Navin N, Lucito R, Healy J, Hicks J, Ye K, Reiner A, Gilliam TC, Trask B, Patterson N,Zetterberg A, Wigler M. Large-scale copy number polymorphism in the human genome. Science.2004; 305(5683):525–8. [PubMed: 15273396]
107. Weiss LA, Shen Y, Korn JM, Arking DE, Miller DT, Fossdal R, Saemundsen E, Stefansson H,Ferreira MA, Green T, Platt OS, Ruderfer DM, Walsh CA, Altshuler D, Chakravarti A, TanziRE, Stefansson K, Santangelo SL, Gusella JF, Sklar P, Wu BL, Daly MJ. Association betweenmicrodeletion and microduplication at 16p11.2 and autism. New England Journal of Medicine.2008; 358(7):667–75. [PubMed: 18184952]
108. Walsh T, McClellan JM, McCarthy SE, Addington AM, Pierce SB, Cooper GM, Nord AS,Kusenda M, Malhotra D, Bhandari A, Stray SM, Rippey CF, Roccanova P, Makarov V, LakshmiB, Findling RL, Sikich L, Stromberg T, Merriman B, Gogtay N, Butler P, Eckstrand K, Noory L,Gochman P, Long R, Chen Z, Davis S, Baker C, Eichler EE, Meltzer PS, Nelson SF, SingletonAB, Lee MK, Rapoport JL, King MC, Sebat J. Rare structural variants disrupt multiple genes inneurodevelopmental pathways in schizophrenia. Science. 2008; 320:539–43. [PubMed:18369103]
Sullivan et al. Page 23
Mol Psychiatry. Author manuscript; available in PMC 2009 October 1.
NIH
-PA Author Manuscript
NIH
-PA Author Manuscript
NIH
-PA Author Manuscript

Figure 1.GWAS results for MDD in cases versus controls. Panel a shows the quantile-quantile plotsand lambda estimates for the primary analysis using the Cochran-Armitage trend test andconfirmatory analyses using logistic regressions and Cochran-Mantel-Haenszel stratifiedtests. The dashed lines show the expected 95% probability interval for ordered p-values, andthe circles show the observed versus expected values for all SNPs. The λ values are themedian Χ2 from all association tests divided by the expected value under the null hypothesisof no association. If λ is large (e.g., >1.2), there is evidence that the observed test statisticsdeviate from the expected. This could be due to true associations but is more likely due to asystematic bias (e.g., population stratification effects). The λ values in Panel a are notconsistent with the presence of stematic biases in the results. Panel b depicts −log10(p) bygenomic location for chr1-chr22 plus chrX. Odd-numbered chromosomes are in light blueand even-numbered chromosomes in orange. The 25 smallest p-values are shown with greencrosses.
Sullivan et al. Page 24
Mol Psychiatry. Author manuscript; available in PMC 2009 October 1.
NIH
-PA Author Manuscript
NIH
-PA Author Manuscript
NIH
-PA Author Manuscript

Figure 2.Plot of the PCLO region (NCBI build 35, UCSC hg17, chr7:82,000,000-82,500,000). P-values in this figure are all from SNPMstat. The x-axis is chromosomal position, the left y-axis −log10(p) for genotyped SNPs (colored diamonds) and imputed SNPs (grey diamonds),and the right y-axis the recombination rate from the HapMap EUR panel (light blue curve).The color of the genotyped SNPs corresponds to LD with the SNP with smallest p-value(rs2715148): red 0.8 ≤ r2 ≤ 1.0, orange 0.5 ≤ r2 < 0.8, yellow 0.2 ≤ r2 < 0.5, and white r2 <0.2. The significant and extent of all 3-SNP haplotypes with p<0.0001 in this region arecolored light green. The transcripts for two PCLO isoforms are shown in dark green at thebottom. Graph adapted from an R function by the Broad DGI group.
Sullivan et al. Page 25
Mol Psychiatry. Author manuscript; available in PMC 2009 October 1.
NIH
-PA Author Manuscript
NIH
-PA Author Manuscript
NIH
-PA Author Manuscript

Figure 3.PCLO region replication results for MDD showing genomic context and forest plots for thetop 12 SNPs in the original sample. The backbone of the graph is the region of PCLOtargeted for follow-up. SNP locations are given by the grey triangles. There are 12 forestplots for the SNPs with p<0.001 in the original sample. Each forest plot is for one SNP andshows the odds ratio (square) and 95% confidence intervals (horizontal line) for a particularsample with the area of the square proportional to sample size.
Sullivan et al. Page 26
Mol Psychiatry. Author manuscript; available in PMC 2009 October 1.
NIH
-PA Author Manuscript
NIH
-PA Author Manuscript
NIH
-PA Author Manuscript
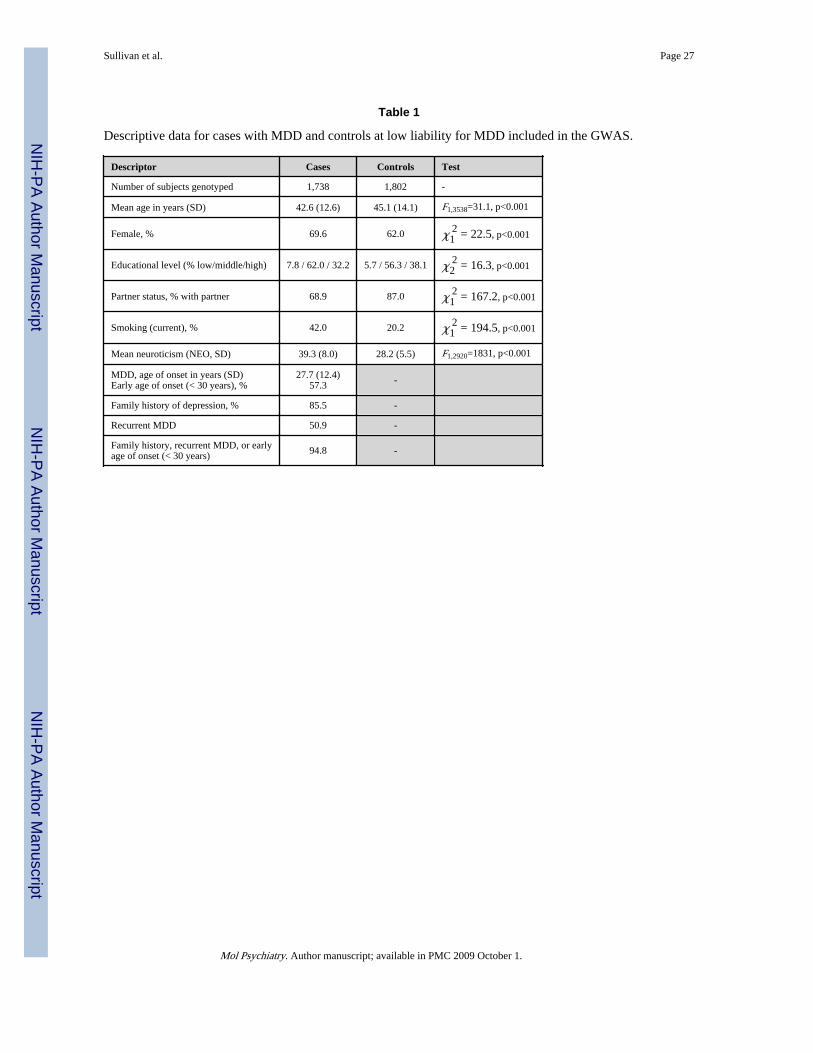
NIH
-PA Author Manuscript
NIH
-PA Author Manuscript
NIH
-PA Author Manuscript
Sullivan et al. Page 27
Table 1
Descriptive data for cases with MDD and controls at low liability for MDD included in the GWAS.
Descriptor Cases Controls Test
Number of subjects genotyped 1,738 1,802 -
Mean age in years (SD) 42.6 (12.6) 45.1 (14.1) F1,3538=31.1, p<0.001
Female, % 69.6 62.0 χ12 = 22.5, p<0.001
Educational level (% low/middle/high) 7.8 / 62.0 / 32.2 5.7 / 56.3 / 38.1 χ22 = 16.3, p<0.001
Partner status, % with partner 68.9 87.0 χ12 = 167.2, p<0.001
Smoking (current), % 42.0 20.2 χ12 = 194.5, p<0.001
Mean neuroticism (NEO, SD) 39.3 (8.0) 28.2 (5.5) F1,2920=1831, p<0.001
MDD, age of onset in years (SD)Early age of onset (< 30 years), %
27.7 (12.4)57.3 -
Family history of depression, % 85.5 -
Recurrent MDD 50.9 -
Family history, recurrent MDD, or earlyage of onset (< 30 years) 94.8 -
Mol Psychiatry. Author manuscript; available in PMC 2009 October 1.

NIH
-PA Author Manuscript
NIH
-PA Author Manuscript
NIH
-PA Author Manuscript
Sullivan et al. Page 28
Tabl
e 2
Info
rmat
ion
on th
e SN
Ps w
ith th
e sm
alle
st a
ssoc
iatio
n p-
valu
es in
the
GW
AS.
Bas
ic S
NP
dat
aB
ioin
form
atic
sR
esul
tsM
AF
Qua
lity
cont
rol -
SNP
mis
sing
ness
Qua
lity
cont
rol -
SNP
Chr
Pos
itio
nA
llele
sSt
rand
Gen
eT
AM
AL
†SL
EP
‡R
ank
OR
(CI)
P-
asym
ptot
icP
-em
piri
cal
q-va
lue
P-g
wem
pA
llC
ases
Con
trol
sH
apM
ap_E
UR
All
Cas
esC
ontr
ols
p-m
issi
ngad
diti
onal
chec
ks
rs12
4717
962
20,1
77,8
20A
/G+
101.
26(1
.14-
1.39
)0.
0000
140.
0000
140.
580.
990.
298
0.32
20.
275
0.27
10.
012
0.01
00.
014
0.36
rs75
6512
42
20,1
83,3
13A
/G+
Reg
pot
71.
26(1
.14-
1.40
)0.
0000
120.
0000
110.
580.
980.
296
0.32
10.
272
0.27
10.
030
0.03
40.
026
0.20
rs39
2302
82
29,5
97,2
47T
/C−
AL
KC
NV
CN
V,
mut
ated
inco
lon
CA
121.
34(1
.17-
1.54
)0.
0000
240.
0000
200.
661.
000.
135
0.15
30.
119
0.17
50.
001
0.00
20.
000
0.06
rs12
6214
412
201,
794,
446
A/G
+N
ear
CN
V13
1.31
(1.1
6-1.
49)
0.00
0024
0.00
0027
0.66
1.00
0.16
60.
185
0.14
70.
150
0.00
80.
008
0.00
90.
86
rs11
1321
684
184,
428,
336
T/C
+M
DD
linka
gepe
ak(8
.6 m
b)
160.
75(0
.65-
0.86
)0.
0000
290.
0000
350.
661.
000.
133
0.11
60.
150
0.11
70.
001
0.00
10.
002
0.63
rs17
0746
314
184,
652,
456
G/A
+M
DD
linka
gepe
ak(8
.3 m
b)
230.
75(0
.66-
0.86
)0.
0000
430.
0000
400.
661.
000.
137
0.12
00.
154
0.07
60.
003
0.00
50.
002
0.26
rs20
9492
36
14,3
97,0
61T
/G−
SCZ
linka
gem
eta-
anal
syis
(2.5
mb)
200.
82(0
.74-
0.90
)0.
0000
420.
0000
460.
661.
000.
417
0.39
30.
441
0.47
50.
001
0.00
10.
002
1.00
rs22
7482
26
14,3
99,0
68C
/T−
SCZ
linka
gem
eta-
anal
syis
(2.5
mb)
60.
79(0
.71-
0.88
)0.
0000
090.
0000
070.
580.
960.
268
0.24
50.
291
0.28
30.
003
0.00
20.
003
1.00
rs15
5847
77
30,9
28,5
87C
/T+
MD
Dlin
kage
peak
(3.0
mb)
11.
27(1
.16-
1.40
)0.
0000
010.
0000
020.
280.
370.
430
0.46
00.
401
0.44
20.
003
0.00
30.
004
0.77
HW
D c
ases
rs77
9198
67
30,9
30,7
19G
/C+
MD
Dlin
kage
peak
(3.0
mb)
141.
22(1
.12-
1.35
)0.
0000
260.
0000
380.
661.
000.
451
0.47
70.
427
0.42
50.
001
0.00
10.
002
0.38
Mol Psychiatry. Author manuscript; available in PMC 2009 October 1.

NIH
-PA Author Manuscript
NIH
-PA Author Manuscript
NIH
-PA Author Manuscript
Sullivan et al. Page 29
Bas
ic S
NP
dat
aB
ioin
form
atic
sR
esul
tsM
AF
Qua
lity
cont
rol -
SNP
mis
sing
ness
Qua
lity
cont
rol -
SNP
Chr
Pos
itio
nA
llele
sSt
rand
Gen
eT
AM
AL
†SL
EP
‡R
ank
OR
(CI)
P-
asym
ptot
icP
-em
piri
cal
q-va
lue
P-g
wem
pA
llC
ases
Con
trol
sH
apM
ap_E
UR
All
Cas
esC
ontr
ols
p-m
issi
ngad
diti
onal
chec
ks
rs27
1514
87
82,0
94,6
86A
/C+
PCL
OC
ons,
reg
pot
BIP
GW
AS
rs27
1514
8(p
=0.
03)
20.
79(0
.72-
0.87
)0.
0000
010.
0000
030.
280.
420.
482
0.45
20.
510
0.52
50.
002
0.00
20.
002
0.72
rs25
2283
37
82,0
98,3
59C
/A+
PCL
OC
ons,
reg
pot
,cS
NP
BIP
GW
AS
rs77
8114
2(p
=0.
03)
31.
26(1
.15-
1.39
)0.
0000
020.
0000
020.
280.
520.
455
0.48
50.
427
0.42
50.
002
0.00
00.
003
0.03
rs25
2284
07
82,1
23,0
66G
/T+
PCL
OC
ons,
reg
pot
BIP
GW
AS
rs77
9926
0(p
=0.
04)
41.
25(1
.14-
1.38
)0.
0000
040.
0000
030.
400.
740.
456
0.48
40.
428
0.42
50.
004
0.00
20.
006
0.18
rs21
0782
87
82,2
00,3
20A
/T+
PCL
OR
eg p
ot8
0.81
(0.7
4-0.
89)
0.00
0013
0.00
0007
0.58
0.99
0.46
00.
433
0.48
60.
500
0.03
70.
036
0.03
80.
79
rs14
5726
68
24,8
25,7
57A
/G−
Reg
pot
MD
Dlin
kage
peak
(7.4
mb)
170.
81(0
.73-
0.89
)0.
0000
290.
0000
340.
661.
000.
319
0.29
50.
342
0.30
00.
002
0.00
20.
001
0.44
rs70
0518
98
81,6
63,2
11T
/C+
Con
s, r
eg p
otB
IPG
WA
Srs
1177
8905
(p=
0.03
,9.
9 kb
)
150.
76(0
.66-
0.86
)0.
0000
280.
0000
360.
661.
000.
153
0.13
40.
170
0.15
00.
001
0.00
00.
002
0.25
rs17
8043
610
34,2
97,6
18A
/G−
50.
80(0
.73-
0.88
)0.
0000
080.
0000
130.
580.
950.
374
0.34
80.
400
0.32
50.
018
0.01
60.
021
0.31
rs11
0316
7611
32,2
42,7
21T
/C+
Reg
pot
211.
26(1
.13-
1.40
)0.
0000
430.
0000
350.
661.
000.
232
0.25
30.
212
0.13
90.
006
0.00
70.
004
0.28
rs12
5797
7112
44,0
19,6
89T
/C+
TM
EM
16F
Con
s, r
eg p
otM
DD
linka
gepe
ak(8
.8 m
b)
110.
78(0
.69-
0.87
)0.
0000
220.
0000
230.
661.
000.
205
0.18
40.
225
0.27
10.
000
0.00
00.
001
1.00
rs47
6507
812
123,
171,
707
C/T
+25
0.82
(0.7
4-0.
90)
0.00
0044
0.00
0035
0.66
1.00
0.37
40.
350
0.39
70.
408
0.00
40.
003
0.00
41.
00
rs80
2344
515
46,9
80,0
83C
/T+
SHC
4R
eg p
ot9
0.72
(0.6
2-0.
84)
0.00
0014
0.00
0009
0.58
0.99
0.11
90.
101
0.13
50.
108
0.01
10.
012
0.01
00.
63
rs38
8517
919
14,6
88,8
30A
/C−
ZN
F333
Reg
pot
, cSN
P18
0.61
(0.4
8-0.
77)
0.00
0032
0.00
0031
0.66
1.00
0.04
60.
035
0.05
60.
033
0.02
10.
024
0.01
80.
24
rs94
1796
2039
,724
,220
A/G
+R
eg p
ot22
1.22
(1.1
1-1.
35)
0.00
0043
0.00
0037
0.66
1.00
0.39
80.
422
0.37
40.
408
0.01
30.
013
0.01
20.
88
rs12
4801
4320
39,7
41,2
40G
/A+
241.
25(1
.13-
1.39
)0.
0000
440.
0000
350.
661.
000.
265
0.28
80.
244
0.23
30.
001
0.00
10.
002
1.00
Mol Psychiatry. Author manuscript; available in PMC 2009 October 1.

NIH
-PA Author Manuscript
NIH
-PA Author Manuscript
NIH
-PA Author Manuscript
Sullivan et al. Page 30
Bas
ic S
NP
dat
aB
ioin
form
atic
sR
esul
tsM
AF
Qua
lity
cont
rol -
SNP
mis
sing
ness
Qua
lity
cont
rol -
SNP
Chr
Pos
itio
nA
llele
sSt
rand
Gen
eT
AM
AL
†SL
EP
‡R
ank
OR
(CI)
P-
asym
ptot
icP
-em
piri
cal
q-va
lue
P-g
wem
pA
llC
ases
Con
trol
sH
apM
ap_E
UR
All
Cas
esC
ontr
ols
p-m
issi
ngad
diti
onal
chec
ks
rs92
8862
2120
,559
,590
G/A
+R
eg p
otN
ear
CN
V19
0.78
(0.6
9-0.
88)
0.00
0040
0.00
0044
0.66
1.00
0.19
00.
170
0.20
90.
167
0.01
30.
012
0.01
30.
77
Not
es. S
orte
d by
loca
tion.
All
loca
tions
per
NC
BI
Bui
ld 3
5 (U
CSC
hg1
7). A
llele
s ar
e gi
ven
as m
inor
/maj
or. O
R (
CI)
=od
ds r
atio
(95
% c
onfi
denc
e in
terv
al).
P-a
sym
ptom
ic=
p-va
lue
from
Tre
nd te
st. P
-em
piri
cal=
poin
twis
e p-
valu
e fr
om a
dapt
ive
perm
uatio
n m
etho
d in
PL
INK
. q-
valu
e=se
e te
xt. P
-gw
emp=
geno
mew
ide
empi
rica
l p-v
alue
via
trad
ition
al p
erm
utat
ion
test
ing
(500
0 re
plic
ates
). M
AF=
min
or a
llele
fre
quen
cy. H
apM
ap M
AFs
hav
e be
en c
onve
rted
to th
e re
fere
nce
alle
le o
f th
e M
DD
sam
ple.
P-m
issi
ng te
sts
the
diff
eren
ce in
mis
sing
ness
bet
wee
nca
ses
and
cont
rols
. For
not
ewor
thy
asso
ciat
ions
, the
fou
r fl
ags
refe
r to
acc
epta
ble
clus
ter
plot
s, c
onfo
rmat
ion
to H
ardy
-Wei
nber
g eq
uilib
rium
, abs
ence
of
plat
e-sp
ecif
ic a
ssoc
iatio
n ou
tlier
s, a
nd th
e pr
esen
ce o
f a
“pro
xy”
SNP
in h
igh
linka
ge d
iseq
uilib
rium
with
the
prim
ary
SNP.
† TA
MA
L c
odes
. cSN
P=co
ding
SN
P. B
ioin
form
atic
fla
g po
ssib
ilitie
s: c
odin
g SN
P (c
SNP)
, SN
P in
seg
men
tal d
uplic
atio
n, k
now
n co
py n
umbe
r va
rian
t (C
NV
), c
onse
rved
bas
e (C
ons)
, miR
NA
targ
et s
ite, r
egio
n of
reg
ulat
ory
pote
ntia
l (re
g po
t), p
redi
cted
pro
mot
er, t
rans
fact
orbi
ndin
g si
te, e
nhan
cer,
exo
n, s
plic
e si
te, m
RN
A e
xpre
ssio
n Q
TL
(ly
mph
ocyt
es o
r co
rtex
). O
nly
posi
tive
flag
s ar
e sh
own.
‡ SLE
P=Su
lliva
n L
ab E
vide
nce
Proj
ect (
http
://sl
ep.u
nc.e
du)
a co
mpe
ndiu
m o
f ge
netic
fin
ding
s fr
om th
e lit
erat
ure.
Sou
rces
(Pu
bMed
ID
s): C
NV
s fr
om D
atab
ase
of G
enom
ic V
aria
tion
(152
8678
9), b
reas
t and
col
on c
ance
r m
utat
ions
(17
9322
54),
MD
D g
enom
ewid
e lin
kage
stu
dies
(126
1286
4, 1
4582
139,
174
2720
3), S
CZ
gen
omew
ide
linka
ge m
eta-
anal
ysis
(12
8027
86),
and
bip
olar
dis
orde
r (B
IP)
GW
AS
(175
5430
0).
Mol Psychiatry. Author manuscript; available in PMC 2009 October 1.

NIH
-PA Author Manuscript
NIH
-PA Author Manuscript
NIH
-PA Author Manuscript
Sullivan et al. Page 31
Tabl
e 3
Clu
ster
ing
of S
NPs
with
low
p-v
alue
s.
Ran
kC
hrSt
art
End
Nsn
psP
min
N<0
.000
1N
<0.0
01N
<0.0
1E
xpre
ssed
in b
rain
?G
enes
Gen
epr
oduc
tsSL
EP
‡
17
30,9
28,5
8730
,931
,521
31.
25E
-06
20
1Y
esA
DC
YA
P1R
1
aden
ylat
e cy
clas
e ac
tivat
ing
poly
pept
ide
1(p
ituita
ry)
rece
ptor
type
IN
euro
activ
e lig
and-
rece
ptor
inte
ract
ion
27
82,0
41,5
7682
,208
,167
101.
50E
-06
64
0Y
esPC
LO
picc
olo
(pre
syna
ptic
cyt
omat
rix
prot
ein)
46
14,3
88,9
3214
,399
,068
29.
09E
-06
11
0
52
20,1
77,8
2020
,183
,313
21.
18E
-05
20
0Y
esL
APT
M4A
lyso
som
al-a
ssoc
iate
d pr
otei
n tr
ansm
embr
ane
4 al
pha
615
46,9
79,6
1846
,980
,083
21.
36E
-05
11
0Y
esC
RI1
EID
1 R
aLP
SHC
4
CR
EB
BP/
EP3
00 in
hibi
tor
1/E
P300
inte
ract
ing
inhi
bito
r of
diff
eren
tiatio
n 1/
rai-
like
prot
ein/
SHC
(Src
hom
olog
y 2
dom
ain
cont
aini
ng)
fam
ily, m
embe
r 4
92
201,
794,
446
201,
880,
818
22.
44E
-05
11
0Y
es
AJ4
8767
8 A
J487
679
AK
1253
94 A
Y69
0601
CA
SP10
CFL
AR
ND
UFB
3
Cas
pase
10.
/Cas
pase
10.
/PR
O30
98./C
aspa
se 1
0 sp
lice
vari
ant G
./cas
pase
10,
apo
ptos
is-r
elat
ed c
yste
ine
pept
idas
e/C
ASP
8 an
d FA
DD
-lik
e ap
opto
sis
regu
lato
r/N
AD
Hde
hydr
ogen
ase
(ubi
quin
one)
1 b
eta
subc
ompl
ex, 3
, 12k
Da
CA
SP10
cau
ses
mul
tiple
neo
plas
ms
(OM
IM 6
0176
2); C
FLA
R u
preg
ulat
ed in
MD
D in
pos
t-m
orte
m b
rain
1420
39,7
24,2
2039
,742
,644
54.
27E
-05
50
0
156
14,3
86,1
4814
,397
,061
34.
23E
-05
11
1
164
184,
652,
456
184,
658,
003
34.
28E
-05
10
2
175
117,
174,
763
117,
282,
887
44.
84E
-05
11
2
1910
127,
071,
672
127,
087,
021
30.
0000
461
20
205
22,7
52,6
0522
,792
,155
34.
65E
-05
10
2Y
esC
DH
12ca
dher
in 1
2, ty
pe 2
(N-c
adhe
rin
2)
2215
88,1
30,1
9688
,136
,792
25.
52E
-05
11
0Y
esA
NPE
P M
ESP
2
alan
yl(m
embr
ane)
am
inop
eptid
ase
(am
inop
eptid
ase
N,
amin
opep
tidas
e M
, mic
roso
mal
am
inop
eptid
ase,
CD
13,
p150
)/m
esod
erm
pos
teri
or 2
hom
olog
(mou
se)
ME
SP2
caus
es s
pond
yloc
osta
l dys
osto
sis
(OM
IM 6
0519
5)
238
54,0
98,2
4754
,102
,064
24.
83E
-05
20
0
244
145,
875,
183
145,
878,
794
25.
47E
-05
10
1
2711
32,2
42,7
2132
,244
,520
24.
25E
-05
20
0
288
27,2
49,8
4027
,379
,524
65.
38E
-05
12
3Y
esA
K12
8371
CH
RN
A2
PTK
2B
Hyp
othe
tical
pro
tein
FL
J465
14./c
holin
ergi
c re
cept
or,
nico
tinic
, alp
ha 2
(neu
rona
l)/P
TK
2B p
rote
in ty
rosi
ne k
inas
e
CH
RN
A2
caus
es n
octu
rnal
fro
ntal
lobe
epile
psy
(OM
IM 1
1850
2)
Mol Psychiatry. Author manuscript; available in PMC 2009 October 1.

NIH
-PA Author Manuscript
NIH
-PA Author Manuscript
NIH
-PA Author Manuscript
Sullivan et al. Page 32
Ran
kC
hrSt
art
End
Nsn
psP
min
N<0
.000
1N
<0.0
01N
<0.0
1E
xpre
ssed
in b
rain
?G
enes
Gen
epr
oduc
tsSL
EP
‡
2 be
ta
293
12,4
53,8
1712
,459
,985
20.
0000
51
10
PPA
RG
pero
xiso
me
prol
ifer
ator
-act
ivat
ed r
ecep
tor
gam
ma
Typ
e 2
diab
etes
mel
litus
ris
k ge
ne
323
99,9
75,8
2110
0,18
3,00
92
7.26
E-0
51
01
Yes
DC
BL
D2
ST3G
AL
6di
scoi
din,
CU
B a
nd L
CC
L d
omai
n co
ntai
ning
2/S
T3
beta
-ga
lact
osid
e al
pha-
2,3-
sial
yltr
ansf
eras
e 6
343
70,4
51,8
5270
,476
,913
28.
22E
-05
10
1
382
7,42
4,09
87,
440,
754
38.
95E
-05
11
1
415
54,3
52,6
3554
,363
,712
30.
0000
711
11
Yes
GZ
MK
gran
zym
e K
(gra
nzym
e 3;
tryp
tase
II)
4313
111,
889,
281
111,
902,
203
27.
87E
-05
11
0
441
211,
470,
329
211,
508,
991
40.
0000
721
30
468
24,7
84,5
7624
,825
,085
20.
0003
590
20
NE
F3 N
EFM
neur
ofila
men
t 3(1
50kD
a m
ediu
m)/
neur
ofila
men
t, m
ediu
mpo
lype
ptid
e 15
0kD
a
‡ SLE
P=Su
lliva
n L
ab E
vide
nce
Proj
ect (
http
://sl
ep.u
nc.e
du)
a co
mpe
ndiu
m o
f ge
netic
fin
ding
s fr
om th
e lit
erat
ure.
Mol Psychiatry. Author manuscript; available in PMC 2009 October 1.

NIH
-PA Author Manuscript
NIH
-PA Author Manuscript
NIH
-PA Author Manuscript
Sullivan et al. Page 33
Table 4
PCLO replication results.
Abbreviations: N=total sample size for an analysis, Z=logistic regression beta divided by its standard error, P=asymptotic p-value from Wald chi-square test (1 df) uncorrected for multiple comparisons, P_corr=empirical p-value from accounting for multiple comparisons and LD structure(50K permutations), and I^2=i-squared, an index of heterogeneity of logistic regression parameter estimates.
Mol Psychiatry. Author manuscript; available in PMC 2009 October 1.
Copyright © 2022 FDOKUMEN