Nilam Shakeel Depressive symptoms in pregnant and ...
166
University of Oslo Faculty of Medicine Nilam Shakeel Depressive symptoms in pregnant and postpartum women dŚĞƌŽůĞŽĨĞƚŚŶŝĐŝƚLJůĞǀĞůŽĨŝŶƚĞŐƌĂƚŝŽŶĂŶĚƉŚLJƐŝĐĂů ĂĐƚŝǀŝƚLJͶƚŚĞ^dKZ<ʹ'ƌŽƌƵĚĚĂůĞŶƉŽƉƵůĂƚŝŽŶͲďĂƐĞĚĐŽŚŽƌƚ ƐƚƵĚLJ Nilam Shakeel 2019
-
Upload
khangminh22 -
Category
Documents
-
view
1 -
download
0
Transcript of Nilam Shakeel Depressive symptoms in pregnant and ...

University of OsloFaculty of Medicine
Nilam Shakeel
Depressive symptoms in pregnant and postpartum women
Nilam Shakeel
2019

© Nilam Shakeel, 2019
Series of dissertations submitted to the
Faculty of Medicine, University of Oslo
ISBN 978-82-8377-436-8
All rights reserved. No part of this publication may be
reproduced or transmitted, in any form or by any means, without permission.
Cover: Hanne Baadsgaard Utigard.
Print production: Reprosentralen, University of Oslo.

Table of contents


i. PrefaceI started my medical doctor career working as a general
practitioner in Grorudalen. At the time when the STORK
Groruddalen project started, I was working at one of the child
health clinics (Stovner) where the data was collected. I was
inspired by the interesting topic of this project and by the large
scale of data collection. This was my first contact with this
project. I expressed my sincere interest in research regarding
ethnic disparities and Hanna Selstø Hatlehol, the project
manager of STORK Groruddalen put me in contact with the
project leader Anne Karen Jenum, who after a while offered me
to be a part of her research team.
By working with immigrants in a multiethnic population, I was
strictly aware of the issue related to mental health problems
among ethnic minorities, stigma related to it and its relation to
culture. I found it very inspiring to have the opportunity to work
on this project. My insight in ethnic differences in health, in
particular in the field of mental health is enhanced greatly after
being part of this project.
ii. AknowledgementsAll praise to God for giving me the strength to complete this
academic work, which was completed at the department of
General Practice, Institute of Health and Society, University of
Oslo. This thesis would not have been possible without the
support, hard work and endless effort of a large number of
individuals and their contribution. I would like to take this
opportunity to express my gratitude for all those who made this
work possible.

The first person I would like to offer immense gratitude to is my
main supervisor Anne Karen Jenum. She encouraged me, gave
me important advice and worked with me in evenings and
weekends. Anne Karen Jenum guided me into the world of
research and epidemiology and has always been patient and
available for help and discussion. Thank you Anne Karen for
guiding me through all the phases of the research process and
your endless support. My sincere gratitude also goes to my co-
supervisor Egil Wilhelm Martinsen who has a substantial
knowledge in research field and writing, thank you for being
positive and giving, and being available on short notice. Very
special thanks go to my research team and co-authors who have
critically reviewed my work and made constructive comments. I
express my sincere gratitude to Malin Eberhard-Gran for being
my mentor in the field of perinatal mental health and sharing her
expert knowledge, for her contribution and giving me the
opportunity to learn from one of the foremost in the area of
perinatal mental health. Kari Slinning I have benefitted
immensely from your expertise knowledge and thank you for
your enthusiasm, kindness and excellent contribution to this
work. Kåre Rønn Richardsen thank you for your teaching skills
in statistics, specifically imputation, the time you have spent
discussing methodological consideration of this study with me in
late evenings, holidays and weekends, for critically reviewing
my work and coming with a solution for all my technical
problems related to this work, including EndNote. Line Sletner
thank you for building up the research database, your valuable
guidance and sharing your experience in an excellent and
friendly way. Ragnhild Sørum Falk I would like to thank you for
your statistical help and advice. I am also deeply grateful to

statistician Kathrine Frøy Frøslie for her inspiring way of
teaching statistics.
I am also indebted to the head of Department for General
Practice at the Institute of Health and Society, University of
Oslo, Jørund Straand, for making me feel welcome, and making
this department good, inspiring and a stimulating workplace.
Jørund Straand I am also sincerely grateful that you provided me
the opportunity to work part time at the department of General
Practice during my final phase of this thesis. I am also grateful to
my inspiring and supporting colleagues at the department of
General Practice, especially my “roommates” from room number
238: Kirsten V. Knutsen, Åse Ruth Eggemoen and Marthe Lise
Næss who created a good academic environment in addition to
fun and laughter. Kirsten Valebjørg Knutsen, thank you for your
support, optimism and work spirit. Åse Ruth Eggemoen thank
you for your practical support and critical review during my final
phase of the thesis. Marthe Lise Næss, thank you for positive
feedback and encouragement.
My gratitude also goes to my colleagues at Norwegian Research
School in General Practice and Elin Olaug Rosvold for giving
me research training and a stimulating teaching environment. I
would also like to express med gratitude to my research
collegues in the STORK Groruddalen study for all the academic
discussions and Christin Wiegels Waage for her positive
feedback during our small talks in the corridor. Siri Evju
Jannsen, I offer my thanks to you for always helping me with the
practical problems, being available and kind.
I owe my greatest thanks to the women who participated in
STORK Groruddalen study and the study staff, not least Hanna
Selstø Hatlehol, the project manager of STORK Groruddalen.

Thank you Hanna for your kind way of sharing and explaining
all the project procedures.
Finally, my deep gratitude and love goes to my dear dear family
for their endless support, patience and understanding. Especially
to my parents, for their love and care during my upbringing and
encouraging me to focus on education. In addition, my love goes
to my beautiful children Zarah and Isak. Thank you for being
patient. I have spent a lot of time working on this thesis, I now
look forward to spend more time with you.
iii. List of papersPaper I: Shakeel N, Eberhard-Gran M, Sletner L, Slinning K,
Martinsen E.W, Jenum A.K. (2015) A Prospective cohort study
of depression in pregnancy, prevalence and risk factors in a
multiethnic population. BMC Pregnancy Childbirth. 2015 Jan
24; 15:5. doi: 10.1186/s12884-014-0420-0.
Paper II: Shakeel N, Sletner L, Falk R.S, Slinning K, Martinsen
E.W, Jenum A.K, Eberhard-Gran M. (2018) Prevalence of
postpartum depressive symptoms in a multi-ethnic population
and the role of ethnicity and integration, J Affect Disord. 2018
Jul 24;241:49-58. doi: 10.1016/j.jad.2018.07.056.
Paper III: Shakeel N, Richardsen K.R, Martinsen EW,
Eberhard-Gran M, Slinning K, Jenum AK, Physical activity and
postpartum depressive symptoms in a multi-ethnic cohort.
Journal of Affect Disorders. 2018 Aug 15; 236:93-100. doi:
10.1016/j.jad.2018.04.081.

iv. Abbreviations BDI: Beck Depression Inventory
CI: confidence interval
DAG: directed acyclic graph
DSM-5: Diagnostic and Statistical Manual of Mental disorders,
fifth edition. American Psychiatric Association
EPDS: Edinburgh Postnatal Depression Scale
GHQ: General Health Questionnaire
GP: general practitioner
GW: gestational week
MADRS: Montgomery and Aasberg Depression Rating Scale
MVPA: moderate-to-vigorous physical activity
PCA: principal component analysis
RCT: randomized control trials
SCL-25: Hopkins Symptoms Check List 25-items
SD: standard deviation
SWA: SenseWear™ Pro3 Armband
WHO: World Health Organization
v. Definitions and termsAntenatal or prenatal: in pregnancy, before giving birth
Peripartum: pregnancy and after birth
Postpartum or postnatal: after birth
Perinatal: covers both pregnancy and postpartum.

vi. SupervisorsAnne Karen Jenum
Egil Wilhelm Martinsen
vii. FundingThe Norwegian Research Fund for General Practice.
Allmennmedisinsk forskingsfond (AMFF)
1 Introduction
1.1 Depression during pregnancy and the postpartum period
While depression in pregnancy and the postpartum period may
be a new occurrence, it can also begin prior to pregnancy,
continue into the pregnancy, and further. The natural course of
depression during pregnancy or postpartum varies a lot. It may
resolve spontaneously within weeks after onset, but, when
untreated, it can also last for a year or sometimes beyond the first
year after delivery (1).
Other terms for depression in pregnancy are antenatal or prenatal
depression. Conversely, terms used for depression present after
birth are usually postpartum or postnatal depression. Perinatal
depression is sometimes used as a term covering both depression
in the pregnancy and postpartum periods. However, these
concepts are often used in an overlapping manner and
imprecisely in the literature.
Until the middle of the 1990s, most of the existing research on
this topic had been carried out in Western populations (2), and
perinatal depression was thought to be a problem restricted
largely to Western countries. Later, transcultural research also
included non-Western countries. Although research involving

immigrants in Western countries gradually emerged, few studies
were population-based. Limitations related to small samples
were often present, and very few studies included those who did
not speak the language of the host country.
Depression in pregnancy and the postpartum period has the same
symptoms as depression in other periods of life and is defined in
the same way (3). The definition in the Diagnostic and
Statistical Manual of Mental Disorders (DSM-5) of the
American Psychiatric Association is major depressive disorder
with onset either in pregnancy or in the four weeks following
delivery. The criteria for major depressive disorder are a duration
of at least two weeks and the episode not being attributable to the
psychological effects of a substance or another medical condition
(4). At least one of the two main symptoms should be present
nearly every day or most of the day, specifically either a
depressed mood or a loss of interest or pleasure. In addition, four
or more of the following symptoms should be present to
diagnose a major depressive disorder: reduced concentration,
feeling of worthlessness or guilt, change of appetite, sleep
problems, fatigue or loss of energy, psychomotor agitation like
feeling restless or slowed down, reduced self-esteem, and/or
thoughts of death or ideas of suicide (4). In some cases, the
classical symptoms may be masked due to the pregnancy (5) and
the woman just presents with diffuse pain. At worst, some
women may have thoughts of harming their own newborn (6).
1.2 Consequences of depression during pregnancy and the postpartum
period
Depression during pregnancy and the postpartum period affects a
woman during a vulnerable period of her life. It may be
devastating for the woman and can ruin her quality of life (7),

her relationships with her partner and with her other children (8),
and the attachment process between the newborn and the mother
(9, 10).
Cigarette smoking and the abuse of alcohol and other substances
may be related to depression (11) and can further increase the
risk of complications. Depression in pregnancy may cause
preterm birth (12, 13) and babies being small for their gestational
age (14, 15). Further, depressed mothers are more likely to not
attend the typical follow-ups conducted during pregnancy and
the postpartum period (11). Thus, other serious conditions that
occur during pregnancy can be overlooked, putting both the
pregnant woman and her baby at risk for a range of
complications. Due to the mood alterations seen in depressed
mothers, the communication between mother and infant is
hampered (16). Further, depressed mothers may exhibit negative
behaviours toward their infant in the form of being unresponsive
with minimal face mimics (17). Depressed mothers also tend to
spend less time with their infants, have less eye contact, and
express less pleasure when playing with their infant, which are
behaviours sometimes indicative of rejection when compared
with nondepressed mothers. (6).
On the other hand, infants of depressed mothers have been
reported to have lower level of spontaneous motoric movements,
be more irritable and fussy, have a difficult temperament, and
show less mimics versus the infants of nondepressed mothers
(18). Further, infants of depressed mothers may also demonstrate
an impaired degree of attachment to their mothers (9).
Young children of mothers who were depressed during
pregnancy and/or the postpartum period may present with a
fearful temperament and anxiety, internalizing behaviours or

externalizing behaviours, and delayed motor and cognitive
development (19-21). Older children may have attention-deficit
hyperactivity disorder, depression, altered stress response, and
anxiety disorders (10, 19, 22, 23).
Adverse effects in the child develop over time and may cause
long-term consequences with duration into adulthood, such as
concentration problems and aggressive behaviour (24-27). The
negative impact on the infant is well-documented and is not only
observed in severely depressed women but also in women with
higher levels of depressive symptoms (22, 28) as well. The
impairment in the interaction between newborns and their
depressed mothers is noticeable across different cultures and
socioeconomic position groups. Adverse effects do not always
develop as described above, but health personnel should be
aware of such adverse development potential and should strive to
detect early signs of depression onset in mothers. Depressive
symptoms may be a precursor of depression and indicate an
increased risk of a clinical depression.
1.3 Risk factors for perinatal depression
A review of the literature provides us with a range of risk factors
associated with depression in pregnancy and the postpartum
period. The same main risk factors including depression earlier
in life, negative life events, and a lack of social support are found
(29) regardless of whether the studies are conducted in high-
income countries or low-income countries or in immigrant
versus native-born women. During the past few decades, a
greater focus on immigrants or ethnic minorities living in
Western societies has emerged, giving rise to new risk factors
including factors related to the level of integration.

1.3.1 Psychosocial risk factors
Previous depression earlier in life or during a previous
pregnancy or postpartum period is a very important factor (29-
32). In addition, the experience of one or more adverse or
negative life events may trigger or exacerbate depression (30, 31,
33, 34). Important adverse life events include divorce, serious
economic difficulties, and separation from a long-lasting
relationship or a death in the family.
Further, the lack of social support/a healthy social network will
reduce the mother’s capacity to cope with stressors and adapt to
pregnancy and motherhood, thereby putting her at risk for
depressive symptoms. Immigrant women are at increased risk
(35, 36) particularly when separated physically and culturally
from their social and familial support systems. Social support is
one of the key factors protecting women from depression,
especially when provided in the form of companionship,
emotional support, and instrumental support, e.g., assistance
with household tasks. The type, source, and appraisal of social
support differ across cultures and the mechanisms by which
support works may also be different in the same manner (37,
38).
Factors increasing the likelihood of depressive symptoms are 1)
social isolation, 2) lack of perceived support from primary social
group, 3) lack of friends or a confident friend/partner, and 4)
lack of a friend who has experienced similar problems (39, 40).
Further, social support can be contextualized into factors
including formal and informal support (38). Formal support
includes the available services provided by health care workers
or the kind of relationship women have with their health care

providers and community support groups, whereas informal
support includes support received from family, friends, and
partners/spouses. Formal support may be of a limited availability
for immigrant woman in a new country. Moreover, having a
spouse/partner or family members around may not necessarily
mean that women perceive this as support. A qualitative study
(38) showed that there are contradictory findings concerning
how immigrant women feel about the availability of support
systems, their relation to health care providers, and the informal
support from their partner/spouse/family. Some are satisfied with
the support systems and some experience not receiving relevant
support. Most women in this qualitative study (38) indicated that
being newly immigrated without her family and preexisting
support around and not always knowing the availability of
community support systems in the new country were challenging
factors. Further, women in this study agreed that receiving
support from their partner/spouse was significant in improving
their ability to cope with the difficulties related to depression,
but some also described the challenges inherent when the partner
was dominating, abusive, or did not share the same
understanding of depressive symptoms after birth.
This points to the importance of satisfaction with the relationship
to the partner. A Norwegian study from 2012 concluded that a
dissatisfactory partner relationship was strongly associated with
emotional distress (41), which in turn may increase the risk of
depression.
Qualitative studies highlight the thought that the common belief
of benefit from the ‘extended Asian family’, which is often
thought of as a support system, may also act as a source of
conflict (42, 43). A woman`s lack of family network and

dependence on their in-laws can make her more isolated (36, 43).
In cases where the new mother has a conflict with her own
mother or mother-in-law, the emotional support given by them is
not perceived as support and is instead associated with
depression (44).
1.3.2 Cultural risk factors/risk factors related to the level of integration
Being an immigrant is associated with an increased risk for
depressive symptoms (45). Time since immigration may
moderate such an association, as immigrants who have spent
longer time in the new country may be more adapted to their new
culture. Depressive symptoms are associated with a lower level
of integration (46, 47).
The two factors together (i.e., the added stress of living in new
surroundings with an unfamiliar culture and the challenges of
being parent to a newborn) may create an extra burden.
Language problems in the new country and economic difficulties
may hinder the access of migrants to the health care system (48).
Immigrants are more likely to underutilize maternal health
services and have difficulties communicating with health care
providers (49).
In some traditional cultures, there may be a gender preference in
favour of the newborn being a boy (50, 51). In patriarchal
societies in India, Pakistan, the Arab world, Turkey, China,
Japan, Korea, Taiwan, and Hong Kong, sons are considered to
contribute positively to the family (52) economy (52, 53),
support elderly parents, and carry on the family`s bloodline (51).
Daughters have traditionally been regarded as a financial burden
because they belong to the groom`s family after marriage and
cannot contribute economically to the family of origin. In

addition, upon the girls’ marriage, their parents have to pay
dowry to the in-laws of their daughter, whereas upon the
marriage of a son, they will receive an economic reward by way
of a dowry payment, providing them with economic security.
These cultural norms pose a risk toward the onset of depressive
symptoms with the birth of a girl. However, studies addressing
the relationship between the gender of the baby and depression
report diverging results (29, 48, 54, 55).
There are also issues related to social control, as some women
have to ask for permission before leaving the house or making
decisions on their own (54), particularly if they live with their
parents or in-laws. However, depending on the level of
acculturation (for definition of acculturation see paragraph 1.7)
in the new country, some of the traditional risk factors may no
longer be relevant. This contributes to heterogeneity within and
among immigrant groups, making the completion of research in
this area challenging.
1.3.3 Sociodemographic risk factors
Socioeconomic difficulties, for example financial problems such
as not having a job or enough income to cover all necessities for
the newborn, may increase the maternal distress, making the
woman more vulnerable (56). Low socioeconomic position is a
risk factor for depression recurrence in many studies (48). A low
household income may also cause an increased amount of stress
because of the unavailability of financial means necessary for
raising an infant. Variations in the external environment, such as
living in an urban versus rural area, will also affect the
association between socioeconomic position and perinatal
depression (8). In low-income countries where there is no

welfare system or governmental financial help for new mothers,
it might be challenging to afford food, clothes, and necessary
equipment for the newborn, which creates a burden on the
mother (8).
Although adolescent mothers are regarded as a risk group for
developing depressive symptoms in the perinatal period (57),
there are contradictory findings in the literature regarding the
association between the age of the mother and depressive
symptoms in the perinatal period (56, 57).
1.3.4 At-risk groups
In addition to the abovementioned risk factors, women are more
likely to develop depressive symptoms if they have experienced
physical or sexual abuse or neglect in childhood or adulthood
(58), intimate partner violence (59), or if they have coexisting
chronic diseases such as epilepsy (60). Furthermore, the
transition to motherhood may be particularly difficult after the
delivery of a preterm or low for gestational age infant and
neonatal intensive care unit admission (61). Perinatal
complications, especially if there are two or more in existence,
such as preeclampsia and acute caesarean section are also
associated with an increased risk of depressive symptoms after
birth (62). These stressful events around delivery in addition to
failed expectation and disappointment may increase stress that in
turn may contribute to a higher risk of developing depression
(44, 62).
Asylum seekers and refuges have increased vulnerability for
depression (63). Due to factors like forced immigration, past
insecure living conditions, and experiences of violence, refugees
and asylum seekers may be different in this regard from other

immigrant groups. However, this thesis will not focus
specifically on these groups but rather on a diverse transcultural
community.
1.3.5 Genetics/heredity
There is a genetic factor in major depression. First-degree family
members of individuals with major depressive disorder have a
two- to four-times-higher risk of developing the disorder in
comparison with the general population. For people with first-
degree family members with bipolar disorder, the risk is even
higher (4). We are not aware of studies in existence at this time
that address the genetic risks specifically in perinatal depression.
1.4 Measures of depression in pregnancy and the postpartum period
The DSM-5 (4) is the standard diagnostic manual for the
diagnosis of depression in the United States. In Norway, the
International Classification of Diseases, 10th edition is the
official diagnostic system, but the DSM-5 is often used in
research studies. The DSM-5 does not recognize postpartum
depression or depression in pregnancy as a separate diagnosis,
but allows for a per partum specifier if the patient meets the
criteria for major depressive disorder and the symptoms began
during pregnancy or within four weeks after delivery. However,
in clinical practice and in research, it has been variably defined
as depression that occurs within four weeks after birth, three
months, six months, or up to 12 months after birth (64).
Moreover, epidemiological research uses screening instruments,
primarily questionnaires, to assess depressive symptoms, as
these are easier to use and less time-consuming than a diagnostic
interview.

Some physiological manifestations of pregnancy, especially
during the first trimester and postpartum period, are similar to
symptoms of clinical depression. For instance, fatigue, weight
gain, and sleep disturbances are characteristic symptoms of
depression and are also common in pregnancy and the
postpartum period. Due to this overlap, a pregnant or postpartum
woman tends to score high on the common self-rating scales for
depression, like the Center for Epidemiologic Studies Depression
Scale (CES-D), the Beck Depression Inventory (BDI), and the
General Health Questionnaire (GHQ). Early in the 1980s, the 30-
item GHQ and the 21-item BDI were tested in two studies,
respectively, among postpartum women (65, 66), with both
investigations reporting that these questionnaires needed
modifications if they were to be accurately used among
postpartum women. Of the 89 women who scored above the cut-
off on GHQ in the study by Nott and Cutts, only 37 were found
to have clinical depression. When they removed items from
GHQ that mentioned physical symptoms that are common after
birth, the specificity of the test increased (65). The specificity of
the modified test was 87% to 92% and the sensitivity was 74%
To 83%, depending on two different cut-off values.
Such difficulties in identifying depressed women in the perinatal
phase with the existing scales initiated the development of the
Edinburgh Postnatal Depression Scale (EPDS) (67) (see table 1
below). The scale was specifically developed in 1987 to measure
depressive symptoms in postpartum women and differs from
other screening instruments because it does not include any
mention of symptoms that are normal following childbirth.
Further, it is simple to complete (67). EPDS contains 10
questions, each with four response options and possible scores
ranging from zero to three points. The scores are combined into a

total sum of zero to 30 points, with a high symptom score
indicating depression.


The sensitivity was 86%, specificity was 78%, and positive
predictive value was 73% in the first validation study of EPDS
conducted among 84 women at three months after giving birth
(67), using a threshold score of 12 or 13 points. Further, this
study stated that lowering the threshold would lead to the
detection of more cases and suggested a threshold of 10 points.
Another study comparing EPDS to BDI and the Montgomery
and Asberg Depression Rating Scale (MADRS) (68) in a group
of women with DSM-III major depression reported that EPDS
identified 21 of the 22 depressed mothers using a threshold of 13
points. This represented a sensitivity of 95%, and only seven
women were false positives (i.e., those without a clinical
diagnosis of depression but who displayed scores indicating
depression), representing a specificity of 93%. Lowering the
threshold to EPDS score of 10 points or more resulted in 100%
sensitivity and lowered the specificity to 82%. In the same study,
the BDI had poorer performance with a sensitivity of 68% and
specificity of 88%. BDI also focusses more on insomnia,
lassitude, and a loss of appetite, which are common in
postpartum women, thus contributing to its nonusefulness in the
postpartum period for identifying depression. The MADRS has
two somatic items (sleep and appetite). It had a sensitivity of
91% and a specificity of 96%, so its overall performance was
good. Still, since EPDS is specifically designed for postpartum
women with no focus on physiological symptoms common in the
postpartum period, the study (68) recommended EPDS with a
cut-off value of 10 points as a valuable screening instrument for
depression. Moreover, in this study, highly significant
correlations between EPDS and MADRS and between EPDS and
BDI were found (r = 0.79/P 0.001 and r = 0.68/P 0.001).

Now, EPDS is the most commonly used screening questionnaire
to assess depressive symptoms in the perinatal period (69, 70).
The threshold score of 10 points or more has been used in
several epidemiological studies to date (71-75). Appropriate cut-
off levels have frequently been discussed in the literature.
Studies using high EPDS cut-off scores generally show lower
sensitivity and higher specificity than do studies using lower cut-
off scores (76). A systematic review of studies validating EPDS
(70) including 37 studies (and, among these, three validated the
EPDS during pregnancy), reported a wide range of values for
sensitivity and specificity. This study concluded that EPDS
would create many false positives and miss a considerable
amount of cases if used for the diagnosis of depression.
Therefore, it is better to use EPDS to indicate a possibility of
depression/depressive symptoms, as a clinical assessment is
required to make further diagnosis. The heterogeneity among
studies in this review due to different clinical settings, countries,
language of administration (e.g., 25 studies used a language
other than English), timing of testing, and diagnostic criteria
made it impossible to perform a meta-analysis (70).
Although EPDS has good psychometric properties, it is only a
screening instrument and so should not be used for diagnostic
purposes. This instrument has been translated to many different
languages, and most of these versions are validated (77). Two
Norwegian studies (71, 78) reported good internal consistency
with Cronbach alpha values of 0.81 and 0.87 respectively as well
as a very good interrater reliability as measured by Cohen’s
kappa (Cohen’s kappa = 0.74–1). In order to be reliable as a
satisfactory instrument, the Cronbach alpha value should be at
least 0.7 and Cohen`s kappa value should be at least 0.6 (79).

The Norwegian validation study by Eberhard-Gran (71) reported
a sensitivity of 100% and a specificity of 87% with a threshold
of 10 points when testing against DSM-IV criteria. When using a
cut-off of 11 points, however, the sensitivity decreased to 67%,
while the specificity increased to 92%. Further, the study
compared the EPDS against the Hopkins Symptoms Check List
25-items (SCL-25) and MADRS scores. Correlations between
EPDS and SCL-25 and between EPDS and MADRS were strong
[Pearson’s correlation = 0.78 (P < 0.01) and Pearson’s and
Spearman correlations both = 0.8 (P < 0.01), respectively].
1.5 Ethnicity and health
We should use the term ethnicity with caution, as this is a
complex concept. Members of one ethnic group are considered
to have some shared cultural practices and the same language as
well as geographical and ancestral origin (80). Ethnicity may
overlap with other concepts such as nationality and race, but is
not the same. Nationality is defined by the country a person
belongs to via citizenship. Race implies common hereditary
characteristics that make one group of people (one race) different
from other groups of individuals (81). It is common in health
research to use the country of birth or mother’s country of birth
as a proxy for ethnicity (81).
Culture largely influences ethnicity. Culture is a set of norms,
including traditions and beliefs, which in turn might have an
impact on mental and physical health. Culture can affect an
individual`s lifestyle and identity and will influence the
understanding of mental health (82).

1.6 Postpartum care of new mothers, traditions and different
perspectives throughout the years
Postpartum care in Norway has changed considerably over time
(83). Prior to 1950, the society placed more focus on bedrest,
care, and relief from housework after the woman had given birth.
In the 1950s, the length of stay in the hospital after giving birth
was around 14 days. This has gradually decreased and hospital
beds have mostly been replaced by maternity hotels, where the
woman and her partner can stay after birth. During the 1970s, in
some subgroups, it became kind of a norm that women should
focus on education and examinations and be fit rather than taking
extensive maternity leave, removing away the focus from the
traditional postpartum care. During the 1950s, there was a public
support system put in place to assist families facing challenges.
An assistant (‘husmorvikar’), normally a public employee, took
care of the household for these families. However, this practice
also gradually disappeared. Nowadays, women are usually not
admitted to the maternity unit after birth unless there is a medical
condition necessitating this, and the provision of postpartum care
is more dependent on her partner/husband and network.
Discharge from the hospital after giving birth nowadays is
individually customized, with about 4% of new mothers
nationwide being discharged within 24 hours (84). It is further
planned that about 40% will be discharged within 24 hours.
The traditional postpartum care differs between ethnic groups as
such is often culture-dependent (52). The Old Testament
described the woman as being unclean and said she should not
touch anything holy for the first 40 days after birth. In
accordance with this, Judaism, Christianity, and Islam define the
postpartum period as the first 40 days after giving birth. Most
cultures perceive this period as something unique and consider

that the woman is in need of specific care and traditional
customs (83). For example, the usual postpartum care in Pakistan
and many other Muslim countries implies 40 days of mandatory
rest for the new mother. She is advised not go out in order to stay
away from the evil eye nor take part in any physical activity, but
rather remain on bed rest, and she gets help with care of the
baby. Some women also move back into their mothers’ home in
order to receive extra care. This is also frequently practiced in
India and Japan (83). When the woman leaves her mother’s
house after rest and special care, the return to her husband`s
place is often marked with gifts to signal her new social status as
a mother. In Vietnam and China, they call the postpartum ritual
‘doing the month’. This includes a set of rules like just drinking
hot drinks and having hot meals, avoiding cold and windy
weather, and participating in bed rest. In some African countries
like Nigeria, Kenya, and Tanzania, both the woman and her baby
stay in a special ‘fattening room’. Here, the women are supposed
to eat a lot and put on weight and their only other duties are to
rest and take care of the baby.
Care during pregnancy and postpartum has an impact on mental
health, especially because it involves a social network helping
the woman with household and taking care of the baby so that
she can rest and get enough sleep. Traditional postpartum care is
still practiced in most parts of Asia and Africa, whereas Norway
and other Western European countries have moved in the
direction of a more individualistic culture. People from the
former locations not having the same facilities and their
extended family around after migration to Western society can
act as a stressor and increase vulnerability toward depressive
symptoms for some. This, in turn, is dependent on the extent to
which the woman is adherent to such traditions, as heterogeneity

exist within an ethnic group, and the new mother does not
always perceive traditions and rituals as being supportive.
1.7 Culture and mental health
Some ethnic minorities exhibit collectivistic understanding
thoughts, whereas other groups or individuals may have more
individualistic values (85). A collectivistic approach prioritizes
family-oriented values over the individual. Those with collective
upbringing are raised with the idea that everything they do
affects the whole family either negatively or positively.
Constantly being committed to family norms or rules may be
related to depression for some. Acculturation is a process of
cultural change that occurs when meeting another culture. One of
the first definition of acculturation was given by Redfield in the
Journal of American Anthropologist in 1936: “ The changes that
occur in the ethnic cultural patterns when groups or individuals
with different cultures come into continuous contact with each
other" (page 149)" (86). One of the elements in the acculturation
process is integration, which may relate to a gradual
understanding and mastery in the new context while at the same
time keeping up with and maintaining original traditions, values,
and cultural aspects (46, 87). Hence, integration correlates
strongly with ethnicity.Studies have shown that migrants who
are well integrated into the host culture have higher self-esteem
and less depressive symptoms (88, 89).
Another aspect is that, when ethnic minorities with more
individualistic values live in more traditionally-oriented areas or
vice versa, this may represent an extra tension due to social
control mechanisms (85). In some cultures, depression is taboo
and no word exists for the condition (90). Ethnic minorities

belonging to such a culture will usually have more masked
symptoms of depression (77).
1.8 Prevalence of depressive symptoms in pregnancy and the
postpartum period
The prevalence of depressive symptoms in pregnancy and the
postpartum period varies considerably in different parts of the
world, in part due to different measures and contexts (75, 91). In
comparison with in high-income countries, prospective and
cross-sectional studies using EPDS from primary health care in
low-income countries generally reported higher rates of
depressive symptoms (92-95). Studies from Turkey, Pakistan,
and Jordan reported rates of depressive symptoms in pregnancy
to be between 19% and 57%. As for postpartum depressive
symptoms, the range is 22% to 38% in studies from India,
Pakistan, Jordan, and Turkey (93, 94, 96, 97).
1.8.1 Prevalence of depressive symptoms in pregnancy
A systematic review of 21 studies reported the mean prevalence
of depressive symptoms across the antenatal period to be 10.7%
(98).
According to a recent multinational cross-sectional study (99)
from Europe that covered 18 different countries, the reported rate
for antenatal depressive symptoms using EPDS was between
6.8% and 7.5% for the Western European countries (Italy,
Switzerland, France, and the United Kingdom) and 4.3% for
Northern countries (Finland, Norway, Sweden). However, these
studies did not report prevalence rates for immigrants.
Research on depression/depressive symptoms among pregnant
ethnic minorities living in Western societies is scarce. Studies

addressing whether immigrants represent at-risk populations for
depression/depressive symptoms in pregnancy do not always
report prevalence rates stratified according to different
immigrant groups (100-102). One study reporting prevalence
rates stratified for ethnicity was a large (n = 5,239) cross-
sectional study from Canada (103) and the reported rates in the
third trimester were as follows: 42% among south Asians, 22%
among Middle-Eastern women, and 22% among Canadians.
Notably, the participants in this study had to speak English,
French, or Spanish, which may have impacted the results to
some degree.
Another study from Canada reporting the prevalence of
depressive symptoms in pregnancy among immigrants included
immigrants only (104). The participants in this community-based
study had to speak English, French, or Spanish. The authors
recruited their 121 participants from two hospitals and found that
42% of the participants demonstrated an EPDS score of 12
points or more.
1.8.2 Prevalence of postpartum depressive symptoms
In Norway, based on EPDS with cut-off value of 10, the reported
prevalence rate of depressive symptoms 6 weeks postpartum was
15% (105). However, this study included only those who could
read and write Norwegian.
Few studies seen to report on prevalence rates for ethnic
minorities or populations with diverse ethnicities (106, 107),
although a cross-sectional study on Somalian women in Norway
reported a prevalence rate of 7.7% (107). This study, however,
included a very small sample (n = 39).

The recent multinational cross-sectional study (99) from Europe
covering 18 different countries and using EPDS as measure for
depressive symptoms, reported rate of postnatal depressive
symptoms between 7.6% for the Western European countries
(Italy, Switzerland, France, and the United Kingdom) and 4.7%
for Northern countries (Finland, Norway, Sweden). However,
these studies did not report prevalence rates for immigrants.
A much-cited meta-analysis from 1996 (56) included 59 studies
and reported an overall prevalence of 13% within the first year
after birth. However, the studies included in this meta-analysis
did not report separate rates for immigrants/ethnic minorities.
A systematic review on postpartum symptoms including studies
from around the world, including both high-income and low-
income countries (29) and defining a postpartum period as
ranging from zero days to one year after birth, described
extremely diverging prevalence rates. The reported rates were
between 1.9-82% in low-income countries (highest in Turkey
and lowest in Pakistan) and between 5.2-74% in high-income
countries (highest in the United States and lowest in Germany)
when using various self-report questionnaires. When using a
clinical interview, a much lower overall prevalence was detected,
with the lowest being in Finland (0.1%) and the highest being in
India (26%). Based on EPDS results, the prevalence of
postpartum depression in high-income countries ranged between
5.5-34 % at less than four weeks, 2.6-35% at four to eight weeks,
2.9-26% at up to six months, and 6-29% at 12 months
postpartum. On the other hand, in low-income countries, rates
based on EPDS were reported to be higher, specifically 13- 51%
at less than four weeks, 5-50% at four to eight weeks, 8.2-38 %
at six months, and 21-33% at 12 months postpartum. Further,

this systemic review reported that immigrants in both Western
and non-Western countries had higher prevalence rates (0.5–
65%).
A systematic review and meta-analysis on postpartum depressive
symptoms specifically in immigrant women (69) reported the
prevalence of postpartum depressive symptoms among
immigrant women to be 20% and the existence of an adjusted
odds ratio (OR) of 1.63 for immigrant versus native-born
women. This review consisted of 12 cross-sectional and 10
prospective cohort studies, including 11 studies from Canada,
three from Australia, one from the United Kingdom, four from
Taiwan, two from Israel, one from Switzerland, and one each
from Norway and Sweden.
A systematic review from 2014 specifically focused on migrants
from South Asia who travelled to high-income countries (48)
reported the prevalence rate of postpartum depression, or
clinically significant symptoms of postpartum depression (this
latter definition was used when data were reported using a
screening instrument) to be between 5% and 20%. The authors
further stated that this rate is most probably underreported due to
a lack of studies on this topic from South Asian countries and
specific subgroup analyses. This review consisted of 10
quantitative and five qualitative studies and included all types of
study designs and a variety of measures for
depression/depressive symptoms. Five of the studies in this
review compared the obtained results to those of native-born
women and reported an increased risk (with ORs of 1.8–2.5)
among mothers born overseas. However, not all studies in this
review defined the postpartum period.

Prevalence rates vary between studies using self-rating versus
clinical interview as do the cut-off values used for the
instrument, sample size, population (e.g., immigration, mothers
of preterm babies, epilepsy patients), whether or not the study is
carried out in a high- or low-income country, how the
postpartum period is defined, and the psychometric properties of
the translated instruments. These factors may explain the large
differences between studies. The reported rates of depression and
depressive symptoms are between 2% to 82%, and there is a
generally higher prevalence in low-income countries versus
high-income ones.
The large variety in prevalence rates point out the importance of
knowledge of the prevalence rate on the local level for health
policies and preventive measures.
1.9 Physical activity and its relation to depressive symptoms
Physical activity is any bodily movement produced by
contraction of the skeletal muscles that results in an increased
level of energy expenditure above the basic level (108), while
exercise is a subcategory of physical activity that is
planned/structured and intended to improve components of
physical fitness (108).
Longitudinal prospective studies on nonpregnant populations
show that physical activity is associated with a reduced risk of
future depression, summarized in a systematic review by
Mammen and Faulkner (109).
A recent Cochrane review of randomized control trials (RCTs)
including nonpregnant participants presented evidence that
physical activity is moderately effective as a treatment for
depression (110).

As for the perinatal period, sedentary behaviours have been
associated with an increased risk for postnatal depressive
symptoms, whereas physical activity in pregnancy and the
postpartum period has been associated with a decreased risk for
developing depressive symptoms (111, 112).
Observational prospective studies with self-reported physical
activity data have suggested no significant association between
physical activity in pregnancy and depressive symptoms after
birth (113, 114).
A systematic review of RCTs reported that exercise was
effective as a treatment for depression in pregnancy (115). This
systematic review consisted of RCTs with small sample sizes
and large confidence intervals (CIs). Findings from RCTs are
supported by observational cohort studies performed in both
pregnancy and postpartum scenarios (116, 117).
Another systematic review (118) consisting of 13 RCTs
examined whether or not exercise initiated in postpartum might
reduce postpartum depressive symptoms and concluded that
exercise was effective for such.
Nevertheless, there is a gap in the literature when it comes to
studies evaluating exercise as a preventive measure for
depressive symptoms after birth (119, 120). The study by
Poyatos-Leon (120) is a meta-analysis of 12 RCTs reporting a
moderate beneficial effect of physical activity (both during
pregnancy and during the postpartum period) on depressive
symptoms after birth. However, only two of the studies included
in this meta-analysis initiated their exercise program during
pregnancy and assessed the effects postpartum. One reported no
effect of a home-based stretching and breathing exercise
intervention during pregnancy on postpartum depressive

symptoms (121), while the other one reported some effect due to
noting a lower score on BDI for those in the intervention group
as compared with those in the control group (122). Further, the
studies included in this meta-analysis were overall of a low
quality.
Self-report of the level of physical activity has low reliability.
There is in particular a lack of studies based on objectively
recorded physical activity and the relation of such to depressive
symptoms in the perinatal period (119). Further, in many of the
RCTs carried out in the perinatal period, the intervention
targeted already depressed women (123, 124), which makes it
possible to evaluate its therapeutic effect on depression, but not
its preventive effect. Thus, our knowledge about the preventive
effects of exercise on postnatal depression is limited.
1.9.1 Possible mechanisms on how physical activity affects depression
The hormonal withdrawal theory represents a possible causal
mechanism explaining how physical activity may affect
depression (33). After childbirth, there is a dramatic decrease in
estradiol and progesterone levels. Estradiol and progesterone
modulate neurotransmitter systems including serotonin and
dopamine systems. Serotonin is related to certain biological
functions relevant to depression like sleep and appetite.
Dopamine increases happiness and motivation. Estradiol would
normally upregulate dopamine receptors and thereby increase
dopamine-related phenomena like happiness. As the estradiol
level is low in the postpartum period, one way of increasing
dopamine could be through exercise (125). Exercise increases
the levels of beta-endorphins, which in turn stimulate dopamine.
However, a weakness of these studies is that they are carried out
in animals and so we do not know how relevant these findings
are in humans, especially as it is difficult to measure
neurogenesis in humans (126).
An alternative theory is that exercise provides a ‘time-out,’ shifts
focus away from symptoms of depression, and increases self-
esteem, which in turn may provide relief from depression (127).
A third theory is that exercise can improve the body image and
thereby mediate the positive relationship between exercise and
reduced depressive symptoms (128).
The effects of exercise are widely recognized but poorly
understood (129). There are many hypotheses on the subject that
exist currently, but we do not know for sure about the exact
mechanisms behind the antidepressant effects of physical
activity.
1.10 Treatment of perinatal depression
A variety of treatment options have been proposed for treating
and preventing perinatal depression (5, 91, 130, 131) including
yoga, exercise, bright light therapy, omega 3 fatty acid
supplementation, cognitive therapy, strengthening of the network
around the woman, supportive counselling, emphatic listening,
psychotherapy, and pharmacotherapy. Among antidepressant
options, selective serotonin reuptake inhibitors (SSRIs) and
tricyclic antidepressants are the drugs most commonly used (7).
Many women do not want to take antidepressants as a result of
concerns about the possible effects on their child (132). The
decision to initiate antidepressant treatment must be
individualized based on the severity of depression and functional
impairment as, for instance, risky behaviours, suicidal thoughts,
and thoughts of harming the newborn may present.

When tested against usual antepartum care, a Cochrane review
concluded that there is no evidence to suggest that bright light
therapy, omega 3 fatty acids, maternal massage, and acupuncture
have a clear effect on the treatment of antenatal depression
(130).
Psychotherapy as well as pharmacotherapy are the best
documented forms of treatment for moderate to severe major
depressive disorder in general (7). Cochrane reviews testing
psychosocial and psychological interventions against usual
postpartum care concluded that psychosocial and psychological
interventions had a clear effect in both the prevention and
treatment of postpartum depression both when initiated in the
postpartum period or during pregnancy in women at risk (91,
133). The psychosocial and psychological preventive
interventions that demonstrated an effect were interpersonal
psychotherapy, postpartum home visit, and lay or peer-based
telephone support. All of the abovementioned plus cognitive
behavioural therapy were effective treatment interventions for
postpartum depression.
1.11 Screening for depression in the perinatal period
The Norwegian antenatal guidelines do not recommend regular
screening of all women for depression in pregnancy or the
postpartum period. However, the Norwegian guidelines for
antenatal care do recommend being aware of the possibility for
depression among perinatal women without in detail referring to
how to recognize such. On the other hand, the British National
Institute for Clinical Excellence (NICE) (134) offers quite clear
guidelines on how to recognize, assess, treat, and follow women
with perinatal depression. The NICE guidelines suggest

screening be performed both at the woman`s first contact with
primary care during the pregnancy and also during the early
postnatal period. The NICE suggests considering asking two
depression identification questions as part of a general discussion
about the patient’s mental health, as follows:
1. During the past month, have you often been bothered by
feeling down, depressed, or hopeless?
2. During the past month, have you often been bothered by
having little interest or pleasure in doing things?
If the woman answers yes to at least one of these questions, it is
suggested that consideration be given to using EPDS or a patient
health questionnaire (PHQ-9) for further assessment.
The American College of Obstetricians and Gynecologists also
recommends screening for perinatal depression at least once
during pregnancy and the postpartum period with a validated
instrument. In some parts of Norway, child health clinics carry
out a two-step screening approach called the Edinburgh method
(8). This involves screening with the EPDS followed by a
conversation with the nurse.
The World Health Organization (WHO) has additionally
developed some assumptions for screening (135) that include the
following points:
1. The distribution of the disease should be of a certain size
2. A documented effective treatment should be offered for the
disease being screened
3. To be able to offer help for those testing positive
4. The screening instrument should be comfortable and easy to
use and have good measurement properties with an
agreement for positive cut-off if the screening program has to
be introduced
5. Procedures for further diagnostic testing should be available

Although many of the points listed above are present for
perinatal depression and many countries suggest screening, there
is no agreement on the cut-off for testing positive on the EPDS
(74). This, in addition to the lack of cost-effective studies and
user surveys regarding how women feel about such testing in
Norway, is the rationale behind not recommending a screening
involving the EPDS in Norway at present (136).
1.12 Norwegian antenatal care and guidelines
In Norway, all pregnant women are entitled to pregnancy
care/antenatal care, which is free of charge (137). The pregnant
woman can choose if she wants her routine checkups at a child
health clinic, at her general practitioner (GP), or both. The child
health clinic is responsible for providing health promotional and
preventive offers to pregnant women and their children. In
addition, women can get advice and guidance during pregnancy
and the postpartum period from either their GP, the midwife, or
both.
The child health clinic provide regular checkups for physical and
psychological health during pregnancy and the postpartum
period, including checkups of the children after they are born up
to the preschool age. Both nurses and GPs provide the checkups.
The Norwegian antenatal health care system reaches almost
100% of all pregnant women in Groruddalen Oslo, where the
majority (75%–85% of pregnant women) prefer going for several
follow-ups at the child health clinic (138).

1.12.1 Mental health
The Norwegian guidelines for antenatal care recommend the
following: all pregnant women should be asked whether or not
they have experienced depression or other mental health
problems now or in the past (137). Further, a migration
background is listed among vulnerabilities. The guidelines
recommend an individually customized treatment strategy. As
treatment options, the guidelines emphasize the application of
interdisciplinary efforts including home visits; family support;
psychological treatments; and, for some women,
pharmacological treatment.
1.12.2 Physical activity
The Norwegian antenatal guidelines also recommend that
pregnant women who are not physically active prior to
pregnancy should engage in physical activity of a moderate
intensity for 150 minutes or more per week and should gradually
increase their activity level (137). Women who are already
physically active prior to pregnancy are encouraged to continue
with their activity level. The recommendation of a moderate-
intensity activity level during pregnancy is in line with
guidelines from other high-income countries (108) including
Canada. The Canadian guidelines contain a quality assessment of
the literature with a comprehensive rating of scientific evidence
to support each recommendation (139). Moreover, physical
activity is a safe activity for the pregnant woman and is not
associated with negative neonatal or childhood outcomes (140),
and should be carried out except for in the case of a few
conditions including pre-eclampsia, persistent vaginal bleeding
and placenta praevia. Exercises normally not recommended for
pregnant women include contact sports, sports with a danger of

falling and/or that significantly increase the body heat, and scuba
diving.
1.13 The Norwegian context: immigration
Throughout history, people have emigrated due to reasons like
poverty and religious and political conflicts in search of better
living conditions. As is true for the rest of Europe, there has been
an increased immigration to Norway, especially from non-
Western countries. Before 1970, the population of Norway was
rather homogeneous. Thereafter, there has been a considerable
influx of immigrants (141). Labour immigrants from Pakistan,
Turkey, Morocco, and what was previously Yugoslavia
characterized the 1960s and 1970s. These immigrants were
mainly young men. Most women and any children came for
family reunions in the subsequent years. Then, in the 1970s and
late 1980s, refugees from Sri-Lanka, Chile, and Vietnam came to
Norway due to political conflicts. As a consequence of war,
immigrants from Afghanistan, Somalia, Iraq, and Bosnia
(formerly Yugoslavia) immigrated to Norway in the 1980s and
1990s. During the last few decades, there has been an influx of
labour immigrants from Eastern Europe, particularly due to the
demands of the construction market, and an influx of immigrants
from Sweden looking for work in the service industry. In the last
few years, a large influx of immigrants has come from Syria
because of the escalating conflict in the Middle East (142).
1.13.1 Immigrants and Norwegians born to immigrant parents
Statistics Norway (142) defines an immigrant as a person born in
a foreign country from two foreign-born parents and four
foreign-born grandparents. Children of immigrants born in

Norway are considered to be Norwegians born to immigrant
parents. They are the second generation. As of 1 January 2018,
14.1% of the total population of Norway were immigrants, while
Norwegians born to immigrant parents constituted 3.2%.
1.13.2 The largest immigrant group is from Poland
As of 2018, the 10 largest represented immigrant groups in
Norway in descending order are from Poland, Lithuania,
Somalia, Sweden, Pakistan, Iraq, Syria, Germany, Eritrea, and
the Philippines, respectively (142).

Among Norwegians born to immigrant parents, most have
parents from Pakistan, which compose 10% of all Norwegians
born to immigrant parents. The second largest group of
Norwegians born to immigrant parents are from Somalia,
followed by Poland in third place.
1.13.3 The multiethnic population in Oslo
The immigrant population represents a minority group with
different cultures as compared with Norwegians and a
heterogeneous level of social integration into the Norwegian
society (142). Immigrants and Norwegians born to immigrants
live in all municipalities across Norway, but no other
municipalities have as many inhabitants with an immigrant
background as Oslo does. Specifically, these individuals account
for 33% of Oslo’s population. Groruddalen is one of the districts
in Oslo with the largest proportion of immigrants and
Norwegians born to immigrant parents, where the proportion

was more than 50% as of 2018 (142). When the research
program STORK Groruddalen was begun in 2008, the
proportion of immigrants and Norwegians born to immigrant
parents was already more than 40% (142). Groruddalen is a
multiethnic district of diverse socioeconomic conditions that is
composed of both affluent and economically-deprived residential
areas. Increasing the amount of immigration and its relation to
mental health problems creates a need for more knowledge about
health challenges as well as an increased adaptation of health
services (143).
1.14 Antenatal period: a window of opportunity
Women display numerous behavioural changes during
pregnancy, including an improved diet, reduced alcohol
consumption, and an intention to stop smoking when pregnant.
Concern for their baby’s health is a strong motivator for a
healthier lifestyle. From a public health perspective, a change in
lifestyle can promote health and prevent disease (144). The
prenatal period can therefore be a unique window of opportunity
where the woman can incorporate healthier habits including
increasing their physical activity level. Some need help with
establishing a healthier lifestyle. A report carried out by the
Norwegian Directorate of Health (145) confirms that most
pregnant woman think it is natural for midwives and GPs to ask
them about their lifestyle when they are pregnant. This places the
GPs in a unique position to prevent adverse pregnancy outcomes
like depression and promote positive changes, including an
increase in physical activity level (144). Further, pregnancy
represents a period of increased contact between the woman and
health services. This provides a valuable opportunity for
identifying and supporting at-risk women.

2 Aims of this thesis The overall aim of this project was to:
Increase the knowledge about depressive symptoms during the
perinatal period in a multiethnic population, explore ethnic
differences, and thereby contribute to:
1. Optimizing pregnancy and postnatal care in primary care,
especially for immigrant women
2. Increasing the early detection of symptoms of depression
for enhanced preventive measures at an earlier stage
The specific objectives of this project were to:
Paper I: Determine the prevalence of depression/depressive
symptoms in pregnancy and the associations with ethnicity, level
of integration, and other risk factors
Paper II: Determine the prevalence of postpartum depressive
symptoms and the associations with ethnicity and the level of
social integration
Paper III: Investigate whether higher levels of moderate to
vigorous physical activity (MVPA) in pregnancy were associated
with a reduced risk of postpartum depressive symptoms
3 Methods
3.1 The STORK–Groruddalen study
The STORK–Groruddalen research program was primarily set
up to increase the knowledge about gestational diabetes and to
develop culturally sensitive strategies to improve maternal and

offspring health and reduce ethnic and social differences (143).
In total, 823 pregnant women were included in early pregnancy
and followed to three months into the postpartum period. With
this, a broad, large, and high-quality dataset was compiled. Three
ongoing and six completed PhD projects and about 40 peer-
reviewed published papers have now used data from the
STORK–Groruddalen study.
3.1.1 Design and setting
The STORK–Groruddalen project, initiated in 2007, is a
prospective cohort study of healthy pregnant women and their
offspring carried out at the three child health clinics in the
residential areas of the administrative districts of Bjerke, Grorud,
and Stovner in Groruddalen, Oslo. The participants were
evaluated during three visits, with the first visit being in early
pregnancy [mean gestational week (GW): 15.1 (standard
deviation (SD): 3.4)], the second visit being in late pregnancy
[mean GW: 28.3 (SD: 1.3)], and the third visit being in the
postpartum period [mean number of weeks postpartum: 14.3
(SD: 2.8)]. All information material and questionnaires were
translated into eight different languages: Arabic, English, Sorani,
Somali, Tamil, Turkish, Urdu, and Vietnamese and the quality of
the translations were checked by bilingual health professionals.
All three papers in this thesis had a prospective cohort study
design.
3.1.2 Data collection
Data were collected through interviews, objective recordings of
physical activity, physical examinations, blood and morning
urine sample collections (for both analysis and biobanking),

study-related ultrasound examinations of the placentas, biopsies
of the placentas and umbilical venous cords, anthropometric
measurements of the newborns, and the collection of
questionnaire data from the father after informed consent. Data
were collected according to established protocols. Midwives and
study personnel were certified after extensive training in data
collection to ensure a standardized collection procedure was
followed. Professional interpreters assisted the study personnel
when needed. Data collection took place between 2008 and
2011.
3.2 Recruitment and inclusion
To recruit potentially eligible women, information leaflets
translated into Arabic, English, Sorani, Somali, Tamil, Turkish,
Urdu, and Vietnamese were widely distributed in the city district
at public places where women attended. For instance,
information leaflets were distributed in the GP waiting rooms, at
Mosques, Norwegian language classes, information services,
pharmacists, playgroups for mothers/babies, and women’s
groups. In addition, GPs in the district were informed about the
study through written information and visits by study personnel
and were asked to refer their pregnant patients to the child health
clinics for assessment of eligibility for the study.
Child health clinic study staff invited those who were eligible
and gave written information about the study. After participants
signed the consent form, the necessary data were collected at the
child health clinics. Midwives and child health clinic staff
members interviewed the participants and collected a rich dataset
from questionnaires on demographics and health-related issues
as well as clinical measurements and objectively-recorded data

on physical activity (143). The study used the EPDS
questionnaire to identify depressive symptoms.
3.3 Inclusion criteria
The inclusion criteria for the women were as follows:
1. Residence in the study districts
2. Planned to give birth at one of two study hospitals
3. Were at less than 20 weeks of gestation at the time of
inclusion
4. Could communicate in Norwegian or any of the other
eight specified languages
5. Were able to give written consent
Women with diseases necessitating intensive hospital follow-up
during pregnancy were excluded.
3.4 Data material
An overview of variables used in the papers in this thesis is listed
in Table 2.

Table 2 Overview of variables used in the papers
Paper I Paper II Paper III
Primary outcome variable
EPDS score
Explanatory/exposure variables
EPDS score X X X
Ethnicity X X X
Proportion with low score for social integration X X
Reading Norwegian newspaper, X
Physical activity X
Demographic variables
Education X X X
Proportion with low score for socioeconomic position X X X
Age at inclusion (continuous) X X X
Parity X X X
Single parenthood/living without a partner, marital status, civil
status X X X
Unemployed in prepregnancy X
Living together with in-laws X
Psychosocial variables
History of depression X X X
Depressive symptoms in index pregnancy X X
Adverse life events X X X
Lack of social support around the period of birth X
Poor subjective health at three months before pregnancy X
Use of antidepressants at the postpartum visit X
Other variables
Gestational week at inclusion X
Postpartum week X
Offspring gender X
Use of interpreter during the first visit X
Gestational diabetes with WHO criteria X
Pelvic girdle syndrome X
3.5 Primary outcome variables derived from the questionnaire
3.5.1 Edinburgh Postnatal Depression Scale
We used all the following available translated versions of the
EPDS questionnaire: Norwegian, Arabic, Somali, Tamil,
Turkish, Urdu, and Vietnamese. In addition, we used a version
in Sorani, translated by the City Services Department’s

Interpreting Service in Oslo, for this study. All except the
Somalian and Sorani versions were previously validated (77).
We dichotomized the EPDS score and set the cut-off levels to 10
points or more and 12 points or more. We used the cut-off of 10
points or more in the main analysis in all three papers and the
cut-off of 12 points or more in the sensitivity analysis in paper I.
In paper I, we defined those having a score of 10 points or more
as depressed, as a score of 10 points or more is indicative of
depression. However, in papers II and III, we defined those
having a score of 10 points or more as women with depressive
symptoms rather than depression, as a stronger consensus to use
this term seems to have developed over the years when using the
EPDS (146).
3.6 Explanatory/exposure variables
3.6.1 Ethnicity
The study midwife asked the participant at inclusion which
country she was born in and if she was a descendant of
immigrant parents. If her parents were immigrants, she was
asked in which country were they born. Ethnicity was defined by
the participant`s country of birth. If the participant’s mother was
born outside Europe or North America, we also used the country
of birth of her mother to define the participant as an ethnic
minority.
We used the following categorizations of Western Europe
(Norway, Sweden, Denmark, other Western European countries,
and North America), South Asia (primarily Pakistan and Sri-
Lanka), Middle East (mainly Iraq, Iran, and Turkey) and other
(Eastern Europe, Africa South of the Sahara, East Asia, and
South and Central America) when describing prevalence in

papers I and II. For papers II and III, we used the dichotomized
ethnicity variable of either ethnic minority or Western European
women.
In addition, due to the observed significant interaction term
(described in paragraph 3.11.3), in paper II we also used the
following categorization: “Western European no depressive
symptoms in pregnancy”,” Western European depressive
symptoms in pregnancy”, “ethnic minority depressive symptoms
in pregnancy”, and “ethnic minority no depressive symptoms in
pregnancy”.
3.6.2 Level of social integration
The questionnaire included several variables/items related to
integration. We used the variables in principal component
analyses (PCAs). The PCA variables are described in detail in
3.11.2 Statistics.
3.6.3 Reading of Norwegian newspapers/watch TV
This information was derived from a questionnaire administered
at inclusion asking questions about how often during the last
year the participant had read Norwegian newspapers/watched
Norwegian television, with the possible categories being ‘daily’,
‘weekly’, ‘seldomly’, and ‘never’.
3.6.4 Objectively recorded moderate-to-vigorous physical activity
Data on physical activity were derived from the SenseWear™
Pro3 Armband (SWA) (Body Media Inc., Pittsburgh, PA, USA)
(147). At each visit, participants were asked to wear the SWA
for the following 4-7 days. The SWA is an activity monitor,
which incorporates data from sensors to determine heat

fluctuations, skin temperature, and galvanic skin responses and
produce a mean estimate for energy expenditure for one minute.
Further, the SWA uses algorithms to calculate the metabolic
equivalent (MET). Resting metabolism, i.e., energy expenditure
at rest is equal to 1 MET (1 MET = 3.5 O2 kg 1 min 1).
Women were asked to wear the SWA over the right triceps
brachia continuously for four to seven days during both
weekdays and weekend days and to only remove it during water
activities. Daily wear time and number of monitoring days were
extracted from the SWA.
We downloaded raw physical activity data integrated into 60-
second epochs via the manufacturer’s software (Sense Wear™
Professional Research Software version 6.1, Body Media Inc.,
Pittsburgh, PA, USA). A valid monitoring day was defined as
19.2 hours or more of SWA wear time. We included women who
wore the SWA for two or more days (148).
MVPA was restricted to bouts of 10 minutes or more at
intensities of 3 METs or more. MVPA in bouts was extracted
with the SQL Server Management Studio and SQL Server
Express version 11.0.50580 software programs (Microsoft Corp.,
Redmond, WA, USA). We treated MVPA as an ordinal variable
with four categories, as follows: 1) 0 minutes of MVPA per
week, 2) 1 to 74 minutes of MVPA per week, 3) 75 to 149
minutes of MVPA per week, and 4) 150 minutes or more of
MVPA per week. We defined the most active group as women
who accumulated 150 minutes or more of MVPA to ensure that
one group represented women who met the recommended level
of MVPA (137). We defined women with zero minutes per week
as the reference group, as this category provided a relatively
homogeneous reference group in terms of MVPA. The

categories used to represent the two medium-activity groups
were selected to ensure a certain number of cases was included
in each activity group
3.7 Demographic variables derived from the questionnaire
3.7.1 Education
The participants were asked about their highest completed
education level. The response options were as follows: 1) less
than seven years of schooling, 2) primary school (7–9 years), 3)
one to two years of upper secondary school (10–11 years), 4)
three years of upper secondary school (12 years), 5) a maximum
of four years at a district college/university (bachelor`s degree),
and 6) a minimum of four years at a university/university college
(Master`s degree, PhD).
Of the six original categories, this variable was categorized into
four categories in all three papers in this thesis, as follows: 1)
less than 10 years of schooling, 2) secondary level (10–12 years),
3) up to four years of further education, and 4)
university/college.
3.7.2 Socioeconomic position
The questionnaire included several items about socioeconomic
position. We used the variables in the PCAs described in detail
in 3.11.2 Statistics.
3.7.3 Age at inclusion
We obtained information about the women’s dates of birth from
the routinely recorded data from the child health clinics, which

obtained these data from the Norwegian population register. This
variable was used as a continuous variable in all three papers.
3.7.4 Parity
We defined parity as previous pregnancies lasting more than 22
weeks, further categorized as either nulliparous (no children) or
multiparous (one or more children).
3.7.5 Single parenthood/marital status
At each visit, information about the current marital status was
obtained. We categorized this variable in two categories: ‘living
without a partner’ and ‘living with a partner’. In papers I and II,
this variable was called single parenthood, while in paper III, it
was called marital status.
3.7.6 Unemployed during the prepregnancy period
At inclusion, one of the questions was about the participants’
work situation when they became pregnant. We treated this
variable as categorical, with two categories, as follows: 1)
unemployed during the prepregnancy period or 2) employed.
We used this variable in paper I only.
3.7.7 Living together with in-laws
The participants were asked with whom they shared their
household and the number of persons living in the house/number
of household members. This included the partner/spouse,
number of children, and anyone from the extended family of
either side living in the household.

We categorized this variable into two categories of whether they
lived with their in-laws or not, as a proxy measure for family
structure.
3.8 Psychosocial variables derived from the questionnaire
3.8.1 History of depression
This variable builds on Kendler's Lifetime Major Depression
Scale (149). It is based on DSM-IV criteria assessing the lifetime
history of major depression by asking five questions regarding
sadness, appetite changes, lack of energy, self-blame, and
concentration problems. The response categories are ‘yes’ and
‘no’ for each of the five questions. In paper I, a history of
depression was defined as having had at least three
simultaneously co-occurring symptoms with a duration of at
least two weeks. In papers II and III, a history of depression was
defined as having at least two simultaneously co-occurring
symptoms with a duration of at least two weeks in addition to a
sad mood.
3.8.2 Depressive symptoms in pregnancy
In paper II, about postpartum depressive symptoms, we used
information about depressive symptoms in the index pregnancy,
derived from the EPDS sum score in gestational week 28 (EPDS
score 10 = depressive symptoms in pregnancy), to explore if
depressive symptoms present postpartum were of new onset or
also present during pregnancy.

3.8.3 Adverse life events
This information was based on seven questions asked at each
visit regarding the following topics: 1) serious illness or injury
(self); 2) serious illness or injury of a close family member; 3)
death of a close family member; 4) divorce or separation from a
long-term relationship; 5) unemployment or serious difficulty
finding a job; 6) major concerns about children; and 7) any other
major event not already covered, such as serious financial
problems, difficulties at work, and serious other conflicts. The
response categories were ‘yes’ and ‘no’.
Questions about adverse life events at inclusion covered any
event occurring during the past six months, while, at gestational
week 28, they covered any event after inclusion and, in the
postpartum period, they covered any new event after gestational
week 28.
Of the seven questions asked at each study visit, we first
calculated the number of events for each time and then combined
these numbers into a single variable to reflect the total number of
events. This was further categorized as zero or one events, two
events, or three or more events in papers I and II and as zero
events, one event, and two or more events in paper III.
3.8.4 Lack of social support
Data about social support were collected at the postpartum visit
through asking the question: ‘Did you get help from your closest
ones around the time (period) of birth?’ The response options
were yes ‘to a large extent’, ‘to some extent’, or ‘to a low
extent’. We ultimately merged the first two, driven by the
distribution of the data. This variable was used in paper II.

3.8.5 Poor subjective health before pregnancy
At inclusion, the participants were asked about their state of
health in the last three months prior to pregnancy. This is a
valuable self-assessed indicator of short and longer-term health
(75). This question had four response options, as follows: ‘bad’,
‘not bad’, ‘good’, and ‘very good’. We dichotomized this
variable into the two categories of ‘bad’ and ‘good’.
3.8.6 Use of antidepressants at the postpartum visit
The study personnel asked the participants whether they used
any and, if so, the name of the medication. The possible
responses for the use of antidepressants were ‘yes’ and ‘no’.
3.9 Other variables derived from the questionnaire
3.9.1 Postpartum week
Information about postpartum week was obtained using the
offspring’s date of birth. We treated this as a continuous
variable.
3.9.2 Gestational week at inclusion
We estimated gestational week by using self-reported first day of
the last menstrual period and treated this variable as a continuous
variable.
3.9.3 Offspring gender
We obtained this from the routinely recorded data in the
postpartum period.

3.9.4 Interpreter
The participants were asked if they normally used an interpreter
for doctor’s appointments. We treated this as a categorical
variable with the response options of ‘yes’ and ‘no’.
3.9.5 Gestational diabetes with WHO criteria
We offered all participants an oral glucose tolerance test in
gestational week 28. Women with fasting plasma glucose levels
of 7 mmol/L or more and/or two-hour plasma glucose levels of
7.8 mmol/L or more were informed about having gestational
diabetes, according to the WHO 1999 criteria (143).
3.9.6 Pelvic girdle syndrome
At the second study visit, we asked about seven items to define
pain in the pelvic girdle, as follows (150): 1) pain in the lower
back not radiating to the leg(s); 2) pain in the lower back
radiating to the leg(s); 3) pain in the front of the pelvic bone,
over the pubic symphysis; 4) pain in the back over one pelvic
joint; 5) pain in the back over both pelvic joints; 6) pain in the
front and back of one side of the pelvic bone; and 7) pain in the
front and back of both sides of the pelvic bone. The response
options were: 1) no pain, 2) some pain, and 3) much pain. The
latter two were merged to create the two categories of 1) no pain
and 2) some pain.
We defined the existence of some or much simultaneous pain
from both iliaosacral joints and the pubic symphysis as pelvic
girdle syndrome.

3.10 Sample size
During the inclusion period, a total number of 1,918 women
visited the three child health clinics for antenatal care. Of these,
1,114 women were invited to participate and 823 women (74%
of the invited) were included in the study (Figure 1 appendix). In
total, 59% of the included women had an ethnic minority
background. Late first attendance at the child health clinic in
pregnancy (82%), not meeting the inclusion criteria (9%), and
periodically limited resources at the child health clinics (7%)
were the main reasons for not being asked to participate (143).
Those who declined to participate indicated a lack of time due to
work obligations and childcare as the main reasons for not
participating.
Of the 823 women included, 772 women (93.8% of included)
attended the second visit at gestational week 28. (Figure 2
appendix). Of these, 739 had answered all 10 items on the EPDS.
Eight women had missing answers on one item, one woman had
missing answers on two items, and one woman had missing
answers on three items. We calculated the mean value of what
the other participants had answered for each of these missing
items and imputed such for those who were missing answers. We
ended up with a sample of 749 women for paper I.
At the third visit, occurring in the postpartum period, 662 women
attended (81% of included). Of these, 632 had answered all
questions on EPDS. Seven women had missing data on one item,
two had missing data on two items, and two had missing data on
three items. After similar calculations as done before for those
who were missing items, we ended up with a sample of 643
women for papers II and III (Figure 1).

Figure 3, flowchart. Overview of study sample paper I-III

3.11 Statistics
3.11.1 Descriptive statistics
Demographic statistics for categorical variables are expressed as
numbers (percentages) and, for continuous variables, as means
and standard deviations if normally distributed and medians with
interquartile ranges if not normally distributed. To compare
groups with categorical data, we used the chi-squared test or
Fisher`s exact test, while, for continuous data, we used the T-test
or Mann–Whitney U test.
3.11.2 Principal component analyses,PCA
Different variables describing socioeconomic position and level
of integration are correlated. For instance, it may be natural that
the aspects of education, occupation, housing, and
rent/ownership together reflect a person’s socioeconomic status.
However, they also represent different dimensions or angles of
such. To reduce dimensionality, we extracted the smallest
number of components that accounted for most of the variation.
We therefore entered all variables related to socioeconomic
position and level of integration into a PCA (151) and extracted
two separate components.
The first component was strongly correlated with predefined
markers of the level of integration, as follows:
1. Language skills (e.g., need of interpreter during study
interviews, need of interpreter at a doctor’s appointment, self-
reported abilities in the Norwegian language)
2. Length of residency in Norway

3. Frequency of reading a Norwegian newspaper or watching
Norwegian television
4. How often one is visited (in any context) by an ethnic
Norwegian
Only ethnic minorities were asked these questions, whereas the
ethnic Norwegians were automatically given the highest value
for these variables. The score variable was therefore skewed to
the right, reflecting the fact that ethnic Norwegians all had high
scores.
The second component was strongly correlated with the
following predefined individual and household markers of
socioeconomic position:
1. Educational level
2. Occupational class
3. Employment status
4. Renting tenure and rooms per person in the household
These scores were normally distributed. We further
dichotomized the PCA score as the 40% with the lowest scores
versus the 60% with highest scores.
The PCA variables are study-specific and data-driven, and the
resulting associations will represent the effects of gradually
increasing socioeconomic position and integration levels.
However, we were mainly interested in the impact of having
poor integration and a poor socioeconomic position. We
performed analyses using the PCA variables as a continuous
score, and the results were similar. We additionally explored
alternative cut-off values (20%/80% and three categories with
different cut-off values). However, notably, the pragmatic
40%/60% cut-off point had a sufficient number in the lowest

category yet still carried important information. We therefore
preferred to present these categories, considering our aim of the
study. In paper III, we used the socioeconomic PCA variable as a
continuous score.
3.11.3 Main analyses
Papers II and I: We first defined our research question as
regarding whether or not depressive symptoms were associated
with ethnicity and level of integration. Hence, the main
explanatory variables in papers I and II were ethnicity and level
of social integration. Then, we performed a literature search and
identified confounders. Further, we created a directed acyclic
graph (DAG) to visualize true confounders (152). We next
adjusted for confounders/variables that were clinically relevant
using logistic regression analysis. Further, significant
confounders (P < 0.05) in univariate analysis and confounders
with clinical relevance, independent of their significance level
(purposeful selection with forward selection) (79), were included
in the model-building process.
Specifically, we hypothesized that different risk factors may
operate differently in ethnic minorities and Norwegians (153),
i.e., that there may be synergistic effects. For instance, an ethnic
minority woman might be more vulnerable if she lacks support
from her closest relatives, compared with ethnic majority
women, who potentially have a wider social network. We
therefore checked statistical interaction between the main
explanatory variable ethnicity and other variables by including
product terms, one at a time. In paper I we found a significant
interaction between ethnicity and age, and age was therefore

removed from the adjusted models as it had negligible impact on
the estimates.
In paper II we had a significant interaction (p=0.01) between
ethnicity and depressive symptoms in index pregnancy. A new
variable with four categories was created to explore this
interaction effect: “Western European, no depressive symptoms
in pregnancy”, “Western European with depressive symptoms in
pregnancy”, “ethnic minority, no depressive symptoms in
pregnancy” and “ethnic minority, with depressive symptoms in
pregnancy”.
Paper III: We wanted to explore the association between MVPA
and postpartum depressive symptoms. Hence, MVPA was the
main explanatory variable in this paper. Adverse life events,
depression in index pregnancy, pelvic girdle syndrome, ethnic
background, maternal age, socioeconomic position, and
sedentary time were considered as true confounders and adjusted
for in logistic regression analysis. Since we only had 60 cases,
the numbers of confounders we could adjust for were limited
(rules of degree of freedom), as adjusting for too many could
lead to over adjustment and biased estimates. We drew a DAG
that helped us include a minimum number of necessary
confounders in the analysis. Second to DAG development, we
used the epidemiological method called ‘purposeful selection’
and fitted our model in the logistic regression analysis by way of
backward selection (79). No significant interactions were found
in paper III.
3.11.4 Missing data for physical activity—imputations
In paper III, of the 643 participants with a valid EPDS score, 171
had missing data on objectively recorded physical activity. Thus,
the results presented in paper III were obtained using multiple

imputations to increase the sample size and to strengthen the
plausibility of missing at random (154).
In addition to missing data on MVPA, we had some missing data
on sedentary time, adverse life events, depressive symptoms in
index pregnancy, self-reported pelvic girdle syndrome, and
history of depression. We used logistic regression analysis to
identify variables that predicted missing values and,
subsequently, these predictors were included as auxiliary
variables in the imputation model (155). The variables predicting
missing values for MVPA were body mass index at the first visit,
residency in Norway, ethnicity, maternal age, educational level,
socioeconomic position (PCA score), marital status, parity,
adverse life events, and self-reported prepregnancy health. We
identified that a significantly higher proportion of ethnic
minority women had missing data on MVPA. In line with the
study by Sterne et al. (155), we included ethnicity in the
imputation model. Ethnicity was also included in the analytic
model because it was a confounder. Thus, the inclusion of
ethnicity in the analytic model and in the imputation model
supports the plausibility of the missing at random assumption
(155). The following variables were imputed: MVPA/sedentary
time (SWA data), socioeconomic position, adverse life events,
depressive symptoms in index pregnancy, and pelvic girdle
syndrome. We used the automatic mode in the Statistical
Package for the Social Sciences software program (IBM Corp.,
Armonk, NY, USA) and imputed 25 datasets to obtain pooled
estimates of the overall measures of the association. The primary
models presented were based on the pooled estimates derived by
multiple imputation analyses.

3.11.5 Sensitivity analyses
In addition to the main analyses, we repeated our analyses using
a subsample to ensure that our results/associations were robust.
Paper I: We performed logistic regression analyses with an
EPDS score of 12 points or more as the main outcome.
Paper II: We then reran our main analysis while considering
ethnic minorities only and used level of integration as the main
explanatory factor (Model 2; Table 3 in paper II was reran
including ethnic minorities only ). This model included age,
adverse life events, socioeconomic position, integration, and
history of depression.
Paper III: We repeated the logistic regression analyses on
complete case as sensitivity analysis. In addition, we performed
the main analyses on ethnic minorities only.
4 EthicsThe Regional Committee for Medical and Health Research
Ethics for Southern Eastern Norway (reference number:
2007.894) and the Norwegian Data Inspectorate (reference
number: 07/01355-4/CGN) approved the STORK–Groruddalen
study. Further, all the participants provided informed written
consent, in that the participating women gave written consent
both on behalf of themselves and their offspring. Removal of
identifying information was done prior to analysis and the study
was conducted in agreement with the Declaration of Helsinki.

5 Results
5.1 Paper I
The crude prevalence of depression was as follows: in Western
Europeans, 8.6% (95% CI: 5.45–11.75); in Middle Easterners,
19.5% (95% CI: 12.19–26.81); in South Asians, 17.5% (95%
12.08–22.92); and in other groups, 11.3% (95% CI: 6.09–16.51).
The median EPDS score was six points in Middle Easterners and
three points in all other groups.
Middle Easterners (OR: 2.8; 95% CI: 1.29–6.15) and South
Asians (OR: 2.7; 95% CI: 1.35–5.48) had a significantly higher
risk for depression than did other minorities and Western
Europeans in logistic regression models when adjusted for single
parenthood, three or more recent adverse life events, poor self-
reported health, and a history of depression. When adjusting for
socioeconomic position and family structure, the ORs were
reduced (OR: 2.5; 95% CI: 1.07–5.57 and OR: 2.3; 95% CI: 1.07–
4.72). Other independent risk factors were three or more recent
adverse life events, self-reported history of depression, and poor
subjective health at three months before conception.
We also explored which of the individual items related to
integration contributed most to the results by replacing the PCA
variable for integration by the following variables, each at a
time: Self-reported abilities in Norwegian, time of residence in
Norway, how often the last year participant read Norwegian
newspaper/watched Norwegian TV, and how often the
participant was visited by an ethnic Norwegian (questionnaire in
appendix). This analysis was done in the subgroup of ethnic

minorities only. Reading Norwegian newspaper/watching
Norwegian TV “never” or “less” than once a week during the
last year was independently associated with depressive
symptoms in pregnancy.
5.2 Paper II
The crude prevalence of postpartum depressive symptoms was
9.3% for the whole study sample but was higher in ethnic
minorities at 12.7% (95 % CI: 9.31–16.09) than in Western
Europeans at 4.8% (2.26–7.34). Ethnic minority background
was an independent risk factor for postpartum depressive
symptoms as was recent adverse life events, lack of social
support, and depressive symptoms during the index pregnancy.
As a result of the interaction between ethnicity and depressive
symptoms in pregnancy, Western Europeans with no
depressive symptoms in pregnancy had an adjusted OR of 0.2
(p=0.005), whereas Western Europeans with depressive
symptoms in pregnancy had an adjusted OR of 4.0 (p=0.012).
Hence, Western Europeans with postpartum depressive
symptoms were more likely to have had depressive symptoms
also during pregnancy, whereas ethnic minorities were more
likely to have new onset of depressive symptoms (72.2%
versus 33.3 %, P = 0.04). Low social integration was an
independent risk factor for postpartum depressive symptoms
when replacing ethnicity in our models [OR: 2.1 (95% CI:
1.11–3.95)].

5.3 Paper III
In logistic regression analyses with imputed values, women who
recorded 150 MVPA minutes/week or more in bouts of more
than 10 minutes had, in the unadjusted model, a significantly
lower risk (OR: 0.2; 95% CI: 0.06–0.60) for postpartum
depressive symptoms as compared to those who recorded no
MVPA minutes/week in bouts of more than 10 minutes (i.e.,
who were inactive). When we adjusted for ethnic minority
background, depressive symptoms in index pregnancy (EPDS
score points), and self-reported pelvic girdle syndrome, the
reduced risk for postpartum depressive symptoms persisted.
We then reran the analyses in the complete case sample and
among a subgroup of ethnic minority women only, as a
sensitivity analyses, achieving similar results.
Further, bivariate logistic regression analysis of imputed values
showed that postpartum depressive symptoms were associated
with ethnic minority background, with zero MVPA
minutes/week in bouts of more than 10 minutes (inactivity),
adverse life events, low socioeconomic position, history of
depression and depression in index pregnancy (EPDS score
points).
6 Discussion of methods
6.1 Methodological considerations
In order to interpret the results as accurately as possible, it is
important to be aware of possible bias.
Internal validity refers to how well a study is carried out,
especially with respect to the role of confounding and other
systematic errors, whereas external validity refers to the extent to
which a study is representative for the source populations and
other populations. Internal validity is a premise for external
validity (156).
6.1.1 Internal validity
When considering internal validity, we are concerned with two
types of errors: Errors at random and systematic errors. There are
usually two types of these: accuracy in the measurements and
issues related to the sample size.
Systematic errors include selection bias, information bias, and
confounding. These errors will now be covered in more detail
with regard to the three aforementioned papers.
6.1.2 Validity of the Edinburgh Postnatal Depression Scale instrument
When considering the accuracy of measurements, our main
outcomes variable, the EPDS merits comments.
First, the EPDS is a validated instrument, tested against DSM-
IV criteria for major depression with 100% sensitivity and 87%
specificity when using the cut-off value of 10 points or more (68,
71).
Further several translated versions have also been validated (77)
and demonstrate good psychometric properties when tested in
different languages and cultures (78, 94, 157, 158). In addition to
the original English version, we used other available validated
versions in Norwegian, Urdu, Tamil, Vietnamese, and Arabic
(77). The city service department translated the Sorani version
for this study. The Sorani and Somali versions were not
validated.

The validation studies suggest different cut-off values for
different languages, but we used the cut- points
or more for all. This cut-off value has been used in many
epidemiological studies. The choice of an appropriate cut-off
level has frequently been discussed in the literature. Studies
using a high EPDS cut-off score generally find lower sensitivity
and higher specificity than do studies using a lower cut-off (76).
EPDS is only a screening tool, which cannot be used to diagnose
depression. In clinical practice, we have to carry out a diagnostic
interview for diagnosing depression. We therefore changed the
term depression used in paper I to depressive symptoms in
papers II and III. However, we stated clearly in paper I that this
was a proxy measure for depression and that a diagnostic
interview is necessary to diagnose depression. Therefore, in
paper I, we may have cases that are not actually depression but
rather just show increased depressive symptoms. Nevertheless,
we wanted to demonstrate the higher symptom load among
ethnic minorities.
6.1.3 Information bias
Information bias can occur when the outcomes or exposure data
are incorrectly recorded(156) . This includes objective
measurement errors, misclassification of self-reported
information, and recall bias.
In this thesis, data were mostly collected through questionnaires
(i.e., EPDS for the primary outcome and other questions for all
other information). Validated versions and questions already
used in other studies were used to the highest extent possible
(143).

Due to limitations of resources, it was not possible to perform
forward and backward translations of all of the questions.
However, the translated questionnaires were sent to bilingual
health personnel for review.
In the following, information bias will be discussed in further
detail.
The maternal line is important for the application of maternal
and biological influences, for the transfer of cultural identity to
the child, and later for determining behaviour risk factors in
children. Further, the pregnant woman usually gets care and
support from her mother during pregnancy and the postpartum
period and the maternal line has influence on early upbringing of
the child. We therefore put emphasis on the relationship of the
pregnant woman and her mother when defining ethnicity.
However, heterogeneity within an ethnic group and between
ethnic groups in each category possibly exists. Nevertheless, for
paper II and III, we categorized all ethnic minority women into
one large ethnic group. As we had a limited number of cases,
including 97 with depressive symptoms in pregnancy (EPDS
score points) in paper I and only 60 with postpartum
depressive symptoms in papers II and III, we had to limit the
total number of categories in the models and so therefore we
used a crude measure of ethnicity to avoid overfitting the model.
Ethnic minority women, mostly of the first generation from
outside Europe, face more challenges (e.g., not having enough
language skills, not knowing the health care system, separation
from their social support systems in their home countries) during
pregnancy as compared with women from Western Europe,
specifically mostly Scandinavian countries. Members of these

groups are considered to have some shared cultural practices that
differ from those of groups originating from Europe, where, for
instance, more individual-oriented values dominate versus the
more collectivistic and family-oriented values of traditional
Asian and African cultures.
Moreover, our studies included a large number of women with
very diverse cultural backgrounds. Grouping them under one
ethnic group or categorizing them into only a few groups hides
heterogeneity in exposure and vulnerability and may introduce a
problem with the generalization of associations.
In our study only, one single question was used to investigate
the presence of someone who can help or be talked to, reflecting
dimensions of social support related to the possibility of having
assistance and people to confide in, especially around the time
of birth when the woman is especially vulnerable. This measure
of social support may have some limitations. First, this variable
refers to social support only during pregnancy and the hospital
stay for delivery. However, social support is more than the
support around the period of birth and is a complex structure,
which is not easy to measure by asking one question. However,
we have other aspects of social support such as marital status
(the variable single motherhood in our paper I and II) and
questions about family structure, which also are dimensions of
social support.
Second, we collected data for this variable retrospectively, which
may have caused some recall bias. Nevertheless, as social
support may have an impact on postpartum depressive
symptoms, we decided to use the information we had rather than
not including it at all.

Importantly, this variable has some limitations. First, we asked
about earlier history of depression at the postpartum visit. Some
of those answering ‘yes’ regarding a previous history of
depression may have referred to their depression period in the
index pregnancy. For this reason, we did not use depressive
symptoms in the index pregnancy and a history of depression
variable in the same model. Second, we cannot rule out recall
bias. Third, some participants did not answer all of the seven
questions about mental health. The last one of these seven
questions summarized all of the questions, as follows: ‘Have you
ever had at least three of the abovementioned symptoms,
continuously for two weeks or more?’
In paper I, we used by mistake only the last summarizing
question and did not include the core symptom of ‘sadness’
when creating the history of depression variable. This was later
pointed out, so we created a new variable for papers II and III.
The new variable measuring the history of depression/depression
earlier in life consists of: the core symptom of ‘sadness’ and
answers of ‘yes’ to at least two of the other questions on
Kendler’s Lifetime Depression Scale. The effect estimates
obtained were nearly the same with the new variable.
Nevertheless, as it is perhaps the most important variable listed
as a risk factor for depression, we deemed that it was important
to use it.
Self-rated health is often assessed for its ease of use and power
in measuring other dimensions of health than those captured by
medical terms. Several studies have found a higher incidence of
depression in some ethnic minorities, related to language

problems, poor integration, and low socioeconomic position (69).
Depression has been associated with an increased risk of
mortality for all ethnic groups (159). In surveys conducted in
Norway, women from Pakistan and Turkey had the poorest self-
reported health . Nevertheless, this variable should be interpreted
with caution when comparing ethnic groups. Culture and
language can influence the perception of health (160).
This self-reported variable collected at inclusion described how
the woman felt about her health the last three months prior to
pregnancy. This may have been influenced by some recall bias.
However, it was our intention to ask about the period prior to
pregnancy as a proxy for the woman’s general health. As there is
a predominance of nausea and vomiting during the first
trimester, asking how she felt about her health at that point
would probably be biased by interpregnancy symptoms.
It was generally recommended that the participants used the
SWA for at least three to four days (147). One of these days
should be a weekend day so as to be able to obtain a reliable and
valid estimate of daily physical activity level (161). Due to the
natural fluctuations in physical activity across days, a higher
number of physical activity recordings would capture the
average daily habitual activity level more accurately. There were
women who removed their armbands due to reasons that we do
not know. There is also a limitation of that we do not know
whether all women with valid armband data used the armband on
at least one weekend day.
Women with two or more days of use were included in the
current analysis.

We do not have access to data showing the whole range of daily
wear time, as physical activity data was only available if the
SWA was worn 19.2 hours or more on a given day. However,
the number of days that the SWA was worn gives an indication
of compliance. In total, data from 171 women were not eligible
for analysis (i.e. the data were from less than two days of wear
time, see under, Table 3, right column). Of the remaining
women, data was collected over at least 3 days for 402 women,
and over two days for 472 women.
Table 3 Number of days of SWA use
Armband days Number of women included Number of women excluded
0 N=138
1 N=33
2 N=70
3 N=136
4 N=200
5 N=43
6 N=20
7 N=2
8 N=1
SUM 472 N=171
Another limitation of the SWA is that it does not measure water
activities. While it has been documented that the SWA provides
valid measures of energy expenditure during pregnancy for a
range of physical activity types, the validity of energy
expenditure during bicycling during pregnancy has not been
reported (147). In a nonpregnant sample, the SWA
underestimated energy expenditure during ergometer cycling by
37% (162). If many women did bicycling or water exercises, not
having them included among the physically active women could
give bias in the form of underreported numbers among those
who were actually physically active. This may lead to a weaker
association. Nevertheless, unpublished data from our study

showed that very few women were bicycling or participating in
water activities during pregnancy.
We acknowledge that treating MVPA as an ordinal variable
reduces the amount of information that can be obtained. This
decision reflected the highly skewed distribution of MVPA and
the large number of women with zero counts (i.e., no minutes of
MPVA in bouts lasing
The participants’ physical activity level may have increased
because of wearing the armband; hence, the physical activity
estimates may not reflect the true habitual level of physical
activity during pregnancy.
6.1.4 Confounding
The benefit of a cohort study is that the exposure is measured
before the outcome, thereby offering the possibility of studying
associations and potentially causal relationships, as we have
done in our papers. A causal relationship cannot be proven, but
observational studies can assume causal inference. This is further
supported by the Bradford Hill criteria, a set of criteria
developed by the English epidemiologist Bradford Hill that can
be used to provide evidence of a possible causal relationship
between a cause and an effect (163, 164). The Bradford Hill
criteria are the following:
1. Strength of the association
2. Consistency of the association
3. Temporality
4. Plausibility
5. Coherence of association/biological gradient
6. Experiment
7. Analogy

An observational study design is also an appropriate design to
study the distribution of diseases, symptom load, or risk factors
among populations and subgroups. Proper statistical methods are
necessary when establishing causal associations (152, 165).
Causal inference involves exploring methods for causal
relationships, with RCTs being the gold standard. However,
RCTs are very resource-intensive and expensive, and it is highly
unrealistic that all important research questions will be answered
by RCTs in the future. In situations where evidence from RCTs
do not exist, observational studies may offer options to study
causal inferences, using new tools such as drawing directed
acyclic graph (DAG). A DAG is a visual graph that is used to
structure thoughts related to casual associations (152). The graph
consists of a junction between two points (variables) with an
arrow in between them. Each arrow points from one causal
factor to an outcome and illustrates a potential causal
association. The arrows are acyclic, meaning that it is not
possible for them to start at one point and then return to the same
point. A confounder is a variable that affects both the exposure
and the outcome and which is not in the pathway between the
exposure and outcome (166). Generally, variables used in
multivariate analyses to study associations with outcomes can be
noted/labelled with different terms (e.g., risk factor, explanatory
factor, predictor, and confounder). Building on the DAG
approach, a risk factor is considered a confounder if it is both
associated with the exposure and the outcome (depressive
symptoms in pregnancy and postpartum). Confounders should be
adjusted for. Importantly, a collider is a variable that is a
common consequence of both exposure and outcome and which
should not be adjusted for.

In papers I and II, we used the longitudinal design to observe
certain factors associated with depressive symptoms in
pregnancy and the postpartum period. In paper III, we used the
longitudinal design to study the association between physical
activity in pregnancy and postpartum depressive symptoms. The
prospective design made it possible to draw a DAG and to build
etiological models for papers I through III.
In papers I and II, first, ethnic origin and, second, social
integration were the main explanatory variables. We considered
all of the other variables listed in the DAGs as potential
confounders and adjusted for them.
In paper III, our main exposure variable was physical activity in
the third trimester of pregnancy, whereas postpartum depressive
symptoms constituted the main outcome. Our research directive
was to investigate the association between physical activity in
the third trimester of pregnancy and depressive symptoms after
birth. All other variables were only of interest to the extent that
they affected and changed the association between physical
activity and postpartum depressive symptoms (163).
We wanted to explore the independent effects of physical
activity in the last trimester of pregnancy on depressive
symptoms after birth; hence, we drew an arrow from physical
activity to depressive symptoms. Adverse life events, depression
in the index pregnancy, pelvic girdle syndrome, ethnic
background, maternal age, socioeconomic position, and
sedentary time were considered as confounders in this study and
were therefore adjusted for.
With the cohort design, it is not possible to draw a firm
conclusion as to whether physical activity prevents or reduces
postpartum depressive symptoms, as there will always be

residual confounding. Since we measured physical activity first
in gestational week 28 and then symptoms of depression in the
postpartum period, we were able to explore the potential
protective effect of physical activity. A RCT is needed to
definitely conclude whether physical activity in pregnancy
prevents postpartum depressive symptoms.
6.1.5 Selection bias
To consider whether the STORK–Groruddalen study is
representative for the source population, we need to assess any
selection bias. Selection bias is related to procedures related to
select study participants.
Our sample of 823 pregnant women was representative of the
source population regarding ethnicity (143). However, the
included women had slightly lower age and parity compared to
those not included (not eligible and declined to participate)
(143).
We also performed analyses comparing those who attended
follow-up visits versus those who did not re-attend after the first
or second visit. Participants in papers II and III had slightly but
significantly higher socioeconomic positions, more education,
less unemployment, and more were living with their partner.
This pattern is often the case in cohort studies with longer
follow-up-times. In paper I, no significant differences were
found between the study sample and those who did not re-attend
after the first visit. We do not consider that selection bias had a
major impact on our results.
6.1.6 External validity and representativeness
External validity refers to the generalizability of the study results
outside the study sample. If STORK–Groruddalen study is

representative for the source population, we can suppose that it
might be representative for similar ethnic groups in multiethnic
societies in Scandinavia and Europe.
We attempted to include a representative sample, including hard-
to-reach groups, to ensure good external validity (143). Due to
language and cultural barriers and methodological challenges,
ethnic minorities are often underrepresented in research. We
therefore did not restrict our inclusion to those who could write,
read, understand, and speak Norwegian. In our sample, 21% of
participants were in need of an interpreter during doctor’s visits,
indicating that we managed to include individuals from this
group. However, data collection was demanding, as it required
the use of extensive resources for the translation and
administration of material and the need of both personnel and
financial resources. Due to this, the inclusion period was limited,
which in turn limited the number of participants involved.
Further, the three districts where this study was carried out each
have a large population of ethnic minorities and a large majority
(75%–85%) of pregnant women in the study districts attend the
child health clinics for antenatal care. Of all the 1,918 women
that attended the child health clinics during the inclusion period,
1,114 (58%) women were eligible, 291 (26%) refused to
participate, and 823 (73.9%) of the invited (42.9% of all women
who attended the clinics) ultimately participated (143)
(Flowchart fig. 1 Appendix). This is higher than that study
cohorts in many other health surveys (167). As compared with
the Norwegian Medical Birth Registry, participants in STORK–
Groruddalen had similar characteristics (e.g., regarding age,
parity, education).
This study also aimed to have a specialized approach to increase
participation and representability. For instance, the child health

clinic staff members were familiar with the culture and religion
in ethnic minorities living in this area, further facilitating data
collection. In addition to this, flexibility in terms of the timing
and appointment of interviews facilitated the attendance and
increased participation from all ethnic groups.
We therefor assumed that the largest ethnic groups (i.e., South
Asians, Middle Easterners, and Western Europeans) in our
sample were representative of healthy women attending the child
health clinics. With the large inclusion rate, this is probably also
representative for immigrants of similar ethnicities in
Scandinavia and other Western countries. However, although
women from 62 different countries were included in the study,
many of the ethnic minority groups were still small. Further,
women with profound depression and other serious diseases
usually do not attend child health clinics, as specialists typically
follow them up from early on in pregnancy. Therefore, we
consider our study cohort to be representative of healthy
pregnant women from the specified districts.
Although heterogeneity may be a problem, we focused on
including pregnant women of ethnic minorities in Norway, as all
ethnic minorities have some common challenges.
7 Discussion of results
7.1 Persistent depressive symptoms from pregnancy to the postpartum
period
In our study, 28% of women had depressive symptoms in both
pregnancy and the postpartum period (persistent depression) and
the majority of those with persistent depressive symptoms were
of Western European origin. Women with ethnic minority
background more often had a new onset of depressive symptoms

after birth. In line with our results, one retrospective study from
the United Kingdom (168) reported that 21% of women had
persistent depression and among those who were depressed
antenatally ethnic or black minority had decreased risk for
postnatal depression. On the other hand, prospective studies
have reported lower rates of persistent depressive symptoms
than we did, specifically between 6-8% (54, 169, 170), but these
studies are methodologically different and not direct comparable
to our study. Furthermore, these studies did not compare ethnic
minorities with Western Europeans as we did when reporting
the rates for persistent depressive symptoms. To our knowledge,
few studies have reported the prevalence of persistent and new-
onset depression stratified by ethnic group as we did. However,
the findings so far indicate that screening for depressive
symptoms in pregnancy would not detect the cases among
minority women, as there are more new-onset postpartum cases
among them.
7.2 Prevalence of depressive symptoms in pregnancy
Population-based studies using either the short version of EPDS
or the complete EPDS (171, 172) and, like the current theses,
report prevalences of depressive symptoms of between 17-22%
for ethnic minority groups. After the work associated with this
thesis began in 2011, an increase in the focus on perinatal
depression has occurred, but still little has been published
specifically on ethnic minorities, including on the prevalence for
different ethnic groups like those that we have reported on.
Further, as mentioned earlier due to different settings and
measurement assessments of depressive symptoms, a direct
comparison is often not possible.

7.3 Prevalence of postpartum depressive symptoms
A review of population-based studies on maternal health care in
migrants (173) and a recent population-based multistate study
from the United States (174) reported the following rates for the
prevalence of postpartum depressive symptoms: 8% to 35% in
immigrants and 7% to 17% among Western Europeans. The
review (173) included only five studies on the prevalence of
postpartum depressive symptoms and most were cross-sectional.
Four of the studies in this review used EPDS, one Australian
study used another measure, and only two studies from
Scandinavia (Sweden) were included. Our identified prevalences
of 12.7% among ethnic minority groups and 4.8% in Western
Europeans are within this range found in other studies.
Nevertheless, although many studies find that being an
immigrant is a risk factor for depressive symptoms after birth
(175), not all studies’ results are comparable to our findings as
the ethnic groups, the setting, and the measurement of depressive
symptoms between studies differ.
7.4 Ethnicity, integration, and other risk factors associated with
depressive symptoms in pregnancy
In the present thesis, being an ethnic minority, having
experienced adverse life events, having a past history of
depression, and exhibiting a low level of social integration were
factors associated with depressive symptoms in pregnancy.
These results are consistent with those obtained from other
studies investigating depressive symptoms in pregnancy (169,
176-178). Still, many studies fail to report whether or not
integration can influence depressive symptoms in this period of
life. For instance, the systematic review from the United States

published in 2010 (176), which reported that stressful life events
and a history of previous depression were associated with
depressive symptoms in pregnancy, excluded risk factors related
to acculturation when estimating the effect size.
There are studies supporting our finding of a strong independent
association between stressful life events and depressive
symptoms in pregnancy (100, 102, 104). The two studies by
Rubertsson et al. (100, 102) are population-based from antenatal
clinics in Sweden. Antenatal clinics in Sweden reach almost
100% of all pregnant women. However, in contrast to the present
study, these authors included only those who spoke Swedish.
Hence, they may have failed to include those who were poorly
integrated. Separately, Zelkowitz et al. (104) conducted their
study among immigrants only. Hence, there was no control
group of Canadian-born individuals in this study to compare
with regarding risk factors.
We found an association between poor self-reported health prior
to pregnancy and depressive symptoms in pregnancy. Few prior
studies have examined the association between self-perceived
health and depressive symptoms in pregnancy. A study
comparing correlates of depression among Pakistani and
Canadian women (179) reported that women of all origins who
perceived their overall health as being poor were significantly
more likely to experience depressive symptoms. We also found
that ethnic minorities were more likely to report a poorer health
status as compared with Western European women.
Other studies have reported that ethnic minorities are more likely
to have mental distress versus Western European women (180).
The study by Prady et al. (180) evaluated disparities among
ethnic minorities and white British women regarding the

detection of depression and anxiety during the last trimester of
pregnancy. They linked data from GP records, data from a
maternity database, and data from the ‘Born in Bradford’ birth
cohort (a cohort that aims to examine the impact of
environmental, psychological, and genetic factors on maternal
and child health). Women having a high score on the
15) were defined as having a mental problem. The high scores
were checked against any diagnosis of mental disorder on the GP
record. As compared with white British women, Pakistani
women were more likely to have a high score on the GHQ and,
at the same time, no mental disorder diagnosis in the GP records.
Put another way, few women with a high score had an identified
mental disorder and the majority of these women were of
Pakistani origin. The study concluded that ethnic minority
women had a 2.3- to 2.7-fold risk of potentially missed common
mental disorders. This could be because ethnic minorities may be
less willing to express depressive ideas due to the stigma related
with it, which subsequently hinders detection. Being an ethnic
minority woman in our study was a risk factor for depressive
symptoms, which demonstrates the high level of symptom load
in this group versus in Western European women, consistent
with the Born in Bradford study. This suggests that we need
specific support for women with a reduced understanding and
acceptance of mental health disorders. The WHO has reported
that cultural factors differ by level of acculturation in the host
country and this represents one of the largest barriers to
treatment (181).
Although women from South Asia and Middle East in our study
had significantly higher risks for depressive symptoms in
pregnancy (ORs: 2.7 and 2.8, respectively) versus Western
Europeans, the ORs were reduced when we adjusted for

socioeconomic position and family structure. This may suggest
that factors other than ethnicity may increase the risk of
depressive symptoms among pregnant women. This is
consistent with the results of other studies on pregnant ethnic
minorities (177, 182-185), suggesting that once
sociodemographic factors are taken into account, the increased
risk among minority mothers may be reduced.
7.5 Ethnicity, integration, and other risk factors associated with
postpartum depressive symptoms
In the present thesis, we found that having a history of
depression, having a lack of social support, adverse life events,
depression in the index pregnancy, and low socioeconomic
position were independent risk factors for postpartum depressive
symptoms, in addition to either being an ethnic minority or
having a low level of social integration,.
Other results support our finding of the strong associations of
both history of depression and being an immigrant with
postpartum depressive symptoms (168, 186, 187). The study by
Silverman et al. (186) is a recent population-based study from
Sweden. This was a large study that used the Swedish National
birth Register linked with the Swedish National Patient Register,
and which followed women for one year after delivery. The
study reported significantly increased postpartum depression risk
(relative risk: 21.03, 95% CI: 19.72–22.42) among those with a
history of depression as compared with those without a history of
depression.
Statistics Canada participated in the study by Lanes and
colleagues (187). They conducted a large, nationwide cross-
sectional survey to assess pregnancy, delivery, and postnatal
experiences of mothers and their children by way of both
telephone and personal interviews. The study used the EPDS to
assess depressive symptoms. The authors reported that being an
immigrant, having a low household income, having a lack of
support postpartum, and having depression earlier in life were
associated with postpartum depressive symptoms. These findings
are in agreement with our results. Nevertheless, these authors did
not translate the questionnaires into other languages to reduce
the barriers to participate in the study. Although an increasing
number of studies are reporting that immigrants may have a
higher risk for depressive symptoms, few studies to date have
explored the reasons for the increased risk. Our study adds to the
field by exploring reasons for ethnic disparities in the risk of
depression by including level of integration into society as an
alternative variable.
A recent registry-based cohort study from Canada (188)
measured mental health care contact after discharge from the
delivery hospitalization and at one year postpartum. The authors
categorized the included women into regions of origin and
classified the women by the length of time since immigration (<
5 years, 5–10 years, and > 10 years) and by whether they had
immigrated as refugees or not. This was a large study that
included 123,231 immigrant mothers, with almost half being
from South Asia or East Asia and the Pacific. The most common
problem resulting in contact with mental health care services was
a depressive or anxiety disorder, and immigrants who had
recently arrived were less likely to use mental health services as
compared with women who had been in Canada for more than
10 years. Our largest ethnic minority group in the present study
was from South Asia, our social integration variable holds
information about the length of stay in Norway, and a shorter

length of stay is reflected in a low level of integration. Hence,
our study managed to include women with a low level of
integration who are usually hard to reach, as reported by a
previous study (188). Few studies include ‘hard-to-reach
groups’, including those with no or few language skills in the
host language. Of our total study population, 21% were those
who usually used interpreters at doctor’s appointments.
Our finding of a lack of social support being an important risk
factor for postpartum depressive symptoms is consistent with
previous studies (29, 189). This is further supported by
qualitative studies: two meta-syntheses (55, 63) reported that
immigrants are at increased risk for developing postpartum
depressive symptoms, and a lack of social support and cultural
differences were some of the identified associated factors.
Additionally, a study from 2018 (190) explored this in Hispanics
and Africans living in the United States, finding that high levels
of social support were strongly protective for postpartum
depressive symptoms in all groups. Our study confirms this, as
we found a strong independent association between a lack of
social support and postpartum depressive symptoms. However,
this study included more measures of social support than we did,
but, on the other hand, it included only Hispanics and Africans
living in the United States.
A recent systematic review on postpartum depression in
immigrants from South Asia who settled down in high-income
countries (48) reported that social isolation and not accessing the
health care system due to language problems in the new country
were some of the factors associated with postpartum depression.
This systematic review further emphasized that little was known
about experiences of South Asian immigrant mothers who have

traditions that are different from those of the country they are
settled down in. Our study adds to this literature. Our largest
minority group is from South Asia (mainly Pakistan and some
from Sri-Lanka) and we found that a low level of integration and
low socioeconomic position partly explained the increased risk
for depressive symptoms in pregnancy and the postpartum period
among these women. Only three of the studies in this review (48)
included women born in Pakistan.
Women born in Pakistan or who had parents born in Pakistan are
among the largest South Asian group in many Western countries
like Norway. As there is little research on this group, our study is
a contribution to this field. Only one earlier study from Norway
explored postpartum depressive symptoms among Pakistani
mothers (106). In this study, the husbands were present at the
interview in 71% of the cases, which may have led to
underreporting of symptoms. To the best of our knowledge, no
other studies from Norway have addressed depressive symptoms
in relation to ethnicity and integration in the perinatal period
among a diverse ethnic population, including those who have
newly arrived to the country and who have limited command of
the majority language.
Our study is highly relevant as a very recent systematic review
on migrant status and mental disorders highlighted the dearth of
studies when it comes to including women who do not speak the
majority language (191).
7.6 Physical activity
We found that women who were physically active in 10-minute
bouts of MVPA in the last trimester of pregnancy experienced
lower odds for depressive symptoms at three months after birth
as compared with those who were inactive.
A prospective cohort study (192) followed healthy pregnant
women from pregnancy until six months postpartum. Women
filled in self-report questionnaires on physical activity, which
assessed how much time they spent exercising and what type(s)
of exercise they performed in each trimester. They categorized
women achieving 150 minutes/week or more as sufficient
exercisers. An EPDS score of 10 points or more and quality of
life were measured during pregnancy and at six months after
birth. In contrast to our results, there were no differences among
sufficient and insufficient exercisers during pregnancy and
regarding EPDS scores in the postpartum period. However, the
authors reported a higher quality of life in women who were
sufficient exercisers. A limitation of this study is that physical
activity level was assessed by self-report.
A cross-sectional study on physical activity in pregnancy and
depressive symptoms in a multiethnic population in the perinatal
period has demonstrated positive associations with exercise.
Using data from the ‘Born in Bradford’ cohort study (193), the
authors investigated whether living in a green space reduced
depressive symptoms or not. The study reported that physical
activity had a small but significant mediator effect, as the
positive estimate for living in a greener area on depressive
symptoms was stronger in those already physically active. This
is the only study that has focused on a multiethnic population, as
we did.
The lack of prospective studies on physical activity in pregnancy
and its association with depressive symptoms after birth, using
reliable measures of both physical activity and depression in a

diverse ethnic minority population, makes our study highly
relevant. To the best of our knowledge, our study is the first one
covering this topic.
Previous intervention studies
A recent systematic review (194) included 26 RCTs, seven non-
randomized intervention studies, 10 cohort studies, six cross-
sectional studies and three case control studies. Notably, none of
these studies included multiethnic populations. This review
concluded that exercise in pregnancy did not reduce the odds of
depression or depressive symptoms after birth. However, the
results in the various studies were inconsistent and many of the
single studies in this review suggested that exercise was
associated with a reduction in depressive symptoms after birth.
Many of the included studies also had methodological
limitations. In some of the trials, there were baseline differences
in depression and anxiety levels between the comparison groups.
Some of the trials included women already using
antidepressants, and this could have influenced the results. Some
studies combined exercise and other interventions like education
classes on diet or smoking cessation in addition to exercise
intervention.
After the studies for this review were assembled, two RCTs not
included in the systematic review mentioned above were found
to have demonstrated that exercise in pregnancy might reduce
the prevalence or the risk of depression in the postpartum period.
In one study, 129 pregnant women were randomly assigned to an
exercise and control group (195). The exercise group had a one-
hour exercise session three times a week in an aquatic
environment during gestational week 20 to 37. The control group

received treatment as usual. Symptoms of depression at six
weeks postpartum were measured with the EPDS. The mean
scores on EDPS and the number of cases with an EPDS score of
10 points or more were significantly lower in the exercise group
(P < 0.001). This study also had a large enough sample
according to their power calculation and equal numbers of
women in the exercise and control groups with no baseline
differences and with very few dropouts. In the other RCT (196),
124 women at less than 16 weeks of gestation participated in 60-
minute exercise sessions three times a week throughout their
pregnancies. The authors found that the prevalence of depression
in late pregnancy and the postpartum period was significantly
lower in the exercise group as compared with in the control
group. In this latter RCT, it was, however, a limitation that there
was not an equal number of women in the exercise and control
groups and also there was a difference in dropouts between these
two groups. None of these studies had multiethnic populations.
These most recent studies with a higher methodological quality
indicate that exercise during pregnancy may have a preventive
effect on depression level after birth, but more high-quality
studies are still needed. Studies addressing multiethnic
populations are especially warranted.
8 Conclusions
1. The prevalence of depressive symptoms in pregnancy and the
postpartum period was more than doubled in ethnic
minorities as compared with in Western European women.
2. Independent risk factors for depressive symptoms in
pregnancy were adverse life events, a history of depression,

poor self-reported health, and lower level of socioeconomic
position and either ethnic minority origin or a low level of
social integration,.
3. Independent risk factors for postpartum depressive symptoms
included depressive symptoms in the index pregnancy,
adverse life events, lack of social support, a history of
depression, a low level of socioeconomic position and either
ethnicity or a low level of social integration
4. Western European were more likely to have a continuation of
depressive symptoms from pregnancy to the postpartum
period, whereas ethnic minorities were more likely to have a
new onset of depressive symptoms after birth.
5. Women who met the physical activity recommendation in
pregnancy ( 150 min/week of moderate- to vigorous-
intensity physical activity) had a lower risk of postpartum
depressive symptoms versus inactive women.
6. The association between being physically active for 150
minutes/week or more while performing moderate- to
vigorous-intensity activity during pregnancy was strong and
significant even when adjusted for sedentary time, self-
reported pelvic girdle syndrome in gestational week 28,
adverse life events, and depressive symptoms in the index
pregnancy. This risk reduction was also seen in a subgroup of
ethnic minorities.
7. Ethnic minorities were less likely to meet the physical
activity recommendation ( 150 min/week) and were less
active as compared with Western European women.

9 Implications
9.1 Implications for health care personnel
Migrants and ethnic minorities are becoming a substantial part of
the populations of Western countries. Prevention, identification,
and management of depressive symptoms in the perinatal period
in these populations in the primary care setting is an important
issue. Health care personnel should be aware of the excess
burden of depressive symptoms among those who are inactive
during pregnancy and among ethnic minorities in general.
Pregnant women often do not meet the recommendation of
physical activity in pregnancy (197), and a higher priority should
be placed on both education and the promotion of physical
activity during pregnancy (108). Qualitative interviews have
shown that pregnant women see it as a positive experience to be
advised about physical activity and be pushed to adopt healthy
and active lifestyles (198). Therefore, health care professionals
should advise pregnant women about physical activity and this
conversation should be held early on in the first trimester.
For all women, an emphasis on improving health behaviours
including physical activity is important at the critical times of
pregnancy and the postpartum period, when women are typically
interacting regularly with the health care system. Health care
personnel should encourage pregnant women to incorporate
physical activity of a moderate to vigorous intensity into their
daily life. Providing support for healthy lifestyles for pregnant
and postpartum women and incorporating knowledge and skills
through prenatal care may promote mental health in minority
women.

There is also heterogeneity within ethnic groups. Health care
providers should not have a stereotypic view about postpartum
women based on ethnicity but rather should explore the cultural
aspects of the patient beyond ethnicity.
9.2 Implications for public health
Our results indicate that it might be possible to reduce the excess
risk of depressive symptoms observed in ethnic minority women
with better integration and socioeconomic position. An emphasis
on mental health promotion in the form of awareness, education
of health care providers and information about perinatal
depressive symptoms in different languages including help-lines
in different languages may decrease some of the health
disparities between minority and majority women, as minority
women are known to experience increased levels of stress,
anxiety, and depression.
10 Future researchAs for the course of depressive symptoms, we found that
Western Europeans are more likely to have a continuation of
depressive symptoms from pregnancy to the postpartum period,
whereas ethnic minorities are more likely to have a new onset of
depressive symptoms after birth. Future research should focus on
these different trajectories of depressive symptoms, for example,
elucidate risk factors for those who are persistently depressed,
those who have a resolved depression after birth, and those with
new-onset depression after birth. Do the different trajectories
have special characteristics?

Yet importantly, future research should explore the role of
acculturation, for example by dividing study populations into
first- and second-generation groups and by time of residence.
As for physical activity, there is a need for high-quality RCTs to
be conducted involving multiethnic samples with adequate
sample sizes, objective measures of physical activity, and
reliable measures of depression to evaluate the effects of
physical activity in pregnancy on depressive symptoms after
birth. Further, there should be an emphasis placed on the
intensity, type, and duration of exercise.
As we have seen that low level of integration is associated with
depressive symptoms, it would be interesting to carry out
intervention studies testing if any measures of integration during
pregnancy would lead to lesser depressive symptoms after birth.
Finally, studies including qualitative approaches would be useful
in order to elucidate the meaning of the identified and new risk
factors in the lives of immigrant women. For example, what do
they perceive as support and what are the reasons for why
women may be dissatisfied with their support systems or with
their marital relationships.

11 References
1. Goodman JH. Postpartum depression beyond the early postpartum period. Journal of obstetric, gynecologic, and neonatal nursing : JOGNN / NAACOG. 2004;33(4):410-20.2. Kumar R. Postnatal mental illness: a transcultural perspective. Social psychiatry and psychiatric epidemiology. 1994;29(6):250-64.3. Howard LM, Molyneaux E, Dennis CL, Rochat T, Stein A, Milgrom J. Non-psychotic mental disorders in the perinatal period. Lancet (London, England). 2014;384(9956):1775-88.4. Association AP. Diagnostic and Statistical Manual of Mental Disorders. 5th ed. Washington, DC: American Psychiatric Publishing 2013. American Psychiatric Association. 2013.5. Eberhard-Gran M, Slinning K. Nedstemthet og depresjon i forbindelse med fødsel. 2007. Nasjonalt folkehelseinstitutt. ISBN:978-82-8082-208-6.6. Loh C-C, Vostanis P. Perceived mother-infant relationship difficulties in postnatal depression. Infant and Child Development. 2004;13(2):159-71.7. Howard MM, Mehta ND, Powrie R. Peripartum depression: Early recognition improves outcomes. Cleveland Clinic journal of medicine. 2017;84(5):388-96.8. Cox J, Holden J. a guide to the Edinburgh Postnatal Depression Scale2003. Royal College of Psychiatrists. ISBN:1.901242-81-19. Hayes LJ, Goodman SH, Carlson E. Maternal antenatal depression and infant disorganized attachment at 12 months. Attachment & human development. 2013;15(2):133-53.10. Stein A, Pearson RM, Goodman SH, Rapa E, Rahman A, McCallum M, et al. Effects of perinatal mental disorders on the fetus and child. Lancet (London, England). 2014;384(9956):1800-19.11. Apter G, Devouche E, Gratier M. Perinatal mental health. The Journal of nervous and mental disease. 2011;199(8):575-7.12. Hermon N, Wainstock T, Sheiner E, Golan A, Walfisch A. Impact of maternal depression on perinatal outcomes in hospitalized women-a prospective study. Archives ofwomen's mental health. 2018. https://doi.org/10.1007/s00737-018-0883-513. Lefkovics E, Baji I, Rigo J. Impact of maternal depression on pregnancies and on early attachment. Infant mental health journal. 2014;35(4):354-65.14. Szegda K, Markenson G, Bertone-Johnson ER, Chasan-Taber L. Depression during pregnancy: a risk factor for adverse neonatal outcomes? A critical review of the literature. The journal of maternal-fetal & neonatal medicine : the official journal of the European Association of Perinatal Medicine, the Federation of Asia and Oceania Perinatal Societies, the International Society of Perinatal Obstet. 2014;27(9):960-7.15. Goedhart G, Snijders AC, Hesselink AE, van Poppel MN, Bonsel GJ, Vrijkotte TG. Maternal depressive symptoms in relation to perinatal mortality and morbidity: results from a large multiethnic cohort study. Psychosomatic medicine. 2010;72(8):769-76.16. McLearn K, Minkovitz CS, Strobino DM, Marks E, Hou W. Maternal depressive symptoms at 2 to 4 months post partum and early parenting practices. Archives of Pediatrics & Adolescent Medicine. 2006;160(3):279-84.17. Kaitz M, Maytal H. Interactions between anxious mothers and their infants: An integration of theory and research findings. Infant mental health journal. 2005;26(6):570-97.18. Malin Eberhard-Gran KS. Nedstemthet og depresjon i forbindelse med fødsel. Oslo, Norway: Nasjonalt folkehelseinstitutt; 2007. ISBN:978-82-8082-208-6.

19. Graignic-Philippe R, Dayan J, Chokron S, Jacquet AY, Tordjman S. Effects of prenatal stress on fetal and child development: a critical literature review. Neuroscience and biobehavioral reviews. 2014;43:137-62.20. Glover V. Maternal depression, anxiety and stress during pregnancy and child outcome; what needs to be done. Best practice & research Clinical obstetrics & gynaecology. 2014;28(1):25-35.21. O'Donnell KJ, Glover V, Barker ED, O'Connor TG. The persisting effect of maternal mood in pregnancy on childhood psychopathology. Development and psychopathology. 2014;26(2):393-403.22. Waters CS, Hay DF, Simmonds JR, van Goozen SH. Antenatal depression and children's developmental outcomes: potential mechanisms and treatment options. European child & adolescent psychiatry. 2014;23(10):957-71.23. Pearson RM, Evans J, Kounali D, Lewis G, Heron J, Ramchandani PG, et al. Maternal depression during pregnancy and the postnatal period: risks and possible mechanisms for offspring depression at age 18 years. JAMA psychiatry. 2013;70(12):1312-9.24. Hay DF, Pawlby S, Sharp D, Asten P, Mills A, Kumar R. Intellectual problems shown by 11-year-old children whose mothers had postnatal depression. Journal of child psychology and psychiatry, and allied disciplines. 2001;42(7):871-89.25. Hay DF, Pawlby S, Angold A, Harold GT, Sharp D. Pathways to violence in the children of mothers who were depressed postpartum. Developmental psychology. 2003;39(6):1083-94.26. Pawlby S, Sharp D, Hay D, O'Keane V. Postnatal depression and child outcome at 11 years: the importance of accurate diagnosis. J Affect Disord. 2008;107(1-3):241-5.27. Murray L, Arteche A, Fearon P, Halligan S, Goodyer I, Cooper P. Maternal postnatal depression and the development of depression in offspring up to 16 years of age. Journal of the American Academy of Child and Adolescent Psychiatry. 2011;50(5):460-70.28. Tronick E, Reck C. Infants of depressed mothers. Harvard review of psychiatry. 2009;17(2):147-56.29. Norhayati MN, Nik Hazlina NH, Asrenee AR, Wan Emilin WMA. Magnitude and risk factors for postpartum symptoms: A literature review. Journal of Affective Disorders. 2015;175:34-52.30. Beck CT. Predictors of postpartum depression: an update. Nursing research. 2001;50(5):275-85.31. Robertson E, Grace S, Wallington T, Stewart DE. Antenatal risk factors for postpartum depression: a synthesis of recent literature. Gen Hosp Psychiatry. 2004;26(4):289-95.32. Larsson C, Sydsjo G, Josefsson A. Health, sociodemographic data, and pregnancy outcome in women with antepartum depressive symptoms. Obstetrics and gynecology. 2004;104(3):459-66.33. O'Hara MW, McCabe JE. Postpartum depression: current status and future directions. Annual review of clinical psychology. 2013;9:379-407.34. Leigh B, Milgrom J. Risk factors for antenatal depression, postnatal depression and parenting stress. BMC psychiatry. 2008;8(1):24.35. Stewart DE, Gagnon A, Saucier J-F, Wahoush O, Dougherty G. Postpartum Depression Symptoms in Newcomers. The Canadian Journal of Psychiatry. 2008;53(2):121-4.36. Collins CH, Zimmerman C, Howard LM. Refugee, asylum seeker, immigrant women and postnatal depression: rates and risk factors. Archives of women's mental health. 2011;14(1):3-11.37. Dennis CL, Letourneau N. Global and relationship-specific perceptions of support and the development of postpartum depressive symptomatology. Social psychiatry and psychiatric

epidemiology. 2007;42(5):389-95.38. O'Mahony JM, Donnelly TT, Raffin Bouchal S, Este D. Barriers and facilitators of social supports for immigrant and refugee women coping with postpartum depression. ANS Advances in nursing science. 2012;35(3):E42-56.39. Dennis CL, Ross LE. Depressive symptomatology in the immediate postnatal period: identifying maternal characteristics related to true- and false-positive screening scores. Canadian journal of psychiatry Revue canadienne de psychiatrie. 2006;51(5):265-73.40. Brugha TS, Sharp HM, Cooper SA, Weisender C, Britto D, Shinkwin R, et al. The Leicester 500 Project. Social support and the development of postnatal depressive symptoms, a prospective cohort survey. Psychological medicine. 1998;28(1):63-79.41. Rosand GM, Slinning K, Eberhard-Gran M, Roysamb E, Tambs K. The buffering effect of relationship satisfaction on emotional distress in couples. BMC Public Health. 2012;12:66.42. Teng L, Robertson Blackmore E, Stewart DE. Healthcare worker's perceptions of barriers to care by immigrant women with postpartum depression: an exploratory qualitative study. Archives of women's mental health. 2007;10(3):93-101.43. Parvin A, Jones CE, Hull SA. Experiences and understandings of social and emotional distress in the postnatal period among Bangladeshi women living in Tower Hamlets. Family practice. 2004;21(3):254-60.44. Gulamani SS, Premji SS, Kanji Z, Azam SI. A review of postpartum depression, preterm birth, and culture. The Journal of perinatal & neonatal nursing. 2013;27(1):52-9; quiz 60-1.45. Pascoe EA, Smart Richman L. Perceived discrimination and health: a meta-analytic review. Psychological bulletin. 2009;135(4):531-54.46. Bhugra D, Becker MA. Migration, cultural bereavement and cultural identity. World psychiatry : official journal of the World Psychiatric Association (WPA). 2005;4(1):18-24.47. Gonidakis F, Korakakis P, Ploumpidis D, Karapavlou DA, Rogakou E, Madianos MG. The relationship between acculturation factors and symptoms of depression: a cross-sectional study with immigrants living in Athens. Transcultural psychiatry. 2011;48(4):437-54.48. Nilaweera I, Doran F, Fisher J. Prevalence, nature and determinants of postpartum mental health problems among women who have migrated from South Asian to high-income countries: a systematic review of the evidence. J Affect Disord. 2014;166:213-26.49. Fung K, Dennis CL. Postpartum depression among immigrant women. Current opinion in psychiatry. 2010;23(4):342-8.50. Chandran M, Tharyan P, Muliyil J, Abraham S. Post-partum depression in a cohort of women from a rural area of Tamil Nadu, India. Incidence and risk factors. The British journal of psychiatry : the journal of mental science. 2002;181:499-504.51. Patel V, Rodrigues M, DeSouza N. Gender, poverty and post-natal depression: a cohort study from Goa, India. Am J Psychiatry. 2002;159 (8):43-47.52. Klainin P, Arthur DG. Postpartum depression in Asian cultures: a literature review. Int J Nurs Stud. 2009;46(10):1355-73.53. Xie RH, He G, Liu A, Bradwejn J, Walker M, Wen SW. Fetal gender and postpartum depression in a cohort of Chinese women. Social science & medicine (1982). 2007;65(4):680-4.54. Husain N, Cruickshank K, Husain M, Khan S, Tomenson B, Rahman A. Social stressand depression during pregnancy and in the postnatal period in British Pakistani mothers: A cohort study. Journal of Affective Disorders. 2012;140(3):268-76.55. Wittkowski A, Patel S, Fox JR. The Experience of Postnatal Depression in Immigrant Mothers Living in Western Countries: A Meta-Synthesis. Clinical psychology & psychotherapy. 2017;24(2):411-27.

56. O'Hara M, Swain A. Rates and risk of postpartum depression-a meta-analysis. Int Rev Psychiatry. 1996;8:37-54.57. Stowe ZN, Nemeroff CB. Women at risk for postpartum-onset major depression. American journal of obstetrics and gynecology. 1995;173(2):639-45.58. Shamblaw AL, Cardy RE, Prost E, Harkness KL. Abuse as a risk factor for prenatal depressive symptoms: a meta-analysis. Archives of women's mental health. 2018; 116(21):1-15.59. Kothari CL, Liepman MR, Shama Tareen R, Florian P, Charoth RM, Haas SS, et al. Intimate Partner Violence Associated with Postpartum Depression, Regardless of Socioeconomic Status. Maternal and child health journal. 2016;20(6):1237-46.60. Turner K, Piazzini A, Franza A, Fumarola C, Chifari R, Marconi AM, et al. Postpartum depression in women with epilepsy versus women without epilepsy. Epilepsy & behavior : E&B. 2006;9(2):293-7.61. K Brett P, Office of Analysis and Epidemiology, National Center for Health Statistics; W Barfield, MD, Div of Reproductive Health, National Center for Chronic Disease Prevention and Health Promotion; C Williams, ScD, EIS Officer, CDC. . Prevalence of self-reported postpartum depressive symptoms--17 states, 2004-2005. MMWR Morbidity and mortality weekly report. 2008;57(14):361-6.62. Blom EA, Jansen PW, Verhulst FC, Hofman A, Raat H, Jaddoe VW, et al. Perinatal complications increase the risk of postpartum depression. The Generation R Study. BJOG : an international journal of obstetrics and gynaecology. 2010;117(11):1390-8.63. Tobin CL, Di Napoli P, Beck CT. Refugee and Immigrant Women's Experience of Postpartum Depression: A Meta-Synthesis. Journal of transcultural nursing : official journal of the Transcultural Nursing Society. 2017; 29(1): 84-100.64. Vigod SN, Stewart DE. Postpartum Depression. The New England journal of medicine. 2017;376(9):895. DOI: 10.1056/NEJMc161654765. Nott PN, Cutts S. Validation of the 30-item General Health Questionnaire in postpartum women. Psychological medicine. 1982;12(2):409-13.66. O'Hara MW, Rehm LP, Campbell SB. Postpartum depression. A role for social network and life stress variables. The Journal of nervous and mental disease. 1983;171(6):336-41.67. Cox JL, Holden JM, Sagovsky R. Detection of postnatal depression. Development of the 10-item Edinburgh Postnatal Depression Scale. The British journal of psychiatry : the journal of mental science. 1987;150:782-6.68. Harris B, Huckle P, Thomas R, Johns S, Fung H. The use of rating scales to identify post-natal depression. The British journal of psychiatry : the journal of mental science. 1989;154:813-7.69. Falah-Hassani K, Shiri R, Vigod S, Dennis CL. Prevalence of postpartum depression among immigrant women: A systematic review and meta-analysis. Journal of psychiatric research. 2015;70:67-82.70. Gibson J, McKenzie-McHarg K, Shakespeare J, Price J, Gray R. A systematic review of studies validating the Edinburgh Postnatal Depression Scale in antepartum and postpartum women. Acta psychiatrica Scandinavica. 2009;119(5):350-64.71. Eberhard-Gran M, Eskild A, Tambs K, Schei B, Opjordsmoen S. The Edinburgh Postnatal Depression Scale: validation in a Norwegian community sample. Nordic journal of psychiatry. 2001;55(2):113-7.72. Eberhard-Gran M, Tambs K, Opjordsmoen S, Skrondal A, Eskild A. Depression during pregnancy and after delivery: a repeated measurement study. Journal of psychosomatic obstetrics and gynaecology. 2004;25(1):15-21.73. Dorheim SK, Bjorvatn B, Eberhard-Gran M. Insomnia and depressive symptoms in

late pregnancy: a population-based study. Behavioral sleep medicine. 2012;10(3):152-66.74. Dorheim SK, Bjorvatn B, Eberhard-Gran M. Can insomnia in pregnancy predict postpartum depression? A longitudinal, population-based study. PloS one. 2014;9(4):e94674.75. Giardinelli L, Innocenti A, Benni L, Stefanini MC, Lino G, Lunardi C, et al. Depression and anxiety in perinatal period: Prevalence and risk factors in an Italian sample. Archives of women's mental health. 2012;15(1):21-30.76. Eberhard-Gran M, Eskild A, Tambs K, Opjordsmoen S, Samuelsen SO. Review of validation studies of the Edinburgh Postnatal Depression Scale. Acta psychiatrica Scandinavica. 2001;104(4):243-9.77. Marshall DJ, Bethell K. "Department of Health, Government of Western Australia. Edinburgh Poastnatal depression scale (EPDS): Translated Versions-validtaed. State Perinatal Mental Health Reference Group Perth, Western Australia: 2006.78. Berle JO, Aarre TF, Mykletun A, Dahl AA, Holsten F. Screening for postnatal depression. Validation of the Norwegian version of the Edinburgh Postnatal Depression Scale, and assessment of risk factors for postnatal depression. J Affect Disord. 2003;76(1-3):151-6.79. Veierød BM. SL, Laake P. Medical statistics in clinical and epidemiological research, book. 1st edition 2012. ISBN: 978-82-05-39959-4.80. Bhopal R. Glossary of terms relating to ethnicity and race: for reflection and debate. J Epidemiol Community Health. 2004;58(6):441-5.81. Bhopal RS. Ethnicity, Race, and Health in Multicultural Societies: Foundations for better epidemiology, public health, and health care. 2009. 1-384 p.82. Papadopoulos I. Transcultural Health and Social Care: Development of Culturally Competent Practitioners: Elsevier Health Sciences; 2006. eBook ISBN: 9780702033797 83. Eberhard-Gran M, Garthus-Niegel S, Garthus-Niegel K, Eskild A. Postnatal care: a cross-cultural and historical perspective. Archives of women's mental health. 2010;13(6):459-66.84. Eberhard-Gran M. Nyfødte barn og sårbare mødre. Tidsskrift for den Norske laegeforening : tidsskrift for praktisk medicin, ny raekke. 2018;138(20). doi: 10.4045/tidsskr.18.0878.85. Bhugra D. Cultural identities and cultural congruency: a new model for evaluating mental distress in immigrants. Acta psychiatrica Scandinavica. 2005;111(2):84-93.86. Redfield R, Linton R, Herskovits MJ. MEMORANDUM FOR THE STUDY OF ACCULTURATION. American Anthropologist. 1936;38(1):149-52.87. Unlu Ince B, Fassaert T, de Wit MA, Cuijpers P, Smit J, Ruwaard J, et al. The relationship between acculturation strategies and depressive and anxiety disorders in Turkish migrants in the Netherlands. BMC psychiatry. 2014;14:252.88. Chen SX, Benet-Martinez V, Harris Bond M. Bicultural identity, bilingualism, and psychological adjustment in multicultural societies: immigration-based and globalization-based acculturation. Journal of personality. 2008;76(4):803-38.89. Gupta A, Leong F, Valentine JC, Canada DD. A meta-analytic study: the relationship between acculturation and depression among Asian Americans. The American journal of orthopsychiatry. 2013;83(2 Pt 3):372-85.90. Clarke K, Saville N, Bhandari B, Giri K, Ghising M, Jha M, et al. Understanding psychological distress among mothers in rural Nepal: a qualitative grounded theory exploration. BMC psychiatry. 2014;14(1):60.91. Dennis CL, Dowswell T. Psychosocial and psychological interventions for preventing postpartum depression. Cochrane database of systematic reviews. 2013(2):Cd001134.92. Abujilban SK, Abuidhail J, Al-Modallal H, Hamaideh S, Mosemli O. Predictors of antenatal depression among Jordanian pregnant women in their third trimester. Health care for women international. 2014;35(2):200-15.

93. Mohammad KI, Gamble J, Creedy DK. Prevalence and factors associated with the development of antenatal and postnatal depression among Jordanian women. Midwifery. 2011;27(6):e238-45.94. Husain N, Parveen A, Husain M, Saeed Q, Jafri F, Rahman R, et al. Prevalence and psychosocial correlates of perinatal depression: a cohort study from urban Pakistan. Archives of women's mental health. 2011;14(5):395-403.95. Golbasi Z, Kelleci M, Kisacik G, Cetin A. Prevalence and correlates of depression in pregnancy among Turkish women. Maternal and child health journal. 2010;14(4):485-91.96. Savarimuthu RJ, Ezhilarasu P, Charles H, Antonisamy B, Kurian S, Jacob KS. Post-partum depression in the community: a qualitative study from rural South India. The International journal of social psychiatry. 2010;56(1):94-102.97. Gümüfl AB, Keskin G, Alp N, Özyar S, Karsak A. The prevalence of postpartum depression and associated variables. Yeni Symposium. 2012;50(3):145-54.98. Bennett HA, Einarson A, Taddio A, Koren G, Einarson TR. Prevalence of depression during pregnancy: systematic review. Obstetrics and gynecology. 2004;103(4):698-709.99. Lupattelli A, Twigg MJ, Zagorodnikova K, Moretti ME, Drozd M, Panchaud A, et al. Self-reported perinatal depressive symptoms and postnatal symptom severity after treatment with antidepressants in pregnancy: a cross-sectional study across 12 European countries using the Edinburgh Postnatal Depression Scale. Clinical epidemiology. 2018;10:655-69.100. Rubertsson C, Wickberg B, Gustavsson P, Radestad I. Depressive symptoms in early pregnancy, two months and one year postpartum-prevalence and psychosocial risk factors in a national Swedish sample. Archives of women's mental health. 2005;8(2):97-104.101. Zelkowitz P, Saucier JF, Wang T, Katofsky L, Valenzuela M, Westreich R. Stability and change in depressive symptoms from pregnancy to two months postpartum in childbearing immigrant women. Archives of women's mental health. 2008;11(1):1-11.102. Rubertsson C, Waldenström U, Wickberg B. Depressive mood in early pregnancy: Prevalence and women at risk in a national Swedish sample. Journal of Reproductive and Infant Psychology. 2003;21(2):113-23.103. Miszkurka M, Goulet L, Zunzunegui MV. Contributions of immigration to depressive symptoms among pregnant women in Canada. Canadian journal of public health = Revue canadienne de sante publique. 2010;101(5):358-64.104. Zelkowitz P, Schinazi J, Katofsky L, Saucier JF, Valenzuela M, Westreich R, et al. Factors associated with depression in pregnant immigrant women. Transcultural psychiatry. 2004;41(4):445-64.105. Haga SM, Ulleberg P, Slinning K, Kraft P, Steen TB, Staff A. A longitudinal study of postpartum depressive symptoms: multilevel growth curve analyses of emotion regulation strategies, breastfeeding self-efficacy, and social support. Archives of women's mental health. 2012;15(3):175-84.106. Bjerke SE, Vangen S, Nordhagen R, Ytterdahl T, Magnus P, Stray-Pedersen B. Postpartum depression among Pakistani women in Norway: prevalence and risk factors. The journal of maternal-fetal & neonatal medicine : the official journal of the European Association of Perinatal Medicine, the Federation of Asia and Oceania Perinatal Societies, the International Society of Perinatal Obstet. 2008;21(12):889-94.107. Lovlie AL, Madar AA. Postpartum Depression Among Somali Women in Norway. Journal of immigrant and minority health / Center for Minority Public Health. 2017;19(3):638-44.108. Evenson KR, Barakat R, Brown WJ, Dargent-Molina P, Haruna M, Mikkelsen EM, et al. Guidelines for Physical Activity during Pregnancy: Comparisons From Around the World. American journal of lifestyle medicine. 2014;8(2):102-21.109. Mammen G, Faulkner G. Physical activity and the prevention of depression: a

systematic review of prospective studies. American journal of preventive medicine. 2013;45(5):649-57.110. Cooney GM, Dwan K, Greig CA, Lawlor DA, Rimer J, Waugh FR, et al. Exercise for depression. Cochrane Database of Systematic Reviews. 2013(9):CD004366.111. Claesson IM, Klein S, Sydsjo G, Josefsson A. Physical activity and psychological well-being in obese pregnant and postpartum women attending a weight-gain restriction programme. Midwifery. 2014;30(1):11-6.112. Teychenne M, York R. Physical activity, sedentary behavior, and postnatal depressive symptoms: a review. American journal of preventive medicine. 2013;45(2):217-27.113. Demissie Z, Siega-Riz AM, Evenson KR, Herring AH, Dole N, Gaynes BN. Physical activity during pregnancy and postpartum depressive symptoms. Midwifery. 2013;29(2):139-47.114. Ersek JL, Brunner Huber LR. Physical activity prior to and during pregnancy and risk of postpartum depressive symptoms. Journal of obstetric, gynecologic, and neonatal nursing : JOGNN / NAACOG. 2009;38(5):556-66.115. Daley AJ, Foster L, Long G, Palmer C, Robinson O, Walmsley H, et al. The effectiveness of exercise for the prevention and treatment of antenatal depression: systematic review with meta-analysis. BJOG : an international journal of obstetrics and gynaecology. 2015;122(1):57-62.116. Ko YL, Yang CL, Fang CL, Lee MY, Lin PC. Community-based postpartum exercise program. Journal of clinical nursing. 2013;22(15-16):2122-31.117. Strom M, Mortensen EL, Halldorson TI, Osterdal ML, Olsen SF. Leisure-time physical activity in pregnancy and risk of postpartum depression: a prospective study in alarge national birth cohort. The Journal of clinical psychiatry. 2009;70(12):1707-14.118. Pritchett RV, Daley AJ, Jolly K. Does aerobic exercise reduce postpartum depressive symptoms? a systematic review and meta-analysis. The British journal of general practice : the journal of the Royal College of General Practitioners. 2017;67(663):e684-e91.119. Harrison CL, Brown WJ, Hayman M, Moran LJ, Redman LM. The Role of Physical Activity in Preconception, Pregnancy and Postpartum Health. Seminars in reproductive medicine. 2016;34(2):e28-37.120. Poyatos-Leon R, Garcia-Hermoso A, Sanabria-Martinez G, Alvarez-Bueno C, Cavero-Redondo I, Martinez-Vizcaino V. Effects of exercise-based interventions on postpartum depression: A meta-analysis of randomized controlled trials. Birth. 2017;44(3):200-8.121. Mohammadi F, Malakooti J, Babapoor J, Mohammad-Alizadeh-Charandabi S. The effect of a home-based exercise intervention on postnatal depression and fatigue: A randomized controlled trial. International journal of nursing practice. 2015;21(5):478-85.122. Huang TT, Yeh CY, Tsai YC. A diet and physical activity intervention for preventing weight retention among Taiwanese childbearing women: a randomised controlled trial. Midwifery. 2011;27(2):257-64.123. Buttner MM, Brock RL, O'Hara MW, Stuart S. Efficacy of yoga for depressed postpartum women: A randomized controlled trial. Complementary therapies in clinical practice. 2015;21(2):94-100.124. Lewis BA, Gjerdingen DK, Avery MD, Sirard JR, Guo H, Schuver K, et al. A randomized trial examining a physical activity intervention for the prevention of postpartum depression: The healthy mom trial. Mental Health and Physical Activity. 2014;7(1):42-9.125. Chen C, Nakagawa S, Kitaichi Y, An Y, Omiya Y, Song N, et al. The role of medial prefrontal corticosterone and dopamine in the antidepressant-like effect of exercise. Psychoneuroendocrinology. 2016;69:1-9.126. Ernst C, Olson AK, Pinel JP, Lam RW, Christie BR. Antidepressant effects of exercise: evidence for an adult-neurogenesis hypothesis? Journal of psychiatry &
neuroscience : JPN. 2006;31(2):84-92.127. Daley AJ, Macarthur C, Winter H. The role of exercise in treating postpartum depression: a review of the literature. Journal of midwifery & women's health. 2007;52(1):56-62.128. Rauff EL, Downs DS. Mediating effects of body image satisfaction on exercise behavior, depressive symptoms, and gestational weight gain in pregnancy. Annals of behavioral medicine : a publication of the Society of Behavioral Medicine. 2011;42(3):381-90.129. Schiller D. Running to Forget. The international journal of neuropsychopharmacology. 2016;19(6) https://doi.org/10.1093/ijnp/pyw017130. Dennis CL, Dowswell T. Interventions (other than pharmacological, psychosocial or psychological) for treating antenatal depression. Cochrane Database of Systematic Reviews. 2013(7) CD006795.131. Molyneaux E, Howard LM, McGeown HR, Karia AM, Trevillion K. Antidepressant treatment for postnatal depression. Cochrane Database of Systematic Reviews. 2014(9)CD002018.132. Battle CL, Salisbury AL, Schofield CA, Ortiz-Hernandez S. Perinatal antidepressant use: understanding women's preferences and concerns. Journal of psychiatric practice. 2013;19(6):443-53.133. Dennis CL, Hodnett E. Psychosocial and psychological interventions for treating postpartum depression. Cochrane database of systematic reviews. 2007(4):Cd006116.134. NICE. National Institute for Health and Care Excellence. Antenatal and postnatal mental health: clinical management and service guidance. (Clinical Guideline 45.) 2007. London. Access: december 2018. Available from: www.nice.org.uk/nicemedia/live/11004/30433/30433.pdf135. Wilson J, Junger G. Principles and practice of screening for disease. Geneve:. World Health Organization. 1968.136. Eberhard-Gran M, Slinning K, Rognerud M. Screening for postnatal depression--asummary of current knowledge. Tidsskrift for den Norske laegeforening :2014;134(3):297-301.137. The Norwegian Directorate of Health. Anetnatal care. Access:december 2018.Available from: https://helsedirektoratet.no/retningslinjer/svangerskapsomsorgen138. Sletner L, Nakstad B, Yajnik CS, Morkrid K, Vangen S, Vardal MH, et al. Ethnic differences in neonatal body composition in a multi-ethnic population and the impact of parental factors: a population-based cohort study. PloS one. 2013;8(8):e73058.139. Mottola MF, Davenport MH, Ruchat SM, Davies GA, Poitras VJ, Gray CE, et al. 2019 Canadian guideline for physical activity throughout pregnancy. British journal of sports medicine. 2018;52(21):1339-46.140. Davenport MH, Meah VL, Ruchat SM, Davies GA, Skow RJ, Barrowman N, et al. Impact of prenatal exercise on neonatal and childhood outcomes: a systematic review and meta-analysis. British journal of sports medicine. 2018;52(21):1386-96.141. IMDi. The Directorate of Integration and Diversity, IMDi. accessed november 2018https://www.imdi.no/om-integrering-i-norge/innvandrere-og-integrering/innvandrerbefolkningen-i-norge/142. SSB. Statistics Norway November. Accessed 2018. Available fromhttps://www.ssb.no/befolkning143. Jenum AK, Sletner L, Voldner N, Vangen S, Morkrid K, Andersen LF, et al. The STORK Groruddalen research programme: A population-based cohort study of gestational diabetes, physical activity, and obesity in pregnancy in a multiethnic population. Rationale, methods, study population, and participation rates. Scandinavian journal of public health.

2010;38(5 Suppl):60-70.144. Thornton JS, Fremont P, Khan K, Poirier P, Fowles J, Wells GD, et al. Physical activity prescription: a critical opportunity to address a modifiable risk factor for the prevention and management of chronic disease: a position statement by the Canadian Academy of Sport and Exercise Medicine. British journal of sports medicine.2016;50(18):1109-14.145. Mosdøl A DE, Straumann GH. Tidlig samtale om sunne levevaner for gravide. Forskningsoversikt Folkehelseinstituttet 6/2016. 2016.Accessed nov 2018. Available from: https://www.fhi.no/publ/2016/tidlig-samtale-om-sunne-levevaner-for146. Kozinszky Z, Dudas RB. Validation studies of the Edinburgh Postnatal Depression Scale for the antenatal period. J Affect Disord. 2015;176:95-105.147. Berntsen S, Stafne SN, Morkved S. Physical activity monitor for recording energy expenditure in pregnancy. Acta obstetricia et gynecologica Scandinavica. 2011;90(8):903-7.148. Herrmann SD, Barreira TV, Kang M, Ainsworth BE. Impact of accelerometer wear time on physical activity data: a NHANES semisimulation data approach. British journal of sports medicine. 2014;48(3):278-82.149. Kendler KS, Neale MC, Kessler RC, Heath AC, Eaves LJ. The lifetime history of major depression in women. Reliability of diagnosis and heritability. Archives of general psychiatry. 1993;50(11):863-70.150. Bjelland EK, Eskild A, Johansen R, Eberhard-Gran M. Pelvic girdle pain in pregnancy: the impact of parity. American journal of obstetrics and gynecology. 2010;203(2):146.e1-6.151. Sletner L, Jenum AK, Morkrid K, Vangen S, Holme IM, Birkeland KI, et al. Maternal life course socio-economic position and offspring body composition at birth in a multi-ethnic population. Paediatric and perinatal epidemiology. 2014;28(5):445-54.152. Shrier I, Platt RW. Reducing bias through directed acyclic graphs. BMC medical research methodology. 2008;8:70.153. Smith GD. Learning to live with complexity: ethnicity, socioeconomic position, and health in Britain and the United States. American journal of public health. 2000;90(11):1694-8.154. Sterne JA, White IR, Carlin JB, Spratt M, Royston P, Kenward MG, et al. Multiple imputation for missing data in epidemiological and clinical research: potential and pitfalls. BMJ (Clinical research ed). 2009;338:b2393.155. Sterne JAC, White IR, Carlin JB, Spratt M, Royston P, Kenward MG, et al. Multiple imputation for missing data in epidemiological and clinical research: potential and pitfalls. BMJ (Clinical research ed). 2009;338.156. Aalen, Odd O.; Frigessi, Arnoldo; Moger, Tron Anders; Scheel, Ida; Skovlund, Eva & Veierød, Marit Bragelien (2006). Statistiske metoder i medisin og helsefag. Gyldendal Akademisk. ISBN 978-82-05-34685-7. 335 s.157. Aydin N, Inandi T, Yigit A, Hodoglugil NN. Validation of the Turkish version of the Edinburgh Postnatal Depression Scale among women within their first postpartum year. Social psychiatry and psychiatric epidemiology. 2004;39(6):483-6.158. Benjamin D CA, Annie IK, Prasad J, Jacob KS. Validation of the tamil version of Edinburgh post-partum depression scale. the journal of obstetrics and gynecology of India. 2005;55(may/june 2005):242-3.159. McGee DL, Liao Y, Cao G, Cooper RS. Self-reported health status and mortality in a multiethnic US cohort. American journal of epidemiology. 1999;149(1):41-6.160. Kumar B, N. The Oslo Immigrant Health Profile. Oslo: Norwegian Institute of Public Health; 2008. 2008:contract No.: 7.

161. Smith KM, Lanningham-Foster LM, Welk GJ, Campbell CG. Validity of the SenseWear(R) Armband to predict energy expenditure in pregnant women. Medicine and science in sports and exercise. 2012;44(10):2001-8.162. Brazeau AS, Beaudoin N, Belisle V, Messier V, Karelis AD, Rabasa-Lhoret R. Validation and reliability of two activity monitors for energy expenditure assessment. Journal of science and medicine in sport. 2016;19(1):46-50.163. Abdelnoor M, Sandsveen I. etiologisk versus statistisk strategi i klinisk epidemiologisk forskning. Norsk Epidemiologi. 2006;16(2):77-80.164. Iversen BG, Hofmann B, Aavitsland P. Questions on causality and responsibility arising from an outbreak of Pseudomonas aeruginosa infections in Norway. Emerging Themes in Epidemiology. 2008;5(1):1-12.165. Stensrud MJ, Aalen O. Hva kan vi si om kausalitet. Tidsskr Nor Legeforen. 2015; 135: 1465-7.166. Hernan MA, Hernandez-Diaz S, Werler MM, Mitchell AA. Causal knowledge as a prerequisite for confounding evaluation: an application to birth defects epidemiology. American journal of epidemiology. 2002;155(2):176-84.167. Rahman A, Iqbal Z, Harrington R. Life events, social support and depression in childbirth: perspectives from a rural community in the developing world. Psychological medicine. 2003;33.168. Redshaw M, Henderson J. From antenatal to postnatal depression: associated factors and mitigating influences. Journal of women's health (2002). 2013;22(6):518-25.169. Verreault N, Da Costa D, Marchand A, Ireland K, Dritsa M, Khalife S. Rates and risk factors associated with depressive symptoms during pregnancy and with postpartum onset. Journal of psychosomatic obstetrics and gynaecology. 2014;35(3):84-91.170. Sidebottom AC, Hellerstedt WL, Harrison PA, Hennrikus D. An examination of prenatal and postpartum depressive symptoms among women served by urban community health centers. Archives of women's mental health. 2014;17(1):27-40.171. Wangel AM, Schei B, Ryding EL, Ostman M. Mental health status in pregnancy among native and non-native Swedish-speaking women: a Bidens study. Acta obstetricia et gynecologica Scandinavica. 2012;91(12):1395-401.172. Peer M, Soares CN, Levitan RD, Streiner DL, Steiner M. Antenatal depression in a multi-ethnic, community sample of Canadian immigrants: psychosocial correlates and hypothalamic-pituitary-adrenal axis function. Canadian journal of psychiatry Revue canadienne de psychiatrie. 2013;58(10):579-87.173. Almeida LM, Caldas J, Ayres-de-Campos D, Salcedo-Barrientos D, Dias S. Maternal healthcare in migrants: a systematic review. Maternal and child health journal. 2013;17(8):1346-54.174. Mukherjee S, Fennie K, Coxe S, Madhivanan P, Trepka MJ. Racial and ethnic differences in the relationship between antenatal stressful life events and postpartum depression among women in the United States: does provider communication on perinatal depression minimize the risk? Ethnicity & health. 2018;23(5):542-65.175. Fellmeth G, Fazel M, Plugge E. Migration and perinatal mental health in women from low- and middle-income countries: a systematic review and meta-analysis. BJOG : an international journal of obstetrics and gynaecology. 2017;124(5):742-52.176. Lancaster CA, Gold KJ, Flynn HA, Yoo H, Marcus SM, Davis MM. Risk factors for depressive symptoms during pregnancy: a systematic review. American journal of obstetrics and gynecology. 2010;202(1):5-14.177. Rich-Edwards JW, Kleinman K, Abrams A, Harlow BL, McLaughlin TJ, Joffe H, et al. Sociodemographic predictors of antenatal and postpartum depressive symptoms among women in a medical group practice. J Epidemiol Community Health. 2006;60(3):221-7.

178. Leigh B, Milgrom J. Risk factors for antenatal depression, postnatal depression and parenting stress. BMC psychiatry. 2008;8:24.179. Shah SMA, Bowen A, Afridi I, Nowshad G, Muhajarine N. Prevalence of antenatal depression: Comparison between Pakistani and Canadian women. Journal of the Pakistan Medical Association. 2011;61(3):242-6.180. Prady SL, Pickett KE, Petherick ES, Gilbody S, Croudace T, Mason D, et al. Evaluation of ethnic disparities in detection of depression and anxiety in primary care during the maternal period: combined analysis of routine and cohort data. The British journal of psychiatry : the journal of mental science. 2016;208(5):453-61.181. Brundtland GH. From the World Health Organization. Mental health: new understanding, new hope. Jama. 2001;286(19):2391.182. Shen JJ, Lin F, Jackson T. Risk of prenatal depression: Differences by race. Ethnicity and Disease. 2010;20(1):35-9.183. Canady RB, Bullen BL, Holzman C, Broman C, Tian Y. Discrimination and Symptoms of Depression in Pregnancy Among African American and White Women. Women's Health Issues. 2008;18(4):292-300.184. Goebert D, Morland L, Frattarelli L, Onoye J, Matsu C. Mental health during pregnancy: A study comparing Asian, caucasian and native Hawaiian women. Maternal and child health journal. 2007;11(3):249-55.185. Gavin AR, Melville JL, Rue T, Guo Y, Dina KT, Katon WJ. Racial differences in the prevalence of antenatal depression. Gen Hosp Psychiatry. 2011;33(2):87-93.186. Silverman ME, Reichenberg A, Savitz DA, Cnattingius S, Lichtenstein P, Hultman CM, et al. The risk factors for postpartum depression: A population-based study. Depression and anxiety. 2017;34(2):178-87.187. Lanes A, Kuk JL, Tamim H. Prevalence and characteristics of postpartum depression symptomatology among Canadian women: a cross-sectional study. BMC Public Health. 2011;11:302.188. Vigod SN, Bagadia AJ, Hussain-Shamsy N, Fung K, Sultana A, Dennis CE. Postpartum mental health of immigrant mothers by region of origin, time since immigration, and refugee status: a population-based study. Archives of women's mental health. 2017;20(3):439-47.189. Ganann R, Sword W, Thabane L, Newbold B, Black M. Predictors of Postpartum Depression Among Immigrant Women in the Year After Childbirth. Journal of women's health (2002). 2016;25(2):155-65.190. Pao C, Guintivano J, Santos H, Meltzer-Brody S. Postpartum depression and social support in a racially and ethnically diverse population of women. Archives of women's mental health. 2018.https://doi.org/10.1007/s00737-018-0882-6191. Anderson FM, Hatch SL, Comacchio C, Howard LM. Prevalence and risk of mental disorders in the perinatal period among migrant women: a systematic review and meta-analysis. Archives of women's mental health. 2017;20(3):449-62.192. Campolong K, Jenkins S, Clark MM, Borowski K, Nelson N, Moore KM, et al. The association of exercise during pregnancy with trimester-specific and postpartum quality of life and depressive symptoms in a cohort of healthy pregnant women. Archives of women's mental health. 2018;21(2):215-24.193. McEachan RR, Prady SL, Smith G, Fairley L, Cabieses B, Gidlow C, et al. The association between green space and depressive symptoms in pregnant women: moderating roles of socioeconomic status and physical activity. J Epidemiol Community Health. 2016;70(3):253-9.194. Davenport MH, McCurdy AP, Mottola MF, Skow RJ, Meah VL, Poitras VJ, et al.

Impact of prenatal exercise on both prenatal and postnatal anxiety and depressive symptoms: a systematic review and meta-analysis. British journal of sports medicine. 2018;52(21):1376-85.195. Aguilar-Cordero MJ, Sanchez-Garcia JC, Rodriguez-Blanque R, Sanchez-Lopez AM, Mur-Villar N. Moderate Physical Activity in an Aquatic Environment During Pregnancy (SWEP Study) and Its Influence in Preventing Postpartum Depression. Journal of the American Psychiatric Nurses Association. 2018:https://doi.org/10.1177/1078390317753675196. Vargas-Terrones M, Barakat R, Santacruz B, Fernandez-Buhigas I, Mottola MF. Physical exercise programme during pregnancy decreases perinatal depression risk: a randomised controlled trial. British journal of sports medicine. Published Online First: 13June 2018. doi: 10.1136/bjsports-2017-098926.197. Richardsen KR, Falk RS, Jenum AK, Morkrid K, Martinsen EW, Ommundsen Y, et al. Predicting who fails to meet the physical activity guideline in pregnancy: a prospective study of objectively recorded physical activity in a population-based multi-ethnic cohort. BMC pregnancy and childbirth. 2016;16(1):186.198. Vedøy G LT. Tidlig samtale om alkohol og levevaner - FRIDA. 2014. Accessed nov 2018. Available from: https://helsedirektoratet.no/Lists/Publikasjoner/Attachments/632/Tidlig-samtale-om-alkohol-og-levevaner-IS-2065.pdf


12 Appendix


Flow chart of 1918 pregnant women attending the Child Health Clinic for antenatal care in Groruddalen (May 2008 – May 2010).
The STORK Groruddalen research programme: A population-based cohort study of gestational diabetes, physical activity, and obesity in
pregnancy in a multiethnic population. Rationale, methods, study population, and participation rates (reference 160).

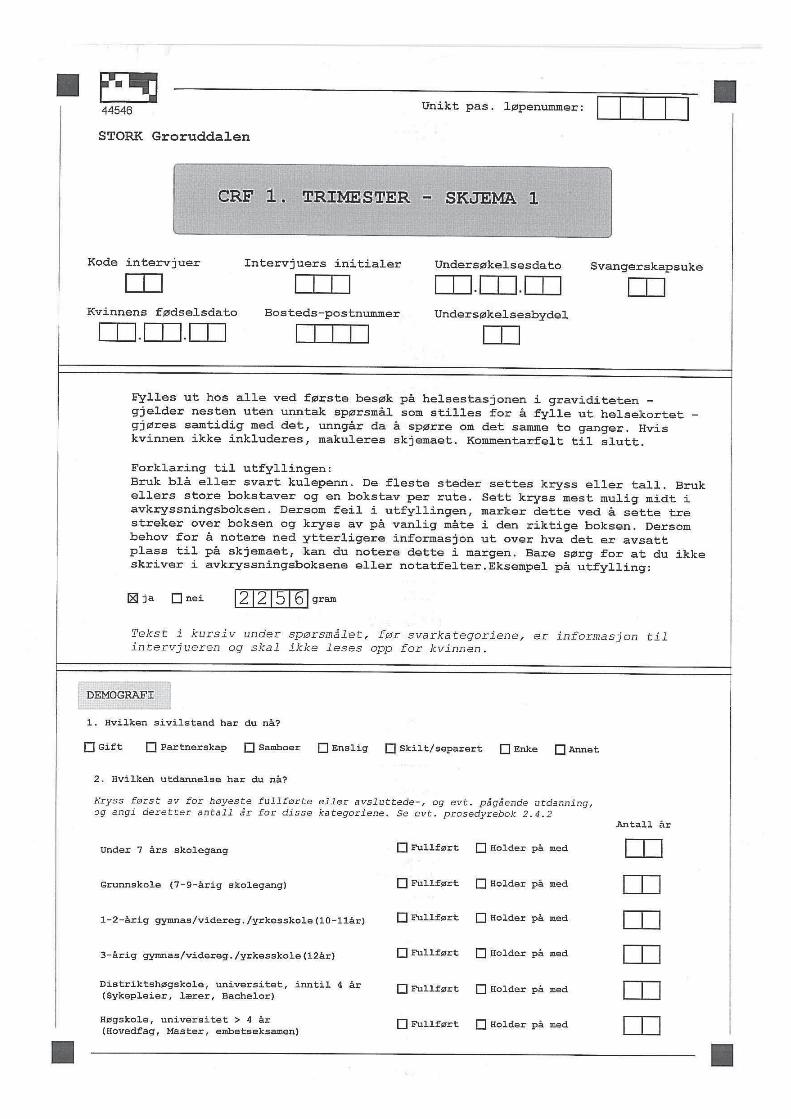
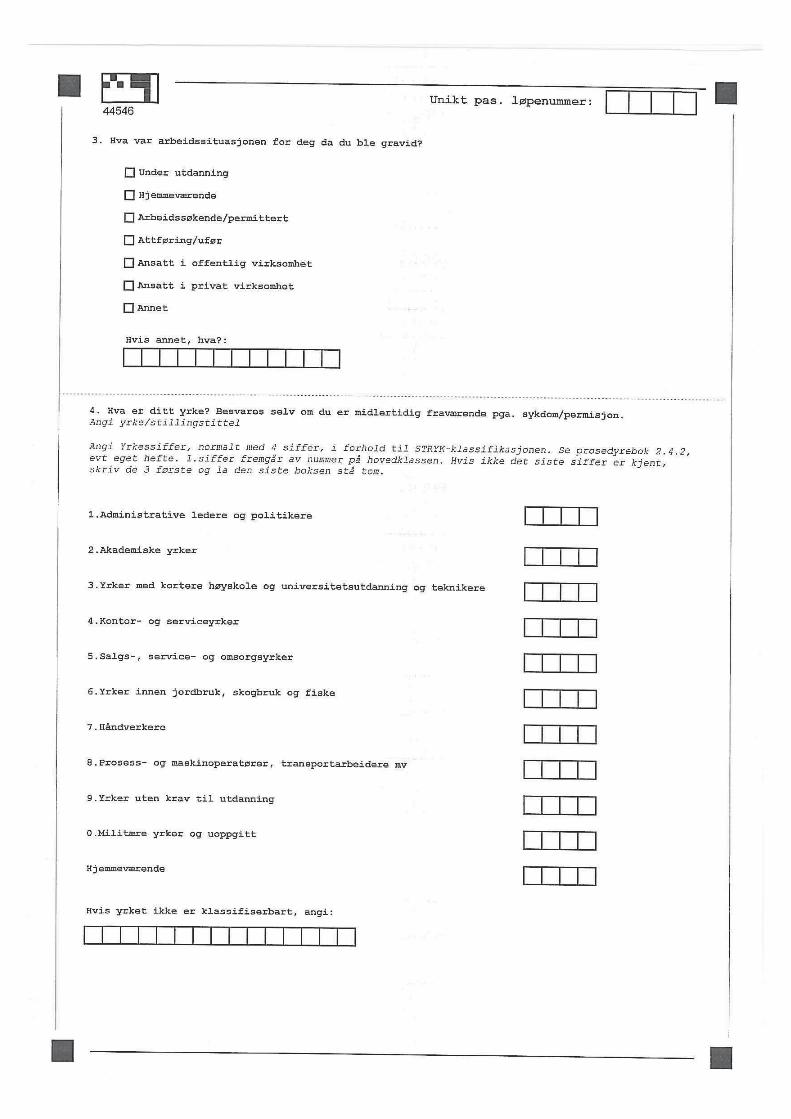

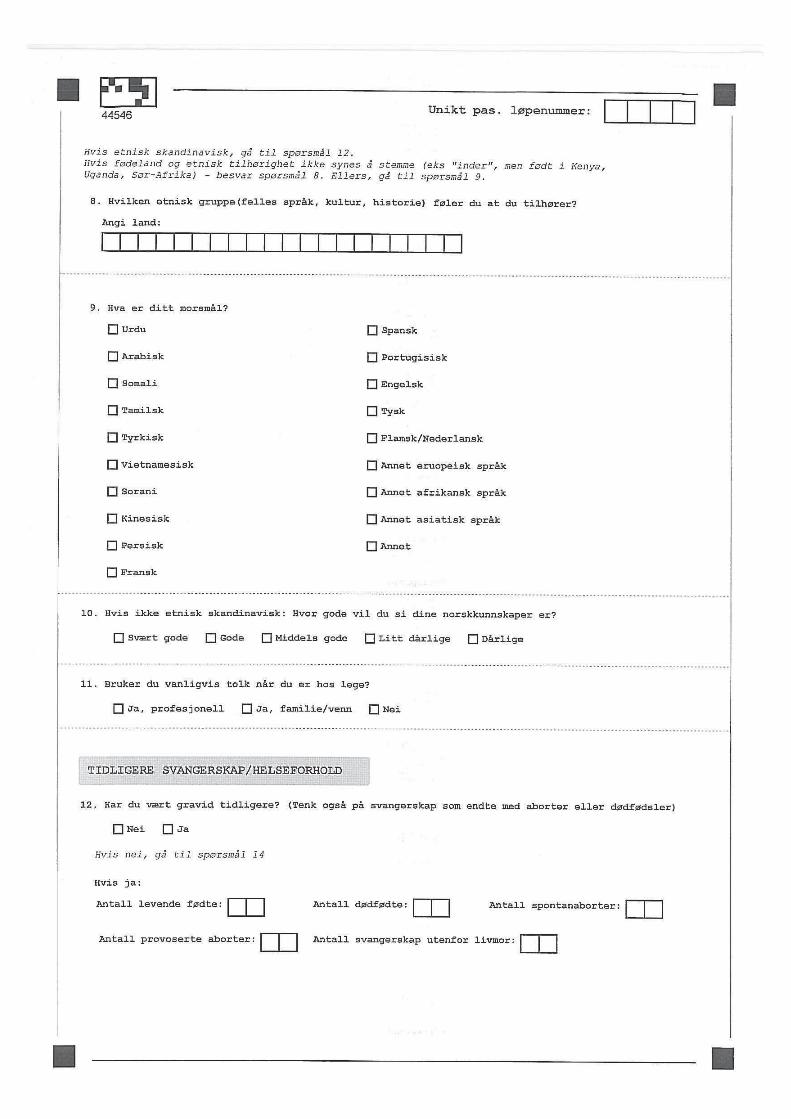


STORK Groruddalen
CRF 2 - UKE 28
Unikt pas. løpenummer:
Forklaring til utfyllingen:Bruk blå eller svart kulepenn. De fleste steder settes kryss eller tall. Brukellers store bokstaver og en bokstav per rute. Sett kryss mest mulig midt iavkrysningsboksen. Dersom feil i utfyllingen, marker dette ved å sette trestreker over boksen og kryss av på vanlig måte i den riktige boksen. Dersombehov for å notere ned ytterligere informasjon ut over hva det er avsattplass til på skjemaet, kan du notere dette i margen. Bare sørg for at du ikkeskriver i avkrysningsboksene eller notatfelter.Eksempel på utfylling:
Tekst i kursiv under spørsmålet, før svarkategoriene, er informasjon tilintervjueren og skal ikke leses opp for kvinnen.
gram2 2 5 6ja nei
Kode intervjuer
Bosteds-postnummer
Undersøkelsesdato. .
Intervjuers initialer Svangerskapsuke
UndersøkelsesbydelKvinnens fødselsdato. .
1. Hvilken sivilstand har du nå?Gift Partnerskap Samboer Enslig Skilt/separert Enke Annet
2. Termin basert på ultralyd:Dato: . . Sikker Usikker
3. Hvis i lønnet arbeid - er du fraværende fra ditt vanlige arbeid nå?Ja Nei Delvis
4. Hvis svart ja eller delvis på spørsmål 3: Hva er årsaken til fraværet? Sett evt. flere kryss:Sykemelding Permisjon Sykt barn Annet
5. Hvis i lønnet arbeid - har du vært sykemeldt i tilsammen mer enn 2 uker i løpet av dettesvangerskapet? Se evt. prosedyrebok 2.4.2
Hvis ja, angi ca antall uker: Hvis ja, angi ca antall uker:Helt sykemeldt: Delvis sykemeldt:
6. Hvordan er helsen din nå?Dårlig Ikke helt god God Svært god
Nei En del plaget Sterkt plagetI korsryggen uten utstråling til bein(a)
I korsryggen med utstråling til bein(a)
7.Har du i de siste 3 måneder hatt smerter i noen av de følgende kroppsdeler?Intervjuer ber kvinnen peke på aktuelt sted på egen kropp. Sett kryss for aktuell lokalisasjon.Du kan sette flere kryss. se evt. prosedyrebok 2.4.2
Nei En del plaget Sterkt plaget
42364

8. Har du fått noen av disse sykdommene siden du ble med i prosjektet? *Bruk evt. kommentarfelt sisteside. Se evt prosedyrebok 2.4.2
Diabetes type 1
Diabetes type 2
Astma
Allergi
Gjentatte urinveisinfeksjoner
Ja Nei
Ja Nei
Ja Nei
Ja Nei
Ja NeiStoffskiftesykdom * Ja Nei
Foran i bekkenet, over kjønnsbeinet(symfysen)
Bak, over det ene bekkenleddet
Bak, over begge bekkenleddene
Foran og bak på ene siden av bekkenet
Foran og bak på begge sider av bekkenet
Nei En del plaget Sterkt plaget
Nei En del plaget Sterkt plaget
Nei En del plaget Sterkt plaget
Nei En del plaget Sterkt plaget
Nei En del plaget Sterkt plaget
Kronisk nyresykdom
Vedvarende høyt blodtrykk
Hjertesykdom *
Leddgikt/Bechterew
Epilepsi
Sykdom i mage/tarm
Ja Nei
Ja Nei
Ja Nei
Ja Nei
Ja Nei
Ja Nei
Annet Ja Nei
Har du hatt alvorligsvangerskapskvalme med oppkast(hyperemesis gravidarum)
Ja Nei Hvis ja, fra uke : til uke :
9. Har en eller flere av dine førstegradsslektninger (mor, far, søsken, barn) diabetes? Sett evt.flere kryss
Nei Ja, type 1 diabetes Ja, type 2 diabetes Ja, diabetes (type ukjent)MorFarEgne søskenEgne barn
Nei Ja, type 1 diabetes Ja, type 2 diabetes Ja, diabetes (type ukjent)Nei Ja, type 1 diabetes Ja, type 2 diabetes Ja, diabetes (type ukjent)Nei Ja, type 1 diabetes Ja, type 2 diabetes Ja, diabetes (type ukjent)
10. Kjenner du til om en eller flere av dine førstegradsslektninger (mor, far, søsken, barn) harfått hjerte- og karsykdom (hjerteinfarkt, angina, hjerneslag/blødning) før fylte 55 års alder formenn og 65 års alder for kvinner? Sett evt. flere kryss
Nei JaMorFarEgne søskenEgne barn
Nei JaNei JaNei Ja
Vekt eller kroppsform påvirker ikke i det hele tatt hva jeg synes om meg selvVekt eller kroppsform betyr noe for hva jeg synes om meg selvVekt eller kroppsform betyr en del for hva jeg synes om meg selvVekt eller kroppsform betyr mye for hva jeg synes om meg selvVekt eller kroppsform betyr alt for hva jeg synes om meg selv
11. Hvilken av følgende påstander passer best på deg?Spiseproblemer
Kommentarer:
Unikt pas. løpenummer:42364

Aldri En eller to ganger Ukentlig Daglig12.Har du noen gang brukt noen av følgende metoder for å kontrollere vekten?
Aldri En eller to ganger Ukentlig Daglig
Aldri En eller to ganger Ukentlig Daglig
Aldri En eller to ganger Ukentlig Daglig
Fremkalle brekninger for å kaste opp
Ta avføringsmidler
Trene mer enn to timer per dag
Faste eller ikke spise i 24 timer eller mer
Aldri En eller to ganger Ukentlig Daglig
Aldri En eller to ganger Ukentlig Daglig
Aldri En eller to ganger Ukentlig Daglig
Aldri En eller to ganger Ukentlig Daglig
Fremkalle brekninger for å kaste opp
Ta avføringsmidler
Trene mer enn to timer per dag
Faste eller ikke spise i 24 timer eller mer
13. I dag, bruker du noen av følgende metoder for å kontrollere vekten?
14. Har du noen gang hatt perioder med overspising, dvs anfall der du har spiststore mengder mat i løpet av en kort tid? Ja Nei
Unikt pas. løpenummer:
Hvis aldri - gå til sp. 14
Hvis nei - gå til sp.25
15. Hvis ja, følte du da at du ikke kunne kontrollere spisingen?Ikke i det hele tatt Litt Noe Mye Veldig mye
16. Når du hadde flest episoder med overspising, hvor mange ganger per måned skjedde dette?
17. Hvor lenge varte perioden med overspising
Mindre enn en måned 1-2 måneder 3-5 mnd 6-12 mnd Lengre enn et år
Ikke i det hele tatt Litt Noe Mye Veldig mye18. Førte episodene med overspising til at du ble opprørt eller ulykkelig?
Aldri En eller to ganger Ukentlig Daglig
19. Brukte du noen av metodene nedenfor samtidig som du overspiste?
Aldri En eller to ganger Ukentlig Daglig
Aldri En eller to ganger Ukentlig Daglig
Aldri En eller to ganger Ukentlig Daglig
Fremkalle brekninger for å kaste opp
Ta avføringsmidler
Trene mer enn to timer per dag
Faste eller ikke spise i 24 timer eller mer
20. I dag, hender det du har perioder med overspising, dvs anfall der du harspist store mengder mat i løpet av kort tid? Ja NeiHvis nei - gå til sp.25
21. Hvis ja, føler du da at du ikke kan kontrollere spisingen?Ikke i det hele tatt Litt Noe Mye Veldig mye
22. Hvor mange ganger per måned skjer dette?
42364

23. Hvor lenge har perioden med overspising vart?Mindre enn en måned 1-2 mnd 3-5 mnd 6-12 mnd Lengre enn et år
Ikke i det hele tatt Litt Noe Mye Veldig mye24. Fører episodene med overspising til at du blir opprørt eller ulykkelig?
25. Spiser du mer når du er engstelig, stresset eller opprørt?
Alltid Ofte Noen ganger Nei, jeg spiser heller mindre
Unikt pas. løpenummer:
26.Har du siste 7 dager kunnet le og se detkomiske i en situasjon?
Like mye som vanligIkke riktig så mye som jeg pleierKlart mindre enn jeg pleierIkke i det hele tatt
27.Har du siste 7 dager gledet degtil ting som skulle skje?
Like mye som vanligIkke riktig så mye som jeg pleierKlart mindre enn jeg pleierIkke i det hele tatt
28.Har du siste 7 dager bebreidet deg selvuten grunn når noe gikk galt?
Ja, nesten hele tidenJa, av og tilIkke særlig ofteNei, aldri
29.Har du siste 7 dager vært nervøs ellerbekymret uten grunn?
Nei, slett ikkeNesten aldriJa, iblantJa, veldig ofte
Svangerskapsdepresjon
30.Har du siste 7 dager vært redd ellerfått panikk uten grunn?
Ja, svært ofteJa, noen gangerSjeldenNei, aldri
31.Har du siste 7 dager følt at det har blittfor mye for deg?Ja, jeg har stort sett ikke fungert i det hele tattJa, iblant har jeg ikke klart å fungere som jeg pleierNei, for det meste har jeg klart meg braNei, jeg har klart meg like bra som vanlig
32.Har du siste 7 dager vært så ulykkeligat du har hatt vanskeligheter med å sove?
Nei, ikke i det hele tattIkke særlig ofteJa, iblantJa, for det meste
33.Har du siste 7 dager følt degnedfor eller ulykkelig?
Ja, det meste av tidenJa, ganske ofteIkke særlig ofteNei, ikke i det hele tatt
34.Har du siste 7 dager vært så ulykkeligat du har grått?
Ja, nesten hele tidenJa, veldig ofteJa, det har skjedd iblantNei, aldri
35.Har tanken på å skade deg selv streifetdeg, de siste 7 dagene?
Ja, nokså ofteJa, av og tilJa, såvidtAldri
42364

Unikt pas. løpenummer:36.Hvor ofte lekker du urin? Kryssav i kun en boks
AldriOmtrent en gang i uken eller sjeldnere2-3 ganger i ukenCa. en gang per dagFlere ganger per dagHele tiden
Ikke noeEn liten mengdeEn moderat mengdeEn stor mengde
37.Vi vil gjerne vite hvor mye urin du lekker. Hvormye urin lekker du vanligvis (enten du brukerbeskyttelse eller ikke)? Kryss av i kun en boks
38.Hvor mye påvirker urinlekkasje ditt hverdagsliv? Her bruker vi en skala fra 0-10.
0 1 2 3 4 5 6 7 8 9 10Ikke i det hele tatt Svært mye
39.Nå lekker du urin? Kryss evt. av i flere bokserAldri, jeg lekker ikke urinLekker før jeg når toalettetLekker når jeg hoster eller nyserLekker når jeg soverLekker når jeg er fysisk aktiv/trimmerLekker når jeg er ferdig med å late vannet og har tatt på meg klærneLekker uten noen opplagt grunnLekker hele tiden
40. Røyker du/snuser du nå?Røyk: Aldri
Ja, av og tilJa, daglig
Antall sigaretter/dg Snus: AldriJa, av og tilJa, daglig
41. Ditt alkoholforbruk nå:Aldri Av og til Ja, daglig Antall alkoholenheter vanligvis:
Antall alkoholenheter - 1 enhet er: 1 glass vin, 0,33 liter øl, 1 likørglass42. Har du opplevd noen av de følgende livshendelser eller problemer siden du ble med i prosjektet?
Du har selv vært utsatt for alvorlig sykdom, skade eller overfall
En i din nærmeste familie (mor eller far, ektefelle/samboer, barneller søsken) har vært alvorlig syk, utsatt for skade elleroverfall
En i din nærmeste familie (mor eller far, ektefelle/samboer, barneller søsken) er avgått ved døden
Du er separert/skilt, eller har brutt et langvarig forhold
Du har hatt problemer/store bekymringer med barna dine(oppdragelse, skole, disiplin)
Du har blitt arbeidsledig, eller søkt forgjeves etter jobb i merenn 1 måned
Du har opplevd andre belastende forhold, som et alvorlig problemmed en nær venn, nabo, slektning eller partner, alvorligeøkonomiske bekymringer, noe du satte stor pris på ble mistet ellerstjålet, dødsfall hos annen nærstående, eller opplever storeproblemer på jobb
Ja Nei
Ja Nei
Ja Nei
Ja Nei
Ja Nei
Ja Nei
Ja Nei
42364

43. Tenk tilbake på de siste 14 dager. Har du tatt/brukt tran/trankapsler og/eller andre kosttilskudd iløpet av disse dagene? Hvis ja, angi antall kapsler/tabletter/skjeer per dag på rett frekvens
Tran/Trankapsler
Fiskeoljekapsler
Seloljekapsler
Folat
<1g/uke 1-2g/uke 3-4g/uke 5-6x/uke DagligAldri
Jerntilskudd
Multivitaminer m/mineraler(som Vitamineral,Kostplussoa)
Multivitaminer uten mineraler(som Sanasol,BioVit,Vitaplexoa )
Andre kosttilskudd
Unikt pas. løpenummer:
Angi navn på kosttilskudd 1:
Angi navn på kosttilskudd 3: Angi navn på kosttilskudd 4:
Angi navn på kosttilskudd 2:
44. Har du brukt faste medisiner de siste 3 måneder? Angi legemiddel navn - og evt. sykdom/plage
Angi legemiddelnavn Evt sykdom/plage
Angi legemiddelnavn
Angi legemiddelnavn
Angi legemiddelnavn
Evt sykdom/ plage
Angi legemiddelnavn
Evt sykdom/ plage
Evt sykdom/ plage
Evt sykdom/ plage
Angi navn på jerntilskudd:
TAKK FOR AT DU HAR TATT DEG TID TIL Å SVARE PÅ SPØRSMÅLENE!
Øvrige kommentarer, relater til spørsmålsnummer:
42364

STORK Groruddalen
CRF 3 - 3 MÅNEDER ETTER FØDSEL
Unikt pas. løpenummer:
Forklaring til utfyllingen:Bruk blå eller svart kulepenn. De fleste steder settes kryss eller tall. Brukellers store bokstaver og en bokstav per rute. Sett kryss mest mulig midt iavkrysningsboksen. Dersom feil i utfyllingen, marker dette ved å sette trestreker over boksen og kryss av på vanlig måte i den riktige boksen. Dersombehov for å notere ned ytterligere informasjon ut over hva det er avsattplass til på skjemaet, kan du notere dette i margen. Bare sørg for at du ikkeskriver i avkrysningsboksene eller notatfelter.Eksempel på utfylling:
Tekst i kursiv under spørsmålet, før svarkategoriene, er informasjon tilintervjueren og skal ikke leses opp for kvinnen.
gram2 2 5 6ja nei
Kode intervjuer
Bosteds-postnummer
Undersøkelsesdato. .
Intervjuers initialer Antall uker etter fødsel
UndersøkelsesbydelKvinnens fødselsdato. .
1. Hvilken sivilstand har du nå?Gift Partnerskap Samboer Enslig Skilt/separert Enke Annet
2. Hvordan var din opplevelse av svangerskapet i det store og det hele?
Hvordan følte du deg ivaretatt under svangerskapet?
Svært godt Godt Dårlig Svært dårlig
0 1 2 3 4 5 6 7 8 9 10Veldig god Veldig dårlig
Svært godt Godt Dårlig Svært dårlig
Svært godt Godt Dårlig Svært dårlig
Svært godt Godt Dårlig Svært dårlig
Svært godt Godt Dårlig Svært dårlig
Av dine nærmeste
Av fastlegen
Av jordmor på helsestasjonen
Av jordmor på sykehuset*
Av lege på sykehuset** Hvis aktuelt
3. Hvordan var din opplevelse av fødselen i det store og det hele?0 1 2 3 4 5 6 7 8 9 10
Veldig god Veldig dårlig
4. Hvor redd var du under fødselen?0 1 2 3 4 5 6 7 8 9 10
Overhodet ikke redd Svært redd
Ja, i stor grad Ja, i noen grad I liten grad5. Følte du at dine nærmeste ga hjelp og viste omsorg i dagene rundt fødsel?
42746

Svært godt Godt Dårlig Svært dårlig
Svært godt Godt Dårlig Svært dårlig
På fødeavdelingen
På barselavdelingen
Hvor ivaretatt følte du deg under fødselen?
6. Hvordan er helsen din nå?Dårlig Ikke helt god God Svært god
Nei En del plaget Sterkt plagetI korsryggen uten utstråling til bein(a)
I korsryggen med utstråling til bein(a)
7.Har du den siste måneden hatt smerter i noen av de følgende kroppsdeler?Intervjuer ber kvinnen peke på aktuelt sted på egen kropp. Sett kryss for aktuell lokalisasjon.Du kan sette flere kryss. se evt. prosedyrebok 2.4.2
Nei En del plaget Sterkt plaget
8. Har du fått noen av disse sykdommene de siste 6 månedene? *Bruk evt. kommentarfelt siste side. Se evtprosedyrebok 2.4.2Diabetes type 1
Diabetes type 2
Astma
Allergi
Gjentatte urinveisinfeksjoner
Ja Nei
Ja Nei
Ja Nei
Ja Nei
Ja NeiStoffskiftesykdom * Ja Nei
Foran i bekkenet, over kjønnsbeinet(symfysen)
Bak, over det ene bekkenleddet
Bak, over begge bekkenleddene
Foran og bak på ene siden av bekkenet
Foran og bak på begge sider av bekkenet
Nei En del plaget Sterkt plaget
Nei En del plaget Sterkt plaget
Nei En del plaget Sterkt plaget
Nei En del plaget Sterkt plaget
Nei En del plaget Sterkt plaget
Kronisk nyresykdom
Vedvarende høyt blodtrykk
Hjertesykdom *
Leddgikt/Bechterew
Epilepsi
Sykdom i mage/tarm
Ja Nei
Ja Nei
Ja Nei
Ja Nei
Ja Nei
Ja Nei
Har det noen gang i livet ditt vært sammenhengende perioder på to uker eller mer, da du:Ja Nei
Ja Nei
Ja Nei
Ja Nei
Ja Nei
Ja Nei
Følte deg deprimert, trist eller nedfor
Hadde problemer med matlysten eller spiste for mye
Var plaget av kraftløshet eller mangel på overskudd
Virkelig bebreidet deg selv og følte deg verdiløs
Hadde problemer med å konsentrere deg eller vanskelig for å ta beslutninger
Hadde minst tre av de problemene som er nevnt over samtidig
9. Hvordan var barnets helse straks etter fødselen? (sett ett eller flere kryss)Barnet var frisktBarnet ble innlagt på barneavd,men var ikke alvorlig sykBarnet ble innlagt på barneavd. og var alvorlig syk
Årsak til innleggelse:
Unikt pas. løpenummer:42746

Hvordan er barnets helse nå? (sett ett eller flere kryss)Barnet er frisktBarnet er syktBarnet døde
Type sykdom/problem:
10.1. Får barnet morsmelk nå, evt. noe i tillegg til morsmelk?Tenk på de siste 14 dager. Med fast føde menes alle andre matvarer enn juice, saft eller andresukkerholdige drikker, vann og kosttilskudd. Sett ett kryss.
Unikt pas. løpenummer:
Ja, bare morsmelk (og evt. tran eller annet kosttilskudd) (gå til spm. 10.6)
Ja, morsmelk og juice, saft eller andre sukkerholdige drikker
Ja, morsmelk og fast føde og evt. juice, saft eller andre sukkerholdige drikker
Ja, morsmelk og morsmelkerstatning/annen melk
Ja, morsmelk og morsmelkerstatning/annen melk og juice, saft eller andresukkerholdige drikkerJa, morsmelk og morsmelkerstatning/annen melk og fast føde og evt. juice, safteller andre sukkerholdige drikkerNei, men barnet har fått morsmelk tidligere
Nei, barnet har aldri fått morsmelk
Hvis barnet har fått morsmelk tidligere, men ikke får morsmelk nå:10.2. Hvor gammelt var barnet da det sluttet å få morsmelk? Sett ett kryss
1 2 3 4 5 6 7 2 2,5 3 3,5 4Uker Måneder
Hvis barnet har fått morsmelkerstatning (evt. i tillegg til morsmelk):10.3. Hvor gammelt var barnet da det begynte med morsmelkerstatning/annen melk i tillegg til eller isteden for morsmelk? Her regnes både det som drikkes og det som du selv tilsetter i grøt eller annen mat.Sett ett kryss
1 2 3 4 5 6 7 2 2,5 3 3,5 4Uker Måneder
10.4. Dersom barnet får juice, saft eller andre sukkerholdige drikker nå, hvor gammelt var barnet da detbegynte å få dette? Sett ett kryss
1 2 3 4 5 6 7 2 2,5 3 3,5 4Uker Måneder
10.5. Dersom barnet får fast føde nå, hvor gammelt var barnet da det begynte å få dette? Sett ett kryss
1 2 3 4 5 6 7 2 2,5 3 3,5 4Uker Måneder
10.6. Målinger av barnet ved ca 3 måneders alder:
Alder (hele uker): Vekt i gram: Lengde(cm): , HO(cm): ,
Kjønn: Jente Gutt
Alder (hele uker): Vekt i gram: Lengde(cm): , HO(cm): ,Kjønn: Jente Gutt
Tvilling 2:
42746

Vekt eller kroppsform påvirker ikke i det hele tatt hva jeg synes om meg selvVekt eller kroppsform betyr noe for hva jeg synes om meg selvVekt eller kroppsform betyr en del for hva jeg synes om meg selvVekt eller kroppsform betyr mye for hva jeg synes om meg selvVekt eller kroppsform betyr alt for hva jeg synes om meg selv
11. Hvilken av følgende påstander passer best på deg?
Spiseproblemer
Aldri En eller to ganger Ukentlig Daglig
Aldri En eller to ganger Ukentlig Daglig
Aldri En eller to ganger Ukentlig Daglig
Aldri En eller to ganger Ukentlig Daglig
Fremkalle brekninger for å kaste opp
Ta avføringsmidler
Trene mer enn to timer per dag
Faste eller ikke spise i 24 timer eller mer
13. I dag, bruker du noen av følgende metoder for å kontrollere vekten?
20. I dag, hender det du har perioder med overspising, dvs anfall der du harspist store mengder mat i løpet av kort tid? Ja NeiHvis nei - gå til sp.25
21. Hvis ja, føler du da at du ikke kan kontrollere spisingen?Ikke i det hele tatt Litt Noe Mye Veldig mye
22. Hvor mange ganger per måned skjer dette?
23. Hvor lenge har perioden med overspising vart?Mindre enn en måned 1-2 mnd 3-5 mnd 6-12 mnd Lengre enn et år
Ikke i det hele tatt Litt Noe Mye Veldig mye24. Fører episodene med overspising til at du blir opprørt eller ulykkelig?
25. Spiser du mer når du er engstelig, stresset eller opprørt?
Alltid Ofte Noen ganger Nei, jeg spiser heller mindre
26.Har du siste 7 dager kunnet le og se detkomiske i en situasjon?
Like mye som vanligIkke riktig så mye som jeg pleierKlart mindre enn jeg pleierIkke i det hele tatt
27.Har du siste 7 dager gledet degtil ting som skulle skje?
Like mye som vanligIkke riktig så mye som jeg pleierKlart mindre enn jeg pleierIkke i det hele tatt
28.Har du siste 7 dager bebreidet deg selvuten grunn når noe gikk galt?
Ja, nesten hele tidenJa, av og tilIkke særlig ofteNei, aldri
29.Har du siste 7 dager vært nervøs ellerbekymret uten grunn?
Nei, slett ikkeNesten aldriJa, iblantJa, veldig ofte
Svangerskapsdepresjon
Unikt pas. løpenummer:42746

30.Har du siste 7 dager vært redd ellerfått panikk uten grunn?
Ja, svært ofteJa, noen gangerSjeldenNei, aldri
31.Har du siste 7 dager følt at det har blittfor mye for deg?Ja, jeg har stort sett ikke fungert i det hele tattJa, iblant har jeg ikke klart å fungere som jeg pleierNei, for det meste har jeg klart meg braNei, jeg har klart meg like bra som vanlig
32.Har du siste 7 dager vært så ulykkeligat du har hatt vanskeligheter med å sove?
Nei, ikke i det hele tattIkke særlig ofteJa, iblantJa, for det meste
33.Har du siste 7 dager følt degnedfor eller ulykkelig?
Ja, det meste av tidenJa, ganske ofteIkke særlig ofteNei, ikke i det hele tatt
34.Har du siste 7 dager vært så ulykkeligat du har grått?
Ja, nesten hele tidenJa, veldig ofteJa, det har skjedd iblantNei, aldri
35.Har tanken på å skade deg selv streifetdeg, de siste 7 dagene?
Ja, nokså ofteJa, av og tilJa, såvidtAldri
36.Hvor ofte lekker du urin? Kryssav i kun en boks
AldriOmtrent en gang i uken eller sjeldnere2-3 ganger i ukenCa. en gang per dagFlere ganger per dagHele tiden
Ikke noeEn liten mengdeEn moderat mengdeEn stor mengde
37.Vi vil gjerne vite hvor mye urin du lekker. Hvormye urin lekker du vanligvis (enten du brukerbeskyttelse eller ikke)? Kryss av i kun en boks
38.Hvor mye påvirker urinlekkasje ditt hverdagsliv? Her bruker vi en skala fra 0-10.
0 1 2 3 4 5 6 7 8 9 10Ikke i det hele tatt Svært mye
Urinlekkasje
39.Når lekker du urin? Kryss evt. av i flere bokserAldri, jeg lekker ikke urinLekker før jeg når toalettetLekker når jeg hoster eller nyserLekker når jeg soverLekker når jeg er fysisk aktiv/trimmerLekker når jeg er ferdig med å late vannet og har tatt på meg klærneLekker uten noen opplagt grunnLekker hele tiden
Unikt pas. løpenummer:42746

Unikt pas. løpenummer:
40. Røyker du/snuser du nå?Røyk: Aldri
Ja, av og tilJa, daglig
Antall sigaretter/dg Snus: AldriJa, av og tilJa, daglig
41. Ditt alkoholforbruk nå:Aldri Av og til Ja, daglig Antall alkoholenheter vanligvis:
Antall alkoholenheter - 1 enhet er: 1 glass vin, 0,33 liter øl, 1 likørglass42. Har du opplevd noen av de følgende livshendelser eller problemer de siste 6 måneder?
Du har selv vært utsatt for alvorlig sykdom, skade eller overfall
En i din nærmeste familie (mor eller far, ektefelle/samboer, barneller søsken) har vært alvorlig syk, utsatt for skade elleroverfall
En i din nærmeste familie (mor eller far, ektefelle/samboer, barneller søsken) er avgått ved døden
Du er separert/skilt, eller har brutt et langvarig forhold
Du har hatt problemer/store bekymringer med barna dine(oppdragelse, skole, disiplin)
Du har blitt arbeidsledig, eller søkt forgjeves etter jobb i merenn 1 måned
Du har opplevd andre belastende forhold, som et alvorlig problemmed en nær venn, nabo, slektning eller partner, alvorligeøkonomiske bekymringer, noe du satte stor pris på ble mistet ellerstjålet, dødsfall hos annen nærstående, eller opplever storeproblemer på jobb
Ja Nei
Ja Nei
Ja Nei
Ja Nei
Ja Nei
Ja Nei
Ja Nei
43. Tenk tilbake på de siste 14 dager. Har du tatt/brukt tran/trankapsler og/eller andre kosttilskudd iløpet av disse dagene? Hvis ja, angi antall kapsler/tabletter/skjeer per dag på rett frekvens
Tran/Trankapsler
Fiskeoljekapsler
Seloljekapsler
Folat
<1g/uke 1-2g/uke 3-4g/uke 5-6x/uke DagligAldri
Jerntilskudd
Multivitaminer m/mineraler(som Vitamineral,Kostplussoa)
Multivitaminer uten mineraler(som Sanasol,BioVit,Vitaplexoa )
Andre kosttilskudd
42746

Unikt pas. løpenummer:
Angi navn på kosttilskudd 1:
Angi navn på kosttilskudd 3: Angi navn på kosttilskudd 4:
Angi navn på kosttilskudd 2:
44. Har du brukt faste medisiner de siste 3 måneder? Angi legemiddel navn - og evt. sykdom/plage
Angi legemiddelnavn Evt sykdom/plage
Angi legemiddelnavn
Angi legemiddelnavn
Angi legemiddelnavn
Evt sykdom/ plage
Angi legemiddelnavn
Evt sykdom/ plage
Evt sykdom/ plage
Evt sykdom/ plage
Angi navn på jerntilskudd:
TAKK FOR AT DU HAR TATT DEG TID TIL Å SVARE PÅ SPØRSMÅLENE!
Øvrige kommentarer, relater til spørsmålsnummer:
MerkeP-piller Minipiller Spiral
42746


Side 1 av 4
Til deg som er gravid og bor i bydelene Stovner, Grorud og Bjerke
Forespørsel om å delta i forskningsprosjektet ”STORK Groruddalen”
Hensikten med studien Formålet er å videreutvikle svangerskaps- og fødselsomsorgen og helsestasjonstjenesten slik at vi bedre kan forebygge og behandle nye helseproblemer som overvekt, inaktivitet og diabetes. Kvinner med diabetes og deres barn har noe høyere risiko for komplikasjoner i svangerskapet. Noen ganger oppstår diabetes i svangerskapet. Selv om tilstanden vanligvis går over etter fødselen, er det økt risiko for å få type 2 diabetes senere. Vi som arbeider på helsestasjonene i bydelene Stovner, Grorud og Bjerke, ønsker i samarbeid med universitetssykehusene i Osloområdet å kartlegge disse problemene, hvordan de påvirker helsetilstanden for mor og barn på kort og lang sikt, og finne årsakene til at svangerskapsdiabetes og type 2 diabetes øker. Aker universitetssykehus er ansvarlig for studien. Hva innebærer studien? Du vil på helsestasjonen få en ekstra og en utvidet kontroll i svangerskapet og en ekstra undersøkelse etter fødselen. Vi vil ta noen ekstra blod- og urinprøver og målinger, og be deg svare på spørsmål om din helse, fysiske aktivitet og kosthold. Du vil også få ekstra ultralyd-undersøkelser i svangerskapet. Det tas noen blodprøver fra barnets navlesnor og morkaken ved fødselen, og noen undersøkelser og blodprøver av barnet senere. Hva skjer med prøvene og informasjonen om deg? Dette skal kun brukes slik som beskrevet i hensikten med studien. Alle opplysningene og prøvene vil bli behandlet uten navn og fødselsnummer eller andre direkte gjenkjennende opplysninger. En kodeliste som knytter sammen studieresultatene og deltakernes navn, er kun tilgjengelig for autorisert helsepersonell knyttet til studien, og denne vil bli slettet ved studieslutt, senest i 2030. Det vil selvsagt ikke være mulig å identifisere deltakerne når resultatene av studien offentliggjøres. For å finne ut hvor mange som får diabetes og/eller hjerte- og karsykdom i fremtiden, ønsker vi å kunne hente ut disse opplysningene fra din fastlege og fra sykehus der du får behandling, og fra Norsk Diabetesregister for voksne, Norsk Pasientregister, Reseptregistret, Dødsårsaksregisteret og Medisinsk fødselsregister.
Frivillig deltakelse Det er frivillig å delta i studien, og alle har rett til betenkningstid før man bestemmer seg. De som ikke ønsker å delta, trenger ikke å oppgi grunn, og det får ingen konsekvenser for den videre behandlingen. Hvis du ønsker å delta, undertegner du samtykkeerklæringen på siste side. Du kan senere trekke tilbake samtykket uten at det påvirker behandlingen, ved å kontakte prosjektleder dr. med. Anne Karen Jenum (telefon 91 18 14 16). Mer informasjon om studien finnes i Kapittel A
Mer informasjon om biobank, personvern økonomi og forsikring finnes i Kapittel B

Side 2 av 4
Kapittel A- utdypende forklaring om hva studien innebærer
Alle gravide som går til svangerskapskontroll i bydelene Stovner, Grorud og Bjerke, vil bli invitert til å delta i studien. Hvis du sier ja til å delta, vil vi be deg møte til en ekstra undersøkelse på helsestasjonen omkring uke 12, en utvidet undersøkelse omkring uke 28 og en ekstra undersøkelse omkring 12 uker etter fødselen. Alle gangene vil vi stille deg spørsmål om din helse og intervjue deg om kostholdet ditt og din fysiske aktivitet, og kartlegge din fysiske aktivitet med et armbånd som bæres på overarmen. Vi vil også stille noen spørsmål om helseforhold og sykdom i familien, veie deg med en spesialvekt som angir fettinnholdet i kroppen, og måle hudtykkelsen med en enkel ytre målemetode. Alle disse tre gangene må du møte fastende på grunn av de ekstra blodprøvene som skal tas sammen med rutineprøvene i svangerskapet. Det betyr at du ikke skal spise, drikke eller røyke etter kl 24 kvelden før disse timene hos oss. Rutineprøvene og noen av de andre blodprøvene vil du få svar på ved neste undersøkelse. Andre blir sendt til sykehus for nedfrysing for senere analyser. Det gjelder også urinprøvene. Omkring uke 28 vil vi ta en blodsukkerbelastning som gjøres på følgende måte: Etter den fastende blodprøven drikker du 75 gram druesukker. Etter 2 timer tas en ny blodprøve. Det er lurt å ta med matpakke som du kan spise etterpå. Prøvene analyseres på helsestasjonen. Du får med en gang vite om du har fått svangerskapsdiabetes. Da får du ekstra oppfølging/behandling. Du vil også bli tilbudt 3 ekstra ultralydundersøkelser for å se på barnets vekst. Etter fødselen vil vi i samarbeide med sykehuset du føder på innhente journalopplysninger fra svangerskapet om resultatene av ultralydundersøkelsene, fødselsforløpet, din helse og barnets lengde, vekt, hodeomkrets, fordeling av kroppsfett og helsetilstand. Det tas også blodprøver fra barnets navlestreng og morkake ved fødselen. Etter fødselen ønsker vi å kartlegge hvor lenge barnet får morsmelk, og hvordan barnet vokser (lengde og vektutvikling) i barnealderen. Dette skjer ved den vanlige barnekontrollen på helsestasjonen. Vi ønsker å kunne gjøre noen tilleggsundersøkelser av barnet ved 6 og 10 års alder (kost, fysisk aktivitet og blodprøver). Kvinner som får påvist svangerskapsdiabetes vil få utført ny blodsukkerbelastning ca.3 måneder etter fødselen. Vi vil senere også innkalle dem en gang i året i 5 år, og så hvert 5. år for nye prøver for å avklare om de har fått type 2 diabetes. Ved oppfølgingsstudiene vil vi komme tilbake med ny henvendelse med spørsmål om å delta. Mulige fordeler og ubehag/ulemper
Økt kunnskap om fysisk aktivitet, sunn kost og helse.
Ekstra nøye oppfølging av de som får påvist svangerskapsdiabetes
Blodsukkerbelastningen (uke 28 og 3 mnd etter fødsel) kan utløse kvalme
Ingen av de andre undersøkelsene gir ubehag eller risiko utover vanlig blodprøvetakning.
Ved blodprøver av barnet ved 6 og 10 års alder vil barnet på forhånd kunne få lokalbedøvende salve på huden.

Side 3 av 4
Kapittel B - Personvern, biobank, økonomi og forsikring
Personvern Opplysninger som registreres om deg er journalopplysninger fra helsekort for gravide, sykehusjournal fra mors og barnets journal i forbindelse med svangerskap og fødsel hentet ut av autorisert helsepersonell, fra intervjuene om kost og fysisk aktivitet, og resultater fra de innsamlede målinger og blod- og urinprøver. For barnet ditt gjelder det opplysninger fra sykehuset fra fødsel og nyfødtperiode, og helsestasjonsdata om amming, vekstutvikling, samt tilleggsundersøkelsene om kosthold, fysisk aktivitet og blodprøver ved 6 og 10 års alder. For å finne mer ut om helsekonsekvensene av fysisk inaktivitet, overvekt og diabetes og senere helse for mor og barn, spesielt hvorfor noen får diabetes og hjerte- og karsykdom, ønsker vi å kunne hente ut opplysninger om disse diagnosene fra din journal hos fastlege og sykehus der du får behandling, og kunne koble opplysningene fra ”STORK Groruddalen” med data fra Norsk Pasientregister, Norsk Diabetesregister for voksne, Reseptregisteret, Dødsårsaksregisteret og Medisinsk fødselsregister Alle som får innsyn, har taushetsplikt. Opplysninger om fars helse og forekomst av hjerte- og karsykdom og diabetes i familien vil også bli samlet inn. For at det skal være mulig å følge med din og barnets medisinske utvikling over lengre tid, slettes opplysninger og prøver først i 2030. Aker universitetssykehus ved administrerende direktør er databehandlingsansvarlig for studien.
Behandling av materiale og opplysninger hos andre Hvis du sier ja til å delta i studien, gir du også ditt samtykke til at avidentifiserte opplysninger og prøver kan oppbevares og behandles hos ulike forskere og samarbeidspartnere tilknyttet prosjektet, i Norge og i utlandet. Dette er nødvendig for å oppfylle formålet med studien. Vi vil stille samme strenge krav til beskyttelse av informasjonen til våre samarbeidspartnere, også i land med lover som ikke gir like god personvernbeskyttelse som her. Biobank Blod- og urinprøvene og vev fra morkake som blir tatt og informasjonen utledet av dette materialet, vil bli lagret i en forskningsbiobank ved Aker universitetssykehus. Hvis du sier ja til å delta i studien, gir du også samtykke til at det biologiske materialet og analyseresultater inngår i biobanken. Prof. dr. med. Kåre Birkeland er ansvarlig for biobanken. Biobanken planlegges å vare til 2030. Etter dette vil materialet og opplysninger bli ødelagt etter interne retningslinjer. Rett til innsyn og sletting av opplysninger om deg og sletting av prøver Hvis du sier ja til å delta i studien, har du rett til å få innsyn i hvilke opplysninger som er registrert om deg. Du har også rett til å få korrigert eventuelle feil i de opplysningene vi har registrert. Dersom du trekker deg fra studien, kan du kreve å få slettet innsamlede prøver og opplysninger, med mindre opplysningene allerede er inngått i analyser eller brukt i vitenskapelige publikasjoner. Økonomi, prosjektleders rolle og forsikring Studien og biobanken er finansiert gjennom forskningsmidler fra Forskningsrådet og Helse Sør-Øst. Vi vil senere kunne søke også andre kilder, som farmasøytisk industri. Prosjektleder har ingen personlige økonomiske interesser i prosjektet. Norsk pasientskadeerstatningsordning gjelder ved deltagelse i studien.

Side 4 av 4
Samtykke til deltakelse i studien
Jeg er villig til å delta i studien ---------------------------------------------------------------------------------------------------------------- (Signert av prosjektdeltaker, dato) Jeg bekrefter å ha gitt informasjon om studien ---------------------------------------------------------------------------------------------------------------- (Signert, rolle i studien, dato) 10.05.09

I
Paper I


RESEARCH ARTICLE Open Access
A prospective cohort study of depression inpregnancy, prevalence and risk factors in amulti-ethnic populationNilam Shakeel1*, Malin Eberhard-Gran2,3,4†, Line Sletner5†, Kari Slinning6,7†, Egil W Martinsen8†, Ingar Holme9†
and Anne Karen Jenum10,11†
Abstract
Background: Depression in pregnancy increases the risk of complications for mother and child. Few studies are
done in ethnic minorities. We wanted to identify the prevalence of depression in pregnancy and associations with
ethnicity and other risk factors.
Method: Population-based, prospective cohort of 749 pregnant women (59% ethnic minorities) attending primary
antenatal care during early pregnancy in Oslo between 2008 and 2010. Questionnaires covering demographics,
health problems and psychosocial factors were collected through interviews. Depression in pregnancy was defined
as a sum score≥ 10 by the Edinburgh Postnatal Depression Scale (EPDS) at gestational week 28.
Results: The crude prevalence of depression was; Western Europeans: 8.6% (95% CI: 5.45-11.75), Middle Easterners:
19.5% (12.19-26.81), South Asians: 17.5% (12.08-22.92), and other groups: 11.3% (6.09-16.51). Median EPDS score was
6 in Middle Easterners and 3 in all other groups.
Middle Easterners (OR = 2.81; 95% CI (1.29-6.15)) and South Asians (2.72 (1.35-5.48)) had significantly higher risk for
depression than other minorities and Western Europeans in logistic regression models. When adjusting for
socioeconomic position and family structure, the ORs were reduced by 16-18% (OR = 2.44 (1.07-5.57) and 2.25
(1.07-4.72). Other significant risk factors were the number of recent adverse life events, self-reported history of
depression and poor subjective health three months before conception.
Conclusion: The prevalence of depression in pregnancy was higher in ethnic minorities from the Middle East and
South Asia. The increased risk persisted after adjustment for risk factors.
Keywords: Depression, Mental health, Risk factors, EPDS, Pregnancy, Ethnic groups
BackgroundDepression in pregnancy shares a similar symptom pro-
file as depression occurring in other contexts, involving
changes in appetite, feelings of guilt and low energy [1].
It may also disrupt the foetal developmental process [2]
and increase the risk of adverse health outcomes for the
mother and foetus such as preeclampsia and preterm
birth [3]. Substance and alcohol abuse and cigarette
smoking are associated with depression, and may further
increase the risk of pregnancy complications [4,5]. The
strongest risk factors appear to be a history of anxiety
and depression [6,7], adverse life events [8] and lack of
support, from the partner and others [3]. Depression in
pregnancy may persist into the postpartum period [9]
and disrupt the parenting behaviour, the attachment
process between the mother and baby, as well as the re-
lationship with the partner and any other children [10].
Although studies from pregnancy are few, they indicate
that depression during pregnancy is as prevalent as dur-
ing the postpartum period [11].
Ethnic minorities in Western countries are often ex-
posed to stressors both before and during migration and
* Correspondence: [email protected]†Equal contributors1University of Oslo Institue for health and society, departement of general
practice, Norway, Avdeling for allmennmedisin, institutt for helse og
samfunn, Universitetet i Oslo, Norge, Postboks 1130 Blindern, Oslo 0318,
Norway
Full list of author information is available at the end of the article
© 2015 Shakeel et al.; licensee BioMed Central. This is an Open Access article distributed under the terms of the CreativeCommons Attribution License (http://creativecommons.org/licenses/by/4.0), which permits unrestricted use, distribution, andreproduction in any medium, provided the original work is properly credited. The Creative Commons Public DomainDedication waiver (http://creativecommons.org/publicdomain/zero/1.0/) applies to the data made available in this article,unless otherwise stated.
Shakeel et al. BMC Pregnancy and Childbirth (2015) 15:5
DOI 10.1186/s12884-014-0420-0

after resettlement, such as lack of social integration, lan-
guage problems, exposure to racism, unhealthy nutrition
and poor housing conditions. These factors may ad-
versely affect their mental health [12,13], placing ethnic
minorities at higher risk for the development of postpar-
tum depression [14]. Another aspect is the potential ten-
sion that immigrants from some countries with cultures
more dominated by collective values may experience
when exposed to the more individualistic Western soci-
eties. When there is a congruency between own prefer-
ences and those in the area of residence, living in
neighbourhoods with many others from the same culture
may be protective compared to living relatively alone in an
affluent districts [15,16]. However, for an immigrant who
does not share the collective values of his or her group,
living among more traditionally oriented family members
or neighbours may represent an extra burden due to social
control mechanisms. Further, the care of women during
pregnancy and postpartum differ in Europe compared to
Asia and Africa [17]. Not living close to their extended
family, and not having access to the type of care they are
used to in their home countries can be distressing and
negatively affect their mental health. However, little is
known about depressive symptoms and risk factors for de-
pression in pregnancy for ethnic minority groups living in
Western societies [18-24].
Hence, the primary aim of this study was to determine
the prevalence of depression in pregnancy and its associ-
ations with ethnicity and other risk factors. In addition,
for immigrant groups we aimed to assess the importance
of factors related to the level of social integration into
the Norwegian mainstream society.
MethodsDesign, study population and setting
This study is part of the STORK Groruddalen Research
Program, with the primary goal to reduce short and
long-term health risks for mothers and offspring by initi-
ating knowledge-based and culturally-sensitive interven-
tions among pregnant women and their families. Data
are drawn from a population-based, prospective cohort
of 823 healthy pregnant women attending the Child
Health Clinics (CHC) for antenatal care in three adminis-
trative districts in Groruddalen, Oslo, covering a popula-
tion of 82 500, between 2008 and 2010 [25]. Groruddalen
was chosen as it covers affluent as well as more deprived
residential areas, has a population with a diverse socioeco-
nomic status and a high proportion of ethnic minorities.
The majority (75-85%) of pregnant women residing in this
area attend the CHC for antenatal care [25]. Antenatal
care of normal pregnancies in Norway is carried out in
primary care, either at the public CHC alone, in combin-
ation with the general practitioner (GP), or by the GP
alone. All information material and questionnaires were
translated to Arabic, English, Sorani, Somali, Tamil, Turkish,
Urdu and Vietnamese and quality controlled by bilingual
health professionals. The participation rate was 74% (range
64-83% among ethnic groups), and the participating
women were found representative of all pregnant women
attending the CHCs [25,26]. Women were eligible if they:
1) lived in the study districts; 2) planned to give birth at
one of two study hospitals; 3) were at <20 weeks of gesta-
tion at inclusion; 4) could communicate in Norwegian or
any of the other eight specified languages; and 5) were able
to give written consent.
Women with diseases necessitating intensive hospital
follow-up during pregnancy were excluded. Data were
collected at study inclusion (mean gestational week (GW):
15.1 (SD: 3.4)), at GW 28 (mean GW: 28.3 (1.3)) and in
the postpartum period (mean number of weeks postpar-
tum: 14.3. (2.8)). The STORK Groruddalen project has
been described in detail previously [25,26]. In short, ques-
tionnaire data covering demographics, health issues and
psychosocial factors were collected through interviews
by midwives at all three visits, assisted by professional
translators when needed. Staff members were certified
after extensive training to ensure standardized data col-
lection procedures.
The study was approved by The Regional Ethics Com-
mittee South-East and the Norwegian Data Inspectorate,
(reference number: 2007.894). All participants gave their
written informed consent prior to their inclusion in the
study.
Primary outcome variable – depression in pregnancy
We used The Edinburgh Postnatal Depression Scale
(EPDS) [27], a 10-item, self-rating scale, originally de-
signed to identify women at risk for postpartum depres-
sion, but also later used for depression in pregnancy
[28,29]. The EPDS has previously been thoroughly vali-
dated for use in postnatal, non-postnatal [30] as well as
in pregnant women [31-34]. This measure is now the
most frequently used screening instrument in epidemio-
logical studies related to depression in pregnancy and
postpartum [35]. The EPDS sum score ranges from 0 to
30 points, with higher score indicating more symptoms.
This instrument has been found to have good sensitivity
and specificity when tested against other assessment
methods [36]. High test-retest reliability (0.81) has also
been demonstrated in other pregnant populations [31].
The EPDS has previously been used for pregnant women
in numerous Norwegian studies [11,37-45].
We used the validated Norwegian translation, which
has satisfactory psychometric properties among postnatal
Norwegian women, with satisfactory measures of reliabil-
ity, including a Cronbach’s alpha of 0.81 and a test-retest
correlation of 0.74 [36,46], and the official translations
of seven other languages (Arabic, English, Somali, Tamil,
Shakeel et al. BMC Pregnancy and Childbirth (2015) 15:5 Page 2 of 11

Turkish, Urdu and Vietnamese) at the visit in GW 28
[27,47]. The Sorani version was translated by the City Ser-
vices Department, The Interpreting Service in Oslo, and
quality-checked for clarity and content validity by bilingual
health professionals. In accordance with most epidemio-
logical studies, we used the proportion scoring above a
cut-off EPDS score ≥10 as a proxy measure for depression
[48], both when referring to the prevalence data and in
the subsequent logistic regression analyses. We also per-
formed supplementary sensitivity analyses based upon an
EPDS total score ≥ 12.
Exposure variables
Ethnicity
Ethnicity was considered as our main exposure variable,
and was defined according to each participant’s country of
birth or the participant’s mother’s country of birth if the
participant’s mother was born outside of Europe or North
America [26]. The Western European group comprised
participants born in Norway (93%), Sweden, Denmark,
other Western European countries and North America.
Women with origin from Eastern Europe, Africa, Asia,
South - and Central America are referred to as ethnic mi-
norities, further categorized as Middle Easterners (mainly
from Iraq, Iran and Turkey), South Asians (mainly from
Pakistan and Sri Lanka), and others (from Eastern Europe,
Africa South of Sahara, East Asia and South and Central
America) [26].
Adverse life events
Seven questions assessed stressful life events: 1) serious
illness or injury (self ), 2) serious illness or injury of close
family member, 3) death of close family members, 4)
divorce or separation from a long-term relationship, 5)
unemployment or serious problems finding a job, 6) major
concerns for children and 7) any other major event not
already covered, like serious financial problems, difficulties
at work, serious conflict etc. Response options were “yes”
or “no”. Women reported adverse life events at inclusion,
covering any event occurring during the past six months,
and at GW 28, covering events after inclusion. First,
the number of events for each time period was calculated,
and then combined to a single variable to reflect the total
number of events from six months prior to the study
inclusion up to GW 28. This variable was recoded as 0-1
event (reference), 2 events or ≥ 3events, driven by the
distribution of data.
Subjective health
At inclusion, women were asked to self-report their sub-
jective health during the last three months before preg-
nancy. The response categories were “bad”, “not that good”,
“good” and “very good” [26], and responses were further
dichotomized as “bad” or “good”.
History of depression
We used the lifetime major depression scale based on
the DSM-IV criteria to assess history of depression [49].
This scale consists of five questions concerning sadness,
appetite changes, and lack of energy, self-blame and
concentration problems, with the response categories
“yes” or “no”. Prior depression was defined as having had
at least three simultaneously co-occurring symptoms
with duration of at least two weeks. This information
was collected at the postpartum visit, as it was recognized
as an important risk factor for postpartum depression. Al-
though the number of participants was somewhat lower at
postpartum (N = 662), this variable was included due to its
relevance for the outcome.
Other variables
Age, GW at inclusion, parity, level of education and oc-
cupational status were regarded as possible cofactors/
confounding factors. Single parenthood (living without
a partner) was treated as a potential risk factor (lack of
emotional and practical support). Information about fam-
ily structure (three generational households – living with
own parents or parents-in-law) were also available. Mater-
nal individual and household socioeconomic factors used
in the analyses were maternal educational level, pre-
pregnancy employment status, household crowding (per-
sons per room) and housing tenure (owning vs. renting).
We also explored factors related to the level of social inte-
gration for immigrant groups into the Norwegian main-
stream society, here represented by variables reflecting
language skills (three different questions), time of resi-
dency, social interaction with ethnic Norwegians and use
of Norwegian media. Ethnic Norwegian participants were
not asked these questions but were automatically given
the highest value for these variables.
Study sample
From the total cohort of 823 women included in the
study, 772 attended the follow-up at GW 28. 739 women
had complete valid scores for all EPDS items at week 28.
An additional 10 women had ≤ 3 missing items, for
which mean values were imputed leaving a study sample
of 749 women (Figure 1).
Statistical methods
Descriptive statistics are provided as mean (SD), median
(interquartile range; IQR) and frequency (%) as appropri-
ate. To compare groups, chi-square tests were used
for categorical data and T-tests or Mann-Whitney U for
continuous variables as appropriate, depending on their
distribution.
Most variables reflecting socioeconomic position (SEP)
and level of integration are strongly correlated and interact
with each other. However, they clearly represent different
Shakeel et al. BMC Pregnancy and Childbirth (2015) 15:5 Page 3 of 11

dimensions of societal and contextual factors. We there-
fore aimed at reducing dimensionality by extracting the
smallest number of components that accounted for most
of the variation in the original multivariate data. To
achieve this goal, all individual and household markers
of maternal SEP and variables related to the level of inte-
gration were entered into a principal components analysis
(PCA) [50]. Two components were extracted. The first
component was highly correlated with the predefined
markers of the level of integration and was skewed to the
right, reflecting that the ethnic Norwegians all had high
scores. The second component had high correlations with
the predefined individual and household markers of SEP.
This score was normally distributed. Maternal occupa-
tional class was equally correlated with both components.
Single parenthood was not correlated with other markers
of SEP or the level of integration and was therefore not
included in the PCA. The PCA scores were further dichot-
omized, into the 40% with the lowest scores versus the
60% with highest scores for SEP and level of integration,
as the score values may be difficult to interpret directly
from the tables. We examined different cut-off values (20/
80 and also three categories with different cut-off values),
but found that the pragmatic 40/60 cut point had a suffi-
cient number in the lowest category, and still carried im-
portant information. We used both the PCA scores and
the individual components in the analyses.
Using univariate and multiple logistic regression ana-
lyses, a directed acyclic graph was drawn and an etio-
logical approach was chosen to assess the association
between the explanatory factors and depression in
pregnancy. In a timeline, ethnic origin was considered
as a point of departure, followed by SEP and then de-
pression before pregnancy. Single parenthood, subject-
ive health prior to pregnancy and the sum score of
recent adverse life events were considered as risk fac-
tors, whereas age, parity and the pregnancy stage (ges-
tational week at inclusion) were included as potential
confounders. Level of social integration was considered
as an intermediate factor. Our primary research ques-
tion was whether depression was associated with ethnic
origin. The second question was whether the level of
social integration was associated with depression in
ethnic minority women. To address these aims, univari-
ate and multiple logistic regression analyses were per-
formed with depression (EPDS score ≥10; yes/no) as
the dependent variable. Two models were fitted to ad-
dress the primary research question. Model 1 used eth-
nicity as the main independent (exposure) variable and
the covariates included gestational week at inclusion,
single parenthood, adverse life events, subjective health
three months before pregnancy and a history of depres-
sion. In model 2, SEP and family structure were added
to the model.
To answer the second research question, ethnicity was
replaced by level of integration, as over-adjustment was
expected when including a variable highly correlated
with ethnicity and falling on the pathway between ethni-
city and depression in pregnancy. After removal of eth-
nicity from Model 2, we first used the PCA variable for
level of integration. Then we assessed different indica-
tors of social integration in the total sample, and then
restricted analyses to the ethnic minority group. We
used all available individual items thought to reflect level
of integration, plus family structure, thereafter including
SEP in all models. The model with the PCA variable
reflecting the overall level of integration instead of the
individual items had the best fit (Model 3).
All models were tested for interactions, entering cross-
product terms one-by-one. The only significant inter-
action found was between ethnicity and age (p = 0.04),
and age was therefore excluded from the final models as
it had negligible impact on the estimates. Lastly, a sensi-
tivity analysis was performed (Model 1-2 repeated) using
EPDS sum score ≥12, for Western versus ethnic minor-
ity women. In these analyses, all minority groups were
merged due to low numbers in some groups.
The statistical significance level was set to p <0.05. We
report explained variance for the Models as Nagelkerke
R-square (R2). The SPSS version 19 (IBM SPSS statistics,
NY, USA) was used for all analyses.
Figure 1 Flowchart of study sample selection.
Shakeel et al. BMC Pregnancy and Childbirth (2015) 15:5 Page 4 of 11

ResultsCharacteristics of study sample
Of the 749 women with valid EPDS data, 444 (59.3%) were
ethnic minorities. Baseline socio-demographic characteris-
tics according to ethnic group are presented in Table 1.
The ethnic minority women were younger, had less educa-
tion, and higher parity and unemployment compared to
Western European women. Heterogeneity was found
across ethnic minority subgroups. No significant baseline
differences were found between participants and the 74
excluded women on the following variables: ethnicity, age,
GW at inclusion, parity, single parenthood, employment
status and education.
Prevalence of depression
A total of 97 women had an EPDS score ≥10, yielding a
crude prevalence rate of 13.0% (95% CI: 10.59-15.41) for
the whole study sample (Figure 2), 8.6% (5.45-11.75) for
Western European women and 16.0% (12.59-19.41) for
the ethnic minority group (p = 0.003). Women with
Middle East ethnic origin had the highest prevalence of
19.5% (12.19-26.81), compared to 17.5% (12.08-22.92)
among South Asians and 11.3% (6.09-16.51) in the group
of other ethnic minorities (Eastern Europe, Africa South
of Sahara, East Asia, and South and Central America).
Middle Eastern women also had the highest median
EPDS score of 6 (IQR: 2; 9) compared with South
Asians: median of 3 (IQR 1; 7.5), Western Europeans:
median of 3 (IQR: 1; 5), and other ethnic minorities: me-
dian of 3 (IQR 1; 7).
In the total study population, 60 women had an EPDS
score ≥12 (8.0% (6.06-9.94), and the breakdown accord-
ing to group was 4.6% (2.25-6.95) in Western Europeans
versus 10.6% (7.56-13.24) in the merged ethnic minority
group (p < 0.001).
Risk factors for depression in pregnancy
Among women with EPDS ≥10, a total of 72.3 % had an
ethnic minority background (Table 2). A higher number
of women with EPDS ≥10 were unemployed, had a low
SEP, reported single parenthood, more recent adverse
life events and poor subjective health.
In the logistic regression analyses using EPDS ≥10 as
the dependent variable (Models 1 and 2), women from
the Middle East and South Asia had significantly higher
ORs than Western European women (Table 3). Ethnic
minority origin from the Middle East (OR 2.81; 95% CI:
(1.29-6.15)) and South Asia (2.72; 95% CI: (1.35-5.48))
Table 1 Baseline characteristics for Western and ethnic minority women
Total n =749 Western Europen = 305
Ethnic MinorityGroup n = 444
South Asian = 189
Middle Eastn = 113
OtherMinoritiesn = 142
n (%) n (%) n (%) n (%) n (%) n(%)
Age, mean (SD) 29.9 (4.84) 30.9 (4.50) 29.2 (4.93) 28.7 (4.46) 29.6 (5.46) 29.4 (5.07)
Week of inclusion, mean (SD) 15.1 (3.39) 14.2 (2.25) 15.7 (3.87) 15.6 (3.86) 15.1 (3.27) 16.2 (4.26)
Nulliparous 344 (45.9) 157 (51.5) 187 (42.1) 78 (41.3) 40 (35.4) 69 (48.6)
Single parenthood1 40 (5.3) 13 (4.3) 27 (6.1) 2 (1.1) 5 (4.4) 20 (14.1)
Education
<10 years of education 120 (16.1) 9 (3.0) 111 (25.2) 34 (18.1) 42 (37.5) 35 (24.8)
10-12 years 295 (39.7) 95 (31.4) 200 (45.4) 93 (49.5) 51 (45.5) 56 (39.7)
13-16 years 229 (30.8) 126 (41.6) 103 (23.4) 48 (25.5) 16 (14.3) 39 (27.7)
university/college 100(13.5) 73 (24.1) 27 (6.1) 13 (6.9) 3 (2.7) 11 (7.8)
Unemployed in pre-pregnancy 219 (29.5) 36 (11.9) 183 (41.7) 71 (38.0) 59 (52.2) 53 (38.1)
Proportion with low score for socioeconomic position 294 (39.3) 61 (20) 233 (52.5) 88 (46.6) 72 (63.7) 73 (51.4)
Proportion with low score for social integration 300 (40.1) 17(5.6) 283 (63.7) 122 (64.6) 73 (64.6) 88 (62.0)
Self-reported adverse life events at inclusion2
≥2 events 66 (9.1) 23 (7.8) 43 (10.0) 16 (8.6) 16 (14.5) 11 (8.2)
Self-reported adverse life events after inclusion3
≥2 events 45 (6.1) 16 (5.4) 29 (6.5) 14 (7.4) 10 (8.8) 5 (3.6)
Poor subjective health 3 months before pregnancy 77 (10.4) 17 (5.6) 60 (13.7) 30 (16.0) 18 (16.2) 12 (8.7)
Previous history of depression3 114 (18.2) 61 (23.1) 53 (14.6) 21 (13.5) 15 (16.5) 17 (14.8)
1Living without a partner.2Past six months.3Data collected postpartum.
Values are n (%) if not stated otherwise.
Shakeel et al. BMC Pregnancy and Childbirth (2015) 15:5 Page 5 of 11

remained independent risk factors for depression when
adjusted for single parenthood, gestational week of in-
clusion, adverse life events, poor subjective health and
history of depression (Model 1, R2 19.7%).
In Model 2, with additional adjustment for SEP and
other available variables potentially reflecting social
support (living with in-laws or with own parents), the
ORs of the Middle Easterners and South Asians were re-
duced by 16-18% (Middle Easterners: 2.44; 95% CI:
(1.07-5.57); South Asians: 2.25; 95% CI: (1.07-4.72)), but
still remained strong and significant, indicating less re-
sidual confounding in this model (R2 20.7%). In both
model 1 and 2, reporting ≥ 3 recent adverse life events
(six months before inclusion), a history of depression
and poor subjective health three months before concep-
tion were robust and significant risk factors. Single
parenthood was borderline significant in the last model
(p = 0.06). In model 2, living with in-laws seemed to in-
crease the risk of depression (OR 2.41; 95% CI: (0.86-6.75)),
but did not reach significance (p = 0.096). When replacing
living with in-laws with living with one’s own parents, the
effect of family structure was the opposite, indicating a
trend towards protection, although not significant.
To investigate our secondary aim, we replaced ethni-
city by the PCA variable for overall level of integration
(Model 3), due to the strong correlation between
markers of social integration and ethnicity. In the alter-
native modelling strategy, the variable reflecting social
integration was significant (OR = 1.84; 95% CI: (1.07-
3.17)), including history of depression, recent adverse life
events and poor subjective health three months before
Figure 2 Prevalence of depression in pregnancy in percentage,
for the different ethnic groups with 95% confidence
intervals, CI.
Table 2 Sociodemographic characteristics for women with Edinburgh Postnatal Depression Scale score above and
below cut-off 10
Total 749 (100%) EPDS ≥10, n = 97 (13%) EPDS < 10, n = 652 (87%) p-value4
Ethnic minority women 444 (59.3) 71 (73.2) 373 (57.2) 0.003
Age, mean (SD) 29.9 (4.84) 30 (5.17) 29.9 (4.79) 0.743
Nulliparous 344 (45.9) 39 (40.2) 305 (46.8) 0.226
Single parenthood1 40 (5.3) 11 (11.3) 29 (4.4) 0.005
Educational level
<10 years education 120 (16.1) 19 (15.6) 101 (19.6) 0.721
10-12 yrs, secondary level 295 (39.7) 39 (39.6) 256 (39.8)
up to 4 years of higher education 229 (30.8) 28 (28.9) 201 (31.1)
University/college 100 (13.4) 11 (11.3) 89 (13.8)
Unemployed/working disabled (pre-pregnant) 219 (29.5) 39 (40.2) 180 (27.9) 0.013
Proportion with low SEP score 294 (39.3) 48 (49.5) 246 (37.7) 0.027
Proportion with low score for social integration 300 (40.0) 47 (48.5) 253 (38.8) 0.070
Sum score of recent adverse life events2
0 or 1 event 544 (76.2) 49 (54.4) 495 (79.3) <0.001
2 events 107 (14.9) 17 (18.9) 90 (14.4)
≥3events 63 (8.8) 24 (26.7) 39 (6.3)
Poor subjective health 3 months before pregnancy 77 (10.4) 22 (23.4) 55 (8.5) <0.001
History of depression3 114 (18.2) 29 (36.3) 85 (15.6) <0.001
1Living without a partner.2From six months before pregnancy to gestational week 28.3Data collected postpartum.4Chi-square tests (%) for categorical variables or t-test (SD) for age (yrs).
Values are in n (%) if not stated otherwise.
Shakeel et al. BMC Pregnancy and Childbirth (2015) 15:5 Page 6 of 11

conception, although the total explained variance in this
model was slightly reduced (R2 18.9%).
To examine which of the individual items related to so-
cial integration contributed most to the model, we per-
formed separate analyses within the subgroup of ethnic
minority women. The PCA variable for level of social inte-
gration in Model 3 was replaced sequentially by the follow-
ing variables one-at-a-time: 1) self-reported abilities in
Norwegian, 2) time of residence in Norway, 3) how often
during the last year the participant read Norwegian news-
papers/ watched Norwegian TV, 4) was visited by an ethnic
Norwegian. Only reading Norwegian newspapers/watching
Norwegian TV “never” or “less than once a week” during
the last year was independently associated with depression
in pregnancy (results not shown).
In the sensitivity analyses using a stricter definition
with EPDS sum score ≥ 12 as the primary dependent
variable, results remained relatively unchanged. Specific-
ally, risk of depression was independently associated
with ethnic minority background (OR = 3.3, P = 0.007),
self-reported history of depression and recent adverse
life advents. With an EPDS cut-off value of ≥ 12, the R2
was 22.4% when using the same variables as in Model 2.
DiscussionOur study adds to the sparse literature about depression
in pregnancy among multi-ethnic populations. We found
that depression in pregnancy (defined as an EPDS
score ≥ 10), was twice as prevalent in ethnic minority
women as Western Europeans. However, this increased
Table 3 Odds Ratio (OR) for depression in pregnancy in univariate and multiple logistic regression analyses
Unadjusted OR *Model 1 (R2 = 19.7%) *Model 2 (R2 = 20.7%) *Model 3 (R2 = 18.9%)
OR 95% CI p-value OR 95% CI p-value OR 95% CI p-value OR 95% CI p-value
Ethnic origin (Western Europe ref)
Middle East 2.60 1.40-2.80 0.002 2.81 1.29-6.15 0.010 2.44 1.07-5.57 0.034
South Asia 2.27 1.31-3.94 0.003 2.72 1.35-5.48 0.005 2.25 1.07-4.72 0.033
Other minorities 1.36 0.71-2.63 0.356 1.24 0.51-3.04 0.638 1.16 0.46-2.88 0.759
Gestational week at inclusion 1.03 0.97-1.10 0.380 0.99 0.92-1.08 0.878 0.99 0.91-1.08 0.863 0.99 0.91-1.08 0.781
Age 1.01 0.97-1.05 0.743
Single parenthood1 2.75 1.33-5.71) 0.007 2.91 1.035-8.18 0.043 2.74 0.96-7.84 0.060 2.05 0.79-5.36 0.143
Adverse life events
(0-1 ref)
2 1.91 1.05-3.46 0.033 1.54 0.77-3.08 0.222 1.58 0.79-3.17 0.199 1.64 0.82-3.27 0.161
≥3 6.22 3.46-11.18 <0.001 4.97 2.45-10.08 <0.001 4.95 2.43-10.10 <0.001 4.83 2.40-9.70 <0.001
Poor self-reported health2
good (ref)
bad 3.28 1.89-5.70 <0.001 2.00 1.01-3.99 0.048 2.08 1.04-4.16 0.039 2.29 1.16-4.48 0.016
Mother’s socioeconomic position (SEP)
highest 60% (ref)
lowest 40% 1.62 0.10-2.65 0.028 1.30 0.73-2.31 0.370 1.68 0.98-2.90 0.061
Mother’s level of social integration
highest 60% (ref)
lowest 40% 1.48 0.97-2.28 0.072 1.84 1.07-3.17 0.027
Previous history of depression3 3.01 1.86-5.14 <0.001 2.77 1.51-5.06 0.001 2.83 1.53-5.20 0.001 2.61 1.44-4.73 0.002
Read Norwegian newspapers/watch TV
Daily(ref)
Weekly 0.85 0.087-8.32 0.889
Seldom 1.12 0.42-3.01 0.828
Never 2.94 1.0-8.67 0.051
Living together with in-laws 1.41 0.55-3.60 0.472 2.41 0.86-6.75 0.096
1Living without partner.23months before pregnancy.3Collected postpartum.*Model 1-3: multiple logistic regression analyses with adjusted OR for included variables.
Shakeel et al. BMC Pregnancy and Childbirth (2015) 15:5 Page 7 of 11

risk did not apply equally to all groups of ethnic minor-
ity women. Middle Eastern and South Asian women had
a significantly higher OR than the other minority women
and Western Europeans, even after adjusting for known
risk factors, including SEP. A history of depression, ad-
verse life events and poor subjective health prior to
pregnancy were independent risk factors, while single
parenthood was borderline significant.
When replaced by ethnicity, level of social integration
functioned as a significant risk factor for depression in
pregnancy, in addition to a history of depression, adverse
life events and poor subjective health before pregnancy.
Specifically, results indicated that some aspects of social
integration, such as reading Norwegian newspapers or
watching Norwegian TV never or less than once a week,
may serve as a proxy for factors related to integration
that mediate the increased risk of depression observed
in ethnic minority women.
Most previous studies have used an EPDS score ≥10 as
a proxy for depression. In a Norwegian study of postpar-
tum women to establish the validity of the EPDS against
clinical diagnostic interviews and other screening instru-
ments, an EPDS score of ≥10 had a sensitivity of 100%
and specificity of 87% [46], compared to a sensitivity of
95% for major depression and a specificity of 93% for
the English version [48]. However, false positives might
be expected when using the EPDS as a screening instru-
ment in clinical practice, thereby necessitating a clinical
evaluation or diagnostic test to identify cases of clinical
depression in need of treatment. In this regard, women
with EPDS ≥10 are not necessarily clinically depressed,
but have an increased level of depressive symptoms,
which in turn implies a higher risk of depression. As our
aim was to compare the symptom load in different ethnic
groups in Europe mainly with Asian and African origin,
living in the same residential area in the capital of Norway,
we used the same cut-off value for all the pregnant
women. Some researchers have employed a stricter EPDS
score ≥12 [29], thus we also performed sensitivity analyses
with this threshold. Results were essentially unchanged,
with similar effect estimates, despite loss of power.
Prevalence estimates of depression in pregnancy differ
substantially across studies, likely attributable to popula-
tion heterogeneity, but also due to methodological differ-
ences such as choice of measurement [51,52]. Our
findings are in accordance with a recent Cochrane meta-
analysis of 21 studies [3], which reported that the preva-
lence of depression in pregnancy ranged from 7.4% in
the first trimester to 12.8% in the second trimester, with
a mean prevalence rate of 10.7%. Very few studies report
results stratified by ethnicity, and this review failed to
report the prevalence in minority groups. However, one
study found that ethnic minority origin, specifically
Asian, was associated with high EPDS scores [53]. A
Swedish study found a significantly higher adjusted OR
for depression in non-native speakers compared to
women speaking the native language [24]. An Italian
study investigating the prevalence of depression in preg-
nancy (EPDS ≥10) found a prevalence rate of 21.9%
among the total sample, which included 7.5% of partici-
pants with a non-Italian background [54]. Women with
depressive symptoms were more likely to be non-Italians
and unemployed, with greater socioeconomic stress. An-
other Italian multi-centre, cross-sectional study similarly
reported that a higher risk of depressive symptoms was
associated with an ethnic minority background, a history
of depression, being single and unemployment [55]. The
Born in Bradford study of pregnant women used the
General Health Questionnaire (GHQ-28), and found that
ethnic minorities had higher risk of depression. Strug-
gling financially, and for some ethnic groups not being
part of the work force, also increased the risk of poor
mental health [23]. While it is well-documented that a
history of affective disorders is a strong risk factor for
postpartum depression, only few articles have investi-
gated the association between a history of depression
and depression during pregnancy [3]. We found a strong
association between a history of depression and depres-
sive symptoms in pregnancy, regardless of ethnicity.
When comparing our results from pregnancy with stud-
ies using the EPDS instrument from countries where the
ethnic minorities in Oslo originate from, they mostly re-
port higher rates. We identified studies from Middle-East
reporting prevalence rates from 19% to 57% [56-59]. Simi-
larly, studies from Pakistan reported prevalence rates of
depression to be 25% [60,61], but a recent study from
Punjab, where most Pakistanis in Norway originally come
from, reported even higher rates [62]. We did not find
studies from the Tamil population in Sri-Lanka, only one
for postpartum depression in India [63]. However, direct
comparison is difficult due to methodological issues, not
least the representativeness of included samples. Context-
ual factors also differ considerably.
Our study has several strengths. It is based upon a co-
hort design with a population-based sample including a
high proportion of ethnic minorities, and the attendance
rate was high. We have succeeded in including illiterate
and recently immigrated women by adapting the study
methods to the needs of these women [26]. The results
are considered generalizable to the total cohort of 823
women included in the STORK-Groruddalen study, as
no significant differences between participants and the
those with missing data om EPDS (n = 74) were found.
We also have information on a broad range of socio-
economic measures, family structure, variables related to
level of social integration, and we have applied an etio-
logical approach. To our knowledge, only a few studies
have explored depression in pregnancy among multi-
Shakeel et al. BMC Pregnancy and Childbirth (2015) 15:5 Page 8 of 11

ethnic populations and even fewer have presented ana-
lyses for several ethnic minority groups.
Some manifestations of pregnancy, particularly during
the first trimester, may mirror symptoms of depression,
such as fatigue, poor appetite and sleeping problems. As
a consequence, depressed pregnant women often tend to
have higher scores than non-pregnant women on avail-
able diagnostic tools, such as the Centre for Epidemio-
logic Studies Depression Scale (CES-D) [5]. The EPDS
does not include any somatic symptoms, rendering this
measure methodologically advantageous to use among
pregnant women [64,65].
In our study, the EPDS was administered through inter-
views performed by certified study midwives. However,
some women may have felt uncomfortable reporting prob-
lems in a face-to-face setting with a health care profes-
sional. If so, this may have led to underreporting and
consequently an underestimate of the prevalence of
depression. This may have been the case in a previous
Norwegian study of postpartum depression in Pakistani
women, in which the prevalence of depression was found
to be 7.6% [66]. In that study, the women were inter-
viewed at home, with family members, sometimes the hus-
band, being present or acting as translators.
Nevertheless, there are some noteworthy limitations.
We did not have direct measures of social support, but
relied upon indirect measures like single parenthood
and family structure. Further, information about history
of depression was self-reported and collected in the
postpartum period, thereby subject to various recall and
memory biases associated with retrospective self-report.
We cannot rule out that if a woman had her first depres-
sive symptoms ever in the index pregnancy, she refers to
this episode. However, it seems unlikely that this may be
the case for many women, and that this category error
would have a large effect on the estimates. The small
number in some ethnic minority groups limited study
power and the number of categories included in the re-
gression analyses, especially for the sensitivity analyses
using EPDS ≥12 as the cut-off score. Heterogeneity
within the relatively broad ethnic groups probably exists,
and our grouping strategy may have also masked im-
portant within-group differences.
Lastly, an important issue for any study of multi-ethnic
populations is the cross-cultural validity of the instrument
used. The expression of depression may differ according
to cultural context [47]. The EPDS instrument has been
used extensively worldwide, with established psychometric
properties across different contexts and cultures. We used
official and validated versions to the extent possible. The
Urdu version of the EPDS has been used in Pakistan with
good psychometric properties [67]. The Tamil version
has been validated in a Tamil population in India with
high specificity and sensitivity [68], the Turkish version
has satisfactory validity when used in a Turkish sample
[69]. The Arabic and Vietnamese versions have also been
validated and found to be reliable [47]. Although we used
the official translation for the Somalian language, we were
unable to find any validation studies for this version. We
did not have the resources to formally validate our Sorani
version of the instrument.
As in the rest of Europe, there is an increasing number
of ethnic minorities in Norway. The awareness in health
policy is growing about the importance of adapting ser-
vices for these groups to meet their needs according to
legal standards of equity, but little is known about the
actual quality of care. When planning services for the
ethnic minority groups, knowledge about relevant risk
factors are necessary to design preventive and manage-
ment strategies. The EPDS measure is so far not recom-
mended as a routine screening test for antenatal and
postpartum depression, as more studies about the effect
of such a procedure on patient important outcomes in
the Norwegian context is requested.
ConclusionAlthough Middle Eastern and South Asian women were
more likely to be depressed, a low SEP partly explained
their increased risk. Irrespective of ethnicity, a history of
depression, recent adverse life events and poor subject-
ive health remained independent risk factors for depres-
sion. Data also suggest that a low level of social
integration may mediate the increased risk observed in
ethnic minorities. However, cultural factors or other un-
measured variables may likely contribute to risk status.
In sum, our findings point to the potential for improving
mental health among high-risk ethnic minority pregnant
women by improving socioeconomic conditions and fa-
cilitating integration.
Abbreviation
CHC: Child Health Clinics; GP: General practitioner; GW: Gestational week;
SD: Standard deviation; EPDS: Edinburgh Postnatal Depression Scale;
IQR: Interquartile range; SEP: Socioeconomic position; PCA: Principal
component analysis; OR: Odds ratio; GHQ: General health questionnaire;
CES-D: Center for epidemiologic studies scale.
Competing interests
The authors declare that they have no competing interests.
Authors’ contributions
NS performed the statistical analysis (except the PCA analyses, wrote the first
draft and revised the paper, LS contributed with the data acquisition and
performed the PCA analyses on socio-economic and integration variables,
ME-G, KS, and EWM contributed with expert knowledge about the EPDS and
other instruments to capture depression, and IH with the statistical advice.
AKJ initiated and was the project leader of the STORK Groruddalen study. All
authors contributed to the interpretation of data, revised the manuscript
critically, checked for clarity and content, and approved the final version.
Acknowledgements
The authors thank all the study participants. We also thank Johan Torper, H S
Hatlehol and the other study staff at the CHCs in Stovner, Grorud and Bjerke
districts in Oslo, and Haavard Skaaland, Kjersti Mørkrid and Ragnhild Sørum
Shakeel et al. BMC Pregnancy and Childbirth (2015) 15:5 Page 9 of 11

Falk, Oslo University Hospital, for help with preparing the database and
statistical analyses. Translation of information material and questionnaires
was performed by the City Services Department, The Interpreting and
Translating Service in Oslo.
Funding
The STORK Groruddalen research program was primarily funded by the
Norwegian Research Council, with additional funding from The South-
Eastern Norway Regional Health Authority, Norwegian Directorate of Health
and collaborative partners in The City of Oslo, Stovner, Grorud and Bjerke
administrative districts. Nilam Shakeel received funding for a PhD grant
through the Norwegian Research Fund for General Practice. The funder had
no involvement in any aspects of the study.
Author details1University of Oslo Institue for health and society, departement of general
practice, Norway, Avdeling for allmennmedisin, institutt for helse og
samfunn, Universitetet i Oslo, Norge, Postboks 1130 Blindern, Oslo 0318,
Norway. 2Department of Psychosomatics and Health Behaviour, Division of
Mental Health, Norwegian Institute of Public Health, Oslo, Norway. 3Health
Services Research Center, Akershus University Hospital, Lørenskog, Norway.4Institute of Clinical Medicine, Campus Ahus, University of Oslo, Lørenskog,
Norway. 5Department of Child and Adolescents Medicine, Akershus
University Hospital, Lørenskog, Norway. 6The Center for Child and Adolescent
Mental Health, Eastern and Southern Norway (RBUP), Oslo, Norway.7Department of psychology, University of Oslo, Oslo, Norway. 8Division of
Mental Health and Addiction, Oslo University Hospital, Institute of Clinical
Medicine, University of Oslo, Oslo, Norway. 9Oslo University Hospital Ullevål,
departement of Biostatic, Epidemiology and Health economics, Oslo, Norway.10Department of General Practice, Institute of Health and Society, Faculty of
Medicine, University of Oslo, Oslo, Norway. 11Faculty of Health Sciences, Oslo
and Akershus University College of Applied Sciences, Oslo, Norway.
Received: 7 May 2014 Accepted: 9 December 2014
References
1. Leung BM, Kaplan BJ. Perinatal depression: prevalence, risks, and the nutrition
link–a review of the literature. J Am Diet Assoc. 2009;109(9):1566–75.
2. Van den Bergh BRH, Mulder EJH, Mennes M, Glover V. Antenatal maternal
anxiety and stress and the neurobehavioural development of the fetus and
child: links and possible mechanisms. A review. Neurosci Biobehav Rev.
2005;29(2):237–58.
3. Dennis CL, Allen K. Interventions (other than pharmacological, psychosocial
or psychological) for treating antenatal depression. Cochrane Database Syst
Rev. 2008;4:CD006795.
4. Goedhart G, Snijders AC, Hesselink AE, Van Poppel MN, Bonsel GJ, Vrijkotte
TGM. Maternal depressive symptoms in relation to perinatal mortality and
morbidity: results from a large multiethnic cohort study. Psychosom Med.
2010;72(8):769–76.
5. Orr ST, Miller CA. Maternal depressive symptoms and the risk of poor
pregnancy outcome. Review of the literature and preliminary findings.
Epidemiol Rev. 1995;17(1):165–71.
6. Dayan J, Creveuil C, Dreyfus M, Herlicoviez M, Baleyte JM, O’Keane V.
Developmental model of depression applied to prenatal depression: role of
present and past life events, past emotional disorders and pregnancy stress.
PLoS ONE. 2010;5(9):e12942.
7. Marcus SM, Flynn HA, Blow FC, Barry KL. Depressive symptoms among
pregnant women screened in obstetrics settings. J Womens Health
(Larchmt). 2003;12(4):373–80.
8. Rubertsson C, Waldenström U, Wickberg B. Depressive mood in early
pregnancy: Prevalence and women at risk in a national Swedish sample.
J Reprod Infant Psychol. 2003;21(2):113–23.
9. Harvey ST, Pun PK. Analysis of positive Edinburgh depression scale referrals
to a consultation liaison psychiatry service in a two-year period. Int J Ment
Health Nurs. 2007;16(3):161–7.
10. Eberhard-Gran M, Slinning K. Nedstemthet og depresjon i forbindelse med
fødsel (Depressed mood and depression associated with the birth). 2007.
11. Eberhard-Gran M, Tambs K, Opjordsmoen S, Skrondal A, Eskild A. Depression
during pregnancy and after delivery: a repeated measurement study.
J Psychosom Obstet Gynaecol. 2004;25(1):15–21.
12. Karlsen S, Nazroo JY. Relation between racial discrimination, social class, and
health among ethnic minority groups. Am J Public Health. 2002;92(4):624–31.
13. Williams DR. Race, socioeconomic status, and health. The added effects of
racism and discrimination. Ann N Y Acad Sci. 1999;896:173–88.
14. Fung K, Dennis CL. Postpartum depression among immigrant women. Curr
Opin Psychiatry. 2010;23(4):342–8.
15. Bhugra D. Cultural identities and cultural congruency: a new model for
evaluating mental distress in immigrants. Acta Psychiatr Scand. 2005;111(2):84–93.
16. Bhugra D, Becker MA. Migration, cultural bereavement and cultural identity.
World Psychiatry. 2005;4(1):18–24.
17. Eberhard-Gran M, Garthus-Niegel S, Garthus-Niegel K, Eskild A. Postnatal
care: a cross-cultural and historical perspective. Arch Womens Ment Health.
2010;13(6):459–66.
18. Edge D. Falling through the net - Black and minority ethnic women and
perinatal mental healthcare: health professionals’ views. Gen Hosp
Psychiatry. 2010;32(1):17–25.
19. Husain N, Cruickshank K, Husain M, Khan S, Tomenson B, Rahman A. Social
stress and depression during pregnancy and in the postnatal period in
British Pakistani mothers: a cohort study. Journal of Affective Disorders.
2012;140(3):268–76.
20. Lansakara N, Brown SJ, Gartland D. Birth outcomes, postpartum health and
primary care contacts of immigrant mothers in an Australian nulliparous
pregnancy cohort study. Matern Child Health J. 2010;14(5):807–16.
21. Miszkurka M, Goulet L, Zunzunegui MV. Antenatal depressive symptoms
among Canadian-born and immigrant women in Quebec: differential
exposure and vulnerability to contextual risk factors. Soc Psychiatry Psychiatr
Epidemiol. 2012;47(10):1639–48.
22. Miszkurka M, Goulet L, Zunzunegui MV. Contributions of immigration to
depressive symptoms among pregnant women in Canada. Can J Public
Health. 2010;101(5):358–64.
23. Prady SL, Picket KE, Croudace T, Fairley L, Bloor K, Gilbody S, et al. Psychological
distress during pregnancy in a multi-ethnic community: findings from the born
in Bradford cohort study. PLoS ONE. 2013;8(4):e60693.
24. Wangel AM, Schei B, Ryding EL, Ostman M. Mental health status in
pregnancy among native and non-native Swedish-speaking women: a
Bidens study. Acta Obstet Gynecol Scand. 2012;91(12):1395–401.
25. Jenum AK, Mørkrid K, Sletner L, Vangen S, Torper JL, Nakstad B, et al. Impact of
ethnicity on gestational diabetes identified with the WHO and the modified
International Association of Diabetes and Pregnancy Study Groups criteria: a
population-based cohort study. Eur J Endocrinol. 2012;166(2):317–24.
26. Jenum AK, Sletner L, Vangen S, Mørkrid K, Andersen LF, Nakstad B, et al. The
STORK Groruddalen research programme: A population-based cohort study
of gestational diabetes, physical activity, and obesity in pregnancy in a
multiethnic population. Rationale, methods, study population, and
participation rates. Scand J Public Health. 2010;38(5):60–70.
27. Cox J. A guide to the Edinburgh Postnatal Depression Scale. 2003.
28. Cox JL, Holden JM, Sagovsky R. Detection of postnatal depression.
Development of the 10-item Edinburgh Postnatal Depression Scale.
Br J Psychiatry. 1987;150:782–6.
29. Murray L, Carothers AD. The validation of the Edinburgh Post-natal Depression
Scale on a community sample. Br J Psychiatry. 1990;157:288–90.
30. Cox JL, Chapman G, Murray D, Jones P. Validation of the Edinburgh
Postnatal Depression Scale (EPDS) in non-postnatal women. J Affect Disord.
1996;39(3):185–9.
31. Bunevicius A, Kusiminskas L, Pop VJ, Pedersen CA, Bunevicius R. Screening
for antenatal depression with the Edinburgh Depression Scale. J Psychosom
Obstet Gynaecol. 2009;30(4):238–43.
32. Rubertsson C, Borjesson K, Berglund A, Josefsson A, Sydsjo G. The Swedish
validation of Edinburgh Postnatal Depression Scale (EPDS) during
pregnancy. Nord J Psychiatry. 2011;65(6):414–8.
33. Murray D, Cox JL. Screening for depression during pregnancy with the
edinburgh depression scale (EDDS). J Reprod Infant Psychol. 1990;8(2):99–107.
34. Husain N, Rahman A, Husain M, Khan SM, Vyas A, Tomenson B, et al.
Detecting Depression in Pregnancy: Validation of EPDS in British Pakistani
Mothers. J Immigr Minor Health. 2014;16(6):1085–92.
35. Hewitt C, Gilbody SM, Brealey S, Paulden M, Palmer S, Mann R, et al.
Methods to identify postnatal depression in primary care: an integrated
evidence synthesis and value of information analysis. Health Technol Assess.
2009;13(36):1–145. 147-230.
36. Berle JO, Arre TF, Mykletun A, Dahl AA, Holsten F. Screening for postnatal
depression. Validation of the Norwegian version of the Edinburgh Postnatal
Shakeel et al. BMC Pregnancy and Childbirth (2015) 15:5 Page 10 of 11

Depression Scale, and assessment of risk factors for postnatal depression.
J Affect Disord. 2003;76(1-3):151–6.
37. Nordeng H, Hansen C, Garthus-Niegel S, Eberhard-Gran M. Fear of childbirth,
mental health, and medication use during pregnancy. Arch Womens Ment
Health. 2012;15(3):203–9.
38. Dorheim SK, Bjorvatn B, Eberhard-Gran M. Insomnia and depressive symptoms in
late pregnancy: a population-based study. Behav Sleep Med. 2012;10(3):152–66.
39. Garthus-Niegel S, Von Soest T, Vollrath M, Eberhard-Gran M. The impact
of subjective birth experiences on post-traumatic stress symptoms:
a longitudinal study. Arch Womens Ment Health. 2013;16(1):1–10.
40. Gjestland K, Bø K, Owe KM, Eberhard-Gran M. Do pregnant women follow
exercise guidelines? Prevalence data among 3482 women, and prediction
of low-back pain, pelvic girdle pain and depression. Br J Sports Med.
2013;47(8):515–20.
41. Dorheim SK, Bjorvatn B, Eberhard-Gran M. Sick leave during pregnancy: a
longitudinal study of rates and risk factors in a Norwegian population. BJOG.
2013;120(5):521–30.
42. Storksen HT, Eberhard-Gran M, Garthus-Niegel S, Eskild A. Fear of childbirth;
the relation to anxiety and depression. Acta Obstet Gynecol Scand. 2012;91
(2):237–42.
43. Storksen HT, Eberhard-Gran M, Garthus-Niegel S, Eskild A. The impact of
previous birth experiences on maternal fear of childbirth. Acta Obstet
Gynecol Scand. 2013;92(3):318–24.
44. Dorheim SK, Bjorvatn B, Eberhard-Gran M. Can insomnia in pregnancy
predict postpartum depression? A longitudinal, population-based study.
PLoS ONE. 2014;9(4):e94674.
45. Garthus-Niegel S, Størksen HT, Torgersen L, Von Soest T, Eberhard-Gran M.
The Wijma Delivery Expectancy/Experience Questionnaire: a factor analytic
study. J Psychosom Obstet Gynaecol. 2011;32(3):160–3.
46. Eberhard-Gran M, Eskild A, Tambs K, Schei B, Opjordsmoen S. The
Edinburgh Postnatal Depression Scale: validation in a Norwegian
community sample. Nord J Psychiatry. 2001;55(2):113–7.
47. Marshall J. Edinburgh Poastnatal depression scale (EPDS) Translated
Versions. 2006.
48. Harris B, Huckle P, Thomas R, Johns S, Fung H. The use of rating scales to
identify post-natal depression. Br J Psychiatry. 1989;154:813–7.
49. Kendler KS, Neale MC, Kessler RC, Health AC, Eaves LJ. The lifetime history of
major depression in women, Reliability of diagnosis and heritability. Arch
Gen Psychiatry. 1993;50(11):863–70.
50. Sommer C, Sletner L, Jenum AK, Morkrid K, Andersen LF, Birkeland KI, Mosdøl A:
Ethnic differences in maternal dietary patterns are largely explained by
socio-economic score and integration score: a population-based study.
Food Nutr Res 2013 jul 8; 57. doi: 10.3402/fnr.v57i0.21164
51. Apter G, Devouche E, Gratier M. Perinatal mental health. J Nerv Ment Dis.
2011;199(8):575–7.
52. Bennett HA, Einarson A, Taddio A, Koren G, Einarson TR. Prevalence of
depression during pregnancy: systematic review. Obstet Gynecol. 2004;103
(4):698–709.
53. Onozawa K, Kumar RC, Adams D, Doré C, Glover V. High EPDS scores in
women from ethnic minorities living in London. Arch Womens Ment
Health. 2003;6 Suppl 2:S51–5.
54. Giardinelli L, Innocenti A, Benni L, Stefanini MC, Lino G, Lunardi C, et al.
Depression and anxiety in perinatal period: Prevalence and risk factors in an
Italian sample. Arch Women’s Mental Health. 2012;15(1):21–30.
55. Matteo B, Miriam L, Giulia B, Salvatore C, Anita C, Lorenza D, et al.
Determinants of ante-partum depression: a multicenter study. Soc Psychiatry
Psychiatr Epidemiol. 2012;47(12):1959–65.
56. Karacam Z, Ancel G. Depression, anxiety and influencing factors in
pregnancy: a study in a Turkish population. Midwifery. 2009;25(4):344–56.
57. Golbasi Z, Kelleci M, Kisacik G, Cetin A. Prevalence and correlates of
depression in pregnancy among Turkish women. Matern Child Health J.
2010;14(4):485–91.
58. Abujilban SK, Abuidhail J, Al-Modallal H, Hamaideh S, Mosemli O. Predictors
of antenatal depression among jordanian pregnant women in their third
trimester. Health Care Women Int. 2014;35(2):200–15.
59. Mohammad KI, Gamble J, Creedy DK. Prevalence and factors associated
with the development of antenatal and postnatal depression among
Jordanian women. Midwifery. 2011;27(6):e238–45.
60. Husain N, Parveen A, Husain M, Saeed Q, Jafri F, Rahman R, et al. Prevalence
and psychosocial correlates of perinatal depression: a cohort study from
urban Pakistan. Arch Womens Ment Health. 2011;14(5):395–403.
61. Rahman A, Iqbal Z, Harrington R. Life events, social support and depression
in childbirth: perspectives from a rural community in the developing world.
Psychol Med. 2003;33(7):1161–7.
62. Humayun A, Haider II, Imran N, Iqbal H, Humayun N. Antenatal depression and
its predictors in lahore, Pakistan. East Mediterr Health J. 2013;19(4):327–32.
63. Savarimuthu RJ, Ezhilarasu P, Charles H, Antonisami B, Kurian S, Jacob KS.
Post-partum depression in the community: a qualitative study from rural
South India. Int J Soc Psychiatry. 2010;56(1):94–102.
64. Adewuya AO, Ola BA, Dada AO, Fasoto OO. Validation of the Edinburgh
Postnatal Depression Scale as a screening tool for depression in late
pregnancy among Nigerian women. J Psychosom Obstet Gynaecol.
2006;27(4):267–72.
65. Felice E, Saliba J, Grech J, Cox J. Validation of the Maltese version of the
Edinburgh Postnatal Depression Scale. Arch Womens Ment Health.
2006;9(2):75–80.
66. Bjerke SE, Vangen S, Nordhagen R, Ytterdahl T, Magnus P, Stray-Pedersen B.
Postpartum depression among Pakistani women in Norway: prevalence and
risk factors. J Matern Fetal Neonatal Med. 2008;21(12):889–94.
67. Husain N, Bevc I, Husain M, Chaudry IB, Atif N, Rahman A. Prevalence and
social correlates of postnatal depression in a low income country. Arch
Womens Ment Health. 2006;9(4):197–202.
68. Benjamin D, Chandramohan A, Annie IK, Prasad J, Jacob KS. Validation of
the tamil version of Edinburgh post-partum depression scale. J Obstet
Gynecol India. 2005;55:242–3.
69. Aydin N, Inandi T, Yigit A, Hodoglugil NN. Validation of the Turkish version
of the Edinburgh Postnatal Depression Scale among women within their
first postpartum year. Soc Psychiatry Psychiatr Epidemiol. 2004;39(6):483–6.
Submit your next manuscript to BioMed Centraland take full advantage of:
• Convenient online submission
• Thorough peer review
• No space constraints or color figure charges
• Immediate publication on acceptance
• Inclusion in PubMed, CAS, Scopus and Google Scholar
• Research which is freely available for redistribution
Submit your manuscript at www.biomedcentral.com/submit
Shakeel et al. BMC Pregnancy and Childbirth (2015) 15:5 Page 11 of 11