Cognition as predictor of current and follow-up depressive symptoms in the general population
142
In search of neurobiological intermediate phenotypes of aberrant information processing in psychosis
Transcript of Cognition as predictor of current and follow-up depressive symptoms in the general population

In search of neurobiological intermediate phenotypes of
aberrant information processing in psychosis

ISBN | 978-90-8891-169-9 Cover image | brain coral, Red Sea | Victor Pardede Cover design | Claudia Simons | Box Press B.V. Print | Box Press B.V., Oisterwijk © 2010 C.J.P. Simons, Maastricht. All rights reserved. No part of this publication may be reproduced, stored in a retrieval system, or transmitted, in any form or by any means, electronic, mechanical, photocopying, recording, or otherwise, without the prior permission in writing from the proprietor.

In search of neurobiological intermediate phenotypes of
aberrant information processing in psychosis
PROEFSCHRIFT
ter verkrijging van de graad van doctor aan de Universiteit Maastricht op gezag van de Rector Magnificus, Prof. mr. G.P.M.F. Mols,
volgens het besluit van het College van Decanen in het openbaar te verdediging op vrijdag 18 juni om 10.00 uur
door
Claudia Johanna Petronella Simons
geboren op 7 september 1980 te Tegelen

Promotores
Prof. dr. J. van Os
Prof. dr. W. Riedel
Copromotor
Dr. L. Krabbendam (Vrije Universiteit Amsterdam)
Beoordelingscommissie
Prof. dr. M. de Vries (voorzitter)
Dr. A.L. van Bemmel (Geestelijke Gezondheidszorg Eindhoven en de Kempen)
Prof. dr. P. van Harten
Dr. I. Myin-Germeys
Prof. dr. W.M.A. Verhoeven (GGz Noord- en Midden-Limburg, Erasmus MC)
South Limburg Mental Health Research and Teaching Network, PhD Series
The research presented in this thesis was conducted at the School for Mental Health and Neuroscience, Department of Psychiatry and Neuropsychology, Maastricht University. The publication of this thesis was financially supported by: Eli Lilly Nederland B.V., Lundbeck B.V., Schering-Plough Nederland B.V., Servier Nederland Farma B.V.


Paranimfen
Mari de Gracia Dominguez
Stefanie Pfeifer

CONTENTS
Chapter 1 9
Introduction
Chapter 2 21
Subclinical psychotic experiences and cognitive functioning as a bivariate
phenotype for genetic studies in the general population
Chapter 3 37
Cognition as predictor of current and follow-up depressive symptoms in the
general population
Chapter 4 55
Auditory P300 and N100 components as intermediate phenotypes for
psychotic disorder: familial liability and reliability
Chapter 5 73
Subtle gene-environment interactions driving paranoia in daily life
Chapter 6 95
Functional magnetic resonance imaging of inner speech in schizophrenia
Chapter 7 115
Epilogue
Summary 127
Samenvatting 131
Dankwoord 135
Curriculum vitae 137
List of publications 139


9
CHAPTER 1
Introduction

Chapter 1
10
Introduction
Phenomenology of psychosis
Psychotic disorders, of which schizophrenia is the most prevalent and severe, are
characterised by a marked distortion in the perception of reality. Traditionally, the main
symptoms of psychotic disorder have been subdivided into positive and negative symptoms.
Positive symptoms (e.g. hallucinations, delusions) are experiences that are not present in
healthy individuals and tend to be of a fluctuating nature. In contrast, negative symptoms (e.g.
flattening of affect, apathy, poverty of thoughts or speech) reflect an absence of certain
abilities and impulses present in healthy individuals and tend to be of a more chronic nature
(Green, 2001). Affective symptoms also form an integral part of psychotic disorders. In
addition, it has been well established that psychotic disorders are characterised by robust
neurocognitive deficits, although they are not part of the diagnostic criteria for psychosis.
Deficits can be found across a broad array of cognitive domains, such as auditory attention,
episodic memory, and working memory (Faraone, et al., 1999; Krabbendam, et al., 2001) and
have been regarded as predictors of functional outcome (Green, et al., 2004).
Psychotic symptoms have been traditionally regarded as clinical manifestations that can be
either present or absent, a dichotomy still employed in clinical practice up until this day.
However, there is accumulating evidence that the psychosis phenotype is better perceived as a
continuous rather than categorical phenotype, extending from subclinical experiences to
clinical symptoms (Johns and van Os, 2001; Stefanis, et al., 2002; van Os, et al., 2009;
Verdoux and van Os, 2002). These subclinical psychotic experiences, alternatively labeled as
schizotypy, psychosis-proneness or at-risk mental states, are prevalent in the general
population (Eaton, et al., 1991; Peters, et al., 1999; Tien, 1991; Van Os, et al., 1999).
Evidence that subclinical psychotic experiences are related to underlying aetiological
influences similar to those underlying psychotic disorder further supports a continuity model
of psychosis. Investigating psychotic experiences in individuals with non-clinical expression
of the psychosis phenotype may therefore be a fruitful approach to studying the underlying
aetiology of psychosis and has the advantage that it avoids potential confounds of illness-
related factors that do not reflect psychosis vulnerability, such as institutionalisation,
stigmatisation and antipsychotic drug treatment.

Introduction
11
Aetiology of psychosis
Schizophrenia is a particularly heterogeneous disorder with multiple causes. It has been well
established that schizophrenia is a highly heritable disorder, with an estimated contribution of
genetic factors and gene–environment interactions to schizophrenia vulnerability of
approximately 80% (Cardno and Gottesman, 2000; Gottesman, 1991; Sullivan, et al., 2003).
However, genetic association studies have, as yet, failed to provide consistent results
regarding the precise mode of transmission of the genetic vulnerability. The complex genetic
architecture of the disorder has led to the search for intermediate phenotypes with a simpler
genetic basis than the dichotomous schizophrenia phenotype. Intermediate phenotypes,
alternatively called endophenotypes, are biological markers that: 1. are associated with the
illness in the population, 2. are heritable, 3. are state-independent, 4. cosegregate with the
illness within families, and 5. are present in unaffected relatives of patients to a higher degree
than in the general population (Gottesman and Gould, 2003). Studying such quantifiable,
relatively simpler and biologically-based intermediate phenotypes may guide genetic research
and assist in neurobiological validation of the overarching psychosis phenotype.
Neurocognitive intermediate phenotypes
Genetic mechanisms are likely to impact on developing brain systems, resulting in a
predisposition to schizophrenia and manifest across a wide range of neurocognitive faculties.
Consequently, behavioural measures of neurocognitive functioning are promising potential
intermediate phenotypes as are neurophysiological assessments of brain systems that bring
about specific neurocognitive processes. Neurocognitive deficits have been widely recognised
as core features of psychosis and have been shown i) to be heritable, ii) to cluster in families
of patients with a psychotic disorder and, iii) to be present in first-degree relatives of patients
at levels that are intermediate between healthy controls and patients (Krabbendam, et al.,
2001; Kremen, et al., 1994). These findings underline the well-recognized notion that deficits
in cognitive functioning can be useful intermediate phenotypes in studying psychosis
(Gottesman and Gould, 2003). At a behavioural level, largest effect sizes of neurocognitive
deficits have been reported for attention/information processing speed, memory, and
executive functioning (Braff, 1993; Dickinson, et al., 2007; Heinrichs and Zakzanis, 1998;
Morice and Delahunty, 1996; Nuechterlein and Dawson, 1984). At the neurophysiological
level, one of the most promising intermediate phenotypes is the P300 waveform. Amplitude
reduction of the auditory P300 wave is a robust finding in patients with a psychotic disorder

Chapter 1
12
and P300 latency has been shown to be delayed in patients compared with healthy controls
(Bramon, et al., 2004; Jeon and Polich, 2001), reflecting abnormalities in attention to
incoming stimulus information when representations are updated (P300 amplitude) (Polich,
2007; Turetsky, et al., 2007) and processing speed (P300 latency) (Polich, 2007).
Gen–environment interactions: stress sensitivity, COMT and BDNF
Genetic mechanisms are likely to exert their influence on developing brain systems not in
isolation, but in symphony with environmental influences (van Os and Kapur, 2009). The
impact of environmental stressors depends on the genetic makeup of the individual and any
impact of genetic variation on the phenotype is contextualized by the environment (van Os, et
al., 2008). This is essentially what is described by the widely accepted vulnerability–stress
model (Zubin and Spring, 1977).
Aversive life events (Bebbington, et al., 1993; Bebbington, et al., 1996), victimisation and
childhood trauma (Bebbington, et al., 2004; Janssen, et al., 2004; Read, 1997), and aversive
family environments (Bebbington and Kuipers, 1994; Butzlaff and Hooley, 1998) have been
consistently linked to vulnerability for psychotic disorder. These studies show that
environmental stressors can play a significant role in the emergence of psychotic symptoms,
but these studies can not establish whether sensitivity to stress may be an intermediate
phenotype because they did not asses the individual’s way of coping with the stressors. The
Experience Sampling Method (ESM) does enable the study of moment-to-moment
interactions between daily life stressors and the individual. The ESM is a momentary
assessment technique to assess subjects in their daily living environment and has been
extensively validated for the use of immediate effects of stressors on mood (Csikszentmihalyi
and Larson, 1987; Delespaul, 1995; DeVries, 1992; Myin-Germeys, et al., 2001; Wichers, et
al., 2007). These studies have shown that stress sensitivity (defined in terms of affective or
psychotic responses to self-reported daily life stressors) is higher in patients with a psychotic
disorder than in healthy controls, with first-degree relatives showing intermediate scores for
stress sensitivity (Myin-Germeys, et al., 2005; Myin-Germeys, et al., 2001). Evidence has
also been found that this heightened stress sensitivity i) is state-independent as stress
sensitivity was investigated in patients in remission (Myin-Germeys, et al., 2005; Myin-
Germeys, et al., 2001), and ii) cosegregates within families (Lataster, et al., 2009), suggesting
stress sensitivity may be a potential intermediate phenotype.

Introduction
13
Two promising genes that may moderate psychotic reactivity to environmental stressors are
the catechol-O-methyltransferase (COMT) and brain-derived neurotrophic factor (BDNF)
genes. The COMT gene is a biologically plausible candidate given that it codes for catechol-
O-methyltransferase, an enzyme that plays a critical role in the degradation of dopamine. The
COMT gene contains a functional polymorphism (Val158Met) with two common variants
(valine and methionine), corresponding to high and low activity, respectively. Increased
COMT activity may result in i) reduced dopamine neurotransmission in the prefrontal cortex,
and, subsequently, ii) increased levels of mesolimbic dopamine signalling (Bilder, et al.,
2004). The first has been associated with neurocognitive impairments, including impairments
in working memory, attention, and executive functioning (Bilder, et al., 2002; Egan, et al.,
2001; Nolan, et al., 2004), whereas the latter has been associated with increased risk for
delusions and hallucinations (Akil, et al., 2003; Bilder, et al., 2004).
Based on the neurodevelopmental hypothesis, BDNF is also a conceivable candidate gene
because of the acknowledged effects of BDNF on neurodevelopment and neuronal activity
(Hua and Smith, 2004; Huang, et al., 1999). A Val66Met functional polymorphism in the gene
encoding BDNF has been the focus of much recent investigation. The valine (Val) variant is
associated with higher neuronal BDNF secretory activity than the methionine (Met) variant
(Chen, et al., 2004). The polymorphism has been linked to hippocampal functioning in
humans and has correspondingly been thought to affect episodic memory functioning (Egan,
et al., 2003) and sensitivity to stress. Met carriers may be more sensitive to stress-induced
BDNF depletion and may thus experience more extreme behavioural responses to stress
compared with Val/Val subjects.
Monitoring of inner speech
Although neurocognitive intermediate phenotypes such as information processing speed and
memory have been linked to the negative symptom dimension rather than other symptom
dimensions (de Gracia Dominguez, et al., 2009), they are not linked to specific psychotic
symptoms, but rather seem to indicate a general vulnerability. Identifying cognitive
abnormalities specific to psychosis is the aim of the cognitive neuropsychiatric approach. This
approach attempts to explain psychiatric phenomena such as delusions and hallucinations in
terms of aberrations in normal cognitive mechanisms. Using a symptom-oriented approach
can greatly facilitate our understanding of underlying cognitive mechanisms and tends to
demonstrate greater reliability and biological validity than a syndrome-oriented approach.

Chapter 1
14
Auditory verbal hallucinations (AVHs) are one of the most common symptoms in
schizophrenia, often described as ‘hearing voices’. One of the most influential current
cognitive models suggests that auditory hallucinations are the result of defective self-
monitoring. Self-monitoring refers to the cognitive capacity to correctly differentiate
information that is internally generated from information that is generated by an external
source (Johnson, et al., 1993). If this monitoring system is defective, verbal thoughts will not
be recognized as being self-generated, leading to the experience of AVHs (Feinberg, 1978).
The development of neuroimaging techniques has given investigators tools to study the
biological basis of cognitive processes implicated in AVHs. Neuroimaging studies have
revealed that imagining another person’s speech yields normal activation of the left inferior
frontal gyrus but abnormal activation of the temporal cortex in schizophrenia patients prone to
auditory hallucinations compared with schizophrenia patients without a history of AVHs and
healthy controls (McGuire, et al., 1996; Shergill, et al., 2000), thus adding biological
plausibility to the cognitive model.

Introduction
15
Aims and outline of this thesis
The overall aim of this thesis was to examine dysfunctions in information processing in
relation to various symptoms of the psychosis phenotype and in relation to neurobiological
abnormalities.
Our first aim was to investigate neurocognitive functions as potential intermediate phenotypes
for psychosis. In chapters 2 and 3, we looked at the relationship between behavioural
measures of neurocognitive functioning and symptom dimensions in a general population
twin sample. In chapter 2 we examined whether cognitive deficits are related to specific
dimensions of subclinical psychotic experiences and whether associations between these
variables are caused by additive genetic, common environmental, and/or individual-specific
environmental factors. In chapter 3 we looked at depressive symptoms, which form an
integral part of the psychosis phenotype. We examined whether poor cognitive functioning
can be a risk factor in the development of depressive symptoms. In chapter 4 we investigated
the physiological correlates of information processing mechanisms in patients with a
psychotic disorder, their first-degree relatives, and healthy controls, focussing on two
important features potential intermediate phenotype should demonstrate: familiality and
stability.
Our second aim was to investigate gene–environment interactions. In chapter 5 we examined
whether the COMT Val158Met and BDNF Val66Met polymorphisms in part mediate genetic
effects on paranoid reactivity to minor stressors, using the same general population twin
sample as in chapters 2 and 3.
Our third aim was to investigate self-monitoring of inner speech. In chapter 6 we investigated
the functional neuroanatomy of inner and external speech in both schizophrenia patients with
a history of auditory verbal hallucinations and healthy controls.
Finally, chapter 7 closes with a general discussion.

Chapter 1
16
References
Akil M, Kolachana BS, Rothmond DA, Hyde TM, Weinberger DR and Kleinman JE. Catechol-O-methyltransferase genotype and dopamine regulation in the human brain. J Neurosci 2003; 23: 2008-2013.
Bebbington P and Kuipers L. The predictive utility of expressed emotion in schizophrenia: an aggregate analysis. Psychol Med 1994; 24: 707-718.
Bebbington P, Wilkins S, Jones P, Foerster A, Murray R, Toone B and Lewis S. Life events and psychosis. Initial results from the Camberwell Collaborative Psychosis Study. Br J Psychiatry 1993; 162: 72-79.
Bebbington P, Wilkins S, Sham P, Jones P, Os J, Murray R, Toone B and Lewis S. Life events before psychotic episodes: do clinical and social variables affect the relationship? Soc Psychiatry Psychiatr Epidemiol 1996; 31: 122-128.
Bebbington PE, Bhugra D, Brugha T, Singleton N, Farrell M, Jenkins R, Lewis G and Meltzer H. Psychosis, victimisation and childhood disadvantage: Evidence from the second British National Survey of Psychiatric Morbidity. Br J Psychiatry 2004; 185: 220-226.
Bilder RM, Volavka J, Czobor Pá, Malhotra AK, Kennedy JL, Ni X, Goldman RS, Hoptman MJ, Sheitman B, Lindenmayer J-P, Citrome L, McEvoy JP, Kunz M, Chakos M, Cooper TB and Lieberman JA. Neurocognitive correlates of the COMT Val158Met polymorphism in chronic schizophrenia. Biol Psychiatry 2002; 52: 701-707.
Bilder RM, Volavka J, Lachman HM and Grace AA. The catechol-O-methyltransferase polymorphism: relations to the tonic-phasic dopamine hypothesis and neuropsychiatric phenotypes. Neuropsychopharmacol 2004; 29: 1943-1961.
Braff DL. Information Processing and Attention Dysfunctions in Schizophrenia. Schizophr Bull 1993; 19: 233-259.
Bramon E, Rabe-Hesketh S, Sham P, Murray RM and Frangou S. Meta-analysis of the P300 and P50 waveforms in schizophrenia. Schizophr Res 2004; 70: 315-329.
Butzlaff RL and Hooley JM. Expressed Emotion and Psychiatric Relapse: A Meta-analysis. Arch Gen Psychiatry 1998; 55: 547-552.
Cardno AG and Gottesman II. Twin studies of schizophrenia: From bow-and-arrow concordances to Star Wars Mx and functional genomics. Am J Med Genet 2000; 97: 12-17.
Chen ZY, Patel PD, Sant G, Meng CX, Teng KK, Hempstead BL and Lee FS. Variant brain-derived neurotrophic factor (BDNF) (Met66) alters the intracellular trafficking and activity-dependent secretion of wild-type BDNF in neurosecretory cells and cortical neurons. J Neurosci 2004; 24: 4401-4411.
Csikszentmihalyi M and Larson R. Validity and reliability of the Experience-Sampling Method. J Nerv Ment Dis 1987; 175: 526-536.
de Gracia Dominguez M, Viechtbauer W, Simons CJP, van Os J and Krabbendam L. Are psychotic psychopathology and neurocognition orthogonal? A systematic review of their associations. Psychol Bull 2009; 135: 157-171.
Delespaul P. Assessing schizophrenia in daily life: The experience sampling method. Maastricht: University of Limburg; 1995.
DeVries MW. The experience of psychopathology: investigating mental disorders in their natural settings. Cambridge: Cambridge university press; 1992.
Dickinson D, Ramsey ME and Gold JM. Overlooking the Obvious: A Meta-analytic Comparison of Digit Symbol Coding Tasks and Other Cognitive Measures in Schizophrenia. Arch Gen Psychiatry 2007; 64: 532-542.
Eaton WW, Romanoski A, Anthony JC and Nestadt G. Screening for Psychosis in the General Population with a Self-Report Interview. J Nerv Ment Dis 1991; 179: 689-693.
Egan MF, Goldberg TE, Kolachana BS, Callicott JH, Mazzanti CM, Straub RE, Goldman D and Weinberger DR. Effect of COMT Val108/158 Met genotype on frontal lobe function and risk for schizophrenia. Proc Natl Acad Sci U S A 2001; 98: 6917-6922.
Egan MF, Kojima M, Callicott JH, Goldberg TE, Kolachana BS, Bertolino A, Zaitsev E, Gold B, Goldman D, Dean M, Lu B and Weinberger DR. The BDNF val66met Polymorphism Affects Activity-Dependent Secretion of BDNF and Human Memory and Hippocampal Function. Cell 2003; 112: 257-269.
Faraone SV, Seidman LJ, Kremen WS, Toomey R, Pepple JR and Tsuang MT. Neuropsychological functioning among the nonpsychotic relatives of schizophrenic patients: A 4-year follow-up study. J Abnorm Psychol 1999; 108: 176-181.
Feinberg I. Efference copy and corollary discharge: implications for thinking and its disorders. Schizophr Bull 1978; 4: 636-640.
Gottesman II. Schizophrenia genesis: the origins of madness. New York: W.H. Freeman; 1991. Gottesman II and Gould TD. The Endophenotype Concept in Psychiatry: Etymology and Strategic Intentions.
Am J Psychiatry 2003; 160: 636-645.

Introduction
17
Green M. Schizophrenia Revealed - From neurons to social interactions. New York: W.W. Norton & Company Inc.; 2001.
Green MF, Kern RS and Heaton RK. Longitudinal studies of cognition and functional outcome in schizophrenia: implications for MATRICS. Schizophr Res 2004; 72: 41-51.
Heinrichs RW and Zakzanis KK. Neurocognitive deficit in schizophrenia: A quantitative review of the evidence. Neuropsychology 1998; 12: 426-445.
Hua JY and Smith SJ. Neural activity and the dynamics of central nervous system development. Nat Neurosci 2004; 7: 327-332.
Huang ZJ, Kirkwood A, Pizzorusso T, Porciatti V, Morales B, Bear MF, Maffei L and Tonegawa S. BDNF Regulates the Maturation of Inhibition and the Critical Period of Plasticity in Mouse Visual Cortex. Cell 1999; 98: 739-755.
Janssen I, Krabbendam L, Bak M, Hanssen M, Vollebergh W, Graaf R and Os J. Childhood abuse as a risk factor for psychotic experiences. Acta Psychiatr Scand 2004; 109: 38-45.
Jeon Y-W and Polich J. P300 asymmetry in schizophrenia: a meta-analysis. Psychiatry Res 2001; 104: 61-74. Johns LC and van Os J. The continuity of psychotic experiences in the general population. Clin Psychol Rev
2001; 21: 1125-1141. Johnson MK, Hashtroudi S and Lindsay DS. Source monitoring. Psychol Bull 1993; 114: 3-28. Krabbendam L, Marcelis M, Delespaul P, Jolles J and Van Os J. Single or multiple familial cognitive risk factors
in schizophrenia? Am J Med Genet 2001; 105: 183-188. Kremen WS, Seidman LJ, Pepple JR, Lyons MJ, Tsuang MT and Faraone SV. Neuropsychological Risk
Indicators for Schizophrenia: A Review of Family Studies. Schizophr Bull 1994; 20: 103-119. Lataster T, Wichers M, Jacobs N, Mengelers R, Derom C, Thiery E, Van Os J and Myin-Germeys I. Does
reactivity to stress cosegregate with subclinical psychosis? A general population twin study. Acta Psychiatr Scand 2009; 119: 45-53.
McGuire PK, Silbersweig DA, Wright I, Murray RM, Frackowiak RSJ and Frith CD. The neural correlates of inner speech and auditory verbal imagery in schizophrenia: relationship to auditory verbal hallucinations. Br J Psychiatry 1996; 169: 148-159
Morice R and Delahunty A. Frontal/Executive Impairments in Schizophrenia. Schizophr Bull 1996; 22: 125-137. Myin-Germeys I, Delespaul PH and Van Os J. Behavioural sensitization to daily life stress in psychosis. Psychol
Med 2005; 35: 733-741. Myin-Germeys I, van Os J, Schwartz JE, Stone AA and Delespaul PA. Emotional Reactivity to Daily Life Stress
in Psychosis. Arch Gen Psychiatry 2001; 58: 1137-1144. Nolan KA, Bilder RM, Lachman HM and Volavka J. Catechol O-Methyltransferase Val158Met Polymorphism
in Schizophrenia: Differential Effects of Val and Met Alleles on Cognitive Stability and Flexibility. Am J Psychiatry 2004; 161: 359-361.
Nuechterlein KH and Dawson ME. Information Processing and Attentional Functioning in the Developmental Course of Schizophrenic Disorders. Schizophr Bull 1984; 10: 160-203.
Peters ER, Joseph SA and Garety PA. Measurement of Delusional Ideation in the Normal Population: Introducing the PDI (Peters et al. Delusions Inventory). Schizophr Bull 1999; 25: 553-576.
Polich J. Updating P300: An integrative theory of P3a and P3b. Clin Neurophysiol 2007; 118: 2128-2148. Read J. Child abuse and psychosis: A literature review and implications for professional practice. Prof Psychol
Res Pr 1997; 28: 448-456. Shergill SS, Bullmore E, Simmons A, Murray R and McGuire P. Functional anatomy of auditory verbal imagery
in schizophrenic patients with auditory hallucinations. Am J Psychiatry 2000; 157: 1691-1693. Stefanis N, Hanssen M, Smirnis N, Avramopoulos D, Evdokimidis I, Verdoux H, van Os J and Stefanis C.
Evidence that three dimensions of psychosis have a distribution in the general population. Eur Psychiatry 2002; 17: 61-61.
Sullivan PF, Kendler KS and Neale MC. Schizophrenia as a Complex Trait: Evidence From a Meta-analysis of Twin Studies. Arch Gen Psychiatry 2003; 60: 1187-1192.
Tien AY. Distribution of hallucinations in the population. Soc Psychiatry Psychiatr Epidemiol 1991; 26: 287-292.
Turetsky BI, Calkins ME, Light GA, Olincy A, Radant AD and Swerdlow NR. Neurophysiological Endophenotypes of Schizophrenia: The Viability of Selected Candidate Measures. Schizophr Bull 2007; 33: 69-94.
van Os J and Kapur S. Schizophrenia: The Lancet. Lancet 2009; 374: 635-635. van Os J, Linscott RJ, Myin-Germeys I, Delespaul P and Krabbendam L. A systematic review and meta-analysis
of the psychosis continuum: evidence for a psychosis proneness-persistence-impairment model of psychotic disorder. Psychol Med 2009; 39: 179-195.
van Os J, Rutten BPF and Poulton R. Gene-Environment Interactions in Schizophrenia: Review of Epidemiological Findings and Future Directions. Schizophr Bull 2008: sbn117.

Chapter 1
18
Van Os J, Verdoux H, Bijl R and Ravelli A. Psychosis as an extreme of continuous variation in dimensions of psychopathology. In: H. Häfner and W. Gattaz, editors. Search for the Causes of Schizophrenia vol. IV. Berlin: Springer, 1999: 59-79.
Verdoux H and van Os J. Psychotic symptoms in non-clinical populations and the continuum of psychosis. Schizophr Res 2002; 54: 59-65.
Wichers M, Myin-Germeys I, Jacobs N, Peeters F, Kenis G, Derom C, Vlietinck R, Delespaul P and Van Os J. Genetic risk of depression and stress-induced negative affect in daily life. Br J Psychiatry 2007; 191: 218-223.
Zubin J and Spring B. Vulnerability: A new view of schizophrenia. J Abnorm Psychol 1977; 86: 103-126.


21
CHAPTER 2
Subclinical psychotic experiences and cognitive
functioning as a bivariate phenotype for genetic studies in
the general population
CJP Simons1, N Jacobs1 2, J Jolles1, J van Os1 3, L Krabbendam1
1 Department of Psychiatry and Neuropsychology, Maastricht University, European Graduate School of
Neuroscience, SEARCH, P.O. Box 616, 6200 MD Maastricht, The Netherlands 2 Faculty of Psychology, Open University of the Netherlands, P.O. Box 2960, 6401 DL Heerlen, The
Netherlands 3 Division of Psychological Medicine, Institute of Psychiatry, De Crespigny Park, London SE5 8AF, United
Kingdom
Schizophrenia Research 2007; 92: 24-31

Chapter 2
22
Abstract
Objective. Cognitive deficits may be vulnerability markers for the development of
schizophrenia. This study examined whether cognitive deficits are related to specific
dimensions of subclinical psychotic experiences and whether associations between these
variables are caused by additive genetic, common environmental and/or individual-specific
environmental factors. Method. A general population sample of 298 female twin pairs
completed the Community Assessment of Psychic Experiences and a neuropsychological test
battery. Associations between subclinical positive and negative psychotic dimensions and
neuropsychological factors (episodic memory and information processing speed) were
examined. Univariate correlation and structural equation analyses were performed to explore
the role of genetic and environmental factors in the phenotypes separately. Bivariate
correlation and structural equation analyses were applied to examine the causes of association.
Results. There were significant correlations between information processing speed and both
the positive (r = .11; p < .05) and the negative dimension (r = .10; p < .05). For the negative
dimension and for speed of processing, the data suggested a model that included genetic
factors. The observed phenotypic correlation between the negative dimension and information
processing speed could be solely explained in terms of additive genetic factors. Although the
comparison of the correlations for MZ and DZ pairs did not give a clear indication as to the
underlying causes of the association, structural equation modelling suggested that the
observed phenotypic correlation between the negative dimension and information processing
speed could be solely explained in terms of additive genetic factors. Conclusion. Negative
symptoms and information processing speed are associated at the subclinical level and this
association appears to be influenced by genetic factors exclusively. Bivariate psychosis
phenotypes may represent suitable candidates for molecular genetic studies in the general
population.
Keywords: psychosis; psychosis-proneness; schizotypy; cognition; twins; genetic analysis

Chapter 2
23
Introduction
Psychotic experiences at the subclinical level, alternatively labeled as schizotypy, psychosis-
proneness or psychosis-like symptoms, are prevalent in the general population (Eaton, et al.,
1991; Peters, et al., 1999; Tien, 1991; Van Os, et al., 1999) and thought to be expressions of a
continuous distribution extending from subclinical experiences to clinical symptoms (Van Os
and Verdoux, 2003). There is evidence for family-specific variation of subclinical psychotic
experiences in the general population (Hanssen, et al., 2006), whereas relatives of patients
with schizophrenia display higher levels of the subclinical manifestations of psychosis than
well controls (Kendler, et al., 1995; Kremen, et al., 1998). These findings suggest that
subclinical psychotic experiences are transmitted within families as the phenotypic expression
of liability to schizophrenia. Twin studies suggest that both the positive and the negative
dimensions of schizotypy are influenced by additive genetic effects and are moderately
heritable (e.g., Claridge and Hewitt, 1987; Hay, et al., 2001; Kendler, et al., 1991; Linney, et
al., 2003). Similar to subclinical psychotic experiences, neurocognitive deficits associated
with schizophrenia cluster in families of patients with schizophrenia and are detectable in the
first-degree relatives of patients at levels that are intermediate between well controls and
patients (Krabbendam, et al., 2001; Kremen, et al., 1994).
Some studies have found associations between subclinical psychotic symptom dimensions
and cognitive functioning (Krabbendam, et al., 2005; Laurent, et al., 2001; Suhr and
Spitznagel, 2001; Vollema, et al., 2002). This suggests that both may vary as part of the same
underlying cause. Given the fact that both cognitive deficits and subclinical psychotic
experiences cluster in the families of patients with a diagnosis of schizophrenia, it can be
surmised that part of this overlap is likely due to shared genetic factors. The aim of the
present study therefore was to investigate (i) associations between cognitive functioning and
psychotic symptom dimensions and (ii) whether any association is caused by genetic factors.
A twin design was used in order to disentangle genetic from common and individual-specific
environmental factors.
Methods
Subjects
The study sample consisted of 187 monozygotic and 111 dizygotic female twin pairs between
18 and 46 years of age, and was recruited in the context of a study on stress and depression.
Two-hundred and thirty-six pairs came from the East Flanders Prospective Twin Survey. This

Chapter 2
24
population-based survey has prospectively recorded all multiple births in the province of East
Flanders since 1964 (Derom, et al., 2002; Loos, et al., 1998). Zygosity was determined
through sequential analysis based on sex, fetal membranes, blood groups and DNA
fingerprints. Sixty-two pairs were recruited using registers from Flemish municipalities.
Determination of zygosity in these twins was based on their and their mothers’ response to
standard questions about physical similarity and the degree to which others confused them
(Christiansen, et al., 2003; Peeters, et al., 1998; Spitz, et al., 1996) and if necessary, on
examination of DNA fingerprints.
Measures
Psychotic symptoms were measured with the Community Assessment of Psychic Experiences
(CAPE; Stefanis, et al., 2002). The CAPE is a 42-item self-report questionnaire measuring
attenuated psychotic experiences. Previous research with the CAPE has shown a three-
dimensional structure, of a positive, a negative and a depressive factor in a large and
representative sample of young men (Stefanis, et al., 2002) and in a large sample of
undergraduate female students (Verdoux and van Os, 2002).
The neuropsychological assessment was directed at the following cognitive domains: episodic
memory, and simple and complex information processing. The Auditory Verbal Learning
Task (AVLT) (Brand and Jolles, 1985; Lezak, 1995) was used to evaluate memory storage
and retrieval of information in episodic memory. In three consecutive trials, a list of 15 words
had to be memorised and reproduced. The measures used were the total number of words
recalled over the three trials, and number of words recalled after a 20-min delay. Tests used to
measure the speed of information processing were the Stroop Color-Word Test (SCWT)
(Stroop, 1935), the Concept Shifting Test (CST) (Houx, et al., 1991), which is a modified
version of the Trail Making Test (Reitan, 1958), and the Letter Digit Substitution Test
(LDST), which is a modified version of the Symbol Digit Modalities Test (Smith, 1968). The
number of correctly completed letters in 90s was used as the dependent variable. Speed of
complex information processing was assessed using the interference task of the SCWT and
the number/letter-shifting task of the CST. For the SCWT, time (in seconds) to complete each
of the three 4x10-item subtasks (name the print colour, to read the colour names and to name
the print colour while ignoring the word), were used as dependent variables. Dependent
variables were time (in seconds) to cross out the numbers, to cross out the letters and to
switch between numbers and letters.

Chapter 2
25
Statistical analysis
The number of neuropsychological test variables was reduced by means of a principal
component factor analysis of the entire study sample followed by varimax rotation, using
STATA version 8 (StataCorp, 2003). Guided by the scree plot, a two-factor solution was
chosen, accounting for 52% of the variance. Furthermore, a three-factor solution did not result
in significant correlations for the third factor. Therefore a two-factor solution is more
parsimonious and corresponds better to previous work in terms of correlations with
symptoms. Factor scores were used. The variables of the Auditory Verbal Learning Task
strongly loaded on the first factor, which we termed episodic memory (factor loadings -0.92).
The variables of the Stroop, CST (factor loadings from 0.49 to 0.70) and LDST (factor
loading -0.66) loaded on the second factor, which we termed information processing speed.
Spearman correlations between the subclinical psychotic symptom dimensions and the
neuropsychological factors were calculated, followed by further analysis of significant
correlations. Pearson product-moment correlations did not result in higher correlations.
Genetic analyses
Univariate analyses
First, twin univariate correlation analyses were performed to explore the role of genetic and
environmental factors on the phenotypes separately. If the within-pair correlation in MZ pairs
is substantially higher than the within-pair correlation in DZ pairs, genetic factors are thought
to play a causative role in the phenotypic variance. Guided by the preliminary correlational
analysis, univariate structural equation modelling was applied, using Mx (Neale, et al., 1999).
Univariate structural equation modelling decomposes the variance within a phenotype into
three possible sources: 1) genetic factors, 2) common environmental factors (those
environmental experiences that are shared by both members of a twin pair), and 3) unique
environmental factors (those environmental experiences not shared by both members).
Several models were fitted to the data. The models were compared using the difference in fits
and the difference in degrees of freedom as criterion (Neale and Cardon, 1992). The best
fitting model was chosen, based on likelihood and parsimony of the model.
Bivariate analyses
Next, bivariate analysis was performed based on the results of the univariate analysis.
The within-twin cross-variable (i.e. a cognitive factor in twin 1 correlated with a CAPE
dimension in twin 1, and the same for twin 2) and cross-twin cross-variable (i.e. a cognitive

Chapter 2
26
factor in twin 1 correlated with a CAPE dimension in twin 2 and vice versa) correlations were
calculated. The pattern of these correlations gives an impression about the causes of
association between cognitive functioning and the different CAPE dimensions. If the cross-
twin cross-variable correlation is significantly higher in MZ than in DZ twins, a genetic factor
can be hypothesized to play a role in the association between the two traits. Furthermore, if all
of the association is due to genes, then the within-twin cross-variable correlation in MZ twins
should be the same as the cross-twin cross-variable correlation in MZ twins. If, on the other
hand, the within-twin cross-variable correlation in MZ twins is higher than the cross-twin
cross-variable correlation, individual-specific environmental factors are also likely to play a
role in the association.
Guided by the pattern of the correlations and the univariate structural equation modelling
results, structural equation modelling, using Mx (Neale, et al., 1999) was used to fit bivariate
models. This is the most common statistical method to explain observed covariance between
two variables in twin data (see e.g., Agrawal, et al., 2004; Bulik, et al., 2003). The goal of a
bivariate twin analysis (Fig. 1) is to decompose the covariance between two associated
characteristics (cognitive factor and CAPE dimension) into three possible sources: 1) genetic
factors, 2) common environmental factors, 3) individual-specific environmental factors.
Several models were fitted to the data. The models were compared using the difference in fit
and the difference in degrees of freedom as criterion (Neale and Cardon, 1992). The best
fitting model was chosen, based on likelihood and parsimony of the model. The bivariate
heritability (that part of the phenotypic correlation that is due to shared
genes: 22CAPEacognitive ara ×× ), bivariate c2 (that part of the phenotypic correlation that is due
to common environmental factors: 22CAPEccognitive crc ×× ) and bivariate e
2 (that part of the
phenotypic correlation that is due to individual-specific environmental
factors: 22CAPEecognitive ere ×× ) were calculated.
Results
Sample
Of the 298 female twin pairs that participated, 187 were monozygotic and 111 dizygotic.
Mean age of the sample was 27 years (SD = 7.5 years, range 18-46 years). A majority of 60%
had a college or university degree, 37% completed secondary education and 2% only had
primary education. The majority was currently employed (64% employed, 31% student, 2%

Chapter 2
27
unemployed, 2% homemaker and 1% sick leave). Mean weighted frequency of positive
psychotic experiences per subject was 1.2 (SD = 0.18, range 1.0-2.1), of negative psychotic
experiences 1.5 (SD = 0.3, range 1.0-2.9) and of depressive symptoms 1.7 (SD = 0.4, range
1.0-3.6). Mean scores on the neuropsychological measures were: AVLT total immediate
recall, mean = 32.7 (SD = 5.0); AVLT delayed recall, mean = 11.5 (SD = 2.5); Stroop names,
mean = 14.0 (SD = 3.5); Stroop colors, mean = 19.5 (SD = 3.3); Stroop interference task,
mean = 33.8 (SD = 6.9); CST numbers, mean = 16.2 (SD = 3.5); CST letters, mean = 19.1
(SD = 5.1); CST number/letter shifting, mean = 25.3 (SD = 7.8) and LDST, mean = 61.0 (SD
= 8.2). Distributions of all variables were skewed, with the exception of the distribution of the
LDST.
Univariate analysis
Correlations
A significant Spearman within-twin correlation was found between information processing
speed and the positive dimension of the CAPE (r = .11; p < .05) and between information
processing speed and the negative dimension of the CAPE (r = .10; p < .05). All other
correlations between the two cognitive factors and the CAPE dimensions were not significant.
Since information processing speed was measured as reaction times and factor loadings on
this factor were generally positive, the positive correlation with the positive and negative
dimensions indicates that higher positive and negative symptoms are accompanied by slower
reaction times.
The correlations in MZ pairs for information processing speed (r = .61) and the negative
dimension of the CAPE (r = .41) were higher than those observed among DZ pairs (r = .38
and r = .29, respectively) (see Table 1), suggesting that genetic factors contribute causally to
information processing speed and the negative dimension separately. The fact, however, that
the correlations for information processing speed and for the negative dimension among DZ
twins were higher than half of those among MZ twins suggests that they are also under the
influence of environmental factors shared by the pairs. The correlations in MZ twin pairs for
the positive dimension (r = .27), in contrast, were not higher than those in DZ pairs (r = .29),
providing no support for the hypothesis that a genetic factor contributes to sub-clinical
positive experiences. Therefore further analysis focussed only on the association between the
negative dimension and information processing speed.

Chapter 2
28
Table 1. Correlations between the negative dimension and information processing speed in MZ and DZ twin
pairsª
T1 negative T1 speed T2 negative T2 speed
T1b negative - 0.03 0.41** -0.004
T1 speed 0.16 - 0.11 0.61**
T2 negative 0.29** 0.18 - 0.06
T2 speed 0.02 0.38** 0.06 -
ª Correlations in MZ twin (172 pairs) are above the diagonal, those for DZ twin (107 pairs) are below the
diagonal. b Twins were assigned to T1 or T2 based on whether they were the first or second born of the twin pair. c ** p < 0.01.
Structural equation modelling
Univariate structural equation modelling of the information processing speed factor suggested
a best-fitting model with a genetic factor explaining 64% (95% CI: 55%-71%) and an
individual-specific environmental factor explaining 36% of the variance (95% CI: 29%-45%).
Univariate model fitting of the negative dimension data set suggested a best-fitting model
with a genetic factor explaining 48% (95% CI: 36%-58%) and an individual-specific factor
explaining 52% of the variance (95% CI: 42%-64%).
Bivariate Analysis
Correlations
The cross-twin cross-variable correlation did not differ between MZ (mean, r = 0.05) and DZ
pairs (mean, r = 0.10), suggesting that genetic factors do not play a role in the observed
association between negative symptoms and information processing speed. If the entire
association were due to genes, the cross-twin cross-variable correlation in MZ twins should be
the same as the within-twin cross-variable correlation in MZ twins. If, on the other hand, the
within-twin cross-variable is higher than the cross-twin cross-variable correlation, than
individual-environmental factors contribute to the association. The results suggest that this
was not the case (within-twin correlation = 0.045; cross-twin correlation = 0.05). Since
univariate structural equation modelling did not find evidence for a common environmental
factor for neither negative symptoms nor information processing speed, it is unlikely that the
association between these two variables can be explained by common environmental factors.
Thus, the comparison of the correlations for MZ and DZ pairs does not give a clear indication

Chapter 2
29
whether additive genetic, common environmental or individual-specific environmental factors
play a role in the association.
Structural equation modelling
As the bivariate correlations did not provide a clear indication of the factors underlying the
association between the negative dimension and information processing speed, all structural
equation models were tested. Bivariate model fitting began with the full model (model 1 in
Table 2), allowing for additive genes (A), common environment (C), and individual-specific
environment (E) for both the negative symptom dimension and information processing speed
and allowing for genetic, common environment and individual-specific environmental
correlations between them: ra, rc and re respectively (see Fig. 1).
Based on the results of the univariate model fitting, the full model was changed by omitting
the common environmental factor in the negative symptom dimension, information
processing speed and the common environmental factor between these two variables. This
model fitted nearly as well as the full model (χ2model 2 - χ
2model 1 = 0.73, ∆df = 3, p > 0.05) and
therefore was more parsimonious.
Based on model 2, we fitted a third model in which the individual-specific environmental
correlation between negative symptoms and information processing speed was set to 0,
forcing the model to explain all of the association between negative symptoms and
information processing speed by genetic factors. The fit of this model was not significantly
worse than the fit of model 2 (χ2model 3 - χ
2model 2= 0.22, ∆df = 1, p > 0.05) and was also more
parsimonious.
A fourth model was fitted, also based on the second model, now forcing the model to explain
all of the association by means of individual-specific factors (i.e. the genetic correlation was
set to 0). The fit of this model was significantly worse than the fit of model 2 (χ2model 4 - χ
2model
2 = 5.13, ∆df = 1, p =0.02). Therefore, model 3 remained the best fitting model (see Fig. 2).
The genetic correlation between the negative psychotic dimension and information processing
speed was estimated at 0.19 (95% CI: 0.03-0.35). Thus, the bivariate heritability equalled
22CAPEacognitive ara ×× = 48.019.064.0 ×× = 0.10. The average phenotypic correlation
between the negative psychotic dimension and information processing speed was 0.10 (95%
CI: 0.01-0.18).

Chapter 2
30
Table 2. Results of bivariate model fitting
Model 1 Model 2 Model 3a Model 4
Speed ACE AE AE AE
Negative symptoms ACE AE AE AE
ra F F F 0
rc F - - -
re F F 0 F
- 2 LnL 1889.47 1890.20 1890.42 1895.33
df 1146 1149 1150 1150
A indicates additive genetic factors; C, common environmental factors; E, individual-specific environmental
factors; ra, genetic correlation; rc, common environmental correlation; re, individual-specific environmental
correlation; F, free (parameter free to take any value); 0, parameter fixed to 0. a Best fitting model.
eneg cneg aneg aspeed espeedcspeed
negative dimension processing speed
Eneg Cneg Aneg Aspeed Cspeed Espeed
re
rc
ra
eneg cneg aneg aspeed espeedcspeed
negative dimension processing speed
Eneg Cneg Aneg Aspeed Cspeed Espeed
re
rc
ra
Figure 1. A full bivariate twin model for negative dimension and information processing speed. The variance in
liability to each trait is divided into that due to additive genetic factors (Aneg and Aspeed ), common environmental
effects (Cneg and Cspeed) and individual-specific environmental factors (Eneg and Espeed). Paths, which are the
standardized regression coefficients, must be squared to equal the proportion of variance accounted for. They are
represented by lowercase (a, c and e) with the subscripts neg and speed. The phenotypic correlation between the
negative dimension and information processing speed is, in this model, decomposed into that due to the
correlation of additive genes (ra), and the correlation of common environmental factors (rc) and the correlation of
individual-specific environmental factors (re).

Chapter 2
31
0.72 0.69 0.80 0.60
0.19
negative dimension processing speed
Eneg Aneg Aspeed Espeed
0.72 0.69 0.80 0.60
0.19
negative dimension processing speed
Eneg Aneg Aspeed Espeed
negative dimension processing speed
Eneg Aneg Aspeed Espeed
Figure 2. The parameter estimates from the best fitting bivariate model (model 3, Table 2) for the negative
dimension and information processing speed. Path coefficients must be squared to equal the proportion of
variance accounted for in the dependent variable. Aneg, Eneg, Aspeed, Espeed are explained in the legend to Fig. 1.
Discussion
The results showed a significant association between the negative symptom dimension and
information processing speed. The association, although significant, was weak (r = 0.10).
However, correlations between symptoms and cognitive deficits have generally been found to
be quite modest. The result is in line with previous studies finding significant but modest
associations between performance on the Continuous Performance Test (CPT) or the Trail
Making Test (TMT) and negative symptoms (Cameron, et al., 2002; Grove, et al., 1991;
Kendler, et al., 1991; Mahurin, et al., 1998; O'Leary, et al., 2000).
The variation in negative symptoms could best be explained in terms of a model that
contained both genetic and individual-specific factors. Twin studies have shown that best-
fitting models for negative symptoms are comprised of additive genetic and individual-
specific environmental factors (Claridge and Hewitt, 1987; Kendler, et al., 1991; Linney, et
al., 2003). Linney et al. (2003) found a heritability estimate of 49% for the Introvertive
Anhedonia subscale of the Oxford-Liverpool Inventory of Feelings and Experiences. This is
in the same order of magnitude as the 48% found in the present study. The variation in
information processing speed was also best explained in terms of a model that contained both
a genetic and an individual-specific factor. The finding of a significant genetic factor for
information processing speed is consistent with previous twin studies investigating
information processing speed (Rijsdijk, et al., 1998).

Chapter 2
32
Since a genetic factor was found to contribute to both the negative dimension and the
information processing speed factor, the association between negative symptoms and
information processing speed was further analysed to examine whether the association was (in
part) caused by additive genetic factors. The bivariate correlations for MZ and DZ twins did
not differ much from each other. The correlation between information processing speed and
negative symptoms was rather weak, this might explain the lack of a substantial difference
between MZ and DZ pairs. Although the bivariate correlation analysis did not show a clear
pattern, the results of the structural equation modelling indicated that the association between
negative symptoms and information processing speed could be solely explained by shared
genetic effects. This is consistent with a model of pleiotropic effects, in which susceptibility
loci manifest as both slower information processing and subclinical negative symptoms. This
finding may guide the search for specific genes in samples characterized by both subclinical
negative symptoms and slow information processing.
In schizophrenia patient samples, measures of negative symptoms typically tend to show a
quite modest correlation with neurocognitive functioning (i.e., r values in the −0.15 to 0.30
range) (Gold, 2004). As in patient samples the range of symptoms is broader than in a general
population sample, the correlations found in the present study are even weaker. Still, from the
viewpoint that the psychosis phenotype is expressed as a continuous distribution of
experiences, elucidating the causes of the association between symptoms and cognition in the
general population will also be relevant to understanding the clinical disorder.
In addition, the amount of variance explained by the bivariate endophenotype negative
symptoms–neurocognitive performance is low. This suggests that although negative
symptoms and neurocognitive performance may have a shared underlying cause, they are to a
large part independent of each other.
The subjects in this study were women in the age range of 18 to 46 years. The main age range
of risk for developing a psychotic disorder is between 20 to 35 years. For women the onset is,
on average, 3–4 years later than for men and women show a second peak of onset around
menopause (Häfner, 2003; Hambrecht, et al., 1994). Therefore the age range of the study
sample was adequate for detecting subclinical psychotic experiences in the female sample.
The significant correlations between information processing speed and the positive and
negative dimension could not be accounted for by an age effect, since additional analyses still
showed significant correlations after controlling for age.

Chapter 2
33
The findings of this study must be interpreted in the light of several issues. First, the sample
consisted of female participants only. Gender differences in psychotic symptoms include
higher levels of positive schizotypy in females compared to males, and higher levels of
negative schizotypy in males compared to females (Jackson and Claridge, 1991; Maric, et al.,
2003; Raine, 1992). However, this does not necessarily imply that the association between
negative symptoms and information processing speed is different in women than it is in men.
Mean weighted positive, negative and depressive scores on the CAPE were comparable to
those reported in other papers (Hanssen, et al., 2006; Krabbendam, et al., 2005).
Second, more than 60% of the subjects had a college or university degree, which is not
representative for the general population. This may have affected the performance on the
cognitive measures, e.g. by creating ceiling effects, but it is unlikely that the association
between cognitive functioning and subclinical psychotic experiences is different in a
population with a high educational level than for the general population. However, it is
possible that the correlation is weaker for the current, high cognitive functioning sample in
comparison to the general population, because if there is indeed an association between
cognitive functioning and negative symptoms, it would be more easily detected in a general
population sample that contains more variation in cognitive performance.

Chapter 2
34
References
Agrawal A, Jacobson KC, Prescott CA and Kendler KS. A Twin Study of Personality and Illicit Drug Use and Abuse/Dependence. Twin Res 2004; 7: 72-81.
Brand N and Jolles J. Learning and retrieval rate of words presented auditorily and visually. J Gen Psych 1985; 122: 201-210.
Bulik CM, Sullivan PF and Kendler KS. Genetic and environmental contributions to obesity and binge eating. Int J Eat Disord 2003; 33: 293-298.
Cameron AM, Oram J, Geffen GM, Kavanagh DJ, McGrath JJ and Geffen LB. Working memory correlates of three symptom clusters in schizophrenia. Psychiatry Res 2002; 110: 49-61.
Christiansen L, Frederiksen H, Schousboe K, Skytthe A, Von Wurmb-Schwark N, Christensen K and Kyvik K. Age- and sex-differences in the validity of questionnaire-based zygosity in twins. Twin Res 2003; 6: 275-280.
Claridge G and Hewitt JK. A biometrical study of schizotypy in a normal population. Pers Individ Dif 1987; 8: 303-312.
Derom C, Vlietinck R, Thiery E, Leroy F, Fryns J-P and Derom R. The East Flanders Prospective Twin Survey (EFPTS). Twin Res 2002; 5: 337-341.
Eaton WW, Romanoski A, Anthony JC and Nestadt G. Screening for psychosis in the general population with a self-report interview. J Nerv Ment Dis 1991; 179: 689-693.
Gold JM. Cognitive deficits as treatment targets in schizophrenia. Schizophr Res 2004; 72: 21-28. Grove WM, Lebow BS, Clementz BA, Cerri A, Medus C and Iacono WG. Familial Prevalence and
Coaggregation of Schizotypy Indicators: A Multitrait Family Study. J Abnorm Psychol 1991; 100: 115-121.
Häfner H. Gender differences in schizophrenia. Psychoneuroendocrinology 2003; 28: 17-54. Hambrecht M, Riecher-Rössler A, Fätkenheuer B, Louzã MR and Häfner H. Higher morbidity risk for
schizophrenia in males: Fact or fiction? Compr Psychiatry 1994; 35: 39-49. Hanssen M, Krabbendam L, Vollema M, Delespaul P and Van Os J. Evidence for Instrument and Family-
Specific Variation of Subclinical Psychosis Dimensions in the General Population. J Abnorm Psychol 2006; 115: 5-14.
Hay DA, Martin NG, Foley D, Treloar SA, Kirk KM and Heath AC. Phenotypic and Genetic Analyses of a Short Measure of Psychosis-proneness in a Large-scale Australian Twin Study. Twin Res 2001; 4: 30-40.
Houx PJ, Vreeling FW and Jolles J. Age-associated cognitive decline is related to biological life-events. In: K. Iqbal, D. R. C. McLachlan, B. Winblad and H. M. Wisniewski, editors. Alzheimer's Disease: Basic Mechanisms, Diagnosis and Therapeutic Strategies. Chichester: John Wiley & Sons Ltd, 1991: 353-359.
Jackson M and Claridge G. Reliability and validity of a psychotic traits questionnaire (STQ). Br J Clin Psychol 1991; 30: 311-332.
Kendler KS, McQuire M, Gruenberg AM and Walsh D. Schizotypal symptoms and signs in the Roscommon family study: their factor structure and familial relationship with psychotic and affective disorders. Arch Gen Psychiatry 1995; 52: 296-303.
Kendler KS, Ochs AL, Gorman AM, Hewitt JK, Ross DE and Mirsky AF. The structure of schizotypy: A pilot multitrait twin study. Psychiatry Res 1991; 36: 19-36.
Krabbendam L, Marcelis M, Delespaul P, Jolles J and Van Os J. Single or multiple familial cognitive risk factors in schizophrenia? Am J Med Genet 2001; 105: 183-188.
Krabbendam L, Myin-Germeys I, Hanssen M and van Os J. Familial covariation of the subclinical psychosis phenotype and verbal fluency in the general population. Schizophr Res 2005; 74: 37-41.
Kremen WS, Faraone SV, Toomey R, Seidman LJ and Tsuang MT. Sex differences in self-reported schizotypal traits in relatives of schizophrenic probands. Schizophr Res 1998; 34: 27-37.
Kremen WS, Seidman LJ, Pepple JR, Lyons MJ, Tsuang MT and Faraone S. Neuropsychological risk indicators for schizophrenia: a review of family studies. Schizophr Bull 1994; 20: 103-119.
Laurent A, Duly D, Murry P, Foussard N, Boccara S, Mingat F, Dalery J and d'Amato T. WCST performance and schizotypal features in the first-degree relatives of patients with schizophrenia. Psychiatry Res 2001; 104: 133-144.
Lezak MD. Neuropsychological Assessment (third ed.). Oxford: Oxford University Press; 1995. Linney YM, Murray RM, Peters ER, MacDonald AM, Rijsdijk F and Sham PC. A quantitative genetic analysis
of schizotypal personality traits. Psychol Med 2003; 33: 803-816. Loos R, Derom C, Vlietinck R and Derom R. The East Flanders Prospective Twin Survey (Belgium): a
populationbased register. Twin Res 1998; 1: 167-175. Mahurin RK, Velligan DI and Miller AL. Executive-frontal lobe cognitive dysfunction in schizophrenia: A
symptom subtype analysis. Psychiatry Res 1998; 79: 139-149.

Chapter 2
35
Maric N, Krabbendam L, Vollebergh W, de Graaf R and van Os J. Sex differences in symptoms of psychosis in a non-selected, general population sample. Schizophr Res 2003; 63: 89-95.
Neale MC, Boker SM, Xie G and Maes HH. MX: Statistical Modeling (Fifth ed.): Department of Psychiatry, Medical College of Virginia, Commonwealth University, Box 980126, Richmond, VA 23298; 1999.
Neale MC and Cardon LR. Methodology for Genetic Studies of Twins and Families. Dordrecht, The Netherlands: Kluwer Academic Publishers BV; 1992.
O'Leary DS, Flaum M, Kesler ML, Flashman L, Arndt S and Andreasen NC. Cognitive correlates of the negative, disorganised, and psychotic symptom dimensions of schizophrenia. J Neuropsychiatry Clin Neurosci 2000; 12: 4-15.
Peeters H, Van Gestel S, Vlietinck R, Derom C and Derom R. Validation of a telephone zygosity questionnaire in twins of known zygosity. Behav Genet 1998; 28: 159-163.
Peters ER, Joseph SA and Garety PA. Measurement of delusional ideation in the normal population: introducing the PDI (Peters et al. Delusions Inventory). Schizophr Bull 1999; 25: 553-576.
Raine A. Sex differences in schizotypal personality in a nonclinical population. J Abnorm Psychology 1992; 101: 361-364.
Reitan RM. Validity of the Trail Making Test as an indication of organic brain damage. Percept Mot Skills 1958; 8: 271-276.
Rijsdijk FV, Vernon PA and Boomsma DI. The genetic basis of the relation between speed-of-information-processing and IQ. Behav Brain Res 1998; 95: 77-84.
Smith A. The Symbol Digit Modalities Test: a neuropsychological test for economic screening of learning and other cerebral disorders. Learn Disabil 1968; 36: 83-91.
Spitz E, Moutier R, Reed T, Busnel M, Marchaland C, Roubertoux P and Carlier M. Comparative diagnoses of twin zygosity by SSLP variant analysis, questionnaire, and dermatoglyphic analysis. Behav Genet 1996; 26: 55-63.
StataCorp. STATA Statistical Software: Release 8.0. College Station, Texas: STATA Inc.; 2003. Stefanis NC, Hanssen M, Smirnis NK, Avramopoulos DA, Evdokimidis IK, Stefanis CN, Verdoux H and Van
Os J. Evidence that three dimensions of psychosis have a distribution in the general population. Psychol Med 2002; 32: 347-358.
Stroop JR. Studies of interference in serial verbal reactions. J Exp Psychol 1935; 18: 643-662. Suhr JA and Spitznagel MB. Factor versus cluster models of schizotypal traits. II: relation to neuropsychological
impairment. Schizophr Res 2001; 52: 241-250. Tien AY. Distribution of hallucinations in the population. Soc Psychiatry Psychiatr Epidemiol 1991; 26: 287-
292. Van Os J and Verdoux H. Diagnosis and classification of schizophrenia: categories versus dimensions,
distributions versus disease. In: R. M. Murray, P. B. Jones, E. Susser, J. Van Os and M. Cannon, editors. The Epidemiology of Schizophrenia: Cambridge University Press, 2003: 364–410.
Van Os J, Verdoux H, Bijl R and Ravelli A. Psychosis as an extreme of continuous variation in dimensions of psychopathology. In: H. Häfner and W. Gattaz, editors. Search for the Causes of Schizophrenia vol. IV. Berlin: Springer, 1999: 59-79.
Verdoux H and van Os J. Psychotic symptoms in non-clinical populations and the continuum of psychosis. Schizophr Res 2002; 54: 59-65.
Vollema MG, Sitskoorn MM, Appels MCM and Kahn RS. Does the Schizotypal Personality Questionnaire reflect the biological-genetic vulnerability to schizophrenia? Schizophr Res 2002; 54: 39-45.


37
CHAPTER 3
Cognition as predictor of current and follow-up depressive
symptoms in the general population
CJP Simons1, N Jacobs1 2, C Derom3, E Thiery3, J Jolles1, J van Os1 4, L Krabbendam1
1 Department of Psychiatry and Neuropsychology, Maastricht University, European Graduate School of
Neuroscience, SEARCH, P.O. Box 616, 6200 MD Maastricht, The Netherlands 2 Faculty of Psychology, Open University of the Netherlands, P.O. Box 2960, 6401 DL Heerlen, The Netherlands 3 Department of Human Genetics, University Hospital Gasthuisberg, Katholieke Universiteit Leuven, Leuven,
Belgium 4 Division of Psychological Medicine, Institute of Psychiatry, De Crespigny Park, London SE5 8AF, United
Kingdom
Acta Psychiatrica Scandinavica 2009; 120: 45-52

Chapter 3
38
Abstract
Objective. Previous studies have reported an association between depression and poor
cognitive functioning. Unknown is to what degree such associations are merely state-related
or reflect an enduring depression vulnerability. This study examined whether cognitive
deficits predict current and/or follow-up (sub)clinical depressive symptoms in the general
population. Method. A population-based sample of 569 female twins and 43 of their sisters
completed a neuropsychological battery. Cross-sectional and prospective associations
between depressive symptoms measured at the subclinical [Symptom Checklist-90 (SCL-90)]
and clinical level (Structured Clinical Interview for DSM-IV disorders) and
neuropsychological factors (episodic memory and information processing speed) were
examined. Results. Structured Clinical Interview for DSM-IV baseline depressive symptoms
were significantly associated with information processing speed but not with episodic
memory. Episodic memory was significantly associated with follow-up SCL-90 depressive
symptoms. Conclusion. Being depressed is accompanied by slower information processing.
Poor memory functioning may be a predictor for the onset of subclinical depressive
symptoms.
Keywords: depression; cognition; memory; risk factors; follow-up studies
Significant outcomes
• Slower information processing was associated with clinical depressive symptoms at
baseline, which disappeared at follow-up 2 years later, suggesting a state effect.
• Poor episodic memory functioning predicted subclinical depressive symptoms assessed
over a 2-year follow-up period, suggesting mediation.
Limitations
• The sample consisted of female participants only.
• The sample was a relatively highly educated group.
• The cognitive assessment in this study was limited to tasks involving verbal memory,
attention and speed of information processing.

Chapter 3
39
Introduction
Previous studies have found depression to be associated with a number of deficits across a
range of domains of cognitive functioning including memory, executive functioning, attention
and speed of information processing (Burt, et al., 1995; Degl’Innocenti, et al., 1998; Hickie,
1996; Rossi, et al., 1990; Zakzanis, et al., 1998). Studies investigating cognitive functioning
in depressed patients have shown that resolution of the depressive symptoms is paired with
improvement in cognitive functioning, although residual impairments in cognitive functioning
can be detected (Abas, et al., 1990; Beats, et al., 1996; Kuny and Stassen, 1995). These
findings, therefore, suggest that poor cognitive functioning is at least in part a state effect and
that depression might also be a predictor of future cognitive impairment. It is generally
believed that depression precedes the development of cognitive deficits. However, the
causality may be reversed. Prospective studies investigating the impact of cognitive
functioning on follow-up depressive symptoms have been rare and have generally focussed on
depressed elderly patients; such studies do suggest, however, that cognitive deficits may be a
risk factor for future depression (Berger, et al., 1998; Den Hartog, et al., 2003a; Den Hartog,
et al., 2003b; Roberts, et al., 1997; Roberts, et al., 2000). Airaksinen et al. (2007) studied a
general population sample of non-depressed individuals (20–64 years) and found that low
episodic memory performance was a reliable predictor for depression diagnosis three years
later. Colman and colleagues (2007) showed that depression, measured in a birth cohort over
the life course, is associated with neurodevelopmental impairments and the relationship
between neurodevelopmental impairments and depression may be mediated by cognition
(Colman, et al., 2007; Van Os, et al., 1997).
It has been shown that depressive symptoms exist as a continuous distribution of symptoms in
the general population (Anderson, et al., 1993; Goldberg, 2000; Kendler and Gardner, 1998;
Krabbendam, et al., 2004; Stefanis, et al., 2002; Whittington and Huppert, 1996) ranging from
subclinical depressive symptoms or dysphoria to a major depressive disorder. Subclinical
depression may be more sensitive to detect associations with risk factors in general population
studies. The advantage of a general population design is that confounding as a result of illness
characteristics such as medication effects or severe psychopathology can be avoided. In
addition, in a longitudinal design temporal relationships between emergence of cognitive
deficits and depressive symptoms can be assessed adjusted for their baseline presence.

Chapter 3
40
Aims of the study
This study investigated whether depressive symptoms in the general population are associated
with cognitive dysfunction. The existence of cross-sectional associations between cognitive
deficits and depressive symptoms would imply a state effect of depressive mood on cognitive
functioning. However, if poor cognitive functioning would precede the depressive state, this
would imply that cognitive functioning may be causally related to the onset of depressive
symptoms.
Material and methods
Subjects
The study sample consisted of 569 monozygotic and dizygotic female twin pairs and 43 of
their sisters, all between 18 and 61 years of age. The sample was recruited in the context of a
study on stress and depression (Jacobs, et al., 2006; Wichers, et al., 2007). Two-hundred and
thirty-six pairs came from the East Flanders Prospective Twin Survey. This population-based
survey has prospectively recorded all multiple births in the province of East Flanders since
1964 (Derom, et al., 2006; Loos, et al., 1998). Sixty-two pairs were recruited using registers
from Flemish municipalities. The project was approved by the Local Committee of Medical
Ethics and all participants gave written informed consent.
Measures
At baseline, a neuropsychological battery was administered. The neuropsychological
assessment was directed at the following cognitive domains: episodic memory, and simple
and complex information processing. The Auditory Verbal Learning Task [AVLT; (Van der
Elst, et al., 2005)] was used to evaluate memory storage and retrieval of information in
episodic memory. The measures used were the total number of words recalled over the three
trials, and number of words recalled after a 20-min delay. Tests used to measure the speed of
information processing were the Stroop Color-Word Test (SCWT; (Van der Elst, et al.,
2006c)), the Concept Shifting Test (CST; (Van der Elst, et al., 2006a)), which is a modified
version of the Trail-Making Test (Reitan, 1958), and the Letter Digit Substitution Test
[LDST; (Van der Elst, et al., 2006b)], which is a modified version of the Symbol Digit
Modalities Test (Smith, 1968).
Subclinical depressive symptoms were measured with the Symptom Check List [SCL-90
(Arrindell and Ettema, 1986; Derogatis, 1977), Dutch version: (Arrindell and Ettema, 1986)].
The SCL-90 is a widely used 90-item self-report questionnaire measuring general

Chapter 3
41
psychological distress. This study only used the depression subscale, consisting of 13 items.
The SCL-90 was administered five times with an interval of 5.2 (SD = 0.6) months between
two measurements. The first administration of the SCL-90 was at baseline, at the same time
the neuropsychological test battery was administered. This measure of current subclinical
depressive symptoms was used to test for cross-sectional association between cognition and
depressive symptoms. To investigate the role of cognition as a possible predictor for future
subclinical depressive symptoms, the mean number of depressive symptoms over follow-up
1–4 was used (Fig. 1). To account for partial non-response, depression scores were weighted
for the valid number of items.
Clinical depressive symptoms were assessed with the Structured Clinical Interview for DSM-
IV axis I Disorders (SCID). The SCID was administered at baseline and the fourth follow-up,
approximately 24.3 (SD = 7.5) months after assessment of neuropsychological test
performance. A continuous depression scale was created by taking the sum of the items,
scored 0 (absent) or 1 (present), on the SCID that form the nine symptoms listed under
criterion A for major depressive episode in DSM-IV. The SCID baseline score was used to
test for a cross-sectional association between cognition and clinical depressive symptoms; the
SCID score at follow-up 4 was used to test for a prospective association between cognition
and clinical depressive symptoms (Fig. 1).
Statistical analysis
The number of neuropsychological test variables was reduced by means of a principal
component factor analysis of the entire study sample followed by varimax rotation, using
STATA version 9.0 (StataCorp, 2003). Guided by the scree plot, a two-factor solution was
chosen, accounting for 52% of the variance. The variables of the AVLT loaded on the first
factor, which was termed episodic memory (factor loadings –0.92). The variables of the
Stroop, CST (factor loadings from 0.49 to 0.70) and LDST (factor loading –0.66) loaded on
the second factor, which was termed information processing speed. Factor scores for this
factor were multiplied by –1 so that higher scores on each factor indicated better performance.

Chapter 3
42
Figure 1. Cross-sectional and prospective associations between cognition and depression. Dashed lines indicate
at what time-points the tests were administered. Cross-sectional associations were tested between
neuropsychological performance and depression scores gathered at T1. The gray lines indicate multilevel
regression analyses to investigate these associations. The arrows are bidirectional to emphasize the cross-
sectional nature of the analyses. Prospective associations were tested between neuropsychological performance
at T1 and subclinical depression (mean of T2-T5) and clinical depression (measured at T5). The black lines
indicate multilevel regression analyses to investigate these associations.
Although the present sample consisted of twin pairs, the data analysis did not focus on
specific techniques commonly associated with twin analyses, such as structural equation
modelling. Rather, the analyses focussed on the longitudinal aspect of the study. Thus, within-
twin linear regression analyses were conducted to examine, within subjects, the association
between each cognitive factor and depression. Regression analyses were adjusted for age and
education, unless stated otherwise. Regression analysis examining the association between
follow-up depressive symptoms and cognition were corrected for depressive symptoms at
baseline. Correction for depressive symptoms at baseline is necessary to disentangle potential
prospective associations between cognition and depression from potential state effects of
SCID current depressive symptoms
SCL-90 future depressive symptoms
SCID future depressive symptoms
Neuro-psychological performance
SCL-90 current depressive symptoms
T1
T2 T3 T4 T5

Chapter 3
43
depressive symptoms on cognitive performance. Effect sizes were expressed as the
standardized regression coefficient (β) from the multilevel models. Multilevel random
regression models were constructed, using the XTREG procedure in STATA (StataCorp,
2003), given the fact that members of a twin pair cannot be considered statistically
independent.
Results
Sample
Five hundred-and-sixty-nine female twin pairs and 43 sisters of these twins participated.
Mean age of the sample was 28 years (SD = 7.9 years, range 18–61 years). A majority of 62%
had a college or university degree, 38% completed secondary education and 1% had primary
education. The majority was currently employed (61% employed, 35% student, 3%
unemployed and 1% homemaker).
At baseline, 642 subjects completed the neuropsychological test battery. Of these subjects,
612 completed the SCL-90 at baseline. Follow-up SCL-90 scores were available for 553
subjects and for 548 of these subjects, baseline depressive symptom scores on the SCL-90
were also available. For 637 out of the 642 subjects, SCID baseline depressive symptoms
were available. At follow-up, 445 subjects had SCID depressive symptoms scores, for 444 of
these subject, SCID baseline depression scores were also available (Fig. 2). Education (β =
.28, p = .02) and SCL-90 subclinical (β = –.50, p = .01), as well as SCID clinical depression
scores (β = .59, p < .001) were significant predictors for missing scores on the SCL-90
follow-up depression variable. Cognition, age, education, nor depressive symptoms on SCID
and SCL-90 predicted missing values on the SCID at follow-up.
Mean score on the SCL-90 depressive dimension was 1.45 (SD = .52) for baseline and the
mean aggregated follow-up score was 1.48 (SD = .48). Based on the SCID, 4.7% of the
subjects could be characterized as having a current depressive episode at baseline. All
depression variables were skewed to the right, indicating that a majority of the subjects scored
relatively low on the depression scales and a minority had higher depression scores.
Mean scores on the neuropsychological tests are summarized in Table 1. Distributions of all
neuropsychological measures were skewed, indicating that the majority of the subjects
showed normal to good test performance, with the exception of the distributions of the LDST.
Given the skewed distributions of the depression and cognition variables, the Huber-White

Chapter 3
44
estimator of variance was used in the regression analyses which is robust against
distributional assumptions (Hardin and Hilbe, 2007).
Figure 2. Flow chart of subjects for Symptom Checklist-90 (SCL-90) and Structured Clinical Interview for
DSM-IV disorders (SCID) measures of current and future depressive symptoms.
Current depressive symptoms
Regression analysis showed a significant association between current depressive symptoms
measured with the SCID (i.e. depression measured at baseline) and information processing
speed (β = –.11, p = .02), after controlling for age. However, for the SCL-90 the effect fell
just short of statistical significance (β = –.09, p = .06). After additional adjustment for
education, the association was reduced for the SCL-90 (β = –.05, p = .31) but less so for the
SCID (β = –.09, p = .05.) No large or significant associations were found between episodic
memory and current depressive symptoms measured either with the SCL-90 (β = .05, p = .22)
or with the SCID (β = –.02, p = .60) after adjustment for age and education.
n = 642 subjects with complete neuropsychological data
n = 612 for SCL-90 current depressive symptoms
n = 553 for SCL-90 future depressive symptoms
n = 548 for SCL-90 future depressive symptoms corrected for current SCL-90 depressive symptoms
n = 637 for SCID current depressive symptoms
n = 445 for SCID future depressive symptoms
n = 444 for SCID future depressive symptoms corrected for current SCID depressive symptoms

Chapter 3
45
Table 1. Summary of performance on neuropsychological tasks.
Neuropsychological measure Mean (SD)
Episodic memory
AVLT † Immediate recall 32.7 (5.0) Delayed recall 11.5 (2.5)
Information processing speed
SCWT (s) ‡
Names 14.0 (3.5) Colors 19.5 (3.3) Interference 33.8 (6.9) CST (s) ‡ Numbers 16.2 (3.5) Letters 19.1 (5.1) Number/letter 25.3 (7.8) LDST † 61.0 (8.2)
AVLT, Auditory Verbal Learning Task; SCWT, Stroop Color-Word Test; CST, Concept Shifting Test; LDST, Letter Digit Substitution Test. † Higher scores indicating better performance. ‡ Higher scores indicating poorer performance.
Follow-up depressive symptoms
Regression analysis of mean aggregated follow-up SCL-90 depression score, after adjustment
for age and education but without adjustment for baseline SCL-90 depression score, showed
no significant association between follow-up SCL-90 depression score and episodic memory
(β = –.04, p = .35). Baseline SCL-90 depression score significantly predicted follow-up SCL-
90 depression score (β = .65; p < .001) and accounted for the most variance in future
subclinical depressive symptoms. With adjustment for baseline SCL-90 depression score, the
association between follow-up SCL-90 depression score and episodic memory became larger
and statistically significant (β = –.07; p = .03). The association between follow-up SCL-90
depression score and information processing speed was significant (β = –.12; p = .02), but the
significance was strongly reduced and non-significant after controlling for baseline SCL-90
depression score (β = –.05, p = .17).
Structured Clinical Interview for DSM-IV axis I Disorders follow-up depressive symptoms
were associated with neither information processing speed (β = –.06, p = .31) nor episodic
memory (β = .05, p = .35). SCID baseline depressive symptoms significantly predicted SCID
follow-up depressive symptoms (β = .22; p = .001) and accounted for the most variance in
future clinical depressive symptoms. After adjustment for SCID baseline depressive

Chapter 3
46
symptoms, information processing speed (β = –.04, p = .43) and episodic memory (β = .06, p
= .25) still showed no significant associations.
Discussion
Depression and episodic memory
Episodic memory functioning was not associated with depressive symptoms measured at
baseline. In contrast, a significant association was found between episodic memory
functioning and SCL-90 follow-up depressive symptoms, controlling for depressive
symptoms at baseline. However, episodic memory functioning was not significantly
associated with SCID follow-up depressive symptoms. The SCID is an interview that
measures clinical symptoms, whereas the SCL-90 is a self-report questionnaire that measures
psychological distress. The difference in results for the SCL-90 and the SCID may be
explained by the fact that the present research sample was a general population sample and
not a clinical sample. The SCL-90 may be a more sensitive instrument for the present
population than the SCID. A similar differential sensitivity of subclinical vs. clinical
instruments was noted by Colman and colleagues (Colman, et al., 2007) in relation to
associations with low birth weight. Furthermore, SCID follow-up depressive symptoms scores
were available for fewer subjects than SCL-90 follow-up scores. In addition, SCID follow-up
depressive symptoms were assessed at one time point (follow-up 4), examining symptoms
during the past month. In contrast, for the SCL-90 the mean of four follow-ups was used, thus
reflecting a much longer time span. Therefore, the SCL-90 arguably constituted a much more
sensitive measure.
The results of the SCL-90 thus suggest that poor episodic memory may be a risk factor for the
development of depressive symptoms, in contrast with the more commonly voiced notion that
cognitive deficits represent a secondary consequence of the depressive disorder or depressive
mood. However, several studies investigating cognitive performance in depressive patients
have shown that the cognitive deficits do not always resolve with the remission of the
depressive symptoms (Den Hartog, et al., 2003a; Den Hartog, et al., 2003b; Kuny and
Stassen, 1995; O'Brien, et al., 1993; Paradiso, et al., 1997). The present findings are in
accordance with the study of Airaksinen et al. (2007), who found that low episodic memory
performance (the sum of free and cued recall) predicted depression diagnoses 3 years later.
This suggests that cognitive deficits may be more than just an epiphenomenon of a depressed

Chapter 3
47
mood. A recent study by Colman and colleagues (2007) add further credence to this
suggestion. In a large birth cohort they found depressive symptoms to be associated with
neurodevelopmental markers and suggested that prenatal maternal stressors may play a crucial
role by altering the development of the hypothalamic–pituitary–adrenal (HPA) axis in the
foetus, leading to a permanently altered stress response. Repeated stress may lead to loss of
hippocampal volume as a consequence of the neurotoxic effects of excessive glucocorticoid
levels (Sapolsky, 2000; Sauro, et al., 2003) and the effect of stress may be modulated by
genetic variants (Frodl, et al., 2008). As the hippocampus is involved in episodic memory
(Burgess, et al., 2002) and there is evidence that depression correlates with lower
hippocampal volume (Campbell, et al., 2004; Videbech and Ravnkilde, 2004), it is attractive
to speculate that decreased hippocampal functioning plays a crucial role in the mechanism
underlying the association between episodic memory functioning and depressive symptoms
observed in this study. Alternatively, depression has been associated with subcortical white
matter lesions (De Groot, et al., 2000a) and episodic memory functioning has been associated
with white matter lesions in periventricular areas of the brain (De Groot, et al., 2000b).
Although explanations in terms of underlying biology are speculative, this may suggest that
decreased connectivity throughout the brain could lead to depressive symptoms and poor
episodic memory functioning. Alternatively, depression could be a reaction to cognitive
problems, although this explanation cannot account for the specificity of the association for
episodic memory. It can also be speculated that episodic memory deficits may give rise to
stressful events, which in turn may fuel depressive symptoms. As this study controlled for
depressive symptoms at the time of neuropsychological testing, and still found a significant
association with depressive symptoms measured at later moments in time, it can be argued
that motivational factors are not involved in the longitudinal association between episodic
memory and depressive symptoms.
The findings of the present study that poor episodic memory functioning predicts future
depressive symptoms, is not compatible with a general recommendation of screening for
deficits in episodic memory functioning, because this would lack sensitivity and specificity.
Rather, as Colman and co-workers (2007) already suggested, general population screening of
cognition and longitudinal depressive symptoms may be important in finding factors involved
in the aetiology of depression.

Chapter 3
48
Depression and information processing speed
Depressive symptoms measured at baseline showed a significant association with information
processing speed. This association was seen regardless of whether depressive symptoms were
measured with the SCL-90 or with the SCID. However, the association disappeared for the
SCL-90 when controlling for educational level, whereas it still remained significant for the
SCID. Higher educational level was associated with significantly lower level of current
depressive symptoms, even though the present sample was a relatively highly educated group
with more than 60% of the subjects having a college or university degree. Therefore, it is
possible that in a sample with a lower educational level, associations between present state
depression and cognition could be observed, that nonetheless may be confounded.
There was a significant association between SCL-90 follow-up depressive symptoms and
information processing speed when the association was not adjusted for baseline depressive
symptoms. This is to be expected in the presence of state effects of current depressive
symptoms on information processing speed, because current depressive symptoms are
predictive of future depressive symptoms and therefore can confound the relation between
cognition and future depressive symptoms. After adjustment for baseline depressive
symptoms, the association between information processing speed and future depressive
symptoms did indeed disappear. These findings indicate that the association between clinical
depressive symptoms and information processing speed is a state effect. This is in accordance
with studies reporting state effects in clinical populations (Egeland, et al., 2005; Gualtieri, et
al., 2006; Rund, et al., 2006). Although the cross-sectional association between depressive
symptoms and cognitive deficits is usually interpreted as depressive states impacting
negatively on information processing speed, the cross-sectional nature of the association
between clinical depressive symptoms and information processing speed, makes it is
impossible to assess causality. Furthermore, it can not be excluded that both poor episodic
memory functioning and depressive symptoms are not causally related but are caused by a
shared vulnerability factor.
Limitations
The findings of this study must be interpreted in the light of several sample and
methodological issues. First, the sample consisted of female participants only. A consistent
finding in epidemiological research is that women are at least twice as likely as men to suffer
from a unipolar depression (Kessler, et al., 1994; Nolen-Hoeksema, et al., 1999) and in non-
clinical samples, women tend to score higher on depression scales (Hildebrandt, et al., 2003;

Chapter 3
49
Olsen, et al., 2006). Therefore, the range of depressive symptoms in a general population
female sample may be wider than the range of depressive symptoms in a male sample. Thus,
it is possible that any association with cognitive functioning is more easily detected in a
female sample.
The cognitive assessment in this study was limited to tasks involving verbal memory,
attention and speed of information processing. Other cognitive domains and their associations
with depression should be the subject of further study.
The continuous outcome measure of depressive symptoms is different from clinical diagnosis
according to DSM criteria. However, several arguments can be brought to bear to demonstrate
that this would not have biased or otherwise negatively impacted on the results. First, there is
good evidence that constructs such as major depressive episode defined by DSM or ICD
criteria may be arbitrary diagnostic conventions imposed on a continuum of depressive
symptoms (Aggen, et al., 2005; Anderson, et al., 1993; Baumeister and Morar, 2008;
Goldberg, 1996; Kendler and Gardner, 1998; Viken, et al., 1994). Second, it would be
difficult to conceive how any phenotype would depend on a categorical rather than a
dimensional expression for associations with cognition to be valid or significant.
To conclude, the results indicate that slow processing of information may be the result of
being in a depressed state, whereas poor episodic memory functioning may a predictor of
depressive symptoms.
Acknowledgements
This research was supported by the Dutch Foundation for Scientific Research. The East
Flanders Prospective Survey has been in part supported by grants from the Fund of Scientific
Research, Flanders and Twins, a non-profit Association for Scientific Research in Multiple
Births (Belgium). The authors thank all twins for their cooperation.

Chapter 3
50
References
Abas MA, Sahakian BJ and Levy R. Neuropsychological deficits and CT scan changes in elderly depressives. Psychol Med 1990; 20: 507-520.
Aggen SH, Neale MC and Kendler KS. DSM criteria for major depression: evaluating symptom patterns using latent-trait item response models. Psychol Med 2005; 35: 475-487.
Airaksinen E, Wahlin Å, Forsell Y and Larsson W. Low episodic memory performance as a premorbid marker of depression: evidence from a 3-year follow-up. Acta Psychiatr Scand 2007; 115: 458–465.
Anderson J, Huppert F and Rose G. Normality, deviance and minor psychiatric morbidity in the community: A population-based approach to General Health Questionnaire data in the Health and Lifestyle Survey. Psychol Med 1993; 23: 475-485.
Arrindell WA and Ettema JHM. SCL-90. Een multidimensionele psychopathologie indicator (The SCL-90. A multidimensional instrument for the assessment of psychopathology). Lisse, The Netherlands: Swets & Zeitlinger; 1986.
Baumeister H and Morar V. The impact of clinical significance criteria on subthreshold depression prevalence rates. Acta Psychiatrica Scandinavica 2008; 118: 443-450.
Beats BC, Sahakian BJ and Levy R. Cognitive performance in tests sensitive to frontal lobe dysfunction in elderly depressed. Psychol Med 1996; 26: 591-603.
Berger AK, Small BJ, Forsell Y, Winblad B and Bäckman L. Preclinical symptoms of major depression in very old age: A prospective longitudinal study Am J Psychiatry 1998; 155: 1039-1043.
Burgess N, Maguire EA and O’Keefe J. The human hippocampus and spatial and episodic memory. Neuron 2002; 35: 625-641.
Burt DB, Zembar MJ and Niederehe G. Depression and memory impairment: a meta-analysis of the association, its pattern, and specificity. Psychol Bull 1995; 177: 285-305.
Campbell S, Marriott M, Nahmias C and MacQueen GM. Lower hippocampal volume in patients suffering from depression: A meta-analysis. Am J Psychiatry 2004; 161: 598-607.
Colman I, Ploubidis GB, Wadsworth MEJ, Jones PB and Croudace TJ. A longitudinal typology of symptoms of depression and anxiety over the life course. Biol Psychiatry 2007; 62: 1256-1271.
De Groot JC, De Leeuw FE, Oudkerk M, Hofman A, Jolles J and Breteler MMB. Cerebral white matter lesions and depressive symptoms in elderly adults. Arch Gen Psychiatry 2000a; 57: 1071-1076.
De Groot JC, De Leeuw FE, Oudkerk M, Van Gijn J, Hofman A, Jolles J and Breteler MMB. Cerebral white matter lesions and cognitive function: the Rotterdam Scan Study. Ann Neurol 2000b; 47: 145-151.
Degl’Innocenti A, Agren H and Backman L. Executive deficits in major depression. Acta Psychiatr Scand 1998; 97: 182-188.
Den Hartog HM, Derix MMA, Van Bemmel AL, Kremer B and Jolles J. Cognitive functioning in young and middle-aged unmedicated out-patients with major depression: testing the effort and cognitive speed hypotheses. Psychol Med 2003a; 33: 1-9.
Den Hartog HM, Nicholson NA, Derix MMA, Van Bemmel AL, Kremer B and Jolles J. Salivary cortisol patterns and cognitive speed in major depression: a comparison with allergic rhinitis and healthy control subjects. Biol Psychol 2003b; 63: 1-14.
Derogatis LR. SCL-90: Administration, Scoring and Procedures Manual-1 For The R(evisited) Version. Baltimore, MD: John Hopkins School of Medicine, Clinical Psychometrics Research Unit; 1977.
Derom CA, Vlietinck RF, Thiery EW, Leroy FOG, Fryns J-P and Derom RM. The East Flanders Prospective Twin Survey (EFPTS). Twin Research and Human Genetics 2006; 9: 733-738.
Egeland J, Lund A, Landrø NI, Rund BR, Sundet K, Asbjørnsen A, Mjellem N, Roness A and Stordal KI. Cortisol levels predict executive and memory function in depression, symptom level predicts psychomotor speed. Acta Psychiatr Scand 2005; 112: 434-441.
Frodl T, Möller HJ and Meisenzahl E. Neuroimaging genetics: new perspectives in research on major depression? Acta Psychiatr Scand 2008; 118: 363-372.
Goldberg D. Plato versus Aristotle: Categorical and dimensional models for common mental disorders. Compr Psychiatry 2000; 41: 8-13.
Goldberg DP. A dimensional model for common mental disorders. Br J Psychiatry 1996; 168: 44-49. Gualtieri CT, Johnson LG and Benedict KB. Neurocognition in depression: patients on and off medication
versus healthy comparison subjects. J Neuropsychiatry Clin Neurosci 2006; 18: 217-225. Hardin JW and Hilbe JM. Generalized linear models and extensions. College Station, TX: STATA Press; 2007. Hickie I. Validity of the CORE: II. Neuropsychological tests. In: G. Parker and D. Hadzi-Pavlovic, editors.
Melancholia: A disorder of movement and mood. New York: Cambridge University Press, 1996: 149-159.
Hildebrandt MG, Stage KB and Kragh-Soerensen P. Gender and depression: a study of severity and symptomatology of depressive disorders (ICD-10) in general practice. Acta Psychiatr Scand 2003; 107: 197-202.

Chapter 3
51
Jacobs N, Rijsdijk F, Derom C, Vlietinck R, Delespaul P, Van Os J and Myin-Germeys I. Genes making one feel blue in the flow of daily life: A momentary assessment study of gene-stress interaction. Psychosom Med 2006; 68: 201-206.
Kendler KS and Gardner CO. Boundaries of major depression: an evaluation of DSM-IV criteria. Am J Psychiatry 1998; 155: 172-177.
Kessler R, McGonagle K, Zhao S, Nelson CB, Hughes N, Eshleman S, H.U. W and Kendler KS. Life-time and 12-month prevalence of DSM-III-R psychiatric disorders in the United States. Arch Gen Psychiatry 1994; 51: 8-19.
Krabbendam L, Myin-Germeys I, De Graaf R, Vollebergh W, Nolen WA, Iedema J and Van Os J. Dimensions of depression, mania and psychosis in the general population. Psychol Med 2004; 34: 1177-1186.
Kuny S and Stassen HH. Cognitive performance in patients recovering from depression. Psychopathology 1995; 28: 190-207.
Loos R, Derom C, Vlietinck R and Derom R. The East Flanders Prospective Twin Survey (Belgium): A population-based register. Twin Res 1998; 1: 167-175.
Nolen-Hoeksema S, Larson J and Grayson C. Explaining the gender difference in depressive symptoms. J Pers Soc Psychol 1999; 77: 1061-1072.
O'Brien JT, Sahakian BJ and Checkley SA. Cognitive impairments in patients with seasonal affective disorder. Br J Psychiatry 1993; 163 338-343.
Olsen LR, Mortensen EL and Bech P. Mental distress in the Danish general population. Acta Psychiatr Scand 2006; 113: 477-484.
Paradiso S, Lamberty GJ, Garvey MJ and Robinson RG. Cognitive impairment in the euthymic phase of chronic unipolar depression. J Nerv Ment Dis 1997; 185: 748-754.
Reitan RM. Validity of the Trail Making Test as an indication of organic brain damage. Percept Mot Skills 1958; 8: 271-276.
Roberts RE, Kaplan GA, Shema SJ and Strawbridge WJ. Does growing old increase the risk for depression? Am J Psychiatry 1997; 154: 1384-1390.
Roberts RE, Shema SJ, Kaplan GA and Strawbridge WJ. Sleep complaints and depression in an aging cohort: A prospective perspective. Am J Psychiatry 2000; 157: 81-88.
Rossi A, Stratta P, Nistico R, Sabatini MD, Di Michele V and Casacchia M. Visuospatial impairment in depression: A controlled ECT study. Acta Psychiatr Scand 1990; 81: 245-249.
Rund BR, Sundet K, Asbjørnsen A, Egeland J, Landrø NI, Lund A, Roness A, Stordal KI and Hugdahl K. Neuropsychological test profiles in schizophrenia and non-psychotic depression. Acta Psychiatr Scand 2006; 113: 350-359.
Sapolsky RM. The possibility of neurotoxicity in the hippocampus in major depression: a primer on neuron death. Biol Psychiatry 2000; 48: 755-765
Sauro MD, Jorgensen RS and Pedlow T. Stress, glucocorticoids, and memory: a meta-analytic review. Stress 2003; 6: 235-245.
Smith A. The Symbol Digit Modalities Test: A neuropsychological test for economic screening of learning and other cerebral disorders. Learning Disabil 1968; 36: 83-91.
StataCorp. STATA Statistical Software: Release 8.0. College Station, TX: StataCorp; 2003. Stefanis NC, Hanssen M, Smirnis NK, Avramopoulos DA, Evdokimidis IK, Stefanis CN, Verdoux H and Van
Os J. Evidence that three dimensions of psychosis have a distribution in the general population. Psychol Med 2002; 32: 347-358.
Van der Elst W, Boxtel MP, Van Breukelen GJ and Jolles J. The Concept Shifting Test: adult normative data. Psychol Assess 2006a; 18: 424-432.
Van der Elst W, Boxtel MP, Van Breukelen GJ and Jolles J. The Letter Digit Substitution Test: normative data for 1,858 healthy participants aged 24-81 from the Maastricht Aging Study (MAAS): influence of age, education, and sex. J Clin Exp Neuropsychol 2006b; 28: 998-1009.
Van der Elst W, Boxtel MP, Van Breukelen GJ and Jolles J. The Stroop color-word test: influence of age, sex, and education; and normative data for a large sample across the adult age range. Assessment 2006c; 13: 62-79.
Van der Elst W, Boxtel MPJ, Van Breukelen GJP and Jolles J. Rey's Verbal Learning Test: Normative data for 1,855 healthy participants aged 24-81 years and the influence of age, sex, education, and mode of presentation. J Int Neuropsycholog Soc 2005; 11: 290-302.
Van Os J, Jones P, Lewis G, Wadsworth M and Murray R. Developmental precursors of affective illness in a general population birth cohort. Arch Gen Psychiatry 1997; 54: 625-631.
Videbech P and Ravnkilde B. Hippocampal volume and depression: A meta-analysis of MRI studies. Am J Psychiatry 2004; 161: 1957-1966.
Viken RJ, Rose RJ, Kaprio J and Koskenvuo M. A developmental genetic analysis of adult personality: extraversion and neuroticism from 18 to 59 years of age. J Pers Soc Psychol 1994; 66: 722-730.

Chapter 3
52
Whittington JE and Huppert FA. Changes in the prevalence of psychiatric disorder in a community are related to changes in the mean level of psychiatric symptoms. Psychol Med 1996; 26: 1253-1260.
Wichers MC, Myin-Germeys I, Jacobs N, Peeters F, Kenis G, Derom C, Vlietinck R, Delespaul P and Van Os J. Evidence that moment-to-moment variation in positive emotions buffer genetic risk for depression: a momentary assessment twin study. Acta Psychiatr Scand 2007; 115: 451-457.
Zakzanis KK, Leach L and Kaplan E. On the nature and pattern of neurocognitive function in major depressive disorder. Neuropsychiatry Neuropsychol Behav Neurol 1998; 11: 111-119.


55
CHAPTER 4
Auditory P300 and N100 components as intermediate
phenotypes for psychotic disorder: familial liability and
reliability
Claudia J.P. Simons1 2, Anke Sambeth3, Jim Van Os1 4, Lydia Krabbendam1 5, Wim J. Riedel3
1 Department of Psychiatry and Neuropsychology, Maastricht University, European Graduate School of
Neuroscience, SEARCH, P.O. Box 616, 6200 MD Maastricht, The Netherlands 2 GGz Eindhoven, P.O. Box 909, 5600 AX Eindhoven, The Netherlands 3 Department of Neuropsychology and Psychopharmacology, Faculty of Psychology & Neuroscience, Maastricht
University, P.O. Box 616, 6200 MD Maastricht, The Netherlands 4 Visiting Professor of Psychiatric Epidemiology King's College London, King's Health Partners Department of
Psychosis Studies Institute of Psychiatry 5 Centre Brain and Learning, Department of Psychology and Education, VU University Amsterdam, van der
Boechorststraat 1, 1081 BT Amsterdam, The Netherlands

Chapter 4
56
Abstract
Background. Abnormalities of the auditory P300 evoked potential are a robust finding in
patients with psychosis. The purposes of this study were to determine whether patients with a
psychotic disorder and their healthy siblings show abnormalities in P300 and N100 waves and
to establish test-retest reliabilities for these event-related potential (ERP) components.
Method. Using an auditory oddball paradigm, P300 and N100 latency and amplitude were
acquired from 19 patients with a psychotic disorder, 28 unaffected first-degree relatives, and
37 healthy controls, on two separate occasions. Event-related potential components were
compared between groups, using multilevel random regression analyses. Intraclass
correlations were used to determine consistency of ERP components between the two
sessions. Results. A delayed N100 latency was found in unaffected siblings of psychosis
patients. Patients showed significantly delayed P300 latency and diminished P300 amplitude
compared with controls. Most ERP parameters showed good test-retest reliability. However,
patients did not show sufficient test-retest reliability for N100 latency. Conclusion. The
present study failed to find any significant P300 abnormalities in healthy siblings of patients
with a psychotic disorder. However, N100 latency is delayed in healthy siblings and can be
reliably measured in controls and siblings, suggesting that this component, rather than P300,
may serve as a liability marker.
Keywords: P300; N100; EEG; event-related potential; psychosis; reliability; schizophrenia

Chapter 4
57
Introduction
Schizophrenia is a highly heritable disorder (Cardno and Gottesman, 2000; Gottesman, 1991).
However, genetic association studies have, as yet, failed to provide consistent results
regarding the precise mode of transmission of the genetic vulnerability. The genetic
complexity of the disorder has led to the search for intermediate phenotypes with a simpler
genetic basis than the dichotomous schizophrenia phenotype to facilitate the identification of
genetic loci involved in the disorder. Deficits in cognition and information processing, which
are prominent in schizophrenia, may be such intermediate phenotype markers. Event-related
brain potentials (ERPs) reflect neural activity associated with cognitive information
processing (Donchin, 1979) and as such, could be biological intermediate phenotype markers
for schizophrenia.
The P300 waveform has been considered as a promising candidate intermediate phenotype.
P300 amplitude is thought to index brain activity reflecting attention to incoming stimulus
information when representations are updated, as well as attribution of salience to deviant
stimuli (Polich, 2007; Turetsky et al., 2007). P300 latency is considered to be a measure of
perceptual processing speed (Polich, 2007). Amplitude reduction of the auditory P300 wave is
a robust finding in patients with a psychotic disorder and P300 latency has been shown to be
delayed in patients compared with healthy controls (Bramon, et al., 2004b; Jeon and Polich,
2001). Twin and family studies exhibit moderate to high heritability of the P300 amplitude
(Hall, et al., 2006; O'Connor, et al., 1994; Polich and Burns, 1987; Wright, et al., 2001) and,
although less consistently, suggest that a significant proportion of the variance in P300
latency may be attributed to genetic factors (Almasy, et al., 1999; Katsanis, et al., 1997;
Wright, et al., 2001). Studies investigating the P300 waveform in first-degree relatives of
patients with a psychotic disorder have produced mixed results. Some family studies have
found reductions in P300 amplitudes in siblings (Frangou, et al., 1997; Kidogami, et al., 1991;
Kimble, et al., 2000; Schreiber, et al., 1992; Turetsky, et al., 2000; Weisbrod, et al., 1999),
whereas other studies did not find differences between siblings and controls (de Wilde, et al.,
2008; Karoumi, et al., 2000; Sumich, et al., 2008). In a meta-analysis, Bramon and colleagues
(2005) showed that siblings displayed normal P300 amplitude, but had a significantly
prolonged P300 latency.
Reductions in the amplitude of the earlier auditory N100 evoked potential are also found in
patients with a psychotic disorder, reflecting deficits in mechanisms involved in initial
sensory processing and early selective attention (Frangou, et al., 1997; Laurent, et al., 1999;

Chapter 4
58
Strik, et al., 1992). A study of healthy twins suggested that the reduction in N100 amplitude is
highly heritable (Anokhin, et al., 2007), and there is some evidence that the reduction in N100
amplitude is also seen in first-degree relatives (Blackwood et al., 1991; Frangou et al., 1997;
Turetsky et al., 2008).
Thus, the P300 and N100 waveforms both may be potential intermediate phenotypes because
both appear to be abnormal in patients, both appear heritable and there is also evidence,
although mixed, that both show abnormalities in healthy first-degree relatives. However,
biological markers should not only be meaningfully associated with the disorder and be under
significant genetic control; they should also be stable over time to be considered as useful
intermediate phenotypes (de Geus, 2002). Studies of healthy control subjects suggest that
P300 amplitude has good test-retest reliability (Mathalon, et al., 2000; Segalowitz and Barnes,
1993; Walhovd and Fjell, 2002; Winterer, et al., 2003) and measurements of N100 amplitude
reliability are satisfactorily as well (Fuerst, et al., 2007; Kinoshita, et al., 1996; Segalowitz
and Barnes, 1993; Walhovd and Fjell, 2002). Compared with amplitude, ERP latency
generally shows lower test-retest reliability (Fabiani, et al., 1987; Kinoshita, et al., 1996;
Polich, 1986). Relatively few studies have reported short-term (days) test-retest reliability in
patients with a psychotic disorder and to our knowledge, no study to date has reported
separate test-retest reliabilities for siblings.
The aims of the present study were to investigate P300 and N100 components as potential
intermediate phenotypes of psychosis. More specifically, the present study investigated
whether these ERP components (i) display abnormalities in patients with a psychotic disorder
as well as in their unaffected family members, and (ii) show adequate test-retest reliability
across control, sibling and patient groups.
Method
Subjects
The present study consisted of three groups: (i) 22 patients with a DSM-IV diagnosis of non-
affective psychosis (17 schizophrenia, 1 schizophreniform disorder, 2 schizoaffective
disorder, 2 psychotic disorder not otherwise specified), (ii) 31 non-psychotic siblings of
patients with a non-affective psychosis, and (iii) 39 healthy control participants without a
familial history of psychosis. Inclusion criteria were: fluent in Dutch and aged between 18-50
years. Subjects were excluded if there was a history of significant head injuries or
neurological disorders. All three groups were frequency-matched on age and gender (Table
1). Patients were recruited from community mental health centres and psychiatric hospitals in

Chapter 4
59
the south of the Netherlands and in Belgium. Siblings were recruited through the participating
patient, and control participants were recruited from the same geographical regions as the
patients through advertising and mailing lists.
Participants were interviewed by trained psychologists using the Comprehensive Assessment
of Symptoms and History (Andreasen, et al., 1992). Two verbal subtests (Information and
Arithmetic) and two performance subtests (Block Design and Symbol Search) of the
Wechsler Adult Intelligence Scale-III (Wechsler, 1997) were used to estimate IQ (Blyler, et
al., 2000).
The study was approved by the medical ethical committee of Maastricht University Medical
Centre. All participants provided written informed consent.
Experimental procedure
Subjects took part in two identical recording sessions, temporally spaced apart by 11 days
(SD = 7.5, range: 2-44 days). The oddball paradigm was assessed as part of a larger study,
which further included: assessments of cognitive functioning (verbal memory, sustained
attention, executive functioning, and processing speed), resting electroencephalogram (EEG),
40-Hz steady state response, contingent negative variation paradigm, three gamma band
paradigms, P50 gating paired-click paradigm, and mismatch negativity oddball paradigm. The
order of administration was fixed. The P300 auditory oddball paradigm was administered
within the first fifteen minutes of the EEG test session. To assess the presence of psychiatric
symptoms at the time of testing, the extended Brief Psychiatric Rating Scale (Lukoff, et al.,
1986) was administered after the second recording session.
Auditory oddball paradigm
Within a simple auditory two-tone oddball paradigm, 576 auditory stimuli were presented
binaurally by loudspeaker at an approximately 60-dB sound pressure level. Non-targets (1000
Hz tones) and targets (2000 Hz tones) were presented in a ratio of 7:1 in a pseudo-randomized
sequence with a stimulus duration of 50 ms and a 1000-ms fixed interstimulus interval.
Subjects were instructed to fixate their eyes on a central cross displayed on a monitor and to
press a button in response to targets only.

Chapter 4
60
Table 1. Demographic and clinical variables.
Patients
(n = 20)
Siblings
(n = 28 )
Controls
(n = 38)
Mean SD Mean SD Mean SD
Statistic (df)
p-value
Age
Male sex, n (%)
Educationa
IQb
Reaction time
BPRS totalc
Antipsychotic use
Atypical
Typical
29.3
13
(65%)
5.6
97.7
376
42.0
n = 12
n = 3
6.4
1.7
16.2
83.0
13.9
29.2
17
(61%)
6.1
114.1
297
28.3
7.6
1.9
17.8
48.8
3.6
28.6
24
(63%)
6.0
113.4
280
26.6
9.1
1.7
15.4
40.9
2.1
F(2,86) = .06
χ2 (2) = .10
F(2,86) = .53
F(2,86) = 7.36
F(2,86) = 20.37
F(2,85) = 33.33
.94
.95
.59
.001
<.0001
<.0001
a Educational level achieved, measured on a nine-point scale from no education (0) to university degree (8) b IQ was assessed using a short form of the WAIS-III using Information, Block Design, Digit Symbol and
Arithmetic c Brief Psychiatric Rating Scale total scores
ERP recording
Scalp electrode activity was recorded using Neuroscan Synamps and Neuroscan Scan 4.3
software (Neuroscan Inc., Sterling, VA, USA) and was measured at 30 electrode sites, of
which Fz, Cz and Pz were analysed. The EEG electrodes were referenced to the left mastoid.
Tin electrodes were used to record bipolarly the vertical (above and below the left eye) and
horizontal (at outer canthi of both eyes) electrooculogram (EOG). An electrode at an anterior
midline site (AFz) served as ground. Electrode impedances were kept below 5 kΩ. EEG and
EOG were digitally filtered with a bandpass of 0.1 to 100 Hz. Digitization rate and gain were
1000 Hz and 150, respectively, and no notch filter was applied.

Chapter 4
61
ERP analysis
Analyses were performed using Neuroscan Scan 4.3 (Neuroscan Inc., Sterling, VA, USA).
Data were filtered off-line with a 1-Hz high-pass filter (6 dB/oct). Ocular activity was
removed using a regression procedure. Epochs were segmented at intervals of 100 ms pre-
stimulus and 1000 ms post-stimulus. After segmentation, data were filtered using a 30-Hz
low-pass filter (6 dB/oct) and data were baseline-corrected. Artefacts were removed both
automatically by eliminating epochs that contained signals exceeding ±75 µV between 100
ms pre-stimulus and 500 ms post-stimulus, and based on visual inspection. Sweeps with
incorrect performance were also rejected, that is, target tones to which no response was made
and non-targets to which a response was made were excluded from analysis. The ERP
components for target and non-target tones were analysed separately.
Components were defined as: N100, the most negative peak occurring between 70 and 160
ms post-stimulus; and P300, the most positive peak between 250 and 500 ms post-stimulus.
Amplitudes were measured from baseline to peak.
Statistical analysis
The present data have a hierarchical structure. Multiple observations (level 1) were clustered
within subjects (level 2), who were part of families (level 3). Multilevel random regression
analysis is the method of choice to deal with data consisting of observations at more than one
level in terms of unit of analysis, by taking the variability associated with each level of
nesting into account (Snijders and Bosker, 1999). The XTMIXED command in STATA 10.0
(StataCorp, 2007) was used to conduct multilevel linear regression analyses, fitted with
maximum likelihood methods. Data from test and retest sessions and three midline electrodes
(Fz, Cz, Pz) were entered into the regression analyses. For the standard stimuli, there was no
clear P300 component in a large proportion of the sample. Therefore, we conducted analyses
of the P300 components for target stimuli only, whereas the analyses for the N100
components were conducted for standard as well as target stimuli. Each ERP variable was
assessed in a separate analysis. Sex and age were included as covariates for all regression
analyses. Group was coded as 0, 1 and 2, with value 0 for the control group (reference group),
1 for the sibling group, and 2 for the patient group.

Chapter 4
62
Test-retest reliability was estimated by calculating intraclass correlation coefficients (ICCs)
for each of the three midline electrodes (Fz, Cz, Pz), carried out using SPSS (SPSS version
16.0 for Windows; SPSS Inc., Chicago). ICCs take both within-subject as well as between-
subject variance into account and therefore provide a better measure of test-retest reliability,
compared with, for example, Pearson product moment correlations (Bartko, 1991; Bartko,
1994; Farahat, et al., 2003). ICCs were used in a two-way mixed effects model with
consistency and single measurements (Farahat, et al., 2003). It was decided a priori that a
reliability coefficient of less than .40 would be considered poor, coefficients between .40-.59
would be considered fair, coefficients between .60-.75 good and coefficients larger than .75
excellent, based on previous accounts of classifying the degree of reliability (Fleiss, 1986;
Rentzsch, et al., 2008).
Results
Sample
Due to technical difficulties, two participants of the patient group and one participant of the
control group were excluded. Additionally, one participant of the control group was excluded
because of use of antidepressive medication and one sibling was excluded because of use of
methylphenidate. One patient’s EEG data contained excessive artefacts on both occasions;
two control subjects had data containing excessive artefacts on a single occasion. These data
were excluded from further analyses. Thus, EEG data from the oddball paradigm were
available for 20 patients, 28 siblings and 38 healthy control participants, stemming from 68
different families (including 12 patient-sibling couples, 1 patient-sibling-sibling couple, 2
sibling-sibling couples, 2 control-control couples and 7 single patients, 9 single siblings, and
34 single controls). Eighty-three of these subjects had data available from both sessions.
Table 1 shows demographic and clinical data.
ERP data
Descriptive statistics are depicted in Table 2. Grand average waveforms elicited by standard
and target tones are presented in Figure 1. There were no large or significant differences
between groups in the number of sweeps analyzed.
N100
For the standard stimuli, N100 latencies of patients differed significantly from controls (β =
.42, p = .048). Siblings also displayed a significantly longer N100 latency than controls (β =

Chapter 4
63
.38, p = .049). Results were similar for target stimuli: patients (β = .41, p = .04) as well as
siblings (β = .51, p = .001) displayed significantly longer N100 latencies compared with
controls.
A trend towards significance was found for the difference in N100 amplitude between
patients and controls for standard stimuli (β = .39, p = .09). There was no significant
difference in N100 amplitude between patients and controls for target stimuli (β = -.20, p =
.33), nor were there significant differences in N100 amplitude between siblings and controls
(standards: β = .15, p = .49; targets β = -.23, p = .22).
Table 2. P300 and N100 descriptive statistics.
Patients
(n = 20)
Siblings
(n = 28 )
Controls
(n = 38)
Mean SD Mean SD Mean SD
N100 latency (ms)
Standards
Targets
N100 amplitude (µV)
Standards
Targets
P300 latency (ms)
Targets
P300 amplitude (µV)
Targets
127
127
-2.9
-4.1
332
7.8
11.2
12.1
1.8
2.9
46.0
4.9
127
128
-3.6
-4.8
304
11.7
6.3
9.2
1.9
2.3
39.2
4.2
124
122
-3.9
-4.0
290
11.0
8.4
11.0
2.4
2.9
38.1
5.2
P300
Patients showed a significantly longer P300 latency compared with controls (β = .94, p
<.001). The difference in P300 latency in siblings compared with controls showed a trend
towards significance (β = .32, p = .09).
Patients showed a significantly reduced P300 amplitude compared with controls (β = -.61, p
=.004), whereas siblings did not differ significantly from controls (β = .15, p = .44).

Chapter 4
64
Fz Target response
-100 0 100 200 300 400 500
-5
0
5
10 Controls
Patients
Siblings
N100
P300
Time (ms)
Amplitude (
µµ µµV)
Fz Standard response
-100 0 100 200 300 400 500
-5
0
5
10 Controls
Patients
Siblings
N100
Time (ms)
Amplitude (
µµ µµV)
Cz Target response
-100 0 100 200 300 400 500
-5
0
5
10 Controls
Patients
Siblings
Time (ms)
Amplitude (
µµ µµV)
Cz Standard response
-100 0 100 200 300 400 500
-5
0
5
10 Controls
Patients
Siblings
Time (ms)
Amplitude (
µµ µµV)
Pz Target response
-100 0 100 200 300 400 500
-5
0
5
10 Controls
Patients
Siblings
Time (ms)
Amplitude (
µµ µµV)
Pz Standard response
-100 0 100 200 300 400 500
-5
0
5
10 Controls
Patients
Siblings
Time (ms)
Amplitude (
µµ µµV)
Figure 1. Grand average event-related potential waveforms elicited by oddball target and standard tones in
patients with schizophrenia, unaffected siblings of patients and healthy controls.

Chapter 4
65
Table 3. Intraclass correlation coefficients. Two-way mixed effect model with consistency and single
measurements.
Patients
ICC (CI)
Siblings
ICC (CI)
Controls
ICC (CI)
N100 latency Standards
Fz
Cz
Pz
Targets
Fz
Cz
Pz
.20 (-.25-.58)
.20 (-.27-.59)
-.07 (-.49-.37)
.74 (.45-.89)**
.72 (.40-.88)**
.40 (-.04-.71)*
.86 (.72-.94)**
.89 (.76-.95)**
.61 (.29-.80)**
.63 (.33-.82)**
.76 (.52.-.88)**
.45 (.08-.71)*
.85 (.71-.92)**
.94 (.88-.97)**
.72 (.50-.84)**
.73 (.52-.85)**
.50 (.20-.72)*
.34 (.01-.61)*
N100 amplitude
Standards
Fz
Cz
Pz
Targets
Fz
Cz
Pz
.92 (.80-.97)**
.89 (.73-.96)**
.79 (.54-.91)**
.63 (.26-.84)**
.76 (.47-.90)**
.53 (.13-.78)*
.92 (.82-.96)**
.90 (.78-.95)**
.77 (.55-.89)**
.62 (.31-.81)**
.61 (.29-.81)**
.45 (.09-.71)*
.77 (.59-.88)**
.74 (.53-.86)**
.63 (.37-.79)**
.75 (.55-.87)**
.76 (.56-.87)**
.56 (.27-.75)**
P300 latency
Targets
Fz
Cz
Pz
.61 (.24-.83)*
.64 (.27-84)*
.52 (.11-.78)*
.77 (.56-.89)**
.76 (.52-.88)**
.54 (.20-.76)*
.34 (.01-.61)*
.61 (.34-.78)**
.41 (.08-.65)*
P300 amplitude Targets
Fz
Cz
Pz
.77 (.51-.90)**
.83 (.61-.93)**
.85 (.65-.94)**
.73 (.49-.87)**
.84 (.67-.93)**
.80 (.61-.91)**
.77 (.59-.88)**
.75 (.55-.87)**
.74 (.54-.86)**
CI: 95% confidence interval
* p < .05, ** p < 0.001

Chapter 4
66
Test-retest reliability
The intraclass correlation coefficients as a measure of test-retest reliability are displayed in
Table 3. Of the 54 ICCs, 22 were larger than .75 and can therefore be classified as evidence of
‘excellent’ test-retest reliability. Eighteen ICCs could be classified as good, 9 as fair and 5 as
poor. Test-retest reliability for all P300 amplitude measures was good to excellent. P300
latency was typically less consistent with all P300 latencies ranging from fair to excellent,
with the exception of one. All N100 amplitude measures had ICCs ranging from fair to
excellent. ICCs for N100 latency were less consistent; test-retest reliability for the N100
latency parameters for standard stimuli was poor in patients and failed to reach statistical
significance.
Discussion
Between-group differences
The present study confirms previous findings of reduced P300 amplitude (de Wilde, et al.,
2008; Frangou, et al., 1997; Sumich, et al., 2008; Turetsky, et al., 2000; Weisbrod, et al.,
1999; Winterer, et al., 2003) and latency (Bramon, et al., 2005) in patients with a psychotic
disorder. The unaffected sibling group did not show any significant differences in P300
latency and amplitude, although a trend towards significance was seen for P300 latency.
There have been several negative reports regarding P300 abnormalities in unaffected siblings
(de Wilde, et al., 2008; Karoumi, et al., 2000; Sumich, et al., 2008). Task difficulty may
influence the magnitude of genetic influences on the variance in P300 amplitude (Polich and
Burns, 1987; van Beijsterveldt, et al., 1998) and may therefore influence the effect size when
comparing a genetic risk group with a healthy control group. The oddball task used in the
present study is a relatively easy task, which could explain the lack of effect in siblings.
However, other studies suggest comparable heritability for easy and difficult tasks (Katsanis,
et al., 1997; Wright, et al., 2001). In their review, Bharath and colleagues (2000) point out
that studies using difficult tasks found P300 differences in high risk groups, whereas studies
using relatively simple oddball tasks did not, and suggest that high risk studies should use
more attention demanding tasks.
There were no significant differences in N100 amplitude between the three groups, in contrast
to previous studies finding amplitude reductions in patients (Laurent, et al., 1999; Strik, et al.,
1992) and in first-degree relatives (Blackwood, et al., 1991; Frangou, et al., 1997). N100
latency, on the other hand, was significantly delayed in patients and in siblings, for non-target
as well as target stimuli, thus suggesting that N100 latency may be a manifestation of familial

Chapter 4
67
and possibly genetic liability for psychosis. The results are suggestive of slowed processing of
auditory information early in the processing sequence, consistent with findings of
abnormalities in other early components such as abnormalities in mismatch negativity (Alain,
et al., 1998; Bramon, et al., 2004a; Javitt, et al., 1993) and impaired auditory sensory gating
(Boutros, et al., 2009; Clementz, et al., 1997). Slowing of initial auditory processing may
have downstream consequences for conscious processing of information, as indexed by
delayed peaking of later ERP components such as P300.
Reliability
The reliability of the ERP components recorded with an average interval of 11 days was
sound, with the main exception of N100 latencies for standards in patients. P300 amplitude
reliability was good to excellent across electrode site and group (ICC .73-.85). The latency of
the P300 was less consistent (ICC .34-.76). This is in line with previous studies applying
oddball paradigms, showing good test-retest correlation coefficients (r) for P300 amplitude
(.5-.8) and good, but generally lower coefficients for P300 latency (.4-.7) in healthy controls
(Fabiani et al., 1987; Polich, 1986; Segalowitz and Barnes, 1993).
N100 amplitude reliability ranged from fair to excellent across group and electrode (ICC .45-
.92), with somewhat higher reliabilities for standard trials than for target trials. Conform
previous findings (Fuerst, et al., 2007; Walhovd and Fjell, 2002), N100 amplitude measures
were overall more robust than latency measures, in line with the findings for the P300
reliability measures. Previous studies suggest that ERP test-retest reliability tends to follow
the topographical distribution of the ERP component, and is greatest where the component is
maximal (Walhovd and Fjell, 2002; Williams, et al., 2005). N100 latency and amplitude
reliabilities did indeed appear lower for Pz than for Fz and Cz. In contrast, the P300, which
peaks at Pz, did not show clear signs of this topographical effect.
The usefulness of the P300 component as a biological marker for schizophrenia has been
questioned, because it is limited by its lack of specificity, e.g., abnormalities in P300 have
been reported in other clinical populations and in family members at risk for other
neuropsychiatric disorders, such as alcoholism (Hill, et al., 1999), bipolar disorder (Schulze,
et al., 2008) and Alzheimer’s disease (Boutros, et al., 1995). Furthermore, oddball paradigms
and the electrophysiological methods used in family studies of schizophrenia do not show
uniformity, thereby complicating comparisons between studies on test-retest reliability.

Chapter 4
68
Limitations
Siblings and controls were screened for psychotic disorders and affective disorders and were
excluded if they had a lifetime history of psychotic disorder. Six of the siblings in the study
sample and six controls met criteria for a lifetime history of major depressive disorder. Since
P300 amplitude may show abnormalities in unipolar depression (Gangadhar, et al., 1993),
including subjects with a diagnosis of major depressive disorder may influence the results.
However, in depression, P300 abnormalities appear state-dependent and all siblings and
controls with a lifetime history of depression were currently in remission.
At the time of testing, most patients were on antipsychotic medication, thereby raising the
possibility that some of the observed differences between patients and controls may be caused
by medication effects. The delayed N100 latency we found in patients was also found in the
sibling group, who did not use any psychotropic medication. The delayed latency can
therefore not be related to medication status only.
In summary, abnormalities in the P300 component are highly consistent in patients with a
psychotic disorder. N100 latency is delayed in patients and in siblings of patients with a
psychotic disorder and can be reliably measured in siblings, thereby lending support for the
use of N100 latency as a biological marker for psychosis liability.
Acknowledgements
This study was partially made possible by GROUP (Genetic Risk and Outcome of Psychosis)
Maastricht. The study was financially supported by research agreement CSMD Ref No:
002510 from GlaxoSmithKline, R&D Ltd. Brentford, Middlesex, UK. LK was supported by a
VIDI grant from the Netherlands Organisation of Scientific Research, and at times during the
study, AS received funding from the Netherlands Organisation of Scientific Research (VENI
grant 451-07-011).

Chapter 4
69
References
Alain C, Hargrave R and Woods DL. Processing of auditory stimuli during visual attention in patients with schizophrenia. Biol Psychiatry 1998; 44: 1151-1159.
Almasy L, Porjesz B, Blangero J, Chorlian DB, O'Connor SJ, Kuperman S, Rohrbaugh J, Bauer LO, Reich T, Polich J and Begleiter H. Heritability of event-related brain potentials in families with a history of alcoholism. Am J Med Genet 1999; 88: 383-390.
Andreasen NC, Flaum M and Arndt S. The Comprehensive Assessment of Symptoms and History (CASH) An Instrument for Assessing Diagnosis and Psychopathology. Arch Gen Psychiatry 1992; 49: 615-623.
Anokhin AP, Vedeniapin AB, Heath AC, Korzyukov O and Boutros NN. Genetic and environmental influences on sensory gating of mid-latency auditory evoked responses: A twin study. Schizophr Res 2007; 89: 312-319.
Bartko JJ. Measurement and Reliability: Statistical Thinking Considerations. Schizophr Bull 1991; 17: 483-489. Bartko JJ. Measures of agreement: A single procedure. Stat Med 1994; 13: 737-745. Bharath S, Gangadhar BN and Janakiramaiah N. P300 in family studies of schizophrenia: review and critique.
Int J Psychophysiol 2000; 38: 43-54. Blackwood DHR, St Clair DM, Muir WJ and Duffy JC. Auditory P300 and Eye Tracking Dysfunction in
Schizophrenic Pedigrees. Arch Gen Psychiatry 1991; 48: 899-909. Blyler CR, Gold JM, Iannone VN and Buchanan RW. Short form of the WAIS-III for use with patients with
schizophrenia. Schizophr Res 2000; 46: 209-215. Boutros N, Torello MW, Burns EM, Wu S-S and Nasrallah HA. Evoked potentials in subjects at risk for
Alzheimer's Disease. Psychiatry Res 1995; 57: 57-63. Boutros NN, Brockhaus-Dumke A, Gjini K, Vedeniapin A, Elfakhani M, Burroughs S and Keshavan M.
Sensory-gating deficit of the N100 mid-latency auditory evoked potential in medicated schizophrenia patients. Schizophr Res 2009; 113: 339-346.
Bramon E, Croft RJ, McDonald C, Virdi GK, Gruzelier JG, Baldeweg T, Sham PC, Frangou S and Murray RM. Mismatch negativity in schizophrenia: a family study. Schizophr Res 2004a; 67: 1-10.
Bramon E, McDonald C, Croft RJ, Landau S, Filbey F, Gruzelier JH, Sham PC, Frangou S and Murray RM. Is the P300 wave an endophenotype for schizophrenia? A meta-analysis and a family study. NeuroImage 2005; 27: 960-968.
Bramon E, Rabe-Hesketh S, Sham P, Murray RM and Frangou S. Meta-analysis of the P300 and P50 waveforms in schizophrenia. Schizophr Res 2004b; 70: 315-329.
Cardno AG and Gottesman II. Twin studies of schizophrenia: From bow-and-arrow concordances to Star Wars Mx and functional genomics. Am J Med Genet 2000; 97: 12-17.
Clementz BA, Geyer MA and Braff DL. P50 Suppression among schizophrenia and normal comparison subjects: A methodological analysis. Biol Psychiatry 1997; 41: 1035-1044.
de Geus EJC. Introducing genetic psychophysiology. Biol Psychol 2002; 61: 1-10. de Wilde OM, Bour LJ, Dingemans PM, Koelman JHTM, Boerée T and Linszen DH. P300 deficits are present
in young first-episode patients with schizophrenia and not in their healthy young siblings. Clin Neurophysiol 2008; 119: 2721-2726.
Donchin E. Event Related Potentials: A tool in the study of human information processing. In: H. Begleiter, editor. Evoked Brain Potentials and Behaviour. London: Plenum Press, 1979: 13-88.
Fabiani M, Gratton G, Karis D and Donchin E. The definition, identification, and reliability of measurement of the P300 component of the event-related brain potential. In: P. K. Ackles, J. R. Jennings and M. G. H. Coles, editors. Advances in Psychophysiology 2. Greenwich, CT: JAI Press Inc, 1987: 1-78.
Farahat FM, Rohlman DS, Storzbach D, Ammerman T and Anger WK. Measures of Short-Term Test-Retest Reliability of Computerized Neurobehavioral Tests. NeuroToxicology 2003; 24: 513-521.
Fleiss J. The Design and Analysis of Clinical Experiments. New York: John Wiley & Sons; 1986. Frangou S, Sharma T, Alarcon G, Sigmudsson T, Takei N, Binnie C and Murray RM. The Maudsley Family
Study, II: Endogenous event-related potentials in familial schizophrenia. Schizophr Res 1997; 23: 45-53.
Fuerst DR, Gallinat J and Boutros NN. Range of sensory gating values and test-retest reliability in normal subjects. Psychophysiology 2007; 44: 620-626.
Gangadhar BN, Ancy J, Janakiranaiah N and Umapathy C. P300 amplitude in non-bipolar, melancholic depression. J Affect Disord 1993; 28: 57-60.
Gottesman II. Schizophrenia genesis: the origins of madness. New York: W.H. Freeman; 1991. Hall M, Schulze K, Rijsdijk F, Picchioni M, Ettinger U, Bramon E, Freedman R, Murray R and Sham P.
Heritability and Reliability of P300, P50 and Duration Mismatch Negativity. Behav Genet 2006; 36: 845-857.
Hill SY, Yuan H and Locke J. Path analysis of P300 amplitude of individuals from families at high and low risk for developing alcoholism. Biol Psychiatry 1999; 45: 346-359.

Chapter 4
70
Javitt DC, Doneshka P, Zylberman I, Ritter W and Vaughan HG. Impairment of early cortical processing in schizophrenia: An event-related potential confirmation study. Biol Psychiatry 1993; 33: 513-519.
Jeon Y-W and Polich J. P300 asymmetry in schizophrenia: a meta-analysis. Psychiatry Res 2001; 104: 61-74. Karoumi B, Laurent A, Rosenfeld F, Rochet T, Brunon A-M, Dalery J, d'Amato T and Saoud M. Alteration of
event related potentials in siblings discordant for schizophrenia. Schizophr Res 2000; 41: 325-334. Katsanis J, Iacono WG, Mcgue MK and Carlson SR. P300 event-related potential heritability in monozygotic
and dizygotic twins. Psychophysiology 1997; 34: 47-58. Kidogami Y, Yoneda H, Asaba H and Sakai T. P300 in first degree relatives of schizophrenics. Schizophr Res
1991; 6: 9-13. Kimble M, Lyons M, O'Donnell B, Nestor P, Niznikiewicz M and Toomey R. The effect of family status and
schizotypy on electrophysiologic measures of attention and semantic processing. Biol Psychiatry 2000; 47: 402-412.
Kinoshita S, Inoue M, Maeda H, Nakamura J and Morita K. Long-term patterns of change in ERPs across repeated measurements. Physiol Behav 1996; 60: 1087-1092.
Laurent A, Garcia-Larréa L, d'Amato T, Bosson J-L, Saoud M, Marie-Cardine M, Maugière F and Dalery J. Auditory event-related potentials and clinical scores in unmedicated schizophrenic patients. Psychiatry Res 1999; 86: 229-238.
Lukoff D, Nuechterlein KH and Ventura J. Manual for the Expanded BPRS. Schizophr Bull 1986; 12: 594-602. Mathalon DH, Ford JM and Pfefferbaum A. Trait and state aspects of p300 amplitude reduction in
schizophrenia: a retrospective longitudinal study. Biol Psychiatry 2000; 47: 434-449. O'Connor S, Morzorati S, Christian JC and Li T-K. Heritable features of the auditory oddball event-related
potential: peaks, latencies, morphology and topography. Electroencephalogr Clin Neurophysiol 1994; 92: 115-125.
Polich J. Normal variation of P300 from auditory stimuli. Electroencephalogr Clin Neurophysiol/Evoked Potentials Section 1986; 65: 236-240.
Polich J. Updating P300: An integrative theory of P3a and P3b. Clin Neurophysiol 2007; 118: 2128-2148. Polich J and Burns T. P300 from identical twins. Neuropsychologia 1987; 25: 299-304. Rentzsch J, Jockers-Scherübl MC, Boutros NN and Gallinat J. Test-retest reliability of P50, N100 and P200
auditory sensory gating in healthy subjects. Int J Psychophysiol 2008; 67: 81-90. Schreiber H, Stolz-Born G, Kornhuber HH and Born J. Event-related potential correlates of impaired selective
attention in children at high risk for schizophrenia. Biol Psychiatry 1992; 32: 634-651. Schulze KK, Hall M-H, McDonald C, Marshall N, Walshe M, Murray RM and Bramon E. Auditory P300 in
patients with bipolar disorder and their unaffected relatives. Bipolar Disord 2008; 10: 377-386. Segalowitz SJ and Barnes KL. The reliability of ERP components in the auditory oddball paradigm.
Psychophysiology 1993; 30: 451-459. Snijders T and Bosker R. Multilevel analysis: an introduction to basic and advanced multilevel modeling.
London: SAGE publications Ltd; 1999. StataCorp. Stata Statistical Software: Release 10. College Station, TX: Statacorp LP; 2007. Strik WK, Dierks T, Böning J, Osterheider M, Caspari A and Körber J. Disorders of smooth pursuit eye
movement and auditory N100 in schizophrenic patients. Psychiatry Res 1992; 41: 227-235. Sumich A, Kumari V, Dodd P, Ettinger U, Hughes C, Zachariah E and Sharma T. N100 and P300 amplitude to
Go and No-Go variants of the auditory oddball in siblings discordant for schizophrenia. Schizophr Res 2008; 98: 265-277.
Turetsky BI, Cannon TD and Gur RE. P300 subcomponent abnormalities in schizophrenia: III. Deficits in unaffected siblings of schizophrenic probands. Biol Psychiatry 2000; 47: 380-390.
van Beijsterveldt CEM, Molenaar PCM, de Geus EJC and Boomsma DI. Individual differences in P300 amplitude: a genetic study in adolescent twins. Biol Psychol 1998; 47: 97-120.
Walhovd KB and Fjell AM. One-year test-retest reliability of auditory ERPs in young and old adults. Int J Psychophysiol 2002; 46: 29-40.
Wechsler D. WAIS-III administration and scoring manual. San Antonia, TX: The Psychological Corporation; 1997.
Weisbrod M, Hill H, Niethammer R and Sauer H. Genetic influence on auditory information processing in schizophrenia: P300 in monozygotic twins. Biol Psychiatry 1999; 46: 721-725.
Williams LM, Simms E, Clark CR, Paul RH, Rowe D and Gordon E. The test-retest reliability of a standardized neurocognitive and neurophysiological test battery: "Neuromarker". Int J Neurosci 2005; 115: 1605-1630.
Winterer G, Egan MF, Raedler T, Sanchez C, Jones DW, Coppola R and Weinberger DR. P300 and Genetic Risk for Schizophrenia. Arch Gen Psychiatry 2003; 60: 1158-1167.
Wright M, Hansell N, Geffen G, Geffen L, Smith G and Martin N. Genetic Influence on the Variance in P3 Amplitude and Latency. Behav Genet 2001; 31: 555-565.


73
CHAPTER 5
Subtle gene-environment interactions driving
paranoia in daily life
CJP Simons1, M Wichers1, C Derom2, E Thiery3, I Myin-Germeys1, L Krabbendam1, J van
Os1 4
1 Department of Psychiatry and Neuropsychology, Maastricht University Medical Centre, European Graduate
School of Neuroscience, SEARCH, P.O. Box 616, 6200 MD Maastricht, The Netherlands 2 Department of Human Genetics, University Hospital Gasthuisberg, Katholieke Universiteit Leuven, Leuven,
Belgium 3 Association for Scientific Research in Multiple Births, Ghent, Belgium 4 Division of Psychological Medicine, Institute of Psychiatry, De Crespigny Park, London SE5 8AF, United
Kingdom
Genes, Brain and Behavior 2009; 8: 5-12

Chapter 5
74
Abstract
It has been suggested that genes impact on the degree to which minor daily stressors cause
variation in the intensity of subtle paranoid experiences. The objective of the present study
was to test the hypothesis that catechol-O-methyltransferase (COMT) Val158Met and brain-
derived neurotrophic factor (BDNF) Val66Met in part mediate genetic effects on paranoid
reactivity to minor stressors. In a general population sample of 579 young adult female twins,
appraisals of, on the one hand, appraisals of (1) event-related stress and (2) social stress and,
on the other hand, feelings of paranoia in the flow of daily life were assessed using
momentary assessment technology for five consecutive days. Multilevel regression analyses
were used to examine moderation of daily life stress-induced paranoia by COMT Val158Met
and BDNF Val66Met genotypes. Catechol-O-methyltransferase Val carriers displayed more
feelings of paranoia in response to event stress compared with Met carriers. Brain-derived
neurotrophic factor Met carriers showed more social stress-induced paranoia than individuals
with the Val/Val genotype. Thus, paranoia in the flow of daily life may be the result of gene-
environment interactions that can be traced to different types of stress being moderated by
different types of genetic variation.
Keywords: brain-derived neurotrophic factor; catechol-O-methyltransferase; paranoia;
psychoses; risk factors; schizophrenia; stress; twins

Chapter 5
75
Introduction
Paranoid thoughts in healthy individuals (subclinical paranoia (Combs and Penn, 2004;
Fenigstein and Vanable, 1992)) represent a common and psychometrically accessible
phenomenon, with at least 10–15% of the general population regularly experiencing them
(Freeman and Garety, 2006). It has been suggested that paranoid thoughts in healthy
individuals are on the same continuum as paranoid delusions in psychotic patients (Combs
and Penn, 2004; Fenigstein and Vanable, 1992). Studies using momentary assessment
technology (Delespaul, 1995; DeVries, 1992) have shown that individuals display stable
differences in their tendency to respond with paranoid and other psychotic experiences to
small daily life stressors and that some of this variation may represent the behavioural
expression of genetic risk for severe psychotic disorders (Myin-Germeys, et al., 2005a),
mediated possibly by underlying abnormal dopamine reactivity (Myin-Germeys, et al.,
2005b).
The enzyme catechol-O-methyltransferase (COMT) plays a critical role in the degradation of
dopamine. The gene contains a functional polymorphism (Val158Met) with two common
variants (Val and Met), corresponding to high and low COMT activity, respectively.
Increased COMT activity may result in increased levels of mesolimbic dopamine signalling
and increased risk for delusions and hallucinations (Akil, et al., 2003; Bilder, et al., 2004).
Given the fact that stress similarly affects subcortical dopamine release (Pruessner, et al.,
2004; Wand, et al., 2007) synergistic COMT–stress interactions may be hypothesized.
Brain-derived neurotrophic factor (BDNF) is likely to play a role in stress-related disorders
such as anxiety and depression (Chen, et al., 2006; Duman, 2004; Hashimoto, 2007;
Santarelli, et al., 2003). Extensive literature documents that stress (acute, chronic, physical or
social stress such as social isolation and social defeat) decreases BDNF expression in the
hippocampus (Duman and Monteggia, 2006; Kozlovsky, et al., 2007). A Val66Met functional
polymorphism in the gene encoding BDNF has been the focus of much recent investigation.
The valine (Val) variant is associated with higher neuronal BDNF secretory activity than the
methionine (Met) variant (Chen, et al., 2004). Met carriers may be more sensitive to stress-
induced BDNF depletion and may thus experience more extreme behavioural responses to
stress compared with Val/Val subjects. Meta-analyses yield conflicting results as to whether
BDNF Val66Met is associated with schizophrenia (Gratacòs, et al., 2007; Kanazawa, et al.,
2007; Xu, et al., 2007), which may be indicative of underlying heterogeneity caused by gene-
environment interaction (Van Os and Sham, 2003). Given the close association between

Chapter 5
76
anxiety and paranoia (Combs and Penn, 2004; Freeman and Garety, 2004; Freeman, et al.,
2005; Martin and Penn, 2001), it is attractive to speculate that BDNF–stress interactions may
underlie symptoms of paranoia.
The aims of this study were to investigate the potential moderating effects of COMT and
BDNF polymorphisms on feelings of paranoia in response to stress. Given the fact that
stressful environmental exposures associated with schizophrenia differ in the degree to which
they may induce ‘social defeat’-type psychological effects (Bjorkqvist, 2001) in the realm of
interpersonal interactions (Collip, et al., 2008), two types of stressors were included in the
current investigation: the first associated with events and the other with social interactions.
Materials and methods
Subjects
The study sample consisted of 621 participants, aged 18-61 years, who were taking part in an
ongoing longitudinal, general population twin study on gene–environment interactions in
psychiatric disorders. Most participants (twins) were recruited from the East-Flanders
Prospective Twin Survey. This population-based survey has prospectively recorded all
multiple births in the province of East-Flanders since 1964 (Derom, et al., 2006; Loos, et al.,
1998). Zygosity was determined through sequential analysis based on sex, fetal membranes,
blood groups, and DNA fingerprints. The project was approved by the local ethics committee
and all participants gave written informed consent. Participants were white and of Belgian
origin.
Experience sampling method
The Experience Sampling Method (ESM) is a momentary assessment technique to assess
subjects in their daily living environment and has been extensively validated for the use of
immediate effects of stressors on mood (Csikszentmihalyi and Larson, 1987; Delespaul, 1995;
DeVries, 1992; Myin-Germeys, et al., 2001; Wichers, et al., 2007). Subjects received a digital
wristwatch and a set of ESM self-assessment forms collated in a booklet for each day. The
wristwatch was programmed to emit a signal (beep) at an unpredictable moment in each of
ten 90-min time blocks between 0730 and 2230 h on five consecutive days. After each beep,
subjects were asked to fill in the ESM self-assessment forms previously handed to them,
collecting reports of thoughts, current context (activity, persons present, and location),
appraisals of current situation, and mood. All self-assessments were rated on 7-point Likert
scales. Trained research assistants with ample experience in momentary assessment

Chapter 5
77
techniques explained the ESM procedure to the participants during an initial briefing session
and a practice form was completed to confirm that subjects understood the rating scales.
Subjects could call a telephone number in case they had questions or problems during the
ESM sampling period. Subjects were instructed to complete their reports immediately after
the beep, thus minimizing memory distortion, and to record the time at which they completed
the form. To verify whether subjects had completed the form within 15 min of the beep, the
time at which subjects indicated they completed the report was compared with the actual time
of the beep. All reports not filled in within 15 min after the beep were excluded from the
analysis because previous work (Delespaul, 1995) has shown that reports completed after this
interval are less reliable and consequently less valid. In addition, subjects with less than 17
valid reports (of 50) were excluded from the analysis as previous work has shown that
measures of individuals with less than 30% of completed reports are less reliable (Delespaul,
1995).
Measures
Event stress and social stress in daily life
Appraisals of minor daily events, situational contexts and feelings of paranoia were collected
at each beep within the ESM framework. For the measurement of event-related stress,
subjects were asked to report the most important event that happened between the current and
the previous beep. This event was subsequently rated on a 7-point bipolar scale (from –3 =
very unpleasant, 0 = neutral to 3 = very pleasant). The scale was reversed so that higher
scores represent higher disliking the event (event stress). Social stress was measured by
asking subjects whether they were alone at the time of the beep. If not alone, they were asked
whether they liked the company they were in at that moment. This was rated on a 7-point
Likert scale [from ‘not at all’ (1) to ‘very much’ (7)]. The scale was reversed so that higher
scores represent higher disliking of being in that company (social stress). To validate the
measure of social stress, the association between the ESM item whether they liked the
company they were with and another ESM item ‘I would like this situation to be different’
was calculated, yielding a significant correlation between the two (r = 0.52, p < .001).
Paranoia
The paranoia scores were derived from the ESM reports as described previously (Myin-
Germeys, et al., 2005a; Myin-Germeys, et al., 2003; Thewissen, et al., 2008). They were
assessed by the ESM item ‘I feel suspicious’ [from ‘not at all’ (1) to ‘very’ (7)].

Chapter 5
78
To test whether the effects of social and event stress on paranoia level were independent of
negative affect, the ESM-negative mood items (feeling insecure, lonely, anxious, guilty,
down; hereafter ‘negative affect’) were entered separately into the model. These ESM items
were rated on 7-point Likert scales [from ‘not at all’ (1) to ‘very’ (7)].
Genotyping
Placental tissue for DNA analysis was available for 156 participants, blood samples for 14,
and buccal cell samples for 208, using a sterile swab specifically designed for the collection
of buccal cell samples for DNA testing (Omni Swabs; Whatman plc, Brentford, England).
Genomic DNA was extracted using QIAamp DNA Mini Kits (Qiagen, Venlo, The
Netherlands) according to the appropriate protocol for each sample type. COMT Val158Met
and BDNF Val66Met genotypes were determined by KBioscience (Hertz, UK) using their
proprietary allelic discrimination assay (for details see http://www.kbioscience.co.uk).
For every monozygotic (MZ) twin in the sample with genotypic data, the same genotypic data
were included for the co-twin, under the assumption that both twins had identical genotypes.
Statistical analysis
ESM data have a hierarchical structure. Thus, multiple observations (level 1) were clustered
within subjects (level 2), who were part of twin pairs (level 3). Multilevel random regression
analysis is the method of choice to deal with data consisting of observations at more than one
level in terms of unit of analysis by taking the variability associated with each level of nesting
into account (Snijders and Bosker, 1999). Thus, multilevel random regression analysis models
both fixed and random effects. The fixed effects are interpreted similarly as standard
regression coefficients and are estimated directly; the random effects portion of the model is
specified by considering the nesting of the data. The XTMIXED command in STATA 10.0
(StataCorp, 2007) was used to conduct multilevel linear regression analyses.
First, the increase in feelings of paranoia following event stress and social stress was assessed.
Second, moderation of the stress-induced paranoia response by COMT (Val/Val, Val/Met,
Met/Met) was examined, fitting the two-way interaction term between COMT genotype and
stress in the model of paranoia. The same was carried out for the BDNF polymorphism.
Effect sizes of interactions between the COMT and BDNF variants on the one hand and event
and social stress appraisals on the other were calculated by applying and testing the
appropriate linear combinations using the STATA LINCOM command. Main effects and
interactions were assessed by Wald test (Clayton and Hill, 1993).

Chapter 5
79
As subjects can differ in the number of beeps that they are actually in other people’s
company, all analyses for social stress were controlled for the number of observations each
person contributed to the analyses to take into account possible systematic differences in
appraisal of social events through, for example personality differences. All variables included
in the analyses were standardized (by dividing the variables by their between-subject standard
deviation) yielding standardized effect sizes.
Results
Sample
The total sample consisted of 621 white subjects, of which 610 participated in the ESM
procedure. Thirty-one subjects were excluded because they had missing or less than 17 valid
ESM self-reports, thus leaving 579 subjects with ESM measurements for feelings of paranoia.
Subjects with less than 17 valid ESM self-reports did not differ in mean scores for event and
social stress (t = -.34, p = .73; t = -1.35, p = .18 respectively). However, there was a
significant difference in reported paranoia scores (t = -3.29, p = .001), excluded subjects
scoring higher. However, it is unclear whether these differences represent true differences in
feelings of paranoia because the self-reports of the excluded subjects are less reliable. Also, in
order for the difference in paranoia score to have biased the results, additional differential
attrition for the stress scores would have been necessary as well, and this was not the case.
Thus, a true difference in paranoia as a function of attrition would have affected
generalizability of the findings rather than causing bias. Mean age of these subjects was 27.7
years (SD = 7.9 years, range 18–61 years). Of these subjects, 552 were female members of
MZ and dizygotic twin pairs and 27 were non-twin sisters. A majority of 62% had a college or
university degree, 36% completed secondary education and 1 % had primary education only.
The majority was currently employed (64% employed, 30% student, 3% unemployed and 3%
homemaker). The mean score on the ESM paranoia item was 1.16 (SD = .63, range 1 to 7);
mean score for event stress was –1.10 (SD = 1.56, range –3 to 3) and mean score for social
stress was –5.39 (SD = 1.47, range –7 to –1). Eight subjects had incomplete ESM
measurements with respect to event stress.
Out of the 579 subjects with ESM measures of paranoia, COMT Val158Met and BDNF
Val66Met genotype were available for 461 and 473, respectively. The frequencies of the three
COMT genotypes were 24.5% Val/Val, 53.7% Val/Met, 21.8% Met/Met comparable with
previous reported frequencies (Henquet, et al., 2006; Stefanis, et al., 2004) and in Hardy–

Chapter 5
80
Weinberg equilibrium (χ2 = 3.02, df = 1, p = .08). The COMT Met/Met variant was the
reference category.
The frequencies of the three BDNF genotypes were 64.1% Val/Val, 30.7% Val/Met, 5.2%
Met/Met comparable with previous reported frequencies (Lang, et al., 2005; Oroszi, et al.,
2006; Schule, et al., 2006) and in Hardy–Weinberg equilibrium (χ2 = 1.51, df = 1, p = .22). As
the BDNF Met/Met genotype group was very small (n = 23), statistical analyses were not
conducted separately in this group of subjects, as they would be underpowered. The Met/Met
group was not simply added to the Val/Met group because differential pathophysiological
mechanisms with regard to mental health outcomes may apply to each genotype (Chen, et al.,
2004). The Val/Val variant was the reference category.
Stress-induced paranoia response in the flow of daily life
In 5189 observations out of a total of 20 837 (24.9%), subjects indicated they were alone and
thus not in the company of other persons. These observations were therefore not informative
with respect to social stress and were not used in the present analyses for social stress.
Event stress was correlated significantly with social stress (r = .27, df = 569, p < .001). Both
event stress (β = .08, p < .001) and social stress (β = .06, p < .001) were significantly and
positively associated with feelings of paranoia, indicating that experiencing stressful
situations are associated with elevated levels of feeling suspicious. When controlling for
negative affect, the association for event stress was reduced but remained highly significant (β
= .02, p = .001), whereas the association with social stress was reduced more and became
non-significant (β = .01, p = .07).
Moderation of stress sensitivity by COMT
Event stress
There were no significant main effects of COMT genotype on feelings of paranoia or on event
stress. There was evidence that COMT genotype moderated event-related stress sensitivity.
Thus, while COMT Val/Met carriers did not differ significantly from Met/Met carriers (β =
.001, p = .94) and this effect remained non-significant after controlling for negative affect (β =
–.005, p = .67), COMT Val/Val carriers reported significantly more feelings of paranoia in
association with event stress compared with Met/Met carriers (β = .05, p = .002). This effect
was essentially unchanged after controlling for negative affect (β = .05, p = .001). In Table 1,
unadjusted beta-coefficients are given, stratified by values of event stress relative to the
reference category (Fig. 1). The greatest degree of separation in effect size between Val/Val

Chapter 5
81
and Met/Met were in the highest categories of unpleasant (χ2 = 4.83, df = 1, p = .03) and very
unpleasant appraisals of events (χ2 = 29.18, df = 1, p < .001).
Social stress
Catechol-O-methyltransferase had a significant main effect on social stress. Catechol-O-
methyltransferase Val/Val (β = –.15, p = .04) and Val/Met carriers (β = –.15, p = .02) reported
significantly less social stress than Met/Met carriers. This effect remained significant after
controlling for negative affect (Val/Met: β = –.16, p = .01; Val/Val: β = –.16, p = .02).
Catechol-O-methyltransferase genotype did not interact with social stress in the model of
paranoia (Val/Met: β = .02, p = .10; Val/Val: β =.01, p = .41), and this remained so after
controlling for negative affect (Val/Met: β = .004, p = .74; Val/Val: β = .01, p = .40).
Table 1. Beta-coefficients and p-values of interaction term ‘event stress’ x ‘COMT Val158Met genotype’ on
paranoia score, separate for each value of event stress relative to the reference category
Met/Met Val/Met Val/Val
β-coefficient p-value β-coefficient p-value β-coefficient p-value
Event stress
‘very pleasant’ -3 - - - - - -
-2 -0.054 0.307 0.027 0.418 0.062 0.250
-1 0.093 0.128 0.066 0.073 -0.008 0.888
‘neutral’ 0 0.079 0.155 0.066 0.054 0.102 0.052
1 0.117 0.180 0.073 0.195 0.157 0.057
2 0.180 0.058 0.281 < 0.001 0.492 < 0.001
‘very unpleasant’ 3 0.246 0.008 0.381 < 0.001 0.996 < 0.001

Chapter 5
82
-0.2
0
0.2
0.4
0.6
0.8
1
Pleasant A bit pleasant Neutral A bit
unpleasant
Unpleasant Very
unpleasant
Event stress
Incre
ase in
fe
elin
gs
of
para
no
iaVal/Val
Val/Met
Met/Met
**
*
Figure 1. Effect sizes of event stress on feelings of paranoia: effect sizes of the paranoia response of event stress
levels ‘pleasant’ to ‘very unpleasant’, relative to the paranoia response of the reference category ‘very pleasant’,
stratified by COMT Val158Met genotype. * p < .05 and ** p < .001 indicate that the difference between COMT
Met/Met and COMT Val/Val is significant for the given category of event stress.
Moderation of stress sensitivity by BDNF
Social stress
There were no significant main effects of BDNF genotype on paranoia, event- or social stress.
Brain-derived neurotrophic factor interacted with social stress in the model of paranoia. Thus,
BDNF Val/Met carriers showed significantly more feelings of paranoia to stressful social
situations than BDNF Val/Val carriers (β = .04, p < .001). This effect was reduced (β = .02, p
= .07) when the analysis was controlled for negative affect. In Table 2, unadjusted beta-
coefficients are given, stratified by values of social stress relative to the reference category
(Fig. 2). Again, most separation was towards higher values of stress; differences in effect size
between the Val/Val and Val/Met variants were significant for unpleasant (χ2 = 4.12, df = 1, p
= .04) and very unpleasant (χ2 = 12.77, df = 1, p = .0004) appraisals of company.
Event stress
Brain-derived neurotrophic factor genotype did not interact with event stress in the model of
paranoia (β = .05, p = .33) and this remained so after controlling for negative affect (β = –.01,
p = .66).
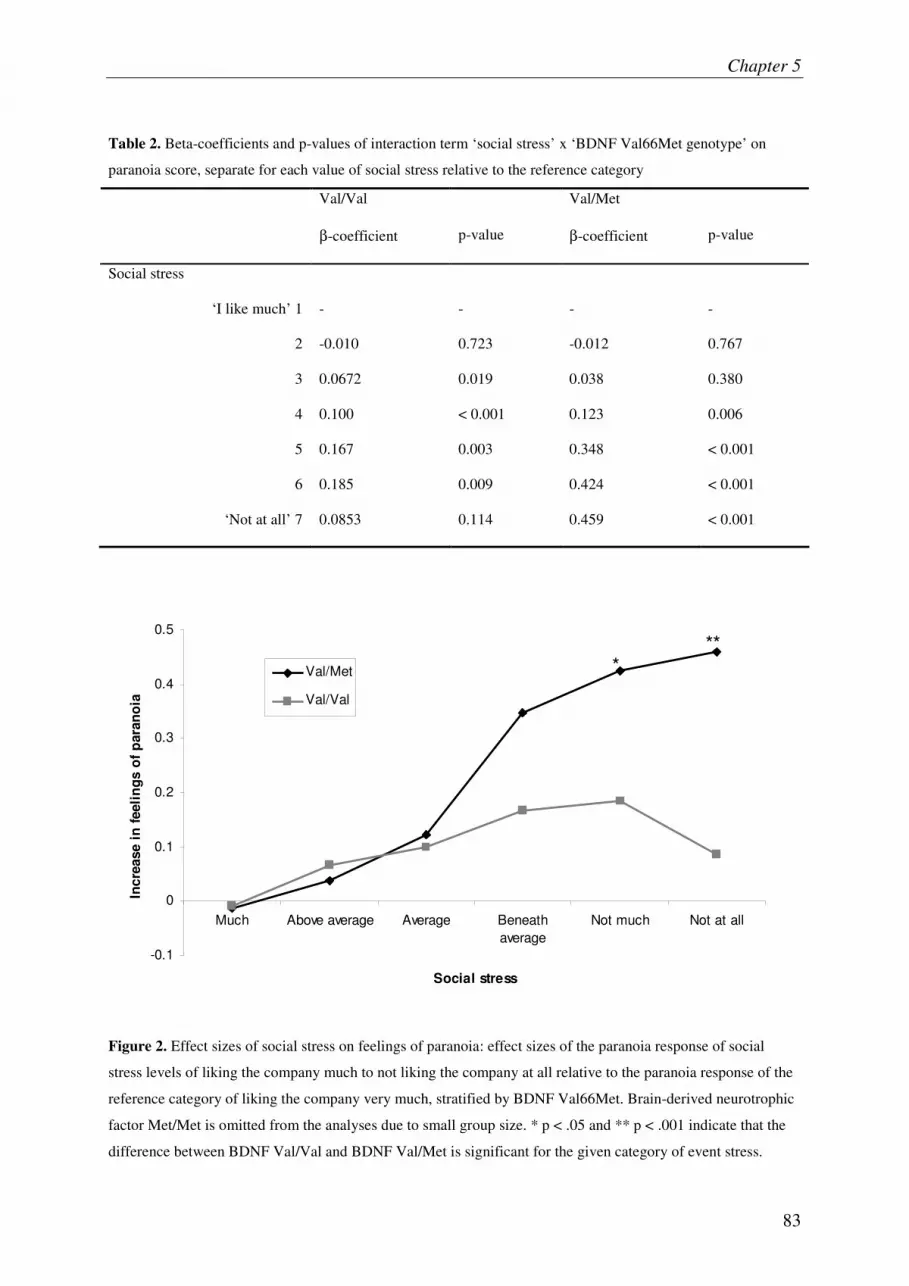
Chapter 5
83
Table 2. Beta-coefficients and p-values of interaction term ‘social stress’ x ‘BDNF Val66Met genotype’ on
paranoia score, separate for each value of social stress relative to the reference category
Val/Val Val/Met
β-coefficient p-value β-coefficient p-value
Social stress
‘I like much’ 1 - - - -
2 -0.010 0.723 -0.012 0.767
3 0.0672 0.019 0.038 0.380
4 0.100 < 0.001 0.123 0.006
5 0.167 0.003 0.348 < 0.001
6 0.185 0.009 0.424 < 0.001
‘Not at all’ 7 0.0853 0.114 0.459 < 0.001
-0.1
0
0.1
0.2
0.3
0.4
0.5
Much Above average Average Beneath
average
Not much Not at all
Social stress
Incre
ase i
n f
eeli
ng
s o
f p
ara
no
ia
Val/Met
Val/Val
***
Figure 2. Effect sizes of social stress on feelings of paranoia: effect sizes of the paranoia response of social
stress levels of liking the company much to not liking the company at all relative to the paranoia response of the
reference category of liking the company very much, stratified by BDNF Val66Met. Brain-derived neurotrophic
factor Met/Met is omitted from the analyses due to small group size. * p < .05 and ** p < .001 indicate that the
difference between BDNF Val/Val and BDNF Val/Met is significant for the given category of event stress.

Chapter 5
84
Discussion
The present study found that minor stressful events in general as well as social stressful daily
life situations are associated with an increase in feelings of paranoia in the flow of daily life,
in line with previous research (Malla, et al., 1990; Myin-Germeys, et al., 2005a; Norman and
Malla, 1991). The results confirm that paranoia is a highly dynamic and fluctuating mental
state, variation of which is strongly associated with environmental stimuli (Freeman, et al.,
2008; Thewissen, et al., 2008).
Catechol-0-methyltransferase, BDNF, stress and paranoia
There were no main effects for the COMT Val158Met polymorphism on feelings of paranoia.
This is in accordance with two recent meta-analyses that found no or little evidence for an
association between the COMT Val158Met polymorphism and familial vulnerability to
psychoses (Fan, et al., 2005; Munafo, et al., 2005). Absence of genetic main effects is
possible in the presence of strong gene–environment interactions, which can reduce the power
of non-stratified molecular genetic studies to such an extent that detection of association
becomes all but impossible (Van Os and Sham, 2003). Thus, the influence of COMT
Val158Met on psychosis phenotypes may be better understood in terms of gene–environment
interactions, rather than in terms of genetic main effects. The results showed that COMT
moderated the effect of event stress on feelings of paranoia, with Val/Val carriers showing
more feelings of paranoia in response to unpleasant events compared with Met/Met carriers,
even after controlling for other forms of negative affect. The findings are in agreement with
those described by Stefanis et al. (2007), who reported that environmental stressful changes
associated with induction into compulsory military service led to an increase in psychotic
symptoms, the effect being larger in Val carriers than in Met/Met subjects. Our findings do
not agree with another previous study (Van Winkel, et al., 2008), which showed that Met/Met
patients showed the largest increase in ESM delusional ideation in reaction to ESM event
stress, whereas there were no significant interactions between COMT and ESM event stress in
control subjects. However, the study sample was predominantly male and consisted of
cannabis users with a psychotic disorder and non-psychotic cannabis users, which limits
comparability with the present results.
In contrast to the results for event stress, COMT did not moderate the effect of social stress on
feelings of paranoia. However, there was a significant gene–environment correlation (genetic
control of exposure to the environment) for the COMT genotype in relation to social stress.
Met/Met carriers had higher social stress scores than Val carriers. These results suggest that

Chapter 5
85
while Val carriers may have a lower tendency to appraise social company as unpleasant, they
are prone to experience more paranoid feelings in response to stressful events.
In contrast to the COMT Val158Met polymorphism, there was no interaction between BDNF
Val66Met and event-related stress reactivity. Rather, BDNF Val66Met interacted with social
stress in its effect on feelings of paranoia. Thus, the effects of BDNF Val66Met on behaviour
may also be understood in terms of gene–environment interactions. The different findings for
the COMT and BDNF polymorphism suggest that both may impact on paranoia through
different pathways, the first by acting on stressful events and the second by acting on stressful
social situations. High levels of COMT may result in enhanced reactivity of dopamine
neurons in response to environmental stimuli so that exposure to even minor stressors can
result in an excessive dopamine response (Laruelle, 2000; Myin-Germeys, et al., 2005b).
Catechol-O-methyltransferase activity is thought to be particularly important for the
regulation of prefrontal dopamine levels and to influence mesolimbic dopaminergic activity
only indirectly by controlling prefrontal feedback mechanisms (Deutch, et al., 1990;
Tunbridge, et al., 2006). The presence of the high-activity Val allele results in increased
metabolism of dopamine in the prefrontal cortex and to decreased tonic inhibition of
downstream projections leading to increased phasic dopamine in mesolimbic areas.
Environmental risk factors may disrupt the inhibitory influence the prefrontal cortex has on
mesolimbic activity, leading to an enhanced responsiveness of mesolimbic dopamine
signalling to stress (Deutch, et al., 1990). Stimulus-independent release of dopamine may take
over the normal process of contextually driven salience attribution, resulting in aberrant
assignment of salience to environmental events and internal representations (Kapur, 2003).
Myin-Germeys et al. (2005b) have shown that sensitization of the dopamine system may
indeed underlie psychotic reactivity to daily life stressors in individuals at elevated genetic
risk for psychosis. Cougnard et al. (2007) suggested that relatively common, subclinical
developmental psychotic experiences may become abnormally persistent when synergistically
combined with environmental risk factors, which may impact on sensitization, such as
cannabis, childhood trauma or urbanicity.
The results of the present study suggest the effect of COMT on event-stress reactivity may be
relatively independent of negative affect. In contrast, the interaction between BDNF and
social stress was reduced after controlling for negative affect, suggesting mediation by
negative affect. Brain-derived neurotrophic factor is associated with stress-related disorders,
such as anxiety and depression (Chen, et al., 2006; Duman, 2004; Hashimoto, 2007;
Santarelli, et al., 2003). A prenatal genetic manipulation of the BDNF gene causing fetal

Chapter 5
86
BDNF depletion results in depressive, aggressive and anxiety-related behaviours in adult mice
(Chan, et al., 2006). This behavioural effect may be mediated by BDNF signalling through
amygdaloid structures. Experimentally reduced BDNF expression in the central and medial
amygdala in rats resulted in increased anxiety-like behaviour (Pandey, et al., 2006). Berton et
al. (2006) showed that repeated exposure to social defeat stress sensitizes the ventral
tegmental area-nucleus accumbens pathway in mice only when BDNF function is intact, and
BDNF deletion requires repeated exposure to social defeat stress to result in social avoidance
behaviour. This suggests that the effect of BDNF would mainly come to the fore during
negative social situations, Met carriers showing a greater degree of anxious responses to these
minor social stressors, which in turn could lead to feelings of paranoia. In line with this
hypothesis was the finding by Wichers et al. (2008), using the same sample, that
BDNFVal66Met Met carriers showed an increased negative affective response to social stress,
but not event stress, compared with Val/Val subjects. Thus, there may be two pathways
leading to feelings of paranoia. Individuals may come to experience paranoid ideas through
abnormal dopamine sensitization, mediated by the COMT Val158Met polymorphism.
Alternatively, negative affect can lead to increased feelings of paranoia and may be mediated
by genes such as BDNF that are involved in depression.
Clinical significance
Stress exposures alone, and in interaction with genetic vulnerability, showed statistically
significant associations with daily life stress sensitivity. However, the question rises to what
extent these effects represent clinically meaningful findings. Generally, effect sizes of around
0.2 are considered relevant but low and those around 0.8 high (Cohen, 1988). In the current
study, the overall effect sizes vary but are generally low (under 0.2). However, when
examining the beta-coefficients for each of the separate values of stress (Table 1 and 2), effect
sizes for the COMT Val/Val and the BDNF Val/Met carriers are clinically meaningful for the
highest levels of stress. Furthermore, the results of the current study were derived from data
reflecting daily life context of repetitive events (unlike effects reported in most unilevel
studies) indicating cumulative impact over time. For example, the findings indicate that the
genetic vulnerability for psychotic reactivity to minor stressors is not present only once in a
single event but impacts repeatedly in daily life person–context interactions.

Chapter 5
87
Limitations
Several methodological issues need to be considered. First, the measures of event-related
stress and paranoia are based on paper-and-pencil self-report. Therefore, concerns exist about
the lack of control over participant compliance with the ESM protocol (Broderick, et al.,
2004; Kudielka, et al., 2003). In particular, fixed time sampling protocols may be problematic
and can bias results. However, the present study did not use a fixed time sampling frame, and
our ESM procedure was validated in a previous study (Jacobs, et al., 2005). Part of the same
sample as described in the present analysis (Jacobs, et al., 2005) was instructed to take, during
the ESM procedure, saliva samples at each of the 10 unpredictable moments during the five
consecutive days. Participants recorded collection times, unaware that compliance with the
sampling protocol was investigated by means of electronic monitoring devices. Results
showed that compliance was high (more than 90%) and inclusion of the inaccurately timed
samples did not distort the data (Jacobs, et al., 2005). Therefore, results from the ESM
procedure in the present study can be considered valid.
Second, the assessment of paranoia contained only one item (‘I feel suspicious’).
Nevertheless, paranoia is the most common abnormal belief found in patients with psychosis
and psychometrically accessible in healthy volunteers (Garety and Hemsley, 1987; Jorgensen
and Jensen, 1994).
Third, the present analyses are cross-sectional, making it impossible to assess causality.
Feelings of paranoia may be a reaction to event-related or social stressors, or feeling
suspicious may bias a person to interpreting (social) events as being more unpleasant (more
stressful). Possibly, paranoid beliefs arise from minor daily stressors as well as generate
negative evaluations of (social) events. However, even if the direction of association was
reversed, what holds is that the COMT and BDNF genotypes have an impact on the
associations between daily stressors and feelings of paranoia.
Fourth, the sample consisted of female participants only. A previous study (Bolger, et al.,
1989) showed that women reported more distress in relation to daily stressors than men.
Consistent with these findings, Myin-Germeys et al. (2004) showed a significant increase in
emotional reactivity to daily stress in women compared with men. Sex differences in feeling
suspicious are also expected because previous research found higher levels of positive
schizotypy in females compared with males (Jackson and Claridge, 1991; Maric, et al., 2003;
Raine, 1992), and there is evidence that sex differences in schizophrenia patients are
particularly present for persecutory delusions (Goldstein, et al., 1990). Last, there are studies
that suggest that there may be sex differences with respect to COMT (Alsobrook, et al., 2002;

Chapter 5
88
Kates, et al., 2006; Zinkstok, et al., 2006). Women have been shown to have markedly lower
COMT activity than men (Boudikova, et al., 1990; Floderus, et al., 1981), presumably due to
down-regulation of COMT by estrogens (Jiang, et al., 2003; Xie, et al., 1999). Analogue to
the high-activity Val allele being associated with increased feelings of paranoia, male
populations may therefore show higher levels of paranoia. Therefore, the present findings
cannot necessarily be extrapolated to a male population.
The present study included only a single variant of the COMT and BDNF genes. Although the
COMT Val158Met polymorphism is the most frequently investigated COMT polymorphism
capturing most of the genetic functional variation, some studies suggest that the Val158Met
polymorphism may not capture all functional variation in COMT (Meyer-Lindenberg, et al.,
2006; Shifman, et al., 2002; Shifman, et al., 2004). Haplotypes defined by several
polymorphism gene sites may be provide better measures than single nucleotide
polymorphisms for analysis of genetic variations (Nackley, et al., 2006). Catechol-O-
methyltransferase haplotypes can modulate protein expression by altering messenger RNA
secondary structure (Nackley, et al., 2006), and recent studies have shown that COMT
haplotypes may be more strongly associated with schizophrenia risk or endophenotypes for
schizophrenia than the Val158Met polymorphism alone (Diaz-Asper, et al., 2008; Meyer-
Lindenberg, et al., 2006; Shifman, et al., 2002; Shifman, et al., 2004). Likewise, BDNF
haplotypes may capture more of the genetic variation than the Val66Met polymorphism
alone, although this remains to be determined (Gratacòs, et al., 2007).
Finally, multiple testing was not taken into account because we tested a limited number of
main hypotheses, and outcomes were correlated across analyses, obviating the need for
conservative corrections such as Bonferroni. The probability of false-positive results is low in
the present study: more tests were significant than might be expected by chance alone. Thus,
of the 20 multilevel regression analyses performed, 8 showed a p-value of <0.05, while only 1
significant finding would have been expected by chance alone.
Acknowledgements
This research was supported by the Netherlands Organisation for Scientific Research; the
Fund for Scientific Research, Flanders and Twins, a non-profit association for scientific
research in multiple births (Belgium) (to the East-Flanders Prospective Survey).We thank all
twins for their co-operation. M.C.W. was supported by the Dutch Medical Council (VENI
grant number 916.76.147).

Chapter 5
89
References
Akil M, Kolachana BS, Rothmond DA, Hyde TM, Weinberger DR and Kleinman JE. Catechol-O-methyltransferase genotype and dopamine regulation in the human brain. J Neurosci 2003; 23: 2008-2013.
Alsobrook JP, Zohar AH, Leboyer M, Chabane N, Ebstein RP and Pauls DL. Association between the COMT locus and obsessive-compulsive disorder in females but not males. Am J Med Genet 2002; 114: 116-120.
Berton O, McClung CA, DiLeone RJ, Krishnan V, Renthal W, Russo SJ, Graham D, Tsankova NM, Bolanos CA, Rios M, Monteggia LM, Self DW and Nestler EJ. Essential role of BDNF in the mesolimbic dopamine pathway in social defeat stress. Science 2006; 311: 864-868.
Bilder RM, Volavka J, Lachman HM and Grace AA. The catechol-O-methyltransferase polymorphism: relations to the tonic-phasic dopamine hypothesis and neuropsychiatric phenotypes. Neuropsychopharmacol 2004; 29: 1943-1961.
Bjorkqvist K. Social defeat as a stressor in humans. Physiol Behav 2001; 73: 435-442. Bolger N, DeLongis A, Kessler RC and Schilling EA. Effects of daily stress on negative mood. J Pers Soc
Psychol 1989; 57: 808-818. Boudikova B, Szumlanski C, Maidak B and Weinshilboum R. Functional analysis of genetic variation in
catechol-O-methyltransferase (COMT): effects on mRNA, protein, and enzyme activity in postmortem human brain. Am J Hum Genet 1990; 75: 807-821.
Broderick JE, Arnold D, Kudielka BM and Kirschbaum C. Salivary cortisol sampling compliance: comparison of patients and healthy volunteers. Psychoneuroendocrino 2004; 29: 636-650.
Chan JP, Unger TJ, Byrnes J and Rios M. Examination of behavioral deficits triggered by targeting BDNF in fetal or postnatal brains of mice. Neuroscience 2006; 142: 49-58.
Chen ZY, Jing D, Bath KG, Ieraci A, Khan T, Siao CJ, Herrara DG, Toth M, Yang C, McEwen BS, Hempstead BL and Lee FS. Genetic Variant BDNF (Val66Met) Polymorphism Alters Anxiety-Related Behavior. Science 2006; 314: 140-143.
Chen ZY, Patel PD, Sant G, Meng CX, Teng KK, Hempstead BL and Lee FS. Variant brain-derived neurotrophic factor (BDNF) (Met66) alters the intracellular trafficking and activity-dependent secretion of wild-type BDNF in neurosecretory cells and cortical neurons. J Neurosci 2004; 24: 4401-4411.
Clayton D and Hill M. Wald tests. In: D. Clayton and M. Hill, editors. Statistical Models in Epidemiology. Oxford: Oxford Science Publications, 1993: 101-102.
Cohen J. Statistical Power Analysis for the Behavioral Sciences. Hillsdale, NJ: Lawrence Earlbaum Associates; 1988.
Collip D, Myin-Germeys I and Van Os J. Does the concept of “sensitization” provide a plausible mechanism for the putative link between the environment and schizophrenia? Schizophr Bull 2008; 34: 220-225.
Combs DR and Penn DL. The role of subclinical paranoia on social perception and behavior. Schizophr Res 2004; 69: 93-104.
Cougnard A, Marcelis M, Myin-Germeys I, De Graaf R, Vollebergh W, Krabbendam L, Lieb R, Wittchen HU, Henquet C, Spauwen J and Van Os J. Does normal developmental expression of psychosis combine with environmental risk to cause persistence of psychosis? A psychosis proneness–persistence model. Psychol Med 2007; 37: 513-527.
Csikszentmihalyi M and Larson R. Validity and reliability of the Experience-Sampling Method. J Nerv Ment Dis 1987; 175: 526-536.
Delespaul P. Assessing schizophrenia in daily life: The experience sampling method. Maastricht: University of Limburg; 1995.
Derom C, Vlietinck RF, Thiery EW, Leroy FO, Fryns JP and Derom RM. The East Flanders Prospective Twins Survey (EFPTS). Twin Res Hum Genet 2006; 9: 733-738.
Deutch AY, Clark WA and Roth RH. Prefrontal cortical dopamine depletion enhances the responsiveness of mesolimbic dopamine neurons to stress. Brain Res 1990; 521: 311-315.
DeVries MW. The experience of psychopathology: investigating mental disorders in their natural settings. Cambridge: Cambridge university press; 1992.
Diaz-Asper CM, Goldberg TE, Kolachana BS, Straub RE, Egan MF and Weinberger DR. Genetic variation in catechol-O-methyltransferase: effects on working memory in schizophrenic patients, their siblings, and healthy controls. Biol Psychiatry 2008; 63: 72-79.
Duman RS. Depression: A Case of Neuronal Life and Death? Biol Psychiatry 2004; 56: 141-145. Duman RS and Monteggia LM. A neurotrophic model for stress-related mood disorders. Biol Psychiatry 2006;
59: 1116-1127. Fan JB, Zhang CS, Gu NF, Li XW, Sun WW, Wang HY, Feng GY, St Clair D and He L. Catechol-O-
methyltransferase gene Val/Met functional polymorphism and risk of schizophrenia: a large-scale association study plus meta-analysis. Biol Psychiatry 2005; 57: 139-144.

Chapter 5
90
Fenigstein A and Vanable PA. Paranoia and self-consciousness. J Pers Soc Psychol 1992; 62: 129-138. Floderus Y, Ross SB and Wetterberg L. Erythrocyte catechol-O-methyltransferase activity in a Swedish
population. Clin Genet 1981; 19: 389-392. Freeman D, Bentall R and Garety P. Persecutory Delusions: Assessment, Theory, and Treatment. Oxford:
Oxford university press; 2008. Freeman D and Garety P. Helping patients with paranoid and suspicious thoughts: a cognitive–behavioural
approach Advan Psychiat Treat 2006; 12: 404-415. Freeman D and Garety PA. Paranoia: the psychology of persecutory delusions. New York, NY: Psychology
Press; 2004. Freeman D, Garety PA, Bebbington P, Slater M, Kuipers E, Fowler D, Green C, Jordan J, Ray K and Graham D.
The psychology of persecutory ideation II: a virtual reality experimental study. J Nerv Ment Dis 2005; 193: 309-315.
Garety PA and Hemsley DR. Characteristics of delusional experience. Eur Arch Psychiat Neurol Sci 1987; 236: 294-298.
Goldstein JM, Santangelo SL, Simpson JC and Tsuang MT. The role of gender in identifying subtypes of schizophrenia: A latent class analytic approach. Schizophr Bull 1990; 16: 263-275.
Gratacòs M, González JR, Mercader JM, De Cid R, Urretavizcaya M and Estivill X. Brain-derived neurotrophic factor Val66Met and psychiatric disorders: meta-analysis of case-control studies confirm association to substance-related disorders, eating disorders, and schizophrenia. Biol Psychiatry 2007; 61: 911-922.
Hashimoto K. BDNF variant linked to anxiety-related behaviors. Bioessays 2007; 29: 116-119. Henquet C, Rosa A, Krabbendam L, Papiol S, Fananas L, Drukker M, Ramaekers JG and Van Os J. An
experimental study of catechol-O-methyltransferase Val158Met moderation of Delta -9-tetrahydrocannabinol-induced effects on psychosis and cognition. Neuropsychopharmacol 2006; 31: 2748-2757.
Jackson M and Claridge G. Reliability and validity of a psychotic traits questionnaire (STQ). Br J Clin Psychol 1991; 30: 311-323.
Jacobs N, Nicolson NA, Derom C, Delespaul P, Van Os J and Myin-Germeys I. Electronic monitoring of salivary cortisol sampling compliance in daily life. Life Sci 2005; 76: 2431-2443.
Jiang H, Xie T, Ramsden DB and Ho SL. Human catechol-O-methyltransferase down-regulation by estradiol. Neuropharmacology 2003; 45: 1011-1019.
Jorgensen P and Jensen J. Delusional beliefs in first admitters. A clinical description. Psychopathology 1994; 27: 100-112.
Kanazawa T, Glatt SJ, Kia-Keating B, Yoneda H and Tsuang MT. Meta-analysis reveals no association of the Val66Met polymorphism of brain-derived neurotrophic factor with either schizophrenia or bipolar disorder. Psychiatr Genet 2007; 17: 165-170.
Kapur S. Psychosis as a state of aberrant salience: a framework linking biology, phenomenology, and pharmacology in schizophrenia. Am J Psychiatry 2003; 160: 13-23.
Kates WR, Antshel KM, AbdulSabur N, Colgan D, Funke B, Fremont W, Higgins AM, Kucherlapati R and Shprintzen RJ. A gender-moderated effect of a functional COMT polymorphism on prefrontal brain morphology and function in velo-cardio-facial syndrome (22q11.2 deletion syndrome). Am J Med Genet B Neuropsychiatr Genet 2006; 141: 274-280.
Kozlovsky N, Kaplan Z, Zohar J, Matar MA, Shimon H and Cohen H. Protein synthesis inhibition before or after stress exposure results in divergent endocrine and BDNF responses disassociated from behavioral responses. Depress Anxiety 2007; 0: 1-11.
Kudielka BM, Broderick JE and Kirschbaum C. Compliance with salivary sampling protocols: electronic monitoring reveals invalid cortisol daytime profiles in noncompliant subjects. Psychosom Med 2003; 65: 313-319.
Lang UE, Hellweg R, Kalus P, Bajbouj M, Lenzen KP, Sander T, Kunz D and Gallinat J. Association of a functional BDNF polymorphism and anxiety-related personality traits. Psychopharmacology 2005; 180: 95-99.
Laruelle M. The role of endogenous sensitization in the pathophysiology of schizophrenia: implications from recent brain imaging studies. Brain Res Rev 2000; 31: 371-384.
Loos R, Derom C, Vlietinck R and Derom R. The East Flanders Prospective Twin Survey (Belgium): a population-based register. Twin Res 1998; 1: 167-175.
Malla AK, Cortese L, Shaw TS and Ginsberg B. Life events and relapse in schizophrenia. Soc Psychiatry Psychiatr Epidemiol 1990; 25: 221-224.
Maric N, Krabbendam L, Vollebergh W, De Graaf R and Van Os J. Sex differences in symptoms of psychosis in a non-selected, general population sample. Schizophr Res 2003; 63: 89-95.
Martin JA and Penn DL. Social cognition and subclinical paranoid ideation. Br J Clin Psychol 2001; 40: 261-265.

Chapter 5
91
Meyer-Lindenberg A, Nichols T, Callicott J, Ding J, Kolachana B, Buckholtz J, Mattay VS, Egan M and Weinberger DR. Functional neuroimaging of ambiguous haplotypes reveals impact of complex genetic variation in COMT. Mol Psychiatry 2006; 11: 867-877.
Munafo MR, Bowes L, Clark TG and Flint J. Lack of association of the COMT (Val158/108 Met) gene and schizophrenia: a meta-analysis of case-control studies. Mol Psychiatry 2005; 10: 765-770.
Myin-Germeys I, Delespaul P and Van Os J. Behavioural sensitization to daily life stress in psychosis. Psychol Med 2005a; 35: 733-741.
Myin-Germeys I, Krabbendam L, Delespaul PAEG and Van Os J. Sex Differences in Emotional Reactivity to Daily Life Stress in Psychosis. J Clin Psychiatry 2004; 65: 805-809.
Myin-Germeys I, Marcelis M, Krabbendam L, Delespaul P and Van Os J. Subtle fluctuations in psychotic phenomena as functional states of abnormal dopamine reactivity in individuals at risk. Biol Psychiatry 2005b; 58: 105-110.
Myin-Germeys I, Peeters F, Havermans R, Nicolson NA, De Vries MW, Delespaul P and Van Os J. Emotional reactivity to daily life stress in psychosis and affective disorder: an experience sampling study. Acta Psychiatr Scand 2003; 107: 124-131.
Myin-Germeys I, Van Os J, Schwartz JE, Stone AA and Delespaul PA. Emotional reactivity to daily life stress in psychosis. Arch Gen Psychiatry 2001; 58: 1137-1144.
Nackley AG, Shabalina SA, Tchivileva IE, Satterfield K, Korchynsky O, Makarov SS, Maixner W and Diatchenko L. Human catechol-O-methyltransferase haplotypes modulate protein expression by altering mRNA secondary structure. Science 2006; 314: 1930-1933.
Norman RM and Malla AK. Subjective stress in schizophrenic patients. Soc Psychiatry Psychiatr Epidemiol 1991; 26: 212-216.
Oroszi G, Lapteva L, Davis. E, Yarboro CH, Weickert T, Roebuck-Spencer T, Bleiberg J, Rosenstein D, Pao M, Lipsky PE, Goldman D, Lipsky RH and Illei GG. The Met66 allele of the functional Val66Met polymorphism in the brain-derived neurotrophic factor gene confers protection against neurocognitive dysfunction in systemic lupus erythematosus. Ann Rheum Dis 2006; 65: 1330-1335.
Pandey SC, Zhang H, Roy A and Misra K. Central and medial amygdaloid brain-derived neurotrophic factor signalling plays a critical role in alcohol-drinking and anxiety-like behaviors. J Neurosci 2006; 26: 8320-8331.
Pruessner JC, Champagne F, Meaney MJ and Dagher A. Dopamine release in response to a psychological stress in humans and its relationship to early life maternal care: a positron emission tomography study using [11C]raclopride. J Neurosci 2004; 24: 2825-2831.
Raine A. Sex differences in schizotypal personality in a nonclinical population J Abnorm Psychol 1992; 101: 361-364. Santarelli L, Saxe M, Gross C, Surget A, Battaglia F, Dulawa S, Weisstaub N, Lee J, Duman R, Arancio O,
Belzung C and Hen R. Requirement of hippocampal neurogenesis for the behavioral effects of antidepressants. Science 2003; 301: 805-809.
Schule C, Zill P, Baghai TC, Eser D, Zwanzger P, Wenig N, Rupprecht R and Bondy B. Brain-derived neurotrophic factor Val66Met polymorphism and dexamethasone/CRH test results in depressed patients. Psychoneuroendocrino 2006; 31: 1019-1025.
Shifman S, Bronstein M, Sternfeld M, Pisanté-Shalom A, Lev-Lehman E, Weizman A, Reznik I, Spivak B, Grisaru N, Karp L, Schiffer R, Kotler M, Strous RD, Swartz-Vanetik M, Knobler HY, Shinar E, Beckman JS, Yakir B, Risch N, Zak NB and Darvasi A. A highly significant association between a COMT haplotype and schizophrenia. Am J Hum Genet 2002; 71: 1296-1302.
Shifman S, Bronstein M, Sternfeld M, Pisanté A, Weizman A, Reznik I, Spivak B, Grisaru N, Karp L, Schiffer R, Kotler M, Yakir B, Zak NB and Darvasi A. COMT: a common susceptibility gene in bipolar disorder and schizophrenia. Am J Med Genet B Neuropsychiatr Genet 2004; 128: 61-64.
Snijders T and Bosker R. Multilevel analysis: an introduction to basic and advanced multilevel modeling. London: SAGE publications Ltd; 1999.
StataCorp. Stata Statistical Software: Release 10. College Station, TX: Statacorp LP; 2007. Stefanis NC, Henquet C, Avramopoulos D, Smyrnis N, Evdokimidis I, Myin-Germeys I, Stefanis CN and Van
Os J. COMT Val158Met moderation of stress-induced psychosis. Psychol Med 2007; 37: 1651-1656. Stefanis NC, Van Os J, Avramopoulos D, Smyrnis N, Evdokimidis I, Hantoumi I and Stefanis CN. Variation in
catechol-O-methyltransferase val158met genotype associated with schizotypy but not cognition: a population study in 543 young men. Biol Psychiatry 2004; 56: 510-515.
Thewissen V, Bentall RP, Lecomte T, Van Os J and Myin-Germeys I. Fluctuations in self-esteem and paranoia in the context of daily life. J Abnorm Psychol 2008; 117: 143-153.
Tunbridge EM, Harrison PJ and Weinberger DR. Catechol-O-methyltransferase, cognition, and psychosis: Val158Met and beyond. Biol Psychiat 2006; 60: 141-151.

Chapter 5
92
Van Os J and Sham P. Gene-environment interactions. In: R. M. Murray, P. B. Jones, E. Susser, J. Van Os and M. Cannon, editors. The Epidemiology of Schizophrenia. Cambridge: Cambridge University Press, 2003: 235-254.
Van Winkel R, Henquet C, Rosa A, Papiol S, Fananas L, De Hert M, Peuskens J, Van Os J and Myin-Germeys I. Evidence that the COMT Val158Met polymorphism moderates sensitivity to stress in psychosis: an experience-sampling study. Am J Med Genet Part B 2008; 147B: 10-17.
Wand GS, Oswald LM, McCaul ME, Wong DF, Johnson E, Zhou Y, Kuwabara H and Kumar A. Association of amphetamine-induced striatal dopamine release and cortisol responses to psychological stress. Neuropsychopharmacol 2007; 32: 2310–2320.
Wichers M, Kenis G, Jacobs N, Myin-Germeys I, Schruers K, Derom C, Vlietinck R, Mengelers R, Delespaul P and Van Os J. The psychology of psychiatric genetics: evidence that positive emotions in females moderate genetic sensitivity to social stress associated with the BDNF Val66Met polymorphism. J Abnorm Psychol 2008; 117: 699-704.
Wichers M, Myin-Germeys I, Jacobs N, Peeters F, Kenis G, Derom C, Vlietinck R, Delespaul P and Van Os J. Genetic risk of depression and stress-induced negative affect in daily life. Br J Psychiatry 2007; 191: 218-223.
Xie T, Ho SL and Ramsden DB. Characterization and implications of estrogenic down-regulation of human catechol-O-methyltransferase gene transcription. Mol Pharmacol 1999; 56: 31-38.
Xu MQ, St-Clair D, Ott J, Feng GY and He L. Brain-derived neurotrophic factor gene C-270T and Val66Met functional polymorphisms and risk of schizophrenia: a moderate-scale population-based study and meta-analysis. Schizophr Res 2007; 91: 6-13.
Zinkstok J, Schmitz N, Van Amstelvoort T, De Win M, Van den Brink W, Baas F and Linszen D. The COMT Val158Met polymorphism and brain morphometry in healthy young adults. Neurosci Lett 2006; 405: 34-39.


95
CHAPTER 6
Functional magnetic resonance imaging of inner speech in
schizophrenia
Claudia J.P. Simons1 2 MSc, Derek K. Tracy3 MB BCh BAO MSc MRCPsych, Kirandeep K.
Sanghera 3 4 BSc MSc, Owen O’Daly3 5 PhD, James Gilleen3 PhD, Maria-de-Gracia
Dominguez1 MD, Lydia Krabbendam1 6 PhD, Sukhwinder S. Shergill3 MBBS FRCPsych PhD
1Department of Psychiatry and Neuropsychology, Maastricht University, European Graduate School of
Neuroscience, SEARCH, P.O. Box 616, 6200 MD Maastricht, The Netherlands 2 GGz Eindhoven, P.O. Box 909, 5600 AX Eindhoven, The Netherlands 3Cognition Schizophrenia and Imaging Lab, Division of Psychological Medicine, Institute of Psychiatry, De
Crespigny Park, London SE5 8AF, United Kingdom 4 University of Leicester School of Medicine, Leicester, LE1 9HN, United Kingdom 5 Department of Clinical Neuroscience, the Institute of Psychiatry, De Crespigny Park, London SE5 8AF, United
Kingdom 6 Centre Brain and Learning, Department of Psychology and Education, VU University Amsterdam, van der
Boechorststraat 1 1081 BT Amsterdam, The Netherlands
Biological Psychiatry, 2010; 67: 232-237

Chapter 6
96
Abstract
Background. Auditory verbal hallucinations in schizophrenia have been linked to defective
monitoring of one’s own verbal thoughts. Previous studies have shown that patients with
auditory verbal hallucinations show attenuated activation of brain regions involved with
auditory processing during the monitoring of inner speech. However, there are no functional
magnetic resonance imaging studies explicitly comparing the perception of external speech
with internal speech in the same patients with schizophrenia. The present study investigated
the functional neuroanatomy of inner and external speech in both patients with schizophrenia
and healthy control subjects. Methods. Fifteen patients with schizophrenia and 12 healthy
control subjects were studied using functional magnetic resonance imaging while listening to
sentences or imagining sentences. Results. Significant interactions between group (control
subjects vs. patients) and task (listening vs. inner speech) were seen for the left superior
temporal gyrus, as well as regions within the cingulate gyrus. Conclusions. Attenuated
deactivation of the left superior temporal gyrus in schizophrenia patients during the
processing of inner speech may reflect deficits in the forward models subserving self-
monitoring.
Keywords: auditory verbal hallucinations; fMRI; inner speech; schizophrenia; temporal lobe;
verbal self-monitoring

Chapter 6
97
Introduction
Auditory verbal hallucinations (AVHs) are one of the most common symptoms in
schizophrenia. Current cognitive models suggest that auditory hallucinations are the result of
defective self-monitoring (Allen, et al., 2007a; Ford, et al., 2001; Kumari, et al., 2008;
Shergill, et al., 2005). A feed-forward mechanism (Wolpert, et al., 1995) has been proposed to
explain self-monitoring of motor actions. In this model, motor commands that are needed to
achieve a specific goal are identified and subsequently issued. Simultaneously, an efference
copy is generated and transmitted through a corollary discharge mechanism to the sensory
brain regions that are relevant to the planned act. The efference copy of the motor command
serves to predict the sensory effects of the motor act. If the actual and predicted sensory
feedback match, the actual sensory feedback will be attenuated. If a movement is externally
controlled, there will be no efference copy that can attenuate the sensory information. Hence,
the monitoring of motor acts can help to recognize whether a movement is self-initiated or
externally generated. If generation of language and thought can be considered as a type of
motor act (Feinberg, 1978; Jones and Fernyhough, 2007; Seal, et al., 2004), then monitoring
of the verbal act may contribute to the distinction between self as source versus others as
source. If this monitoring system is defective, verbal thoughts will not be recognized as being
self-generated, leading to the experience of AVHs (Feinberg, 1978).
Neuroimaging studies investigating the generation of speech in healthy control subjects
indicate that the monitoring process is associated with activation of the left prefrontal cortex
and deactivation of the left and right superior temporal cortices (Frith, et al., 1995),
suggesting that corollary discharge from the areas involved in the generation of verbal speech
results in attenuation of the activity in areas involved in speech perception. Initial studies of
verbal fluency in schizophrenia indicated that this temporal deactivation was absent (Frith, et
al., 1995). However, more recent studies have failed to replicate this finding (Dye, et al.,
1999; Spence, et al., 2000). Neuroimaging studies trying to “capture” auditory verbal
hallucinations when they are naturally occurring have reported activation of temporal lobe
structures during AVHs (Dierks, et al., 1999; Shergill, et al., 2000a). In healthy control
subjects, the generation of inner speech, or the silent articulation of words, is associated with
activation in the left inferior frontal cortex/insula, the supplementary motor area, the left
superior temporal/inferior parietal region, and the right posterior cerebellar region (Shergill, et
al., 2003). The left inferior frontal cortex has also been shown to be activated during AVHs
(McGuire, et al., 1993; Shergill, et al., 2000a). A more recent study suggest the right inferior

Chapter 6
98
frontal gyrus may also be involved (Sommer, et al., 2008), indicating involvement of inner
speech in AVHs. An early positron emission tomography (PET) study investigating auditory
verbal imagery – imagining another person’s speech – revealed that schizophrenia patients
who were prone to auditory hallucinations displayed normal activation of the left inferior
frontal gyrus but abnormal activation of the left temporal cortex compared to both
schizophrenia patients without a history of AVHs and healthy control subjects (McGuire, et
al., 1996b). More recently, we have used functional magnetic resonance imaging (fMRI) to
show normal activation of the left inferior frontal gyrus and attenuation of right temporal
cortex activation in hallucination-prone schizophrenia patients, relative to an inner speech
task, during verbal imagery (Shergill, et al., 2000b). To summarize, previous studies indicate
that when generating verbal material, schizophrenia patients display normal activation of the
inferior frontal cortex, but abnormal activity in the temporal cortex, with the changes varying
with the condition used as the baseline. However, to demonstrate the specificity of this
hypothesis, ideally one would compare simple self-generated speech with comparable
external speech to exclude any nonspecific impairments in the auditory cortical processing
and to exclude the increased demands associated with generating more complex stimuli such
as imagery. To our knowledge, there are no fMRI studies explicitly comparing this in patients
with schizophrenia.
In the present study, we used fMRI to investigate brain activation during the perception of
internally generated speech, and external speech, in both patients with schizophrenia and
matched healthy control subjects. Activation during the self-monitoring of inner speech was
compared directly with activation during listening to externally generated speech, a task
requiring no self-monitoring. We predicted that inner speech would lead to attenuation of
temporal cortex activation in healthy control subjects as a consequence of corollary discharge,
while the patients with schizophrenia would show less attenuated activation of the temporal
cortex during inner speech trials, indicating faulty verbal self-monitoring. Since external
sensory stimulation does not lead to an efference copy, we anticipated an interaction between
task (listening vs. inner speech) and group (control subjects vs. patients) in the temporal
cortex. As silent articulation is associated with activation of the left inferior frontal cortex, we
also predicted that inner speech trials would be accompanied by an increased activation of this
area compared with listening trials in both patients and the control subjects. The present study
minimized the effects of acoustic scanner noise during the stimulus presentation through the
use of a partially silent acquisition in which the auditory stimulus preceding the inner speech

Chapter 6
99
and listening prompts, was presented in a partially silent gap followed by a period of
continuous image acquisition (Amaro, et al., 2002).
Methods and materials
Subjects
Fifteen male patients with a DSM-IV diagnosis of schizophrenia and right-handed, as
assessed with the Annett Handedness Inventory (Annet, 1970), participated in the study.
Patients were recruited through consultant and key worker recommendations and had all
experienced prominent auditory hallucinations during exacerbations of their illness. Fourteen
subjects were outpatients and one subject was an inpatient. All patients were receiving regular
doses of antipsychotic medication. Mean age of the patients was 34.7 (SD = 8.7). Mean
duration of illness was 11.2 years (range 3-27). Mean score on the Positive and Negative
Syndrome Scale (Kay, et al., 1987) was 48.5 (SD = 16.5, range 30-83). Patients were matched
for age, sex and handedness to a control group. Twelve healthy right-handed, male control
subjects were recruited through an advertisement in a city-wide newspaper. They did not
suffer from psychiatric disorders and had no family history of psychiatric disorder. Mean age
of the control subjects was 34.4 (SD = 7.9). English was a first language for all subjects and
all subjects had a minimum of 11 years of education. Exclusion criteria were any illicit drug
use within the previous 6 months, or any contraindications to magnetic resonance imaging
(MRI) scanning. Potential subjects were assessed on their ability to perform the tasks
(detailed below) outside the scanner, approximately 1 week before scanning. Subjects
provided written informed consent, and ethical approval was provided by the Institute of
Psychiatry and Maudsley National Health Services Trust.
Tasks performed during fMRI
Subjects performed two active tasks: listening and inner speech, and there was one additional
null baseline condition. Each of these tasks were administered over six counterbalanced
blocks, each block comprising four listening trials, four inner speech trials and four baseline
trials, with the baseline trials consisting of a silent period equal in length to four paired stimuli
(Figure 1).
Auditory stimuli used for the listening and inner speech conditions were 24 neutral sentences,
spoken by an adult female native English speaker. During the listening trials, the auditory
stimulus was followed by a visual cue prompting the subjects to listen to a second auditory
stimulus identical to the first; during the inner speech trials, the auditory stimulus was

Chapter 6
100
CLIILCILCCLILICCIL CLIILCILCCLILICCIL
IIII IIII
AS VC R
+
1124-2862 ms 1000 ms
FAFAFAFAPAPAPA FAFAFAFAPAPAPA
2.1 s
14.7 s
Figure 1. Stimulation protocol. Illustrated are the experimental blocks, the trials within a single block,
and how stimulus acquisition, stimulus presentation, and response take place during a trial. AS,
auditory stimulus; C, baseline; FA, full acquisition; I, inner speech; L, listening; PA, partial acquisition;
R, response; VC, visual cue.
followed by a visual cue prompting the subjects to covertly imagine repeating the sentence to
themselves in their own voice and press a button with their right index finger once this was
completed.
Each auditory stimulus was presented once during a listening trial and once during an inner
speech trial. Sentences were presented via pneumatically driven earphones, incorporated
within ear defenders, specifically designed for functional MRI (Quiet Muff 29 Earmuffs,
Avotec, Jensen Beach, FL, USA). These reduced unattenuated noise from the scanner. As
some sentences were longer than others, the duration of the stimuli varied from 1124 msec to
2862 msec, with an average length of 1971 msec. The auditory stimulus was followed by a
1000-msec period in which the visual prompt was presented, followed by the actual task
(listening/inner speech). There was a gap before the onset of the next trial (intertrial interval:
14728 msec). Image acquisition was performed during this nontrial interval. Total length of
the task was 17 minutes and 39 seconds.

Chapter 6
101
Image acquisition
Gradient-echo echo-planar imaging data were acquired on a neuro-optimized GE Signa 1.5
Telsa system (General Electric, Milwaukee WI, USA) at the Maudsley Hospital, London. For
complete details on methodologies, please see Section 1 in Supplement 1.
Image analyses
Data were realigned (Bullmore, et al., 1999) to minimize motion related artefacts, smoothed
using a Gaussian filter (full-width at half maximum 7.2 mm) and transformed into Talairach
space (Brammer, et al., 1997). Task (listening vs. inner speech) and group (control subjects
vs. patients) specific comparisons were carried out. Second, the interaction between task and
group was tested by subtracting the inner speech trials from the listening trials. Cluster-level
statistics (Bullmore, et al., 1999) corrected for multiple comparisons were thresholded at
p<.009 to ensure less than one false positive cluster per image. For complete detail on
methodologies, please see Section 2 in Supplement 1.
Results
Behavioural data
The mean response time to complete the inner speech task was 2.62 seconds (SD = 1.59) for
control subjects and 2.28 (SD = .85) for patients. This difference was not statistically
significant [t(22) = .64, p = .53]. On postscan debriefing, all subjects reported that they had
been able to perform the tasks and thus data from all subjects were included in the analyses.
Imaging data: Inner speech versus listening
The main effect of inner speech was associated with greater activation in the left inferior
frontal gyrus and anterior cingulate gyrus compared with listening (Figure 2A, Table 1).
Listening was associated with greater activation in the right superior temporal gyrus, left
transverse temporal gyrus, and right inferior parietal lobule across both groups.
Between-group differences in activation
The main effect of group showed significant differences in the left and right occipital gyrus
(Figure 2B, Table 1). Patients demonstrated greater bilateral activation of the occipital gyri
during the active tasks, compared with the control subjects, who showed greater activation
during the baseline condition.

Chapter 6
102
Interaction between task and group
Significant interactions between group (control subjects vs. patients) and task (listening vs.
inner speech) were seen for the left superior temporal gyrus, bilateral anterior cingulate gyrus,
right hippocampus, and the left posterior cingulate gyrus (Figure 3A, Table 1). The plots from
the peak sum of squares response in the left superior temporal gyrus of both patients and
control subjects demonstrated activation during the listening task compared with baseline.
However, during the generation of inner speech, the control subjects showed markedly
attenuated activation, while this difference between inner speech and listening was less
pronounced in the patients (Figure 3B).
Within the other regions with significant interactions, including the right hippocampus and
regions within the cingulate gyrus, control subjects showed activation during inner speech
compared with listening, while the patients showed a decrease in activation during the inner
speech.
Table 1. Regions of differential activation
Coordinates
Region of activation (BA) X Y Z Cluster size
Effect of task Inner speech > Listening
Left Inferior frontal gyrus (BA 44)
Anterior cingulate gyrus (BA 32)
Inner speech < Listening
Right superior temporal gyrus (BA 22)
Left transverse temporal gyrus (BA 41)
Right inferior parietal lobule (BA 40)
Effect of group (control subjects > patients)
Left middle occipital gyrus (BA 18)
Right middle occipital gyrus (BA 19)
Interaction
Left superior temporal gyrus (BA 22)
Left cingulate gyrus (BA 24)
Right cingulate gyrus (BA 24)
Right hippocampus
Left posterior cingulate (BA 29)
-54
4
58
-58
33
-25
33
-54
-11
18
29
-11
4
15
-7
-19
-37
-81
-74
-11
-19
-15
-37
-41
15
42
-2
9
53
4
15
-2
42
39
-2
9
33
45
168
161
42
59
33
20
81
221
69
86
Thresholded at p < .009. Cluster size indicates total number of activated voxels in region. BA, Brodmann Area.

Chapter 6
103
Figure 2. Brain activation map for the effects of (A) task (blue: inner speech > listening, yellow:
listening > inner speech) and (B) group (p =.009, <1 false-positive cluster).
Left superior temporal gyrus
-0.08
-0.06
-0.04
-0.02
0
0.02
0.04
0.06
0.08
0.1
0.12
listening inner speechMed
ian
SS
Q r
ati
o
controls
patients
Figure 3. (A) Brain activation map for the interaction between the effects of task and group (p =.009,
<1 false-positive cluster; blue: listening minus inner speech has higher peak SSQ in patients than in
control subjects, yellow: listening minus inner speech has higher peak SSQ in control subjects than in
patients). (B) SSQ plots for the interaction between task and group in the left superior temporal cortex.
SSQ, sum of squares.

Chapter 6
104
Discussion
The main finding was a significant interaction between group and task for the left superior
temporal cortex. During the listening trials, the anticipated activation of the left superior
temporal cortex was evident in control subjects and in schizophrenia patients, suggesting that
listening to spoken sentences is not impaired in schizophrenia patients. Control subjects
showed greater decrease in activation during inner speech compared with listening than
patients. This provides evidence for defective self-monitoring of inner speech in
schizophrenia patients. Failure to attenuate the activity in the temporal cortex may lead to the
attribution of the verbal material as being of external origin, ultimately leading to auditory
hallucinatory experiences.
The attenuation of temporal cortex activity is thought to be associated with corollary
discharge from the inferior frontal cortex (Ford and Mathalon, 2004; Frith, 1992). Activation
of the left inferior frontal cortex is thought to correspond to silent articulation (McGuire, et
al., 1996a; Paulesu, et al., 1993; Price, et al., 1996; Smith, et al., 1992). In line with previous
studies (McGuire, et al., 1996a; Shergill, et al., 2000b), we found increased activation of the
left inferior frontal gyrus during inner speech compared with the listening condition across
groups.
Previous studies did not find clear differences between healthy control subjects and
schizophrenia patients on an inner speech task (McGuire, et al., 1996b; Shergill, et al.,
2000b). These studies used an inner speech task that required subjects to silently articulate a
sentence in the form “I like…” or “You are…,” appended with a single word that was
presented to them in the auditory or visual modality. The task used in the present study differs
from these early studies in requiring the subjects to repeat longer sentences that were
presented to them aurally, placing higher demands on verbal self-monitoring. The same
previous studies (McGuire, et al., 1996b; Shergill, et al., 2000b) did, however, find abnormal
activation in the inferior frontal and temporal cortex during auditory verbal imagery, a task
presumably requiring more self-monitoring than simple silent repetition. Thus, the findings of
the present and previous studies suggest that when self-monitoring demands are absent or
minimal, patients show no language network related abnormality, and it is only when the
verbal material gets more complex and requires greater self-monitoring that the reduced
attenuation of superior temporal cortex activation in patients with schizophrenia becomes
apparent.

Chapter 6
105
Studies on repetition priming in healthy control subjects show a decrease in activity in the left
inferior prefrontal cortex and temporal cortex in response to repeated words in comparison
with novel words (Buckner, et al., 2000). It has been suggested that repetition priming for
semantic material may be reduced in patients (Kubicki, et al., 2003). Since the auditory
stimuli were repeated after presentation of a visual cue, it could be argued that the reduced
attenuation in the patient group may be the result of reduced repetition priming. However,
there were no significant group differences in activation of the left superior temporal gyrus
during listening and there were no group differences in activation of the left inferior frontal
gyrus. Furthermore, reaction times during the inner speech condition were not significantly
shorter in control subjects, which may be expected in case of differential priming effects. The
present study also differs considerably from the typical repetition priming designs in that the
stimuli are more complex and the stimulus onset asynchrony is comparatively long (2124–
3862 msec).
The present study found a main effect for the anterior cingulate gyrus, with inner speech trials
eliciting more activation in this area than listening trials. There were significant interactions
between group and task within the left and right anterior cingulate gyrus. Control subjects
showed activation of these regions during inner speech, and decreased activation when
listening to external speech. Patients did not show this activation of the cingulate cortex
during inner speech. The anterior cingulate has been implicated in divided attention (Corbetta,
et al., 1991) and competition monitoring (Carter, et al., 1998), and patients with schizophrenia
have been shown to display attenuated anterior cingulate activation during a cognitive
inhibition task compared with control subjects (Krabbendam, et al., 2009). It has been
suggested that the anterior cingulate may act as a top-down modulator of activity in the left
superior temporal gyrus (Allen, et al., 2007b; Fletcher, et al., 1999). This impaired modulation
may be associated with external misattributions of inner speech (Allen, et al., 2007b).
The only between-group activations were in the occipital cortices; control subjects showed
greater decreases in activation of the occipital cortex during the listening and inner speech
tasks than the patients. Studies using fMRI have demonstrated that stimulation of one sensory
modality can deactivate activation in other sensory regions (Laurienti, et al., 2002; Lewis, et
al., 2000). Functional MRI deactivation probably reflects inhibition of neural processes in
task-irrelevant regions or regions that potentially interfere with the task at hand (Tomasi, et
al., 2006). This may indicate that schizophrenia patients show less cross-modal inhibition and
may even engage some aspect of visual imagery upon hearing or generating the sentences.
There were no group differences in the superior temporal gyrus during listening. Previous

Chapter 6
106
studies have found attenuated activation in response to listening to sentences (David, et al.,
1996; Woodruff, et al., 1997); one reason for not replicating this finding may lie in the fact
that the patients were not actively hallucinating during the imaging session. Earlier studies of
inner speech per se have reported increased activation of the temporal cortex (Shergill, et al.,
2001), but these differ significantly in including an active listening baseline rather than a null
baseline as used in this study.
Limitations
Inner speech is a subjective phenomenon and as such cannot be easily objectively monitored.
Training subjects on the task before scanning was done to minimize the influence of variation
in performance and we also included an external measure of completion of the inner speech
with an explicit button press, and there was no difference from control subjects in mean
response time, suggesting that both groups performed the inner speech task in a similar
manner. One further issue is related to the level of intrinsic, implicit, inner speech activity,
which may be occurring during the baseline task; however, this is difficult to remove
completely, as it occurs implicitly. The use of the identical baseline during the listening
condition should go some way to eliminating any systematic effects due to this.
We selected patients on the basis of a prior history of auditory hallucinations, and the
inclusion of a nonhallucinating group would have permitted the examination of the specificity
of this finding with regard to hallucinations versus schizophrenia. Ford and Mathalon (2005)
conducted several studies using event-related potentials and electroencephalogram (EEG)
gamma coherence as proxies of corollary discharge. These studies reported abnormalities in
the corollary discharge system in patients with schizophrenia, without specificity to
hallucinations. Other studies (Ford, et al., 2002; Ford, et al., 2007; Heinks-Maldonado, et al.,
2007) using similar EEG paradigms, have shown that the corollary discharge system is
disrupted in patients, especially in those prone to AVHs. Even if inner speech deficits can be
linked to AVHs, it remains to be seen whether these deficits can serve as the basis for all
AVHs (Jones, 2008; Langdon, et al., 2009). Jones (2008) argues that AVHs that involve
voices attempting to regulate ongoing actions of the voice hearer may be consistent with
inner-speech based models, but other AVHs, e.g., those with a content clearly linked to
previous traumatic experience, may better be explained by other cognitive models.
Intrinsic scanner noise poses a problem in all fMRI studies, especially in studies investigating
auditory processing. The present study attempted to minimize scanner noise during the tasks
by using a partially silent acquisition during the stimuli presentation. Nevertheless, scanner

Chapter 6
107
noise remains perceptible. Although scanner noise can significantly influence the blood
oxygenation level-dependent response in the temporal cortex (Amaro, et al., 2002; Bandettini,
et al., 1998), the confounding effects of background noise should be considered as constant
across conditions.
To summarize, our data indicate that when generating inner speech, schizophrenia patients
show an attenuated deactivation in the left superior temporal gyrus, an area that has been
implicated in verbal self-monitoring processes (Shergill, et al., 2000b). This is consistent with
the notion that auditory verbal hallucinations in schizophrenia may arise as a consequence of
faulty predictive models underlying the monitoring of behaviours including inner speech
(Frith and Done, 1989; McGuire, et al., 1995).
Acknowledgements
Sukhwinder S. Shergill was supported by a Higher Education Funding Council for England
Clinical Senior Lecturer Fellowship. Lydia Krabbendam was supported by the Netherlands
Organisation for Scientific Research (VIDI grant). Claudia J. P. Simons, Derek K. Tracy,
Kirandeep K. Sanghera, Owen O’Daly, James Gilleen and Maria-de-Gracia Dominguez report
no biomedical financial interests or potential conflicts of interest.

Chapter 6
108
References
Allen P, Aleman A and McGuire PK. Inner speech models of auditory verbal hallucinations: evidence from behavioural and neuroimaging studies. Int Rev Psychiatry 2007a; 19: 407-415.
Allen P, Amaro E, Fu CHY, Williams SCR, Brammer MJ, Johns LC and McGuire PK. Neural correlates of the misattribution of speech in schizophrenia. Br J Psychiatry 2007b; 190: 162-169.
Amaro E, Williams SCR, Shergill SS, Fu CHY, MacSweeney M, Picchioni MM, Brammer MJ and McGuire PK. Acoustic noise and functional magnetic resonance imaging: current strategies and future prospects. J Magn Reson Imaging 2002; 16: 497-510.
Annet MA. A classification of hand preference by association analysis. Br J Psychol 1970; 61: 303-321. Bandettini PA, Jesmanowicz A, Van Kylen J, Birn RM and Hyde JS. Functional MRI of brain activation induced
by scanner acoustic noise. Magn Reson Med 1998; 39: 410-416. Brammer MJ, Bullmore ET, Simmons A, Williams SCR, Grasby PM, Howard RJ, Woodruff PWR and Rabe-
Hesketh S. Generic brain activation mapping in fMRI: a nonparametric approach. Magn Reson Imaging 1997; 15: 763-770.
Buckner RL, Koutstaal W, Schacter DL and Rosen BR. Functional MRI evidence for a role of frontal and inferior temporal cortex in amodal components of priming. Brain 2000; 123: 620-640.
Bullmore ET, Brammer MJ, Rabe-Hesketh S, Curtis VA, Morris RG, Williams SCR, Sharma T and McGuire PK. Methods for diagnosis and treatment of stimulus-correlated motion in generic brain activation studies using fMRI. Hum Brain Mapp 1999; 7: 38-48.
Carter CS, Braver TS, Barch DM, Botvinick MM, Nol D and Cohen JD. Anterior cingulate cortex, error detection, and the online monitoring of performance. Science 1998; 280: 747-749.
Corbetta M, Miezin FM, Dobmeyer S, Shulman GL and Petersen SE. Selective and divided attention during visual discriminations of shape, color, and speed: functional anatomy by positron emission tomography. J Neurosci 1991; 11: 2383-2402.
David AS, Woodruff PWR, Howard R, Mellers JDC, Brammer M, Bullmore E, Wright I, Andrew C and Williams SCR. Auditory hallucinations inhibit exogenous activation of auditory association cortex. NeuroReport 1996; 7: 932-936.
Dierks T, Linden DEJ, Jandl M, Formisano E, Goebel R, Lanfermann H and Singer W. Activation of Heschl's gyrus during auditory hallucinations. Neuron 1999; 22: 615-621.
Dye SM, Spence SA, Bench CJ, Hirsch SR, Stefan MD, Sharma T and Grasby PM. No evidence for left superior temporal dysfunction in asymptomatic schizophrenia and bipolar disorder. PET study of verbal fluency. Br J Psychiatry 1999; 175: 367-374.
Feinberg I. Efference copy and corollary discharge: implications for thinking and its disorders. Schizophr Bull 1978; 4: 636-640.
Fletcher P, McKenna PJ, Friston KJ, Frith CD and Dolan RJ. Abnormal cingulate modulation of fronto-temporal connectivity in schizophrenia. NeuroImage 1999; 9: 337-342.
Ford JM and Mathalon DH. Electrophysiological evidence of corollary discharge dysfunction in schizophrenia during talking and thinking. Int J Psychophysiol 2004; 58: 179-189.
Ford JM and Mathalon DH. Corollary discharge dysfunction in schizophrenia: Can it explain auditory hallucinations? International Journal of Psychophysiology 2005; 58: 179-189.
Ford JM, Mathalon DH, Kalba S, Whitfield S, Faustman WO and Roth WT. Cortical responsiveness during inner speech in schizophrenia: an event-related potential study. Am J Psychiatry 2001; 158: 1914-1916.
Ford JM, Mathalon DH, Whitfield S, Faustman WO and Roth WT. Reduced communication between frontal and temporal lobes during talking in schizophrenia. Biol Psychiatry 2002; 51: 485-492.
Ford JM, Roach BJ, Faustman WO and Mathalon DH. Synch Before You Speak: Auditory Hallucinations in Schizophrenia. Am J Psychiatry 2007; 164: 458-466.
Frith C, Friston KJ, Herold S, Silbersweig D, Fletcher P, Cahill C, Dolan R, Frackowiak RS and Liddle PF. Regional brain activity in schizophrenic patients during the performance of a verbal fluency task. Br J Psychiatry 1995; 167: 343-349.
Frith CD. The cognitive neuropsychology of schizophrenia. Hove, UK: Psychology Press; 1992. Frith CD and Done DJ. Towards a neuropsychology of schizophrenia. Br J Psychiatry 1989; 153: 437-443. Heinks-Maldonado TH, Mathalon DH, Houde JF, Gray M, Faustman WO and Ford JM. Relationship of
Imprecise Corollary Discharge in Schizophrenia to Auditory Hallucinations. Arch Gen Psychiatry 2007; 64: 286-296.
Jones SR. Do We Need Multiple Models of Auditory Verbal Hallucinations? Examining the Phenomenological Fit of Cognitive and Neurological Models. Schizophr Bull 2008: sbn129.
Jones SR and Fernyhough C. Thought as action: Inner speech, self-monitoring, and auditory verbal hallucinations. Consciousness and Cognition 2007; 16: 391-399.
Kay SR, Fiszbein A and Opler LA. The Positive and Negative Syndrome Scale (PANSS) for schizophrenia. Schizophr Bull 1987; 13: 261-276.

Chapter 6
109
Krabbendam L, O'Daly O, Morley LA, Van Os J, Murray RM and Shergill SS. Using the Stroop task to investigate the neural correlates of symptom change in schizophrenia. Br J Psychiatry 2009; 194: 373-374.
Kubicki M, McCarley RW, Nestor PG, Huh T, Kikinis R, Shenton ME and Wible CG. An fMRI study of semantic processing in men with schizophrenia. NeuroImage 2003; 20: 1923-1933.
Kumari V, Fannon D, ffytche DH, Raveendran V, Antonova E, Premkumar P, Cooke MA, Anilkumar APP, Williams SCR, Andrew C, Johns LC, Fu CHY, McGuire PK and Kuipers E. Functional MRI of Verbal Self-monitoring in Schizophrenia: Performance and Illness-Specific Effects. Schizophr Bull 2008: sbn148.
Langdon R, Jones SR, Connaughton E and Fernyhough C. The phenomenology of inner speech: comparison of schizophrenia patients with auditory verbal hallucinations and healthy controls. Psychological Medicine 2009; 39: 655-663.
Laurienti PJ, Burdette JH, Wallace MT, Yen YF, Field AS and Stein BE. Deactivation of sensory-specific cortex by cross-modal stimuli. J Cogn Neurosci 2002; 14: 420-429.
Lewis JW, Beauchamp MS and DeYoe EA. A comparison of visual and auditory motion processing in human cerebral cortex. Cereb Cortex 2000; 10: 873-888.
McGuire PK, Shah GMS and Murray RM. Increased blood flow in Broca's area during auditory hallucinations in schizophrenia. Lancet 1993; 342: 703-706.
McGuire PK, Silbersweig DA and Frith CD. Functional anatomy of inner speech and auditory verbal imagery. Psychol Med 1996a; 26: 177-189.
McGuire PK, Silbersweig DA, Wright I, Murray RM, David AS, Frackowiak RS and Frith CD. Abnormal monitoring of inner speech: a physiological basis for auditory hallucinations. Lancet 1995; 346: 596-600.
McGuire PK, Silbersweig DA, Wright I, Murray RM, Frackowiak RSJ and Frith CD. The neural correlates of inner speech and auditory verbal imagery in schizophrenia: relationship to auditory verbal hallucinations. Br J Psychiatry 1996b; 169: 148-159
Paulesu E, Frith CD and Frackowiak RSJ. The neural correlates of the verbal component of working memory. Nature 1993; 362: 342-345.
Price CJ, Wise RJS, Warburton E, Moore CJ, Howard D, Patterson K, Frackowiak RJS and Friston KJ. Hearing and saying: the functional neuroanatomy of auditory word processing. Brain Lang 1996; 119: 919-931.
Seal M, Aleman A and McGuire PK. Compelling imagery, unanticipated speech and deceptive memory: neurocognitive models of auditory verbal hallucinations in schizophrenia. Cogn Neuropsychiatry 2004; 9: 43-72.
Shergill SS, Brammer MJ, Fukuda R, Williams SCR, Murray RM and McGuire PK. Engagement of brain areas implicated in processing inner speech in people with auditory hallucinations. Br J Psychiatry 2003; 182: 525-531.
Shergill SS, Brammer MJ, Williams SCR, Murray RM and McGuire PK. Mapping auditory hallucinations in schizophrenia using functional magnetic resonance imaging. Arch Gen Psychiatry 2000a; 57: 1033-1038.
Shergill SS, Bullmore E, Simmons A, Murray R and McGuire P. Functional anatomy of auditory verbal imagery in schizophrenic patients with auditory hallucinations. Am J Psychiatry 2000b; 157: 1691-1693.
Shergill SS, Bullmore ET, Brammer MJ, Williams SCR, Murray RM and McGuire PK. A functional study of auditory verbal imagery. Psychol Med 2001; 31: 241-253.
Shergill SS, Samson G, Bays PM, Frith CD and Wolpert DM. Evidence for sensory prediction deficits in schizophrenia. Am J Psychiatry 2005; 162: 2384-2238.
Shuster LI and Lemieux SK. An fMRI investigation of covertly and overtly produced mono- and multisyllabic words. Brain Lang 2005; 93: 20-31.
Smith JD, Reisberg D and Wilson M. Subvocalisation & auditory imagery: interactions between the inner ear and inner voice. In: D. Reisberg, editor. Auditory Imagery. New Jersey: Lawrence Erlbaum Associates, 1992: 95-120.
Sommer IEC, Diederen KMJ, Blom JD, Willems A, Kushan L, Slotema K, Boks MPM, Daalman K, Hoek HW, Neggers SFW and Kahn RS. Auditory verbal hallucinations predominantly activate the right inferior frontal area. Brain 2008; 131: 3169-3177.
Spence SA, Liddle PF, Stefan MD, Hellewell JS, Sharma T, Friston KJ, Hirsch SR, Frith CD, Murray RM, Deakin JF and Grasby PM. Functional anatomy of verbal fluency in people with schizophrenia and those at genetic risk. Focal dysfunction and distributed disconnectivity reappraised. Br J Psychiatry 2000; 176: 52-60.
Talairach J and Tournoux P. Co-planner stereotaxis atlas of the human brain: three-dimensional proportional system. Stuttgart Thieme Medical Publishers; 1988.

Chapter 6
110
Tomasi D, Ernst T, Caparelli EC and Chang L. Common deactivation patterns during working memory and visual attention tasks: an intra-subject fMRI study at 4 Tesla. Human Brain Mapping 2006; 27: 694-705.
Wolpert DM, Ghahramani Z and Jordan MI. An internal model for sensorimotor integration. Science 1995; 269: 1880-1882.
Woodruff PWR, Wright IC, Bullmore ET, Brammer M, Howard RJ, Williams SCR, Shapleske J, Rossell S, David AS, McGuire PK and Murray RM. Auditory Hallucinations and the Temporal Cortical Response to Speech in Schizophrenia: A Functional Magnetic Resonance Imaging Study. Am J Psychiatry 1997; 154: 1676-1682.

Chapter 6
111
Supplemental Information
Section 1 – Image acquisition
One hundred and twelve T2*- weighted MR whole-brain volumes depicting blood oxygen
level-dependent (BOLD) contrast were acquired at each of 24 near-axial non-contiguous
planes parallel to the intercommissural line (slice thickness = 5 mm; gap = 0.5 mm; repetition
time (TR) = 2100 ms; echo time (TE) = 40 ms; flip angle = 90˚; matrix = 64x64). A pass-
delay was inserted between each volume acquisition in order to synchronize the time of
acquisition with the period of minimal interference from listening or inner speech trials and
maximal BOLD response similar to other studies (Shuster and Lemieux, 2005). At the same
session, a high-resolution gradient echo image of the whole brain was acquired in the
intercommissural plane consisting of 43 slices (slice thickness = 3 mm; gap = 0.3 mm; TR =
3000 ms; flip angle = 90˚; matrix = 128x128). Scanner noise during the tasks was minimized
by using a partially silent acquisition during the stimuli presentation lasting 6.3 seconds while
fMRI data was collected during the following 8.4 seconds.
Section 2 – Image analyses
Data were first realigned (Bullmore, et al., 1999) to minimize motion related artefacts. Data
were then smoothed using a Gaussian filter (FWHM 7.2 mm). Responses to the experimental
paradigms were then detected by time-series analysis using gamma variate functions (peak
responses at 4 and 8 s) to model the BOLD response. Each experimental condition was
convolved separately with the 4 and 8 s Poisson functions to yield two models of the expected
haemodynamic response to that condition. The weighted sum of these two convolutions that
gave the best fit (least-squares) to the time series at each voxel was then computed. This
weighted sum effectively allows voxel-wise variability in time to peak haemodynamic
response. Following this fitting operation, a goodness of fit statistic was computed at each
voxel. This was the ratio of sum of squares of deviations from the mean intensity value due to
the model (fitted time series) divided by the sum of squares due to residuals (original time
series minus model time series). This statistic is called the SSQratio. In order to sample the
distribution of SSQratio under the null hypothesis that observed values of SSQratio were not
determined by experimental design (with minimal assumptions), the time series at each voxel
was permuted using a non-wavelet resampling method (Cochrane-Orcutt AR1 regression).
This process was repeated 10 times at each voxel and the data combined over all voxels,
resulting in 10 permuted parametric maps of SSQratio at each plane for each subject. The

Chapter 6
112
same permutation strategy was applied at each voxel to preserve spatial correlational structure
in the data using randomization. Combining the randomized data over all voxels yields the
distribution of SSQratio under the null hypothesis. Voxels activated at any desired level of
type I error can then be determined obtaining the appropriate critical value of SSQratio from
the null distribution.
In order to extend inference to the group level, the observed and randomized SSQratio maps
were transformed into standard space by a two stage process involving first a rigid body
transformation of the fMRI data into a high-resolution inversion recovery image of the same
subject followed by an affine transformation onto a Talairach template (Brammer, et al.,
1997). By applying the two spatial transformations computed above for each subject to the
statistic maps obtained by analyzing the observed and non-wavelet-randomized data, a
generic brain activation map (GBAM) could be produced for each experimental condition by
testing the median observed SSQratio over all subjects at each voxel (median values were
used to minimize outlier effects) at each intracerebral voxel in standard space (Talairach and
Tournoux, 1988). Median activation maps were thresholded at a voxel-wise probability of a
false activation of p < .05 to construct the distribution of median SSQratios under the null
hypothesis of null significant response (Brammer, et al., 1997). Task (listening vs. inner
speech) and group (controls vs. patients) specific comparisons were then carried out using
cluster-level statistics (Bullmore, et al., 1999) and random permutation of group membership
to obtain the distribution of SSQratio differences under the null hypothesis of no task or group
difference in level of response. Next, the interaction between task and status was tested, by
subtracting the inner speech trials from the listening trials and subsequently carrying out a
comparison between controls and patients using cluster-level statistics and random
permutation of group membership to obtain the distribution of SSQratio differences. A
conservative significance level was adopted for all comparisons in which p-values were set at
p < 0.009 to ensure less than one false positive cluster per image. Median SSQ ratios were
extracted from peak values and plotted to clarify the interactions.


115
CHAPTER 7
Epilogue

Chapter 7
116
Epilogue
Schizophrenia is an aetiologically complex disorder of which the underlying neural
mechanisms and precise mode of transmission of genetic vulnerability remain elusive. In spite
of the fact that the estimated heritability of schizophrenia is high and a large number of
genetic association studies have investigated potential neurodevelopmental susceptibility
genes, results regarding susceptibility genes have, as yet, not been consistent. Different
approaches have been suggested to increase our understanding of the (genetic) aetiology of
psychosis, including (i) searching for intermediate phenotypes, (ii) incorporating information
about the environment into genetic designs, and (iii) investigating specific psychotic
symptoms rather than DSM-IV diagnoses in clinical populations. The studies described in this
thesis aimed at examining the symptomatic, neurobiological and genetic correlates of
dysfunctions in information processing at subclinical and clinical levels of the psychosis
phenotype.
Neurocognitive intermediate phenotypes
The rational behind the intermediate phenotype approach is to find phenotypes with a simpler
genetic basis than the genetically complex and aetiologically heterogeneous schizophrenia
phenotype, thus reducing the complexity of genetic analyses and assisting in the
neurobiological validation of the overarching psychosis phenotype. In order for a biological
marker to be a useful intermediate phenotype, the marker should be: 1. associated with the
illness in the population, 2. heritable, 3. state-independent, 4. co-segregated with the illness
within families, and 5. present in unaffected relatives of patients to a higher degree than in the
general population (Gottesman and Gould, 2003).
There is convincing evidence that neurocognitive functioning may form an intermediate
phenotype for psychosis, especially in the domains of episodic memory, attention/information
processing speed, and executive functioning (Braff, 1993; Dickinson, et al., 2007; Heinrichs
and Zakzanis, 1998; Morice and Delahunty, 1996; Nuechterlein and Dawson, 1984).

Chapter 7
117
Associations between neurocognition and subclinical psychotic symptoms
In this thesis, we explored episodic memory and information processing speed as potential
intermediate phenotypes. Since many studies have examined associations between symptom
dimensions and neurocognitive functioning only at the clinical level and restricted to the
narrowly defined schizophrenia diagnosis, the studies in chapter 2 and 3 focussed on the
broader psychosis phenotype. In a general population twin study, it was shown that
information processing speed was significantly associated with self-reported subclinical
psychotic experiences (chapter 2), in line with previous studies, indicating that information
processing speed is a robust intermediate phenotypic marker of psychosis liability (Dickinson,
et al., 2007; Jabben, et al., 2007).Variation in information processing speed could partially be
explained by genetic factors. More importantly, the association between self-reported
subclinical negative symptoms and information processing speed could best be explained in
terms of a model that solely contained genetic factors, consistent with a model of pleiotropic
effects, in which susceptibility loci manifest as both slower information processing and
subclinical negative symptoms. Such multivariate phenotypes make an even stronger case for
intermediate phenotypes, allowing for multivariate phenotype analyses that may have a
greater likelihood of assisting in the search for psychosis-related genotypes (Iacono, 1998;
Price, et al., 2006).
The great majority of schizophrenia studies investigating the relation between neurocognitive
functioning and symptom dimensions have excluded depressive symptoms from their
analyses. Yet, depressive symptoms form an integral part of the psychosis phenotype and it
has been suggested that the depressive dimension may have cognitive correlates (Holthausen,
et al., 1999). Studies on major depressive disorder have pointed out that depression may be
associated with a number of deficits across a range of domains of cognitive functioning
including memory, executive functioning, attention, and speed of information processing
(Burt, et al., 1995; Degl’Innocenti, et al., 1998; Hickie, 1996; Rossi, et al., 1990; Zakzanis, et
al., 1998). The commonly voiced notion is that these cognitive deficits are a secondary
consequence to the depressed state. However, several studies investigating cognitive
performance in depressive patients have shown that the cognitive deficits do not always
resolve with the remission of the depressive symptoms. Thus, it may be that causality is
reversed. Yet, prospective studies investigating the impact of cognitive functioning on follow-
up depressive symptoms have been rare and have generally focussed on depressed elderly
patients (Berger et al., 1998; Den Hartog et al., 2003a; Den Hartog et al., 2003b; Roberts et
al., 1997; Roberts et al., 2000). In a longitudinal design of general population female adults,

Chapter 7
118
we looked at both cross-sectional and longitudinal associations between cognitive functioning
and subclinical and clinical measures of depressive symptoms (chapter 3). The results
indicated that the association between clinical depressive symptoms and information
processing speed is a state effect, in accordance with the generally held idea of cognitive
deficits being epiphenomena of depressed mood. In contrast, a significant association was
found between episodic memory and future depressive symptoms, indicating that poor
episodic memory may be a risk factor for the development of depressive symptoms.
Neurocognition at a neurophysiological level
Investigating neurocognition at a neurophysiological level may yield promising intermediate
phenotypes because these measures are sensitive to both biological and psychological factors
associated with psychopathology. Brain event-related potentials (ERPs) serve as objective
neurophysiological measures of brain function, indexing time-locked changes to external
stimuli in electroencephalogram activity. Different ERPs can be used to study different
aspects of the neural basis of aberrant information processing. The P300, for example, is a
positive ERP evoked by the presentation of a target stimulus embedded among irrelevant
stimuli, occurring with a latency of approximately 300 ms after onset of the target stimulus.
The P300, but also earlier components such as the N100 waveform, are well suited to
investigate attention/information processing speed at a neurophysiological level. In chapter 4,
the P300 and N100 waveforms were investigated as potential intermediate phenotypes. P300
abnormalities were found in patients with a psychotic disorder, but no significant P300
abnormalities were found in unaffected siblings of these patients. Patients also showed
significantly prolonged N100 latencies, suggestive of slowed processing of auditory
information early in the processing sequence. In contrast to the P300, prolonged N100
latencies were also present in the unaffected siblings. Test-retest results measured over two
sessions, with a time interval of approximately one week, suggested that this prolonged
latency can be reliably measured in siblings, thereby lending support for the use of N100
latency as a biological marker for psychosis liability.
Gene–environment mechanisms
An explanation for the lack of clear findings regarding the genetic basis of schizophrenia,
despite the vast amount of genetic association studies that have been conducted, may be that
testing for direct effects of genotype on phenotype ignores the fact that genetic mechanisms

Chapter 7
119
are likely to exert their influence on developing brain systems under influence of
environmental factors (van Os and Kapur, 2009). The impact of environmental stressors
depends on the genetic makeup of the individual and any impact of genetic variation on the
phenotype is contextualized by the environment (van Os, et al., 2008). In chapter 5, we tested
whether the impact of daily life stressors on feelings of paranoia depended on the genetic
makeup of individuals. The Experience Sampling Method (Csikszentmihalyi and Larson,
1987; Delespaul, 1995; DeVries, 1992; Myin-Germeys, et al., 2001) was used to study the
effects of minor environmental stressors on subtle feelings of paranoia as they occur in the
flow of daily life. Genetic vulnerability was investigated using two functional polymorphisms
of the catechol-O-methyltransferase (COMT) and brain-derived neurotrophic factor (BDNF)
genes. The results showed that the effect of minor environmental stressors on feelings of
paranoia was dependent on COMT or BDNF genotype, indicating gene–environment
interaction. COMT Val158Met moderated the effect of event-stress on feelings of paranoia,
with Val/Val carriers showing more feelings of paranoia in response to unpleasant events
compared with Met/Met carriers. In contrast to the COMT Val158Met polymorphism, there
was no interaction between BDNF Val66Met and event-related stress reactivity. Rather, BDNF
Val66Met interacted with social stress in its effect on feelings of paranoia. Thus different
genotypes may impact on different environmental stressors, resulting in increased expression
of specific psychotic symptoms. Neither COMT nor BDNF showed any significant main
effects on feelings of paranoia. These results highlight the importance of incorporating
environmental stressors or protectors in genetic studies. Presence of strong gene–environment
interactions may reduce the power in genetically heterogeneous samples to the extent that
genetic association studies are at best able to find small, non-robust effects. The results of the
present study do not only suggest that gene–environment interactions can be established in a
daily life context of repetitive events, but that these gene–environment interactions can also
be clinically meaningful, because effect sizes for the COMT Val/Val and the BDNF Val/Met
carriers for the highest levels of daily life stress were sufficiently large to consider them
clinically relevant. Since the study assessed frequently occurring exposures to stressors in
daily life, it can be envisaged that the cumulative effects of these daily stressors may be
considerable in genetically vulnerable individuals.

Chapter 7
120
Cognitive model for auditory verbal hallucinations
Neurocognitive intermediate phenotypes such as information processing speed and memory
have been linked to the negative symptom dimension rather than the positive symptom
dimension (de Gracia Dominguez, et al., 2009). Examining more experimental, hypothesis-
driven models of distinct cognitive processes gone astray may help in unravelling the
underlying neurobiology of positive symptoms. In chapter 6, we examined one of the most
influential cognitive models for auditory verbal hallucinations (AVHs) which assumes that
AVHs are the result of a dysregulation in the monitoring of inner speech. Self-monitoring of
inner speech refers to the capacity to distinguish one’s own thoughts and utterances from
those that are generated by an external source. If this monitoring system (referred to as
forward modelling or corollary discharge) is defective, verbal thoughts will appear unintended
and are attributed to an external source, resulting in the experience of AVHs. Several studies
have investigated the inner speech model at a cognitive level, using different paradigms.
Some of these studies used paradigms that required subjects to discriminate between self-
generated and externally generated utterances, while artificially creating an experience of
uncertainty in the subject when hearing his/her own voice by distorting the pitch of the
subject’s speech. These studies have reported that schizophrenia patients are more likely to
misattribute self-generated speech to an external source than healthy controls (Johns and
McGuire, 1999; Johns, et al., 2001). Other studies have reported lower levels of perceived
intentionality and control over self-generated words in schizophrenia patients than in healthy
controls during word-association tasks (Baker and Morrison, 1998; Morrison and Haddock,
1997). In chapter 6, we used functional magnetic resonance imaging (fMRI) to investigate
brain activation during the perception of internally generated speech and external speech, in
both patients with schizophrenia and matched healthy controls. The main finding was a
significant interaction between group and task for the left superior temporal cortex. During
listening to externally generated speech, activation of the left superior temporal cortex was
evident in both controls and schizophrenia patients. In contrast, control subjects showed
greater decrease in activation during inner speech compared with listening than patients.
These findings provide evidence at the neural level for a dysregulation in the monitoring of
inner speech as an underlying mechanism in the generation of AVHs.

Chapter 7
121
Implications for clinical practice
Although the present thesis suggests that vulnerability for psychosis can be measured in the
general population, including psychotic experiences and neurocognitive deficits, these
findings are of little use for prevention, because general population screening would lack
sensitivity and specificity. However, the theoretical framework of the present thesis does offer
some recommendations for clinical practice. The studies presented in this thesis have taken a
more symptom-oriented rather than a syndrome-oriented approach to study the aetiology of
the heterogeneous psychosis phenotype. A symptom-oriented approach may also prove to be
fruitful in clinical practice, generating theory-driven therapeutic interventions directed at the
underlying mechanisms of specific symptoms (Bentall, 2006; Garety and Freeman, 1999; van
Os and Kapur, 2009). Clinical practice should not be fixated merely on a diagnostic label, but
rather focus on the specific symptoms that occur in the patient, including positive, negative,
and affective symptoms, and neurocognitive functioning. Clinical attention to deficits in
neurocognitive functioning may be valuable, given that deficits in neurocognitive functioning
appear to be of functional significance, and it has been suggested that functional outcome in
schizophrenia is better predicted by more stable characteristics such as neurocognition than by
fluctuating positive symptoms (Green, et al., 2004).
The present thesis furthermore suggests that psychotic symptoms are not exclusively
associated with disorder, but also occur in the general population. In addition, the findings
highlight that aberrations in normal cognitive processes such as the processing of inner speech
can lead to psychotic symptoms. Providing psychoeducation that emphasizes these aspects of
psychotic symptoms and avoids dichotomisation between healthy state and disorder may
lessen the extent of internalised stigma and its negative psychological effects on the patient.
Conclusions and directions for future research
The studies described in this thesis illustrate that investigating cognitive intermediate
phenotypes in relation to the broader psychosis phenotype may provide means for finding
bridging explanations between underlying neurobiological factors and behavioural symptoms.
The putative neurodevelopmental nature of schizophrenia and the findings that
neurocognition may precede behavioural symptoms, including affective symptoms as chapter
3 suggests, imply that longitudinal associations between cognition and symptoms merit
further research. Furthermore, previous research suggested that subclinical psychotic

Chapter 7
122
experiences are generally transitory in nature and it is only in a small proportion of the
general population that these symptoms show persistence over time and may eventually
become clinically relevant (Cougnard, et al., 2007; Dominguez, et al., 2009; Hanssen, et al.,
2005). Longitudinal general population studies focussing on associations between
neurocognitive functioning and subclinical symptoms may therefore provide a valuable
framework for investigating cognitive vulnerabilities, and one that is unconfounded by
illness-related effects.
The use of biological markers of information processing abnormalities may provide a very
constructive approach in elucidating the underlying neurobiological and genetic architecture.
However, the usefulness is limited by the lack of specificity for psychotic disorders. For
example, abnormalities in P300 have been reported in other clinical populations and in family
members at risk for other neuropsychiatric disorders, such as alcoholism (Hill, et al., 1999),
bipolar disorder (Schulze, et al., 2008) and Alzheimer’s disease (Boutros, et al., 1995).
Genetic analyses using intermediate phenotypes instead of clinical disorder may therefore
gain by diminishing genetic complexity, but with the consequence of loss of specificity.
Relatively few studies have focused on multivariate intermediate phenotypes. A composite
intermediate phenotype comprising multiple biological markers might show greater
specificity to a specific disorder and may show greater test-retest reliability than a single
intermediate phenotype (Turetsky, et al., 2007). Gene–environment interaction studies on
psychotic symptoms or intermediate phenotypes may also provide tools for understanding
disorder-specific psychopathology. Genetic epidemiological studies suggest that gene–
environment interactions are quite common in psychiatric disorders (van Os, et al., 2008) and
studies investigating gene–environment interactions on subclinical and clinical
symptomatology may provide insight into genetic factors underlying the psychosis phenotype.
As chapter 5 underscores, failing to take environmental stressors into account when studying
genes, may lead to failure to detect important genetic influences on the phenotype. Reversely,
including genes when studying environmental stressors may help reveal stronger effects of
environmental stressors in genetically vulnerable subgroups.
Greater understanding of the underlying neurobiological mechanisms specific for psychosis
may also be reached by investigating cognitive models for specific symptoms. The present
thesis focused on self-monitoring of inner speech as a cognitive model for AVHs. The model
provides an explanation for one of the properties of AVHs, namely that they are not
recognized as internally generated, but rather appear to come from an external source.
However, none of the proposed cognitive models for AVHs have been able to explain all the

Chapter 7
123
characteristic features of AVHs. Cognitive models for AVHs should, for example, be able to
explain that AVHs are often perceived to have different acoustic properties than the patients
own voice and are often of an emotional nature (Aleman, 2002; Jones and Fernyhough, 2007).
Thus, future research should focus on explaining all characteristics of AVHs.

Chapter 7
124
References
Aleman A. Hallucinaties: een cognitief-neuropsychiatrische benadering. Tijdschr Psychiatr 2002; 44: 753-758. Baker CA and Morrison AP. Cognitive processes in auditory hallucinations: attributional biases and
metacognition. Psychol Med 1998; 28: 1199-1208. Bentall R. Madness explained: Why we must reject the Kraepelinian paradigm and replace it with a 'complaint-
orientated' approach to understanding mental illness. Med Hypotheses 2006; 66: 220-233. Boutros N, Torello MW, Burns EM, Wu S-S and Nasrallah HA. Evoked potentials in subjects at risk for
Alzheimer's Disease. Psychiatry Res 1995; 57: 57-63. Braff DL. Information Processing and Attention Dysfunctions in Schizophrenia. Schizophr Bull 1993; 19: 233-
259. Burt DB, Zembar MJ and Niederehe G. Depression and memory impairment: a meta-analysis of the association,
its pattern, and specificity. Psychol Bull 1995; 177: 285-305. Cougnard A, Marcelis M, Myin-Germeys I, De Graaf RON, Vollebergh W, Krabbendam L, Lieb R, Wittchen H-
U, Henquet C, Eacute, Cile, Spauwen J and Van Os JIM. Does normal developmental expression of psychosis combine with environmental risk to cause persistence of psychosis? A psychosis proneness-persistence model. Psychol Med 2007; 37: 513-527.
Csikszentmihalyi M and Larson R. Validity and reliability of the Experience-Sampling Method. J Nerv Ment Dis 1987; 175: 526-536.
de Gracia Dominguez M, Viechtbauer W, Simons CJP, van Os J and Krabbendam L. Are psychotic psychopathology and neurocognition orthogonal? A systematic review of their associations. Psychol Bull 2009; 135: 157-171.
Degl’Innocenti A, Agren H and Backman L. Executive deficits in major depression. Acta Psychiatr Scand 1998; 97: 182-188.
Delespaul P. Assessing schizophrenia in daily life: The experience sampling method. Maastricht: University of Limburg; 1995.
DeVries MW. The experience of psychopathology: investigating mental disorders in their natural settings. Cambridge: Cambridge university press; 1992.
Dickinson D, Ramsey ME and Gold JM. Overlooking the Obvious: A Meta-analytic Comparison of Digit Symbol Coding Tasks and Other Cognitive Measures in Schizophrenia. Arch Gen Psychiatry 2007; 64: 532-542.
Dominguez M-d-G, Wichers M, Lieb R, Wittchen H-U and van Os J. Evidence That Onset of Clinical Psychosis Is an Outcome of Progressively More Persistent Subclinical Psychotic Experiences: An 8-Year Cohort Study. Schizophr Bull 2009: sbp022.
Garety PA and Freeman D. Cognitive approaches to delusions: A critical review of theories and evidence. Br J Clin Psychol 1999; 38: 113-154.
Gottesman II and Gould TD. The Endophenotype Concept in Psychiatry: Etymology and Strategic Intentions. Am J Psychiatry 2003; 160: 636-645.
Green MF, Kern RS and Heaton RK. Longitudinal studies of cognition and functional outcome in schizophrenia: implications for MATRICS. Schizophr Res 2004; 72: 41-51.
Hanssen M, Bak M, Bijl R, Vollebergh W and van Os J. The incidence and outcome of subclinical psychotic experiences in the general population. Br J Clin Psychol 2005; 44: 181-191.
Heinrichs RW and Zakzanis KK. Neurocognitive deficit in schizophrenia: A quantitative review of the evidence. Neuropsychology 1998; 12: 426-445.
Hickie I. Validity of the CORE: II. Neuropsychological tests. In: G. Parker and D. Hadzi-Pavlovic, editors. Melancholia: A disorder of movement and mood. New York: Cambridge University Press, 1996: 149-159.
Hill SY, Yuan H and Locke J. Path analysis of P300 amplitude of individuals from families at high and low risk for developing alcoholism. Biol Psychiatry 1999; 45: 346-359.
Holthausen EAE, Wiersma D, Knegtering RH and Van den Bosch RJ. Psychopathology and cognition in schizophrenia spectrum disorders: the role of depressive symptoms. Schizophr Res 1999; 39: 65-71.
Iacono WG. Identifying psychophysiological risk for psychopathology: Examples from substance abuse and schizophrenia research. Psychophysiology 1998; 35: 621-637.
Jabben N, Os Jv, Janssen I, Versmissen D and Krabbendam L. Cognitive alterations in groups at risk for psychosis: neutral markers of genetic risk or indicators of social disability? Acta Psychiatr Scand 2007; 116: 253-262.
Johns LC and McGuire PK. Verbal self-monitoring and auditory hallucinations in schizophrenia. Lancet 1999; 353: 469-470.
Johns LC, Rossell S, Frith C, Ahmad F, Hemsley D, Kuipers E and McGuire PK. Verbal self-monitoring and auditory verbal hallucinations in patients with schizophrenia. Psychol Med 2001; 31: 705-715.

Chapter 7
125
Jones SR and Fernyhough C. Thought as action: Inner speech, self-monitoring, and auditory verbal hallucinations. Consciousness Cogn 2007; 16: 391-399.
Morice R and Delahunty A. Frontal/Executive Impairments in Schizophrenia. Schizophr Bull 1996; 22: 125-137. Morrison AP and Haddock G. Cognitive factors in source monitoring and auditory hallucinations. Psychol Med
1997; 27: 669-679. Myin-Germeys I, van Os J, Schwartz JE, Stone AA and Delespaul PA. Emotional Reactivity to Daily Life Stress
in Psychosis. Arch Gen Psychiatry 2001; 58: 1137-1144. Nuechterlein KH and Dawson ME. Information Processing and Attentional Functioning in the Developmental
Course of Schizophrenic Disorders. Schizophr Bull 1984; 10: 160-203. Price GW, Michie PT, Johnston J, Innes-Brown H, Kent A, Clissa P and Jablensky AV. A Multivariate
Electrophysiological Endophenotype, from a Unitary Cohort, Shows Greater Research Utility than Any Single Feature in the Western Australian Family Study of Schizophrenia. Biol Psychiatry 2006; 60: 1-10.
Rossi A, Stratta P, Nistico R, Sabatini MD, Di Michele V and Casacchia M. Visuospatial impairment in depression: A controlled ECT study. Acta Psychiatr Scand 1990; 81: 245-249.
Schulze KK, Hall M-H, McDonald C, Marshall N, Walshe M, Murray RM and Bramon E. Auditory P300 in patients with bipolar disorder and their unaffected relatives. Bipolar Disord 2008; 10: 377-386.
Turetsky BI, Calkins ME, Light GA, Olincy A, Radant AD and Swerdlow NR. Neurophysiological Endophenotypes of Schizophrenia: The Viability of Selected Candidate Measures. Schizophr Bull 2007; 33: 69-94.
van Os J and Kapur S. Schizophrenia: The Lancet. Lancet 2009; 374: 635-635. van Os J, Rutten BPF and Poulton R. Gene-Environment Interactions in Schizophrenia: Review of
Epidemiological Findings and Future Directions. Schizophr Bull 2008: sbn117. Zakzanis KK, Leach L and Kaplan E. On the nature and pattern of neurocognitive function in major depressive
disorder. Neuropsychiatry Neuropsychol Behav Neurol 1998; 11: 111-119.


127
SUMMARY
SAMENVATTING

Summary
128
Summary
This thesis entitled In search of neurobiological intermediate phenotypes of aberrant
information processing in psychosis, examines dysfunctions in information processing in
relation to various symptoms of the broader psychosis phenotype, using various approaches to
increase understanding of the biological underpinnings.
Chapter 1 provides an introduction to the phenomenology and aetiology of psychosis. The
failure of genetic association studies to identify genes involved in the schizophrenia
phenotype has led to alternative strategies. These strategies include investigating intermediate
phenotypes, investigating gene-environment interactions, and investigating specific psychotic
symptoms rather than DSM-IV diagnosis. Neurocognitive functioning is presented as a
promising intermediate phenotype. Next, gene-environment interactions are discussed in the
context of psychotic reactivity to daily life stressors. Subsequently, the monitoring of inner
speech is presented as a model for auditory verbal hallucinations. The chapter finishes with
the aims and outline of the thesis.
Chapter 2 examines measures of neurocognitive functioning as potential intermediate
phenotypes in relation to specific dimensions of subclinical psychotic experiences. First, the
chapter established whether there were significant associations between cognitive deficits and
psychotic symptom dimensions. Second, it was investigated whether any association is caused
by genetic factors. In a general population sample of female twin pairs, it was shown that
negative symptoms and information processing speed are associated at the subclinical level
and that this association appears to be influenced by genetic factors exclusively. These
findings indicate that bivariate psychosis phenotypes may represent suitable candidates for
molecular genetic studies in the general population.
Chapter 3 examines neurocognition in relation to subclinical and clinical depressive
symptoms in the general population. The commonly voiced notion is that associations
between neurocognitive functioning and depression are merely state-related and can therefore
not be considered intermediate phenotypes for depression. However, prospective studies
investigating the impact of cognitive functioning on follow-up depressive symptoms have
been rare. Therefore, this study investigated whether neurocognitive functioning predicts

Summary
129
current and/or follow-up depressive symptoms in the general population. Cross-sectional and
prospective associations between depressive symptoms measured at the subclinical and
clinical level and neuropsychological factors (episodic memory and information processing
speed) were examined. Episodic memory was significantly associated with follow-up
subclinical depressive symptoms. The results thus suggest that poor memory functioning may
be a risk factor for the onset of subclinical depressive symptoms.
Chapter 4 reports a study investigating potential neurocognitive intermediate phenotypes at a
neurophysiological level. The aims of this study were to determine whether patients with a
psychotic disorder and their healthy siblings show abnormalities in P300 and N100 waves and
to establish test-retest reliabilities for these event-related potential components. Using an
auditory oddball paradigm, P300 and N100 latency and amplitude were acquired from
patients with a psychotic disorder, unaffected siblings, and healthy controls. Patients showed
significantly delayed P300 latency and diminished P300 amplitude compared to controls.
However, the present study failed to find any significant P300 abnormalities in unaffected
siblings. In contrast, N100 latency was delayed in the unaffected siblings. N100 could reliably
be measured in controls and siblings, suggesting that this component, rather than P300, may
serve as an intermediate phenotype.
Chapter 5 focussed on gene–environment interactions. It has been suggested that genes
impact on the degree to which minor daily stressors cause variation in the intensity of subtle
paranoid experiences. The objective of the study was to test the moderating effects of
catechol-O-methyltransferase (COMT) Val158Met and brain-derived neurotrophic factor
(BDNF) Val66Met genotypes on paranoid reactivity to minor stressors. In a general population
sample of female twins, appraisals of event-related and social stress in the flow of daily life
were assessed in relation to feelings of paranoia using momentary assessment technology. The
results showed that COMT Val carriers displayed more feelings of paranoia in response to
event stress compared to Met carriers. BDNF Met carriers showed more social stress-induced
paranoia than individuals with the Val/Val genotype. Thus, these findings demonstrate the
importance of incorporating both genetic and environmental factors in studying psychotic
symptoms in the flow of daily life.

Summary
130
Chapter 6 investigates aberrations in the monitoring of inner speech as a cognitive model for
auditory verbal hallucinations. Auditory verbal hallucinations in schizophrenia have been
linked to defective monitoring of one’s own verbal thoughts. The study described in this
chapter investigated the functional neuroanatomy of inner and external speech in both patients
with schizophrenia and healthy controls. Patients with schizophrenia and healthy controls
were studied using functional magnetic resonance imaging while listening to sentences or
imagining sentences. Significant interactions between group (controls vs. patients) and task
(listening vs. inner speech) were seen for the left superior temporal gyrus. These findings
provide evidence at the neural level for a dysregulation in the monitoring of inner speech in
schizophrenia, possibly pinpointing the underlying mechanism in the generation of auditory
verbal hallucinations.
Chapter 7 presents a summary of the main findings of this thesis. The chapter illustrates that
investigating cognitive intermediate phenotypes, gene–environment interactions, and
symptom-specific cognitive models in relation to the broader psychosis phenotype may
provide valuable means for finding bridging explanations between underlying neurobiological
factors and behavioural symptoms. Finally, the clinical implications of the findings of this
thesis, as well as suggestions for further research, are given.

Samenvatting
131
Samenvatting
Dit proefschrift getiteld In search of neurobiological intermediate phenotypes of aberrant
information processing in psychosis onderzoekt afwijkingen in de informatieverwerking in
relatie tot symptomen van het bredere psychosefenotype met behulp van verschillende
benaderingen om zodoende meer begrip te krijgen van de onderliggende neurobiologie.
Hoofdstuk 1 geeft een introductie betreffende de fenomenologie en etiologie van psychose.
Het tekortschieten van genetische associatiestudies in het identificeren van genen die
betrokken zijn bij het schizofreniefenotype heeft geleid tot alternatieve strategieën. Deze
strategieën omvatten onder andere het onderzoeken van tussenliggende fenotypes, het
onderzoeken van gen–omgevingsinteracties en het onderzoeken van specifieke psychotische
symptomen in plaats van DSM-IV diagnose. Neurocognitief functioneren wordt
geïntroduceerd als een veelbelovend intermediair fenotype. Vervolgens worden gen–
omgevingsinteracties besproken binnen de context van psychotische reacties op stressoren in
het dagelijks leven. Daarnaast wordt het monitoren van innerlijke spraak als model voor
auditieve verbale hallucinaties beschreven. Het hoofdstuk eindigt met de doelstellingen en
uiteenzetting van het proefschrift.
Hoofdstuk 2 onderzoekt neurocognitief functioneren als potentieel intermediair fenotype in
relatie tot specifieke dimensies van subklinische psychotische ervaringen. Ten eerste wordt in
dit hoofdstuk vastgesteld of er significante associaties zijn tussen cognitieve verstoringen en
psychotische symptoomdimensies. Ten tweede wordt onderzocht of genetische factoren ten
grondslag liggen aan deze associaties. In een algemene populatie steekproef van vrouwelijke
tweelingparen werd aangetoond dat negatieve symptomen op subklinisch niveau significant
geassocieerd zijn met snelheid van informatieverwerking en dat deze associatie volledig kan
worden verklaard door genetische factoren. Deze bevindingen geven aan dat bivariate
psychotische fenotypes mogelijk geschikte kandidaten zijn voor moleculair genetische studies
in de algemene populatie.
Hoofdstuk 3 onderzoekt neurocognitie in relatie tot subklinische en klinische depressieve
symptomen in de algemene populatie. Algemeen wordt aangenomen dat associaties tussen
neurocognitief functioneren en depressie louter toestandsgerelateerd zijn en dat neurocognitie

Samenvatting
132
dus geen intermediair fenotype is voor depressie. Prospectieve studies die de impact van
cognitief functioneren op follow-up depressieve symptomen onderzoeken zijn echter
zeldzaam. Daarom onderzoekt deze studie of neurocognitief functioneren huidige en/of
follow-up depressieve symptomen in de algemene populatie kan voorspellen. Cross-sectionele
en prospectieve associaties tussen depressieve symptomen gemeten op subklinisch en klinisch
niveau en neuropsychologische factoren (episodisch geheugen en informatieverwerkings-
snelheid) werden onderzocht. Episodisch geheugen was significant geassocieerd met follow-
up subklinische depressieve symptomen. De resultaten suggereren dus dat een slecht
functionerend geheugen een risicofactor zou kunnen zijn voor het ontstaan van subklinische
depressieve symptomen.
Hoofdstuk 4 rapporteert een studie die potentiële onderliggende neurocognitieve fenotypes
onderzoekt op neurofysiologisch niveau. Het doel van deze studie is vast te stellen of
patiënten met een psychotische stoornis en hun gezonde broers/zussen afwijkingen vertonen
in P300 en N100 en om test-hertest betrouwbaarheid vast te stellen voor deze ‘event-related
potential’ componenten. Middels een auditief oddball paradigma, werden P300 en N100
latentie en amplitude gemeten bij patiënten met een psychotische stoornis, gezonde
broers/zussen en gezonde controles. Patiënten vertoonden een significant vertraagde P300
latentie en afgenomen P300 amplitude vergeleken met controles. De huidige studie kon echter
geen significante P300 afwijkingen vinden bij gezonde broers/zussen. N100 latentie,
daarentegen, was vertraagd in gezonde broers/zussen en kan betrouwbaar gemeten worden in
controles en broers/zussen, wat suggereert dat deze component, meer dan de P300, kan dienen
als intermediair fenotype.
Hoofdstuk 5 focust op gen–omgevingsinteracties. Er is gesuggereerd dat genen de mate
beïnvloeden waarin kleine dagelijkse stressoren variatie veroorzaken in de intensiteit van
subtiele paranoïde ervaringen. Het doel van de studie was de modererende rol van de COMT
Val158Met en BDNF Val66Met genotypen op paranoïde reactiviteit voor kleine stressoren te
testen. In een algemene populatie steekproef van vrouwelijke tweelingen werden
beoordelingen over gebeurtenisgerelateerde en sociale stress en gevoelens van paranoia in het
beloop van het dagelijkse leven vastgesteld met behulp van de zogeheten Experience
Sampling Methode. De resultaten lieten zien dat COMT Val-dragers meer gevoelens van
paranoia toonden als reactie op gebeurtenisgerelateerde stress vergeleken met Met-dragers.
BDNF Met-dragers toonden meer paranoia op momenten van sociale stress dan individuen

Samenvatting
133
met het Val/Val genotype. Deze bevindingen demonstreren aldus het belang van het
incorporeren van zowel genetische als omgevingsfactoren in de bestudering van psychotische
symptomen in het beloop van het dagelijks leven.
Hoofdstuk 6 onderzoekt abnormaliteiten in het monitoren van innerlijke spraak als cognitief
model voor auditieve verbale hallucinaties. Auditieve verbale hallucinaties in schizofrenie
zijn in verband gebracht met een defect in het monitoren van de eigen verbale gedachten. De
studie die in dit hoofdstuk wordt beschreven, onderzoekt de functionele neuroanatomie van
innerlijke en externe spraak zowel in patiënten met schizofrenie als in gezonde controles.
Patiënten met schizofrenie en gezonde controles werden bestudeerd met behulp van
functionele magnetische resonantie beeldvorming terwijl zij naar zinnen luisterden of zinnen
inbeelden. Voor de linker superieure temporale gyrus werden significante interacties
gevonden tussen groep (controles vs. patiënten) en taak (luisteren vs. innerlijke spraak). Deze
bevindingen leveren bewijs op neuraal niveau voor een verstoorde regulatie van het
monitoren van innerlijke spraak in schizofrenie. Dit wijst mogelijk in de richting van het
mechanisme dat ten grondslag ligt aan het ontstaan van auditieve verbale hallucinaties.
Hoofdstuk 7 presenteert een samenvatting van de belangrijkste bevindingen van dit
proefschrift. Het hoofdstuk illustreert dat het onderzoeken van cognitieve onderliggende
fenotypes, gen– omgevingsinteracties en symptoomspecifieke cognitieve modellen in relatie
tot het bredere psychose fenotype belangrijke middelen kunnen leveren voor het vinden van
overbruggende verklaringen tussen onderliggende neurobiologische factoren en
gedragssymptomen. Het hoofdstuk besluit met klinische implicaties van de bevindingen uit
dit proefschrift en suggesties voor toekomstig onderzoek.


135
Dankwoord
En dan is het eindelijk af.... maar niet zonder een woord van dank aan de mensen die hebben
bijgedragen aan de totstandkoming van mijn proefschrift.
Allereerst gaat mijn dank uit naar mijn promotor, Prof. dr. Jim van Os en mijn copromotor,
Dr. Lydia Krabbendam. Beste Jim, ik heb veel van je mogen leren en ik heb bewondering
voor je geestdrift. Lydia, door jou ben ik bij de Capaciteitsgroep Psychiatrie &
Neuropsychologie terecht gekomen en daar ben ik je erg dankbaar voor. Dank je wel voor je
goede begeleiding en de prettige samenwerking. Ik wil jullie beiden in het bijzonder bedanken
voor het vertrouwen en de mogelijkheden die jullie me hebben geschonken.
Ook wil ik mijn tweede promotor, Prof. dr. Wim Riedel en Anke Sambeth bedanken voor hun
hulp bij de EEG studie. Wim, dank je wel voor je interesse in de voortgang van het onderzoek
en je feedback op het manuscript van de EEG studie. Anke, bedankt dat je me wegwijs hebt
gemaakt in de wereld die EEG heet. Ik vond het heel prettig dat ik altijd bij je mocht
aankloppen.
Zonder proefpersonen was dit EEG onderzoek echter nooit tot stand gekomen en daarom wil
ik dan ook alle deelnemers oprecht bedanken voor de tijd en moeite die zij hebben genomen
om twee keer voor een halve dag naar het lab in Maastricht te komen. Ook wil ik Chantal,
Ellen en Ilse hartelijk danken die als stagiair een belangrijke bijdrage hebben geleverd aan de
dataverzameling van deze studie.
De leden van de leescommissie, Prof. dr. M. de Vries, Dr. A.L. van Bemmel, Prof. dr. P. van
Harten, Dr. I. Myin-Germeys en Prof. dr. W.M.A. Verhoeven, wil ik bedanken voor het
beoordelen van het manuscript, en de coauteurs voor de prettige samenwerking. Prof. dr. C.
Derom en Prof. dr. E. Thiery wil ik bedanken voor de gelegenheid om gebruik te maken van
de data van het Oost-Vlaamse tweelingregister waarop drie van de hoofdstukken uit dit
proefschrift zijn gebaseerd.

136
I would also like to thank Dr. Sukhwinder Shergill for giving me the opportunity to work at
the CSI lab and analyse your interesting fMRI inner speech data set. It was a great pleasure
working with you.
Mijn paranimfen, Steffi en Mari. Steffi, mijn kamergenootje, dank je wel voor de gezellige
praatjes en voor je hulp. Mari, it was a pleasure to work with you on the neurocognition meta-
analysis paper. Thank you both for being my paranimf. Marijntje, dank je wel voor de
gezelligheid tijdens de periode waarin wij een kamer deelden. Ron, een laptop blijkt - in ieder
geval bij mij - geen aio-leven lang mee te gaan. Gelukkig zorgde jij er altijd voor dat ik bij
computerproblemen weer heel snel verder kon werken. Trees, bedankt voor het bijspringen bij
administratieve zaken. Truda, bedankt voor de ondersteuning bij de dataverwerking van de
EEG studie. Ook wil ik alle andere collega’s van Sociale Psychiatrie en Klinische Psychiatrie
bedanken voor de fijne samenwerking, hun hulp en voor alle gezelligheid. Mijn ‘nieuwe’
collega’s van GGzE, Lex, Ingrid en Jessica, dank voor jullie interesse in de vorderingen van
mijn proefschrift.
Dank ook aan mijn familie en vrienden voor jullie steun en belangstelling. Pap en mam,
bedankt voor jullie steun en voor het feit dat jullie me altijd gestimuleerd hebben. Pap,
bedankt voor de kritische vragen die je telkens stelde. Victor, dank je wel voor je luisterend
oor, het begrip en de steun die je me hebt geschonken. Bedankt ook voor de mooie foto op de
omslag van dit proefschrift en de bijbehorende herinneringen. Mogen er nog vele volgen.

137
Curriculum Vitae
Claudia Simons werd geboren op 7 september 1980 te Tegelen. Nadat zij in 1999 haar VWO
diploma behaalde aan College Den Hulster in Venlo, begon zij met de studie Psychologie aan
de Universiteit Maastricht waar zij in 2004 afstudeerde in de richtingen cognitieve
psychologie (onderwijspsychologie) en biologische psychologie (neuropsychologie), met
onderscheiding. Aansluitend werd ze aangesteld als onderzoeksmedewerker bij de
capaciteitsgroep Psychiatrie en Neuropsychologie van de Faculteit der Geneeskunde van de
Universiteit Maastricht. In februari 2009 begon zij als promovendus aan haar
promotieonderzoek naar neurocognitieve fenotypen bij psychose bij dezelfde
capaciteitsgroep, sectie Sociale Psychiatrie en Psychiatrische Epidemiologie. In 2008 verbleef
zij een paar maanden in Londen, waar zij als onderzoeker verbonden was aan het Institute of
Psychiatry, King’s College London. Momenteel is ze als onderzoeker werkzaam bij GGZ
Eindhoven en de Kempen en bij de Universiteit Maastricht.


List of publications
139
List of publications
International journals
Simons CJP, Tracy DK, Sanghera KK, O'Daly O, Gilleen J, Dominguez M-d-G,
Krabbendam L & Shergill SS. Functional Magnetic Resonance Imaging of Inner Speech in
Schizophrenia. Biological psychiatry 2010; 67: 232-237.
Simons CJP, Wichers M, Derom C, Thiery E, Myin-Germeys I, Krabbendam L & Van Os J.
Subtle gene-environment interactions driving paranoia in daily life. Genes, Brain and
Behavior 2009; 8: 5-12.
Simons CJP, Jacobs N, Derom C, Thiery E, Jolles J, van Os J & Krabbendam L. Cognition
as predictor of current and follow-up depressive symptoms in the general population. Acta
Psychiatrica Scandinavica 2009; 120: 45-52.
Simons CJP, Jacobs N, Jolles J, van Os J & Krabbendam L. Subclinical psychotic
experiences and cognitive functioning as a bivariate phenotype for genetic studies in the
general population. Schizophrenia Research 2007; 92: 24-31.
de Gracia Dominguez M, Viechtbauer W, Simons CJP, van Os J & Krabbendam L. Are
psychotic psychopathology and neurocognition orthogonal? A systematic review of their
associations. Psychological Bulletin 2009; 135: 157-171.
Galdos M, Simons C, Fernandez-Rivas A, Wichers M, Peralta C, Lataster T, Amer G, Myin-
Germeys I, Allardyce J, Gonzalez-Torres MA & van Os J. Affectively Salient Meaning in
Random Noise: A Task Sensitive to Psychosis Liability. Schizophrenia Bulletin: sbq029.
Wichers M, Peeters F, Geschwind N, Jacobs N, Simons CJP, Derom C, Thiery E, Delespaul
PH & van Os J. Unveiling patterns of affective responses in daily life may improve outcome
prediction in depression: A momentary assessment study. Journal of Affective Disorders; In
Press, Corrected Proof.

List of publications
140
Abstracts
Simons C, Tracy D, Krabbendam L & Shergill S. Functional magnetic resonante Imaging of
inner speech in schizophrenia. Schizophrenia Bulletin 2009; 35: 164.
Simons C, Sambeth A, van Os J, Krabbendam L & Riedel W. P300 and N100 components in
schizophrenia patients and their first-degree relatives. Schizophrenia Research 2008; 102:
109-109.
Simons C, Wichers M, Myin-Germeys I, Krabbendam L & Van Os J. Stressgerelateerde
fluctuaties in achterdocht en het COMT-Val158Met- en BDNF-Val66Met-genotype.
Tijdschrift voor de Psychiatrie 2008; 50: s86.
Simons C, Jacobs N, Jolles J, Van Os J & Krabbendam L. Subclinical psychotic experiences
and cognitive functioning as a bivariate phenotype for genetic studies in the general
population. Schizophrenia Bulletin 2007; 33: 246.
Simons CJP, Jacobs N, Jolles J, Van Os J & Krabbendam L. Subclinical psychotic
experiences and cognitive functioning as a bivariate phenotype for genetic studies in the
general population. Schizophrenia Research 2006; 81: 223.
Dominguez Barrera MdG, Viechtbauer W, Simons C, Van Os J & Krabbendam L. Are
psychotic psychopathology and neurocognition orthogonal? A systematic review of their
associations. Schizophrenia Bulletin 2009; 35: 286.
Dominguez MdG, Viechtbauer W, Simons CJP, van Os J and Krabbendam L. Are psychotic
psychopathology and neurocognition orthogonal? A systematic review of their associations.
Schizophrenia Research 2008; 102: 118-118.