Heavy Metal Load Of Soil, Water And Vegetables In Peri-Urban Delhi
13
Environmental Monitoring and Assessment (2006) 120: 79–91 DOI: 10.1007/s10661-005-9050-3 c Springer 2006 HEAVY METAL LOAD OF SOIL, WATER AND VEGETABLES IN PERI-URBAN DELHI S. SINGH ∗ and M. KUMAR Division of Environmental Sciences, Indian Agricultural Research Institute, New Delhi 110012, India ( ∗ author for correspondence, e-mail: [email protected]) (Received 18 February 2005; accepted 22 September 2005) Abstract. Peri-urban lands are often used for production of vegetables for better market accessibility and higher prices. But most of these lands are contaminated with heavy metals through industrial effluents, sewage and sludge, and vehicular emission. Vegetables grown in such lands, therefore, are likely to be contaminated with heavy metals and unsafe for consumption. Samples of vegetables i.e., spinach (Spinacia oleracea L.) and okra (Abelmoschus esculentus L.); soil and irrigation water were collected from 5 peri-urban sites of New Delhi to monitor their heavy metal loads. While heavy metal load of the soils were below the maximum allowable limit prescribed by the World Health Organization (WHO), it was higher in irrigation water and vegetable samples. The spinach and okra samples showed Zn, Pb and Cd levels higher than the WHO limits. The levels of Cu, however, were at their safe limits. Metal contamination was higher in spinach than in okra. Spatial variability of metal contamination was also observed in the study. Bio-availability of metals present in soil showed a positive relationship with their total content and organic matter content of soil but no relationship was observed with soil pH. Washing of vegetables with clean water was a very effective and easy way of decontaminating the metal pollution as it reduced the contamination by 75 to 100%. Keywords: bio-availability, contamination, heavy metals, okra, safe limits, spinach 1. Introduction Throughout the world, there is a long tradition of farming intensively within and at the edge of cities (Smit et al., 1996). However, most of these peri-urban lands (lands in the periphery of city) are contaminated with pollutants including heavy metals such as Cu, Zn, Pb, Cd, Ni, and Hg. These metals are contributed mainly through industrial effluents, sewage and sludge, vehicular emission, diesel generators and application of pesticides in agriculture. This loading of heavy metals often leads to degradation of soil health and contamination of food chain mainly through the vegetables grown on such soils (Jackson and Alloway, 1992; Rattan et al., 2002). When grown on contaminated soils toxic metals are accumulated in vegetables re- sulting in reduction of yields due to the inhibition of metabolic processes (Sanders et al., 1987). Heavy metals are cytotoxic, mutagenic and carcinogenic in nature and are posing serious threat to the urban population, which rely on vegetable
-
Upload
klunivrsity -
Category
Documents
-
view
4 -
download
0
Transcript of Heavy Metal Load Of Soil, Water And Vegetables In Peri-Urban Delhi
Environmental Monitoring and Assessment (2006) 120: 79–91
DOI: 10.1007/s10661-005-9050-3 c© Springer 2006
HEAVY METAL LOAD OF SOIL, WATER AND VEGETABLESIN PERI-URBAN DELHI
S. SINGH∗ and M. KUMARDivision of Environmental Sciences, Indian Agricultural Research Institute,
New Delhi 110012, India(∗author for correspondence, e-mail: [email protected])
(Received 18 February 2005; accepted 22 September 2005)
Abstract. Peri-urban lands are often used for production of vegetables for better market accessibility
and higher prices. But most of these lands are contaminated with heavy metals through industrial
effluents, sewage and sludge, and vehicular emission. Vegetables grown in such lands, therefore, are
likely to be contaminated with heavy metals and unsafe for consumption. Samples of vegetables
i.e., spinach (Spinacia oleracea L.) and okra (Abelmoschus esculentus L.); soil and irrigation water
were collected from 5 peri-urban sites of New Delhi to monitor their heavy metal loads. While
heavy metal load of the soils were below the maximum allowable limit prescribed by the World
Health Organization (WHO), it was higher in irrigation water and vegetable samples. The spinach
and okra samples showed Zn, Pb and Cd levels higher than the WHO limits. The levels of Cu,
however, were at their safe limits. Metal contamination was higher in spinach than in okra. Spatial
variability of metal contamination was also observed in the study. Bio-availability of metals present
in soil showed a positive relationship with their total content and organic matter content of soil
but no relationship was observed with soil pH. Washing of vegetables with clean water was a very
effective and easy way of decontaminating the metal pollution as it reduced the contamination by 75 to
100%.
Keywords: bio-availability, contamination, heavy metals, okra, safe limits, spinach
1. Introduction
Throughout the world, there is a long tradition of farming intensively within and atthe edge of cities (Smit et al., 1996). However, most of these peri-urban lands (landsin the periphery of city) are contaminated with pollutants including heavy metalssuch as Cu, Zn, Pb, Cd, Ni, and Hg. These metals are contributed mainly throughindustrial effluents, sewage and sludge, vehicular emission, diesel generators andapplication of pesticides in agriculture. This loading of heavy metals often leadsto degradation of soil health and contamination of food chain mainly through thevegetables grown on such soils (Jackson and Alloway, 1992; Rattan et al., 2002).When grown on contaminated soils toxic metals are accumulated in vegetables re-sulting in reduction of yields due to the inhibition of metabolic processes (Sanderset al., 1987). Heavy metals are cytotoxic, mutagenic and carcinogenic in natureand are posing serious threat to the urban population, which rely on vegetable
80 S. SINGH AND M. KUMAR
and foliage crops grown in peri-urban lands (Kumar et al., 1991; Fargasova,1994).
Peri-urban lands of New Delhi, the capital city of India, are intensively culti-vated with vegetable crops. The objectives of the present study were to (1) esti-mate the heavy metal loads of soil, irrigation water and vegetables of peri-urbanlands of New Delhi, (2) understand the mode of heavy metal contamination inthese areas and (3) formulate strategies for safe and sustainable cropping in suchareas.
2. Materials and Methods
2.1. SELECTION OF SAMPLING SITES AND VEGETABLES
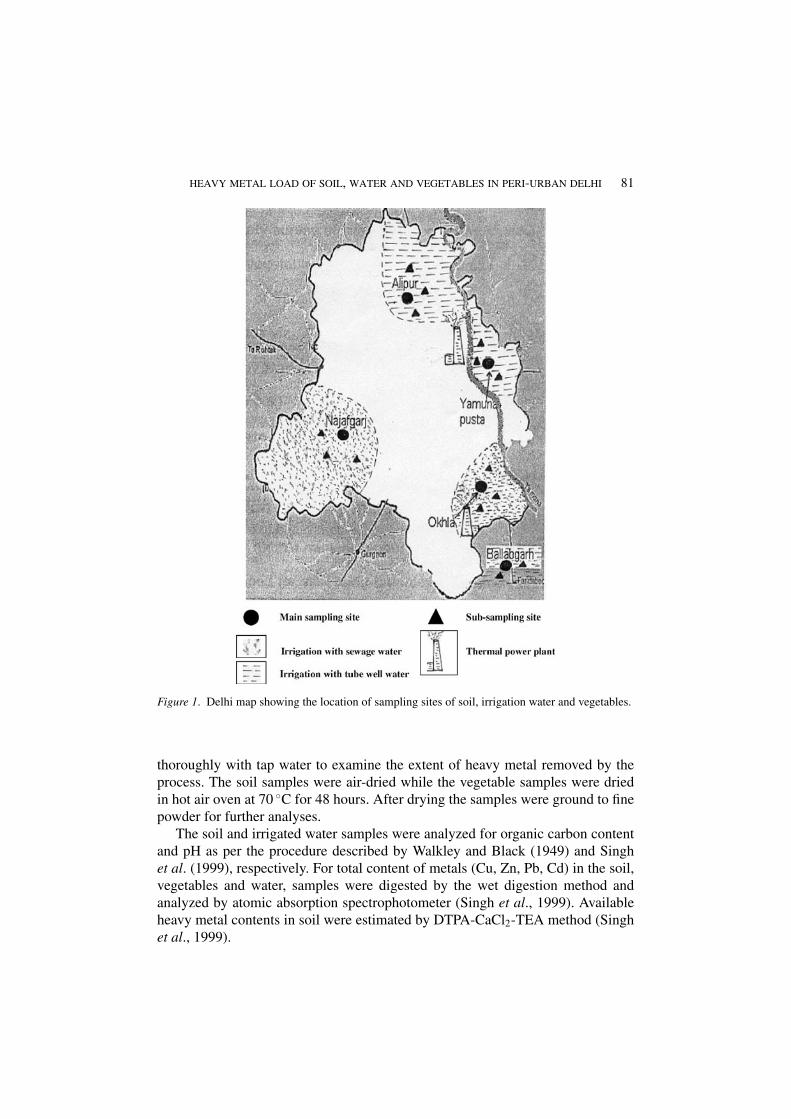
Based on the intensity and types of vegetable grown in the peri-urban Delhi, fivemajor vegetable growing sites viz., Yamunapusta, Okhla, Najafgarh, Alipur andBallabhgarh (Figure 1) were selected for assessing the heavy metal contaminationload of soil, irrigation water and vegetables in these sites. These five sites are locatedin four different directions of Delhi and are subjected to different sources of heavymetal contamination. Yamunapusta site is prone to contamination through aerialdeposition from a coal-based thermal power plant operating in this area. At Okhlasite thermal power plant and sewage water are the major sources of contamination.At Najafgarh the main source of contamination is sewage water while at Ballabhgarhthe main source is industrial emission. At Alipur sources of heavy metals are mainlyagro-chemicals (micro-nutrients and fungicides) as there are almost no industriesin this area.
Two important vegetables namely okra (Abesmoschus esculentus L.) andspinach (Spinacia oleracea L.), grown extensively in these sites were selectedfor this study. Four heavy metals i.e., copper (Cu), zinc (Zn), lead (Pb) and cad-mium (Cd) were identified for assessing their load in soil, water and vegetables.These elements were selected on the basis of their occurrence and severity in thecity.
2.2. COLLECTION AND ANALYSES OF SOIL, WATER AND VENGETABLE
SAMPLES
Surface soil (0–15 cm), irrigation water and vegetable (okra fruits and spinachleaves) samples were collected from the farmers’ fields of selected sites during rainyseason (August to September) of 2003. In order to represent the whole vegetablegrowing areas of the selected sites, three sub-sites within each site were marked forsoil, water and vegetable sampling. Further, three samples were collected from eachsub-site. The samples of soil, water and vegetables were processed immediatelyafter collection for chemical analyses. A part of the vegetable samples were washed
HEAVY METAL LOAD OF SOIL, WATER AND VEGETABLES IN PERI-URBAN DELHI 81
Figure 1. Delhi map showing the location of sampling sites of soil, irrigation water and vegetables.
thoroughly with tap water to examine the extent of heavy metal removed by theprocess. The soil samples were air-dried while the vegetable samples were driedin hot air oven at 70 ◦C for 48 hours. After drying the samples were ground to finepowder for further analyses.
The soil and irrigated water samples were analyzed for organic carbon contentand pH as per the procedure described by Walkley and Black (1949) and Singhet al. (1999), respectively. For total content of metals (Cu, Zn, Pb, Cd) in the soil,vegetables and water, samples were digested by the wet digestion method andanalyzed by atomic absorption spectrophotometer (Singh et al., 1999). Availableheavy metal contents in soil were estimated by DTPA-CaCl2-TEA method (Singhet al., 1999).
82 S. SINGH AND M. KUMAR
3. Results and Discussion
3.1. PHYSICO-CHEMICAL PROPERTIES AND HEAVY METAL CONTENTS OF SOIL
AND WATER OF THE PERI-URBAN DELHI
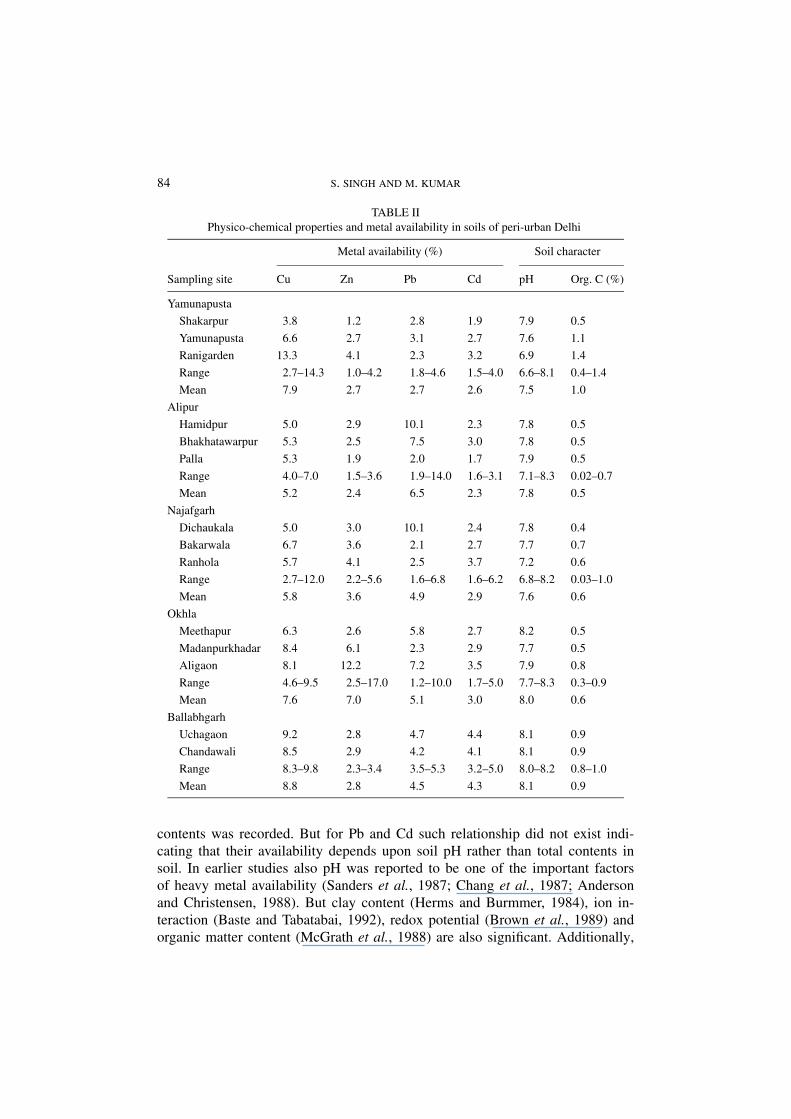
The soils of the five sites were slightly alkaline with pH 7.5 to 8.2 (Table II).Organic carbon content ranged from 0.5 to 1%. At Yamunapusta, Alipur, Najafgarh,Okhla and Ballabhgarh organic carbon content of soil were 1.0, 0.5, 0.6, 0.6 and0.9%, respectively (Table II). Irrigation water of these sites had pH 7.7 to 8.5(Table III).
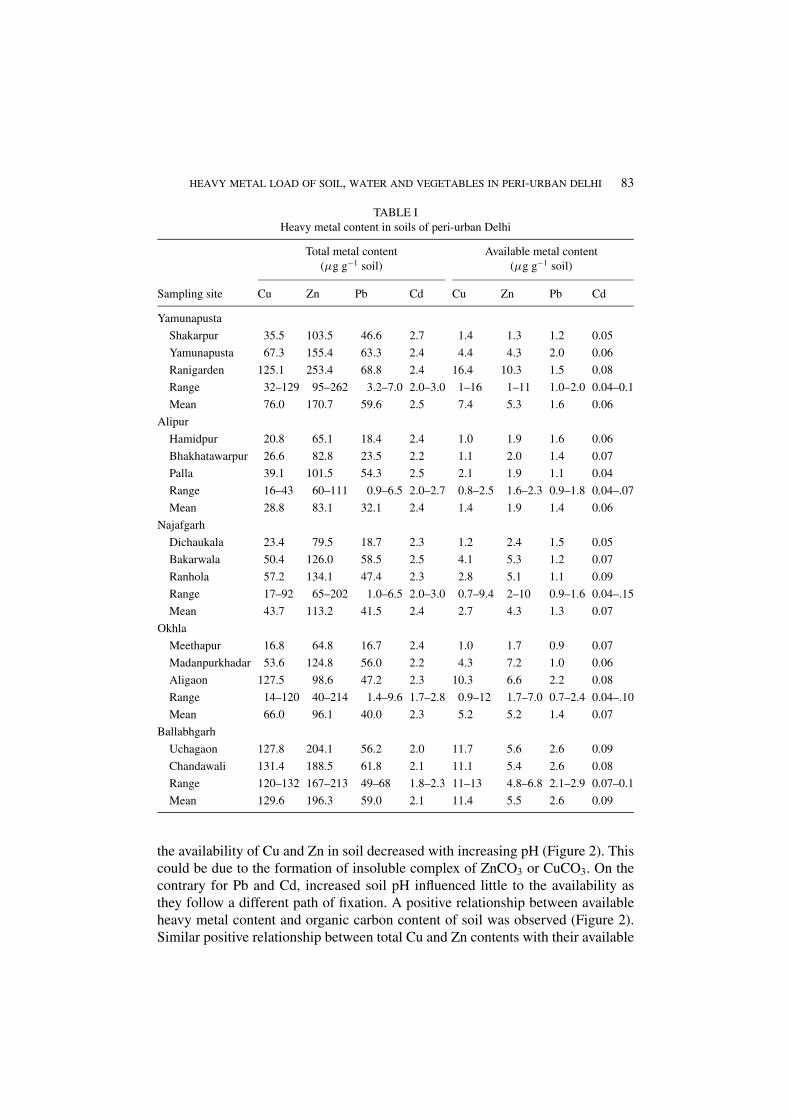
Among the heavy metals Zn content was the highest (83.1–196.3 μg g−1 soil)followed by Cu (28.8–129.6 μg g−1), Pb (32.1–59.6 μg g−1) and lowest with Cd(2.1–2.5 μg g−1) at all the five peri-urban sites (Table I). Soil samples collectedfrom the sites showed marked variation in the level of heavy metal contamination(Table I). Ballabhgarh soils had the highest level of Cu (129.6 μg g−1 soil) and Zn(196.3 μg g−1) but lowest level of Cd contamination (2.1 μg g−1). Yamunapustasoils registered the highest levels of Pb (59.6 μg g−1). The differences in heavymetal level of soil was due to use of different quantity and quality of sewage andsludge, level and type of industrialization near the sampling sites, proximity offield from main road and highways, presence of thermal power plants, and use ofdifferent types of agrochemicals containing heavy metals (Rajurkar and Kulkarni,1997; Rattan et al., 2002; Marshall et al., 2003). Higher levels of metal contam-ination in soil were due to thermal power plants near Yamunapusta and Okhla,and use of industrial effluents and sewage and sludge in crop fields at Yamuna-pusta, Okhla and Najafgarhlead. Rattan et al. (2002) reported that at Najafgarhsite sewage effluent is used for irrigation for the last two decades and the DTPA-extractable Zn, Cu, Fe and Ni increased by 253, 202, 337 and 157%, respectively ineffluent irrigated soil as compared to that of tube well irrigated soils. Low level ofcontamination at Alipur site was due to its semi-rural background with least indus-trialization. However, Cd level in Alipur soil was at par to other sites due to appli-cation of high dose of phosphetic fertilizers and metal based pesticides in vegetablecrops.
Contrary to the marked differences in total metal content of soils among thedifferent sites, small differences were observed in available metal contents in soil.The available Cu, Zn, Pb and Cd contents ranged between 1.4–11.4, 1.9 –5.5, 1.3–2.6 and 0.06–0.09 μg g−1 soil, respectively at all the sites (Table I). Thus only5.2–8.8, 2.4–7, 2.7–6.5 and 2.3–4.3% of total Cu, Zn, Pb and Cd contents of soil,respectively, were available (Table II). Availability of heavy metal is decided bythe various physico-chemical properties of soil. Organic matter in soil may chelatethese metals and reduce their availability. Cationic metals such as Zn+2, Cu+1,Cu+2, Pb+2, Cd+2 may exist as adsorbed ion on clay-humus complex. Several stud-ies have reported strong relationships between soil pH and organic carbon withmetal absorption in soil (Adriano, 1986). In the present study it was observed that
HEAVY METAL LOAD OF SOIL, WATER AND VEGETABLES IN PERI-URBAN DELHI 83
TABLE I
Heavy metal content in soils of peri-urban Delhi
Total metal content Available metal content
(μg g−1 soil) (μg g−1 soil)
Sampling site Cu Zn Pb Cd Cu Zn Pb Cd
Yamunapusta
Shakarpur 35.5 103.5 46.6 2.7 1.4 1.3 1.2 0.05
Yamunapusta 67.3 155.4 63.3 2.4 4.4 4.3 2.0 0.06
Ranigarden 125.1 253.4 68.8 2.4 16.4 10.3 1.5 0.08
Range 32–129 95–262 3.2–7.0 2.0–3.0 1–16 1–11 1.0–2.0 0.04–0.1
Mean 76.0 170.7 59.6 2.5 7.4 5.3 1.6 0.06
Alipur
Hamidpur 20.8 65.1 18.4 2.4 1.0 1.9 1.6 0.06
Bhakhatawarpur 26.6 82.8 23.5 2.2 1.1 2.0 1.4 0.07
Palla 39.1 101.5 54.3 2.5 2.1 1.9 1.1 0.04
Range 16–43 60–111 0.9–6.5 2.0–2.7 0.8–2.5 1.6–2.3 0.9–1.8 0.04–.07
Mean 28.8 83.1 32.1 2.4 1.4 1.9 1.4 0.06
Najafgarh
Dichaukala 23.4 79.5 18.7 2.3 1.2 2.4 1.5 0.05
Bakarwala 50.4 126.0 58.5 2.5 4.1 5.3 1.2 0.07
Ranhola 57.2 134.1 47.4 2.3 2.8 5.1 1.1 0.09
Range 17–92 65–202 1.0–6.5 2.0–3.0 0.7–9.4 2–10 0.9–1.6 0.04–.15
Mean 43.7 113.2 41.5 2.4 2.7 4.3 1.3 0.07
Okhla
Meethapur 16.8 64.8 16.7 2.4 1.0 1.7 0.9 0.07
Madanpurkhadar 53.6 124.8 56.0 2.2 4.3 7.2 1.0 0.06
Aligaon 127.5 98.6 47.2 2.3 10.3 6.6 2.2 0.08
Range 14–120 40–214 1.4–9.6 1.7–2.8 0.9–12 1.7–7.0 0.7–2.4 0.04–.10
Mean 66.0 96.1 40.0 2.3 5.2 5.2 1.4 0.07
Ballabhgarh
Uchagaon 127.8 204.1 56.2 2.0 11.7 5.6 2.6 0.09
Chandawali 131.4 188.5 61.8 2.1 11.1 5.4 2.6 0.08
Range 120–132 167–213 49–68 1.8–2.3 11–13 4.8–6.8 2.1–2.9 0.07–0.1
Mean 129.6 196.3 59.0 2.1 11.4 5.5 2.6 0.09
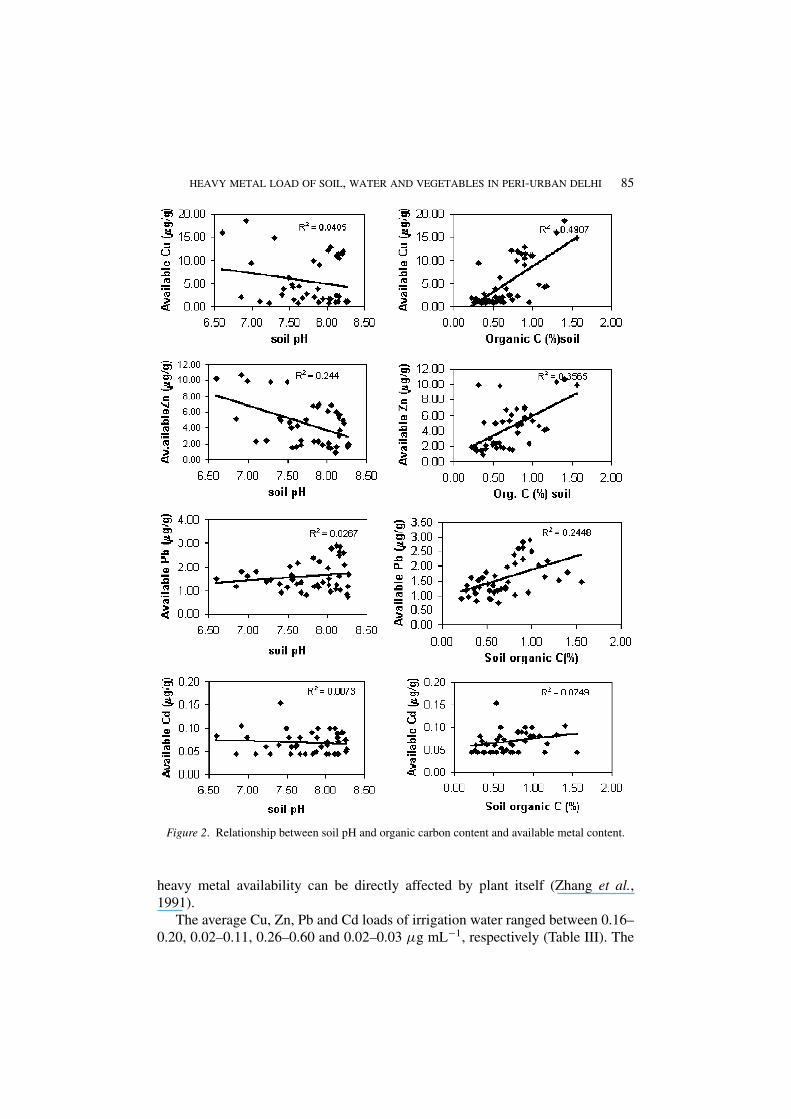
the availability of Cu and Zn in soil decreased with increasing pH (Figure 2). Thiscould be due to the formation of insoluble complex of ZnCO3 or CuCO3. On thecontrary for Pb and Cd, increased soil pH influenced little to the availability asthey follow a different path of fixation. A positive relationship between availableheavy metal content and organic carbon content of soil was observed (Figure 2).Similar positive relationship between total Cu and Zn contents with their available
84 S. SINGH AND M. KUMAR
TABLE II
Physico-chemical properties and metal availability in soils of peri-urban Delhi
Metal availability (%) Soil character
Sampling site Cu Zn Pb Cd pH Org. C (%)
Yamunapusta
Shakarpur 3.8 1.2 2.8 1.9 7.9 0.5
Yamunapusta 6.6 2.7 3.1 2.7 7.6 1.1
Ranigarden 13.3 4.1 2.3 3.2 6.9 1.4
Range 2.7–14.3 1.0–4.2 1.8–4.6 1.5–4.0 6.6–8.1 0.4–1.4
Mean 7.9 2.7 2.7 2.6 7.5 1.0
Alipur
Hamidpur 5.0 2.9 10.1 2.3 7.8 0.5
Bhakhatawarpur 5.3 2.5 7.5 3.0 7.8 0.5
Palla 5.3 1.9 2.0 1.7 7.9 0.5
Range 4.0–7.0 1.5–3.6 1.9–14.0 1.6–3.1 7.1–8.3 0.02–0.7
Mean 5.2 2.4 6.5 2.3 7.8 0.5
Najafgarh
Dichaukala 5.0 3.0 10.1 2.4 7.8 0.4
Bakarwala 6.7 3.6 2.1 2.7 7.7 0.7
Ranhola 5.7 4.1 2.5 3.7 7.2 0.6
Range 2.7–12.0 2.2–5.6 1.6–6.8 1.6–6.2 6.8–8.2 0.03–1.0
Mean 5.8 3.6 4.9 2.9 7.6 0.6
Okhla
Meethapur 6.3 2.6 5.8 2.7 8.2 0.5
Madanpurkhadar 8.4 6.1 2.3 2.9 7.7 0.5
Aligaon 8.1 12.2 7.2 3.5 7.9 0.8
Range 4.6–9.5 2.5–17.0 1.2–10.0 1.7–5.0 7.7–8.3 0.3–0.9
Mean 7.6 7.0 5.1 3.0 8.0 0.6
Ballabhgarh
Uchagaon 9.2 2.8 4.7 4.4 8.1 0.9
Chandawali 8.5 2.9 4.2 4.1 8.1 0.9
Range 8.3–9.8 2.3–3.4 3.5–5.3 3.2–5.0 8.0–8.2 0.8–1.0
Mean 8.8 2.8 4.5 4.3 8.1 0.9
contents was recorded. But for Pb and Cd such relationship did not exist indi-cating that their availability depends upon soil pH rather than total contents insoil. In earlier studies also pH was reported to be one of the important factorsof heavy metal availability (Sanders et al., 1987; Chang et al., 1987; Andersonand Christensen, 1988). But clay content (Herms and Burmmer, 1984), ion in-teraction (Baste and Tabatabai, 1992), redox potential (Brown et al., 1989) andorganic matter content (McGrath et al., 1988) are also significant. Additionally,
HEAVY METAL LOAD OF SOIL, WATER AND VEGETABLES IN PERI-URBAN DELHI 85
Figure 2. Relationship between soil pH and organic carbon content and available metal content.
heavy metal availability can be directly affected by plant itself (Zhang et al.,1991).
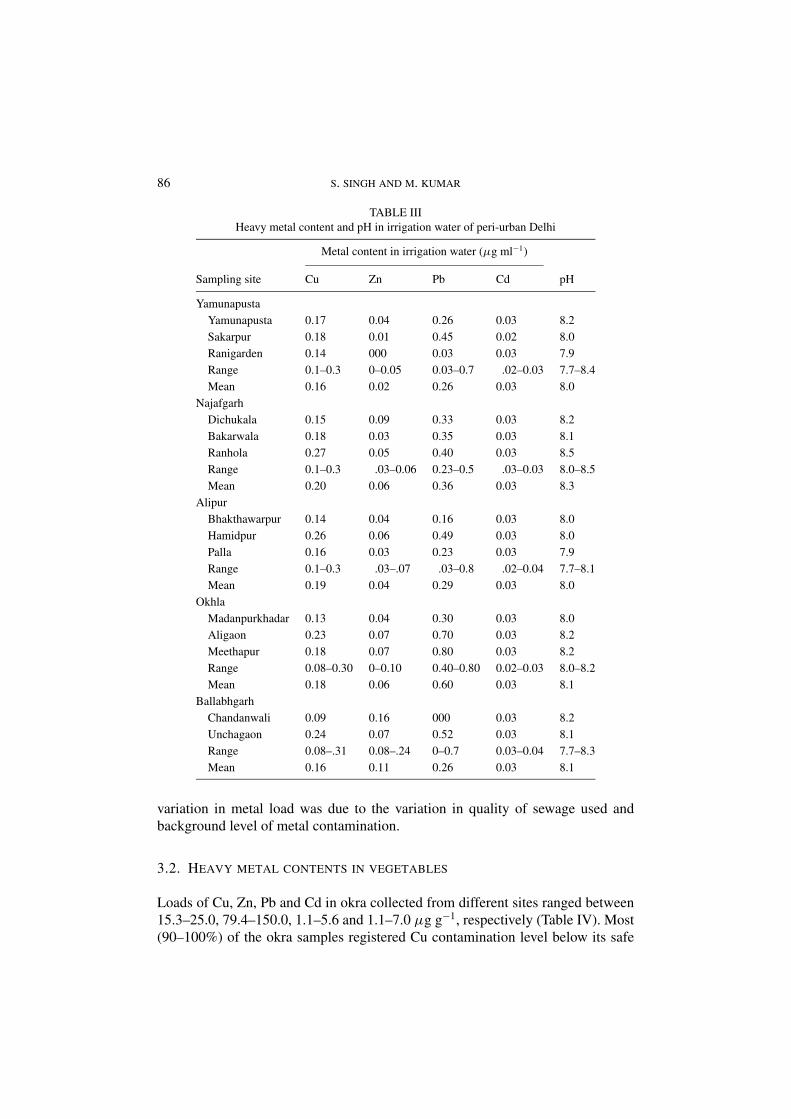
The average Cu, Zn, Pb and Cd loads of irrigation water ranged between 0.16–0.20, 0.02–0.11, 0.26–0.60 and 0.02–0.03 μg mL−1, respectively (Table III). The
86 S. SINGH AND M. KUMAR
TABLE III
Heavy metal content and pH in irrigation water of peri-urban Delhi
Metal content in irrigation water (μg ml−1)
Sampling site Cu Zn Pb Cd pH
Yamunapusta
Yamunapusta 0.17 0.04 0.26 0.03 8.2
Sakarpur 0.18 0.01 0.45 0.02 8.0
Ranigarden 0.14 000 0.03 0.03 7.9
Range 0.1–0.3 0–0.05 0.03–0.7 .02–0.03 7.7–8.4
Mean 0.16 0.02 0.26 0.03 8.0
Najafgarh
Dichukala 0.15 0.09 0.33 0.03 8.2
Bakarwala 0.18 0.03 0.35 0.03 8.1
Ranhola 0.27 0.05 0.40 0.03 8.5
Range 0.1–0.3 .03–0.06 0.23–0.5 .03–0.03 8.0–8.5
Mean 0.20 0.06 0.36 0.03 8.3
Alipur
Bhakthawarpur 0.14 0.04 0.16 0.03 8.0
Hamidpur 0.26 0.06 0.49 0.03 8.0
Palla 0.16 0.03 0.23 0.03 7.9
Range 0.1–0.3 .03–.07 .03–0.8 .02–0.04 7.7–8.1
Mean 0.19 0.04 0.29 0.03 8.0
Okhla
Madanpurkhadar 0.13 0.04 0.30 0.03 8.0
Aligaon 0.23 0.07 0.70 0.03 8.2
Meethapur 0.18 0.07 0.80 0.03 8.2
Range 0.08–0.30 0–0.10 0.40–0.80 0.02–0.03 8.0–8.2
Mean 0.18 0.06 0.60 0.03 8.1
Ballabhgarh
Chandanwali 0.09 0.16 000 0.03 8.2
Unchagaon 0.24 0.07 0.52 0.03 8.1
Range 0.08–.31 0.08–.24 0–0.7 0.03–0.04 7.7–8.3
Mean 0.16 0.11 0.26 0.03 8.1
variation in metal load was due to the variation in quality of sewage used andbackground level of metal contamination.
3.2. HEAVY METAL CONTENTS IN VEGETABLES
Loads of Cu, Zn, Pb and Cd in okra collected from different sites ranged between15.3–25.0, 79.4–150.0, 1.1–5.6 and 1.1–7.0 μg g−1, respectively (Table IV). Most(90–100%) of the okra samples registered Cu contamination level below its safe
HEAVY METAL LOAD OF SOIL, WATER AND VEGETABLES IN PERI-URBAN DELHI 87
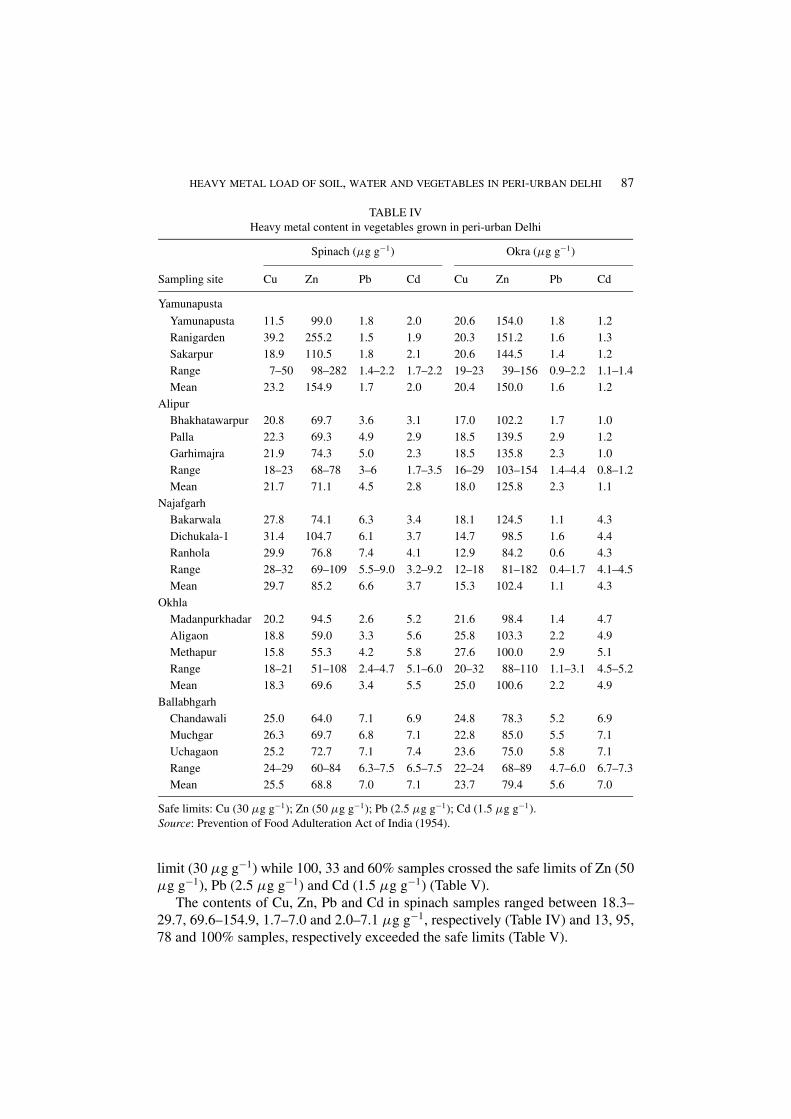
TABLE IV
Heavy metal content in vegetables grown in peri-urban Delhi
Spinach (μg g−1) Okra (μg g−1)
Sampling site Cu Zn Pb Cd Cu Zn Pb Cd
Yamunapusta
Yamunapusta 11.5 99.0 1.8 2.0 20.6 154.0 1.8 1.2
Ranigarden 39.2 255.2 1.5 1.9 20.3 151.2 1.6 1.3
Sakarpur 18.9 110.5 1.8 2.1 20.6 144.5 1.4 1.2
Range 7–50 98–282 1.4–2.2 1.7–2.2 19–23 39–156 0.9–2.2 1.1–1.4
Mean 23.2 154.9 1.7 2.0 20.4 150.0 1.6 1.2
Alipur
Bhakhatawarpur 20.8 69.7 3.6 3.1 17.0 102.2 1.7 1.0
Palla 22.3 69.3 4.9 2.9 18.5 139.5 2.9 1.2
Garhimajra 21.9 74.3 5.0 2.3 18.5 135.8 2.3 1.0
Range 18–23 68–78 3–6 1.7–3.5 16–29 103–154 1.4–4.4 0.8–1.2
Mean 21.7 71.1 4.5 2.8 18.0 125.8 2.3 1.1
Najafgarh
Bakarwala 27.8 74.1 6.3 3.4 18.1 124.5 1.1 4.3
Dichukala-1 31.4 104.7 6.1 3.7 14.7 98.5 1.6 4.4
Ranhola 29.9 76.8 7.4 4.1 12.9 84.2 0.6 4.3
Range 28–32 69–109 5.5–9.0 3.2–9.2 12–18 81–182 0.4–1.7 4.1–4.5
Mean 29.7 85.2 6.6 3.7 15.3 102.4 1.1 4.3
Okhla
Madanpurkhadar 20.2 94.5 2.6 5.2 21.6 98.4 1.4 4.7
Aligaon 18.8 59.0 3.3 5.6 25.8 103.3 2.2 4.9
Methapur 15.8 55.3 4.2 5.8 27.6 100.0 2.9 5.1
Range 18–21 51–108 2.4–4.7 5.1–6.0 20–32 88–110 1.1–3.1 4.5–5.2
Mean 18.3 69.6 3.4 5.5 25.0 100.6 2.2 4.9
Ballabhgarh
Chandawali 25.0 64.0 7.1 6.9 24.8 78.3 5.2 6.9
Muchgar 26.3 69.7 6.8 7.1 22.8 85.0 5.5 7.1
Uchagaon 25.2 72.7 7.1 7.4 23.6 75.0 5.8 7.1
Range 24–29 60–84 6.3–7.5 6.5–7.5 22–24 68–89 4.7–6.0 6.7–7.3
Mean 25.5 68.8 7.0 7.1 23.7 79.4 5.6 7.0
Safe limits: Cu (30 μg g−1); Zn (50 μg g−1); Pb (2.5 μg g−1); Cd (1.5 μg g−1).
Source: Prevention of Food Adulteration Act of India (1954).
limit (30 μg g−1) while 100, 33 and 60% samples crossed the safe limits of Zn (50μg g−1), Pb (2.5 μg g−1) and Cd (1.5 μg g−1) (Table V).
The contents of Cu, Zn, Pb and Cd in spinach samples ranged between 18.3–29.7, 69.6–154.9, 1.7–7.0 and 2.0–7.1 μg g−1, respectively (Table IV) and 13, 95,78 and 100% samples, respectively exceeded the safe limits (Table V).
88 S. SINGH AND M. KUMAR
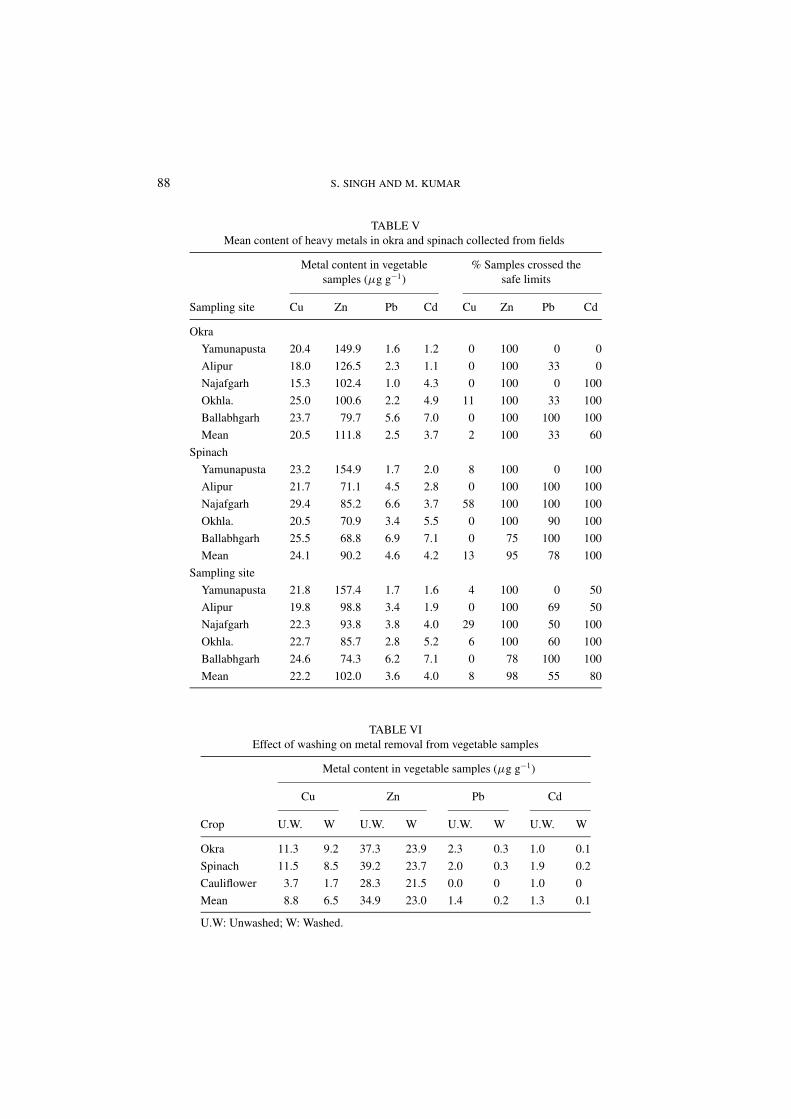
TABLE V
Mean content of heavy metals in okra and spinach collected from fields
Metal content in vegetable % Samples crossed the
samples (μg g−1) safe limits
Sampling site Cu Zn Pb Cd Cu Zn Pb Cd
Okra
Yamunapusta 20.4 149.9 1.6 1.2 0 100 0 0
Alipur 18.0 126.5 2.3 1.1 0 100 33 0
Najafgarh 15.3 102.4 1.0 4.3 0 100 0 100
Okhla. 25.0 100.6 2.2 4.9 11 100 33 100
Ballabhgarh 23.7 79.7 5.6 7.0 0 100 100 100
Mean 20.5 111.8 2.5 3.7 2 100 33 60
Spinach
Yamunapusta 23.2 154.9 1.7 2.0 8 100 0 100
Alipur 21.7 71.1 4.5 2.8 0 100 100 100
Najafgarh 29.4 85.2 6.6 3.7 58 100 100 100
Okhla. 20.5 70.9 3.4 5.5 0 100 90 100
Ballabhgarh 25.5 68.8 6.9 7.1 0 75 100 100
Mean 24.1 90.2 4.6 4.2 13 95 78 100
Sampling site
Yamunapusta 21.8 157.4 1.7 1.6 4 100 0 50
Alipur 19.8 98.8 3.4 1.9 0 100 69 50
Najafgarh 22.3 93.8 3.8 4.0 29 100 50 100
Okhla. 22.7 85.7 2.8 5.2 6 100 60 100
Ballabhgarh 24.6 74.3 6.2 7.1 0 78 100 100
Mean 22.2 102.0 3.6 4.0 8 98 55 80
TABLE VI
Effect of washing on metal removal from vegetable samples
Metal content in vegetable samples (μg g−1)
Cu Zn Pb Cd
Crop U.W. W U.W. W U.W. W U.W. W
Okra 11.3 9.2 37.3 23.9 2.3 0.3 1.0 0.1
Spinach 11.5 8.5 39.2 23.7 2.0 0.3 1.9 0.2
Cauliflower 3.7 1.7 28.3 21.5 0.0 0 1.0 0
Mean 8.8 6.5 34.9 23.0 1.4 0.2 1.3 0.1
U.W: Unwashed; W: Washed.

HEAVY METAL LOAD OF SOIL, WATER AND VEGETABLES IN PERI-URBAN DELHI 89
Figure 3. Relationship between total and available metal content in soil and okra and palak (spinach).
Spatial difference in heavy metal contamination load of okra as well as spinachwas due to different levels of heavy metal contamination of soil, water and airthrough various polluting sources prevailed in these areas (Tables I and III). Apartfrom heavy metal content in soil, the pysico–chemical properties of soil also affectthe degree of contamination of vegetable crop. The cultural practices adopted by
90 S. SINGH AND M. KUMAR
farmers at different sites, like use of industrial and municipal effluents for irrigation,application of sewage-sludge and application of agro- chemicals might have causeddifferences in the level of contamination.
The results showed higher level of Pb contamination in spinach (4.6 μg g−1)compared to okra (2.5 μg g−1) (Table V). Several workers have reported higherlevel of metal contamination in foliage leafy vegetables than in non-foliage crops(Bingham et al., 1979). The difference in level of heavy metal contamination be-tween okra and spinach was due to their morpho-physiological differences in termsof heavy metal uptake, exclusion, accumulation, foliage deposition and retentionefficiency (Carlton Smith and Davis, 1983).
When the vegetable samples were washed 2–3 times with clean tap water, thelevel of heavy metals reduced drastically (Table VI). Removal of contamination loadby washing was greater for Pb and Cd (75–100%) than those for Cu and Zn (27–55%). This indicated that the Pb and Cd contamination of vegetables was mainlythrough foliar deposition, while Cu and Zn contamination was mainly throughuptake from soil. Moreover, a higher positive correlation between available metalcontents in soil and their corresponding contents in okra as compared to that ofspinach (Figure 3) indicated that okra took up more metals from soil. Spinachbeing a leafy vegetable with large exposed leaf area than okra fruits, might haveled to higher deposition of heavy metal on its foliage especially.
4. Conclusion
The soil, irrigation water and okra and spinach vegetables samples collected fromfive peri-urban sites of New Delhi showed substantial level of contamination withheavy metal such as Cu, Zn, Pb and Cd. Most of the soil and irrigated water samplesshowed higher levels of Pb and Cd loads as compared to Cu and Zn loads. Most ofthe vegetable samples crossed the safe limits of Zn, Pb and Cd while Cu contentwas below the safe limit. The level of contamination was higher in spinach thanin okra. Thermal power plants, industrial effluent, sewage water and pesticidescontributed the metal contamination of soil and vegetables. Thus peri-urban landsmay be utilized with caution for growing vegetables. These lands may be used forgrowing ornamental and timber plants rather than leafy, root and tuber vegetables tominimize the transfer of heavy metals from soil to human beings through food chain.
References
Adriano, D. C.: 1986, Trace Elements in the Terrestrial Environment, Springer-Verrlag Inc.,
New York, pp. 1–533.
Anderson, P. R. and Christensen, T. H.: 1998, ‘Distribution of coeffieceant of Cd, Co, Ni and Zn in
soils’, Journal of Soil Science 39, 15–22.
HEAVY METAL LOAD OF SOIL, WATER AND VEGETABLES IN PERI-URBAN DELHI 91
Basta, N. T. and Tabatabai, M. A.: 1992, ‘Effect of cropping system on adsorption of metals by soils:
II Effect of pH’, Soil Science 151, 195–204.
Bingham, F. T., Page, A. L., Mitchell, G. A. and Strong, J. E.: 1979, ‘Effect of liming and acid soil
amended with sewage sludge enriched with Cd, Cu, Ni, and Zn on yield and Cd content of Wheat
grain’, J. Environ. Qual. 8, 202–210.
Brown, P. H., Dunemann, L., Schulz, R. and Marschner, H.: 1989, ‘Influence of redox potential and
plant species on the uptake of nickel and cadmium from soils’, Zeitschrift fur pflanzenerrmahrungund Bodenkunde 152, 85–91.
Carlton-Smith, C. H. and Devis, R. D.: 1983, ‘Comparative uptake of heavy metals by forage
crops grown on sludge-treated soils’, Proc. Int. Conf. Heavy Metals in the Environment, Vol. 1,
Heidelberg, CEP consultants Ltd., Edinburgh, U.K., 3933.
Chang, A. C., Page, A. L. and Warneke, J. E.: 1987, ‘Long-term Sludge application on Cadmium and
Zinc accumulation in Swiss Chard and Radish’, J. Environmental Quality 16, 217–221.
Fargasova, A.: 1994, ‘Effect of Pb, Cd, Hg, As and Cr on germination and root growth of Sinapsis
alba seeds’, J. Environ. Qual. 26, 639–646.
Herms, U. and Brummer, G.: 1984, ‘Einflubgroben der Schwermetalloslichkeit und – bindung in
Boden,’ Zeitscfurift for pflanzenerahrung und Bodenkunde 147, 400–424.
Jackson, A. P. and Alloway, B. J.: 1992, ‘The transfer of cadmium from agricultural soils to human
food chain’, in: D. C. Adriano (ed), Biogeochemistry of Trace Metals, Lewis Publ., Boca Raton,
FL, pp. 109–158.
Kumar, G., Singh, R. P. and Sushila: 1991, ‘Nitrate assimilation and biomass production in Sesamum
indicum L. seedlings in a lead enriched environment’, Water Air and Soil Pollution 66, 163–171.
Marshall, F., Agrawal, R., Lintell, D., Bhupal, D. S., Singh, R. B., Mukherjee, P., Sen, C., Poole,
N., Agrawal, M. and Singh, S. D.: 2003, ‘Heavy Metal Contamination of Vegetables in Delhi’,
Executive Summary of Technical Report.
McGrath, S. P., Sanders, J. R. and Shalaby, M. H.: 1988, ‘The effect of soil organic matter levels
on soil solution concentration extractabilities of manganese, Zinc and Copper’, Geoderma 42,
177–188.
Rajurkar, N. S. and Kulkarni, J. D.: 1997, ‘Indian J. Environ. Hlth. 39, 326–329.
Rattan, R. K., Datta, S. P., Chandra, S. and Saharaan, N.: 2002, ‘Heavy metals in Environments-Indian
Scenario’, Fert. News 47, 21–26 and 29–40.
Sanders, J. R., McGarth, S. P. and Adams, T.: 1987, ‘Zinc, Cu and Ni concentration in soil extracts
and crops grown on four soils treated with metal loaded sewage sludges’, Environ. Pollut. 44,
193–210.
Singh, D., Chhonkar, P. K. and Pandey, R. N.: 1999, ‘Soil, plant and water analysis: A methods
Manual’, Indian Agricultural Research Institute, New Delhi.
Smit, J.: 1996, ‘Urban Agriculture, Progress and Prospect 1975–2005. Report 18, Cities Feeding
People Series, March 1996, IDRC, Canada.
Walkely, A. C. and Black, T. A.: 1949, ‘Estimation of soil organic carbon by the chromic and titration
method’, Soil Sci. 47, 29–38.
Zhang, F., Romheld, V. and Marschner, H.: 1991, ‘Release of zinc mobilizing root exudates in different
plant species as affected by Zn nutritional status’, Journal of Plant Nutrition 14, 675–686.