Heat Transfer Processes During Intermediate and Large ...
164
NUREG/IA-0002 Intemational Agreement Report Heat Transfer Processes During Intermediate and Large Break Loss-of-Coolant Accidents (LOCAs) Prepared by 1. Vojtek Reactor Safety Corporation Gesellschaft fuer Reaktorsicherheit Porschungsgefaende, 8046 Garching, The Federal Republic of Germany Office of Nuclear Regulatory Research U.S. Nuclear Regulatory Commission Washington, D.C. 20555 September 1986 Prepared as part of The Agreement on Research Participation and Technical Exchange * under the International Thermal- Hydraulic Code Assessment and Application Program (ICAP) Published by U.S. Nuclear Regulatory Commission
-
Upload
khangminh22 -
Category
Documents
-
view
1 -
download
0
Transcript of Heat Transfer Processes During Intermediate and Large ...

NUREG/IA-0002
IntemationalAgreement Report
Heat Transfer Processes DuringIntermediate and Large BreakLoss-of-Coolant Accidents (LOCAs)
Prepared by1. Vojtek
Reactor Safety CorporationGesellschaft fuer ReaktorsicherheitPorschungsgefaende, 8046 Garching,The Federal Republic of Germany
Office of Nuclear Regulatory ResearchU.S. Nuclear Regulatory CommissionWashington, D.C. 20555
September 1986
Prepared as part ofThe Agreement on Research Participation and Technical Exchange
* under the International Thermal- Hydraulic Code Assessmentand Application Program (ICAP)
Published byU.S. Nuclear Regulatory Commission

NOTICE
This report was prepared under an international cooperativeagreement for the exchange of technical information. Neitherthe United States Government nor any agency thereof, or any oftheir employees, makes any warranty, expressed or implied, orassumes any legal liability or responsibility for any third party'suse, or the results of such use, of any information, apparatus pro-duct or process disclosed in this report, or represents that its useby such third party would not infringe privately owned rights.
Available from
Superintendent of DocumentsU.S. Government Printing Office
P.O. Box 37082Washington, D.C. 20013-7082
and
National Technical Information ServiceSpringfield, VA 22161

NUREG/IA-0002
InternationalAgreement Report
Heat Transfer Processes DuringIntermediate and.-Large BreakLoss-of-Coolant Accidents (LOCAs)
Prepared by1. Voitek
Reactor Safety CorporationGesellschaft fuer ReaktorsicherheitPorschungsgelaende, 8046 Garching,The Federal Republic of Germany
Office of Nuclear Regulatory ResearchU.S. Nuclear Regulatory CommissionWashington, D.C. 20555
September 1986
Prepared as pert ofThe Agrement on Research Participation and Technical Exchangeunder the International Thermal-Hydraulic Coda Assessmentend Application Program 4ICAP)
Published byU.S. Nuclear Regulatory Commission
Translated by: Fischer Translation Service1928 Catoctin TerraceSilver Spring, MD 20906

NOTICE
This report documents work performed under the sponsorship of the Kraftwerk
Union in the Federal Republic of Germany. The information in this report has
been provided to the USNRC under the terms of an information exchange
agreement between the United States and the Federal Republic of Germany
(Technical Exchange and Cooperation Arrangement Between the United States
Nuclear Regulatory Commission and the Bundesminister Fuer Forschung und
Technologie of the Federal Republic of Germany in the field of reactor safety
research and development, April 30, 1981). The Kraftwerk Union has consented
to the publication of this report as a USNRC document in order that it may
receive the widest possible circulation among the reactor safety community.
Neither the United States Government nor the Kraftwerk Union or any agency
thereof, or any of their employees, makes any warranty, expressed or implied,
or assumes any legal liability of responsibility for any third party's use, or
the results of such use, of any information, apparatus, product or process
disclos'e-d inf this report, or represents that its use by such third party would
not infringe privately owned rights.

SUMMARY
Within the framework of this research project there were examined the
heat transfer ranges, as they occur during the high pressure phase of
a LOCA with intermediate and large breaks. Special attention was given
to the phenomena important for the prediction of the highest clad tube
temperatures of the maximum and minimum critical heat flux and to the
steam-droplets cooling. The experimental results of the 25-rod bundle
tests, conducted at the KWU facility in Karistein, were used as a data-
base for the verification of the assembled models and correlations.
The values of the heat flux and of the heat transfer coefficients, ob-
tained from these measurements, were used for the comparison with the
calculated results and allowed the evaluation of the used correlations
and models. The local values of the important thermal and fluid dynamic
parameters, required for this comparison, were calculated with the aid
of the computer code BRUDI-VA. -In particular, the following correlations
were evaluated on hand of these experimental results:
Maximum critical heat flux:
- W-3 correlation
- B-W-2 correlation
- Macbeth correlation- Zuber-Griffith correlation
- Biasi correlation
- CISE correlation
- Slifer-GE correlation
- Smalin correlation
- Tong correlation
- Thorgenson correlation
- Monde-Katto correlation
Minimum heat flux:
- Berenson modification of the Zuber correlation
i

Minimum temperature difference in case of rewetting:
- Berenson correlatio'n
- Henry correlation
- Ilceje correlation
Correlations for the calculations of the heat transfer coefficients in the
sphere of steam-droplets cooling:
- modified Dougall-Rohsenow correlation
- Groeneveld-5.7 correlation
- Condie-Bengston-IV correlation
- Groeneveld-Delorme correlation
- Chen-Ozkaynak-Sunderam correlation
The verification of the correlations for the calculations of the maximumcritical heat flux made apparent the limitation of the spheres of applica-tion of the individual correlations and showed, that none of these correla-
tions can be recommended for the entire range of the test parameters for
a safe prediction of the DNB moment and location. The verification of
the correlations for the calculation of the heat transfer coefficients
after the exceeding of the maximum critical heat flux showed, that these
correlations also lead only in certain ranges of the test parameters to
a good consistency between the measurement and the calculated results.
The use of the chosen correlations for the calculation of the minimum
temperature difference between wall and coolant and the minimum critical
heat flux showed, that none of these correlations, at least in the para-
meter combinations that resulted from the 25-rod bundle tests, can be used
for the prediction of the rewetting phenomenon.
On hand of the results of the verification of the correlations for the
calculation of the heat transfer coefficients in the case of steam-dropletscooling there was developed a new "two components correlation." Theapplication of this correlation within the entire range of the test
parameters of the 25-rod bundle measurements (pressure 2 to 12 MPa,
mass flow density 300 to 1400 kg/m'.s, steam quality 0.3 to 1, and wall
temperature 300 to 700'C) led to a very good consistency between measure-
ment and calculated results.
ii

ABSTRACT
The general purpose of this project was the- investigation of the heat trans-fer regimes during the high pressure portion of blowdown. The main at-tention has been focussed on the evaluation of those phenomena which aremost important in reactor safety, such as maximum and minimum criticalheat flux and forced convection film boiling heat transfer. The experimen-tal results of the 2S-rad bundle blowdown heat transfer tests, which wereperformed at the KWU heat transfer test facility in Karistein, were usedas a database for the verification of different correlations which are usedor were developed for the analysis of reactor safety problems. The compu-ter code BRUDI-VA was used for the calculation of local values of Impor-tant thermohydraulic parameters in the bundle.
In particular the following correlations have been evaluated in this study:
Maximum critical heat flux:
-W-3 correlation
-B-W-2 correlation
-Macbeth correlation
-Zuber-GriffIth correlation-Biasi correlation-CISE correlation
- Slifer-GE correlation- Smolin correlation
- ng correlation- Thorgerson correlation
- Monde-Katto correlation
Minimum critical heat flux and minimum film boiling temperature:
- Berenson modification of the Zuber correlation- Berenson correlation- Henry correlation- lioeje correlation
Heat transfer coefficients in flow film boiling:
- modified Dougal l-Rohsenow correlation- Groeneveld-5.7 correlation
iii

- Candie-Bengston-lV correlation- Groeneveld-Delorme correlation- Chen -Ozkayna k-Sundaram correlation.
The evaluation of correlations for the prediction of critical heat flux, film
boiling heat transfer coefficients and minimum film boiling temperatureshowed that none of the correlations should be used over the entire range
of test parameters investigated.
Using results of this investigations a new equilibrium correlation for the cal-culat!on of forced film boiling heat transfer coefficients has been developed.
This correlation is shown to agree well. with the experimental data over thefollowing range of testparameter: Mass flow rate 300 to 1400 kg/M 2 .s, pres-
sure 2 to 12 MPa and quality 0.3 to 1.0.
iv

TABLE OF CONTENTS
1. Introduction~
2.
2.1
2.2
Foundations and definitions
Forced convection with water as a coolant
Subcooled nucleate boiling
2.3 Nucleate boiling
2.4 Transfer from nucleate boiling ti
steam-dropl ets flow
2.4.1 Transfer from nucleate boiling ti
2.4.2 Transfer from nucleate boiling ti
2.5 Fil~m boiling
2.6 Steam-droplets cooling
2.7 Transfer fromfilm boiling, resp.
to nucleate boiling
2.8 *Forced steam convection
ofilm boiling, resp.
1
2
3
4
4
4
4
5
5
6
6
6
0 film boiling
steam-droplet cool ing
steam-dropl ets cool ing
3.
3.1
3.2
3.3
3.3.1
3.3.2
Experimental i nvestogations
The test device
Instrumentation
Test program
DNB tests
Post DNB tests
7
7
8
9
9
11
4. Calculation of the heat transfer coefficients from the
test data and the evaluation of the results
4.1 Calculation of the heat transfer coefficients from-
the test data
4.2 Compilation of the important parameters from the test
5. Calculation of the local thermal and fluid dynamic
parameters
5.1 The computer code BRUDI-VA
5.1.1 Basic equations of the homogenous point of equilibrium
model
5.1.2 Calculation of the two-phase pressure loss
12
12
12
14
14
14
15
V

5.1.3 Heat conduction model 1
5.1.4 Heat transfer model 16
5.2 Calculation of the chosen tests and determination of the
local thermal and fluid dynamic parameters at the DNB,
dry-out and RND moment 16
6. Compilation and comparison of the correlations for the
calculation of the heat transfer coefficients in the
region of the forced convection with one-phase coolant 18
6.1 Forced water convection 18
6.2 Forced steam convection 19
6.3 Comparison of the correlations 20
7. Compilation and comparison of the correlations for the
calculation of the heat transfer coefficients (HTC) of
the subcooled and saturated nucleate boiling 21
7.1 Calculation of the necessary temperature difference
for bubbles formation with subcooled fluid 217.2 Calculation of the heat transfer coefficients in the
region of the subcooled nucleate boiling 21
7.3 Calculation of the heat transfer coefficients in the
region of nucleate boiling 22
7.4 Comparison of the correlations 23
8. Transfer from nucleate boiling to film boiling, resp.
stea~m-droplets cooling - (maximum critical heat flux) 25
8.1 Vessel film boiling 25
8.2 Heat transfer crisis with forced convection, high heat
flux and low steam-cOntent - (DNB) 27
8.2.1 Semi-empirical models 27
8.2.2 Empirical models 31
8.3 Heat transfer crisis with forced convection, low to
intermediate heat flux, and intermediate to high steam
content (dry-out) 33
8.3.1 Analytical models 33
8.3.2 Semi-empirical and empirical correlations 36
8.4 Verification of the correlations for the calculation
of the maximum cri tical heat flux (KHB) based on the
experimental results 38
vi

862-.1 Selection of the correlations 388.4.2 Evaluation of the correlations for the calculation
of the maximum critical-heat flux 44
9. Heat transfer at boiling abd steam-droplets cooling 45
9.1 Film boiling 459.1.1 Film boiling with wettable wall 459.1.2 Film boiling with not wettable wall 46.9.1.3 Vessel film boiling 469.2 Steam-droplets cooling 499.2.1 Equilibrium models and correlations 509.2.2 Non-equilibrium models 529.3 Comparison of each of the correlations based on the
recalculation of selected 25-rid bundle tests 569.3.1 Recalculation of the test ONBi 579.3.2 Recalculation of the test DNB3 -59
9.3.3 Recalculation of the test DNB9 619.3.4 Recalculation of the test PDNB11 639.4 Evaluation of the correlations for the calculation
of the heat transfer coefficients in the steam-dropletscooling region 64
10. Transfer from steam-droplets cooling or film boilingto nucleate boiling (RNB-rewetting) 65
10.1 Compilation of the experimental data from the 25-rodbundle investigation 65
10.2 Correlations for the calculation of the minimum criticalheat flux and of the minimum temperature difference withrewetti ng 66
10.3 Investigation of the correlations based on the resultsof the 25-rod bundle tests 68
10.4 Evaluation of the correlations 70
11. Development of a new correlation for the calculation ofthe heat transfer coefficients in the steam-dropletscooling region 71
11.1 Heat transfer between wall and steam phase 72
vii

11.1.1 Comparison of various slippage and drift equations 73
11.2 Heat transfer between wall and droplets -76
11.2.1 Determination of the surface inherent to the heit"
transfer between wall and droplets 76
11.2.2 Determination of the droplet diameter 76
11.2.3 Determination of the number of droplets 78
11 .3 Heat transfer between steam and droplets 79
11.4 Calculation of the individual components of the heat
flux density between wall and steam-droplets flow 80
11.5 Formulation in agreement with the similarity theory
of the new model for the calculation of the heat transfer
coefficients with steam-droplets cooling 85
12. Conclusions 92-
13. Bibliography 93
Attachments 1-11 99
Distribution 141
viii

INDEX OF FIGURES
Figure 1: Heat transfer and flow configurations with- intermediate
heat flux 2
Figure 2: Heat transfer and flow configurations with high heat
flux 3
Figure 3: Schematic representation of the measuring section 7
Figure 4: Heating conductor geometry and power distribution 7
Figure 5: Position of the thermocouple elements in the bundle 8
Figure 6: Typical processes of the test parameters of the DNBtests 10
Figure 7: Typical processes of the test parameters of the
post-DNB tests 11
Figure 8.: Correlation of the temperature difference with
rewetting and of the electric power 13
Figure 9: Pressure difference along the measuring section
Test DNB-2 15
Figure 10: Pressure difference along the measuring section
Test DNB-9 15
Figure 11:
FigureFigureFigure
12:
13:14:
Figure 15:
Figure 16:
Figure 17:
Figure 18:
Figure 19:
Figure 20:
Comparison between the measured and the calculated
wall temperatures - Test DNB-9
Reynolds number multiplier F according to Chen
Suppression factor S according to Chen
Boiling curve according to Nukiyama for container
boiling with 0.1 MPa
Model representation for the determination of the
critical heat flux according to TongModel of the annular flow with entrainment and
depositionH-arwell correlation for the determination of the
entrainment coefficient
Harwell correlation for the determination of the
deposi ti on coeffi ci entComparison of the critical heat flux correlations
Test DNB3Comparison of the critical heat flux correlations
Test DNB3
1724
24
26
29
33
34
35
40
41
ix

Figure 21:
Figure 22:
Figure 23:
Figure 24:
.Comparison of the critical heat flux correlations
Test DNB9
Comparison of the critical heat flux correlations
Test DNB9
Schematic representation~of film boiling in vesselboiling
Model of the vessel film boiling according to
42
43
46
Figure
Figure
Figure
Figure
Fi gure
Figure
Figure
Berenson
25: Comparison of
26: Comparison of
Test DNBI
27: Comparison of
28: Comparison of
Test DNB3
29: Comparison-of
30: Comparison o 'f
Test DNB931: Comparison of
Test PDNB11
the equilibrium correlations Test DNB1the non-equilibrium correlations
the equilibrium correlations Test DNB3
the non-equilibrium correlations-
the equilibrium correlations Test DNB9the non-equilibrium correlations
49
57
58
59
60
61
62
63
the equilibrium correlations
Figure
Figure
Figure
Figure
Figure
Figure
Figure
Figure
32: Measuring points Tw-Tsat = f(P)33: Measuring points Tw-Tsat = f(q)34: Correlation of G to TW-Tsat35: Correlation of X to TW-Tsat36: Comparisons of the correlations for the calculation
Of &Tmin37: Comparison of the minimum and actual heat flux
38: Model representation for the heat transfer in the
steam-droplets cooling phase
39: Comparison of several correlations for the calculation
of the heat transfer coefficient with forced steam
convecti on
40: Comparison of various slippage equations
41: Comparison of the steam velocities calculated with
and without drift42: Comparison of the wall temperatures and the heat
transfer coefficients calculated with and without
slippage
55
55
56
56
58
59
11
Figure
Figure
Figure
T4
'5
x

Figure 43: Comparison of the correlations for the calculation
of the droplet diameter 77
Figure 44: HTC between steam and droplets 79
Figure 45: Heat flux density of steam on droplets 79
Figure 46: Components of the heat flux in steam-droplets
cooling 82
Figure 47: Comparison of the droplets mass flow densities 83
Figure 48: Components of the heat flux density acc. t6 the
"two-component model" 84
Figure 49: Results from the recalculation of the test DNB1 with
the application of the new correlation for the
calculation of the heat transfer coefficients 88
Figure 50: Results of the recalculation of the test DNB3 with
the application of the new correlation for the
calculation of the heat transfer coefficients 89Figure 51: Results from the recalculation of the test DNB9 with
the application of the new correlation for the
calculation of the heat transfer coefficients 90
Figure 52: Results from the recalculation of the test PDNBil
with application of the new correlation for the
calculation of the heat transfer coefficients 91
xi

INDEX OF TABLES
Table 1: Variation of the test parameters of the DNB tests 10Table 2: Variation of the test parameters of the post DNB
tests 1Table 3: Values of the Macbeth correlation coefficients
for various pressure ranges 32
Table 4: Comparison of the critical heat flux correlations 39
Table 5: Values of the correlation coefficients for the
Groenevel d correlation 52
xii

EXPRESSIONS (Notations)
a maAB
CCp J/kg K
D M
F m2
F
g rn/sec 2
G kg/M3 sec
h J/kgAhm J/kg
6&he J/kgH m<J> M3 /Sac
K
K soKa
I mM kgm kgM kg/sec
NP Pa (bar)
p mP C Pa (bar)
C
q W/M2 (W(CrnZ)
R mR SPOhm *MM2/M
SS mS
t sec
T OC, K
characteristic lengthcorrelation constantcorrelation constantcorrelation constantcorrelation constantspecific heat capacitydiameter, equivalent diameterpressure loss factorarea [surface]Chen factoracceleration due to gravitymass flow densityspecific enthalpymodified evaporation heatevaporation heatheight
volume flowconstantStefan-Bol tzmann constant
absorption coefficient
lengthmassmassmass flownumberpressure
heated rangecritical pressureheat fluxheat flux densityradiusspecific resistanceChen suppression factorthicknessslip~slippage]timetemperature
xiii

W kg/sec mass floww rn/sec velocityX steam content
xtt Martinelli-Nelson parameterY Jiiropolskij parameter
a W/rn2K heat transfer coefficient8 M film thickness, droplets diameter9 emission numbern~ kg/rn-sec dynamic viscosity#5 m film thicknessA. W/rnK heat conductivityTp volumetric steam content
p kg/rn3 densityT N/rn2 tangential stressT sec timea N/rn surface stress
Characteristic factors
Gr Grashoff numberNu rHusselt number
Pr Prandtl number
Re Reynolds numberWe Weber number
Subscripts (and superscripts)
A outlet [discharge]a actual [real]6 Berensonbs nucleate boiling
d steam
E) deposition
ONE Departure from nucleate boilingD0 dry-out
xiv

E inlet (entrainment)* equilibrium
effectivef fluid [liquid]
H Henryhorn homogenous (without slippage)in inletmin injection
I IloejeK convectionI localLF liquid filmmic microscopicalMac macroscopicalmax maximummin minimumstat stationary value
T dropletsTOT in tototP two-phasew waillZP two-phase
xv


1. INTRODUCTION
In the safety analyses of light water reactors there are examined hypothetical
LOCA cases. Depending on the size and the position of the assumed breaks,
the important thermal and fluid dynamic parameters, such as pressure, mass
flow and enthalpy in the primary loop, undergo more or less quick changes
compared with the conditions under normal operation. The therefrom resulting
reduction of the core mass flow can lead to~a so-called exceeding of the
maximum critical heat flux (KHB) [CHF] at the fuel rods and to a high increase
of the clad tube temperatures. Thus, an accurate knowledge of the heat
transfer conditions under high pressure and mass flow transients is one
of the most important prerequisites for a correct prediction of the
process of the clad tube temperatures in the case of LOCA. Therein, of
decisive influence upon the process of the clad tube temperatures are the
moment of the exceeding of the maximum critical heat flux and the magnitude
of the heat transfer coefficients (WUK) in the subsequent phase of film
boiling and steam-droplets cooling. For the clarification of these problems,
intermittently controlled tests with a 25-rod bundle with PWR geometry were
conducted in the KWU facility, within the framework of the German emergency
cooling program. The task of this research project was the analytical
examination of the heat transfer conditions under considerable pressure and
mass flow transients and under high pressure.
1
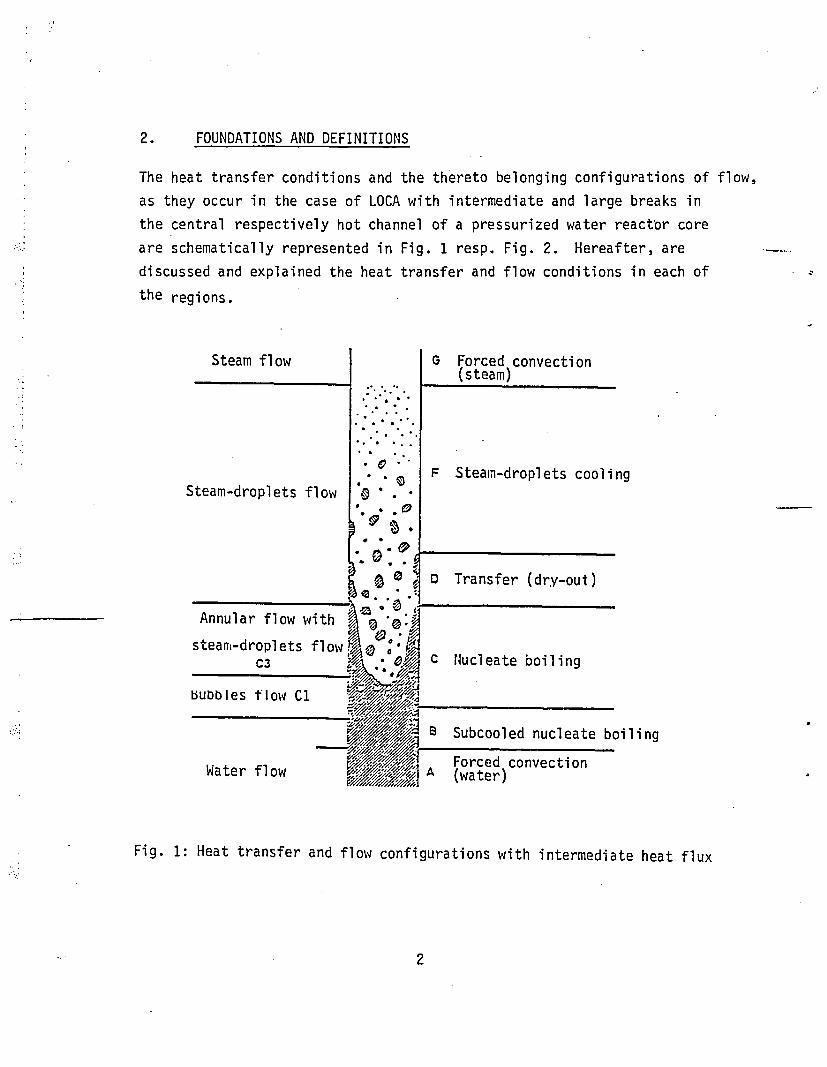
2. FOUNDATIONS AND DEFINITIONS
The heat transfer conditions and the thereto belonging configurations of flow,
as they occur in the case of LOCA with intermediate and large breaks in
the central respectively hot channel of a pressurized water reactor core
are schematically represented in Fig. 1 resp. Fig. 2. Hereafter, are
discussed and explained the heat transfer and flow conditions in each of
the regions.
Steam flow
P: Steamn-droplets coolingSteam-dropl ets flow
Annular flow with
steam-dropl ets flowC3 C Nlucleate boiling
biubbles flow C1
8 Subcooled nucleate boiling
Water flowForced convection
A (water)
Fig. 1: Heat transfer and flow configurations with intermediate heat flux
2

Steam flow
Steam
droplets flow
Inverseannular flow
* 4
0 .**.
* 0o *.~ .~
* . 6.
,*~ 0
o~.
4,/
~;~ AlI :/~,
G Forced convection(steam)
F Steam-droplets cooling
E Film boiling
0 Transfer (DNB)
Slug flow C 2
Bubbles flow C 1C Nucleate boiling
"-'4;,Subcooled nucleate boiling
Water flow A Forced convection(water)
Fig. 2: Heat transfer and flow configurations with high heat flux
2.1 Forced convection with water as coolant (Region A, Fig. 1, 2)
This type of heat transfer occurs in steady-state operating conditions and
in the first, subcooled phase of LOCA in the greatest part of the reactor
core. The thereto belonging configuration of flow is the single-phase,
fully developed, turbulent flow.
3

2.2 Subcooled nucleate boiling (region B, Fig. 1, 2)
The mean water temperature in this region lies only a little below the
saturation temperature. Bubbles are formed on the wall if the wall
temperature presents a certain increase above the saturation temperature.
Due to the actio n of the flux, the bubbles are broken off the wall and
condense in the subcooled region of the flow. Because of the movement of
the bubbles in the center of the flow there occurs the destruction of the
laminar boundary layer and in increased mass transfer in the layers in
the proximity of the wall takes place. This leads to a significant
improvement of the heat transfer between wall and coolant. Also, in this
case, the flow is fully turbulent, but partially with a destroyed boundary
1laye r.
2.3 Nucleate boiling (region C, Fig. 1, 2)
When the saturation tCemperature reaches over the entire flow cross-section,
the bubbles that are broken off the wall spread into the flow, do not con-
dense any longer and the average enthalpy lies now above the boundary
value of x = 0. Due to the velocity distribution, the constantly
originating bubbles on the wall are conveyed to the center of the flow,
they coalesce and displace the water into the less accelerated layers near
the wall. The heat transfer between wall and coolant is also very effective
in this region and amounts to only a few dc-grees Kelvin. The configura-
tions of flow inherent to this heat transfer can appear to be quite dif-
ferent and range from a bubble flow (region Cl), through a slug flow
(region C2, Fig. 2), to the annular flow with steam-droplets cooling
in the center (region 03, Fig.).
2.4 Transfer from nucleate boiling to film boiling, resp. steam-droplets
flow (the first heat transfer crisis)
2.4.1 Transfer from nucleate boilin2_to film boilinS (region D, Fig. 2)
The transfer from nucleate boiling to the film boiling is characterized by
a high heat flux density and a low steam content. When the steam production
4
at nuclear boiling reaches a determined limit because of the high heat
flux density, the water is displaced from the wall and the heat is trans-
fered to the water only through the conduction-in the thin steam layer.
The sudden reduction of the heat transfer coefficient (WUK) brings about
a steep increase of the wall temperature. This type of transfer from
nuclear boiling to film boiling is hence called "Departure from Nucleate
Boiling - DNB." Characteristic for this heat transfer crisis is the
change of configuration of flow of bubbles and slug flow to the inverse
annular flow (region D, Fig. 1, 2).
2.4.2 Transfer from nucleate boilin2 t ta-r~ t oln
(region D, Fig. 1)
As shown in Fig. 1, in this transfer there exist completely different con-
ditions in the flow channel as in the above described transfer from nucleate
boiling to film boiling. In this case, the heated wall is covered only
with a thin film of water from which are broken off individual droplets
because of the great velocity difference between steam nucleus and water
film. Thus, in the center there is created a steam-droplets flow, also
called mist flow; Due to the constant evaporating of the water film, it
becomes always thinner downward the flow until it fully evaporates at the
end of this region. After the drying of the water film, the heat transfer
coefficient (WUK) does suddenly decrease also in this case, and the walltemperature increases rapidly. This transfer from nucleate boiling to
the steam-droplets cooling is called "dry-out" in the literature and
also henceforth. The configuration of flow changes from an annular
flow to steam-droplets cooling.
2.5 Film boiling (region E, Fig. 2)
Film, boiling is a heat transfer process which can chiefly occur at boiling
in the pool with a heated wall. In the case of a formed flow, the pure
film boiling could be observed locally limited only with a high heat flux
density. During a transient process with quickly dropping pressure, this
heat transfer range is also limited in time.
5

2.6 Steam-droplets cooling (region F, Fig. 1, 2)
The heat transfer conditions and the magnitude of the heat transfer coef-
ficient (WUK) in this region are of decisive influence on the process of
the clad tube temperatures after an exceeding of the maximum critical
heat flux. The analytical examination of the heat transfer in a steam-
droplets flow (liquid deficient region) was one of the main t asks of this
research project and it is dealt with in details in Chapters 9 and 11.
2.7 Transfer from film boiling, resp. steam-droplets cooling, to
nucleate boiling (the second heat transfer crisis)
In the new intermittent examinations with reactor LOCA-like conditions,
there was not only observed the first heat tran 'sfer crisis (DNB, dry-out)
but also the second one, the transfer from steam-droplets cooling or filmboiling to nucleate boiling. This process -described as "Return to
Nucleate Boiling (RNB)" in the literature -is thoroughly investigated
in Chapter 10.
2.8 Forced steam convection (region G, Fig. 1, 2)
If even the last droplets evaporate in the center of the flow because of
the constant addition of heat and the pressure relief, the steam~is super-
heated with a constant addition of heat. The inherent configuration of
flow in this region is, in most of the cases, the fully developed turbulent
steam flux.
6

3. EXPERIMENTAL INVESTIGATIONS
The experimental investigation of the intermittent heat transfer conditionsduring reactor LOCA-like transients was conducted in the KWU facility withinthe framework of the research project RS-37C, sponsored by the BMFT (FederalMinister for Technology). The purpose of the controlled 25-rod bundletests was the experimental determination of the heat transfer coefficient(WUK) in the region of the film boiling and of the steam-droplets cooling,and the investigation of various parameters on the magnitude of the maximumcritical heat flux.
3.1 The -test device
Figure 3 shows a schematic representation of the testing device.
Safety disk val vesP~f (time) heat
25s-rod bundle3.8 m
water
G;=f (time)
steam
G~f (time
Fiq. 3: Schematic representationof the measuring section
Fig. 4: Heating conductor geometryand power distribution
7

..--- -'The most important element of the testing device is the measuring section
with the electrically heated 25-rod bundle. The axial power distribution
of the five-stage, direct-heated heating conductor is shown in Fig. 4.
The measuring section is designed for a maximum pressure of 16 MPa. The
inlet mass flow and the inlet enthalpy were controlled by means of the
valves in the main steam pipe and in the water pipe. At the outlet of
the measuring section are installed two quick-controllable valves and a
safety disk, with the aid of which the desired pressure distribution is
repoduced. The desired heating capacity, adjustable in time, of maximum
5 MW was generated in the thereto belonging direct current plant. A
detailed description of the testing device is contained in /1 and 2/.
3.2 Instrumentation
The following parameters were measured in each conducted test.
377(cm)
_________________327
00000'00000 225
00000'300-0004 IS
A 6 C 0 E u
Beginning of heatedlength
Fig. 5: Position of the thermocouple elements in the bundle
8

- absolute pressure at the measuring section inlet and outlet
- pressure diffe -rence between inlet and outlet
- coolant-temperature at the inlet and outlet
- water and steam mass flows in the inlet pipes
- electrical current and voltage
- 8 temperatures in the measuring section wall
- 80 heating conductor wall temperatures at several positions in the
rod (Fig. 5).
3.3 Test program
Due to reasons of technical testing nature, the tests were divided into two
testing groups, the so-called "DNB tests" and the so-called "post-DNB tests."
3.3.1 DNB tests
The main purpose of the DNB tests was that of furnishing information aboutthe influence of the various test parameters upon the DNB delay times and
upon the value of the heat transfer coefficient (WUK) immediately after
the occurrence of the DNB. The test runs, compiled in Table 1, were set
up in connection with the LOCAS between the reactor pressure vessel and
the steam generator. In view of the importance of the hot channel for'the
safe technical investigation, all of the DNB test runs were conducted
with a heating capacity similar to that of the hot channel. But since all
25 rods had to be equally heated in order to be able to reproduce also the
other thermal and fluid dynamic conditions that appear in the hot channel
of a pressurized water reactor, the following parameter variations had
to be carried out:.
a) Bundle inlet enthalpy and initial mass flow as in the reactor, theoutlet enthalpy higher (DNBI, DNB2, DNB3)
b) Bundle outlet enthalpy and initial mass flow as in the reactor,
the inlet enthalpy lower (DNB4, DNB5, DNB6)
c) Rod inlet and outlet enthalpy as in the reactor, the mass flow
higher (DNB7, DNB8, DNB9).
9

In the post-'DNB phase, the inlet mass flow was reduced for each of the
three types a), b) resp. c) to three different levels (G/G STAT = 0.45;G/GSA= 0.3; and G/GTA=0.) In order to investigate the influence
of the pressure drop after the beginfii ng of the blowdown upon the DNB delay
times, two test runs w ere condu cted with a lower pressure drop time of
0.7 (DNB1O) resp. 1.2 s (DNB11). The typical time behaviors of the pressure,
of the heating capacity and of the inlet mass flow are represented in
Fig. 5.
Table 1; Variation of the test parameters of the DNB tests
Test
ON B-iON 8-2ON 8-3ON 8-4ON B-5ON B-SON 8-7DNS-8ON 8-9ONS8-10ON B-11
Initial massflow density
kg/M2 -S
3300.3300.3300.3300.3300.3300.3828.3828.3828.3300.3300.
Mass flow densityin the post DNB
regionkg/M2.S
1419.957.660.
1450.990.660.
1378.937.689.660.600.
Inlet enthalov
kJ/kg
1284.1284.1284.1233.1233.1233.1284.1284.1284.1233.1233.
'~15000.
S.-
3300
~216504-
CA
(1
4.5 9. 13.5 18.time (s)
0 4.5 9 13.5 18
time (s)
Fig. 6: Typical processes of the test'parameters of the DNB tests
10

3.3.2 Post DNB tests
The purpose of these tests~wa§ the experimental determination of the heat
exchange coefficient in the region of the steam-droplets cooling with dif-ferent mass flows and pressure transients. The test runs, compiled in
Table 2, were set up in connection with the accident conditions with various
leak cross-sections (0.25F to 2F). The inlet mass flow of this test series,
maintain constant during a test run, was varied between the values G/GSTAT=0.4 and G/GTT 0.3 The blowdown time, determining the pressure
gradient during a test, amounted to 15, 25, 50 resp. 150 s. The bundle
inlet enthalpy remains constant during a test and was varied between 1.086-10'
and 1.55-10' kJ/kg. Figure 7 shows typical time processes of the twocontrolled test parameters.
Table 2: Variation of the test parameters of the post DNB tests
Test Inlet Mass Maximum Pressureenthalpy flow heat flux relief
density density periodkJlkg kg/M2S W/CM2 s
PD 1 1247. 1254. 162. 21.PD 3 1086. 248. 113. 23.7PD 5 1238. 858. 121. 29.PD 7 1086. 248. 113. 29.PD 8 1519. -157. 74. 35.PD 9 1519. 165. 78. 29.PD 10 1466. 91. 74. 32.5PO 11 1295. 319. 112. 51.PD 14 1461. 91. 74. 150.
0.
I
S2-
20 4time (s)
204time (s)
Fig. 7: Typical processes of the test parameters of the post DNB tests
11
4. CALCULATION OF THE HEAT TRANSFER COEFFICIENTS FROM THE TEST DATA
AND THE EVALUATION OF-THE RESULTS
4.1 Calculation of the heat transfer coefficients from the test data
The task of the KWU Co. in Erlangen was the determination of the heat trans-
fer coefficients from the measured time processes of the heating conductor
wall temperature, the heating capacity and the pressure at the outlet.
More detailed information about the inverse heat conduction program, used
for the calculation of the heat transfer coefficients, and several examples
of the results are contained in /3/.
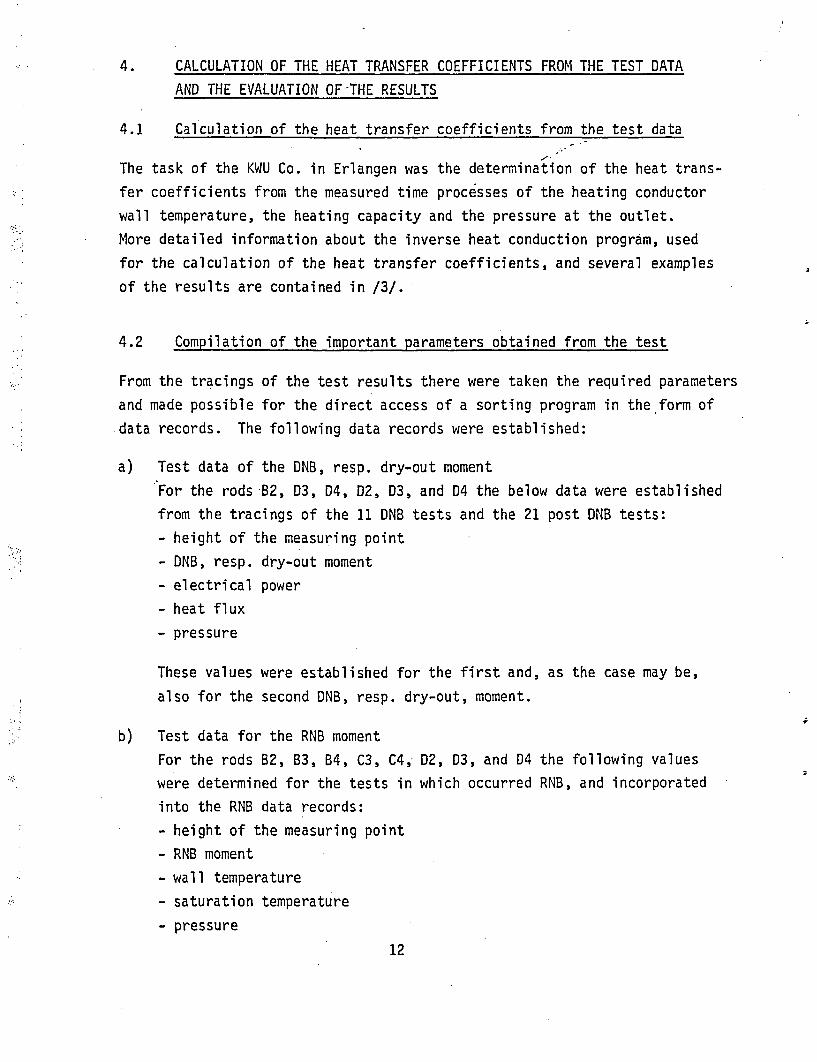
4.2 Compilation of the important parameters obtained from the test
From the tracings of the test results there were taken the required parameters
and made possible for the direct access of a sorting program in the form of
data records. The following data records were established:
a) Test data of the DNB, resp. dry-out moment
For the rods-B2, D3, D4, D2, 03, and 04 the below data were established
from the tracings of the 11 DNB tests and the 21 post DNB tests:
- height of the measuring point
- DNB, resp. dry-out moment
- electrical power
- heat flux
- pressure
These values were established for the first and, as the case may be,
also for the second DNB, resp. dry-out, moment.
b) Test data for the RNB moment
For the rods B2, B3, B4, C3, C4,- 02, 03, and D4 the following values
were determined for the tests in which occurred RNB, and incorporated
into the RNB data records:
- height of the m easuring point
- RNB moment
- wall temperature
- saturation temperature
- pressure
12
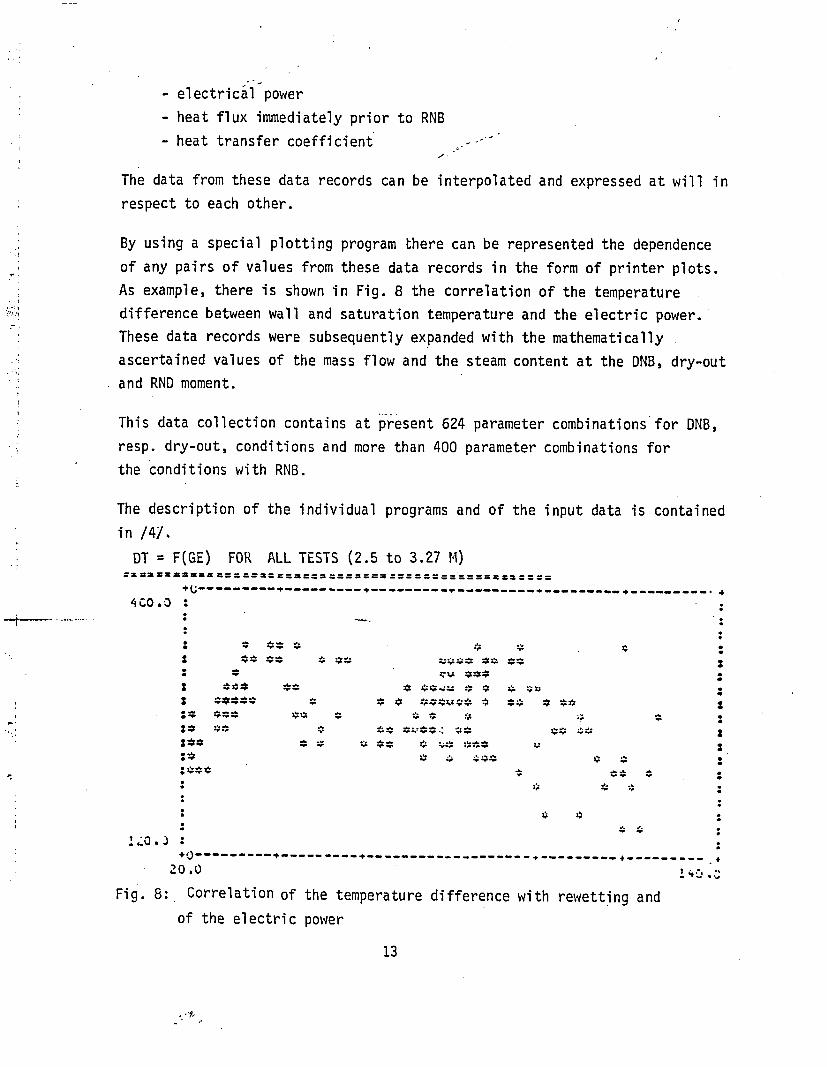
- electrical power- heat flux immediately prior to RNB
- heat transfer coefficient -
The data from these data records can be interpolated and expressed at will in
respect to each other.
By using a special plotting program there can be represented the dependence
of any pairs of values from these data records in the form of printer plots.
As example, there is shown in Fig. 8 the correlation of the temperature
difference between wall and saturation temperature and the electric power.
These data records were subsequently expanded with the mathematically
ascertained values of the mass flow and the steam content at the DNB, dry-out
and RND moment.
This data collection contains at present 624 parameter combinations for DNB,
resp. dry-out, conditions and more than 400 parameter combinations for
the conditions with RNB.
The description of the individual programs and of the input data is contained
in /4/.DT =F(GE) FOR ALL TESTS (2.5 to 3.27 M)
---------- ------------------- I ----------- 4-------- ----------. 4
A co .. _3
2+0* -- -- - -- - -- - -- - -- - - . ---- -- - - -- --- -- -- -- --
2010..
Fi 8:.Creaino h eprtredfeec.ihrwt~n n
ofr the. eletrcpwe
13

5. CALCULATION OF THE LOCAL THERMAL AND FLUID DYNAMIC PARAMETERS-*
The local values of the thermal and fluid dynamic parameters required for
the evaluation, not measured in the experimental investigation, were cal-
culated in the supplementary analysis of the tests with the aid of the
computer code BRUDI-VA.
5.1 The computer code BRUDI-VA
The computer code is a substantially modified version of the blowdown code
BRUCH-D /5, 6/ and was developed for the evaluation of the 25-rod bundle
tests. This computer program is based on a so-called homogenous point of
equilibrium model.
5.1.1 Basic eguations of the homoqenou s point of equil ibrium model
Starting from the one-dimensional formulation of the conservation theorems
for mass and energy and-the equation of condition, the following differential
set of equations can be differentiated for the homogenous point of equilibrium
model
P [-M(h+ -) (G-h)A + (G-h)E + Q]/fM( + v) (2)
with e av andc~ & (
C (p/2 W2 .F), -n. (p/2 W3), -F and g-p-w-sin~b-F are disregarded)at z at'
Through the integration of the theorem of conservation of momentum between the
points i and i+1 of the flow path with constant time, the equation for G is
derived
14
i+1 da -G f . - [Pi- P1+1-g-p(H.~1-H.)-K'G- IGI (4)
(with ommission of 2_ (W2~ 4 -W2 .)2 i1 i
The still unknown values of K, resp. Q, are determined with the aid of cor-relations for the calculation of the two-phase pressure loss, respectively
with the aid of a heat conduction and heat transfer model.
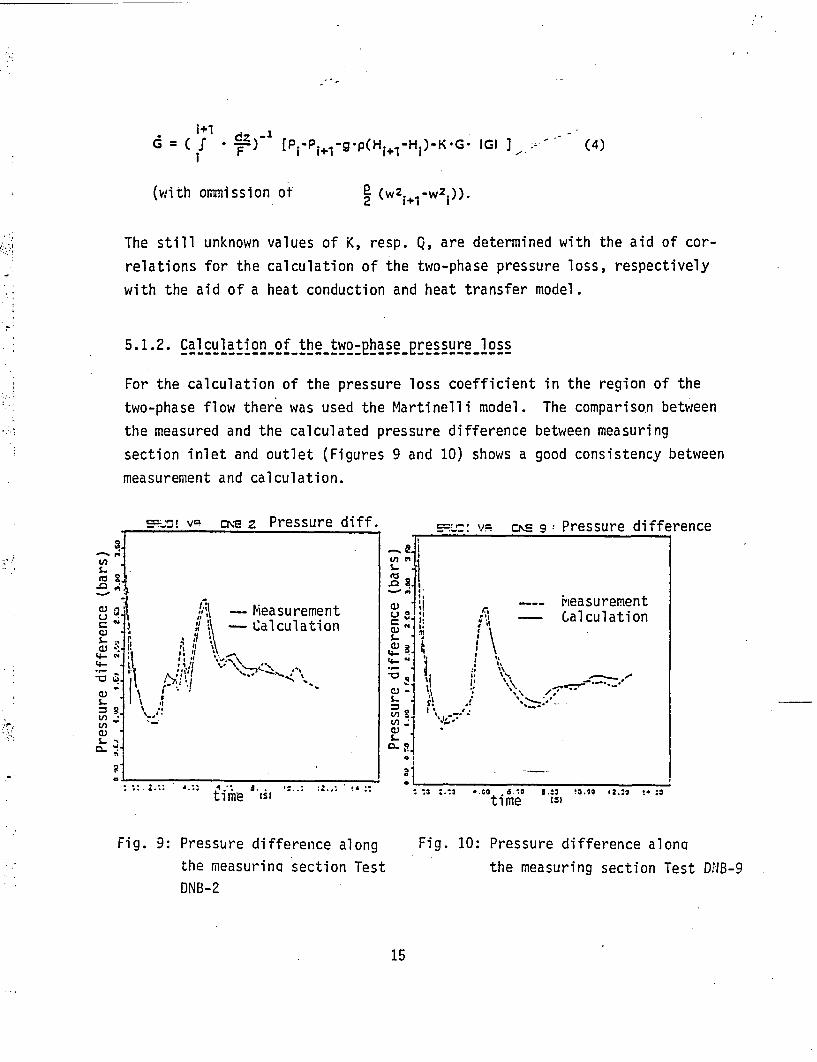
5.1.2. Calculation of the two-pha se_2ressure loss
For the calculation of the pressure loss coefficient in the region of the
two-phase flow there was used the Martinelli model. The compariso~n between
the measured and the calculated pressure difference between measuring
section inlet and outlet (Figures 9 and 10) shows a good consistency between
measurement and calculation.
s:;!v- ce 7- Pressure diff. =.-j V = = 9 ,. . rNIE Pressure difference
S-as
Q)iUr_
CLe
W-
S_
a)
4-.
4-',
V)
a, -
5-US_
CL
Hieasurernent- Calculation
:.-~~ * C a.d11 8.-^3 2 2.g ~ ':
time '
Fig. 9: Pressure difference alongthe mjeasurinq 'section TestDNB-2
Fig. 10: Pressure difference alonq
the measuring section Test DPIB-9
15

5.1.3 Heat conduction model
The fuel rod model implemented in the-computer code BRUCH-D did not allow th'6
simulation of the heat production by means of electric current in the heat
conductor wall. Therefore, for the evaluation of the 25-rod bundle tests
there was developed a heat conductor model. The following hypotheses were
taken for the specifications of the model describing the intermittent heat
conduction:
- The axial heat conduction was neglected,
- The heat is conducted only on the external wall,
- The heat is produced only in the heat conductor wall and calculated with the
aid of the Lenz-Joule law from the current and the specific resistance,
- The temperature dependence of the values of p, Cp, y and Rp was-taken
into consideration.
- The wall thickness remains constant within a heat conductor segment.
The heat conductor model was technically designed for the program in such a
manner, that the number of the radial layers for each of the heat conductor
segments can chosen at will.
5.1.4 Heat transfer model
The examination of the heat transfer conditions in the high pressure phase
during LOCA was the task of this research project and it is dealt with in
details in the below chapters.
5.2 Calculation of the chosen tests and determination of the local thermal
and fluid dynamic parameters at the DNB, dry-out and RND moment
The purpose of the calculation of the chosen experiments was the determination
of the local values of the mass flow and of the steam content in the bundle
from the boundary conditions that had been measured-or had been determined
from the.-measurements. The followinq parameters were given as boundary
conditions for the individual computer runs:
16

- Geometry and pressure loss coefficients
- Inlet mass weight rate of flow
- Inlet enthalpy
- Pressure at the measuring section outlet- Heat flux
The calculated values of the mass flow and steam content at the DNB, resp.
dry-out, moment are contained in Attachment 1. In Attachment 2 are compiled
the important parameters at the RNB moment.
These computer runs were concomitantly used for the verification of the heat
conductor model and of the Martinell-Nelson model for the calculation of
the two-phase pressure loss.
The slight deviations between the measured and the calculated temperature
are caused by the necessary flattening of the heat flux curves (Fig. 11).
The consistency of the time slopes of the pressure difference along the
measuring section can be described as good (Fig. 9 and 10). A detailed
information about the calculation of the 25-rod bundle tests is contained
in /7/ and /8/.
SRUDI VA DNS 9 HB given
4-3
S-
.4-)
9-] -calculation
time (s)Y~
Fig. 11: Comparison between the measured and the
calculated wall temperatures - test DNB-9
17

6. COMPILATION AND COMPARISON OF THE CORRELATIONS FOR THE CALCULATION
OF THE HEAT TRANSFER COEFFICIENTS IN THE REGION OF THE FORCED CON-
VECTION WITH ONE-PHASE COOLANT
6 .1 Forced water convection
For the calculation of the heat transfer coefficients (WUK) with fully developed
turbulent flow there were chosen two correlations, well established on hand
of test results:
a) Dittus-Boelter correlation /9/
a =0.023Re0.8 Pr0.4
wih Re-G*D and Pr = Alfcr'ff
The physical characteristics are calculated with the mean temperature
between wall and coolant.
Region of validity: 5000 ;9 Re ;9 7l10
0.7 ;1 Pr 9 100
b) Sieder-Tate correlation /10/
002Re0.8 0.33 rif 0.14
a003*~*Rf *Prf if;) (6).
The reference temperature for the physical characteristics is the
water temperature n* is calculated with the wall temperature [sic].
Region of validity: 2300 ;S Re 9 106
0.6 9 Pr -%70
For the calculation of the heat transfer coefficients (WUK) with laminar
flow there was used the Sieder-Tate correlation
18

- Sieder-Tate correlation for laminar flow /10/
a =1.86 - (R - 0r-) .(-.14D (R * P (7)
The physical characteristics are calculated with the coolant temperature.
For n*is used the wall temperature.
*Region of validity: Re ;S 2300Pr %1
6.2 Forced steam convection
For the calculation of the heat transfer coefficients with turbulent flow
there were chosen the following correlations:
- Dittus-Boelter equation /9/
0.03 d *Re0.8 0.40O 3 .~Rd Pr d (8)
with Re d =G*D and Ord = %dCPd
The physical characteristics are calculated with the mean temperature
between wall and coolant.
Region of Validity: SOCO :i Re ;1 7-10~0.7 9 Pr ;S 100
- McEligot correlation /11/
a =0. 021 - d 0.8 0.4 T d 0.5*- D Re4d .Prd f- (....)
W(9)
The physical characteristics are
between wall and steam.
calculated with the mean temperature
19

Region of validity:140 R 4.*O1450 S Re S 4.5-10 4
The heat transfer coefficients in the region of the laminar steam flow were
calculated with the aid of the Hausen correlation.
-Hausen correlation for laminar steam flow/12/
a =~.s . d Td 0.23 10
Xd is calculated with the mean temperature between wall and steam.
Region of validity: Re 1 2300
6.3 Comparison of the correlations
The values of the heat transfer coefficients, as calculated with these cor-
relations for typical parameter combinations in loss-of-coolant accidents,
are shown in Attachment 3 and compared with each other. An examination of
these correlations within a wider parameter scope is contained in /13/..
20

7. COMPILATION AND COMPARISON OF THE CORRELATIONS FOR THE CALCULATION
OF THE HEAT TRANSFER COEFFICIENTS (WUK) OF THE SUBCOOLED AND
SATURATED NUCLEATE BOILING
7.1 Calculation of the necessary temperature difference for bubbles
formation with subcooled fluid
For the calcu lation of the temperature difference between the wall and
saturation temperatures, necessary for the formation of bubbles, there
were chosen two empirical equations.
- Jens-Lottes equation /14/
A~s= 7.9 -(q.10-4) 0 25 - eA (11)
A =- 66.205.106
Region of validity: P :9 14 MPa'q S 11 .10 6 WV/M
G 9 10000 kg/m2-s
- Thom equation /15/
AT bs = 2.2.5 .(q.10-4)1- -e A(12)
A= p8. 687 .106
Region of validity: 5 MWa 5 P :5 14 MWa
q 5 6-1 W/m2
1000 1 G 5 3800 kg/mZ.s
7.2 Calculation of the heat transfer coefficients in the region of the
subcooled nucleate boiling
For the calculation of the heat flux there was used the modified Chen cor-
relation.
21

- Modified Chen correlation /16/
q rMc(T -VT)f+ aMc . T -Tsa) (13)
'If 0.3 0.4with a Mac =0.023 * _D Reg f Pr f (14)
and amic. 0.00122-C- )aTO 24 '.P 0.3,S (15)
wheei A X0.79 0.45 0.49
0.5 0.29 0.24.02B =a - ah e
and s = eff 0. 99 co seCatr73and S C -~~~- ) - suppression faco (seCatr73
This correlation was verified by Butterworth based on experiments with water
and butyl alcohol and it led to a good consistency between the calculated and
the measured values. However, the exact region of validity was not given
in /16/.
7.3 Calculation of the heat transfer coefficients (WUK) in the region of
nucleate boing
For the calculation of the heat transfer coefficients (WUK) during nucleate
boiling there were used the Chen and Schrock-Grossmann correlations.
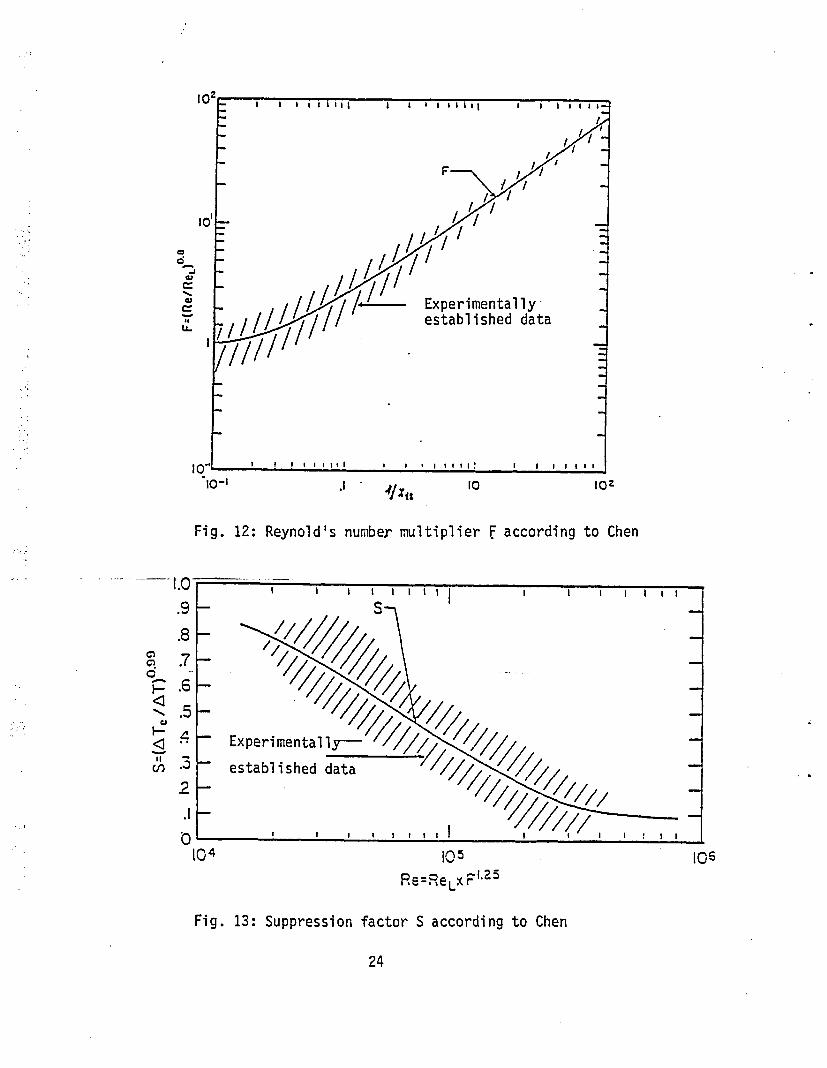
a) Chen correlation /17/
a =a Mi . C a (16)
Af 0.8 0.4mac =0.023 - :1 Ref Pr~ o F (17)
with F = Re~ 0.
%c=0.00122 LT 0.2 T *AP 0.SS (18)
22

A X0.79 0.45 0.49Af Cpf -Pf
0.5 0.29 0.24. 0.24
The curves of F and S are shown in Fig. 12 resp. Fig. 13.
Region of validity: o < x < 0.7
70 < G < 8000 kg/M2 .s40. < q < 2.40 W/CM2
b) Schrock-Grossmann correlation /18/
a2.5 * 1 0.752. C-I) . CItt0
= 0.023 f .[D-G 0.8 0.4
1 -- X- 50 -9 P 0 S 'i, 0.x 1x x ' 'I , (Ifd
(19)
(20)
(21)
Region of validity: x > 0. 02
7.4 Comparison of the correlations
The values of ATBS and of the heat transfer coefficients for some typicalparameter combinations are contained in Attachment 4.
23
C1
43
LL.
4XIt~
Fig. 12: Reynold's numiber multiplier F according to Chen
00~0
~1N
4JI-
II
104 106Re=ReLX '
Fig. 13: Suppression factor S according to Chen
24

8. TRANSFER FROM NUCLEATE BOILING TO FILM BOILING, RESP. STEAM-DROPLETS
COOLING - (MAXIIMUM CRITICAL HEAT FLUX)
The two fundamental physical appearances of the first heat transfer crisis
were already dealt with in Chapter 2. Here, there shall be examined the
individual physical models and correlations for the calculation of the
critical heat flux.
8.1 Vessel film boiling
The phenomenon of the critical heat flux easily examined during boiling in
heated vessels. A closed process of the dependence between heat flux and
temperature difference (Twall -Tsat) was first represented by Nukiyama /19/
in the manner of a so-called boiling-curve (Fig. 14). Due to the r~ise
of the heat transfer coefficients in the region of the nucleate boiling
the slope of the boiling-curve becomes gradually steeper up to point B.
When the heat flux reaches the value of point B, there is formed a steam
film between the wall and the fluid, the heat elimination from the wall is
limited now by the low heat conductivity of the steam, and the temperature
difference increases suddenly (B-C jump of the boiling-c~irve).
The hypothesis of the fuild dynamic origin of the heat transfer crisis
was first formulated by Kutateladze /20/. From the separated impulse
and continuity equations for water and steam there were established thefollowing dimensionless groups, describing the conditions during the first
heat transfer crisis:
W 2 A__ Wf*T Wdt Pf'f 2 Wd 2Pd a
With the assumption, that with free convection the first five groups can be
disregarded, there was deduced the following equation in agreement with
the Rayleigh theory of stability for the maximum steam volume flow from
the heated surface:
- a~g~f~p~)0.2S
(id~max pd -Ah K-( , Pd 2 (22)
25

610I-,
2
s-i
5~. 10
I-te~
a,=
.10
102
1~0,
Temperature di fference: (Tw -Tsat ) K 3
Fig 14: Boiling-curve according to Nuki~yama for containerboiling with 0.1 MPa
26

The value of K was analytically determined by Zuber
K = 4n
so that the equation for the maximum critical heat flux reads:
qmx=0.1567 Ahe'Pd2 [a.g.(Pf-Pd)l],2 (23)
Similar equations were established at a later date by other authors, as
for example by Zuber /21/ and Chang, Snyder /22/.
8.2 Heat transfer crisis with forced convection, high heat flux and
low steam content - (DNB)
8.2.1 Semi:e2irical miodel
Essentially, two different models were devel~oped-for the description of the
physical processes during the'transfer between nucleate boiling and film
boiling. For the first and more simple model one starts with the premise,
that the isolating steam layer is located directly between the wall and
-the fluid. Based on the result of an experimental investigation, Kutateladze
and Leontev /23/ developed an equation for the- calculation of the separation
of the boundary layer in fluid flow with lateral injection of air into the
flow channel.
P..jV.in.=2*1f * wff (24)
Tong /24/ modified this equation for the conditions under DNB
Pg * Vb= i-C a t= .P wf (25)
He further used the correlation of Maines /25/ for a calculation of ft with
low steam content
-0.6f---= Re -(25)tp
27

established, based on test results, the correlation constant C as function
of steam content:
C 1.76 -7.43x +12.22 -x2 (27)
Tong equation for the calculation of the critical heat fl ux (KHB):
q ~ ~ ~ ~ ~ ~~! (17 -74x122x).J ij W. 0.4. 0.4tia =(.7-.4x122X2 he. D f Pf (28)
Starting from the Reynolds analogy, Thorgerson et al /26/ developed another
equation for the calculation of the critical heat flux (KHB):
Pf~lf*CPf
therefrom results:
f- AT 2f *C~f (29)
and for the,DNB con ditions:
q = fDNBmx 2 1f Wf*Cpf (TwT sa) (30)
For the calculation of f there was used the equation (31):
f DNB =7.413 -Re OS (31)
Monde, Katto /27/ and Katto, Ishii /28/ started from the dimensional analysis
for the development of their own correlations and they established for the
volume-related steam velocity the following dimensionless groups:
q____ ma Pf 2_f r (f 9(PfPd)I (32)
PdA e d 'Id Pf~w2*' Pf~wI' ~
It was assumed that the influence of viscosity and buoyancy can be disregarded
during the first-heat-transfer--crlisis-in-the-f-lowed-through-channel.,-so-thatthe equation (32) reads:
28

_____ f__ Pf a
Pd-ahe-W =F (;(33)
Through the adaption of the individual exponents and of the correlationconstant to each of the used test results, there were established thefollowing correlations:
Monde-Katto correlation /27/
ma ` .O0745 - w - A
Katto-Ishii correlation /28/
q 0.014 - w- P .Ah (p 0.867 C /
~max d e ' Pd )W-P(P nhe2. a
(34)
(35)
These correlations were chosen from the plethora of similar equations'andused for the calculation of the critical heat flux (KHB). The figures inAttachment 5.show the comparison of the processes of qmxfor some typic~lparameter combinations.
W.- Z
f,bIy
Fig. 15: Model representation for the determination of the critical heat flux
.accordi ng to Tong
29

The second model -developed by Tong starts from the premise that the isolatingsteam 1ayer~is not located directly between wall and fluid but rather, as
shown in Fig. 15, that there is a thin layer of water between wall and the
bubbles. The presence of this layer of water was observed during the
photographic examination with freon of the flow conditions at DNB /29/.
The energy equation for the layer of water between the wall and the
bubbles was established by Tong as follows /30/:
j (Pf-Wf-P-h) + afb* -qp 0 (36)
with s =thickness of layer of waterlf ,bl = heat transfer coefficient (WUK) .between layer of water and bubbles
p = heated range
Under the assumption that pf-wf- remains constant along the flow path,
the equation (36) can be simplified as follows:
dz (h -h~ ) + C~h lh ) . Cpf-q (7M~~ ~ ~ ff~stbtf~a
wi th c = rf~bfPf Wf S.Cpf (38)
Z)ince the individual parameters in the equation (38) are partially unknown,
an empirical equation was established for C, based on measured results
C=O0. 44. A. inch- 1 (9
with A = (1'X DNB) .9and B 7 (G-10' ) 17
The practical application of this model is however very difficult because of
the very narrow region of validity for C and because of the complicated
conversion to conditions with variable heat flux.
30

8.2.2 Emeiricalcorrelations
In a manner similar to the one for the preceding case, a series of empirical
-correlations was published for the calculation of the maximum critical heatflow (KHB). Already in the year 1964, in the treatise of Milioti /31/
there were compiled 59 correlations for the calculation of the critical
heat flux, which were developed in connection with the reactor safety
analysis. The deviations of the values of the-maximum critical heat flux,
calculated with each of the-correlations, were denoted in this treatise as
very large. Instead of this group of correlations there were chosen three
equations, most used in the reactor safety analysis:
a) W-3 correlation /32/
=ma 3.15459 - 10
-[(2.022 - 0.0004302 * P) - (0.1722 -0.0000984
*P) * exp[(18.177 - 0.004129 -P) xJ])
*[(0.1484 - 1.596 - x + 0.1729 * x lxi )* (40)
*G*10 + 1.0371 - [1.157 - 0.869 -x]
*(0.2664 + 0.8357 -exp (-3.151 * 0)]
*(0.82s8 + 0.000794 - hi - hd
Region of validity 7 1 P :5 16 MPa
1360 1 G '1 6800 kg/m 2.s
-0.15 ;S x $ 0.15S-103 : 0 ; 175-1-3
0.25 $ L 1 3.6 m
Observation: This equation is applicable only in the case of homogenouspower distribution.
b) B-W-2 correlation /33/
=mx - 12.71.[3.0S45G.Gio-]A (41)
-{3.702-1.10 7 -(059137-G-10 I - 0.15208.x.,ah *'G}
.31

-3A = 0.71186 +'0.20729-10 -(P-2000)
8 = 0.834 + 0.68479-10- 3.(P-2000)
Region of validity: 14 9 P ý 16 MPa1020 S G !5 5430 kg/mZ-s
c) N-acbeth correlation /16/
=16 A+C*D*(G*10- ).O.25.(hz-h)1+C-1
(42)q ax
with A = yo* Dy (G-10-6) Y2
B = y3* DY'4 (G-10-6)Y
The values of y0, Y1, Y2-Y. yv4, and Y5for various pressures arein Table 3.
contained
Table 3: Values
ranges
of the Macbeth-correlation coefficients for various pressure
P~~essi~tt M.S No. of7 7 ' I 7P'Sia I I~ I IIPoinus
is 11 -0-211 0-3:4 0-0010 -1-4 -1-03 13-8 882-40 (norn) 177T -05353 _-0260 0-0166 :-14 -03M727530 (nomn) 1S57 0-i366 -0-329 00127 -14 0-07377 5.7 170
1000 1-06 -0-487 -0-179 0_003S -14 -0-SSS 7-4 .031570 (nozm) 07r0 -0-527 0-024 0.0323 -1.4 -0096 3-4 1332000 0-627 -0-268 0-192 0-0093 -1.4 -0-343 9-0 362Z"00 (no m) 0-011:4 -1-45 01439 0-0097 -1-4 -0S529 4-T 37
Observation: The parameters in the equations (40), (41) and (42) are tobe given in British units.
The values of the critical heat fluxes, calculated with these three cor-
relations, for the same paramater combinations as in Chapter 8.2.1., areshown in Attachment 5.
32

8.3 Hjeat-transfer crisis with forced convection, low to intermediate
heat flux, and intermediate to high steam content (dry-out)
8.3.1 Analytical models
The known model designs for the calculation of the dry-out of the water film
in.dependence of the supplied energy-, total mass flow and system pressure
do mostly originate from a mass balance for the film flowing along the wall.
The change of the liquid mass flowing in the film has to be attributed to
the evaporation, to the breaking-off of droplets (entrainment) and to the
originating renewed deposition of the droplets caused by the turbulent
radial velocity component (Fig., 16).
The mass balance equation for the water film with an annular flow *in'the
flowed-through-pipe was first established by Leslie and Kirby /34/ as
follows:
B = LF nD(G-G~ (43)
e
liquid film tdropletsG E/
Gjo
Fig. 16: Model of the annular flow with entrainment and deposition
33

he mass balance for the separated-fluid:-
BWE = nD(G -G )_ 4t0 8Caz E 0 I-,Y (44)
with C as droplet concentration in the steam flow.
The deposition of droplets in the liquid film was described with the 'aid
of a mass transfer coefficient K
G D =K *C
andG E K CE
(45)
(46)
Under the assumption that C E is a function of T*6/a and that K is a func~tion
of a, the correlations shown in Figures 17 resp. 18 were established for
these two unknown quantities. For the determination of the local pressure
loss (necessary for the calculation of T) there was used the equation (47).
46 = (dP/dz) LF 10-5
(7dp/dZ)(47)
Ica
10IC
It
I
0
-TA -At 07 Wta011~
0.1
C.C 0.1 0.2 0.3 . . . . . .
Fig. 17: Harwell correlation for the' determination of
coefficient.the entrainment
34

* - I.IWUIu .1"itnil~
z 0* ~ a0FREON 12
000(2.4
0.0c0 .14
0.O01 0.01 0.1CEPOSITIO?4 COEFFICI.ENT, k (rnsi
Fig. 18: Harwell correlation for the determination of the deposition
coefficient
For BWR conditions, Belda /35/ developed a model for the calculation of
the film thickness in dependence of time. For the determination of the
film thockness in the case of a BWR LOCA one started from the conservation
ths~orems for mass and energy, whereby the mass flows, given by film and
droplets, were described by simple statements. T he obtained differential
equation for the film thickness in dependence of time was solved numerically
and the dry-out moment was determined with film thickness = zero.
An equation for the calculation of the dry-out moment was developed by
Mayinger and Belda /36/:
tDO (aCPr/3P ) -(3P/8t) B n( )(8
A a -L*h - 60 ~ 2-.- 2:.. BI1-) Dtln~o8P e I 8t 4-1-pffi vz"IEo
f' e f f- D
35

wherein 6 0 is the film thickness in the stati onary initial state and the
constant C was determined by the adaption t .o the test results.
C = 0.15 for-freon 12 and C = 0.6 for water.
8.3.2 Semi: m2irical and empirical correlations
a) Hsu-Beckner correlation /37/
Hsu and Beckner developed a correlation for the calculation of the
maximum critical heat flux (KHB) in transient processes. This cor-
relation is, according to the assertions by the authors, valid for
a wide sphere of the determining parameters and can be used for both
types of the first heat transfer crisis DNB and dry-out.
q a-wd=1.33 -(O.96-tp)0* (49)
wherein q - is the heat flux with steam content x = 0, calculated
with the aid of the W-3 correlation, and xq,, d represents the heatflux density between wall and steam, calculated with the aid of the
Dittus-Boelter correlation for heat transfer coefficient.
b) Zuber-Griffin correlation /38/
This correlati on represents a modified form of the Kutateladze-Zuber
correlation for the calculation of the critical heat flux (KHB)
during nucleate boiling and it was developed for the range of the
low mass flows.
c) Slifer-GE correlation /39/
This correlation has a. very simple form and it was divided into tworegions of validity through the modification of the correlation
coefficient.
.36

qmx= 3.155-10 6 (0.8-x) for G 680 kg/M 2 .S
and (51)
qmx= 3.155.106 (0.84-x)fdr G 9 680 kg/M 2 -S
d) Smolin correlation /40/
Also this correlation has a simple form and according to the assertions
of the authors a relatively wide region of validity.
S 0.2 1.2.8qmx= 6.S-10 * EG *(1_X), *(1 .3-4.2S-10 -P) (52)
Reqion of validity: 380 9 G Z 4930 kg/M2-S
2.94 :5 P 9 13.7 MPa
e) Biasi correlation /41/
4
q2.7S510 1.4-A X) (S3)mx (1000)n .G0-167 GO- 167
for low steam contents (x < 0.3) and
4
q 1.51.10 8 1-)(4max (1OOD)n G*" 1)(4
for higher steamd contents and UG < 300 kg/in2 s
wherein n = 0.4 for 0 Z; 0.01 mn = 0. 6 for D < 0. 01- m
A =0.7249 + 0.99 * P -exp (-0.32P)
B = -1.159 + 1.49 -P - exp (-0.19P) + 8. 99-P1+lOPZ
f) CISE correlation /42/
1 .2S8-Ah(8)F (5S)
37

A =( -1)und B =(f-P )/(G-10Pr r
wherein p = P and PC = 22.1 MPa - critical pressure --.r PC
In Attachment 5 are shown the values of qmxfor chosen parameter combinations,calculated with the equations (49), (50), (51), (52), (53), and (55).
8.4 Verification of the correlations for the calculation of the maximumcritical heat flux (KHB) based on the experimental results
8.4.1 Selection of the correlations
For the verification based on the results from the 25-rod bundle tests therewere chosen the-following correlations:
- Tong equation-(28)- Thorgerson equation (30)
- Monde-Katto equation (34)
- W-3 equation (40)
- B-W-2 equation (41)
- Macbeth equation (42)
- Silfer-GE equation (51)
- Smolin equation (52)
- Zuber-Griff in equation (50)
- Biasi equation (53)
- CISE equation (55)
The chosen tests from the DNB and post-DNB test groups were recalculated with
the computer code BRUDI-VA, whereby the maximum critical heat flux (KHB)
was determined with the aid of each of the correlations in parallel with
the calculation. If, in accordance with the correspondincq correlation, the
value of the critical heat flux was below the value cf the local heat flux,
there was effected the transfer from nucleate bubbling to the correlation
for the calculation of the heat transfer coefficients ih the post-DNB resp.
post-dry-out region's. The moments of this transfer, as determined in the
-recalculation of several tests with each of the correlations, are compiled
in Table 4 and compared with the test results.
38

critical he~t flux (KHB) correlationsTable 4: Comparison of the
TE DNS time delay (s)TEST Height
Cen)teasur. Mod. W-3 Sli- Smo- B-W-2 Mlac- Biasi Tons Thor-Zuber fer lin bet~h gerson
135 No DNIB 2.6 - - - - - - --
190 No DNB 0.7 0.65 - - 0.7 1.2 - 0.92 0.4DNB-l 2.59 0.7 0.6 0.45 - - 0.52 0.8 0.9 0.75 0.4
327 0.4 0.5 0.2 1.1 1.1 0*.4 '0.6 0.6 0.8 0.4377 0.7 0.5 0.1 1.15 1.15 0.3 0.68 0.6 - 0.4
135 No DN'B 0.8 0.7 1.5 1.5 0.7 1.0 1.4 - 0.38190 No DNB 0.65 0.5 1.2 1.2 0.65 0.84 1.0 0.64 0.38
DNB-3 259 0.45 0.5 0.35 1.0 1.0 0.4 0.7 0.7 0.57 0.3327 0.2 0.4 0.15 0.85 0.85 0.2.5 0.55 0.46 0.63 0.3377 0.5 0.4 0.1 0.8 0.8 0.2 0.62 0.5 - 0.3
135 No D*NB 2.3 - - - - - - --
190 'No DNB 0.8 0.65 - - 0.8 1.4 - o .6DNB-7 259 0.7 0.65 0.5 - - 0.7 0.9 0.9 0.8 0.5
327 0.5' 0.55 0.35 1.5 - 0.4 0.65 0.65 0.8 0.4377 0.7 0.6 0.4 1.45 1.45 0.4 0.75 0.65 - 0.4
135 No DNB 1.1 0.65 - - - - - - -
190 No DNB 0.8 0.6 - - 0.82 0.93 1.2 0.85 0.8DNB-8 259 0.6 0.65 0.45 1.2 1.2 0.6 0.85 0.85 0.7 0.5
327 0.5 0.55 0.4 0.95 0.'95 0.45 0.75 0.7 0.75. 0.4377 0.6 0.6 0.4 1.0 1.0 0.4 0.8 0.6 - 0.4
135 No DNB 0.9 0.85 - - - - - - -
190 No DNB 0.75 0.65 1.3 1.3 0.75 0.9 1.2 0.8 0.8DNB-9 259 0.7 0.65 0.5 1.1 1.1 0.6 0.8 0.85 0.7 0.5
327 0.5 0.55 0.4 1.0 1.0 0.5 0.75 0.7 0.78 0.4377 0.6 0.6 0.45 1.0 1.0 0.5 0.8 0.65 - 0.4
135 No DNB 2.0 - - - - - - - -
190 No DNB 1.5 1.6 3.2 3.2 1.7 1.9 1.8 1.5 1.5DNB-11 259 1.2 1.2.5 1.25 1.45 1.45 1.35 1.5 1.5 1.4 1.3
327 0.9 1.2 1.2 1.75 1.75 1.3 1.45 1.5 1.5 1.2377 1.0 1.2 1.2 1.7 1.7 1.3 1.5 1.4 - 1.2
39

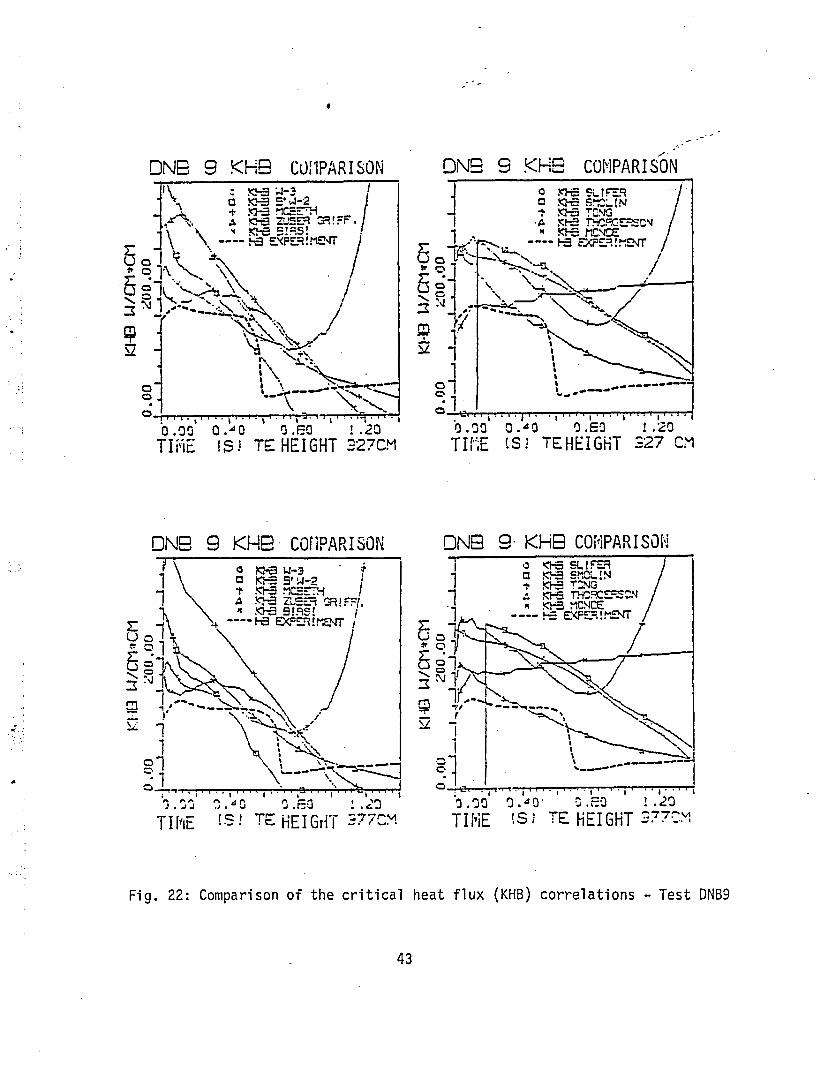
The Figures 19 to 22 show the processes of the critical heat flux, calculated
-with the chosen correlations, in the initial stage of two different DNB-tests.
By way of comparison, in these figures are also plotted the processes of. the
heat flux as determined from measurement.
ONE2 3 KHO CWNPARIS-ON ONE 3 KHE COM~PARISON
Zr
r_U-
U
[P
TINIE (S) TE HEIC-HT 190 CM
ONE 9 KHE COMiPARISON0N9 3 KHE CEi'PARIS01i
U
rn
0.0
00*N
S'W-
HZ EXE9.ZU
CD,
*j . . .
(S I 7'm HEIGHT,1259CM0 O0G 3 .4 3 0 1 .20
TI HE (S E HEIGHT 259CM1
Fig. 19: Comparison of the critical heat flux (KHB) correlations - Test DNB3
40

ONE DN2 9 K~---COM1PAR ISON
ON 9K!HGSr-K-= ThZPM==
LX KH3"VC
E,
TI1V1E (S I TE HEIGHT 927 CMI
ONE 13 KHE CO3MPARISONiONE
Th1E 7SE: H~IEIGHT3 77CM
Fig. 20: Comparison of the critical heat flux (KHB) correlations - Test DNB3
41

ONE 9 KHE CO1f'PAR I SONI OjNE S)<V COIMPAR ISJO.N
(-)
7 " '71 ........
TIME (ScI TE HEIGHT190 C-M
-NrE 9 KH9 COINPARISON~%*- \-
- -a ENT,!
ONE 9 KHE2- C01,iPAIRIS3!No %*- SL !.=9
C Iý-~~SU- 7 l-'TCG
A.10--= MCrCEýE- E(FR!MNT
~to 15r
!s)~ 1c T HE-IGHT"~OrM
Fig. 21: Comparison of the critical heat flux (KHB) correlations - Test DNB9
42
4
DNJE 9 <P.9 C0i11PARISON DN8- 9 KHE2 COMPARI SON
0
bm.O o.ýdo -o.rTII-,iE 1S) TE:HEIGHT 227CM TIES! TEHEIGHT S27 rC'M
0N96- 9 KH9 C011PARISON 0N9 9- KH9 COMPARISON
U
*-*.j9 .2T IIME (S I TE HLEI GHT 277C'A
Fig. 22: Comparison of the critical heat flux (KHB) correlations - Test DNB9
43

r.
8.4.2 Evaluation of the correlations for the calculation of the maximum
critical heat flux
The results of the verification of the chosen correlations for the calculation
of the maximum critical heat flux, compiled in this Chapter, show that none
of the used correlations can calculate with sufficient accuracy for this
phenomenon the critical heat flux in the abovementioned sphere of the test
parameters of the 25-rod bundle tests. The graphic comparison of theprocesses of the critical heat flux under the same conditions in the measuringsection", calculated with these correlations, shows how the values of thecritical heat flux can differ. From the tabular comparison of the DNB delay
times, calculated with each of the correlations, it'results, that most of
the equations calculated the moment of DNB too late and also an exceeding
of the critical heat flux at axial positions in the bundle, whereas in theexperiment the critical heat flux was not exceeded. As only realistic
and, in the sense of the reactor safety analysis, conservative correlation
proved to be, and this only after leaving the given region of validity, the
W-3 equation. For the prediction of the dry-out moment with intermediate
heat flux, based on this examination, there can be recommended the cor-
relations by Slifer, Smolin and Biasi.
44

9. HEAT TRANSFER AT FILM BOILING AND STEAM-DROPLETS COOLING
This region of the heat transfer was, not only because of the importance
in the reactor loss of coolant accident analysis, the center of many
ex perimental and theoretical investigations. In this chapter is ex-
plained the phenomenology of each of the partial regions of the two-
phase heat transfer after the exceeding of the maximum critical heat
flux and some correlations are presented for the calculation of the heat
transfer coefficients in this region. Subsequently, these correlations
are used for the verification of selected tests of the research project
RS 37C and the results will be comparied with the test results.
9.1 Film boiling
As already mention in Chapter 2, in the case of film boiling it deals with
a form of heat transfer which occurs in the high pressure phase of a LOCA
with a rapid depressurization only very limited in function of time and
place.
The transfer of the inverse annular flow, the flow form typical for this
heat transfer mechanism, to the steam-droplets flow is additionally
accelerated in a PWR bundle, in contrast to the flowed-through pipe, due
to the effect of spacers and of the transverse exchange.
9.1.1 Film boili nq with wettable wall
The accurate calculation of the heat eliminated from the wall in this area
is very difficult because of the unstable thermal and fluid dynamic processes.
The thin steam film, enveloping the wall, can be pierced by the waves at
the core water flow. The liquid reaches the still wettable wall and it is
again forced away from the wall by the very high evaporation. The wall
temperature has however dropped because of the very effective nucleate
boiling. This process can repeat itself several times.
Since the heat flux density in the case of an inverse annular flow has to
be generally very high, the wall temperature increases very sharply
45

(up-to 300 K per second) after the formation of the insulating steam film
and the wetting temperature is rapidly exceeded. Therefore, the area of
film boiling with wettable wall is only of subordinate importance for
the calculation of the clad tube temperature processes and for the cal-
culation of the heat transfer coefficients (WUK) there can be used byapproximation the correlations described under 9.1.3.
9.1.2 Film boil ins with not wettable wall
In case the wall temperature lies above the temperature of application, the
liquid does always remain separated from the wall by A steam film (Leiden-
frost phenomenon). The heat removal from the wall can be determined in this
case with the aid of the correlations for the calculation of the heattransfer coefficients (WUK) with forced steam convection (equations (8), (9)
Chapter 6.2) or with the correlations for the calculation of the heat
transfer coefficients (WUK) with vessel film boiling.
9.1.3 Vessel film boilin
The conditions dur~ing film boiling in the heated vessel are schematically
represented in Figure 23.
Fig. 23: Schematic representation of film boiling in vessel boiling
46

One of the first models of the film boiling mechanism with free convection
was established by 8Vtberr /43/. The heat that was conveyed to the water
phase was calculated in this model as the sum of the heat fluxes which
are conveyed to the water through the steam film because of conduction andradiation, less the heat required for the additional evaporation.
According to his conception, the heat flux was then determined at thewall through the free convection in the water phase, so that for the
Nusselt number there can be used the following equation:
Nu f K * GIP (56)
(n =1/3 for horizontal plate)
All values in the equation were calculated with the mean temperature between
saturation temperature (water surface) and the mean water temperature. For
the calculation of the heat flux density there was derived the following
equation:
q = (TsatT) K-(T -T )4.'3(f.2.~fp)nfI' (57)stfsat f ((~p..f Cp)q]'
The correlation constant was determined through the adpation to experimen-
tal data:
K = 0.0015
2rornIey /44/ postulated, in a manner similar to Awberry, that the heat
from the wall is conveyed to the liquid through heat conduction and heat
radiation. The heat conduction share was adequately treated pursuant to
the film condensation theory of Nusselt, so that heat transfer coefficient
(WUK) was defined as relation between the heat conductivity and the steam
film thickness.3 (K {%*d (T W- sat) /[p*p/p).g.-_jiC] }1 /4 (58)
with Ah-1 = Ah (i04p(WT )Ih(9e e sa4c(T~ t )Aie'(9
thus, the correction for the heat transfer coefficient with laminar film
boiling reads:
K[Xdgp-h][j(T-st-]II (0
47

The mean value of the correlation constant was given by Bromley as K =0.62.
In cylinder geometry, is replaced with D.
The heat transfer coefficient for the calculation of the radiation share
was calculated according to Bromley from the following equation:
at= {K52 /[(1/C).(1/Ka)-11j[TW4Ta 4 )/CTWTa) (61
Hsu and Westwater /45/ did take into consideration the influence of the
turbulence in the upper region of the steam film and developed for the con-
-vective heat transfer coefficient the equation:
Cr = .02-Re 4 Wd[j2[,-pd (f-d(2
wi th Re=d
wherein Wd is the steam mass flow at the end of the film boiling region.
Berenson /46/ used for the determination of the characteristic geometric
parameter (:resp. D in equation (60)) the Taylor-Helmholz instability
theory and established for the calculation of the convective heat transfer
coefficient the following equation:
e~ (63)sa
with a = {a/[g(pf-pd])1 12 (64)
and the correlation constant K =0.425.
The physical model, based on.which is the reasoning of Berenson, is
schematically represented in Fig. 24.
The values of the heat transfer coefficients, as they were calculated withthe correlations of Bromley and Berenson, are shown in Attachment 6.
48

Fig. 24: Model of the vessel film boiling according to Berenson
9.2 Steam-droplets cooling
During the last few years, there were developed many more or less empiricalcorrelations for the calculation of the heat transfer coefficients in the
region of the steam-droplets cooling. Generally, these correlations can
be divided into two groups:
- semi-empirical (pheomenological) models
- empirical correlations.
The empirical correlations are valid mostly only in a determined region of
the parameters, without differentiating if in this region it deals with
different physical processes. On the other hand, in the development of
of the phenomenological models it was endeavored to take into consideration
the mechanism of the physical processes. The resolution of the overall
49

process into individual steps, led however in the majority of the casesto the need for the determination of parameters, which cannot be unobjectionably
determined through measuring techniques and, thus, have to be finallyestabl ished empirically.
In connection with the development of the so-called progressive computer
programs hereafter will be subdivided the existing models into so-calledequilibrium models, which are established on the assumprion of the thermo-dynamic equilibrium, and the so-called nonequilibrium models, in which the.
thermodynamic non-equilibrium was taken into consideration.
9.2.1 Equilibrium models and correlations
Into this category fall most of the empirical correlations. They are based
on the statement derived from the similarity principle for the on-phaseforced convection.
Nu =K - Ren , Prm (5
In order to take into account the varied nature of the two-phase flow,
there was expanded either only the Reynolds number or the entire right side
of the equation (65).
Dougall-Rohsenow and, simultaneously, Miropolskij introduced the Reynoldsnumber modified for the two-phase flow.
Rep Re (66)
wherein the steam volume share q was defined as follows:
ý1=X/(x+$*(1-x)*p d/pt] (67)
If the same velocity Is postulated for water and steam, one obtains for the
RezP :
Rez c x4.(1-X).Pd/pfI 68
50

22M11lland Rohse now /47/ inserted then this Reynolds number into the Dittus-Boelter equation-(8) for forced convection and obtained:
Nud = 0.023 Rez 0.8 - Prd 0.4 (69)
wherein all the values of the steam were calculated with the saturation
temperature. The influence of the certainly higher temperature in the boundary
layer upon the magnitude of the Prandtl number was later on consideredthrough the expansion of the right side of this equation with the correction
term (Tf/T W)05$, so that the modified Dougall-Rohsenow equation reads:
Nud = 0.023 - Re 0 8 * Pr0 '(0
d ~ ZP rdo (Tf/Tw) 0-5(0
The wall and water temperature has to be inserted in this equation in degree
Kel1vi n.
Uiro221il /48/ expanded besides the Reynolds number the right side of
the equation (65) with the so-called two-phase multiplier Y
Y =1-0.1 (P f/pd)-1O4* 0 -. )4 (71)
so that his equation assumes the following form:
Nu = 0.023 - ReO-8 Pr 0-S * Y (72)ZP d
The values for the Husselt and the Yenolds numbers were relative to the
saturation temperature, and that of the Prandtl number to the wall tem-
perature.
Groeneveld /49/ presented in this treatise the general form of his equation
for the calculation of the heat transfer coefficients (WUK) in the region
of the steam-droplets cooling:
Nu K Ra Pb. c.qZP d (73)e
The correlation constant and the exponents were determined with the aid of
venious experimental data and they are contained in Table 5.
The values of the Nusselt and Reynolds numbers and of the two-phase multiplier
are calculated with the saturation temperature, that of the Prandtl number
with the wall temperature.
51

Table 5: Valu-es of the correlation coefficients for the Groeneveld correlation
Gcaeorry ab C d e No. nr R.M.s. Equationpoints error(7.) no.
Tubes 1.85 X 10⁻⁴ 1.00 1.57 -1.12 0.131 438 10.1 181.09 x 10⁻¹ 0.989 1.41 -1.15 0 438 11.5 19
Annuli -1.30 x 10⁻² 0.664 1.68 -1.12 0.133 266 6.1 205.20 x 10⁻² 0.688 1.26 -1.06 0 266 6.9 21
Tubes and 7.75 x 10' 0.902 1.47 -1.54 0.112 704 11.6 22annuli 3.271x 10⁻³ 0.901 1.32 -1.50 0 704 12.4 23
A surmmary of the empirical correlations for the calculation of the heattransfer coefficients after the exceeding of the maximum critical heatflux was established by Groeneveld /50/ and it contains 24 differentequations.
Conde andBen9ston /51/ used the regression analysis for the evaluation ofthe experimental data contained in the NRC data bank and they determined
the following equation for the calculation of the heat transfer coefficients
(WUK):
0.05345 - (,a . Pr b ReC)/(D)d .*x,)] (74)
with Re = D. und a = 0.4593; b =2.2598;
C= (0.6249 + 0.2043 -In (x+1)l; d = 0.8059 and e =2.0514.
Reqion of validity 0.42 :9 P' 22.15 MPa
40.1 ;9 b ý 3939 kg/m2-s
X <
The values of the heat transfer coefficients for typical parameter combinations,
calculated with the equations (69), (70), (72), (73), and (74), are shown in
Attachment 6 and compared with each other.
9.2.2 Non:tguilibrium -models
The fact, that the steam and water phase in the region of the steam-droplets
cooling can be in thermodynamic non-equilibrium, was determined already in
52

196-1 during the experimental investigation by Parker and Grosh /52/. The
resence of water droplets was observed during this investigation although
the equilibrium steam contents lay far above the value of x = 1. One of the
first so-called "Two-step'"'-hbat transfer models for the steam-droplets
cooling was developed by Laverty and Rohsenow /53/. The first step in
this model - the heat transfer from the wall to steam - serves mainly
for the superheating of the steam, which is then cooled in the second
step through the evaporation of the droplets. This viewpoint of the heat
transfer between wall and the steam-droplets cooling was used as the basis
for most~of the subsequently developed models.
Forslund and Rohsenow /54/ expanded the "two-step" heat transfer model and
attempted to determine quantitatively the heat transfer between wall and
the droplets near the wall. The heat transfer coefficient between wall
and droplets was determined with the aid of the Baumeister correlation
/55/
UWT 1 (X~p-pf -g.Ah-)/B] (75)
with B * (TW.T U) . V(rd~/61 1/3
and Ah he * (1+0. 35Cd(Tw-T )/I,3 (76)e eC~ sat)&e]
The number of droplets in the proximity of the wall was calculated with the
following equation:
N =~ / (777)
wherein NT is the droplets density per volume unit and was calculated as
follows:
im =G - 1-x a]/t(P,*W,*rr*&3 )/6] (78)
The local droplets diameter 6 TI still unknown in the equations (75) and (78),
was calculated with -the aid of the energy balance for one droplet and the
initial droplets diameter, determined from some measurements.
The equation for the calculation of the heat flux density between all and
droplet reads:
53

q = Cr * (n-8 2/4-) - N * (TW-TwT wT T Tw sat - (79)
Hynek, Rohsenow and Ber9!es /56/ determined the values of the correlation
constant for various liquids
Nitrogen K 1 * K2 =0.2
Water K1 I * 2 1.
Methane K1I * K2 =2.
Propane K 1 * K2 =1. 2.
In lieu of the non-equilibrium models in this treatise were examined the
correlation systems of Groeneveld-Delorme and Chen-Ozkaynak-Sundaram.
a) Groeneveld-Delorme model /57/
The Groeneveld-Delorme method is based on the following important
assumptions:
- The wall temperature is higher than the Leyden frost temperature
- The heat removal from the wall through the flow can be disregarded
- The velocity difference between steam and water phase can bedisregarded
- The entire heat removal from the wall can be calculated with the
aid of a correlation for the calculation of the heat transfer coef-ficient (WUK) with forced convection of steam with the applicationof the steam velocity.
For the calculation of the heat transfer density between wall and steam
there was used the Hadaller correlation /58/:
q (=- ad I -0.O.08348.ReO .774..PrO.6112 (80)
The actual steam content xa was determined from the energy balance:
Xa =Xe ' he/(hd-hf) (1
54

For the determination of the steamntehnperature and, thus, also of the
"actual" steam enthalpy there was established an empirical equation:
(h da-hd )/&h e= exp [-tan 0] (82)
with the rather complicated function:
* *Pb * eC d i=2a Pr Re am (pD-Cpd/Xd*.h el I fi(e1=0
(83)
with Re ham G -D- /l *'hamanu *'ham =Xe/l:Xe+( Pd/Pt) (1Xe)]
The values of the correlation constant and of the exponents were given
as follows:
a =0.13864; b =0.2031;
f 1.3072;
c= 0. 20006;
f 1 = 1. 0833;
d =0. 09232;
f 0. 8455
Region of validity 0. 71 ý6 P130 9 G
-0. 12 9 xe0. 005 9 D
S 21.47 MPa;S 5100 kg/M2 .S;S 1.69 0. 02 m
b) Chen-Ozkaynak-Sundaram model /59/
Chen at al developed for this model a new equation, based on the Reynolds
analogy, for the calculation of the convective heat transfer between
wall and steam:
Starting with the statement for the Stanton number:
St = f/2 (84)
the following equation was developed for the steam convection in the
steam-droplets cooling region:
St= a wd/(p *w*CP)d (85)
55

After the introduction of Gd = G*Xa and the expansion of the's~tatement
also for Pr f1 (Colburn modification of the Reynolds analogy) theequation for the convective share of the heat flux read s:
Qw,d = d CPd -Prd /3 (T -Td) -f/2 (86)
For the calculation of f there was ued the approximate correlation ofBeattie /60/:
f = 0. 037 * R eO -17 (87)
with the following definition of'the Reynolds number:
Re = (Dpd.<j>)!nqd; <j> = (Gd/pd) + CGf/pf)
For the calculation of the relation xa /xe there was developed a cor-relation with the use of several experimental results:
Xa 1 - S(P) - o(88)
with S(P) 0.26/[l-i5-(P/P )0 * 6 3 ] (89)
and 7.D (Td-TSat) / (TW-Td) (90)
The heat transfer through radiation was also disregarded in this
model.
Region of validity P 9 19.S MPa16.6 ;5 G 9 3011 kg/M 2 .S
0.5 ý Xe ý 1.728
9.3 Comparison of each of the correlations based on the recalculation of
selected 25-rod bundle tests
For the investigation of the equilibrium and non-equilibrium correlations
the tests DNB1, DNB3 and DNB9 were selected from the "DNB test sre" and
the test PDNBil was selected from the "Post DNB test series."
56

9.3.1 Recalculation of the test DNB1
The curves of the important test parameters, of the local values of the
mass flow calculated with the computer code BRUD I-VA, and of the steam
contents, and a complete set of the calculated results in comparison with
the test are compiled in Attachment 7.
ONG I CORR. COMPARISON 0N9 I CORR. COU!PARISON
IN
LU
2-,
LU
a-
.0N8
LD
(Dol-
0,-.
_i 0
I. CORR. COf IPARISO'N 0N9 CORR, C0O11PARISON'7l I
V
2
2
0-00"
00.
0 M. CUJGCJ.=- Rq-'SEj.W
*- CRI-EýZELD 3.7
---Exerirnent
THIjE S TE C3 327 G-10.00 2.00, '..n SJ
TUiE S- TEE C-m 327 CM-,'
Fig. 25: Comparison of the equilibrium correlations - Test DNB1

The values of the wall temperatures and of the heat transfer coefficients,as they were calculated with the equilibrium correlations at two differentaxial positions in the bundle, are compared in Fig. 25 to each other and
with the values determined from the test.
The comparison of the values of the wall temperature, calculated with the
non-equilibrium correlations,of the heat flux, of the steam temperature, and
of the actual steam content is shown in Fig. 26.
0N9 :CORR. CO[IPARISN.hH
wU
CDw
0~EwH
-J-J
14.c1-~~1-4
0:
-I
I,
9,1
tZN 3z<R1'1A
Experiment
ON9 if CORR. CO!"PARISON
U Zx;eriment
04-
T IME E- CSm 32.7 CM3.13 2.23 d.13.3 a
TIME S T C3 =27 CM
0j
0n
-I/ -
Ri I
~-li ' * I-~,, -~--
-i C C.'-SN ~IC'P~
j*flTh
3.30 2.30 433
TIME S TE 02 227 CM
911U
Lo.I
Cn 7
4.- oj :..
TIMiE S 7-C-2 227 CN"11
Fig. 26: Comparison of the non-equilibrium correlations - Test DNB1
58

9.3.2 Recalculation of Test DNB3
The curves of the important test parameters, of the local values of the mass
flow, calculated with the computer code BRUDI-VA, and of the steam content,
and a complete set of the calculated results in comparison with the test
are compiled in Attachment 8.
DN19 3 CORR. COMPARIOSUN D N t23 CORR. COMPARISON
01-
C-
p.
N
D
.00O 6.'30 .05 T C3 259 CMTIMlE. TIME -9 TE C-3 259 CM
DN9 3 CORR. CO1',1PARISO14
0-1
C-_.,0
5-
*1~11
Clo.J
I,-~ *1
070~*101
o .~
rI[IE
I= ;3 *HSE CcCNý31E 'S O IV*i- GNZr-L. S .7
-- Ex--eri~ent
D0N9230
NOI
CORR. COMIPARISON
S C'773 B277 Cm T I ME E r C3 ':277 r"
Fig. 27: Comparison of the equilibrium correlations - Test DNB3
59

The values of the wall temperatures and of the heat transfer coefficients,as they were calculated with the equilibrium correlations at two differentaxial positions in the bundle, are compared in Fig. 27 to each other andwith the values determined from the test.
The comparison of the values of the wall temperature, calculated with thenon-equlibrium correlations, of the heat flux, of the steam temperature, andof the actual steam content is shown in Fig. 28.
No
DN9 3 CORR. COIIPARISUN 0N93 CORR. COfIPARI SON'
F xperiment
aI.
C-
-j-j
2:
2:N.2- = - . = - - S
0-- Experienert
0'ý 10I
0*
a
a-
wH
wHU)
-J
HC-,
;.J3 S.0 6.00 9.03
Ti1 i-E s TE C 3 27 CM,
. - - - - - . . I
T IiME* ~SJ
S E.C 3 B27 CM
zcH0
0
LU
U)
T I HE SZ6,00 . 9.00
TE C3: 3217 C> TI PIE S !E c3n 327' C-II
.Fig. 28: Comparison of the non-equilibrium correlations - Test DNB3
60

9.3.3 Recalculation of the Test DNB9
The curves of the impcrtant test parameters, of the local values of, the
mass flow, calcdlated with the computer code BRUDI-VA, and of the steam
content, and a complete set of the calculated results in comparison-with
the test are compiled in Attachment 9.
ONE 9 CORR, C0i'iPARISOIN ON.E 9 CORR. COIMPARISON
C-.,0
0~
-j-J
0
0~
I--J-J
J!6
D
TIME S TE C3 259 CM TIME S .T E rC'3 2 59 C M
1-9 9 CORR. COMAPARISONDONE 9 CORR, COM1PARISON'1 0-M. 0CJG72L L~'c CzNO!E ~ESr-UCN ;V~1+ CRC2/EL.Dý S.7
1-- Experiment2:
0
TIMETE C3 .2 C
TIME T!:0 32 CM=7
Fig. 29: Comparison of the equilibrium correlations - Test DNB9
61

The values of the wall temperatures and of the heat transfer coefficients,as they were calculated with the equilibrium correlations at two differentaxial positions in the bundle, are compared in Fig. 29 to each other and
with, the values determined from the test.
The comparison of the values of the wall temperature, calculated with the
non-equilibrium correlations, of the heat flux, of the steam temperature, andof the actual steam content is shown in Fig. 30.
DN299
t-
CORRI COIPARI SOiN DN2 g CORR. C01"'PARISON1
E
U
TIME STE Cm 327 CM1 T IME TE_ C-7 327 C:"'
C,,
C-,
I-
u-II-0U
u-iI-U,
-J
I-U
TIME S CE 3 :327 TIME 55 *EC3m 327
Fig. 30: Comparison of the non-equilibrium correlations - Test DNB9
62
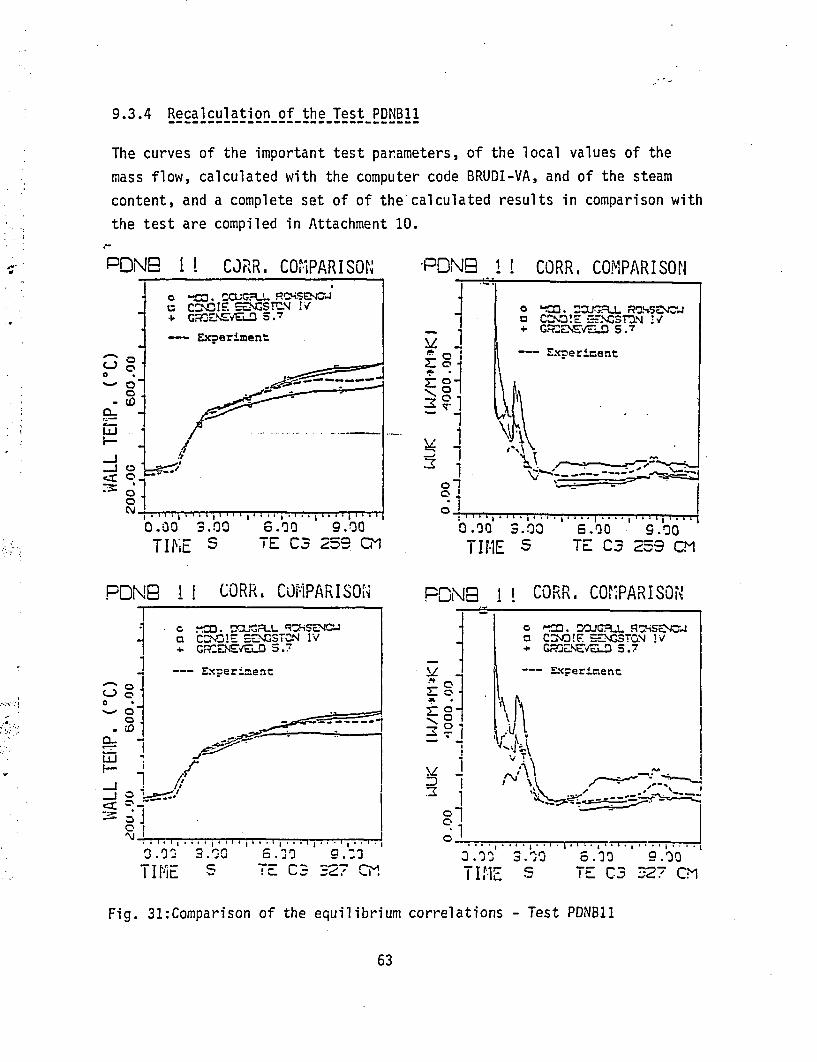
9.3.4 Recalculation of the Test PDNBl1
The curves of the important test parameters, of the local values of the
mass flow, calculated with the computer code BRUDI-VA, and of the steam
content, and a complete set of of the'calculated results in comparison with
the test are compiled in Attachment 10.
PONE 1 t CJ~RR CO1"PARISON'
U c:>n!S: SEr-\STrM IIV+ G~rMZY'ELD S.7
E- xperiment
5-
,PDNE 1! CORR. COMPARISON
.1!
TINE 5 TE C3 259ý CM
PONG 1 1 CORR. COi1PARISOIN
TIM*E S TE C3 25591 Cii
P-DN9 CORR, C01";PARISON
0
0~
I--J-J
p.
-.J 3n.0~ 6-.'n 3 J .
TIME S~ 77 C3B 327 Cii T I la *S T C. 52. C
Fig. 31:Comparison of the equilibrium correlations - Test PONBII
63

The values of the wall temperatures and of the heat transfer coefficients,
as they were calculated with the equilibrium correlations at two different
axial positions in the bundle, are compared in Fig. 31 to each other and
with the values determined from the test.
9.4 Evaluation of the correlations for the calculation of the heat transfer
coefficients in the steam-droplets cooling region
The recalculation of the selcted tests with the utilization of the verious'
correlations for the calculation of the heat tran'sfe"r --coefficients in the
region after the exceeding of the critical heat flux showed, that none of
the selected correlations can be recommended for the entire scope of the
test parameters. In the recalculation of the tests with intermediate tohigh steam content (0.5 < X < 0.9) and with intermediate mass flow density
(1300 to 1800 kg/m 2-s) there could be obtained a good agreement between
calculated and test results if the modified correlation of Dougall-Rohsenow
was used for the calculation of the heat transfer coefficients. In the
recalculation of the tests with a lower mass flow density (G < 1000 kg/m2-s)
the curves of the measured wall temperatures were better reproduced with
aid of the Condie-Bengston equation and partially also with that of Groene-
veld. The application of the newer non-equilibrium correlations showed
to be rather complicated and did not lead to a better agreement between
the calculated and the test ~results.
- - 64---- ----
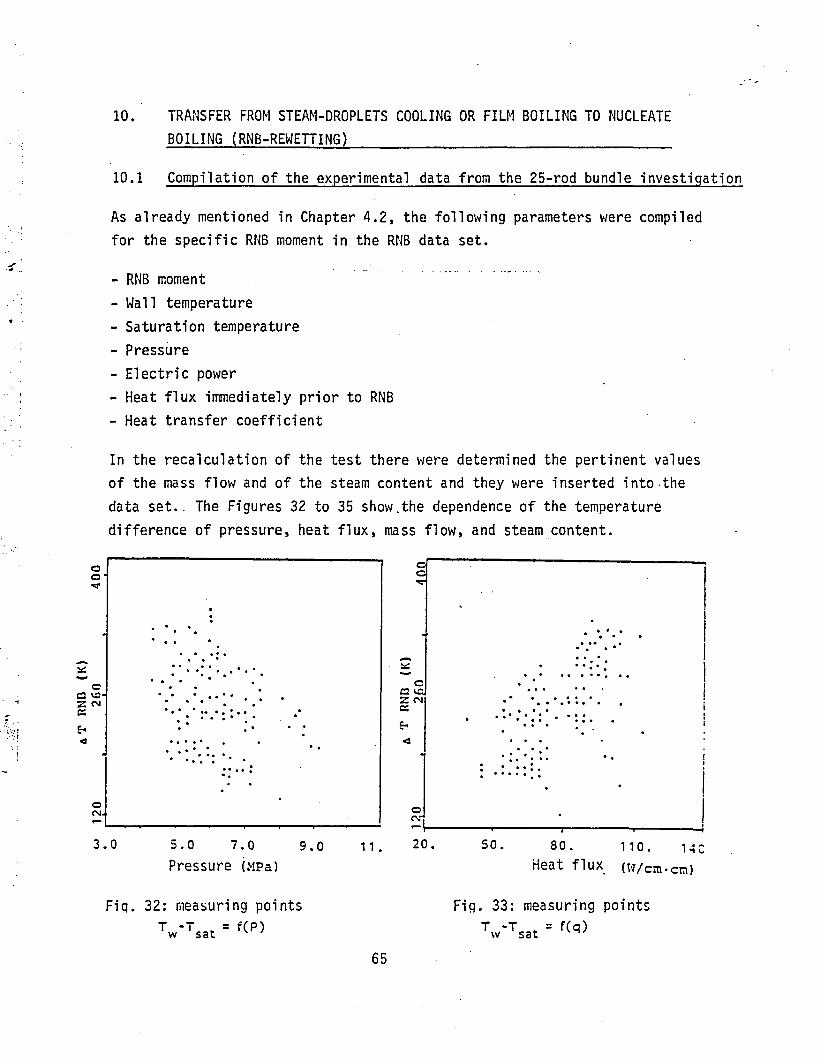
10. TRANSFER FROM STEAM-DROPLETS COOLING OR FILM BOILING TO NUCLEATE
BOILING (RNB-REWETTING)
10.1 Compilation of the experimental data from the 25-rod bundle investigation
As already mentioned in Chapter 4.2, the following parameters were compiled
for the specific R14B moment in the RNB data set.
- RNB moment
- Wall temperature
- Saturation temperature
- Pressure
- Electric power
- Heat flux immediately prior to RNB- Heat transfer coefficient
In the recalculation of the test there were determined the pertinent values
of the mass flow and of the steam content and they were inserted into-.the
data set.. The Figures 32 to 35 show.the dependence of the temperature
difference of pressure, heat flux, mass flow, and steam content.
C0,
3.5.0 7.0
Pressure (M.Pa)
9.0 11 . 20. so. 80.
Heat flux110. 140
(W/crn -cn)
Fiq. 32: m~easuring pointsTW-T sa = f(p)
Fig. 33: measuring pointsT WT sa (q)
65

C-
E-4-
0.0 2.0 4.0 6.0 8.0 0.1 0.2 0.3 0.4Mass flow (kg/s) Steam contenXt
Fig. 34: Correlation of G to TwT sat Fig. 35: Correlation of X to T -T sat
10.2 Correlations for the calculation of the minimum critical heat flux and
of the minimum temperature difference with rewetting
The transfer from steam-droplets cooling or film boiling back to the nucleate
boiling in the high pressure phase of a LOCA was thoroughly investigated
only after both nuclear LOFT tests (L2-2 and L2-3) had been conducted. Forthe calculation of the minimum critical heat flux or of the minimum- temperature
difference with rewetting, in these investigations were mostly used the
correlations of Berenson, Henry and Iloeje.
Berenson /61/ used his correlation for the determination of the heat transfer
coefficient in the proximity of the minimum of the Nukiyama boiling curve
(Fig. 14).
with a = {O/[g(pf~pd 111/2
The Zuber correlation for the calculation of the maximum critical heat flux
was modified by Berenson and adapted to the conditions with rewetting.
66

q =iný0.09.P (92)lga(fPd/P-d 2 / (92)
The equation for the calculation of the minimum temperature difference withrewetting was obtained by dividing the equations (87) and (86):
Clg-(f-d)11/2.n/( -d 11,3 (93)
The minimum temperature difference resulting from this equation was used asthe basis for the development of further empirical correlations.
U22er~v /82/ investigated, among others, the influence of the relative values
upon'the magnitude of the monimum temperature difference and he established
the following equation:
0 6C(T _T )/(T -T )J=0.42 -(A]*min,H min,B min,B f
(94)
wherein A = [*/Af.pf-Cpf/4A." P*'CP ]*[Ah e/4Tmin,]
and T min,8 =6T min, 8 + Tsat
Iloeje et al /63/ developed an empirical correlation, in which the influence
of mass flow and steam content is taken into consideration and he determinedthe correlation coefficients based on own tests.
A~TmnI = 0.2 9*ATiB(1-0.295-X2 4S)(1+(G.10-4) (95)
The tests with an internally flowed-through tube were conducted within the
following range of the test parameters:
68 ;5 G ;5 340 kg/mz*s
0.3 9 1
P = S. 9 MPa
D =0.0124 - internally flowed-through
67

10.3 Investigation of the correlations based on the results of the 25-rodbundle tests
During the recalculation of the tests DNB3 and DNB9, the values of theminimum temperature difference and of the minimum critical heat flux werecalculated with the aid of the correlations (93), (84), (95), and (92).
DN9 3 TEST DM8 3 TLES T
Z,1 OTo test
SOTM!N !LCL.C
Id:
zz
-JLU0
0.00 3.00TIME S HEIGHT 2-59CM TIME S HEIGHT 327CM
DM8 9 TEST
~0.(~0
0*Zo-(0
I--IU0~~~
TIME S HEIGHT -327CM
Fig. 36: Comparisons of the correlations for the calculation of ATmin
68

In Fig. 36 are compared the values of the ATmi n with the temperature~dif-
ference between wall and saturation temperature, determined from the test.
Fig. 37 shows the comparison of the local heat flux with the values of
qmnwhich were calculated with the Berenson correlation (92).
ON9ES TESTr ONE 3 TrEST
z0
ONE 9 TE~ST
CD
0
N aC C.1 IN =- J-NS4
ONE 9 TEST
o aCCHW/ci1CM
c~ 1 I1N
Oen
o 1.'
TIME S HEIGHT 2590CM TIME S8 .1)O
HEIGHT,1 27 1.
Fig. 37: Comparison of the minimum and actual heat flux
69

10.4-- Evaluation of the correlations
From the comparison of the minimum temperature difference, calculated withthe aid of correlations, with the test results it follows that all threecorrelations rendered too high values of ATmi n* The Berenson correlation
for the calculation of the minimum critical heat flux (KHB) [CHF) is mass
flow and steam content independent and, thus, inadequte for the applicationto the conditions in a flowed- throuqh coolant channel.
Further, it has to be established that precisely for the parameters thatare typical for the high pressure phase of a LOCA there exist only a fewpublished test results. The experimental results, determined within theframework of the 25-rod bundle tests, are thus very valuable and they canbe used for the verification of the correlations and models.
70

11. DEVELOPMENT OF A NEW CORRELATION FOR THE CALCULATION OF THE HEAT
TRANSFER COEFFICIENTS IN THE STEAM-DROPLETS COOLING REGIME
The comparison of the calculated and test results in Chapter 9 showed, that
none of the used correlations for the heat transfer coefficients in the
steam-droplets cooling phase can be recommended without limitations to be
applied to all of the test parameters. The individual correlations, that
were developed and verified based in the majc~rity of the cases on deadbeat
investigations, covering only a certain phase of the important parameters,
did show significant deviations from the test results ascertained from
the 25-rod bundle tests. Also the use of later models, in which the
thermodynamic non-equilibrium between the two phases was taken into con-
sideration and which separated the heat transfer mechanism into individual
steps, did not lead to an approximation of the calculated time behaviors
of the wall temperature to the test results. Therefore, each of the
heat transfer processes during steam-droplets cooling was throroughly
investigated.
Figure 308 shows the heat transfer meachanism in the steam-droplets cooling
phase.
.X1Qd SUPERHEATING
qwdI (1-Ff)
q TOT - T, EVAPORATIO'N
IqWtT*F;
Fig. 38: Model representation for the heat transfer in the steam-droplets
c-ooling phase
71

According to this consideration, the entire heat flux density is made up
of two componrents:
= ~d (1-Ff) + q w,T P Ff (96)
wherein cy~ - is the amount of heat per surface unit of the heated wall,
eliminated by the steam phase (convection and radiation)
and qw, - is the amount of heat per surface unit of the heated wall,
eliminated by the water phase (convection, conduction,
radiation).
11.1 Heat transfer between wall and steam phase
For the cakculation of the heat transfer coefficients between wall and the
steam phase there were used not only the correlations given in Chapter 6(equations 8 and 9) but also the Hadaller correlation (equation 80) and
the Chen equation (equation 80)'derived from the Reynolds-Colburn analogy.
DM8 3 CORR. CUMPARES"OiN DM8 CORR. COMPARISON'
-14F11 :-i 1 C MCMGO
0--- Zxperizent
-40 -r
-JE-
-j Ex~eriment -. 0
.Q .0 .0 .00.00 3 .0 0 6.00 9.-00TIME S TE C3 259 CM TIME S TE C-3 2-59 CM
Fig. 39: Comparison of several correlations for the calculation of the
heat transfer coefficients with forced steam convection
72

The processes of the wall temperatures and of the heat transfer coefficients,
calculated with these correlations, as they were determined in the recal-
culation of the DNB3 test, are shown in Figure 39 and they are compared
with the experimentally established values of the entire heat flux density.
For the calculations of the Reynolds number in the correlations, there was
firstly taken the homogenous steam velocity and the density of the steam.
The heat flux density was calculated in this case with the entire temperature
difference between the wall and the saturation temperatures. As shown by.
the results, the heat eliminated from the wall by the pure steam convection
is too-low. If it is postulated that between the droplets present in the
steam flux and the wall there does not take place a direct heat transfer,
and the heat is eliminated from the wall solely by the steam convection,
the steam velocity has to be considerably higher as the one calculated
with the homogenous statement. In other words, there has to exist a con-
siderable slippage between steam and droplet.
Therefore, the known equations for the calculation of the slippage and the
drift correlations were set up and used for the determination of the'steam
velocity.
1.1.1 Comearison of various slip2age and drift eguations
For the calculation of the slippage there were used the following correlations:
a) Ahmad correlation /64/:
SA= (/d0.20 G* )-0.016 (7
b) Groeneveld modification of the Ahmad equation /65/:
Soo = 0.5 . (S A-1) + 1 (98)
c) Hemn correlation /66/:
SH ~ * .7.5 (99
73

The values of the slippage, calculated with these correl~ations, and the
therefrom resulting courses-o? the steam velocity are compared to each
other in Fig. 40.
DN9 3 CORR, COMTPARISON
Cz,
Fig.
~~ C-
b-o sb 6.0 90
TIME S H I HT 22 7r_ w40 oprsno vrossipg
0.00 3.00 6.00 9.00TIME S HEIGHT 227CM
equations
For the calculation of the drift there was used the Ishii correlation /67/:
U jý(1-qi) - .12- ag.P Pd/ d]02 (100)
(101)and U d =C 00) + U
The course of the steam velocity, calculated with this correlation, is com-
pared in Fig. 41 with the mean steam velocity with homogenous flux.
74

0.00 3.00 6.00 9.00TI ME S HEIGHT 927 CM
Fig. 41: Comparison of the steam velocities calculated with and withoutdrift
In Figure 42 are shown the calculated courses of the wall temperature and
of the heat transfer coefficients. For the calculation of the Reynolds
number there was used in this case the steam velocity calculated with the
Groeneveld correlation. As shown by the comparison of the results, the
influence of the velocity calculated with slippage is not significant upon
the course of the wall temperature. Therefore, there was maintained the
assumption of homogeneity, as it was also recommended by many authors for
this sphere of the steam-droplets coolong.
a
<0
u0~
Lu
V
Fig. 42: Comparison of the wall temperatures and the heat transfer coefficientscalculated with and without slippage
75

11.2 Heat tranfer between wall and droplets
For the determination of the heat transfer between the heated wall and the
individual droplets there was first taken the following assumption:
- The wall temperature lies above the Leyden frost temperature.
- The realtive velocity between droplets and wall can be disregarded.
*(The evaporation time of the droplets lies in the order of 10-6 to
- The heat transfer by radiation between wall and droplets can be dis-
regarded /66/.
Under these assumptions, for the calculation of the heat transfer coefficient
-between wall and droplets there can be used either the correlation for vessel
film boiling (equations 60 and 63) or the correlation developed by Baumeister
(equation 75).
11.2.1 Determination of the surface inherent to the heat transfer between* wall and d roplets
For the determination of the surface (area) inherent to the wall-droplets heat
transfer there has to be determined the size of the droplet and the number
of droplets involved in this process.
11.2.2 Determination of the dropl et diameter
The mean droplet diameter was determined in most of the treatises in this
sphere from their own experimental investigations /54, 66 and 68/. Since
these investigations were normally conducted with low pressure, the values
of the droplet diameter determined in these treatises are inadequate for
the application in the high pressure region of the steam-droplets cooling.
For the determination of the size of droplets in this pressure range, among
others, two frequently used empirical correlations were developed:
a) Cumo correlation /69/
6T= 123.1 - (1-pr )0.32 [rjf/(G~x)] 12
76

wherein Pr = P/Pc wheei P =and PC 22.1 MPa critical pressure
b) Determination of the average-droplet diameter from the critical Weber
number
We kr 2konst, We =[pr * (Wd wf)2 6 T]1 a~
therefrom results for the critical droplet diameter
45T, kr = We kr o/[Pd(wd wf)2J (103)
The average droplet diameter can be then determined by means of various
9T= f6T r
statements.
(104)
This method for the determination of the droplet diameter
preclude the knowledge of the phase velocities and of the
the critical Weber number and is not used in this investig
the uncertainties for the determination of the phase veloc
11.1). The values of the droplet diameter, calculated wit
slippage according to the Groeneveld equation (equation 98
in Figure 43.
' D N9 31 [i~EWm cORii D N9 9 NLEW
does, however,
magnitude of
~ation due to
:ity (Chapter
:h We = 1 and
)are shown
CORR.
1 0-,J
0.. -
C 0 7RC-.1a T- MCC. "--c.10 T=
TI MET IME
Fig. 43: Comparison of the correlations for the calculation of the droplet
diameter
77

The values of the droplet diameter, determined with the.4C~u-mo correlation
in the recalculation of the DNB3 and DNB9 tests, are shown in Fig. 43.
The average value of the droplet diameter of 6 v is, however, too low
in comparison with the experimentally deternined values of 100 to 200 v.
The correlation constant in the Cumo equation was therefore adapted to
the experimental values, so that the modified correlation reads:
6T= 3.0 - 103 [.~/G (1- r(105)
This correlation will be henceforth used for the calculation of the droplet
diameter in the steam-droplets cooling.
11.2.3 Determination of the number of droplets
For the determination of the number of droplets involved in the heat transfer
between wall and droplets it is precluded that with the droplets in question
it deals with the droplets present in the boundary layer.
The boundary layer thickness is calculated with the Prandtl equation /70/:
6GS z34.2 /(0.5. Re)0.8?s (106)
The number of droplets per volume unit of the coolant can be calculated as
follows:
NT = 6 * (1-tb) / [nt.63. (107)
Therefrom results the number of droplets in the boundary layer per surface
unit of the wall:
NT,w = T - GS(18
Forslund and Rohsenow /54/ determined the number of droplets per surface
unit of the wall from the equation:
NTwz K -NT 2 /3 (10OS)
78

This equation was used for the calculation of the droplets mass flow
densi ty.
11.3 Heat transfer between steam and dtroplets
For the calculation of the heat transfer coefficients between steam anddroplets there are generally used the equations for the determination ofthe heat transfer coefficients for flow-encircled sphere.
Forslund and Rohse now /54/ used the equation
NU = 2 + f [Re, Pr] (110)
with f(Re,Pr) = 0.55 * [((wd-Wf ). 6T/rld Pd) 1 O * Prd 1' 3 (111)
The values of the heat transfer coefficients, calculated with this equation,are shown in Figure 44. The .veloci~tydAifference required for correlation(111) was determined with the aid of the Groeneveld equation (equation 98)
for slippage. The pertinent values of the heat flux density, which werecalculated with a temperature difference between steam and water phase of10 K, are shown in Figure 45 and they are compared with the wall-coolant
heat flux density determined from the test.
ONE 9 HTC1 AN~D 0 STEAFI--D RDOPLETS
rz1 ý'_IQ
in
< LL
TIME IS) HEIGHT 3927 CM TIME -(S) HEIGHT _2127 CNIFig. 411:HTG between steam and Fig. 45: Heat flux density of
droplets steam on droplets
79

11.4 Calculation of the individual components of the heat flux dtensitybetween wall and steam-droplets flow
The entire heat flux density between wall and coolant is according to the
equation (96):
qO = w'd*(- dl-Pf CT -T) +tw,T Ft.-(Tw-Tsa) (112) N
During the recalculation of the post-DNB tests with low mass flow rate, thecorrelations for the calculation of the heat transfer coefficients withforced steam convection were compared to each other and with the testresults /7/. From the comparison it results, that the best agreementbetween the measured and the calculated processes of the wall temperature
could be obtained with the aid of the McEligot correlation.
The value of the correlation constant in this equation was determined through
the adpation to the test results. The modified McEligot equation reads:T .
aCd 0.022 Re - Tr. .(d (1.3D' d 71ý9w
and is used for the calculation of the convective heat transfer between
wall and steam.
For the calculation of the heat transfer coefficients between wall anddroplets are sued the baumeister and Berenson equations (equations 75 and
63). If one postu;ates a spherical shape of the droplets, the equation for
Ff reads:
F= NT n-6 2/4] .(114)
The heat per surface unit, which can be eliminated t 'hrough steam convection
(with the assumption, that the steam outside of the boundary layer is not
superheated) can be calculated with the following equation:
A 0 0..5st -Q =0.022- :1 sat-r (ý )-T T )(w, d 0 d' d E--- s(T at ) 15
80

with F f from equation (114).
The heat transfer between wall and droplets results from the following
equation:
QW,T Cr BAUM *(TW-T sat~ Ff (115)
or
The entire heat flux dens~ity is then calculated as follows:
qTT 2 w,d + w,T(17
The individual components, as they were determined during the recalculation of
the tests DNB1, DNB3 and DNB9, are shown in Fig. 46 and they are compared
with the heat flux density calculated from the test. From this comparison
it results, that the heat flux density calculated from this model is much
too low in comparison with the test. But since the steam convection pai-t
was already calculated with the entire temperature difference, the steam-
droplets share~to be necessarily too low.
The results in Chapter 11.3 showed, that the heat transfer between superheated
steam and the water droplets is very effective. Therefrom, henceforth one
starts with the consideration that all droplets present in the boundary
layer do immediately evaporate because of the therein reigning great
temperature difference. The droplets mass flow density can be defined in
the steam-droplets flow as follows:
GT =N T-1"P6 (fc -/S.f *pf (118)
With the aid of equation (109) there is effected the correlation of the
droplets mas s flow density per surface unit of the heated wall as follows:
G N23.[.36w,T NTZ [T~.6 Wf *Pf(19
81

DM8 3 T ES T CDN9 3 TF E S T
C 03 A'or~S~
UN --- Experi~ent
X
o1L
7 I
Q~O.
0-U 0
('.4.
-jLI.
1-w00.
a C W O 1rr 0 -!C O T0 cwr =_a9tv I T~iAOTOT Er-F!SOZN
Zxnerirmner
£ I I I'
0.00 a3.0TIMES
I6 .00 9.00
HEIGHT 2591CM0.00 t3.00
TIME S HEIGHT9.00327C-M
DM9 9 T ES T
0~
U
X~
0_
TIME S HEIGHT
7
Fig. 46: Components of the heat flux in steam-droplets cooling
82

Another possibility for the determination of the droplets mass f-lix- density
results from the consideration for the calculation of the number of droplets
in the boundary layer according to equation (108). The mean mass flow density
can be calculated by using the mean droplets velocity in the boundary
layer as follows:
w,T T N GS *WfGS *n. 3/]-* (120)
The comparison with the droplets mass flow densities per cm2 of the wall,
calculated with the eqiations (119) and (120), is shown in Fig. 47.
ul
NjEW' CORR.
C.--A!T-R FSLUkC-71 Boundary layer
m'c 0N9 9LU(j)1
IN
U' 1
C:)C
N~EW CORR.
773 Boundary layer
5.Q 04OTIME S HEIGHT 227CM TIME Z HEIGHT 327CM1
Fig. 47: Comparison of the droplets mass flow densities
The heat per surface unit necessary for the evaporation of the droplets can
be calculated from the following equation:
Qw, T = Ah e * G T (121)
The entire heat flux density does then rsult from the sum of the two
components:
=TO ý w (1-F f + Qw(122)
83

DN9 3 T E S*T CON9 3 T ES T
7-0U
-J
U_
DN299 T E S T D0N 99 T ES T
CL
0
LL
0
40 C~a Mc S.1 _S04 Ow new corr....new corr.
-- Ex:_erizent
XV
C-
XN.
-J
o 'new corr.+ GWT new corr.
LxPeriment
Al I
. ý b i !I I
T IME4.1)0
S
........................................................................a
HEIGHT12.0012 5--C M
0.00 I .1 0 0
TIME SE6. 00HEIGHT
12.00O=27CM
Fig. 48: Components of the hat flux density acc. to the "two-component
model"
84

In Figure 48 are shown the components of the heat flux density, calculated
with this model, and compared with the test results. As shwon by these
results, the agreement of the entire heat flux densities can be considered
good.
11.5 Formulation in agreement with the similarity theory of the new model
for the calculation of the heat transfer coefficients with steam-
droplets cooling
The equation (97) can be expressed as follows:
=TO ý w,d -(1-Pf) *(TW-Td)+C w a Ff -(T ;T a (123)
Ad T 0.5with aw~d =0.022 *A Re 0 .8
*PrO.4 d
0 d d ý
Hereafter it is postulated that also a wT can be expressed in a similar
manner:
a.02. Ad pO.4T, d .R4 (124)
The Reynolds number is formed with the mass flow density of the droplets in
the steam-droplets flow.
Re7 [ND. w.*~S * DI/n, (12S
and with the exponent from the equation (119) there can be established the
following equation for awT:
,T T d.2 . (126)
The heat flux desnity share through the heat transfer between wall anddroplets per surface unit of the heated wall is then:
0 w,T Ow,T ' v (T sat)
85

After the inserting of the equations (123) and (126) into the equation (122),
one obtaines the expression for the entire heat flux density.
-(0.022 -~Re0 -8 Pr0 .4 T~ sa. 0
qTOT ~ ~ d d ýý ).(- T- a]
+[ Id 23 04 T st0.5+(.022 D * Re2'T Pr 0 4 ,ý )*Ff,(wTsd
W (127)
with Re T from equation (125).
The equation (127) can be written as follows:
= 0.022 A d [Re--1 )+R23j ]Pr. Tst0.5
TWTsat)(128)
and for the entire heat transfer coefficient results:
(ITOT = 0.022- Ld [[e3-1F j[e/CfjPr4.Tst0.5
In order to eliminate the difficulties that result in the practical applica-
tion of this correlation for the determination of the surface distri~butionfor the steam and droplets components (droplets diameter, number of droplets,and shape of droplets), it was attempted to determine the abovementioned
distribution with the aid of the steam content. The ratio between the
variables F f and x was taken into consideration through the introduction of
a corrective factor, which was defined as the proportion of volume and mass
steam content. The exponent of this corrective factor was determined
through the adaption to the test values.
K A )0-21(10
The correlation for the calculation of the heat transfer coefficients in
the steam-droplets cooling phase can then be written as follows:
aTT 0.022 [ (Re0-8-x)+(Re2/3.(1-X)]1.
* ~ŽO.1 Pr 0 4' sat. (131)X d TW
86

The physical characteristics in this equation were generally calculated
with the mean temperature between wall and coolant. The physical charac-
teristics of the Reynolds number are relative to the saturation temperature.
This equation for the calculation of the heat transfer coefficients was
used for the recalculation of the tests DNB1, DNB3, DNB9, and PONBil in
the phase after the exceeding of the critical heat flux (KHB). The
results of these computer runs are shown in the Figures 49 to 52 and the
calculated time behaviors of the wall temperature, of the heat transfer
coefficients, and of the heat flux are compared with the test results.
From this comparison it results, that the agreement between the calculated
and the test results in the sphere of the test parameters can be described
as very good. The comparison of the calculated time behaviors of the
wall temperature and of the heat transfer coefficients, calculated with
the aid of the new correlation and other equilibrium correlations, is shown
in Attachment 11 and compared with the test result.
87

SN 2 1. NEW CORRELATION
* 0
wL
F-
1-i
V.'
- I*0.
-I
- I1
ol
t...
~ a~7:1* !-Z~-E 3~7~i
ExperimerLt*................I
,jn1 2 . DTIME
,4.0
S.1ts- 1 , '' * I5.J 0
TIME S
ri
I NEW CORRELATION
HOEHE: HEIGHT
U-
U-
TIME :-
Fig. 49: Results from the recalculation of the test DNB1 with the application
of the new correlation for the calculation of the heat transfer coefficients
88

WE 3 1'Ei4 COIRRELATIOIN
'27:%I
C.120
cLo
I.j
wU
_3
=-00;TIME TIME S
UN
(cn IN..- .
Wx<
3 N~EW CORRELATION
HOEHE: HEIGHT
TIME
Fig. 50: Results of the recalculation of the test DNB3 with the application
of the new correlation for the calculation of the heat transfer coefficients
89

DNE99 N51!i CORRELATION
0
I.-
F-
4, - IZE 2Hr. Ir, nEf*`7!'
o--- Exmeriment
.F.
C31
I.Z
-- Experiment
1
0.110 1.00TIME S
! 2. 0 .0 02. .00TIME S
CDN9 9T-
I0-Z
NN2W1 CORRELATION
HOEHE: HEIGHT
TIME --
Fig. 51: Results from the recalculation of the test DNB9 with the application
of the new correlation for the calculation of the heat transfer coefficient
90

PCM9 1 1 NEWi CORRELATIO14
C-,
0
w
I-
wa-
wI--J-J
01frD
rol
1352''*
-- Experiment
-I
TIME SZ T IME
6 .'J~.5
S. 1
U.1
!ii NEW CORRELM\TON
HOEHE: HEIGHT
-- Experimenlt
* S
9/YZ
T IME
Fig. 52: Results from the recalculation of the test PDNB11 with application
of the new correlation for the calculation of the heat transfer coefficients
91

12. CONCLUSIONS
The 25-rod bundle tests, conducted within the-framework-of--the--research project
RS 37C, furnished a valuable experimental data-base for the verification of
the compiled models and correlations for the calculation of the critical heat
flux and of the heat transfer coefficients in the steam-droplets cooling
regime.
The verification of the various correlations for the calculation of the maximum
critical heat flux illustrated the limitation of the spheres of applicationof the individual correlations and showed, that none of the equations used inthe wide sphere 'of the important thermal and fluid dynamic test parameters
can be recommended fo r an accurate prediction of the DNB moment and point.
A similar result was shown in the verification of the correlations for the
calculation of the heat tra-sfer-coefficients after the exceeding of themaximum critical heat flux. Even the use of new models, which took into con-
sideration the thermodynamic non-equilibrium between the steam and water
phases, did not lead to the expected approximation of the calculated an~dmeasured time behaviors of the wall temperatures. It was further established,
that the herein verified correlations for the calculation of the minimum
temperature dofference between wall and coolant, and of the minimum critical
heat flux for the conditions with rewetting in the high pressure phase of
a pressure drop process cannot be used for a prediction of the rewetting
phenomenon at least in the sphere of the parameter combinations, cropped
up in the 25-rod bundle tests.
The application of the "two components correlation," developed for the cal-
culation of the heat transfer coefficients in the steam-droplets cooling
regime, led to a very good agreement between the test and calculated results
during the recalculation of the representative DNB and post-DNB tests.(Test parameter range: pressure 3 to 12 MPa, steam content 0.3 to 1 andmass flow rate 300 to 1400 kg/in2 sec).
To prove the general validity of this correlation there is necessary the
examination with the aid of further experimental investigations, which is
planned within the framework of the evaluation of various experiments.
92

13. BIBLIOGRAPHY
I1/ Agemar, Brand, Emmerling, Flittner, Koehler, LoserFinal Report on the Start-up of the Testing Device for thecontrolled bundle testings and on the first tests with aPWR 25-rod bundleTechnical Report KWU R52-3015
/ 2/ Agemar, Brand, EmmerlingPWR Main Tests with a 25-rod bundlePart 1: Experimental Implementation and Documentation ofthe Test ResultsKWU-RE23/012/77
/ 3/ Emmerl ingPWR Main Tests with a 25-rod bundlePart 2: Calculation of the Heat Transfer CoefficientsKWU -RE23/029/77
/4/ HD-Heat Transfer in 25-rod bundle testsTest EvaluationPSP Ingenieur-Planung No. 8204
I5/ H. Karwat, K. WolfertBRUCH-D- A Digital Program for PWR Blowdown InvestigationsNucl. Eng. Des. 11, 1970, p. 241-254
/ 6/ K.J. Liesch, F. Steinhoff, I. Vojtek, K. WolfertBRUCH-D-02 - A Computer Code for the An'alysis of the Fluid andThermodynamic Processes in the Primary Loop of PWR withlarge LOCAsMRR-I, Laboratory for Reactor Controls and Plant Safety
/ 7/ I. VoitekPWR-25-rod bundle testsVerification of the conducted DNB and post-DNB TestsMRR-I, December 1976
/ 8/ I. VojtekEvaluation of the 25-rod bundle Tests with the Computer CodeBRUDI -VAGRS-A-208, September 1978
/ 9/ F.W. Dittus, L.M.K. BoelterHeat Transfer in Automobile Radiators of the Tubular TypeUni. of Cal. Publications in Engineering, Vol. 2, No. 13, pp'443-461October 1980
/10/ E.N. Sieder, G.E. TateHeat Transfer and Pressure Drop of Liquids in TubesIndustrial and Engineering Chemistry, Vol 28, No. 12, pp 1429-1435
93

/11/ D.M. McEligot, L.W. Ormand, M.C. PerkinsInternal Low Reynolds Number Turbulent and Transitional Gas Flowwith Heat TransferJ. of Heat Transfer, Trans ASME, May 1966
/12/ H. HausenRepresentation of the Heat Transfer in Tubes through GeneralizedExponential equationsVDI-Zeitschrift, 1943
/13/ K.J. Liesch, G. Raemhild, K. HofmannFor the Determination of the Heat Transfer and the Critical Heat. Fluxin View of Special Conditions in the Coolant Channels of a PWR withlarge LOCAsMRR 150, 1975
114/ W.H. Jens, P.A. LottesAnalysis of Heat Transfer, Burnout, Pressure Drop and DensityData for High Pressure WaterUSAEC Rep. ANL-4627, 1951
/15/ I.R.S.-Thom et alBoiling in Subccoled Water During Flow Up Heated Tubes or AnnuliProc. Instr. Mech. Engrs. 1965-1966, Vol . 180, 3C, 1966
/16/ J.G. CollierConvective Boiling and CondensationMcGraw-Hill Book Company, 1972
/17/ J.C. ChenCorrelation for Boiling Heat Transfer to Saturated Fluids inConvestive Flow1-EC Process Design and Development, Vol. 5, No. 3, July 1966
/18/ V.E. Schrock, L.M. GrossmannForced Convection Boiling in TubesNucl. Sci. and Eng. 12, pp 474-481, 1962
/19/ S. NukiyamaMaximum and Minimum Values of Heat Transmitted from Metal toBoiling Water under Atmospheric PressureJ. Soc. Mech. Engrs., Japan 37, 53-54 and 367-374, 1934
/20/ S.S. KutateladzeFundamentals of Heat TransferEdward Arnold (Publishers) Ltd., 1963
/21/ ,N. ZuberHydrodynamic Aspects of Boiling Heat TransferOh. D. Thesis, University of California, Los Angeles, 1959
/22/ Y.P. Chang, N.W. SnyderHeat Transfer in Saturated BoilingChem. Progr. Symp. Ser. 56, No. 30, 1960
94

/23/ 5.5. Kutateladze, A.I. LeontevSome Applications of Asymptotic Theory of the Turbulent BoundaryLayerProc. 3rd Int. Heat Transfer Conference, 1960
/24/ L.S. TongBoiling Heat Transfer and Two-Phase FlowJohn Wiley, Inc., 1966
/25/ D. MainesSlip Ratios and Friction Factors in the Bubble Flow Regime inVertical TubesInstitut for Atomenergi, Kjeller, Norway, 1966
/26/ F.G. Thorgerson, D.M. Knoebel, J.H. GibbonsA Model to Predict Convective Subcooled CriticalTrans ASME Series C, 96, 1976
/27/ M. Monde, Y. KattoBurnout in a High Heat Flux Boiling System withInt. J. H. M. Transfer 21, 1978
/28/ Y. Katto, K. IshiiBurnout in a High Heat Flux Boiling System withof Liquid through a Plane Jet6th Int. Heat Transfer Conference, 1978
/29/ L.S. Tong et alInfluence of Axially Non-Uniform Heat Flux on DNI8th National Heat Transfer Conference, Los Angel
Heat Flux
an impinging Jet
a Forced Supply
Bes, 1965
/30/ L.S. TongBoiling Heat Transfer and Two-Phase FlowJohn Wiley, Inc., 1966
/31/ S. MiliotiA Survey of BurnoufECorF61Thtions as applied to Water Cooled NuclearReactorsM. Engng. thesis, Pennsylvania State University, 1964
/32/ L.S. TongPrediction of Departure from Nucleate Boiling for one Axially Non-uniform Heat Flux DistributionJour. of Nucl. Energy, Vol. 21, pp 241-243, p967
/33/ R.H. Wilson, L.J. Stanek, J.S. GellerstedtCritical Heat Flux in a Non-uniformly Heated Rod Bundle9th Winter Annual Meeting, Los Angeles, Cal., November 16-20, 1969
/34/ D.C. Leslie, KiroyApplication of Flow Modell to Predicting Burnout under TransientCondi tionsAEEW R542, 1967
95

K
/35/ W. BeldaDryou-t. delay with LOCA in Nuclear ReactorsDisse'rtation TU Hannover, 1975
/36/ F. Mayinger, W. BeldaSome Deliberations and Measurements Concerning Burnaout-DelayDuring BlowdownEuropean Two-Phase Flow Group Mtg., Harwell, 1974
/37/ Y.Y. Hsu, W.D. BecknerCorrelation for the Onset of Transient CHFUnpubl ished report
/38/ P. Griffith, J.F. Pearson, R.J. LepkowskiCritical Heat Flux during Loss-of-Coolant Acc dentNuclear Safety 18, 298, 1977
/39/ B.C. SliferLoss-of-Coolant Accident and Emergency Core Cooling Models for'General Electric Boiling Water ReactorsNEDO-10329, 1971
/40/ V.N. Smolin et alTeploenergetica No. 4, p. 54-58, 1967
/41/ L. Biasi et alStudies on Burnout, Part 3Energia Nucleare, Vol 14, No. 9, September 1967
/42/ Bertoletti et alHeat Transfer Crisis with Steam-Water MixturesEnergia Nucleare, Vol 12, 1965
/43/ J.H. AwberryJ. Iron and Steel Inst. 144, 1941
/44/ A. Bromley, R. NormanHeat Transfer in Forced Convection Film BoilingInd. and Eng. Chemistry, Vol 45, December 1953
/45/ Y.Y. Hsu, J.W. WestwaterAl ChE Hournal , Vol . 15, 1958
/46/ P.J. BerensonFilm Boiling Heat Transfer from a Horizontal SurfaceJ. of Heat Transfer, Vol 83, August 1961
/47/ R.S. Dougall, W.M. RohsenowFilmboiling on the Inside of Vertical Tubes with Upward Flow of theFluid at Low Qualities'II-T 9079-26, September 1963
96

/48/ .Z.L. Miropolskij-W t rM x u ei S ea-Heat Transfer in Film Boiling of Steam-WtrMxuei ta
Generating Tubes
Teptoenergetica Vol. 10, No. 5, pp 49-53, 1963
/49/ D.C. GroeneveldAn Investigation of Heat Transfer in the Liquid Deficient RegimeAECL-3281, December 1969
/50/ D.C. GroeneveldPost Dryout Heat TransferPhysical Mechanisms and Survey of Prediction MethodsNuclear Engineering and Design 32, 1975
/51/ K.G. Condie, 'S.J. Bengston, S.L. RichlienPost-CHF Heat Transfer Data, Analysis, Comparison and CorrelationUnpubl1i shed Report
/52/ J.D. Parker, R.j. GroshHeat Transfer to a Mist FlowANL-6291, 1962
/53/ W.F. Laverty, W.M. RohsenowFim Boiling of Saturated Liquid Nitrogen Flowing in a Vertical TubeJ. of Heat Transfer, Vol 89, pp 90-98, 1967
/54/ R.P. Forslund, W.M. RohsenowDispersed Flow Film BoilingASME Paper No. 68-HT-44, J. of Heat Transfer, 1968
/55[ K.J. Baumeister, T.D. Hamill, G.J. SchoessowA Generalized Correlation of Vaporization Times of Drops in FilmBoiling on a Flat PlateU.S.-AICHE, 3rd International Heat Transfer Conference, August 1966
/56/ S.J. Hynek, W.M. Rohsenow, A.B. BerglesForced Convection Dispersed Flow BoilingMIT Report No. DSR 70586-63, 1969
/57/ D.C. Groeneveld, G.G.J. DelormePrediction of Thermal'Non-Equilibrium in the Post-Dryout RegimeNuclear Engineering and Design 36, pp 17-26, 1976
/58/ G. Hadaller, S. BanarjeeHeat Transfer to Superheated Steam in Round TubesAECL unpublished Report, 1969
/59/ J.C. Chen, F.T. Ozkaynak, B.K. SundaramVapor Heat Transfer in Post-CHF Region including the Effect ofThermodynamic Non-Equil ibriumNuclear Engineering and Design 51, pp. 143-155, 1979
97

/60/ D.H.R. BeattleFriction Factors and Regime Transition in High Pressure Steam-WaterFlowsAus. Atomic Energy Coin. Sutherland 2232, NSW, Australia
/61/ P.J. BerensonTrans. ASME J. Heat Transfer, 83, 351, 1961
/62/ R.*E. HenryA Correlation for the Minimum Film Boiling TemperatureAICHE Sym. Series No. 138, Vol. 70, pp. 81-90, 1974
/63/ O.C. Iloeje, D.N. Plummer, W.M. Rohsenow, P. GriffithAn Investigation of the Collapse and Surface Rewet in Film Boilingin Forced Vertical FlowTrans. of the ASME, J. of Heat Transfer, May 1975
/64/ S.Y. AhinadAxial Distribution of Bulk Temperature and Void Fraction in aHeated Channel with Inlet SubcoolingASME J. of Heat Transfer, 92, pp. 595-509, 1970
/65/ D.C. GroeneveldThe Thermal Bahaviour of a Heated Surface at and beyond DryoutPh.D. Thesis University of Western Ontario, 1972
/66/ D. HeinModel Representations for Rewetting through FloodingDissertation, Techn. Universitaet, Hannover, 1980
/67/ M. IshiiOne Dimensional Drift-Flux Model and Constitutive Equations forRelative Motion between Phases in Various Two-Phase Flow RegimesANL-77-47, Argonne National Laboratory, 1977
/68/ A. GhazanfariExperimental Investigation of the Heat Transfer in a Droplet Flowafter Exceeding of the Rewetting TemperatureDissertation, Techn. Universitaet, Bochum, 1977
/69/ M. Cumo, G.E. Farello, G. Ferrari, G. PalazziOn Two-Phase Highly Dispersed FlowsASME paper 73-HT-18, 13th National Heat Transfer Conference,Atlanta, 1973
/70/ W. BohlTechnical Fluid DynamicsVogel Verlag, 1971
98

ATTACHMENT 1
Compilation of the important parameters at DNB moment (extract)
99

MR. HOUEII STABlim)
70:401"3
GH ICLImIct'.*cm)
150S 2.59151.5 2.5A9Iscs 2.5915c5 3.1815c5 3.li315c5 3.1815.6b 2.5:!151'6 2.51.1ISC6 2.5'!IMC 2.5915f6 2.5915C6 2.591506 3.10151.6 3.181546 3.1815-.7 2.5.i15!..? 2.5.)15t*7 2.5,j15 G7 2.591507 1.59W5( i.53)15C7 3.18154.7 3.11315C7 3.18.15. 0 2.531509 2.5,1509 2.5.i15-:9 2.5915C.9 2.59is :9 2.591509 3.181509 3.18C15-19 3.181510 2.591510 2.591513 3.101513 3.181510 3.181513 2.501513 2.5:15 13 Z.5971513 2.591514 2.5i1514 2.501514 2.5915 1§ 2.5915-14 2.591514 3.181514 3.181514 3.181515 51!15 :51515 2.591515 2.591515 3.181515 3.18
11-3 .11516 2.59151if 3.1815 16 3.18a
84 3.5 1603.02 0.5 134'.83 0.~5 136.
3z .5 1Z..03 0.5 12j..04 a.1. 122.04 1 ., 136.02 1.0^ 134.00V 1.0 13:..03 1.: 139.94 -3.5 142z.02 0.5 137.03 ).5 122.C4 o'.5 124.82 0.5 121.82 0.W 168.03 3.5 164t.04I 0.5 173.84 J.5 17'.02 j.! 167.P3 0.5 169.04 0.5 149.03 0.5 15;;.92 J.5 152.04 0.5 169.03 0.3 lol.82 3.c lbs.U2 0.5 163).53 32.5 162.84 3.5s 166.92 0.5 144.03 .3.5 146.04 .i.5 14n~.04 0.5 166.83 .).a 166.02 0.5 147.CV 3.5 11411.04 3.5 1,49.04 U.5 169.03 .3.5 162.02 0.5 16',.e3 L5 79.C4 1.5 121.03 0.5 16-3.02 1 .0 MIg.83 1 . . 13'j.8' 1.0 133.e2 .1.5 14-,.03 13.5 141.04 03.5 1141.04 I .t 133.03 1.5 12Z .02 1.3 128.84 1 .4) 13,2.02 1 .31 114.CV 1.2 114.-04 0 --114.
e - ., 17,~r.3 *3.5 154.04. 0.5 154.
144.136.L36.120.123.L22 .136.13q.13.1.139.142.137.122.124.
142.14d.1#46.144.143.123.126.126.153.1403.148.140.141.144.125.125.125.016 .
145.125.125.L26.
144.141.14Z.121.140.131.131.133.125.125.
133.-
IN0.13:
114.
148.126.120.
( OAR)I
107.
W13.N~2.
t.'3.1,;3.
118.112.
115.1-.9.
115.
117.
115.116.112.
112.112.I12.114.110.
115.119.114.
112.115.119.
111.
114.11:.112.116.
11G.
116.114.
10pNe CapeCKE151
0.163771 7.e124Co0.163771 7.F124i.303.163771 7.8124CO0.117633 10.41.34C0
13.117633 W1L.63420
0.t?1152 8 .2716700.131152 8.271670
0.131152 8.2716700.131152 8 .2716 7'20.131152 8.2716700.11.3813 WU.436CO0.1'.3613 10 .4346r000.1-.3813 1*.43146 0Q&.9.4169 8 .7252*.,0 .-94189 8 .728200C..'14189 8s.7'i2-2.:0C.':94189 13.72112';30..294100 8.1282:0O.0.S4189 8.7282:0.IIP.855 12 .6262CO0.128B855 12.t626230.109855 12.f252000.124239 8.21934"50a.121Z89 8.3932!00.12i289 8.j932!00.1242a9 8.33932500.124#289 8.3932100.124289 8.3932500.13ES72 8 .919903.138072 B.SC39100.132872 8.9.'39900.162266 7.3269CO0.162266 7.3269r0-3.14C996 9.Z621200.14.'996 9.C62130-3 I4C996 9 t.621200.18C299 6.4443100.18C299 &.4443500 IBCZ') 6.4443500. 118 -2 2)9 6.444350
11.144118 6.!438200.044118 6.!438200.144118 6.1%3P-100.144118 6..43820)*3.118276 7L.L45800.119276 7.C:45eO0.11827-6 7 .CI34580
100

ATTACHMENT 2
Compilation of the important parameters at RNB moment (extract)
101

15e7 3. L6 C415C7 !.6b C315C7 3 . G 041507 3.613 0215C7 3.77 C31507 3.77 04
M5i7 3.77 F131509 2 .0 0,j 41509 2.5.) C41519 Z.b' C3159 2. 5:. r215C9 2.59 C31509 2.5n) 0I15 ;9 .1.59 P31509 2.59 P4
15.9 3. Il 021M9 3.1A 031ISO 3 .. IL 0
1509 3.27 0215L9 3.27 F.31509 3.:7 E4ISLO 3.6a C'.15.19 3.Cm C41509 3 .6e 031509 3.68 a 21509 3.77 C3111V 3.77d F3150'? 3.77 e41510 2.59 C31510 2.59 P4Isla 2.50 e3I1!10 3.11: C4.1510 3.1 Il e02151.3 3.1if! 031510 3.10 0*1510 3.27 C31!510 3.27 P3151-3 3.27 021513 3.Z7 8415 IJ 3.77 C31513 3.77 e4
1513 3.77 021510 3.77 031s515 3.68 C4.1515 3.613 821515 3.bfi C3
1515 3.77 021!515 3.77 V031515 3.77 1 4
S.4.54.55.5
6 .-j
2.5
3.:
6-
6.56. :6.f6.5
7.57.'7.:
C.53.54 .:ý
3.C
5.:
ft .1)3.5~3.53.53.5
6.54..,4.0.
3.54.j6 .41
5.55.37. 17.;
64.54.
56.45.4!.
Lis.
9A..al..94.
021.7: .67.7'.*74.
65..60.
51.61.56.74.6L.67.93p.
913.9s.
a7.9'.72.67.62.'35.63.721.67.-
6'..67.64.
46.46.46.44.42.45.45.
115.
12j .be.944.a1.71.66.64 .61.65.5L.54.51.52.69.68.69.06.-58.41.6.3.
84.87.9..85.C2.82.1:5.03.64.67.G8.V7.6j.59.62.59.61.ezl.58.
f6. 17'.66. 170.: 41r~. 200.e6j. 16C. 4!C:. 290.
f:2. 17-.*62. 17C: 45C. M0.62. 17'.. 45,:. 280.
SIC. 2Vfl. 21:. 'a. 0.73. 24".. 530. 250.59. 13.. 144C4 310.62. 28f6. 27~. C. 2064. 28.. 56t0C. 2P,).e1. 29.. 57C. 280.03. 14 1.1:5. 230. I510.. 2bo.621. 23: S1C. 28u).62. 240. 52C. 280.59. 2: 52...0
t6. 23.. 500. 270.!6. Z3;. 51C:. .170.72. 16:73. 16.. 'o. 5.72. 16c. 4!C. 250.71. 16z:. #!':. 290.6b. 17..66. 18.-.. 4&C. 200).66. 17.1. 45C. 200.74. 27.10. 26'o 55C. 210.75; 27,.. 560 290.69. &2:.
71. 21L. 500C. 250).71. ZI . 510:*. 25o.
61. 210:.99. 23.. SIC:. 2120.65. 24 :. 53C. 250.61. 22. . Sec. 20.67. 16..:7.2. 16'. 4 ! C. 2-9.72. 16'. 45C. 2CM.69. t6,:. 4!1.. 290.
ift. L8 Z 45C. Z70.5e. 19C. 460. 2170.!*1 l 40.~ 46z. t054. 10.. 460. .70.!4 . 19:. . 46C. 270.1.5. Lac.. 45C. Z70.
(7.33q910 3O;C7 o'0.33511`2 2.99q971C0.339192 3.919770L..339192 3 099771 i0.339192 3.q94017I0ý.33 c192 3.99977470.339192 30'991V'C.243641.4bl'i0.Z24,691, 4.63R25'C.24!601 4.63!29:.C.124691 4.53!2e'0.24?691 4.631;2!f0-243691 4.63i"25'0.243691 4 .6 3; 15
o.2P4R25 '.Z94ffC
0 .F91125 4.2946!f0'.UA582 4.2044!tC0.2!q82! 4 .204'e'J
0ý.2eO!825 4 .214 I i00.2e;RZ5 4.294560.7.204934 6 .:2n 9-ofCC.29993! 6 02", 7rC.2q193! 6.22091C0i.290935 6 .120801'-1.2?1931 b.i:7091:0.29~q35 6 .0299le'o.29;0315 6.C2cc1C
%.;55 !.136q5o
O.2P!5Fe. 5 .1359xf::....891A 6 .54377 Vý.2.67914 6.543771:0).267914 6.`54171C0.267914 6.5*37tf0.267914 6.54!770.CG.26191t 6.54377'0.267914 6 .143 7100.267`114 6.14377C0.2!12".5 7.75I0l.26227! 7 .97RCE60C.262275) 7.07!C!i!I.'6227F 7.97Vq C V
v .3 It I-IJ4 .28!74 !0.3410e4k 4 e!74!f:C.349354 4."7''0"u.3'50!4 4.8!7'5'(..3496,4 4.SP74!f0 .3 4 1)F4 4 .8F74!#10.34.C084 4.11874!C
*N,
102

.R. ?COiIE STAU01.
M5U 2.59 0315CS 2.5'; 04is CS 2.517 0215CS 2.59 p 3ISO5 3.1.1 C415cs 3.1L e 821505 3 .IH. C31503 3.11- 0415.5 3.27 C31505 3.27 C2isCS 3.Z.7 a I151.5 3.Z7 8315015 3.68 C4151. 3.60 IPZ15 0 3.L0 C31505 3.633 0415 1:5 3.77 C 31505 3.77 P.31005 3.77 02?1515 3.77 E-41506 2.5.) C'.1506 2.51 C415C6 2.53 r215C6 2 .5: 031506 2 .Sr9 C31506 2.59 831506 2.39 041506 2.59 CZ1506 3.18 C.415S6 3.1 C315C6 3.10 0415C6 3.16 021506 3.27 C3ISO6 3.27 031IS. 3.27 021506 3.17 P415F.6 3.68 C'v15C6 3.65 C315C6 3 .61J 0'15cb 3 rift F21506 3.77 0315C6 3.77 03lI'S 6 3.77 04t1507 2-C-5 Cq1507V 2 .5 -1 r2.1507 2.50 V03
1507 2.5 04#15027 2.59 C315 07 2.59 04IS'.? 2.59 C21307 2.59 P 3195:7 3.1.1- C4.1507 3 .12! C41!;;7 34.1 C31SC7 3.1-1 a.,1!5;7 3.27 C31!1)7 3.27 !'1507 3.217 0215"? 3.Z7 F3
111.U1 I (1 Ul .C L(S) ill/c".C.10
f 'III(CAR I ( X
T1I-Nh 72.ASSER XPI.0(W) M'
(CC/i)
3 .7
3.5
3.53.515.
3.52 . ;6.0
3.54..
.20
3.56.1
2.5'S.!
6.06..J6.5
6.063.3
0.37.5
4 .,J4 .. )4.4
4 .55.05 .f54.55.54.S .5
9.5a.57.::
7.57.57.5
.9.5
9.
71.2.166.
U72.
97.023.
a.366,t..
79 .73.
75.
79.6.1.65.
63.
121.122.
96.364.
179.7-j.69..66.7j.75.7*.62.64.5'..63.62.
35.574.6 .0.
idB.I06.
on.07.Ea.7j.0l.72.6?.74.al.79.e-3.67.69.7^-.68.
112.123.
69.77.71.79.67.64.66.66.
6o3.67.57.66.67.
61.59.64.
ki.69.44.46.54.
51d.'7.'.6.
44.13.
7'.. 26.. 5C 2O74. 27C. 5~. 2391. 19.. 49C. 31.'0 .If4. 27.. 56C. 250 .t9. 221:.7?. zz * i. 29-1.69. 22. 51.. ISO.71. z21. SCC. 290.t4. 4"3.. 3*5. 25..5, 28J63. 23.. SIC. 280.62. 23':. SIC. 260.74 . 16%.
7 2. 12.. 420,. 3.C0.
ez. 162L. 42C:. - 29.
019 . 16.:. 4Z ZO71. 16 . 4!t. 2130.6A. 16.. 45Z. 29o.3
e9~. 25:I. i. 20
S4. 17. 4F0. 310.74. 254. 54Z. 290.
e. 2:. S7C. 280.!9. 29.. 57'.. zeo.U2. 27.. 55C. 280.62. 241ZV . 23.: 51C. 280.6:1 23C. 51C. 20o.62. 2331. SIC. 280.t5. -4..53. ;3:. SCC. 270.56. 241. 51C. Z'70.58. 22C. SCC. 280.7.,. 16 :.7%~ 16!- 45C. 250.7-C. 16C. 4!C. 290.7:4 . 18:. 47C.. 290.64. 17:.
112. 18C. -6C. Z-00.113. 17 Z'. 4!C. 280.04., 27:.t6. 24C. SFC. 2M.6'.. 27*.. 55C. 2N0.ti. !a.. SEC. NO0.52. '6-:
iZ.. 26C. 53C. 270.!6. 261'. 53C. 270.
!4. 27.. 54C:. 270.
56. 23.. 300. 270.56. Z2k. 49c. 220.
53. 21.. 4 e C. 2 V.)!5. Z4.:. 510. 270.44. 22:. 46*.. 260.
C, .2&*66*9 6 .1P7F!!L. .22'69q 6 .)P7P4-
v .226655 6 .?87P850.2286q9 6.46P7700.262861 6 .46'P77C-.242861 6IA'fi'771 C
02442861 6.46'71'.242P161 6.46671C
0.242861 6 .46:77l".242861 6 .406??.)'
4.373R14 5.39?1100 .37Z2814 5.302132P0.373814 5Sjq5I2'C.372814 i.3q912'0.3718114 .3.2814,P0.373M14 1.39PI200.37?914 it.198l2':2.3 7 ?114 5 .3v'9F12F0.2!t465 4.Ve7e7cC.236461! 4 .3P.7eopC.23*465 '.3q727P0.23646'S Sq37P V!C .27"465 4.Se 7PC..236465 4 .187F 7C0.226465 4.RP7P7'*C.2?1465 i .197Pl.7'0.301111 4 .312re:!
0.3f.101 1 4.312C6!:
w .3010311 4.312CIC0.3l01012 4.31206':0 .301011I 4.112idt0Z.ZOA8S1 6 .4 130!0.2q6851 6.41';CZC( Zieed4t 6 .4 [email protected] 6.41IC2':0.296951 6 .4 I"O't I.2:2685 1 6 .401902e
C.29C8S51 6.419CICC.2613Ce 3 .21111117.2.2613"8 3.24312'O.2613CS 3.24!11:O.V2 13195 .4U.Z-6130f- .4220'.ZA13'ýi 3.24212'0 .2 13 ̂ ! 3 .24312':0.2e13Z8 3.243121C.3224341 o.ý!Ce;'C .32434.3 3.P~20.324343 3-1Ffe2p0.3243'63 3:6C.324343 3.':Feti-.'2434' 3 f:A'I- z r
n.374,343 ?3O"1Z
103

ATTACHMENT 3
Comparison of the correlations for the calculation of the heat transfer
coefficients with forced convection
104
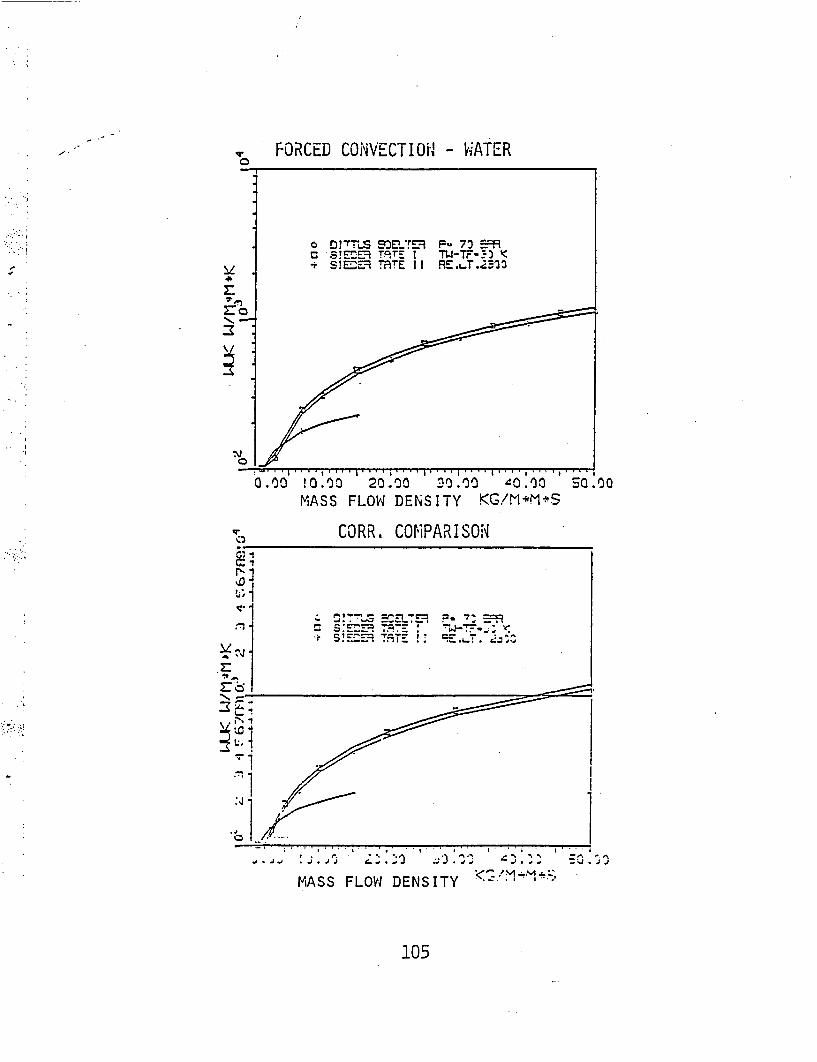
FORCED CONVECTIlON' - WATER
ro
!0.00 20.00 p0.00 40.00MASS FLOW DENSITY KG!M-*fr*S
CORR. COMPARISON
MASS FLOW DENSITY
105

CORR, COPI1PARI SON~
0
22
MASS FLOWi DENSITY KG/M-4M*S
CORR. COM'PARISON
A0 C!TTLs E5L-TM F3- 71, =-=a SEC-1- IATE I TW-TF-30 K
MASS FLOW DENSITY ~-"-M~
106

FORCED CONVECTION - STEAM1
2.00 4.00 6.00 S.00MASS FLOW DENSITY KG/M*r1*S
FORCED CONVECTION - "STEANI
.00 2.00 4 s
MASS FLOW DENSITY KGP/-v1-1 *&S
107

FOR~CED CON~VECT ION - STEEN1i
07
400 .01O soo.'33MASS FLOW DEN'SITY KG/M.*M-*S
FORCED CONIVECTION - STEAM
MASS FLOW DENSITY K/~~
108

ATTACHMENT 4
Comparison of the correlations for the calculation of the heat transfer
coefficients and of the temperature difference in nucleate boiling
109

CORR. CatPARISO.'-
mL~ -XS orr-s OT X13
.HEAT FLUX
-~ CORR. COI-IPARI SJN
HEAT FLUXW.MM

CO~RR. "U'CLEATE BOILINiG
MASS FLOW DENSITY KG/M-,M.*S
MASS FLOW DENSITY K CS/M-M !* S
ill

ATTACHMENT 5
Comparison of the correlations for the calculation of the maximum criticalheat flux
112

CORR. COHIPARISON
r -D
r-
CORR. CONiPARI SON
6
V CSE+j MIO.CE^~ rS11. I
MtLJ!-3 t )G C'WF~ -310 C
0.00 0.20 0.20 .0.'=I0.STEAM CONTENT
0.00 0.!o 0.20 0 .30ZSTEAM CONTENT
CORR. CON1PARISONCORR. COHIPARISON0
Lfl
(?p
-,Q
-;- i
i4f
ITM)n
aU
CE SL!7-:.S'-fL.! N -~ z
CCI. V.. SE
cFc<-!C
a I I aI I I I
O .~ 0 0.10 0.20 0.3STEAM CONTENT
0 .00STEAM CONTENT
Inside legends: Druck = pressure.Wand = wall
113

CO-R8l. CONAPRISOIN CORR, CONPAR ISOUN0
STEAM CONTENT STEAM CONTENT
C...0 CORR. COMPARISON4
1ora
*1
N,
CI.
GR! =! TNH
C! STCNG
9c.ur<- ! 43 O1 e-.FUU 1 ~3'1 C
a
=-S*iL -!F*!43i ERR
I I . I I . . . . . . . . I I ~*~l.* .~***I
.- STEAM CONTEN4T
Inside legends: Druck pressureWand =wall
I I I 1 1
STEAM CONTENT
114

CORR. COMPARISON I'.0 CORR. COfi-PARISON
0 0.20 0.30STEAM CONTENT
,.00 0.0 .! 3.20u 1 a.:STEAM CONTENT
0 CORR. COMiPARISdN
STEAM CONTENT
Inside legends: Druck =pressureW.'and =wall
f'.0
~0i- -
-- 2
CORR. COM'PARI SON'
c
TON7ý~ -31 C
~4.
STEAM CONTENT
115

ATTACHMENT 6
Comparison of the correlations
for the calculation of the heat transfer
coefficients in the steam-droplets
cooling regime
a
1.16

CORR. COi'~PARI'%SJN CORR, COiMPARI SON11
U,.
Cc~D!E--=j-sNGST IVMI-=~Ls1 I j
r.,
r.1
C
FLU10-200 ,C
I**. ~ ~. - r
b.00' 0.2 0.S 0 .75 I.0 0.O 0.25 0.50 0.~STEAM CONTENT
I ~
STEAM CONTENT
CORR. COITARI SON
x. I
tr InnIla-o GL~~HS~CW
~ ri
A Z~J' ~-~NC5~N IV~
*rý--NO =10iCc=50 cGm-q * a ~ ~
EN~V~fl 3.' Cý-.Eo
a I S
12.ýJ 0 .25 0 .10 0.75
STEAM CONTENT
.. 1. T I.1.) 0..5 . ..5 I ..0
STEAM CONTENT1 .01--
117

CORR. CO1'PARIS-ili CORR. CNjIPARI SON0
N-
tT,
W
o c-L-ME.co -N !-7,c5z, IV
.11 R=U.SE! DP-!30
c-~~-A LC.-4ST !V 7FL\Dl-=!oo c
G2!I I
G.25 .0.0 0.7STEAM CONTENT
I.30 0.00 0.25 0.~0 0.75
STEAM CONTENT
.0-LI,-
ro
V0
Ln
2'.rzLc
o~ CzG~-\:Cw0 M. .cc t--L- Rl:C4~ C*~\E'/~..IV
Aii= RD!--G~N77-J!05o` C
00
A*1
C:N : E-=-lNG57TZV IV
4
FUJ!-~OC~l~~RJD=~C
I
STEAM CONTENT0.00 0.5 .0 .1.
i
STEAM CONTENT
118

0 CORR, COM"PARISON CORR. COM.-PARISONi
to.U,-4.-
~Lm4,
*
'I,
(.40
UrZEINSIV8 f) S. 7A C !E-ENGSTU-4 IV
MIP.PO.SKIJ
P. 6 -0 rAf7FLUIQ-_ý00 C71.Pf'J =700 C
to.U,.4..
4,
4
;ii0
0-I.A
DCL*L-=ýlcECWmzi .flLi' 6:-rJA~
CCNO! E-EN'riSTC IV
Fl- 6 0 EARTFLL'IO-500 C7WP?\U =7^,0 C-1 00M~G/mo.m's
STEAM CONTEN~T0.130 0.25s 0.50 0.7S5
STEAM CONTENT
CORR. COMPARISON,,----CORR. COM~'PARISON
to.
to.
AI.
-j0D
r NE~P~ ~ =
~ G=I5-v-. /M
C
A
LL~~L~S~.4CW~ _ =- El. 1=
7 *r-Nl, C'-
-..... I
0.00 0.25 030 0 ~75 a0. 0 0.;2 030c 0 .73
STEAM CONTENT .qTFAM CnNTENT
119

0 CORR. COMPARISON CORR, COM1PARISON
X0.tr.I
I.,I
M
I44'
r- c?:zEvfL) 5.7 7F*UJ!O-3^j C-A Ca !E"-ýNC STCLN 1V T.v.Ft',- C
GIZNW LL-M5.7- P-!C c I=_M.7F%2j!0-2Q C*ratND .0 c
: .- I .I I I . , . I
0.00 0.25 o.Eso 0* .1
I .30STEAM CONTENT
CORR. COPIiPARISON
0.40
*%
STEAM CONTENT
CORR. CO.'IPARIS0N
=01EIEý: .7 K1O-"~ ~ !V P~FT~rf =!,I
* I
0 .3- 3 .;_STEAM CON~TENT
I .33 G.10 0.ý 0.co 0.75STEAM CONTENT
120

ATTACHMENT 7
Test parameters and results from the recalculation -Test DNBI
121

Test parameters and local values of the mass flow and steam content
I- C ~.. ~
w1 w~1 UEtihT.i.T inlet
00
< 0
TIME ~ ~ C (S(IMDS
- (L.'n-~I.o 4CL ~7C~
"77Cý
0.0 2.00 i C 0R01 inlet0 .0 .0 80IE (ITM S
TIME(STIM CS) H-EIGHT B27 CM
H bundleT i nlet
1z
CL
01-
TIME T3 P IM) EIH 2211 CM
a,122

Comparison of the equilibrium correlations
LD
LD
11.
1W
0.00 2.00 4.130 6.00TIME S TE C3 25=9 CM
b.00' 2.00 4.'00 -6.00TIME 0- TE C3 259 CM1
* MCC. rCaJG--L. FRCHSM'4,.J* CCND!F St.:ýSTON IV* UCENEYSLO 5.7
Experiment
<0
kv0.00 -2.00 14.00 6 .00TIME 5 TE C3 327 CM TIME *-S5 TE C3 327 CM
2J
- 'I
oC2-NEl!E SEýS70- IV
-- Exneriment~L.
a
0'0N
-s
0 .00r i ME
2.-00 .4 , 6.0II* 3 iI - 2.~TIME. q- T7-3 377 '
123

Comparison of the non-equilibrium. correlations
LU
to
rUz-.
N.2
~1~
C-,
0
LUI
t
.0.30 . 2.00 -. 0 '63TIME % E C3 25-9 (-l1: TIME 5 TE. C3 2591 0`
u
.7.
TIME S TE C3 27COM
L;
u
U
T IME S,:. ý 8..
TIMIAE.. j.J ~
- .. - S I
124

ATTACHMENT 8
Test parameters and results from the recalculation -Test DNB3-
125

Test parameters and local values of the mass flow and steam content
0
Cn
CtR
0
C . I E:N-rR!TT inlet
1:
0 .13( TI14
IS)
£ I
TIME
. I I - . -6.0-3
I S )
V
0z I
H EINTRITT
inlet
LU
0lTI MIE S I
h el, S
CE- ý-CF--E ?-2 01L-1
0
TIME IS) HEIGHT 2327 C-M
CD CUt*A
3:
U-
bundle inlet
aU != - *'N I?-
!a; NI h ih
LUU
zo0ULUý-,Zjcn %
Cbundle inlet
X BTr
X ;-rX C I I
TIME So%
TIME
a
126

Co-mparison of the equilibrium corrclations
---] Experimnent
. 1
v
-J-J o .00
TI ME S6.00 9.00TE C.= 259 CM TIME S TE C3 259 C-
.4
-:1
cN,1
_j
=... =CLjC.-L ROI,5C--WC C'JDE E=-N'ZsT3MN 1V
+. I 57-
-- Exneriment
v
.I
I.
~~=1TIME S 7E C3 B27 CM
0.02 2-00 6 .00 9.00TIME S* T#E- C 3 3 227, C
C, Exmeriment
4 :-
0L i.
.i*.*. \~L~1 g
a
-0 'A
-J
~*1
Exzeriment
=2-I
< -
TIME
I. .I..
C * .j
=7 I...' T IME S - .- .-.
-7 -11
127

Comparison of the non-equilibrium correlations
0 1
ý: 8
A&~1
+ CLrLZ 1
^AK
merimernt
11
I
-- xzerizent
0
-J-J
*................I
TIME S TE C33255.0 L` T IME
* *I..3~133.5
I
TE C%"3 25-'.:,'
-jUiU
L)
~ --- Experim~ent
UoJ
O.>3 .;')3 8:30 9.^0TIME S TE C3 327 C.`1
0.00 3:30 6.020 9.00TIME S 7=E t-3 327 0-1
c !T
LU--
TIE 1 ý
Uoc%*
U .?'
u S,-~ - -- - -- C
-- 'x~erimret~
a
TIME* .4 .4
.I-. -- 0 '
128

ATTACHMENT 9
Test parameters and results from the recalculati~on - test DNB9-
129

Test parameters ana local values oi- tne mass flow and steam content
0.
0
t;j
in-C,,
ROPLS
00
C9on
W w :L'VMrrrinlet
It
C,, 0.
0.01:T IME
Is J2.00TIME
I ,.
8.00IS]
j2.60
0
00-
0-0
CH EIMMITn77inlet
Ci
UN
i t
0L>C0
0L.
0.00 .4.00 E.00 !2.00TIME ISI
).00 A*Q 80 20TIME IS) HEIGHT327 CM
(J) C0.1-o
3i:CO
4
bundle inletW ~EUCCE-TtRTU ?--CEýE 19 ^1.1!T heighlU Ew i 2=3 ZýMW FCE~- -5 CM1
FC-UZ- ýý7 C-j
0U-
wL(H
1'.- J.
* I I
2.')~ .4.%I I-
IS!2. 0- 0
T IME TIME130

Comparison of the equilibrium correlations
(D00
L)
mc m. 00ý-- S~iENS.C~Cr.3S GC:CS70N !V
+c~rfiN2V-/..:D 5.7
a.
S.-
I-- Experim-ent
-i I I I . I I ~ *IIIg~III II t
TIMES
2.')0 !2.00TE C3 259 CM TIME S TE C3 259 CM1
D
TIME S -TE CS327 CM TIME S TýE CS 3=27 CM
U.00 a.
11.% a: 1-.:; f: 2 nTIME 37 > - Z C3 377 CsA
131

Comparison of the non-equilibrium correlations
-Juu
1
U
2-
0
00.~,...
+c:-F-N
-- Ex~eriment
0.T
.00 4.00 9.00 !2.00IME S TE C3 25-0 C`MTIME C TE C33 2259 CM1
UJ
0--
U
2
TIME %5 TE C3 B27 CM
ILiU
U
U
2
0
4.C .3 :2. -.1'T IME C377l TIME S 3 770
132

ATTACHMENT 10
Test parameters and results from the recalculation -Test PDNB11-
133

Test parameters and local values of the mass flow and steam content
3: W E! kr!-r-r
_J inlet
ci'
CL'
0.00 3.00 6.00 9.00 0.00 3.00 6.00 9.00TIME (SI T IME (SI
4 - -I
inlet + O. a hCEL B27 C.-I
_j 01-
0.00 S.00 a.010 93.10 W 0.00 3.10 6.00 9.0.0TIMcE- (S) TIME (SIHEIGHT 3271 CM
~\ I bundle inlet o -
a WJ L-CcLý. !9 c-i* helght :E
+ < X Lya7I N9 'M
TIM X3 TIMvE C1L~j_ 134

Comparison of the equilibrium correlaticns
.. i 1~. Gv 5.71~~ 1 E-- Eeriment '
a.-
0.00 3.00 6.00 9.00 0.Oc... .. **.. * . . III . . I
~.0O 6.00 9.00E S TE C3 25101CtlTIME S TC3259 C1 TIM
G ýO! S2:..iJ ~ l IV~
L) 1 - Experiment
-I7-- xme - - - - --.t
CI
-J1.. . .. . . . .........
V
\1,~0
0N ,~
0
0
X,4MC ZLLCSOT
II X ~..... ..
TIME6.rý C;. ^ ".IJ
T IME
. . . . . . . . . .
j - s.
135

ATTACHMENT 11
Comparison of the new correlations with the equili~brium correlations and
with the measured values
-V
136

Test ONBi
.1- i
U
i0 .
QoCR.
<-
0l
wr
-J
Lu
0
a70
LU
14
C
*1* C*:ENEvC-.. .~1 N~LPi- newcExperiment
orr.
:orr.
b0.00 2.00O 4.00T IME ( SI TE *r C Z 259 CM
IN
TIME (S) TE C3 927 CM
E~:~ .N newcorr.t.xcerlCfl
TIME 'M C 7~ TIME
137
4 . 1
-. -, 7

Test DNB3
I
C-:
-IR
<
0 MOO. Ozu'i-R P-1EEI'JJ13 CCND!E ~~rN~
-r CCENE-/V-1 SA~ Nc.E aF:L~a new
-- Experimentco rr
v
IN2
V
I I R ! I - A - A 1 4 ! - ;E . i
0.00 ~~TIME S TE CS
9.-00259 CM
a MCo. ccccJ2, ql!" RCE- 'Wc CC,.DCr SENCSrN IV+i EGREEVF n S. 7
ANS-EK~CF:Fa.T1CN new corExperiment
ro-N 0
0-
.30 =.00 6.00 9.00TIME (S) TE CZ*- X27 CMTIME (S) TE C3 327 CM
L, c 'lCD. c~c.Z F-1
Ao Ntz. KCF~a5T,!:N new corr-- Experim-ent
1~138
,r.
A
A
rN2
.7

j.*est DNB9
uJ
uo101
LuoT
~1A.
a
r.
tirr.
C*2* =N0!E -=NGT:N Co
Experiment
SI S) E 03!2.0
25 0 C M
I
TIME
corr.
0.00 AIJ .8E3.0 '3 !2.00TIME (SI 7E C3 -27 Cm
_. ýS.
--- Exmeriment
ew CI WE A .;Zif I new c6A. -- Experiment
TIME .i< 2~: 721
rr.
TIME ':E.C"1 !2. C
':77-
139

Test PDNBll
I
U
CC
JI.
FE 1 51 .~ N.Z Et9!-~ new c(Experiment
rr
w
-J ý/33 3.10 6.03. 9.130TIME ! S 7:: CE 32 2 59 0CMt
3 .1*T IME .E 02 259 cm
u01
1101. 00-L
CZ.V\D!E E- 'N23- VNE new
Experimentcort V
a
oaf
T IME IS) 7YE C 293.100
227 CM- ~ ~ ~ B- C.G3'0 63 .e10
TIME IS) YE* C02 327 CM
,7
CL= I
w -U -
lie "
~ ~E~91~NnewExperiment
corvkl
14
1~1
c.1
-i
-i
- I
- 'lC. D-CLC-r -A-"
N* L newExperiment
X>4
~orr.
I
-1
-_j. .- j
TIMEA -i
-: T IME -- 1=~ '7 (-5.-I
140

NRIC FORM 335 U.S. NUCLEAR REGULATORY COMMISSION 1. REPORT NUMBER (A ssigned by TIDC, add VoL No., deany)12-84)NRCM 1102, BBIGAHCDT HE3201, 3202 BBIGAHCDT HE
SEE INSTRUCTIONS ON THE REVERSE. -- NUREG/IA-00022. TITLE AND SUBTITLE 3. LEAVE BLANK
Heat Transfer Processes'ýDuring Intermediate and Large ________________
Break LOCAs. 4. DATE REPORT COMPLETED .-
MONTH -YEAR
5. AUTHOR(S)1 March 19826. DATE REPORT ISSUED
MONTH 18YEAR
I. Vo~itek September I 967. PERFORMING ORGANIZATION NAME AND MAILING ADDRESS (Includ Z~p Code) B. FROJECTITASKIWORK UNIT NUMBER
Reactor Safety Corporation B. FIN OR GRANT NUMBER
Gesellschaft Fuer ReaktorsicherheitForschungsgelaende, 8046 GarchingWest Germany
10. SPONSORING ORGANIZATION NAME AND MAILING ADDRESS (Include Z,0 Code) I1Is. TYPE OF REPORT
Division of Reactor- System SafetyOffice of Nuclear Regulatory Research Technical ReportU.S. Nuclear Regulatory Commission b. PERIOD COVERED (mnclusive dares)
Washington, D.C. 20555
12. SUPPLEMENTARY NOTES
33. ABSTRACT (200 words or less)
The general purpose of this project was the investigation of the heat transfer regimesduring the high pressure portion of blowdown. The main attention has been focussed onthe evaluation of those phenomena which are most important in reactor safety, such asmaximum and minimum critical heat flux and forced convecti',n film boiling heat transfer.The experimental results of the 25-rod bundle blowdown heat transfer tests, which 'wereperformed at the KWU heat transfer test facility in Karlstein, were used as a databasefor the verification of different correlations which are used or were developed for theanalysis of-.reactor safety problems. The computer code BRUDI-VA was used for thecalculation of local values of important thermohydraulic parameters in the bundle.
15.AVAILABiLITY14. DOCUMENT ANALYSIS - a. KEYWORDS/DESCRIPTDRS
Critical Heat Flux (CHF)rewetMinimum film boiling temperatureFilm Boiling
b. IDENTIFIERIS/OPEN.ENDED TERMS
STATEMENT
Unl imi ted
1B. SECURITY CLASSIFICATION
('This pa#e)
Unclassified~17. NUMBER OF PAGES
1s. PRICE
±

I,C
4
V
4

7777 "

UNITED STATESNUCLEAR REGULATORY COMMISSION
WASHINGTON, D.C. 20555
OFFICIAL BUSINESSPENALTY FOR PRIVATE USE. $300
SPECIAL PDURTH*CLASS RATE 2PS GE6FEES PAID c:
IUSNRCII WASH. D.C. I
PERMIT W.CG-67 m
C)0
m
,n-n
0000
C,-
A m6
10
o
m
0mZ3,
4-N.
4
IF:7..'N .. . *-'2