
Heat transfer enhancement mechanisms in inline and staggered parallel-plate fin heat exchangers
Upload
khangminh22Category
view
0download
0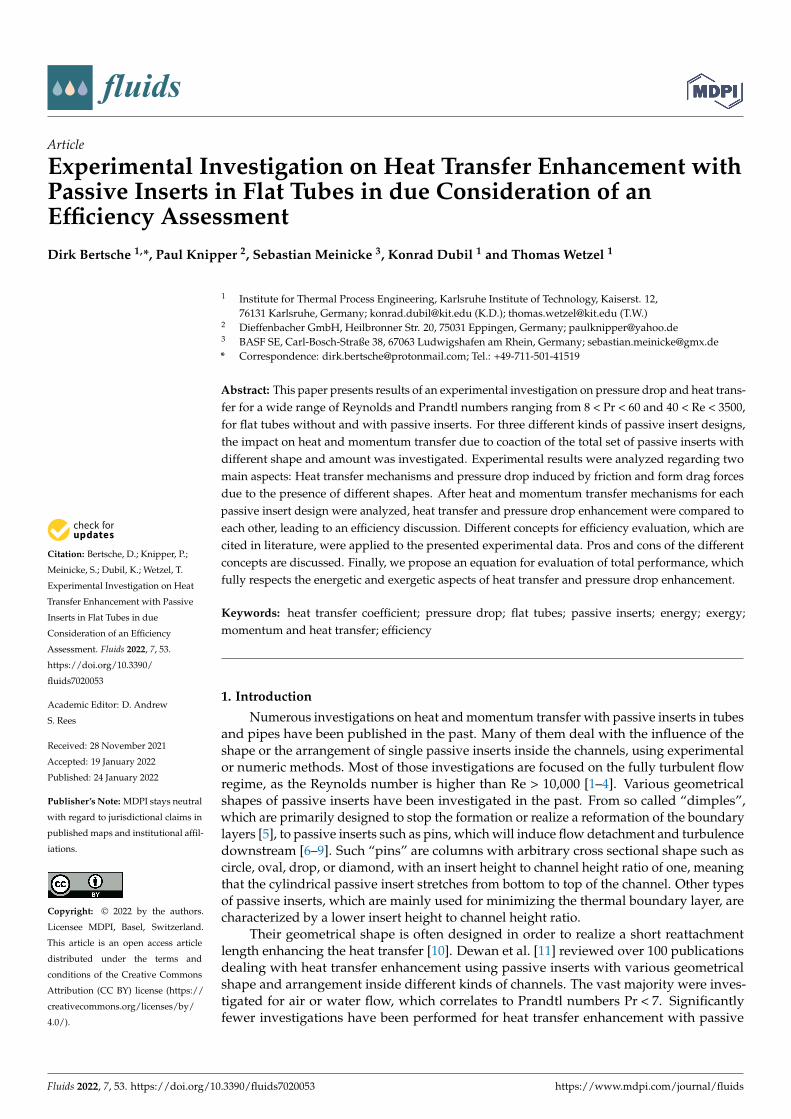
�����������������
Citation: Bertsche, D.; Knipper, P.;
Meinicke, S.; Dubil, K.; Wetzel, T.
Experimental Investigation on Heat
Transfer Enhancement with Passive
Inserts in Flat Tubes in due
Consideration of an Efficiency
Assessment. Fluids 2022, 7, 53.
https://doi.org/10.3390/
fluids7020053
Academic Editor: D. Andrew
S. Rees
Received: 28 November 2021
Accepted: 19 January 2022
Published: 24 January 2022
Publisher’s Note: MDPI stays neutral
with regard to jurisdictional claims in
published maps and institutional affil-
iations.
Copyright: © 2022 by the authors.
Licensee MDPI, Basel, Switzerland.
This article is an open access article
distributed under the terms and
conditions of the Creative Commons
Attribution (CC BY) license (https://
creativecommons.org/licenses/by/
4.0/).
fluids
Article
Experimental Investigation on Heat Transfer Enhancement withPassive Inserts in Flat Tubes in due Consideration of anEfficiency AssessmentDirk Bertsche 1,*, Paul Knipper 2, Sebastian Meinicke 3, Konrad Dubil 1 and Thomas Wetzel 1
1 Institute for Thermal Process Engineering, Karlsruhe Institute of Technology, Kaiserst. 12,76131 Karlsruhe, Germany; [email protected] (K.D.); [email protected] (T.W.)
2 Dieffenbacher GmbH, Heilbronner Str. 20, 75031 Eppingen, Germany; [email protected] BASF SE, Carl-Bosch-Straße 38, 67063 Ludwigshafen am Rhein, Germany; [email protected]* Correspondence: [email protected]; Tel.: +49-711-501-41519
Abstract: This paper presents results of an experimental investigation on pressure drop and heat trans-fer for a wide range of Reynolds and Prandtl numbers ranging from 8 < Pr < 60 and 40 < Re < 3500,for flat tubes without and with passive inserts. For three different kinds of passive insert designs,the impact on heat and momentum transfer due to coaction of the total set of passive inserts withdifferent shape and amount was investigated. Experimental results were analyzed regarding twomain aspects: Heat transfer mechanisms and pressure drop induced by friction and form drag forcesdue to the presence of different shapes. After heat and momentum transfer mechanisms for eachpassive insert design were analyzed, heat transfer and pressure drop enhancement were compared toeach other, leading to an efficiency discussion. Different concepts for efficiency evaluation, which arecited in literature, were applied to the presented experimental data. Pros and cons of the differentconcepts are discussed. Finally, we propose an equation for evaluation of total performance, whichfully respects the energetic and exergetic aspects of heat transfer and pressure drop enhancement.
Keywords: heat transfer coefficient; pressure drop; flat tubes; passive inserts; energy; exergy;momentum and heat transfer; efficiency
1. Introduction
Numerous investigations on heat and momentum transfer with passive inserts in tubesand pipes have been published in the past. Many of them deal with the influence of theshape or the arrangement of single passive inserts inside the channels, using experimentalor numeric methods. Most of those investigations are focused on the fully turbulent flowregime, as the Reynolds number is higher than Re > 10,000 [1–4]. Various geometricalshapes of passive inserts have been investigated in the past. From so called “dimples”,which are primarily designed to stop the formation or realize a reformation of the boundarylayers [5], to passive inserts such as pins, which will induce flow detachment and turbulencedownstream [6–9]. Such “pins” are columns with arbitrary cross sectional shape such ascircle, oval, drop, or diamond, with an insert height to channel height ratio of one, meaningthat the cylindrical passive insert stretches from bottom to top of the channel. Other typesof passive inserts, which are mainly used for minimizing the thermal boundary layer, arecharacterized by a lower insert height to channel height ratio.
Their geometrical shape is often designed in order to realize a short reattachmentlength enhancing the heat transfer [10]. Dewan et al. [11] reviewed over 100 publicationsdealing with heat transfer enhancement using passive inserts with various geometricalshape and arrangement inside different kinds of channels. The vast majority were inves-tigated for air or water flow, which correlates to Prandtl numbers Pr < 7. Significantlyfewer investigations have been performed for heat transfer enhancement with passive
Fluids 2022, 7, 53. https://doi.org/10.3390/fluids7020053 https://www.mdpi.com/journal/fluids

Fluids 2022, 7, 53 2 of 26
inserts for coolant fluids such as water–glycol mixtures or different kinds of oil with Pr > 7.In addition, most of the investigations published so far have been performed for fullyturbulent flow.
Passive inserts used in air or gas flow are mainly designed for heat transfer enhance-ment in turbulent flow regime since most industrial heat exchanger applications operate inthis. Nonetheless, the situation may be different for industrial heat exchanger applicationsusing coolant fluids or oils. In addition to their typically higher Prandtl number, whichresults from higher viscosity and density, the Reynolds number is significantly lower inindustrial applications, i.e., in heater core or radiator. In addition, for fluids with Pr > 7(increased viscosity), the induced pressure drop, which comes along with heat transferenhancement, becomes more important, as the pumping power or energy consumptionover time will increase significantly more compared with fluids with Pr < 7. Consequently,an optimum shape of passive inserts used for air or pure water flow may be designedcompletely differently as for fluids with higher Prandtl number. For the latter, it may beeven efficient to first induce turbulence, which may not be present without passive insertsfor Re < 10,000.
As published data are sparse for the use of passive inserts for Pr > 7 and Re < 4000,this contribution is specifically focused of the influence of passive inserts on heat andmomentum transfer in this Prandtl and Reynolds number range. It was the aim of thisinvestigation to elaborate the heat transfer mechanisms, which are present with and withoutpassive inserts. Pressure drop was analyzed simultaneously in order to gain insight in thedifferent mechanisms behind it, such as surface shear stress or from local pressure gradientsin the wake of inserts. This contribution is focused on flat tubes. They are widely used inindustry with and without passive inserts for flat tube heat exchangers, such as the heatercore in cabin or room heating systems, low temperature radiators, or other heat exchangersused especially in the automotive industry.
The operating conditions were set such as to achieve Prandtl and Reynolds numberranges 8 < Pr < 60 and 40 < Re < 3500. Based on 434 data points analysis on the influenceof three different passive insert types on pressure drop, heat transfer, and flow regimeboundaries are presented. The increase in form and friction drag pressure drop is comparedto the increase in heat transfer, resulting from induced turbulences, forcing a reformationof boundary layers and increasing the heat transferring surface. The contradicting goals ofminimizing the increase in pressure drop while increasing heat transfer significantly arefinally analyzed using available and extended criteria to rate the efficiency of passive inserts.
In this contribution, we focus on the situation with a set of passive inserts inside a flattube. In contrast with many other investigations dealing with passive inserts, we do notcompare the impact of single passive inserts with different shape but same height, length,etc., or vice versa, and we do not investigate the local phenomena around one single passiveinsert. Instead, we discuss the impact of the co-action of the total set of passive inserts usedin one flat tube. In addition, we want to keep either heat transfer or pressure drop constantthroughout the variations of the inserts, which is in line with the situation in most practicalapplications. An example for this is an upper limit in the allowable pressure drop due to,e.g., pump capacity. At the same time this is a suitable way to enable comparisons of theeffects of different insert shape and arrangement over a wide range of Re and Pr.
Since the testing infrastructure has already been used for determination of heat transferand pressure drop data for other purposes, some of the following chapters, which arelabeled respectively, have already been described in other publications of the authors. Thisis why we thoroughly reference and indent these text passages in the following to avoidself-plagiarism.
2. Methods
We described the methods in a previous publication:Heat transfer coefficients were determined in this investigation by cooling down a
hot liquid flow towards a cold one in a parallel flow arrangement. The test facility used

Fluids 2022, 7, 53 3 of 26
was exactly the same as described in [12–15]. For technical details, the reader is referred toone of these publications. Figure 1 shows the process flow diagram for the hot flow side ofthe experimental setup, including the test section itself (reproduced with permission fromSection 2, page 3 in [16], published by Elsevier 2021).
Figure 1. Overview of publications dealing with passive inserts classified into Reynolds and Prandtlnumber range.
2.1. Test Section
We also described the first part of the following chapter test section in a previouspublication:
A hot flow was cooled down in the measuring channel. This test rig was designed totest different pipe geometries with different heat flow directions (heated and cooled flowinside the circular pipe measuring channel, see Bertsche et al. [14,15]). A heat exchanger-like approach was chosen instead of, e.g., an electrically heated pipe, which is describedin the following. This easily allows mimicking heat exchanger conditions and realizing athermal boundary condition close to constant wall temperature. The test section consistedof seven geometrically identical channels which were formed by eight aluminum half-shells(see Figures 2–4). This arrangement was chosen to ensure the desired thermal boundarycondition and checked using numerical calculations. For the exact positioning (x,y) oftwo half shells onto each other, dowel pins were used to ensure a “perfect” flat tube.
Figure 2. Process flow diagram of the test facility: 1, thermostat; 2, gear pump; 3, inlet section; 4, testsection; 5, cold co-current flow to develop thermal boundary condition desired. Reproduced withpermission from [16], published by Elsevier 2021.
High-precision milling was used to secure perfect contours of the flat tube and asmooth surface quality with a resulting peak-to-trough roughness height of k = 1.3 µm.According to [17] and the investigated Reynolds number range, the assumption of atechnically smooth pipe was therefore valid. The length of the aluminum half shells was220 mm, its width was 52 mm, and the hydraulic diameter of the flat tube was 2.1 mm witha height to width ratio of the flat tube h/w = 0.075. The aluminum half shell contained thecontour of two flat tube channels with 14.7 mm in width, 1.12 mm in height and 220 mm inlength. The thickness of the half shells, i.e., the distance between the hot and cold channelswas 28 mm. The channel in the center was the measuring channel with a cross-section area

Fluids 2022, 7, 53 4 of 26
Ac and a hydraulic diameter to length ratio of 0.01. The channels above and below werenecessary for homogeneously cooling the measuring channel. The neighboring “secondary”hot channels of the two “primary” cold channels below and above the measuring channelprovided homogeneous conditions for those “primary” cold channels, etc. In total, sevenflat tube channels were subject to alternate hot (temperature Thot,in) and cold (temperatureTcold,in) flow. Due to this arrangement, the thermal boundary condition at the flat tube’swetted surface was close to a constant wall temperature (uniform wall temperature). Thiswas checked by nine thermocouples, which were used to determine the homogeneoustemperature inside the aluminum shell in the drilled holes, albeit only three are indicatedin Figure 3 on the right.
Figure 3. Test section and supply pipes without insulation (flow direction from left to right); accesspoints for temperature and pressure sensors are marked in red and blue respectively. Reproducedwith permission from [16], published by Elsevier 2021.
Figure 4. Test section with eight stacked aluminum half shells and supply pipes (a) and enlarged viewof one of the half-shells (b) (for clarity, only three of the seven supply pipes are shown). Reproducedwith permission from [16], published by Elsevier 2021.
The whole setup including supply pipes and a half-shell stack was wrapped in ther-mally insulating material. Sheath resistance thermometers at the inlet and outlet were usedto determine the averaged fluid temperatures Thot,in and Thot,out. Homogeneity of the inlettemperature was ensured using mixing elements in the supply line and at the outlet. Inaddition, two sensors were placed side by side with respect to the mixing effect of thesudden cross section expansion at the end of the measurement channel and at the startof the measurement channel to account for the changed cross section of the supply pipes.The signals of the parallel sensors were arithmetically averaged. Pressure drop sensorswere used in order to determine the pressure drop over the measuring channel. One ofthe eight aluminum half shells, which was used to investigate the flow in flat tube withpassive inserts is shown in Figure 4. As one flat tube consisted of two identical separate

Fluids 2022, 7, 53 5 of 26
channels, a separating wall is shown in the middle of the channel, as it is also presented inFigure 3 for the flat tube without passive inserts (reproduced with permission from Section2.1, pages 3–4 in [16], published by Elsevier 2021).
In addition to a flat tube channel without passive inserts, two other test sections withpassive inserts have been used, which are both shown in Figure 4. On the left side, onealuminum shell with the contour of a flat tube with 132 bump-like shaped passive inserts astypically used in industry and called there “winglets” is shown. A detailed investigation onheat transfer enhancement and mechanisms with this kind of passive inserts was publishedby Forooghi et al. [18]. The flat tube on the right of Figure 4 is equipped with 35 cylindricalpins with a diameter of d = 0.6 mm.
The detailed geometry of the passive inserts is presented in Figures 5 and 6. Theleft sides in Figures 5 and 6 show a short section of the whole flat tube with 2 out of the33 identical winglet rows and one out of the seven periodic pin patterns. One completechannel is shown in a perspective view on the right sides in Figures 5 and 6. It should benoted that the number of pins in the channel shown in Figure 6 is significantly smaller thanthat of the winglets in the tube according to Figure 5. The reason for this is that the pinchannel is the result of a design process aiming at similar heat transfer at reduced pressuredrop compared with the winglet channel over the whole Pr and Re range investigated, asis discussed in Sections 3 and 4.
Figure 5. Aluminum half shells with passive inserts. (a): Contour of flat tube within aluminum shellwith passive inserts used in automotive industry (reproduced with permission from [16], publishedby Elsevier 2021). (b): Contour of flat tube within aluminum shell with cylindrical pins with d = 0.6 mm.
Figure 6. Flat tube with passive inserts (“winglets”) used in automotive industry for flat tube heatexchangers. (a): Detailed geometry of passive inserts. b/a = 2; c/d = 0.6. The ratio of the insert heightto channels height is 0.325. (b): Left channel of the corresponding flat tube with l = 220 mm lengthand passive inserts used in automotive industry. Reproduced with permission from [16], publishedby Elsevier 2021.
A third kind of passive insert type was investigated, which consisted of several wave-shaped bumps stretching over the whole width of the channel. Every bump was placed

Fluids 2022, 7, 53 6 of 26
transverse to the flow direction, as shown in Figure 7 on the right. Alternately one of thosebumps, with a cross sectional shape, as shown in Figure 8, was turned into the channel,forcing a decrease in cross section, followed by another wave-shaped bump, which wasturned outside the channel, enlarging the cross section of the flat tube locally. The bumpsat the top were displaced compared with the ones at the bottom to realize a constant crosssection of the flat tube over the entire flat tube length. Table 1 shows the geometricalparameters, which describe the wave-shape as well as the arrangement of all those passiveinserts inside the flat tube channel.
Figure 7. Flat tube with cylindrical pins. (a): Detailed geometry of passive inserts. Pin diameterd = 0.6 mm, e = 16.3 mm, f = 5.4 mm. (b): Flat tube with l = 220 mm length and passive inserts.
Figure 8. Entire flat tube (a) and parts of the flat tube with wave-shapes bumps in top (b) and sideview (c).
The questions to be answered were, which flow modifications or phenomena areinduced by the three different passive insert types and in what way do they affect heattransfer and pressure drop? The bulk and boundary layers will be influences in different

Fluids 2022, 7, 53 7 of 26
ways with the present passive inserts, which is why on the one hand we considered differentportions of heat transfer realized by minimizing boundary layer thickness and inducingturbulence in core flow and on the other hand pressure drop induced by friction and dragforces. To this end, particularly the ratio between friction and form drag induced by thethree different passive insert types is discussed.
Table 1. Geometrical parameters for wave-shaped bumps inside the flat tube channel.
Parameter Value
Number of bumps/- 168t/h/- 0.12p/h/- 11.6γ1/- 16◦
2.2. Hydrodynamic Inlet Boundary Condition
Since the test section was used in a previous publication, the hydrodynamic inletboundary condition was described in a previous publication:
The pressure drop, the hydrodynamic entry length, and the transition point betweenthe different flow regimes (laminar, transitional, and turbulent flow regime) stronglydepend on the inlet condition, as thoroughly investigated by Ghajar and Tam [19–21] and—to a lesser extent though—also depend on the surface roughness. The inlet configurationchosen in the present work was named “square edged” by Ghajar and Tam [21] and isrealized by a sharp step geometry directly at the inlet of the flat tube measurement channel(see Figure 9) with a step height to flat tube characteristic length of 0.21. This kind of inletconfiguration is typical for the vast wealth of existing data and typical for heat exchangersin general.
Figure 9. Geometrical shape of the wave-shaped bump, cross section at an angle of 90 degrees to flowdirection.
The supply pipes (see Figure 3) expand gradually into a wide channel with a flat tubecross section (inlet chamber) before abruptly experiencing a step jump into the measurementpipe. The supply pipe contracts with a very small contraction ratio to avoid or minimizerecirculation and detachment zones. It is followed by an inlet chamber or smoothing sectionto secure reproducible hydrodynamic inlet conditions for all investigated flow rates ortemperature levels.
As indicated in Figure 3, a flat tube channel form is present for the smoothing section,because this test facility was originally designed to work for flat tubes, as commonly usedin compact heat exchangers for automotive applications. Therefore, a minimum of pressuredrop occurs at the inlet section using a flat tube as test channel geometry. However, wecalculated this additional pressure drop using available correlations from the literature [22]and subtracted it from the measured overall pressure drop to obtain a corrected value for theflat tube channel only. The influence of surface roughness on transition can be neglected,since the present peak-to-trough roughness height was calculated to k = 1.3 µm usingNikuradse’s laws of flow in rough pipes (reproduced with permission from Section 2.2,pages 4–5 in [16], published by Elsevier 2021).
2.3. Thermal Boundary Condition
We described the thermal boundary condition in a previous publication:

Fluids 2022, 7, 53 8 of 26
A co-current flow condition with separately adjustable hot and cold flow rates wasrealized in combination with a symmetric arrangement of the flat tube channels. Once thesame heat transfer conditions, including similar values of the heat transfer coefficients, werepresent in the hot and the cold flow flat tubes, a homogeneous temperature distributionin the symmetry plane of the aluminum shells (see Tplane in Figure 10) was established.This provided an excellent option for evaluating the heat transfer coefficients (see Section 3)when slightly adjusting the mass flow rates in the primary heating pipes next to themeasuring one.
Figure 10. Cross-sectional view of the supply pipe and the beginning of the flat tube measuringchannel. Reproduced with permission from [16], published by Elsevier 2021.
Although a non-homogeneous wall temperature was present at the heat transfersurface, the temperature difference in the flat tube measurement channel was 10 times thechange in temperature at the heat transferring wall along the flat tube in flow direction.Thus, the heat transfer coefficients determined can be compared with correlations valid foruniform wall temperature conditions.
The Prandtl number was evaluated with the arithmetic mean of inlet and outlettemperature values. In order to achieve constant Pr-numbers over a wide range of variedRe, the inlet temperature was slightly adjusted with changing Re. In this way, a maximumvariation of the Prandtl number of Pr ± 1 could be achieved. The ratio (Pr/PrW)0.11 wasdetermined for all the following heat transfer data with values of (Pr/PrW)0.11 < 1.01. TheReynolds number was determined using the characteristic length of the flat tube.
The temperature difference along the flat tube was chosen to be small enough toachieve quasi-isothermal conditions, which in turn enabled the use of constant thermo-physical properties in the evaluation procedure. However, these small temperature differ-ences also applied to the evaluation of the heat transfer coefficients. Obviously, the accuracyof this evaluation would improve with increasing temperature differences. Therefore, acompromise between both requirements was sought based on a careful uncertainty analysisfollowing the guide for determination of uncertainty in measurement (GUM) [23]. Forfurther details concerning the measurement uncertainty and reproducibility, the reader isreferred to one of the following publications [12–16] (reproduced with permission fromSection 2.3, pages 5–6 in [16], published by Elsevier 2021).
The uncertainty of all measuring devices and the subsequent uncertainties of the targetvalues Nusselt number and pressure drop are listed in Table 2.

Fluids 2022, 7, 53 9 of 26
Table 2. Uncertainty of all measuring devices and resulting uncertainties of target values heat transferand pressure drop.
Measurement Device Uncertainty
Resistance thermometer Pt100 with data logger: NI9213 (National Instruments) ∆T ≤ ±0.023 K
Thermocouple Typ K with data logger: NI9203 (National Instruments) and externalreference temperature ∆T ≤ ±0.14 K
Coriolis mass flow meter CMFS015M with evaluation electronics MVD 2500D(Emerson Process Management) ∆
.M ≤ ±0.05 %
Target Values Uncertainty
Nusselt number/- ∆Nu ≤ ±12%
Pressure drop/mbar ∆p ≤ ±8.5%
In order to validate setup and procedure, comprehensive experimental results weredetermined for cylindrical pipe flow at the same test facility and compared with theliterature in [12,14,15] showing an excellent match to the literature. Thus, the test facilityand the data processing can be considered as validated. The results for the flat tube floware compared to literature in addition to that; please see Section 4.
3. Evaluation Procedure
We described the evaluation procedure in a previous publication:
3.1. Determination of Heat Transfer Coefficients from Measured Data
Equation (1) was used for the calculation of the Nusselt number, which was calculatedfrom the measured values of the inlet temperature, Thot,in, the outlet temperature, Thot,out,and the temperature in the planes between the flat tube measuring channel and its directneighbors, Tplane, as well as the mass flow rate,
.M, of the cold flow.
Nu =α·dhλ
=dh
A·λ ·
2.
M·cp· lnThot,in−TplaneThot,out−Tplane
− RAl
−1
(1)
RAl =1
2π·L·λAl·arcosh
(2·edh
)(2)
Figure 11 shows the system boundary for determining the Nusselt number Nu froman energy balance. The heat is transferred from the neighboring hot fluids across the flattube walls through the planes of homogeneous temperature distribution, Tplane = const inthe aluminum shells and finally across the heat-transferring surface, A, to the cold flat tubemeasuring channel. The heat transfer resistance of the aluminum shell RAl was determinedusing Equation (3) taken from [24] and depends on the geometry of the aluminum shell,i.e., the distance of pipe center to isothermal plane (Tplane), e, the hydraulic diameter, dhand length, l as well as the heat conductivity λAl of the aluminum. A detailed derivation ofEquation (1) is presented in [15].
3.2. Determination of Friction Factor from Measured Data
The pressure drop, ∆p, along the measuring channel was determined as describedin [15]. To express the friction factor ξ we used the Darcy friction factor fD, which isdetermined with the total pressure drop of the flat tube.
fD =∆pL·2·dh
ρ·u2 (3)
The mean flow velocity was determined from the mass flow,.
M, and density, ρ, mea-sured in the coriolis mass flow meter. Since pressure drop in flat tubes without and with

Fluids 2022, 7, 53 10 of 26
passive inserts will be induced by friction and form drag forces, the pressure drop can beseparated in so-called form drag pressure drop dpfo/dx and friction drag pressure dropdpfr/dx. The friction fraction xfr represents the fraction of the friction drag pressure dropdpfr/dx on the measured total pressure drop dpfr/dx + dpfo/dx. In order to allow a com-parison of both, form pressure drop and friction pressure drop fraction on the total pressuredrop of flat tube without and with passive inserts, an approach by Della Torre et al. [25]was used.
Figure 11. Schematic drawing of the test section with the flow in the hot and cold flat tubes markedin red and blue, the symmetry plane Tplane between the flat tubes marked in green, and the systemboundary for deriving Equation (1). Reproduced with permission from [16], published by Elsevier 2021.
∆pfr ∝FfrA
=6π·η·u·dh
A(4)
∆pfo ∝FfoA
=0.5·ρu2·Ac·cw
A(5)
∆p = ∆pfr + ∆pfo (6)
Since the friction pressure drop ∆pfr is proportional to the velocity u and the formpressure drop ∆pfo to the square of the velocity u, Equation (15) was assumed for the totalpressure drop with the constants D1 and E1. The Hagen number, Hg, was used in additionto the friction factor to express the pressure drop in dimensionless form using Equation (8).
∆p = D1·Re + E1·Re2 (7)
Hg =∆pL· dh
3
ρ·ν2 =fD
2·Re2 (8)

Fluids 2022, 7, 53 11 of 26
Consequently, it is possible to compare the two parts—friction and form drag—on thetotal pressure drop by the quantity of the two constants D (measure for friction drag) and E(measure for form drag) in Equation (9), which results from Equation (7).
HgRe
= D + E·Re (9)
By plotting Hg/Re vs Re, the axis intercept D becomes a measure for the friction drag,and the slope E becomes a measure for the form drag. In addition, the change in slope forhigher Reynolds numbers indicates a change in flow regime boundary, which is the end ofthe laminar flow regime [25] (reproduced with permission from Section 3, pages 6–7 in [16],published by Elsevier 2021).
4. Results and Discussion
Experimental data for heat transfer coefficients and pressure drop were determinedfor a Reynolds number range between 40 < Re < 3500 and Prandtl numbers between8 < Pr < 60. The test fluid was a water–glycol mixture with a mass fraction of water ofxm = 0.477. Table 3 shows the parameter combinations during the experiments in flattubes with and without passive inserts and the number of data points determined foreach of them. These conditions are typical for the liquid side of single-phase flat tube heatexchangers in automotive applications.
Table 3. Amount of test data for specific Prandtl and Reynolds number ranges.
Pr Re Flat Tube withoutPassive Inserts
Flat Tube with“Winglets”
Flat Tube withCylindrical Pins
Flat Tube withWave-Shaped Bumps
8 200–3500 27 9 17 911 150–2700 22 13 0 013 190–2000 9 9 15 915 170–1600 11 11 0 017 150–1500 8 9 14 922 120–1300 8 9 9 926 90–1500 13 10 22 932 75–800 9 9 11 936 70–750 8 9 30 940 50–650 8 9 15 050 45–500 0 9 0 060 40–400 0 9 0 0
Total 123 115 133 63
In the following subsections, we discuss the results along the following order: Firstin Section 4.1, experimental data for flat tube flow without passive inserts is comparedwith appropriate literature data in order to further validate the experimental procedure.Second, in Section 4.2, the heat transferring surface and the specific surface, which isthe heat transferring surface per fluid volume of all flat tube channels with and withoutpassive inserts are compared. Heat transfer and pressure drop for flat tube flow withthree different types of passive inserts are presented in Section 4.3. Here, the influenceof passive inserts on the flow regime boundary and on the pressure drop as well as onthe heat transfer mechanisms are analyzed. Finally, we discuss the trade-off between heattransfer enhancement and pressure drop increase with the help of an efficiency assessment,for which we used an energetic and an exergetical analysis presented in Section 4.4.
4.1. Validation for Flat Tube without Passive Inserts
The detailed validation for heat and momentum transfer inside a flat tube withoutpassive inserts is shown in Bertsche et al. [16]. In the following we sum up the mostimportant points. For further details, the reader is referred to Bertsche et al. [16].

Fluids 2022, 7, 53 12 of 26
4.1.1. Heat Transfer
Based on a correlation for calculation of heat transfer in flat tubes without passiveinserts for laminar flow proposed by Garimella et al. [26], we compared our results for flattube without passive inserts for laminar flow with this correlation. In order to apply thiscorrelation, it is required to know the Nusselt number Nufd for a fully developed laminarflow under the present thermal boundary condition of uniform wall temperature (UWT).Therefore, we used a correlation proposed by Shah and Bhatti [27] for flat tubes. A totalof 81% of all data shown in [16] were predicted by the correlation of Garimella et al. [26],within the experimental error.
4.1.2. Pressure Drop
Using a correlation, which was also proposed by Shah and Bhatti [27], for calcula-tion of the Darcy friction factor for laminar flow in flat tubes, we proved that 90% of allexperimental data were within the measurement accuracy.
4.2. Geometrical Analysis of Flat Tube Channels with and without Passive Inserts
In order to evaluate the different heat transfer mechanisms and the influence of passiveinserts on pressure drop, boundary layer, and bulk flow, the heat transferring surface Aand the specific surface SV, are listed in Table 4 for all flat tube channels. The passiveinserts investigated here only increased the heat transferring surface by 0.8% to 1.1%. Thespecific surface of the flat tube with “winglets” was increased by 5.8%, which is in contrastto the 1.1% increase with cylindrical pins. The reason lies in the internal fluid volume,which is decreased much further than when using pins in the designs considered here(see Section 2.1 for background on that). Using wave-shaped bumps, which grow “inside”and “outside” the flat tube, the inner volume was equivalent to the volume of the flat tubewithout passive inserts, but the heat transfer surface was increased by 2.1%, causing aspecific surface increase of 3.6%.
Table 4. Heat transfer surface A and specific surface for flat tube channels with and without passiveinserts.
Flat Tube Channel A/m2 (Aw − Aw/o)/Aw/o/% SV/m2/m3 SV/%
w/o passive inserts 6.75 × 10⁻³ - 1907 -w/“winglets” 6.82 × 10⁻³ 1.0 2018 5.8
w/cylindrical pins 6.80 × 10⁻³ 0.7 1928 1.1w/wave-shaped bumps 6.90 × 10⁻³ 2.2 1976 3.6
4.3. Heat and Momentum Transfer without and with Passive Inserts
Passive inserts as described in Figures 5–7 cause an increase in pressure drop as wellas in heat transfer. The corresponding results are shown in Figures 12 and 13. Heat transferfor flat tube with “winglets” and cylindrical pins was increased approximately in thesame range. It should be noted again that this was the result of the specific design of thepin arrangement and not a general feature of pins as passive inserts. A quite differentbehavior was shown for the flat tube with wave-shaped bumps. Heat transfer was enhancedparticularly for high Reynolds numbers, whereas pressure drop was already exceeding thatof pin and winglet channels for low Reynolds numbers.
Since the passive inserts increase the heat transferring surface by approximately 2%,this would only result in a heat transfer enhancement of <3%. Thus, there must be otherheat transfer mechanisms that are responsible for a heat transfer enhancement of up to200% for both passive inserts. Nonetheless, before discussing potential reasons, an analysisof pressure drop is provided.
Fluids 2022, 7, 53 13 of 26
Figure 12. Heat transfer results for flat tube without passive inserts as well as with “winglets”,cylindrical pins, and wave-shaped bumps.
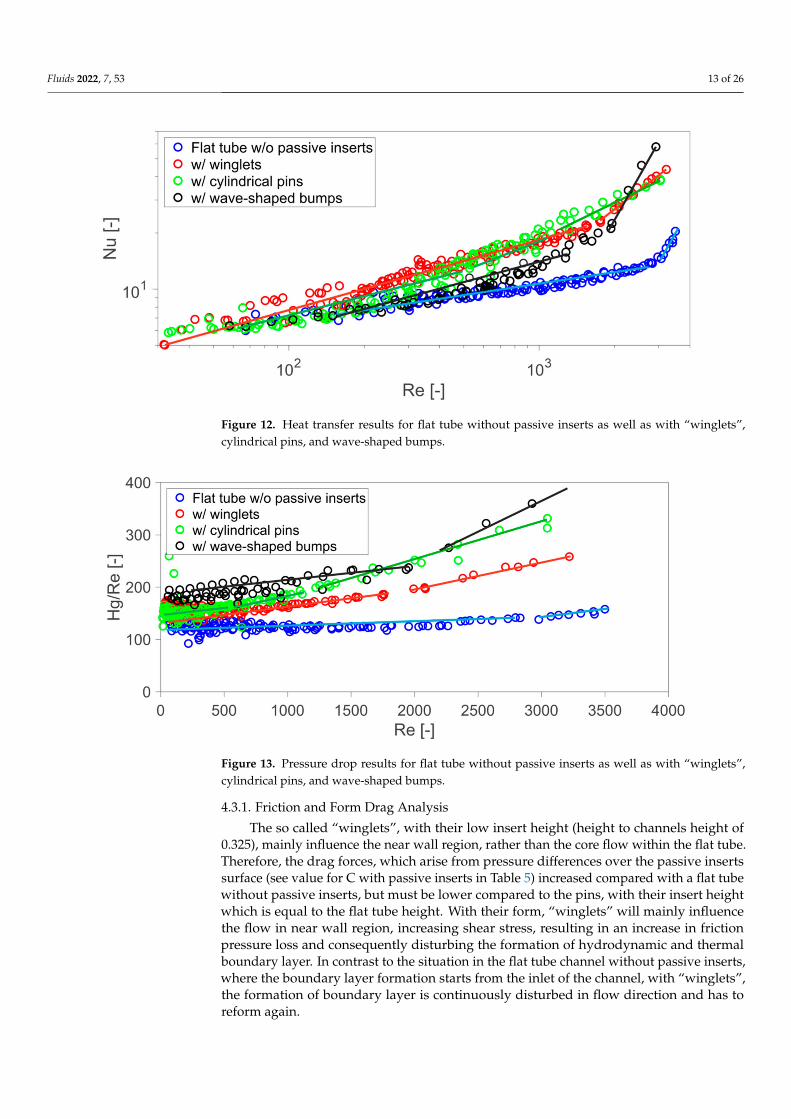
Figure 13. Pressure drop results for flat tube without passive inserts as well as with “winglets”,cylindrical pins, and wave-shaped bumps.
4.3.1. Friction and Form Drag Analysis
The so called “winglets”, with their low insert height (height to channels height of0.325), mainly influence the near wall region, rather than the core flow within the flat tube.Therefore, the drag forces, which arise from pressure differences over the passive insertssurface (see value for C with passive inserts in Table 5) increased compared with a flat tubewithout passive inserts, but must be lower compared to the pins, with their insert heightwhich is equal to the flat tube height. With their form, “winglets” will mainly influencethe flow in near wall region, increasing shear stress, resulting in an increase in frictionpressure loss and consequently disturbing the formation of hydrodynamic and thermalboundary layer. In contrast to the situation in the flat tube channel without passive inserts,where the boundary layer formation starts from the inlet of the channel, with “winglets”,the formation of boundary layer is continuously disturbed in flow direction and has toreform again.

Fluids 2022, 7, 53 14 of 26
Table 5. Measures (slope C and axis intercept B from Hg/Re vs Re plot) for friction B and form Cdrag pressure drop.
Flat Tube Channel Axis Intercept B in Hg/Re vs. Re Plot(Measure for Friction Drag Pressure Drop)
Slope C in Hg/Re vs. Re Plot(Measure for Form Drag Pressure Drop)
w/o passive inserts 120 0.0048w/“winglets” 150 0.0200
w/cylindrical pins 138 0.0430w/wave-shaped bumps 185 0.0200
Using pins, the form drag pressure drop was significantly enhanced because the coreflow with high local velocity components in flow direction was disturbed by the cylindricalpin inserts. Consequently, high local pressure differences arose around the pin surface,resulting in higher form drag pressure drop compared with non-pin inserts like “winglets”even in a design with just 35 cylindrical pins compared with 132 “winglets”.
It is known from other publications [6–9] that pins are used to induce transient flowstructures, such as the Karman vortex street and turbulence. In most of the investigationsdealing with pin or pin fin structures as passive inserts in different kinds of tubes orchannels a turbulent air flow is used. This results in an optimized pin fin design and in apin fin arrangement in the channel, which could not be transferred to the present situationin flat tube channels with a liquid coolant fluid with a significantly higher Prandtl numberand at lower Reynolds numbers, leading to a purely laminar flow in the correspondingflat tube channel without passive inserts. At this stage it must be stated that the availableresults and design suggestions from the literature [7–9,28,29] for an optimized pin finstructure cannot be used for flat tube heat exchangers since the pressure drop would be fartoo high, as too many pin inserts would be used.
This finding confirmed that no suitable insight in using pins in flat tube channels forthe present Prandtl and Reynolds number range under the boundary condition of moderatepressure drop increase was available. Since the increased Prandtl number 8 < Pr < 60 wascaused primarily by an increased viscosity, the pressure drop also increased, which forcedengineers to spend fewer pins inside the channel to enable the already used coolant pumps,i.e., in automotive industry, to pump the flow.
However, the development of the flat tube channel with cylindrical pins is not partof this contribution, yet the background and why exactly this geometry and arrangementwere chosen shall be briefly illuminated.
Using wave-shaped bumps, the friction pressure drop was increased significantly, seeC value in Table 5, because of the huge amount of inserted bumps with a very small insertheight. The small insert height was exactly the reason why the form drag pressure drop wasnot significantly increased but instead matched the level of the “winglets” inserts. Becauseof the low velocity components in the near wall region, where the peak of the wave-shapedbumps is located, quite low pressure differences at the bump surfaces were present. Itshould be noted that the amount of bumps was chosen so as to create a comparable pressuredrop level over all Reynolds and Prandtl numbers and the same total pressure drop as withthe flat tube channel with “winglets”. This provides a good foundation for a discussion ofpotential reasons for the characteristic differences in heat transfer and pressure drop as aneffect of the different passive inserts.
4.3.2. Flow Regime Boundary and Heat Transfer Mechanism Analysis
Pressure drop results are presented in Figure 13 using the dimensionless numbersHagen, Hg, and Reynolds number, Re. The heat transfer results with Nusselt number Nuand Reynolds number Re are presented in Figure 12.
Since we have already presented results for heat transfer and pressure drop for the twochannels without and with winglets as passive inserts, we have shortened the followingexplanations to the most relevant topics for the extended investigation within this contri-

Fluids 2022, 7, 53 15 of 26
bution, focusing on two other passive inserts and the efficiency assessment of all types ofpassive inserts. The following results were determined for:
- Flat tube without passive inserts:
# End of laminar flow regime occurring at Recrit = 2800, indicated by the changein the slope for pressure drop results ∆(Hg/Re)/∆Re, presented in Figure 13.
# Confirmation of change in slope for heat transfer results ∆Nu/∆Re at Recrit = 2800in Figure 12.
- Flat tube with winglets:
# End of laminar flow regime occurring at Recrit = 1500, indicated by the changein the slope for pressure drop results ∆(Hg/Re)/∆Re, presented in Figure 13.
# Therefore, for Re > 1500 we assume that flow separation and local turbulencesat the surface of the passive inserts are induced, which changes the characterof the flow from laminar to turbulent.
# These experimental results are confirmed by a numerical investigation withthe exact same flat tube channel with winglets by Forooghi et al. [18], whoconcluded the following:
Fluids 2022, 7, x FOR PEER REVIEW 15 of 26
the wave‐shaped bumps is located, quite low pressure differences at the bump surfaces
were present. It should be noted that the amount of bumps was chosen so as to create a
comparable pressure drop level over all Reynolds and Prandtl numbers and the same total
pressure drop as with the flat tube channel with “winglets”. This provides a good foun‐
dation for a discussion of potential reasons for the characteristic differences in heat trans‐
fer and pressure drop as an effect of the different passive inserts.
4.3.2. Flow Regime Boundary and Heat Transfer Mechanism Analysis
Pressure drop results are presented in Figure 13 using the dimensionless numbers
Hagen, Hg, and Reynolds number, Re. The heat transfer results with Nusselt number Nu
and Reynolds number Re are presented in Figure 12.
Since we have already presented results for heat transfer and pressure drop for the
two channels without and with winglets as passive inserts, we have shortened the follow‐
ing explanations to the most relevant topics for the extended investigation within this
contribution, focusing on two other passive inserts and the efficiency assessment of all
types of passive inserts. The following results were determined for:
‐ Flat tube without passive inserts:
o End of laminar flow regime occurring at Recrit = 2800, indicated by the change in
the slope for pressure drop results Δ(Hg/Re)/ΔRe, presented in Figure 13.
o Confirmation of change in slope for heat transfer results ΔNu/ΔRe at Recrit = 2800
in Figure 12.
‐ Flat tube with winglets:
o End of laminar flow regime occurring at Recrit = 1500, indicated by the change in
the slope for pressure drop results Δ(Hg/Re)/ΔRe, presented in Figure 13.
o Therefore, for Re > 1500 we assume that flow separation and local turbulences
at the surface of the passive inserts are induced, which changes the character of
the flow from laminar to turbulent.
o These experimental results are confirmed by a numerical investigation with the
exact same flat tube channel with winglets by Forooghi et al. [18], who con‐
cluded the following:
“The flow is fully laminar and steady at Re = 1000 and turbulent at Re = 2710.
At Re = 1500, turbulence transition is already triggered by formation of un‐
steady vortices in the region with inserts.”
“Destruction and reformation of the boundary layer has shown to be the main
heat transfer enhancement mechanism due to passive inserts. This mechanism
is equally in action in both laminar and turbulent regimes.”
o Confirmation of change in slope for heat transfer results ΔNu/ΔRe at Recrit = 1500
in Figure 12.
For flat tube with pins and wave‐shaped bumps, the results are explained in detail
as follows, with more explanations, starting with the flat tubes with cylindrical pins.
Due to the Reynolds number range investigated, in the flat tube without passive in‐
serts only laminar flow conditions were present, whereas laminar and transitional flow
conditions were present with passive inserts. With pin inserts, two characteristic changes
in the slope Δ(Hg/Re)/ΔRe for pressure drop results existed for Recrit,1 = 550 and Recrit,2 =
1200. With the assumption of an analogy to flow around a single cylinder according to
Schlichting’s “boundary layer theory” [30], the first change in slope must indicate the end
of the laminar flow regime with no flow separation, with a fixed pair of symmetric vortices
directly downstream of the pin, or with laminar vortex street downstream of the pin. Fol‐
lowing the assumption of an analogy to flow around a single cylinder [30], the laminar
flow regime boundary was expected to occur for Rep < 150, which corresponded to Refl =
525, see Table 6. The indices p and fl reflect the characteristic length calculated either using
the pin diameter “p” or the hydraulic diameter of the flat tube “fl” without passive inserts,
“The flow is fully laminar and steady at Re = 1000 and turbulent atRe = 2710. At Re = 1500, turbulence transition is already triggered byformation of unsteady vortices in the region with inserts.”
Fluids 2022, 7, x FOR PEER REVIEW 15 of 26
the wave‐shaped bumps is located, quite low pressure differences at the bump surfaces
were present. It should be noted that the amount of bumps was chosen so as to create a
comparable pressure drop level over all Reynolds and Prandtl numbers and the same total
pressure drop as with the flat tube channel with “winglets”. This provides a good foun‐
dation for a discussion of potential reasons for the characteristic differences in heat trans‐
fer and pressure drop as an effect of the different passive inserts.
4.3.2. Flow Regime Boundary and Heat Transfer Mechanism Analysis
Pressure drop results are presented in Figure 13 using the dimensionless numbers
Hagen, Hg, and Reynolds number, Re. The heat transfer results with Nusselt number Nu
and Reynolds number Re are presented in Figure 12.
Since we have already presented results for heat transfer and pressure drop for the
two channels without and with winglets as passive inserts, we have shortened the follow‐
ing explanations to the most relevant topics for the extended investigation within this
contribution, focusing on two other passive inserts and the efficiency assessment of all
types of passive inserts. The following results were determined for:
‐ Flat tube without passive inserts:
o End of laminar flow regime occurring at Recrit = 2800, indicated by the change in
the slope for pressure drop results Δ(Hg/Re)/ΔRe, presented in Figure 13.
o Confirmation of change in slope for heat transfer results ΔNu/ΔRe at Recrit = 2800
in Figure 12.
‐ Flat tube with winglets:
o End of laminar flow regime occurring at Recrit = 1500, indicated by the change in
the slope for pressure drop results Δ(Hg/Re)/ΔRe, presented in Figure 13.
o Therefore, for Re > 1500 we assume that flow separation and local turbulences
at the surface of the passive inserts are induced, which changes the character of
the flow from laminar to turbulent.
o These experimental results are confirmed by a numerical investigation with the
exact same flat tube channel with winglets by Forooghi et al. [18], who con‐
cluded the following:
“The flow is fully laminar and steady at Re = 1000 and turbulent at Re = 2710.
At Re = 1500, turbulence transition is already triggered by formation of un‐
steady vortices in the region with inserts.”
“Destruction and reformation of the boundary layer has shown to be the main
heat transfer enhancement mechanism due to passive inserts. This mechanism
is equally in action in both laminar and turbulent regimes.”
o Confirmation of change in slope for heat transfer results ΔNu/ΔRe at Recrit = 1500
in Figure 12.
For flat tube with pins and wave‐shaped bumps, the results are explained in detail
as follows, with more explanations, starting with the flat tubes with cylindrical pins.
Due to the Reynolds number range investigated, in the flat tube without passive in‐
serts only laminar flow conditions were present, whereas laminar and transitional flow
conditions were present with passive inserts. With pin inserts, two characteristic changes
in the slope Δ(Hg/Re)/ΔRe for pressure drop results existed for Recrit,1 = 550 and Recrit,2 =
1200. With the assumption of an analogy to flow around a single cylinder according to
Schlichting’s “boundary layer theory” [30], the first change in slope must indicate the end
of the laminar flow regime with no flow separation, with a fixed pair of symmetric vortices
directly downstream of the pin, or with laminar vortex street downstream of the pin. Fol‐
lowing the assumption of an analogy to flow around a single cylinder [30], the laminar
flow regime boundary was expected to occur for Rep < 150, which corresponded to Refl =
525, see Table 6. The indices p and fl reflect the characteristic length calculated either using
the pin diameter “p” or the hydraulic diameter of the flat tube “fl” without passive inserts,
“Destruction and reformation of the boundary layer has shown to be themain heat transfer enhancement mechanism due to passive inserts. Thismechanism is equally in action in both laminar and turbulent regimes.”
# Confirmation of change in slope for heat transfer results ∆Nu/∆Re at Recrit = 1500in Figure 12.
For flat tube with pins and wave-shaped bumps, the results are explained in detail asfollows, with more explanations, starting with the flat tubes with cylindrical pins.
Due to the Reynolds number range investigated, in the flat tube without passive insertsonly laminar flow conditions were present, whereas laminar and transitional flow condi-tions were present with passive inserts. With pin inserts, two characteristic changes in theslope ∆(Hg/Re)/∆Re for pressure drop results existed for Recrit,1 = 550 and Recrit,2 = 1200.With the assumption of an analogy to flow around a single cylinder according to Schlicht-ing’s “boundary layer theory” [30], the first change in slope must indicate the end of thelaminar flow regime with no flow separation, with a fixed pair of symmetric vorticesdirectly downstream of the pin, or with laminar vortex street downstream of the pin. Fol-lowing the assumption of an analogy to flow around a single cylinder [30], the laminar flowregime boundary was expected to occur for Rep < 150, which corresponded to Refl = 525,see Table 6. The indices p and fl reflect the characteristic length calculated either using thepin diameter “p” or the hydraulic diameter of the flat tube “fl” without passive inserts,which was used for calculating the Reynolds number. Since the cylindric diameter istypically used for the flow around a cylinder, for Rep, the pin diameter of d = 0.6 mm wasused. For Refl the flat tube hydraulic diameter was used as the characteristic length in orderto calculate the Reynolds number, which was dh = 2.08 mm.
Table 6. Flow regime boundary for flow around single cylinder [30] compared with flow regimeboundaries in flat tube with cylindrical pins determined from experiment.
Flow Regime According to [30] Rep Taken from [30] Refl Calculated from Rep [30] Refl Determined from Exp. Data, seeFigures 11 and 12
Laminar flow <150 <522 <550Transition to turbulence 150 < Rep < 350 522 < Refl < 1225 550 < Refl < 1200
Fully turbulent flow Rep > 400 Refl > 1225 Refl > 1200
The subsequent flow regime, which was expected to occur for 150 < Rep < 350 [30],which corresponded to 525 < Refl < 1225, was characterized by transition to turbulence

Fluids 2022, 7, 53 16 of 26
in the vortex downstream of the pin and an increase in pressure drop and heat transferdue to local pressure differences and enhanced convective exchange of heat inside the flattube, which occurred for 550 < Recrit,2 < 1200. For Reynolds numbers Re > 1200 the vortexstreet became fully turbulent, which caused a further increase in pressure drop, while itwas of course also further reducing the thermal boundary layer, which enhanced the heattransfer significantly.
Using wave-shaped bumps, the heat transfer enhancement was quite low for Reynoldsnumbers Re < 1000. The small insert height did not affect the core flow; thus, no turbulencewas induced. In addition, the formation of the boundary layer was also not affected forRe < 1000 since the Nusselt numbers were comparable with the flat tube without passiveinserts, but the pressure drop was significantly increased for Re < 1000 since the entireamount of wave-shaped bumps seemed to effectuate a flow situation in a flat tube channelwith reduced channel height. A significant heat transfer enhancement was present forReynolds numbers Re > 2000, which was indicated by a change in the slope ∆(Hg/Re)/∆Reand ∆Nu/∆Re. It seems, that turbulence directly in the boundary layer was induced, whichsignificantly reduced the thermal boundary layer thickness.
4.4. Efficiency Assessment
Since there are different methods for performing an efficiency assessment availablein the literature, we want to summarize the most frequently used ones and comparethe different approaches. As long as either pressure drop or heat transfer of several flattubes with passive inserts stay in the same range, the efficiency can simply be rated bythe difference between the other quantity. Since in most cases, especially when a broadparameter range is investigated, this is not true, the efficiency of different passive insertshas to be evaluated in another way. Both heat transfer, with finite temperature difference,and pressure drop, due to friction and form drag forces, produce exergetic losses. Becauseof occurring irreversibilities, despite an energy balance, it may also be useful to use entropybalance for efficiency assessment.
4.4.1. Energetic Evaluation
When focusing on energy aspects, a first possible approach to rate efficiency is tocompare the heat transfer expressed, e.g., by the Nusselt number, with the pressure drop inone diagram. Figure 14 shows the data for all three flat tube channels discussed before fora Prandtl number of Pr = 13.
Figure 14. Efficiency in terms of Nusselt number Nu vs. pressure drop ∆p for Pr = 13.
The results for the flat tube with cylindrical pins and the flat tube with “winglets” arequite similar. For low Reynolds number, the Nusselt number was slightly higher whenusing “winglets”, while the pin tube showed highest values above approximately 50 mbar.Overall, the heat transfer increase with pressure drop was largest for the pin tube. The flat

Fluids 2022, 7, 53 17 of 26
tube with wave-shapes bumps showed lower Nusselt numbers with similar pressure drop,which allowed rating this flat tube as being less efficient for Pr = 13 compared with theflat tube with “winglets” and the one with pins. Since the Reynolds number is not directlyshown within Figure 13, the plot Nu vs Re shown in Figure 12 is helpful for interpretationconcerning different underlaying flow regimes, since the Reynolds number is presentwithin the diagram. However, no direct evaluation of “efficiency” in terms of heat transfervs pressure drop is possible by plotting the results as shown in Figure 12. In order to helpunderstanding the interpretation of the results in Figure 14, the additional informationof Reynolds number shown in Figure 12 may help for energetic analysis interpretation.However, at this stage it is clear, that a more pleasant way plotting and interpreting theresults would be helpful.
Another option to directly compare the increase in pressure drop and heat transferenhancement of the flat tubes with different passive inserts with the flat tube channelwithout passive inserts is the thermal enhancement factor TEF, see Equation (10) [31,32].For this, the quotient from Nusselt number with and without passive inserts is divided bythe third root of the quotient from friction factor with and without passive inserts.
TEF =Nuw/Nuw/0
(fw/fw/0)1/3 (10)
The results for the thermal enhancement factor for the flat tube with passive insertsare shown in Figure 15 for a Prandtl number of Pr = 13, like before. The lowest TEF ispresented for the wave-shaped bumps. For Reynolds numbers Re < 1000, the highest TEFis presented when using “winglets”, but for Re > 1000, the situation changes, as higherTEF values for the use of cylindrical pins are present. Qualitatively, the results of ananalysis according to Figures 13 and 15 are similar. If the total pressure drop is limitedto a certain level, which is true for many practical applications, it is recommended to usean efficiency comparison as shown in Figure 13. Using the TEF, the total pressure dropis not presented, yet the corresponding Reynolds numbers are shown, which makes theTEF a suitable efficiency criterion for scientific investigations on passive inserts affecting,e.g., flow regime boundaries. The lowest TEF is shown for the wave-shaped bumps sincewithin the experiments for Pr = 13, which were performed for Re < 2000, no turbulence wasinduced by the wave-shaped bumps. Since for a Prandtl number of Pr = 13 an increasedfluid viscosity was present (compared with lower Prandtl numbers), it was not possible toinvestigate higher Reynolds numbers than Re = 2000 with the used fluid pumps.
Figure 15. Efficiency in terms of thermal enhancement factor TEF for Pr = 13.
Following the ideas of Fan et al. [33], the quotient of the Nusselt number with passiveinserts Nuw and without passive inserts Nuw/o is plotted against the quotient of therespective dimensionless pressure drop fw and fw/o. This graphic representation is called aperformance evaluation plot (PEP) and shown in Figure 16. According to Fan et al. [33],

Fluids 2022, 7, 53 18 of 26
this allows a cost–benefit analysis based on the distinction between increase in pumpingpower P, pressure drop ∆p enhancement, or increase in friction factor f if the followingboundary conditions are met:
• Quasi-local test conditions are required, enabling the use of constant physical properties;• The heat transferring surface of the channel without passive inserts is used for the
calculation of heat transfer of all flat tubes with passive inserts;• For the calculation of the Reynolds number, the characteristic length of the flat tube
without passive inserts is used.
Figure 16. Efficiency in terms of performance evaluation plot (PEP) for Pr = 13.
These points can be considered as fulfilled for the experiments presented in thiscontribution. The correlation between the increase in pumping power, Pw/Pw/o, theincrease in pressure drop, ∆pw/∆pw/o, and the increase in friction factor, fw/fw/o, areincluded as dashed lines in Figure 15. The correlation between the heat flow enhancement.
Qw/.
Qw/o and friction factor enhancement fw/fw/o is also presented as a bisecting line. Adetailed derivation of the correlations is presented in [33].
In all areas 1–4, the heat transfer using passive inserts was increased. In area 1, theheat transfer was increased without energy savings, as the heat flow increase was lowerthan the increase in pumping power. Area 1 and 2 are separated by the line, which indicatesthe same increase in heat transfer and pumping power. In area 2 the increase in heattransfer exceeded the enhanced pumping power. In area 3, the increase in heat flow evenexceeded the increase in pressure drop. In the most efficient area 4, the heat transferenhancement exceeded the increase in friction factor. For Reynolds numbers Re < 300, noincrease in heat transfer is presented for the use of cylindrical pins, as already presentedin Figure 14 with TEF < 1. Flat tube with cylindrical pins seems to be very efficient forRe > 300 since for Re > 550 turbulent structures behind the pins are induced mainly inthe flow direction rather than crosswise to the flow direction, which allows a minimumincrease in pressure drop, while convective heat transfer is still enhanced. In contrast withthat, using “winglets”, which mainly force a reformation of boundary layers rather thaninducing turbulence, always operate in the most efficient regime.
The efficiency using wave-shaped bumps was enhanced with increasing Reynoldsnumbers. In contrast to pins and “winglets”, the most efficient area 4 in the performanceevaluation plot is not reached. With increasing Reynolds number, first, the increase inheat transferring surface of 2.1% affects the increase in efficiency since in the near-wallregion, for low Reynolds numbers, low velocity components are present, which causes aminimum pressure drop increase. Further increasing the Reynolds number, higher velocitycomponents arise in near-wall region, which disturb the formation of the boundary layer,resulting in a further efficiency enhancement, ranging from area 1 over 2 to 3.

Fluids 2022, 7, 53 19 of 26
Compared with the plots for rating the efficiency, which are shown in Figures 14 and 15,the PEP allows the effect of the different insert types along four efficiency areas to berated. It is also possible to account for a maximum pressure drop restriction with the PEP.Therefore, it is recommended to use the PEP for practical application, as it provides a lot ofadded relevant information.
4.4.2. Energetic and Exergetic Evaluation
Bejan [34,35] developed a method to evaluate the efficiency based on entropy produc-tion or rather based on the minimization of irreversibilities. In its original form however,this method does not account for the heat transfer enhancement, nor pressure drop in-crease, which hinders its application for rating the efficiency of passive inserts used forheat exchangers. This fact has also been recognized by Zimparov and Vulchanov [36],who used Bejan’s [34,35] method to extend the performance evaluation plot, proposedby Fan [33]. Zimparov [37] further extended this method in order to also account fordifferent thermal boundary conditions (UWT and UWH—uniform wall heat flux) and forchanging fluid temperature. Similar analyses have also been published by Prasad andShen [38] and Hesselgreaves [39]. Following the derivation described above, we thoroughlyinvestigate and apply the energetic and exergetic evaluation proposed by Zimparov [37] inthis contribution.
The idea behind this method is to use the first and second law of thermodynamicsand balance a differential volume element of the flat tube channel. A detailed derivationfor the channel geometry used in this contribution can be found in Appendix A. Finally,Equation (11) for the total entropy production due to heat flow and pressure drop is derived.This equation can be divided in the part of entropy production due to heat flow
.Sgen,Nu and
the one due to pressure drop.Sgen,∆p. For comparing the entropy production of a flat tube
without and with passive inserts, the entropy enhancement factor NS, see Equation (13),is used.
.Sgen =
.Q·Tw − Tout
Tin·Tout+
2·(U/Ac)2
dh·
.M
3·f
ρ2 ·L
Tw(11)
.Sgen =
.Sgen,Nu +
.Sgen,∆p (12)
NS =
.Sgen, w.Sgen,w/o
(13)
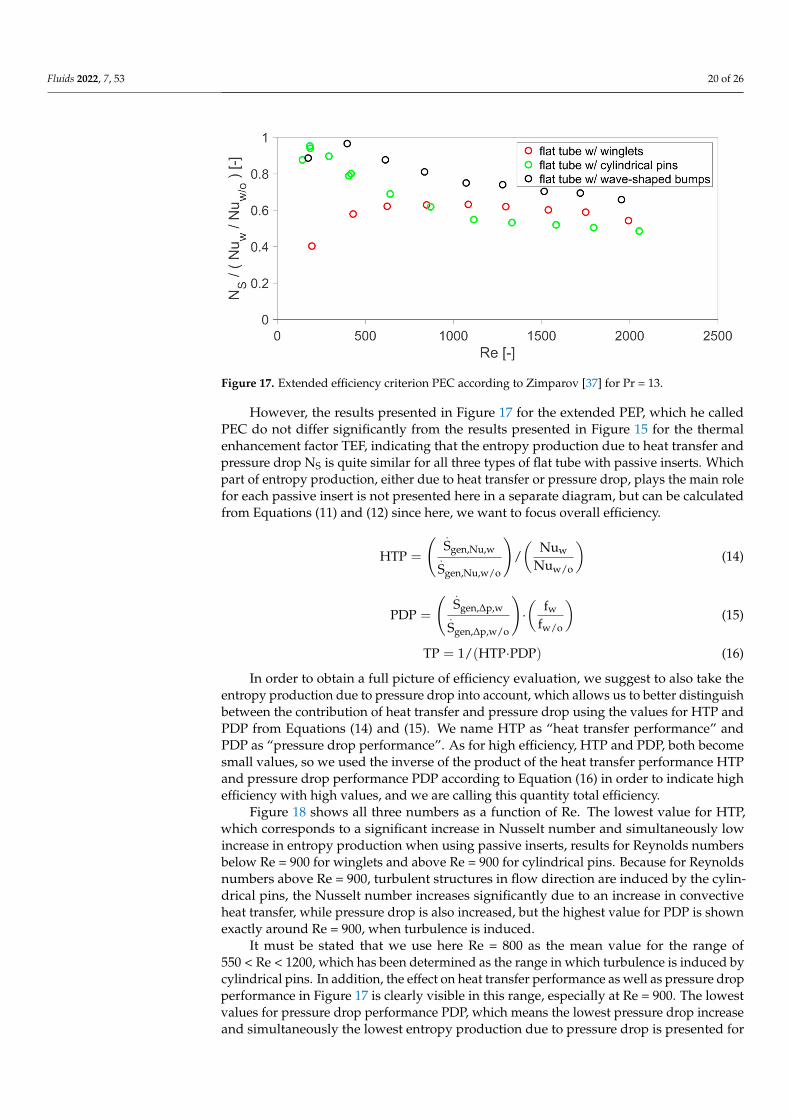
In order to finally realize an energetic and exergetic evaluation, Zimparov [36] suggestscomparing the quotient of NS, which described the difference in entropy production withNuw/Nuw/o, which described the energetic enhancement in heat transfer, see Figure 17.The smaller this value, the fewer irreversibilities are produced, or rather the less entropyis produced per increase in heat transfer. In addition, a high increase in Nusselt numberwhen using passive inserts also causes a small value for NS/(Nuw/Nuw/o). Consequently,the most effective flat tube with passive inserts is represented in Figure 17 with the small-est values.
For Reynolds numbers Re < 800, the flat tube with winglets was the most effective flattube for Pr = 13. Here the pressure drop increase for flat tubes with cylindrical pins for lowReynolds numbers was significantly higher compared with the one using winglets. Thepins first started to induce heat transfer enhancing mechanisms, as described above, for Re> 550, so that their NS/(Nuw/Nuw/o)-ratio was lowest there.
Fluids 2022, 7, 53 20 of 26
Figure 17. Extended efficiency criterion PEC according to Zimparov [37] for Pr = 13.
However, the results presented in Figure 17 for the extended PEP, which he calledPEC do not differ significantly from the results presented in Figure 15 for the thermalenhancement factor TEF, indicating that the entropy production due to heat transfer andpressure drop NS is quite similar for all three types of flat tube with passive inserts. Whichpart of entropy production, either due to heat transfer or pressure drop, plays the main rolefor each passive insert is not presented here in a separate diagram, but can be calculatedfrom Equations (11) and (12) since here, we want to focus overall efficiency.
HTP =
( .Sgen,Nu,w
.Sgen,Nu,w/o
)/(
Nuw
Nuw/o
)(14)
PDP =
( .Sgen,∆p,w
.Sgen,∆p,w/o
)·(
fw
fw/o
)(15)
TP = 1/(HTP·PDP) (16)
In order to obtain a full picture of efficiency evaluation, we suggest to also take theentropy production due to pressure drop into account, which allows us to better distinguishbetween the contribution of heat transfer and pressure drop using the values for HTP andPDP from Equations (14) and (15). We name HTP as “heat transfer performance” andPDP as “pressure drop performance”. As for high efficiency, HTP and PDP, both becomesmall values, so we used the inverse of the product of the heat transfer performance HTPand pressure drop performance PDP according to Equation (16) in order to indicate highefficiency with high values, and we are calling this quantity total efficiency.
Figure 18 shows all three numbers as a function of Re. The lowest value for HTP,which corresponds to a significant increase in Nusselt number and simultaneously lowincrease in entropy production when using passive inserts, results for Reynolds numbersbelow Re = 900 for winglets and above Re = 900 for cylindrical pins. Because for Reynoldsnumbers above Re = 900, turbulent structures in flow direction are induced by the cylin-drical pins, the Nusselt number increases significantly due to an increase in convectiveheat transfer, while pressure drop is also increased, but the highest value for PDP is shownexactly around Re = 900, when turbulence is induced.
It must be stated that we use here Re = 800 as the mean value for the range of550 < Re < 1200, which has been determined as the range in which turbulence is induced bycylindrical pins. In addition, the effect on heat transfer performance as well as pressure dropperformance in Figure 17 is clearly visible in this range, especially at Re = 900. The lowestvalues for pressure drop performance PDP, which means the lowest pressure drop increaseand simultaneously the lowest entropy production due to pressure drop is presented for

Fluids 2022, 7, 53 21 of 26
the flat tube with “winglets”. Although wave-shaped bumps and pins are quite differentin their effects and flow characteristics, the pressure drop performance is quite similar.The difference between the different flat tube types in total efficiency originates fromthe differences in heat transfer performance, where the wave-shaped bumps show lessperformance. For Re > 1000, the flat tube with cylindrical pins shows the highest totalefficiency. Thus, for a Prandtl number of Pr = 13, it seems to be more effective for flattube flow to induce streamwise vortices and turbulence in flat tubes, rather than using“winglets”, which mainly destruct and reform the boundary layer [18]. It must be statedagain here that both flat tube types were developed in order to realize the same heat transferlevel, so the results should not be generalized.
Figure 18. Heat transfer performance (HTP) and pressure drop performance (PDP) as well as totalperformance (TP) criterion for the tubes investigated in this contribution for Pr = 13.
Since the flat tube with “winglets” and that with wave-shaped bumps show the sameform drag pressure drop, the difference in pressure drop performance PDP must be due tothe differences in friction drag, which is higher for the wave-shaped bumps.
In summary, this newly proposed efficiency criterion, which fully accounts for ener-getic and exergetic evaluation, allows comparison of the different effects on heat transfermechanisms and pressure drop, which are inducing turbulence, destructing the boundarylayer, and inducing local pressure differences or shear stress, causing form and friction drag,respectively. However, the most application-oriented efficiency criterion seems to remainthe performance evaluation plot since different areas of efficiency are directly indicated here.Maximum pressure drop restrictions are also very easy to track. On the other hand, this cri-terion does not allow analysis of the mechanisms of heat and momentum transfer, which areinduced by the passive inserts. Plotting the total performance TP according to Equation (16)enables determination of the critical Reynolds numbers. For the flat tube with “winglets”, asignificant increase is visible for Re > Recrit = 1500, confirming the critical Reynolds numberof the flat tube with “winglets”. In addition, also the second critical Reynolds number forthe flat tube with cylindrical pins can be confirmed to Recrit,1 = 1200. Since only two datapoints for Re < 500 are shown for Pr = 13, it is not possible to finally judge the first criticalReynolds number, which should be found for Recrit,2 = 550. Consequently, this criterioncould be the means of choice for scientific and academic studies on passive heat transferenhancement, evaluating the efficiency with respect to heat transfer and pressure dropenhancement, because it fully covers energetic and exergetic consideration of heat transferand pressure drop.
5. Conclusions
Experiments were performed for a wide range of Reynolds and Prandtl numbersranging from 8 < Pr < 60 and 40 < Re < 3500, for flat tubes without and with three differentkind of passive inserts. The following points were understood for flat tube flow withoutand with passive inserts.

Fluids 2022, 7, 53 22 of 26
Without passive inserts:
• Pressure drop is mainly induced by friction drag forces. The form drag forces con-tribute to a significantly minor part on the total pressure drop.
• Laminar flow is present for Reynolds numbers Re < 2800.
With “winglets”:
• Passive inserts mainly destruct and reform the boundary layer, and form drag andfriction pressure drop are increased; however, pressure drop is mainly induced byfriction forces.
• Laminar flow is present for Reynolds numbers Re < 1500. Turbulence is induced forRe > 1500.
• “Destruction and reformation of the boundary layer has shown to be the main heattransfer enhancement mechanism due to passive inserts. This mechanism is equally inaction in both laminar and turbulent regimes.” [18]
With “cylindrical pins”:
• Passive inserts mainly reduce the critical Reynolds number, inducing turbulenceat lower Reynolds numbers, as when using the other passive inserts, which havebeen investigated in this contribution. Turbulence is induced inside the core flowdownstream of the pins for Re > 550.
• Form drag and friction pressure drop are increased; however, pressure drop is mainlyinduced by form drag forces, arising from local pressure differences.
With “wave-shaped bumps”:
• Passive inserts mainly destruct and reform the boundary layer, and form drag andfriction pressure drop are increased; however, pressure drop is mainly induced byfriction forces.
• Turbulence is induced in the near-wall region, which significantly enhances the heattransfer for Re > 2000. Since in near-wall region relatively low velocity componentsare present, turbulence is induced not before Recrit = 2000 is reached.
Based on the experimental results for heat transfer and pressure drop, different meth-ods for efficiency assessment cited in literature were reviewed and discussed. Best pressuredrop performance was calculated with winglets. Best heat transfer performance was calcu-lated for cylindrical pins for Re > 1000 and for winglets for Re < 1000. Consequently, thetotal performance was best for cylindrical pins for Re < 1000 and for winglets for Re < 1000.The proposed concept for rating the efficiency, the “total performance”, fully respects theenergetic and exergetic aspects of heat transfer and pressure drop enhancement.
Author Contributions: Conceptualization, D.B., S.M. and T.W.; formal analysis, D.B. and P.K.;funding acquisition, T.W.; methodology, D.B., P.K. and S.M.; project administration, T.W.; software,D.B. and P.K.; supervision, T.W.; validation, D.B., P.K. and S.M.; visualization, D.B. and K.D.; writing—original draft, D.B.; writing—review and editing, D.B., K.D. and T.W. All authors have read andagreed to the published version of the manuscript.
Funding: This research was funded by MAHLE Behr GmbH & Co. KG and BMWi, grant number03ET1106A.
Acknowledgments: The fundamental analysis and experiments were performed during the first,second, and third authors’ time as research assistants at the Karlsruhe Institute of Technology, Instituteof Thermal Process Engineering. The authors would like to thank MAHLE Behr GmbH & Co. KGand BMWi for their support of this research project. In addition, we would like to thank KlarissaNiedermeier, Dorothea Groß, Hannah Milena Kröhl, Tim Teichmann, Julyan Hanna, Michael Betz,and Konstantin Kapfer for their experimental work and for contributing ideas for this paper.
Conflicts of Interest: The authors declare no conflict of interest. The funders had no role in the designof the study; in the collection, analyses, or interpretation of data; in the writing of the manuscript; orin the decision to publish the results.

Fluids 2022, 7, 53 23 of 26
Nomenclature
Latin symbolsA Heat transfer surface (m2)AC Cross section of the measuring channel (m2)a,b,c,d,e,f Geometrical distances (m)B, C, B1, C1 Constant value (—)cp Specific heat capacity (J kg−1 K−1)cw Drag coefficient (—)d, dh Diameter (m), hydraulic diameter (m)fD Darcy friction factor (—)Ffo, Ffr Flow forces due to form drag, due to friction drag (N)h Height of the flat tube channel (m)k Peak-to-trough roughness height (m)kA Heat transmission coefficient (W K−1)L Length (m).
M Mass flow (kg s−1)n Normal direction (m)p/h Pitch-to-height ratio of passive inserts (—)p, ∆p Pressure (bar), pressure drop (bar).
Q,.q Heat flow (W), Heat flow density (W m−2)
R Heat transfer resistance (K W−1)t/h Depth-to-height ratio of passive inserts (—)T, ∆T Temperature (◦C), temperature difference (K)u Mean flow velocity (m s−1)V Fluid volume inside flat tube (m3)xm Mass fraction (—)Greek symbolsα Heat transfer coefficient (W m−2 K−1)η Dynamic viscosity (kg m−1 s−1)λ Thermal conductivity (W m−1 K−1)υ Kinematic viscosity (m2 s−1)ρ Density (kg m−3)τ Shear stress (N m−2)SubscriptsAl Aluminumcrit Indication of boundary between flow regimescold Cold flowd Pin diameterfl Flat tubehot Hot flowin Inletlam Laminarout Outletplane Plane in the aluminum shellturb TurbulentUWT Uniform wall temperaturew WallDimensionless numbersNu = α·dh
λ Nusselt number (—)Re = u·dh
υ Reynolds number (—)Pr = η·cp
λ Prandtl number (—)
Hg =∆p∆l ·
dh3
ρ·υ2 Hagen number (—)

Fluids 2022, 7, 53 24 of 26
Appendix A
With differential balancing energy (Equation (A1)) and exergy (Equation (A2)) insidethe flat tube, the equation for the extended Performance Evaluation Criteria is derived inthe following.
− α·(Tw − T)·U·dy = ρ·cp·u·Ac·dT (A1)
d.Sgen +
d.
QTw
=.
M·ds (A2)
Integrating Equation (A1) along the flat tube results in Equation (4) with the Stantonnumber St. ∫ y=y
y=0−α·(Tw − T)·U·dy =
∫ T=T
T=Tin
ρ·cp·u·Ac·dT (A3)
Tw − T = (Tw − Tin)· exp{−St· U
Ac·y}
(A4)
St =Nu
Re·Pr=
α
ρ·cp·u(A5)
Further, assuming an incompressible fluid(dH = cpdT
)and using the following
thermodynamic relations (T·ds = dH−V·dp) and(
dQ =.
M·dH)
, Equation (A2) is trans-formed to Equation (A6).
d.Sgen
dy=
.Mcp·
Tw − TT·Tw
·dTdy
+
.Mρ·T ·
(−dp
dy
)(A6)
Substituting Tw = T(y) + ∆T(y) and τT = ∆T/T, we obtain Equations (A7) and (A8).
d.Sgen
dy=
.Mcp·
∆TT·(T + ∆T)
·dTdy
+
.Mρ·T ·
(−dp
dy
)(A7)
d.Sgen
dy=
.Mcp·
∆TT2·(1 + τT)
·dTdy
+
.Mρ·T ·
(−dp
dy
)(A8)
Due to the present quasi-local test conditions, one has τT � 1 and Equation (A9).
d.Sgen
dy=
.Mcp·
∆TT2 ·
dTdy
+
.Mρ·T ·
(−dp
dy
)(A9)
Replacing the bulk temperature T(y) in Equation (A9) with Equation (A4), usingEquations (A10) and (A11), and integrating the resulting equation over the entire flat tubelength results in Equation (A12).
dpdy
= 2·f·ρ· udh
(A10)
u =M
Ac·ρ(A11)
.Sgen =
.Mcp·( −
(Tw−Tin)· exp{−St· UAc ·L}
Tw−(Tw−Tin)· exp{−St· UAc ·L}
+ (Tw−Tin)Tw−(Tw−Tin)
− lnTw−(Tw−Tin)· exp{−St· U
Ac ·L}Tw−(Tw−Tin)
)+
2· UAc
dh·
.M
3·f
ρ2
·[− 1
St· UAc ·Tw
·(
ln TinTout− St· U
Ac·L)]
(A12)

Fluids 2022, 7, 53 25 of 26
With the following equations (Equations (A13)–(A15)) the final equation results forthe entropy production in Equation (A16), which is equal to Equation (11) used in this con-tribution. .
Q =.
M cp·(Tin − Tout) (A13)
lnTin
Tout= ln
(1 +
Tout − Tin
Tin
)∼=
Tout − Tin
Tin(A14)
1St· U
Ac·L·Tout − Tin
Tin=
Tw − Tm
Tout − Tin·Tout − Tin
Tin=
Tw − Tm
Tin� 1 (A15)
.Sgen =
.Q·Tw − Tout
Tin·Tout+
2·(U/Ac)2
dh·
.M
3·f
ρ2 ·L
Tw(A16)
References1. Lau, S.C.; Kukreja, R.T.; McMillin, R.D. Effects of V-shaped rib arrays on turbulent heat transfer and friction of fully developed
flow in a square channel. Int. J. Heat Mass Transf. 1991, 34, 1605–1616. [CrossRef]2. Han, J.C.; Zhang, Y.M. High performance heat transfer ducts with parallel broken and V-shaped broken ribs. Int. J. Heat
Mass Transf. 1992, 35, 513–523. [CrossRef]3. Kumar, S.; Saini, R. CFD based performance analysis of a solar air heater duct provided with artificial roughness. Renew. Energy
2009, 34, 1285–1291. [CrossRef]4. Chung, H.; Park, J.; Park, S.S.; Choi, S.M.; Rhee, D.-H.; Cho, H.H. Augmented heat transfer with intersecting rib in rectangular
channels having different aspect ratios. Int. J. Heat Mass Transf. 2015, 88, 357–367. [CrossRef]5. Turnow, J.; Kornev, N.; Isaev, S.; Hassel, E. Vortex mechanism of heat transfer enhancement in a channel with spherical and oval
dimples. Int. J. Heat Mass Transf. 2011, 47, 301–313. [CrossRef]6. Peng, Y. Heat Transfer and Friction Loss Characteristics of Pin Fin Cooling Configurations. J. Eng. Gas Turbines Power 1984, 106,
246–251. [CrossRef]7. Armstrong, J.; Winstanley, D. A review of staggered array pin fin heat transfer for turbine cooling applications. ASME J. Turbomach.
1988, 110, 94–103. [CrossRef]8. Metzger, D.E.; Berry, R.A.; Bronson, J.P. Developing heat transfer in rectangular ducts with staggered arrays of short pin fins.
ASME J. Heat Transf. 1982, 104, 700–706. [CrossRef]9. Wang, F.; Zhang, J.; Wang, S. Investigation on flow and heat transfer characteristics in rectangular ducts with drop-shaped
pin-fins. Propuls. Power Res. 2012, 1, 64–70. [CrossRef]10. Wongcharee, K.; Changcharoen, W.; Eiamsa-ard, S. Numerical investigation of flow friction and heat transfer in a channel with
various shaped ribs mounted on two opposite ribbed walls. Int. J. Chem. React. Eng. 2011, 9, A26. [CrossRef]11. Dewan, A.; Mahanta, P.; Raju, K.S.; Kumar, P.S. Review of passive heat transfer augmentation techniques. Proc. Inst. Mech. Eng.
Part A J. Power Energy 2004, 218, 509–527. [CrossRef]12. Bertsche, D.; Knipper, P.; Dietrich, B.; Wetzel, T. The Generalized Lévêque Equation and its application to circular pipe flow. Int. J.
Heat Mass Transf. 2015, 90, 1255–1265. [CrossRef]13. Bertsche, D.; Wetzel, T. Experimental set-up for investigation of passive heat transfer augmentation in water-air heat exchangers. In
Proceedings of the 8th World Congress on Experimental Heat Transfer, Fluid Mechanics and Thermodynamics, Lisbon, Portugal,16–20 June 2013.
14. Bertsche, D.; Knipper, P.; Wetzel, T. Experimental investigation on heat transfer in laminar, transitional and turbulent circularpipe flow. Int. J. Heat Mass Transf. 2016, 95, 1008–1018. [CrossRef]
15. Bertsche, D.; Knipper, P.; Kapfer, K.; Wetzel, T. Experimental investigation on heat transfer in laminar, transitional and turbulentcircular pipe flow with respect to flow regime boundaries. Int. J. Heat Mass Transf. 2019, 145, 118746. [CrossRef]
16. Bertsche, D.; Meinicke, S.; Knipper, P.; Dubil, K.; Wetzel, T. The Generalized Lévêque Equation and its application to flat tubeswithout and with passive inserts. Int. J. Heat Mass Transf. 2021, 171, 121053. [CrossRef]
17. Herwig, H. Wärmeübertragung: Physikalische Grundlagen, 3. Erweiterte und Überarbeitete Auflage; Springer: Wiesbaden, Germany, 2014.18. Forooghi, P.; Flory, M.; Bertsche, D.; Wetzel, T.; Frohnapfel, B. Heat transfer enhancement on the liquid side of an industrially
designed flat-tube heat exchanger with passive inserts–Numerical investigation. Appl. Therm. Eng. 2017, 123, 573–583. [CrossRef]19. Ghajar, A.J.; Madon, K.F. Pressure drop measurements in the transition region for a cylindrical tube with three different inlet
configurations. Exp. Therm. Fluid Sci. 1992, 5, 129–135. [CrossRef]20. Ghajar, A.J.; Tam, L.M. Flow regime map for a horizontal pipe with uniform wall heat flux and three inlet configurations.
Exp. Therm. Fluid Sci. 1995, 10, 287–297. [CrossRef]21. Ghajar, A.J.; Tam, L.M. Heat transfer measurements and correlations in the transition region for a cylindrical tube with three
different inlet configurations. Exp. Therm. Fluid Sci. 1994, 8, 79–90. [CrossRef]22. Kast, W. Pressure Drop in Single Phase Flow, VDI Heat Atlas, 2nd ed.; Springer Verlag: Berlin/Heidelberg, Germany, 2010; Chapter Lac 1–6.

Fluids 2022, 7, 53 26 of 26
23. ISO/IEC GUIDE 98-3:2008; Uncertainty of Measurement–Part 3: Guide to the Expression of Uncertainty in Measurement(GUM:1995). ISO/IEC: Geneva, Switzerland, 2008.
24. Baehr, H.D.; Stephan, K. Wärme-und Stoffübertragung; Springer: Berlin, Germany, 2010; Chapter 2.2.5.1; pp. 154–161.25. Della, A.; Torre, G.; Montenegro, G.R.; Tabor, M.; Wears, L. CFD characterization of flow regimes inside open cell foam substrates.
Int. J. Heat Fluid Flow 2014, 50, 72–82. [CrossRef]26. Garimella, S.; Dowling, W.J.; Van Der Veen, M.; Killion, J.D. The effect of simultaneously developing flow on heat transfer in
rectangular tubes. Heat Transf. Eng. 2001, 22, 12–25. [CrossRef]27. Shah, R.K.; Bhatti, M.S. Laminar Convective Heat Transfer in Ducts. In Handbook of Single-Phase Convective Heat Transfer; Kakac, S.,
Shah, R.K., Eds.; Wiley: New York, NY, USA, 1987; pp. 3.1–3.137.28. VanFossen, G.J. Staggered Arrays of Short Pin. J. Eng. Gas Turbines Power 1982, 104, 268–274. [CrossRef]29. Moon, M.A.; Kim, K.Y. Analysis and optimization of fan-shaped pin–fin in a rectangular cooling channel. Int. J. Heat Mass Transf.
2014, 72, 148–162. [CrossRef]30. Schlichting, H.; Gersten, K. Boundary Layer Theory, 10th ed.; Springer: Berlin/Heidelberg, Germany, 2006.31. Wang, G.L.; Yang, D.W.; Wang, Y.D.; Niu, X.; Zhao, L.; Ding, G. Heat Transfer and Friction Characteristics of the Microfluidic
Heat Sink with Variously-Shaped Ribs for Chip Cooling. Sensors 2015, 15, 9547–9562. [CrossRef]32. Park, J.S.; Han, J.C.; Huang, Y.; Ou, S.; Boyle, R.J. Heat transfer performance comparisons of five different rectangular channels
with parallel angled ribs. Int. J. Heat Mass Transf. 1992, 35, 2891–2903. [CrossRef]33. Fan, J.F.; Ding, W.K.; Zhang, J.F.; He, Y.L.; Tao, W.Q. A performance evaluation plot of enhanced heat transfer techniques oriented
for energysaving. Int. J. Heat Mass Transf. 2009, 52, 33–44. [CrossRef]34. Bejan, A. Entropy Generation Through Heat and Fluid Flow; CRC Press: New York, NY, USA, 1982.35. Bejan, A. Entropy Generation Minimisation; Wiley: New York, NY, USA, 1996.36. Zimparov, V.D.; Vulchanov, N.L. Performance evaluation criteria for enhanced heat transfer surfaces. Int. J. Heat Mass Transf.
1994, 37, 1807–1816. [CrossRef]37. Zimparov, V.D. Extended performance evaluation criteria for enhanced heat transfer surfaces: Heat transfer through ducts with
constant wall temperature. Int. J. Heat Mass Transf. 2000, 43, 3137–3155. [CrossRef]38. Prasad, R.C.; Shen, J. Performance evaluation of convective heat transfer enhancement devices using exergy analysis. Int. J. Heat
Mass Transf. 1993, 36, 4193–4197. [CrossRef]39. Hesselgreaves, J.E. Rationalisation of second law analysis of heat exchangers. Int. J. Heat Mass Transf. 2000, 43, 4189–4204. [CrossRef]
Copyright © 2022 FDOKUMEN