health expenditure scenarios - in the new member states ...
31
European Network of Economic Policy Research Institutes HEALTH EXPENDITURE SCENARIOS IN THE NEW MEMBER STATES COUNTRY REPORT ON SLOVAKIA VLADIMÍR KVETAN VILIAM PÁLENÍK MARTIN MLÝNEK MAREK RADVANSKÝ ENEPRI RESEARCH REPORT NO. 48 AHEAD WP9 DECEMBER 2007 ENEPRI Research Reports are designed to make the results of research projects undertaken within the framework of the European Network of Economic Policy Research Institutes (ENEPRI) publicly available. This paper was prepared as part of Work Package 9 of the AHEAD project – Ageing, Health Status and the Determinants of Health Expenditure – which has received financing from the European Commission under the 6 th Research Framework Programme (contract no. SP21-CT-2003-502641). Its findings and conclusions are attributable only to the author/s and not to ENEPRI or any of its member institutions. A brief description of the AHEAD project and a list of its partner institutes can be found at the end of this report. ISBN 978-92-9079-765-4 AVAILABLE FOR FREE DOWNLOADING FROM THE ENEPRI WEBSITE (HTTP://WWW.ENEPRI.ORG) AND THE CEPS WEBSITE (WWW.CEPS.EU) © COPYRIGHT 2007, VLADIMÍR KVETAN, VILIAM PÁLENÍK, MARTIN MLÝNEK, MAREK RADVANSKÝ
-
Upload
khangminh22 -
Category
Documents
-
view
1 -
download
0
Transcript of health expenditure scenarios - in the new member states ...

European Network of Economic Policy Research Institutes
HEALTH EXPENDITURE SCENARIOS IN THE NEW MEMBER STATES
COUNTRY REPORT ON SLOVAKIA
VLADIMÍR KVETAN VILIAM PÁLENÍK MARTIN MLÝNEK
MAREK RADVANSKÝ
ENEPRI RESEARCH REPORT NO. 48 AHEAD WP9
DECEMBER 2007
ENEPRI Research Reports are designed to make the results of research projects undertaken within the framework of the European Network of Economic Policy Research Institutes (ENEPRI) publicly available. This paper was prepared as part of Work Package 9 of the AHEAD project – Ageing, Health Status and the Determinants of Health Expenditure – which has received financing from the European Commission under the 6th Research Framework Programme (contract no. SP21-CT-2003-502641). Its findings and conclusions are attributable only to the author/s and not to ENEPRI or any of its member institutions. A brief description of the AHEAD project and a list of its partner institutes can be found at the end of this report.
ISBN 978-92-9079-765-4 AVAILABLE FOR FREE DOWNLOADING FROM THE ENEPRI WEBSITE (HTTP://WWW.ENEPRI.ORG)
AND THE CEPS WEBSITE (WWW.CEPS.EU) © COPYRIGHT 2007, VLADIMÍR KVETAN, VILIAM PÁLENÍK, MARTIN MLÝNEK, MAREK RADVANSKÝ

Contents
Introduction ................................................................................................................................... 1 Health care expenditure models in Slovakia ................................................................................. 1 1. Description of Health budget model....................................................................................... 5
1.1 Module of labour market .............................................................................................. 6 1.2 Module of health care demand...................................................................................... 7 1.3 Module of health budget ............................................................................................... 7 1.4 Module of Economy ..................................................................................................... 8 1.5 Demographic variables ............................................................................................... 10 1.6 Labour market variables ............................................................................................. 11 1.7 Economic variables..................................................................................................... 12
2. Results of projection and sensitivity analysis to given parameters....................................... 13 2.1 Sensitivity test............................................................................................................. 15
Conclusions ................................................................................................................................. 19 Policy recommendation............................................................................................................... 20 References ................................................................................................................................... 22 Appendix. Sensitivity scenarios – Slovak Republic.................................................................... 23
List of Tables Table 1. Demographic variables.................................................................................................. 11 Table 2. Labour market variables................................................................................................ 12 Table 3. Economic variables ....................................................................................................... 13 Table 4. Projection of health budget revenues and expenditures and health system
deficit/surplus ............................................................................................................... 14 Table 5. Real wage growth under different scenarios ................................................................. 16 Table 6. Employment rates under different scenarios................................................................. 16 Table 7. Life expectancy for males under different scenarios..................................................... 17 Table 8. Life expectancy for females under different scenarios ................................................. 17 Table 9. Health expenditures under different scenarios .............................................................. 18 Table 10. Health expenditures under different scenarios and assumptions................................. 19
List of Figures Figure 1. Health care insurance system incomes in the year of 2000 ........................................... 2 Figure 2. Number of the unemployed in years 1995-2000............................................................ 4 Figure 3. State insured persons in the years 1995 – 2000 ............................................................. 5 Figure 4. Basic relations in expenditure model of health security system .................................... 6 Figure 5. Level of premium needed to close gap ........................................................................ 15 Figure 6. Comparison of total revenues & expenditures of health system (mil.Skk).................. 15 Figure 7. Revenues sensitivity test results................................................................................... 16 Figure 8. Expenditures of healthcare system............................................................................... 18 Figure 9. Expenditures of healthcare system............................................................................... 19 Figure A.1 Total revenues of health system................................................................................ 26 Figure A.2 Deficit (-), Surplus (+) of health system as share of GDP ........................................ 27

| 1
Health Expenditure Scenarios in the New Member States
Country Report on Slovakia ENEPRI Research Report No. 48/December 2007
Vladimír Kvetan, Viliam Páleník, Martin Mlýnek & Marek Radvanský*
Introduction After social shifts, in 1989, Slovak economy passes through decade of transformation from directive economy to free market economy. Similarly as in other transforming economies, neither Slovak economy avoided transformation recession. In Slovak health system two negative effects have combined:
- impact of transformation recession on financial perspective of health system
- traditionally public sectors (as health system is typical example) don’t undertake transformation process at all, or only made a partial transformation and were last sectors that started transformation process
As a consequence national healthcare systems in transitive economies don’t profit from transformation of economy and transition to market oriented healthcare system by privatization and liberalization are lagged. To 21st century Slovak health care system entered:
- in poor financial perspective corresponding to economy after transformation recession - in fact with socialistic internal organization - with fully liberalized world pharmaceutical market - with population aging problem - and with high unemployment rate and low employment rate
This situation brings many challenges for healthcare system of Slovakia for the future. In basic setting receipts and expenditures of healthcare system will be one of the challenges in the future, especially with best healthcare possible for citizens.
Goal of this work was to construct macroeconomic model of revenues and expenditures of healthcare system and application of model in quantification of basic forecast of healthcare budged and for sensitivity analysis. Aim of work is based on prediction of:
- life expectations - real wage projection - employment rate projection
Health care expenditure models in Slovakia There is no clear evidence about existence of more or less sophisticated models used in health care expenditures analysis on a government level. There is possibility, that health insurance
* Vladimír Kvetan, Viliam Páleník, Martin Mlýnek and Marek Radvanský are at the Institute of Economic Research, Slovak Academy of Sciences.

2 | KVETAN, PÁLENÍK, MLÝNEK & RADVANSKÝ
companies have a model estimating their health care expenditures, but they never been published.
Only publication that is close to health care modelling is based on econometric model of Slovak economy (Páleník et al., 2005). This model is based on modification of macroeconomic models that are built on Institute for Economic Research, Slovak Academy of Sciences.
The core of this model is description of impact and mutual dependence of macroeconomic variables in real economy. The model consists of eight blocks of equations describing the particular part of economy. In the block of prices and deflators the main prices (CPI, PPI) and deflators of GDP components are described. The block of labour market consists of equations for demand and supply of labour force. The labour force supply is based on demographic forecast. Block of population is describing micro - macro relations. The nominal wages and employment (micro level) is combined to labour and other incomes resulting in household disposable income, which is spent for consumption or kept as a savings. In the block of foreign trade, the prices and values of Slovak export and import are calculated. The main indicators - GDP and components of use are calculated in a block of GDP. Monetary block describes the interactions between monetary policy and real economy. The state budget income and expenditures are calculated in a block of state budget.
This model has been extended by block oh health insurance system incomes. This block is divided into three parts. Equations of employment payments constitute the first part. Payments from unemployed persons are included in the second part. Payments of state are contained in the third part. In Figure 1 the shares of particular health care system contributors are described.
Figure 1. Health care insurance system incomes in the year of 2000
Paid by state26%
Paid from the employment
fund1%
payments from employees
19%
Paid by employers
51%
Self employing persons
3%
Payments from employers, employees and self-employed persons are calculated using the regression equations1. Equations estimations are based on the income of population as an explanatory variable.
PZ1 = -1552.23 + 26.51*OZ
(-1.5) (7.8)
R2 = 0.938 DW = 2.16 1 Numbers in brackets show the t-statistics; R2 (coefficient of determination) and DW (Durbin-Watson’s coefficient) are also reported.

HEALTH EXPENDITURE SCENARIOS IN THE NEW MEMBER STATES: SLOVAKIA | 3
where
PZ1 incomes of health insurance system paid by employees OZ rewards of employees
PZ2 = 247.51 + 58.54*OZ
(0.2) (12.7)
R2 = 0.976 DW = 1.97
where
PZ2 incomes of health insurance system paid by employers OZ rewards of employees
PSZCO = (-19.31) + 5.11*YW
(-0.2) (9.0)
R2 = 0.953 DW = 1.71
where
PSZCO incomes of health insurance system paid by self-employed YW gross wages and salaries
As it can be seen, incomes of health insurance system are determined by the incomes of population to a great extent.
Health insurance for unemployed has been paid from two sources. National Institute of Labor pays to health insurance system for those unemployed who receive unemployment benefits. State pays for those who do not receive unemployment benefits.
PLUNUP = LU*QNUP* NUP1
PLUROZ = LU*(1-QNUP) * ROZ1
where
PLUNUP payments for unemployed receiving unemployment benefits PLUROZ payments for unemployed not receiving unemployment benefits LU number of unemployed QNUP share of unemployed receiving unemployment benefits on total NUP1 unit payment of National Institute of Labor per one unemployed ROZ1 unit payment of state per one unemployed
Payments of state and NIL are calculated as identities. These identities represent the products of number of unemployed, share of particular group of unemployed on total and payment per unit.

4 | KVETAN, PÁLENÍK, MLÝNEK & RADVANSKÝ
Figure 2. Number of the unemployed in years 1995-2000
0
100
200
300
400
1995 1996 1997 1998 1999 2000
registered unemployed not receiving the unemployment benefitsregistered unemployed receiving the unemployment benefits
State paid to health insurance system for unemployed (as mentioned above), unprovided-for children, retired people and other state policyholders. Unprovided-for children are considered children aged 0-14 and also children belonging to a part of age group 15-24 (almost 60 %). High school and university students with any regular income are placed in category 15-24.
Retired people are considered people aged 60 or more. A part of age group 55-59 also belongs to this category. Women and prematurely retired men are found in this category, too. Other state policyholders are persons taking care of a baby, young men on military service, etc.
Equations for calculating payments of these three groups are identities. The calculation represents a product of number of persons in the particular group and unit payment stated according to the relevant legislation.
PDETI = DETI*PDETI1 PDOCH = DOCH*PDOCH1 POST = OST*OST1
where
PDETI payments for unprovided-for children DETI number of children PDETI1 unit payment for a child PDOCH payments for retired persons DOCH number of retired persons PDOCH1 unit payment for a retired person POST payments for other policyholders OST number of other policyholders POST1 unit payment for other policyholder
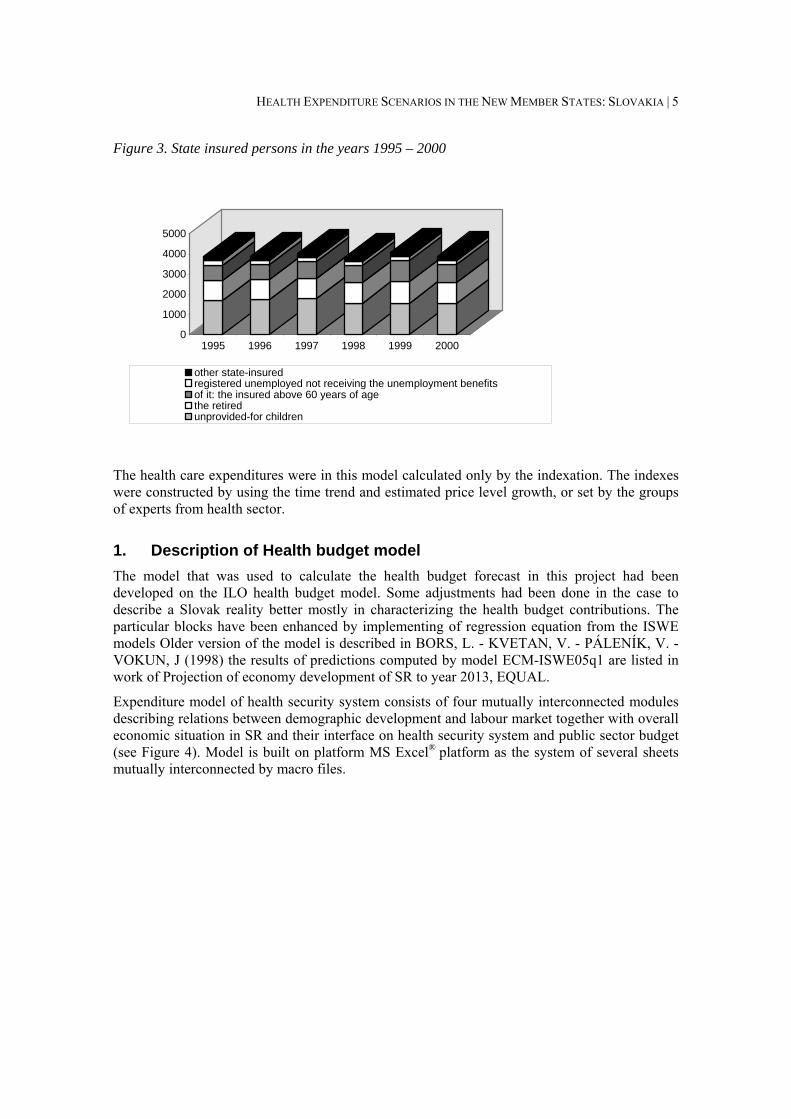
HEALTH EXPENDITURE SCENARIOS IN THE NEW MEMBER STATES: SLOVAKIA | 5
Figure 3. State insured persons in the years 1995 – 2000
0
1000
2000
3000
4000
5000
1995 1996 1997 1998 1999 2000
other state-insuredregistered unemployed not receiving the unemployment benefitsof it: the insured above 60 years of agethe retiredunprovided-for children
The health care expenditures were in this model calculated only by the indexation. The indexes were constructed by using the time trend and estimated price level growth, or set by the groups of experts from health sector.
1. Description of Health budget model The model that was used to calculate the health budget forecast in this project had been developed on the ILO health budget model. Some adjustments had been done in the case to describe a Slovak reality better mostly in characterizing the health budget contributions. The particular blocks have been enhanced by implementing of regression equation from the ISWE models Older version of the model is described in BORS, L. - KVETAN, V. - PÁLENÍK, V. - VOKUN, J (1998) the results of predictions computed by model ECM-ISWE05q1 are listed in work of Projection of economy development of SR to year 2013, EQUAL.
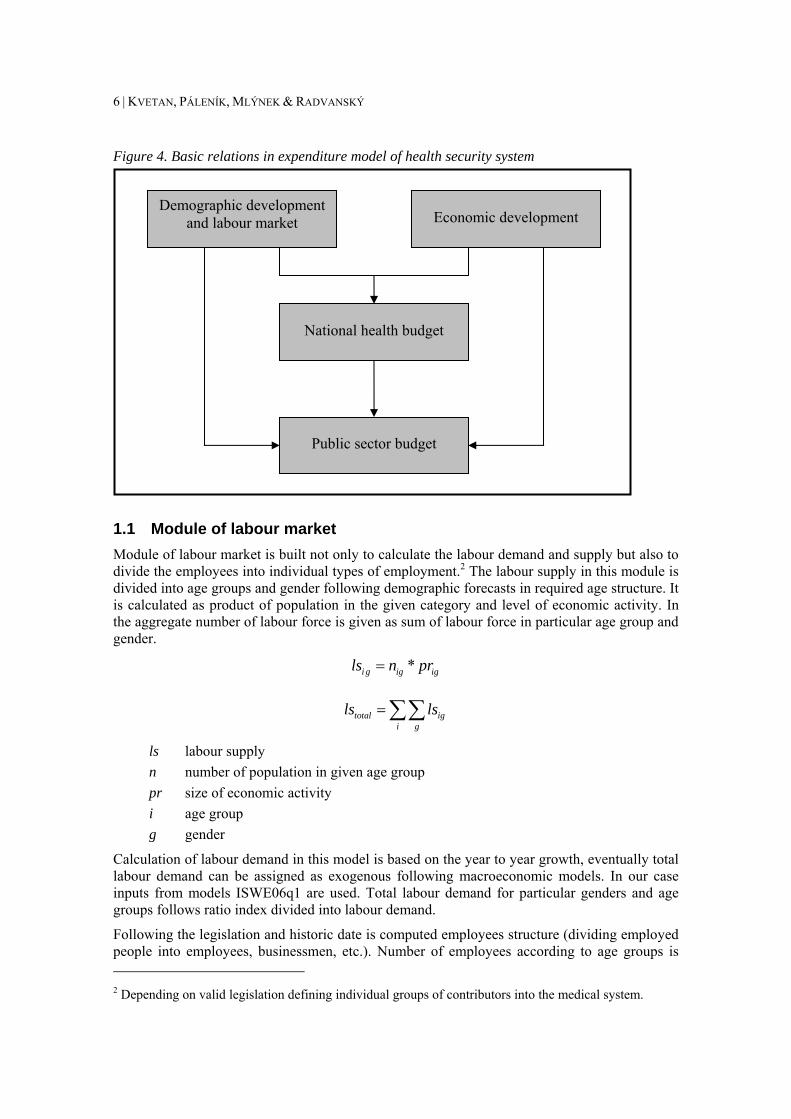
Expenditure model of health security system consists of four mutually interconnected modules describing relations between demographic development and labour market together with overall economic situation in SR and their interface on health security system and public sector budget (see Figure 4). Model is built on platform MS Excel® platform as the system of several sheets mutually interconnected by macro files.
6 | KVETAN, PÁLENÍK, MLÝNEK & RADVANSKÝ
Figure 4. Basic relations in expenditure model of health security system
1.1 Module of labour market Module of labour market is built not only to calculate the labour demand and supply but also to divide the employees into individual types of employment.2 The labour supply in this module is divided into age groups and gender following demographic forecasts in required age structure. It is calculated as product of population in the given category and level of economic activity. In the aggregate number of labour force is given as sum of labour force in particular age group and gender.
*i g ig igls n pr=
total igi g
ls ls=∑∑
ls labour supply n number of population in given age group pr size of economic activity i age group g gender
Calculation of labour demand in this model is based on the year to year growth, eventually total labour demand can be assigned as exogenous following macroeconomic models. In our case inputs from models ISWE06q1 are used. Total labour demand for particular genders and age groups follows ratio index divided into labour demand.
Following the legislation and historic date is computed employees structure (dividing employed people into employees, businessmen, etc.). Number of employees according to age groups is 2 Depending on valid legislation defining individual groups of contributors into the medical system.
Demographic development and labour market Economic development
National health budget
Public sector budget

HEALTH EXPENDITURE SCENARIOS IN THE NEW MEMBER STATES: SLOVAKIA | 7
predicted as well as number of unemployed people and unemployment rate in the given predicted horizon.
1.2 Module of health care demand3 Input data of this module are data describing health care services used by people of different age groups. Available data of average number of physician visits and average number of hospitalization in particular age group is the base for approximation of health care services demand dependence following the age. Model input is approximation of a J-curve4 for Slovak republic that is the base of prediction of health care demand according to age groups. Basic version of the model assumes the J-curve based on historical data as given for next periods. The model allows also adding own probabilities of health care use in proper age groups.
*ig ig igHCU n p= (1.1)
total igi g
HCU HCU=∑∑ (1.2)
where
HCU health care use p probability of health care use (from J-curve) n number of population in the proper group i age group g gender
1.3 Module of health budget This module balance revenue and expenditure side of health care system. Expenditure of general health care system is counted as sum of hospital, medical and long-term care expenditure. Development of each expenditure category depends on health care demand and unit cost calculated in module. Growth rate of unit cost are one of the exogenous variables in the model. Unit costs can be set up for all age groups and gender group as well as model structure enable individual unit cost settings.
Revenue of medical system are calculated following the structure and number of contributors, allocated percentage share of contributions and level of base for contributions into the health care system.5 In this module the revenues and expenditures of Social Insurance are computed too. The base of this calculation follows the structure of insured people and contributors into the Social Insurance Company.
3 Older version of the model is described in BORS, L. - KVETAN, V. - PÁLENÍK, V. - VOKUN, J.: Construction and Verification of Macroeconomic Model ISWE97q3. Econ. Magazine 46, 1998, è. 3, pg. 428-466. actual results of predictions computed by model ECM-ISWE05q1 are listed in work of ĎURAŠ, J. – KVETAN, V. – MLYNEK, M. – ONDKO, P. – PÁLENÍK, V. –RADVANSKÝ, M.: Makroekonomická prognóza ekonomiky SR na roky 2005 – 2009 In. Zborník konferencie: Pohľady na ekonomiku Slovenska 2005, SDSS, Bratislava, 2005. 4 Determination „J-curve“ is characterizing relatively low health care demand from population in middle age, increased demand from side of children and enormous health care use from side of population in pension age. 5 Prediction of revenue is based on presumption that wage will grow – see Economic module.

8 | KVETAN, PÁLENÍK, MLÝNEK & RADVANSKÝ
1.4 Module of Economy The main inputs represents basic indicators describing the real growth of GDP, labour productivity, inflation, growth of real wages and real interest rate. In this module is possibility to use the existing macroeconomic forecasts (made aside of this model) and use exogenous settings of macroeconomic indicators. Research team used an economic forecast made by Error-Correction model ECM-ISWE06q1 for purpose of middle-term projection of economy development. Forecast of all variables and indicators were made by ECM-ISWE06q1model and were exogenously incorporated to Module of Economy. Projection period of ECM-ISWE06q1 model is from 2006 to 2013.
This module is oriented also on predictions of public budget revenues and expenditure. On the side of revenues the income from direct and indirect taxes and other incomes (is possible to deliver your own predictions too). The expenditure side the health care service expenditures (from the module of health budget), pension care expenditures (derived from prediction of retired population and assumptions of pension level and growth), education expenditures (calculated from the prediction of population in school age) and the other expenditure. Used model of health care expenditures provides besides prediction of health care budget also approximate prediction of overall public budget (exogenous setting of other balances, for example deficit of municipalities is necessary).
Development of Slovak economy indicates that after 2000 pensions level had slow real growth so we assumed that real pension grow will keep its trend and modified block such that it will capture this growth.
Also development of non-tax revenues and expenditures of government ware highly volatile between 1998 and 2005. This volatility was supported by receipts from privatization of state enterprises and by redevelopment of banks in 2001 and 2001 in which state overtook some of private bank irrecoverable debts. We assume that this development will be finished and that volatility of general government budget will be more stable and lower. Therefore development of non-tax receipts is enhanced in module by autoregressive process AR(1).
Data source for model The main economic indicators are based on the national accounts. National accounts of Slovak republic are provided by Statistical Office Slovak Republic. Compilation of National Accounts of Slovak republic is based on the European System of Accounts 95 (ESA 95). Compilation include data on Gross Domestic Product (GDP), calculated by production as well as expenditure approach, development of GDP by branches, components of GDP by economic activities, Gross Fixed Capital Formation (GFCF), generation and use of Income in sector of households, Disposable Income (DI) and Employment indicators according to ESA95. Time series created on National Accounts were used in estimation of ISWE-ECM model which was source of middle -term forecast of development of Slovak economy. Although national accounts are published since 1993, some changes were made in their structure and methods of compilation. These changes result in time series inconsistency with where dealt by research team. For construction of model team used quarterly published time series and quartile time series data. Other data, for example consumption price index, real wage growth data and etcetera are also published by Statistical Office Slovak Republic on quartile basis and are compiled with ESA 95 methodology.
The main indicators of economic performance of health care system are provided by Health Statistic Yearbook. This publications provides a yearly based overview of health services and health status of Slovak Republic population. It is issued by National Centre of Health Information (in the past Institute of Health Information and Statistics) in Bratislava. The

HEALTH EXPENDITURE SCENARIOS IN THE NEW MEMBER STATES: SLOVAKIA | 9
yearbook is issued since the year 1996 and the latest yearbook (in the time of working out this report) is describing the situation in the year 2003. The yearbook is divided into seven sections by theme: Demographic, Health Status of Population, Network and Activity of Health Establishments, Employees and Health Education, Economic Indicators, International Comparison and Enclosures. The yearbook produces official administrative data for general public and it is widely accessible by internet.
The data for the health care budget are based on the OECD national health data.
There was no significant problem in data gathering for this model. The data of Slovak Republic economic performance are collected by the Institute of Economic Research regularly each quarter of the year. These data are the base of macroeconomic models which is developed in the Institute and reestimated almost each quarter to develop economic forecasts. The Health Statistic Yearbook data are taken from the internet versions of publication. Only problem is the significant time lag of these publications. The problem with OECD national health data was based on the accessibility. The main problem was in high price of these data which in the terms of the Institute should be used only for the purpose of this project. The best solution was to have these data from public library for free.
Variables and assumption on variables development Forecast of variables development, economic and demographic, is based on three basic assumptions.
First, that the size of government measured as total government expenditures as share of gross domestic product (GDP) will be stable through the years 2005-2050. This assumption is based on the fact that that there are no indications and concepts that current government will raise taxation and increase size of government by additional spending. Since government is aimed to meet Maastricht criteria and further Pact of Stability and Growth it is limited by these criteria especially by annual deficit below 3% of GDP. Although small changes in flat tax have been made, these changes will not raise total taxation significantly. Reform of social security system and healthcare system are undergoing reforms and yet not finished. Current trends and concepts of these reforms are based on capitalization and private systems rather than public security system.
Second, that the growth of economy, measured by real GDP grows will converge to average growth of European Union and that Slovak economy will converge to European Union average, measured as GDP per capita, between years 2030 and 2040. This assumption is based on study Performance and Perspective of the European Union as Seen by the New Member States – Post-Accession Monitoring Conference.6 We are expecting high expansion of economy in next decade, supported by direct foreign investment, political stability of central European region and comparative advantages of Slovak economy compared to former EU12. After convergence period, however, Slovak economy will lose some of its comparative advantages and therefore we are assuming that growth of economy will be around average of EU growth which we are forecasting at 2.5% annual real GDP growth.
Third, that the structure of population will dramatically change because of population ageing and low birth ratio. This change will have main impact on labour market. Drop in birth ratio and total fertility rate between 1990 and 2005 is a result of transition from planned economy to free 6 Performance and Perspective of the European Union as Seen by the New Member States, Šikula M., Kadeřábkoá A., Klvačová E., Mrkaić M., Rezdir R., Okáli I., Vida K., Zeman K., Michalski R., Gaidys V., Sereghyová J., Bakosová K., Kvetan V., Kawecka-Wyrzykowska E., Institute of Economic Research of Slovak Academy of Sciences, 2006, ISBN 80-7144-151-1.

10 | KVETAN, PÁLENÍK, MLÝNEK & RADVANSKÝ
market, mixed economy. Unstable economy development joined, with shock reforms lead to decline of real income of population and real gross domestic product. As result of these development trends current population age groups between 5 and 20 years old are substantially lower then before and in long term this will lead into smaller share of work force on total population.
Participation rate of labour force, unemployment rate, productivity and wage growth as well as real GDP growth rate are main variables that have impact on revenues of health budget as well as total government revenues. Population ageing and population structural changes, birth ratio, wage growth of medical staff, utilization of health facilities and medical staff are main variables that affect expenditures of health budget, with social security system and real interest rates, total expenditures of government.
1.5 Demographic variables Grow rate of population is highly dependent on birth ratio and death ratio. Within the years of 2003 and 2015 we are expecting 0.06% average annual grow rate of total population. After 2015 death ratio will be permanently higher than birth ratio therefore between years 2015 and 2030 we expect -0.2% average annual grow rate of total population and after 2030 -0.5% average annual grow rate of total population. We assume that life expectation of male population at birth will rise from 70 years in 2003 to 73 in 2015. In 2030 we are expecting life expectation of male population at birth of 75 years and in 2050 77 years. Life expectations of female population at birth will raise from 78 years in 2003 to 80 years in 2015 and in 2030 to 82 years. After 2030 we expect slight increase to 83 years in 2040 and stabilization of life expectation at birth until 2050 at 83 years. Expected increase of life expectations between 2005 and 2050 is based on stable medical healthcare and nutrition of Slovak population. Total fertility rate (TFR) for Slovak population have been dropping since 1980, and we are expecting that this trend continue until 2010 hitting bottom with 1.19 TFR. Main reason for this development is recession and huge drop of real Gross Domestic Product and population real income after fall of communism and planned economy between 1989 and 1993. Unstable economic development, high unemployment and reforming and transition of economy to free market, mixed economy after 1990 was another crucial element of TFR drop. After 2000 recover of bank sector and incorporation of tax reform in 2004 lead to rise of economy performance and to high economic development. We expect that increase of real income of population and high economic between 2005 and 2015 will lead to change in trend of TFR development and that after 2010 TFR will gain slowly growing trend. Between 2010 and 2030 we expect to raise of TFR from 1.19 to 1.43 and until 2050 it will raise to 1.71. Between 2010 and 2050 we expect that development of newborn will have slowly dropping trend of -0.008%. This is due the fact that share of women population between 15-49 will drop due to the population aging and TFR between 1990 and 2005 was highly below replacement fertility 2.1. We don’t expect that TFR will rise above replacement fertility. In comparison to population prognoses of INFOSTAT7, TFR of Slovak population have been assumed from 1.11 in 2005 to 1.4 2050 for very low scenario, 1.19 in 2005 to 1.7 2050 for medium scenario, 1.26 in 2005 to 2.1 2050 for very high scenario. To compare life expectancy INFOSTAT prognoses life expectancy at birth 69.9 years in 2005 and 75.0 in 2050 for very low scenario, 70.4 in 2005 and 77.1 in 2050 in medium scenario and 70.8 in 2005 and 80.3 in very high scenario for male population and 77.7 years in 2005 and 81.7 in 2050 for very low scenario, 78.3 in 2005 and 84.0 in 2050 in medium scenario and 78.7 in 2005 and 87.5 in very high scenario for female population. For further details please refer to Table 1.
7 INFOSTAT – Institute of Informatics and Statistics, Demographic Research Center, Population projection of Slovakia until 2050, Vaňo, 2001.

HEALTH EXPENDITURE SCENARIOS IN THE NEW MEMBER STATES: SLOVAKIA | 11
Table 1. Demographic variables
2003 (base year)
2010 2015 2020 2025 2030 2035 2040 2045 2050
Grow rate – total 0.10% 0.07% 0.01% -0.11% -0.25% -0.35% -0.44% -0.53% -0.61% -0.68%Total fertility rate (TFR) 1.29 1.19 1.22 1.29 1.36 1.43 1.50 1.57 1.64 1.71 Life expectation (LE) – males 70 72 73 74 74 75 76 76 77 77
Life expectation (LE) – females 78 79 80 80 81 82 82 83 83 83
Sex ratio (males : females) 0.944 0.949 0.951 0.952 0.950 0.948 0.945 0.941 0.938 0.935
1.6 Labour market variables Development of labour market will be affected mainly by population growth and by high economic grow. High long-term unemployment is one of the main problems of Slovak labour market. We assume that fight with long-term unemployment will be rather slow process, due to the low education and mobility of long-term unemployed. Between 2003 and 2015 we forecast fall of total unemployment from 18.8% to 8.9%. This fall in unemployment will by mainly supported by high demand because of high economic growth and government support of long-term unemployed in their educational efforts, which is one of the main priority of National Strategic Reference Framework. We assume that within next 5 years unemployment rate will fall to 6.0%, in 2020, and that it will remain at this level. This is due the fact that long term unemployed are in many cases even unemployable. Gradual affords of educating and supporting long-term unemployed in job seeking will lead to lower rates of long-term unemployment, but we assume that natural rate of unemployment on Slovak labour market is around 6.0%.
We are expecting employment grow at 1.35% per annum between 2005 and 2015, because of high economy growth and high demand on labour market. After 2015 we assume drop in employment grow and after 2020 we expect negative grow of employment. This development is based on structural changes of population after 2015 which will lead in to fall of share of workforce on total population.
We assume that total participation rate of labour force will raise from 69.5% in 2003 to 71.1% in 2015. Grow of participation rate will hit its peak in 2025 with 73.2%. Between 2025 and 2050 we assume that participation rate will slowly fall with hitting bottom in 2040 at 71.4% rate and start again slowly grow to 72.1% in 2050. This development is based on assumed population structural changes and population aging. Of course major part in this development will have education and mainly college and university education. Therefore age groups between age 18-28 will have lower participation rates between 2005 and 2050 than before and population groups from 50 to 65 will have significantly hire participation rates due to the reform of labour law (retirement age was moved from 55 to 62 for female population and from 60 to 62 for male population) and willingness to work longer because of capitalization social security system reform.
Development of total employment rate is based on same assumptions as development of participation rate. We expect raise of total employment rate from 57.6% in 2003 to 65.2% in 2015. After 2015 we are expecting slow growth of total employment rate with culmination in 2025 at 69.4%. After 2025 we forecast slight fall of total employment rate with hitting bottom in 2040 at 68.0%. After 2040 we expect again grow of total employment rate to 68.9% in 2050. For further details please refer to Table 2.

12 | KVETAN, PÁLENÍK, MLÝNEK & RADVANSKÝ
Table 2. Labour market variables
2003 (base year)
2010 2015 2020 2025 2030 2035 2040 2045 2050
Participation rate – total 69.5% 70.0% 71.1% 72.4% 73.2% 73.1% 71.9% 71.4% 71.7% 72.1%Participation rate – males 76.3% 76.4% 77.0% 77.5% 77.5% 76.9% 75.5% 74.9% 75.0% 75.3%
Participation rate – females 57.3% 59.3% 60.8% 62.4% 63.9% 64.4% 63.7% 63.3% 63.4% 63.7%
Employment growth 0.8% 0.8% 0.5% -0.4% -0.4% -0.7% -1.1% -1.3% -1.4% -1.2%Unemployment rate 18.8% 11.7% 8.9% 6.0% 6.0% 6.0% 6.0% 6.0% 6.0% 6.0% Employment rate 15-64 – total 57.6% 62.0% 65.2% 68.6% 69.4% 69.3% 68.3% 68.0% 68.4% 68.9%
Employment rate 15-64 – males 63.0% 67.8% 70.6% 73.5% 73.6% 73.1% 71.9% 71.6% 72.0% 72.4%
Employment rate 15-64 – females 52.2% 56.2% 59.7% 63.6% 65.2% 65.5% 64.6% 64.4% 64.8% 65.5%
1.7 Economic variables Assumed development of economic variables is based on economic forecast of ECM-ISWE06q1 econometric error-correction model for years 2006 to 2013. Forecast is based on assumption of growing economic development with peak in 2007 and between 2006 and 2008 at 6.5-6.8% real GDP growth. This assumption is based on high investment activities in economy as result of high direct foreign and domestic investment and high growth of personal consumptions as a result of increasing real wage growth. In comparison to other institution short-term forecasts, OECD8 forecast for years 2006 and 2007 an annual 6.3 real GDP growth, European Commission 6.1% and 6.5% and IMF 6.5% and 7.0% and according to Consensus Forecast9 mean rate of forecasted growth for 2006 and 2007 is 6.4% and 6.5% with standard deviation of 0.2 and 0.7. After 2008 we are expecting steady development of economy at 5.8 to 6.2% of real GDP growth until 2012. This development will be supported by National Strategic Reference Framework (NSRF) as we shown in evaluation by HERMIN model. Assumed impact of NSRF, financed by Slovak government and EU in financial perspective 2007-2013, will be increase of economic growth measured by real GDP growth 1.0-1.5% on average. In comparison only source of middle-term forecast is available by Ministry of Finance of the Slovak Republic, with forecasted annual growth in 2006 and 2007 6.6% and 7.1% annual real GDP growth and for years 2008 to 2009 with average growth of 5.5% real GDP growth,10 but in their forecast they exclude impacts of NSRF. After 2012 we are assuming slight slowdown in grown of economy and after 2015 we forecast growth of real GDP under 5% per annum. This slowdown is based on assumption that Slovak economy as it converge towards average of EU it will lose its comparative advantages, as for example relatively cheap but highly educated work force. Until 2030 we are expecting annual average real GDP grow above 3%. Because of high uncertainty after 2030 we forecast slowdown and convergence of economy expansion to only 2.5% per annum of real GDP grow.
8 OECD Economic Outlook No. 79 9 Eastern Europe Consensus Forecasts (ISSN: 1462-4001), Consensus Economics Inc., Survey Date September 18, 2006 10 Financial Policy Institute, Ministry of Finance of the Slovak Republic

HEALTH EXPENDITURE SCENARIOS IN THE NEW MEMBER STATES: SLOVAKIA | 13
We assume that Slovak economy expansion between 2006 and 2015 will be supported by low real interest rates and low labour cost due to the high unemployment rates. Foreign direct investment will also play major role in high economic development as well as domestic investment activities. Since Slovak ambition to join European Monetary Union and government support of Maastricht criteria and Pact of Stability and Growth we expect that inflation rates will be kept at low rates by central bank. Therefore we forecast average inflation of 3.1% between 2006 and 2015 with bottom of 2.5% in 2009 which is ascension year for Slovak to monetary union. It is still uncertain if Slovak will fulfil requirements for ascension to monetary union. After 2009 we are forecasting slight increase in inflation due to the growth of personal consumption expenditures and efforts of price convergence to average of European Union. Between years 2015 and 2030 we are expecting average inflation rate of 3.0 %. After 2030 we are expecting slow slight decrease of inflation and average inflation rate of 2.4% within period 2030 - 2050.
Labour productivity growth and real wage growth are tightly merged; therefore we are assuming same trends in development of these variables. We are expecting an average 4.7% labour productivity growth as well as 4.2% growth of real wage between 2006 and 2015. High labour productivity growth between these years will be supported by high investment activities and additional life-long education as well as education of unemployed. After 2015 we are assuming decrease of productivity grow and growth of real wages. For years 2015 to 2030 we are forecasting an average labour productivity growth of 3.5% and real wage growth of 3.2%. This slowdown will be result of slower economic development as well as we are assuming that Slovak economy will no longer benefit from import of management skills and know-how in international companies. After 2030 we are estimating a 2.6% average labour productivity growth and 2.5% average real wage growth, but real development is highly uncertain. For further details please refer to Table 3.
Table 3. Economic variables
2003 (base year)
2010 2015 2020 2025 2030 2035 2040 2045 2050
Real GDP growth rate 4.5% 6.2% 5.1% 4.1% 3.2% 3.1% 2.9% 2.8% 2.6% 2.5% GDP deflator 5.1% 2.9% 3.0% 2.9% 2.8% 2.6% 2.5% 2.3% 2.2% 2.0% Nominal GDP per capita growth 9.0% 9.2% 8.3% 7.2% 6.3% 6.1% 5.9% 5.7% 5.5% 5.3%
Labour productivity growth 3.6% 5.3% 4.6% 3.7% 3.0% 2.9% 2.7% 2.6% 2.4% 2.3%
Real wage growth -2.1% 4.3% 4.0% 3.4% 2.9% 2.8% 2.6% 2.5% 2.3% 2.2% Inflation, CPI 8.6% 2.7% 3.1% 3.0% 3.0% 2.8% 2.6% 2.4% 2.2% 2.0% Real interest rates -1.0% 2.4% 2.2% 2.7% 3.0% 2.9% 2.8% 2.7% 2.6% 2.5%
2. Results of projection and sensitivity analysis to given parameters Baseline scenario results indicate that current adjustment of health system will have mild decreasing surplus until 2025. After 2025 health budget will run growing deficit with average deficit 1.2% share of GDP per annum rising from balanced budget to deficit of 2.35% in 2050. Expenditure of health system will grow by average 9.2% grow rate between 2005 and 2015. After assumed slowdown of economic growth expenditures of health system will grow at average 7.2% annual rate between 2015 and 2035, after 2035 annual average grows rate of health expenditures will be 5.7%. Revenues of health system will grow at 7.8 average annual

14 | KVETAN, PÁLENÍK, MLÝNEK & RADVANSKÝ
grow rate between 2005 and 2015. After assumed slowdown of economic growth revenues of health system will grow at 5.2% average annual grow rate between 2015 and 2035. After 2035 average grow rate of health revenues will be 3.3% per year. Higher grow rate of expenditures in forecasting period is mainly due to the population aging. Between years 2005 and 2015 old age population as share of total population, will raise from 11.9% to 13.8%. After 2015 development will have more dramatic trend and between years 2015 and 2035 old age population share will raise to 21.4% and to year 2050 share of old age population will raise to 27.9%. Revenues grow will be supported by high economic development between years 2005 and 2015, with annual average grow of 7.8%. After years 2010 to 2015 share of labour force to total population will slowly fall from average of 50% to 46.5% in 2035 and to 41.7% in 2050. This development joined with economic grow slowdown will lead to average revenues grow at 5.2% between years 2015 and 2035 and 3.3% between 2036 and 2050. For further details on revenues and expenditures of health system please refer to Table 4.
Table 4. Projection of health budget revenues and expenditures and health system deficit/surplus
2005 2010 2015 2020 2025 2030 2035 2040 2045 2050 Total health expenditures as share of GDP
4.8% 5.0% 5.1% 5.4% 5.6% 5.8% 6.1% 6.4% 6.6% 6.9%
Deficit/surplus of health system as share of GDP
1.5% 1.4% 0.8% 0.4% 0.0% -0.4% -0.9% -1.4% -1.9% -2.3%
Deficit/surplus of expenditures and revenues of health system (mld.Sk)
22.1 31.9 28.7 19.7 -1.9 -38.7 -101.0 -207.1 -364.5 -573.8
Total health expenditures as share of total government expenditures
10.7% 10.9% 11.4% 12.0% 12.5% 13.0% 13.5% 14.0% 14.6% 15.1%
Total government expenditures as share of GDP
39.0% 38.2% 37.6% 37.4% 37.4% 37.3% 37.3% 37.2% 37.2% 37.2%
Total government deficit/surplus as share of GDP
-2.5% -1.7% -1.1% -0.9% -0.9% -0.8% -0.8% -0.7% -0.7% -0.7%
Total government public debt as share of GDP 34.5% 32.2% 26.2% 22.4% 20.5% 19.4% 18.5% 17.6% 17.1% 16.9%
Current insurance system have 14% insurance premium rate from gross wage. Nor government or private sectors are attending to raise addition funding for health system. Ministry of Health of Slovak republic is preparing reform of health system, but it is still uncertain if this reform will raise or lower insurance premium rate and privatize health system. Gap between insurance system revenues and expenditures will rise significantly after 2030. Current equilibrium insurance premium rate is 9.4%. Until 2025 with current rate health system will raise enough revenues to satisfy expenditures. After 2030 current rate might be raised because revenues of health system will don’t satisfy expenditures. Equilibrium insurance premium rate are shown in Figure 5.

HEALTH EXPENDITURE SCENARIOS IN THE NEW MEMBER STATES: SLOVAKIA | 15
Figure 5. Level of premium needed to close gap
9.0%
11.0%
13.0%
15.0%
17.0%
19.0%
21.0%
2005
2007
2009
2011
2013
2015
2017
2019
2021
2023
2025
2027
2029
2031
2033
2035
2037
2039
2041
2043
2045
2047
2049
Equilibrium insurance premium rate (level to close the gap) Current insurance premium rate
Comparison of revenues & expenditures of health system is show in Figure 6.
Figure 6. Comparison of total revenues & expenditures of health system (mil.Skk)
0
200,000
400,000
600,000
800,000
1,000,000
1,200,000
1,400,000
1,600,000
2005
2007
2009
2011
2013
2015
2017
2019
2021
2023
2025
2027
2029
2031
2033
2035
2037
2039
2041
2043
2045
2047
2049
Total revenues of health system Total expenditures of health system
2.1 Sensitivity test Sensitivity test is based on different assumption about real wage grow and employment rate. We present two scenarios, high scenario, with higher real wage grow and employment rate and low scenario with lower real wage grow and employment rate. High scenario are based on optimistic assumptions about real wage grow, with could be acquired by higher economy grow, and labour market liberalization. This scenario could be probable, but is quite uncertain if government authorities will be in favour labour market liberalization in environment of population aging and negative population growth. On the other hand low scenario represents development of economy and labour market under contrarily assumptions. Lower wage grow could be probable if labour market would not be liberalized not only in Slovakia but European labour market will remain closed. Also lower employment rate as a result of high social security benefits will significantly affect revenues of health system. For further details about development of variables refer to Table 5 and Table 6.
16 | KVETAN, PÁLENÍK, MLÝNEK & RADVANSKÝ
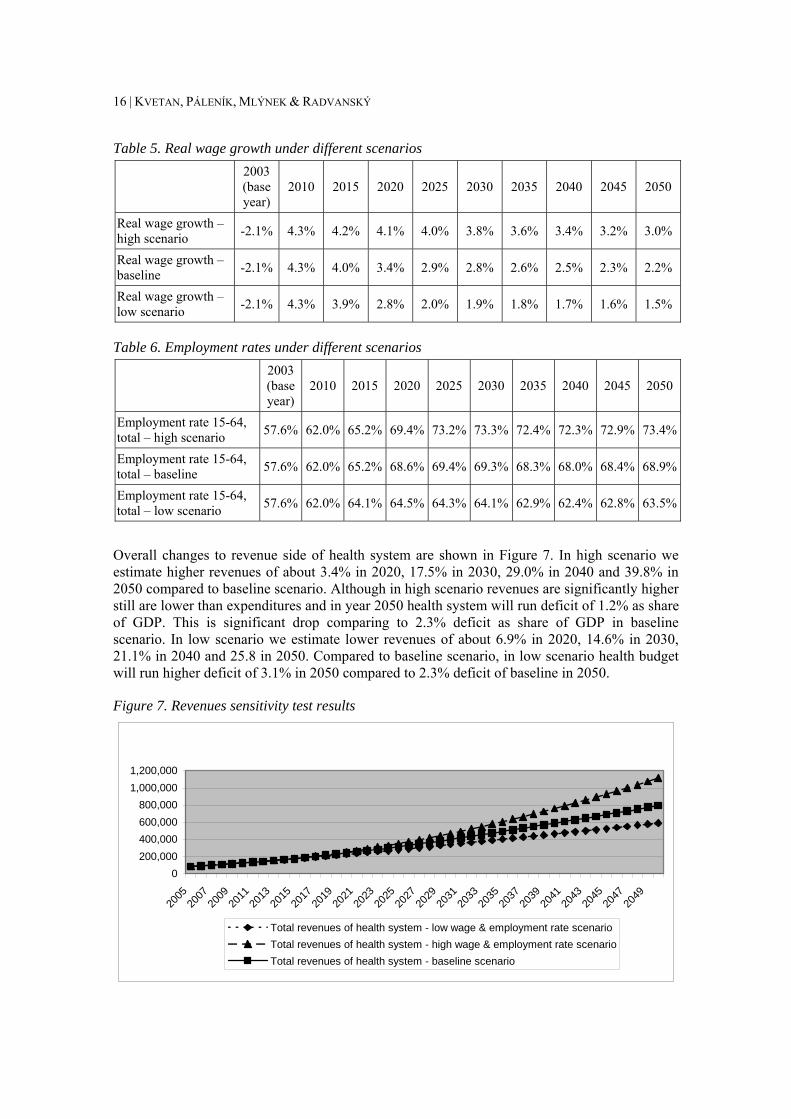
Table 5. Real wage growth under different scenarios
2003 (base year)
2010 2015 2020 2025 2030 2035 2040 2045 2050
Real wage growth – high scenario -2.1% 4.3% 4.2% 4.1% 4.0% 3.8% 3.6% 3.4% 3.2% 3.0%
Real wage growth – baseline -2.1% 4.3% 4.0% 3.4% 2.9% 2.8% 2.6% 2.5% 2.3% 2.2%
Real wage growth – low scenario -2.1% 4.3% 3.9% 2.8% 2.0% 1.9% 1.8% 1.7% 1.6% 1.5%
Table 6. Employment rates under different scenarios
2003 (base year)
2010 2015 2020 2025 2030 2035 2040 2045 2050
Employment rate 15-64, total – high scenario 57.6% 62.0% 65.2% 69.4% 73.2% 73.3% 72.4% 72.3% 72.9% 73.4%
Employment rate 15-64, total – baseline 57.6% 62.0% 65.2% 68.6% 69.4% 69.3% 68.3% 68.0% 68.4% 68.9%
Employment rate 15-64, total – low scenario 57.6% 62.0% 64.1% 64.5% 64.3% 64.1% 62.9% 62.4% 62.8% 63.5%
Overall changes to revenue side of health system are shown in Figure 7. In high scenario we estimate higher revenues of about 3.4% in 2020, 17.5% in 2030, 29.0% in 2040 and 39.8% in 2050 compared to baseline scenario. Although in high scenario revenues are significantly higher still are lower than expenditures and in year 2050 health system will run deficit of 1.2% as share of GDP. This is significant drop comparing to 2.3% deficit as share of GDP in baseline scenario. In low scenario we estimate lower revenues of about 6.9% in 2020, 14.6% in 2030, 21.1% in 2040 and 25.8 in 2050. Compared to baseline scenario, in low scenario health budget will run higher deficit of 3.1% in 2050 compared to 2.3% deficit of baseline in 2050.
Figure 7. Revenues sensitivity test results
0200,000400,000600,000800,000
1,000,0001,200,000
2005
2007
2009
2011
2013
2015
2017
2019
2021
2023
2025
2027
2029
2031
2033
2035
2037
2039
2041
2043
2045
2047
2049
Total revenues of health system - low wage & employment rate scenarioTotal revenues of health system - high wage & employment rate scenarioTotal revenues of health system - baseline scenario

HEALTH EXPENDITURE SCENARIOS IN THE NEW MEMBER STATES: SLOVAKIA | 17
We have created two sensitivity analyses on expenditure side. One for different assumption of expenditures grows without changes in life expectancy, and another with changes to life expectancy.
In base line scenario we assume middle rates of improvement of life expectancy. Therefore two new scenarios with changes of life expectancy are with fast and slow rates of improvement of life expectancy, also called Fast and Slow. Sensitivity test results are shown in Figure 7. In Fast scenario life expectancy is slightly higher. For male population gains of life expectancy are 0.15 years higher than in baseline scenario per 5 years which lead to life expectancy of 78.7 years at birth in 2050. For female population, life expectancy is also 0.15 years higher than in baseline scenario per 5 years which lead to life expectancy of 84.3 years at birth in 2050. In slow scenario for male population gains of life expectancy are 0.19 years lower than in baseline scenario per 5 years which lead to life expectancy of 75.3 years at birth in 2050. For female population, life expectancy is also 0.19 years lower than in baseline scenario per 5 years which lead to life expectancy of 81.5 years at birth in 2050. Further details are shown in Table 7 and Table 8.
Table 7. Life expectancy for males under different scenarios
2003 (base year)
2010 2015 2020 2025 2030 2035 2040
Life expectation (LE), males – fast scenario 70 72 73 74 75 76 77 77
Life expectation (LE), males – baseline 70 72 73 74 74 75 76 76
Life expectation (LE), males – slow scenario 70 71 72 73 73 74 74 75
Table 8. Life expectancy for females under different scenarios
2003 (base year)
2010 2015 2020 2025 2030 2035 2040
Life expectation (LE), females – fast scenario 78 79 80 81 82 83 83 84
Life expectation (LE), females – baseline 78 79 80 80 81 82 82 83
Life expectation (LE), females – slow scenario 78 79 79 80 80 80 81 81
Results of health budget expenditures are shown in Figure 8 and Table 9.

18 | KVETAN, PÁLENÍK, MLÝNEK & RADVANSKÝ
Figure 8. Expenditures of healthcare system
0
200,000
400,000
600,000
800,000
1,000,000
1,200,000
1,400,00020
05
2007
2009
2011
2013
2015
2017
2019
2021
2023
2025
2027
2029
2031
2033
2035
2037
2039
2041
2043
2045
2047
2049
Total expenditures of health system - fast scenarioTotal expenditures of health system - baselineTotal expenditures of health system - slow scenario
Table 9. Health expenditures under different scenarios 2005 2010 2015 2020 2025 2030 2035 2040 2045 2050 Total expenditures of health system – fast scenario
61.6 93.8 148.6 223.7 319.0 441.3 598.2 804.1 1,066.8 1,392.8
Total expenditures of health system – baseline
61.6 93.8 148.4 223.1 317.6 438.4 593.2 796.1 1,053.8 1,371.7
Total expenditures of health system – slow scenario
61.6 93.7 148.2 222.4 316.4 436.3 589.2 789.1 1 043.1 1 356.9
In baseline scenario additional assumptions about yearly cost increase in health expenditure is scenario II ad assumption of increase in costs in same rate as GDP per capita. Two additional scenarios are based on assumption I and III, that is increase of cost separated for wage and non-wage shares and increase with same rate as GDP per employment. Results of expenditures development are shown in Figure 9 and Table 10.

HEALTH EXPENDITURE SCENARIOS IN THE NEW MEMBER STATES: SLOVAKIA | 19
Figure 9. Expenditures of healthcare system
-100 000
100 000
300 000
500 000
700 000
900 000
1 100 000
1 300 000
1 500 000
2005
2007
2009
2011
2013
2015
2017
2019
2021
2023
2025
2027
2029
2031
2033
2035
2037
2039
2041
2043
2045
2047
2049
Total expenditures of health system - I. scenario
Total expenditures of health system - baseline (II. scenario)
Total expenditures of health system - III. scenario
Table 10. Health expenditures under different scenarios and assumptions 2005 2010 2015 2020 2025 2030 2035 2040 2045 2050 Total expenditures of health system – I. scenario
61.6 80.9 111.2 154.1 209.6 279.3 365.0 473.1 604.1 757.8
Total expenditures of health system – baseline (II. scenario)
61.6 93.8 148.4 223.1 317.6 438.4 593.2 796.1 1 053.8 1 371.7
Total expenditures of health system – III. scenario
61.6 86.4 132.9 196.5 282.8 396.7 551.2 767.7 1 058.1 1 421.2
Conclusions For purpose of quantification of revenues and expenditures of Slovak health system on macroeconomic level, we have constructed econometric model for this project.
Model of healthcare system of SR was created by modification and extension of macroeconomic model used by researchers. Relevant modules of model are aimed on labour market, demand of health services and healthcare budget and macroeconomics. In estimation of parameters of model there were exploited relevant data sources of indicators from demographics, labour market and economy.
In basic scenario we quantify most probable development of revenues and expenditures of healthcare system to year 2050. Basic assumption based on this scenario is that until 2025 healthcare system will be in surplus based on accounting basis. After 2025 system will began to be deficit with average deficit of 1.2 % of GDP.

20 | KVETAN, PÁLENÍK, MLÝNEK & RADVANSKÝ
This development will be caused by lower dynamics of budget revenues and expenditures with is explained by different dynamics of particular exogenous variables.
Revenues will have high dynamics of growth in first decade, between 2006 and 2016. This development is due to the high economy growth. After Slovak economy reach higher economic level in 2015 dynamics of economic growth will decline and with decline of share of workforce on population also growth of revenues of health system will fall.
High dynamics of expenditures of health system are based on aging and this development will have main impact between 2015 and 2035 on expenditures of health system. Actual healthcare contribution paid from gross wage is 14 %. To mark equilibrium in healthcare budget current rate might be 9 % and to 2050 it should be raised to 21 %.
For purports of examination of deviation of key exogenous explanatory variables we have run some sensitivity tests. From this test emerged that healthcare budget will sensitively respond to development of aging of population, wage growth and employment rate. On other side response to different life expectations will be negligible.
Aims of work were matched by quantification of basic scenario and by sensitivity analysis on beforehand determined key variables from area of demographic development and labour market.
In future development high uncertainty is in migration trends. Key migration trends will be emigration from Slovak to states with higher developed economy in first decade. After Slovak economy reach higher economic level, trend might change and Slovak will have immigration from states with less developed economies. Weight of these effects will be based on development of globalization process within EU and out of EU states and mutual migration policy of EU.
In context of natural cyclical economy development also labour marked will suffer with cycles. These cycles will influence revenues of healthcare system. Solution might be strengthening of state policyholders as anti-cyclic factor of health revenues. Such questions are relevant topics of future research.
Policy recommendation For economy policy perspective is necessary to include that after 2025 health system will suffer from gradual deficit growth. Therefore it will be necessary to soften factors that cause this, but it will not solve the problem in full extent. It will be necessary to raise contribution for healthcare from gross wage. Evenly it will be necessary to raise other revenues of healthcare system. Unavoidable will be financial partnership of patient on healthcare to restrict ineffective fund allocation.
Health system is poorly reformed and therefore systematic changes are necessary in function of system. Main goal of reform efforts might be in increase of efficiency of system with sustainability of budget boundaries. Systematic changes are necessary also in administration and management of health system and in organization directed to lower costs and rise in efficiency. Such factors might be prevention, long-term care, enlightenment and one day surgery.
These activities will lead to better health of population and rise of life expectations. Main ethical purpose of health system will be achieved by those effects. Simultaneously, expenditures on healthcare will raise and its economic stability will suffer. Ethical focus of raising health of population is contradictory to economic focus of stable funding of healthcare. Quantitative analysis proved that this contradictory is not crucial in development of expenditures. Rise of life expectations lead only to negligible rise of heath expenditures.

HEALTH EXPENDITURE SCENARIOS IN THE NEW MEMBER STATES: SLOVAKIA | 21
On different ways of rising efficiency of healthcare are different opinions. In Slovak, liberal-conservative government of Mikuláš Dzurinda, began an fundamental reform of health system. Main outlines of reform, where to introduction of market principles to healthcare and creation of competitive environment. Current socialistic government of Róbert Fico has different opinions on these questions. Horizon of prognosis is 50 years and essential rise of deficits will begin after 2025. In such long horizon in democratic states it is often that left-wing and right-wing political parties change in formation of government. Same development is shown in Slovak republic. Particular governments will be gradually confronted with stated problems and in long-term there will be task to tackle it in most efficient way.
22 |
References
Páleník et all.: Mid-term Projection of Trends in Macroeconomic Development of the Slovak Health Sector, EMPA, Bratislava, 2005
BORS, L. - KVETAN, V. - PÁLENÍK, V. - VOKUN, J.: Construction and Verification of Macroeconomic Model ISWE97q3. Econ. Magazine 46, 1998, Nr. 3, pg. 428-466.
ĎURAŠ, J. – KVETAN, V. – MLYNEK, M. – ONDKO, P. – PÁLENÍK, V. –RADVANSKÝ, M.: Makroekonomická prognóza ekonomiky SR na roky 2005 – 2009 In. Zborník konferencie: Pohľady na ekonomiku Slovenska 2005, SDSS, Bratislava, 2005
ĎURAŠ, J. – KVETAN, V. – MLYNEK, V. –RADVANSKÝ, M.: Prognóza vývoja ekonomiky SR do roku 2013 In. EQUAL: 15110100009, Bratislava, 2005

| 23
Appendix. Sensitivity scenarios – Slovak Republic
Introduction The model described in WP IX country report for Slovakia11 was used to make sensitivity analyses. The sensitivity scenarios were made to deeper understanding the behaviour of health care system. The main idea of the scenarios, was to interpret the effects of the changes in wages and employment rates. The scenarios were based on changes of variables by itself and on the combinations in both directions as well. The results were focused mostly on the sustainability of health care system presented by deficit of health care system as a share of GDP. The scenarios are based on possible deviations of nominal wages and employment rate comparing the baseline scenario.
Description of scenarios One variable scenarios on wages High wage HW scenario is based on assumption of fast growth of the real wage. This growth will be based on high growth of labour productivity. The main reasons of assumed productivity growth are structural changes of production. The changes are characteristic of increase of higher technology demanding and higher value added production. The growth of service sector share is expected too. We assume at the same time the stability and the prosperity in the EU. This will lead to EU economic growth at the average level of the world economy.
Low wage LW scenario is based on opposite assumptions as the previous one. The assumed average wage growth rate in this scenario is 1.5 pp lower as in the high wage scenario. The foundation of this assumption is the low labour productivity growth and the stagnation of EU economy. Low labour productivity growth can be expected with respect of no structural changes. This will cause rigid structure of economy concentrated on high labour intensive production with low value added. We do not expect the convergence of the share of service sector production towards EU average. Other assumption is lower economic growth rate of EU compared to other world.
One variable scenarios on employment rate High employment rate scenario HER is based mostly on higher participation rate in the population age group 25-64. Growth of participation rate is related mostly with age group 55- 64 (old age). We expect the growth of the share (actual is 27%) nearly 62% in the year 2050. At the same time we assume growth of participation in the age group 45-54 from 82% to 97%. In the young age group (15-24) we expect slight decline (from 47% to 42%). The main reason is in higher propensity to education. These trends will be based on structural changes that lead to increase of high skill labour intensive production. In this scenario we assume that the total participation rate will grow in 2050 by 9 pp.
The main assumption of Low employment scenario LER is the total participation rate growth only in the middle run. Participation rate will culminate at maximum level 2015-2025 following by stagnation (slight decline) in the long run horizon. The growth of employment rate will be connected with increasing total unemployment, but we expect that unemployment rate will remain at same level due to the growth of labour demand. Total participation rate growth will be in the year 2050 (compared actual state) 2 p.p. The most significant age group with respect of
11 Kvetan V., Mlýnek M, Páleník V., Radvanský M.: Health Expenditures Scenarios, Country Report – Slovak Republic, Institute of Economic Research, Bratislava September, 2006.

24 | KVETAN, PÁLENÍK, MLÝNEK & RADVANSKÝ
increased participation rate will is 55 – 64. The participation rate will grow from 27% to 47% in the forecast horizon. Lower participation rate will be based on failure of the active labour market instruments. We assume, that despite of decrease of unemployment rate, the willingness to work will remain unchanged.
Combination scenarios The scenario High wage, high employment rate HWHER presents synergy of positive factors in scenarios HW and HER. Such trend can be assumed only in exceptionally positive development of Slovak economic situation as well as EU.
Low wage and low employment scenario LWLER can be presented as a most negative one. It represents synergy of negative factors of scenarios LW and LER. It is based with extremely negative development of internal economic situation as well as EU and world environment. Such trend we can expect with rather low probability.
The High wage, low employment rate scenario HWLER assumes the positive trends in wage growth. The growth of wages can in long run lead to decline of participation rate. The high growth rates of wages can act satisfactory population income level. This can cause decrease of labour supply with respect to preferring free time or early retirement. Such trend can be expected if the social situation will not be apprehended negatively and economic grow will be able to secure high wage growths.
The main assumption of the Low wage, high employment rate scenario LWHER is, that low wage growth rates will motivate to increase population’s participation rate. The slow growth of wages will increase also propensity of employers to employ what will lead to growth of employment. This trend can be reaction to situation, if there will be no significant structural changes and whole economy will remain on high labour intensive and low value added production. Other impact can be slow EU economic growth. At the same time we expect, that public budget incomes will be unsatisfactory for creation of active social policy. General labour market situation will lead to higher participation rate, because to enter the labour market will be only possibility to improve living conditions and personal economic situation.
Scenarios results The scenarios are built up on different assumptions of labour market and general economic trends. Scenarios presets comparison of impacts of development in economic environment to sustainability of health care system. Baseline scenario presents the mostly expected trend. Comparative scenarios present possible trends in both optimistic and pessimistic nature.
In the HW scenario we are assuming growth of nominal wage by 0.75 pp after 2020 comparing baseline. In HER scenario we are expecting 3 pp higher participation rates. In LW and LWR we are expecting the changes of same values but opposite direction.
The HWHER, HW and HWLER can be characterized as optimistic. In these scenarios forecasted incomes of health system are in general higher level comparing baseline. The deficit of the health care system is lower as well. The growth rates of the system incomes are in average from 0.7 pp to 0.4 pp higher (depending on the scenario) comparing baseline. The forecasted share of health care deficit on GDP in 2050 is lower by 1.1 pp to 0.8 pp (based on the scenario) comparing baseline.
On the other hand LW, LWHER, LWLER are characteristic of pessimistic nature. Comparing baseline scenario, the pessimistic scenarios indicate 0.7pp – 0.4pp (depending on scenario) lower income of health care system. The share of health deficit on GDP in these scenarios is by 0.8 pp – 0.7 pp (depending on scenario) higher comparing baseline.

HEALTH EXPENDITURE SCENARIOS IN THE NEW MEMBER STATES: SLOVAKIA | 25
Scenarios HER and LER can be characterized as neutral. The trends in health care system financing indicate differences, which are within the error interval of the model. We can take these differences as marginal.
Migration The official demographic forecasts12 assume the balance migration in the year 2050 in the interval 600 (the very low scenario) till 9000 (very high scenario) per year. The main factors impacting migration will be the leave of young population to search better job in more developed countries (old EU15 and USA) and inflow of people from third (non EU countries) searching better living conditions in Slovakia. The inflow of old population from old EU 15 might play important role as well. On the other hand, Slovakia will still be not the most interesting immigrant destination (comparing old EU 15). The most probable trend will be temporary settlement with inclination of further fluctuation westwards.
The most probable development of demographic forecast is the middle scenario assuming approximately 3000 persons per year in the year 2050. We assume, that the most of immigrating (temporary od permanent) will be of younger age groups (25-45). Even thou, the modelling results indicate changes in the level of the model statistical errors. We consider, that the migration will play only marginal role with respect to health care system financing.
Conclusions The alternative scenarios have shown that even under the conditions of optimistic assumptions, financing of health care system is not sustainable in the long run. By the end of the year 2050 it will run in to deficit at the level 1.2-1.5 % of GDP. The analysis proved that the income of the system is the most sensitive to changes in the real wage comparing the change of employment rate. The one percentage increase/ decrease of real wage leads to approximately 0.6-0.7 % of additional growth/decline to the income. On the one percentage change of employment rate will cause only 0.05% change. In the case of pessimistic scenario the deficiency of the system will fall down to 3% of GDP. Migration will not play an important role considering the impact to financing of the health care system.
12 Vaňo B. et al.: Forecast of development of population of SR till the year 2050, Infostat VDC, 2002.

26 |
Figure A.1 Total revenues of health system
0
200,000
400,000
600,000
800,000
1,000,000
1,200,000
2005
2007
2009
2011
2013
2015
2017
2019
2021
2023
2025
2027
2029
2031
2033
2035
2037
2039
2041
2043
2045
2047
2049
mil.
Loc
. Cur
renc
y (S
kk)
Baseline scenario High wage scenario Low wage scenarioHigh employment rate scenario Low employment rate scenario High wage, high employment rate scenarioLow wage, low employment rate scenario High wage, low employment rate scenario Low wage, high employment rate scenario

| 27
Figure A.2 Deficit (-), Surplus (+) of health system as share of GDP
-4.0%
-3.0%
-2.0%
-1.0%
0.0%
1.0%
2.0%
2005
2007
2009
2011
2013
2015
2017
2019
2021
2023
2025
2027
2029
2031
2033
2035
2037
2039
2041
2043
2045
2047
2049
perc
ent (
%)
Baseline scenario High wage scenario Low wage scenarioHigh employment rate scenario Low employment rate scenario High wage, high employment rate scenarioLow wage, low employment rate scenario High wage, low employment rate scenario Low wage, high employment rate scenario

About AHEAD
n February 2004, a CEPS-led consortium of research institutes launched the implementation of a three-year project called AHEAD (Ageing, Health Status and the determinants of Health Expenditure). Most of the consortium’s 18 partner institutes are members of the European
Network of Economic Policy Research Institutes (ENEPRI – see http://www.enepri.org for details). As specified in the call for proposals, the main task of the project is to carry out an “Investigation into different key factors driving health care expenditures and in particular their interaction with particular reference to ageing” in the (enlarged) European Union.
The strategic objectives of AHEAD are to: assess pressures on health spending in the existing EU and in selected candidate countries,
looking both at those arising directly from ageing and at those affected by changing incomes, social change and methods of expenditure control;
develop models for projecting future health spending and estimate confidence limits for these projections.
Expenditure on medical treatment has tended to rise as a proportion of national income throughout the European Union. A particular concern is that an ageing population and therefore the presence of more old people will create further pressures for expenditure on health care. This issue is of concern both in its own terms and because of its fiscal implications. Rising health expenditures put pressure on the targets of the Stability and Growth Pact. They also raise the question whether budgetary targets should be tightened ahead of projected growth in public expenditures, so as to ‘save up’ for future spending and keep expected future tax rates reasonably constant.
This project has aimed to refine existing estimates of the links between reported states of health and use of medical services. As well as looking at the effects of ageing on health care, the research has taken account of the link between health expenditure and fertility rates and the demands on health services made by non-native populations. Particular attention is paid to the costs of care near death. One study examined factors other than demand (such as methods of financial control) that may influence health spending. An important aspect of this research is that the work is carried out so as to be able to provide not only the familiar projections and scenarios but also standard deviations and confidence limits for predictions of key variables, such as healthy life expectancy and demand-driven expenditure levels. These will allow policy-makers to judge not only possible outcomes but also the risks surrounding them and to assess their implications.
Participating Research Institutes Centre for European Policy Studies, CEPS, Belgium National Institute for Economic and Social Research, NIESR, UK Netherlands Bureau for Economic Policy Research, CPB, The Netherlands Deutsches Institut für Wirtschahftsforschung, DIW, Germany Economic and Social Research Institute, ESRI, Ireland Research Institute of the Finnish Economy, ETLA, Finland Federal Planning Bureau, FPB, Belgium Istituto di Studi e Analisi Economica, ISAE, Italy Institute for Advanced Studies, HIS, Austria Institute for Public Health, IPH, Denmark Laboratoire d’Economie et de Gestion des Organisations de Santé, LEGOS, France Personal Social Services Research Unit, PSSRU, UK Fundación de Estudios de Economía Aplicada, FEDEA, Spain Centre for Social and Economic Research, CASE, Poland Institute of Slovak and World Economy, ISWE, Slovak Republic Institute of Economics at the Bulgarian Academy of Sciences, IE-BAS, BG Social Research Centre, TARKI, Hungary Department of Public Health, University of Tartu, Estonia
I

About ENEPRI he European Network of Economic Policy Research Institutes (ENEPRI) is composed of leading socio-economic research institutes in practically all EU member states and candidate countries that are committed to working together to develop and consolidate a European agenda of research.
ENEPRI was launched in 2000 by the Brussels-based Centre for European Policy Studies (CEPS), which provides overall coordination for the initiative.
While the European construction has made gigantic steps forward in the recent past, the European dimension of research seems to have been overlooked. The provision of economic analysis at the European level, however, is a fundamental prerequisite to the successful understanding of the achievements and challenges that lie ahead. ENEPRI aims to fill this gap by pooling the research efforts of its different member institutes in their respective areas of specialisation and to encourage an explicit European-wide approach.
ENEPRI is composed of the following member institutes:
CASE Center for Social and Economic Research, Warsaw, Poland CEE Center for Economics and Econometrics, Bogazici University, Istanbul, Turkey CEPII Centre d’Études Prospectives et d’Informations Internationales, Paris, France CEPS Centre for European Policy Studies, Brussels, Belgium CERGE-EI Centre for Economic Research and Graduated Education, Charles University, Prague,
Czech Republic CPB Netherlands Bureau for Economic Policy Analysis, The Hague, The Netherlands DIW Deutsches Institut für Wirtschaftsforschung, Berlin, Germany ESRI Economic and Social Research Institute, Dublin, Ireland ETLA Research Institute for the Finnish Economy, Helsinki, Finland FEDEA Fundación de Estudios de Economía Aplicada, Madrid, Spain FPB Federal Planning Bureau, Brussels, Belgium IE-BAS Institute of Economics, Bulgarian Academy of Sciences, Sofia, Bulgaria IER Institute for Economic Research, Bratislava, Slovakia IER Institute for Economic Research, Ljubljana, Slovenia IHS Institute for Advanced Studies, Vienna, Austria ISAE Istituto di Studi e Analisi Economica, Rome, Italy NIER National Institute of Economic Research, Stockholm, Sweden NIESR National Institute of Economic and Social Research, London, UK NOBE Niezalezny Osrodek Bana Ekonomicznych, Lodz, Poland PRAXIS Center for Policy Studies, Tallinn, Estonia RCEP Romanian Centre for Economic Policies, Bucharest, Romania SSB Research Department, Statistics Norway, Oslo, Norway SFI Danish National Institute of Social Research, Copenhagen, Denmark TÁRKI Social Research Centre Inc., Budapest, Hungary ENEPRI publications include three series: Research Reports, which consist of papers presenting the findings and conclusions of research undertaken in the context of ENEPRI research projects; Working Papers, which constitute dissemination to a wider public of research undertaken and already published by ENEPRI partner institutes on their own account; and thirdly, Occasional Papers (closed series) containing a synthesis of the research presented at workshops organised during the first years of the network’s existence.
European Network of Economic Policy Research Institutes c/o Centre for European Policy Studies
Place du Congrès 1 ▪ 1000 Brussels ▪ Tel: 32(0) 229.39.11 ▪ Fax: 32(0) 219.41.51 Website: http//:www.enepri.org ▪ E-mail: [email protected]
T