Expenditure Reforms Commission - National Institute of Educational ...
Upload
khangminh22Category
view
3download
0
European Network of Economic Policy Research Institutes
HEALTH EXPENDITURE SCENARIOS IN THE NEW MEMBER STATES
COMPARATIVE REPORT ON BULGARIA, ESTONIA, HUNGARY, POLAND AND SLOVAKIA
STANISŁAWA GOLINOWSKA
EWA KOCOT AGNIESZKA SOWA
ENEPRI RESEARCH REPORT NO. 43 AHEAD WP9
DECEMBER 2007
ENEPRI Research Reports are designed to make the results of research projects undertaken within the framework of the European Network of Economic Policy Research Institutes (ENEPRI) publicly available. This paper was prepared as part of Work Package 9 of the AHEAD project – Ageing, Health Status and the Determinants of Health Expenditure – which has received financing from the European Commission under the 6th Research Framework Programme (contract no. SP21-CT-2003-502641). Its findings and conclusions are attributable only to the author/s and not to ENEPRI or any of its member institutions.
A brief description of the AHEAD project and a list of its partner institutes can be found at the end of this report.
ISBN 978-92-9079-760-9 AVAILABLE FOR FREE DOWNLOADING FROM THE ENEPRI WEBSITE (HTTP://WWW.ENEPRI.ORG)
AND THE CEPS WEBSITE (WWW.CEPS.EU) © COPYRIGHT 2007, STANISŁAWA GOLINOWSKA, EWA KOCOT & AGNIESZKA SOWA

Contents
Introduction ................................................................................................................................... 1 1. Applied model of health revenues and expenditures .............................................................. 1
1.1 Models used for health care expenditure projection ..................................................... 2 1.1.1 Actuarial models .............................................................................................. 2 1.1.2 Macroeconomic models ................................................................................... 4 1.1.3 Econometric models ........................................................................................ 5
1.2 ILO social budget model............................................................................................... 5 2. Health care system in analyzed countries ............................................................................... 7 3. Data sources............................................................................................................................ 9 4. Assumptions and development of variables ......................................................................... 12
4.1 Development of demographic variables ..................................................................... 12 4.2 Labour market projection............................................................................................ 24 4.3 Economic assumptions and projections ...................................................................... 26 4.4 Assumption regarding income elasticity of health expenditures ................................ 27 4.5 Assumption on health status and health service utilization ........................................ 28
5. Projection results .................................................................................................................. 30 5.1 Baseline scenario ........................................................................................................ 31 5.2 Scenario of increased expenditures in the last year of life.......................................... 35 5.3 Diverse longevity scenarios ........................................................................................ 42 5.4 Diversified wage growth scenario .............................................................................. 43 5.5 Labour market indicators diversified development scenario ...................................... 44 5.6 Sensitivity analysis ..................................................................................................... 47
6. Conclusions, discussion and policy recommendations......................................................... 49 Literature ..................................................................................................................................... 53 Annex 1. Methodology for death related costs estimation (in Hungary and Poland) ................. 57

List of Tables
Table 1. Introduction of health insurance in analyzed countries (2003) ....................................... 8 Table 2. Sources of data for projections...................................................................................... 10 Table 3. TFR development.......................................................................................................... 15 Table 4. Employment rate development ..................................................................................... 24 Table 5. Unemployment rate development ................................................................................. 25 Table 6. GDP growth rate ........................................................................................................... 26 Table 7. Selected results of the analysis of impact of income changes on the level of health expenditures ................................................................................................................................ 27 Table 8. Projected health revenues (public) as a share of GDP .................................................. 31 Table 9. Projected public expenditures on health as a share of GDP.......................................... 33 Table 10. Deficit/surplus as a share of GDP ............................................................................... 34 Table 11. Selected results of the analysis of expenditures per deceased in proportion to expenditures per survivor (k indicator) ....................................................................................... 37 Table 12. Indicator showing the proportion of expenditures per deceased to expenditures per survivor, ECFIN data .................................................................................................................. 39 Table 13. Projected public expenditures on health and the deficit with/without death-related costs............................................................................................................................................. 40 Table 14. Projection results for the scenarios of different life expectancy improvement: slow, medium (baseline scenario), and fast (as a share of GDP).......................................................... 42 Table 15. Scenarios of different wage development patterns (revenues, expenditures and deficit as a share of GDP)....................................................................................................................... 43 Table 16. Scenarios of different activity rate development (expenditures, revenues and deficit as GDP share) .................................................................................................................................. 45 Table 17. Scenarios of different employment rate development (expenditures, revenues and deficit as GDP share) .................................................................................................................. 45 Table 18. Scenarios of different labour force participation and employment rate development (expenditures, revenues and deficit as GDP share) ..................................................................... 46 Table 19. Scenarios of different unemployment rate (expenditures, revenues and deficit as GDP share) ........................................................................................................................................... 47 Table 20. Revenue side sensitivity .............................................................................................. 48 Table 21. Expenditure side sensitivity ........................................................................................ 48 Table 22. Deficit/surpluse sensitivity.......................................................................................... 49 Table 23. Summary – factors that affect health care sector budget in projection exercise ......... 50 Table 24. Comparison: insurance premium required to balance public health care sector revenues and expenditures .......................................................................................................... 52

List of Figures
Figure 1. Composition of health expenditures in analyzed NMS countries by source (%GDP) .. 9 Figure 2. Size of population changes (5-year period) ................................................................. 13 Figure 3. Changes in population size, 2004-2050 ....................................................................... 14 Figure 4. Life expectancy – males .............................................................................................. 16 Figure 5. Life expectancy – females ........................................................................................... 16 Figure 6. Population histogram – Bulgaria 2003 ........................................................................ 17 Figure 7. Population histogram – Bulgaria 2050 ........................................................................ 17 Figure 8. Population histogram – Estonia 2003 .......................................................................... 18 Figure 9. Population histogram – Estonia 2050 .......................................................................... 18 Figure 10. Population histogram – Hungary 2002 ...................................................................... 19 Figure 11. Population histogram – Hungary 2050 ...................................................................... 19 Figure 12. Population histogram – Poland 2003 ......................................................................... 20 Figure 13. Population histogram – Poland 2050 ......................................................................... 20 Figure 14. Population histogram – Slovakia 2005 ...................................................................... 21 Figure 15. Population histogram – Slovakia 2050 ...................................................................... 21 Figure 16. Share of population 0-14............................................................................................ 22 Figure 17. Share of population 15-64.......................................................................................... 23 Figure 18. Share of population 65+............................................................................................. 23 Figure 19. Old age dependency ratio .......................................................................................... 24 Figure 20. Utilisation by age group in Estonia............................................................................ 28 Figure 21. Utilisation by age group in Hungary.......................................................................... 29 Figure 22. Average insurance expenditures per capita as % of GDP per capita (base year)....... 29 Figure 23. Average health cost per capita as % of GDP per capita (base year) .......................... 30 Figure 24. Total public health care revenues as a share of GDP................................................. 32 Figure 25. Public health care revenue growth in relation to the year 2005 (2005 = 100%)........ 32 Figure 26. Public expenditures on health as a share of GDP ...................................................... 33 Figure 27. Public health expenditures growth in relation to the year 2005 (2005 = 100%)........ 34 Figure 28. Public health surplus/deficit as a share of GDP......................................................... 35 Figure 29. Projected deficit in Hungary and in Poland, as GDP percentage............................... 41

| 1
Health Expenditure Scenarios in the New Member States
Comparative Report on Bulgaria, Estonia, Hungary, Poland and Slovakia
ENEPRI Research Report No. 43/December 2007
Stanisława Golinowska, Ewa Kocot & Agnieszka Sowa*
Introduction The objective of comparative report is to present the model of future health care system revenues and expenditures in selected Central and Eastern European countries (CEE) which are now the New EU Member States,1 and to discuss projection assumptions and results.
Health expenditure analysis and projections are based on the ILO social budget model, a part of which is the health budget model. The model covers health care system revenues and expenditures. It is suitable for the analysis of impact exerted by demography (especially ageing) on health care system revenues and expenditures. The objective of AHEAD project is to examine those factors. Up to date, data and information sources in New Member States that could be used for the long-term comparative projections have been limited. An analysis fully comparable with the EU-15 (WPVIII) will only be possible starting from 2005, based on EU-SILC survey panel data.
Structure of the report corresponds with the template of WPIX country reports. After the presentation of applied methodology and model, data and information sources are described. Next, model assumptions are discussed. In the projection an attempt was made to standardize the assumptions, although the assumptions for each country are also responsive to country policy processes, latest policy proposals and reforms. The development of specific model variables during projection period is described in detail. Finally, the report presents projection results together with sensitivity analysis and conclusions with regard to future development of health care system revenues, expenditures and financial balance. The report concludes with recommendations also presented in country reports, and additional recommendations resulting from comparative analysis.
1. Applied model of health revenues and expenditures A design of health care system expenditure projection is a complicated and risky task. Earlier AHEAD papers (Christiansen at al., 2006) have argued that theoretical, especially macroeconomic background for health expenditure determinants is rather modest, if not weak.
* Stanisława Golinowska, Ewa Kocot & Agnieszka Sowa are with the Social and Economic Research (CASE) in Poland. 1 Estonia represents Baltic countries, Bulgaria – Balkan countries, and Slovakia represents countries from Central Europe. Poland is a unique country in that it has demographic and epidemiological characteristics similar to Slovakia, but is much larger, with a high share of rural population. In Hungary, demographic processes related to second demographical transition started much earlier and are still dynamic, thus being a reference for other CEE countries.

2 | GOLINOWSKA, KOCOT & SOWA
Research in the area pointed at income as the dominant determinant of health expenditures (Newhouse 1977), while demographic variables were not taken into account or – when included in the analysis – impact of demography was not significant from the standpoint of expenditure development. A number of analyses emphasized the importance of policy processes, political affairs and quality of management in the health sector that affect the supply side of expenditures (i.e. Getzen, 1992). Only in late 1990’s did the research begin to concentrate on impact of demography on aggregated health expenditures.
Analyses pertaining to health care revenues and expenditures are complicated in that they must take into account numerous data from various fields, such as demography and labour market, macroeconomics, health status and quality of management in the health sector, and finally, policy and institutional implications. Furthermore, it is necessary to perform additional analysis to estimate the inter-relations between factors that have impact on the level of revenues and expenditures.
In view of the reasons referred to above, most projection models are not as comprehensive and complex, and take into account only some of the variables that affect the level of aggregated revenues / expenditures.
The choice of projection method and determinants strongly depends on the time horizon of projection, i.e. the period included in projection. For example, changes of age structure of the population are so slow that they will not affect the outcome of short- or even medium-term projections. On the other hand, factors such as health care sector reforms or changes in medical procedures may have strong impact on results of short-, medium-, and long-term projections (Lee 2002.) These factors are the most difficult to foresee and project due to potential rapid changes in the policy process. In consequence, they may introduce high level of uncertainty in projections.
Length of projection period affects not only the variables, but also the unit of expenditure measurement (Getzen, 2000). According to Getzen, nominal monetary unit is the best measure for short-term projections, and the variables covering insurance, labour market and inflation represent main determinants of health expenditure level. Real monetary unit of per capita expenditures is useful for mid-term projections, as these are mostly driven by income. In the case of long-term projections, the best unit to present the level of expenditures is the percentage of GDP reflected in expenditures (Getzen op.cit., s.56-57).
1.1 Models used for health care expenditure projection The most common projection methods can be summarized in three groups: (Mahal & Berman, 2001):
• Projections based on actuarial models,
• Macroeconomic projections,
• Projections based on econometric models.
1.1.1 Actuarial models Aggregated actuarial models are most common in health care expenditure projections. They are based on an equation that quantifies the level of expenditures in the year t:
)( ,,,,∑ ∑ ⋅=a
gatgatg
t HENHE

HEALTH EXPENDITURE SCENARIOS IN THE NEW MEMBER STATES: COMPARATIVE REPORT | 3
where:
HEt – health expenditures in the year t,
g – gender,
a – age cohort (most typically, 5-year age cohorts),
Nt,a,g – headcount of age cohort a in the year t by gender g,
HEt,a.g – average per capita expenditures in the age cohort a, by gender g in the year t.
Among the most popular actuarial models, two approaches can be identified: the “traditional” approach, where the share of population in the last year of life (in each age cohort) is not taken into consideration, and the “generalized” projection approach, where the level of per capita expenditures is differentiated depending on the time period left till death (Kildemoes et al., 2006).
Projection prepared by L. Mayhew (Mayhew 2000)2 is a typical example of “traditional” approach to health care expenditure modelling and projection. It looks at the level of health expenditures in two regions of the world, namely: the more developed countries (MDC) and less developed countries (LDC), and covers the period up to 2050.
The analysis of expected development of health expenditure growth takes two types of factors into account: demographic changes (changes in the size and structure of the population), and other changes aggregated, including technological changes, changes in per capita medical service utilization, and cost factors. Inter-relations between the level of expenditures in the base year and the level of expenditures in year t are quantified in the equation:
)()0()( up rrteHtH +⋅=
where:
t – year under analysis,
H(t) – expenditures in the year t,
rp - demographic change coefficient,
ru – other factors’ change coefficient.
The indicator responsible for demographic changes takes into account changes in health needs depending on population size and costs of care for the elderly. An index of relative level of expenditures3 depending on age cohort and year is used. Index stability was assumed for the MDC (different values of the index are only assumed for different age cohorts based on data for the period of 1980-1990), while in the case of LDC index value is linked to mortality by age. In the MDC, index value is slightly below historical data. Due to lack of current data, the same values were assumed in the LDC.
A similar approach with demographic variables taken into account is represented, among others, by Denton et al. (Denton et al. 2001), Antolin et al. (Antolin et al., 2001) and by Fuchs (Fuchs, 1998).
2 Projection is an extention of projections based on economic and demographic model of IIASA (International Institute for Applied Systems Analysis.) The model analyses the impact of ageing on economic development and, with respect to social insurance, concentrates on pension expenditures. 3 Index has a value 1 for the age kohort 0-4, for other age cohorts its value is quantified in relation to expenditures for the youngest cohort.

4 | GOLINOWSKA, KOCOT & SOWA
Projection of short-term expenditures in Medicare and Medicaid schemes in the USA, prepared by Cutler and Sheiner (Cutler & Sheiner, 1998), is an example of a generalized approach to analysis. Two factors that influence changes in per capita expenditures were taken into account: age of death and disability indicator among survivors. The age of death is shifting towards older cohorts due to increasing life expectancy and decreasing mortality. At the same time, the number of persons for whom a given year is the last year of life is decreasing for younger cohorts.
Two models recently developed by the Ageing Working Group (European Commission, 2006) and the OECD experts (OECD, 2006), also belong to the group of models that apply the factor of increasing health expenditures in the last stage of life in the projection.
Actuarial models are used to build financial balance models as well, covering the revenue and the expenditure side of health care sector. These models are applied to the analysis of public and private health insurance schemes. The main purpose behind the application of financial balance models is to evaluate financial sustainability of health insurance system and estimate the amount of health insurance premium needed to assure system sustainability.4 Total health insurance revenues are calculated as the sum of health insurance premiums paid by (or on behalf of) the insured. Additional revenues of insurance institutions can also be included in projections, depending on the source of revenue and type of activity of the insurer (i.e. interest rates from the capital or capital investments.) Most balance models use similar methodology in calculations, but some models are restricted to variables pertaining to health care sector only (health insurance, mostly), while others include system variables and are well set in the macroeconomic context.
Projection prepared by the Management Sciences for Health (MSH)5 in the USA is an example of a financial balance model applied to health insurance projections. Projection is used to evaluate health insurance sustainability, with diverse scenarios of future development of actual contribution rate and insurance premium needed to cover the expenditures.
Another example of a model based on similar methodology is the WHO model applied to regional/local insurance systems. The model is suitable for projecting the impact of the introduction of regional/local insurance systems on the national health care system (Carrin & Ron, 1993). As with other models, the level of revenues, expenditures and insurance financial balance are estimated. Likewise, financial structure of health care system, the number of insured and projected level of medical service utilization are described.
1.1.2 Macroeconomic models The second category of models that can be distinguished are macroeconomic models that present health care system in a broad macroeconomic context. This approach allows for a broader analysis of the reasons underlying the increase in health expenditures and its long term economic implications.
A two-sector model of health care system and social insurance by M. Warshawsky (Warshawsky, 1994, 1999.) The model is based on simple equilibrium between two production sectors: health care sector and the sector covering the rest of the market with two production factors: namely, labour and capital. Health care sector development is driven by the Leontiew 4 Financial sustainability of insurance system is understood as the level of revenues higher or equal to the level of expenditures. 5 Management Sciences for Health – a private, non-profit organization established in 1971, which works for health managers, policy-makers, medical service providers and often patients; and assists in solving problems in the health care sector by providing information and expertise.

HEALTH EXPENDITURE SCENARIOS IN THE NEW MEMBER STATES: COMPARATIVE REPORT | 5
production function,6 while the rest of the market is driven by the Cobb-Douglas production function.7 Aggregated supply of labour is a function of demographic, social and institutional factors (i.e. high school and university enrolment, women’s participation, retirement age, etc.) Projection covers 40-year period. The results include not only the estimation of health and pension expenditures in relation to GDP, but also the relations between labour and capital in each of the two sectors, the level of consumption per capita, productivity in health care sector, and impact of various insurance systems on the level of expenditures. The model also includes assumptions on technological changes: better utilization of the capital from technical perspective (capital deepening), decreasing productivity in the health care sector, and technological development on the market.
1.1.3 Econometric models The work by Getzen and Poullier (Getzen & Poulier, 1992) is an example of econometric projections. It includes health expenditure projections for 19 OECD countries. Projections were made using various econometric methods: naive method, assuming the same growth rate of expenditures as in the previous year, moving averages method, exponential smoothing and regressions on historical data, projecting each country’s growth rate as the average growth rate for all 19 countries combined, econometric model, and econometric models with additional macroeconomic information.
In addition, combination of methods listed above was also applied in the model. In general, projections based on econometric models are rarely used to estimate the level of long-term expenditures, rather, they are applied to short-term projections. However, if the projection aims at the evaluation of impact of demographic changes on health expenditure, projection period should be extended, because changes in the size and age structure of the population are clearly visible only in the long term.
1.2 ILO social budget model Projections of health care system financing and financial balance were made, as was already mentioned, based on the actuarial model prepared by the Social Security Department (SECSOC) of International Labor Organization (ILO.)
The ILO social budget model has been broadly applied in the countries which cooperate with ILO, including CEE countries. In the past, the model was used to assess financial balance of the whole social welfare system in these countries. It is suitable for middle- and long-term projection of revenues and expenditures of major social welfare schemes, and for the simulation of impact of demographic, economic and legislative changes on social welfare financing. The model can be used for short-term evaluation of already existing schemes, as well as the simulation of future reforms of some parts of the system (i.e. the introduction of a defined contribution pension system or insurance-based health care system.) The social budget model consists of four sub-models (Scheme 1):
• Pension system sub-model;
• Health care system sub-model;
• Other sub-models, including unemployment benefits, family benefits, social assistance scheme.
6 q=min{K,L}, where q - production size, K,L - factors of production (capital and labor.) 7 q=a Kb Lc, where a,b,c – constant.

6 | GOLINOWSKA, KOCOT & SOWA
Scheme 1. ILO social budget model structure
Source: Scholz W., Cichon M., Hagemejer K. (2000), Social budgeting, International Labor Office, Geneva.
The baseline model of social budget is restricted to health care budget, which in the CEE countries is mostly represented by the institution of health insurance budget. The baseline model has been further adjusted to country situation, health care system institutional framework, country legal regulations and policy proposals.
The ILO health budget model has certain advantages compared to other potential models that could have been applied for health care financing projections in accession economies.
• This model reflects the character of health care sector, as it comprises many different determinants that influence financial situation in the sector.
• It constitutes a basic platform of a kind, allowing wide adaptation to specific country health system situation. There is great variety in health care systems, especially from the standpoint of their financing structure, so no single model can be applied to each country.
• The ILO model allows for a comparison of the expenditure and the revenue side and, in consequence, for a deficit or surplus calculation. Such feature is absolutely essential, especially in financial projections. Therefore, it is useful not only for international comparisons of health care system expenditures – as was the case with the Ageing Working Group projection – but also for country-based policy makers who are interested in financial sustainability of health care system in the long term.
• This model, unlike some others, takes demographic changes into account (ageing of the population.)
Following the structure of the ILO social budget model, four types of factors are used for the purpose of projecting health care system revenues and expenditures (Scheme 2).
Pension model
Projection of sector-specific variables, revenue and
expenditure
Health model
Projection of sector-specific variables, revenue and
expenditure
Other social protection Projection of sector-specific variables,
revenue and expend.
Demographic, labour market, macro-economic and governmental model
Social budget model
SOCIAL BUDGET MODEL SCHEME

HEALTH EXPENDITURE SCENARIOS IN THE NEW MEMBER STATES: COMPARATIVE REPORT | 7
Scheme 2. Key factors that influence financial balance of the health care system
Source: Cichon M., Newbrander W., Yamabana H., Weber A., Normand Ch., Dror D., Preker A. (1999),
Modeling in health care finance. A compendium of quantitative techniques for health care financing, International Labor Office, Geneva
The model applied in the AHEAD research is slightly different from the original social budget model presented above (Schemes 1 and 2.) Main groups of variables used in the analysis are classified under four headings:
• Demographic: TFR, LE, population structure (share of 65+ population) ;
• Labour market: participation and employment rate, wages;
• Macroeconomic: GDP, inflation and labour productivity;
• Health status and utilization patterns.
Analogically to other AHEAD projections (Work Package VIII), policy variables were not included in the analysis, with the assumption that the legal framework and financial mechanisms in health care system remain unchanged during projection period.
One of the most significant modifications to the health module of the social budget model (in case of projections for Hungary and Poland) is the introduction of per capita expenditures instead of average medical service utilization level (number of per capita primary care visits and hospital days.) This modification was made due to greater availability of data on expenditure levels per capita, by gender and by age than the data pertaining to average medical service utilization in these two countries. Moreover, the introduction of average per capita expenditures allowed for death-related costs scenario.
The health care budget model applied in projections is not limited to health insurance in a given country, but covers the whole public financing of the health care sector. This implies that not only insurance revenues and expenditures, but also budgetary revenues and expenditures are included.
2. Health care system in analyzed countries A vast majority of transition countries (CEE and CIS) achieved the first objective of health cared reform in that they introduced health insurance with an earmarked fund established from payroll tax, instead of integrated budgetary funding financed from general taxation. Health
Financial balance of the health care system:
revenues and expenditures
Health status of the population, medical service utilisation,
medical technologies
Economic factors
Governmental factors
Demographic and labour market factors

8 | GOLINOWSKA, KOCOT & SOWA
insurance was introduced gradually: in Hungary social insurance fund, including health care, was separated from budgetary funding in 1990, and then (in 1992) health insurance fund was further isolated from social insurance fund.8 Over the same period of time, the Baltics designed health insurance approach within the framework of reforms prepared for the new independent states (1991.) In Slovakia, health insurance was introduced in 1994, in the Czech Republic in 1997, in Romania in 1998 and, finally, in Bulgaria and Poland in 1999.
Table 1. Introduction of health insurance in analyzed countries (2003)
Country Year of HI introduction Contribution Share of HI in the total HC funding
Bulgaria 1999 6.0% 32%
Estonia 1991 13.0% 66%
Hungary 1990 as SI 1996 – separate HI
14.0% 71.6%
Poland 1999 9% 62.7%
Slovakia 1994 14.0% 86%
Source: AHEAD WP II – country reports (http://www.enepri.org/Ahead).
Medical circles strongly supported the introduction of health insurance. It was believed that the inflow of funds to the system would be more secure and stable when the funds are contingent upon economic results (payroll tax) rather than upon political decisions made every year while setting the priorities in budgetary expenditures. Another advantage was related to the possibility of defining a package of insurance benefits for the purpose of separating the public component, and thus creating the space for private health insurance.
The introduction of health insurance generated tension between increasing health needs on the one hand, and relatively low health care funding and requirements of low taxes and low non-wage labour costs needed to stimulate employment and economic growth, on the other. In consequence of these tensions, health care sector has been systematically falling in debt. Debts are incurred either by insurance institutions or by medical service providers, depending on institutional framework of the health care sector. High level of indebtedness is stable or even growing (Golinowska, Sowada & Woźniak, 2007), which has adverse impact on the effectiveness of health care management. Future, long-term financial decisions should be made with the awareness of these tendencies, as well as external determinants of health care sector in the future.
8 In Hungary, health insurance premium was earmarked as late as in 1996. Before that, one premium for all insurable social benefits was calculated. The total premium equaled 52.5% gross compensation, and the health insurance premium isolated therein – 22% (Gaal 2004, p. 37.)

HEALTH EXPENDITURE SCENARIOS IN THE NEW MEMBER STATES: COMPARATIVE REPORT | 9
Figure 1. Composition of health expenditures in analyzed NMS countries by source (%GDP)
0,0
1,0
2,0
3,0
4,0
5,0
6,0
7,0
8,0
Bulgaria Estonia Hungary Poland Slovakia
soc.sec publ.gov others
Source: AHEAD WP II – Health Status and Health Care Systems in Central and Eastern Europe
Countries (http://www.enepri.org/Ahead, WPIX – country reports).
3. Data sources Health budget model is based upon national data supplemented (or adjusted) with the data collected and used by the international institutions in their comparative analyses. These include: United Nations, Organization for Economic Co-operation and Development, International Labor Organization, Eurostat, and European Commission. Domestic data includes the data collected by national statistical offices, national health insurance and social insurance institutions, national banks, ministries of finances, ministries of labour and social policy, and ministries of health (Table 2).
Due to rapidly changing economic environment in the countries of political and economic transition, such as CEE countries, historical data used in the model is not always the data valid for the base year, but rather the average data from the longer period. By the same token, in some cases long-term historical data was not available or not fully reliable as the background for projections.

10 |
Table 2. Sources of data for projections Country National statistical offices Social insurance Health insurance Governmental agencies Independent organizations National banks Bulgaria NSI
(Nazionalen statisticheski institut - National Statistical Office): demographic data –population figures, including population by gender, population age structure, total fertility rate, mortality rate, birth rate, rate of natural increase, life expectancy at birth, etc.; macroeconomic data – GDP volume and growth, CPI (inflation), GDP deflator, income of population; labor statistics taken from National Survey on Labor Force, organized periodically..
NOI (Nazionalen osiguritelen institut - National Insurance Institute): data on the socio-insurance system, number and structure of insured, insurance payments.
NZOK (Nazionalna zdravno-osiguritelna kasa - National Health Insurance Fund (NHIF): health revenues and expenditures, financial balance of the health sector.
MZ (Ministerstvo na zdraveopazvaneto - Ministry of Health Care) NCZI (Nazionalen centur po zdravna informazia pri Ministerstvoto na zdraveopazvaneto- National Center for Health Information at the Ministry of Health): papers on health care policy and strategy. MF (Ministerstvo na finansite – Ministry of Finance): state budget data AZ (Agenzia po zaetostta pri Ministerstvoto na truda I sozialnata politika - Employment Agency at the Ministry of Labor and Social Policy): economically active population, employed persons both total number and by gender, employment rate, unemployment rate.
II na BAN Ikonomichwski institut na Bulgarska academia na naukite (Institute of Economics at the Bulgarian Academy of Sciences – IE-BAS): GDP, labour productivity projections. CIN (Centur za izsledvane na naselenieto - Centre for Population Studies at the Bulgarian Academy of Sciences): ageing population projections.
BNB (Bulgarska nazionalna banka - Bulgarian National Bank): macroeconomic data – interest rates.
Estonia Statistikaamet - SA (Statistics Estonia): population, employment, economic data, national population prognosis.
NA Eesti Haigekassa - EHK (Estonian Health Insurance Fund): number and structure of insured, health insurance expenditures and revenues, utilisation of hospital and outpatient care by age.
Sotsiaalministeerium - SoM (Ministry of Social Affairs of Estonia): total utilisation of health care, expenditures of health care providers, national health accounts, consultation on health expenditure prognosis Rahandusministeerium - RM (Ministry of Finance of Estonia): official financial prognosis, consultation on health expenditure prognosis
UN (United Nations): UN population prognosis data. Poliitikauuringute Keskus PRAXIS (Center for Policy Studies): macroeconomic assumptions used in various projections. Tartu Ülikool (TÜ) University of Tartu : macroeconomic projection
NA
Hungary KSH (Hungarian Central Statistical Office) KSH NKI (Population Research Institute): target
NA OEP (National Health Insurance Fund): aggregate data on health care
Pénzügyminisztérium (Ministry of Finance): target values for macroeconomic and labour market variables from the Convergence
Kopint-TÁRKI: forecast on real wage growth.
MNB (Hungarian National Bank): interest rates.

HEALTH EXPENDITURE SCENARIOS IN THE NEW MEMBER STATES: COMPARATIVE REPORT | 11
values for TFR and life expectancy, forecast on migration.
utilisation, expenditures and revenues; micro data on utilisation and health expenditures by age.
ESKI (National Institute for Strategic Health Research, Ministry of Health): National Health Accounts 2001, 2002.
Poland GUS (Główny Urząd Statystyczny - Central Statistical Office): population data, labor market data, economic data for the base year, health expenditures (National Health Account.)
ZUS (Zakład Ubezpieczeń Społecznych - Social Insurance Institution), KRUS (Kasa Rolniczego Ubezpieczenia Społecznego - Agricultural Social Insurance Fund): number of insured, farmer insurance data.
NFZ (Narodowy Fundusz Zdrowia - National Health Fund): health expenditures by age groups, for survivors and deceased (base year), insurance revenues in the base year.
MZ (Ministerstwo Zdrowia - Ministry of Health): budget health expenditures; MF (Ministerstwo Finansów - Ministry of Finance), MPiPS (Ministerstwo Pracy i Polityki Społecznej - Ministry of Labor and Social Policy): macroeconomic projection.
CASE (Center for Social and Economic Research): macroeconomic projection consultation.
NA
Slovakia SU SR (Štatistický úrad Slovenskej republiky) Statistical Office of Slovak Republic Data used: national accounts, prices, labor market.
SOCIÁLNA POISŤOVŇA Social Insurance Data used: number of insured, population shares in the groups of insured.
NCZI (Národné centrum zdravotníckych informácií) National Centre for Health Information Data used: health data, health care utilisation.
MZ SR (Ministerstvo zdravotníctva Slovenskej Republiky) Ministry of Heatlh of the Slovak Republic Data used: contribution rates, data regarding health care reform.
VDC (Výskumné demografické centrum) Demographic Research Centre Data used: demographic trends forecast (assumptions for life expectancy, migration and fertility rates); EU SAV (Ekonomický ústav Slovenskej Akadémie vied) Institute of Economic Research, Slovak Academy of Sciences Data used: forecast of economic trends – GDP, labor market, prices.
NBS (Národná banka Slovenska) National Bank of Slovakia Data used: exchange rates, prices (CPI.)
Source: AHEAD WPIX country reports.

12 | GOLINOWSKA, KOCOT & SOWA
4. Assumptions and development of variables The assumptions on future development of health care sector revenues and expenditures which lie at the background of long-term projections are positive. This implies that in almost every case the trend for future development is positive. At first glance, in the case of CEE countries which went through rapid changes during 1990’s, it would seem rather risky to assume only positive trends. Over the 17 years of transition, several indicators which are important for the model did not have a positive trend: TFR was declining, employment was declining, and GDP growth strongly fluctuated. Therefore, it is necessary to keep it in mind that projections assume recovery from the crisis and negative trends of the 80’s and 90’s.
Assumption of positive economic growth is an extrapolation of ambitions of the New Member States in convergence to the EU-15 economic level. Similar assumptions are adopted in the National Action Plans in the framework of OMC and National Convergence Programs in the framework of the accession process. According to these documents, economic growth in the NMS should guarantee growth in employment and productivity at the same time. Previous experience shows that this objective is difficult to reach – Poland, for example, experienced (still does?) the situation of “jobless growth” (Kwiatkowski, 2002).
4.1 Development of demographic variables Assumptions on future demographic changes in the countries under analysis are based on country sources, which include analytical research and projections prepared by national statistical offices and institutes of demography. These are confronted with the Eurostat projections (EUROPOP 2004), especially with aggregated data on the NMS and the EU15 country comparisons.
According to demographic projections, in the oncoming decades countries included in the analysis will face the same trends as those observed earlier in the EU-15: fertility decline, life expectancy increase, and increase in the share of the elderly (65+) in the population. The dynamics of those changes, however, will be higher than in the EU-15. Furthermore, one must remember that they will take place in relatively poorer countries9.
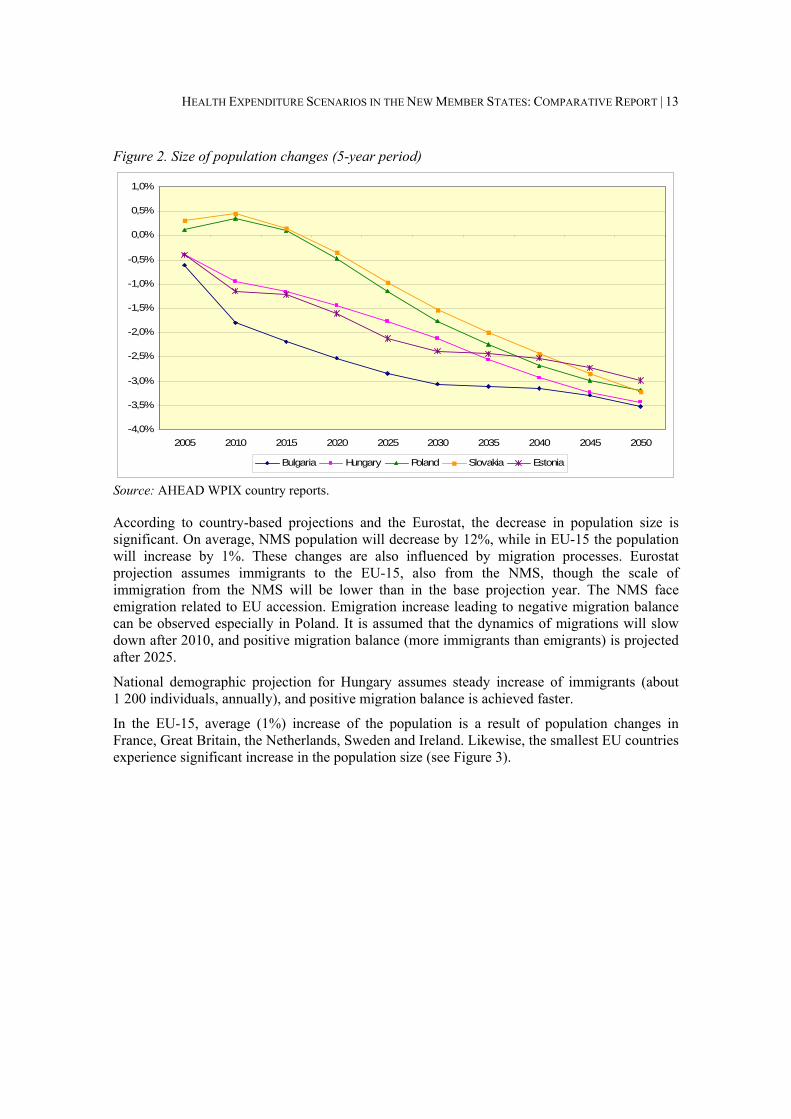
The scale of population decrease varies from 2% in Slovakia to about 20% in Bulgaria, during the next 25 years.
Figure 2 shows that, in the long run, the fastest decrease of population will be observed in Bulgaria. Negative trend will slow down after 2030. In Poland and Slovakia in the period of 2005 – 2010, a slight increase of the population is foreseen, while in the following 5 years (2010 – 2015) the population will start to decrease, but replacement will still be positive. After 2015, the population of these countries is going to shrink.
9 International analyses, i.e. Eberstatd 2005, World Bank 2007, indicate that CEE countries face unusual phenomenon of co-existence of demographic transformation and lower development level.
HEALTH EXPENDITURE SCENARIOS IN THE NEW MEMBER STATES: COMPARATIVE REPORT | 13
Figure 2. Size of population changes (5-year period)
-4,0%
-3,5%
-3,0%
-2,5%
-2,0%
-1,5%
-1,0%
-0,5%
0,0%
0,5%
1,0%
2005 2010 2015 2020 2025 2030 2035 2040 2045 2050
Bulgaria Hungary Poland Slovakia Estonia
Source: AHEAD WPIX country reports.
According to country-based projections and the Eurostat, the decrease in population size is significant. On average, NMS population will decrease by 12%, while in EU-15 the population will increase by 1%. These changes are also influenced by migration processes. Eurostat projection assumes immigrants to the EU-15, also from the NMS, though the scale of immigration from the NMS will be lower than in the base projection year. The NMS face emigration related to EU accession. Emigration increase leading to negative migration balance can be observed especially in Poland. It is assumed that the dynamics of migrations will slow down after 2010, and positive migration balance (more immigrants than emigrants) is projected after 2025.
National demographic projection for Hungary assumes steady increase of immigrants (about 1 200 individuals, annually), and positive migration balance is achieved faster.
In the EU-15, average (1%) increase of the population is a result of population changes in France, Great Britain, the Netherlands, Sweden and Ireland. Likewise, the smallest EU countries experience significant increase in the population size (see Figure 3).

14 | GOLINOWSKA, KOCOT & SOWA
Figure 3. Changes in population size, 2004-2050
-20
-10
0
10
20
30
40
50
Luxe
mbe
rg
Irlan
d
Cyp
res
Mal
ta
Swed
en
Fran
ce
Net
herla
nds
Uni
ted
King
dom
Belg
ium
Den
mar
k
Spai
n
Aust
ria
EU15
Finl
and
EU25
Gre
ece
Portu
gal
Slov
enia
Ger
man
y
Italy
Hun
gary
Pola
nd
Slov
akia
EU10
Cze
ch R
epub
lic
Lith
uani
a
Esto
nia
Latv
ia
%
Source: EPC and European Commission, 2006.
Total fertility rate During the last 15 years one could observe a decrease in fertility in analyzed countries. It results from modernization in life style (the so-called “westernization”), accompanied by changes in family structure (marriages in older ages, more common cohabitation, birth in older ages, one-child families.) The cost related to raising a child has increased dramatically during transition period. The relations between goods for children and other goods and consumption goals have changed, accessibility of childcare has decreased, and family policy has changed from universal to targeted benefits.
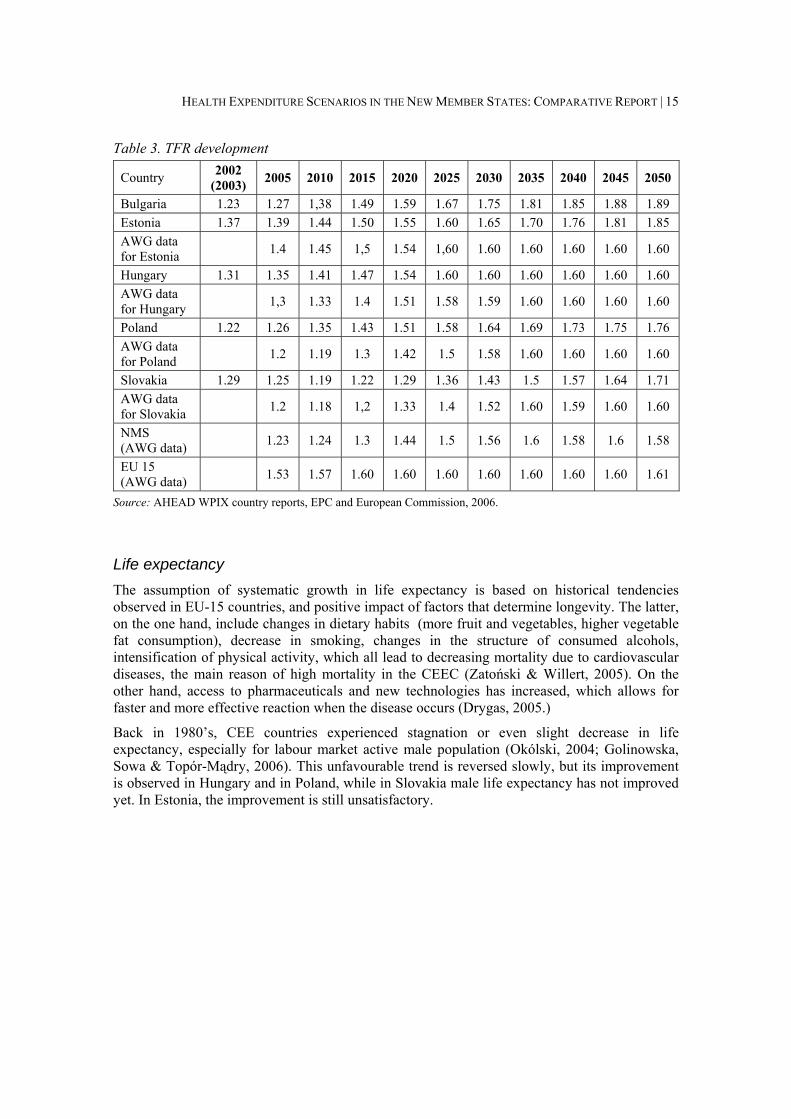
Despite negative tendencies in the last 15-20 years, in all countries under analysis the assumption of fertility increase is adopted (Table 3). In the next 25 years, the scale of foreseen TFR improvement is smaller than in the EU-15, while in the following period the value of fertility indicator is closer to the projected EU-15 level. This is due to increasing similarities in family formation process, i.e. the age of giving birth to the first child (30).
Notwithstanding the positive trend in fertility development projection, fertility level is not sufficiently high to offset systematic decrease in the size of the population in analyzed countries.10
10 Simple replacement level is assured when TFR equals at least 2.1.
HEALTH EXPENDITURE SCENARIOS IN THE NEW MEMBER STATES: COMPARATIVE REPORT | 15
Table 3. TFR development
Country 2002 (2003) 2005 2010 2015 2020 2025 2030 2035 2040 2045 2050
Bulgaria 1.23 1.27 1,38 1.49 1.59 1.67 1.75 1.81 1.85 1.88 1.89 Estonia 1.37 1.39 1.44 1.50 1.55 1.60 1.65 1.70 1.76 1.81 1.85 AWG data for Estonia 1.4 1.45 1,5 1.54 1,60 1.60 1.60 1.60 1.60 1.60
Hungary 1.31 1.35 1.41 1.47 1.54 1.60 1.60 1.60 1.60 1.60 1.60 AWG data for Hungary 1,3 1.33 1.4 1.51 1.58 1.59 1.60 1.60 1.60 1.60
Poland 1.22 1.26 1.35 1.43 1.51 1.58 1.64 1.69 1.73 1.75 1.76 AWG data for Poland 1.2 1.19 1.3 1.42 1.5 1.58 1.60 1.60 1.60 1.60
Slovakia 1.29 1.25 1.19 1.22 1.29 1.36 1.43 1.5 1.57 1.64 1.71 AWG data for Slovakia 1.2 1.18 1,2 1.33 1.4 1.52 1.60 1.59 1.60 1.60
NMS (AWG data) 1.23 1.24 1.3 1.44 1.5 1.56 1.6 1.58 1.6 1.58
EU 15 (AWG data) 1.53 1.57 1.60 1.60 1.60 1.60 1.60 1.60 1.60 1.61
Source: AHEAD WPIX country reports, EPC and European Commission, 2006.
Life expectancy The assumption of systematic growth in life expectancy is based on historical tendencies observed in EU-15 countries, and positive impact of factors that determine longevity. The latter, on the one hand, include changes in dietary habits (more fruit and vegetables, higher vegetable fat consumption), decrease in smoking, changes in the structure of consumed alcohols, intensification of physical activity, which all lead to decreasing mortality due to cardiovascular diseases, the main reason of high mortality in the CEEC (Zatoński & Willert, 2005). On the other hand, access to pharmaceuticals and new technologies has increased, which allows for faster and more effective reaction when the disease occurs (Drygas, 2005.)
Back in 1980’s, CEE countries experienced stagnation or even slight decrease in life expectancy, especially for labour market active male population (Okólski, 2004; Golinowska, Sowa & Topór-Mądry, 2006). This unfavourable trend is reversed slowly, but its improvement is observed in Hungary and in Poland, while in Slovakia male life expectancy has not improved yet. In Estonia, the improvement is still unsatisfactory.

16 | GOLINOWSKA, KOCOT & SOWA
Figure 4. Life expectancy – males
60,0
65,0
70,0
75,0
80,0
85,0
90,0
2002 (03) 2005 2010 2015 2020 2025 2030 2035 2040 2045 2050
Bulgaria Hungary Poland Slovakia Estonia
Source: AHEAD WPIX country reports.
Figure 5. Life expectancy – females
60,0
65,0
70,0
75,0
80,0
85,0
90,0
2002 (03) 2005 2010 2015 2020 2025 2030 2035 2040 2045 2050
Bulgaria Hungary Poland Slovakia Estonia
Source: AHEAD WPIX country reports.
Changes in population structure – ageing Changes in demographic structure according to age are clearly reflected in the shape of age pyramid, which even at the beginning of projection period looks like a Christmas tree, and at the end of projection is shaped as a mushroom with a narrow mushroom leg.
The figures below present age structure of the population in the base year and at the end of projection period. In the base year in Hungary, Poland and Slovakia two periods of population growth can be distinguished: the first one is the baby boom following World War II, while the other one is its echo after 20-25 years.

HEALTH EXPENDITURE SCENARIOS IN THE NEW MEMBER STATES: COMPARATIVE REPORT | 17
The highest share of population is observed for the cohort of 55-75 years of age. In Poland, the peak is at the age of 67-68, in Bulgaria about 60-70, in Estonia 60-65, while in Hungary and Slovakia the peak is at the age of 70-75 and 68-72, respectively.
Figure 6. Population histogram – Bulgaria 2003
Year : 2003
-3 5 0-2 5 0-1 5 0-5 05 01 5 02 5 03 5 0
0 -4
1 0 -1 4
2 0 -2 4
3 0 -3 4
4 0 -4 4
5 0 -5 4
6 0 -6 4
7 0 -7 4
8 0 -8 4
9 0 -9 4
T housands
M a le s F e m a le s
Source: AHEAD WP IX country report of R. Rangelova and G. Sariiski.
Figure 7. Population histogram – Bulgaria 2050 Y e a r : 2 0 5 0
-3 5 0-2 5 0-1 5 0-5 05 01 5 02 5 03 5 0
0 -4
1 0 -1 4
2 0 -2 4
3 0 -3 4
4 0 -4 4
5 0 -5 4
6 0 -6 4
7 0 -7 4
8 0 -8 4
9 0 -9 4
T h o u sa n d s
M a le s F e m a le s
Source: AHEAD WP IX country report of R. Rangelova and G. Sariiski.

18 | GOLINOWSKA, KOCOT & SOWA
Figure 8. Population histogram – Estonia 2003
20 00010 000010 00020 0000
10
20
30
40
50
60
70
80
90
Age
MalesFemales
Source: Estonian calculation based on SE data and ILO model 2007.
Figure 9. Population histogram – Estonia 2050
20 00010 000010 00020 0000
10
20
30
40
50
60
70
80
90
Age
MalesFemales
Source: Estonian calculation based on SE data and ILO model 2007.

HEALTH EXPENDITURE SCENARIOS IN THE NEW MEMBER STATES: COMPARATIVE REPORT | 19
Figure 10. Population histogram – Hungary 2002
-100 000 -80 000 -60 000 -40 000 -20 000 0 20 000 40 000 60 000 80 000 100 00005
101520253035404550556065707580859095
100
Population pyramid - 2002Age
Males Females
Source: AHEAD WP IX country report of A. Gabos and I. Gal.
Figure 11. Population histogram – Hungary 2050
-80 000 -60 000 -40 000 -20 000 0 20 000 40 000 60 000 80 00005
101520253035404550556065707580859095
100
Population pyramid - 2050Age
Males Females
Source: AHEAD WP IX country report of A. Gabos and I. Gal.

20 | GOLINOWSKA, KOCOT & SOWA
Figure 12. Population histogram – Poland 2003
400 300 200 100 0 100 200 300 400
0
4
8
12
16
20
24
28
32
36
40
44
48
52
56
60
64
68
72
76
80
84
88
92
96
10
Age
Females Males
Source: AHED WP IX country report of S. Golinowska, E. Kocot, A. Sowa.
Figure 13. Population histogram – Poland 2050
400 300 200 100 0 100 200 300 400
0
4
8
12
16
20
24
28
32
36
40
44
48
52
56
60
64
68
72
76
80
84
88
92
96
10
Age
Females Males
Source: AHEAD WP IX country report of S. Golinowska, E. Kocot, A. Sowa.

HEALTH EXPENDITURE SCENARIOS IN THE NEW MEMBER STATES: COMPARATIVE REPORT | 21
Figure 14. Population histogram – Slovakia 2005
-50 000 -40 000 -30 000 -20 000 -10 000 0 10 000 20 000 30 000 40 000 50 0000
6
12
18
24
30
36
42
48
54
60
66
72
78
84
90
96
Age
Females Males
Source: AHEAD WP IX country report of V. Kvetan, V. Páleník, M. Mlýnek, M. Radvanský.
Figure 15. Population histogram – Slovakia 2050
50000 40000 30000 20000 10000 0 10000 20000 30000 40000 500000
6
12
18
24
30
36
42
48
54
60
66
72
78
84
90
96
Age
Females Males
Source: AHEAD WP IX country report of V. Kvetan, V. Páleník, M. Mlýnek, M. Radvanský.

22 | GOLINOWSKA, KOCOT & SOWA
A decrease in the share of children in the population of analyzed countries can be observed until 2010. Following that period, this decreasing trend remains at the level of about 15%. The share of children slowly decreases again after the year 2020.
The lowest shares of young population are observed in Bulgaria in the first projection period (up to 2025), and in Hungary in the second period (up to 2050).
Figure 16. Share of population 0-14
0,0%
5,0%
10,0%
15,0%
20,0%
25,0%
30,0%
2002 (03) 2005 2010 2015 2020 2025 2030 2035 2040 2045 2050
Bulgaria Hungary Poland Slovakia Estonia
Source: AHEAD WPIX country reports.
A decrease in the share of labour market active age population can be observed after 2010, when baby boomers begin to retire (at the age of 65.) In the NMS the drop in the share of active age population is rapid (about 27% compared to 13% in the EU-15), and it is projected to continue dynamically up to 2025. In years 2025 – 2030 the decrease will slow down, but in the last decade of projection the share of labour market active population will rapidly shrink again (Figure 17).
Labour market activity development is similar in Eastern and Western Europe, although the dynamics is higher in the NMS. Decrease in labour market activity rate is the main reason for policies of employment promotion and new labour market programs at the EU-level. It also leads to changes in immigration policy in the enlarged EU. In the future, the potential of Eastern Europe as a migration source for Western Europe countries will diminish.
An increase in the share of the elderly has already been described by age pyramids at the beginning and at the end of projection period. Still, it is worth noting that the dynamics of increase in the share of the elderly (from 15% to almost 30% at the end of projection period) will be higher in the period of 2015 – 2025, when baby boomers get older.

HEALTH EXPENDITURE SCENARIOS IN THE NEW MEMBER STATES: COMPARATIVE REPORT | 23
Figure 17. Share of population 15-64
40,0%
45,0%
50,0%
55,0%
60,0%
65,0%
70,0%
75,0%
2002(03)
2005 2010 2015 2020 2025 2030 2035 2040 2045 2050
Bulgaria Hungary Poland Slovakia Estonia
Source: AHEAD WPIX country reports.
Figure 18. Share of population 65+
0,0%
5,0%
10,0%
15,0%
20,0%
25,0%
30,0%
35,0%
40,0%
45,0%
50,0%
2002(03)
2005 2010 2015 2020 2025 2030 2035 2040 2045 2050
Bulgaria Hungary Poland Slovakia Estonia
Source: AHEAD WPIX country reports.
As a result of presented demographic scenario, the old age dependency ratio, which is calculated as a proportion of the number of the elderly (65+) to the number of labour market active age population, doubles – from 20% to around 40%. In Hungary, Poland and Bulgaria the indicator dramatically increases to over 50% (Figure 19).

24 | GOLINOWSKA, KOCOT & SOWA
Figure 19. Old age dependency ratio
0
10
20
30
40
50
60
2002(03)
2005 2010 2015 2020 2025 2030 2035 2040 2045 2050
Bulgaria Hungary Poland Slovakia Estonia
Source: AHEAD WPIX country reports.
4.2 Labour market projection Employment rate is one of the indicators that deteriorated during transition. In Bulgaria and Poland, only half of the population in labour market active age is currently employed. Estonia has the highest employment rate among all countries under research; moreover, it had the highest rate of economic growth in recent years.
Table 4. Employment rate development 2005 2010 2015 2020 2025 2030 2035 2040 2045 2050 Bulgaria 51.4 54.8 64.0 64.8 63.8 62.1 60.1 58.9 58.9 59.3 Estonia 63.8 69.4 71.6 73.0 73.4 73.6 73.5 73.7 73.5 73.4 AWG data for Estonia 64.4 68.4 71.8 72.3 71.9 71.6 71.1 71.2 71.1 70.8
Hungary 56.4 58.7 60.8 64.3 64.0 62.6 61.9 62.0 63.4 63.2 AWG data for Hungary 58.4 60.8 62.4 64.3 65.3 64.6 63.5 62.4 63.1 63.2
Poland 51.2 55.3 59.4 62.9 66.5 70.0 71.0 72.0 73.0 74.0 AWG data for Poland 52.7 57.0 61.0 64.9 68.4 68.6 67.4 66.2 65.6 66.1
Slovakia 57.7 62.0 65.2 68.6 69.4 69.3 68.3 68.0 68.4 68.9 AWG data for Slovakia 59.2 62.1 66.7 70.2 72.7 72.6 71.2 69.5 69.0 68.7
NMS (AWG data) 57.2 60.7 64.2 67.2 69.4 69.2 68.1 67.0 66.8 67.1
EU 15 (AWG data) 65.6 68.1 70.1 70.5 70.5 70.7 71.1 71.5 71.5 71.5
Source: AHEAD WPIX country reports, EPC and European Com mission, 2006.

HEALTH EXPENDITURE SCENARIOS IN THE NEW MEMBER STATES: COMPARATIVE REPORT | 25
Assumptions regarding the development of employment rate in all the countries are quite optimistic, but they are coherent with the national action plans on employment and convergence strategies adopted by selected New Member States (NMS) after EU accession. Projected level of employment rate is necessary in the long run to keep the economy growing (even if productivity growth is high) in view of unfavourable demographic changes.
When comparing these assumptions to the EPC and European Commission projection, one can see some discrepancies, especially in phase one of projection period (until 2025.) Presented projections for Poland, Hungary and Slovakia assume higher employment rate than the EPC projection. In general, labour market indicators projected by the EPC and European Commission are less favourable for nearly all NMS in comparison to the EU-15. Most likely, this is a result of demographic situation in the NMS and its impact on labour market activity level. Population ageing dynamics in the NMS is higher than in the EU-15, so the size of labour market active cohort is smaller. Significant improvements in the economic situation in the NMS in recent years seem to indicate that there are grounds for more optimistic employment assumptions that those included in EPC prognosis. Following Lisbon Strategy assumptions, the NMS have released some employment improvement programs which could bring about improvements in labour market situation.
Employment rate assumptions in national and European projections in the second part of projection period (2025-2050) are similar. One should emphasize that the projections do not assume that the NMS will have reached the goals of the Lisbon Strategy, and national projections are even more sceptical. In Hungary and Bulgaria, estimated employment level is lower than the average for the NMS in 2050. It is assumed that by 2020-2025 employment level will have decreased by 20-25%, compared to 2003.
Table 5. Unemployment rate development 2005 2010 2015 2020 2025 2030 2035 2040 2045 2050 Bulgaria 13.2 8.4 6.0 5.6 5.2 4.9 4.7 4.5 4.3 4.1 Estonia 9.4 5.5 5.7 5.0 5.3 5.3 5.3 5.3 5.3 5.3 AWG data for Estonia 9.1 7.8 7.0 7.0 7.0 7.0 7.0 7.0 7.0 7.0
Hungary 8.0 7.2 6.4 4.8 6.2 6.6 5.6 4.2 3.9 4.8 AWG data for Hungary 5.3 4.8 4.8 4.8 4.8 4.8 4.8 4.8 4.8 4.8
Poland 18.2 14.3 11.4 9.9 8.5 7.0 7.0 7.0 7.0 7.0 AWG data for Poland 18.7 15.8 12.9 9.9 7.0 7.0 7.0 7.0 7.0 7.0
Slovakia 17.9 11.7 8.9 6.0 6.0 6.0 6.0 6.0 6.0 6.0 AWG data for Slovakia 16.7 15.2 12.5 9.7 7.0 7.0 7.0 7.0 7.0 7.0
NMS (AWG data) 13.8 12.0 10.0 8.3 6.6 6.6 6.6 6.6 6.6 6.6
EU 15 (AWG data) 7.7 7.0 6.1 6.1 6.1 6.1 6.0 6.0 6.0 6.0
Source: AHEAD WPIX country reports, EPC and European Com mission, 2005.
European Commission projections on the level of unemployment assume that the indicator will decrease up to the NAIRU level of 6-7%. In the case of Poland and Slovakia, where unemployment rate is the highest, it will take even 20 years to approach this estimated level (EPC and European Commission, 2006.)

26 | GOLINOWSKA, KOCOT & SOWA
Background for projections on unemployment level prepared by each country is similar to the assumptions made by the European Commission, although the indicators regarding the first period of projection are more optimistic. Only in Hungary is the slope of unemployment rate decrease less steep (overall decrease of unemployment is at the level of 40%), due to the already low unemployment rate in the base year (about 8.0%). In other countries unemployment rate decreases by 60-70% during projection period, with the lowest unemployment rate estimated in 2050 in Bulgaria.
4.3 Economic assumptions and projections Projection of economic growth in analyzed countries is built upon convergence assumptions, which implies that these countries will catch up with the average European economic level relatively fast. It is assumed that labour productivity in the NMS will be substantially higher than in the EU-15, particularly with lower employment rate.
In consequence of convergence, GDP growth is expected to be nearly two times higher than in the EU-15 in the first period of projection. National projections are even more optimistic in the next 20 years. Nearly all the countries (except for Hungary in 2025) assume higher GDP growth than that included in European Commission projection.
In phase two of projection period, economic growth dynamics in the EU-15 and in the NMS is assumed to be similar, and by 2050 economic growth in some of EU-15 countries will be higher than in the NMS. National projections assume lower decrease in GDP growth in the second part of projection period, especially in Bulgaria. This is a result of high labour productivity (especially productivity capital deepening) accompanied with adverse tendency in demography and labour utilization.
Table 6. GDP growth rate 2005 2010 2015 2020 2025 2030 2035 2040 2045 2050 Bulgaria 4.4 4.3 4.2 4.0 3.9 3.7 3.6 3.5 3.4 3.2 Estonia 10.5 7.2 4.3 4.1 4.1 3.9 3.8 3.6 3.4 3.3 AWG data for Estonia 6.3 5.6 3.7 2.7 2.4 2.3 1.5 1.3 0.9 0.6
Hungary 4.1 3.6 3.0 2.5 2.3 2.0 1.8 1.6 1.3 1.1 AWG data for Hungary 3.8 3.3 2.8 2.5 2.4 2.1 1.0 0.8 1.0 1.1
Poland 5.3 5.1 4.8 4.2 3.7 3.2 2.6 2.1 1.5 1.0 AWG data for Poland 3.6 5.0 3.7 3.2 2.9 2.2 1.2 0.7 0.5 0.4
Slovakia 6.0 6.2 5.1 4.1 3.2 3.1 2.9 2.8 2.6 2.5 AWG data for Slovakia 3.9 5.3 4.1 3.3 2.9 2.0 0.8 0.4 0.2 0.3
NMS (AWG data) 4.4 4.6 3.5 2.9 2.7 2.1 1.1 0.7 0.6 0.6
EU 15 (AWG data) 2.0 2.5 2.2 1.7 1.5 1.2 1.2 1.3 1.3 1.3
Source: AHEAD WPIX country reports, EPC and European Com mission, 2005.

HEALTH EXPENDITURE SCENARIOS IN THE NEW MEMBER STATES: COMPARATIVE REPORT | 27
4.4 Assumption regarding income elasticity of health expenditures Presented projections are based upon an assumption that income elasticity of health expenditures is equal to 1.0. This supposition is arbitrary, drawn upon partial analysis of the relation between income and health expenditures (MZ 2004.) It should be noted that there are numerous discussions on the value of income elasticity indicator. The outcome of one of the first analyses dedicated to that subject were published in 1977 (Newhouse, 1977), and indicated that income elasticity of health expenditures is above 1, which implies that health expenditures are, in fact, luxury expenditures. Over the next 30 years various analyses were published, but their outcome was inconclusive. According to Getzen (Getzen, 2000), different results of those analyses should be attributed to the differences in the definitions of the subject under analysis. Income elasticity varies depending on the subject under analysis: individual, group (i.e. insurance company clients), or the whole population covered by national health insurance. Income elasticity measured at the individual level is typically lower than unity (health is understood as a basic, necessary asset), while income elasticity measure at the national level is often higher than unity (which implies that health is a luxury good) (Getzen, 2000.) Table below presents some of the results of income elasticity analysis at the macro (national) level.
Table 7. Selected results of the analysis of impact of income changes on the level of health expenditures
Source Income elasticity Comments
Newhouse (1977) 1.30 13 developed countries
Gertler i van der Gaag (1990) 1.30 25 countries
Getzen (1990) 1.60 USA
Getzen i Poullier (1992) 1.40 selected OECD countries (19)
Murthy i Ukpolo (1994) 0.77 USA
Gerdtham et al. (1998) 0.66 – 0.82 selected OECD countries (22)
Fogel (1999) 1.60 USA
Okunade i Murthy (2002) 1.56-1.64 USA
Ariste i Carr (2003) 0.88 Canada
Clemente et al. (2004) 1.47 – 3.65 selected OECD countries (22): results depend on the country
Okunade et al. (2004) 0.87 selected OECD countries – total (17)
Dreger i Reimers (2005) 0.68 – 0.84 selected OECD countries (21): results depend on medical development indicator (LE, infant mortality, share of 65+ population)
OECD (2006) 0.87 – 1.5 OECD countries (30): results depend on the method applied in the analysis
0.79 – 0.97 EU14+Iceland+Norway+Switzerland: results depend on the model adopted
0.81 EU11+Iceland+Norway+USA+Canada CPB (2006)*
0.69 OECD countries, excl. Turkey * Source: Mot (2006).
28 | GOLINOWSKA, KOCOT & SOWA
4.5 Assumption on health status and health service utilization Health status of the population and behavioural pattern of medical service utilization were analyzed in the WPII – an earlier component of AHEAD project. Conclusions were included in projections, together with the assumptions on mortality and medical service utilization pattern by age. The latter was especially important, since projections are oriented towards the examination of the impact of ageing on health expenditures. Medical service utilization curve is the basic element of expenditure diversification by age.
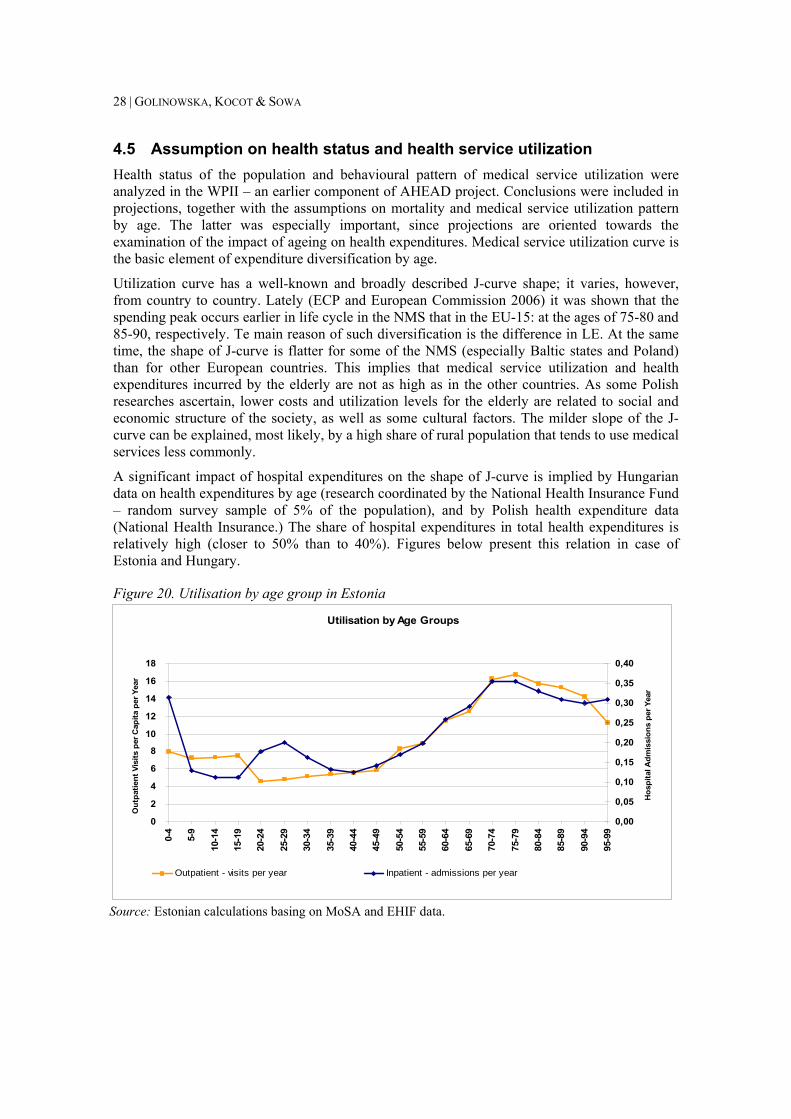
Utilization curve has a well-known and broadly described J-curve shape; it varies, however, from country to country. Lately (ECP and European Commission 2006) it was shown that the spending peak occurs earlier in life cycle in the NMS that in the EU-15: at the ages of 75-80 and 85-90, respectively. Te main reason of such diversification is the difference in LE. At the same time, the shape of J-curve is flatter for some of the NMS (especially Baltic states and Poland) than for other European countries. This implies that medical service utilization and health expenditures incurred by the elderly are not as high as in the other countries. As some Polish researches ascertain, lower costs and utilization levels for the elderly are related to social and economic structure of the society, as well as some cultural factors. The milder slope of the J-curve can be explained, most likely, by a high share of rural population that tends to use medical services less commonly.
A significant impact of hospital expenditures on the shape of J-curve is implied by Hungarian data on health expenditures by age (research coordinated by the National Health Insurance Fund – random survey sample of 5% of the population), and by Polish health expenditure data (National Health Insurance.) The share of hospital expenditures in total health expenditures is relatively high (closer to 50% than to 40%). Figures below present this relation in case of Estonia and Hungary.
Figure 20. Utilisation by age group in Estonia
Utilisation by Age Groups
0
2
4
6
8
10
12
14
16
18
0-4
5-9
10-1
4
15-1
9
20-2
4
25-2
9
30-3
4
35-3
9
40-4
4
45-4
9
50-5
4
55-5
9
60-6
4
65-6
9
70-7
4
75-7
9
80-8
4
85-8
9
90-9
4
95-9
9
Out
patie
nt V
isits
per
Cap
ita p
er Y
ear
0,00
0,05
0,10
0,15
0,20
0,25
0,30
0,35
0,40
Hos
pita
l Adm
issi
ons
per Y
ear
Outpatient - visits per year Inpatient - admissions per year
Source: Estonian calculations basing on MoSA and EHIF data.

HEALTH EXPENDITURE SCENARIOS IN THE NEW MEMBER STATES: COMPARATIVE REPORT | 29
Figure 21. Utilisation by age group in Hungary
Utilisation by Age Groups
0
5
10
15
20
25
0-4 5-910
-1415
-1920
-2425
-2930
-3435
-3940
-4445
-4950
-5455
-5960
-6465
-6970
-7475
-7980
-8485
-8990
-9495
-99
Out
patie
nt V
isits
per
Cap
ita p
er Y
ear
0,0
0,1
0,2
0,3
0,4
0,5
0,6
0,7
0,8
0,9
Hos
pita
l Adm
issi
ons
per Y
ear
Outpatient - visits per year Inpatient - admissions per year
Source: Country report AHEAD WPIX – Hungary.
The following figures present the assumptions on the shape of the J-curve in Poland. Its shape varies significantly from the shape typical of EU-15 countries. Namely, higher expenditures in Poland start for younger cohorts than in the old EU countries; respectively: above 40 and above 50 years of age. However, the peak of expenditures occurs in similar age: about 75-80 for men and 90 for women, but the level of spending in Poland can be even 7 times lower.
Figure 22. Average insurance expenditures per capita as % of GDP per capita (base year)
0,00%
2,00%
4,00%
6,00%
8,00%
10,00%
12,00%
0 - 4
5 - 9
10 -
14
15 -
19
20 -
24
25 -
29
30 -
34
35 -
39
40 -
44
45 -
49
50 -
54
55 -
59
60 -
64
65 -
69
70 -
74
75 -
79
80 -
84
85 -
89
90 -
94
95 -
99
males females
Source: Country report AHEAD WPIX – Poland.

30 | GOLINOWSKA, KOCOT & SOWA
Figure 23. Average health cost per capita as % of GDP per capita (base year)
0,0%
0,5%
1,0%
1,5%
2,0%
2,5%
0-9 10-19 20-29 30-39 40-49 50-59 60-69 70-79 80-89 90+
Males Females
Source: Country report AHEAD WPIX – Hungary.
Per capita health expenditures in Hungary also have a typical J-curve shape. Analogically to Poland, a rapid increase in per capita health expenditures can be observed for younger cohorts than is the case in the EU-15. The peak of expenditures occurs at the age of 70-79, irrespective of gender. The same male age cohort faced the peak of health expenditures in Poland, while for females the peak of health expenditures is observed for a younger cohort.
5. Projection results Projections pertaining to public funding in health care sector (revenues, expenditures and financial balance) based on the ILO social budget model were prepared according to several scenarios. The first one, identical for all the countries under research, is the (1) baseline scenario. It is based on some assumptions, established for all the countries:
• the base year is 2003,
• life expectancy improvement is medium, based on national demographic projections, taking gender and age-specific mortality rate into account,
• total fertility rate development is the medium variant of national demographic prognosis, with the assumption of no changes / very minor changes in the second part of projection (2025 – 2050),
• yearly increase in health expenditures per capita has the same rate as GDP per capita (Scenario II in ILO model),
• economic and labour market variables are assumed to be the most probable version of national projections, for Hungary, Poland and Slovakia based on updated country projections used in Governmental Convergence Programs prepared for the European Committee last year (2006), and for Bulgaria based on national Bulgarian considerations from different institutions.

HEALTH EXPENDITURE SCENARIOS IN THE NEW MEMBER STATES: COMPARATIVE REPORT | 31
Additional scenarios are not identical across countries. (2) Polish and Hungarian teams have prepared the death-related costs scenario, where expenditures in the last year of life are taken into account. This scenario was possible thanks to disaggregation of health insurance expenditure data. (3) Next to it, the four country teams: Bulgarian, Hungarian, Polish and Slovakian, prepared different prognoses contingent upon future LE developments. (4) Additionally, three country teams: Bulgarian, Hungarian and Slovakian, have prepared variants with different assumptions concerning wage development. (5) Lastly, different development of labour market indicators: activity rate (Hungary), employment rate (Poland and Slovakia), and unemployment rate (Bulgaria), was taken into account. (6) Variants with some combinations of different variable development assumption were also prepared, for instance, wages and employment rate (Slovakia), and different wage development (Bulgaria, Hungary and Slovakia).
5.1 Baseline scenario Revenue side Public health care sector projected revenues depend on adopted scenarios on the development of demographic and economic variables, including employment, unemployment and economic growth. Institutional framework in the health care sector and insurance premium are assumed to be constant during the whole projection period, according to the ceteris paribus principle.
The picture of health care sector revenues in relation to GDP is strongly differentiated. In projection phase one we can observe the trend of increasing revenues, although the trend is very strong only in Bulgaria, in Poland it is weaker, in Hungary the trend is non-linear (decreasing in the first 5 years), and in Slovakia it begins to decrease as early as 2010. In projection phase two, that increasing trend is reversed and we observe a drop in the level of health care revenues in relation to GDP. Only in Poland do the revenues grow almost continuously.
Table 8. Projected health revenues (public) as a share of GDP
2005 2010 2015 2020 2025 2030 2035 2040 2045 2050
Bulgaria 4.6 5.6 6.2 6.5 7.0 7.0 6.9 6.7 6.4 6.1
Estonia 4.2 4.2 4.2 4.1 4.1 4.0 3.8 3.7 3.5 3.3
Hungary 4.0 3.9 4.1 4.3 4.1 3.9 3.8 3.6 3.5 3.4
Poland 4.5 4.7 4.8 5.0 5.2 5.2 5.3 5.4 5.6 5.8
Slovakia 6.3 6.4 6.0 5.8 5.6 5.4 5.2 5.0 4.7 4.5
Source: AHEAD WPIX country reports.

32 | GOLINOWSKA, KOCOT & SOWA
Figure 24. Total public health care revenues as a share of GDP
0,0%
1,0%
2,0%
3,0%
4,0%
5,0%
6,0%
7,0%
8,0%
2005 2010 2015 2020 2025 2030 2035 2040 2045 2050
Bulgaria Hungary Poland Slovakia Estonia
Source: AHEAD WPIX country reports.
Figure 25. Public health care revenue growth in relation to the year 2005 (2005 = 100%)
0,0%
200,0%
400,0%
600,0%
800,0%
1000,0%
1200,0%
1400,0%
1600,0%
1800,0%
2005 2010 2015 2020 2025 2030 2035 2040 2045 2050
Bulgaria Hungary Poland Slovakia Estonia
Source: AHEAD WPIX country reports.
Expenditure side At the beginning of projection period, countries under research are characterized by a low share of public expenditures on health care sector in relation to GDP. Only in Hungary the share of expenditures exceeds 5% of GDP. In the first projection period, relative increase in expenditures

HEALTH EXPENDITURE SCENARIOS IN THE NEW MEMBER STATES: COMPARATIVE REPORT | 33
is slow in each country except Bulgaria, where the level of 6% of GDP is reached as early as 2020.11
Table 9. Projected public expenditures on health as a share of GDP
2005 2010 2015 2020 2025 2030 2035 2040 2045 2050
Bulgaria 5.0 5.4 5.4 6.1 6.4 6.6 6.8 7.0 7.1 7.1
Estonia 4.0 4.3 4.5 4.7 5.0 5.3 5.6 6.0 6.3 6.7
Hungary 5.5 5.5 5.6 5.8 5.9 6.1 6.2 6.4 6.6 6.7
Poland 4.6 4.9 5.2 5.5 5.9 6.2 6.6 6.8 7.0 7.1
Slovakia 4.8 5.0 5.1 5.4 5.6 5.8 6.1 6.4 6.6 6.9
Source: AHEAD WPIX country reports.
In the second projection period, public expenditures on health systematically increase in relative terms, up to the level of 7% of GDP. The lowest dynamics is projected in Slovakia and Hungary.
Figure 26. Public expenditures on health as a share of GDP
0,0%
1,0%
2,0%
3,0%
4,0%
5,0%
6,0%
7,0%
8,0%
2005 2010 2015 2020 2025 2030 2035 2040 2045 2050
Bulgaria Hungary Poland Slovakia Estonia
Source: AHEAD WPIX country reports.
The highest share of public expenditures on health in relation to GDP in the year 2050 is projected in Bulgaria and Poland. In Poland, the growth rate of public expenditures on health is the highest during the whole projection period. Level of expenditures, the lowest as compared to other countries in the base year, rapidly increases to the level of 7.1% of GDP in 2050.
11 In many CEE countries the level of public expenditures on health equal to 6% of GDP is perceived as a standard of appropriate financing in the sector, in relation to other expenditure objectives of the state. In Poland, medical associations are lobbying for priority for health care sector and stipulate for fast increase of expenditures to the level of 6% of GDP.

34 | GOLINOWSKA, KOCOT & SOWA
Figure 27. Public health expenditures growth in relation to the year 2005 (2005 = 100%)
0,0%
500,0%
1000,0%
1500,0%
2000,0%
2500,0%
3000,0%
3500,0%
4000,0%
2005 2010 2015 2020 2025 2030 2035 2040 2045 2050
Bulgaria Hungary Poland Slovakia Estonia
Source: AHEAD WPIX country reports.
Balance: surplus/deficit Public funding surplus/deficit indicators in health care sector in relation to GDP illustrate the scale of financial balance/imbalance and reflect financial tensions in the sector. In the base year, health care sector is in balance only in Slovakia, in consequence of reforms introduced several years ago.12 The reforms included the introduction of co-payment for services provided in the public sector.
Table 10. Deficit/surplus as a share of GDP
2005 2010 2015 2020 2025 2030 2035 2040 2045 2050
Bulgaria -0.5 0.1 0.4 0.4 0.6 0.4 0.0 -0.3 -0.7 -1.0
Estonia 0,2 0,0 -0,3 -0,6 -0,9 -1,3 -1,8 -2,3 -2,8 -3,4
Hungary -1.5 -1.6 -1.5 -1.5 -1.8 -2.2 -2.5 -2.8 -3.1 -3.4
Poland -0.2 -0.3 -0.4 -0.6 -0.7 -1.0 -1.3 -1.4 -1.4 -1.3
Slovakia 1.5 1.4 0.8 0.4 0.0 -0.4 -0.9 -1.4 -1.9 -2.3
Source: AHEAD WPIX country reports.
In Bulgaria, despite the presence of financial deficit in the base year, financial balance is projected in the first period and over several subsequent years. Bulgarian health care system experiences financial deficit after 2035, but until 2050 the deficit does not exceed 1% of GDP, staying well above the level of deficit in other countries. Poland faces the deficit starting from the base year; but further increase of the deficit is milder than in other countries, and in final years of projection the deficit even slightly decreases, reaching the level close to the level of the deficit in Bulgaria (1.3% of GDP). The least favourable situation is expected in Hungary, where
12 It should be noted that currently the government withdraws some of the reforms introduced earlier.

HEALTH EXPENDITURE SCENARIOS IN THE NEW MEMBER STATES: COMPARATIVE REPORT | 35
the deficit is the highest during the whole projection period. After the year 2020 the deficit increases with the highest slope, reaching the level of 3.4% GDP in 2050.
Figure 28. Public health surplus/deficit as a share of GDP
-4,0%
-3,0%
-2,0%
-1,0%
0,0%
1,0%
2,0%
2005 2010 2015 2020 2025 2030 2035 2040 2045 2050
Bulgaria Hungary Poland Slovakia Estonia
Source: AHEAD WPIX country reports.
5.2 Scenario of increased expenditures in the last year of life Death-related costs – theoretical background From the beginning of 1990’s, numerous analyses were conducted to examine the relation between per capita expenditures on health and the time left until death. Research findings point at two main conclusions:
• Majority of per capita expenditures on health is incurred in the last years (months) of individual’s life (death-related costs), and the increase in per capita expenditures on the elderly is caused not only by the impact of age, but by the fact that the elderly face higher probability of death (Raitano, 2006; Brockmann, 2002; Lubitz et al., 1995).
• The indicator that describes the relation of costs generated by an individual in the final stage of life to costs generated by an individual in the same age group but not in the final stage of life is very high; though it has a tendency to decrease with age (Raitano, 2006; Kildemoes et al., 2006 (expenditures on drugs); Gabriele et al., 2005; Busse, 2002; McGrail et al., 2000; Zweifel et al., 1999; Lubitz et al., 1995; Lubitz & Riley, 1993).
Research shows that per capita expenditures in the last years of life decrease with age (Gabriele et al., 2005; Polder & Achterberg, 2004; Brockmann, 2002; Hoover et al., 2002; Serup-Hansen et al., 2002; Madsen, 2002; McGrail et al., 2000; Lubitz, 1993). In contrast to individual expenditures in the group of survivors, which increase with age (except for the oldest age groups, where in some cases a decrease of expenditures is observed) (Gabriele et al., 2005; Hoover et al., 2002; Serup-Hansen et al., 2002; McGrail et al., 2000). McGrail et al. argue that the expenditures on nursery and social care increase with age, interdependently of the status of the patient and proximity to death. Similar relation is confirmed in the research on utilization of health care services, especially day-care in hospitals in Germany (including psychiatric care,

36 | GOLINOWSKA, KOCOT & SOWA
excluding long-term care) (Busse et al., 2002) Among the groups included in the analysis, in the third, second and last year before death the number of days of hospital care decreases with age.
High share of aggregated health expenditures is targeted towards care over individuals in their last year of life. According to Medicare expenditures in 1978 (Lubitz & Prihoda, 1984), health expenditures on individuals who died in that year amounted to 28% of total health expenditures in Medicare. These expenditures were only incurred by the care over 5.9% of the population covered by the analysis. In the following ten years, percentage of the deceased covered by Medicare was between 5.1-5.4%, and the cost of their care was at the level of 26.9-30.6% of total health expenditures annually (Lubitz & Riley, 1993). In 1992-1996, the share of costs incurred by individuals in their last year of life amounted to 26% of total Medicare costs (Hoover et al. 2002), so only slight differences in costs can be observed in the course of years. Similar findings were described by Seshamani & Gray (2004), who found that 28% of hospital expenditures in England were generated by the deceased.
When death-related costs are included in the analysis of the impact of ageing on health expenditures, it may lead not only to the constraint of health expenditure growth, but even a decrease in projected health expenditures. This is a result of the fact that expenditures in the last year of life of younger population are significantly higher than those incurred in the case of the elderly (due to more common utilisation of intensive and costly treatment for younger popula-tion, types of diseases related to age, and the fact that the costs of care for the elderly are shifted outside of health care system – to long-term and home care) (Brockmann, 2002; Kramer, 1995).
Assuming increasing life expectancy and decreasing mortality rates, the point of death and higher health expenditures are shifted towards older age. Average expenditures by age change over the years, and in every age cohort the share of persons generating higher costs (costs related to death) decreases (Ahn et al., 2005; Batljan, 2004; Seshamani & Gray, 2004).
Lack of necessary data on average health expenditures on the deceased and average health expenditures on survivors represents a common problem in the estimation of increased expenditures related to death. One way to resolve that issue it to use DRG data (Ahn et al. 2005); but in the countries where DRG payment system has not been introduced, the problem remains unresolved.
Owing to lack of necessary data, most analyses are based on the division of population into two groups: the deceased and the survivors in a given year (or shorter period of time) (Batljan & Lagergren, 2004 – 1 year for expenditures on ambulatory care; Hoover et al., 2002; Serup-Hansen et al., 2002; McGrail et al., 2000 – 6 months; Lubitz & Riley, 1993). Health expenditures are generated especially over the last 2-3 months of life (Hoover et al., 2002 – 51% in the last 3 months of life; Lubitz & Riley, 1993 – up to 50% in the last two months). Only in some research are the expenditures examined depending on the time left until death in a period longer than 1 year (Kildemoes et al., 2006 – two years before death for pharmaceutical expenditures; Batljan & Lagergren, 2004 – 8 groups of population for hospital expenditures and death in a given calendar year (0 years until death), 6 groups depending on proximity to death (from 1 to 6 years), and the last group – over 6 years till death); Dixon et al., 2004 – 3 groups of population – 1, 2, 3 years before death, analyzed for hospital expenditures; Busse et al., 2002).
Indicator of proportion of per capita expenditures on a person in the last of life to per capita expenditures on a survivor (k indicator) – comparison of diverse research.
It is difficult to compare projections prepared in different countries mainly due to diversified baskets of benefits included in the analysis, different periods before death that are taken into account, and discrepancies in age groups under analysis.

HEALTH EXPENDITURE SCENARIOS IN THE NEW MEMBER STATES: COMPARATIVE REPORT | 37
Table 11. Selected results of the analysis of expenditures per deceased in proportion to expenditures per survivor (k indicator)
Analysis prepared by:
Country Type of care Age of population
under research
Indicator of proportion of per capita expenditures per deceased to per capita
expenditures per survivor
Kildemoes et al. (2006)
Denmark Pharmaceuticals Age groups 0-24, 25-49, 50-74, 75+, by gender
Age 0-24 25-49 50-74 75+
Males 12.36 7.87 4.00 1.80
Females 1.37 9.91 3.68 1.63
Gabriele et al. (2005)
Italy (four regions)
Hospital care 5-year age cohorts
For all age groups: Lombardy: 13.8 Tuscany: 14.0 Apulia: 11.9 Abruzzo: 10.2
Ahn et al. (2005)
Spain Hospital care 5-year age cohorts
Age 0 1-5 6-10 11-15 16-20 21-25 26-30 31-35 36-40 41-45
Indicator 7.6 71.1 82.1 92.7 96.5 75.6 48.9 40.7 43.7 43.5
Age 46-50 51-55 56-60 61-65 66-70 71-75 76-80 81-85 86+ Total
Indicator 35.0 26.9 21.7 15.8 11.9 9.4 7.4 6.3 5.0 24.1
Batljan & Lagergren (2004)
Sweden (region Skane)
Hospital and outpatient care, excluding long-term care
Indicators with no distinction by age
5.96 for outpatient care, 21.5 for hospital care.
National Health Insurance Agency for Wage Earners (2003)
France Medical treatment
Six age groups: 35-44, 45-54, 55-64, 65-74, 75-84, 85+
Age 35-44 45-54 55-64 65-74 75-84 85+
Indicator 6.5 8.8 3.3 2.6 2.8 1.8
Busse et al. (2002)
Germany Hospital days per year
Up to 24 and above 85 years of life, between 24 i 85, 10-year age groups
Age <24 25-34 35-44 45-54 55-64 65-74 75-84 85+
Indicator 29.2 30.8 31.0 21.1 17.6 12.0 6.6 4.3
Hoover et al. (2002)
USA Medicare Three age groups over 65 years of life: 65-74, 75-84, 85+
Age 65-74 75-84 85+
Indicator 8.57 6.28 3.61

38 | GOLINOWSKA, KOCOT & SOWA
McGrail et al. (2000)
Canada Medical treatment including nursing care (half a year before death)
Four age groups: 65, 75-76, 85-87, 90-93
Age 65 75-76 85-87 90-93
Year 1986 1993 1986 1993 1986 1993 1986 1993
Indicator 16.6 16.7 8.4 8.6 3.4 3.8 2.5 2.5
Lubitz & Riley (1993)
USA Medicare Over 65 years of life
6.92
Source: Own compilation.
Compilation presented above illustrates the differences in the results of k-indicator analyses depending on a country, age and type of services under research. Irrespective of the values of k-indicator shown, one can identify decreasing trend in indicator’s value by age (except for the youngest age cohort, which relates to intensive treatment of newborns.)

| 39
Table 12. Indicator showing the proportion of expenditures per deceased to expenditures per survivor, ECFIN data
Belgium Czech Republic Denmark Spain Italy Netherlands Austria Poland EU average Age
group M* F* M F M F M F M F M F M F M F M F
0-4 12.1 20.1 34.5 43.5 4.5 4.0 3.4 3.4 68.0 79.5 31.7 79.1 27.0 39.1 25.7 39.7 25.9 38.5 5-9 33.3 33.0 55.3 48.2 77.4 58.4 6.4 6.9 79.5 163.0 39.6 60.0 104.8 153.0 47.0 50.3 55.4 71.6 10-14 27.7 9.5 74.0 42.5 8.7 14.5 6.9 6.3 73.1 101.4 26.9 43.3 121.6 120.4 40.7 49.3 47.4 48.4 15-19 10.7 21.1 31.0 26.2 1.1 1.3 4.1 7.0 38.7 46.7 21.6 24.7 64.7 69.1 29.5 37.3 25.2 29.2 20-14 8.9 11.7 17.1 26.2 0.3 0.3 3.3 7.1 26.0 32.5 47.4 33.2 41.7 87.3 23.0 26.1 21.0 28.0 25-29 9.4 13.1 19.1 28.7 12.0 12.1 3.9 5.9 29.0 25.5 38.0 10.4 57.7 41.3 27.4 24.5 24.6 20.2 30-34 13.6 11.4 23.1 32.0 11.4 12.7 3.2 6.2 30.4 28.4 25.3 18.9 48.1 33.4 21.2 25.6 22.0 21.1 35-39 14.3 11.7 20.2 25.7 7.1 6.0 2.8 4.6 40.5 37.2 26.7 23.5 42.9 29.6 18.3 23.0 21.6 20.2 40-44 12.4 13.8 19.2 20.4 6.3 5.9 2.6 3.2 35.3 40.7 17.0 18.1 34.6 33.9 13.6 20.5 17.6 19.6 45-49 11.0 14.3 16.8 17.1 8.2 7.2 2.3 2.8 30.9 31.5 15.1 17.2 31.4 28.0 11.1 15.1 15.9 16.6 50-54 10.1 12.1 11.0 13.6 7.5 7.0 2.3 2.6 21.1 26.9 14.2 15.5 21.4 25.7 8.9 12.3 12.1 14.5 55-59 9.5 10.4 8.1 10.7 7.5 6.8 2.2 2.4 17.1 23.7 8.8 12.9 18.9 22.0 7.8 10.9 10.0 12.5 60-64 7.4 9.6 7.2 10.0 6.2 6.0 2.0 2.3 12.1 16.8 8.3 12.4 16.3 20.6 6.6 9.3 8.3 10.9 65-69 5.5 6.8 5.4 6.8 5.0 5.0 1.8 2.1 8.5 11.9 6.4 8.3 13.2 15.0 5.6 7.4 6.4 7.9 70-74 4.5 5.0 4.3 5.1 4.4 4.3 1.7 1.8 6.2 8.2 5.1 6.4 11.6 11.0 4.5 5.6 5.3 5.9 75-79 3.3 3.5 3.5 3.7 2.8 2.9 1.6 1.6 4.5 5.4 4.1 4.6 8.9 8.9 3.9 4.4 4.1 4.4 80-84 2.8 2.5 2.8 2.9 2.0 2.1 1.3 1.3 3.3 3.8 3.4 3.1 8.0 7.1 3.3 3.7 3.4 3.3 85-89 2.1 1.8 2.3 2.2 1.7 1.7 1.3 1.3 2.5 2.6 3.0 2.5 7.3 6.5 3.0 3.3 2.9 2.7 90-94 1.7 1.4 2.3 2.2 1.4 1.4 1.3 1.3 1.7 1.7 2.5 2.0 7.3 6.5 2.9 2.8 2.6 2.4 95-99 1.4 1.1 2.3 2.2 1.6 1.8 1.3 1.3 1.7 1.7 2.0 1.7 7.3 6.5 3.0 2.6 2.6 2.4 100+ 0.7 0.9 2.3 2.2 1.6 1.8 1.3 1.3 1.7 1.7 2.0 1.7 7.3 6.5 3.0 2.6 2.5 2.3 Source: European Commission (2006) – ECFIN calculations based on country sources. * M - males, F - females

40 | GOLINOWSKA, KOCOT & SOWA
Results of public health expenditure projection, including the analysis of increased expenditures in the last year of life – case of Hungary and Poland Due to limited availability of adequate data, the scenario of health expenditures adjusted for death-related costs is conducted only for Hungary and Poland. Methodology referred to above and in Annex 1 was prepared for Poland, and further applied to Hungarian data. Minor differences between the two estimations include different age groups (5-year cohorts for Poland and 10-year cohorts for Hungary), and the base year for calculations (2004 for Poland and 2002 for Hungary.) In the case of Hungary, estimations are based on total health expenditures, while in the case of Poland they are based on insurance expenditures.
Population split into two groups - the deceased and the survivors - does not affect projected revenues, but only impacts projected expenditures and, as a result, the size of financial deficit.
In both countries, together with the introduction of diversified level of average per capita expenditures depending on individual status (deceased or survivor), projected expenditure increase is slowed down and, as a result, projected financial deficit in the health care system is reduced.
Table 13. Projected public expenditures on health and the deficit with/without death-related costs
2010 2015 2020 2025 2030 2035 2040 2045 2050 POLAND Total public health expenditures – A (PLN mln)
56 654 76 414 100 683 129 842 162 756 196 793 228 340 255 028 275 730
Total public health expenditures – B (PLN mln)
56 131 75 211 98 500 126 199 157 216 189 222 218 565 242 699 260 821
Reduction in projected health expenditures (%) 0.92 1.57 2.17 2.81 3.40 3.85 4.28 4.83 5.41
Deficit – A (PLN mln) 3 015 6 470 10 255 15 890 27 159 38 336 46 848 50 777 49 777
Deficit – B (PLN mln) 2 493 5 267 8 072 12 246 21 619 30 764 37 072 38 448 34 869 Reduction in projected deficit (%) 17.34 18.59 21.29 22.93 20.40 19.75 20.87 24.28 29.95
HUNGARY Total public health expenditures – A (HUF bln)
1 800 2 585 3 551 4 721 6 100 7 686 9 451 11 313 13 242
Total public health expenditures – B (HUF bln)
1 780 2 538 3 457 4 551 5 851 7 295 8 896 10 545 12 153
Reduction in projected health expenditures (%) 1.14 1.82 2.64 3.60 4.07 5.09 5.88 6.79 8.23
Deficit – A (HUF bln) 518 686 906 1 456 2 159 3 040 4 100 5 297 6 642 Deficit – B (HUF bln) 498 639 812 1 286 1 911 2 649 3 545 4 530 5 553 Reduction in projected deficit (%) 3.96 6.85 10.35 11.67 11.51 12.87 13.54 14.49 16.40
Source: WPIX-country reports (Hungary and Poland). A – baseline scenario B – death-related costs scenario

HEALTH EXPENDITURE SCENARIOS IN THE NEW MEMBER STATES: COMPARATIVE REPORT | 41
Table 12 presents total projected public expenditures on health in Poland and in Hungary, according to the assumptions. When differences in average per capita expenditures for the survivors and the deceased are taken into account, projected health expenditures in Poland decrease by 0.92% (in comparison to the baseline scenario), and in Hungary by 1.14% already in 2010. The gap between baseline scenario and death-related costs scenario broadens in years, amounting to 5.41% for Poland and 8.23% for Hungary at the end of projection period. A decrease in estimated level of expenditures is reflected in the decrease in estimated deficit. In Poland, deficit reduction amounts to 17% in 2010, and almost 30% in 2050. In Hungary, deficit reduction is not that impressive, but quite substantial still – close to 4% in 2010, and over 16% in 2050. Less extensive deficit reduction in Hungary is a result of the size of the deficit – already in the year 2025 it amounts to 30% of total projected health expenditures, and in 2050 it is equivalent to 50.2%. In Poland, projected financial balance looks a bit better since the peak of the deficit falls for 2040 and amounts to 21% of total public expenditures on health care.
Figure 29. Projected deficit in Hungary and in Poland, as GDP percentage
0,00%
0,50%
1,00%
1,50%
2,00%
2,50%
3,00%
3,50%
4,00%
2005 2010 2015 2020 2025 2030 2035 2040 2045 2050
Poland-baseline scenario Poland-with death-related costs
Hungary-baseline scenario Hungary-with death-related costs
Source: WPIX-country reports (Hungary and Poland).
The gap in deficit size with and without the assumption regarding death-related costs is quite significant and widens during projection period for both countries, notwithstanding the differences in the size of the deficit between the two countries (measured as percentage of GDP,) By the end of projection period, projected deficit reduction (scenario ‘including’ death-related costs compared to the scenario ‘excluding’ death-related costs) equals 29.95% for Poland and 16.4% for Hungary.
Overall, these results confirm the findings presented in other publications (some of them quoted above), and indicate that when we take increased health expenditures in the last year of life into account, it has significant impact on projection results and decreases projected level of expenditures.

42 | GOLINOWSKA, KOCOT & SOWA
5.3 Diverse longevity scenarios Scenarios allowing for different longevity development patterns were prepared for each country. There are three possibilities with regard to the improvement of life expectancy in the model applied: fast, medium and slow. In the baseline scenario, the medium one was adopted, and the two residuals were considered as alternative scenarios.
Table 14. Projection results for the scenarios of different life expectancy improvement: slow, medium (baseline scenario), and fast (as a share of GDP)
LE –slow growth LE – medium growth (baseline scenario) LE – fast growth
2005 2025 2050 2005 2025 2050 2005 2025 2050 BULGARIA Health expenditures (% of GDP) 5.0 6.4 7.0 5.0 6.4 7.1 5.0 6.4 7.2
Health revenues (% of GDP) 4.6 7.0 6.0 4.6 7.0 6.1 4.6 7.1 6.1
Surplus/deficit (% of GDP) -0.5 0.6 -1.0 -0.5 0.6 -1.0 -0.5 0.6 -1.0
ESTONIA Health expenditures (% of GDP) 4.0 4.9 6.7 4.0 5.0 6.7 4.0 5.0 6.8
Health revenues (% of GDP) 4.2 4.0 3.3 4.2 4.1 3.3 4.2 4.1 3.4
Surplus/deficit (% of GDP) 0.2 -0.9 -3.3 0.2 -0.9 -3.4 0.2 -0.9 -3.4
HUNGARY Health expenditures (% of GDP)
5.5 5.9 6.7 5.5 5.9 6.7 5.5 5.9 6.8
Health revenues (% of GDP)
4.0 4.1 3.4 4.0 4.1 3.4 4.0 4.1 3.4
Surplus/deficit (% of GDP)
-1.5 -1.8 -3.3 -1.5 -1.8 -3.4 -1.5 -1.8 -3.5
POLAND Health expenditures (% of GDP)
4.63 5.84 6.92 4.63 5.88 7.08 4.63 5.92 7.25
Health revenues (% of GDP)
4.45 5.13 5.71 4.45 5.16 5.80 4.45 5.19 5.91
Surplus/deficit (% of GDP)
-0.18 -0.71 -1.21 -0.18 -0.72 -1.28 -0.18 -0.73 -1.35
SLOVAKIA Health expenditures (% of GDP)
4.83 5.57 6.78 4.83 5.59 6.85 4.83 5.61 6.95
Health revenues (% of GDP)
6.33 5.55 4.46 6.33 5.56 4.50 6.33 5.57 4.51
Surplus/deficit (% of GDP)
1.50 -0.02 -2.32 1.50 -0.03 -2.35 1.50 -0.04 -2.44
Source: AHEAD WPIX country reports.

HEALTH EXPENDITURE SCENARIOS IN THE NEW MEMBER STATES: COMPARATIVE REPORT | 43
There are no significant differences between the results from various scenarios. In general, faster life expectancy improvement can lead to deeper deficit, but the extent of that effect is rather insignificant (no differences in the deficit in Bulgaria, 0.1 percentage points in Hungary and 0.07 percentage points in Poland.) Faster increase in LE affects both sides of health care funding, expenditures as well as revenues. On the one hand, there are more elderly individuals to take care of due to the unique pattern of mortality and morbidity among the elderly, but on the other, increased LE has positive influence on employment rate, most likely. Overall, the expenditures grow faster than the revenues, so the deficit is higher. Slower life expectancy improvement has the opposite effect.
5.4 Diversified wage growth scenario The main source of revenues for social and health insurance system is the pay-roll tax or insurance contributions. Therefore, wage development has significant influence on the revenue side of health care sector financing. In the baseline scenario it was assumed that wage growth is a derivative of assumed labour productivity, which variable is subjected to convergence strategy.13 In alternative scenarios it was assumed, additionally, that these variables (productivity and wages) will vary in plus and in minus from the baseline scenario. In the case of higher dynamics of real wages growth (in Bulgaria, 0.6 percentage points higher in 2025 and the same value in 2050, 1.5 percentage points higher in Slovakia, and in Hungary 3% higher over the whole period) during projection period, health care sector deficit will be lower by at least 1 percentage point of GDP share Although higher average wage growth has impact on the health expenditure increase, by expanding labour costs, this effect is smaller than the effect of revenue increase. Hence, the impact on health sector financial balance is positive.
Slower wage growth scenario (in Bulgaria, 0.6 percentage points lower in 2025 and 1 percentage point in 2050, in Hungary 0.5% from 2007) yields the opposite result – higher deficit compared to the baseline scenario, and twice as high in comparison to the high wage growth scenario.
Table 15. Scenarios of different wage development patterns (revenues, expenditures and deficit as a share of GDP)
2005 2010 2015 2020 2025 2030 2035 2040 2045 2050
BULGARIA
Revenues 4.3 5.0 7.1 7.6 8.3 7.7 7.8 5.9 9.0 7.3
Expenditures 4.7 4.8 6.5 6.9 7.2 6.9 7.3 5.8 9.3 7.9
Fast
er w
age
grow
th
Surplus/deficit -0.4 0.2 0.6 0.7 1.1 0.8 0.5 0.1 -0.3 -0.6
Revenues 4.6 5.6 6.2 6.5 7.0 7.0 6.9 6.7 6.4 6.1
Expenditures 5.0 5.4 5.4 6.1 6.4 6.6 6.8 7.0 7.1 7.1
Bas
elin
e sc
enar
io
Surplus/deficit -0.5 0.1 0.4 0.4 0.6 0.4 0.0 -0.3 -0.7 -1.0
13 In the baseline scenarios of convergence strategy prepared in the national plans and AWG report (EPC and European Commission 2006), it was assumed that welfare in NMS will be close to an average EU level in the final part of projection period, which means that labor productivity rate should be three times as high in the following years, and twice as high at the end of the first part of projection period (up to 2025.)

44 | GOLINOWSKA, KOCOT & SOWA
Revenues 4.7 4.7 6.5 5.0 6.6 5.9 5.4 5.8 5.3 5.1
Expenditures 5.2 4.6 6.3 4.9 6.3 5.9 5.7 6.5 6.3 6.4
Slow
er w
age
grow
th
Surplus/deficit -0.5 0 0.2 0.1 0.3 0 -0.3 -0.7 -1 -1.3
HUNGARY
Revenues 4.0 3.9 4.2 4.4 4.4 4.3 4.2 4.2 4.2 4.1
Expenditures 5.5 5.5 5.6 5.7 5.9 6.0 6.2 6.4 6.5 6.7
Fast
er w
age
gr
owth
Surplus/deficit -1.5 -1.6 -1.4 -1.3 -1.6 -1.8 -2.0 -2.2 -2.4 -2.5
Revenues 4.0 3.9 4.1 4.3 4.1 3.9 3.8 3.6 3.5 3.4
Expenditures 5.5 5.5 5.6 5.8 5.9 6.1 6.2 6.4 6.6 6.7
Bas
elin
e sc
enar
io
Surplus/deficit -1.5 -1.6 -1.5 -1.5 -1.8 -2.2 -2.5 -2.8 -3.1 -3.4
Revenues 4.0 3.9 4.1 4.1 3.9 3.6 3.4 3.2 3.1 2.9
Expenditures 5.5 5.5 5.6 5.8 6.0 6.1 6.3 6.5 6.7 6.8
Slow
er w
age
grow
th
Surplus/deficit -1.5 -1.6 -1.6 -1.7 -2.1 -2.5 -2.9 -3.3 -3.6 -3.9
SLOVAKIA
Revenues 6.33 6.40 5.99 5.86 5.87 5.93 5.95 5.85 5.69 5.54
Expenditures 4.83 4.98 5.15 5.35 5.59 5.84 6.10 6.36 6.61 6.85
Fast
er w
age
grow
th
Surplus/deficit 1.50 1.42 0.84 0.51 0.28 0.09 -0.15 -0.51 -0.92 -1.31
Revenues 6.33 6.40 5.98 5.75 5.56 5.41 5.25 5.00 4.73 4.50
Expenditures 4.83 4.98 5.15 5.35 5.59 5.84 6.10 6.36 6.61 6.85
Bas
elin
e sc
enar
io
Surplus/deficit 1.50 1.42 0.83 0.40 -0.03 -0.43 -0.86 -1.36 -1.87 -2.35
Revenues 6.33 6.40 5.97 5.66 5.32 5.03 4.75 4.42 4.10 3.84
Expenditures 4.83 4.98 5.15 5.35 5.59 5.84 6.10 6.36 6.61 6.85
Slow
er w
age
grow
th
Surplus/deficit 1.50 1.42 0.82 0.31 -0.27 -0.82 -1.35 -1.94 -2.50 -3.01
Source: Country reports of Bulgaria, Hungary and Slovakia.
5.5 Labour market indicators diversified development scenario Different values of indicators pertaining to the labour market (employment and unemployment rate) do impact projection results, but the scale of the change is smaller than in the case of wage growth. In the Hungarian report, the following conclusion is even drawn to the point: „ Hungarian health care system could not expect an improvement of its currently expected financial problems solely from increasing employment rates” (Gabos, Gal, WPIX Country report – Hungary, 2007).

HEALTH EXPENDITURE SCENARIOS IN THE NEW MEMBER STATES: COMPARATIVE REPORT | 45
By the same token, employment rate diversification in projections made for Poland and Slovakia exerts only slight influence on financial balance of health sector, and none at all on health care expenditures (Golinowska, Kocot, Sowa: Country Report – Poland, 2006; Kvetan, Palenik, Mlynek, Radvansky: Country Report – Slovak Republic, 2006).
Table 16. Scenarios of different activity rate development (expenditures, revenues and deficit as GDP share)
2005 2010 2015 2020 2025 2030 2035 2040 2045 2050
HUNGARY
Revenues 4.1 4.1 4.4 4.6 4.5 4.3 4.2 4.1 4.0 4.0
Expenditures 5.5 5.5 5.6 5.8 6.0 6.1 6.3 6.4 6.6 6.8
Fast
er a
ctiv
ity
rate
gro
wth
Surplus/deficit -1.4 -1.4 -1.2 -1.2 -1.5 -1.8 -2.1 -2.3 -2.6 -2.8
Revenues 4.0 3.9 4.1 4.3 4.1 3.9 3.8 3.6 3.5 3.4
Expenditures 5.5 5.5 5.6 5.8 5.9 6.1 6.2 6.4 6.6 6.7
Bas
elin
e sc
enar
io
Surplus/deficit -1.5 -1.6 -1.5 -1.5 -1.8 -2.2 -2.5 -2.8 -3.1 -3.4
Revenues 4.0 3.8 3.8 3.9 3.7 3.5 3.4 3.3 3.2 3.1
Expenditures 5.5 5.5 5.6 5.7 5.9 6.0 6.2 6.4 6.5 6.7
Slow
er a
ctiv
ity
rate
gro
wth
Surplus/deficit -1.5 -1.7 -1.7 -1.9 -2.2 -2.5 -2.8 -3.1 -3.3 -3.6
Source: Country report from Hungary.
Table 17. Scenarios of different employment rate development (expenditures, revenues and deficit as GDP share)
2005 2010 2015 2020 2025 2030 2035 2040 2045 2050
POLAND
Revenues 4.45 4.73 4.85 5.04 5.24 5.28 5.36 5.48 5.65 5.88
Expenditures 4.63 4.92 5.22 5.53 5.88 6.24 6.56 6.80 6.96 7.08
Fast
er
empl
oym
ent r
ate
gr
owth
Surplus/deficit -0.18 -0.20 -0.37 -0.48 -0.64 -0.96 -1.20 -1.32 -1.31 -1.20
Revenues 4.45 4.66 4.77 4.96 5.16 5.20 5.28 5.40 5.57 5.80
Expenditures 4.63 4.92 5.22 5.53 5.88 6.24 6.56 6.80 6.96 7.08
Bas
elin
e sc
enar
io
Surplus/deficit -0.18 -0.26 -0.44 -0.56 -0.72 -1.04 -1.28 -1.39 -1.39 -1.28
Revenues 4.45 4.63 4.70 4.88 5.08 5.12 5.21 5.33 5.50 5.73
Expenditures 4.63 4.92 5.22 5.53 5.88 6.24 6.56 6.80 6.96 7.08
Slow
er
empl
oym
ent
rate
gro
wth
Surplus/deficit -0.18 -0.30 -0.52 -0.64 -0.80 -1.12 -1.36 -1.47 -1.46 -1.35

46 | GOLINOWSKA, KOCOT & SOWA
SLOVAKIA
Revenues 6.33 6.38 5.93 5.74 5.70 5.54 5.37 5.11 4.83 4.59
Expenditures 4.83 4.98 5.15 5.35 5.59 5.84 6.10 6.36 6.61 6.85
Fast
er
empl
oym
ent
rate
gro
wth
Surplus/deficit 1.50 1.40 0.78 0.38 0.11 -0.30 -0.73 -1.25 -1.78 -2.27
Revenues 6.33 6.40 5.98 5.75 5.56 5.41 5.25 5.00 4.73 4.50
Expenditures 4.83 4.98 5.15 5.35 5.59 5.84 6.10 6.36 6.61 6.85
Bas
elin
e sc
enar
io
Surplus/deficit 1.50 1.42 0.83 0.40 -0.03 -0.43 -0.86 -1.36 -1.87 -2.35
Revenues 6.33 6.43 5.96 5.59 5.38 5.24 5.09 4.85 4.61 4.40
Expenditures 4.83 4.98 5.15 5.35 5.59 5.84 6.10 6.36 6.61 6.85
Slow
er e
mpl
oym
ent
rate
gro
wth
Surplus/deficit 1.50 1.45 0.82 0.23 -0.21 -0.60 -1.02 -1.50 -2.00 -2.46
Source: Country reports from Poland and Slovakia.
Table 18. Scenarios of different labour force participation and employment rate development (expenditures, revenues and deficit as GDP share)
2005 2010 2015 2020 2025 2030 2035 2040 2045 2050
ESTONIA
Revenues 4.4 4.4 4.4 4.3 4.3 4.2 4.1 3.9 3.8 3.6
Expenditures 4.0 4.3 4.5 4.7 4.9 5.3 5.6 6.0 6.3 6.7
Fast
er la
bor
forc
e pa
rtic
ipat
ion
and
empl
oym
ent r
ate
gr
owth
Surplus/deficit 0.4 0.1 -0.1 -0.4 -0.7 -1.1 -1.6 -2.0 -2.6 -3.1
Revenues 4.2 4.2 4.2 4.1 4.1 4.0 3.8 3.7 3.5 3.3
Expenditures 4.0 4.3 4.5 4.7 5.0 5.3 5.6 6.0 6.3 6.7
Bas
elin
e sc
enar
io
Surplus/deficit 0.2 0.0 -0.3 -0.6 -0.9 -1.3 -1.8 -2.3 -2.8 -3.4
Revenues 4.3 4.3 4.2 4.1 4.0 3.9 3.8 3.7 3.5 3.3
Expenditures 4.0 4.3 4.5 4.7 5.0 5.3 5.6 6.0 6.4 6.7
Slow
er la
bor
forc
e pa
rtic
ipat
ion
and
empl
oym
ent r
ate
gr
owth
Surplus/deficit 0.3 0.0 -0.3 -0.6 -1.0 -1.4 -1.8 -2.3 -2.9 -3.4
Source: Estonian data.

HEALTH EXPENDITURE SCENARIOS IN THE NEW MEMBER STATES: COMPARATIVE REPORT | 47
The Bulgarian team have prepared projection variant with the assumption of diversified unemployment rate. Results presented in Table 17 do not corroborate the impact of this variable on health care sector finances. It seems that unemployment rate indicator is not sufficient to illustrate problems connected with the labour market in the context of health care sector budget projection.
Table 19. Scenarios of different unemployment rate (expenditures, revenues and deficit as GDP share)
2005 2010 2015 2020 2025 2030 2035 2040 2045 2050
BULGARIA
Revenues 5.0 8.0 6.4 6.2 7.1 7.9 6.2 5.8 6.3 6.0
Expenditures 5.5 7.9 6.1 5.9 6.5 7.5 6.2 6.1 7.0 7.0
Diff
eren
t un
empl
oym
ent
rate
gro
wth
*
Surplus/deficit -0.5 0.1 0.3 0.3 0.6 0.4 0 -0.3 -0.7 -1.0
Revenues 4.6 5.6 6.2 6.5 7.0 7.0 6.9 6.7 6.4 6.1
Expenditures 5.0 5.4 5.4 6.1 6.4 6.6 6.8 7.0 7.1 7.1
Bas
elin
e sc
enar
io
Surplus/deficit -0.5 0.1 0.4 0.4 0.6 0.4 0.0 -0.3 -0.7 -1.0 * Changes in the minimum unemployment rate: 14% (for the base year, instead of 7% in the baseline scenario); 7% (in 2025, instead of 5% in the baseline scenario); 4% (in 2050 the value is the same as in the baseline scenario)
Source: Bulgaria country report.
5.6 Sensitivity analysis For the purpose of sensitivity analysis of projection results, a new indicator was established – the relative change of revenues that takes place in consequence of the changes in the parameters under analysis. The analyzed year is 2050, the last year of projection period. The indicator has got a percentage value. The following sensitivity scale was adopted:
• insensitivity: up to 10%;
• moderate sensitivity: 10% - 40%;
• sensitivity: above 40%.
In sensitivity analysis, relative change in parameter value was not taken into account - it was recognized simply as a probable for the analyzed country. Death-costs scenario is of different nature than the other scenarios, in that the revenue (expenditures, deficit/surplus) change is the result of a new variable used rather than a change of the variable used previously.

48 | GOLINOWSKA, KOCOT & SOWA
Table 20. Revenue side sensitivity
Country Bulgaria Estonia Hungary Poland Slovakia
Sensitivity degree Scenario in
sens
itiv
e m
oder
ate
sens
itive
in
sens
itiv
e m
oder
ate
sens
itive
in
sens
itiv
e m
oder
ate
sens
itive
in
sens
itiv
e m
oder
ate
sens
itive
in
sens
itiv
e m
oder
ate
sens
itive
Death-related costs scenario - - X X -
Fast X X X X X LE improvement Slow X X X X X
Faster X - X - X Wage growth
Slower X - X - X Faster - X X X X - Employment
rate growth* Slower - X X X X Unemployment rate decline Slower X - - - -
‘-‘ indicates that no such scenario was prepared * activity rate for Hungary, activity and employment rate for Estonia Source: Own calculations based on country reports.
Table 21. Expenditure side sensitivity
Country Bulgaria Estonia Hungary Poland Slovakia
Sensitivity degree Scenario in
sens
itiv
e m
oder
ate
sens
itive
in
sens
itiv
e m
oder
ate
sens
itive
in
sens
itiv
e m
oder
ate
sens
itive
in
sens
itiv
e m
oder
ate
sens
itive
in
sens
itiv
e m
oder
ate
sens
itive
Death-related costs scenario - - X X -
Fast X X X X X LE improvement Slow X X X X X
Faster X - X - X Wage growth
Slower X - X - X Faster - X X X X - Employment
rate growth* Slower - X X X X Unemployment rate decline Slower X - - - -
‘-‘ indicates that no such scenario was prepared * activity rate for Hungary, activity and employment rate for Estonia Source: Own calculations based on country reports.

HEALTH EXPENDITURE SCENARIOS IN THE NEW MEMBER STATES: COMPARATIVE REPORT | 49
Table 22. Deficit/surpluse sensitivity
Country Bulgaria Estonia Hungary Poland Slovakia
Sensitivity degree Scenario in
sens
itiv
e m
oder
ate
sens
itive
in
sens
itiv
e m
oder
ate
sens
itive
in
sens
itiv
e m
oder
ate
sens
itive
in
sens
itiv
e m
oder
ate
sens
itive
in
sens
itiv
e m
oder
ate
sens
itive
Death-related costs scenario - - X X -
Fast X X X X X LE improvement Slow X X X X X
Faster X - X - X Wage growth
Slower X - X - X Faster - X X X X - Employment
rate growth* Slower - X X X X Unemployment rate decline Slower X - - - -
‘-‘ indicates that no such scenario was prepared * activity rate for Hungary, activity and employment rate for Estonia Source: Own calculations based on country reports.
The main conclusion is that health revenues, expenditures and deficit/surplus are slightly sensitive to variable changes in general. There are only two cases of real sensitivity - in the scenario of faster wage growth in Hungary and Slovakia.
The consideration of higher health expenditures in the last year of life has no impact on the revenue side and a slight impact on expenditures, but it strongly affects the deficit in health care sector.
In the case of different life expectancy scenarios, both the revenues, the expenditures, and the deficit are insensitive, even to the point of 0% value.
As was mentioned earlier, a stronger impact can be observed for changes in wage growth rate, especially on the revenue side.
Projection results are not sensitive to the changes in labour market variables, except for the impact of higher activity rate in Hungary on the revenue side and, consequently, on the deficit as well.
6. Conclusions, discussion and policy recommendations Health care sector balance projection based on the ILO social budget model shows basic trends in the development of future revenues and expenditures shaped by the impact of the so-called external factors, i.e. those that do not belong to the domain of health care system: demography and economy, as well as current medical service utilization pattern depending on age (J curve.) The variables pertaining to population ageing are especially important for the results of the analysis. These factors include: increasing share of the elderly in the population, decreasing share of labour market active population, and – as a result – decreasing labour supply and changing trends in labour productivity. The impact of those factors was also reflected in adopted scenarios of future economic growth development. Projected revenues, expenditures and public health care sector balance are presented in relation to economic growth.

50 | GOLINOWSKA, KOCOT & SOWA
The results of health care sector financial projections enable us to analyze simultaneously (at the same time) the two sides of public health care sector: revenues, expenditures and financial balance (surplus/deficit) with interactions between sides, as well as impact on balance effect. That is the advantage of ILO social budget model. As a result, conclusions and recommendations can be well-targeted, depending on the element of the health care sector that each of the variables addresses.
If labour market activity rate strongly affects health care sector revenues, decreasing the deficit in public health care sector, recommendations address labour market policy and economy. This policy includes high economic growth, taxable income and employment.
If, on the other hand, longevity has strong impact on increasing expenditures, the policy is targeted towards expenditure decrease, which is a less effective policy. Rational demographic policy, required to shape health care system expenditures, should create incentives towards changing values and behaviours in the life-cycle related to procreation and health. One must add that there is a correlation between longer economic activity and health of the population. Only healthy and more active population can stay active on the labour market for the longer period, which will lead to the increase in expenditures on health, especially public health.
Health care sector model also takes into account expenditures on health modified by higher costs incurred in the last year of life. Restricted access to data was an obstacle to the process of preparing similar projections in all the countries under analysis. Projections for Hungary and Poland, however, confirm that death-related cost is a significant factor. Longevity leads to an “extension in time” of higher health care costs incurred in the last year of life. In consequence, aggregated health expenditures in a given projection period are lower. Death-related costs scenario substantially decreases estimated financial deficit in health care system, in comparison to the baseline scenario. Still, the impact of death-related costs on expenditures is restricted since it is contingent upon potential future longevity developments. These are not infinite.
In the table below, key results of analyses and projections are compiled, together with generalized relationships and tendencies. Direction of these changes is similar in the analyzed group of countries. These countries, with higher dynamics of demographic changes and, at the same time, lower level of economic development, may face greater tensions, or even conflicts, between future development objectives.
From social and political perspective, decisions regarding health care financing are particularly sensitive due to higher health needs. Changes are also necessary due to the high costs of the health care system – costs incurred and potential costs related to the ageing. Finally, one of the most crucial cost drivers in the health sector – new medical technology – was not isolated and accounted for in the analysis.
Table 23. Summary – factors that affect health care sector budget in projection exercise Sides of the budget
Variables Channel trough which budget side is affected
Impact on projection results - evidence
Demographic: population size, TFR and longevity
Population size and age structure determine the number of persons who can potentially contribute to public health care budget
Positive impact for variants of improved demographic development: especially TFR and healthy longevity, negative - for population decline and dynamic aging. Longevity quantitative, not qualitative.
Revenues
Labour market development: participation rate
Higher employment rate increases the number of tax payers (contributors)
Significant positive effect strengthened by the increase of wages in Slovakia, moderate

HEALTH EXPENDITURE SCENARIOS IN THE NEW MEMBER STATES: COMPARATIVE REPORT | 51
and employment rate
to health budget positive effect in Hungary
Economic development: wages
Wages are the main source of taxable income
Positive effect, proven for Hungary, Slovakia and Bulgaria
Utilization pattern Promotion of investments in health; approval for increased health payments
Assumption - not modelled
Demographic: longevity and age structure
Increased aging and longevity extend the time spent with poorer health status
Positive effect: higher for Bulgaria, moderate for Hungary
Death related costs Morbidity picture of the elderly tends to sharply increase the expenditures at an older age, but the costs are substantially higher only in the last year of life, so the ratio between the deceased and the survivors declines with age
Slower increase; 1 percentage point of GDP (Poland) and 0.7 percentage points of GDP (Hungary)
Labour market development: employment and unemployment
Unemployment leads to poorer health status and more frequent utilization of health services
No evidence
Economic development: wages, labour productivity and GDP
Income elasticity of demand for health rather neutral at an aggregate level; wage increase entails higher labour cost in the health sector as well
Moderate influence
Expenditures
Utilization pattern Changes in line with ageing and wage increase when income elasticity is greater than 1
Assumption
Demographics: population size, age structure, longevity
Strengthens the effect on both sides: decrease in revenues and increase in expenditures
Higher deficit
Death related costs On the expenditure side Deficit is modified – smaller than in the baseline scenario
Labour market development: employment
On the revenue side Smaller deficit – moderate effect
Financial balance
Economic development: wages and labour productivity
Interactions between sides: increase in revenues higher than a decrease in expenditures
Smaller budget deficit – moderate effect (Hungary), stronger effect (Bulgaria)
Source: Own comparison based country reports.

52 | GOLINOWSKA, KOCOT & SOWA
The ILO social budget model not only lends itself to the projection of future financial balance (in this case, a deficit at the end of the projection period), but it also allows for the calculation of insurance premium (tax) needed to balance health care system revenues and expenditures.
Table 24. Comparison: insurance premium required to balance public health care sector revenues and expenditures
Country Base year 2025 2050
Bulgaria n/a n/a n/a
Estonia 12.4% 15.8% 25.8%
Hungary 17% 21% 28%
Poland 8.6% 10.7% 11.7%
Slovakia 9.4% 12.7% 21.5%
Source: AHEAD WPIX.
Health care system reforms are required in order to balance the disequilibrium of revenues and expenditures caused by external factors (demographic and economic), and decrease the premium needed to cover expenditures. Such reforms should lead, on the one hand, to the rationing of medical services covered by public resources, and on the other, to more effective governance and management of the sector and within the sector.
Finally, it should be added that the ageing process affects other types of expenditures, i.e. those outside of health care sector. In the CEE, one issue is financing income benefits (pensions), which is not discussed here, and another issue is the need to increase the level of LTC financing. Up to date, this type of care was most commonly provided within the family rather than within the framework of institutionalized social protection. In Poland, for example, it has also been provided by religious organizations and, albeit only lately, by commercial (private) long-term care institutions. Access to this type of services is restricted, and long-term diseases related to old age are becoming one of the most urgent social issues. Overall, the hypothesis that new social problems will arise, the demand for social care will increase, and new financing mechanisms will be needed in the face of ageing, has been confirmed. The other reasons include rapid economic development and modernization processes in the NMS. Thus, rationalization of health care expenditures becomes a necessity, as well as building the space for new taxes and – if socially accepted – increased private financing.

| 53
Literature
Ahn N., Garcia J.R., Herce J.A. (2005), Demographic Uncertainty and Health Care Expenditure in Spain, Paper prepared for the DEMWEL project, FEDEA
Antolin P., Oxley H., Suyker W. (2001), How will ageing affect Finland?, OECD Economics Department Working Papers No.295
Ariste R., Carr J. (2003), New Considerations on the Empirical Analysis of Health Expenditures in Canada: 1966-1998, Health Policy Research Working Paper Series, WP 02-06, Policy Research Communication Unit, Canada
Batljan I., Lagergren M. (2004), Inpatient/outpatient health care costs and remaining years of life – effect of decreasing mortality on future acute health care demand, Social Science and Medicine 59, pp.2459-2466
Brockmann H. (2002), Why is less money spent on health care for the elderly than for the rest of the population? Health care rationing in German hospitals, Social Science & Medicine 55, pp.593-608
Busse R., Krauth C., Schwartz F.W. (2002), Use of acute hospital beds does not increase as the population ages: results from a seven year cohort study in Germany, Journal of Epidemiology and Community Health 56, pp.289-293
Carrin G., Ron A. (1993), Towards a framework for health insurance in Viet Nam, WHO, Geneva
Christiansen T., Bech M., Lauridsen J., Nielsen P. (2006), Demographic changes and aggregate health care expenditure in Europe, paper for AHEAD project, WP VI
Cichon M., Newbrander W., Yamabana H., Weber A., Normand Ch., Dror D., Preker A. (1999), Modelling in health care finance. A compendium of quantitative techniques for health care financing, International Labour Office, Geneva
Clemente J., Marcuello C., Montanes A., Pueyo F. (2004), On the international stability of health care expenditure functions : Are government and private functions similar ?, Journal of Health Economics 23, pp.589-613
Cutler D.M., Sheiner L. (1998), Demographics and Medical Care Spending: standard and non-standard effects, Burch Working Paper No.B98-3, University of California, Berkeley, USA
Denton F.T., Gafni A., Spencer B.G. (2001), Exploring the effects of population change on the costs of physician services, Journal of Health Economics 21, s.781-803
Dixon T., Shaw M., Frankel S., Ebrahim S. (2004), Hospital Admissions, age and death: retrospective cohort study, British Medical Journal 328, pp.1288-1291
Dreger Ch., Reimenrs H-E. (2005), Health Care Expenditures in OECD Countries: A Panel Unit Root and Cointegration Analysis, The Institute for the Study of Labour Discussion Paper No.1469, Bonn
Drygas, W. (2005), Usprawnienie wczesnej diagnostyki i czynnej opieki nad osobami z ryzykiem rozwoju niedokrwiennej choroby serca, (Improvements in early diagnostics and active care over myocardial ischemia risk patients), In: P. Goryński, B. Wojtyniak K. Kuszewski (ed.) Monitoring oczekiwanych efektów realizacji Narodowego Programu Zdrowia 1996 – 2005. Suplement (Monitoring of expected outcome of 1996 – 2005 National Health Plan) , Ministerstwo Zdrowia i Państwowy Zaklad Higieny (Ministry of Health and National Institute of Hygiene), Warszawa

54 | GOLINOWSKA, KOCOT & SOWA
Eberstadt N. (2005), Health and Demography: The Achilles’ Heel of Post – Socialist development in Europe, presentation on the conference “Advancing Economic Growth: Investing in Health”, Chatham House, June 22-23, London
EPC and European Commission (2006), The impact of ageing on public expenditure: projections for the EU25 Member States on pensions, health care, long-term care, education and unemployment transfers (2004-2050), Report No 1/2006
Fogel R.W. (1999), Catching Up with the Economy, The American Economic Review 89(1), pp.1-21
Fuchs V.R. (1998), Provide, provide: the economics of aging, Working Paper 6642, National Bureau of Economic Research, Cambridge, USA
Gabos A., Gal R.I. (2006), Development of Scenarios for Health Expenditure in the Accession Economies. Country report - Hungary, AHEAD WPIX
Gabriele S., Cislaghi C., Constantini F., Innocenti F., Lepore V., Raitano M., Tediosi M., Valerio M., Zocchetti C. (2005), Demographic factors and health expenditure profiles by age : the case of Italy, XVII Conferenza Societa Italiana di Economia Pubblica paper, Universita di Pavia
Gerdtham U.G., Sögaard J., MacFarlan M., Oxley H. (1998), The determinants of health expenditure in the OECD countries, w: Zweifel P. (red.), Health, the Medical Profession and Regulation, Kluver, pp.113-134
Gertler P., van der Gaag (1990), The willingness to pay for medical care, Johns Hopkins Press, Baltimore
Getzen T. (1990), Macro forecasting of national health expenditures, Advances in health economics and health services research 11, pp.27-48
Getzen T., Poullier J.P. (1992), International health spending forecasts: Concepts and evaluation, Social Science and Medicine 34(9), 1057-1068
Getzen T.E. (2000), Health care is an individual necessity and a national luxury: applying multilevel decision models to the analysis of health care expenditures, Journal of Health Economics 19, pp.259-270
Getzen T.E. (2000a), Forecasting Health Expenditures: Short, Medium and Long (Long) Term, Journal of Health Care Finance, 26(3), 56-72
Golinowska S., Kocot E., Sowa A. (2006), Development of Scenarios for Health Expenditure in the Accession Economies. Country report - Poland, AHEAD WPIX
Golinowska S., Sowa A., Topór-Mądry R. (2006), Health Status and Health Care Systems in Central and Eastern European Countries: Bulgaria, Estonia, Poland, Slovakia and Hungary, http://shop.ceps.be/BooksList.php?category_id=17&
Golinowska S., Sowada Ch., Wozniak M. (2007), Sources of inefficiency and financial deficits in Poland’s health care system, WHO memo
Gornick M., McMillan A., Lubitz J.A. (1993), A longitudinal perspective on patterns of Medicare payments, Health Affairs (Millwood) 12(2), pp.140-150
Hoover D.R., Crystal S., Kumar R., Sanbamoorthi U., Cantor J.C. (2002), Medical Expenditures during the Last Year of Life: Findings from the 1992-1996 Medicare Current Beneficiary Survey, Health Services Research 37 (6), pp.1625-1642

HEALTH EXPENDITURE SCENARIOS IN THE NEW MEMBER STATES: COMPARATIVE REPORT | 55
Kildemoes H.W., Christiansen T., Gyrd-Hansen D., Kristiansen I.S., Andersen M. (2006), The impact of population ageing on future Danish drug expenditure, Health Policy 75, 298-311
Kildemoes H.W., Christiansen T., Gyrd-Hansen D., Kristiansen I.S., Andersen M. (2006), The impact of population ageing on future Danish drug expenditure, Health Policy 75, pp.298-311
Kramer A.M. (1995), Health Care for Elderly Persons – Myths and Realities, New England Journal of Medicine 332 (15), pp.1027-1029
Kvetan V., Palenik V., Mlynek M., Radvansky M. (2006), Health Expenditure Scenarios in Slovakia. Country Report – Slovak Republic, AHEAD WPIX
Kwiatkowski E. (2002), Bezrobocie. Podstawy teoretyczne (Unemployment. Theoretical premises), Wydawnictwo Naukowe PWN, Warszawa
Lee R., Miller T. (2002), An Approach to Forecasting Health Expenditures, with Application to the U.S. Medicare System, Health Services Research 37(5), 1365-1386
Lubitz J., Prihoda R. (1984), The use and costs of Medicare services in the last 2 years of life, Health Care Financing Review 5, pp.117-131
Lubitz J.D., Riley G.F. (1993), Trends in Medicare payments in the last year of life, New England Journal of Medicine 328, pp.1092-1096
Madsen J., Serup-Hansen N., Kragstrup J., Kristiansen I.S. (2002), Ageing may have limited impact on future costs of primary health providers, Scandinavian Journal of Primary Care 20, pp.169-173
Mahal A., Berman P. (2001), Health Expenditures and the Elderly: A Survey of Issues in Forecasting, Methods Used and Relevance for Developing Countries, Research Paper No.01.23, Harvard Burden of Disease Unit, Cambridge
Mayhew L. (2000), Health and Elderly Care Expenditure in an Aging World, International Institute for Applied Systems Analysis, Austria
McGrail K., Green B., Barer M.L., Evans R.G., Hertzman C. (2000), Age, costs of acute and long-term care and proximity to death: evidence for 1987-88 and 1994-95 in British Columbia, Age and Ageing 29, pp.249-253
Murthy N., Ukpolo V. (1994), Aggregate health care expenditure in the United States: evidence from cointegration tests, Applied Economics 26, pp.797-802
National Health Insurance Agency for Wage Earners (2003), Des Tendances de Fond aux Mouvements de Court Terme, Point de conjoncture No 15
Newhouse J.P. (1977), Medical care expenditure: a cross-national survey. Journal of Human Resources 12, 115-125
OECD (2006), Projecting OECD health and long-term expenditures: what are the main drivers?, ECO/WKP(2006)5, OECD
Okólski, M. (2004), Demografia zmiany społecznej (Social change demographics), Wydawnictwo Naukowe Scholar, Warszawa
Okunade A.A., Murthy V.N.R. (2002), Technology as a “major driver” of health care costs: a cointegration analysis of the Newhouse conjecture, Journal of Health Economics 21(1), pp.147-159

56 | GOLINOWSKA, KOCOT & SOWA
Polder J.J., Achterberg P.W. (2004), Cost of illness in the Netherlands, RIVM Report No.270751006, The National Institute for Public Health and the Environment, Bilthoven, Holandia
Raitano M. (2006), The impact of Death-Related Costs on Health-Care Expenditure: A Survey, ENEPRI Research Report No.17, AHEAD WP7
Rangelova R., Sariiski G. (2006), Development of Scenarios for Health Expenditure in the Accession Economies. Country report for Bulgaria, AHEAD WPIX
Scholz W., Cichon M., Hagemejer K. (2000), Social budgeting, International Labour Office, Geneva
Serup-Hansen J., Wickstrom J., Kristiansen I.S. (2002), Future health care costs – do health care costs during the last year of life matter?, Health Policy 62, pp.161-172
Seshamani M., Gray A. (2004), Time to death and health expenditure: an improved model for the impact of demographic change on health care costs, Age and Ageing 33 (6), pp.556-561
The World Bank (2007), From red to gray. The “Third Transition” of Ageing Populations in Eastern Europe and the Former Soviet Union, (authors: M.Chawla, G.Betcherman, A.Banerji), Washington D.C.
Warshawsky M. (1994), Projections of health care expenditures as a share of GDP: Actuarial and macroeconomic approaches, Health Services Research 29, 293-313
Warshawsky M.(1999), An enhanced macroeconomic approach to long-range projections of health care and social security expenditures as a share of GDP, Journal of Policy Modeling 21(4), 413-426
Zatonski W. A., Willert W. (2005), Changes in dietary fat and declining coronary heart disease in Poland: population based study, BMJ Volume 331
Zweifel P., Felder S., Meiers M. (1999), Ageing of population and health care expenditure: a red herring?, Health Economics nr 8, pp.485-496

| 57
Annex 1. Methodology for death related costs estimation (in Hungary and Poland)
1. Estimation based on National Health Fund data on average expenditures per capita (per deceased and survivor, broken down according to gender and 5-year age cohorts) for medical services for which appropriate data is available:
lpa
lpal
paNTEAE
2004,,
2004,,2004,, =
where: { }dsl ,∈ , status of an individual: s – survivor, d – deceased
{ }20,..,1∈a , 5-years age cohort
{ }fmp ,∈ , sex: m – male, f - female
l
paAE 2004,, – average per capita expenditures for an individual of l status, age cohort a and sex p in the year 2004
l
paTE 2004,, – total expenditures for l status, age cohort a and sex p (according to National Health Fund data in the year 2004)
lpaN 2004,, – number of individuals with l status (deceased in the given year or survivors)
in age cohort a and sex p in the year 2004 (according to the demographic projection used in the ILO model.)
2. Estimation of k-indicator, broken down according to gender and age:
spa
dpa
paAEAEk
2004,,
2004,,, =
K-indicator describes the ratio between average expenditures for given medical services per deceased in the base year and average expenditures per survivor. The value of the indicator is constant during the projection period and specified according to the sex and age cohort.
3. Estimation based on National Health Fund data, pertaining to annual insurance expenditures for given medical services. As the National Health Fund data includes the data with an undefined status of a person (without information on sex and/or age), it was necessary to divide these expenditures using the k-indicator between groups, in order to receive expenditures coherent with National Health Data. These estimations, covering year 2004, are further applied to the 2003 National Health Data assuming constancy of the k-indicator and unchanged proportions of expenditures between genders and age cohorts. Average expenditures per capita for a person with s (survivor) and d (deceased) status were calculated as:
α⋅+α−=
kAE
AE paspa )1(
2003,,2003,,

58 | GOLINOWSKA, KOCOT & SOWA
spapa
dpa AEkAE 2003,,,2003,, ⋅=
where: α − probability of death depending on sex and age cohort in a given year,
2003,, paAE – average per capita expenditures depending on sex and age, calculated based on National Health Data expenditures, applying sex and age structure from National Health Fund data
4. Calculation of average per capita expenditures depending on sex, age and status for the year n and assuming growth of expenditures in line with GDP per capita.
)1(1,,,, ns
npas
npa rAEAE +⋅= −
)1(1,,,, nd
npad
npa rAEAE +⋅= −
where: n – following year of projection
rn – GDP per capita growth rate in year n
5. Calculation of total expenditures in year n:
snfa
a
snfa
snma
a
snma
sn NAENAETE ,,
20
1,,,,
20
1,, ⋅+⋅= ∑∑
==
dnfa
a
dnfa
dnma
a
dnma
dn NAENAETE ,,
20
1,,,,
20
1,, ⋅+⋅= ∑∑
==
dn
snn TETETE +=
where: dn
sn TETE , – total expenditures in year n for survivors (s) and deceased (d)
nTE – total expenditures in year n
6. Due to lack of adequate data on pharmaceutical expenditures, additional indicator defining the ratio between average pharmaceutical expenditures per deceased and average pharmaceutical expenditures per survivor is used. It is assumed that the value of this indicator equals the value of the indicator for other types of medical services. As a result, total expenditures are summed up with expenditures on pharmaceuticals, divided by sex, age cohort and status.
7. In view of the capitation system in primary care services financing, National Health Fund expenditures on primary care are divided proportionally between the insured, and added to total expenditures.

About AHEAD
n February 2004, a CEPS-led consortium of research institutes launched the implementation of a three-year project called AHEAD (Ageing, Health Status and the determinants of Health Expenditure). Most of the consortium’s 18 partner institutes are members of the European
Network of Economic Policy Research Institutes (ENEPRI – see http://www.enepri.org for details). As specified in the call for proposals, the main task of the project is to carry out an “Investigation into different key factors driving health care expenditures and in particular their interaction with particular reference to ageing” in the (enlarged) European Union.
The strategic objectives of AHEAD are to: assess pressures on health spending in the existing EU and in selected candidate countries,
looking both at those arising directly from ageing and at those affected by changing incomes, social change and methods of expenditure control;
develop models for projecting future health spending and estimate confidence limits for these projections.
Expenditure on medical treatment has tended to rise as a proportion of national income throughout the European Union. A particular concern is that an ageing population and therefore the presence of more old people will create further pressures for expenditure on health care. This issue is of concern both in its own terms and because of its fiscal implications. Rising health expenditures put pressure on the targets of the Stability and Growth Pact. They also raise the question whether budgetary targets should be tightened ahead of projected growth in public expenditures, so as to ‘save up’ for future spending and keep expected future tax rates reasonably constant.
This project has aimed to refine existing estimates of the links between reported states of health and use of medical services. As well as looking at the effects of ageing on health care, the research has taken account of the link between health expenditure and fertility rates and the demands on health services made by non-native populations. Particular attention is paid to the costs of care near death. One study examined factors other than demand (such as methods of financial control) that may influence health spending. An important aspect of this research is that the work is carried out so as to be able to provide not only the familiar projections and scenarios but also standard deviations and confidence limits for predictions of key variables, such as healthy life expectancy and demand-driven expenditure levels. These will allow policy-makers to judge not only possible outcomes but also the risks surrounding them and to assess their implications.
Participating Research Institutes Centre for European Policy Studies, CEPS, Belgium National Institute for Economic and Social Research, NIESR, UK Netherlands Bureau for Economic Policy Research, CPB, The Netherlands Deutsches Institut für Wirtschahftsforschung, DIW, Germany Economic and Social Research Institute, ESRI, Ireland Research Institute of the Finnish Economy, ETLA, Finland Federal Planning Bureau, FPB, Belgium Istituto di Studi e Analisi Economica, ISAE, Italy Institute for Advanced Studies, HIS, Austria Institute for Public Health, IPH, Denmark Laboratoire d’Economie et de Gestion des Organisations de Santé, LEGOS, France Personal Social Services Research Unit, PSSRU, UK Fundación de Estudios de Economía Aplicada, FEDEA, Spain Centre for Social and Economic Research, CASE, Poland Institute of Slovak and World Economy, ISWE, Slovak Republic Institute of Economics at the Bulgarian Academy of Sciences, IE-BAS, BG Social Research Centre, TARKI, Hungary Department of Public Health, University of Tartu, Estonia
I

About ENEPRI he European Network of Economic Policy Research Institutes (ENEPRI) is composed of leading socio-economic research institutes in practically all EU member states and candidate countries that are committed to working together to develop and consolidate a European agenda of research.
ENEPRI was launched in 2000 by the Brussels-based Centre for European Policy Studies (CEPS), which provides overall coordination for the initiative.
While the European construction has made gigantic steps forward in the recent past, the European dimension of research seems to have been overlooked. The provision of economic analysis at the European level, however, is a fundamental prerequisite to the successful understanding of the achievements and challenges that lie ahead. ENEPRI aims to fill this gap by pooling the research efforts of its different member institutes in their respective areas of specialisation and to encourage an explicit European-wide approach.
ENEPRI is composed of the following member institutes:
CASE Center for Social and Economic Research, Warsaw, Poland CEE Center for Economics and Econometrics, Bogazici University, Istanbul, Turkey CEPII Centre d’Études Prospectives et d’Informations Internationales, Paris, France CEPS Centre for European Policy Studies, Brussels, Belgium CERGE-EI Centre for Economic Research and Graduated Education, Charles University, Prague,
Czech Republic CPB Netherlands Bureau for Economic Policy Analysis, The Hague, The Netherlands DIW Deutsches Institut für Wirtschaftsforschung, Berlin, Germany ESRI Economic and Social Research Institute, Dublin, Ireland ETLA Research Institute for the Finnish Economy, Helsinki, Finland FEDEA Fundación de Estudios de Economía Aplicada, Madrid, Spain FPB Federal Planning Bureau, Brussels, Belgium IE-BAS Institute of Economics, Bulgarian Academy of Sciences, Sofia, Bulgaria IER Institute for Economic Research, Bratislava, Slovakia IER Institute for Economic Research, Ljubljana, Slovenia IHS Institute for Advanced Studies, Vienna, Austria ISAE Istituto di Studi e Analisi Economica, Rome, Italy NIER National Institute of Economic Research, Stockholm, Sweden NIESR National Institute of Economic and Social Research, London, UK NOBE Niezalezny Osrodek Bana Ekonomicznych, Lodz, Poland PRAXIS Center for Policy Studies, Tallinn, Estonia RCEP Romanian Centre for Economic Policies, Bucharest, Romania SSB Research Department, Statistics Norway, Oslo, Norway SFI Danish National Institute of Social Research, Copenhagen, Denmark TÁRKI Social Research Centre Inc., Budapest, Hungary ENEPRI publications include three series: Research Reports, which consist of papers presenting the findings and conclusions of research undertaken in the context of ENEPRI research projects; Working Papers, which constitute dissemination to a wider public of research undertaken and already published by ENEPRI partner institutes on their own account; and thirdly, Occasional Papers (closed series) containing a synthesis of the research presented at workshops organised during the first years of the network’s existence.
European Network of Economic Policy Research Institutes c/o Centre for European Policy Studies
Place du Congrès 1 ▪ 1000 Brussels ▪ Tel: 32(0) 229.39.11 ▪ Fax: 32(0) 219.41.51 Website: http//:www.enepri.org ▪ E-mail: [email protected]
T
Copyright © 2022 FDOKUMEN