Expenditure Reforms Commission - National Institute of Educational ...
266
Government of Karnataka Expenditure Reforms Commission Second Report (For Official Use Only) February 2011 Bangalore CHAIRMAN Shri B.K Bhattacharya, Retired Chief Secretary, Government of Karnataka MEMBERS Shri Mohandas Pai, Director (Human Resources), Infosys, Bangalore Shri G. Ramesh, Associate Professor, Centre for Public Policy, IIM Bangalore Principal Secretary to Government, Finance Department Principal Secretary to Government, Planning Department
-
Upload
khangminh22 -
Category
Documents
-
view
0 -
download
0
Transcript of Expenditure Reforms Commission - National Institute of Educational ...

Government of Karnataka
Expenditure Reforms Commission
Second Report (For Official Use Only)
February 2011 Bangalore
CHAIRMAN Shri B.K Bhattacharya, Retired Chief Secretary, Government of Karnataka
MEMBERS Shri Mohandas Pai, Director (Human Resources), Infosys, Bangalore
Shri G. Ramesh, Associate Professor, Centre for Public Policy, IIM Bangalore
Principal Secretary to Government, Finance Department
Principal Secretary to Government, Planning Department

MSIL House, 9th Floor, No. 36, Cunningham Road, Bangalore – 560 052.
Phone – 2234 2888
Expenditure Reforms Commission
No. ERC/BLR-REPT/2/2009-10 17th February 2011
Dear Shri. Nagarajan,
I have great pleasure in forwarding to you the Second Report of the Expenditure Reforms
Commission, constituted by the Government of Karnataka in Government Notification No. F.D 76
Sa.Ma.Ya 2009 dated 6.6.2009.
The recommendations in this Report cover certain general issues, viz. the balance required
between controlled public debt on the one hand and enhanced public expenditure for growth and
welfare on the other, re-prioritisation of Government expenditure in favour of rural healthcare,
nutrition, elementary education, water supply and sanitation, rigorous pre-investment appraisal of
high cost projects; and tools and systems for effective legislative and executive control over
expenditure. Specific recommendations have also been made in respect of the twelve Government
Departments (listed at page-1) that were studied individually in this second phase. The reports
prepared by the Research Institutions/ Consulting organisations engaged by the ERC to study the
schemes etc., of the individual Departments will be forwarded to you shortly.
I would like, in particular, to draw your attention to the following extract from the preface to
the Report:
a) The Reports submitted by the ERC, as well as the Study reports prepared by the
Research / Consultant Institutions which are being forwarded separately to the
Government, may be brought into the public domain so that there could be enlightened
discussions about Public expenditure priorities, the efficacy of expenditure, and
monitoring of the outcome of Government Programmes.
b) A Cell may be set up in the Finance Department to follow-up the recommendations of
the ERC. The Cell may be wound up after 2 years or as soon as follow-up action is
completed, whichever is earlier.

MSIL House, 9th Floor, No. 36, Cunningham Road, Bangalore – 560 052.
Phone – 2234 2888
You may like to obtain an early decision of the State Government on these suggestions
regarding follow-up action on this report.
I take this opportunity to convey to you my sincere thanks for your active participation in the
deliberations of the Commission, your contribution to the formulation of the Commission’s
recommendations and for ensuring Finance Department’s unstinted help and co-operation thereby
facilitating the smooth functioning of the Commission.
Yours Sincerely,
B.K. Bhattacharya
Chairman
Shri L.V. Nagarajan,
Principal Secretary to Government,
Finance Department,
Vidhana Soudha,
Bangalore.

Conte n ts
Page
Nos.
Preface by Chairman a - j
Summary of Recommendations i - xx
Chapter 1 Introduction 1 - 4
Chapter 2 Review of Public Expenditure 5 - 15
Chapter 3 Pre-Investment Project Appraisal 16 - 24
Chapter 4 Legislative Control over Expenditure 25 - 33
Chapter 5 Executive Control over Expenditure 34 - 39
Chapter 6 Primary and Secondary Education 40 - 46
Chapter 7 Employment and Training 47 - 50
Chapter 8 Higher Education 51 - 60
Chapter 9 Agriculture 61- 74
Chapter 10 Horticulture 75 - 78
Chapter 11 Fisheries 79 - 83
Chapter 12 Animal Husbandry and Veterinary Sciences 84 - 87
Chapter 13 Co-operation and Agricultural Marketing 88 - 92
Chapter 14 Social Welfare 93 - 97
Chapter 15 Minorities Welfare 98 -103
Chapter 16 Women and Child Development 104 -126
Chapter 17 Health and Family Welfare and Medical Education 127 -136
Annexures 138 -221
a
P R E F A C E
„Last, but not the least, we have the principle of
the balanced budget or, rather, since debt has to
be reduced, the principle that Robert Lowe, one
of the Chancellors of the Exchequer of the
Gladstonian era, embodied in his definition of a
Minister of Finance : An animal that ought to
have a surplus‟. [Joseph Schumpeter, History of Economic Analysis. page 404-405
“I expect to see the State which is in a position
to calculate the marginal efficiency of capital
goods on long views and on the basis of the
general social advantage, taking an ever
greater responsibility for directly organising
investment”. [John Maynard Keynes, “The General Theory of Employment Interest
and Money, Page 164]
The recognition of evident injustice in
preventable deprivation, such as widespread
hunger, unnecessary morbidity, premature
mortality, grinding poverty, neglect of female
children, subjugation of women, and phenomena
of that kind does not have to await the
derivation of some complete ordering over
choices that involve finer differences and puny
infelicities. [Amartya Sen ‘Development as Freedom’ Page 254]

b
1. Over the Centuries, debates in Public Finance (or Public Economics as it is now
called) have centred around critical issues such as:
i. The respective roles of the State and the Market in the promotion of
public welfare.
ii. The desired size of Government or optimum ratio of Government
Expenditure: GDP.
iii. Appropriate composition of Government expenditure.
iv. Measures to ensure efficiency in expenditure.
v. Ideal strategies for raising revenue to meet desired levels of Government
Expenditure.
vi. Debt Sustainability (Public Debt and Inflation, sustainable size of Debt,
measures to reduce Government Deficit and Debt).
vii. Feasibility of arriving at democratic social choice on these public policy
issues, on the basis of individual preferences (an issue debated in Public
choice theory).
viii. Institutional Mechanism required to safeguard against irrational
decisions that could lead to fiscal imbalances for Democratic
Governments.
ix. Appropriate location of Fiscal Decision Making Power (at Federal, State
or Local Government level), and related issues in Fiscal Federalism.
2. Kautilya‟s Arthashastra, believed to have been written in the third century B.C, lays
down several basic principles of taxation: “taxing power is limited; taxation should not be felt
to be heavy or exclusive” (selective); “tax increases should be graduated” In the course of
discussing Departments of the Government, Kautilya refers to Defence, Internal security,
Irrigation, Roads, etc. The importance of public Finance to the successful reign of the
monarch is underscored by the following advice to the monarch” “All undertakings depend
on Finance. Hence, foremost attention must be paid to the treasury”. 1
1[ M.H Gopal's Mauryan Public Finance, quoted in the article “Kautilya‟s Arthashastra : A
Neglected precursor to classical Economics” published in the Indian Economic Review, Vol.
Xxx1, No.1, 1996, written by Charles Waldaner, et al].

c
3. In the 17th Century, when the European rulers were frequently engaged in intensive
war and were perpetually in need of tapping new sources of revenue, administrators and
economists of the time initiated serious discussion about the pros and cons of various forms
of Taxation including Progressive Income Tax, Commodity Taxes and Wealth Tax. The first
systematic discussion of all aspects of Public finance, Taxation, Public Expenditure, Debt is
found, however, in Book V [“Of the Revenue of the Sovereign or Commonwealth"] of Adam
Smith's 'Wealth of Nations' (1776).
4. Adam Smith classified Public Expenditure under three categories: Defence,
Administration of Justice and “Expenses of Public Works and Public Institutions” (which
include Roads, Bridges, Canals as well as Institutions for the Education of youth).
5. England in the 17th and 18th Centuries believed in minimum Government
intervention in economic matters, and in a balanced budget (or rather, a surplus Budget that
would provide for Debt redemption). Later, the Liberal Government that came to power in
1908 implemented a Reform Agenda, i.e. old age pension, German Style Health Insurance,
experimental unemployment Insurance, etc., marking a break with the laissez-faire policy of
the earlier period 2.
6. The theoretical underpinning for large increases in Government‟s investment
Expenditure was provided by Keynes in his “General Theory”, in the aftermath of the Great
Depression of the „30s when the developed countries underwent contraction in national
income, falling prices and asset values, and an unemployment rate as high as 25 percent in
some countries (e.g. USA).
7. After the Great Depression, a series of emerging issues such as:(a) the demand on
resources for financing the Second World War,(b) the need for Post-War reconstruction, and
(c) the pressure to increase Social Security expenditure to take care of the sick, the
unemployed and the elderly, led to an irrevocable increase in government expenditure.
Today, in the U.K., U.S.A and the developed countries of Europe, Government expenditure
as a percentage of GDP (which was around 10 percent before the First World War) ranges
between 30 to 50 percent.
2 [ Peter Clarke „Keynes‟ page 36]

d
8. In most countries, since such a high level of public expenditure could not be met from
government revenues for extended periods of time, this has inevitably led to higher public
Debt, triggering discussions about burden of debt, sustainability of debt, Government Debt
crowding out private investment, its long term adverse impact on growth and employment,
etc.
9. From the 1950‟s onwards, economists have been trying to find a logical basis for
decision making by Government as an economic agent. This led to the Public Choice theory,
developed by Duncan Black, Anthony Downs, James Buchanan and others. There are several
variants of this theory: The Median Voter Theory (Duncan Black, Downs) which suggests
that politicians try to get re-elected by placating the median voter through government
expenditure policy; the hypothesis that politicians and bureaucrats try to maximise their
power and influence through big departments and big budgets; and the view propounded by
Buchanan (following Swedish economists Wicksell and Lindahl) that optimum economic
policy will be arrived at through unanimity.
10. Based on theories such as these, attempts have been made during the last two decades
in different parts of the world to bring in statutory provisions for balancing the budget,
putting a ceiling on government deficit, and capping government expenditure.
11. The Fiscal Responsibility Act 2002 passed by Karnataka was the first of its kind in
India providing for reducing the Revenue Deficit to Zero and the Fiscal Deficit to 3 percent
within a given time frame. The Law also envisages formulation of a Medium Term Fiscal
Plan (MTFP) which shall include an assessment of sustainability relating to the balance
between revenue receipts and expenditure; and the use of capital receipts including
borrowings for generating productive assets. The MTFP is required to be placed before the
Legislature along with the Budget every year.
12. However, such legislations relating to capping of government deficit / mandating a
balanced budget, etc., may be effective to a significant extent only at the sub national level, as
the Federal Government has the power to make the release of Central clearances & benefits
(e.g. Central Grants and Incentives, permission for floating of Bonds) conditional to
adherence with the provisions of the Act. This would not work at the federal level where, in
the absence of penal provisions, it is possible for Central Government to resort to escape
clauses such as 'unforeseen situations' or 'economic depression', etc., to avoid the rigours of

e
any legislation (other than a constitutional provision) aimed at curbing government
expenditure/deficit.
13. Over the last 10 years, Governments in the U.S.A, U.K, E U Countries, New Zealand,
Australia, Canada, and others have set up various Committees and Commissions to take up,
inter alia, rationalising of government expenditure and reduction of deficits. Apart from
suggesting cutting down of transfer payments, subsidies, and so on, many of these countries
have tried to look at the efficiency of Government expenditure, and have adopted measures to
optimise returns from Public expenditure on Government schemes and Projects. While
Sweden has attempted legislative control by institutionalising a binding three year
expenditure ceiling, Canada has taken steps towards institutional changes by introducing an
Expenditure Control Act. Spain has set up a Fiscal and Financial Policy Council. Other
institutional measures adopted by some of the industrialised countries for Expenditure
reforms include Medium Term Financial strategies and Multi-Annual monetary and
budgetary targets for Fiscal Stability.
14. Despite such Institutional arrangements, these countries could not withstand the
adverse consequences of the recent global financial crisis. The Industrialised countries are
still searching for a way out of the crisis that could bring about an increase in effective
demand and promote GDP growth and employment, without at the same time leading these
economies into Debt traps. There has, however, been hardly any unanimity among the voters
or the legislators either in U.S.A, U.K, Greece or any other European Countries as to either
the timing of withdrawing fiscal stimulus, possibility of increasing tax rates or the desired
quantum of reduction in Government expenditure. If Government expenditure has to be
reduced, which sectors should bear the brunt of the cut, whether it could be Medicare or
Educational subsidy or Unemployment Insurance? Questions are also being raised about
Pork-barrel expenditure or earmarked budget for congressmen in U.S.A. (Incidentally, this
last item is comparable to India‟s MPLAD schemes and MLAs‟ schemes). The debate is still
on. In India also the fiscal authorities have to strive hard to maintain the right balance
among the various policies that would contribute to the competing objectives of growth,
Social Justice and controlling inflationary pressure.
15. During this period from 2003-04 to 2008-09 despite large inflow of Foreign Direct
Investment to Bangalore which is now internationally recognised as a hub of I.T Industry, the

f
average rate of growth of GSDP in Karnataka (8.1% ) has been just marginally above the All-
India figure of 7.8% In fact, the growth rate in Karnataka‟s GSDP has been below the rate of
growth of GSDP in the States of Bihar (9.8%), Gujarat (11.19%) Haryana (9.28%), Kerala
(8.73%), Maharashtra (8.70%), Uttaranchal (9.15%) etc. 3
16. Moreover, while other states like Uttar Pradesh, Rajasthan, Orissa and Madhya
Pradesh have improved their rankings in Human Development Index between 1991 and 2001,
Karnataka has not shown any such improvement in its HDI ranking, inspite of its substantial
expenditure on Social Sector. 4
17. In his budget speech for the year 2009-10, the Chief Minister announced that there is
a need to review the expenditure incurred on government programmes, to reduce expenditure
on less productive programmes and to utilise such consolidated resources to increase the
efficiency of implementation of the more productive programmes. Following this
announcement, the Government of Karnataka, vide Order No FD 76 Sa.Ma.Ya 2009 dated
6.6.2009, constituted the Expenditure Reforms Commission (ERC) with the mandate inter
alia to review the efficiency of schemes of major departments and make recommendations for
their restructuring and convergence to facilitate improvement in their development
effectiveness. The ERC, while working on the issues included in these terms of reference,
has borne in mind relevant developments in Public Economics theory and policy over the last
decades as also recent happenings in various parts of the world (including India).
18. The First Report of the ERC submitted to the Government in February 2010 contained
suggestions for prudent management of over-all expenditure of the Government as well as
specific recommendations regarding the schemes of a few selected Departments. This was
based on Studies conducted by Research Institutions / Consultants engaged by the
Commission to interact with the Departments concerned and look into the objectives and
effectiveness of the schemes administered by them.
19. With this second Report, issues pertaining to most of the Social Sectors and
Departments dealing with Agriculture and related areas have been covered by the
Commission. Study Reports regarding Infrastructure and some other sectors like Rural
3 Real Growth Rates of States (GSDP% at Constant Prices as on 26.04.2010), http://planningcommission.nic.in/
dated 10.01.2011 4NHDR – Planning Commission 2001.

g
Development, Forest & Environment, etc., are expected soon. These Departments will be
covered in the next reports.
Separate reports will be submitted on other issues included in the Terms of Reference,
viz. User Charges, Subsidies, Institutional Mechanism for Service Delivery and Performance
Monitoring.
20. Apart from suggesting changes with regard to the structure, coverage and
implementation strategies of certain schemes of the Departments mentioned, the Commission
has also suggested that, in order to ensure that Karnataka‟s rate of growth of GSDP and
increase in Human Development Index remains consistently above the national average, the
rate of growth of public expenditure, especially expenditure on physical and social
infrastructure has to remain above the rate of growth of GSDP; that expenditure on schemes
should be incurred after conducting detailed Social Benefit-Cost analysis; and that
appropriate Institutional mechanism should be put in place (in the form of a separate Division
in FD / Independent Agency) to undertake both such Pre-Investment Appraisal as well as
Post-Implementation evaluation.
21. The Commission would also like to place the following two suggestions before the
Government:
a) The Reports submitted by the ERC, as well as the Study reports prepared by the
Research / Consultant Institutions which are being forwarded separately to the
Government, may be brought into the public domain so that there could be
enlightened discussions about Public expenditure priorities, the efficacy of
expenditure, and monitoring of the outcome of Government Programmes.
b) A Cell may be set up in the Finance Department to follow-up the recommendations of
the ERC. The Cell may be wound up after 2 years or as soon as follow-up action is
completed, whichever is earlier.
22. Recently, the Government of U.K has set up an independent Office for Budget
Responsibility (OBR) to provide independent Budget Forecasts regarding Revenue, Public

h
Expenditure, Public Debt, etc.5 The Government of Karnataka may seriously consider setting
up of such an independent body with a similar mandate. This may be examined in the light
of the recommendations of the 13th Finance Commission regarding the setting up of a
committee for annual independent and public review of compliance with the Karnataka Fiscal
Responsibility Act.
23. The role of Public Expenditure in promoting growth, reducing inequality, generating
employment and optimizing the economic welfare of the citizens has undergone a dramatic
change after the introduction of liberalized economic policies in the early „90s. At the
national level, the ratio of Public : Private investment has come down from (approx) 50 : 50
during the 1960‟s to about 25 : 75 now.
24. However, Government policies on subjects such as taxation, expenditure, Debt
management, Sectoral promotion policies, etc., have an effect on investment and other
decisions of private economic agents, which in turn impact on the rate of growth of the
economy, on Human Development indicators and on the level of general welfare. It is
desirable that, closely following the MTFP (but before the entire Budget is voted) a detailed
analytical report is prepared as well by the Government on the likely impact of Government‟s
policies and programmes [including Budget initiatives] on the over-all economy and placed
before the Legislature.
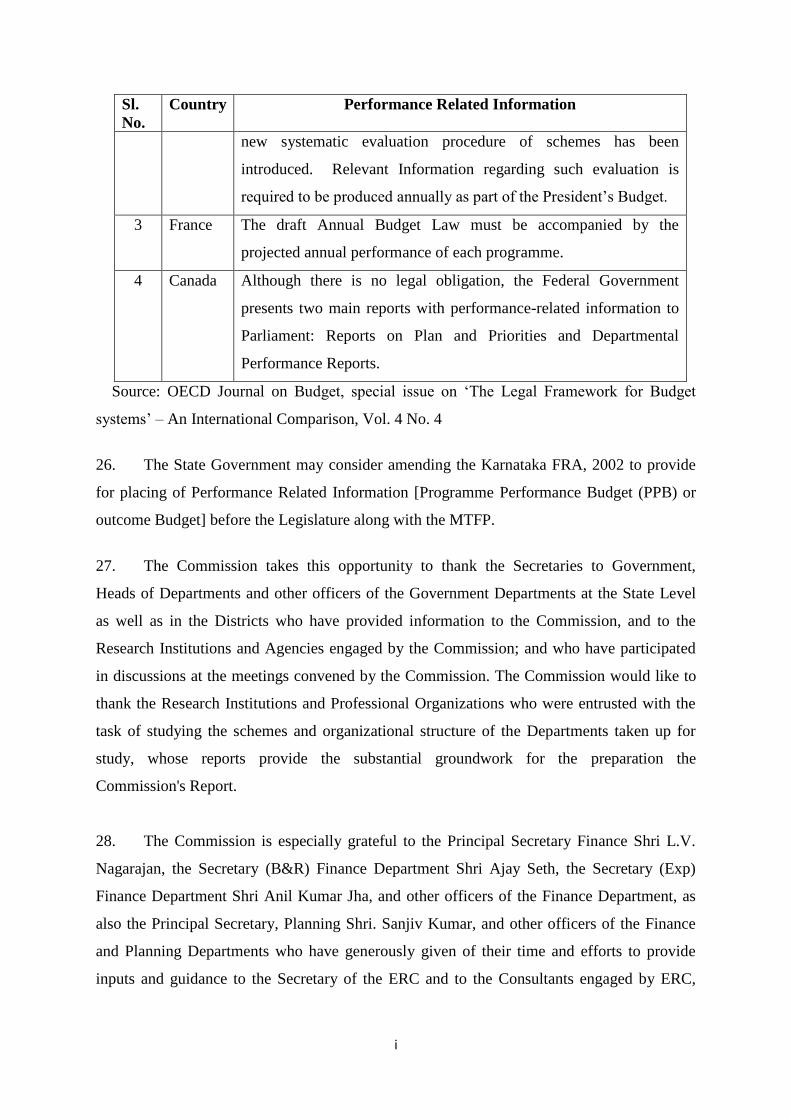
25. The following table shows the legal provisions and established practices regarding the
provision of Performance Related Information along with Budget Documents in a few
countries:
Sl.
No.
Country Performance Related Information
1 Spain General Budget Act (GBA) 2003 requires the Government to
incorporate performance related information into the Budget
documents.
2 U.S A The Government Performance and Results Act (GPRA) 1993
requires agencies to produce strategic plans, Annual Performance
Plans and Annual Programme Performance Reports. From 2004 a
5 [The Wall Street Journal June 15, 2010].
i
Sl.
No.
Country Performance Related Information
new systematic evaluation procedure of schemes has been
introduced. Relevant Information regarding such evaluation is
required to be produced annually as part of the President‟s Budget.
3 France The draft Annual Budget Law must be accompanied by the
projected annual performance of each programme.
4 Canada Although there is no legal obligation, the Federal Government
presents two main reports with performance-related information to
Parliament: Reports on Plan and Priorities and Departmental
Performance Reports.
Source: OECD Journal on Budget, special issue on „The Legal Framework for Budget
systems‟ – An International Comparison, Vol. 4 No. 4
26. The State Government may consider amending the Karnataka FRA, 2002 to provide
for placing of Performance Related Information [Programme Performance Budget (PPB) or
outcome Budget] before the Legislature along with the MTFP.
27. The Commission takes this opportunity to thank the Secretaries to Government,
Heads of Departments and other officers of the Government Departments at the State Level
as well as in the Districts who have provided information to the Commission, and to the
Research Institutions and Agencies engaged by the Commission; and who have participated
in discussions at the meetings convened by the Commission. The Commission would like to
thank the Research Institutions and Professional Organizations who were entrusted with the
task of studying the schemes and organizational structure of the Departments taken up for
study, whose reports provide the substantial groundwork for the preparation the
Commission's Report.
28. The Commission is especially grateful to the Principal Secretary Finance Shri L.V.
Nagarajan, the Secretary (B&R) Finance Department Shri Ajay Seth, the Secretary (Exp)
Finance Department Shri Anil Kumar Jha, and other officers of the Finance Department, as
also the Principal Secretary, Planning Shri. Sanjiv Kumar, and other officers of the Finance
and Planning Departments who have generously given of their time and efforts to provide
inputs and guidance to the Secretary of the ERC and to the Consultants engaged by ERC,

j
thus greatly facilitating the compilation of information and analysis of data for the
Commission.
29. The Commission would like to place on record the contribution of Shri P.R. Devi
Prasad, Director FPI, Shri R.S. Phonde, Secretary, ERC, Shri Mandar Nayak and
Ms.Prathiksha Shetty Internal Consultants of the Commission, towards drafting of the Report
which has been discussed, debated and then finalised by the Commission over several
meetings. It has to be appreciated that both Shri P.R Devi Prasad and Shri R.S.Phonde have
put in tireless efforts in assisting the Commission, despite their other onerous responsibilities
under the Government. They have contributed immensely in conducting the meetings of the
Commission, interacting with the officers of different Departments of the Government and in
co-ordinating the activities of the Research Institutions engaged by the Commission. But for
their most valuable contribution, smooth conduct of the Commission‟s work would not have
been possible. The Commission also cannot forget on this occasion the dedicated work put in
by Smt. Sasikala, Smt. Lokamba and the other staff of the Commission in connection with the
exercises leading to the preparation of this report.
30. Finally, as Chairman, I would like to sincerely thank my fellow members of the
Commission Shri L.V.Nagarajan, Principal Secretary to Government, Finance Department,
Shri Sanjiv Kumar, Principal Secretary to Government, Planning, Programme Monitoring
and Statistics, Department, Shri Mohandas Pai, Director (Human Resources) Infosys Ltd and
Shri G.Ramesh, Professor, IIM, Bangalore, for their very active participation in the
deliberations of the Commission and contribution of so many novel and valuable ideas which
have significantly enriched this report.
B.K Bhattacharya
Chairman

i
Summary of Recommendations
Review of Public Expenditure
Pre-Investment Project Appraisal
Legislative Control over Expenditure
Executive Control over Expenditure
Department-wise Recommendations
1. Primary and Secondary Education
2. Employment and Training
3. Higher Education
4. Agriculture
5. Horticulture
6. Fisheries
7. Animal Husbandry and Veterinary Sciences
8. Co-operation and Agricultural Marketing
9. Social Welfare
10. Minorities Welfare
11. Women and Child Development
12. Health and Family Welfare and Medical Education

ii
Review of Public Expenditure
1. Government has to strike a balance between the need to contain public debt and the
need to enhance productive expenditure particularly (a) on Economic Infrastructure, Urban
Development, Energy, and Skill Development which impact economic growth with lower
time lag and also (b) on Education and Health which lead to immediate higher level of human
development and long term economic growth. (para 2.7)
2. To achieve Millennium Development Goals (MDGs) by 2015 the State needs to
reorient its strategy particularly focusing on decreasing the gap between potential and actual
Infant Mortality Rates (IMR), Maternal Mortality Rates (MMR) and improving other health
indicators viz. Life Expectancy at Birth, Institutional births, etc. (para 2.12)
3. Though Karnataka has shown an upward shift in the allocations favouring
development expenditure, Karnataka Social Priority Ratio i.e. the percentage of social
expenditure devoted to human priority for elementary education, rural health, public health,
family welfare, water supply and sanitation and rural development expenditure has gone
down from 41 percent in 1987-88 to 34.5 percent in 2008-09. This trend has to be reversed.
While increasing the share of development expenditure in the budget, greater priority has to
be given to social priority sectors, like elementary education, rural health, public health,
water supply and sanitation, etc. (para 2.13)
4. In keeping with the recommendations of the Thirteenth Finance Commission, the
State should set up a Committee for annual independent and public review of KFR Act, 2002
compliance. The Committee could evolve into a full fledged Fiscal Council. (para 2.15)
5. There is a need to closely monitor the outcome derived from the expenditure made by
the State towards Human Development Indictors at regular intervals. (para 2.16)
6. The regional inequalities remain a matter of serious concern and need to be addressed
by not only increased allocations but also with effective planning and management of
programmes/interventions and better deployment of personnel, ensuring adequate number of
teachers and doctors in the backward regions. (para 2.16)
7. There is a need to regularly ascertain the impact of capital expenditure on GSDP, in
order to prioritize Government expenditure, and to provide impetus to economic growth as
required under Karnataka Fiscal Responsibility Act, 2002. This task needs to be undertaken
jointly by Planning and Finance Departments. (para 2.17)
8. While considering the expenditure priorities, the Government has to take into account
the overall impact of Schemes and programmes on growth and welfare by balancing
efficiency and equity. Most of the projects, programmes, and Schemes have been started

iii
without stating the objective and outcome in clear and measurable terms. Keeping this in
mind, the Commission would advocate Government‟s immediate action towards merger of
Schemes which have common objective and outputs. This would require structured and
effective inter-Departmental consultations. (para 2.17)
Pre-Investment Project Appraisal
9. While retaining the generic character of guidelines already issued relating to pre-
investment appraisal (Annexure-3c), there is a need for specific guidelines, templates,
definitions suited to sectors as diverse as Education and Health, Road and Transport,
Irrigation, Agriculture Extension, Electricity, Water supply, Tourism, Waste Management
etc., Finance Department as also the Planning Department should give sector specific
guidelines, with examples based on case studies and necessary tool-kits should be made
available in English as well as Kannada on the Finance Department website. The tool-kit
should contain customized software matching the guidelines, updated discount rates,
desirable rates of returns etc., along with separate examples for social sector, infrastructure,
etc. (para 3.11 and 3.13)
Projects, Schemes or Programmes with investments above ` 5 crore in the social sector
should be appraised and the necessary Institutional mechanism should be put in place for this
purpose. For infrastructure sector, the low limit may be kept at ` 10 crore i.e. all
infrastructure projects above ` 10 crore should be subjected to detailed Social Cost: Benefit
analysis. Further, all the Programmes, Projects and Schemes which have already been
without such appraisal should be subjected to effective monitoring and evaluation for timely
course correction. (para 3.12, 3.14)
Legislative Control over Expenditure
10. Finance Department should define „adequacy‟ in Revenue surplus and put in place a
mechanism to utilise Revenue surplus generated every year, for use in capital formation as
mandated under the provisions of Sec. 4(1)(j) of the KFR Act. (para 4.3)
11. Appendix-E relating to civil works requires being prepared at the beginning of the
year. Government needs to explore the feasibility of using MTFP to prepare a Capital budget
for major Projects, which should be normally understood and treated as a non negotiable
commitment to be honoured until the projects come to a conclusion. (para 4.5)

iv
12. The Planning Cells and the IFAs in each line Department, who are required to handle
MTFP related work, have to be further strengthened in order to have analytical reporting of
the MTFP as a statement of commitment. (para 4.7)
13. The Monthly Programme Implementation Calendar (MPIC), which replaced Monthly
Multilevel Review (MMR) is a tool to review programme performance. The Programme
Performance Budgeting (PPB) exercise along with the MTFP can provide valuable inputs to
the Legislature and its Committees every year, along with the Budget proposals. As such,
the MPIC has to be seen as supportive tool for PPB/MTFP. The Commission is of the view
that as part of the exercise of strengthening institutional mechanisms, the Departments should
prepare, use and internalize these standardized monitoring tools with due diligence. (para 4.9)
Executive Control over Expenditure
14. The internal controls through the IFAs in the Departments need to be strengthened
and their participation in the day to day financial management ensured, as mandated by “The
Government of Karnataka (consultation with Financial Adviser) Rules 1982” and
Government Notification No. FD 1 TFP 2008 dated 16.5.2008. (para 5.4)
15. The Institution of IFAs has to be strengthened by identifying sufficient number of
officers with the requisite background and seniority and with a remaining service of at least 5
years before superannuation. They should be supported with the required infrastructure and
exposed to extensive training, including computer skills, to match the job chart of IFAs. (para
5.4)
16. The overall status of all the Schemes reviewed by the Planning Department through
the MPIC needs to be brought out into the public domain every month along with measures
taken for corrective action. (para 5.10)
17. The coverage for Expenditure Tracking through physical verification by the
Directorate of Economics and Statistics (DES) should be enlarged to cover 20 percent of the
development /welfare Schemes, programmes, and projects in each Department every year.
The officers currently posted as Project Evaluation and Appraisal Officers (PEAOs) could be
drafted to perform these functions, after empowering/training them with suitable skills.
Presently, most of these officers are said to be engaged in activities not necessarily meant to
be performed by PEAOs. (para 5.14)
18. In addition to MNREGS, Social Auditing mechanism should be put in place for other
programmes which have high and direct human welfare impact viz., NRHM, Housing,
ICDS, Bhagyalakshmi, Social Welfare hostel management, Sarva Shiksha Abhiyan, etc.
(para 5.15)

v
Department-wise Recommendations
i. Primary and Secondary Education
19. Growth in the number of secondary schools in the State needs to keep pace with the
number of students moving from primary school to secondary schools, more particularly in
the context of the objectives set under the Right to Education (RTE) Act and the Millennium
Development Goals (MDGs). This can be achieved by upgrading the existing Higher Primary
Schools and also by setting up new Secondary Schools. (para 6.1)
20. Suitable teacher redeployment policy for rationalization of work load of teachers in
Government primary schools is necessary with due consideration to serve students in districts
or regions with difficult terrain. Considering the high unit costs of providing education in
schools with very low Pupil Teacher Ratio (PTR) (in areas which are not considered to have
difficult terrain) there is a need to close down or merge such schools with nearby schools
located within distance of 1-2 km. The teachers, who are found to be surplus due to such
merger or closure of the schools, be redeployed to schools in near by districts with high PTR.
(para 6.2)
21. In view of the more liberal norm of Pupil Teacher Ratio adopted in Karnataka vis-à-
vis national norms, Government needs to enforce a higher standard of performance indicators
to assess the output of teachers and the quality of learning by the students. (para 6.3)
22. One of the objectives of school learning ought be infusing creative abilities into the
minds of students by teaching the existing subjects in different way. The students need to
learn to think and blend divergent thinking and convergent thinking. Creative abilities have to
be innovatively incorporated through laboratory learning, digital learning, experimenting,
mock sessions, building models. The programme Nali Kali introduced in Government
Primary schools, has some elements which promote creative learning through play as against
conventional learning. However, the critical challenge is ensuring supply of sufficient
learning material in time to all the children. The Department may have an independent study
conducted about the impact of the Scheme after it has been in operation for four years
(covering Ist to IVth standard). If found efficacious, this innovative scheme could be further
extended to the Government aided schools in order to help students to use their imagination,
think critically with reason, develop better problem solving skills and promote the spirit of
co-operation. To supplement such expansion, the DIET has to be repositioned to provide
training to the teachers engaged in Nali Kali on a large scale, including the teachers from
aided schools. (para 6.6)
23. Department should ensure provision of adequate space for recreational activities,
separate toilets for girls, drinking water in a time-bound manner and thus create congenial
vi
atmosphere for learning at schools by preparing a medium term capital budgeting covering
all schools. (para 6.7)
24. In order to bring out of school children/drop-outs to mainstream education system,
opening of alternative education centres like Bridge courses - residential and non-residential,
tent schools, Zero level schools, etc., may be introduced. (para 6.8)
25. With demand for schooling set to increase continuously in medium term, the total cost
on managing the schools would also go up. Therefore, Government needs to encourage
private participation and also put in place appropriate regulatory regime which may enable
the Government to consider introduction of a coupon system in course of time. (para 6.9)
26. The teachers are also increasingly engaged in non-academic activities thus sacrificing
their quality time for students. Their engagement in mid-day meal scheme takes away most of
their academic time. Therefore, more intensive involvement of SHGs promoted by RDPR and
WCD, and adoption of Centralized Kitchen facility needs to be explored. This would relieve
teachers from non-academic activities. (para 6.10)
27. It is necessary to plan reorientation trainings for teachers and utilize DIET facilities
throughout the year. Further, the training manuals need to be updated keeping in view the
futuristic learning needs and that of teaching in order to raise creative abilities and creative
thinking of the learners/students. (para 6.12)
28. To improve the quality of learning in the schools, the minimum entry level
qualification for Higher Primary School teachers be raised to graduate degree and that for
Primary school teachers be raised to Pre-University. Atleast half of the teachers recruited
every year should be Science Graduates. (para 6.13)
29. Commission recommends the Department to prepare Grants-In-Aid policy with a
provision of sunset clause for existing GIA schools as well as for new schools, if they are
brought under GIA in future. (para 6.15)
30. In order to ensure and encourage students to complete Secondary School examination,
the Commission recommends that the minimum educational qualification of seventh standard
pass for entry into Government jobs be raised to SSLC pass. (para 6.18)
ii. Employment and Training
31. In order to address the gap between the capacity and demand for employable ITI
students, more focus is required to enhance the soft skills of the trainees and upgrading the
technical skill of the trainers. (para 7.1)

vii
32. ITI trainers‟ training skills require to be upgraded periodically. The trainers may be
encouraged to periodically go on short term “sabbatical” to established industrial units. Such
kind of re-training (during sabbatical) is required for the trainers in Government ITIs, aided
ITIs and unaided ITIs. (para 7.6)
33. Department of Technical Education needs to support Karnataka Vocational Training
and Skill Development Corporation to encourage ITIs to take up visits to Industrial Units
as part of hands-on-training or as part of apprentice programmes, by collaborating with
Department of Industries and Department of Public Enterprises. (para 7.7)
34. The Department of Employment and Training should co-ordinate with Department of
Social Welfare to encourage ITIs to provide hostel facilities for ITI students so that
scheduled castes and other backward classes students can avail of the hostel facilities
provided by the Social Welfare Department. (para 7.7)
35. The number of ITI courses relating to automobiles need to be increased and the
courses should include orientation to pollution containing technologies. (para 7.8)
36. In order to reduce the employment share in Agriculture and increase employment in
Industry sector and Services sector, more investment is required in technical upgradation of
the workforce through ITIs and Skill Development Centres. New skills are required to
increase employment to about two to three lakhs youths comprising 50 percent of the total
workforce who join the non agricultural work force every year. (para 7.9)
37. New areas where the ITIs can enter are Cathode Ray Technologies, Plasma and LED
(Light Emitting Diode) technologies, Digital and 3D technologies, Data storage and
transformation, Radio Frequency Identification Devices (RFID), medical and precision
equipment, high volume electronics production, high-tech manufacturing, handling e-waste,
cold chain manufacturing and food processing, food preservation, industrial cleaning, high
pressure welding, process improvement techniques, introduction to aircraft/airport support
technologies like elevators, conveyor belts, aerobridges, etc., and Housekeeping, laundry
management, management of multi-storeyed buildings, etc. (para 7.9)
iii. Higher Education
38. Resource allocation to universities and colleges must strike a balance between
provision made towards salary and pensions and other items of expenditure like maintenance,
development and improvements. Infrastructure supporting the teaching-learning process like
library, laboratories also needs to be monitored and upgraded at regular intervals. However,
this does not seem to have been done in Karnataka. Hence, the Department should put in
place an institutional mechanism to monitor these facilities at regular intervals and forecast

viii
medium term investment needs to upgrade the facilities. Without doing so, the State will not
be able to realize the vision for 100 percent National Assessment and Accreditation Council
(NAAC) accreditation of its colleges by 2020. (para 8.3)
39. The Government may discourage establishing single subject universities and also
explore the possibility of realigning the existing single subject universities into general
university system to the extent possible. (para 8.7)
40. The scope of the scheme which is now meant only for attracting science students may
be enlarged to include all subjects in general Degree Colleges (BA / B.Sc / B.Com), the
scholarship amount should be increased from the present rate of ` 5,000 to ` 8,000 per
annum periodically adjustable to inflation once in three years, the coverage should be
expanded, to at least 10,000 students from across the State with equal number of boys and
girls. Of the 10,000 scholarships, 2,000 scholarships be awarded to students without reference
to their status of being APL or BPL families and the balance 8000 to students from BPL
families. Out of this 8000, about 2500 scholarships be exclusively awarded to BPL students
who were born and who studied in schools located in 39 Backward talukas as identified in
Dr. D.M. Nanjundappa Committee‟s Report. Drawing this scholarship need not be a bar on
the students who otherwise can avail support/benefit under any other Scheme administered
by Social Welfare Department, Minorities Welfare Department and WCD etc. (para 8.11)
41. At least ten percent of the university budget should be earmarked towards research by
faculty, in the areas of pure science and applied research, with priority to the subject of
interest to the State. (para 8.13)
42. The Government may increase investment in Government colleges, while also
considering increasing potential for raising tuition fee from students who come from non-
BPL families. Also Universities need to be pro-actively encouraged to explore public private
partnerships (PPPs) in research programmes, laboratory management, centralised digital
library services, including effective use of EDUSAT, and to seek sponsorships for chairs
from leading industrial houses as part of their Corporate Social Responsibility (CSR)
initiatives. (para 8.14)
43. The Grant-in-Aid Code needs to be reviewed by the Government, particularly in the
light of the impact of the implementation of the Right to Education Act. Since pressure on
resources will increase, there is a need to progressively step back from supporting the
institutions which have been given concessional land and grants during the last thirty years.
An exit policy needs to be drawn while keeping in mind the equity issues in Higher
Education. (para 8.15)

ix
44. The Department of Technical Education should therefore encourage the existing
private engineering colleges in the state, having required infrastructure and faculty to
augment their enrolment capacity for disciplines where there is adequate demand. New
Private Colleges (without any GIA from the State Government) who can provide for adequate
faculty and infrastructure could also be permitted, with required clearance from All India
Council for Technical Education (AICTE), particularly in Districts where there are no or very
few colleges for technical education. (para 8.17)
iv. Agriculture Department
45. Government support to agriculture sector or to farmers flow through varied Schemes
administered by several Departments other than Agriculture and Horticulture viz. Water
Resources, Medium and Minor Irrigation, Power, Power Distribution, Co-operation,
Agriculture marketing, Social Welfare, Minority Welfare and Animal Husbandry. The
Government needs to take a holistic view of its expenditure through Schemes, Project and
Programmes which benefit the farmers. (para 9.2)
46. The Commission impresses upon the Government to take a long term view to
encourage and enable the agricultural workforce to migrate to non-agriculture sector to the
maximum extent possible, by promoting the growth of attractive non-farm and off-farm jobs.
The Department also has to safeguard the interest of farmers and ensure, while introducing
new Schemes for increased production, that the terms of trade should be favorable to the farm
sector. (para 9.3)
47. The Department of Agriculture should reprioritize its expenditure in favour of
Schemes like Soil Health Centers, Enrichment of Soil Fertility and Soil Conservation
techniques for better land use planning and land management. (para 9.11)
48. The State Government should increase allocation for intensifying efforts in
Agriculture extension activities. The Agriculture Department, in line with its mission, should
channelize its resources towards reviving the extension activities in the State by making use
of advanced Information Technology (IT) choices. In addition to our own initiatives like
Nemmadi and Raitha Marata Kendra and Bhoomi, the ITC sponsored e-Chaupal in Madhya
Pradesh or e-Sagu in Andhra Pradesh offer instructive examples in this direction. (para 9.11
and 9.15)
49. The Commission is therefore of the view that, instead of making excessive allocations
for subsidy Schemes such as crop loans, which remain under-utilized, allocations need to be
directed towards Schemes that directly raise productivity through research and extension
services, as this is the area that needs to be strengthened and extended further. (para 9.13)

x
50. The relevance, costs, and continuance of the Schemes related to Organic Farming
should be assessed regularly against nationally accepted standards vis-a-vis farm output,
particularly keeping in view the significance of food security in the near term and medium
term. (para 9.14)
51. The Universities of Agricultural Sciences and Institutions under them should be
encouraged to produce scalable innovations - which should have a low lead time from lab to
land. Farmers in the State should be enabled to benefit from technology-based initiatives by
strengthening RSKs/KVKs. (para 9.16)
52. Watershed Development Schemes should be regularly monitored and the farmers
should be educated about in-situ moisture conservation to increase productivity from
unirrigated agricultural land. In this regard, the Commission recommends that the Monitoring
and Evaluation of some of the Schemes may be given to a third party, for which 1% of
budget outlay could be earmarked as recommended by Planning Department. (para 9.19)
v. Horticulture Department
53. Department should ensure effective expenditure in areas which benefit the
horticulturists for better production and productivity. Therefore, Schemes which focus on
improving production, processing, research and extension namely Processing in Horticulture,
Development & Maintenance of Farms & Nursery, Extension and Training, Cold Storage
Subvention and Maintenance of Horticultural Farms should be reviewed and closely
monitored for impact evaluation. (para 10.2)
54. Agriculture and Agricultural Marketing & Co-operation graduates could be appointed
for filling the Direct Recruitment vacancies in the Department of Horticulture, since these
graduates are equally qualified in production technologies, post harvest technologies and
Marketing of Horticultural crops. (para 10.4)
55. There is a need to encourage graded cold storage facilities nearer to farms and
refrigerated transport facilities at affordable costs. The State Government should assess the
feasibility of providing differential rate of tariff for cold storage chain facilities. However,
such tariff should not be allowed to be barrier for accessing cold storage facilities. To provide
support of technical staff, the Department should encourage ITI courses in cold chain
technologies, refrigeration, etc., to support the growth momentum in this sector. (para 10.7)
56. The Government needs to encourage investments in cold chain capacities and
efficient transport facilities. The Commission also recommends that the Department of
Horticulture should co-ordinate research more intensely towards improving the quality of the
xi
seeds, the shelf-life of horticulture products including feasibility of irradiation of select
products. While doing so, the Department should take adequate safeguards in the matter of
phytosanitory measures as applicable under WTO regime. (para 10.8)
57. Current use of Information Technology (IT) is limited, being mainly up to the District
level. It has not reached the Raitha Samparka Kendras (RSK) which serve farmers in groups
of 4 to 5 villages. Infrastructure needs to be created and integrated from the taluk level to the
State level, in order to facilitate the maintenance and updating of records with minimum staff.
In addition to this, as horticulture crops and processing technologies require continuous
extension support or guidance, it is desirable that greater use is made of Hortnet, the
interactive website made for this purpose. This could be operated at RSK level with support
from KVKs, Universities and supporting agencies. (para 10.9)
vi. Department of Fisheries
58. The various colleges and research institutes under the Karnataka Veterinary, Animal
and Fisheries Sciences University, Bidar located at Bangalore, Shimoga, Mangalore,
Gulbarga, Hassan should be encouraged to offer one year courses in fishery technology. This
would facilitate recruitment of adequate number of qualified technical persons in the
Department and strengthen the extension activities for increased Inland fisheries in the State.
(para 11.7)
59. Department should review whether Schemes that provide input subsidy help to
encourage deep sea fishing, and make suitable changes in the Schemes so that resources
available within the State‟s marine territory can be explored. (para 11.8)
Government needs to consider diesel subsidy to cold storages for exclusive use by people
engaged in fish trading, particularly in areas where electric supply is erratic; and also to
specialized refrigerated transport vehicles. (para 11.8)
60. Department should encourage development of an active processing, transport and
storage industry utilising the raw material produced by the marine fisheries sector. The
Department should undertake the promotion of industries such as fish processing and
canning, production of fish oil and dry fish, etc., which have a steady demand in the domestic
and international markets. Such industries would not only help in employment and income
opportunities to populations residing near fishing harbours, but could also be the basis for
developing a sustainable strategy for alternative nutritious food choices at competitive
prices. (para 11.9)
61. There is a need for the Department to assess whether the desired objective of welfare
of the fishermen has been actually achieved. It is also necessary to periodically assess the

xii
facilities developed as part of the marketing Schemes. In this regard, the Commission
recommends that the Department set up a monitoring and evaluation team to periodically pay
visits to the facilities created i.e. housing colonies, co-operative societies, markets etc., to
continuously assess and review expenditure towards welfare schemes. (para 11.11)
vii. Department of Animal Husbandry and Veterinary Sciences
62. Given that the benefits of the huge „Incentive to milk producers‟ Scheme essentially
reach urban milk consumers, the Department needs to seriously re-look at its major
expenditure pattern and assess the true impact of its different Dairy Schemes on milk
production in the State. (para 12.4)
63. There is a need to increase the number of colleges either in government or private
sector with financial assistance and the number of intake into the existing colleges after
obtaining relaxation on class size which has been prescribed by IVC (Indian Veterinary
Council) regulations. Further strengthening of infrastructure in the existing colleges is also
warranted. There is a need to take up skill upgradation of veterinarians by providing short
term P.G. Diplomas to the field staff in field oriented subjects as well as training in short term
courses imparted to the field staff. Also there is a need to include refresher course- training to
be provided once in 2 years regularly to all the Para-vets in the Department. (para 12.7)
viii. Co-operation and Agricultural Marketing
64. Presently, membership in the credit societies is limited to land holding persons. Those
who do not hold land are thus denied the opportunity of benefiting from the programs of the
primary co-operative credit societies. Enrolment norms need, therefore, to be made more
inclusive so as to admit rural land-less people, and extend agriculture credit to more non-farm
activities. Such expanded membership would also facilitate wider flow of benefits from the
popular health insurance scheme, Yeshaswini, to cover these landless rural poor as well. (para
13.2)
65. Vacancies in functionally critical positions like Co-operative Development officers,
Deputy and Assistant Registrars, Inspectors needs to be filled up to ensure quality service
delivery, to promote the mandate of the Department including effective recovery of loans.
(para 13.3)
66. Government needs to devise ways to progressively step back from interest subsidy on
crop loans and introduce insurance oriented Schemes with a sun-set clause regarding
Government support in the initial years. (para 13.5)

xiii
67. Modernising the Co-operatives‟ organisational management through the use of ICT
could be an effective method of bringing about financial inclusion and expansion of business
volume. It would be necessary to design an effective line of command and appropriate
delegation of powers to suit the modernised organisational structure and use of ICT. (para
13.6)
68. Assistance for implementation of BDPs has to receive focus in the revival package
recommended by the Vaidyanathan Committee. The BDPs need to suggest diversification of
their lending activities beyond crop loans and into other activities such as fishery, poultry,
mushroom cultivation, etc., which could give high marketable surplus to members. (para
13.7)
69. There is need to establish an institutional mechanism for price signalling and price
forecasting by drawing from the future price trends particularly in commodities where there
is forward trading through (National Commodities and Derivatives Exchange) NCDEX. Part
of the „Revolving Fund‟ can be utilised for evolving such mechanism through research by
leading institutes in Karnataka viz. IIM, ISEC etc. This mechanism will help the Government
to capture early warning signals about distress sales and identify the commodities to be
notified for Minimum Floor Price (MFP) intervention from time to time. (para 13.11)
70. Higher efficiencies in transportation and marketing are critical to ease the demand-
supply gap at the consumer end. Marketing of Horticultural produces through private
participation are welcome changes. Such changes, however, should facilitate higher
participation of retail food chains to procure horticultural produce at locations close to the
place of production and help the farmer in efficient disposal of horticultural produce.
Agricultural Marketing Department to ensure compliance to the rules of the licence and the
purchase agreements between the farmer and the private purchaser. (para 13.12 )
71. The overarching objective of reducing the role of the intermediaries and making the
farm output available to the retail stores in time and at competitive prices linkage is missing
in the Schemes. The Department has to redefine its role in support of creating enabling
environment for enhancing efficiency of retail markets particularly in urban areas. Critical
areas of intervention are grading norms, standardization of hygiene and waste handling at
retail markets. (para 13.13)
72. In the course of modernization of markets through electronic tendering and other
internet enabled services, the need for group „C‟ and „D‟ staff would come down. The vacant
positions could be converted into technical posts for the technical administration required to
be provided by market committee including price forecasting and price dissemination
activities, and abilities to enforce quality of contract management with outsourced agencies.
(para 13.14)

xiv
ix. Social Welfare Department
73. For improved efficiency in disbursement of scholarships, it is recommended to
consolidate all Schemes relating to scholarships/benefits and entrust the same to a separate
well networked financial institution. Such an institution should be able to disburse
scholarships to students on time through an electronic mode at regular intervals at
predetermined instalments for each student. In case release of funds from Government of
India is delayed; the institution may charge marginal financing charges or interest for
advancing these scholarships. This would require approval of scholarships at one go at the
beginning of the academic year itself so that the financial institution can make its cash flow
arrangements accordingly. (para 14.9)
74. It is recommended that starting of hostels in unsuitable private buildings be
discouraged. The construction and progress of hostel buildings should be monitored by a
dedicated team of Departmental officials with sufficient skills in engineering and agencies
like PWD, Nirmithi Kendra, Zilla Panchayat Engineering, Karnataka Rural Infrastructure
Development Limited (Formerly KLAC) should be made accountable for timely completion
of the construction works. (para 14.11)
75. It is advisable to club all 39 Schemes under the maintenance of hostel/buildings,
constituting revenue expenditure, into a single scheme. The Department should clearly define
the role and functions of Karnataka Residential Educational Institutions Society (KREIS) in
construction, maintenance and running the day to day operations of the residential schools for
SC/ST/BC and what would be their relationship with regards to Zilla panchayats and the
Directorate. (para 14.12)
x. Minorities Welfare
76. The Department of Minorities Welfare should consider switching to electronic mode
of disbursal, and computerised processing of applications can address most of the problems
for Financial Assistance to Students. (para 15.4)
77. Reliable demand assessment and, based upon that, proper mapping to locate the
hostels has to be undertaken before opening the hostels. The entry bar for admission also
needs to be revised downwards to attract more number of students to avail the hostel facility
without over crowding. Wherever there is underutilisation, the excess capacity be utilised for
the students belonging to other communities viz., backward classes and SCs/STs. (para 15.9)
xv
78. Every hostel construction has to be seen as a project inclusive of civil works, furniture
and electrical equipment, along with facilities for bicycle stands, sports activities, etc. (para
15.10)
79. The task of maintenance of all hostels be entrusted to a Special Purpose Vehicle (i) to
optimise administrative costs, (ii) to enhance accountability and (iii) to provide uniform and
standard professional services to students in all hostels, including the residential schools
established by Social Welfare Department, Minorities Welfare Department, Education
Department or any other Department. (para 15.11)
80. The Commission emphasizes the need to orient NGOs and other Institutions about the
spirit of Self Help Groups and ensure that the Self Help Groups do not function merely as
channelizing agency to individuals for distributing Government money, but also act as
genuine Self Help Groups in letter and spirit. The Commission recommends that micro credit
through SHGs/ co-operative societies be expanded to gradually phase out direct lending to
individuals. (para 15.14)
81. Commission while suggesting the Department to create a lean and effective
organisational structure to implement Schemes and Programmes for minority communities,
also recommends that before creating a new Department the Government should assess its
organisational requirements and take appropriate measures in this behalf. (para 15.16)
xi. Women and Child Development
82. Finance and Women and Child Development (WCD) Departments should jointly
conduct a study to devise implementation strategy of Gender Responsive budgeting to
achieve its intended objective. (para 16.8)
83. Demographic projections required for implementing the Bhagyalakshmi Scheme be
reviewed periodically. It is necessary to correct the past mistakes through verification of the
registered applications. (para 16.9 c, d)
84. There is a need to revisit the rate of premium vis-à-vis the assured sum under the
Bhagyalakshmi Scheme. While doing so, all factors like (i) probability of failure on the part
of the beneficiary fulfilling the conditions to claim the assured sum, and (ii) the survival
chances of the girl child until 18 years should be taken into account. The Commission is also
of the opinion that the benefit should be given to the girl child in several installments, linking
it to the girl‟s educational progress, rather than making payment in one lump sum. (para 16.9
g)

xvi
85. The Department of Women and Child Development needs to consider engaging a
competent actuary to recalibrate the premium payable to the LIC, determine different stages
at which benefits should be paid, and the quantum of benefit payable at each stage and to
decide about the vesting in Government, the unclaimed amounts. (para 16.9 i)
86. For Integrated Child Development Services Scheme (ICDS), there is scope for
significant improvement on three counts as below and more particularly in sourcing,
preparation and distribution of nutritious food :
i. providing nutritious food to children at anganwadi centers,
ii. giving them scientific non-formal education,
iii. maintaining a conducive physical environment (para 16.10 e)
87. The Department should assess total requirement and prepare an action plan to
construct sufficient number of Anganwadi centers in time-bound manner. For this purpose,
the Department of RDPR and WCD should exploit the possibility of using funds available
under Mahatma Gandhi National Rural Employment Guarantee Act, 2005 with due regard to
specification indicated in Schedule-I (read with Section 4(3)) of the Act. (para 16.10 f)
88. Department also needs to investigate entire procurement process of supplementary
nutrition food so far and enquire to what extent supreme court orders were or were not
complied with and take corrective measure before starting new contract for the year 2011-12.
While doing so the Department should take care not to disrupt the availability of food to
children. (para 16.10 g)
89. The diversity in the guidelines and financial support as issued by respective ministries
of Government of India needs to be negotiated between the Departments at the State level in
order to have standard/uniform financial packages. (para 16.11) Several State Government
Departments promote Self Help Groups which work on different guidelines, several of which
are issued by Central ministries viz., Ministry of Women and Child Development, Ministry of
Rural Development, Department of Forest (JFM), Department of Watershed Development.
Thus assistance to SHGs varies across the Departments. NGOs too form SHGs. There is a
need to standardize the financial package to all Government sponsored SHGs in order to
avoid confusion or duplication.
90. The scheme of marriage of destitute widows and Devadasis, which is not popular, can
be considered to be merged with Devadasis Rehabilitation Programme, which is being
implemented by the Karnataka State Women‟s‟ Development Corporation. (para 16.12)
91. The Department feels that Additional posts are required for Institute for Mentally
Retarded Children home at Bangalore and Mentally Retarded Children for girls at Hubli for

xvii
maintenance of inmates. Since these homes have a considerable impact on mainstreaming the
children there is a need to have qualified and competent human personnel to manage these
homes. (para 16.13b)
92. Guidelines of the scheme Skill upgradation for inmates of correctional institutions
need to be redesigned so as to suit the children of 10-12 years. The activities which are
restricted in the present guideline also need to be increased to include people of varied age
groups. (para 16.13c)
93. Only one scheme „Suraksha‟ is implemented by the Karnataka State Commission for
Women. This scheme can be transferred to the Karnataka Women Development Corporation
for administering the financial aspects, leaving the Commission with powers to pronounce
the compensation after due consideration. (para 16.16)
94. The Scheme “Training and Employment” under the Department of Welfare and
Disabled and Senior Citizens could be transferred to Karnataka Vocational Skill
Development Corporation (under Department of Employment and Training). The interests of
the disabled can also be safeguarded by the Department by identifying the beneficiaries and
also by periodical monitoring of progress of implementation of schemes by the Corporation.
(para 16.17 a)
95. It is suggested that social welfare pensions i.e. Old Age Pension, Widows‟ Pension
etc., under the Revenue Department could be brought on par with the maintenance allowance
for the Physically Handicapped. At present Old Age Pension is ` 400 per month of which `
200 is Government of India‟s contribution. Taking into account the daily wage being paid
under MNREGS (under which 100 days work is guaranteed for one member per family) and
also the Planning Commission‟s revised definition of poverty level, the Expenditure Reforms
Commission recommends that allowance for disabled persons (with disability of 40-75%)
may be fixed at ` 800 per month. It is suggested that similarly the recipients of Old Age
Pension should be assured of a sum of Rupees Eight hundred per month (inclusive of GOI
contribution). Similar enhancement may be made in Widow‟s Pension also, so that inclusive
of GOI pension, if any, eligible widows also receive ` 800 per month. (para 16.17 b)
State Government should move to the Government of India to share the expenditure on the
welfare pensions on 50:50 basis. Proper verification procedure for such welfare
pension/allowances should be put in place so that benefit goes only to the persons fulfilling
all the conditions of the Schemes and there is no possibility of the same person receiving
pension/allowance from two different sanctioning authorities (e.g. from Tahsildar of the two
different Talukas). (para 16.17 b)

xviii
96. It may be made mandatory that every Department should disclose activities,
undertaken by them for the benefit of physically disabled persons in their Departments in a
separate chapter in its Annual Report. The commissionerate may bring out a report on the
status of implementation of Persons with Disability Act 1995 every year through a sample
study which can be formally institutionalised in a time frame of three to four years. The
Commissioner may be provided with suitable accommodation and requisite staff. (para
16.19)
97. Government should issue guidelines for spending three percent of budget of every
beneficiary oriented scheme on the Disabled and compliance with these guidelines should be
regularly monitored. (para 16.20)
98. There is a need for upgradation of the Status of the Chairman and members of the
Karnataka Child Rights Commission, taking into account the position in the Central
Government. (para 16.22)
xii. Department of Health and Family Welfare
99. The skewed location of PHCs in some of the districts with difficult terrain may be
understandable, but the unevenness of the location of the PHC in other districts not only
violates one of the commitments made in the State Integrated Health Policy but also increases
the unit cost of providing health care services leading to inefficient expenditure through
PHCs. The Government should revisit the present location of health care facilities in the
State with respect to Primary Health Centres, Community Health Centres and Sub Centres.
(para 17.8)
100. The District Health Officers should maintain a record of the drugs procured for the
district hospitals and ensure quality control for timely issue of adequate drugs from district
level offices. There is a need to ensure that regular and periodic quality inspections at District
and Taluk level hospitals are carried out, and also to ensure an efficient administration of
drug supply in Government Hospitals. (para 17.10)
101. Department of Health should,
(a) put in place a mechanism whereby physical infrastructure is fully utilised by posting
adequate staff and ensuring their presence during duty hours,
(b) not create further new physical infrastructure without assessing, through
epidemiological studies, the actual demand for the proposed services,

xix
(c) create and position manpower on the basis of the morbidity pattern, which needs to be
reviewed at least once in three years, and
(d) consider dovetailing services provided by Government with those provided by the
private sector through Government supported insurance schemes. (para 17.13)
102. The hospital patient database could be actively managed and used for monthly review,
procurement and epidemiological analysis. However, the Department has to use existing
hardware and software for data mining from HMIS , HRMIS to enable informed decision
making for better HR placement, drug procurement & distribution and man power planning.
Since HMIS is being used in 11,500 institutions, an intensive training needs to be undertaken
for the staff in the use of HMIS and HRMIS. The Commission also recommends that, using
IT, an accountable performance review mechanism be put in place to assess the performance
of PHCs. (para 17.13)
103. There is a need to support the Department of Drugs Control with sufficient number of
drug testing facilities inline with the quantum of drugs supply and various health institutions
in the State. (Para 17.20)
104. In line with the objectives of the Department of AYUSH, and general popularity,
there is a need to have an integrated policy in pursuit of the objectives and if necessary, for
such a policy to complement the State Health Policy. The integrated policy needs to optimise
the cost advantages in some of the potentially beneficial treatments which otherwise are
costlier in the mainstream Health care system. To strengthen existing research institutions
and ensure research programmes for identified diseases for which AYUSH systems have an
effective treatment, the State needs to encourage research in AYUSH, particularly Ayurveda
and strengthen technical certification in drugs which are normally sold as over the counter
drugs. (para 17.23)
105. There is a need to provide supportive infrastructure to make optimum use of the
dispensaries in the State. Also the vacancies position should be reviewed within the overall
policy priorities and improvements required to be made in Infrastructure facilities. (para
17.24)
106. The preventive, promotive and curative functions of the Department of Health need to
be split between two directors i.e., Director- Medical (for curative and clinical services) and
Director- Public Health (Preventive and promotive services) with required technical staff to
support the Director from positions of Assistant Director, Deputy Director to Joint Director.
Such hierarchy has to be designed for reasonable promotion opportunities and enable focused
supervision on each of the areas. It is recommended that two separate cadres may be
constituted relating to Public Health and Medical (clinical). (para 17.25)

xx
107. It is suggested that the Department needs to have a principle driven formula for
prescribing user charges, which should be reviewed periodically by a team of experts who
should also consider the market rates for the services. Secondly these user charges should be
collected from people without Below Poverty Line (BPL) Cards while exempting Below
Poverty Line (BPL) families. (para 17.26)

ERC Second Report 1
Chapter 1
Introduction
1.1 The Expenditure Reforms Commission has been constituted to review and provide
recommendations to enhance efficiency and effectiveness of public expenditure on various
programmes being implemented in the State. The detailed Terms of Reference given to the
Commission are at Annexure-1a. In order to study department specific issues the
Commission has engaged research consultants [list at Annexure-1b] as provided for in the
Government Order No. FD 76 Samaya 2009 dated 6.6.2009. Based on the interim reports
given by the consultant institutions and discussions with the departmental officers, the
Commission had submitted its first report to Government in February 2010. Presently most of
the consultants are finalising their reports. A few of them have submitted their final reports
recently.
1.2 Meanwhile, the Commission has travelled to some districts in order to appreciate the
current state of expenditure management at the field level through meetings with officials of
Zilla Panchayats, Taluk Panchayats, District officials, and citizens who had received benefit
from one or the other programmes/schemes. Some projects sites were also visited in these
districts. viz., Dharwad, Shimoga, Chamarajanagar and Bidar. These districts were chosen
considering their the socio-economic diversity, relative stages of development, and their
representativeness. The list of officers with whom the Commission had interacted in the four
districts is at Annexure-1c. The Commission had conducted several meetings with senior
officers in the various Departments to get a first hand view of the concerns expressed by the
line department officers.
1.3 While addressing the issues with reference to the ToR, the Commission is guided by
the need to provide pragmatic and implementable set of recommendations to the Government
in short term as also in medium term, rather than giving a report which may merely appear as
a theoretically sound document. The first set of recommendations were limited to some issues
of immediate relevance in six select departments viz.,
i) Primary and Secondary Education,
ii) Employment and Training,
iii) Social Welfare,
iv) Public Works,
v) Agriculture and
vi) Horticulture.
1.4 In its first report the Commission has also suggested some general prudential fiscal
management principles to be adhered to by the departments in implementing various

ERC Second Report 2
programmes/ projects/ schemes. Of the seventy four recommendations in the first report, fifty
five were departmental specific, fifteen were common to all departments and four relate to
principles of expenditure management.
1.5 The first report of ERC had also made recommendations towards organisation
structure and Schemes in respect of six departments (Primary and Secondary Education,
Employment and Training, Social Welfare, Horticulture, Watershed Development
Department and the Health Department). The Report also included an annexure with a list of
schemes to be merged/dropped. Some of the recommendation made by the 1st Report of ERC
included the following:
i. ‘Plan schemes having provision of less than ` 100 lakh be abolished. Schemes
having provision between ` 100 and ` 500 lakh should be reviewed as regards
their efficiency. If found useful they could be merged with any other existing
scheme of the department having similar objectives’. ( Para 4.1, 1).
ii. ‘Every department should disclose key goals for its operations so that all
intervention/ schemes are benchmarked against that goal. Such key goals should
be stated in measurable terms in order to relate resources used to the results
achieved, and the same be disclosed to public every year with effect from 2010-
11’. (Para 4.1, 1, iii).
iii. ‘All schemes / programmes / projects should have a sunset clause, indicating the
objectives/goals to be achieved, and specifying the terminal year in which such
schemes/programmes/projects are to be closed. All departments be asked to
specify in April 2010 the financial resources required for each
scheme/project/programme in its life time, while also indicating the quantifiable
output/objectives/ goals sought to be achieved at the close of such
schemes/programmes/projects, with yearly break-up of the same. All the
Departments have to terminate their existing schemes / programmes / projects
within five years of the inception of the scheme, etc., or as soon as the specified
output/objective/ goals are achieved, whichever is earlier ’. (Para 4.1, 1, iv).
iv. ‘Beginning with the year 2010-11, the Finance Minister should make a statement
on the floor of the House once in six months, explaining the progress of each
project estimated to cost ` 50 crore and above; and that a mandatory impact
analysis of all projects /schemes / programmes with outlay of ` 50 crore and
above has to be made. To ensure compliance of the same, the Karnataka Fiscal
Responsibility Act 2002 may be amended’. (Para 4.1, 1, vi).
v. ‘Ex-ante expenditure management tools like investment/project appraisal used by
Central government or the donor agencies should be comprehensive and be
legally institutionalised to prepare and examine expenditure proposals for

ERC Second Report 3
inducing fiscal discipline in implementation. Government may set up an
Expenditure Finance Committee (EFC) on the line of the prevailing practices in
Government of India. Detailed guidelines should be issued by the concerned
Administrative / Planning / Finance Department in this regard’.(Para 4.1, 3).
vi. ‘Investments in interventions that impact HDI should be addressed on a priority
basis, by earmarking adequate allocations with corresponding emphasis on
expenditure performance monitoring in relation to the objectives set for each
scheme’.(Para 4.1, 5).
1.6 In this direction the Commission is encouraged by the recognition the Government
gave to the recommendations contained in the 1st Report. The encouragement comes from
the fact that the Government had internalised thirty one of the 74 recommendations from the
1st Report as reflected in the Budget Speech of 2010-2011. The Commission has also
forwarded the copy of its 1st Report to the departments concerned, seeking their comments
and to understand their views as well as actions taken on the recommendations. The
Commission has not received any reply from the departments so far. Annexure-1d shows the
recommendations made in the 1st Report, which are directly or indirectly reflected in the
Budget speech 2010-11 and O.M vide which Budget Estimates for 2011-12 have been invited
from the Estimating Officers.
1.7 The 2nd
Report contains additional suggestions with regard to the above mentioned six
departments and also some other departments viz.,
i. Higher education
ii. Women and Child Development
iii. Minorities Welfare
iv. Animal Husbandry and Fisheries
v. Co-operation and Agricultural Marketing
vi. Health & Family Welfare
In this Report, the Commission, while giving department specific recommendations has
also made an attempt to indicate specific line of actions through systemic improvements,
particularly relating to ex-ante expenditure management practices and in the exercise of
control over expenditure by the legislature and the executive. The scope of utilising the
Social Audit mechanism for achieving effective control over expenditure on welfare schemes,
including expenditure made out of Government Grants by Special Purpose Vehicles, Trusts,
Charitable Institutions, etc., has also been explored. In order to strengthen the quality of ex-
ante expenditure management the Commission has specially recommended strengthening of
institutional capacity of pre-investment project appraisal and capital budgeting, in order to
ensure timely results for the resources used.

ERC Second Report 4
1.8 The prudent fiscal management principles mentioned in the 1st Report are reiterated
below in order to emphasis the need to internalise the same.
i. ‘State to make a systematic delineation of the responsibility of the state in terms
of direct provision, facilitation, regulation etc. Adequate allocation has to be
made for discharge of the basic functions of the State, viz. protection of life and
property of citizens and administration of justice.’ (Para 4.1).
ii. ‘Basic services like Primary Education, Public Health, Drinking Water,
Protection and Welfare of the Weaker sections of the Society should get
overriding priority in expenditure planning while ensuring high degree of
expenditure performance in relation to the objectives set for each of the
interventions. Education, Health, Drinking Water Supply, Sanitation, Social
Welfare etc., sectors should be insulated from any adhocism by earmarking a
reasonably prescribed minimum share in the GSDP, while also institutionalizing
reliable and transparent expenditure performance monitoring systems’. (Para
4.1).
iii. ‘Medium term expenditure estimates as provided in the Medium Term Fiscal Plan
(MTFP) of the Government year on year need to be firm, in order to minimise
variation between the planned estimates and actual expenditure. A more realistic
estimation based on more accurate forecasting of expenditure requirements in the
medium term will facilitate better fiscal management’. (Para 4.1).
1.9 In addition to the reports from the Consultants, the Commission has also sourced its
inputs, interalia from reports regarding international practices, the ERC recommendations of
the Central Government, recommendations of the Second Administrative Reforms
Commission media reports, etc. Going forward, a website is being hosted on FD’s web page
inviting suggestions from general public, NGOs and all other stake holders so that ERC
would suitably make use of the same in its next report.

ERC Second Report 5
Chapter 2
Review of Public Expenditure
2.1 In line with the fiscal management principles enunciated in the Karnataka Fiscal
Responsibility Act, 2002 and based on the review discussions held with the Departmental
officers, the Commission in its first report, made certain recommendations to ensure quality
of expenditure (Para 4.1). The Budget speech 2010-11 also reflects on the need for
internalizing such principles by administrative Departments (Para 295 and 299 of the Budget
Speech 2010-11). The focus of this chapter is on the need for increasing development
expenditure, including the quality in expenditure. In this regard, a discussion about the trends
in revenue and the expenditure, both capital and revenue, is required. This helps in taking an
appropriate view on the allocation favouring sectors which directly impact human
development vis-à-vis other sectors, which contribute to economic growth. Commission has
also considered that a review of the trends in expenditure by Karnataka Government and
resultant fiscal performance, in comparison with other states, would be very instructive, from
which valuable lessons can be learned.
Trends in growth rates (GSDP, Revenue and Expenditure) and Fiscal Performance for
the State
2.2 Karnataka is on the forefront of introducing measures for fiscal reforms measures
since 2000 followed by enactment of Karnataka Fiscal Responsibility Act 2002. Karnataka is
the first State to have achieved zero revenue deficit as early as 2006 and generating revenue
surplus there after. In the year 2009-10, the year following global economic slow down, with
the exception of Andhra Pradesh, Karnataka is the only State which has shown Revenue
surplus. Due to ever increasing expectations of the citizens, Governments constantly face the
challenge of creating fiscal space to meet competitive spending priorities. During this period
the State has managed to keep debt within the ceiling as mandated under KFR, besides
reducing the revenue deficit to zero.
2.3 The Expenditure trends on fiscal consolidation path under KFR reveal increasing
capital expenditure, with reduction in revenue expenditure, which is a kind of virtuous cycle.
Annexure-2d provides details of growth in Revenue, Expenditure and GSDP from the period
from 2003-04 to 2009-10. During this period, the State’s own tax revenue has an impressive
CAGR (Compounded Annual Growth Rate) of 17 percent while State’s share in Central taxes
and duties show a growth of 11 percent during the same period.

ERC Second Report 6
2.4 The State Government is generally able to meet expenditure on committed items like
Interest payments, subsidies, grants-in-aid, devolution to PRI, wages, salaries, pensions, etc.
During the period from 2003-04 to 2009-10 (BE) expenditure on all such committed items,
except devolution to PRIs, has declined. Such expenditure which was 153 percent of State’s
own revenue in 2003-04 has come down to 129 percent in 2009-2010 (RE). Similarly the
committed expenditure as a percentage of revenue expenditure which was 91 percent in
2003-04 has come down to 79.7 percent in 2009-10. During the same period the committed
expenditure as a percentage of GSDP remained more or less at 14, with marginal downward
changes in some years. However, during this period there has been a virtuous shift in the
items of committed expenditure. For instance, subsidy as a percentage of GSDP has come
down from 17 percent in 2003-04 to 14.6 percent in 2009-10(RE). Similarly interest burden
which was 29 percent of GSDP in 2003-04 has come down to 17.7 percent in 2009-
2010(RE). This period has witnessed increase in fiscal space as a percentage of GSDP from
1.34 to 3.27, while the increase in fiscal space as a percentage of revenue receipts has also
increased from 9.6 percent to 21 percent.
2.5 Table - 1 below provides a comparison of Major Fiscal Indicators for Karnataka with
other progressive states for the year 2009-10. It shows the de-composition of the indictors
which impact Gross Fiscal Deficit viz. Revenue deficit, Capital outlay, Net Lending and non-
Debt Capital Receipts. Karnataka’s fiscal performance is generally favourable as compared to
other states. As could be seen there-from, the non-development expenditure, as a percentage
of aggregate disbursement at 24.6 percent is lower in Karnataka as compared to other states,
except Andhra Pradesh. Similarly, Capital outlay as percentage to gross fiscal deficit is
highest indicating a higher percentage of borrowed funds towards capital formation. The net
Lending as a percent of Gross Fiscal Deficit is 11 percent as compared to the all States’
average of 4.6 percent. Expenditure of this nature points to the need for better monitoring of
funds which have been already invested into public sector entities vis-a-vis debt service cost
in future.

ERC Second Report 7
Table –1
Major Fiscal Indicators
Non Debt
Capital
Receipts/
Gross Fiscal
Deficit
2009-10 (BE) 2009-10 (BE) 2009-10 (BE) 2009-10 (BE) 2009-10 (BE)
Andhra Pradesh -14.9 111.3 3.6 22.6
Gujarat 32.2 65.9 1.9 30.0
Haryana 39.5 46.4 14.2 25.1
Karnataka -13.6 125.0 11.0 22.40 24.8
Kerala 53.0 30.1 17.0 0.02 38.9
Maharashtra 26.8 70.8 2.3 29.7
Punjab 64.5 36.8 -1.3 47.6
Tamil Nadu 8.7 85.2 6.2 31.3
All States (I+II) 16.2 80.3 4.6 1.11 31.2
Source : Statement 1: Major Fiscal Indicators, State Finances, A Study of Budgets of 2009-10, Reserve Bank of India, February 2010
Gross Fiscal Deficit = Revenue Deficit+Capital Outlay+Net Lending-Non Debt Capital Receipts
State
Net Lending/Gross
Fiscal Deficit
Non-
Development
Expenditure/
Aggregate
Disbursement
Revenue
Deficit/Gross
Fiscal Deficit
Capital
Outlay/Gross
Fiscal Deficit
(Per cent)
Trends in Components of Expenditure
2.6 Given that the capital expenditure is an important pre-requisite towards asset
formation and growth inducing development, a sound balance between Revenue and Capital
expenditure is recommended to achieve balance between expenditures on administrative
services (especially salaries and allowances) and critical infrastructural development needs.
Lack of such balance may result in situation where there are many teachers but too few or
poor quality classrooms and teaching facilities or large number of new hospitals, but
insufficient trained staff or inadequate maintenance. In this regard, an attempt has been made
to review the trends in Revenue and Capital expenditure across the Departments. Table-2
presents the Revenue and Capital Expenditure over the last twenty years i.e. 1990-91 to 2009-
10 covering the period before passing of KFR Act and the period after KFR Act. The
Revenue Expenditure in 2009-10 has more than doubled as compared to the year 2003-04
(2.3 times), while the Capital Expenditure for 2009-10 has not increased at the same pace
during the same period (1.94 times). There is more favourable infusion of capital
expenditure into Departments like Rural Development, Women and Child Development
Social Welfare, Agriculture & Horticulture, Education, etc. This indicates relatively more
asset creation in this sector as compared to pre-KFR Regime.

ERC Second Report 8
Table – 2
Revenue and Capital Expenditure (Karnataka over the years ) ` In lakhs
Total Total Total Total Total Total Total Total
1 Agriculture and Horticulture 11901.06 1657.39 59675.95 10.56 87037.55 817.34 132505.00 1150.00
2 Animal Husbandry and Fisheries 4824.43 474.20 16077.90 641.60 27683.34 4165.54 67189.53 4620.31
3 Finance 13317.14 1147.86 356486.22 905.44 407588.04 376.58 580600.51 12548.65
4Department of Personnel and Administrative
Reforms4100.61 890.00 16591.36 0.00 22080.42 11106.00 53464.95 0.00
5 Home and Transport 17049.72 3791.12 101048.53 7376.00 153062.07 46150.70 220247.32 38969.63
6 Infrastructure Development 0.00 0.00 62.69 12755.56 69.96 52238.12 459.06 39581.86
7 Rural Development and Panchayat Raj 31871.42 0.00 52889.81 23714.02 128112.92 148732.98 169595.81 146751.86
8 Forest Ecology and Environment 8315.76 61.61 35284.06 431.52 34796.66 1243.54 79702.62 295.57
9 Co-operation 4593.99 2190.99 12509.03 446.16 94922.50 3601.80 35502.96 3572.76
10 Social Welfare 13067.73 131.08 40760.13 17670.72 92570.60 32879.98 170309.94 23794.23
11 Women and Child Development 11902.55 70.00 34195.66 680.08 64012.67 517.30 133745.18 4779.36
12 Information Tourism and Youth Services 2080.71 55.00 6230.18 0.00 11864.63 800.00 24428.55 10673.45
13 Food and Civil Supplies 5305.09 0.00 21965.50 278.04 78163.50 20.00 120911.13 1800.00
14 Revenue 12460.95 207.41 82435.73 0.00 182560.67 2883.16 585847.26 11658.61
15 Information Technology 0.00 0.00 357.75 1529.44 1408.01 4074.34 3158.24 1450.44
16 Housing 1440.41 871.25 14883.27 0.00 26751.60 47027.86 61745.87 22268.03
17 Education 80187.96 17.88 374524.67 897.88 563884.63 10232.38 837014.51 20524.13
18 Commerce and Industries 20787.33 3447.47 51113.15 23657.74 134226.27 16841.90 84610.84 19097.73
19 Urban Development 9893.04 856.79 112500.34 50689.54 241502.96 75829.04 333922.28 132731.78
20 Public Works 21495.71 6395.41 43262.20 178774.16 134898.16 408243.72 109821.89 265592.44
21 Water Resources 23715.67 31970.66 19338.39 377986.90 29697.72 823707.54 33606.27 393639.88
22 Health and Family Welfare 22846.33 456.89 92059.14 7377.06 115912.28 29329.22 185431.32 32119.12
23 Labour 3340.93 0.00 10331.30 0.00 14007.04 14.26 34182.17 995.29
24 Energy 6343.12 36585.03 191497.23 117359.80 240245.21 86094.00 235284.95 175570.74
25 Kannada and Culture 500.67 0.00 3919.51 163.50 10183.14 364.52 19319.09 445.78
26 Planning, Statistics, Science and Technolgoy 353.46 0.00 2130.57 0.00 45305.32 0.00 55982.92 1300.00
27 Law 2927.50 0.00 15137.27 0.00 17654.23 0.00 28104.83 0.00
28 Parliamentary Affairs and Legislation 612.15 0.00 3104.45 0.00 4468.03 0.00 8047.43 0.00
29 Debt Servicing 48140.51 32361.13 371000.37 0.00 423639.79 0.00 527215.42 230832.85
TOTAL 383375.95 123639.18 2141372.36 823345.72 3388309.92 1807291.82 4931957.85 1596764.50
CapitalRevenue Revenue Revenue RevenueCapitalCapital
Expenditure
Capital
2009-10 (Provisional)2003-04
Expenditure Expenditure
2006-07
D.
No.Description
1990-91
Expenditure
Source: Summary of Appropriation Accounts, Finance Department.
Notes:
1 Figures as reflected in the Expenditure column (Voted + Charged) of Appropriation
Accounts Books of the respective years;
2 Earlier to 2003-04, the Demands were not fixed. The Demands depended on the
Portfolios of the Ministers. From 2003-04 and onwards the Demands are fixed. Efforts
have been put in to bring the Demands of pre 2003-04 also to the standard 29
Demands;
3 The Grant amount is the summation of Original Grants & Supplementary Grants as
reflected in the Appropriation Accounts of respective years which are brought out by
the Accountant General.
2.7 The CAGR of Government expenditure (allocation) as a whole during the period
2002-03 to 2009-10 was 13 percent whereas the CAGR of GSDP (current prices) was 14
percent . The growth in expenditure during this period was marginally lower as compared to
growth in GSDP. A comparison of year on year growth in Departmental expenditure as
compared to annual growth in GSDP shows a mixed trend. The Departments like Planning,
Programme Monitoring and Statistics (63 percent ), Food and Civil Supplies (29 percent ),

ERC Second Report 9
Co-operation (28 percent ), Women and Child Development (28 percent ), Information
Tourism and Youth Services (28 percent ), Information Technology (27 percent ), Urban
Development (27 percent ), Infrastructure Development (21 percent ), have a higher CAGR
i.e. allocation for these sectors are growing at a much faster rate than the State GSDP (current
prices) while the CAGR of allocation for Departments of Commerce and Industries (2
percent ), Water Resources (10 percent ), Health and Family Welfare (12 percent ), Energy
(11 percent ) i.e allocation for these sectors are growing at a rate much lower than the growth
rate of GSDP (current prices). The year on year growth of GSDP compared over the years
with the year on year growth rate of Government Expenditure on various sectors do not
reflect any particular trend either in favour of sectors that promote higher rate of growth or
directly impact human development. However, the State has complied with the numerical
targets set in Karnataka Fiscal Responsibility Act by eliminating Revenue deficit and limiting
the Fiscal deficit so far. Going forward, with effect from 2011-12, while complying with the
fiscal road map mandated by KFR Act (as well as accommodating the Government of India’s
decision on the recommendations (para 9.85 & 9.86) of the 13th Finance Commission, the
Government has to strike a balance between the need to contain public debt and the need to
enhance productive expenditure particularly (a) on Economic Infrastructure, Urban
Development, Energy, and Skill Development which impact economic growth with lower
time lag and also (b) on Education and Health which lead to immediate higher level of
human development and long term economic growth. Further, in order to ensure growth
inducing expenditure, the Commission is of the view that Finance and Planning Departments
need to undertake regular studies to identify the sectors which accelerate economic growth
and promote human development; and direct its expenditure accordingly as part of its long
term fiscal policy.
Social Services Expenditure
2.8 Karnataka’s share in Social Services expenditure as a percentage of aggregate
expenditure in comparison with other states is shown in Annexure-2a. The Social Service
expenditure mainly comprise of the following:
A. Education, Sports, Art and Culture
B. Medical and Public Health
C. Family Welfare
D. Water Supply and Sanitation
E. Housing
F. Government Servants (Housing)
With the exception of Maharashtra among the compared states, for 2009-10, Karnataka has
the highest percentage of expenditure on Social services (40.2 percent). The expenditure on

ERC Second Report 10
social and economic services which are key drivers of development expenditure has shown a
favourable trend during the decade. Expenditure on Education and Health account for the
largest share of development expenditure towards Social and community services and also
contribute positively towards the development needs of the State. The Compound Annual
Growth Rate (CAGR) for expenditure on social services which was 10.84 during the period
1991-92 to 2002-03 has increased to 16.17 during the period 2003-04 to 2010-2011 (BE).
Similarly, CAGR for economic services has increased from 10.34 to 14.39 during the same
period. The increase in both the services is more than the increase in the growth rate of
GSDP during the same period. The annual growth rate in GSDP (in current prices) was 9.8
percent during 1991-92 to 2002-03 while it was 14 percent (in current prices) during 2003-04
to 2009-10. The increased allocation in Social services however, paradoxically appear to be
slow in improving human development as reflected in HDI (Human Development Index) of
the State.
Major Components of Social Sector Expenditure – Health and Education
2.9 Within the social sectors, the expenditure on Education and Health in Karnataka as a
ratio of aggregate expenditure and compared with other progressive states in the country is
presented in the Tables - 3 and Table - 4 below. As could be noticed therein, over a period
of 10 years, the trend in expenditure is mixed. Except for four years, the expenditure recorded
was never above the national average. Considering the fact that literacy rate in Karnataka at
67 percent was just above the national average (2001 census), and that the obligations
associated with Right to Education that would befall on the State, there is a need to
consciously augment the expenditure on education with due regard for increasing
coverage and achieving better attainment level, particularly in backward regions.

ERC Second Report 11
Table – 3
State 2000-01 2001-02 2002-03 2003-04 2004-05 2005-06 2006-07 2007-082008-09
(RE)
2009-10
(BE)
1 2 3 4 5 6 7 8 9 10 11Andhra Pradesh 13.3 12.5 11.7 11.6 9.8 11.1 10.8 9.0 11.2 11.1
Gujarat 13.6 12.7 13.5 11.2 11.5 12.6 12.7 13.4 11.6 11.5
Haryana 14.6 13.8 13.7 10.2 11.6 13.4 11.9 12.9 15.3 16.8
Karnataka 17.7 16.0 14.8 12.9 12.7 14.0 13.1 14.4 16.1 14.9
Kerala 20.0 19.0 17.6 15.7 16.2 16.6 17.1 15.9 16.8 17.5
Maharashtra 22.3 22.1 18.9 15.5 14.0 15.7 16.4 17.2 16.3 16.2
Punjab 13.2 11.7 12.1 10.2 10.1 11.3 8.9 10.3 11.8 12.1
Tamil Nadu 18.0 17.3 13.8 12.6 11.2 13.6 12.2 12.7 13.8 14.9
All States 17.4 16.2 15.1 12.6 12.7 14.2 14.0 13.8 14.4 15.1
All States (Per cent to GDP) 2.8 2.6 2.5 2.3 2.3 2.2 2.2 2.1 2.4 2.6
RE: Revised Estimates. BE: Budget Estimates.
‘–’ : Not applicable/Not available.
* : Includes expenditure on Sports, Art and Culture under revenue expenditure and capital outlay.
Source: Budget Documents of the State Governments.
Expenditure on Education* – As Ratio to Aggregate Expenditure
(Per cent)
Source : Statement 41, State Finances, A Study of Budgets of 2009-10, Reserve Bank of
India, February 2010
2.10 The capital expenditure in education is increasing in the recent years, and can be
attributed to interventions though Sarva Shiksha Abhiyan, in which the State Government
jointly shares the costs. The expenditure on Education has increased from ` 910 crore in
1991-92 to ` 10,055.72 crore in 2010-11 (BE) registering a Compound Annual Growth Rate
(CAGR) of 13.65 percent. However, the relative share of education expenditure which was
52 percent of total expenditure on social and community services in 2001-02, has declined to
41 percent in 2010-11 (BE). As per the education development index (primary level)
computed by the Ministry of HRD, the State has moved up marginally from 0.627 in 2005-
06 to 0.693 in 2008-09, but its ranking among the states has seen a downward shift. The
State had slipped from a 3rd
position in 2005-06 to 5th
position in 2008-09. The deterioration
in upper primary level is also similar, with a downward shift from 3rd position to 7th
position
during the same period. Further, although Karnataka has achieved a considerable level of
elementary education in the State, investments towards female literacy levels in the State
needs to be augmented by ensuring adequate infrastructure facilities at schools for girl
students. The Commission, in its first report had made twelve recommendations to address
the issues relating to this sector. While reiterating the Government to consider those
recommendations, in this report too, some recommendations are being made in the chapter
dealing with education Department.

ERC Second Report 12
2.11 The expenditure on Health sector has grown at a CAGR of 12 percent during the years
2002-03 to 2009-10. As a percentage of GSDP, expenditure on Health sector, which was 0.65
percent in 2003-04, has increased to 0.85 percent in 2009-11. However, urban health and
medical education, and general health constitute close to 90 percent of total expenditure on
medical and public health. The rural health is mostly covered under National Rural Health
Mission (NRHM). However, it is noticed that funds, measured in per capita terms, under
NRHM are not being allocated giving due weightage to backwardness of districts. In other
words the districts that are better off are getting more funds under NRHM than back-ward
districts. There is a case to allocate funds under NRHM through better planning with
greater focus on equity, giving consideration to skewed and uneven capital investment
already made in Primary health care system in the districts. Investment in Health sector in
the State needs to be channelized appropriately to achieve higher levels of technical
efficiency1 in spending as compared to other states.
Table – 4
State 2000-01 2001-02 2002-03 2003-04 2004-05 2005-06 2006-07 2007-08 2008-09 (RE) 2009-10 (BE)1 2 3 4 5 6 7 8 9 10 11
Andhra Pradesh 4.7 4.4 4.0 3.7 3.2 3.4 3.3 3.3 3.4 3.8
Gujarat 3.4 2.8 3.2 2.7 2.8 3.1 2.9 3.2 3.0 3.4
Haryana 3.3 3.0 3.3 2.4 2.7 3.1 2.5 2.6 3.1 3.2
Karnataka 5.1 4.9 4.2 3.4 3.0 3.3 3.1 3.8 4.2 3.9
Kerala 5.3 5.8 4.8 4.3 4.5 4.7 4.9 4.5 4.7 4.7
Maharashtra 3.9 4.3 3.7 3.2 2.7 3.2 3.1 3.5 3.4 2.8
Punjab 4.5 3.9 3.5 3.0 2.9 3.4 2.7 2.9 3.6 3.1
Tamil Nadu 4.9 4.9 4.1 3.8 3.2 4.2 3.3 3.3 3.8 4.8
States 4.6 4.4 4.0 3.4 3.4 3.9 3.9 3.8 4.1 4.2
All States (per cent to GDP) 0.7 0.7 0.7 0.6 0.6 0.6 0.6 0.6 0.7 0.7
Source: Budget Documents of the State Governments.
Expenditure on Medical and Public Health and Family Welfare* –
As Ratio to Aggregate Expenditure
(Per cent)
RE: Revised Estimates. BE: Budget Estimates.
‘–’ : Not applicable/Not available.
* : Revenue Expenditure and Capital Outlay.
Source : Statement 42, State Finances, A Study of Budgets of 2009-10, Reserve Bank of
India, February 2010
2.12 As could be seen from Table-4, although Karnataka is better placed compared to
some other states, in terms of expenditure on health as a percentage of total expenditure, the
ISEC (Institute for Social and Economic Change) study has found that there is a gap in the
efficiency in health sector expenditure in the State. In this regard, the actual health
parameters achieved were compared with the potential improvement to be achieved, by
standardising the same to the health expenditure efficiency parameters of Kerala. In order to
1 Technical efficiency is defined as attained levels of output as a ratio of ouput/outcome to the potential
obtainable.

ERC Second Report 13
realise full potential of Government expenditure, and to achieve Millennium Development
Goals (MDGs) by 2015 the State needs to reorient its strategy particularly focusing on
decreasing the gap between potential and actual Infant Mortality Rates (IMR), Maternal
Mortality Rates (MMR) and improving other health indicators viz. Life Expectancy at
Birth, Institutional births and Immunization, etc.
2.13 To appreciate public investments in human development objectively, a methodology
was introduced by UNDP in its 1991 HDR for Financing Human Development using four
ratios which are (i) the Public Expenditure Ratio (PER) i.e. the percentage of national
income that goes into public expenditure; (ii) Social Allocation Ratio (SAR) or the
percentage of public expenditure earmarked for social services; (iii) Social Priority Ratio
(SPR), i.e. the percentage of social expenditure devoted to human priority, which include
elementary education, rural health care, public health, family welfare, nutrition, water supply
and sanitation; and (iv) Human Expenditure Ratio (HER) which is the percentage of national
income devoted to human priority concerns.
Human Development Report for Karnataka was first published in 1999 with some marginal
changes in this definition, more particularly relating to public Expenditure Ratio. Unlike
UNDP definition, in Karnataka’s first HDR, the Public Expenditure Ratio had been modified
to revenue expenditure as a percentage of State Domestic Product. A recent exercise in this
regard (i.e., human development expenditure) has been conducted by (National Institute of
Public Finance and Policy) NIPFP, New Delhi, the results of which are at Annexure-2e. The
NIPFP study provides the Human Development Expenditure as percentage of GSDP, Social
Priority Ratio and Human Development Expenditure as percentage of Total Expenditure for
the period 1987-88 to 2008-09. The NIPFP draft paper, January 2010 was accessed from the
website on 29th
January, 2011. This study relies on UNDP’s analysis on the subject. It is
found that the Social Priority Ratio has generally gone down in most of the major states in
India. In Karnataka, it has gone down from 41.02 (in 1987-88) to 34.58 (in 2007-08). This
trend has to be reversed, while increasing the share of development expenditure in the budget,
greater priority has to be given to social priority sectors, like elementary education, rural
health, public health, water supply and sanitation, etc. Similarly, Human Development
Expenditure as percentage of GSDP has gone down practically in every major State during
this period. In Karnataka, this ratio went down from 8.21 in 1987-88 to 7.39 in 2007-08.

ERC Second Report 14
A comparison of the HDI rankings for the States of India are shown in Annexure-2f. During
the period 1981-1991, states like Madhya Pradesh, Rajasthan improved their rankings among
the States of India with respect to HDI. More importantly, Tamil Nadu’s ranking has
improved from seventh position to third position during the same period. On the other hand,
Karnataka which was placed at 6th rank in 1981 slipped to 7th rank in 1991. Also, during the
period from 1991 to 2001, the HDI ranking of the States like Uttar Pradesh, Rajasthan,
Orissa, and Madhya Pradesh has improved, Karnataka’s ranking remained unchanged at 7th
rank.2 Tamil Nadu continued to be in the 3rd position in 2001 ranking. This implies that (a)
Karnataka has a long way to go to improve human development situation in the state, (b)
there is a need to have more focussed investment on sectors and the sub-sectors that promote
human development, and (c) the program implementation machinery is not efficient enough
to ensure value for money. There is a need for Karnataka to closely monitor the outcome
derived from the expenditure made by the State towards Human Development Indictors at
regular intervals.
2.14 Since Per Capita income is an important component in Human Development Index,
rate of growth of GSDP also needs to be analysed in this context. During the period 2003-04
to 2008-09, Karnataka’s average growth rate in GSDP (constant prices) was 8.1 percent,
which was marginally above all India growth rate of 7.83 percent. Some of the major states
which have registered higher growth rate than Karnataka are Kerala, Maharashtra, Haryana,
Gujarat, Bihar, Orissa.3 The key concern is that Karnataka, despite being a favoured
destination for Foreign Direct Investment (FDI) and a major hub of Information Technology
(IT) is unable to register higher growth rate in GSDP during this period implying that growth
of Karnataka’s economy has been Bangalore centric and there has not been significant
increase in economic activities (value-addition in different productive sectors) in the districts
outside Bangalore. The Planning Department has to undertake a study to identify the sectors
which can promote higher growth in Karnataka with better regional distribution. Apart from
Government Investment, appropriate policy measures have to be taken to secure more private
investment to achieve these goals.
2NHDR – Planning Commission 2001.
3 Real Growth Rates of States (GSDP% at Constant Prices as on 26.04.2010), http://planningcommission.nic.in/
dated 10.01.2011

ERC Second Report 15
Summary and Concluding Recommendations
2.15 Karnataka Fiscal Responsibility Act, recognizing the criticality of Human
development or Human welfare, seeks to protect expenditure on Health and Education even
during times of fiscal duress. The Medium Term Fiscal Plan (MTFP) has to lay down explicit
strategy of planning Government expenditure to promote growth and welfare. Considering
the fact that money spent is not leading to desired increase in the level of human
development, there is need to regularly review the budget allocations, expenditure incurred
and its outcome, specially in Social priority sectors. In this regard, the Thirteenth Finance
Commission report contains recommendations to set up an effective institutional mechanism
to monitor fiscal performance in relation to the mandate under Karnataka Fiscal
Responsibility (KFR) Act. The TFC recommends (paras 9.65 and 9.66) setting up a
Committee for annual independent and public review of KFR compliance. The TFC also
provides steps to evolve the Committee into a full fledged Fiscal Council.
2.16 Clearly, there is a need to closely monitor the outcome derived from the expenditure
made by the State towards Human Development Indictors at regular intervals. Annexure-2b
provides a district wise performance of the HDI indicators for Karnataka State. Given the fact
that HDI in backward regions is much below the State average, the regional inequalities
remain a matter of serious concern and need to be addressed by not only increased allocations
but also with effective planning and management of programmes/interventions and better
deployment of personnel ensuring adequate number of teachers and doctors in the backward
regions.
2.17 There is a need to regularly ascertain the impact of capital expenditure on GSDP, in
order to prioritize Government expenditure, and to provide impetus to economic growth as
required under Karnataka Fiscal Responsibility Act, 2002. This task needs to be undertaken
jointly by Planning and Finance Departments. While considering the expenditure priorities,
the Government has to take into account the overall impact of schemes and programmes on
growth and welfare by balancing efficiency and equity. Most of the projects, programmes,
and schemes have been started without stating the objective and outcome in clear and
measurable terms. Keeping this in mind, the Commission would advocate Government’s
immediate action, towards merger of the schemes which have common objective and outputs,
ensuring that they are aligned with the overall objective and mandate of a Department. This
would require structured and effective inter-Departmental consultations.

ERC Second Report 16
Chapter 3
Pre-Investment Project Appraisal
3.1 The Commission in its First Report (February 2010) had made the following
recommendations, based on findings from various studies that it had commissioned, while
keeping in view at the same time the generally accepted principle that the public expenditure
decisions ought to be based on (a) a realistic view of their costs, (b) overall affordability and
(c) difficulties in reversibility of unproductive expenditure:
(i) every department should disclose key goals for its operations so that all
interventions /schemes are benchmarked against such goals (para 1(iii) Chapter
4);
(ii) all schemes/programmes/projects to have a sunset clause indicating the
goals/objectives to be achieved, and specifying the terminal year in which such
projects to be closed (para 1(iv) Chapter 4);
(iii) all departments should be directed to carry out such exercise annually w.e.f FY
2010-11 (para 1 (v) Chapter 4).
(iv) the expenditure planning and management aspects need to be adequately
strengthened to facilitate formulation of alternative choices for informed
decisions; the need is also emphasised for using ex-ante expenditure
management tools for investment/project appraisal through an institutionalised
approach (para 3 of 4.1 Chapter 4).
3.2 The Government has taken the above recommendations on board as reflected in the
Medium Term Fiscal Plan(MTFP) 2010-14, presented to the Legislature as required under
the provisions of Sec 3 of the Karnataka Fiscal Responsibility Act 2002.i These
recommendations were incorporated in Chapter 6 of MTFP, as part of the inputs for Public
Finance Management & Systemic Reforms. To take forward the intended reforms within the
existing legal frame-work relating to budget management and fiscal responsibility,
Government must address medium-term reform challenges, viz. revisiting expenditure
priorities through systemic approach particularly to capture early warning signals and
switch expenditure between mandatory expenditure, entitlement based expenditure, benefit
inducing discretionary expenditure and tax expenditure which are more explicitly stated
below.

ERC Second Report 17
a) mandatory expenditure implies expenditure on sovereign functions, transfers
to local bodies, wage bill, programmes supported by Central Government with
mandatory contribution by State Government etc.,
b) eligibility /entitlement based expenditure is meant for backward area
development, welfare of the vulnerable sections like SCs and STs as also
women through gender budget policy etc.,
c) benefit inducing discretionary expenditure implies expenditure on items like
scholarships, health insurance, across the board subsidies etc.,
d) tax expenditure or revenue sharing agreements include tax exemptions
(revenue foregone) and concessions to SPVs/PPP etc.,
3.3 A systemic review, aligned to medium term fiscal plan would help in re-prioritising
the expenditure not only at the beginning of the fiscal year but also in avoiding spending
surprises before the close of the year. Such an exercise requires a credible and a systemic
support in the form of ex-ante investment/ project appraisal within the line departments and
also in Finance department. This chapter addresses issue relating operationalising the above
recommendations.
3.4 Subsequent to the presentation of MTFP to the State Legislature, the Government
vide Order No. PD 5 IMM 2010 Dated 3rd
April, 2010 has modified the procedure for the
sanction of ongoing Plan schemes, modifications thereon, and new Plan Schemes. By virtue
of these orders, new Plan Schemes with an outlay of more than ` 5 crore require approval of
the Cabinet. An Empowered Committee has been constituted to consider proposals for less
than ` 5 crore. Government Orders No. PD 14 IPR 2007 dated 13th
October 2008 specifies a
“Systemic Framework for appraisal of Plan Schemes” with an outlay of ` 5 crore and above.
3.5 During the course of discussions with the officials of several departments and also
during the field visits by the Commission, it emerged that the heads of the departments or
principal secretaries of line departments are sometimes unaware of the new schemes until
announced through budget speech. The Commission acknowledges that resource allocation
through annual budget exercise is necessarily a political process. However, if schemes are
announced without having had an appraisal through an efficient institutional mechanism and
defined processes, this could result in uncertainty in actual outcome from the investments so
announced. While such budgetary announcements/commitments have potential to create

ERC Second Report 18
undue pressure on available fiscal space the expenditure made on them runs risk of yielding
unproductive results or unintended negative outcomes. Besides, the projects without an
objective appraisal are likely to run the risk of under provision at the beginning of the project,
and consequently continue to create an open-ended pressure on resources, beyond target date
set for completion of the project. For example the Bhagyalakshmi Scheme, prima facie,
appears not to have been appraised in its full ramifications that may arise after 18 years of its
launch, and the unintended benefit derived by LIC - the partner in implementation of the
Scheme.
3.6 Further, the line departments having not prepared their action plans would have to
face operational problems in re-aligning the priorities for implementation and in redeploying
available human resources to match the requirement of newly announced schemes. The re-
alignment process could lead to time over-runs with a possible spiral effect on overall project
costs. It could also lead to rush of expenditure at the end of the year.
3.7 At times, launching of new schemes without institutionalised investment appraisal,
particularly when such schemes/programme/projects are not part of the budget proposals,
including supplementary budget, could run the risk of violating the Constitutional provision
under the Article 205, which mandates approval of Legislature to introduce a new scheme or
a new component for an existing scheme. The Audit Report (State Finances 2009) for the
year ended 31st March 2009 lists out several such violations.
3.8 Further, lack of ex-ante investment/project appraisal also makes monitoring and
evaluation of the schemes/projects/programmes very difficult leading to unending
continuance of schemes. In the absence of expenditure proposals based on appraisal from
the line departments, the Finance Department and the Planning Department are deprived of
information to objectively evaluate technological options, efficiency of expenditure, risks
to commercial viability as also the financial, economic & social costs of proposed
expenditure. As such the prudent assessment of durability and sustainability of
project/schemes in relation to the objectives, and the relative priorities of projects/schemes to
be launched, expanded, or modified becomes a casualty. In other words, effective planning
and monitoring of projects for timely and productive expenditure, which is critical for
disciplined budget management are currently missing. This view is also borne by the
observations by Comptroller and Auditor General (C&AG) of India in their Audit Report for
the year ended March 2009, on the basis of sample of irrigation projects. The C&AG Report

ERC Second Report 19
has observed that “The delay in implementation of projects could have been avoided with
better planning and monitoring”. Learning from the CAG observations, the Commission
recommends that the government should quickly prepare a complete investment/project
plan to utilize the additional Krishna water, that is available due to the recent Tribunal
award.
3.9 The line departments generally take a narrow view of their investments due to their
limited mandate and jurisdiction. Hence, it is the Finance Department and Planning
Department which have to dovetail their proposals into macroeconomic context and fit into
overall medium term budgetary framework by ensuring macro fiscal control, micro fiscal
control and the allocative efficiency. Therefore, the Commission recommends that an
institutionalized process for effective and timely appraisal of investment requires to be put
in place in the Finance Department, in the form of creating a separate Division for
appraisal called Project Appraisal Division (PAD). The Commission is also of the view
that the institutional processes should be able to bind the line departments in spending the
budgetary allocation and delivering the expected outcomes for the money so allocated by the
legislature. Therefore PAD should have some degree of independence and a code for
transparent methods of appraisal. This helps in avoiding the principal and agent problem
often faced by the Finance Department, while dealing with the line departments. The
modalities for the institutional arrangements can be largely drawn from those prevalent in
Government of India. Further, the Commission takes note of lessons from USAID Reform
project in making this recommendation. (The differentials in the existing guidelines of
Karnataka vis-a-vis that of Government of India are shown at Annexure-3a. The suggested
process of institutionalising PAD is at Annexure-3b).
3.10 In this context, the Planning Commission has recently set up Expenditure Reforms
Committee under the Chairmanship of Dr. Rangarajan. One of the ToRs of the said
Committee is to look into artificial separation of expenditure into Plan and non-Plan
categories. Therefore, until a view is taken on this issue, the PAD may deal with appraisal of
Plan programmes/schemes/and projects by actively involving the Planning Department, while
for those of non-Plan category schemes/programmes/projects, the FD may take a view on its
own.
3.11 The KFR Act 2002 vide Sec 4 (c)ii mandates the government to ensure that the policy
decisions of the government have due regard to their financial implications on future
ERC Second Report 20
generations, while Sec 4(i)iii
mandates the government to pursue expenditure policies that
would provide economic growth, poverty reduction and improvement in human welfare.
Thus, government has to appraise the expenditure/investment to assess the impact of
expenditure on economic growth, poverty and human welfare. In this context use of the
existing investment appraisal guidelines issued in 2008 can make a good beginning.
However, implementing these guidelines requiring sophisticated skills not only within the
Finance Department, Planning Department and the line departments but also across the line
departments. Presently, such skill sets do not seem to have been identified to engage the
departments in an institutionalised environment. The templates are highly data-intensive1
as compared to the availability of credible data in the departments. Therefore, the
Commission is of the view that while retaining the generic character of guidelines
(Annexure-3c) on pre-investment appraisal already issued, there is a need for specific
guidelines, templates, definitions suited to sectors as diverse as Education and Health,
Road and Transport, Irrigation, Agriculture Extension, Electricity, Water supply, Tourism,
Waste Management etc., Creation and use of such standardized templates and methods of
analysis would enable the government in effectively responding to judicial scrutiny2
as
well as in meeting citizens’ demand for disclosures under RTI Act.
3.12 The existing Government Orders relating to Appraisal are made applicable uniformly
to all schemes/projects above ` 5 crore. This limit needs to be reviewed keeping in view the
capital intensity of infrastructure projects vis-a-vis social sector projects including the social
sector projects under PPP mode. For infrastructure sector, the cut-off limit may be kept at
` 10 crore i.e. all infrastructure projects above ` 10 crore should be subjected to detailed
Social Cost:Benefit analysis.
3.13 The Framework referred in para 4 above has been supported by exhaustive templates
along with detailed guidelines. These guidelines (Annexure-3a) are applicable to all projects,
implemented by Government Departments, PSUs, SPVs, Local bodies and also to PPPs
including those which receive any guarantees from government. However, there is no
evidence of these templates having been used effectively. Mostly, due to lack of institutional
discipline, which ought to have insisted for pre-investment project appraisal. The
Commission is of the view that the task of using those templates is very challenging as
compared to the availability of data and skill sets in various the departments. Therefore, the
1 Views expressed by the middle level officers during the course of a training programme on Balance Sheet Analysis conducted by Fiscal
Policy Institute in Nov 2009.
2 For eg: The Karnataka High Court observation in the context of notification issued by KAIDB for acquiring 1069 acres of land for Aero-
space works project near Bangalore Airport, Devanahalli. The Indian Express, January 2, 2011, Bangalore Edition.

ERC Second Report 21
Commission recommends that Finance Department as also the Planning Department
should give sector specific guidelines, with examples based on case studies. Such, case
studies along with necessary tool-kits should be evolved and made available in English as
well as Kannada on Finance Department website. The tool-kit should contain customized
software matching the guidelines, updated discount rates, desirable rates of returns etc.,
along with examples separately for social sector, infrastructure, etc.
3.14 On the strength of interactions and the feed-back received from the consultants, the
Commission recognises that the departments do not have in-house capacity and are not
geared up to undertake the technical responsibilities for investment appraisal. Accordingly,
the Commission recommends the Government to create a pool of in-house experts in each
department and also put in place a technical support team of professionals to service the
Empowered Committee (or Cabinet Committee in case of investments above` 5 crores),
which has been set up in Finance Department to consider investments below ` 5 crore,
as also to provide analytical inputs that go into cabinet notes for projects above ` 5
crore. Similarly, each department should have a team of five to six competent officers
with updated skills in pre-investment appraisal. All the team members be periodically
given training required to implement the guidelines, use the department specific
templates, and maintain a data-base on a sustainable basis. The team should be able to
effectively and transparently control the quality of investment appraisal done by outsourced
agencies. The Fiscal Policy Institute which is going to be functional soon can be geared up to
provide sustainable support to all such teams. This fits into the mandate of FPI.
3.15 In this context it is also relevant to take note of the recommendations of 13th
Finance
Commission, wherein the Commission has recommended restructuring of State Public Sector
Undertakings in order to assess and enhance their financial viability and sought an
institutional mechanism to be put in place by March 2011. (para 7.97 and 7.98 of 13th
FC
Report).iv
Therefore, the support system and the teams to be created for Pre-Investment
Project appraisal in Finance Department can be designed to provide suitable support to the
restructuring process of State Public Sector Undertakings as and when the government
decides to comply with the said recommendations.
3.16 Further, the Fiscal Management principle enunciated under the provisions of Sec. 4 (l)
of KFR Act 2002v seeks the government to disclose sufficient information to allow the public
to scrutinise the conduct of fiscal policy and the state of public finances. The Commission

ERC Second Report 22
therefore recommends that the agenda for the meetings of the Empowered Committee,
chaired by Addl. Chief Secretary and also any similar institutions that may be constituted
in future, should be disclosed in public domain, at least one week before the meeting while
the summary of decisions taken at those meetings also be disclosed every month either by
Finance or the Planning Department.

ERC Second Report 23
End Notes:
i Karnataka Fiscal Responsibility (KFR) Act 2002, Sec 3
3. Medium Term Fiscal Plan to be laid before the Legislature.- (1) The State Government shall in each financial year lay
before both Houses of the Legislature a Medium Term Fiscal Plan along with the annual budget.
(2) The Medium Term Fiscal Plan shall set forth a four-year rolling target for the prescribed fiscal indicators with
specification of underlying assumptions.
(3) In particular and without prejudice to the provisions contained in sub-section (2), the Medium Term Fiscal
Plan shall include an assessment of sustainability relating to,–
(i) the balance between revenue receipts and revenue expenditures;
(ii) the use of capital receipts including borrowings for generating productive assets.
(4) The Medium Term Fiscal Plan shall, inter alia, contain,–
(a) the medium term fiscal objectives of the State Government;
(b) an evaluation of the performance of the prescribed fiscal indicators in the previous year vis-à-vis the
targets set out earlier, and the likely performance in the current year as per revised estimates.
(c) a statement on recent economic trends and future prospects for growth and development affecting fiscal
position of the State Government.
(d) the strategic priorities of the State Government in the fiscal area for the ensuing financial year;
(e) the policies of the State Government for the ensuing financial year relating to taxation, expenditure,
borrowings (including borrowings by Public Sector Undertakings and Special Purpose Vehicles and other
equivalent instruments where liability for repayment is on the State Government, with ceiling fixed for each
agency) and other liabilities, lending and investments, pricing of administered goods and services and
description of other activities, such as guarantees and activities of Public Sector Undertakings which have
potential budgetary implications; and the key fiscal measures and targets pertaining to each of these;
(f) an evaluation as to how the current policies of the State Government are in conformity with the fiscal
management principles set out in Section 4 and the fiscal objectives set out in the Medium Term Fiscal Plan.
(5) The Medium Term Fiscal Plan shall be in such form as may be prescribed.
ii KFR Act 2002 Sec 4 (c)
Fiscal Management Principles.- (1) The State Government will be guided by the following fiscal management
principles:
(c) ensure that policy decisions of the Government have due regard to their financial implications on future
generations;
iii KFR Act 2002 Sec 4(i)

ERC Second Report 24
Fiscal Management Principles.- (1) The State Government will be guided by the following fiscal management
principles:
(i) pursue expenditure policies that would provide impetus for economic growth, poverty reduction and improvement
in human welfare;
iv 13th
FC Report Para 7.97 and 7.98
Restructuring/Divestment/Privatisation
7.97 The State Governments should actively consider withdrawal/reduction of SPSUs in non-welfare and non-utility
sectors. There is an immediate need to reduce the number of SPSUs in most of the states as the large number of such
enterprises not only engages the productive assets of the government, but also promotes inefficiency due to lack of
proper monitoring by the State Governments. Divestment and privatisation should also be considered and actively
pursued.
Institutional Mechanism
7.98 In order to design suitable strategy and policies and oversee the process of restructuring, including
disinvestment/privatisation, a task force may be constituted. This task force should suggest unit-wise specific steps to
be taken for restructuring with regard to both working and non-working companies. A Standing Committee on
Restructuring under the Chairmanship of the Chief Secretary may also be constituted to operationalise the
recommendations of the task force. To advise the Finance Department on restructuring/divestment proposals an
independent technical secretariat may also be set up by the states.
v KFR Act 2002Sec. 4 (l)
Fiscal Management Principles.- (1) The State Government will be guided by the following fiscal management
principles:
(l) disclose sufficient information to allow the public to scrutinize the conduct of fiscal policy and the state of public
finances;

ERC Second Report 25
Chapter 4
Legislative Control over Expenditure
4.1 The traditional role of legislature interalia, relates to checking the executive plans and
proposals through annual budget exercise. The Indian constitutional arrangements provide for
legislative control over executive through clearly defined institutional arrangements. Such
arrangements, within the legislature, mainly cover the areas of taxation, appropriation of
expenditure, and devolution of funds. The Legislative Committees are engaged in the
examination of reports from Comptroller and Audit General of India (C&AG). However,
after passing of fiscal responsibility legislation the role and character of legislature‟s control
over executive is progressing towards better fiscal management through setting-up of
medium term fiscal plan/targets and seeking accountability through ex-ante disclosures and
ex-post reporting. Karnataka is the first State to have passed fiscal responsibility legislation
viz., Karnataka Fiscal Responsibility Act, 2002 (KFR Act).
4.2 The overarching objective of the KFR Act is to improve fiscal discipline by
committing the government to annually disclose and implement a monitorable fiscal policy
within a medium term framework. While numerical targets like limits on revenue deficit,
fiscal deficit, guarantees etc., are measurable and hence easily monitorable, the commitments
like adherence to fiscal management principles [Sec.4 (1) ],i ensuring fiscal transparency
[Sec.5]ii requires a demonstrated ownership of the MTFP and a dedicated institutional
arrangement for compliance. The scope of this chapter is limited to discussing the legislative
control over expenditure in the context of fiscal reforms with reference to relevant provisions
in the Act. Accordingly this chapter deals with issues relating to managing „ Revenue
surplus‟, introduction of Capital budgeting, aligning annual budget to MTFP as required
under the law, upgrading the quality of MTFP as suggested by 13th
Finance Commission,
and institutionalising programme Performance Budgeting (PPB) as recommended by the
Estimates Committee 2006-07 (Annexure-4 a).
4.3 The KFR Act, interalia, seeks to maximise developmental expenditure while
enhancing the scope for improving social and physical infrastructure and human development
while also achieving revenue surplus. The law has determined end of FY 2005-06 for the
government to achieve Zero Revenue deficit, which was achieved. Thus Karnataka became
the first State to do so. Simultaneously, post 2005-06, the government was expected to build
sufficient Revenue surplus for use in capital formation as mandated under the provisions of
Sec.4(1)(j) of the KFR Act.iii
The law although specified the purpose for which the revenue
surplus to be used, it left the onus of defining „adequacy‟ to the executive with reference to
the commitments made in the preamble to the Act. There is no evidence for the government
having defined „adequacy‟ so far, and no evidence as having put in place a mechanism to

ERC Second Report 26
utilise surplus so generated every year. Therefore, the Commission recommends that the
Finance Department should define adequacy in Revenue surplus and put in place a
mechanism to utilise Revenue surplus generated every year for use in capital formation as
mandated under the provisions of Sec. 4(1)(j) of the KFR Act. In this regard, Government
may exercise options either to allocate more funds towards capital expenditure using the
Revenue surplus of the same year or to commit future capital expenditure on a medium
term framework. Alternatively, the government may defer any expenditure in favour of
creating Revenue surplus which may occur either due to tax collections exceeding the
target or any windfall gains from non-tax revenue. Commission recommends Government
to put in place a formula defining adequate revenue surplus and a mechanism for the use
of surplus so created in favour of capital expenditure.
4.4 Further, Sec.6 (4)iv
of the Act mandates the government to protect certain expenditure
declared in the MTFP as high priority development expenditure. The high priority areas inter
alia, include elementary education, basic health and rural water supply as mentioned in the
Act. Generally, it is found that Chapter 5 of the MTFP discusses priority development sectors
viz., Rural Development, Health & Education, Agriculture, Power/Energy, Urban
Development. However, the quality and depth of discussion is limited to allocations made in
the Budget Estimate (BE) of the year and Revised Estimate (RE) of the previous year. No
analysis of these sectors in a medium term framework is being reported or analysed.
Therefore, the Commission is of the view that MTFP (Medium Term Fiscal Plan) requires
to be made with rigour of analysis and forecast with verifiable assumptions, so that the
annual budget exercise is anchored to MTFP in the manner as intended in the legislation,
more particularly in the context of the departments engaged in spending high priority
development expenditure.
4.5 The provisions in Sec. [4(1)(j)] iii of the KFR Act, point to „building up revenue
surplus‟ for use in capital formation and productive expenditure. The mandate to protect high
priority expenditure, in a way should enable the government to put in place medium term
capital budget to be expressed through MTFP. This can be done within the existing legal
framework. The ERC, in its first report (chapter 2, para 2) recommended that capital
expenditure to be pegged at least at 5 percent of GSDP. Without going into the debate on
equating Development expenditure with Capital expenditure and vice versa, the Capital
budget is referred in the context of capital formation. Because such expenditure normally
results in creating new economic infrastructure or strengthening of existing infrastructure
relating to Roads, Airports, Power sector, Irrigation, Urban Transport, Water Supply etc.
Such Capital budgeting is likely to improve the framework for decision making processes for
annual budget allocation and for using the funds for asset creation. Such a medium term
capital budgeting ensures the medium term certainty in planning and executing the projects in
time. The funding for such budget could, inter alia, come from the borrowings, revenue

ERC Second Report 27
surplus and project specific grants/transfers from government of India. For instance, such a
capital budgeting can be considered for taking full advantage of Krishna Water Tribunal
Award in the shortest possible time, with certainty. Similarly all the externally aided
projects also can be subjected to medium term capital budgeting. In this regard, the
experiences associated with delay in finalising Appendix-E in the Public Works Department
is very instructive. Often PWD finalises Appendix-E in 3rd quarter or sometimes in 4th
quarter of the year. In the absence of Appendix-E, the field level persons of PWD are unable
to firm up their respective Monthly Programme Implementation Calendar (MPIC) and thus
are deprived of utilising the allocated funds according to pre-specified plan of action.
Therefore, the Commission, while emphasising the need for preparing Appendix-E, at the
beginning of the year, also recommends that Appendix-E relating to civil works requires to
be prepared at the beginning of the year. The government needs to explore the feasibility
of using MTFP to prepare a Capital budget for major projects which should be, normally
understood and treated as a non negotiable commitment to be honoured in the following
year and until the project comes to a conclusion. However, if any deviations in the capital
budget so prepared have to be induced by policy driven exigencies or for political-
economy reasons, such deviations along with the reasons can be disclosed to the
legislature as provided under Sec. [5(2)(a) of the KFR Act 2002].v
4.6 Absence of linkage between Annual Budgetary exercise and the MTFP at the state
level makes the document to stand out as a mere statement of intention, and falls short of
being a statement of commitment on the part of the Government. Moreover, the compliance
required under Sec.[6(1)] of KFR Act 2002vi
makes it mandatory for the Government to
prepare Annual budget, and policies announced at the time of budget, to be consistent with
the objectives and targets specified in the MTFP for the coming and future years. Infact, post
KFR Act, a related legislation „Karnataka Local Fund Authorities Fiscal Responsibility Act,
2003‟ (KLFAFR Act) was also enacted. The said Act, mentions a decision as having been
made by the Government, which mandates that the MTFP be disintegrated on departmental
lines and prepare Departmental Medium Term Fiscal Plan for department along with MTFP
for the entire state.vii
The said decision, if implemented ought to result in each department to
prepare a departmental MTFP, which would be integrated into State MTFP to anchor their
annual budgetary allocations. Accordingly, the Commission recommends that decisions
relating to MTFP preparation and linking it to departmental MTFP as already committed
by Government to the Legislature through KLFAFRA 2003, need to be institutionalised
along with an efficient support system. Government needs to ensure linkage between
Annual Plans and MTFP in Local Bodies as required under KLFAFRA 2003. The
Commission is constrained to note that the Rules required under KLFAFR Act are yet to
be notified.

ERC Second Report 28
4.7 The Commission recognises that an analytical reporting of MTFP as a statement of
commitment requires the line departments as also the Finance Department to position a
qualified and competent team of officers for providing in-house institutional support. For this
purpose the planning cells in each line department as also the Institution of IFAs, who are
required to handle MTFP related work, have to be further strengthened for an analytical
reporting of MTFP as a statement of commitment.
4.8 In this regard the Commission takes note of the recommendations of the 13th
Finance
Commission relating to MTFP in the context of fiscal responsibility law. One of the key
recommendations states that “the structure of MTFP should be more comprehensive, giving
details of all significant items on receipts and expenditure along with the underlying
assumptions made for projection purposes. The MTFP should become an iterative process
where the receipts and expenditure are arrived at as the sum of the building blocks thereof
and conform to the overall fiscal targets.” The said Recommendation seeks to upgrade MTFP
from a mere Statement of Intentions to a Statement of Commitment (para 9.118viii
page 146
of the Volume -1, of the Report, read with paras 9.83ix
& 9.84x therein), and for which an
independent implementation review mechanism be established. Doing so, also helps in
efficient Public Financial Management/budget management particularly in containing risks of
contingent liabilities from Public Private Partnership (PPP) projects and ensuring value for
money being spent or concessions being granted to private parties. Thus, it could be a step
towards action relating recommendation of 13th Finance Commission. By doing so,
Karnataka can take the credit to be the first State to act upon the recommendations. As a
follow-up government can create a reliable and in-house system/team at Fiscal Policy
Institute (FPI) to track Early Warning Signals to support Finance Department in the
implementation of MTFP.
4.9 As part of expenditure reforms and also to keep the legislature better informed of the
allocations, expenditure in relation to the objectives and outcomes of programmes announced
in the Budget, the Estimates Committee in its report for the year 2006-07 had asked the
government to introduce Programme Performance Budgeting (PPB) across the departments.
The Estimates Committee had observed that the Performance budget document which was
introduced in 1981 contains information limited to allocations and expenditure. However,
PPB is an exercise which discloses not only the budgetary allocations but also their link to the
expected outcomes by grouping the programmes in relation to the objectives to be achieved.
The concept of PPB was experimented under USAID supported REFORM project. Health
and Education departments attempted to prepare the PPB for the year 2005-06. However, the
PPB template was found to be very demanding on data. The departments found
implementation challenges, particularly not being able to connect the allocations to objectives
and the outcomes expected out of those allocations. The departments having not organised
their data-base were found to be inadequately equipped to use the template. Therefore, FPI

ERC Second Report 29
was asked to simplify the same. The template so simplified was used on a trial basis to evolve
draft PPB in Education Department for the year 2008-09. The Commission is of the view
that as part of strengthening institutional mechanism for departmental MTFPs, the PPB has to
be seen as an efficient tool for performance review in relation to outcomes. The Monthly
Programme Implementation Calendar (MPIC), which replaced Monthly Multilevel Review
(MMR) is a tool to review programme performance. The Programme Performance
Budgeting (PPB) exercise along with MTFP can provide valuable inputs to Legislature
and its Committees every year along with the Budget proposals. As such MPIC has to be
seen as supportive tool for MTFP. The Commission is of the view that as part of
strengthening institutional mechanisms, the departments should prepare, use and
internalize these standardized monitoring tools with due diligence.
4.10 The ex-post controls on expenditure management are specified in the constitutional
framework. The Comptroller and Auditor General (C&AG) of India has constitutional
mandate to ensure ex-post controls on expenditure by way of auditing government accounts
through regularity audit and performance audit. These reports are presented to legislature.
Public Accounts Committee reviews those reports for action by the Executive. The
Performance Audit Guidelines, focusing on economy, efficiency and effectiveness of
expenditure issued by C&AG are useful in this regard. Realising the intent of these
guidelines require action on the part of the government to put in place a comprehensive
outcomes/output monitoring framework and to align the same to budget management. A
strengthened Institution of IFAs would help in attending to speedy implementation of
audit observations, inspections, disposals and timely action on matters flowing from the
recommendations from various Legislative Committees as explained in the Hand Book of
Instructions issued by Finance Department vide No. FD 32 BPA 92.

ERC Second Report 30
End Notes:
i KFR Act 2002 Sec. 4 (1)
Fiscal Management Principles.- (1) The State Government will be guided by the following fiscal management
principles:
(a) maintain Government debt at prudent levels;
(b) manage guarantees and other contingent liabilities prudently, with particular reference to the quality and
level of such liabilities;
(c) ensure that policy decisions of the Government have due regard to their financial implications on future
generations;
(d) ensure that borrowings are used for productive purposes and accumulation of capital assets, and are not
applied to finance current expenditure;
(e) ensure a reasonable degree of stability and predictability in the level of the tax burden;
(f) maintain the integrity of the tax system by minimizing special incentives, concessions and exemptions; (g)
pursue tax policies with due regard to economic efficiency and compliance costs;
(h) pursue non-tax revenue policies with due regard to cost recovery and equity;
(i) pursue expenditure policies that would provide impetus for economic growth, poverty reduction and
improvement in human welfare;
(j) build up a revenue surplus for use in capital formation and productive expenditure;
(k) ensure that physical assets of the Government are properly maintained;
(l) disclose sufficient information to allow the public to scrutinize the conduct of fiscal policy and the state of
public finances;
(m) ensure that Government uses resources in ways that give best value for money; and also ensure that public
assets are put to best possible use;
(n) minimize fiscal risks associated with running of public sector undertakings and utilities providing public goods
and services;
(o) manage expenditure consistent with the level of revenue generated;
(p) formulate budget in a realistic and objective manner with due regard to the general economic outlook and
revenue prospects, and minimize deviations during the course of the year;
(q) ensure discharge of current liabilities in a timely manner.

ERC Second Report 31
ii 5. Measures for Fiscal Transparency.- (1) The State Government shall take suitable measures to ensure greater
transparency in its fiscal operations in public interest and minimize as far as practicable, secrecy in the preparation of
the annual budget.
(2) In particular, and without prejudice to the generality of the foregoing provision, the State Government shall,
at the time of presentation of the annual budget, disclose in a statement in the form as may be prescribed -
(a) the significant changes in the accounting standards, policies and practices affecting or likely to affect
the computation of prescribed fiscal indicators;
(b) as far as practicable, and consistent with protection of public interest, the contingent liabilities
created by way of guarantees; the actual liabilities arising out of borrowings by Public Sector
Undertakings and Special Purpose Vehicles and other equivalent instruments where liability for
repayment is on the State Government; all claims and commitments made by the State Government
having potential budgetary implications, including revenue demands raised but not realised; tax
expenditure; losses incurred in providing public goods and services through public utilities and
undertakings; liability in respect of major works and contracts; and subsidy payments and the impact of
the same on the fiscal position of the State including in relation to the targets referred to in sub-section
(3) of Section 4.
iii KFR Act 2002 Sec. 4(j)
Fiscal Management Principles.- (1) The State Government will be guided by the following fiscal management
principles:
(j) build up a revenue surplus for use in capital formation and productive expenditure;
iv KFR Act 2002 Sec. 6(4)
6. Measures to enforce compliance.-
(4) Whenever there is a prospect of either shortfall in revenue or excess of expenditure over pre-specified
levels for a given year on account of any new policy decision of the State Government that affects either the
State Government or its Public Sector Undertakings, the State Government, prior to taking such policy decision,
shall take measures to fully offset the fiscal impact for the current and future years by curtailing the sums
authorized to be paid and applied from and out of the Consolidated Fund of the State under any Act to provide
for the appropriation of such sums, or by taking interim measures for revenue augmentation, or by taking up a
combination of both.
Provided that nothing in this sub-section shall apply to the expenditure charged on the Consolidated Fund
of the State under clause (3) of article 202 of the Constitution.
Provided further that, while adhering to the fiscal targets, the State Government will give priority to
protecting certain expenditure declared in the Medium Term Fiscal Plan as “high priority development
expenditure” (including, inter alia, elementary education, basic health and rural water supply) from curtailment
or may impose a reduced or partial curtailment.
ERC Second Report 32
v KFR Act 2002 Sec. 5(2) a
5. Measures for Fiscal Transparency.-
(2) In particular, and without prejudice to the generality of the foregoing provision, the State Government
shall, at the time of presentation of the annual budget, disclose in a statement in the form as may be prescribed -
(a) the significant changes in the accounting standards, policies and practices affecting or likely to affect the computation
of prescribed fiscal indicators;
vi KFR Act 2002 Sec .6(1)
6. Measures to enforce compliance.- (1) The Annual budget, and policies announced at the time of the budget, shall
be consistent with objectives and targets specified in the Medium Term Fiscal Plan for the coming and future years.
vii THE KARNATAKA LOCAL FUND AUTHORITIES FISCAL RESPONSIBILITY ACT, 2003
STATEMENT OF OBJECTS AND REASONS
The framework for budgeting, accounting and auditing for the State Government are specifically provided in
various Code and Manuals framed by Government under Article 283 of the Constitution of India. The budget of the State is
prepared by the Government and is put to vote before both the Houses of Legislature. Once the budget is passed by both
the houses of Legislature, as laid down in the Constitution of India, the expenditure is met out of the Consolidated Fund as
per the budget, duly passed by the Legislature. The deviations from the budget, as voted by the Legislature, can only be
made as laid down in Karnataka
Financial Code and is brought to the notice of Legislature in due course.
The Comptroller and Auditor General performs the audit and account functions for the State Government.
Report of the Comptroller and Auditor General is submitted to the Governor who causes them to be laid before the
Legislature of the State. These reports are referred to the Public Accounts Committee and the report of the Committee
along with the report of the Comptroller and Auditor General is put on the table of the House.
With such a framework, the State Government, to ensure fiscal stability and sustainability, introduced the
Karnataka Fiscal Responsibility Act, 2002, which mandates the State Government to have a Medium Term Fiscal Plan
(MTFP), a rolling document for four years specifying targets for prescribed parameters. The Act also specifies fiscal
management principles to be followed by the State Government. In furtherance to Medium Term Fiscal Plan, the State
Government decided to disintegrate the MTFP on departmental lines and prepare Departmental Medium Term Fiscal Plan
for each department along with the MTFP for the entire State.
It is now felt that a similar framework for budgeting, accounting and auditing should be there for the Local Fund
Authorities (LFA). There is a need for an Act which,
(1) mandates a Medium Term Fiscal Plan for the Local Fund Authorities.
(2) lays down principles for financial management.
(3) ensures transparency in Fiscal Management at the local level. (4) ensures proper procedure for preparation,
submission and audit of accounts.
(4) ensures proper scrutiny and adherence to the audit reports.
(5) lays down measures to enforce compliance to the provisions of the Act.
Hence the Bill.
LA Bill No. 22 OF 2003]
(Entries 5 and 32 of List-II of Seventh Schedule to the Constitution of India)

ERC Second Report 33
viii 13
th FC Report Para 9.118
Summary of Recommendations
9.118 To summarise, our recommendations are as follows:
i) Revenue deficit of the Centre needs to be progressively reduced and eliminated, followed by emergence of a
revenue surplus by 2014-15 (paras 9.18 and 9.31).
ii) Target of 68 per cent of GDP for combined debt of Centre and states to be achieved by 2014-15. Fiscal
consolidation path embodies the steady reduction in augmented debt stock of Centre to 45 per cent of GDP by
2014-15 and for the states to less than 25 per cent of GDP by 2014-15 (paras 9.29 and 9.69, Table 9.7).
iii) MTFP to be reformed and made a statement of commitment rather than a statement of intent. Tighter
integration between the multi-year framework provided by MTFP and annual budget exercise (Para 9.38).
ix 13th
Finance Commission Report Para 9.83
9.83 Some of the structural reforms recommended for the Centre in this chapter need to be replicated at the
state level as well. The most important of these is the structure of the MTFP, which, as explained earlier, should
be more comprehensive, giving details of all significant items on receipts and expenditure along with the
underlying assumptions made for projection purposes. MTFP should become an iterative process where the
receipts and expenditure are arrived at as the sum of the building blocks thereof and conform to the overall fiscal
targets.
x 13th
Finance Commission Report Para 9.84
9.84 Independent review/monitoring is a feature that is desirable in the FRBM Act and some states already have
such a system in place. It is recommended that all states introduce this feature in their Acts. The states should
also attempt to incorporate statements on RCCE, PPP and related liabilities, physical and financial assets and
vacant public land and buildings.

ERC Second Report 34
Chapter 5
Executive Control over Expenditure
5.1 Reforms in Public Financial Management is to be seen as part of overall governance
reforms. While reforms relating to Debt and Revenue Receipts encompass few departments,
the expenditure related issues run across all the departments, as well as all the public sector
entities. Often inter-departmental expenditure priorities impact the pace of activities and
outcome across the departments. Therefore, the key challenge to the Executive is to ensure
that the allocated funds are spent in accordance with programme design, intent and legislative
mandate while also ensuring budget discipline during the year in every department and every
public sector entity under the control of line departments. Thus, a decentralised spending
arrangement with delegation of more powers, but without putting in place a corresponding
mechanism for effective review, compounds the challenge of executive control over
expenditure in relation to budget management and its outcome. Further, where the spending
entities are outside direct control of the departments or involve private sector agencies, the
challenge becomes more complex. This chapter addresses the issues relating to scope and
limits of ex-ante and ex-post expenditure control mechanism with regard to Plan and Non-
Plan schemes.
5.2 A framework for ex-ante controls by the executive, has been defined vide Gazette
Notification No. FD 24 Bud 81 dated 15th
July, 1982 creating the institution of Internal
Financial Advisers (IFAs). The notification is explicit on the role, scope and powers of IFAs
and their relationship with the heads of the line departments vis-a-vis the Finance
Department. This notification was issued in exercise of powers conferred by clause (3) of
Article 166 of the Constitution of India. The rules also seek that IFAs views are to be treated
as permanent records of the department. By definition, the IFAs have a role, both in Plan and
Non-Plan expenditure, from the stage of budget preparation to internal audit. The inputs from
IFAs are expected to be independent and objective in analysing risk management, accounts
and economic governance. The IFAs are key officers to assist the Administrative Secretaries
in exercising the financial powers delegated periodically (latest delegation made vide GO No.
FD 1 TFP 2008 dated 16.5.2008), and the Rules notified in 15.7.1982.
5.3 The ex-post controls on expenditure management are broadly specified in the
constitutional framework. The Comptroller and Auditor General (C&AG) of India has
constitutional mandate to ensure ex-post controls on expenditure by way of reporting to
legislature. The Performance Audit Guidelines, focusing on economy, efficiency and
effectiveness of expenditure issued in this regard by C&AG are useful.
5.4 In general the internal controls through the Institution of IFAs in the Departments
need to be strengthened as well as their participation in the day to day financial

ERC Second Report 35
management as mandated by “The Government of Karnataka (consultation with Financial
Adviser) Rules 1982” and Government Notification No. FD 1 TFP 2008 dated 16.5.2008.
The C&AG report for the year ended March 20091 lists out the evidence showing weak or
inadequate internal financial control across key departments. These inadequacies are
generally found to be continued, as noticed by the Commission during their interactions with
various officials. The technical capacity of IFAs are found to be not matching with the
mandate to be delivered by them. Most of the IFAs are also found to be not aware of the letter
and spirit of principles of fiscal management provided in the Karnataka Fiscal Responsibility
Act, 2002. There are a total of 11 IFAs in position. Some IFAs are found to have been loaded
with work relating to more departments disproportionate to their professional abilities.
Hence, the Commission recommends that the Institution of IFAs has to be strengthened by
identifying sufficient number of officers with requisite background and seniority and who
have at least 5 years service left for superannuation. They should be supported with
required infrastructure, exposed to extensive training, including computer skills, to match
the job chart of IFAs. The Rules notified in 1982 may be suitably amended to empower the
IFAs as mentioned in the GO No. FD 1 TFP 2008 dated 16.5.2008.
5.5 In the context of Plan Schemes, the Government has also put in place various
institutional arrangements to monitor the progress in expenditure. Such monitoring is
intended to be based on a Multilevel Management information system viz., Taluk, District,
Department, Government level. The arrangement should be suitably internalised in the light
of the changes relating to delegation of powers to PRIs. The most influential and surviving
institution is Karnataka Development Programme (KDP / 20 point programme) Review
system. Although historically, the 20- point programme is known to have started in 1976-77,
various circulars or government proceedings cite the GO dated 12.10. 1987 as the first
reference. The government orders issued vide No PD 309 PTP 94 dated 7th
August, 1995
provide for a clearly defined institutional arrangement under KDP review, for state, district
level and taluk level. It provides State level Review by the Chief Minister and the Chief
Secretary separately, while the review at district and taluk level are done by political
executive. The discussions in these meetings address the progress in expenditure on plan
schemes in terms of utilisation of funds released and physical achievements made during the
reference period. The MMR (Monthly Multi-level Review), devised was being used as a tool
to review the progress in expenditure and achievements.
5.6 Despite such high level review mechanisms, very often departments’ expenditure was
found to be skewed in the fourth quarter, resulting in rush of expenditure or parking of funds
or under-utilisation of the allocated funds2. Thus, KDP review mechanism seems to suffer
1 http://www.cag.gov.in/html/cag_reports/karnataka/rep_2009/civil_chap4.pdf
2 Several reports from CAG indicate prevalence of this problem in the state.

ERC Second Report 36
from certain limitations in uniformly inducing spending discipline across the departments. A
random review of minutes of KDP meetings also indicate that often, more time is spent on
addressing inter-departmental co-ordination issues at implementation, and less on the quality
of expenditure in relation to the outputs/outcomes specified for a project and to ensure value
for money.
5.7 Realising the limitations of MMR as a monitoring tool, the government has replaced it
with Monthly Programme Implementation Calendar (MPIC) vide GO No FD 1TFP 08 dated
1.12.2008. This tool while subsuming MMR components, also seeks critical administrative
steps, including key preparatory steps towards implementation of a scheme/activity to be
indicated in MPIC for review. All departments were consulted in evolving the tool through
workshops. A large number of officers have been oriented in the use of MPIC before and
after its launch. The upgraded tool is made applicable to both Plan Schemes and Non-Plan
Schemes. This is the first time that State has institutionalised a review mechanism of Non-
Plan schemes. The monthly MPIC reports are received in the Planning Department for
consolidation and Review.
5.8 While continuing to be an MIS (Management Information System) tool like MMR,
the MPIC has been designed to achieve the following additional objectives viz., (i) avoid
programme implementation without adequate preparation (ii) avoid delay in implementation
(iii) avoid rush of expenditure towards end of the financial year and (iv) to provide a uniform
monitoring format for all departments and make it available to citizens by regularly posting
on the respective websites. A random review of MPIC format from some departments
reveals the following short comings in its use;
(i) often activities are indicated without adequate preparation/plan at appropriate level;
(ii) the outcome/objectives stated are imprecise, inconsistent or unclear;
(iii) most of the departments have not posted MPIC on their respective website.
5.9 There appears to be a practice of non-sharing of MPIC between the departments
through prior consultation, in order to assess inter-dependent activities and to disclose
mutually agreed/convergent priorities in respective MPICs. Lack of such prior consultation
for convergent action by line departments seems to be the main reason that KDP meetings at
every level focus more on issues of inter-departmental co-ordination rather than focusing on
objectives / outputs / outcomes of expenditure.
5.10 Presently Planning Department coordinates monthly review of various schemes,
which mostly focus on Plan Schemes, Special Component Plan and Special Development
Plan. The overall status of all the Schemes reviewed by Planning Department needs to be
brought out into public domain every month along with decisions taken for corrective

ERC Second Report 37
action. Similarly, following the letter and spirit of the provisions in Sec. 4 1 (l)3 of the
Karnataka Fiscal Responsibility Act, 2002, the monthly receipts, expenditure, borrowing,
and guarantees be disclosed in public domain by Treasury Department /Finance
Department as is the practice by the Controller General of Accounts in Government of
India.
5.11 There seems to be a mixed response to the use of MPIC for planning and review by
line departments, Planning and Finance Departments. These types of problems may be initial
aberrations. The Planning Department has recently collaborated with e-Governance
department to consolidate the MPIC of all departments on a real-time basis, which is likely to
improve the use of MPIC as per the intended objective. The understanding of MPIC as a
tool for executive monitoring has to be deepened and the use has to be widened while
ensuring inter-departmental co-ordination at planning and implementation stages.
5.12 Karnataka’s initiatives towards gender equity through government
programmes/schemes, can be traced back to the implementation of Karnataka Mahila
Abhivruddi Yojane (KMAY) as part of the ‘Women’s Component Plan’ during early ‘80s.
As part of this initiative, about 25 departments from development sector have been
earmarking 30 percent of funds and benefits for women in select schemes (about 216
schemes). The progress is being monitored quarterly by the Additional Chief Secretary to
Government and Development Commissioner, who is the ex-officio Chairperson of KMAY.
However, there is no evidence, as of now to substantiate the quantum and quality of women
oriented expenditure under KMAY and its impact, one of the reasons being lack of gender
disaggregated data.
5.13 Supported by the Planning Commission, Karnataka has established Gender Budget
Cell in 2006-07, and has presented a Gender Budget Document to Legislature along with
annual budget. In this document the budgetary allocations that are meant to benefit women
are presented under two categories viz., Category-A schemes where 100% allocations are for
women and Category-B schemes where 30% or more allocations/ benefits are for women.
The Category -C schemes are considered as gender neutral and are currently outside the
purview of documentation. However, without an effective monitoring mechanism and
feedback for reorienting/redesigning the programmes, Gender budgeting runs the risk of
remaining a documentation exercise. This is not the intention of the Government as
announced in the Budget speech of 2005-064. Hence, the Gender budget cell at FPI has
encouraged the Women and Child Development Department to use existing MPIC, with
3 4. (1)The State Government will be guided by the following fiscal management principles: …(l) disclose sufficient
information to allow the public to scrutinize the conduct of fiscal policy and the state of public finances. 4 Gender based budgeting helps to prioritize and orient public expenditure to reflect the concerns of women.
To give focus to this, a gender budget cell would be set up in the Finance Department to identify the quantum of resource allocation and expenditure for women and proper translation of policy commitment.

ERC Second Report 38
minor additions to the format to capture category A and B schemes. This has been used as a
pilot in the departments covered under KMAY. The initial response seems satisfactory. The
participating departments have been able to successfully categorize the schemes. Though the
MPIC format does not enable collating of gender disaggregated data, it does help in
validating the categorization and also in monitoring the schemes. Going forward, Periodic
impact evaluation would help in ascertaining the quality of expenditure meant for women
and to redesign the programmes for improving HDI (Human Development Index) and
GDI (Gender Development Index). The format of KMAY review mechanism also needs to
revisited to cover all programmes included in the GB (Gender Budget) document, more
particularly in view of the decision taken by Ministry of Women and Child Development,
Government of India to move towards gender responsive budgeting.
5.14 The Directorate of Economics and Statistics (DES) has a practice of conducting
sample check verification of select programmes and schemes. However, the Directorate
needs to ensure course corrections by following up with line departments to address the
shortcomings and act on the recommendations. A demonstrated course correction and
effective expenditure tracking by the line departments should be insisted as a condition-
precedent by the Planning / Finance Department, for continuity of the
schemes/programmes in the following year. Further, the scope, and coverage for
Expenditure Tracking through physical verification by the DES should be enlarged to
cover 20 percent of development /welfare schemes, programmes, and projects in each
department every year. The existing officers posted as Project Evaluation and Appraisal
Officers (PEAOs )be drafted to perform these functions, after empowering/training them
with suitable skills. Presently, most of these officers are said to be engaged in activities not
necessarily meant to be performed by PEAOs.
5.15 Guidelines5 (issued in 2008 by the Ministry of Rural Development, Government of
India for implementation of National Rural Employment Guarantee Scheme provide for
creation of Social Audit Forum (SAF) and methodology for working of SAF, in order to
improve quality of implementation through transparent methods. The basic objective of social
audit is to ensure public accountability, through consultation with and consent of stake
holders in the implementation of projects, laws and policies. Social Audit is an on-going
process through which the potential beneficiaries and other stake holders of an activity or
project are involved at every stage. The Commission recommends that the social auditing
mechanism should be put in place for other programmes, particularly those which have
high and direct human welfare impact viz., NRHM, Agriculture Extension, ICDS,
Bhagyalakshmi, Social Welfare hostel management, Sarva Shiksha Abhiyan, Watershed
development projects, and trusts/religious/charitable establishments patronized through
adhoc grants (exceeding ` 10 lakhs) or grants-in-aid by Government. These are
5 NREGA Operational Guideline of NREGA released by Ministry of Rural Development.

ERC Second Report 39
illustrative list of projects/schemes. To begin with, each department should identify at least
one project being implemented through Local bodies, for social audit. The Planning
Department may evolve guidelines for social auditing in consultation with other
departments particularly with RDPR, Urban Development Department, and Department of
Forests.
5.16 Administrative Department-wise status of pending paragraphs of Departmental notes
cleared and pending with regards to the reviews in C&AG Audit Reports for Civil,
Commercial, Revenue Receipts and ZPs is available on public domain (website). Annexure-
5a provides an abstract of number of such paragraphs. There is a mixed progress across the
departments. As seen from the annexure, out of a total of 778 observations made by the
C&AG review, 464 have been cleared by the various departments concerned. The
Departments of Public Enterprises, Water Resources (Major), Rural Development and
Panchayat Raj have more than 90% of the reviews cleared while the Finance Department has
the highest number (223) of paragraphs reviewed by C&AG with a Balance pending
percentage of 43%. In this regard, while the handbook of instructions issued by the
Finance Department provides useful directions to the departments, the government should
set up an exclusive team to closely monitor the progress of the departments towards
expedition of C&AG comments and to take action as per the decisions taken by the Public
Accounts Committee (PAC) in time. The audit monitoring system as posted on the website
shows the status of follow-up action.

ERC Second Report 40
Chapter 6
Department of Primary & Secondary Education
6.1 About 2/3rd of 75 lakh primary school students in the State study in Government
schools. While a total of 3/4th of the students study in Government schools (50 lakhs) or in
Government aided schools (6.4 lakhs). In the year 2008-09, enrolment into 7th class was
9. 92 lakhs while enrolment into 8th class was 9.64 lakhs. The average class size of all grades
in Government primary schools was 16 students while the average class size in secondary
school for all grades was 87 students, indicating both demand for secondary schooling as also
shortage of class rooms in such schools. Therefore, the growth in the number of secondary
schools in the State needs to keep pace with the number of students moving from primary
school to secondary schools, more particularly in the context of the objectives set under
the Right to Education (RTE)Act and the MDGs 1. In this regard, the Government needs
to take adequate steps to upgrade the existing primary schools to secondary levels with
sufficient infrastructure facilities. While doing so, the Department should assess the
infrastructure capacity of the existing primary schools before up gradation. Alternatively
the Government may exercise the option of establishing new secondary schools in order to
meet the ever increasing transition demand from students of upper primary schools to join
secondary school system.
6.2 The pupil teacher ratio (PTR) has steadily improved in the State over the last three
years observed. The Pupil Teacher Ratio in primary schools i.e. 31 observed in 2006-07 has
come down to 26 in 2008-09. On the other hand, in secondary schools the Pupil Teacher
Ratio observed in 2006-07 was 27 which has reduced to 23 to 2008-09. Suitable teacher
redeployment policy for rationalization of work load of teachers in Government primary
schools is necessary with due consideration in the policy to serve students in district or
region with difficult terrain. There are certain districts with high Pupil to Teacher ratio of
18:1 (Chikmagalur, Hassan, Uttara Kannada, Ramnagar, Tumkur Districts have PTR of less
than 20) while some other districts have a PTR close to 35:1 (Yadgir, Bijapur, Koppal,
Bellary have PTR greater than 30). Considering the high unit costs of providing education
in schools with high Pupil Teacher Ratio there is a need to close down or merge such
schools with nearby schools located within distance of 1-2 km. The teachers, who remain
surplus due to such merger or closure of the schools, be redeployed to schools in nearby
districts with low PTR. This may be implemented from the academic year 2011-12. Such a
redeployment of teachers across the districts needs to be supported with attractive
incentives to compensate for potential losses due to disruption of seniority and promotions
of teachers.
1 Ensure that every child gets to complete full primary education by 2015

ERC Second Report 41
6.3 Going by SSA norms of PTR of 40:1(Classes 1 to 8), and as under provision of Right
to Education (RTE) Act, the State has 73,436 teachers. The State policy is to have a PTR of
25:1 (in classes 1 to 7). That being so, as recommended in the first report of the Expenditure
Reforms Commission, the Government needs to enforce a higher standard of performance
indicators to assess the output of teachers and the quality of learning by the students. If
performance is not superior as compared to other states there is a need to revisit the PTR
norms within next two years, so as to minimize the unit cost of providing education in
primary schools. Meanwhile, there should not be any new recruitment of teachers,
including through outsourcing, unless there is subject specific shortage of teachers
assessed at State level.
6.4 „Annual Status of Education Report, 2009‟ brought out by Pratham an NGO,
indicates that the learning levels of students in the State need substantial improvement. Of the
children between standards 3-5 tested for the study, only 61 percent were able to read first
standard text, 41 percent could do subtraction and 40 percent could tell time as compared to
86%, 76% and 72% student in Kerala and 72%, 64% and 33 % in Andhra Pradesh
respectively. Further, considering the PTR, the cost per student in elementary education also
works out to be higher in Karnataka while the results are poor. As such the Education
Department needs to focus its efforts on improving the quality of teaching, thinking and
learning while also expanding the coverage and infrastructure facilities.
6.5 The present day students face increased competition in every sphere of life. As future
citizens they need to be imbued with abilities to think critically in order to effectively
communicate with and work alongside others from various walks of life. They must learn
how to learn. They will have to communicate with people with diverse cultures and work
with people with different perspectives. One of the objectives of school learning ought be
infusing creative abilities into the minds of students, not necessarily by teaching new
subjects but by teaching the existing subjects in different way. The students need to learn to
think and blend divergent thinking and convergent thinking.2
Creativity is always prized in
any society. But creativity does not occur in vacuum. As such creative abilities have to be
innovatively incorporated through laboratory learning, digital learning, experimenting, mock
sessions, building models. The creative learning environment/infrastructure needs to be
experimentally introduced in select schools through PPP mode.
6.6 Play and recreation are identified in the United Nations Convention on the Rights of
the Child, as critical to optimal human development. Play is our brain's favorite way of
learning. In fact, Einstein called play the highest form of research! Play elicits joyful and
2 The Creativity Crisis-Newsweek

ERC Second Report 42
creative energy, and engages our mind, body and spirit3 .
The programme Nali Kali
introduced in Government Primary schools, has some elements which promote creative
learning through play as against conventional learning. The Scheme has now been
extended to all Government Primary schools upto IIIrd Standard. The critical challenge in
this expansion is ensuring supply of sufficient learning material in time to all the children.
The Department may have an independent study conducted about the impact of the
Scheme after it has been in operation for four years (covering Ist to IVth standard). If
found efficacious, this innovative scheme could be further extended to the Government
aided schools in order to help students to use their imagination, think critically with
reason, develop better problem solving skills and promote the spirit of co-operation. To
supplement such expansion, the DIET has to be repositioned to provide training to the
teachers engaged in Nali Kali on a large scale, including the teachers from aided schools.
6.7 Government implements Pancha Soulabhya programme4
in order to improve
infrastructure including supply of drinking water and toilet facilities at schools. However,
half of the 45,000 Government Primary schools do not have toilet facilities for girls. More
than 7000 school buildings are in need of major repairs. Therefore, the Department should
ensure provision of adequate space for recreational activities, separate toilets for girls,
drinking water and thus create congenial atmosphere for learning at schools in a time-
bound manner by preparing a medium term capital budgeting covering all schools.
6.8 In 2008-09 the number of students in Primary and Secondary schools is 1 crore
distributed across ten classes as shown in the graph below. The students studying in class X
for the year 2008-09 belong to that group of students who joined Class I about ten to eleven
years ago. However, as seen from the graph the number of students in class X are 7.2 lakhs as
compared to 11.4 lakhs in Class I.
3 http://www.unescobkk.org/education/apeid/apeid-international-
conference/11apeidconf/programme/concurrent-sessions0/day-1-session-2b-creative-learning-for-active-citizenship/ 4 The five facilities include, Drinking water and Toilet, Compound wall, play ground, Class rooms, electricity.

ERC Second Report 43
Source : DISE 2008-09
However, if the likely dropout rate for each successive class is not contained, all the students
who are in Class I in 2008-09 will not reach Class X in 2018-19. As noted from the Annual
report of Education Department, the drop out rate of 8.5 percent at primary level and 15
percent at secondary level for the year 2008-09, factoring for a lower GER ten years ago
compared to GER of 98 percent in 2008-09 (graph above) and also for a higher birth rate 15
years ago in 1993-94, implies that about one out of every three students enrolled in Class I
are dropping out of the School system by the time they reach Class X. Such transition loss
popularly understood as Drop out Ratio, if not contained, it amounts to children being
deprived of their Right to Education. Further, a high Drop out ratio with every third child
falling on the wayside should be seen as an index of underutilization of resources created. In
order to bring out of school children/drop-outs to mainstream education system, opening of
alternative education centres like Bridge courses - residential and non-residential, tent
schools, Zero level schools, etc., may be introduced.
6.9 The Government needs to encourage private participation and also put in place
appropriate regulatory regime which may enable the Government to consider introduction of
a coupon system in course of time. The coupon voucher system, initiated in some of the
developed countries helps to create a market for private schools in unattended and poorly
served areas and also giving education for the unaffordable section of the society. The
students, by using the coupon system, can make a choice of their own school from the
empanelled schools while the Government reimburses such coupons received from the
Schools. Coupons can be extended for school text books and uniforms also. To make the
coupon voucher system deeper and wider as an effective management solution, key and
strategic interventions ought to include setting up a common norm for all schools, including
all participating schools with respect to infrastructure, Pupil Teacher Ratio, medium of

ERC Second Report 44
instruction, and costing. While encouraging the coupon voucher system, the Government
schools administration may also be enabled and empowered to compete with participating
private school in every respect.
6.10 Involvement of Self Help Groups for cooking mid day meal is preferable to reinforce
the social inclusion goals associated with education/schooling. The key of success factor in
this scheme lies in the active and effective involvement of the local community. The
availability of adequate infrastructure and dependable supplies systems are essential for
maintaining the quality of the output of the programme. The teachers are also increasingly
engaged in non-academic activities thus sacrificing their quality time for students. Their
engagement in mid-day meal scheme takes away most of their academic time. Therefore,
more intensive involvement of SHGs promoted by RDPR and WCD, and adoption of
Centralized Kitchen facility needs to be explored. This would relieve teachers from non-
academic activities.
6.11 In urban areas, where there is shortage of space for construction of kitchen sheds, use
of centralized kitchen to serve a cluster of schools may be explored. Such kitchens need to be
reasonably modernized to cook and transport hot meals just-in-time.
6.12 Teachers require continuous training to learn new methods of teaching, and new
developments in the subject. Presently, the teacher training facilities are provided through 27
District Institute for Education and Training Centres (DIETs) and 6 Center for Teachers‟
Education (CTEs). These are underutilized as the training programmes are scheduled only
during school vacation, for ten to twenty days. For instance out of 3500 training programmes
scheduled in the year 2009-10 to cover 75,000 teachers at DIET, only 2600 programmes
were held, covering 68,000 teachers. It is necessary to plan reorientation trainings for
teachers and utilize DIET facilities throughout the year. Further, the training manuals
need to be updated keeping in view the futuristic learning needs and that of teaching in
order to raise creative abilities and creative thinking of the learners/students.
6.13 Presently, the entry qualifications for teachers to primary schools is Pre-University
course, while for higher secondary school teachers it is Pre-university and diploma in
education. However, to improve the quality of learning in the schools, the minimum entry
level qualification for higher Primary school teachers be raised to graduate degree and
that for primary school teachers be raised to Pre-University. Atleast half of the teachers
recruited every year should be Science Graduates.
6.14 “Public subsidy to private institutions has enabled the Government to expand total
education provisions at lower level of budgetary support than if the Government had

ERC Second Report 45
expanded facilities on its own.”5 However, to make more efficient use of Grant-in-aid to
private sector, Government should try to restructure its aid to private institutions so that the
subsidy benefits poorer student directly. Paying the salaries to teaching staff to aided
institutions is not an effective means to target subsidy since institutions from richer families
can also gain access to aided institutions. Indeed, there is an incentive for aided institutions to
seek richer students who can pay additional charges for higher quality services.
6.15 Under general conditions of aid mentioned in Chapter 4, rule 22 (ii) of the Grant-In-
Aid Code, no school should be eligible for Grant-In-Aid if its income is more than expenses
in any year. For this purpose, financial assistance, if any, received by the institute from any
Department of the Government, Local Body etc., shall be deemed as part of income and
grants regulated accordingly. The provisions of the Grant-In-Aid code for Karnataka
inherently seeks the Department of Education to assess income and expenditure for the
institutions every year; however, the regulation in this regard needs to be revisited,
particularly keeping in view the schools which are receiving grant for period of 10 years,
15 years, 20 years. Such a policy should progressively wean away from the institution
which has received grants for a period of 10 years, 15 years, 20 years and the institution
should be encouraged to charge user fees depending on the socio-economic profile
neighborhood where they are functioning. Therefore the Commission recommends the
Department to prepare Grants-In-Aid policy with a provision of sunset clause for existing
GIA schools as well as for new schools, if they are brought under GIA in future.
6.16 The education administrator is said to spend a lot of their time in litigation pertaining
to teacher services in Grant-in-aid schools. Therefore there is a need to review the settled
cases on a sample basis and revisit the policy of grants in aid in such a way that education
administrators time is more effectively spent into regulation and development of school
education rather than attending to litigation.
6.17 Grants-In-Aid given to every institution should be posted on the website of the
Department and updated every quarter indicating the amount, key personnel authorized to
handle the accounts of that institution. Within a year the website should be uploaded with
historical data of grants given during the past ten years. Such disclosure in public domain
helps citizens, parents and all stakeholders in assessing the justification for the fees being
charged by the institution while admitting students. Such disclosure may be made district
wise for all rural areas and ward wise for all municipalities and municipal corporation areas.
The webpage should be linked to the webpage of the Registrar of societies who would then
display the reports audited.
5 World Bank (24207-IN)

ERC Second Report 46
6.18 As per Rule 5(5) of the Karnataka Civil Services (General Recruitment) Rules 1997
(Notification No. DPAR 57 SRR 75, Dated 25th
June 1977), “No person who has not passed
the seventh standard examination in any language (with Kannada as one of the subjects),
shall be appointed to Group D post in any of the State Civil Services”. In order to ensure
and encourage students to complete secondary School examination, the Commission
recommends that the minimum educational qualification of seventh standard pass for
entry into Government jobs be raised to SSLC pass. Such a move by the Government would
also help in signaling the State Government’s mission to ensure completion of secondary
education for students in the State.

ERC Second Report 47
Chapter 7
Department of Employment and Training
7.1 Karnataka has a total of 1102 ITI institutes of which 150 are Government ITIs, 145
are private aided and 799 are private unaided. The total capacity of the students is 1,28,714.
However, considering the employability of ITI qualified students, the actual supply is about
62,000 while the annual demand is 80,0001. The gap between the capacity and employable
number is due to dropouts, failures and lack of employable skills. Given that the capacity is
already available, more focus is required to enhance the soft skills of the trainees and
upgrading the technical skill of the trainers.
7.2 The Department of Employment and Training has a revised plan budget outlay of
` 26301.93 lakhs for 2009-10 and a Non- Plan budget of ` 3926.86 lakhs for the year 2009-
10. Annexure-7a shows the Schemes implemented by the Department. Out of 19 schemes,
11 schemes have a budget outlay of less than Rupees one crore. Following three Schemes viz.
Modular Training, Industrial Training Institutes and New it is in 10 Talukas form major
scheme expenditure in the Department of Employment and Training.
Modular Training:
Under Modular Employable Skills project, ten million people are provided
training in the ITI’s/ITCs for early school dropouts and industry workers,
especially in organized sectors. Testing is done through a natural agency and
successful students are issued technifide certificates which would have national
recognition.
Industrial Training Institutes /Centres:
Schemes involving plan expenditure towards starting new and existing ITIs.
New ITIs in 10 Talukas:
Scheme involving plan expenditure towards starting new ITIs:-New ITIs have
been started at Gudibande, Koratagere, Sringeri, Ankola, Siddapura, Hoskote,
Soraba, Shiralkoppa, Siggaoan and Hubli-Dharwad.
1 Karnataka Vocational Training and Skill Development Corporation Ltd (KVTSDC), Mapping of Human Resource
and skills for ITI qualified students in Karnataka, December 2009 (ICRA Management Consulting Services Limited)

ERC Second Report 48
7.3 Through The Craftsmen Training Scheme, ITIs offer training in various engineering
and non-engineering trades like Fitter, Electrician, Computer Operator and Programme
Assistant, Dressmaking to PU passed candidates in-line with the norms prescribed by the
National Council for Vocational Training, New Delhi. Also through the World Bank assisted
program of Vocational Training Improvement Project (VTIP) in Centre of Excellence in ITIs
Automobile, Production and Manufacturing, Electronics, and Fabrication Sectors have been
identified as thrust areas of Vocational Training. Number of trainees during 2008-09 in
Government training institutes was 32,378 including 7,529 SCs, 1,947 STs and 1,594
women. All trainees of government ITIs receive a stipend of ` 50/-p.m. (general), ` 150/-
p.m.(ST) and a merit stipend of ` 125/-p.m. irrespective of category or annual income.
7.4 Under this scheme for upgradation of 1,396 ITIs through Public Private Partnerships
(PPP), an Industry partner is associated with each ITI and an interest free loan of ` 2.5 crore
is provided by the Central Government to the ITIs for upgradation. Since the inception of the
scheme from 2007-08, about 56 ITIs have been taken up for upgradation. Such upgrading
includes creation of separate COE (Centre of Excellence) blocks, establishment of Instructor
Training Wing (ITW) for COE instructors, and special placement cell for the trainees.
7.5 The Government of India has envisaged the creation of a National Skill Development
Corporation to provide appropriate operational guidelines and instructions for meeting the
larger objectives of skill development needs of the country. In a report brought out by the
Labour Department, Government of India towards Vision for the National Skill
Development Initiatives in India, it could be noted that there would be an increase in deficit
of 5.25 million employable graduates and vocationally trained workforce by 2012 (study
conducted by Confederation of Indian Industry and Boston Consulting Group (CII & BCG).
Also, among the requirement of skilled workers, the highest incremental Human Resource
requirement is in the Textiles (29%), Construction(18%), Health care (7%) and IT and ITeS
(5%).2 Karnataka also is likely to face severe pressure towards demand of skilled workforce
in the State. As per the Karnataka-A Vision for Development 2020, an estimated four lakh
persons are expected to enter the workforce each year upto 2026 but there is the need to
facilitate the transition of 2-3 lakh persons every year for the next 15 years into the
manufacturing and service sectors.
7.6 Electrician, Plumbing and Carpentry Skills are absorbed by the construction sector
and many ITIs do not have adequate infrastructure or trainers to provide the latest technology
and knowledge, including preparing blue prints in plumbing, load calculation in electricity,
wiring as per circuit diagram, and seamless connection of plumbing. In the absence of such
2 labour.nic.in/policy/National Skill Development Policy Mar09.pdf
ERC Second Report 49
skills, the workmanship suffers and cost of maintaining assets increases. Hence, ITI
trainers’ training skills require to be upgraded periodically. The trainers may be
encouraged to periodically go on short term “sabbatical” to established industrial units.
Such kind of re-training (during sabbatical) is required for the trainers in government
ITIs, aided ITIs and unaided ITIs. Also training of soft skills like writing and
understanding technical notes, conversational English and physical fitness of the ITI
passouts, to match the rigour of hard work involved also need to be improved for better
employability.
7.7 Dropout rate in ITIs ranges from 15% to 25% mostly due to socio- economic
background, distance from residence to location and lack of career focus. Therefore,
(a) Department of Technical Education needs to support Karnataka Vocational Training and
Skill Development Corporation to encourage ITIs to take up visits to Industrial Units as
part of hands-on-training or as part of apprentice programmes, by collaborating with
Department of Industries and Department of Public Enterprises.
(b) The Department of Employment and Training should co-ordinate with Department of
Social Welfare to encourage ITIs to provide hostel facilities for ITI students so that
scheduled castes and other backward classes students can avail of the hostel facilities
provided by the Social Welfare Department.
7.8 ITI qualified workers account for 45% of work force in auto and auto component
industry. Considering the growth in the auto industry, and auto components, the demand for
trained ITI work force will increase. Hence, ITI courses relating to automobiles need to be
increased in number and the courses should include orientation to pollution containing
technologies.
7.9 Though ITIs offer 80 trades, the top 10 trades attract 90% of the enrolment in skills
like fitter, electrician, welder and turner, etc. Most of the contemporary skills and knowledge
are not included in the curriculum. Employment share in agriculture is about 58.8% and the
Karnataka Vision 2020 document envisions the share to be brought down to 35 to 40% by
the XIII five year plan period, while increasing employment in Industry sector from 15% to
22% and in Services sector from 26% to 42% during the same period. This requires more
investment to be made in technical upgradation of the workforce through ITIs and Skill
Development Centres. New skills are required to increase employment to about two to three
lakhs youths comprising 50 percent of the total workforce who join the non agricultural work
force every year. New areas where the ITIs can enter are Cathode Ray Technologies,
Plasma and LED (Light Emitting Diode) technologies, Digital and 3D technologies, Data

ERC Second Report 50
storage and transformation, Radio Frequency Identification Devices (RFID), medical and
precision equipment, high volume electronics production, high-tech manufacturing,
handling e-waste, cold chain manufacturing and food processing, food preservation,
industrial cleaning, high pressure welding, process improvement techniques, introduction
to aircraft/airport support technologies like elevators, conveyor belts, aerobridges, etc., and
Housekeeping, laundry management, management of multi-storeyed buildings, etc.

ERC Second Report 51
Chapter 8
Department of Higher Education
8.1 There are 18 Universities in the State. These are Universities of Mysore, Bangalore,
Karnataka (located at Dharwad), Gulbarga, Mangalore, Kuvempu, Hampi-Kannada, Tumkur,
Davanagere, Open University, Vishweshwariah Technological University, Rajiv Gandhi
University of Health Sciences, Music University and Women University while there are two
universities of Agricultural Sciences, one University of Veterinary Science. Barring the
Technological University, Universities of Agricultural Sciences, University of Health
Sciences, University of Veterinary Sciences, the Music University, the other 12 Universities
come within the ambit of the Secretariat Department of Higher Education. The institutions of
higher learning like Indian Institute of Science (IISc), National Law School of India
University (NLSIU), Indian Institute of Management (IIM), Institute of Social and Economic
Change (ISEC) are also located in Bangalore. Out of them, ISEC receive recurring grants
from Government of Karnataka. Similarly NLSIU also received some grants. The State
Government finances the 12 State universities through Block grants and Development grants.
The Department of Higher Education is also administratively in charge of the Directorate of
Collegiate Education, dealing with Degree Colleges and the Directorate of Technical
Education, dealing with Engineering Colleges and Polytechnics.
8.2 The quality of learning is influenced by combined effect of several factors viz., the
faculty, laboratory facilities, library and other equipment and learning environment, all of
which require considerable state support. In assessing the expenditure challenges to support
these factors in the area of Higher Education, the Commission tried to balance the equity vs.
development concerns. The Commission has anchored its assessment also to the Karnataka
Vision 2020 Document which states that “the state will work towards transforming its
Universities into centres of excellence. The state will endeavour to provide autonomy to
Universities and Research Institutions to achieve the academic goals and self sufficiency.”
The Commission has also drawn from the Report of the Taskforce on Higher Education
which examined the issues for shaping Education in Karnataka in 2004. The Commission
agrees with the observations of the Taskforce, which had stated that “the critical requirement
is to take a long-term view and initiate strategic measures in the areas of both policy-making
and operations in order to create an educations system, which will meet the changing
demands of the youth, society and the nation”.

ERC Second Report 52
8.3 The quality related regulatory issues, accreditation, grading of the Degree level
Educational institutions is under the jurisdiction of the University Grants Commission
(UGC), All India Council for Technical Education (AICTE) and National Assessment and
Accreditation Council (NAAC). NAAC is the central agency in the country that grades
colleges and universities on seven criterion relating to (i) curricular, (ii) Teaching learning
and Evaluation (iii) Research Consultancy and Evaluation (iv) Infrastructure and learning
resources (v) Student Support and progression (vi) Organization and Management and (vii)
Healthy practices. Accordingly, resource allocation to universities and colleges must strike a
balance between provision made towards salary and pensions and other items of expenditure
like maintenance, development and improvements. Importance of critical minimum resources
to ensure excellence and strategic preferences has to be recognized and monitored.
Infrastructure supporting the teaching-learning process like library, laboratories also needs to
be monitored and upgraded at regular intervals. However, this does not seem to have been
done in Karnataka. Hence, the Department should put in place an Institutional mechanism
to monitor these facilities at regular intervals and forecast medium term investment needs
to upgrade the facilities. Without doing so, the state will not be able to realize the vision for
100 percent NAAC accreditation of its colleges by 2020.
8.4 Besides the NAAC recommendations, the recommendations of Parliamentary
Standing Committee, (172nd Report, 2008) on increasing access to Higher Education through
expansion and by making it affordable to the students are also of relevance in the context of
this report. Some of the Recommendations of the Committee are as follows: (a) opening of
new colleges aided by Government in educationally backward, rural and tribal areas, (b)
improvement in private participation, (c) imparting good training in fields like special
education by institutions which may not be conventionally academic in nature, (d) upgrading
of infrastructure in universities and providing easy access to research funding may also be
considered, (e) developing a creative framework for combining the strength of scientific
laboratories, private initiatives and universities to start advanced institutions for
undergraduate and post graduate science education, (f) expanding links with international
educational and research institutions may help in enriching the students as well as faculty.
Thus, while many recommendations and suggestions exist, evolving convergent strategies
and creating enabling environment for effectively implementing the same are key challenges
before the Department of Higher Education.

ERC Second Report 53
8.5 The Department consists of three wings viz. University and Institutes of Higher
Education, Collegiate Education and Technical Education. The Department administers 51
schemes in 2009-10. The Higher Education Secretariat is responsible for:
a. Providing Support services for policy-making.
b. Planning and budgeting for the Education sector.
c. Coordinating with Planning, Finance and other related Departments; and
d. Assisting the cabinet meetings, legislature functioning in regard to education.
e. Releasing grants to the supporting Departments.
f. Admitting /accepting (new) colleges/institutions for grants as well as release of grants
to aided institutions.
g. Liaisioning with the Union Ministry of Human Resources Development, other
funding agencies.
h. Fixing norms and providing broad guidelines for growth, expansion consolidation and
qualitative improvement of education.
i. Initiating research.
j. Monitoring and evaluation of the work of the various Departments and programs.
8.6 Department of Collegiate Education finances and administers 356 Government First
grade Colleges and 297 private aided colleges affiliated to 11 Universities1. Of 343111
students in these institutions about 39% of the students are in government colleges. The
Department consists of one Commisionerate and six Regional Offices. The jurisdiction of the
Department is shown in the table below.
Sl. No. Institution Number
1 Government Colleges 356
2 Private aided Colleges 297
3 Government Law Colleges 5
4 Private Aided Law Colleges 8
5 Government College Hostels 9
8.7 Geographically, the number of degree colleges per one lakh population is unevenly
distributed in the state. For instance, the number college is very low in the districts like Bidar,
Koppal, Raichur, Gulbarga, and Chamarajanagar with 12 colleges per lakh population. While
districts like Uttara Kannada and Dakshina Kannada have more than 20 colleges per lakh
population. Presently, the number of colleges teaching general degree courses at
undergraduate level in the State is 1013. However, there are also some colleges where the
student strength in some classes is very low possibly due to drop in demand for certain
subjects and location of the colleges. In such places, Further, the universities like Bangalore
1 http://www.dce.kar.nic.in/

ERC Second Report 54
and Karnataka are found to be having affiliation of more than one hundred colleges as against
some universities like Kuvempu, Hampi which have limited number of affiliations. To
manage and administer colleges, each university should have only limited number of
colleges. The Colleges can be distributed to different streams based on subjects taught
(a) General degree colleges like Arts, Science and Commerce.
(b) Engineering colleges.
(c) Medical colleges including Dental, Ayurveda, Homeopathy, Unani etc.
The ideal number of colleges ought to be limited to 40-50 per university, as
recommended by University Grants Commission also by national Knowledge Commission
Report. On the grounds of equity and to enhance efficiency, such realignment can be done by
redistributing existing colleges among various districts in the existing universities system,
and also while establishing new universities. Further, The practices of establishing single
subject universities is found to be complicating the administration, management and deprives
the students and teachers of inter-disciplinary learning and teaching experience. Thus cross-
fertilization of ideas through research in frontier lines cutting across narrow subject-wise
boundaries becomes a casualty. Therefore the government may discourage establishing
single subject universities and also explore the possibility of realigning the existing single
subject universities into general university system to the extent possible.
8.8 Gross Enrolment Ratio (GER) in Higher Education of Students aged between 18 to 24
years is 11.6 per cent. In respect of students from SC, the GER is 8.1 per cent, while in the
case of ST it is only 4.4 per cent. As far as female students from SC and ST are concerned,
enrolment is as low as 6.9 per cent and 3.2 per cent respectively. When linking the enrolment
of students into higher studies to the corresponding cohort (of students) enrolled in the first
standard, it was found that for every 1000 students of all categories enrolled in I Standard in
1992-93 merely 3 students get into research in pure sciences, humanities, language / literature
and in the social sciences. Similarly of 13.6 lakh students enrolled in first standard, in
1994-95, less than 2 percent continued their studies into post graduate courses. The

ERC Second Report 55
following table gives progression in studies for cohort of students enrolled into first standard
in different years.
Number of Students at Various Levels of Education out of First Standard Enrolments
during corresponding previous years (A BACKTRACKING EXERCISE)
YEAR ENROLMENTS
I Standard YEAR
ENROLMENT DURING 2009-10
LEVEL ENROLMENTS PROPORTION
as %
1992-1993 13,50,000 2009-10 PhD / DSc / D.Phil 4,000 0.30
1994-1995 13,60,000 2009-10 PG / MA / MSc /
M.Com
27,000 1.98
B.Ed 7,000 0.52
1997-1998 13,80,000 2009-10 BA / B.Sc / B.Com
(=320000/3 years)
1,06,667 7.73
Professional
Courses
BE / MBBS
/Others
(=2,60,000/4 years)
65,000 4.71
1999-2000 13,92,500 2009-10 I PUC 5,56,000 40.00
Polytechnics
(=98,566/3 years)
32,855 2.36
Others(=290736/3) 96,912 6.93
2002-2003 12,60,000 2009-10 VIII Std. 9,50,000 75.40
2004-2005 11,64,000 2009-10 VI Std. 9,98,000 86.00
Source :- 1. Annual Reports of Department of Education for various years. 2. DISE data.
8.9 The above Table indicates that the Gross Enrolment Ratio in Higher education is very
low, compared to the desired level (the vision 2020 document seeks to increase the present
GER ratio in Higher Education from 12% to 25% by 2020. The Commission notes with
concern the following extract from the UGC report on Higher Education “It is interesting to
note that some of the economically and educationally (with respect to literacy rate and school
enrolment) backward States such as Orissa, Assam, Jharkhand and Andhra Pradesh have
shown significantly higher enrolments in Higher Education in comparison with relatively
better off States such as Tamil Nadu and Karnataka”. Further it is learnt that the
employability of the Graduates is far from satisfactory mainly due to lack of required
language and the job skills.
8.10 Although the objectives of respective schemes implemented by the State government
are appreciated, the Commission feels that there is a need to take holistic view to encourage
higher enrolment of students and their continuity, by combining the operation of the (a), (b)
and (c) described below and substantially expanding their coverage. In other words there is a
need to encourage meritorious students from all sections of society to pursue higher studies
on a sustainable basis in subjects relating to science, arts and humanities and business

ERC Second Report 56
studies/commerce as well as Engineering and Medicine. Presently there are several
Scholarship schemes. However, these are narrow in their scope and coverage. For example:
a) A scholarship scheme is implemented to encourage Science at Degree level,
which has an allocation of ` 70 lakhs @ ` 5,000 per annum per student.
b) Sanchi Honnamma Scholarship with an allocation of ` 90 lakhs @` 2000 per
year per girl student.
c) Kittur Rani Chennamma Puraskar with an allocation of ` 70 lakhs for BPL girl
students studying Engineering and Medical courses.
Besides the above there are a few Scholarships sponsored by Government of India viz.,
National Merit Scholarship and Hindi Scholarship to students in non-Hindi speaking States.
8.11 With decline in the students intake into pure sciences, arts and humanities of higher
level studies, a situation may arise that the state would lose its advantage of being a scientific
hub of higher learning in the country and also would be deprived of scholars in humanities
and social sciences. The scope of the scheme which is now meant only for attracting science
students may be enlarged to include all subjects in general Degree Colleges (BA / B.Sc /
B.Com), the scholarship amount should be increased from the present rate of ` 5,000 to
` 8,000 per annum, periodically adjustable to inflation once in three years, the coverage
should be expanded, to at least 10,000 students from across the State with equal number of
boys and girls. Of the 10,000 scholarships, 2,000 scholarships be awarded to students
without reference to their status of being APL or BPL families and the balance 8000 to
students from BPL families. Out of this 8000, about 2500 scholarships be exclusively
awarded to BPL students who were born and who studied in schools located in 39
Backward talukas as identified in Dr.D.M.Nanjundappa Committee’s Report. Drawing
this scholarship should need not be a bar on the students who otherwise can avail
support/benefit under any other scheme administered by Social Welfare Department,
Minorities Welfare Department and WCD etc. These 10000 students to be enlisted ought to
have cleared PU examinations in Karnataka conducted in the immediate preceding academic
year, and joined Degree College in the State of which, the top 2000 students would comprise
of students from all sections of the society and the remaining 8000 students ought to be from
BPL families, who have cleared PU examinations in Karnataka conducted in the immediate
preceding academic year. Such meritorious students may be enlisted and given an option to
avail or not to avail such a scholarship. The amount is suggested to be ` 8,000/- because the
scholarship amount ought to be attractive to the students particularly to those belonging to
backward regions as they have to migrate to towns and cities to pursue higher studies. Such

ERC Second Report 57
migration costs are high for them. The Students from science courses should be provided
with additional 20% scholarship amount to account for higher costs borne by the students
towards books etc and to enable the science students to purchase laboratory instruments,
apparels, as is required by the course. These meritorious students should not be debarred to
avail other entitlement based scholarships from Government of Karnataka during their period
of study. Assuming that a student continues his/her studies upto post graduation the financial
implication would be about ` 8 crore in the first year (say 2011-12). Thereafter it would
increase to about ` 16 crore, ` 24 crore, ` 32 crore, ` 40 crore every successive year. As the
students are expected to complete their masters course in a period of five years the maximum
expenditure on this scholarship would be ` 40 crore from the year 2016-17. The most
challenging part of success of this scholarship would be to retain the students’ interest for the
five years. For this purpose the government may encourage promoting special academic club,
regulated by those students, so that all these them would network, periodically meet and
exchange ideas among these selves and be model students for others.
8.12 The Scholarship to be so instituted be administered through electronic mode and
disbursal to be executed through an identified financial institution. Such an institution
should be able to disburse scholarships to students on time at regular intervals at
predetermined instalments for each student. In case release of funds from Government of
India is delayed; the institution may charge marginal financing charges or interest for
advancing these scholarships. This would require approval of scholarships at one go at the
beginning of the academic year itself so that the financial institution can make its cash flow
arrangements accordingly. Infact, any new scholarship to be introduced in any social welfare
Department should be administered through electronic disbursal mode only with a clear cut
time plan.
8.13 There is no reliable database of research output from various institutes, in the form of
publications, patents, research in progress. However, considering the recommendations
already made by several experts, the Commission suggests that at least ten percent of the
university budget should be earmarked towards research by faculty, in the areas of pure
science and applied research, with priority to the subject of interest to the State. This will
also have a trickling down effect in retaining interest of scholarly students as they would
assisting the faculty as research associate during the period of their study.

ERC Second Report 58
8.14 In the year 2009-10, a total of 1,51,896 students were enrolled in government colleges
in various courses as shown in the Table below.
B.A B.Sc B.Com Other Courses* Grand Total
2008-09
Male Female Total Male Female Total Male Female Total Male Female Total Male Female Total
40770 38182 78952 4992 6035 11027 11876 10689 22565 10161 8872 19033 68369 64167 132536
2009-10
43626 34989 78615 4479 5710 10189 15249 8275 23524 20424 19144 39568 76804 75092 151896
* Other Courses-BBM, BCA, B.L., B.B.A.
As on 1.4.2010, the number of lecturers in position were 5062, which gives Student to
Teacher ratio of 30. As per NAAC the student teacher ratio for A grade Colleges was 20.4
and for B grade colleges it was 25.2. It is important that the Student Teacher ratio is
maintained at 20:1 as recommended by NAAC, particularly for Science courses where such a
ratio is crucial towards better quality of education. The vacancies of lecturers and librarians
in government colleges are considerably high. As of 1.4.2010, fifty percent of librarian
positions (174) are vacant. Similarly 799 positions of lecturers are vacant (13.6%). Further,
the per student expenditure considering only salary component of teachers and non-teaching
staff, worked out to be ` 12,844 in the year 2008-9, while the tuition fee collected was ` 857
per student. Considering these costs and the shortfall in the faculty positions, library
infrastructure and training capacity, raising NAAC accreditation from the present level of less
than 30 percent to 100 percent of colleges by 2020, would need increasing capital
expenditure and recurring expenditure every year. Hence the Commission recommends that
the government may increase investment in government colleges, while also considering
increasing potential for raising tuition fee from APL. Also Universities need to be pro-
actively encouraged to explore public private partnerships (PPPs) in research programmes,
laboratory management, centralised digital library services, including effective use of
EDUSAT, and to seek sponsorships for chairs from leading industrial houses as part of
their Corporate Social Responsibility (CSR) initiatives.
8.15 The Grant-in-Aid Code needs to be reviewed by the government, particularly in the
light of the impact of the implementation of the Right to Education Act. Since pressure on
resources will increase, there is a need to progressively step back from supporting the
institutions which have been given concessional land and grants during the last thirty years.
An exit policy needs to be drawn while keeping in mind the equity issues in Higher
Education.

ERC Second Report 59
8.16 The Department of Technical Education is mandated to promote planned, and
sustainable development of Technical Education in the State consistent with National and
State policies. Annexure-8b provides the details of Institutions and the Intake of the
polytechnics in Karnataka. At present, there are 187 Engineering Colleges, 286 Polytechnics,
12 Junior Technical Schools, and 76 Fine Arts Colleges. Excluding 5 Evening Engineering
Colleges, there are 182 Engineering Colleges of which there are 10 Government Colleges, 2
University Colleges, 9 Government Aided Colleges and 146 Private Engineering Colleges.
Also there are 15 minority colleges for engineering. Out of 286 polytechnics, 81 are
government, 43 are government aided and 162 are private unaided polytechnics. For the year
2008-09, out of an intake capacity of 41,441 students, 38,069 students were admitted to the
polytechnics. The Directorate of Technical Education is the monitoring and controlling body
for the admissions to Diploma and Degree courses in Karnataka.
8.17 Karnataka Common Entrance Test (CET)is conducted for the purpose of admitting
students to first year Courses in Engineering, Medical, Dental Courses in Karnataka.
Professional colleges in Karnataka State which offer Medical, Dental and Engineering
Education and which are affiliated to the state run Universities, admit students through
Karnataka CET every year. There are three kinds of seats (Free seats, payment and
management quota seats) available in various colleges. The fee structure differs every year.
Only Karnataka students are allowed for CET for the academic year. The rest can opt for
COMED-K exam conducted parallel to CET-Karnataka by the private Medical, Dental and
Engineering Colleges Association. Under the COMED-K, the candidates can select their
seats out of a total of 14 medical colleges, 28 Dental Colleges, 113 engineering and nine
architecture colleges.2 Annexure-8c provides the details regarding seat sharing arrangement.
The Number of Students applied and appeared in CET for last five years is as follows:
Year Karnataka Non-Karnataka Total
Applied Appeared Applied Appeared Applied Appeared
2003 77,207 75,240 56,191 34,595 1,33,398 1,09,835
2004 81,417 79,320 27,897 13,613 1,09,314 92,915
2005 87,053 85,270 87,053 85,270
2006 91,217 88,270 91,217 88,270
2007 1,05,135 1,02,481 1,05,135 1,02,481 Source : Data as available on 02.02.2011 from www.karnataka.com/education/cet
It can be seen that the demand for engineering seats for Karnataka has been consistently
increasing and exceeds the intake capacity of the Engineering Colleges in the State. Further,
the study report of the consultants to the Commission indicates a higher demand for
Computer Sciences and Electronic Communications. The Department of Technical Education
2 http://www.karnataka.com/education/cet/news.html

ERC Second Report 60
should therefore encourage the existing private engineering colleges in the state, having
required infrastructure and faculty to augment their enrolment capacity for disciplines where
there is adequate demand. New Private Colleges (without any GIA from the State
Government) who can provide for adequate faculty and infrastructure could also be
permitted, with required clearance from AICTE, particularly in Districts where there are no
or very few colleges for technical education.

ERC Second Report 61
Chapter 9
Department of Agriculture
9.1 The Department of Agriculture is one of the oldest Departments in the State and
came into being with the stated mission to increase the production and productivity of
agricultural crops, and to improve food security and income security for the agricultural
community in the state. The Department also aims at making sustained efforts towards
adoption of new technologies, inculcation of innovative and best farming practices, and
regulation of quality seeds and new crop varieties within the state. The various initiatives,
schemes and programmes of the Department of Agriculture are implemented through the
field Department (Directorate) of Agriculture as well as the Watershed Development
Department. The Department of Agriculture is supported in its research initiatives by the
State Agricultural Universities, viz.
(a) University of Agriculture Sciences, Bangalore and
(b) University of Agricultural Sciences, Dharwad.
The new technologies developed by the State Agricultural Universities are transferred to the
farming community on a continuous basis through Raitha Samparka Kendras (RSKs). The
administrative jurisdiction of the Department includes various corporations/Agencies viz.
(a) Karnataka State Seed Corporation, Bangalore;
(b) Karnataka State Seed Certification Agency, Bangalore;
(c) Karnataka State Agro Corn Products Ltd, Bangalore;
(d) Karnataka State Agricultural Produce Processing and Export Corporation (KAPPEC),
Bangalore;
(e) Karnataka Compost Development Corporation, Ltd.;
(f) Karnataka Togari Abhivrudhi Mandali Ltd, Gulbarga;
(g) Mysore Tobacco Company Ltd.
Out of the total land area of 190.5 lakh ha. in Karnataka State, the gross cropped area is
128.93 lakh ha. (65%) and 30% (37.89 lakh ha.) is the gross irrigated area (Annexure-9b,
Table 2). There are 10 Agro-climatic zones with rich agro diversity, and 5 major soil types.
The agricultural sector contributed 16.4% (current prices) of the state’s GSDP in 2008-09.
The number of farm holdings in the state has increased from 57.76 lakhs in the year 1990-91

ERC Second Report 62
to 75.81 lakhs in 2005-06. Seventy five percent of farmers are small and marginal farmers.
The average size of landholding is 1.63 ha., and forty eight percent of the holdings are less
than one hectare in size.
9.2 The Commission is of the view that while looking at the incentives, policy priorities
and investment relating to agriculture, the government needs to take a holistic view of its
expenditure through schemes, project and programmes which benefit the farmers directly
or indirectly. Government support to agriculture sector or to farmers flow through varied
schemes administered by several Departments other than Agriculture, Horticulture and
Sericulture which are illustrated below;
Sl.No Department Schemes
1. Water Resources –
(Major, Medium
and Minor
Irrigation)
Irrigation Projects/Schemes
Canal Projects including canal modernization
projects
Lift Irrigation Schemes
2. Energy Subsidy Schemes
3. Co-operation Interest Subsidy Scheme
4. Agriculture
Marketing
Floor Price Scheme
5. Social Welfare Ganga Kalyan, Purchase of land to landless farmers
6. Minorities Welfare Ganga Kalyan
7. Animal Husbandry Live- Stock Development Farms, Live-stocks
Farms and Training, Reimbursement of Medical
Expenses- Animal Husbandry
9.3 The Commission recognizes the fact that the agriculture sector continues to support
more than half the total labour force in the state, despite the declining share of agriculture as a
percentage of GSDP. The Commission also recognizes that the farm holding size is
continuously declining. Thus, the Commission impresses upon the government to take a
long term view to encourage and enable the agricultural workforce to migrate to non-
agriculture sector to the maximum extent possible, by promoting the growth of attractive
non-farm and off-farm jobs. The Department also has to safeguard the interest of farmers
and ensure, while introducing new schemes for increased production, that the terms of
trade should be favorable and not exploitative for the farm sector.

ERC Second Report 63
9.4 Over the last five decades, the Department of Agriculture has followed a broadly three
pronged approach towards administration of the sector. Firstly, the Directorate undertakes the
overall monitoring of the crops and seasons, with the help of its officers spread in the districts
and Taluks. Kharif and Rabi Meetings are held regularly to review the succession of
activities starting from the pre-planting preparatory stage till the final harvest and post-
harvest, to assess and handle requirements and problems, if any, from time to time. Secondly,
Centrally Sponsored Schemes and the Central Sector Schemes are implemented based on
Government of India guidelines which also provide sufficient flexibility to the State
Department to tailor the schemes to the requirements of the State. Thirdly, the Directorate
also initiates various schemes based on the requirements in the state and undertakes
implementation.
9.5 The Centrally Sponsored and Central Sector Schemes include the Rashtriya Krishi
Vikas Yojane (RKVY), Rashtriya Krishi Bima Yojane (Weather Based crop Insurance
Scheme (WBCIS), and National Food Security Mission. Apart from providing subsidies to
the farming community, the state sector schemes include development of Seed farms, Soil
Health Centres, Insecticide control Laboratory, Organic farming and implementation of
extension activities including Hasiru Habba (Krishi Mela), Farmers Study Tour and the
Raitha Samparka Kendras.
9.6 The Major roles of the Department can be broadly classified into the following
groups,
a. Administration
b. Extension and Advisory Service
c. Adaptive trials and Demonstrations
d. Training and Farmers Education
e. Crop Development and Estimation.
f. Planning for Input Supply (Seeds, Fertilizers & Plant Protection Chemicals)
i. Seed Production (Seed Farms)
ii. Crop Protection (Plant Protection Chemicals & Bio Pesticides)
iii. Production of Bio Fertilizers and Bio Pesticides.
g. Farm Information Service
h. Regulatory Functions for quality control of Inputs – Implementation of the
i. Seed Act
ii. Fertilizer Control Order
iii. Insecticides Act
i. Soil Testing

ERC Second Report 64
j. Farm Mechanization & Micro Irrigation
k. Implementation of various State & Central Schemes
l. Crop Insurance
Current Activities of the Department include:
A. Distribution of subsidy inputs under various schemes at the Raitha Samparka
Kendra (RSK) such as,
1. Seeds
2. Organic Manure like Vermicompost, Enriched Compost, etc.,
3. Plant Protection Chemicals & Equipment
4. Lime, Gypsum & Micronutrients
5. Farm Machinery like Tractors, Power Tillers & Improved Agricultural
Implements and Diesel Pump sets
6. Agro Processing Equipments like Flour Mills, Threshers, etc.,
7. Post Harvest equipment like sickles, tarpaulins, storage bins, etc.,
8. Micro Irrigation Equipments like Drip & Sprinkler Irrigation Systems
B. Encouraging farmers for -
i. On-farm organic mass production and Organic Farming by providing
assistance for Construction of Biodigestors, Vermicompost units, etc.,
ii. Post Harvest Technologies like Construction of Threshing Yards
C. Training of Farmers & Farm Women.
D. Soil testing for giving fertility based nutrient recommendations.
E. Quality control of Agricultural Inputs through Seed Act, fertilizer Control
Order, and insecticides Act.
F. Crop Estimation (Area & Yield).
G. Laying out Demonstrations in farmers fields to impress upon the new
Technologies.
H. Publicity for crop insurance.

ERC Second Report 65
9.7 The Department of Agriculture is headed by the Commissioner for Agriculture,
supported by the Director of Agriculture and four Additional Directors of Agriculture at the
State level. There is a Joint Director of Agriculture at the district level in each District,
Assistant Directors of Agriculture at each Taluka level, and an Agricultural Officer at each
Hobli. There is a need to clearly define the job charts of agriculture officers so as to be in
harmony with the services provided by Agriculture Universities and under the Central sector
Schemes. The relevance of each scheme in the Department needs to be properly re-assessed,
vis-a-vis the mandate of the Department. The job charts of the officers and staff also need to
be freshly drawn up, since there appear to be no clearly defined or understood job charts at
present.
9.8 During discussions, the Commission noted that the posts of Agriculture Assistants
(AAs) have been abolished in Karnataka whereas the same are retained in Andhra Pradesh
and Tamil Nadu. The salary component which was about 37 percent of total expenditure on
all Plan and Non-Plan schemes in 2005-06, has come down to 16 percent in 2009-10. It was
mentioned to the Commission that there are 3382 vacancies out of 9602 for cadres in all
groups (Annexure-9a). Among Group A, 87 posts were vacant (17% vacancy), 1442 posts
were vacant (51%) in Group B and 1860 posts were vacant (30%) in Group C and D. Within
Group B post, the Cadre of Agricultural Officer has a vacancy of 57%. At the field level
there is a large number of vacancies, adversely impacting the implementation and outcome of
the schemes. Also, the nature of agricultural land holding pattern (paragraph 9.1) in the state
has implications for regulation of crop practices and dissemination of extension activities.
The Commission, as recommended in its first report, has the view that there is a need to
migrate from individual-based approach to group based approach in extension services. Also
the extension and technology support to farmers’ groups should be strengthened with grass
root level deployment of the Agricultural Assistants to help attune the Department with the
ground level need for the farmer. However, lack of sufficient number of agricultural officers
required for the extension activities constrict the free flow of research outputs to the farming
community. In order to achieve a satisfactory outcome of the research efforts, the posts of
AAs need to be revived.
9.9 Figures indicating the budgetary allocation and the actual expenditure incurred by the
Department during the last 5 years are given in the Table below. In 2005-06, the total
allocation was ` 54,253 lakhs out of which ` 37,132 lakhs (68.44 percent) was released, and
only 73.25 per cent of the released fund was spent. Similarly, in 2009-10 out of a budgetary
allocation of ` 1,06,474 lakhs, only 87.98 percent (` 93,675 lakhs) was released, and of this
only about 89 per cent was spent. There is thus repeatedly a wide gap between the budgetary
allocations, amount released and expenditure incurred every year, over a period of time. This
appears to indicate (i) the capacity constraints of the Department to use the budgetary

ERC Second Report 66
allocation and (ii) potential for streamlining the release mechanism. In the course of
discussions the officers of the Department had expressed the view that releases need to be
seasonally adjusted rather than given on a quarterly basis. The Schemes of the Department of
Agriculture and the related agencies are concerned with multiplication of seeds, distribution
of inputs and implements, etc., and are closely linked with the agricultural production cycle
which is season-based. If the funds allocated to these Schemes have to be effectively spent,
they have to be released, keeping in mind the seasonality of the agricultural operations,
otherwise there is possibility of funds remaining unspent or being misspent. The Finance
Department has to bear the same in mind while releasing funds for this Department.

ERC Second Report 67
Trends in Budgetary allocation, Releases and Expenditure from 2005-06 to 2009-10
(` in Lakh)
Year 2005-06 2006-07 2007-08 2008-09 2009-10
Allocation Plan
Non-
Plan Total Plan
Non-
Plan Total Plan
Non-
Plan Total Plan
Non-
Plan Total Plan
Non-
Plan Total
Total Budget
Allotted 42694 11560 54253 27273 32586 59859 45499 30816 76315 107376 19189 126565 81715 24760
10647
5
Amount
Released 26073 11060 37132 26861 18176 45037 38481 24883 63364 71170 18989 90159 74693 18983 93675
Expenditure
Salary Purpose 338 9837 10175 356 10793 11149 118 13038 13156 140 14061 14201 19 13207 13226
Non Salary
Purpose 16283 743 17025 25710 3618 29328 36701 10506 47208 62768 2833 65601 64688 5242 69930
Total
Expenditure 16621 10579 27200 26066 14410 40477 36819 23544 60363 62908 16894 79802 64886 18450 83335
Per cent of
Amount
Released over
total budget
allotted (%) 61 96 68 98 56 75 85 81 83 66 99 71 91 77 88
Per cent of
Expenditure
over Amount
released (%) 64 96 73 97 79 90 96 95 95 88 89 89 87 97 89
Source : Department of Agriculture, Govt. of Karnataka
Note : Expenditure does not includes expenditure on Watershed, Agricultural Universities

ERC Second Report 68
9.10 The Department has 29 Plan Schemes and 12 non-Plan Schemes. For the year 2009-
10, an amount ` 1,08,212.42 lakhs has been provided in the Karnataka State Budget. Over
one fourth of the allocation to the Department of Agriculture comes from central
Plan/sponsored schemes. Within the State sector, about 43 percent of the allocation is for
crop loan subsidy and 17 percent is for organic farming, which is apparently loaded with
indirect subsidies and low intensity technology transfer. The total subsidy component for all
the schemes is shown in the following Table. The schemes have also been categorised into
those serving the core mandate of the Department and those which are supportive schemes of
the Department. There are 26 State sector schemes, out of which 11 schemes are clearly
related to the mandate of the Department (specifically matching the statements in the
mandate), and 15 schemes are supportive schemes as shown in the following Table.
Subsidy Component of various schemes implemented by Agriculture Department
Sl
No
.
Schemes
Relevance to
Type of
Schem
e
Budge
t
Outlay
(2009-
10) `
Lakhs
Subsid
y (%)
Core
Mandat
e
Supportiv
e scheme
1 Subsidy for crop loan * Subsid
y 25000 100%
2 Organic farming * Subsid
y 10000 10%
3 New crop Insurance Scheme * Subsid
y
5000 100%
4 Special Component Plan * Subsid
y 4887 75%
5 Tribal Area Sub Plan * Subsid
y 4034 75%
6 Micro irrigation * Subsid
y 4000 75%
7 Enrichment of Soil Fertility -
SDP
* Subsid
y
4000 50%
8 Supply of seeds & other inputs * Subsid
y 3000 50%
9 Directorate of Agriculture * 1831
10 New agriculture promotion
scheme * 2000
11 Oilseeds production Programme * 1650
12
Development of agriculture
under New Macro-Management
mode
* Subsid
y 100 15%
13 Farm related Activities * 783
14 Soil health Centres * 802
15
Project for Agricultural Training
of farm Women and youth with
DANIDA
* 764
16
Upgradation of District
Agriculture Training Centre * 500
17 Hasiru Habba (Krishi mela) * 500

ERC Second Report 69
Sl
No
.
Schemes
Relevance to
Type of
Schem
e
Budge
t
Outlay
(2009-
10) `
Lakhs
Subsid
y (%)
Core
Mandat
e
Supportiv
e scheme
18 Farmers study tour * 500
19 Insecticides control Laboratory * 225
20 Other agricultural schemes * 300
21
Mini Mission -II Under
Technology Mission on Cotton * 58
22
Agricultural Technology
Management Agency (ATMA) * 200
23
Agricultural Farms &
Development Centres * 168
24 AGRISET * 10
25 Karnataka Agricultural Mission * 50
26 Bio fuels * 1
Note: 1.Core mandate: it refers to the main objective of the Department to achieve higher
production and productivity. 2. Supportive Schemes: The schemes which are in the form
of incentives and infrastructure which indirectly help to achieve the core mandate.
9.11 Going by the definition (notes 1 and 2 above), a large number of schemes are directed
towards the non-core mandate of the Department. The latest figures of subsidy component
within each scheme shown in the Table above, from which it may be seen that about 55%
(` 44,205 lakhs) of the state sector outlay goes towards subsidy. With 16 percent of the state
allocation being spent on the salary component (Para 9.9 of this section), and such a
substantial portion spent on subsidies to farmers, a balance of only about 30% of the
allocation remains for agricultural schemes such as farm development, research and
extension, and IT initiatives. The State government should increase allocation for
intensifying efforts towards Agriculture extension activities. The Department of
Agriculture should reprioritize its expenditure in favour of Schemes like Soil Health
Centres, Enrichment of Soil Fertility and Soil Conservation techniques for better land use
planning and land management. Also the state should accelerate efforts towards reclamation
of alkaline agricultural land through its schemes for Land development. Therefore, appraisal
of the schemes has to be made mandatory both for continuing an existing scheme and for
initiating new schemes. This would require a policy for evaluation specifying the schedule,
standardised costing, defining clear, concise and measurable outcomes. In the case of
schemes that are predominantly subsidy driven, the structure of the scheme, the terms and
conditions for eligibility and the actual modalities for release of money to the beneficiaries

ERC Second Report 70
should be made leak proof and transparent. This is crucial, so that the intended purpose is
served and concrete benefits are reaped from the farms and farm output.
9.12 The Crop loan Subsidy scheme administered by Agriculture Department with an
allocation of ` 250 crore (2009-10) constitutes about 44 percent of the total plan allocation.
This is a State sector scheme aimed at providing interest subsidy of 4 percent to facilitate
short-term crop loans up to ` 50,000 to farmers (at 3 percent interest rate from Public sector
Commercial Banks and Regional Rural Banks). This benefit can be availed only by farmers
who have repaid the loan on time. As requested by the SLBC, the Department has released
` 40 crore for the year 2009-10. However, utilization is said to be poor due to several
reasons which, interalia, as follows:
(a) a large number of small and marginal farmers are still unable to access credit,
(b) updated revenue records to avail the loans are not available,
(c) interest and motivation of public sector and Regional Rural Banks (RRB’s) to
promote and sensitize the farmers about benefits of the scheme is found to be lacking.
9.13 The Departmental view is that the amount allocated was too high. For example, when
the Department had indicated an estimated requirement of ` 2,500 – ` 3,000 lakhs for crop
loan in 2009-10, an allocation of ` 25,000 lakhs was provided. They also suggested that,
since the scheme does not relate to either production or productivity of the crops, it could be
transferred to the Department of Co-operation, which handles the subject of crop loans to
farmers. The Co-operation Department could make suitable arrangements to deal with crop
loans to farmers from Commercial Banks and RRBs. The Commission is therefore of the
view that, instead of making unnecessarily excessive allocations for subsidy schemes such
as crop loans, which remain under-utilized, allocations need to be directed towards
schemes that directly raise productivity through research and extension services, as this is
the area that needs to be strengthened and extended further. Moreover, since the
implementation of the scheme being linked to timely repayment of the loan by farmers,
under-utilization of allocation could be attributed to repayment failure, which may lead to
undesirable burden of Non Performing Assets (NPAs) in the accounts of financial
institutions. Thus under-utilization of the subsidy can be seen as an early warning signal of
likely impact on the balance sheet of the financial institutions. The issue of under-utilization
of the crop loan subsidy be examined by the Government, while also considering the legal
powers vested with officers of agriculture Department effecting recovery of the loans.

ERC Second Report 71
Organic Farming:
9.14 Government of India and many state Governments have started promoting organic
farming in a big way. For this purpose, Government of India has launched the National
Programme for Organic Production (NPOP) standards and accreditation during 2000, and the
National Organic logo “India Organic” has been created. After an initial period of learning
and gradual success, the Government of Karnataka brought out its own Organic Policy in
2004, in order to promote organic farming in a bigger way in the State. Several organic
farming promotional programmes have been initiated in the State in keeping with this policy.
Further, in order to promote organic farming in a big way under a mission mode approach,
the Government of Karnataka constituted a State Level Organic Farming Mission
Empowered Committee in 2008-09, with 14 non officials (including the Chairman) and nine
Senior Officers of various Departments as members. During 2008-09, about 97% of the
outlay of ` 50 crore was utilized. In the following year an outlay of ` 100 crore was allocated
for Organic farming. A view exists among agricultural experts that though organic farming is
an eco-friendly initiative, its impact may be felt over a longer period. There is higher time-
lag in terms of effective gains of production and productivity while the mineral fertilizers
deliver far more essential nutrients per unit weight than organic matter. Therefore, the results
of investment in organic farming would be slow in terms of impact on production and
productivity. Hence, the relevance, costs, and continuance of the schemes need to be
assessed regularly against nationally accepted standards vis-a-vis farm output, particularly
keeping in view the significance of food security in the near term and medium term.
9.15 According to the recommendations of the Committee on Agriculture and Allied
matters headed by Sri. M.R.Sreenivasamurthy, Agriculture Research and Agriculture
Extension should move together by establishing linkage between Raitha Samparka Kendras
(RSKs) and Krishi Vignana Kendras (KVK). The Agriculture Department is supported in its
research initiatives by State Agricultural Universities, the Indian Council of Agricultural
Research and certain private sector research institutions. Agricultural extension activities of
the Department are carried out through RSKs. There are 745 RSKs at Hobli level i.e. 1 each
for 4-5 Gram Panchayats. But the absence of adequate numbers of agricultural officers for
extension activities limits the flow of research outputs to the farming community. In order to
achieve satisfactory outcome of the research efforts, there is a need to widen and deepen the
research output with less time lags. While the conventional Training and Visit (T &V) system
has its merits, it is dependent on higher manpower for better results. The present extension
structure in the State is stagnant and suffers from a complete lack of quality time and
attention on the part of the ground level Departmental officials. During the Commission’s
visits to the Districts, it was noted that most of the RSKs are engaged predominantly with
distribution of seeds and farming inputs without imparting training or advice to the farmer for
better agricultural productivity, thus defeating the purpose with which RSKs were initiated.
Also, with a number of schemes focussed on providing agricultural inputs such as loans,
subsidies, farm implements and seeds, the officials are unable to devote focussed attention to

ERC Second Report 72
the training and information needs of the farmers. As a result, the spirit of T & V targeted at
reaching the farmers with innovative and efficient agricultural practices is completely lost. In
this regard, the Commission recommends that the Agriculture Department, in line with its
mission, should channelize its resources towards reviving the extension activities in the
State by making use of advanced Information Technology (IT) choices. In addition to our
own initiatives like Nemmadi and Raitha Marata Kendra and Bhoomi, the ITC sponsored
e-Chaupal in Madhya Pradesh or e-Sagu in Andhra Pradesh offer instructive examples in
this direction.
9.16 The Universities of Agricultural Sciences and Institutes under them should be
encouraged to produce scalable innovations - which should have a low lead time from lab
to land. Farmers in the state should be enabled to benefit from technology-based initiatives
by strengthening RSKs/KVKs. One of the programmes initiated by the central government in
this regard includes the National e-governance initiative (Box.1) which aims at making
innovative and collaborative use of internet technologies to achieve effective penetration of
agricultural extension activities at the central and state level. Apart from this, the initiatives
made by IFFCO towards dissemination of information through mobile telephony and voice
message services (Madhya Pradesh) should also be studied by the Department, to explore
ways of establishing a robust and efficient extension system through technology platforms.
Box 1 : New Initiatives planned out by the Central Government
National e-governance initiative is a web-based solution to provide end-to-end farm
related solutions to farmers. Along with Himachal Pradesh, Kerala, Madhya Pradesh,
Maharashtra, Jharkhand and Assam, Karnataka has been selected for the ` 200 Crore
National Governance initiative in agricultural extension.
Through this initiative about 12 farmer-related services such as pre and post harvest
technology dissemination, timely weather forecast, information of availability of
pesticides, fertilisers, and market related real time information are to be provided. The
initiatives are planned through the Agricultural Technology Management Agency
(ATMA) to integrate extension at the Zilla Panchayat, Taluk Panchayat and Gram
Panchayat levels. National e-governance will use integrated mobile based SMS
dissemination, broadcast radio and TV and IVRS (Interactive Voice Recognition
Service) with the help of technical support through (Indian Institute of Technology)
IIT Madras. The initiative will integrate web based network of about 80 portals in the
country for Agriculture, Horticulture and Watershed management. To be implemented
initially at national level, implementation at state level would be taken up under the
second phase to showcase best agricultural practises and to help agriculture extension
officers to replicate them across the region.
Source : (‘Karnataka chosen for agri e-gov initiative’, The Hindu Business line dated 16.09.2010)
ERC Second Report 73
Watershed Development Department
9.17 Watershed Development Program was started in the year 1985 with a view to
integrate the activities of three Sectors viz., Agriculture, Forest and Rural Development.
Income Generating Programmes (IGP) are being implemented by watershed Committees
(Planning-bottom up Approach). The watershed development Department was formed during
2000-01 to take up soil conservation measures and enhance the agricultural productivity. The
mandate of the watershed Department is to develop, promote cost effective, transparent and
sustainable watershed treatment packages in the state.
9.18 Major Schemes of the Department of Watershed Development include Sujala
Watershed Project, Participatory Water Development Programme, National Watershed
Development programme for Rainfed area, Drought prone Area Development Programme
and the Integrated Wasteland Development Programme.
(a) Sujala Watershed Project is a World Bank assisted and a community driven watershed
development project being implemented in five districts of Kolar, Tumkur,
Chitradurga, Haveri and Dharwad. The uniqueness of the project lies in the peoples’
participation in decision making. With a total budget outlay of ` 557 crores for the
project, the World Bank would finance ` 451 crores, ` 57 crores shall be borne by
Government of Karnataka and ` 48 crores shall be contributed by beneficiaries among
the communities. During 2008-09, an area of 40,902 hectares was developed by
incurring an expenditure of ` 88.72 crores. The project has earned four National
awards and the State government intends to repeat the project in Bidar, Gulbarga,
Koppal, Gadag and Chamarajnagar districts.
(b) Under the National Watershed Development programme, an area of 9,600 ha. has
been treated with the utilization of ` 5 crores while 14,537 ha. of Sub Watersheds
have been developed with an expenditure of ` 22.48 crores. The scheme has shown a
healthy physical achievement of about 95% in the last three years.
(c) The Integrated Wasteland Development Programme aims at checking land
degradation, putting wastelands to sustainable use and increasing bio-mass
availability, specially fuel wood and fodder. The project is in implementation in
Bangalore(Rural), Chickballapur, Udupi, Koorg, Chitradurga, Tumkur, Mandya,
Davanagere, Shimoga, Mysore, Gulbarga, Raichur, Chamarajanagar, Hassan, Haveri,
Bellary, Bidar, Koppal and Belgaum Districts. For the year 2008-09, an area of
67,770 ha. was developed with an expenditure of ` 42.3 crores.

ERC Second Report 74
9.19 Watershed Development Schemes should be regularly monitored and the farmers
should be educated about In-situ moisture conservation to increase productivity from
unirrigated agricultural land. In this regard, the commission recommends that the
Monitoring and Evaluation of some of the schemes may be given to a third party, for which
1% of budget outlay could be earmarked as recommended by Planning Department.
Karnataka State Seeds Corporation
9.20 The Karnataka State Seeds Corporation procures foundation seeds, certified seeds and
implements distribution of seeds. For the year 2008-09, Corporation procured 7,288 quintals
of foundation seeds, procured 2,17,025 quintals of certified seeds and distributed 2,74,748
quintals of seeds. The corporation achieved a turnover of ` 63 crores and a profit of ` 28.3
lakhs.
Karnataka State Seed Certification Agency
9.21 The Karnataka State Seed Certification Agency is an autonomous institution to ensure
the quality of various crop seeds produced under seed certification programme and to make
them available to the farming community in time for sowing. There is no budgetary support
from the state government and this agency is running on the service charges collected for
various certification services rendered by the Agency. The agency has been certifying seeds
of over 300 varieties of 40 crops in the state and for the year 2008-09 an estimated 7 lakh
seeds were certified by the agency with an income of ` 3.67 crores and net income of ` 23.2
lakhs.

ERC Second Report 75
Chapter 10
Department of Horticulture
10.1 Karnataka occupies a prominent place in the Horticulture map of the country. According to
estimates provided by the Department of Horticulture, Horticultural crops cover an area of 18.25
lakh ha. with production of 143.27 lakh tonnes per annum (Annexure-10a). While the area
constitutes only 14.44 per cent of the net cultivated area in the State, the total income generated
from the horticulture sector accounts for over 40 per cent of the total income derived from the
combined agriculture sector, which itself was 14.3% of the GDP of the State in 2008-09.
10.2 Horticulture provides excellent opportunities for raising the income of the farmers, even in
the dry tracts. A significant shift towards horticulture is evident in the State, as seen by the steady
increase in area and production. Karnataka has great potential for growing high value but less
water demanding horticultural crops. In this regard, the Department should ensure effectiveness of
its expenditure which benefit the horticulturists for better production and productivity. Therefore
Schemes which focus on improving production, processing, research and extension viz. processing
in Horticulture, Development & Maintenance of Farms & Nursery, Extension and Training, Cold
Storage Subvention and Maintenance of horticultural farms should be renewed and closely
monitored for impact evaluation.
10.3 Horticulture being a State subject, the primary responsibility for increasing horticulture
production, enhancing productivity and exploring the vast potential of the sector rests with the state
government. In addition to centrally sponsored and central sector schemes, the state government
implements several state sector schemes for enhancing horticulture production and productivity,
and thereby improving the incomes of the farming community in the state. The Department of
Horticulture has 21 schemes, of which 20 schemes are under the state Plan, and only one is under
the State Non-Plan schemes. Apart from this, 4 centrally sponsored schemes are also being
implemented in the state. The total budget for horticulture schemes amounts to ` 40463.84 lakh, out
of which ` 10,340.05 lakh has been allocated to State plan schemes, ` 25,890.85 lakh to Centrally
Sponsored Schemes and ` 4,232.94 lakh to Non-Plan schemes.

ERC Second Report 76
Table 1: An Abstract of Horticulture Schemes: Budget outlay 2009-10
(` in Lakh)
Sl. No Scheme State Central Total Percent
1 State Plan 10340.05 0.00 10340.05 25.55
2 Centrally Sponsored
Schemes 7396.73 18494.12 25890.85 63.99
3 State Non Plan 4232.94 0.00 4232.94 10.46
4 Total 21969.72 18494.12 40463.84 100.00
Share (%) 54.29 45.71 100.00
Source: Budget documents 2009-10, Department of Horticulture, Govt. of Karnataka
10.4 Currently around 36 percent of the posts in the Department are vacant. This naturally affects
the implementation of many of the Department's programmes. At present, one AHO looks after as
many as 3 RSKs (Raitha Samparka Kendras), as there are 368 vacancies in this cadre. More AHOs
need to be appointed at RSK level, so that the work here can be carried out effectively. One of the
major reasons for high level of vacancies in this Department is the shortage of qualified
Horticulture graduates in the State. Hence it is suggested that Agriculture and Agricultural
Marketing & Cooperation graduates could be appointed for filling the Direct Recruitment
vacancies in the Department of Horticulture, since these graduates are equally qualified in
production technologies, post harvest technologies and Marketing of Horticultural crops.
Sl.
No.
Category
of posts
Number
Sanctioned Filled Vacant
%
Vacancy
1 Group A 204 158 46 23%
2 Group B 1480 814 666 45%
3 Group C 1559 959 600 38%
4 Group D 2127 1479 648 30%
Total 5370 3410 1960 36%
Source: Department of Horticulture, Govt. of Karnataka
Post harvest infrastructure and Management
10.5 In Karnataka, only 1% of the total production of fruits and vegetables is currently being
processed so as to produce value added goods of higher market value. About 25-30% of the
produce is lost due to improper post harvest management. At present there are 79 cold storage units
with a total storage capacity of 2,67,421 MT, for handling fruits and vegetables. Of these units, 5

ERC Second Report 77
are in the co-operative sector, 68 are in the private sector and 6 are in the public sector. The articles
of horticulture produce that are suitable for storage are: potato, grapes, tamarind, Citrus,
Pomegranate, Pineapple, Chilli, Apple and cut flowers.
10.6 Annexure-10a shows the Total state area, Total state production and Year on Year Growth
for Horticulture vis-à-vis Agriculture. It can be seen that Horticulture acreage and production has
shown improvement of 2% and 7%respectively. This is quite appreciable as compared to
agriculture output. The yield in Horticulture is about 7.75 tonnes per hectares as against 1.45 tonnes
per hectare for Agriculture.
10.7 Horticulture output has shorter shelf life and suffers almost 35% post-harvest losses,
mostly due to inadequate cold storage and transport facilities. Moreover, crops such as grapes,
tomato, potato, onion and chillies are subject to a high degree of price volatility, particularly due to
their perishability. Presently the storage facilities are located mostly near mandis and urban areas
and away from farms. Often, the cold storages in rural areas do not have graded cooling for
different types of produce and hence do not get adequate business from local farmers who prefer
quick sales and returns. More over the cold storage chain suppliers incur high power tariffs charged
at commercial rates throughout the year even though their business is often only seasonal. Hence,
there is a need to encourage storage facilities nearer to farms and also to support refrigerated
transport facilities at affordable costs. Given that different horticulture produces differ in their
requirements for cold storage specifications (temperature, duration of cold storage, etc.), there is
a need to encourage graded cooling cold storage facilities in the state. Also, the state government
should assess the feasibility of providing differential rate of tariff for cold storage chain facilities
by working out different tariff for cold storage facilities while taking into account seasonal
demand. Considering the fact that demand is higher in summer due to high perishability for
fruits and vegetables, such tariff should not be allowed to be barrier for accessing cold storage
facilities. Further, the improvement in cold storage infrastructure should be supported with
sufficient number of technically skilled supporting staff as well. For this purpose, the
Department should encourage ITI courses in cold chain technologies, refrigeration, etc., to
support the growth momentum in this sector.
10.8 Based on the estimates of per capita consumption of horticulture produces prepared by the
Task Force set up by Planning Commission, demand for fruits and vegetable in Karnataka would
increase from 123 lakh tonnes in 2008-09 to 145 lakh tonnes by 2020. Presently cold storage
facility is estimated to be to the extent of 2.54 lakh tonnes in 79 facilities, of which 68 are under
private management. The rest are organized by the Karnataka State Warehousing Corporation and
the Karnataka State Co-operative Marketing Federation. Considering the requirement in the
medium term, and also to avoid post-harvest losses the government needs to encourage
investments in cold chain capacities and efficient transport facilities. The Commission also
recommends that the Department of Horticulture should co-ordinate research more intensely

ERC Second Report 78
towards improving the quality of the seed, the shelf-life of horticulture products including
feasibility of irradiation of select products. While doing so, the Department should take adequate
safeguards in the matter of phytosanitory measures as applicable under WTO regime.
10.9 The current use of Information Technology (IT) is limited, being mainly up to the District
level. It has not reached the Raitha Samparka Kendras (RSK) which serve farmers in groups of 4 to
5 villages. Infrastructure needs to be created and integrated from the taluk level to the State level, in
order to facilitate the maintenance and updating of records with minimum staff. In addition to this,
as horticulture crops and processing technologies require continuous extension support or
guidance, it is desirable that greater use is made of Hortnet, the interactive website made for this
purpose. This could be operated at RSK level with support from KVKs, Universities and
supporting agencies.

ERC Second Report 79
Chapter 11
Department of Fisheries
11.1 Karnataka has about 5.00 lakh hectares of inland water resources, 8000 hectares of
brackish water and 300 kms. of coastline with 27,000 sq. kms. of continental shelf.1 The
Fisheries sector contributes to 0.4% of the State Domestic Product2 and about 15% of the
total marine fish production valuing ` 264 crores is exported. Annexure-11a shows the
resources of the state in the matter of potential for fisheries and fish production in Karnataka
over the last ten years. There is a wide gap between the fish harvest and the catchable
potential. The annual fresh water fish catch in the state is about 1.43 lakh (2008-09) metric
tonnes against a potential3
of 2.6 lakh metric tonnes (estimated by the Environment
Management and Policy Research Institute EMPRI) while the marine fish catch is 2.18 lakh
metric tonnes against an estimated potential of 4.25 lakh metric tonnes. Among the important
species of catchable fish are the Mackeral (20% of the total potential), Oil sardines (19%) and
Carangids (10%)4. The value of the marine fish exports have grown impressively over the
years and show a growth of more than 115% in the last ten years.
11.2 The Department of Fisheries was established in the year 1957 with the object of
giving a fillip to fish production from both marine and inland sources. The Department of
Fisheries takes up programs and activities for rational development as also conservation of
fisheries resources in the State. The Department also strives to improve the socio-economic
conditions of fishermen. The objectives, functions and Schemes of the Department are
directed towards;
a) Inland Fisheries Sector;
b) Marine Fisheries Sector; and
c) Fisherman Welfare Schemes.
The Department of Fisheries is also supported in its activities through the Organisations of
the Department:
a) North Kanara District and South Kanara District Co-operative Fish Marketing
Federation;
b) Karnataka Fisheries Development Corporation;
c) Karnataka Co-operative Fisheries Federation Ltd., Mysore;
1 Department of fisheries, Karnataka.
2 Economic Survey of Karnataka, 2009-10
3 http://parisaramahiti.kar.nic.in
4 Annual catchable potential of important group of fishes off Karnataka at 0-50 fathoms depth, Working group
GoI, 1991, Catchable potential

ERC Second Report 80
d) Fish Farmers Development Agencies.
11.3 The Department of Fisheries is under the administrative control of the Principal
Secretary to Government, Animal Husbandry and Fisheries Department. The policies and
schemes of the Government are implemented through the Directorate of Fisheries headed by
the Director of Fisheries, assisted by 3 joint Directors, 9 Deputy Directors, 23 Senior Asst.
Directors, 32 Asst. Directors (Gr.1) and other officers and staff. In addition, 3 Joint Directors,
2 Deputy Directors, and 6 Senior Assistant Directors are working on deputation in other
Departments, institutions/organizations. The total sanctioned strength of the Department is
1410 of which the working strength is 838 and 572 posts are vacant as on 31-03-2009
(Annexure-11b gives details of Organisation structure and Staff position for the Department
of Fisheries).
11.4 The Budget (2008-09) of the Department of Fisheries makes the following allocations
under State Sector Schemes:
20% towards Inland Fisheries, 30% towards Marine Fisheries, 45% towards Welfare
Schemes and the rest for Special Component Plan and Tribal Sub-Plan Schemes. Of the
above, utilisation has been to the extent of 80% of the allocation in the case of Inland
fisheries, 42% of the allocation towards Marine Fisheries and 65% in the case of the Welfare
Scheme. Further out of the 7% of the State plan Budget that is allocated towards Zilla
Panchayat Schemes, the expenditure utilisation is only 40%.5 The scheme wise reasons are
explained in the succeeding paragraphs. The ‘Matsya Mahila Swavalambana Scheme’
(Budget allocation of ` 10 crores in 2009-10), ‘Matsya Ashraya Scheme’ (` 10 crores) and
‘Construction of fisheries link roads, bridges and jetties with NABARD assistance (` 10
Crores) are some of the major schemes of the Department while there are about 10 State
Sector Plan and Non-Plan schemes which have a Budget allocation of less than Rupees One
crore. (Annexure-11c, Schemes of the Department of fisheries).
Inland Fisheries
11.5 Inland fisheries constitute a source of additional income for the rural folk. In
Karnataka, about 201 freshwater fish species belonging to 9 orders, 27 families and 84 genera
have been recorded. However, about 40 fish species are under threat and required urgent
conservation measures to ensure their survival.6 In order to boost inland fish production to
meet the growing demand, the Department of fisheries has laid more emphasis on the culture
of fast growing Indian major carps. Several of the introduced fish species have adopted well
and some of these7 now dominate the State’s inland water fishery, as they breed fast and well.
5 Annual Report 2009-10, Department of Fisheries
6 Study report by EMPRI.
7 EMPRI Study report

ERC Second Report 81
The Departmental schemes for promotion of Inland fisheries include Disposal and
development of tanks, Fish Seed production, Free supply of fish seed for stocking and
training to farmers in Inland fisheries.
11.6 During the year 2009-10, 27.73 crore of fish seed (fry) was produced and developed
by stocking in Department tanks, gram panchayat and minor tanks with a production potential
of 0.85 lakh metric tonnes of inland fish. Based on the optimal seed stocking density8
(capacity) of the inland water resources in the state, the Department of fisheries has estimated
a requirement of 33 crore of fish seeds. With estimated survival of about 30-35% from fry to
fingerlings and about 15% from spawn to fingerlings, this translates into a target about 4
lakh metric tonnes of fish production. Though the Department has several schemes for
subsidised purchase of fish seeds, and assistance for development of fisheries in wells,
ponds, tanks etc., the response by the local fishermen and farmers owning ponds for
developing local inland fisheries has been very low. This can be seen from the poor
response to the scheme and low utilisation of budget provision: in the year 2008-09, only
174 beneficiaries took up fish culture. This seems to be largely because it is felt that the
income therefrom may be low, and also because the fear of new technologies deters local
fishermen and farmers from taking up development of Inland fisheries in the State.
11.7 Out of a total of 5.78 lakh persons enumerated to be inland fishermen, 4.65 lakh are
said to be not engaged in fisheries activities. Moreover, the Department has trained only 543
farmers which indicates a low reach of extension services. The Department has to encourage
fishing as a non-traditional and a profitable trade, in order to exploit the fish catch to its full
potential and also to make fish available at competitive prices to consumers. This would
mean that the Department’s expenditure towards research and extension activities would
have to be intensified to reach higher number of potential fish farmers. For instance,
during the year 2009-10, budget allocation for Research and Extension was ` 25 lakhs of
which only ` 11 lakh was utilised. Apart from this, there are vacancies to the extent of
42% in the technical staff of the Department. The various colleges and research institutes
under the Karnataka Veterinary, Animal and Fisheries Sciences University, Bidar located
at Bangalore, Shimoga, Mangalore, Gulbarga, Hassan should be encouraged to offer one
year courses in fishery technology. This would facilitate recruitment of adequate number
of qualified technical persons in the Department and strengthen the extension activities for
increased Inland fisheries in the state.
8 Expressed in Kg/ha, Stocking Capacity indicates the extent to which fish density can be maintained in a water
body for adequate fish culture maintenance.

ERC Second Report 82
Marine Fisheries
11.8 Out of the total of 2.02 million sq. kms. of Indian Exclusive Economic Zone (EEZ),
the share of Karnataka is 87,000 sq. kms. Of the 4.25 lakh metric tonnes of marine fisheries
resource potential of the State, 2.25 lakh metric tonnes is estimated from the inshore areas
(depth of 70m) and the remaining potential of 2 lakh metric tonnes is estimated to come from
the off shore/deep sea zone. In order to promote marine fishing, the Department of Fisheries
supports several schemes viz. ‘Motorisation of traditional fishing boats’, ‘Supply of Sales tax
exempted diesel’, ‘Remission on central excise duty on purchase of HSD by mechanised
fishing boats’, ‘Assistance for installation of life saving equipment on fishing boats’ etc.
District Fishermen’s cooperatives affiliated to Co-operative Fish Marketing Federation, as
well as the Fisheries Development Corporation are working in the coastal districts help the
fishermen in the matter of supply of diesel, fishery requisites, spare parts, etc. However, as
against the total continental shelf of 27,000 sq. kms., the state is exploiting only 7,000 sq.
kms. with both mechanized and non mechanized fishing craft, indicating that fishing can be
further explored beyond 7,000 sq. kms. The marine fish production is limited and sometimes
brood stock, i.e. young stock or juvenile fish is also being caught, which needs to be
discouraged. In this regard, the Commission recommends that the Department should
review whether schemes that provide input subsidy help to encourage deep sea fishing, and
make suitable changes in the schemes so that resources available within the State’s marine
territory can be explored. Government needs to consider diesel subsidy to cold storages for
exclusive use by people engaged in fish trading, particularly in areas where electric supply
is erratic; and also to specialized refrigerated transport vehicles.
11.9 The Marine fisheries sector, with many forward linkages, has the potential to create
employment opportunities directly in transportation, storage, processing and packaging of
fish produce. For this purpose, the Department should encourage development of an active
processing, transport and storage industry utilising the raw material produced by the marine
fisheries sector. The Department should undertake the promotion of industries such as fish
processing and canning, production of fish oil and dry fish, etc., which have a steady demand
in the domestic and international markets. Such industries would not only help in
employment and income opportunities to populations residing near fishing harbours, but
could also be the basis for developing a sustainable strategy for alternative nutritious food
choices at competitive prices .
Fishermen Welfare Schemes
11.10 The welfare schemes of the Department are directed towards life insurance, distress
relief, housing facilities, and promotion of marketing facilities in fishing. Started in 2006-07
by the Government of Karnataka, ‘Matsya Ashraya Scheme III phase’ is intended to provide
houses at ` 40,000/- per house to houseless fishermen. By the end of 2009, 4028 houses have
ERC Second Report 83
been constructed and 5000 houses were taken up during 2009-10. The ‘Matsya Mahila
Swavalambane Yojane’ aims to provide a revolving fund (limited to a maximum of
` 20,000 per group of fisherwomen) to form Self Help Groups and provide financial
assistance to the fisherwomen for purchase of fish, ice, insulated boxes, baskets, crates and
mats for drying fish, and under the ‘Matsya vahini’, subsidy is provided for purchase of
three- or four- wheelers for hygienic transport of fish. Loans are also provided to fishermen's
co-operative societies for construction of fish markets.
11.11 Welfare schemes have long term impact and hence periodic evaluation and
monitoring of the welfare schemes is relevant for determining the efficacy and continuity of
the Schemes. There is a need for the Department to assess whether the desired objective of
welfare of the fishermen has been actually achieved. It is also necessary to periodically
assess the facilities developed as part of the marketing schemes. In this regard, the
Commission recommends that the Department set up a monitoring and evaluation team to
periodically pay visits to the facilities created i.e. housing colonies, co-operative societies,
markets etc., to continuously assess and review expenditure towards welfare schemes.

ERC Second Report 84
Chapter 12
Department of Animal Husbandry and Veterinary Sciences
12.1 The Animal Husbandry sector supports non-farm activities relating largely to (a)
Rearing of Cattle, Sheep, Goat and Pigs (b) Dairying and (c) Poultry. Annexure-12a shows
the total livestock and poultry population in the state. Livestock provides stability to family
income especially in arid and semi-arid regions of the State. It also gives an added resource to
farmers whose crop yield is often threatened by vagaries of nature such as drought, famine,
etc. The animal husbandry sector contributes over 3.6% to the GSDP of Karnataka and
20.27% to agricultural sector. For the year 2008-09, Karnataka stands 10th in the country for
milk production(45.38 lakhs tonnes), 6th in egg production(23746 lakhs), 3rd in sheep
population (95.32 lakhs) and wool production (7,131 tonnes),and at 7th position in meat
production (1,14,519 tonnes).1
12.2 Market opportunities have opened up for the livestock sector following economic
liberalization. But the sector’s ability to capitalize on these new developments is constrained
by the absence of good quality animal health and extension services, currently provided
mainly by the government. Moreover, these services are not available at the doorstep of the
producers. There is a need to restructure the service delivery mechanism so as to more
effectively meet the actual needs of the rural livestock producers. The strategy should be to
address and correct existing inadequacies in service quality, and to ensure timely availability
of properly identified inputs and services, including credit, to livestock farmers.2 Annexure-
12b provides details regarding the gap between the demand for livestock products3 and the
per capita availability in Karnataka as on 2008-09. Taking an estimated human population of
690 lakhs by 2020 (Karnataka Vision 2020 document), coupled with a continued
Compounded Annual Rate of Growth (CAGR) for livestock production as seen in the trends
in the last five years, it can be expected that demand could soon exceed supply. Except for
milk, which shows availability close to demand, the CAGR required to meet the expected
demand by 2020 is 19% for meat and 16% for eggs, whereas the actual CAGR for the last
four years (2005-2009) is only 8% for both meat and eggs.
12.3 The Department of Animal Husbandry & Veterinary Services was established as an
independent Department in 1945, in which year it was separated from the Agriculture
Department. It is the nodal agency for administration, development, regulation and
monitoring of animal husbandry and dairying activities in the State. In order to achieve its
1 Integrated sample survey report 2008-09 by Dept of AH&VS (Animal Husbandry and Veterinary Sciences)
2 Eleventh Five Year Plan, Planning Commission, GOI
3 estimated on the basis nutrition sources recommended by Indian Council of Medical Research, ICMR

ERC Second Report 85
mandate for promotion of animal health and welfare, the Department has the following
responsibilities:
• To provide technical services and inputs to farmers to augment livestock
productivity;
• To prevent /contain/control/ eradicate animal diseases;
• To support animal welfare activities.
12.4 Annexure-12c shows expenditure through various schemes for the Department of
Animal Husbandry. It can be seen that the Dairy development subsector has a major share of
59.96 percent (` 301.65 crore) out of the total allocation. The Animal husbandry sub-sector
has 31.36 percent (` 157.79 crore) and capital outlay (` 43.58 crore) has 8.68 percent of
total allocation. Of the Schemes for the Department, the scheme ‘Incentive to milk producers’
has a budget allocation of 200 crore and this forms a major head of expenditure. The other
schemes are for development of poultry farms, control of animal diseases, establishment of
veterinary and Animal science University etc. In other words, the large bulk of plan
expenditure is spent on giving subsidy to milk producers, with a paltry balance spread over
crucial schemes for improving infrastructure and strengthening Animal Husbandry services.
Given that the benefits of the huge ‘Incentive to milk producers’ Scheme essentially reach
urban milk consumers, the Department needs to seriously re-look at its major expenditure
pattern and assess the true impact of its different Dairy schemes on milk production in the
state.
12.5 The distribution of Veterinary Hospitals, Dispensaries, Primary Veterinary Centres,
etc., is uneven. As per the National Commission on Agriculture, 1970 there should be one
Veterinary Institute per 5000 livestock targeted to be achieved by the year 2000. This norm is
not followed uniformly across the districts. While the number of centres is low in districts
like Bellary, Raichur and Belgaum, there is a higher number of centres in districts such as
Kodagu, Mandya, Bangalore, and Ramanagara. Annexure-12d indicates the spread of
Veterinary institutes. There is a clear need to review the requirement of institutes with
respect to not only the existing livestock population but also the expected population as
revealed by the census, supplemented by projections made by the Department. It is also
recommended that the capital expenditure of the Department be apportioned in the light of
the above and in line with the expected growth of the livestock population and income from
livestock production in the districts.
12.6 During the Commission's visits to the districts, it was noticed that some of the existing
Veterinary institutions (e.g. Veterinary Dispensary, Shelwadi village, Dharwad District) do
not have required medical equipment and that the infrastructure facilities were very dismal.
The Department spent large funds on civil works without providing supporting services (e.g.
electricity). Though the other Veterinary Institutions (Veterinary Dispensary, Shimoga

ERC Second Report 86
District and Livestock Research Information Centre, Deoni, Bidar District) visited by the
Commission seemed to be well provisioned, there is a need for the Department to make an
overall review of its capital and manpower expenditure on the Veterinary Centres in the
State.
12.7 There are 6 veterinary colleges conducting degree courses. (Bidar Veterinary Sciences
and Animal Husbandry, BVSc & AH). Approximately 180 to 300 students get enrolled in
these colleges annually. The number of students currently passing out of these colleges is
about 160 per year and 2475 veterinarians will be available by the end of 2020, out of which
it is estimated that 40 percent will take up further studies in P.G. courses, 25 percent will opt
for private sector work and only 35 percent will be available for Government veterinary
services.4 By the end of 2020, the required number of veterinary institutions in the State will
be 6954, with corresponding increase in the numbers of posts for veterinarians. Since around
701 doctors would be retiring by the end of 2020, the total number of vacancies by the end of
2020 will be 1714. As against this, the number of new doctors projected to join the State
sector would be only about 866. As such there will be shortage of veterinarians in the
Department.
Expected number of veterinary doctors available by the end of year 20205
Sl.
No
Veterinary colleges
in the state
Intake of students Veterinarians(with 75%
pass) available
at the end of
the year 2020
1 Veterinary college
Bangalore
60 495
2 Veterinary college
Bidar
60 495
3 Veterinary college
Shimoga
30 in 1st year, increase of 10
students each year for next 3
years
405
4 Veterinary college
Hassan
30 in 1st year, increase of 10
students each year for next 3
years
405
5 Veterinary college
Gadag
30 in 1st year, increase of 10
students each year for next 3
years
360
6 Veterinary college
Athani
30 in 1st year, increase of 10
students each year for next 3
years
315
Total 2475
Source: Department of Animal Husbandry and Veterinary Services, Govt. of Karnataka
4 Report submitted by ISEC on Animal Husbandry and fisheries to ERC
5 ISEC Report, Animal Husbandry

ERC Second Report 87
ISEC Report, Animal Husbandry submitted to the ERC.
To address the problem, there is a need to increase the number of colleges either in
government or private sector with financial assistance and the number of intake into the
existing colleges after obtaining relaxation on class size which has been prescribed by IVC
(Indian Veterinary Council) regulations. Further strengthening of infrastructure in the
existing colleges is also warranted. There is a need to take up skill upgradation of
veterinarians by providing short term P.G. Diplomas to the field staff in field oriented
subjects as well as training in short term courses imparted to the field staff. Also there is a
need to include refresher course-training to be provided once in 2 years regularly to all the
Para-vets in the Department.

ERC Second Report 88
Chapter 13
Department of Co-operation and Agricultural Marketing
13.1 As on March 31, 2010, there are 29,475 co-operative societies functioning in the
State, broadly covering 15 divergent categories. These constitute 86 percent of the total
number of societies registered in the state, the remaining 14 percent being either defunct or
under liquidation. Of the working societies,10,484 are Milk Producers Co-operative Unions
and 4,711 are Primary Agricultural Co-operative Societies (PACs), 31 are Apex institutions
and 21 are District Central Co-operative Banks.
13.2 NABARD has estimated a credit requirement of ` 41,085 crore for the agriculture
sector in 2011-12, for both short- and long term investment. Of this, 18 percent is to be
provided by the District Sector Co-operative banks as against ` 4,994 crore during the year
2009-10. Co-operative banks have a membership of 13 lakh farmers with per capita lending
of ` 28,461 per annum. Presently, membership in the credit societies is limited to land
holding persons. Those who do not hold land are thus denied the opportunity of benefiting
from the programs of the primary co-operative credit societies. Enrolment norms need,
therefore, to be made more inclusive so as to admit rural land-less people, and extend
agriculture credit to more non-farm activities. Such expanded membership would also
facilitate wider flow of benefits from the popular health insurance scheme, Yeshaswini, to
cover these landless rural poor as well.
Organisational structure, Adequacy of Staff and urgency for recruitment
13.3 The Department is administered through a five tier structure. At the State level, the
Registrar of Co-operative Societies is the Head of the Department. Below him, each of the
four regions viz. Bangalore, Mysore, Belgaum and Gulbarga is headed by a Joint Registrar.
Below the Joint Registrar are Deputy Registrar (District level), Assistant Registrar (Sub
Divisional level) and Co-operative Development Officer (CDO) at Taluk level. This
prevailing organisational arrangement from the State downward to the District and Taluka
levels is basically satisfactory, but the non filling of many vacant posts is adversely affecting
the functioning of the Department. As of March 31, 2010, Nine Hundred and Forty Four of
the 2,765 sanctioned posts are vacant, mainly because there has been no recruitment of either
officers or junior level staff during the last twenty years. Since many of the existing officers
will retire in next two years, it is essential that recruitment be made against at least the
most critical of those positions such as Co-operative Development officers, Deputy and

ERC Second Report 89
Assistant Registrars, and Inspectors. Without this, the work of the Department will be
seriously affected, including the crucial task of effective loan recovery.
Subsidy intensive Schemes and sun-set clause.
13.4 In the year 2010-11, the Department has an allocation of ` 302.71 crore, to provide
for 36 major schemes, 22 of which are of the State sector, 12 of the District sector and 2 are
centrally sponsored. Of the 22 State sector schemes, only five of the schemes have budget
allocation above ` 10 crore (each). The allocation for the remaining 17 is less than one crore
(each) and the rest of the Schemes have allocations ranging between rupees one crore to
rupees ten crores (each). The five schemes with the highest budget outlay are (i) Interest
subsidy on crop loans (ii) loan waiver subsidies, (iii) financial assistance to DCC Banks (iv)
Yeshaswini Farmers Co-operative Health Schemes and (v) Subsidy to Karnataka State Co-
operative Marketing Federation Ltd.,
13.5 Interest subsidy under various schemes accounted for 36 percent of the total Plan
outlay in 2009-10. The subsidy given to the farmers still results in non repayment of the loans
by the farmers and often leads to the banks seeking for waivers towards the loans disbursed.
At times of severe crop loss due to drought, pest or flood, Government generally responds
with adhoc waiver of co-operative loans. Given the fact that the farmer is ill placed to repay
the loans due to the inherent dependency on natural factors like rain, crop losses etc., and
such risks ought to be effectively covered by insurance schemes implemented through co-
operative societies. In this regard, Government needs to devise ways to progressively step
back from interest subsidy on crop loans and introduce insurance oriented schemes with a
sun-set clause wherein the insurance scheme could be supported by the government in the
initial years with a time-horizon to ensure self sufficiency of the scheme in the future.
Modernising the Co-operatives, and Capacity building
13.6 The level of application of Information and Communication Technology (ICT) in the
operations of Co-operatives is found to be very low. Modernising the Co-operatives’
organisational management through the use of ICT could be an effective method of
bringing about financial inclusion and expansion of business volume. It would be
necessary to design an effective line of command and appropriate delegation of powers to
suit the modernised organisational structure and use of ICT. Provision should be made for
intensive training of the officials and members in the use of ICT. The existing master
trainers who were trained at the Bankers Institute of Rural Management, Lucknow need to
design and carry out focused and effective training programs in Common Accounting
Systems and MIS relating to Co-operative organisations.

ERC Second Report 90
13.7 The Department is moving forward with the implementation of the Vaidyanathan
Committee's Recommendations, which focus on revival of PACs and select DCCBs1. It is
observed that most of the co-operative societies do not provide diversified services/products
and are unable to effect recovery of loans. Presently PACs often do not have Business
Development Plans (BDP). Though the revival package is a welcome initiative, the absence
of BDP's is likely to derail the PACs financial position sooner than later and again push the
societies into a vicious cycle. Therefore, assistance for implementation of BDPs has to
receive focus in the revival package. The Business development plans need to suggest
diversification of their lending activities beyond crop loans and into other activities such as
fishery, poultry, mushroom cultivation, etc., which could give high marketable surplus to
members.
Ambiguity in the objective of the design of Minor Schemes2.
13.8 The minor schemes implemented by the Department suffer from design flaws and
absence of proper guidelines. These schemes are generally implemented at the district level.
There are 12 district sector schemes with 2 percent of the total allocation, and these have
narrow and ambiguous objectives that give scope for a high degree of subjectivity in the
selection of beneficiaries. It was also pointed out by several field level officers that some
schemes are imposed on the societies by the Department, without drawing up either
implementation strategies or guidelines. Loans to Karnataka Co-operative Marketing
Federation, Shimoga and Loans to Coorg Orange Growers Co-operative Society were cited in
this context. Hence, while planning such local specific /targeted schemes, the design inputs
and implementation feasibility report need to be obtained at the field level itself.
Yeshaswini – Farmers Co-operative Health Scheme.
13.9 Yeshaswini is found to be the best example of Public Private Partnership in delivery
of service to poor families who are members of co-operative societies. The enrolment of
beneficiaries, collection of premium, empanelment of service providers, standardising of
procedures, administration of claims and quality control are done by a professional Trust
which is free of bureaucratic interference. The number of members enrolled into the scheme
was 16.01 lakhs in 2003-04 and has increased to 30.33 lakh in 2009-10, while the premium
amount had gone up from ` 60 lakhs to ` 150 lakhs during the same period. Similarly, during
the same period, the members contribution has increased from ` 9.76 crore to ` 41.64 crore
while that of government has gone up from ` 4.50 crore to 30 crore. The increasing
1 KCC Bank Dharwad and DCCB Kolar.
2 There are 31 minor schemes. For e.g. Interest subvention for loans to SHGs, Loans to KSC Areca nut Marketing Federation, Loans for
purchase of debentures KASCARD Bank, Enrolment of SCs/ST persons into Co-operatives, Enrolment BC/Minority People into Co-
operatives, Loan assistance under NCDC sponsored ICDP Project, Share Capital Assistance under NCDC assisted ICP Project , Loan for
construction of business premises for women co-operative societies.

ERC Second Report 91
government support points to the criticality of continued support to such schemes. In some
instances the co-operatives have paid part of the premium (ranging from ` 40 to ` 50),
payable by members as hospitalisation, due to ignorance of benefits covered. Such instances
indicate some areas of vulnerability in the success of the scheme. Considering the divergence
in costs, benefits and administrative procedures in various health insurance schemes being
implemented / sponsored by the Government, there is a need for convergence of all the health
insurance schemes. A separate exercise for this purpose is underway which is being co-
ordinated by the Planning Department. This is dealt with in the chapter relating to the health
department.
Department of Agricultural Marketing.
13.10 Government of Karnataka was an early state to bring amendments in Karnataka
Agricultural Produce Marketing (Regulation and Development) Act, 1966 to provide better
regulation for buying and selling of agricultural produce and facilitate better development of
market infrastructure in the state. The Department of Agricultural Marketing, Government of
Karnataka plays an important role in developing and strengthening agricultural markets and
infrastructural facilities. There are 146 Agricultural Produce Marketing Committees
(APMCs) functioning in the state. These APMCs have established 146 main market yards
and 352 sub market yards across different parts of the state.
13.11 The Karnataka Agriculture Produce Marketing (Regulation and Development) Act
requires the market committees to implement the provisions of the Act, provide facilities for
transport and marketing of agricultural produce as the State government may from time to
time direct; and collect, maintain and disseminate information in respect of production, sale,
storage, processing, prices and movement of notified agricultural produce. (extracts from the
APMC Act and the Model Act of the Government of India 2003, regarding the powers and
duties of the Market Committees are at Annexure-13b). To take forward the mandate given to
this committee, there is need to establish an institutional mechanism for price signalling
and price forecasting by drawing from the future price trends particularly in commodities
where there is forward trading through (National Commodities and Derivatives Exchange)
NCDEX. Part of the ‘Revolving Fund’ can be utilised for evolving such mechanism
through research by leading institutes in Karnataka viz. IIM, ISEC etc. This mechanism
will help the government to capture early warning signals about distress sales and identify
the commodities to be notified for Minimum Floor Price (MFP) intervention from time to
time.
13.12 Lack of adequate production and inefficient marketing of horticultural products is
likely to lead to high food inflation. Higher efficiencies in transportation and marketing are
hence mandatory to ease the demand-supply gap at the consumer end. In this regard, the

ERC Second Report 92
marketing of Horticultural produces through private participation are welcome changes. Such
changes, however, should facilitate higher participation of retail food chains to procure
horticultural produce at locations close to the place of production and help the farmer in
efficient disposal of horticultural produce. Karnataka has been very active towards
encouraging private participation in horticultural marketing as seen from The Karnataka
Agricultural Produce Marketing (Regulation and Development) Rules, 1968. The Department
grants Direct Purchase Licences to Private purchasers in lieu of processing of horticultural
produces and encourages setting up of Direct Purchase Centres and farmer-consumer
markets. However, there is a need for the Agricultural Marketing Department to ensure
stringent compliance to the rules of the licence and the purchase agreements between the
farmer and the private purchaser.
13.13 Annexure-13a, Table 1 and Table 2 provide details of the schemes implemented by
the Department of Agricultural Marketing for 2009-10. For the year 2009-10, for seven
schemes (Annexure-13a , Table 2) of the total budget outlay of ` 222.93 crores, ` 12.50
crores was towards State Sector Schemes while ` 210.43 crores of the budget outlay was for
Centrally Sponsored Schemes. None of these schemes appear to serve the interests of the
farmer in any effective way. The overarching objective of reducing the role of the
intermediaries and making the farm output available to the retail stores in time and at
competitive prices linkage is missing in the schemes. The Department has to redefine its
role in support of creating enabling environment for enhancing efficiency of retail markets
particularly in urban areas. Critical areas of intervention are grading norms,
standardization of hygiene and waste handling at retail markets.
13.14 The Department has 3245 sanctioned posts of which Group ‘C’ and ‘D’ constitute
2986 posts. At present, 35% of group C and D posts are vacant. In the course of
modernization of markets through electronic tendering and other internet enabled services,
the need for group ‘C’ and ‘D’ staff would come down. The vacant positions could be
converted into technical posts for the technical administration required to be provided by
market committee including price forecasting and price dissemination activities, and
abilities to enforce quality of contract management with outsourced agencies.

ERC Second Report 93
Chapter 14
Social Welfare Department
14.1 The following field Departments come under the administrative control of Social
Welfare Department in the secretariat.
I. Directorate of Social Welfare (dealing with welfare of
the Scheduled Castes people of the State)
II. Backward Classes Welfare and
III. Scheduled Tribes Welfare
14.2 Apart from the implementation of the comprehensive and integrated development
plan for the scheduled castes (special component plan) and Scheduled Tribes (Tribal Sub-
Plan), the Department aims to achieve its mandates through several welfare
schemes/programmes which primarily include construction and maintenance of new schools
and hostels, providing scholarships to deserving students, providing vocational and
occupational training to the educated youths and women welfare centres (Annexure-14b
details of Schools, Hostels and number of students benefited by the Department).
14.3 As regards organisation structure of the Directorate of Social Welfare (for Scheduled
Castes Welfare) there are District Social Welfare Officer and Taluka Social Welfare Officer
at District and Taluka level respectively. For Backward Classes there is an extension
officer/inspector at taluka level, in the Taluk Panchayat office. At the district level Backward
Classes and Minorities Welfare Departments have a combined Office and the officer is called
District Officer for Backward Classes and Minorities. Karnataka Minorities Development
Corporation and Backward Classes Development Corporation have common office at the
District level. In 7 districts where the minorities population is more than 16%, the head of the
Office for that district is from the Minorities Development Corporation and in remaining
Districts, the Backward Classes Development Officer is in charge. Scheduled Tribes Welfare
Department though separated and headed by a Directorate, does not have offices in many of
the districts and any of the Talukas, though recently, the Finance Department has sanctioned
independent officer for Tribal Welfare for certain districts and 14 posts have been sanctioned.
14.4 The Department of Social Welfare has 15% vacancies in Group A and Group B. The
Backward Classes Department has an overall vacancy of 43% with 13% vacancy in Group A
and 100% vacancy in group B. Similarly the Department of Scheduled Tribes Welfare has a
vacancy of 59% with 20% vacancy in Group A and 100% vacancy in Group B (Annexure-
14a). After Technical Education (vacancy 70%), the Department of social welfare (vacancy
52%) has the second highest vacancy among the state Departments. Also notable is the fact

ERC Second Report 94
that after Medical education (vacancy 17%) and Department of Education (16%), the
Department of social welfare contributes 10% to the overall state vacancy (21%) (Annexure-
14e: Employee Strength, State Sector and District Sector, Plan & Non-Plan in the state).
14.5 Annexure-14c shows statistics for literacy levels among the scheduled castes as
compared to the general population in Karnataka. Though there has been improvement in the
decadal (between 1991 and 2001) literacy levels in the scheduled castes (from 38.10% to
52.87%), the literacy levels among the scheduled caste population in the state is far below
literacy levels among the general population (66.64%) in the state. Also notable is the fact
that literacy levels among the scheduled caste females are far low (41.72%) as compared to
the general female population (56.87%) and the scheduled caste males (63.75%). Further the
urban scheduled caste population is faring better with 69.27% literacy levels. On the other
hand, the literacy levels among Scheduled Tribes had improved from 36.0 to 48.3 from 1991
to 2001. Literacy levels among the scheduled Tribe females were lower (36.6%) as compared
to the general female population (56.87%) and the scheduled Tribe males (59.7%). Further
the urban scheduled Tribe population is faring better with 64.6 as against rural literacy level
of 45.3 among the Scheduled Tribes population.
14.6 The Commission has noted that the Departmental initiatives towards establishment
of residential schools (for the Scheduled Castes, Scheduled Tribes and Backward Classes
students) have helped to improve access to better schooling for the deserving Scheduled
Castes, Scheduled Tribes and Backward Classes students in the state (Annexure-14c, Table
2). With an increase in number of schools by 5%, the number of students appearing and
passing the SSLC examinations have increased by 14%. Also notable is that the percentage
of students scoring 85% and above in the examinations have increased from 3% to 7%.
Scholarship Schemes
14.7 The Department has provided scholarships to approximately 19.4 lakh SC and ST
students studying in various classes from primary to professional courses during the year
2008-09. The total amount of the scholarship schemes is ` 197 crores giving an average of
` 1015 per student. The scholarships1 range from ` 75 per child per month at primary class to
`1000 per month for professional courses.
1 These do not include scholarships for studies abroad (upto a one time assistance of maximum of ` 10 lakhs
per student) and for which ` 50 lakh is provided in the department’s budget 2008-09. 345 students have been covered under this scheme in 2008-09.

ERC Second Report 95
14.8 Similarly, annual increase in the allocation to meet the scholarship amount is not
commensurate with the demand for scholarship as reflected in the number of applications.
For instance, in the year 2008-09 for the budget link code 2225-03-277-2-52, allocation has
increased by 5% while the numbers of applications have increased by 16% indicating that no
objective assessment of the demand for scholarship is made. As a result, many deserving
students do not receive the scholarship amount even till the end of the academic year.
Scholarships disbursed at the fag end of the year or after the academic year defeat the purpose
of the schemes. The delay in release and the delay in settlement has a potential to create
unavoidable confusion in administration of scholarships. It is possible that many of the
students are unaware of belated release and therefore deprive themselves of the scholarship.
The unintended consequence of this delay is possible misuse, fraud, misappropriation, etc.
14.9 For improved efficiency in disbursement of scholarships, it is recommended to
consolidate all schemes relating to scholarships/benefits and entrust the same to a separate
well networked financial institution. Such an institution should be able to disburse
scholarships to students on time through an electronic mode at regular intervals at
predetermined instalments for each student. In case release of funds from Government of
India is delayed; the institution may charge marginal financing charges or interest for
advancing these scholarships. This would require approval of scholarships at one go at the
beginning of the academic year itself so that the financial institution can make its cash
flow arrangements accordingly. Until that time, an exclusive designated team of officials
should be entrusted the task of disbursal after obtaining approvals/release orders from the
concerned division within the Department at regular intervals. Such designated team can
directly report to the Commissioner. In this regard, the Department needs to prepare a
migration path from switching conventional mode of administrating all scholarships to the
new system of disbursal indicating a time line not spreading more than two academic
years.
Construction of Hostels
14.10 The Department provides hostel facilities to about 3 lakhs SC, ST and BC students
with an average expenditure of ` 7,500 per annum. These students are served through more
than 3,800 hostels and 400 residential/ashram schools. However, about 2,555 are housed in
owned buildings while 1,326 are housed in rented buildings (Annexure-14b). Some of the
post-matric hostels including government hostels, particularly in rented buildings were
suffering from the problems associated with high density such as shortage of water,
insufficient provision of rooms, cots etc. Therefore, there is a need to construct adequate
number of hostels as early as possible. However, there is delay in construction despite

ERC Second Report 96
sanctions. For instance, out of 330 approved constructions, work started only in 59 hostels
due to delay in release of funds.
14.11 It is recommended that starting of hostels in unsuitable private buildings be
discouraged. The construction and progress of hostel buildings should be monitored by a
dedicated team of Departmental officials with sufficient skills in engineering and agencies
like PWD, Nirmithi Kendra, Zilla Panchayat Engineering, Karnataka Rural Infrastructure
Development Limited (Formerly KLAC) should be made accountable for timely
completion of the construction works.
Maintenance of Residential Schools
14.12 Karnataka Residential Educational Institutions Society (KREIS) is established as a
registered body under the Department of Social Welfare. KREIS functions as a nodal agency
and maintenance of the school buildings is under the control of the ZPs. The organisation has
a staff position of 35 of which 22 posts are of group ‘C’ and ‘D’. The society does not have
District level or Taluk level officers. There is a need to strengthen the organisation structure
as the number of hostels and residential schools are increasing. Details of number of
Institutions and sanctioned strength is provided in Annexure-14d. Presently, multiple controls
of these hostels and residential schools are often leading to inefficient management and
supervision in control of buildings. It is advisable to club all 39 schemes under the
maintenance of hostel/buildings, constituting revenue expenditure, into a single scheme.
The Department should clearly define the role and functions of KREIS in construction,
maintenance and running the day to day operations of the residential schools for
SC/ST/BC and what would be their relationship with regards to Zilla panchayats and
the Directorate.
14.13 There is a Scheme for special central assistance to Scheduled Castes and Scheduled
Tribes for which funds are provided by Government of India. These schemes for the last three
years have savings. The schemes are meant for income generation activities and
infrastructure development for Scheduled Tribes. Considering that every year there are
savings, there is a need to evaluate the schemes to find out if the savings are due to
procedural constraints or lack of demand for the scheme.
14.14 Under the scheme ‘Purchase of land to landless farmers’, government buys upto 2
acres of dry land or one acre of wet land to be given to land less farmers belonging to
Scheduled Castes. These activities are administered by BRADC (B.R.Ambedkar
Development Corporation). Land is registered under the name of the house wife. 50% of the

ERC Second Report 97
cost is given as subsidy and the balance is to be repaid within 10 years. For the year 2009-10,
an amount of 12 cores has been allocated to benefit 2,400 landless families. However, the
actual farming status of this land is not clear. A monitoring mechanism has to be put in
place to ensure that the land so purchased and given to the farmers is utilised for the
purpose for which it is given.

ERC Second Report 98
Chapter 15
Department of Minorities Welfare
15.1 The Department of Minorities Welfare is relatively a new Department aimed at the
welfare of the people belonging to Muslim, Christian, Jain, Buddhist, Sikh and Parsi
Communities. The minorities constitute 15.69 percent of the population of the State (2001
Census), of which Muslims constitute 12.23 percent. The activities of the Department have
focus on;
(i) improving literacy by providing scholarships, hostel facilities and
residential schools,
(ii) improving business and occupations, trade,
(iii) increasing employability & economic self sufficiency of the youth
through training,
(iv) subsidising farmers of BPL families by giving assistance to dig bore
wells under Ganga Kalyana Yojane and under land purchase
schemes,
(v) providing long terms loans to professional studies and higher
education, petty trade at concessional rates of interest and
(vi) encouraging cultural activities and safeguarding the cultural rights
of minorities.
15.2 Total budget allocation for the Department in state sector, district and central plan
schemes during the last three years is as under:
(` in lakh)
Year
State Provision Central
Plan
Total
Total
Expenditur
e Plan Non-Plan
2007-08 5877.47 12.64 5890.11 5214.64
2008-09 9012.03 12.64 291.06 9315.73 5283.95
2009-10 15412.77 1693.02 1061.00 18166.79 9228.28 (up
to Jan 2010)
15.3 The Department has no field officers of its own. Most of the work is carried out by a
Directorate and four Corporations viz., Karnataka Minorities Development Corporation
(KMDC), Karnataka State Minorities Commission (KSMC), Karnataka State Board of Wakfs
(KSBW) for administration of Wakf properties, and Karnataka State Hajj Committee (KSHC)
for facilitating Hajj pilgrimage by Muslims.

ERC Second Report 99
The Scheme specific issues and Recommendations are as follows:
15.4 Financial assistance to students. There are six schemes to achieve this objective. Most
often there is a delay in disbursement due to under provisioning of funds towards state
contribution, or delayed submission of documents to Central Government. The key problems
identified are as follows:
(a) processing of the applications in time
(b) making adequate provision in the budget and
(c) timely release of state share in central schemes.
The Department of Minorities Welfare should consider switching over to electronic mode
of disbursal, and computerised processing of applications which can address most of the
problems for Financial Assistance to Students.
15.5 Pre-Matric Scholarship: Students are paid a scholarship at the rate of ` 100 per month
for 10 months in a year. Besides the scholarship, students’ tuition fees, boarding charges are
also reimbursed at the rates approved by government. This is a Central Plan Scheme with
75% support from Centre and 25% from the State Government. In the year 2008-09, out of
2,16,249 applications received; 21,018 applications were considered for sanction of
scholarships there by satisfying demand of 9.72 percent of the applicants. In the following
year i.e., 2009-10 the satisfaction level had gone up to 69.18 percent, although applications
have come down to 1,25,511. However, disbursements were not made even in the month of
January 2010. The monthly scholarship, if not given on time would not serve the purpose,
and expose the students to hardships.
15.6 Post-Matric Scholarship Scheme and Merit cum means Scholarship: Under Post-
Matric Scholarship Scheme, students after SSLC/10th
standard or equivalent are provided
scholarships for pursuing higher studies in PUC, Degree, Post Graduation and Doctoral
Courses. For the year 2008-09 an amount of ` 19.60 crores was provided benefiting 7,232
students. Also under Merit-cum-means Scholarship Scheme, scholarship is given to students
who have obtained admission into a competition based course and whose parental income is
not more than ` 2.5 lakhs per annum. An amount of ` 25,000 is given to day-scholars and
` 30,000 is given to those who are in hostels. The amount has to be disbursed twice a year.
The Schemes are central Sector Schemes and the coverage is often limited by the funds given
by GoI. Due to the delay in funds released from the centre, often the scholarships are
disbursed at the end of the year.
15.7 Incentives /Stipend to students: There are three budget lines (Schemes) in this
category under State Sector Plan Schemes;

ERC Second Report 100
a) the students studying for PUC, Graduate and Post-Graduate courses are given
an amount of ` 3000, ` 4000 and ` 5000 respectively every year.
b) the students pursuing ITI and Diploma are eligible for ` 150 per month and
c) the students who are practicing Law are given ` 1000 p.m for four years
during their juniorship. During the last three years, the achievement is in the
range of 75% to 91%, mainly due to lack of demand.
The three budget lines/Schemes can be merged into one scheme, with safeguards that each
stream of students are covered as per the target set at the beginning of the year.
15.8 Arivu (Educational loan): This Scheme is administered by KMDC. Students
pursuing professional or technical courses are given a loan of ` 75,000 per year till
completion of the course. Every year the number of students covered are more than the
annual target. For instance a total number of 5,712 and 9,721 students were given loans
during the years 2007-08 and 2008-09 respectively, as against a target of 4000 (2007-08) and
5600 (2008-09). As the scheme seems to be popular the Commission recommends that
there is a need to establish an efficient tracking mechanism for ensuring effective recovery.
Construction and Maintenance of Hostels.
15.9 Excess Capacity Creation of Hostels: Students are admitted into the hostels on the
basis of merit. There are 123 hostels, of which 113 are functioning in rented premises, mostly
without adequate facilities. Seventy four of 123 are girl’s hostels. The number of hostels
sanctioned have increased from 73 to 98 from 2007-08 to 2008-09 and to 123 in 2009-10.
Correspondingly, the sanctioned capacity during the respective years has also gone up from
3,650 to 4,900 and to 6,325 students. However, the admissions during respective years was
found to be 2,566, 3,101 and 4,720. This indicates (a) lack of correct assessment of demand,
(b) adhoc approach to project appraisal (c) improper mapping and planning required to
determine location of hostels resulting in excess capacity/ underutilisation which increases
unit cost of operations. Therefore, the Commission recommends that reliable demand
assessment and, based upon that, proper mapping to locate the hostels has to be
undertaken before opening the hostels. The entry bar for admission also needs to be
revised downwards to attract more number of students to avail the hostel facility without
over crowding. Wherever there is underutilisation, the excess capacity should be utilised for
the students belonging to other communities viz., backward classes and SCs/STs.
Inadequate Facilities in the government owned buildings:
15.10 During the year 2009-10, sanctioned number of works for hostel building are 48 while
14 hostels were under construction. Construction of the hostels is entrusted to Karnataka

ERC Second Report 101
Residential Education Institutions Society (KREIS) which executes the work through various
agencies. In the hostels functioning in the government owned buildings, it was found that
the students do not have furniture like study-tables, beds and proper book-shelves, as the
building estimate had included only civil works and no separate provision was made for
furniture. Hence, it is recommended that every hostel construction has to be seen as a
project inclusive of civil works, furniture and electrical equipment, along with facilities for
bicycle stands, sports activities, etc.
15.11 Professional management of Hostels. Only 23 of 123 hostels are maintained by Zilla
Panchayats. Hostel management is a skilled job but it is outsourced to locally available
agencies / individuals who may not have the background and skill necessary for this work.
Therefore, while financing for maintenance of these hostels be routed through Zilla
Panchayats, the Commission recommends that the task of maintenance of all hostels be
entrusted to a Special Purpose Vehicle (i) to optimise administrative costs, (ii) to enhance
accountability and (iii) to provide uniform and standard professional services to students
in all hostels, including the residential schools established by Social Welfare Department,
Minorities Welfare Department, Education Department or any other Department.
15.12 Morarji Desai Residential Schools (MDRS) for students of Minority
communities. There are 43 MDRS under District sector and 6 new MDRS under state sector.
There are two schemes relating to MDRS. One is ‘HUDCO Loan repayment’ and the other is
‘Improvement to Infrastructure’. Both are executed through Karnataka Residential Education
Institutions Society (KREIS). The study team engaged by the ERC observed that during the
last three years the Directorate released money to KREIS and has shown it as expenditure.
However, the research team could not find the details of ‘repayment to HUDCO’ and the
‘work programme for improvement of infrastructure’ by KREIS. It is recommended that the
Minorities Welfare Department should put in place an effective system of internal audit,
timely inspection and reporting the action taken on the inspection reports.
15.13 Training to Unemployed: There are two schemes viz., Skill Development
Programme (Koushalya) & Occupational Training. The key objective of both the schemes is
to provide skill training leading to economic empowerment of youth of minority
communities.
Skill Development Programme provides for training in Computer, Industrial Trades, Fashion
Technology, Plastic Industries, etc. The occupational training is in trades like Electrical,
Refrigeration Mechanics, Civil Works. For occupational training a stipend of ` 500 per
month is paid during the period of training, including training fee to the organizers by ZPs.
During the last three years about 17,000 young persons received benefit under Koushalya and
about 1000 young person received benefit under Occupational training.

ERC Second Report 102
The Commission recommends that (i) both the schemes could be merged as they have
common objectives (ii) the scheme be implemented in consultation with Karnataka
Vocational Training and Skill Development Corporation (under the Department of
Employment and Training).
15.14 Loans and Subsidies Schemes to Minority Communities. The Department
administers two Loan and subsidy Schemes to minorities through KMDC viz., Shrama shakti,
and Micro-credit to minorities through SHGs. Each of the above two schemes are subdivided
into (a) Loan disbursement and (b) Part of the loan amount treated as subsidy. The Loan and
subsidy element of the Schemes are financed through four budget heads.
Under Shrama Shakti Scheme, the minority artisans are trained to upgrade their artistic
and technical skill and also a loan of ` 25000 (maximum) is provided at low rate of interest
to improve their business. During the past three years about 15,000 beneficiaries have availed
loan and the recovery rate is 54%.
Under Micro credit to minorities through Self Help Groups, KMDC provides loan
upto ` 10,000 with 5% interest to petty businessmen under BPL families to meet their
working capital requirement. Also, loans are advanced up to ` 25,000 to NGOs or registered
societies identified as SHGs who in turn advance loans to their members.
The Key value addition by the NGOs or Registered Societies engaged in SHG activities is in
loan processing, monitoring and recovery of loan. The Commission emphasizes the need to
orient NGOs and other Institutions about the spirit of Self Help Groups and ensure that
the Self Help Groups do not function merely as channelizing agency to individuals for
distributing Government money, but also act as genuine Self Help Groups in letter and
spirit. The Commission recommends that micro credit through SHGs/ co-operative
societies be expanded to gradually phase out direct lending to individuals.

ERC Second Report 103
15.15 The following Schemes are suggested for merger due to common objective of the
schemes.
Name of the Scheme Budget head Recommendation
1 Incentives to minority students 2225-03-277-26
Merge 2 Stipend to minority students 2225-03-102-03-01
3 Stipend to Law graduates 2225-03-102-02-01
4 Skill Development Programme
(Koushalya)
2225-03-102-3-5
Merge
5 Occupational Training 2225-03-102-3-05
6 Micro Credit to Minorities
through SHGs
2225-03-190-0-05
Merge
7 Micro Credit to Minorities
through SHGs
4225-03-190-0-02
15.16 Presently, the staff are drawn on outsourcing basis, as the Department does not have
its own organisational structure. Officers are drawn on deputation from other Departments. In
the absence of staff quality in designing the projects, execution and monitoring are
compromised. Hence, the Commission while suggesting to the Department to create a lean
and effective organisational structure to implement schemes and programmes for minority
communities, also recommends that before creating a new Department the government
should assess its organisational requirements and take appropriate measures in this behalf.

ERC Second Report 104
Chapter 16
Department of Women and Child Development
16.1 The Directorate of Women and Child Welfare was created in 1975 under the
administrative control of the Secretariat Social Welfare Department. At the outset, it
incorporated existing programmes of correctional administration and disabled welfare, and
gradually added on various programs for women and children. In 1994, a separate Secretariat
Department for Women and Child Development (WCD) was created, and this Department is
now responsible for formulating and implementing policies and programmes aimed at the
welfare and development of women, children, senior citizens, disabled persons, and persons
covered under social defence measures.
16.2 The objectives of the various activities of the Department are shaped to a good extent
by the National Policy for Empowerment of Women, 2001 and by the various welfare
legislations enacted by the Central and State Government for the protection and welfare of
women, children and the disabled. In the case of women, the Department pursues the goal of
advancement, development and empowerment of women in all spheres of life, taking up pro-
active measures to create greater responsiveness and sensitivity to women's issues in the
judicial and legal systems, and mainstreaming the gender perspective in the development
process. The policies of the Department are also in keeping with the UN General Assembly
Resolution of May 2002 and the Millennium Development Goals (MDGs), with measurable
outcomes in the areas of promoting gender equality and empowerment, improving maternal
health, and reducing child mortality. Although the nature of the Department‟s activities are
such that they should, in the normal course, contribute to national goals as well as global
commitments, there is no mechanism to measure the outcome of the activities in the
Department. Further, the objectives of some of the schemes being implemented by WCD
overlap with similar programmes in the Department of Health and Family Welfare, and there
is no material to show that there is any co-ordination mechanism for policy design and
operations planning between the Departments.

ERC Second Report 105
16.3 The Annual Reports of the Department, apart from listing out the allocations made for
various schemes, do not reveal the objectives and the outcome of the Departmental activities
under the various statues. There is also no structured MIS in place to monitor the progress of
schemes relevant to these legislations. The Department should therefore redesign its Annual
Report to reflect the use of funds and achievements in relation to its functions in a more
coherent manner. This would lead to better disclosure of the levels and standards of
performance every year, and help in assessing the actual trends in progress towards the goals
set for various schemes. Although a good number of studies have been conducted by a
number of organisations including the Institute for Social and Economic Change, Price-
Waterhouse Coopers and the Directorate of Economics and Statistics, on schemes such as
Stree Shakti, Udyogini, ICDS etc., there is no evidence of the Department having acted on
the findings/suggestions in these evaluation reports. The Commission therefore recommends
that the WCD redesign its Annual Report so as to specifically include information
regarding the action taken on the evaluation reports /studies that it commissions every
year.
16.4 The following field Departments and Organizations function under the Secretariat
Department of Women and Child Welfare, and are entrusted with the responsibility of
pursuing the various objectives that fall within the mandate of the Department:
a) Department of Women and Child Development.
b) Department of Welfare of Disabled and Senior Citizens.
c) Karnataka State Women‟s Development Corporation.
d) Karnataka‟s State Women‟s Commission.
e) Bal Bhavan.
f) Karnataka‟s State Social Welfare Board.
g) Commissionerate for Persons with disabilities and Senior Citizens.
h) Karnataka Balavikas Academy.
i) Karnataka State Commission for Protection of Child Rights.

ERC Second Report 106
16.5 The Programmes of Department of Women and Child Development are broadly
categorized as (i) programmes for Women‟s development (ii) Child development
programmes (iii) Social defence programmes (Correctional Administration). The Schemes
under each category are as follows:
Women’s Development:
a) Stree Shakti (Self Help Groups)
b) Santhwana
c) Karnataka Mahila Abhivrudhi Yojane
d) Working Women‟s Hostels
e) Financial Assistance to Women Law Graduates
f) International Women‟s Day and Kittur Rani Chennamma Awards
g) Protection of Women under Domestic Violence Act, 2005
h) Legal Literacy
i) Financial Assistance for the Remarriage of Destitute Widows and Marriages of
Devadasis
j) Scheme for Prevention of Alcoholism and substance (Drugs) Abuse
k) Swadhar
Child Development:
a) Integrated Child Development Services
b) Nutrition Programme for Adolescent Girls
c) Kishori Shakti Yojana
d) Medical Expenses for Severely malnourished Children
e) Bhagyalakshmi Scheme
f) Hostel for Girls students
g) Welfare of Children in need of care and protection
h) Attendance Scholarships for girls from rural areas
i) Crèches for Children of Working Mothers
j) Hoyasala and Kelladi Chennamma Bravery Awards at District level and other
national awards

ERC Second Report 107
Social Defence Programmes:
a) Programmes associated with Juvenile Justice Act 2000 viz., Observation Homes,
Setting up Special Juvenile police Units, Children‟s homes, Fit homes, Training of
functionaries of under JJ Act.
b) Programmes associated with Probation of Offenders Act, 1956 viz., establishment
of Child welfare Committees and Juvenile justice Boards.
c) Programmes associated with Immoral Traffic (Prevention Act) viz., establishing
reception centres and state homes for women.
d) Adoption Co-ordination Agency and Shishu Grihas for in-country adoption.
e) Sponsorship programmes for placing Children in families
f) State Child Protection Units.
Three of the major Schemes of the Department are Bhagyalakshmi, ICDS (Integrated Child
Development Service) and Stree Shakti.
16.6 In 2009-10, the Women and Child Department has a total budget allocation of
` 1652.81 crore. (` 1293.16 crore Plan and ` 359.65 crore non-Plan). Of the Plan budget, the
central share was ` 316.95 crore while that of State was ` 919.81 crore. Two major Plan
programmes are Bhagyalakshmi with an outlay of ` 354.64 crore and Integrated Child
Development Service with an outlay of ` 334.08 crore. (Annexure-16a). The Stree Shakti
Scheme (Self Help Group) has a high exposure to banks through their borrowings.
16.7 A large number of the remaining schemes have allocations of less than one crore
each, and these could be appropriately merged or re-grouped in keeping with the objectives
of the schemes. In its first Report the Commission had recommended for closure / merger of
schemes that have an allocation below ` 1 crore. Therefore, while merging/closing the
schemes, as indicated in the Budget circular 2011-12, the Department should carefully
assess the potential for optimally re-deploying the staff/officers to handle the merged
schemes, and also create a job chart for each functionary. The job charts should specify
the nature and extent of individual responsibilities, particularly specifying their role and
responsibilities with regard to the various legislations that the Department is required to
implement, monitor and enforce.

ERC Second Report 108
16.8 Beginning from 2006-7, the State government has been presenting a Gender Budget
document to the Legislature giving details of Schemes that have 100 percent benefit for
women, and also those which have at least 33% benefit for women. These are spread across
39 Departments, and are categorized as A and B respectively. In 2009-10, forty seven
schemes were accounted for under Category A and 742 Schemes under Category B, with an
allocation of about 46 percent of Plan funds and 32 percent non-Plan Funds. However, the
process of gender budgeting is yet to be upgraded from the documentation stage to gender
responsive budgeting. There is also a need to evaluate the impact of the process of Gender
budgeting, as initiated in the State, on budgeting and women‟s empowerment. Although the
WCD is expected to evaluate Gender Budget initiatives, and take forward the concept of
gender budgeting to Line Departments, no such exercise has been undertaken so far. The
Commission recommends that Finance Department and the WCD jointly conduct a study
to devise an implementation strategy for Gender Responsive budgeting so that it would
achieve the intended objectives.
16.9 In terms of sex ratio (number of women for 1000 men) Karnataka sex‟s ratio is 965
vis –a –vis All India‟s sex ratio of 933. Even if we leave aside Kerala for the present, as a
special case , Karnataka has to strive to reach the level already achieved in Tamil Nadu which
is 987 female for 1000 men.
Census
Year
India Kerala Tamil
Nadu
Andhra
Pradesh
Orissa Karnataka
1981 934 1032 977 975 981 963
1991 927 1036 974 972 971 960
2001 933 1058 987 978 972 965
Source: Arguments for a Better World, Census of India.
The Lower sex ratio can be attributed to a) the age old preference for son b) a modern
desire for smaller families combined with access though illegal, to ultrasound scanning and
other technologies that identify the sex of a foetus.
With a view to encourage parents to welcome a girl child and discourage the possibility of
female feticide and provide for better educational and nutritional support to girl child the
State Government introduced Bhagyalakshmi scheme for girls with effect from April 1, 2006.

ERC Second Report 109
Under this scheme a fixed amount is deposited in the bond issued by LIC and once the
beneficiary (girl child) attains the age of 18 she is eligible for ` 1, 00,000. The details of the
scheme and ERC‟s recommendations to make it more flexible and attractive to the families of
the girl child which will better serve the objectives of the scheme are detailed below.
Bhagyalakshmi: Broad contours of the Scheme, issues and recommendations.
a) The Scheme was launched during the year 2006-07 for the benefit of girl children
born in BPL families after 31.03.2006. Its benefits are restricted to two girls in each
BPL family. Upon the birth of the girl child an amount of ` 10, 000/- is deposited in
her name in fixed deposit.
b) The amount deposited with the LIC, India will be maximized and paid along with
interest to the beneficiary on her attainment of 18 years. During the year 2008-09, the
scheme was modified. Under the modified terms an amount of ` 19, 300/- in the name
of the first beneficiary of the family and an amount of Rs, 18,350/- in the name of the
second beneficiary of the same family is to be deposited. These deposits, on maturity
after 18 years would yield an amount of ` 1,00,097/-. The Life Insurance Corporation
of India manages these deposits under Janasri Bhima Yojana. In order to draw the
maturity amount the girl child should complete 8th standard of her schooling and
remain unmarried until the age of 18 years. The deposit instruments can be used as
collateral to finance the girl's education beyond tenth class. The finance so available
would be ` 50,000. If the beneficiary doesn‟t survive until 18 years, the amount will
be forfeited.
c) Bhagyalakshmi is a demand driven scheme. The demand is projected to be of the
order of 2, 00,000 girl children per year. During the course of discussion with the
departmental officers, it was brought out that ,although as per the demographic
projections, only 9,00,000 girl children from BPL families should have been
registered since the inception of the scheme, it was found that as many as 11,00,000
children were actually registered. Such excess registration indicates that either the
demographic projections in the context of the scheme were incorrect, or non-BPL
beneficiaries have been registered. The Table below shows the projected number of
beneficiaries, estimated financing costs, actual number of beneficiaries and the
amount released during the past three years.

ERC Second Report 110
Table No: 1
Number of beneficiaries and financial targets under Bhagyalakshmi Scheme: Projection and
Achievement.
Year
Target Amount
required to
cover the
projected
number of
girls during
the year
(` in lakh)
Shortfal/Su
rplus
(c-d)
(` in lakh)
Achievement Amount
required as
per (f)
(` in lakh)
Shortfall of
amount
released
during the
year
(` in lakh)
Projected
number of
girl
children
to be to
be
covered
during the
year
Financial
implication
to cover
(b)
(` in lakh)
Number
of girls
covered
under the
scheme
during the
year
Amount
released
during
the year
(`in
lakh)
(a) (b) ( c) (d) (e) (f) (g) (h) (i)
2007-08 1,50,000 15,000 28,237 -13,287 1,23,789 13,216 23,303 -10,087
2008-09 2,00,000 31,665 37,650 -5985 2,97,764 31,660 56,054 -24,394
2009-10 1,63,572 35,464 30,792 +4642 1,44,999 22,989 27,296 -4, 307
The variations in Target, allocation, short fall as compared to the actual registration
indicate a lack of scientific approach in the design and implementation of the scheme. It
shows that the target setting is adhoc, and that the amount released is not related to the actual
coverage. The Commission recommends that the demographic projections required for
implementing the scheme be reviewed periodically.
d) In the long run such mismatch invites the risk of false claims, disputes or disappointment
to rightful beneficiaries. Although the software now being developed by National
Informatics Centre (NIC) is expected to address all such issues and avoid further
problems, It is necessary to correct the past mistakes through verification of the
registered applications.
e) Every application has to be made within one month of the birth of the child, and is
processed for approval by the Deputy Director at the district. Upon consolidation of
information from all the districts, the finance Department releases the grant. However,
following the custom and tradition, most of the expectant mothers goes for confinement
to parental home and return to their respective places of normal residence three months
after delivery. Thus, the restriction of one month creates undue pressure on the parents
and involves avoidable transaction costs in attending to the documentation. Hence, more
ERC Second Report 111
reasonable time frame should be allowed for the parents to carry out the
documentation.
f) Although the Department has sent proposal for creation of 404 posts to implement the
Scheme with an implication of ` 500 lakh per year, no separate staff is created so far, and
the scheme is being implemented through Anganwadi Workers. Operating the scheme
through the Anganwadis is intended to encourage and motivate the parents to send the
child to Anganwadi, where nutritional supplements too would be available to the child.
Therefore, the system of using Anganwadis should be continued while also balancing
their core work load.
g) LIC of India was selected as an Agent for this scheme through a competitive bidding
process. However, considering the fact that the net present value (NPV) of ` 1,00,000
receivable after 18 years is Zero, for any discount rate ≥ 10%, the high premium charged
by the LIC is giving practically an illusory return. Hence the Commission recommends
that there is a need to revisit the rate of premium vis-à-vis the assured sum. While
doing so, all factors such as (i) probability of failure on the part of the beneficiary
fulfilling the conditions-precedent to claim the assured sum, (ii) the survival chances
of the girl child until 18 years, etc., should be taken into account. The Commission is
also of the opinion that the benefit should be given to the girl child in several
instalments, linking it to the girl’s educational progress, rather than making payment
in one lump sum. The Delhi government „Laadli‟ scheme has similar provisions to
disburse funds to the parents of the girl child in periodic instalments. On the one hand,
this ensures close monitoring of the educational progress of the girl child, on the other
hand, payments made in instalments will give a more favourable NPV as the period of
discount will be much less.
h) It is therefore recommended that under this Bhagyalakshmi scheme the financial
support to the girl child may be provided at intermediate intervals rather than
providing for the same at the end of completion of 18 years by the girl child; For
example at first stage (i) upon completion of 6 years of age subject to condition that the
girl child has obtained admission to a School; (ii) at second stage upon completion of
14 years of age subject to the condition that the girl child obtains admission to secondary
school, and (iii) at third stage after completion of 16 years with a condition that the girl

ERC Second Report 112
should have obtained admission to first year of PU course. With right to Education in
force obtaining admission to school should not be a problem.
i) Also, with the dropout rate between 1st and 10 std being 20 percent or more, and the pass
percentage in SSLC being about 60, and with many girls getting married before the age
of 18 years the number of girl children who will receive benefit after 18 years is not
likely to be more than 60 percent of the expected number. The scheme, by design, will
take 18 years time to have major impact on the age of marriage. Given such a scenario,
the provisions regarding vesting in Government the amount not claimed / not disbursed,
etc., requires immediate dialogue with LIC. The Department needs to consider
engaging a competent actuary to recalibrate the premium payable to the LIC,
determine different stages at which benefits should be paid, the quantum of benefit
payable at each stage, and to decide about the vesting the unclaimed amounts in
Government.
16.10 Integrated Child Development Services Scheme (ICDS).
a) ICDS is a Centrally Sponsored Scheme launched in 1975. The scheme is aimed at
addressing problems of persistent hunger and malnutrition amongst children by giving
nutritious food, promotion of maternal and child health, providing pre-post natal care
and health check-up to women, referral services to PHCs & CHCs, and non-formal
education to children in the age group of 3-5. The programme is implemented through
Anganwadi centers. Each Anganwadi centre covers a population of 300 to 800, in
urban and rural areas; a mini-anganwadi covers a population of 150-400 population
while in tribal areas each centre covers a population of 150-300. The key person who
delivers various services in ICDS including those of Department of health and family
welfare is the Anganwadi Worker. The AWWs were found to be lacking in the
techniques required to provide non-formal, pre-school education to the children at
anganwadi particularly to enhance their skills in domains such as general awareness,
gross motor (involve the large function as walking, kicking, sitting upright, lifting and
throwing ball) , fine motor (co-ordination of small muscle movements which occur
e.g. Movement of fingers usually in co-ordination with the eyes), eye to hand co-
ordination, pre-academic calculations, speaking, noting. The work manual prepared
by Price-Waterhouse Coopers, at the instance of the Department, needs to be

ERC Second Report 113
internalized through extensive training of AWWs. It is noteworthy that the said
manual is hosted on the website of the Department of Administrative Reforms of
Government of India as „best practices‟. The Commission recommends that the
Department prepare and implement a training programme using the resources at
ATI and DTIs intensely to raise the capabilities of AWW.
b) Presently, a total of 60,046 anganwadis, 3,331 mini anganwadis are maintained under
185 ICDS Projects covering 175 talukas and 10 urban areas. In the year 2009-10 the
number of beneficiaries covered under the scheme were 44.91 lakh while the
allocation was ` 559.35 crore. Financing is released through Zilla Panchayats. The
Unit cost per day for supplementary nutrition is (a) five rupees for pregnant /nursing
mothers over 300 days, (b) six rupees for severely malnourished children, and (c) four
for malnourished children.
c) Some of the equipment/resources used at these centres include, weighing scales, toys,
teaching aids, play material, fire wood etc. Ninety percent of administrative and
training cost and fifty percent of supplementary nutrition cost is borne by the Central
Government. One of the major challenges at implementation level is finding sufficient
and suitable place to accommodate anganwadi centres.
d) Evaluation studies of the recent past indicate that the ICDS is well established in
districts like Chikmaglur, Kolar, Hasan where about 75 percent of eligible children
received the benefit, and the malnutrition levels are low in these districts. On the other
hand, in districts like Raichur, Bellary and Bijapur the benefit was received by only 40
percent of the eligible children.
e) The key interventions that would have a long term bearing on the children‟s health
and quality of life are (i) providing clean, nutritious food to children at anganwadi
centers and (ii) giving them scientific non-formal pre-school education and (iii)
providing a conducive physical environment. In most of the places visited by the
Commission it was found that there is scope for significant improvement on all the
three counts, more particularly in the sourcing, preparing and distribution of
nutritious food.
f) The anganwadi centres visited by the Commission were found to have inadequate
space to accommodate the number of children present. The Department is unable to

ERC Second Report 114
utilize the available funds, for construction of anganwadi centres. The unit cost of
Anganwadi centre is about ` 3.75 lakh. For instance, in 2008-09 an amount of
` 3,000 lakh was allocated and ` 2,780.71 lakh was released, of which ` 217.95 lakh
lapsed. In the year 2009-10 an amount of ` 468.06 lakhs was allocated and released.
The Department should realistically assess the total requirement and prepare an
action plan to construct sufficient number of Anganwadi centers in a time-bound
manner. For this purpose, the Department of RDPR and WCD should exploit the
possibility of using funds available under the Mahatma Gandhi National Rural
Employment Guarantee Act, 2005 with due regard to specification indicated in
Schedule I, read with Section 4(3)) of the Act.
g) The supplementary nutrition as now provided is found to be not palatable. There are
repeated complaints from parents that there is monotony in the food served at the
centre. They would like some variation in the menu with food items that are palatable
and liked by the children. In many places, the nutrition component is said to be
supplied by the Self-Help Groups formed under Stree Shakti. However, these group
members limit their activities to blending and packing the food items, which is
sourced from M/s. Chritsy Food, Chennai. This firm supplies food in bulk quantities
to Mahila Supplementary Production and Training Centres. These centres are
reportedly registered as Societies. However, it was stated that the so called members
of these Societies do not appear to have actually formed a voluntary SHG group, but
are working as daily wage workers of the Society. Such practices appear to be used as
a convenient way to circumvent the procurement conditions. The food packets made
available at the center do not bear details showing the name of the manufacturer. Such
procurement practices are against the letter and spirit of the schemes under ICDS and
Stree Shakti, and are also violative of Supreme Court Orders. The Supreme Court has
intervened in this matter and following which certain decision have been taken by the
Government of India. For instance the state governments were asked by the Centre in
March 2009, to make financial allocation in such a way “that children in the age group
of 6 months to 3 years must be entitled to food supplement of 500 calorie of energy
and 12-15 gm of protein per child per day in the form of Take Home Ration (THR)”.
The relevant parts of the SC orders are at (Annexure-16b).
ERC Second Report 115
The Department also needs to investigate the entire procurement process of
supplementary nutrition food that has taken place so far, inquire as to what extent
the Supreme court orders were or were not complied with and take corrective
measure before entering into any new contract for the year 2011-12. While doing
so, the Department should take care not to disrupt the availability of food to
children.
h) Nutrition Programme for Adolescent Girls is a Central Government Programme for
adolescent girls (age group 11-19 years) in Karnataka, being implemented in selected
3 backward districts, namely, Kolar, Chickaballapur and Gulbarga on a pilot basis.
Free food grains @ 6 Kg per beneficiary per month would be provided to the
undernourished adolescent girls (weight -30 Kg for those below 15 years of age and
35 Kg over 15 years of age). The physical and financial targets of 1, 98,822 and ` 100
lakh respectively have been achieved during 2008-09.
These beneficiaries are already covered under Supplementary Nutrition Programme
To avoid duplication and for better monitoring this project can be merged with the
SNP with suitable modification.
16.11 Stree Shakti:
The scheme is launched throughout the State in the year 2000-01 with the objective of
empowering women to organize themselves into Self-Help Groups to undertake economic
activities, with initial support from Government. Several State Government Departments
promote self help groups which work on different guidelines, several of which are issued by
Central ministries viz., Ministry of Women and Child Development, Ministry of Rural
Development, Department of Forest (JFM), Department of Watershed Development. Thus
assistance to SHGs varies across the Departments. NGOs too form SHGs. There is a need to
standardize the financial package to all government sponsored SHGs in order to avoid
confusion or duplication. The diversity in the guidelines and financial support as issued by
respective ministries of Government of India needs to be negotiated between the Departments
at the state level in order to have standard/uniform financial packages.

ERC Second Report 116
a) There are about 5 lakh SHGs in the state. SHGs obtain loans from financial
institutions which they supplement with their own generated savings, and undertake
lending among themselves for economic activities. There are 1.40 lakh SHGs under
Stree Shakti with a membership of 18.97 lakhs women. Departmental support is
given in the form of a revolving fund of ` 5000 per group as training support. These
SHGs have availed bank loan to the extent of ` 762.08 crore and raised internal
loans amounting to ` 1926.88 crore. Some Stree Shakti groups have been started at
the village level by Anganwadi workers who are paid incentives under the Scheme.
The progress of this scheme is monitored at the taluk and district levels by the
Child Development Project officers.
b) Issues such as the high prevalence of illiteracy, non-diversified composition of
members of SHGs, lack of managerial skills to the office bearers of the groups, lack
of co-ordination between lending institutions, lack of project on the shelves that
could be taken up profitably by the SHGs, and marketing constraints contribute to a
high potential for loan defaults and consequential disintegration of the SHGs.
c) Considering the exposure that the SHGs have to banks, the high interest costs
involved and the kind of risks indicated above, there is a need to take a hard and
realistic look at micro-financing of SHGs in the State, particularly in view of the
recent reports about micro-financing experiences in the neighboring state of Andhra
Pradesh.
16.12. The Scheme “Marriage of Devadasis and Widows” is intended to bring destitute
women and Devadasis to the mainstream by encouraging marriage. Destitute widows in the
age group of 18-35 years and residing in Karnataka State for a minimum period of 5 years are
eligible for an assistance of ` 10,000/- for the marriage. The assistance will be in the form of
cash of ` 5000/- for marriage expenses and balance ` 5000/- will be in the form of National
Saving Certificates in favour of the woman beneficiary. The allocation for 2008-09 was `
7.60 lakh and no expenditure was incurred. The allocation for current year (2009-10) was
only ` 0.71 lakh. This shows that the scheme is just a token amount and that it has not really
benefited many beneficiaries.

ERC Second Report 117
The scheme of marriage of destitute widows and Devadasis, which is not popular, can be
considered to be merged with Devadasis Rehabilitation Programme, which is being
implemented by the Karnataka State Women’s’ Development Corporation.
Correctional Administration.
16.13 The Department of Women and Child Development is entrusted with the responsibility
of implementing the following Acts:
The Juvenile Justice Act, 2000.
The Probation of Offenders Act, 1958.
Immoral Traffic (Prevention Act), 1956 & Rules, 1960.
The Orphanages and Charitable Homes (Supervision and Control) Act, 1960 and
Rules 2000.
After Care Services.
In furtherance of the objective of these Acts, several schemes are being implemented. Some
of such schemes which require some changes are discussed below:
a) Observation Homes: As per the provisions of Juvenile Justice (Care and Protection
of Children) Act, 2000, eight observation homes have been set up in the State. These
are meant for temporary reception of any Juvenile in conflict with law during the
pendency of any inquiry against him/her. The observation homes are functioning at
Bangalore (Urban), Dharwad, Gulbarga, Mysore, Shimoga, Bellary, Bijapur and
Mangalore. Orders have been issued to start additional 21 observations homes but
they are yet to start. The number of children admitted to these eight observation
homes at the end of March 2010 is 747. Six observation homes are housed in
Government buildings and two are in rented buildings.
Two units of special homes are set up for rehabilitation of Juveniles in conflict with
law, one for boys attached to observation home, Dharwad and another for girls
attached to children‟s home for girls at Bangalore. Till January 2010, there has been
no admission to these Special Homes.
The Department has expressed that additional posts are required for these
institutions and especially in Bangalore Observation Homes creation of 7 additional
posts is most essential. This may have to be considered by the Government while
studying overall development of staff.

ERC Second Report 118
b) Children‟s homes: Government has constituted child welfare committees in 27
districts. Children‟s home are homes meant for the reception of children in need of
care and protection during the pendency of any enquiry. The homes provide
accommodation and facilities for education, training and rehabilitation of children,
food, clothing and bedding as per the scale prescribed by Government. Children are
provided education up to VII standard in the institution itself and training in crafts
like tailoring is also given. Older children studying in high schools and colleges are
sent outside for higher education. There are 44 children‟s homes in the state. During
the year 2008-09, 1591 boys and 789 girls were admitted to these homes. During
2009-10, 970 boys and 803 girls were admitted to these homes and as of March
2010, the strength was 829 boys and 711 girls. 35 children‟s homes are functioning
in Government buildings.
There is one institution at Bangalore exclusively for mentally retarded boys and one
institution at Hubli for mentally retarded girls. A home for the children below the
age of 6 years, „Shishu mandir‟ has been started at Bangalore and 206 children have
been admitted during 2008-09. 10 children were admitted to Shishu Mandir
during 2009-10 and as of March 2010, there were 6 children. Henceforth the scheme
will come under the ICDS umbrella.
The Department feels that Additional posts are required for Institute for Mentally
Retarded Children home at Bangalore and Mentally Retarded Children for girls at
Hubli for maintenance of inmates. Since these homes have a considerable impact
on mainstreaming the children there is a need to have qualified and competent
human personnel to manage these homes.
c) Skill up gradation for inmates of correctional institutions: This scheme was
formulated to provide skill development and vocational training for the rehabilitation
of destitute, orphan, deserted women and children in addition to regular education
that they are provided at present.
Women and children of correctional institutions can undergo training in any of the
reputed training centres, or in training programmes conducted in the premises of the
institution itself. Training in cycle repair, mobile telephone repair, automobile

ERC Second Report 119
repair, plumbing, barbending, hair cutting, computer training, agarbathi and
agarbathi tube making, driving, food conservation, leather bag making, beautician,
tailoring, home nursing, zari work and readymade garments is provided.
The scheme guidelines need to be redesigned so as to suit the children of 10-12
years. The activities which are restricted in the present guideline also need to be
increased to include people of varied age groups. It is suggested that the Skill
upgradation should be measurable and Institutional Heads should monitor the
programme.
d) Scheme for care and maintenance of Destitute Children: The scheme was
commenced during 1975. This is a ZP sector scheme. The programme includes
services of food, clothing, shelter, medical attention and curable services. Financial
assistance is given to registered voluntary organizations working in the field of child
welfare for at least three years to run a destitute children unit with 25 children.
Ninety percent of the cost of the scheme is sanctioned by Government. The
organization is eligible for maintenance grant at the rate of ` 400/- P.M. per child and
rent at the rate of ` 50/- P.M. per child. Against a release of ` 3948.21 lakh during
2007-08, the expenditure was only ` 324.80 lakh. In the subsequent years (ie) 2008-
09 and 2009-10, the expenditure under plan and non plan was ` 324.80 lakh and `
327.78 lakh respectively. Reduction in expenditure was stated to be due to less
strength.
The scheme is run by NGOs and the progress is not satisfactory due to non
enhancement of maintenance grants based on the increase of prices on food and other
articles. The outputs are measurable by the results of the children in the main stream
of education. District officers monitor the programme by making personal visits.
Government may consider institute’s proposals for enhancement of the
maintenance grants.

ERC Second Report 120
Karnataka State Women’s Development Corporation
16.14. In order to rehabilitate the Devadasis, the Karnataka State Women‟s Development
Corporation has been implementing Devadasi Rehabilitation Programme (DRP) since 1990 in
the Districts of Belgaum, Bijapur and Bagalkot. The State Government has brought out
Karnataka Devadasis (Prohibition of dedication) Act 1982 and Rules (1988) to eradicate
Devadasi system. The main programmes under DRP are, Awareness camps, Health check-up
camps, formation of self help groups and monthly pension to ex-devadasis, income
generating Activity.
Under the income generating activities, ex-devadasi women are provided 50 per cent subsidy
from Karnataka State Women‟s Development Corporation and 50 per cent loan through
banks. ` 20, 000/- is the unit cost to take up income generating activities like dairying, petty
business, rope making, mat weaving etc. Necessary training is imparted to the beneficiaries
by the Corporation. The progress achieved under this item in the last three years is as below:
Table -2
Devadasi benefitted under the scheme: Target and achievement.
(Financial: Rupees in lakh)
Year Target Achievement
Physical Financial Physical Financial
2007-08 1650 322.88 1639 345.40
2008-09 1500 300.00 1495 291.66
2009-10
(upto 1/2010)
2500 500.00 2126 436.51

ERC Second Report 121
During 2007-08, Government of Karnataka has sanctioned pension scheme for ex-
Devadasis, who have crossed 45 years and above. Monthly pension of ` 400/- P.M. is
provided to the ex-Devadasis.
Table-3
No of Devadasis benefitted under the scheme: Targets and achievements
(Financial: Rupees in lakh)
Year Target Achievement
Physical Financial Physical Financial
2007-08 16458 560.44 11676 560.44
2008-09 15730 620.40 15730 620.40
2009-10
(upto 1/2010)
16666 800.00 15630 400.00
This scheme was introduced during the year 2007-08 and the allocation is being made
separately to the Corporation, who has been authorized to disburse the same. The
Directorate of Social Security and Pensions is already functioning under the Revenue
Department to look after and disburse all pensions including old-age, destitute, physically
handicapped etc. In view of this, the Corporation implementing the scheme for ex-
Devadasis may lead to duplication and administrative problems.
Karnataka State Commission for Women
16.15. In accordance with the purpose of protecting the interests of women and to ensure
their progress and development, GOK constituted the Karnataka State Commission for
women (KSCW) on 26.5.1995 under the Karnataka State Commission for Women Act. 1995.
The Commission consists of a woman Chair Person and six non official members and four
ex-officio members to be nominated by the Government.
The Commission takes up cases of violation of the provisions of the constitution and of other
laws relating to women, looks into the complaints relating to deprivation of women‟s rights
participates and advise on the planning process of socio economic development of women,
assist women to ensure equal and fair justice in matrimonial disputes before the family courts
etc.
ERC Second Report 122
16.16. Under Suraksha scheme financial assistance of ` 20, 000/- subject to a maximum of
` 2, 00,000 is provided to Acid Victims, Kerosene attack on poor women.
The scheme also provides a) Financial assistance for medical expenses, plastic surgery and
shelter; (b) creation of employment opportunities d) providing shelter facility to these
women under Ashraya/Ambedkar schemes e) financial assistance of children‟s education f)
monthly pension facility to those women who have been handicapped from acid attack.
Only one scheme ‘Suraksha’ is implemented by the commission. This scheme can be
transferred to the Karnataka Women Development Corporation for administering the
financial aspects, leaving the Commission with powers to pronounce the compensation
after due consideration.
Department of Welfare of Disabled and Senior Citizens
16.17. The Department of Welfare of Disabled and Senior Citizen strives for welfare of
persons with disabilities and senior citizens. The Department has eleven plan and nine non
plan schemes for the benefit of physically disabled persons, implemented by a team of
officers headed by Director with the support of a Deputy Director and other officers. At the
District level, there is a Disabled Welfare Officer supported by a program assistant, a
computer operator and a Group „D‟ employee.
a) Training and Employment: There is a demand for employment in the State from
persons with disability. The Department of Welfare for Disabled and Senior
Citizens (under the Department of Women and Child Development) has framed a
scheme to enable disabled youths in the age groups of 18-45 to undergo training in
Computer and VCT for a period of 6 and 3 months respectively. In the year 2007-
08, against a budget provision of ` 300.00 lakh, an expenditure of ` 66.98 lakh was
incurred. A budgetary provision of ` 312.00 lakh was provided covering 27 districts
during the year 2008-09, however no expenditure was incurred in the year 2008-09.
During 2009-10, the budget provision was ` 324.48 lakh, no expenditure was
incurred. During the year 2010-11 budget provision of ` 337.45 lakh, no
expenditure was incurred. From the year 2008 onwards even though no expenditure
was incurred under this budget head, there has been allocation of more than three

ERC Second Report 123
crore every year. It follows that the programme could not be implemented
successfully.
In this connection, it may be stated that the Karnataka Vocational Skill
Development Corporation (under the Department of Employment and
Training) is implementing various schemes of Training and the above scheme of
training to physically disabled can also be transferred to the Corporation. This
may enable the disabled to get proper training and also placement. The interests
of the disabled can also be safeguarded by the Department by identifying the
beneficiaries and also by periodical monitoring of progress of implementation of
schemes by the Corporation.
b) Maintenance Financial Assistance to the Physically Handicapped and the
Disabled Poor: Disabled persons who suffer from 40-75% disability are entitled for
an allowance of ` 400 per month; the amount was revised in the year 2008. Persons
who suffer from disability of 75% and above are given a monthly allowance of
` 1000 per month w.e.f 2009. Disabled persons who are residing in Karnataka for not
less than 5 years and who do not get any other financial assistance or old age
pension, only are eligible for this allowance. Tahsildars, of respective taluks who
verifies the necessary certificates from the authorised medical specialists are the
sanctioning authorities. The disabled population in Karnataka is about 9.40 lakh and
out of which, 5.46 lakh have been covered under this scheme during the year 2008-
09.
There are Schemes benefiting old age people and senior citizens. It is suggested that
these social welfare pensions i.e. Old Age Pension, Widows’ Pension etc., under
the Revenue Department could be brought on par with the maintenance allowance
for the Physically Handicapped. At present Old Age Pension is ` 400 per month of
which ` 200 is Government of India’s contribution. Taking into account the daily
wage being paid under MNREGS (under which 100 days work is guaranteed for
one member per family) and also the Planning Commission’s revised definition of
poverty level, the Expenditure Reforms Commission recommends that allowance
for disabled persons (with disability of 40-75%) may be fixed at ` 800 per month.

ERC Second Report 124
It is suggested that similarly the recipients of Old Age Pension should be assured
of a sum of Rupees Eight hundred per month (inclusive of GOI contribution).
Similar enhancement may be made in Widow’s Pension also, so that inclusive of
GOI Pension, if any, eligible widows also receive ` 800 per month. State
Government should move to the Government of India to share the expenditure on
50:50 basis. Proper verification procedure for such welfare pension/allowances
should be put in place so that benefit goes only to the persons fulfilling all the
conditions of the schemes and there is no possibility of the same person receiving
pension/allowance from two different sanctioning authorities (e.g. from Tahsildar
of the two different Talukas).
Any rise in the above social welfare pensions would naturally appear as additional
expenditure. However, keeping in view the increase in cost of living since the last
revision on the one hand and keeping in view the general inability of the
beneficiaries under these schemes in participating in schemes like MNREGS on the
other, there is a clear justification for such rise.
Implementation of the Persons with Disabilities Act
16.18 A comprehensive Act called the Persons with Disabilities (Equal opportunities,
protection of Rights and full participation) Act 1995 has come into effect from 07.02.1996.
The State Government has constituted the State coordination committee as per Sec 13 of the
Act. The Commissioner for persons with Disabilities has also been appointed as per Sec 60
of the Act. A State Executive Committee has also been constituted as per Sec 19 of the Act.
The Commissionerate for persons with Disability is responsible for implementing the
statutory requirement that three percent of the budget of all the Departments is to be utilized
for persons with disabilities. The Commissionerate is headed by the Commissioner assisted
by an Assistant Commissioner and a Gazette section officer.
16.19 In so far as monitoring is concerned, it may be made mandatory that every Department
should disclose activities, undertaken by them for the benefit of physically disabled persons
in their Departments in a separate chapter in its Annual Report. The Commissionerate may

ERC Second Report 125
bring out a report on the state of implementation of Persons with physically disability Act
every year after conducting a sample of selected Departments every year. The
Commissioner may be provided with suitable accommodation and requisite staff.
16.20 It was found that despite government order issued, no guidelines have been issued on
segregating three percent of the funds and monitoring of the benefits going to physically
disabled persons. Therefore, government should issue guidelines for spending three percent
of budget of every beneficiary oriented scheme on the Disabled and compliance with these
guidelines should be regularly monitored. The Commissionerate also needs to be suitably
strengthened by providing additional technical staff and office premises for their effective
functioning. Compliance with these guidelines should be regularly monitored.
Karnataka State Commission For Protection of Child Rights.
16.21 The Karnataka State Commission for Protection of Child Rights (KSCPCR) has been
constituted under the provision of Commissions for protection of Child Rights (CPCS) Act,
2005 for the protection of child rights and other related matters. The Commission consists of
the Chairperson and five members. For the year 2009-10 out of the budget allotment of `
170.00 Lakhs a sum of ` 48.21 lakhs has been released upto 31.1.2010 and expenditure
incurred is ` 26.81 lakhs. The Commissions Studies and monitors all matters relating to
constitutional and legal rights of children and look into complaints of the cases involving
violation of these rights and recommend measures for the effective implementation of the
safeguards provided by law for protection of child rights.
16.22. Selection process of Chairperson and members has been completed. It is proposed to
form a sub-committee with the objective of providing a forum/platform for children to
directly voice their opinions and concerns. Representatives of children in especially difficult
circumstances (working children, marginalized children, handicapped children etc.) and
members of NGOs working for the rights of children will serve on the subcommittee to take
forward the child protection movement to reach each and every child. For monitoring RTE,
Child Rights Commission at the State level has been given the responsibility under the Act.
In Karnataka the qualification, background, status of Chair person and members of Child
Rights Commission are not at all comparable with the position in the Central Government.

ERC Second Report 126
There is a need for upgradation of the Status of the Chairman and members of the
Karnataka Child Rights Commission, taking into account the position in the Central
Government.

ERC Second Report 127
Chapter 17
Department of Health and Family Welfare
17.1 The Department‟s mandate is to design and implement schemes, programmes and
projects to deliver the State‟s Integrated Health Policy objectives. The health care delivery
infrastructure managed by the Department consists of curative, preventive, promotive and
rehabilitation health care.
17.2 The objective of the State Integrated Health Policy (2004) is to provide “Quality
Health Care with Equity”, which involves:
Providing integrated and Comprehensive primary health care.
Providing a credible and sustainable referral system.
Establishing equity in delivery of quality healthcare.
Encouraging greater Public-Private Partnership (PPP) in the provision of quality
healthcare in order to better serve the under served areas.
Addressing emerging issues in public health.
Strengthening Health Infrastructure.
Improving access to safe and quality drugs at affordable prices.
Increasing access to alternative medicine systems.
The Commission, while appreciating the fact that „equity‟ has been recognized as a key
element in delivery of health care, has noted however, that there is no evidence of the
Department having taken up equity issues, such as the cost of medical care through the
Government hospitals vis-à-vis private hospitals, in relation to the per capita income of the
individuals. Studies reveal that the effectiveness of Primary health care as the first line of
health care is yet to be established in an equitable manner. Generally, even the rural poor are
obliged to meet out of pocket expenses on health care. At all India level, such additional
expenditure on a 15 days non-hospital treatment per ailing person in rural areas, was
estimated to be ` 285. In Karnataka such expenditure was said to be ` 313. A survey quoted
by the Economic & Political weekly (October 23-29,2010) suggests that around 24 percent
of the farmers who committed suicide were suffering from chronic illness, and in 30 percent
of the cases at least one member of the household suffered chronic illness. Such survey
results although are influenced by dynamics of the region or districts from where the sample
was drawn, - their findings are instructive. Because such finding point to the need for the
Department to consider the equity issues in the matters of health care with much more
concern and appreciation.

ERC Second Report 128
17.3 Presently a net-work of Sub-Centres (8870), Primary Health Centres(2310),
Community Health Centres (180), Taluk Hospitals (146), District Hospitals(30) are engaged
in providing health care services in the State. The network implements various State Sector
Schemes and Centrally Sponsored Schemes, including implementation of health care directly
provided by the Government of India, Ministry of Health and Family Welfare through
NRHM.
17.4 For the year 2009-10, government expenditure on health as a percentage of total
government expenditure was 3.93 percent, as compared to the 5.36 percent in the year 2000-
20011. However, the increasing challenge to Government seems to be, not merely securing
adequate funds, but ensuring that the Department spends the funds allocated in the budget.
Annexure-17a which depicts the unspent amount in the Department during the last ten years,
shows that expenditure was always less than the allocation (except for 1999-2000). Though it
cannot be said that the funds provided are adequate to meet the demand for health care
services, the trends in expenditure indicate that the Department‟s capacity to spend the
allocated fund requires to be examined and the systemic deficiencies need to be addressed
and corrected by the Department.
17.5 The health care technology and implementation strategies are channeled through
various schemes financed under both the Plan and Non-Plan budgets of the State
Government, supplemented by grants received from Government of India. Annexure-17b
gives the status of health care infrastructure supported by the Department.
17.6 Karnataka aspires to be one of the top three States in the country in terms of various
health care indices. The health targets as envisaged by 2020 in its vision document are
shown in the following Table.
1 Note: Some of the health care services which were part of by state health budget in the past are now
directly supported by Central Government through schemes like NRHM etc.,

ERC Second Report 129
17.7 The above goals, particularly those relating to child mortality, are generally sensitive
to socio-economic conditions. Lower literacy levels of mothers, their residential status as
rural population and their lower standards of living impact the indicators negatively
(Annexure-17c). With a population of 5.3 crore , which is growing at a rate of about 1.3
percent per annum,2 the State needs to provide for adequate health care supply systems and
manage the same efficiently, in order to achieve these targets. This is a complex and
challenging task, given the fact that one third of the State population lives in rural areas and
one third is illiterate, added to which is the problem that appropriate health care technology,
competent professional man-power, adequate finances and efficient resource management are
all hard to come by.
Scheme specific Findings and Recommendations.
17.8 Uneven distribution of Primary Health Care Facilities: As against the national
norm of one PHC per 30,000 population, the State has established the following facilities:
-11 PHCs serving less than 10,000 population;
-82 PHCs serving up to 20,000 population;
-75 PHCs serving a population of 30,000;
-61 PHCs serving a population above 30,000.
Thus, the median population served per PHC is 21,609 (Mysore, 2008-09). The District with
the highest population per PHC is Dharwad with 57,496 persons per PHC, while the District
with the lowest population per PHC is Chikmangalur with 14,386 persons per PHC
(Annexure-17d). The skewed location of PHCs in some of the districts with difficult terrain
may be understandable, but the unevenness of the location of the PHC in other districts only
violates one of the commitments made in the State Integrated Health Policy but also increases
the unit cost of providing health care services leading to inefficient expenditure through
2 With Birth rate of 19.8 and death rate of 7.4 per thousand population

ERC Second Report 130
PHCs. Hence the Commission recommends that the Government should revisit the present
location of health care facilities. Since only 1376 PHCs are functioning from own
buildings such relocation would not be difficult. The saving generated through relocation
be used for strengthening at various PHCs.
17.9 Annexure-17d also shows the District wise spread of the Government Health
institutions, viz. District Hospitals, Taluk Hospitals, Community Health Centres, Primary
Health Centres and Sub Centres along with the respective number of beds. In the matter of
availability of beds, there are districts like Uttara Kannada (126), Mysore (122), Shimoga
(120) that have more than 120 beds per one lakh, whereas some districts like Bijapur (68),
Ramanagara (68), Belgaum(67), and Bangalore-Rural (67) have less than 70 beds per one
lakh population. If this unevenness is not addressed, by 2010-11,the picture may get further
skewed with the two outlier districts of Bagalkot and Bangalore Urban having, respectively,
as few as 60 beds and as many as 276 beds per one lakh population;and following a similar
trend, Kodagu will have as many as 198 beds and Koppal as few as 65 beds per one lakh
population.
17.10 During visits to the districts, the Commission noted that although there is adequate
flow of drugs in State Hospitals, supervision and regulation of the movement of these drugs
into the interior of districts is poor. The District Health Officers also need to maintain a
record of the drugs procured for the district hospitals and ensure a stringent quality control
for timely issue of adequate drugs from district level offices. There is a need to ensure that
regular and periodic quality inspection at District and Taluk level hospitals are carried out,
and also to ensure an efficient administration of drug supply in Government Hospitals. In
this regard, there is need for the Department to rationalise its budget and manpower
allocation with respect to the quantity and value of drugs used in the districts.
17.11 A survey of 246 PHCs reveals that, despite the commitment to provide 24X7 service
at PHCs, the infrastructure support within the premises of PHCs is inadequate and manpower
shortage persists. In particular:
-52 PHCs (22.7%) do not have Bio-medical waste disposal facilities;
-24 PHCs(24%) had toilets unfit for use;
-151 PHCs (65.9%) have no separate toilet facility for women;
-126 PHCs (56%) do not have electricity back-up support;
-84 PHCs (37%) do not have maternity wards;
-193 PHCs (84%) do not have mosquito mesh.
As regards manpower:
- 12 PHCs have at least 3 doctors,
- 97 PHCs have two doctors,
- 111 PHCs have only one doctor, and

ERC Second Report 131
- 9 PHCs have no doctor at all.
Another cause of concern is frequent absenteeism of doctors at the health facilities, largely
due to the fact that a good number of them are engaged in private practice. Considering the
above, the Commission recommends that an objective exercise be initiated immediately by
Government to address the above deficiencies necessarily to relocate the PHCs.
17.12 On the quality of services, there is a need for the Department to initiate measures to
generate public confidence in the quality of services provided by PHC system. Using
information from the NFHS Survey 2004, Annexure-17e lists the reasons why government
health facilities are not popularly used. The Survey indicates that about 64% of households
do not generally use Government health facilities due to the poor quality of care (51%); and
unavailability of health personnel (15%) and prefer private health care instead, despite higher
healthcare costs (NSSO-60th round). The Commission had also observed instances of
underutilisation of hospital facilities in Bidar and Shimoga where a large percentage of
hospital beds were vacant. Though infrastructure facilities are provided at these places, there
is a lack of adequate medical personnel, and low patronage from patients. In Karnataka, not
only the diagnostic facilities are inadequate, but even existing facilities have vacancies of
technical staff.
17.13 Therefore, the Department of Health needs,
(a) to put in place a mechanism whereby physical infrastructure is fully utilised
by posting adequate staff and ensuring their presence during duty hours,
(b) not to create further new physical infrastructure without assessing, through
epidemiological studies, the actual demand for the proposed services,
(c) to create and position manpower on the basis of the morbidity pattern, which
needs to be reviewed at least once in three years,
(d) to consider dovetailing services provided by Government with those provided
by the private sector through government supported insurance schemes, and
(e) to consider similarly matching infrastructure available in the private and
public sectors.
For this purpose, the hospital patient database could be actively managed and used for
monthly review, procurement and epidemiological analysis. However, the Department has
to use existing hardware and software for data mining from HMIS3, HRMIS
4 to enable
3 Health Management Information System (HMIS) is being used for a variety of health care services provides
covering all three aspects of Hospital Management vis., Patient Administration System (PAS), Clinical
Administrative systems (CAS) & Entreprise Resources Planning (ERP)
4 Human Resource Management Information System (HRMIS), is presently used only for financial disbursement
and not used as managerial tool at district level.

ERC Second Report 132
informed decision making for better HR placement, drug procurement & distribution and
man power planning. Since HMIS is being used in 11,500 institutions, an intensive
training needs to be undertaken for the staff in the use of HMIS and HRMIS. The
Commission also recommends that, using IT, an accountable performance review
mechanism be put in place to assess the performance of PHCs.
17.14 MADILU Scheme: This is a Scheme to encourage women from BPL families to go
for institutional deliveries in order to reduce maternal and infant mortality. Under the Scheme
a medical kit costing ` 1,260 with 19 items, essential and useful for the timely delivery and
post-natal care, is provided to each expectant mother. A sample check verification done by
the Directorate of Statistics revealed that the scheme is generally performing well, although
there is some scope for improving the implementation quality by addressing a few marginal
issues. The 2008-09 Survey is based on a sample study of 1097 beneficiaries. It was seen that
one percent of the beneficiaries do not belong to BPL families; that about 5 percent of the
births took place at private hospitals; that four percent of the beneficiaries received a kit with
less than 19 specified items; that 2.57 percent beneficiaries incurred additional expenditure
for receiving the kit;and that a large number of beneficiaries (71 %) did not receive the kit on
time.
17.15 The Commission recommends that the Department needs to ensure the required
number of kits are procured and made available on time, while also redressing deficiencies
of the nature mentioned above.
17.16 Health Insurance Schemes: The Department implements the Vajpayee Arogya
Shree (VAS) and Suvarna Arogya Chaitanya (SAC). There are also health insurance schemes
implemented through the Department of Co-operation (Yeshasvini) and by the Rural
Development and Panchayati Raj Department (Rashtriya Swasthya Bima Yojna, RSBY).

ERC Second Report 133
Scheme Target population Benefits
VAS BPL families (as per state
govt. list) Tertiary care upto ` 1.5 lakh per
family of five (to cover 70 lakh
BPL families identified by
Department of Food and Civil
Supplies)
SAC School going children from
first to tenth standard Surgical care upto ` 2 lakh per
child
Yeshasvini Members of the Cooperative
societies (APL & BPL) Surgical care upto ` 2 lakh per
member
RSBY BPL families (as per GoI list) Secondary care upto ` 30,000 per
family of five (to cover 19 lakh
BPL families, identified by RDPR)
17.17 As could be seen from above, while the objectives, coverage and the benefit vary
between the schemes as they are set against different parameters /financing norms, which
are indicated below.
Parameters RSBY VAS Yeshasvini SAC
1. Cost per
family of 5 per
year
` 750/- ` 300/- ` 750/- N/A
2.Member
Contribution
(family of 5)
` 30/- per
annum
Nil ` 150/- per
person
None
3.Govt
Contribution
(family of 5)
75% of
premium (not
exceeding `
565/-) + ` 60 /-
per card borne
by Central
Govt.
25% of
premium borne
by State Govt. +
any additional
premium
` 300/-
Govt. of
Karnataka
State Govt.
provides for
difference
between total
expenditure and
total member
contribution
85% of
expenditure
borne by GOI
(NRHM)
15% of
expenditure
borne by
State Govt.
4.Underwriting
of Insurance
(Risk Taking)
Insurance
Company
Government via
Suvarna Arogya
Suraksha Trust
Yeshasvini Trust
and Government
Government

ERC Second Report 134
Parameters RSBY VAS Yeshasvini SAC
5.Benefit
Package
Coverage
Secondary care
– 780 Medical
and Surgical
Procedures
Tertiary Care -
402, Procedures
under 7
specialties
Secondary and
tertiary care-
1600 Surgical
Procedures
All as per
Yeshasvini
norms
6. Average
Benefit Package
amount
(Rupees)
10,300
43,200
11,500
11,500
17.18 Since the government is already considering integration of all the Publicly funded
health insurance schemes, the Commission expects that a substantial part of the health care
burden would shift from the Government health care system to the private health care system.
Government hospitals too should be able to compete and provide services to members
covered under the integrated scheme. The Commission also looks forward to the PHCs,
District hospitals and other Government hospitals being adequately strengthened so as to
participate in the insurance schemes. It was brought to the notice of the Commission that the
Planning Commission is also exploring the possibility of integrating the various health
insurance schemes now being implemented through various ministries. As such, while
integrating the schemes at state level, the Department may take into account the integration
being considered by the Planning Commission.
Drugs Control Department
17.19 The mandate of the Department of Drugs Control is to implement the Drugs and
Cosmetics Act, 1940 and Rules 1945, which aims at maintaining quality, safety, efficacy and
rational use of drugs at controlled prices in the State. The Department had a budget of `
20.3 crore and expenditure of ` 13 crore for the year 2008-09. Expenditure has been recorded
in respect of the Drugs Testing laboratory in North Karnataka, Drugs control Department
buildings and the Government College of Pharmacy, while no expenditure is recorded for
2008-09 under other heads of expenditure viz. Drugs control laboratories at Hubli and
Bellary.
17.20 Presently the Drugs Control Administration is a separate Department under the
Secretariat Department of Family welfare. It is headed by a full time Drugs Controller as its
Administrative head, under whom are three wings viz. which (a) the Enforcement wing, (b)
the Drugs Testing Laboratory headed by a Superintendent (Administration), and (c)a College
of Pharmacy imparting education leading to Diploma, Degree, Post-graduation and Doctorate
in six different faculties. There is a need to support the Department of Drugs Control with

ERC Second Report 135
sufficient number of Drug testing facilities inline with the quantum of drugs supply
agencies and various health institutions in the State.
Department of AYUSH
17.21. Department of Indian Systems of Medicine and Homeopathy (ISM & H) was created
in March 1995 and renamed as Department of Ayurveda, Yoga & Naturopathy, Unani, Sidda
and Homeopathy (AYUSH) in November 2003, with a view to provide focussed attention to
development of Education and Research in AYUSH systems of medicine. The Department
continued to lay emphasis on upgradation of AYUSH educational standards, quality control
and standardization of drugs, improving the availability of medicinal plant material, research
and development and awareness generation about the efficacy of the systems domestically
and internationally. The Department had a budget of ` 43.43 crore and expenditure of `
21.88 crore for the year 2008-09. The Department is headed by the Director who is assisted
by Chief Administrative Officer and other Departmental Officers.
17.22 In the Department of AYUSH, there are 13 plan schemes, 9 schemes are State Plan
Schemes, 2 Schemes are 100% Centrally Sponsored Schemes (CSS) and other two schemes
are CSS sharing. The objectives of the department include:
1. To upgrade the educational standards in the Indian Systems of Medicines and
Homeopathy colleges in the country;
2. To Strengthen existing research institutions and ensure a time-bound research
programme on identified diseases for which these systems have an effective treatment;
3. To draw up schemes for promotion, cultivation and regeneration of medicinal plants
used in these systems;
4. To evolve Pharmacopoeia standards for Indian Systems of Medicine and Homeopathy.
17.23 Generally, about 70% of the total outpatients are for Ayurveda while the remaining go
for Yoga and Naturopathy, Unani, Sidda and Homeopathy. The organisation chart for the
Department is provided in Annexure-17f. Though there is consistent increase in Budget
allocation since 1996-97, on an average, about 90% of the allocation is being spent. 105.
In line with the objectives of the Department of AYUSH, and general popularity, there is a
need to have an integrated policy in pursuit of the objectives and if necessary, for such a
policy to complement the State Health Policy. The integrated policy needs to optimise the
cost advantages in some of the potentially beneficial treatments which otherwise are

ERC Second Report 136
costlier in the mainstream Health care system. Also, to strengthen existing research
institutions and ensure research programmes for identified diseases for which AYUSH
systems have an effective treatment, the state needs to encourage research in AYUSH,
particularly Ayurveda and strengthen technical certification in drugs which are normally
sold as over the counter drugs.
17.24 Further, the Department, having 659 dispensaries throughout the state, there is a need
to provide supportive infrastructure to make optimum use of these facilities. There is also
acute shortage of staff in the Department of AYUSH, particularly the supporting staff
including Group D. This vacancies position has to be reviewed within the overall policy
priorities and improvements required to be made in Infrastructure facilities.
17.25 Public Health Vs Medical Services Cadre: Presently there are no separate cadres for
public health and medical services. The preventive, promotive and curative functions of the
Department of Health need to be split between two directors i.e., Director- Medical (for
curative and clinical services) and Director- Public Health (Preventive and promotive
services) with required technical staff to support the Director from positions of Assistant
Director, Deputy Director to Joint Director. Such hierarchy has to be designed for
reasonable promotion opportunities and enable focused supervision on each of the areas.
It is recommended that two separate cadres may be constituted relating to Public Health
and Medical (clinical).
17.26 User Charges: The Government of Karnataka had issued orders in 1988 prescribing
user charges for an identified range of services. The order provided exemption to poor
patients, specifying that green cards under the Public Distribution System be the means to
check eligibility. It is observed that 85.67%, 28.33% and 36.62% of expenditure is collected
as user charges in Jayadeva Institute of Cardiology, Indira Gandhi Institute of Child Health
and Kidwai Institute of Oncology respectively. It is suggested that the Department needs to
have a principle driven formula for prescribing user charges, which should be reviewed
periodically by a team of experts who should also consider the market rates for the
services. Secondly these user charges should be collected from people with Above Poverty
Line (APL) Cards while exempting Below Poverty Line (BPL) families. Under the
Department of AYUSH, user charges are presently not levied, hence there is scope for
introducing user charges in this Department, for APL families.
ERC Second Report 137
In the Second Report of the Commission, now submitted, some over-arching
recommendations have been made for better appraisal and evaluation of schemes, and for
strengthening of the instruments of effective Legislative and Execution Control over
expenditure, including the emerging idea of Social Audit. Specific recommendations have
been made regarding the schemes and organisational structure of the departments in Social
Sectors and in Agriculture and Allied Sectors. The next report of the Commission would deal
with Infrastructure Sectors and selected developmental and regulatory Departments. The
Final Report of the Commission will contain recommendations regarding the remaining
subjects in the Terms of Reference relating to user charges, subsidies, Institutional
Mechanism for Service delivery and framework for performance and outcome monitoring.
The Commission recommends that the contents of its reports may be brought into public
domain with a view to generate enlightened public debate on these important issues in public
policy. The Commission wishes to thank the officers of various Departments of the
Government of Karnataka for their co-operation, but for which this report could not have
been prepared.
Sri. L.V. Nagarajan Sri Mohandas Pai
Member Member
Sri B.K. Bhattacharya
Chairman
Sri Sanjiv Kumar Sri G. Ramesh
Member Member
Place: Bangalore
Date :17-02-2011

Annexures

ERC Second Report 138
Annexure-1a
Terms of Reference of Expenditure Reforms Commission
The Hon’ble Chief Minister in his Budget Speech 2009-10 mentioned that the Government of
Karnataka would carry out review of Government expenditure in the state for various
programmes with a view to reduce expenditure on less effective programmes and effectively
mobilize resources to improve the efficiency of program implementation. Accordingly the
Expenditure Reforms Commission (ERC) was constituted vide Government Order No. FD 76
Samaya 2009 dated 6.6.2009. The Chairman assumed office on 22nd June, 2009, and the first
meeting of the Commission was held on 24th July 2009. The Commission has been functioning
from MSIL House at Cunningham Road, assisted by secretarial staff provided by the
Government of Karnataka, and with logistic and research support from the Fiscal Policy
Institute, Bangalore.
The Terms of Reference of the Commission:
(1) Review the efficacy of programmes/schemes of major departments, and make
recommendations for their restructuring and convergence to facilitate improvement in their
development effectiveness;
(2) Suggest a framework for performance and outcome monitoring of the development
schemes/programmes;
(3) Review the scope for consolidation of smaller schemes and expenditure items with
common/complementary objectives into a fewer number of viable programmes;
(4) Review the processes and institutional mechanisms of programme implementation and
service delivery to improve efficiency and cost effectiveness;
(5) Review the framework of all subsidies, both explicit and implicit, examine the economic
rationale for their continuance and make recommendations for making subsidies transparent
and suggest measures for maximizing their impact on the target population at minimum cost;
(6) Suggest an effective strategy for meeting a reasonable proportion of expenditure on services
through user charges;
(7) Suggest areas for adoption of new technologies including information technology for
effective implementation of programmes and delivery of services;
(8) Recommend measures for optimizing the staff strength of Government Departments,
attached offices and institutions, for skill upgradation of existing staff, and for redeployment of
programmes and delivery of services;
(9) Consider any other relevant issue concerning expenditure management in Government and
make suitable recommendations.
---

ERC Second Report 139
Annexure-1b
The List of Research Institutions / Consultants engaged by the Commission to
undertake department specific studies
Sl. No.
Research Institutions /Consultant
Study Subject Administrative Department
1. Centre for Policy and Budget Studies (CBPS)
(i) Review of Processes and Institutional mechanisms of Programme Implementation and Service Delivery (Study-1) and
(ii) Levy of User Charges for Providing Services by Selected Departments (Study-2)
2. Institute of Public Auditors of India (IPAI)
Review of Developmental Programmes and Organisation Structure of selected Government Departments.
i. Primary and Secondary Education
ii. Higher Education iii. Employment and Training, iv. Women and Child Development, v. Social Welfare vi. Minorities Welfare
3. Infrastructure Development Corporation of Karnataka (iDeCK)
Review of Developmental Programs and Organisation Structure of selected Infrastructure Departments.
vii. Public Works viii. Water Resources ix. Urban Development
4. Karnataka Institute of Public Auditors (KIPA)
5. Institute for Social & Economic Change (ISEC)
(i) Study on Frame-work for assessing Performance and Outcome monitoring of Schemes/Programmes (Study-1)
(ii) Study on Government Subsidies(Study-2)
(iii) Review of Developmental Programmes and schemes of Departments (Study-3)
i. Agriculture ii. Horticulture iii. Animal Husbandry &
Veterinary Sciences iv. Fisheries
(iv) Review of Developmental Programmes and schemes of Departments (Study-4)
i. Department of Co-operation
(v) Review of Developmental Programmes and schemes of Departments (Study-5)
ii. Department of Forest, Ecology and Environment
6. Karuna Trust Review of organisational structure, developmental programmes / schemes and implementation mechanisms
i. Department of Health & Family Welfare

ERC Second Report 140
Sl. No.
Research Institutions /Consultant
Study Subject Administrative Department
7. Public Affairs Centre (PAC)
Study of 3 schemes viz. i. Swarna Jayanti Shahari Rojgar
Yojana (SJSRY), ii. Urban Infrastructure Development
Scheme for Small and Medium Towns (UIDSSMT) and
iii. Mukhyamanthri Nagarothana Yojane (MNY).
i. Urban Development Department.
8. Abdul Nazir Sab State Institute of Rural Development (ANSSIRD)
Review of important Developmental Programmes / Schemes of Rural Development and Panchayat Raj Department [Both Centrally sponsored Flagship programmes and State Government Schemes] and a few other selected programmes implemented by Panchayat Raj Institutions
i. Rural Development and Panchayat Raj
9 National Law School of India University (NLSIU)
Study of certain aspects of the working of the Department concerned
i. Home (Police) ii. Law, Justice and Human Rights

ERC Second Report 141
Annexure-1c
1. Visit to Dharwad District on 25th and 26th May 2010
List of participants
ERC:
1. Shri. B.K. Bhattacharya, Chairman, ERC. 2. Shri P.R. Devi Prasad, Director, Fiscal Policy Institute. 3. Shri. R.S Phonde, Secretary, ERC. 4. Ms. Prathiksha Shetty, Consultant, ERC.
Departmental Officers:
1. Shri. Darpan Jain, Deputy Commissioner Dharwad. 2. Shri. C.Shikha, CEO, Dharwad, ZP. 3. Shri. Dr. Ajay Nagabhushan, M.D. HESCOM, Hubli. 4. Shir. P.S. Mallapur, Addl. D.C. Dharwad. 5. Shri. U.S. Naik, GM, HESCOM, Hubli. 6. Shri. U.S. Mirji, Deputy Director, Horticulture Dept. Dharwad. 7. Smt. Malati. S. Pol, D.D.W& CD Dharwad. 8. Shri.. Bhaskar V. Bhat, DDPI (Adm) Dharwad. 9. Shri. R.N. Shanbhag, Commissioner HDMC. 10. Dr. Vishal Hadahalli, Asst. Director (AH & VS). 11. Shri. Mahantesh Bilagi, A.C. Dharwad. 12. Shri. Ravindra Ritti, DDPU- Dharwad. 13. Shri. S.T.Patil, Director, WALMI, Dharwad. 14. Shri. H. Premnath, District Registrar, Dharwad. 15. Shri. S.S. Shettar, Executive Engineer, NH Division, Hubli. 16. Shri. M.B. Gudadappanavar, Executive Engineer, PWD, Dharwad. 17. Shri. G.A Wahi, Executive Engineer, MI, Dharwad. 18. Shri. S. Ganesh Naik, Joint director, Agricultural Department. 19. Shri. S.T. Ingale, Dy. Director, City Central Library, Dharwad. 20. Dr. S.M. Honakeri, DPMO/KHASDRP/NRHM 21. Shri. S.C. Tirlapur, DO, BCM, Dharwad. 22. Shri. Saberahmed Mulla, Dist. Social Welfare Officer. 23. Shri. N.P. Patil, Executive Engineer, PRED. 24. Shri. S.M.Dodanna, CPO, ZP Dharwad. 25. Shri.Nagashetti N.S, District. Statistical. Officer, Dharwad. 26. Dr. N.M. Angadi, DH & FWO, Dharwad 27. D.H.M. Ismail Khan, Executive Engineer, MRBC Dn, Byahatti. 28. Shri. K. Krishnamurthy, EE, KUWS & DB DN. Dharwad. 29. Shri. S.B. Siddanaik, EE, KUWS & DB O & M Division Dharwad. 30. Shri. L.C. Naik, Superintending Engineer, HDMC. 31. Shri. Divakar Shankinadasar, Supt. LBRC, Dept. of Social Welfare. 32. Shri. M.S. Faras, AEE, PWD Sub-division, Dharwad. 33. Shri. N. Sreenivas, ADA. CADA (MP) Navalgund.
Consultants:
1. Dr. Dr. H Sudarshan, Hon. Secretary, Karuna Trust, Bangalore 2. Shri. S.R. Varambally, President, KIPA, Bangalore

ERC Second Report 142
3. Shri Ramachandra, IPAI, Bangalore. 4. Dr. G.S. Ganesh Prasad, Assistant Professor, ANSSIRD Mysore. 5. Dr. G.B. Lokesh Assistant Professor, ISEC, Bangalore. 6. Dr. Elumalai Kannan, Associate professor, ISEC, Bangalore. 7. Shri. Guru, ISEC, Bangalore
2. Visit to Shimoga District on 27th and 28th May 2010 List of participants ERC:
1. Shri. B.K. Bhattacharya, Chairman, ERC. 2. Shri L.V Nagarajan, Principal Secretary to Government, Finance Department 1. Shri P.R. Devi Prasad, Director, Fiscal Policy Institute. 2. Shri R.S Phonde, Secretary, ERC 3. Ms. Prathiksha Shetty, Consultant, ERC.
Departmental Officers:
1. Shri. Pankaj Panday, Deputy Commissioner, Shimoga. 2. Shri. Hemachandra A.B. CEO, Shimoga. 3. Shri. M. B. Shankarappa, CPO, ZP Shimoga. 4. Shri. Praveen Kumar G.L. Asst. Commissioner, Sub Division Magistrate, Sagar 5. Dr. N.S. Basavaraja, Dy. Director, Animal Husbandry Veterinary Services. 6. Dr. H.N. Gopalakrishana, Project Director, DUDC, Shimoga. 7. Shri. B.Jayanna, Municipality Engineer, CMC, Shimoga. 8. Shri M.C. Gangadhara, Dy. Director Food & Civil Supplies. 9. Dr. Kumar Naik.G. , Asst. Commissioner of Commercial Taxes, Shimoga. 10. Shri. A.S. Jayappa, Asst. Registrar of Co-op Societies, Shimoga. 11. Shri. B.N. Channalli, General Manager, Shimoga BCC Board. 12. Shri. Y. Eranna, DOBCM. 13. Dr. A.S.Pushpa, District Ayush Officer Shimoga. 14. Shri. N. Munirajappa, Project Director, DRDA ZP, Shimoga. 15. Shri, Rajagopal, DSI. ZP. Shimoga. 16. Shri. Hanumanragaiah, D.S.Z. ZP, Shimoga. 17. Shri. L Subbarao, Lead Dist. Manager, Shimoga. 18. Shri. Anup. K.G., D.W.D.O. Shimoga. 19. Shri. P.P. Banerjee, D.C.F.S.F., Division, Shimoga. 20. Shri. S.L. Chavan, Deputy Director of Public Instruction, Shimoga. 21. Shri.G. Lohith, E.O. MDM ZP, Shimoga. 22. Shri. G.N. Eswara Murthy, I/C. DDPU, Shimoga. 23. Shri. Chandran Naik. W. DSWO, Shimoga. 24. Shri. Hari Kumar, Asst. Director, Kannada & Culture. 25. Shri. Chandrashekar, M., Asst. Director, Dept. Youth Services and Sports 26. Shri. N. Lokeshappa, Ex. Engineer, Irrigation Department. 27. Dr. S.T. Suresh, Deputy Manager, 28. Shri. D.M. Basavaraja, ADA (Sujala), DWDO, WDD, Shimoga. 29. Shri. Ranjinaika, Senior Geologist, Dept. of Mines & Geology (GWS) Shimoga. 30. Shri. J.A. Somashekar, T.A. to Ex. Engineer, PWD SPI. Division, Shimoga. 31. Shri. D.S. Nagaraj, JE, EE, PWD Dn. Shimoga. 32. Shri. G. R. Chandrashekarappa, EE.PRED, Sagar. 33. Shri. B.H. Yogesh, BE, MI Division, Shimoga. 34. Shri. P.A Bajantri, Ex. Engineer, PRED. Shimoga. 35. Dr. R. Thippeshi, District Surgeon, Shikaripura.

ERC Second Report 143
36. Shri. J. Krishna, D.C. of Excise Shimoga. 37. Dr. G.H. Channabasappa, D.H.O. Shimoga. 38. Shri. Agri, ADA (Sub) 39. Shri. M. Viswanath, Deputy Director of Horticulture. 40. Shri. Felixo Souze, A.R.T.O 41. Shri. T.S. Paravellina, 42. Shri. S. Ganesh, AEE, CMC, Shimoga. 43. Shri. Manu Kumar B.P Enul. Engg, CMC. Shimoga. 44. Shri. T. Venkateshappa, Dy. Director, Fisheries Shimoga. 45. Shri. T.K. Krishna Shetty, Dy. Director, K & V.I, Industries Department, ZP, Shimoga. 46. Shri. V. Vasudev, Dy. Director, Fisheries Shimoga. 47. Shri. K.T. Thipperudrappa, Sericulture Dy. Director, Shimoga. 48. Shri. D. Thippeswamy, Senior Asst. Director, Shimoga.
Consultants : 1. Shri. S.R. Varambally, President, KIPA, Bangalore. 2. Dr. Sathyanarayana, Chief Legal Counsel, iDeCK, Bangalore. 3. Shri. D. Venkateshwar, IPAI, Bangalore. 4. Shri. N.A. Ghouri, IPAI, Bangalore. 5. Dr. Govind Madhav, Karuna Trust, Bangalore. 6. Shri. Guru, ISEC, Bangalore.
3. Visit to Chamarajanagar District on 2nd and 3rd November 2010
List of participants
ERC:
1. Shri. B.K. Bhattacharya, Chairman, ERC. 2. Secretary to Government, Planning, Statistics, Science and Technology 3. Shri P.R. Devi Prasad, Director, Fiscal Policy Institute. 4. Shri. R.S Phonde, Secretary, ERC. 5. Shri Mandar Nayak, Consultant, ERC 6. Ms. Prathiksha Shetty, Consultant, ERC.
Departmental Officers: 1. Shri. K. Amaranarayana, Deputy Commissioner Chamarajanagar District.
2. Shri. K. Sundar Naik, Chief Executive Officer, ZP, Chamarajanagar.
3. Shri. B.M. Muniraju, President, ZP.
4. Shri. H.S. Channe Gowda, Chief Accounts Officer, Z.P. Chamarajanagar
5. Smt. Nagarathnamma, District Tribal Welfare Officer.
6. Smt. S. Prathibha District social Welfare Officer, Chamarajanagar
7. Shri. C.N. Visweswar, B.C & Minority Welfare officer, Chamarajanagar.
8. Shri. K.A. Rajendraprasad, DD (KUI), Chamarajanagar.
9. Shri. Gopalakrishna, D.D. Women & Child Development, Chamarajanagar.
10. Shri. B.H. Babasab, A D, Fisheries.
11. Shri. H.S. Mahadeva, Dist. Nodal Officer, Fisheries Department.
12. Shri. B.R. Girisha, Deputy Director of Horticulture, Chamarajanagar.
13. Dr. P. M. Prasad Murthy, Deputy Director animal Husbandry & Veterinary Services.
14. Shri. S.K. Laxman, District Watershed Development Officer, Chamarajanagar.

ERC Second Report 144
15. Shri. K.M. Shivakumaraswamy, Deputy Registrar of Co-Op. Society, Chamarajanagar.
16. Shri. B.M. Shivamallu, Joint Director of Agriculture, Chamarajanagar.
17. Shri. S.P. Raju, DFO, Social Forestry, Chamarajanagar.
18. Shri. M. Krishnaraju, Executive Officer, Taluk Panchayat, Chamarajanagar.
19. Shri. K.H. Prithviraj, Deputy Director of Sericulture, Chamarajanagar.
20. Dr. N. Ramesh Babu, DHO, Chamarajanagar.
21. Shri. B.A. Rajashekara, D.D.P.I, Chamarajanagar.
22. Shri. R.K. Raju, PRED, Chamarajanagar.
23. Shri. K.V.Rajanna, Commissioner for Persons with Disabilities Bangalore.
24. Shri. K.M. Narayana Swamy, DCF
25. Shri. Shivashankar Swamy, ACF Bandipur Tiger Reserve.
Consultants :
1. Shri. N.A. Ghouri, IPAI, Bangalore.
2. Shri. D.Venkateshwar, IPAI, Bangalore.
3. Dr. Manasi.S. ISEC, Bangalore.
4. Shri. Umesh Babu, ISEC, Bangalore.
5. Dr. Bibhu Prasad Nayak, ISEC, Bangalore.
6. Dr. G.B. Lokesh, Assistant Professor, ISEC, Bangalore.
7. Dr. Elumalai Kannan, Associate Professor, ISEC, Bangalore.
8. Dr. Smita V Pillai, Research Associate, Karuna Trust, Bangalore.
9. Dr. G.V. Nagaraj, Karuna Trust, Bangalore.
10. Dr. Jagannath, Research Assistant, Karuna Trust, Bangalore.
11.Shri. S.R. Varambally, KIPA, Bangalore.
12. Ms. Sriharini Narayanan, CBPS, Bangalore.
13. Shri. Madhusudhan Rao, CBPS, Bangalore.
14. Shri. Sandeep M.S, CBPS, Bangalore.
4. Visit to Bidar District on 9th and 10th November 2010
List of participants
ERC:
1. Shri. B.K. Bhattacharya, Chairman, ERC. 2. Principal Secretary to Government, Finance Department 3. Shri P.R. Devi Prasad, Director, Fiscal Policy Institute. 4. Shri. R.S Phonde, Secretary, ERC 5. Shri Mandar Nayak, Consultant, ERC 6. Ms. Prathiksha Shetty, Consultant, ERC.
Departmental Officers:
1. Shri. Jithendra Nayak, CEO, ZP, Bidar. 2. Ms. Khushboo Goel, AC, Bidar. 3. Shri. B.K. Hiremath, Deputy Secretary, ZP Bidar. 4. Smt. Siddamma Patil, Chief Planning Officer, ZP Bidar. 5. Shri. C.A. Salotagi, Chief Accounts Officer Zilla Panchayat, Bidar. 6. Dr. Nandakumar, Deputy Director, Jal Nirmal Project, ZP- DSU, Bidar. 7. Shri. B.C. Pujari, Project Director District Cell Urban Development Bidar.

ERC Second Report 145
8. Shri. B.S. Patil, Executive Officer, TP, Bidar. 9. Dr. Vijayakumar Kulkarni, Ayush Dept. District Nodal Officer, Bidar. 10. Shri. G. Shivashankarappa, Executive Engineer, PWD, Bidar. 11. Shri. M.I. Savadi, Deputy Diector KRIDL, Bidar. 12. Shri. K. Ranga Swamy, Municipal Commissioner, CMC – Bidar. 13. Shri. S.P. Mudhol, Commssioner, Bidar Urban Development Authority, Bidar. 14. Shri. M. V. Biradara, I/C. Executive Officer, Taluk Panchayat, Bhalki. 15. Shri. Ashoka.V, District Treasury Officer, Bidar. 16. Shri. Raju Dange, Executive Engineer, Zilla Panchayat Division, Bidar. 17. Dr. K. Mahadevaswamy, Deputy Director, Animal Husbandry and Veterinary Sciences, Bidar. 18. Shri. Sharanappa Mudgal, Jt. Director Agriculture, Agriculture Dept. Bidar. 19.Shri. Kishorakumara Dube, District Statistical Officer, Bidar. 20. Shri. J. Venkataramareddy Patil, District Watershed Development Officer, Bidar. 21. Shri. Vishwanath Zille, Deputy Director of Horticulture, Bidar. 22. Shri. Narayan Merli, District Manager Devaraj Urs Development Corporation, ZP. Bidar. 23. Shri. Y.G. Nagaral, Asst. Director, Fisheries Grade –I, Bidar. 24. Shri. Marturkar. T.S. Deputy Director, Food & Civil Supplies & CA Dept. Bidar. 25. Shri. N.A. Patil, Executive Engineer, PMGSY Project Director, Bidar. 26. Shri. Shreegangapathi, Deputy Director, Sericulture Department, Bidar. 27. Shri. Dharanesh, District Labour Officer, Bidar. 28. Shri. P. Daulath Hussain, Deputy Conservator of Forest, Social Forestry, Bidar. 29. Shri. S.G. Dhana Shetty, District Officer, Backward Classes & Minorities Welfare Department, Bidar. 30. Shri. S.M. Jyothi, District Social Welfare Officer, Bidar. 31. Shri. Khan Irshad, District Development Officer, Khadi & Village Industries Board (KVIB), Bidar. 32. Shri. G.M. Shedole, Asst. Director Small Savings, Bidar. 33. Shri. V. Doraiswamy, Deputy Director Women and Child Development Department, Bidar. 34. Shri. B.R. Pawar, District Disabled Welfare Officer, Bidar. 35. Shri. B. Rama Murthy, I/c. District Manager Karnataka Food & Civil Supplies Corp. Ltd., Bidar. 36. Dr. T.R. Dodde, Nodal Officer, Total Sanitation Campaign, District Support Unit, Z.P. Bidar. 37. Shri. K.G. Hanumanthappa, Education Officer, MMS, ZP, Bidar. 38. Shri. H.G. Gangannaswamy, Deputy Project Co- ordinator, SSA, Bidar. 39. Shri. Mohamed Basheer, Deputy Director Public Instructions, Bidar. 40. Dr. Satish Akhelikar, District Health Officer, Bidar 41. Shri. Maruthi Gokhale, Executive Engineer, Minor Irrigation Division, Bidar. 42. Shri. Shivakumar, District Manager, Ambedkar Development Corporation, Bidar. Consultants : 1. Dr. G.S. Ganesh Prasad, ANSSIRD, Mysore. 2. Shri. Sandeep. P. iDeCK, Bangalore. 3. Shri. Mathew Mani, Karuna Trust, Bangalore. 4. Shri. Raghavendra, ISEC, Bangalore. 5. Dr. Lokesh, ISEC, Bangalore. 6. Shri. Madhusudhan, CBPS, Bangalore. 7. Dr. Venugopal Reddy, PAC, Bangalore. 8. Shri. Ghouri, IPAI, Bangalore.

ERC Second Report 146
Annexure-1d
ERC’s First Report Recommendations and 2010-11 Budget Announcement
and Budget Estimates for 2011-12
Sl No. Recommendations of ERC 2010-11 Budget Announcement
1 Para No. 4.1.1 (vi):
Beginning with the year 2010-11, the Finance
Minister should make a statement on the floor
of the House once in six months, explaining the
progress of each project estimated to cost ` 50
crore and above; and The Karnataka Fiscal
Responsibility Act 2002 should be amended to
provide a mandatory impact analysis of all
projects /schemes / programmes with outlay of
` 50 crore and above.
Para 298 :
The progress of all government
works/projects of over ` 50 crore will
be reviewed every month by a High-
power Committee headed by the Chief
Secretary.
2 Para No. 4.2.1 (10) :
Standards for providing school infrastructure in
the form of tables, laboratories, toilet and
drinking water facilities, playground, library
need to be specified in terms of units for a
given number of students. The department
should plan to provide all such facilities to each
of the schools in a time frame of three years.
Para 109:
An amount of ` 100 crore will be given
as a fund for school development for
providing facilities of class rooms,
equipment, drinking water, and
sanitation to all government schools
and pre-university colleges in the state
during 2010-11. It is proposed to
provide drinking water and toilet
facilities in all government schools in
the districts and to entrust this task to
State’s Rural Infrastructure
Development Corporation.
3 Para No. 4.2.2 (2):
However, it is apparent that there is a large
number of young drop-outs (probably between
2 to 3 lakhs) who need to be brought under the
cover of systematic job-oriented training. The
KVTSDC should draw up a 5 year plan to
organize such training for young people in
sufficiently large numbers, starting with 1 lakh
trainees in 2010-11 and going up to 2 lakh by
the end of a 5 year period.
Para 160 :
About 8.40 lakhs students are getting
education upto 10th standard every year
in our State. Out of this, only1.88 lakh
are going for higher education, and the
remaining about 6.52 lakh have to try
for employment opportunities in
various fields. There is a need for well-
equipped training centres to train these
young boys and girls for jobs in the
industry and services sectors.

ERC Second Report 147
Sl No. Recommendations of ERC 2010-11 Budget Announcement
Para 161:
About 2 lakhs people every year are
being trained by 1233 Industrial
Training Institutes and other informal
training centres in our State. To double
this in the next three years, it is
proposed establish about 1000
Industrial Training Institutes more in the
private sector.
4 Para No. 4.2.3 (2):
There are 37 Schemes relating to management
and maintenance of hostels and hostel
buildings. Considering the poor maintenance of
hostels and hostel infrastructure, the
management of all government hostels needs
to be rationalised and entrusted to a specialised
agency, which can address the issues of hostel
infrastructure, ensure quality of maintenance
and upgrade the skills sets of the human
resources required for the hostels. All
government departments running hostels can
source the services of such an Agency, which
can provide facility management support of
superior quality.
Para 207:
At present, separate hostels are being
run for Schedules Castes, Scheduled
Tribes, Backward Classes and
minorities, with limited scope of
admission for other categories. It is
proposed to make this system more
comprehensive at district level for
students from all categories and classes
by establishing new Model Hostels. An
amount of ` 20 crore is being provided
for starting such model hostels in 10
districts. It is expected that from the
student life itself young men and
women will develop the feeling of
equality.
Para No. 4.2.3 (3):
Hostels so managed should be open to eligible
students of all categories of social groups viz.,
SCs, STs and BCs as per the entitlements. In
other words, student population in the hostel
should be more of mixed groups. Such mixed
social groups also need to be ensured in girls’
hostels.
5 Para No. 4.2.4 (5):
Project Management Consultant (PMC) be
Para 182:
Panel of approved architects would be

ERC Second Report 148
Sl No. Recommendations of ERC 2010-11 Budget Announcement
attached to every project above a threshold
limit (say, `10 crore) in order to ensure that
DPR is prepared as per standards and to
support the department during the project
execution stage.
utilized for preparation of designs and
supervision of construction works in
every Public Works Zone, in respect of
all buildings with estimated cost of
more than ` 10 crore.
6 Para No. 4.2.4 (11):
Numerical identification/numbering of roads
should be extended to district and Zilla
panchayat roads in line with numeric
identification used in National Highways. Such
numbers have to be brought into public
domain, and these projects should be used
while identifying for repairing and
strengthening of roads.
Para 178:
An amount of ` 7.37 crore has been
provided under State Plan and Non-plan
budget for up-gradation of Major
District Roads. Distinct numbers will be
assigned to all roads so as to enable
systematized maintenance of roads in
the State. A detailed Plan will be
prepared for taking up resurfacing and
renewal works once every 5 years in
respect of all Major Roads. This would
facilitate maintenance of the roads as
per the time-schedule.
7 Para No. 4.2.4 (15)
PWD should prepare type designs and standard
estimates for buildings for schools, colleges,
hostels, taluk offices, courts, primary health
centres, etc., to minimize time taken for
preparation of plans and estimates and to
achieve economy in construction.
Para 181:
Model designs, plans and estimates for
construction of various departmental
buildings based on the needs of every
department will be prepared to avoid
delay in construction of buildings, as
also to economise on expenditure.
Para 297:
There is a need to observe economy in
implementation of various programmes
being taken up by different government
departments. therefore, expert opinion
will be obtained for modifying the
schedule of rates scientifically in all
works departments, so as to design,
estimate and implement various

ERC Second Report 149
Sl No. Recommendations of ERC 2010-11 Budget Announcement
projects in the most cost-effective way.
8 Para No. 4.2.5 (9):
The Department of Horticulture is planning to
set up markets for Agricultural / Horticultural
produce in the PPP mode under the National
Horticultural Mission. It is suggested that the
private partners in such ventures may be
selected in a transparent manner and viability
gap (subsidy) element can be decided after
following a competitive bidding process.
Para 43:
Of about 400 horticulture farms under
the Department of Horticulture, steps
are being taken up to develop 19 farms
in partnership with the private sector.
During this year 100 more farms will be
developed as nurseries and market
centres with private partnership.
9 Para No. 4.1.1(i):
In all the departments, Plan Schemes with
provision of less than ` 100 lakhs should be
abolished.
In the Official Memorandum No. FD 14
BPE 2010 Bangalore dated 15-10-2010
vide which Budget Estimates for 2011-
12 have been invited, it is mentioned
that the budget estimating officers have
to undertake a review of all the
schemes coming under their control
and arrange to merge the Non-Plan and
State Plan schemes with similar
objective into one scheme. No line
item with a provision of less than ` 100
lakhs, will normally be allowed in the
Budget Estimates of 2011-12.
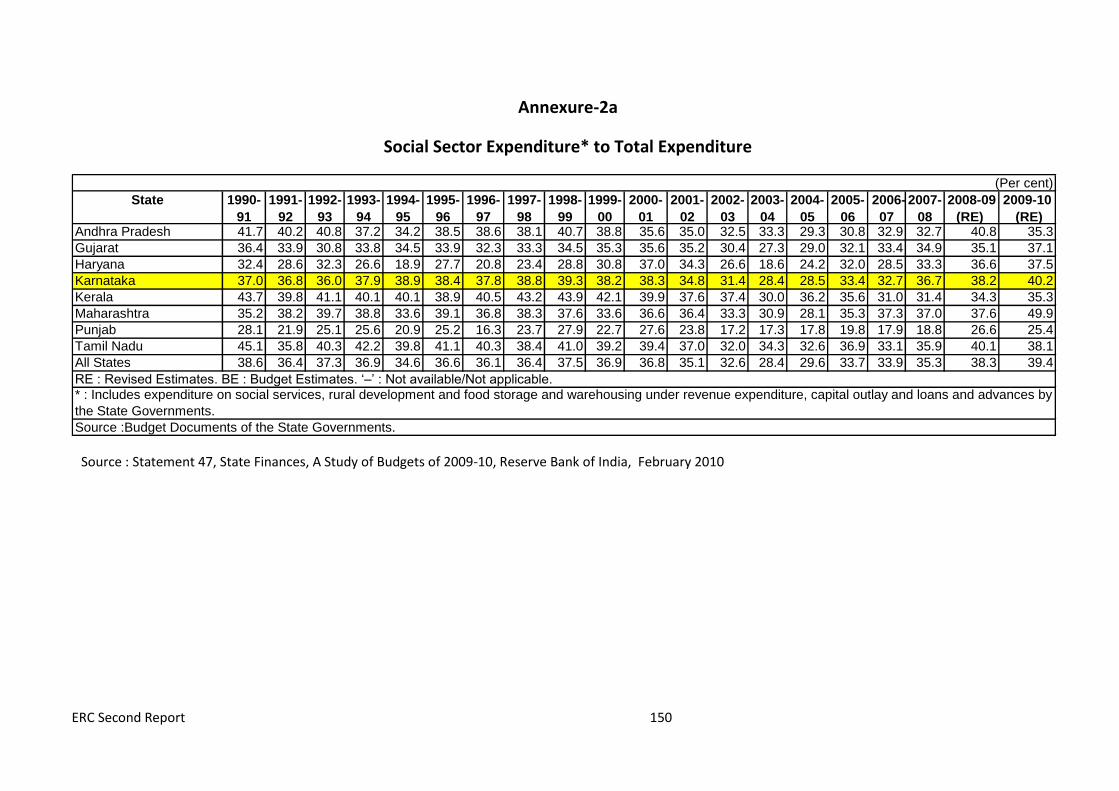
ERC Second Report 150
Annexure-2a
Social Sector Expenditure* to Total Expenditure
State 1990-
91
1991-
92
1992-
93
1993-
94
1994-
95
1995-
96
1996-
97
1997-
98
1998-
99
1999-
00
2000-
01
2001-
02
2002-
03
2003-
04
2004-
05
2005-
06
2006-
07
2007-
08
2008-09
(RE)
2009-10
(RE)Andhra Pradesh 41.7 40.2 40.8 37.2 34.2 38.5 38.6 38.1 40.7 38.8 35.6 35.0 32.5 33.3 29.3 30.8 32.9 32.7 40.8 35.3
Gujarat 36.4 33.9 30.8 33.8 34.5 33.9 32.3 33.3 34.5 35.3 35.6 35.2 30.4 27.3 29.0 32.1 33.4 34.9 35.1 37.1
Haryana 32.4 28.6 32.3 26.6 18.9 27.7 20.8 23.4 28.8 30.8 37.0 34.3 26.6 18.6 24.2 32.0 28.5 33.3 36.6 37.5
Karnataka 37.0 36.8 36.0 37.9 38.9 38.4 37.8 38.8 39.3 38.2 38.3 34.8 31.4 28.4 28.5 33.4 32.7 36.7 38.2 40.2
Kerala 43.7 39.8 41.1 40.1 40.1 38.9 40.5 43.2 43.9 42.1 39.9 37.6 37.4 30.0 36.2 35.6 31.0 31.4 34.3 35.3
Maharashtra 35.2 38.2 39.7 38.8 33.6 39.1 36.8 38.3 37.6 33.6 36.6 36.4 33.3 30.9 28.1 35.3 37.3 37.0 37.6 49.9
Punjab 28.1 21.9 25.1 25.6 20.9 25.2 16.3 23.7 27.9 22.7 27.6 23.8 17.2 17.3 17.8 19.8 17.9 18.8 26.6 25.4
Tamil Nadu 45.1 35.8 40.3 42.2 39.8 41.1 40.3 38.4 41.0 39.2 39.4 37.0 32.0 34.3 32.6 36.9 33.1 35.9 40.1 38.1
All States 38.6 36.4 37.3 36.9 34.6 36.6 36.1 36.4 37.5 36.9 36.8 35.1 32.6 28.4 29.6 33.7 33.9 35.3 38.3 39.4
* : Includes expenditure on social services, rural development and food storage and warehousing under revenue expenditure, capital outlay and loans and advances by
the State Governments.
Source :Budget Documents of the State Governments.
(Per cent)
RE : Revised Estimates. BE : Budget Estimates. ‘–’ : Not available/Not applicable.
Source : Statement 47, State Finances, A Study of Budgets of 2009-10, Reserve Bank of India, February 2010

ERC Second Report 151
Annexure-2b
Actual and Estimated (Potential) Life Expectancy for Districts in Karnataka,
Ranks of Districts and Increase in LEXP in 1991-2004
Districts
Actual LEXP
Potential LEXP
Actual as percent
Ranks of districts according
percent increase
in Actual LEXP
-2004
-2004
of Potential
(2004)
to Realization of Potential LEXP
in 1991-2004
1991 2004
Bagalkot 60.8 70.03 86.82 19 25 3.05
Bangalore Rural 66.5 72.83 91.31 9 12 3.26
Bangalore Urban 67.3 76.44 88.04 24 22 3.86
Belgaum 67.7 75.99 89.09 21 20 5.12
Bellary 66.1 71.63 92.28 13 9 5.25
Bidar 63.3 68.62 92.25 8 10 3.77
Bijapur 62.6 69.99 89.44 16 18 5.74
Chamrajnagar 63.5 67.68 93.82 5 6 1.6
Chikmangalore 63.2 69.32 91.17 17 13 5.16
Chitradurga 64.6 72.5 89.1 14 19 2.87
Dakshina Kannada 67.4 68.17 98.87 2 1 2.12
Davangere 65.8 72.37 90.92 12 14 4.44
Dharwad 61.9 65.91 93.92 10 5 4.74
Gadag 62.7 66.83 93.82 7 7 4.5
Gulbarga 62.9 74.58 84.34 27 27 5.71
Hassan 65.2 72.28 90.2 26 15 9.58
Haveri 62.2 69.43 89.59 18 17 4.36
Kodagu 63.3 65.2 97.09 3 3 3.77
Kolar 64.2 74.05 86.7 25 26 3.55
Koppal 63.5 68.55 92.63 6 8 5.83
Mandya 62.9 71.96 87.41 23 24 3.28
Mysore 64.8 73.64 88 20 23 3.02
Raichur 63.9 69.42 92.05 11 11 5.79
Shimoga 67.4 70.22 95.98 4 4 2.43
Tumkur 65.3 74.02 88.22 22 21 3.65
Udupi 67.8 68.82 98.52 1 2 2.57
Uttar Kannada 62.9 69.9 89.99 15 16 3.28
Source: Brijesh C Purohit, 2010, Efficiency Variation at the sub-State level: The healthcare system in Karnataka

ERC Second Report 152

ERC Second Report 153
Child Mortality Rate (CMR) in Karnataka 2001
Sl.No State/District 1991 2001
T M F M F T
1 Belgaum 70 69 72 63 59 65
2 Bagalkot - - - 76 71 80
3 Bijapur 85 81 90 70 68 74
4 Gulbarga 86 82 90 68 69 76
5 Bidar 66 66 55 52 50 55
6 Raichur 81 77 85 67 66 73
7 Koppal - - - 85 86 90
8 Gadag - - - 76 69 80
9 Dharwad 96 94 98 60 57 73
10 Uttara Kannada 67 68 66 46 42 47
11 Haveri 119 118 120 70 68 74
12 Bellary - - - 89 89 98
13 Chitradurga 105 102 108 76 74 79
14 Davanagere - - - 70 75 72
15 Shimoga 90 96 85 53 47 54
16 Udupi - - - 27 25 27
17 Chikmagalor 79 71 90 58 58 60
18 Tumkur 102 99 105 74 68 75
19 Kolar 85 95 83 65 60 69
20 Bangalore 58 60 67 41 40 50
21 Bangalore Rural 67 66 69 60 56 61
22 Mandya 74 74 74 69 65 70
23 Hassan 79 82 77 53 47 53
24 Dakshina Kannada 49 46 51 35 35 36
25 Kodagu 68 74 61 43 36 40
26 Mysore 91 91 88 71 63 78
27 Chamarajanagar - - - 74 69 76 Source: Census document

ERC Second Report 154
Educational Attainment in the State (in percent) Census 2001
Sl. No District
Below Primary Primary Middle
Matric/Higher secondary/ Diploma
Graduate and above
1 Bagalkot 32.01 29.01 9.29 22.13 5.46
2 Bangalore Rural 23.52 29.26 16.59 24.22 3.97
3 Bangalore Urban 13.92 20.76 12.37 36.28 15.4
4 Belgaum 29.3 29.57 10.13 24.08 5.48
5 Bellary 32.38 28.13 11.05 20.34 5.94
6 Bidar 25.74 29.05 9.96 25.6 6.05
7 Bijapur 31.89 27.79 9.35 22.3 6.49
8 Chamarajanagar 25.97 30.89 15.2 20.56 4.39
9 Chikkamagalur 24.17 30.05 14.4 24.22 5.37
10 Chikkaballapura NA NA NA NA NA
11 Chitradurga 26.94 28.21 12.76 24.85 5.37
12 Dakshina Kannada 24.35 34.74 11.31 22.33 6.75
13 Davanagere 26.53 27.73 13 24.8 5.98
14 Dharwad 26.75 27.24 9.39 26.46 8.76
15 Gadag 32.76 28.28 9.73 22.19 5.32
16 Gulbarga 30.63 26.62 9.53 23.94 6.02
17 Hassan 22.8 30.04 17.92 22.91 4.99
18 Haveri 36.72 29.87 9.04 18.44 4.18
19 Kodagu 22.26 29.32 16.53 24.11 6.61
20 Kolar 23.84 29.28 16.19 24.06 4.74
21 Koppal 40.47 26.26 8.54 17.45 3.89
22 Mandya 20.96 30.12 17.97 24.2 4.84
23 Mysore 20.81 28.5 14.8 25.38 8.91
24 Raichur 36.21 26.27 8.59 19.88 4.8
25 Ramnagar NA NA NA NA NA
26 Shimoga 25.22 28.79 13.6 24.61 6.61
27 Tumkur 23.18 29.03 16.18 24.67 5.19
28 Udupi 25.6 33.81 11.63 22.01 6.29
29 Uttar Kannada 33.97 27.3 11.24 20.49 5.84
Karnataka 25.2 27.8 12.52 25.28 7.34 Source: Census 2001 (District wise basic data sheet)

ERC Second Report 155
Educational status and progress of the district in 2007-08
Source: Government of Karnataka, Department of Public Instructions, Statistics on School Education, Hand Book 2007-08

ERC Second Report 156
Literacy Rate
Sl. No.
District Total literacy rate Male literacy rate Female literacy rate
1991 2001 1991 2001 1991 2001
1 Bagalkot 53.58 57.3 68.78 70.88 38.19 43.56
2 Bangalore Rural 50.17 64.7 61.51 73.99 38.15 54.99
3 Bangalore Urban 76.27 82.96 82.94 87.92 68.81 77.48
4 Belgaum 53 64.21 66.65 75.7 38.69 52.32
5 Bellary 45.89 57.4 59.11 69.2 32.24 45.28
6 Bidar 45.11 60.94 58.97 72.46 30.53 48.81
7 Bijapur 56.55 57.01 70.5 69.94 41.81 43.47
8 Chamarajanagar 38.19 50.87 47.31 59.03 28.6 42.48
9 Chikmagalur 61.05 72.2 70.56 80.29 51.31 64.01
10 Chitradurga 52.28 64.45 64.5 74.66 39.38 53.78
11 Dakshin Kannada 76.74 83.35 84.88 89.7 68.84 77.21
12 Davangere 55.96 67.43 66.82 76.37 44.41 58.04
13 Dharwad 62.73 71.61 74.22 80.82 50.41 61.92
14 Gadag 55.88 66.11 71.63 79.32 39.68 52.52
15 Gulbarga 38.54 50.01 52.08 61.77 24.49 37.9
16 Hassan 56.85 68.63 68.87 78.37 44.9 59
17 Haveri 56.1 67.79 68.05 77.61 43.28 57.37
18 Kodagu 68.35 77.99 75.35 83.7 61.22 72.26
19 Kolar 50.45 62.84 62.69 73.17 37.75 52.23
20 Koppal 38.23 54.1 53.47 68.43 22.78 39.61
21 Mandya 48.15 61.05 59.18 70.5 36.7 51.53
22 Mysore 50.88 63.48 59.71 70.88 41.6 55.81
23 Raichur 34.34 48.81 46.75 61.52 21.7 35.93
24 Shimoga 63.9 74.52 73.12 82.01 54.33 66.88
25 Tumkur 54.48 67.01 66.49 76.78 41.93 56.94
26 Udupi 74.47 81.25 83.58 88.23 66.64 75.19
27 Uttara Kannada 66.73 76.6 76.39 84.53 56.77 68.47
Karnataka 56.04 66.64 67.26 76.1 44.34 56.87 Source: Census documents

ERC Second Report 157
Annexure-2c
Expenditure on Wages and Salaries
State 1990-91 1991-92 1992-93 1993-94 1994-95 1995-96 1996-97 1997-98 1998-99 1999-00 2000-01 2001-02 2002-03 2003-04 2004- 05 2005-06 2006-07 2007-08 2008-09 (RE) 2009-10 (BE)Andhra Pradesh 2,048 2,470 2,732 3,083 3,622 3,773 4,219 4,768 5,936 6,668 7,978 8,165 8,103 8,718 8,825 10,269 11,932 13,243 16,238 19,900
(37.2) (38.3) (38.0) (38.5) (38.1) (35.5) (29.3) (32.8) (35.0) (37.0) 34.6% 33.0% 31.1% 29.2% 28.2% 29.4% 28.8% 24.5% 24.0% 26.0%
Gujarat 636 765 890 917 1049 1299 1345 1547 2124 2116 2229 2310 2460 2548 2567 2709 2801 – – –
(15.6) (14.6) (14.3) (13.2) (13.9) (14.8) (13.1) (12.7) (13.6) (12.1) 10.1% 10.2% 11.5% 11.6% 10.6% 10.6% 9.6%
Karnataka* 1,289 1,431 1,657 1,941 2,213 2,481 2,871 3,365 3,810 4,576 4,630 5,030 4,941 5,323 5,530 5,899 6,545 8,410 11,413 11,305
(32.5) (28.9) (29.6) (31.3) (30.5) (29.2) (28.1) (30.9) (30.6) (30.0) 27.7% 27.0% 26.3% 25.0% 22.2% 21.0% 19.6% 22.5% 27.1% 23.9%
Kerala 1,683 1,384 1,419 1,836 2,194 2,230 2,617 2,842 3,298 4,566 4,561 4,263 4,745 5,136 5,417 5,677 6,663 7,792 9,325 10,307
(59.6) (43.0) (38.8) (42.8) (43.3) (38.3) (38.5) (34.5) (35.7) (39.5) 38.4% 36.6% 32.2% 33.1% 31.6% 30.8% 32.0% 31.3% 32.4% 33.1%
Maharashtra 3,848 4,908 5,548 6,216 6,837 7,899 8,890 10,074 11,125 16,089 18,188 18,475 18,499 19,627 20,678 22,816 24,222 27,561 32,118 41,293
(44.0) (48.8) (48.0) (47.4) (46.2) (46.0) (42.6) (44.0) (43.4) (54.5) 48.6% 48.3% 45.7% 46.0% 40.5% 43.6% 39.5% 42.5% 40.9% 42.9%
Tamil Nadu 2,350 2,530 2,869 3,235 3,603 4,136 4,818 5,559 7,469 8,295 8,251 8,262 7,981 7,966 8,507 8,980 10,695 12,158 17,556 20,858
(41.6) (29.1) (33.6) (36.9) (37.4) (37.9) (36.9) (37.2) (42.2) (40.0) 37.9% 38.3% 31.1% 31.5% 29.2% 28.1% 27.9% 28.3% 31.7% 35.2%
All States 18,515 23,042 26,234 29,431 33,317 37,673 45,746 58,282 71,234 86,285 94,507 93,009 94,717 98,741 1,03,924 1,04,158 1,16,431 1,16,983 1,51,272 1,92,568
(37.3) (35.2) (35.5) (35.6) (34.3) (34.4) (33.3) (34.4) (35.6) (36.4) 39.1% 36.3% 35.1% 32.0% 31.1% 29.1% 27.5% 28.4% 29.3% 32.6%
Source : Information received from respective State Governments.
(Amount in Rs. crore)
BE : Budget Estimates. RE : Revised Estimates. ‘–’ : Not available/Not applicable.
$ : Figures since 2001-02 relate to bifurcated Bihar. * : Relates to salary expenditure.
Note : Figures in % are percentage to total revenue expenditure of the respective State Governments.
Source : Statement 44, State Finances, A Study of Budgets of 2009-10, Reserve Bank of India, February 2010
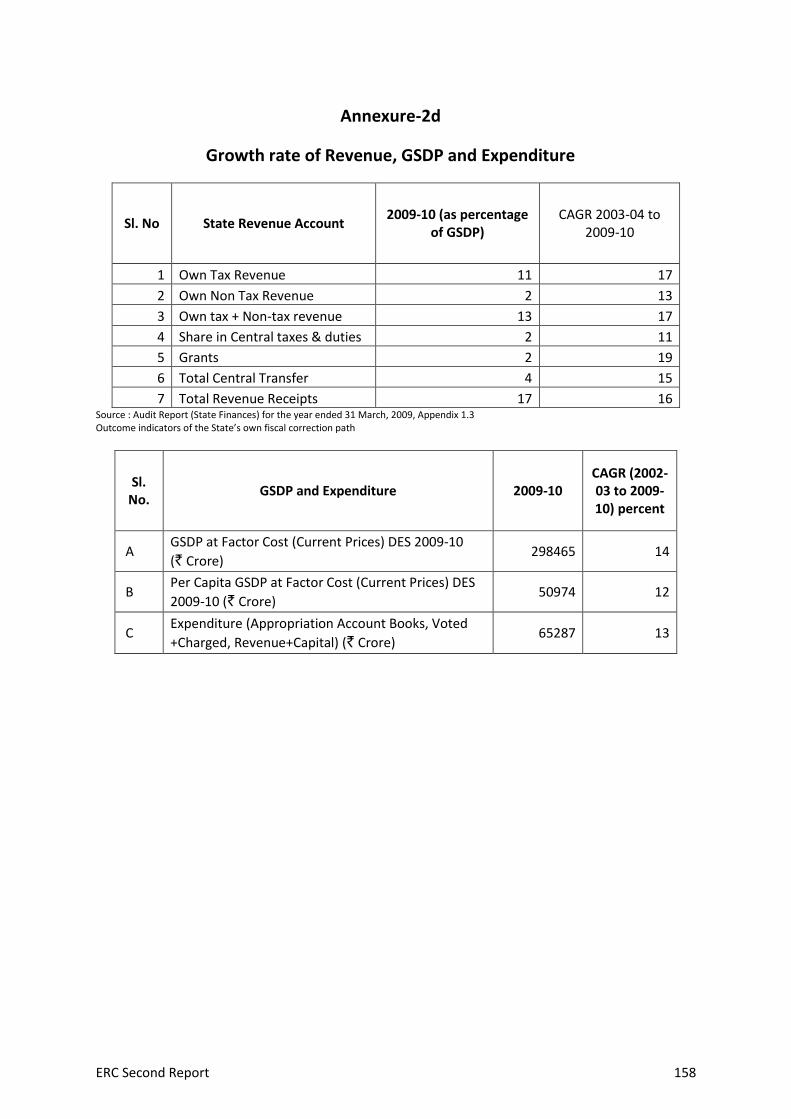
ERC Second Report 158
Annexure-2d
Growth rate of Revenue, GSDP and Expenditure
Sl. No State Revenue Account 2009-10 (as percentage
of GSDP) CAGR 2003-04 to
2009-10
1 Own Tax Revenue 11 17
2 Own Non Tax Revenue 2 13
3 Own tax + Non-tax revenue 13 17
4 Share in Central taxes & duties 2 11
5 Grants 2 19
6 Total Central Transfer 4 15
7 Total Revenue Receipts 17 16 Source : Audit Report (State Finances) for the year ended 31 March, 2009, Appendix 1.3 Outcome indicators of the State’s own fiscal correction path
Sl. No.
GSDP and Expenditure 2009-10 CAGR (2002-03 to 2009-10) percent
A GSDP at Factor Cost (Current Prices) DES 2009-10
(` Crore) 298465 14
B Per Capita GSDP at Factor Cost (Current Prices) DES
2009-10 (` Crore) 50974 12
C Expenditure (Appropriation Account Books, Voted
+Charged, Revenue+Capital) (` Crore) 65287 13

ERC Second Report 159
Annexure-2e
Source : Financing Human Development in Kerala: Issues and Challenges, National Institute of Public Finance and
Policy, New Delhi, January 2010.
Source : Financing Human Development in Kerala: Issues and Challenges, National Institute of Public Finance and
Policy, New Delhi, January 2010.

ERC Second Report 160
Source : Financing Human Development in Kerala: Issues and Challenges, National Institute of Public Finance and
Policy, New Delhi, January 2010.

ERC Second Report 161
Annexure-2f
Source : National Human Development Report, 2001, Planning Commission, Government of India.

ERC Second Report 162
Annexure-3a
Comparative Institutional Arrangement for Approvals in Government of India and Government of Karnataka
Institutional
Arrangement
Government of India Government of Karnataka
Department
Committees
Standing Finance Committee of
Department chaired by Department
Secretary with
Financial Advisor,
Joint Secretary/Director of the concerned division
(For Schemes above 5 crores but less than ` 25 crores
requiring modifications as suggested by Planning
commission or as proposed by administrative
Department or for merged Schemes with modifications)
Committee Headed by Principal Secretary/
Secretary of Administrative Department
with
Concerned Nodal officers of Planning Department and Finance Department
(For Ongoing Plan Schemes which do not require any
modification;
For Ongoing Plan Schemes which require modification such
as additional components including creation of posts and
purchase of vehicles)
Departmental Expenditure Finance
Committee with
Department Secretary (Chairman)
Financial Adviser (Member secretary), and
Representatives of Planning Commission and Dept of Expenditure as members
(For Schemes above `25 crores but less than ` 100
crores requiring modifications as suggested by Planning
commission or as proposed by administrative
Department or for merged Schemes with modifications)
Approval
Committees
Main Expenditure Finance Committee
(EFC)
• Secretary- Expenditure (Chairman) • Secretary (planning commission) • Department Secretary • Financial Adviser (Secretary of the EFC)
(For Schemes above `100 crore but less than ` 200
crore requiring modifications as suggested by Planning
commission or as proposed by administrative
Department or for merged Schemes with modifications)
Empowered Committee
ACS & Development Commissioner
PS of Administrative Dept
PS – Finance Department
PS – Planning, Prog Monitoring and Statistics Department
PS – DPAR (AR)
Concerned Heads of Department Ongoing Plan Schemes which require modification not
involving creation of posts and purchase of vehicles by third
week of April;
For New Plan Schemes by fourth week of April

ERC Second Report 163
Institutional
Arrangement
Government of India Government of Karnataka
Public Investment Board (PIB)
• Secretary- Expenditure (Chairman)
(For Schemes beyond `200 crores requiring
modifications as suggested by Planning commission or as
proposed by administrative Department or for merged
Schemes with modifications)
Cabinet
Approval
Cabinet Committee on Economic Affairs
(CCEA)
Approval for New Projects above ` 50 Cr and less than
` 100 Cr
Cabinet
For New Plan Schemes requiring creation of posts or
purchase of vehicles
For New Plan Schemes more than ` 5 Cr.
Source
Government of Karnataka :
Sanction of Ongoing Plan and Non Plan schemes, Government Order No. PD5 IMM 2010 Bangalore dated The 3rd April 2010
Central Government :
1. EFC Fresh appraisal by SFC/EFC for continuation of on-going schemes from 9th Plan to 10 plan
OM – F.No.1(3)-PF II/2001 Government of India, Department of Expenditure (Plan Finance-II Division dated 10.07.2002)
2. For Schemes/projects involving setting up new autonomous Organizations, EFC will be chaired by Secretary (Expenditure) irrespective of
outlays or nature of ministry/department;
3. Specific approval of Department of expenditure for creation of new posts will be necessary;
4. For Schemes with no major change in content or parameters, no change in pattern of assistance, requirement of funds within outlay
approved by planning commission, fresh consideration by EFC not required.

ERC Second Report 164
Annexure-3b
Institutionalizing the Project Appraisal Process
Objectives:
The Project Formulation and Appraisal Division (PAD) shall be created in the Planning
Department, with a view to assisting the State Government in taking investment decisions in
a manner which would ensure optimal utilization of scarce resources and accrual of
benefits commensurate with investments. PAD will, therefore, examine different
investment alternatives and funding options before these are cleared for funding and
implementation so that their successful and timely completion is assured and the society
derives the desired benefits.
Functions:
The major proposed functions that may be assigned to the PAD are:
1. To provide assistance to various development departments in the formulation of
projects on scientific basis.
2. To carry out ex-ante appraisal of the projects from technical, financial, commercial,
economic and social points of view to justify their worth to the society.
3. To scrutinize projects in the context of sectoral programs and overall requirements of
the plan.
4. To motivate different development departments to adopt “shelf of projects”
approach, to prioritize projects depending upon availability of funds and demand-
supply gap.
5. To carry out basic economic studies for various sectors referred to it by the State
Government.
6. To perform the role of Secretariat and technical wing of the EFC by undertaking
objective appraisal of investment proposals submitted before it.
7. To review all such projects which have not been taken up for execution even after six
months from approval of the EFC.
The PAD shall act as the Secretariat of EFC and shall appraise projects for its
consideration. The recommendations of EFC shall be submitted to the State
Cabinet by the concerned Department for final decision.
Investment proposals of the following
magnitude and description should come within the purview of the EFC:

ERC Second Report 165
Organization:
The PAD’s structure could be as below:
Director 1
Joint Director 1
Senior Research Officer 2
Research Officer 4
Research/Statistical Assistant 6
The Director and joint Director, in addition to administrative work, shall guide the staff of
PAD in conducting appraisal and various studies. One of these should be an engineer and
the other an Economist, both having extensive experience in project appraisal.
Similarly, one Senior Research officer and two Research officers should be Engineers and
another similar set should consist of Economists with each incumbent having some
experience in Project appraisal. The Research Assistant shall assist the officers in day to
day work. Two each of these should have the background of engineering, economics and
statistics.
The posts may be filled in a phased manner depending on the workload.
The officials of PAD and the appraising officers of line ministries would be trained by FPI
Project.
Source : Volume V, Project Appraisal Practitioners’ Guide, USAID.

ERC Second Report 166
Annexure-3c
Suggested Generic Reporting Template
Theme Report Heads Brief Explanation
A. Context and Background
· Description, Priority,
· Strategy, Policy
Framework
· Medium to Long term
scale of impact
Need for the Project (market failure,
development need, economic efficiency
etc.)
Need for intervention (Need based or
based on policy objectives)
Development Objectives with
deliverable outputs and outcomes
based on research.
B. Option Analysis · Economic Analysis
· Cost Benefit Analysis
· Financial Analysis
Sensitivity Analysis
· Scenario Analysis
· Risk Analysis
Economic gains with strategies and
rationale for choosing the best strategy
with reasons;
Cost (Fixed, variable, opportunity costs)
and Benefits (real or estimated market
prices) of each option;
Cash flows, Net Present Value
Changes in underlying assumptions
(prices, Discount rates, wages, inflation
etc)
Unforeseen Changes in Political, socio-
economic scenarios etc.
Enumeration of associated risks with
their impact on the outcomes.
C. Project Analysis · Means of Finance and
Project Budget
Options for Cost Sharing, Cost recovery
(User Charges)

ERC Second Report 167
Theme Report Heads Brief Explanation
· Investment Schedule
· Time Frame
· Success Criteria
· Training Schedule
Cash flow from Investments (including
owners, private, donors, beneficiaries
etc.)
CPM/PERT chart
Measurable outputs, Base-line research
data, Achievement goals
Training needs, timetable for achieving
training goals
D. Project Impact
Analysis
· Commercial and
partnering arrangements
· Management of contracts
· Legal Framework
· Regulatory Impact
· Legislation
· Technology
· Right to Information
· Agency Responsibilities, Organization
structure etc.
· Procurement Schedule/Timetable
· Impact on businesses, NGOs etc.
· Human rights, fundamental rights etc.
· Choices, options etc.
· Dissemination of Project Information
E. Beneficiary
Analysis
· Target beneficiaries
(Regional/Local)
· Sustainability
· Distributive (Stake holders
analysis
· Stakeholders, Cost Sharing options,
beneficiary participation, Impact on
weaker sections;
· Stakeholder commitment,
Operation, maintenance of assets
after project completion
· Distribution of externalities among
stakeholders and their Budget Impact
· Cost and quality of goods and
services delivered by the project

ERC Second Report 168
Theme Report Heads Brief Explanation
· Consumer focus
F. Environment,
Health and Safety
· Environmental impact
assessment
· Gender Impact
· Health/Poverty Impact
· Safety
· Air and water quality
· Land use, noise pollution, water
production, recycling and disposal
· Land acquisition, diversion of forest
land,
· Rehabilitation and resettlement
· Measures to mitigate adverse impact,
· Impact on women with quantifiable
deliverables for women development
· Impact of Poverty, deprivation and
unemployment
· Impact of poor housing, workplace
conditions
· Safety of people at work
G. Evaluation
arrangements
· Lessons from past projects
· Evaluation arrangements
for Concurrent, mid-term
and post-project impact
assessment.
· Lessons from historic (actual or
estimated) data - learnt,
communicated and applied.
· Audit Schedule

ERC Second Report 169
Annexure – 4a
ERC Second Report 170

ERC Second Report 171

ERC Second Report 172
Annexure-5a *C&AG Audit Report: ADMINISTRATIVE DEPARTMENTWISE ABSTRACT OF
DEPARTMENTAL NOTES CLEARED/PENDING PARAS/REVIEWS IN C&AG's AUDIT REPORTS (CIVIL, COMMERCIAL, REVENUE RECEIPTS, ZP's).
Sl.No. Name of the Department No of Paras
Cleared Balance Pending
Percentage of Clearance
1 Agriculture & Horticulture 7 6 1 86%
2 Animal Husbandry & Fisheries 3 0 3 ---
3 Commerce & Industries 27 6 21 22%
4 Co-operation 9 1 8 11%
5 Department of Personnel & Administrative Reforms
2 1 1 50%
6 Energy 70 40 30 57%
7 Finance 223 127 96 57%
8 Food & Civil Supplies 4 2 2 50%
9 Forest & Ecology 28 20 8 71%
10 Health & Family Welfare 30 25 5 83%
11 Home 9 8 1 89%
12 Housing 9 7 2 78%
13 Information Technology 3 2 1 67%
14 Infrastructure Development 0 0 0 ---
15 Water Resources (Major) 62 58 4 94%
16 Labour 3 1 2 33%
17 Law 0 0 0 ---
18 Parliamentary Affairs 2 0 2 ---
19 Planning, Institutional Finance & Statistics
1 0 1 ---
20 Public Works 36 20 16 56%
21 Revenue 69 27 42 39%
22 Rural Development & Panchayat Raj 45 44 1 98%
23 Social Welfare 11 3 8 27%
24 Urban 35 16 19 46%
25 Women & Child Development 5 0 5 ---
26 DPAR AR 0 0 0 ---
27 Transport 33 29 4 88%
28 Minor Irrigation 21 12 9 57%
29 Medical Education 1 0 1 ---
30 Debt Servicing 0 0 0 ---
31 Department of Public Enterprises 2 2 0 100%
32 Information Tourism and Culture 3 2 1 67%
33 Kannada and Culture 0 0 0 ---
34 Primary Education 8 3 5 38%
35 Horticulture 1 0 1 ---
36 Youth Services and sports 2 0 2 ---
37 Other Section in Finance Department 8 1 7 13%
38 Minorities Welfare 0 0 0 ---
39 Higher Education 6 1 5 17%
TOTAL 778 464 314 60%
*Source : Data downloaded from http://ams.kar.nic.in/RepCAGCategwiseabs.aspx, as on 04.02.2011
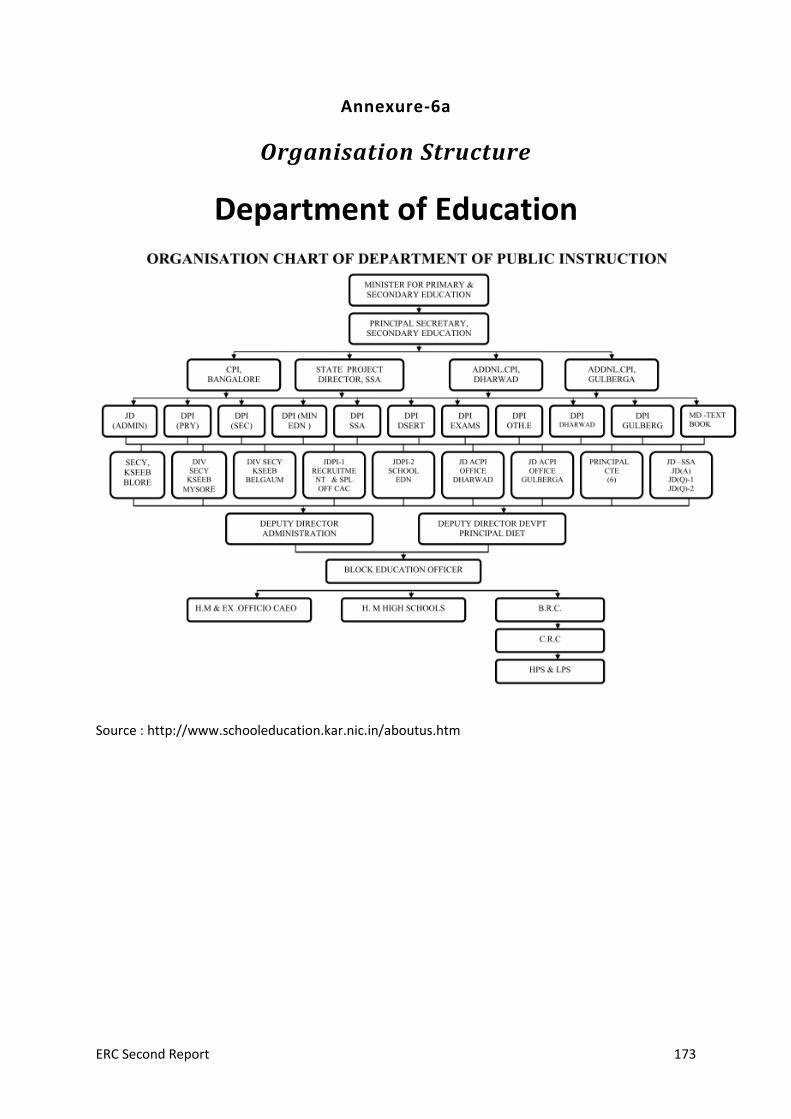
ERC Second Report 173
Annexure-6a
Organisation Structure
Department of Education
Source : http://www.schooleducation.kar.nic.in/aboutus.htm

ERC Second Report 174
Source : http://www.schooleducation.kar.nic.in/aboutus.htm
Source : http://www.schooleducation.kar.nic.in/aboutus.htm

ERC Second Report 175
Annexure-6b
Education Statistics – Karnataka
Details of No. of Schools, Teachers, and enrolment for Karnataka State - Primary School
No. of
Schools (LPS
& HPS)
% of
Total
No. of
Teachers
(LPS & HPS)
% of
Total
No. of
Students
(LPS & HPS)
% of
Total
Average
Drop out
Rate (%)
Teacher/
school
Student /
Teacher
Government 44998 80% 174020 69% 5375618 69% 4 31
Aided 2499 4% 16031 6% 680353 9% 6 42
Un-aided 8711 15% 62138 25% 1735667 22% 7 28
Others 140 0.25% 1387 1% 34806 0% 10 25
Total 56348 100% 253576 100% 7826444 100% 12.1% 5 31
Government 44849 80% 180336 70% 5173949 68% 4 29
Aided 2408 4% 14586 6% 649340 9% 6 45
Un-aided 8411 15% 60565 23% 1723467 23% 7 28
Others 229 0.4% 2323 1% 61316 1% 10 26
Total 55897 100% 257810 100% 7608072 100% 10.1% 5 30
% Change over Previous year = -0.8% 1.7% -2.8%
Government 46030 80% 203782 70% 4953906 65% 4 24
Aided 2449 4% 19464 7% 639276 8% 8 33
Un-aided 8870 15% 64106 22% 1924771 25% 7 30
Others 171 0.3% 2412 1% 52104 1% 14 22
Total 57520 100% 289764 100% 7570057 100% 8.4% 5 26
% Change over Previous year = 2.9% 12.4% -0.5%
LPS : Lower Primary School, Std 1st to 5th; HPS : Higher Primary School, Std 6th to 7th
Source : Government of Karnataka, Education Department, Performance Budget 2009-10
Details of No. of Schools, Teachers, and enrolment for Karnataka State - Secondary School
No. of
Schools
(Secondary)
% of
Total
No. of
Teachers
(Secondary)
% of
Total
No. of
Students
(Secondary)
% of
Total
Average
Drop out
Rate (%)
Teacher/
school
Student /
Teacher
Government 3693 35% 29479 34% 1069256 45% 8 36
Aided 2633 25% 22274 25% 754780 31% 8 34
Un-aided 4133 40% 36201 41% 572219 24% 9 16
Total 10459 100% 87954 100% 2396255 100% 26.8% 8 27
Government 4138 36% 30459 34% 1034799 46% 7 34
Aided 2820 24% 21833 24% 755062 33% 8 35
Un-aided 4567 40% 37957 42% 482965 21% 8 13
Total 11525 100% 90249 100% 2272826 100% 24.7% 8 25
% Change over Previous year = 10.2% 2.6% -5.2%
Government 4387 37% 41781 39% 1138279 46% 10 27
Aided 2997 25% 28139 26% 799682 32% 9 28
Un-aided 4245 36% 35883 33% 562410 22% 8 16
Others 124 2109 17
Total 11753 100% 107912 100% 2500371 100% 14.8% 9 23
% Change over Previous year = 2.0% 19.6% 10.0%
Secondary School : Std 8th to 10th
Source : Government of Karnataka, Education Department, Performance Budget 2009-10
2006-07
2007-08
2008-09
2007-08
2008-09
2006-07

ERC Second Report 176
Infrastructure Facilities in Government Schools (Department of Education) in Karnataka as on 30th September 2008
Department of Education Govt.
Schools
Lower
Primary
Schools
Higher
Primary
Schools
Elementary
(Lower +
Higher)
Schools
High Schools
Lower
Primary
Schools
(Urban)
Higher
Primary
Schools
(Urban)
Lower +
Higher
Primary
Schools
(Urban)
High Schools
(Urban)
Lower
Primary
Schools
(Rural)
Higher
Primary
Schools
(Rural)
Elementary
(Lower +
Higher)
Schools
(Rural)
High Schools
(Rural)
No of Schools (DoE-Govt) 23500 21976 45476 4142 1723 3064 4787 670 21777 18912 40689 3472
No of Students (DoE-Govt) 912061 3983712 4895773 1105574 108483 740226 848709 272403 803578 3243486 4047064 833171
No of Students (Boys : DoE-Govt) 452471 2004182 2456653 551443 52172 359679 411851 121283 400299 1644503 2044802 430160
No of Students (Girls : DoE-Govt) 459590 1979530 2439120 554131 56311 380547 436858 151120 403279 1598983 2002262 403011
Common Toilet 18266 19457 37723 2497 1052 2532 3584 445 17214 16925 34139 2052
Girls Toilet 9185 13659 22844 2292 611 1904 2515 442 8574 11755 20329 1850
Source : DISE 2008-09, Education in Karnataka State, District Reports 2008-09, SSA Project Report
No of Schools as percentage of
Govt Schools in the State 99% 98% 99% 94% 97% 97% 97% 88% 99% 99% 99% 96%
No of Students as percentage of
Govt. School Students in the State 98% 99% 99% 97% 95% 98% 98% 94% 99% 99% 99% 98%
No of Students (Boys) among
total no Students 49.6% 50.3% 50.2% 50% 48% 49% 49% 45% 50% 51% 51% 52%
No of Students (Girls) among total
no of students 50.4% 49.7% 49.8% 50% 52% 51% 51% 55% 50% 49% 49% 48%
Common Toilet as percentage of
Schools 78% 89% 83% 60% 61% 83% 75% 66% 79% 89% 84% 59%
Girls Toilet as percentage of
Schools 39% 62% 50% 55% 35% 62% 53% 66% 39% 62% 50% 53%
Electricity as percentage of
Schools 79% 91% 84% 67% 75% 91% 86% 77% 79% 91% 84% 65%
Playground as percentage of
Schools 39% 59% 49% 67% 30% 56% 47% 66% 40% 60% 49% 67%
Computers as percentage of
Schools 1% 12% 6% 38% 2% 17% 12% 52% 0% 11% 5% 35%
Ramps as percentage of Schools 36% 69% 52% 22% 37% 64% 54% 26% 36% 70% 52% 21%
Compound as percentage of
Schools 69% 67% 68% 69% 68% 75% 73% 79% 69% 66% 68% 67%
Water as percentage of Schools 77% 84% 81% 83% 80% 88% 85% 89% 77% 83% 80% 82%
Library as percentage of Schools 79% 94% 86% 80% 69% 91% 83% 82% 80% 94% 87% 79%
Source : DISE 2008-09, SSA Project Report

ERC Second Report 177
Table 6 : Details of No. of Schools,enrolment, expenditure for Karnataka State - Education
Sr. No. Description
Plan (Rs.
Lakh)
Non Plan
(Rs. Lakh)
Total
(Rs. Lakh)
1 Directorate of Primary Education 98638.78 367696.47 466335.25 56%
2 Directorate of Secondary Education 45380.62 221503.98 266884.60 32%
3 Department of Pre-University Education 39549.92 45333.81 84883.73 9%
3 Department of Collegiate Education ** 11320.90 44841.94 56162.84 9%
Total 194890.22 679376.20 874266.42
Sr. No. Description
1 Directorate of Primary Education 5593182 74% 48479 84% 8,338 1,764 6,574
2 Directorate of Secondary Education 1937961 78% 7384 63% 13,771 2,342 11,430
3 Department of Pre-University Education 545416 57% 1729 49% 15,563 7,251 8,312
3 Department of Collegiate Education ** 343111 80% 647 48% 16,369 3,299 13,069
Source : Government of Karnataka, Education Department, Performance Budget 2009-10
LPS : Lower Primary School, Std 1st to 5th; HPS : Higher Primary School, Std 6th to 7th
Secondary School : Std 8th to 10th
* indicates the Budgetary allocation for the department with regards to the budget allocation for Education for Karnataka
@ No of students in Government and aided schools
# indicates the no of students or no. of school with regards to total no in the state (including Pvt aided and other schools/colleges)
** The % of total for no of colleges and the no of students Collegiate eduation is taken from Task force on Higher Education 2004, pg 87 para 2
AS per the Karnataka Economic Survey 2010, Karnataka state per capita income = Rs. 31031 for the year 2008-09
AS per the Karnataka Economic Survey 2010, Karnataka state per capita income on Education = Rs. 1498 for the year 2008-09
As per the latest HRD report for Karnataka 2005, GER at primary level is 98.12%.
Cost per
Student
(Rs.)
Cost per
Student
PLAN
(Rs.)
Cost per
Student
Non -
PLAN (Rs.)
2008-09
Percentage
of Total*
Percentage of
Total#
Percentage
of Total#
No of
Students@
No of
Schools
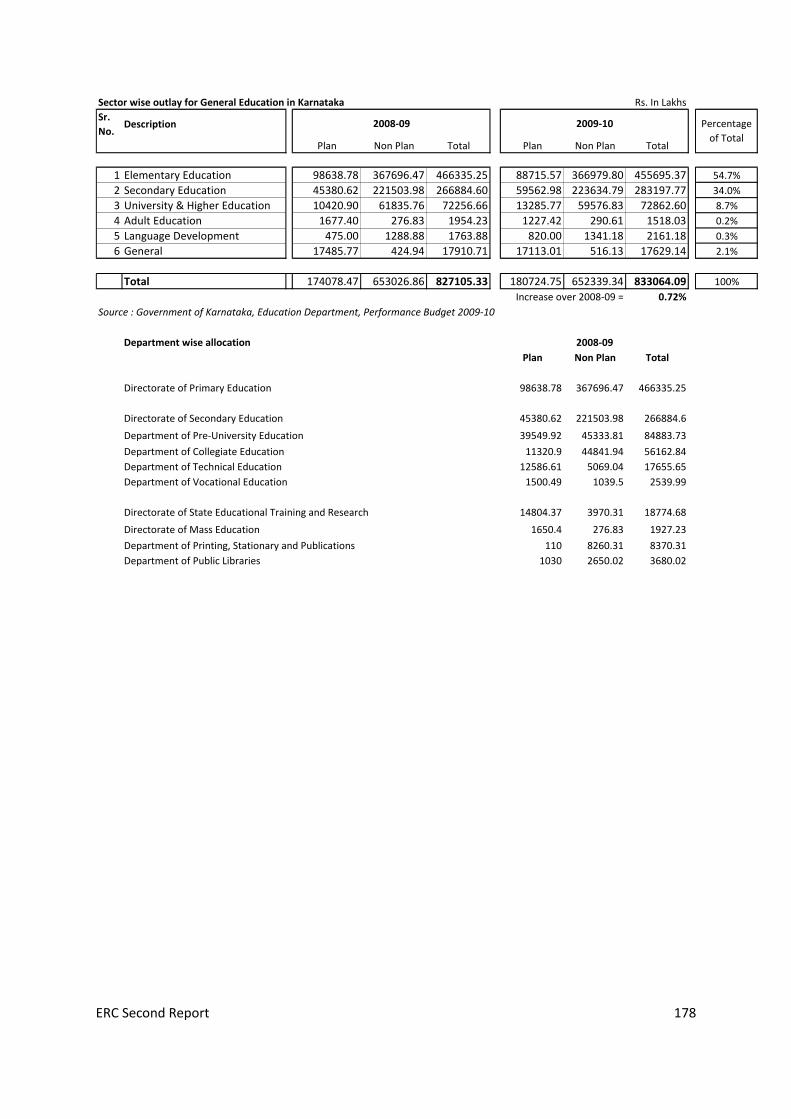
ERC Second Report 178
Sector wise outlay for General Education in Karnataka Rs. In Lakhs
Sr.
No.Description
Plan Non Plan Total Plan Non Plan Total
1 Elementary Education 98638.78 367696.47 466335.25 88715.57 366979.80 455695.37 54.7%
2 Secondary Education 45380.62 221503.98 266884.60 59562.98 223634.79 283197.77 34.0%
3 University & Higher Education 10420.90 61835.76 72256.66 13285.77 59576.83 72862.60 8.7%
4 Adult Education 1677.40 276.83 1954.23 1227.42 290.61 1518.03 0.2%
5 Language Development 475.00 1288.88 1763.88 820.00 1341.18 2161.18 0.3%
6 General 17485.77 424.94 17910.71 17113.01 516.13 17629.14 2.1%
Total 174078.47 653026.86 827105.33 180724.75 652339.34 833064.09 100%
Increase over 2008-09 = 0.72%
Source : Government of Karnataka, Education Department, Performance Budget 2009-10
Department wise allocation
Plan Non Plan Total
Directorate of Primary Education 98638.78 367696.47 466335.25
Directorate of Secondary Education 45380.62 221503.98 266884.6
Department of Pre-University Education 39549.92 45333.81 84883.73
Department of Collegiate Education 11320.9 44841.94 56162.84
Department of Technical Education 12586.61 5069.04 17655.65
Department of Vocational Education 1500.49 1039.5 2539.99
Directorate of State Educational Training and Research 14804.37 3970.31 18774.68
Directorate of Mass Education 1650.4 276.83 1927.23
Department of Printing, Stationary and Publications 110 8260.31 8370.31
Department of Public Libraries 1030 2650.02 3680.02
Percentage
of Total
2008-09 2009-10
2008-09

ERC Second Report 179
Annexure-7a
Employment and training Department
Sl. No.
Schemes Link Code Amount ` in lakh)
1 Modular Training 2230-03-101-0-38 5000.0
Plus 5000.00 (Central
Govt)
2 Industrial Training Institutes/Centres 2230-03-101-0-01 4905.6
3 I.T.Is/Centres (Non Plan) 2230-03-101-0-01 3650.0
4 New I.T.Is in 10 Taluks 2230-03-101-0-35 1500.1
5 I.T.I. at Mundagodu 2230-03-101-0-28 640.1
6 Upgrading ITIs into Centres of Excellence (CSS) 2230-03-101-0-26 600.0
7 New I.T.Is in backward Taluks 2230-03-101-0-37 530.1
8 Student Centric GIA 2230-03-101-0-36 300.0
9 Construction of ITIs 4250-00-203-0-01 300.0
10 New I.T.Is for Women 2230-03-101-0-34 217.0
11 Implementation of 36 New Trades 2230-03-101-0-27 106.0
12 Establishment of STARC 2230-03-101-0-29 70.0
13 Manpower development Corpn. 2230-03-101-0-31 50.0
14 Special Component Plan for Training Programme for SC/ST
2230-03-101-0-17 48.9
15 General Employment Exchanges 2230-02-101-0-01 32.0
16 Motor Driving & Training School 2230-03-101-0-32 30.0
17 Director of Employment and Training 2230-02-001-0-01 10.0
18 State Project implementation unit 2230-03-101-0-30 10.0
19 Employment Parks 2230-02-101-0-07 1.0

ERC Second Report 180
Annexure-8a
(NAAC for Quality and Excellence in Higher Education)
State-wise Analysis of Accreditation Reports - Karnataka
The following are the major concerns/recommendations for Government colleges :
1. Curricular aspects
Curriculum options to be enhanced (Vocational/certificate/PG diploma/others);
Perspective academic vision plan to be developed.
Semester/choice-based credit system and unitization of /modular curricula to be achieved.
Mission objectives of the institutions to be well defined and implemented.
Autonomy to be sought for by selected few colleges.
PG courses to be started in selected few colleges.
Bridge courses, remedial coaching to be introduced atleast in some colleges.
2. Teaching-Learning and Evaluation
Frequent transfers of teachers/Principal to be sorted out.
Imminent need to have better qualified and trained teachers especially in new courses.
Tutorials to be imparted to needy students.
Professional development of faculty to be made more effective.
Training of faculty to use modern methods of teaching and computer-aided teaching to be
encouraged.
Student feedback to be sought to implement corrective measures.
Academic linkages to be established.
Faculty improvement programmes to be made mandatory, to reach more number of staff.
3. Research, Consultancy and Extension
Motivation of even qualified teachers to undertake research to be achieved; a research
culture is hardly seen.
Teachers to be encouraged to apply for research projects.
A research advisory committee to monitor the research activities (plan and implement).
Extension which is at present only through NSS and /or NCC to be made more effective by
involving both, teachers and the taught.
More funds to be made available to permit faculty to conduct and/or attend
conferences/seminars etc., to improve the academic ambience of the institution.
Research linkages, consultancy and industry linkages to be established in due course of time.
4. Infrastructure and learning resources
Need to improve certain academic infrastructure like library, library resources,
computerization of the library, facility for IT training and internet facilities to both teachers,
administrative staff and students.
Hostel accommodation to be improved.

ERC Second Report 181
General amenities to be improved.
Audio-visual amenities to augmented.
5. Student support and progression
Healthcare facilities, canteen, transportation and certain imminent facilities for day boarders
to be improved.
Financial support to needy students to be augmented.
Student guidance, placement and counselling cells to be established.
Library resources/amenities to be enhanced.
6. Organisation and Management
Participatory governance to be established.
Decentralization with autonomy to be established.
Recruitment of adequate/trained staff to be ensured.
Long-term retention of institutional heads to be encouraged, to avoid disruption of functions
on account of transfers.
The criterion-wise recommendations for constituent colleges, private-aided colleges and self-
financing college were highly variable in relation to the different issues raised. However, the
issues pertaining to the Criterion II – Teaching-learning and Evaluation, which is a pointer of
quality of education imparted in the institution, remained more or less similar to those of the
Government colleges.
7. Highlights of the criterion-wise analysis: emerging issues
From the above analysis, irrespective of the type of the institution which has undergone
assessment and accreditation, six most-important issues under each criterion as indicated
below, need to be addressed in due course of time by the stake holders of higher education:
Criterion I: Curricular aspects
1. Clarity of institutional mission and need to work towards achieving them.
2. Need for developing a strategic plan/perspective vision document.
3. Restructuring of Curriculum: introduction of modular curricula and unitization of syllabi.
4. Introduction of need-based programmes/course options, including vocational/certificate
and/or diploma courses.
5. Autonomy to selected colleges.
6. Introduction of semester system/choice-based credit system.
Criterion II: Teaching-Learning and Evaluation
1. Professional development of teachers to be encouraged.
2. Student feedback to be made mandatory.
3. Modern methods of teaching to be adopted.
4. Appropriate teacher-recruitment for newer courses.
5. Participatory teaching-learning process to be inculcated.
6. Staff inadequacy in Govt. colleges (due to frequent transfers) to be overcome.

ERC Second Report 182
Criterion III: Research, Consultancy and Extension
1. Research culture to be inculcated on a priority basis.
2. A research advisory committee to be set up.
3. Research ambience to be created with minimal seed money/infrastructure.
4. Teachers to be guided appropriately to apply for projects and to implement them.
5. Consultancy is hardly evident and industry-academia linkage is yet to be initiated.
6. Extension activity is not well defined/implemented; Student-teacher involvement is hardly
evident.
Criterion IV: Infrastructure and Learning resources
1. General infrastructure expansion and appropriate reallocation and optimal usage to be
achieved.
2. Main library facilities (resources/space/reprography facilities) and Departmental library
resources to be augmented.
3. Certain basic amenities to be made available to students (drinking water/toilets/feasible
transport /canteen etc.)
4. Laboratory and instrumentation facilities to be improved.
5. Computer and internet facilities to be made accessible easily.
6. Hostels and facilities in existing ones to be improved.
Criterion V: Student Support and progression
1. Career guidance and Counselling services to be made available with trained faculty.
2. Language (medium of instructions) and communication skill development to be enhanced.
3. Financial support to needy students and incentive fellowships to advanced learners to be
instituted.
4. Healthcare facilities to be improved.
5. Teacher-taught relations to be improved.
6. Parent-teacher/Alumni associations to be made mandatory, to seek appropriate feedback.
Criterion VI: Organisation and Management
1. Participatory governance to be established with representation to students and teachers, for
a two-way understanding of the requirements and problems and to be able to solve the same
amicably.
2. Transparency and equity in management practices to be adopted, through strategic practices.
3. Student- and teacher-friendly strategic practices to be adopted.
4. Autonomy and decentralization of powers to be encouraged for effective functioning.
5. Confidence building and leadership building strategies to be adopted.
6. A consortium of comparable cluster of institutions to be developed, to effectively design,
plan and implement administrative strategies.
Criterion VII: Healthy practices
1. Institution-specific Innovative ideas and activities to be developed.
2. Orientation to staff and students towards innovation to be mandated.

ERC Second Report 183
3. Incentives to both students and teachers for developing a healthy practice in an institution,
to be introduced.
4. Community/society-related aspects to be tackled.
5. Networking of such innovative ideas, sharing of thoughts and exposure to peer discussions
may be useful.
7. Value-education –based, and heritage-based activities may be emphasized.
8. Recommendations to stakeholders to address the above issues
The probable measures that may be undertaken by the various stakeholders in the Higher
education system to address the above issues are suggested below. Some of these may require
policy decisions to be undertaken by the Government and/or UGC.:
8.1: Administrators: Since the depth of issues to be addressed vary for different clusters of
institutions, feasible suggestions are made for the different administrative components.
a. Universities : since seven out of the eight universities analysed come under the purview
of a common University Act, with each University free to incorporate innovations through its
own statutes, some flexibility is possible. With this in view, under each criterion, the
following suggestions are made largely to improve the standards of postgraduate education:
Criterion I
o The Directorate of planning and evaluation as envisaged in the new act to be established
on priority, to achieve the required goals. A well thought over and defined/focused
institutional mission to be established with perspective plan of action for the next
decade.
o A swift shift over from the present annual/semester pattern to choice-based credit
system, to permit flexibility of course options and horizontal mobility. Teachers should be
motivated to accept this change and have a positive attitude to change in system/
flexibility of programme options so that the student’s aptitudes are honoured.
o A mandatory revision of syllabi once every two years, through a Central Syllabus
Committee which is different from the BOS and which will have at least 40% external
members of proven academic standing in higher education is desirable. The syllabus
committee must also have as its members, people drawn from industrial and business
houses, to give appropriate inputs while framing the syllabi. Unnecessary duplication of
syllabi of allied courses to be avoided. Subject experts may be co-opted as and when
necessary. The whole process of syllabus framing to be undertaken well ahead of the
time schedule so there is adequate planning and design. A student seeking admission
must be aware of the syllabus (including that of the practical component), facilitate
him/her to make the right course-choice.
o In an enthusiasm to start newer courses (to be restricted only to need-based,
multidisciplinary subjects), the long-standing traditional courses are being neglected both
in terms of curricular content and emphasis of applications. Therefore, to begin with,
these course contents must be updated with due weightage to classical concepts, and
applications.

ERC Second Report 184
o An appropriate counselling service be made available to students during and immediately
after admission. At this point, a parallel parent-teacher interaction would also be useful.
A small time frame for change over from one course to another be allowed so that an
additional chance is given to the student to review his choice for course options.
o Departments must have the freedom and incentive to establish appropriate academic
linkages with similar Departments as also with appropriate private organizations
elsewhere. Academic autonomy and appropriate resource allocation for
proven/innovative academic endeavours must be ensured.
Criterion II
o Timely recruitment of qualified teachers to be ensured. Merit and academic
achievements alone should be the criteria for recruitment. It would be advisable to
appoint teachers on contract so that there is academic accountability, and gradually, as
elsewhere, self-financing courses would generate their own manpower of faculty.
Adjunct faculty from other renowned institutions may be drawn to augment teaching
quality.
o Appropriate teacher orientation/refresher programmes not only in specific subjects but
also in the use of modern teaching-aids, development of appropriate computer-aided
teaching packages and student-friendly methods of teaching must be insisted upon. A
teacher-counselling also to be made available for equipping the faculty to appropriately
handle student-related classroom issues. Appropriate Faculty development to be made
mandatory at all cadres.
o Student feedback of faculty performance would be highly useful. This should be
anonymous and in digitized formats, with objective rather than subjective reflections.
o Faculty to be encouraged to develop group activities (both class room and field), to hold
regular seminars, seek assignments and monitor student development through quiz/tests
etc. A record of all these activities to be maintained, to be useful in corrective measures
as well as in continuous assessment of the wards.
o Procedures of continuous assessment and evaluation must be made known to the
students at admission and the evaluation product should be notified for the benefit of
the students.
o Tutorials (Student-mentor) and remedial coaching to be enforced, to help weaker
students and a component of project work/research methodology to be included to aid
the advanced learners. Peer discussions and interactive group discussions to be
encouraged.
o While a gradual shift over to 100% continuous assessment is highly recommended, if
evaluation is resorted to terminal/end examinations, then the whole process of Theory
paper setting and evaluation to be entrusted to external examiners and practicals can be
only through continuous internal assessment.
Criterion III
o A central research planning, development and management board to be set up, with 40%
members drawn from external/research or industry houses. This Board should also
monitor the establishment of adequate laboratory/library resources to undertake need-
based research in the various Departments.

ERC Second Report 185
o Research attitude to be changed to inculcate organized research by all the teachers (if
need be in small allied groups), to work on need-based research problems. Resource
sharing must be insisted upon and duplication of equipment/other research resources to
be avoided.
o External Research funding to be insisted. Internal research fellowships may be instituted.
All PG teachers must be motivated to apply for research projects and adequate academic
freedom should be given to them to monitor the said projects. Research linkages with
other institutions in the vicinity to be encouraged.
o Establishment of research linkages (Regional/National/International) to be encouraged
and faculty to be encouraged to seek hands-on research exposure/training (may be on
sabbatical) in industry/corporate bodies and business houses.
o Appropriate training to develop consultancy, patents with awareness of patenting laws,
thesis writing methods and library and electronic media exposure to be given to faculty.
o Timely Financial and secretarial assistance to be made available for publication and
printing of research articles/books either through Prasaranga or elsewhere.
o USIC and other central facilities to be made more active and supportive to the research
programmes of the university.
o Establish adult and continuous education centers as well as NSS and NCC units to take up
regular extension activity. Both teachers and students to be given incentives to undertake
community-related extension activities especially undertaken through proven NGOs.
o There is an imminent need to develop value-based and heritage based community service
with appropriate credits and collaborations.
Criterion IV
o Inter and Intra University communication linkages, internet connectivity and mobility to
be ensured.
o Sponsors may be sought to augment infrastructure development and maintenance.
o Optimal utilization of the infrastructure to be ensured, with appropriate time frames and
budgetary allocations.
o Wherever the University is located in more than one campus, mobility between
campuses and transport facilities to staff and students to be ensured. Adequate civic
amenities, to be provided at the work place.
o Emphasis on improving and maintaining the education academic landscape to be a
priority over that of general landscape.
Criterion V
o Library resources and facilities to be enhanced. Automation of the library, establishment
of internet connectivity, development of a audio-visual facility, reprographic facility to be
made student-friendly.
o Academic/psychological counselling centres, placement and career guidance bureaus and
grievance redressal / student interaction centers to be established and made functional.
o Parent-teacher and Alumni associations to be set up to interact and support the wards
and the institution to enhance the academic ambience.

ERC Second Report 186
o Office procedures, administrative requirements to be made student-friendly and the
administrative staff and teachers to develop the right attitude to be proactive to students
problems.
o Regular calendar of events, prospectus, news letters and other in-house published
material to be made available to enhance student awareness.
Criterion VI
o Administration to be more proactive, sensitive to student and teacher issues and seek to
develop participatory management practices.
o Staff quality enhancement measures including computer skills, to be implemented.
o Academic decentralization and effective administrative autonomy to Departments to be
ensured for effective functioning.
o Affiliating functions of the University to be reviewed and made more proactive to
colleges; CDC to be made more responsible and effective, to build a liaison between
University, colleges and the UGC.
o All recommendations of the NAAC peer committee report should be complied with within
a definite time frame.
Criterion VII
o Innovative ideas to be encouraged amongst all the personnel/components of the
university.
o Incentives for innovation and upliftment of institutional image must be forthcoming.
o Corporate exposure and interactive discussions with peers and public, would be useful in
motivating innovations.
b. Private college managements/trustees:
Overall recommendations covering all the criteria are suggested:
o Emphasis on institutional development through quality enhancement of education should
be the motto.
o Managements of institutions with proven temporal academic strength should seek
autonomy and develop towards attaining the status of a center of excellence in a
selected field/course.
o Seek to develop more need-based, self-financing courses and PG courses, to be free from
financial constraints and have administrative flexibility.
o Recruitment of qualified staff to be ensured and adequate compensation be provided to
them to retain them so that academic continuity and accountability are achieved.
o Must ensure faculty development for quality enhancement in both, teaching and
research.
o Research and extension must be clearly mandated to achieve holistic development of the
staff and students.
o Management must cater to strategic planning, modern strategic administrative attributes
and value-based management rather than commercial entrepreneurship.

ERC Second Report 187
o Appropriate liaison between students, staff, administrative components and the
community at large to be maintained.
o Recommendations of the Peer Committee Report should be complied with within a
definite time frame.
c. Directorate of Collegiate Education:
As the development and functions of government colleges are achieved through this
Directorate, the following overall suggestions may be addressed:
o The Directorate must establish functional liaison between the CDC, University, UGC
regional office/AICTE regional office and itself, to translate all its developmental activities
into meaningful experiences.
o Remedial coaching, bridge courses and tutorials must be enforced to reach the needy
students and appropriate records must be maintained for the same, with incentives to
teachers involved in such endeavours.
o Faculty recruitment and faculty improvement should be strictly mandated and frequent
transfers should be avoided. This is especially true for Principals.
o Planned batch-wise/seniority-wise faculty improvement programme should be adhered
to, with adequate feedback of the progress and results of such programmes.
o External fund-seeking and project proposals must be made mandatory for those teachers
who have the research exposure through M.Phil. and/or Ph.D. training acquired through
FIP of the UGC or otherwise.
o Extension activities should be clearly spelt out in terms of community service and
outreach exposure. Incentives to staff and students excelling in such activities may be
thought off.
o Selected colleges of proven academic and faculty strength should be given autonomous
status and a few others with similar background may be encouraged to start PG courses.
o Basic infrastructural requirements and civic amenities should be made available to
students and staff, both for personal and academic use.
o A number of concerns regarding student support facilities as indicated under specific
criterion-wise recommendations as above should be addressed on priority.
o Affiliating functions of the University must be debated and discussed to achieve mutual
functional benefits.
o Recommendations of the Peer Committee Report should be complied with within a
definite time frame.

ERC Second Report 188
Annexure-8b
Institution category and Number of Institution
Organization Engg Colleges Polytechnics Junior Technical
Schools Fine Arts colleges
1.Government 10 +1* 81 6 -
2.Government Aided 09+2* 43 - 76
3.Private Management 146 +1* 162 6 -
4.University Colleges (UC) 02+1* - - -
5.Minority Colleges (MC) 15 - - -
Total 187 286 12 76 * Evening Engg College, Source : http://dte.kar.nic.in/
Admission particulars of 1st year students for the year 2008-09
Polytechnics Intake (No of students) Admission (No of Students)
Government polytechnics 11136 11245
Private Aided Polytechnics 8356
8312
Private Unaided polytechnics 21949 18512
Total 41441 38069
Intake for Government Engineering Colleges
Sr. Government Engineering
Colleges
Computer Science &
Engineering
Mechanical Engineering
Civil Engineering
Electronics & Communication
Engineering Total
1 S.K.S.J.T Institute of Engineering, Bangalore
60 60 60 60 240
2 Government Engineering College Chamrajnagar
60 60 60 60 240
3 Government Engineering College Hassan
60 60 60 60 240
4 Government Engineering College K.R.pet
60 60 60 60 240
5 Government Engineering College, Ramanagar
60 60 60 60 240
6 Government Engineering College, Hoovina Hadagali
60 60 60 60 240
7 Government Engineering College, Haveri
60 60 60 60 240
8 Government Engineering College, Kushalnagar
60 60 60 60 240
9 Government Engineering College, Raichur
60 60 60 60 240
10 Government Engineering College, Karwar
60 60 60 60 240
Total 600 600 600 600 2400 Source : http://dte.kar.nic.in/

ERC Second Report 189
Annexure-8c
Seat Sharing in Colleges percentage of Government Seats - 2010
Course Government Private unaided
Engineering 100% 50% (non-minority), 45%
(minority)
Seat Sharing Ratio (%)
Academic Years Engineering
Govt Mgmt
1994-95 to 2002-03 85 15
2003-04 75 25
2004-05 75 25
2005-06 65 35
2006-07 60 40
2007-08 55 45
2008-09 50 40
2007-08 Break-Up of Seats
(Will Remain The Same For 2008-09)
Engineering (138 Colleges) Government Seats 32,450 Management Seats 22,582 All India Quota nil Total 55,032

ERC Second Report 190
Annexure-9a
Staff Position
Department of Agriculture Group A,
Sanctioned
: 525 Filled : 438 Vacant : 87
Commissioner - 1, Director of Agriculture -
01, Additional Director of Agriculture - 08,
Joint Director of Agriculture - 41, Deputy
Director of Agriculture - 58, Asst. Director
of Agriculture - 328, Asst. Director of
Agriculture (FW) - 50, Others - 38
Joint Director of Agriculture - 05,
Dy. Director of Agriculture - 07,
Chief Accounts Officer - 01, Asst.
Director of Agriculture - 51,
Administrative Officer - 21, Asst.
Executive Engineer - 01, Senior
Programmer (Computer) - 01
Group B,
Sanctioned
: 2855 Filled : 1413 Vacant : 1442
Agricultural Officer - 1637, Agricultural
Officer (FW) - 141, Asst. Agril. Officer -
979, Asst. Agril. Officer (Agril. Eng. Water
Mgt) - 58, Others – 40
Agricultural Officer - 931,
Agricultural Officer (FW) - 64, Asst.
Agril. Officer - 380, Asst. Agril.
Officer (Agril. Eng. Water Mgt) - 58,
Others - 9
Group C,
Sanctioned
: 5047 Filled : 3488 Vacant : 1559
Group D,
Sanctioned
: 1175 Filled : 874 Vacant : 301
Source : Government of Karnataka, Secretariat of Agriculture, 2008-09

ERC Second Report 191
Annexure-9b
Agriculture Statistics – Karnataka
Table 1 : Targets and achievements for Agriculture in Karnataka
Description Unit 2008-09 Target
Area under crops lakh hectares 104.95 119.39
Production of Food grains lakh tonnes 73.76 82.92
Demonstrations of best practices Nos. 4168 4172
Supply of Inputs Nos. 18032 15839
Soil Samples analysed Nos. 250000 164501
Seeds Distributed Qtls 936155 919976
Seeds Tested Nos. 18807 36000
Production of Seeds at Seed farms Hectares 500.22 706.96
Area covered under organic farming Hectares 14800
State Soil Survey Hectares 72900 111391 Source : Government of Karnataka, Secretariat of Agriculture Department, Annual Report 2008-09
Area under crops include Kharif, Rabi and summer crops
Food grains include cereals and pulses
Demonstrations of best practices include Demonstrations under NFSM Rice (@ one demo per 0.4 ha at every 100 ha of
area) for Improved package of practices, Rice intensification, Hybrid rice technology
Supply of Inputs include hi-tech implements, storage bins, Hand pumps, diesel, kerosene pump, power tillers, pump sets
etc.
Soil Samples analysed by Soil Testing Laboratories and include General method + STCR + Micronutrients
Seeds distributed included General Seeds by seed suppliers
Seeds tested include samples analysed by Notified Seed Testing Laboratories
Area covered under Organic farming involved 11100 farmers
State Soil survey is carried out as a inventory for sustainable crop production
Table 2 : Agriculture in Karnataka over the years
ITEM 2002-03 2003-04 2004-05 2005-06 2006-07 2007-08
Net Area Sown (000' hectares) 9838 9846 10499 10509 10104 10419
Gross Cropped Area (000' hectares) 11532 11450 12807 13027 12438 12893
Gross irrigated area (000' hectares) 2841 2702 3328 3632 3603 3789
Area under Food grains (000' hectares) 7024 6882 7567 7596 7394 7873
Production of Food grains (000' tonnes) 6664 6562 10491 11535 9329 11415 Source : Appendix 1.1 Karnataka at a glance, ECONOMIC SURVEY OF KARNATAKA 2009-10, Planning, Programme
Monitoring and Statistics Department

ERC Second Report 192
Chart 1 : Agricultural Land use in Karnataka Chart 2 : Year on Year % Change – Agriculture

ERC Second Report 193
Annexure-10a
Area, Production and Yield of Agriculture and Horticulture crops in Karnataka
Year 1999-2000 2000-01 2001-02 2002-03 2003-04 2004-05 2005-06 2006-07 2007-08 2008-09
CAGR (%)
Horticulture Crops Area in Lakh Hectares
Total state Area 15.6 15.31 15.86 15.81 15.42 16.31 16.5 17.25 17.63 18.25 2%
Production in Lakh Tonnes.
Total state Production 103.89 118.21 98.77 95.82 89.28 97.31 122.49 130.26 136.62 143.27 7%
Yield in tonnes per Ha
State Yield 6.66 7.72 6.23 6.06 5.79 5.97 7.42 7.55 7.75 7.58 5%
Source: Various Issues of Horticultural Crop Statistics of Karnataka State at a Glance, Department of Horticulture, Govt. of Karnataka
Agriculture Crops Area in Lakh Hectares
Area under Food grains 70.24 68.82 75.67 75.96 73.94 78.73 2%
Production in Lakh Tonnes.
Production of Food grains 66.64 65.62 104.91 115.35 93.29 114.15 11%
Yield in tonnes per Ha
Yield 0.95 0.95 1.39 1.52 1.26 1.45 9%
Source: Appendix 1.1 Karnataka at a glance, ECONOMIC SURVEY OF KARNATAKA 2009-10, Planning, Programme Monitoring and Statistics Department

ERC Second Report 194
Annexure-11a
1. Inland Fishery Resources
1 Departmental tanks (>40 Ha achcut) 3399
2 Gram Panchayat tanks (<40 Ha achcut) 22624
3 Water spread area of tanks 2.93 lakh ha.
4 Number of Reservoirs 82
5 Water spread area of Reservoirs 2.61 lakh ha
6 Length of rivers 5813 km
7 Length of canals 3187 km
8 Fish seed Production and Rearing Centers
a) Government
i) Production centre 29
ii) Rearing centre 26
b) Private 83
9 Fishermen population 491508
10 Active fishermen population 116858
11 Fish Farmers Development Agencies 13
12 Fishermen Co-operative Societies 362
13 Fishermen Co-operative Apex Federation 1
14 Fishermen training centers 4
15 Fish Markets 224
16 Aquaria 15
17 Ice Plants 37
18 Cold Storages 13
19 Frozen Storages 1
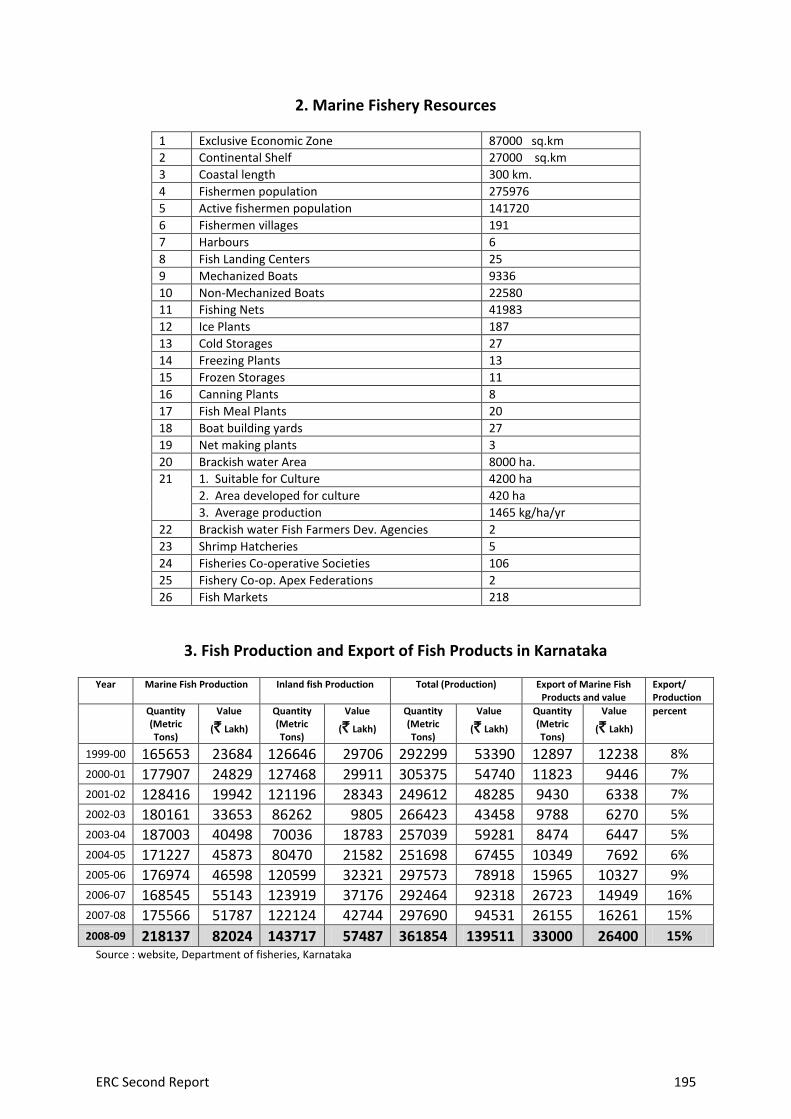
ERC Second Report 195
2. Marine Fishery Resources
1 Exclusive Economic Zone 87000 sq.km
2 Continental Shelf 27000 sq.km
3 Coastal length 300 km.
4 Fishermen population 275976
5 Active fishermen population 141720
6 Fishermen villages 191
7 Harbours 6
8 Fish Landing Centers 25
9 Mechanized Boats 9336
10 Non-Mechanized Boats 22580
11 Fishing Nets 41983
12 Ice Plants 187
13 Cold Storages 27
14 Freezing Plants 13
15 Frozen Storages 11
16 Canning Plants 8
17 Fish Meal Plants 20
18 Boat building yards 27
19 Net making plants 3
20 Brackish water Area 8000 ha.
21 1. Suitable for Culture 4200 ha
2. Area developed for culture 420 ha
3. Average production 1465 kg/ha/yr
22 Brackish water Fish Farmers Dev. Agencies 2
23 Shrimp Hatcheries 5
24 Fisheries Co-operative Societies 106
25 Fishery Co-op. Apex Federations 2
26 Fish Markets 218
3. Fish Production and Export of Fish Products in Karnataka
Year Marine Fish Production Inland fish Production Total (Production) Export of Marine Fish Products and value
Export/ Production
Quantity (Metric Tons)
Value
(` Lakh)
Quantity (Metric Tons)
Value
(` Lakh)
Quantity (Metric Tons)
Value
(` Lakh)
Quantity (Metric Tons)
Value
(` Lakh)
percent
1999-00 165653 23684 126646 29706 292299 53390 12897 12238 8%
2000-01 177907 24829 127468 29911 305375 54740 11823 9446 7%
2001-02 128416 19942 121196 28343 249612 48285 9430 6338 7%
2002-03 180161 33653 86262 9805 266423 43458 9788 6270 5%
2003-04 187003 40498 70036 18783 257039 59281 8474 6447 5%
2004-05 171227 45873 80470 21582 251698 67455 10349 7692 6%
2005-06 176974 46598 120599 32321 297573 78918 15965 10327 9%
2006-07 168545 55143 123919 37176 292464 92318 26723 14949 16%
2007-08 175566 51787 122124 42744 297690 94531 26155 16261 15%
2008-09 218137 82024 143717 57487 361854 139511 33000 26400 15% Source : website, Department of fisheries, Karnataka

ERC Second Report 196
Annexure-11b Organizational chart of Fisheries Department
DIRECTORATE
Category Sanctioned Working strength Vacancy % Vacancy
Group "A"
Technical 46 31 15
Non Technical 1 1 -
Total 47 32 15 32%
GROUP "B"
Technical 222 135 90
Non-Technical 6 6 0
Total 228 141 90 40%
GROUP "C"
Technical 580 331 249
Non-Technical 355 175 180
Total 935 506 429 46%
GROUP "D"
Technical 7 1 6
Non-Technical 193 158 35
Total 200 159 41 20%
Total Technical 855 498 357
Total Non-Technical 555 340 215
Grand Total(A+B+C+D) 1410 838 572 40%
Director
Joint Director (Marine) Joint Director (Inland)
Dy. Director
(Stat.) Dy. Director (Marine)
A.R.C.S.
(Fisheries)
Asst. Director
(S.C.P)
Asst. Director (Mktg)
Asst. Director (I & E)
Asst. Director (Extn.)
Curator
B’lore, Aquarium
AEE /AE
Sr.A.D.
(Admn)
Project Co-ordinator, Malpe
Asst.Director
(Har), Honnavar
Asst.Director
(Har), Malpe
Hon’ble Fisheries Minister
Principal Secretary to Government
Zonal Offices
District level Offices
Nodal Offices

ERC Second Report 197
Annexure-11c
Details of Fisheries Schemes in the Budget 2009-10 (` In Lakh)
Sl.No Schemes State share
Central share
Total
A. PLAN
I. STATE
1 Matsya Mahila Swavalambana Scheme 1000 1000
2 Matsya Ashraya Scheme 1000 1000
3 Construction of fisheries link roads, ridges and jetties with NABARD assistance
1000 1000
4 Fishing harbour at Mangalore 500 500
5 Maintenance of Fisheries link roads 500 500
6 Assistance to Zilla panchayat 409.5 409.5
7 Development and Maintenance of fishing harbour and landing centres 200 200
8 Construction of Matsya Bhavan 200 200
9 Assistance for development of inland fisheries 150.01 150.01
10 Tribal area sub plan 125 125
11 Special component plan 100 100
12 Aqua park 100 100
13 Subsidy for purchase of seed 50 50
14 Supply of Fishery requisite kits 50 50
15 Dredging, Navigation and other works 50 50
16 Directorate of Fisheries 35.27 35.27
17 Contribution to distress relief fund 30 30
18 Research, extension, exhibition and training, 10 10
19 Reimbursement of Medical Expenses 0.1 0.1
Total State Sector Plan 5509.88 5509.88
II. Central Plan Schemes(CPS)
1 Rashtriya Krishi Vikasa Yojane- Fisheries 264 2376 2640
III. Centrally Sponsored Schemes(CSS)
1 Fishermen Welfare Scheme 150 450 600
2 Construction of Fishing harbours 147.88 443.63 591.5
3 Remission of central excise duty on HSD used by mechanised fishing craft
0 500 500
4 FFDA for intensive development of inland fish culture 228.11 76.04 304.14
5 Construction of jetties and landing centers 50 150 200
6 Motorization of traditional crafts 25.48 25.48 50.96
7 Renovation of fishing harbours and landing centres 10 30 40
8 C.S.S.F. Inland Fisheries Statistics 0 12 12
9 Training and Extension 2 8 10
Sub Total CSS 613.46 1695.14 2308.6
Total Plan Schemes(I+II+III) 6387.34 4071.14 10458.48

ERC Second Report 198
Sl.No Schemes State share
Central share
Total
B. Non Plan
1 Assistance to Zilla panchayats 897.63 897.63
2 Director of Fisheries 454.39 454.39
3 Assistance for development of inland fisheries 184.31 184.31
4 Development and Maintenance of fishing harbour and landing centres
55.05 55.05
5 Research, extension, exhibition and training, 20.89 20.89
6 Mechanisation and improvement of fishing crafts 2.72 2.72
7 Reimbursement of Medical Expenses 1.5 1.5
Total Non Plan 1616.49 0 1616.49
Grand Total (A+B) 8003.83 4071.14 12074.97 Source: Department of Fisheries, Govt. of Karnataka

ERC Second Report 199
Annexure-12a
Total Livestock and Poultry population in State (No. In lakhs)
Sl. No Species
2003 census
2007 census
% Variation
1 Cattle 95.95 104.96 9.39
2 Buffaloes 40.24 43.21 7.38
3 Sheep 72.72 95.32 31.08
4 Goats 44.91 61.43 36.78
5 Pigs 3.2 2.78 -13.13
6 Dogs (Domestic) 16.56 19.94 20.41
7 Rabbit 0.06 0.1 66.66
8 Others * 0.39 0.36 -7.69
Total Livestock 274.03 328.12 19.74
9 Poultry 244.51 424.37 73.56 Source: Department of Animal Husbandry and Veterinary Services, Govt. of Karnataka,
* others include Horses, Mules, Donkeys and Camels.

ERC Second Report 200
Annexure-12b
Availability and Requirement of Livestock Products in Karnataka
Sl No
Livestock products Recommended (as per ICMR)
Per capita availability (2008-09)
1 Milk kgs/person / year (250 ml /day) 91.25 Kg 73 Kg
2 Meat kgs/person / year 11 Kg 1.75 Kg
3 Eggs Nos/person / year 180 41 Source: Department of Animal Husbandry and Veterinary Services, Annual Report 2009-10.
Projected Requirement of Milk, Meat and Eggs in Karnataka
Year 2008-09 2013-14 2019-20
Estimated human population 580 lakhs 635 lakhs 690 lakhs
Sl No
Product Availability
Requirement as recommended
(ICMR)
Requirement at present
level of consumption
Requirement as prescribed
Requirement at present
level of consumption
Requirement as prescribed
1 Milk lakh MT 45.38 47.74 53 58.3 62.96 69.27
2 Meat lakh MT 1.14 6.3 1.11 6.9 1.21 7.5
3 Eggs in lakh 23746 104400 26045 113442 28290 124200 Source: Karnataka vision 2020 document
Livestock Production trends during last five years
Product Units 2004-05 2005-06 2006-07 2007-08 2008-09
Milk Lakh tonnes 39.47 40.22 41.24 43.13 45.38
Eggs Lakh nos 17719 18348 19497 20385 23746
Meat Lakh tonnes 0.98 1.09 1.14
Source: Integrated sample survey report (2008-09) by Dept of AH&VS

ERC Second Report 201
Annexure-12c
Abstract of Husbandry and Veterinary Schemes Budget outlay during 2009- 10
(` In Lakhs)
Sl. No
Source Plan Amount % Non plan Amount
% Total Amount
1 State share 48478.43 96.37 19142.53 - 67620.53
2 Central share*
1824.07 3.63 - - 1824.07
Total 50302.5 72.43 19142.5 27.57 69445.03
Source: Department of Animal Husbandry and Veterinary Services, Annual Report 2009-10.
Note: * The Scheme “RKVY” is considered under state sector
Abstract of Budget for various Sectors of AH & VS in Karnataka during 2009-10
(` In Lakhs)
Sl. No
Sector
Allocation Percentage
of allocation
to the sector
Expenditure
Percentage of
expenditure to allocation
State share Central share
Total Allocation
1 Animal Husbandry
14085.43 1694.07 15779.5 31.36 14180.02 89.86
2 Dairy development
30035 130 30165 59.96 24902.5 82.55
3 Capital outlay 4358 0 4358 8.68 3921.75 89.99
Total 48478.43 1824.07 50302.5 100 43004.27 85.27
Source: Department of Animal Husbandry and Veterinary Services, Annual Report 2009-10.

ERC Second Report 202
Annexure-12d
Number of Livestock units per Veterinary Institution in Karnataka
Sl. No
District Total
Livestock (2007 census)
No of Vet Institutes
(31.12.2009)
No. Livestock Units Per Vet.
Institution
1 Raichur 1614572 105 6816
2 Belgaum 3131655 262 6222
3 Bellary 1586710 118 6183
4 Koppal 1076737 80 5755
5 Bagalkote 1724390 137 4923
6 Shimoga 964622 168 4743
7 Chitradurga 1890510 144 4724
8 Bidar 777152 112 4401
9 Tumkur 2522798 233 4305
10 Mysore 1189565 177 4302
11 Gulbarga 2628469 309 4227
12 Hassan 1228661 213 4088
13 Bijapur 1360212 137 4075
14 Chamarajanagar 569979 81 4072
15 Udupi 469126 89 3996
16 Dakshina Kannada 666157 108 3972
17 Davanagere 1162090 176 3919
18 Chickmagalur 731541 139 3781
19 Uttara Kannada 595551 141 3508
20 Chikkaballapura 941245 102 3492
21 Kolar 799886 106 3467
22 Haveri 902521 142 3381
23 Gadag 762503 87 3332
24 Dharwad 493436 109 3095
25 Ramanagara 723294 116 3050
26 Mandya 1190374 218 2748
27 Bangalore Rural 472357 97 2662
28 Kodagu 246784 75 2072
29 Bangalore Urban 388846 129 1266
State 32811743 4110 4103
Source: Department of Animal Husbandry and Veterinary Services, Govt. of Karnataka, Note: 1
Livestock unit = 1 cattle or buffalo, 5 pigs, 10 sheep or goats, 100 poultry birds.

ERC Second Report 203
Break up of the Institutions in Karnataka.
Sl No
Institute Numbers 2009-10
1 Veterinary Hospitals 369
2 Veterinary Dispensaries 1941
3 Primary Veterinary Centres 1181
4 Mobile Veterinary Clinics 174
5 Artificial Insemination Centres 230
6 Other Institutions 215
Department of Animal Husbandry and Veterinary Services, Annual Report 2009-10.

ERC Second Report 204
Annexure-13a
Table 1: DISTRIBUTION OF SCHEMES BY BUDGET OUTLAY
Budget Outlay
(` Crore)
Number of Schemes
% Distribution
< 25.0 4 57
25.0-50.0 2 29
>50.0 1 14
Total 7 100
Source : Department of Agricultural Marketing, Government of Karnataka
Table 2: DETAILS OF EXPENDITURE (` Lakh) ON SCHEMES, 2009-10
Scheme Plan Non-Plan Total
% to
total
State Sector Scheme
1. Minimum Floor Price 200 - 200 0.9
2. Rashtriya Krishi Vikas Yojana (RKVY) 1050 - 1050 4.7
Centrally Sponsored Scheme
3. Development of Rural Markets Under RIDF 1000 - 1000 4.5
4. Grameena Bhandara Yojana 4339 - 4339 19.5
5. Scheme for Strengthening of Infrastructure, Grading and Standardization 12024 - 12024 53.9
6. Assistance to States for Developing Export Infrastructure and Other Allied Activities (ASIDE) 2630 - 2630 11.8
7. Development Under National Horticulture Mission 1050 - 1050 4.7
Total 22293 - 22293 100
Source : Department of Agricultural Marketing, Government of Karnataka

ERC Second Report 205
Annexure-13b
The Karnataka Agricultural Produce Marketing (Regulation and
Development) Act, 1966.
Chapter VI, 63 Powers and duties of market committee.- (1) Subject to provisions to this
act, it shall be the duty of a market committee,-
(i) To implement the provisions of this act, the rules and bye-laws made thereunder in the
market area;
(ii) To provide such facilities for (transport and marketing) of agricultural produce therein
as the state government may from time to time direct;
(2) Without prejudice to the generality of the fore-going provision,-
(a) a market committee shall,-
(ix) collect, maintain and disseminate information in respect of production, sale, storage,
processing, prices and movement of notified agricultural produce;
(b) a market committee may,-
(viii-c) with prior approval of the Director of Agricultural Marketing take such steps as
are necessary to arrange through Co-operative Societies, for purchase, sale, storage or
transport of agricultural produce or for such other matters during the period of
disruption of functioning in the market yard or sub-market yard due to strike of any
market functionary;

ERC Second Report 206
Model Act,
The State Agricultural Produce Marketing (Development and Regulation Act, 2003) 9th
September 2003.
Chapter V
Conduct of Business and Powers and Duties of Market Committee
Section 26 : Powers and Duties of the Market Committee
26 (2) a viii the market committee may, with the prior sanction of state
Government/Director/Managing Director undertake the construction of godowns, roads and
such other infrastructure in market yard/sub yard and market area as may be required to
facilitate movement of agriculture produce to the market for benefit of producer sellers and
traders operating in the market area.
Collect and maintain information in respect of production, sale, storage, processing, prices
and movement of notified agricultural produce and disseminate such information as directed
by the Director.
26 (3) i With prior sanction of Managing Director, the Market Committee may undertake the
following:
(i) Construction of roads, godowns and other infrastructure in the market area to
facilitate marketing of agricultural produce and for the purpose give grant or
advance funds to the Board, the Public Works Department or any other
Department of undertaking of the State Government or any other agency
authorized by the Director/Managing Director.
(ii) Maintain stocks of fertilizer, pesticides, improved seeds, agricultural equipments,
inputs for sale.
(iii) To provide on rent, storage facilities for stocking of agricultural produce to
agriculturists
(iv) To give grant for maintenance of the ‘Goshalas’ recognized by the State
Government.

ERC Second Report 207
Annexure-14a Staff Position
Social Welfare Department
Group
A Group
B Group
C Group D Total
Department of Social Welfare
Sanctioned 48 181 3873 7300 11402
Filled 41 154 3096 4317 7608
Vacant 7 27 777 2983 3794
% Vacancy 15% 15% 20% 41% 33%
Backward Classes Welfare Department
Sanctioned 39 102 3263 5549 8953
Filled 34 0 1529 3559 5122
Vacant 5 102 1734 1990 3831
% Vacancy 13% 100% 53% 36% 43%
Department of Scheduled Tribes Welfare
Sanctioned 15 29 1172 1369 2585
Filled 13 0 482 568 1063
Vacant 3 29 690 801 1523
% Vacancy 20% 100% 59% 59% 59%
Source : Government of Karnataka, Social Welfare Department, Annual Report 2008-09
Annexure-14b 2008-09 (` Lakh)
Budget Allocation Plan Non Plan
Total
1 Social Welfare Department 45357.8 25790.17 71147.97
2 Backward Classes Welfare Department 24437.7 15373.15 39810.85
3 Department of Scheduled Tribes Welfare 12503.33 3459.85 15963.18
4 Dr. B R Ambedkar Development Corporation Ltd., Bangalore
8130
5 D. Devaraj URS Backward Classes Development Corporation Ltd.
6363.5
6 Karnataka Scheduled Tribes Development Corporation Ltd.
7016.88
7 Karnataka Residential Educational Institutions Society, Bangalore
8168.5
8 Dr. B R Ambedkar Research Institute
115.1
9 D. Devaraj URS Research Institute
9
10 Karnataka State Commission for Backward Classes, Bangalore
476.38
11 Karnataka State Commission for Scheduled Castes and Scheduled Tribes
53.29
12 Central Relief Committee
3444
Source : Government of Karnataka, Social Welfare Department, Annual Report 2008-09

ERC Second Report 208
Details of Schools, Hostels and Beneficiaries
Social Welfare
Backward Classes Welfare
Scheduled Tribes Welfare
No. of Hostels 1672 Hostels 1986 Hostels 207 Hostels
No. of Schools/Welfare Centres 90 Residential Schools 74 Schools
158 Schools, 28 Welfare Centres
Beneficiaries in Schools and Hostels (Students)
135318 135433 33820
Own Buildings 1313 Own buildings
1077 Own buildings
165 Own buildings
Rented Buildings 425 Rented buildings
736 Rented buildings
165 Rented buildings
Buildings Under Construction 169 Buildings under
construction
214 Buildings under
construction
44 Buildings under construction
Source : Annual Report, Social Welfare Department, 2008-09
Annexure-14c Statistics - Karnataka
Table 1 : Literacy rate % among SCs and general population in Karnataka
Male Female Total
Sch
edu
led
Cas
tes
Rural
1981 31.83 9.24 20.67
1991 43.21 19.23 31.42
2001 58.71 35.56 47.25
Urban
1981 65.39 37.82 52.03
1991 70.05 47.64 59.18
2001 78.32 59.88 69.27
Total
1981 39.38 15.48 27.62
1991 49.69 25.95 38.10
2001 63.75 41.72 52.87
Sch
edu
led
Trib
es Rural 2001 56.90 33.30 45.30
Urban 2001 74.40 54.30 64.60
Total 1991 47.90 23.60 36.0
2001 59.70 36.60 48.30
Gen
eral
po
pu
lati
on
Rural
1981 51.11 23.84 37.63
1991 60.30 34.76 47.69
2001 70.45 48.01 59.33
Urban
1981 76.54 56.41 66.91
1991 82.04 65.74 74.20
2001 86.66 74.12 80.55
Total
1981 58.73 33.17 46.21
1991 67.26 44.34 56.04
2001 76.10 56.87 66.64 Source: Karnataka Human Development Report 2005

ERC Second Report 209
Table 2 : Results for students in SSLC examinations - Residential Schools
Description Apr-06 Apr-07 Apr-08 % Change (Apr -08 vs
Apr-06)
No. of Schools 110 113 115 5%
No. of students 3816 3893 4358 14%
No. of students passed 3394 3657 3859 14%
% performance 89% 94% 89% State Average 68% 76% 66% Percentage of students who have passed
(85% and above) 3% 9% 7% Percentage of students who have passed
(60% and above) 64% 64% 65% Percentage of students who have passed
(50% and above) 24% 18% 21% Percentage of students who have passed
(pass class) 9% 0% 7% Source : Government of Karnataka, Performance Budget 2008-09, Social Welfare Department

ERC Second Report 210
Annexure-14d Karnataka Residential Educational Institutions Society, Bangalore-No. of
Institutions and sanctioned strength.
Sl.No. Type of Institutions No. of Institutions
Strength (Boys) Strength (Girls)
A) Morarji Desai Residential Schools
1 Scheduled Castes 152 14902 11262
2 Scheduled Tribes --
Morarji Desai Residential Schools 33 2718 2009
Ekalavya Model Residential Schools for Scheduled Tribes
(Government of India Institutions) (VIth to XIIth std.) 4 467 498
3 Backward Classes 130 13165 10478
4 Minorities
Morarji Desai 48 4114 3497
Muslim Residential Schools 5 491 644
5 Residential Schools transferred from Education
Department
General, meritorious children of deceased defence
personnel 27 2713 2775
Aided Residential Schools 3 228 200
6 Education Complexes (1st to 5th Std.) 5 634
Total 407 38798 31997
B) Kittur Rani Chennamma Girls Residential Schools :-
1 Schedule Castes 82 5583
2 Schedule Tribes 32 2034
Total 114 0 7617
Total (A+B) 521 38798 39614 Source : Government of Karnataka, KREIS and Annual Report 2008-09, Social Welfare Department.
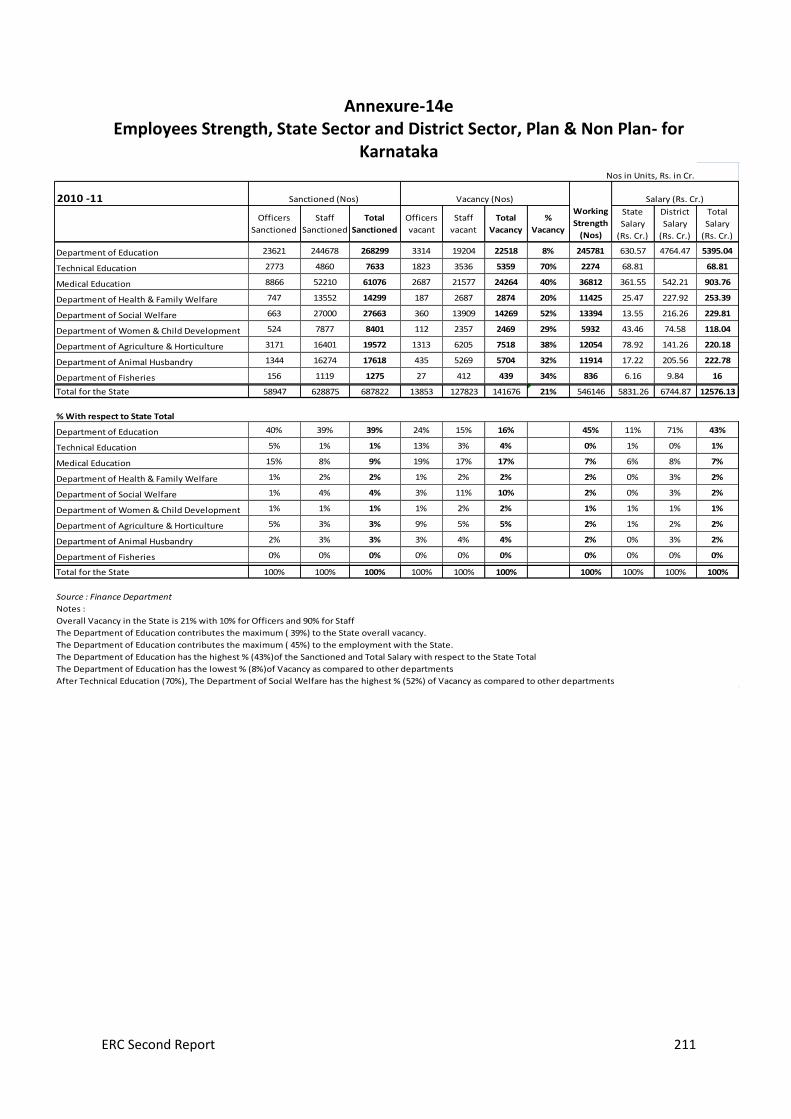
ERC Second Report 211
Annexure-14e Employees Strength, State Sector and District Sector, Plan & Non Plan- for
Karnataka Nos in Units, Rs. in Cr.
2010 -11
Officers
Sanctioned
Staff
Sanctioned
Total
Sanctioned
Officers
vacant
Staff
vacant
Total
Vacancy
%
Vacancy
State
Salary
(Rs. Cr.)
District
Salary
(Rs. Cr.)
Total
Salary
(Rs. Cr.)
Department of Education 23621 244678 268299 3314 19204 22518 8% 245781 630.57 4764.47 5395.04
Technical Education 2773 4860 7633 1823 3536 5359 70% 2274 68.81 68.81
Medical Education 8866 52210 61076 2687 21577 24264 40% 36812 361.55 542.21 903.76
Department of Health & Family Welfare 747 13552 14299 187 2687 2874 20% 11425 25.47 227.92 253.39
Department of Social Welfare 663 27000 27663 360 13909 14269 52% 13394 13.55 216.26 229.81
Department of Women & Child Development 524 7877 8401 112 2357 2469 29% 5932 43.46 74.58 118.04
Department of Agriculture & Horticulture 3171 16401 19572 1313 6205 7518 38% 12054 78.92 141.26 220.18
Department of Animal Husbandry 1344 16274 17618 435 5269 5704 32% 11914 17.22 205.56 222.78
Department of Fisheries 156 1119 1275 27 412 439 34% 836 6.16 9.84 16#DIV/0!
Total for the State 58947 628875 687822 13853 127823 141676 21% 546146 5831.26 6744.87 12576.13
% With respect to State Total
Department of Education 40% 39% 39% 24% 15% 16% 45% 11% 71% 43%
Technical Education 5% 1% 1% 13% 3% 4% 0% 1% 0% 1%
Medical Education 15% 8% 9% 19% 17% 17% 7% 6% 8% 7%
Department of Health & Family Welfare 1% 2% 2% 1% 2% 2% 2% 0% 3% 2%
Department of Social Welfare 1% 4% 4% 3% 11% 10% 2% 0% 3% 2%
Department of Women & Child Development 1% 1% 1% 1% 2% 2% 1% 1% 1% 1%
Department of Agriculture & Horticulture 5% 3% 3% 9% 5% 5% 2% 1% 2% 2%
Department of Animal Husbandry 2% 3% 3% 3% 4% 4% 2% 0% 3% 2%
Department of Fisheries 0% 0% 0% 0% 0% 0% 0% 0% 0% 0%
0% 0% 0% 0% 0% 0% 0% 0% 0% 0%Total for the State 100% 100% 100% 100% 100% 100% 100% 100% 100% 100%
Source : Finance Department
Notes :
Overall Vacancy in the State is 21% with 10% for Officers and 90% for Staff
The Department of Education contributes the maximum ( 39%) to the State overall vacancy.
The Department of Education contributes the maximum ( 45%) to the employment with the State.
The Department of Education has the highest % (43%)of the Sanctioned and Total Salary with respect to the State Total
The Department of Education has the lowest % (8%)of Vacancy as compared to other departments
After Technical Education (70%), The Department of Social Welfare has the highest % (52%) of Vacancy as compared to other departments
Sanctioned (Nos) Salary (Rs. Cr.)Vacancy (Nos)
Working
Strength
(Nos)

ERC Second Report 212
Annexure-16a (`. In Crore)
Sl. No. Scheme Code Eng Description 09-10 P 09-10 NP Total
1 2236-02-197-1-01 Block Grants 296.71 314 610.71
2 2235-02-102-0-25 Bhagyalakshmi 354.64 0 354.64
3 2235-02-197-6-03
Integrated Child Development Service 334.08 0 334.08
4 2235-02-196-1-01 Block Grants 105.86 9.18 115.04
5 4235-02-102-1-02 Anganwadi Buildings-SDP 40 0 40
6 2235-02-103-0-46
PM’s Pilot Project of providing Food grains to Pregnant & Lactating Women and Adolescent Girls 12.93 0 12.93
7 2235-02-106-0-08 Juvenile Homes and
Observation Homes 0 11.56 11.56
8 2235-02-103-0-54 Skill development for Stree
Shakti Groups –SDP 10 0 10
9 2235-60-110-5-01
Aam Aadmi Bhima Yojana Through LIC (Janashri) 10 0 10
10 4235-02-103-1-03 Construction of Houses to
Devadasis-SDP 10 0 10
11 4235-02-102-1-01 Construction of Anganwadi
Buildings 9.8 0 9.8
12 2235-02-103-0-41 Stree Shakti 9.5 0 9.5
13 2235-02-103-0-99 Welfare Programmes for
Women 9.33 0.16 9.49
14 2235-02-103-0-53 Pension to Devadasis 8 0 8
15 4235-02-103-1-02
Construction of Marketing Outlet for Stree Shakti Products at Taluk level 7.5 0 7.5
16 2235-02-001-0-01 Directorate of Women and
Children Welfare 2.45 3.89 6.34
17 2235-02-197-1-01 Block Grants 5.86 0.46 6.32
18 2235-02-196-6-01 Block Grants 6.2 0 6.2
19 2235-02-102-0-05
CSS(100%)-Training of Anganwadi Workers & Helpers 6 0 6
20 2235-02-106-0-10 C.S.S.(50:50)-A Programme
for Juvenile justice 5.21 0 5.21
21 2235-02-103-0-38
Udyogini-Women Development Corporation 5.05 0 5.05
22 2235-02-103-0-11 Rehabilitation of Devadasi
Women 5 0 5
23 2235-02-196-1-03 Block Grants (Physically
Handicapped) 3.68 1.14 4.82

ERC Second Report 213
Sl. No. Scheme Code Eng Description 09-10 P 09-10 NP Total
24 2235-02-101-0-99
Welfare of Physically & Mentally Challenged 1.1 3.34 4.44
25 4235-02-106-1-01 State Plan Scheme 4 0 4
26 2235-02-106-0-06 State Homes and Reception
Centres 0 3.76 3.76
27 2235-02-102-0-99
Bal Bhavan, Bravery Awards & Children’s and Women’s Day and Juvenile Service Bureau and Child Guidance Clinics 1.44 1.85 3.29
28 2235-02-101-0-48 Training and Allowance to
Disabled 0 3.24 3.24
29 2235-02-102-0-04
CSS(100%) of Integrated Child Development Service 3 0 3
30 2235-02-103-0-52
Schemes for Protection of Women against Domestic Violence 2.92 0 3
31 2235-02-103-0-16
Training Programme for Women Entrepreneurs Through Women’s Development Corporation 2.55 0 2.55
32 2235-02-001-0-06
Womens Development Corporation Establishment and Administration 2.5 0 2.5
33 2235-02-101-0-05
Scholarship to the Physically Handicapped 0.2 2.02 2.22
34 2235-02-101-0-50 Hostels for Disabled
Females 0 2.16 2.16
35 2235-02-103-0-55
Training Centres for SHG’s at Divisional level –SDP 2 0 2
36 2235-02-104-2-05
Distribution of Saree, Dhothi to Weaker Sections 2 0 2
37 2235-60-800-2-06 Life Insurance Scheme to
Autorikshaw Drivers 2 0 2
38 2235-02-101-0-53 NPDRP Programme for the
Disabled 1.99 0 1.99
39 2235-02-102-0-28
Karnataka State Commission for Protection of Child Rights 1.7 0 1.7
40 2235-02-001-0-05 Directorate for Disabled 0.23 1.34 1.57
41 2235-02-102-0-31 Balavikasa Academy,
Dharwad 1 0 1
42 2235-02-102-0-33 Special Care Centres for
Children 1 0 1
43 2235-02-101-0-49 Residential Home for
Mentally 0 0.92 0.92

ERC Second Report 214
Sl. No. Scheme Code Eng Description 09-10 P 09-10 NP Total
Challenged
44 2235-02-103-0-50
Suraksha Scheme of Assistance for Acid Victims (Women Commission) 0.75 0 0.75
45 2235-02-104-2-04 Senior Citizen Policy 0.75 0 0.75
46 4235-02-190-0-01 Women Development
Corporation 0.7 0 0.7
47 2235-02-103-0-31
Financial Assistance to Women Law Graduates for Law Practice 0.69 0 0.69
48 2235-02-102-0-30
Meting Medical Expenses of Malnourished Children 0.65 0 0.65
49 2235-02-102-0-32 Child Line 0.5 0 0.5
50 2235-02-101-0-47
Commissionerate for Persons with Disability Act-1995 0.45 0 0.45
51 2235-02-106-0-13
Sponsorship Programme for Placing Children in the Care of Families 0.36 0 0.36
52 2235-02-001-0-03 Social Service Complex 0.06 0.25 0.31
53 2235-02-101-0-02 Development of Schools for
Deaf and Blind 0.01 0.25 0.26
54 2235-02-102-0-27
Hoysala and Keladi Chennamma Prashasthi 0.25 0 0.25
55 2235-02-106-0-14
Training of Inmates of Correctional Institutions in Various Skills 0.2 0 0.2
56 2235-02-102-0-24 Prevention of Trafficking in
Women & Children 0.15 0 0.15
57 2235-60-800-2-07 Reimbursement of Medical
Expenses 0.02 0.11 0.13
58 2235-02-101-0-52 Aids and Appliances for the
Disabled 0.1 0 0.1
59 4235-02-101-1-01 State Plan Scheme 0.1 0 0.1
60 2235-02-101-0-51 Spoorthi Swashaya Yojane 0.01 0 0.01
1293.18 359.63 1652.89

ERC Second Report 215
Annexure-16b
Hon’ble Supreme Court in its interim order dated 7/10/2004, on
implementation of ICDS Scheme, ordered that the contractors shall not be used for
the supply of food to the Anganwadis, and preferably local women groups, Mahila
Mandals, Village Communities should be encouraged to supply the supplementary
food distributed in Anganwadis.

ERC Second Report 216
Annexure-17a
Trends in Total Health Expenditure in Karnataka (1999-2000 to 2008-09) (` in lakhs)
Allocation Expenditure
% of
expenditure Allocation Expenditure
Percentage
of
expenditure Allocation Expenditure
Percentage of
expenditure
1999-2000 3421 3462 101 11087 11465 103 14508 14927 103
2000-01 4413 3625 82 12593 11721 93 17006 15346 90
2001-02 4366 2975 68 13386 13031 97 17752 16006 90
2002-03 5488 5467 100 16589 13906 84 22078 19373 88
2003-04 8637 7494 87 15703 14296 91 24341 21791 90
2004-05 11263 10574 94 18232 15557 85 29495 26130 89
2005-06 8189 5164 63 17104 15750 92 25294 20914 83
2006-07 17418 8264 47 24828 19609 79 42247 27873 66
2007-08 21555 16904 78 31197 26144 84 52752 43048 82
2008-09 45316 35270 78 30196 27086 90 75511 62357 81
Years
Plan Non- Plan Total
Source: Department of Health and Family Welfare, Budget documents and Annual Reports
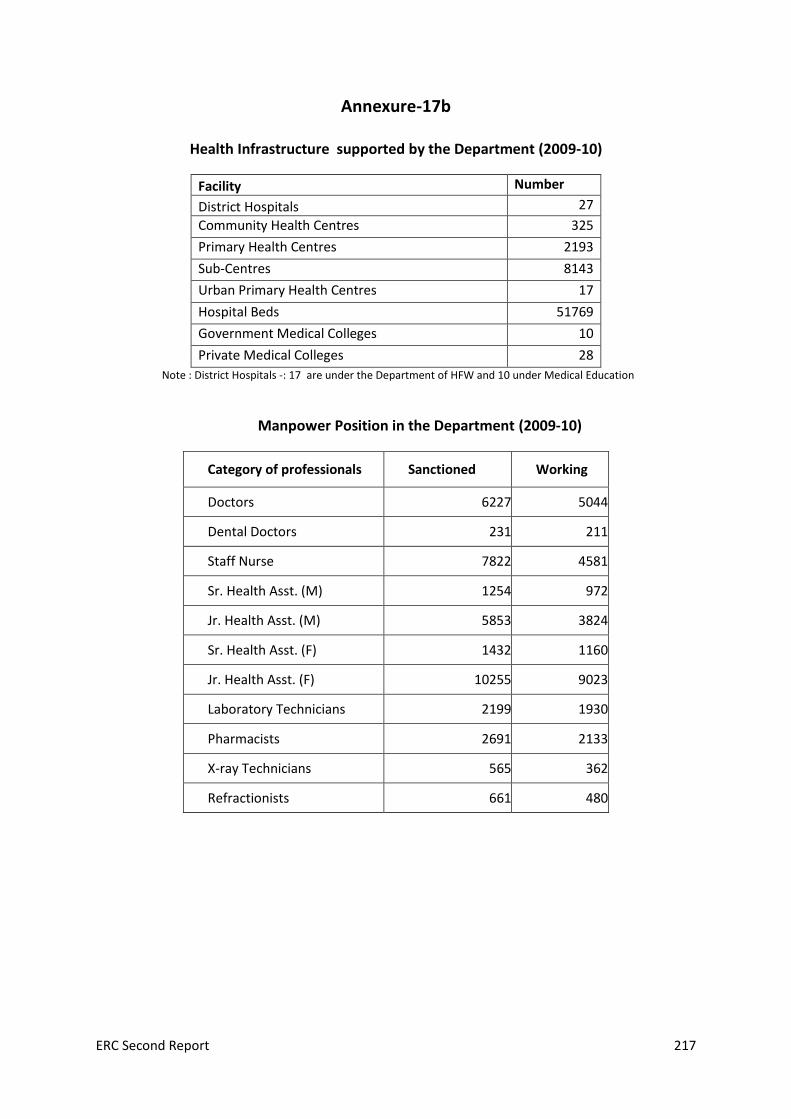
ERC Second Report 217
Annexure-17b
Health Infrastructure supported by the Department (2009-10)
Facility Number
District Hospitals 27
Community Health Centres 325
Primary Health Centres 2193
Sub-Centres 8143
Urban Primary Health Centres 17
Hospital Beds 51769
Government Medical Colleges 10
Private Medical Colleges 28
Note : District Hospitals -: 17 are under the Department of HFW and 10 under Medical Education
Manpower Position in the Department (2009-10)
Category of professionals Sanctioned Working
Doctors 6227 5044
Dental Doctors 231 211
Staff Nurse 7822 4581
Sr. Health Asst. (M) 1254 972
Jr. Health Asst. (M) 5853 3824
Sr. Health Asst. (F) 1432 1160
Jr. Health Asst. (F) 10255 9023
Laboratory Technicians 2199 1930
Pharmacists 2691 2133
X-ray Technicians 565 362
Refractionists 661 480
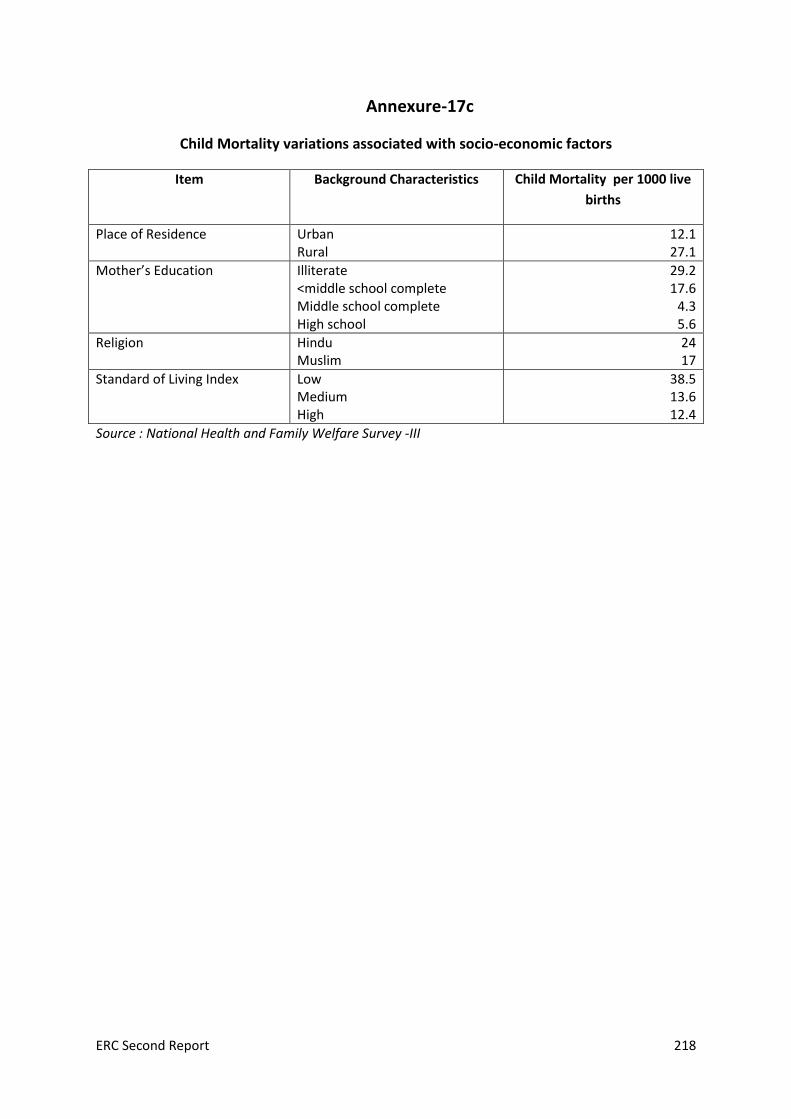
ERC Second Report 218
Annexure-17c
Child Mortality variations associated with socio-economic factors
Item Background Characteristics Child Mortality per 1000 live
births
Place of Residence Urban Rural
12.1 27.1
Mother’s Education Illiterate <middle school complete Middle school complete High school
29.2 17.6
4.3 5.6
Religion Hindu Muslim
24 17
Standard of Living Index Low Medium High
38.5 13.6 12.4
Source : National Health and Family Welfare Survey -III

ERC Second Report 219
Annexure-17d
Districtwise Projected Population, Yearly target Infants, No of FRU, 24X7 PHC, Sub
Centres, Beds.
Sr. Districts
Projected
Population (in
lakhs)
No. of
FRUs
No. of
PHCs
Population/
PHC
No. of
24X7
PHCs
No. of
Sub
Centres
Total No
of Beds
1 DHARWAD 1782380 5 31 57496 29 179 2097
2 BAGALKOT 1836212 10 47 39068 40 224 1108
3 BANGALORE Urban 2612572 4 73 35789 21 185 7203
4 RAICHUR 1831744 5 52 35226 26 196 2026
5 BIDAR 1668555 5 50 33371 34 234 1830
6 BELLARY 2250757 8 70 32154 35 272 2537
7 BELGAUM 4675752 11 146 32026 74 539 3136
8 DAKSHINA Kannada 2107572 6 67 31456 23 431 1909
9 BIJAPUR 2010284 5 64 31411 42 285 1364
10 GADAG 1080184 5 35 30862 20 174 932
11 KOPPAL 1326394 5 45 29475 28 183 866
12 KOLAR 1537965 5 60 25633 45 201 1448
13 HAVERI 1597969 7 68 23500 27 290 1131
14 CHIKKABALLAPUR 1266428 6 56 22615 19 184 948
15 MYSORE 2917201 10 135 21609 25 432 3553
16 RAMANAGARA 1166459 4 54 21601 14 240 799
17 TUMKUR 2866751 9 134 21394 87 477 2082
18 SHIMOGA 1822168 6 88 20706 20 307 2182
19 BANGALORE Rural 920011 4 46 20000 17 192 613
20 CHITRADURGA 1678394 6 86 19516 31 273 1562
21 DAVANAGERE 1988979 6 103 19310 31 291 2016
22 UTTARA Kannada 1503992 10 78 19282 30 120 1890
23 GULBARGA 2401818 10 126 19062 86 378 2860
24 KODAGU 606045 5 32 18939 10 188 1197
25 CHAMARAJANAGAR 1071649 5 57 18801 40 246 1040
26 MANDYA 1957889 7 106 18471 32 375 2382
27 UDUPI 1233039 8 72 17126 23 293 1014
28 HASSAN 1912992 8 124 15427 37 420 2942
29 CHIKMAGALUR 1265946 7 88 14386 28 334 1478
Sources : Compiled from NRHM Project Implementation Plan, 2010-11, Department of Health and Family Welfare Services.
Since population are for 2010-11, no of beds are for 2008-09 there will be some variation in population per bed
*Projected population(page 290 of the Report)
# No of Infants Target (page 220 of the Report)
## (page 255 of the Report)
** Total No of Beds (Table 7, Current Infrastructure, page 107 of the Report)

ERC Second Report 220
Annexure-17e
Reasons for not using government health facilities by State Reasons for not generally using government health facilities
among households that do not generally use government health facilities. (%)
State % of household that do not generally use government health facilities
No nearby facilities
Facility timing not convenient
Health personnel often absent
Waiting time too long
Poor Quality of care
Other reasons
Andhra Pradesh
74.3 49.2 18.1 12.8 23.4 63.3 3.2
Karnataka 64 45.1 25.1 14.3 31.8 50.8 5.2
Kerala 50 47.7 20.5 14.5 25.8 34.2 9.8
Tamil Nadu
47 28.3 23 3 32.3 55.4 3.4
Source : National Family Health Survey 2005-2006 (NFHS-3)
Average medical and other related non medical expenditure per treated person during 15
days by source of treatment
Rural (`) Urban (in Rs)
Medical Expenditure by source of treatment
Medical Expenditure by source of treatment
State Govt Pvt All Other Exp
Total Exp
Loss of household income per treated person
Govt Pvt All Other Exp
Total Exp
Loss of household income per treated person
Andhra Pradesh
6 232 238 24 261 175 2 345 347 22 368 124
Karnataka 4 271 275 38 313 83 14 301 315 20 336 83
Kerala 3 179 182 16 198 72 5 189 193 13 206 83
Tamil Nadu
0 183 184 24 208 77 17 260 277 24 301 48
India 11 246 257 27 285 135 7 299 306 20 326 96
Source : National Sample Survey Organization, 60th Round, (January- June 2004)

ERC Second Report 221
Annexure-17f
Organizational Structure of Department of AYUSH.
Government of Karnataka
COMMISSIONER
Health and Family Welfare Services & AYUSH
DIRECTOR
Department of AYUSH(Ayurveda, Yoga & Naturopathy, Unani, Siddha & Homoeopathy)
Directorate Level
Chief Administrative Officer
Administrative
Officer
Drug
Inspectors-3
Accounts
Officer
Deputy Director-Ay
Deputy Director-Un
Deputy Director-Hom
Colleges with
Attached Hosps.
GIA Institutions
Subordinate
Offices
Principals of AYUSH
Colleges and
Teaching Hospitals
Deputy Director
(Pharmacy)District AYUSH
Officers
Phy Gr-I and Phy Gr-II Medical Officers in the District and Taluk
level AYUSH Hospitals and dispensaries.

ERC Second Report 222
List of Abbreviations used
● AA : Agriculture Assistants
● ACS : Additional Chief Secretary
● AH&VS : Animal Husbandry and Veterinary Sciences
● AHO : Assistant Horticulture Officers
● AICTE : All India Council for Technical Education
● ANSSIRD : Abdul Nazir Sab State Institute of Rural Development
● AO : Agriculture Officers
● APL : Above Poverty Line
● APMC : Agricultural Produce Market Committee
● ASIDE : Assistance to States for Developing Export Infrastructure and Other Allied
Activities
● ATI : Administrative Training Institute
● ATMA : Agricultural Technology Management Agency
● AWW : Anganwadi Worker
● AYUSH : Ayurveda, Yoga, Unani, Siddha and Homoeopathy
● B.B.A : Bachelor of Business Administration
● B.Ed : Bachelor of Education
● B.L. : Bachelor of Law
● BBM : Bachelor of Business Management
● BC : Backward Class
● BCA : Bachelor of Computer Application
● BCG : Boston Consulting Group
● BDP : Business Development Plans
● BE : Bachelor of Engineering

ERC Second Report 223
● BE : Budget Estimates
● BEL : Bharat Electronics Limited
● BHEL : Bharat Heavy Electricals Limited
● BPL : Below Poverty Line
● BRADC : B R Ambedkar Development Corporation
● BVSc & AH : Bidar Veterinary Science and Animal Husbandry (University)
● C&AG : Comptroller & Auditor General
● CAG : Comptroller Auditor General
● CAGR/CARG : Compounded Annual Growth Rate
● CAS : Clinical Administrative systems
● CBPS : Centre for Budgetary and Policy Studies
● CCEA : Cabinet Committee on Economic Affairs
● CDO : Co-operative Development Officers
● CEMI : Composite Expenditure Management Index
● CET : Common Entrance Test
● CHC : Community Health Centre
● CII : Confederation of Indian Industries
● CMD : Certified Medical Doctor
● CMR : Child Mortality Rate
● COE : Centre of Excellence
● COMEDK : Consortium of Medical Engineering and Dental Colleges of Karnataka
● CPM : Critical Path Method
● CSR : Corporate Social Responsibility
● CSS : Centrally Sponsored Scheme/Central Sector Scheme

ERC Second Report 224
● CTE : Centre for Teachers' Education
● DANIDA : Danish International Development Agency
● DCCB : District Credit Co-operative Bank
● DCE : Department of Collegiate Education
● DES : Directorate of Economic and Statistics
● DHO : District Health Officer
● DIET : District Institute for Education and Training
● DISE : District Information System for Education
● DMO : District Medical Officer
● DPAR (AR) : Department of Personnel and Administrative Reforms
● DPR : Detailed Project Report
● DTI : District Training Institute
● EC : Empowered Committee
● EEZ : Exclusive Economic Zone
● EFC : Expenditure Finance Committee
● EFC : Expenditure Finance Committee
● EMPRI : Environment Management and Policy Research Institute
● ERC : Expenditure Reforms Commission
● ERP : Enterprise Resources Planning
● FC : Finance Commission
● FD : Finance Department
● FFDA : Fish Farmers Development Agency
● FPI : Fiscal Policy Institute
● FRBM : Fiscal Responsibility and Budget Management (Act) 2003

ERC Second Report 225
● FRU : First Referral Unit
● GB : Gender Budgeting
● GDI : Gender Development Index
● GER : Gross Enrolment Ratio
● GIA : Grant In Aid
● GoI : Government of India
● GoK : Government of Karnataka
● GSDP : Gross State Domestic Product
● Ha : Hectares
● HAL : Hindustan Aeronautics Limited
● HDI : Human Development Index
● HDR : Human Development Report
● HER : Human Expenditure Ratio
● HMIS : Health Management Information System
● HPS : Higher Primary School
● HRMIS : Human Resource Management Information System
● HSD : High Speed Diesel
● HUDCO : Housing and Urban Development Corporation
● ICDP : Integrated Co-operative Development Project
● ICDS : Integrated Child Development Scheme
● ICISA : International Centre for Information Systems and Audit
● ICMR : Indian Council for Medical Research
● ICP : India Country Programme
● ICT : Internet and Communication Technologies

ERC Second Report 226
● iDeCK : Infrastructure Development Corporation of Karnataka
● IFA : Internal Finance Advisors
● IGP : Income Generating Programmes
● IIM : Indian Institute of Management
● IISc : Indian Institute of Science
● IMR : Infant Mortality Rates
● IPAI : Institute of Public Auditors of India
● ISEC : Institute for Social and Economic Change
● IT : Information Technology
● ITC : Indian Tobacco Company
● ITC : Industrial Training Centre
● ITeS : Information Technology Enabled Services
● ITI : Industrial Training Institute
● ITW : Instructor Training Wing
● IVC : Indian Veterinary Council
● JD : Joint Director
● JFM : Joint Forest Management
● JJ : Juvenile Justice
● KAPPEC : Karnataka State Agricultural Produce Processing and Export Corporation
● KASCARD : Karnataka Agricultural Society for Credit and Agriculture and Rural
Development
● KDP : Karnataka Development Programme
● KFR : Karnataka Fiscal Responsibility (Act) 2002
● KHS : Karnataka Health Services

ERC Second Report 227
● KIPA : Karnataka Institute of Public Auditors
● KLFAFR : Karnataka Local Fund Authorities Fiscal Responsibility (Act) 2003
● KMAY : Karnataka Mahila Abhivrudhi Yojane
● KMDC : Karnataka Minorities Development Corporation
● KREIS : Karnataka Residential Educational Institutions Society
● KSBW : Karnataka State Board for Wakfs
● KSHC : Karnataka State Hajj Committee
● KSMC : Karnataka State Minorities Commission
● KVK : Krishi Vikas Kendras
● KVTSDC : Karnataka Vocational Training and Skill Development Centre
● LED : Light Emitting Diode
● LEXP : Life Expectancy Potential
● LIC : Life Insurance Corporation
● LPS : Lower Primary School
● MA : Master of Arts
● MBBS : Bachelor of Medicine, Bachelor of Surgery
● MDG : Millenium Development Goal
● MDRS : Morarji Desai Residential Schools
● MIS : Management Information System
● MMR : Maternal Mortality Rates
● MMR : Monthly Multilevel Review
● MPIC : Monthly Programme Implementation Calendar
● MSc : Master of Science
● MT : Metric Tonnes
● MTFP : Medium Term Fiscal Plan

ERC Second Report 228
● NAAC : National Assessment and Accreditation Council
● NCDC : National Credit Development Corporation
● NCDEX : National Commodities and Derivatives Exchange
● NFHS : National Family and Health Survey
● NFSM : National Food Security Mission
● NGO : Non Government Organisation
● NIPFP : National Institute for Public Finance and Policy
● NLSIU : National Law School of India University
● NPA : Non Performing Assets
● NPOP : National Programme for Organic Production
● NREGA : National Rural Employment Guarantee Act, 2005
● NRHM : National Rural Health Mission
● NSDC : National Skill Development Corporation
● NSSO : National Sample Survey Office
● PA : Per Annum
● PAC : Public Affairs Centre
● PAC : Public Accounts Committee
● PACS : Primary Agricultural Credit Societies
● PAD : Project Appraisal Division
● PAS : Patient Administration System
● PEAO : Project Evaluation and Appraisal Officer
● PER : Public Expenditure Ratio
● PERT : Programme Evaluation and Review Technique
● PG : Post Graduate

ERC Second Report 229
● PHC : Primary Health Centre
● PIB : Public Investment Board
● PM : Per Month
● PMC : Project Management Consultant
● PPB : Programme Performance Budgeting
● PPP : Public Private Participation
● PS : Principal Secretary
● PSU : Public Sector Units
● PTR : Pupil Teacher Ratio
● PU : Pre University
● PUC : Pre University Course
● PWD : Public Works Department
● RCH : Reproductive Child Health
● RDPR : Rural Development and Panchayat Raj
● RFID : Radio Frequency Identification
● RKVY : Rashtriya Krishi Vikas Yojane
● RMO : Resident Medical Officer
● RSBY : Rashtriya Swasthya Bima Yojane
● RSK : Raitha Samparka Kendra
● RTE : Right to Education
● RTI : Right to Information
● SAC : Suvarna Arogya Chaitanya
● SAF : Social Audit Forum
● SAR : Social Allocation Ratio

ERC Second Report 230
● SC : Scheduled Caste
● SC : Sub Centres
● SCP : Special Component Plan
● SDP : Special Development Plan
● SDP : State Domestic Product
● SEC : State Executive Committee
● SFC : Standing Finance Committee
● SHG : Self Help Group
● SPIU : State Project Implementation Unit
● SPR : Social Priority Ratio
● SPV : Special Purpose Vehicle
● SSA : Sarva Siksha Abhiyaan
● SSLC : Secondary School Leaving Certificate
● ST : Scheduled Tribe
● STCR : Soil Test Crop Response
● T&V : Training and Visit
● TFC : Thirteenth Finance Commission
● THO : Taluka Health Officer
● THR : Take Home Ration
● ToR : Terms of Reference
● TSP : Tribal Sub Plan
● UAS : University of Agriculture Sciences
● UGC : University Grants Commission
● UN : United Nations

ERC Second Report 231
● UNDP : United Nations Development Programme
● USAID : United States Agency for International Development
● VAS : Vajpayee Arogya Shree
● VTIP : Vocational Training Improvement Project
● WB : World Bank
● WBCIS : Weather Based Crop Insurance Scheme
● WCD : Women and Child Development (Department)
● ZP : Zilla Panchayat