Nicaragua Public Expenditure Review 2001–2006
274
March 20, 2008 Document of the World Bank Report No. 39807-NI Nicaragua Public Expenditure Review 2001–2006 Poverty Reduction and Economic Management Central America Department Latin America and the Caribbean Region Public Disclosure Authorized Public Disclosure Authorized Public Disclosure Authorized Public Disclosure Authorized Public Disclosure Authorized Public Disclosure Authorized Public Disclosure Authorized Public Disclosure Authorized
-
Upload
khangminh22 -
Category
Documents
-
view
1 -
download
0
Transcript of Nicaragua Public Expenditure Review 2001–2006

March 20, 2008
Document of the World Bank
Report N
o. 39807-NI
Nicaragua
Public Expenditure Review
2001–2006
Report No. 39807-NI
NicaraguaPublic Expenditure Review 2001–2006
Poverty Reduction and Economic ManagementCentral America DepartmentLatin America and the Caribbean Region
Pub
lic D
iscl
osur
e A
utho
rized
Pub
lic D
iscl
osur
e A
utho
rized
Pub
lic D
iscl
osur
e A
utho
rized
Pub
lic D
iscl
osur
e A
utho
rized
Pub
lic D
iscl
osur
e A
utho
rized
Pub
lic D
iscl
osur
e A
utho
rized
Pub
lic D
iscl
osur
e A
utho
rized
Pub
lic D
iscl
osur
e A
utho
rized


Acknowledgments
This report was prepared by a team led by Ulrich Lachler (LCSPE) and Amparo BalliviAn (LCSPP), as co-task-managers, and comprising Ed Bresnyan (RUTA), Rafael Cortez (LCSHD) Aline Coudouel (LCSHS), Tony James (LCSFT), Rodrigo Jarque (LCC2C), Christine Lao Pena (LCSHH), Fernando Lecaros (LCSFP), Julio Revilla (LCSPE), Jeffrey Rime (LCSPS), Ul r ich Schoppmeyer (Kreditanstalt f i r Wiederaufbau, Germany), Alexandria Valerio (LCSHE), and Manuel Vargas (LCOAA). The peer reviewers for his report are Jordi Prat (IMF) and Steve Webb (LCClA).
The principal authors responsible for each sector addressed in the PER are as follows: 0 Macroeconomic Analysis Ulrich Lachler 0 Debt Sustainability Julio Revilla 0 Education Alexandria Valerio 0 Health Christine Lao Pena and Rafael Cortez 0 Social Protection Al ine Coudouel 0 Transport Tony James 0 Water & Sanitation Ul r ich Schoppmeyer 0 Energy Fernando Lecaros 0 Agriculture/Rural Development Ed Bresnyan a Public Employment and Wages Amparo Ballivihn 0 Decentralization Jeff R i m e 0 Public Expenditure Management Manuel Vargas 0 Statistical Annex Rodrigo Jarque
A mission to coordinate the preparation o f the report visited Nicaragua at the end o f November 2006 and another mission visited in mid-March 2007. The PER team would l i ke to thank the Nicaraguan authorities for their cooperation in facilitating access to any data and information requested by the mission.
Director, LCC2C: Jane Armitage Director, LCSPR: Ernest0 May Task Managers: Ulrich Lachler
AmDaro Ballivihn


NICARAGUA PUBLIC EXPENDITURE REVIEW
2007
PREFACE ........................................................................................................................................... i ... EXECUTIVE SUMMARY .................................................................................................................. 111
CHAPTER I . INTRODUCTION ........................................................................................................... 1 A . Country Context .................................................................................................................. 2
C . Summary Outline of the PER .............................................................................................. 7 B . Two K e y Development Issues ............................................................................................. 5
CHAPTER 11 . OVERVIEW OF PUBLIC SECTOR SPENDING AND FISCAL SUSTAINABILITY ............. 9 A . Overview o f the Public Sector and the Composition o f Public Spending ........................... 9 B . The Pattern o f Recent Fiscal Adjustments and Size o f Government ................................ 16 C . Fiscal Sustainabllity ........................................................................................................... 20 D . M a i n Conclusions .............................................................................................................. 24
. . .
CHAPTER 111 . THE EFFICIENCY OF PUBLIC SPENDING 1N NICARAGUA ........................................ 27 A . Growth and Poverty Reduction Performance .................................................................... 27 B . The Level and Efficiency o f Public Investment ................................................................ 28 C . The Level of Social Sector Spending ................................................................................ 36 D . The Efficiency o f Social Sector Spending ......................................................................... 40 E . Summary and Conclusions ................................................................................................ 48
CHAPTER Iv . PUBLIC SECTOR EMPLOYMENT AND REMUNERATION POLICY .......................... 51 A . The Legal Framework ....................................................................................................... 52 B . Public Sector Employment ................................................................................................ 53 C . Public Sector Remuneration .............................................................................................. 57 D . Ma in Findings and Policy Options .................................................................................... 72
CHAPTER v . FISCAL DECENTRALIZATION IN NICARAGUA ........................................................ 77 Municipal Government Roles and Assigned Revenues (1987-2006) ............................... 78 The Budget Transfer Formula and Municipal Own-Revenues ......................................... 81 Municipal Expenditures ..................................................................................................... 83 Accountability for Public Expenditure .............................................................................. 85 Redressing Imbalances: Current and Proposed Reform Actions ....................................... 87
A . B . C . D . E . F Concluding Considerations 92 . ................................................................................................
CHAPTER V I . IMPROVING GOVERNANCE THROUGH EXPENDITURE MANAGEMENT REFORM ................................................................ 95
The Legal and Institutional Framework o f Public Financial Management ....................... 95 Performance o f Systems. Processes and Institutions ....................................................... 100 Reform Process ................................................................................................................ 120 Main Conclusions ............................................................................................................ 124
A . B . C . D .

REFERENCES ............................................................................................................................... 129
Annexes
Annex A . Technical Note on the Efficiency o f Public Spending in Nicaragua ......................... 133 Annex B . Basic Parameter Assumptions Underlying the Fiscal Sustainability Analysis .......... 143 Annex C . Review o f Public Spending on Education .................................................................. 145 Annex D . Review o f Public Spending on Health ....................................................................... 161 Annex E . Review o f Public Spending on Social Protection ....................................................... 177 Annex F . Review o f Public Spending on Transport ................................................................... 185 Annex G . Review o f Public Spending on Water and Sanitation ................................................ 195 Annex H . Review o f Public Spending on Energy ...................................................................... 203 Annex I . Review o f Public Spending on Agriculture and Rural Development ......................... 209 Annex J . Budget Transfer Allocation by Municipality, 2006-2007 .......................................... 219 Annex K . Implementation Status o f C F A A Action Plan, January 2006 .................................... 223 Annex L . Model Outline for Sector Expenditure Reviews ........................................................ 229
Tables Table 1.1 K e y Social Indicators. 2005 ........................................................................................... 2 Table 2.1 Nicaragua: Financial Structure o f the National Public Sector Budget. 2007 ................. 9 Table 2.2 Nicaragua: Fiscal Balances o f the Non-Financial Public Sector .................................. 11 Table 2.3 Nicaragua: Economic Composition o f Central Government Expenditures ................. 12 Table 2.4 Nicaragua: Sector Composition o f Central Government Expenditures ....................... 14 Table 2.5 Nicaragua: Institutional Composition o f Central Government Expenditures .............. 16 Table 2.6 Central Government Revenues and Expenditures in Latin America & Caribbean ...... 17 Table 2.7 NPV o f Future Stream o f Public Revenues .................................................................. 22 Table 2.8 Nicaragua: Total Domestic Public Liabilities .............................................................. 23 Table 3.1 Relation between Growth Rates and Gross Fixed Capital Investment:l990-2005 ....... 28 Table 3.2 Nicaragua: Capital Expenditures o f the Central Government, by Sector ..................... 29 Table 3.3 Infrastructure Sector Investment in Latin America: 1991-1998 ................................... 30 Table 3.4 Social Sector Spending in Central and Latin America: 1990-2003 ............................. 37 Table 3.5 Public Spending on Primary Education in 2005 ........................................................... 38 Table 3.6 Public Spending on Secondary Education in 2005 ....................................................... 39 Table 3.7 Population, GDP and health Expenditures in Central America, 2003 ......................... 40 Table 3.8 Ranking o f Efficiency Scores for Public Spending in Education and Health .............. 41 Table 3.9 Distribution o f Government Education Subsidies
by Household Expenditure Quintile ............................................................................. 45 Table 3.10 Nicaragua: Health Expenditures, by Source; 2001 -2004 ........................................... 46 Table 3.11 Shares o f Total health Spending by Function .............................................................. 46 Table 3.12 Health Outcomes and Outputs; 2001 and 2005 ........................................................... 47 Table 3.13 Ma in Social Protection Programs in the Budget (executed budget; YO o f GDP) ............. Table 4.1 Nicaragua: Public Sector Employees ........................................................................... 55 Table 4.2 The Central Government Wage Bill ............................................................................. 58 Table 4.3 Salary Distribution in the Public Sector ....................................................................... 58

Table 4.4 Public versus Private Sector Pay .................................................................................. 62 Table 4.5 Average Annual Remuneration. by Gender. 2002 ....................................................... 63 Table 4.6 Monthly Salaries in Education. by Leve l and School Modality ................................... 64 Table 4.7 Monthly Salaries in Education. by Autonomous Centers ............................................ 64 Table 4.8 Monthly Salaries in Education. Decentralized Municipalities ..................................... 64 Table 4.9 Monthly Teacher Salaries in Central America ............................................................. 65 Table 4.10 Hourly Wages Rates in Central America .................................................................... 66 Table 4.11 Health Sector Remuneration and Wages .................................................................... 67 Table 4.12 Health sector: Share o f Gross Wage Bill. by Type o f Service ................................... 68 Table 4.13 Health Sector Professional Wages by Occupation ..................................................... 68 Table 4.14 Average Doctors’ Salaries in Central America .......................................................... 69 Table 4.15 Physicians’ Base Salaries Relative to Per Capita GDP .............................................. 69 Table 4.16 Consultants’ Compensation by Financing Source (1 8 Institutions) ........................... 71 Table 4.17 Budgetary Lines Uti l ized in the Contracting o f Consultants ...................................... 71 Table 4.18 Reference Table for Consultant Wages ...................................................................... 72
Table 4.20 Basic Salary Table for the Ministry o f Health ............................................................ 76 Table 5.1 Areas o f Municipal Responsibility ............................................................................... 78
Table 5.3 Composition o f Total Municipal Current Revenues. 2005 .......................................... 82 Table 5.4 Municipal Current Revenue and Budget Transfers. 2003-2007 ................................... 83
Table 5.6 Current Revenues. Municipal Categories & Budget Allocation Rules ........................ 84 Table 5.7 Allocation o f Transfers According to Municipal Approved Budgets .......................... 84 Table 5.8 Utilization o f Budget Transfer According to Municipal
Approved Capital Budgets. 2004-2006 ....................................................................... 84 Table 5.9 Municipal Expenditures by Category. 2004 ................................................................. 85 Table 5.10 Municipal Debt with the INSS. by Department ......................................................... 86 Table 5.11 Budget Cuts to “Neutralize” Transfers. 2004-2007 ................................................... 88 Table 5.12 Allocations for “Tax Collection Efficiency” 2007 ..................................................... 90 Table 6.1 Deviation in Expenditure Budget Execution and Variance in Composition
o f Primary Expenditure ............................................................................................ 100 Table 6.2 Aggregate Internal Revenue Execution ...................................................................... 101 Table 6.3 Recorded Floating Debt .............................................................................................. 101 Table 6.4 Legally Earmarked Funds ........................................................................................... 107 Table 6.5 In-year Expenditure Budget Modifications ................................................................ 109
Table 4.19 Reference Salary Table. 2006 ..................................................................................... 75
Table 5.2 Evolution o f Central Government Transfers to Municipalities. 2003-2007 ................. 82
Table 5.5 Share o f Municipal Expenditure in Total Public Expenditure. 2003-2006 .................. 83
Figures Figure 2.1 Nicaragua: Evolution o f Total Current Government Expenditures ............................ 11 Figure 2.2 Nicaragua: Evolution o f Central Government Wage Bill ........................................... 13 Figure 2.3 Total Central Government Expenditures, 1994-2006 ................................................. 14 Figure 2.4 Measures o f Government Size: Expenditures and Revenues
o f the Non-Financial Public Sector ............................................................................. 19 Figure 3.1 Nicaragua’s Relative Growth Performance ................................................................ 27 Figure 3.2 Per Capita GDP, Gross Fixed Capital Formation and Infrastructure Quality
Across Lower Middle Income Countries ..................................................................... 32

Figure 4.1 Nicaragua’s Economically Active and Inactive Population ........................................ 54 Figure 4.2 Total Empleados Publicos ........................................................................................... 54 Figure 4.3 Average Individual Salary Gross Monthly C$ ............................................................ 59 Figure 4.4 MHCP, TSR y Rangos Salariales (en C$). Junio 2006 ............................................... 61 Figure 4.5 MECD. Numero de Funcionarios y Masa Salarial Bmta (en C$/Mes) ....................... 61 Figure 4.6 Base Salaries o f Health Care Providers Relative to Physicians’ Salary ..................... 62
Boxes Box 2.1 Pension System Coverage in Nicaragua ......................................................................... 25 Box 6.1 Main Laws and Regulations o f Public Financial Management ...................................... 95 Box 6.2 National Development Plan ............................................................................................ 99
.
Statistical Annex Tables
A.l.O Nicaragua: Key Macroeconomic Indicators ..................................................................... 233 A.l. 1 Nicaragua: Ingresos del Gobierno Central (en millones de Cordobas) ............................ 234 A . 1.2 Nicaragua: Ingresos del Gobierno Central (en porcentaje del PIB) ................................. 235 A . 1.3a Nicaragua: Gasto Corriente del Gobierno Central
por Institucion (en millones Cordobas) ........................................................................... 236 A 1.3b Nicaragua: Gasto Capital del Gobierno Central
por Institucion (en millones Cordobas) ........................................................................... 237 A.1.4 Nicaragua: Gasto Total del Gobierno Central por Institucion (en millones Cordobas) ... 238 A.1.5 Nicaragua: Gasto Total del Gobierno Central por Institucion (en % gasto total) ............ 239 A . 1.6 Nicaragua: Gasto Total del Gobierno Central por Institucion (en % PIB) ....................... 240 A . 1.7 Nicaragua: Balance del Gobierno Central (en millones Cordobas) .................................. 241 A . 1.8. Nicaragua: Balance del Gobierno Central (en % PIB) .................................................... 242 A.1.9 Nicaragua: Gasto del Gobierno Central por Sector (en % PIB) ....................................... 244
B.l Number o f Public Sector Employees. by Institution .......................................................... 245 B.2 Wage Bill. by Institution ..................................................................................................... 246 B.3 Average Gross Monthly Wage Bill. by Institution ............................................................. 247 B.4 Average Individual Salary Gross Monthly ......................................................................... 248

NICARAGUA-PUBLIC EXPENDITURE REVIEW
PREFACE
Public Expenditure Reviews (PERs) are core diagnostic studies periodically prepared by the World Bank to analyze public sector issues, with a focus on the efficiency and equity o f public resource allocation. This PER was undertaken at the request o f the Nicaraguan government administration under President Bolaiios, whose mandate ended in January 2007, and i s mostly based on information up to 2006. Given that time horizon, its capacity to comment on the new programs that have been prepared or are being contemplated by the current government under President Ortega is limited. Furthermore, the analysis in this PER takes as i t s point o f departure the market-based and private sector-led development perspective that was broadly shared by the Bolafios administration and which was reflected in the poverty reduction strategy that was in effect at that time. This perspective differs in several important ways from the more social- oriented and public sector-led development perspective adopted by the current administration. In this context, the reader i s reminded that the views expressed in the PER are solely those o f World Bank staff and do not necessarily reflect the views or positions o f the Nicaraguan government.
The authorities are currently i s in the process o f updating Nicaragua’s poverty reduction strategy for the period 2008-201 1, to be named the Plan Nacional de Desarrollo Humano (PNDH). The PNDH i s expected to build on the longer term poverty reduction strategy presented earlier by placing greater emphasis on social development and inclusive growth. As indicated in several position papers presented in 2007; the Nicaraguan authorities are committed to maintaining continuity with certain key elements o f the earlier strategies that have been considered successful. These include (i) maintaining macroeconomic stability and ensuring public debt sustainability as prerequisites for reducing poverty, (ii) advancing on key social indicators toward meeting the Millennium Development Goals, (iii) diversifying the export base and leveraging regional free trade agreements in order to increase access to external markets, and (iv) preserving a pol icy environment conducive to attracting more private investment, including from foreign sources.
The authorities also have indicated a commitment to change certain elements o f the earlier poverty reduction strategy. The most important strategic changes include: 0 refocusing attention from the “cluster development strategy” that figured prominently in the
earlier growth strategy and which i s viewed as favoring the larger, more established economic agents, towards supporting production by the poorest households and small & medium sized enterprises, including through increased access to credit for these sectors,
L
+ These documents refer to: Gobiemo de Reconciliacion y Unidad Nacional, “Programa Economico-Financier0 2007-2010 (Agosto 2007) Nicaragua: Progress Report National Development Plan 2006 (Agosto, 2007), Gobiemo de Reconciliacion y Unidad Nacional, Secretaria Tecnica del Poder Ciudadano (SETEC), “Nicaragua: Progress Report National Development Plan 2006 (August 2007), and Gobiemo de Reconciliacion y Unidad Nacional, “Prioridades del Gobierno de Reconciliacion y Unidad Nacional Proceso en Construccion Permanente, (Agosto, 2007)
1

0 discontinuing the privatization agenda, which i s viewed as not having worked well especially in the electricity and social security sectors, and placing more emphasis on state intervention and oversight,
0 placing greater attention on promoting human development, instead o f compensatory polices and what i s perceived as too narrow a focus on eliminating extreme poverty, and
0 improving access to public services in health and education, in part by providing these services free o f charge to beneficiaries and in coordination with other l ine ministries. This last strategic change i s associated with a broader program reorientation away from the principle o f targeted interventions toward one that aims for greater universality.
While some o f the recommendations offered in this report may require adaptation to these differences in development perspective, the most important fiscal challenges facing the Nicaraguan authorities remain unchanged. This PER i s intended to provide a timely reference in drawing attention to these challenges and in helping to identify various opportunities for raising the impact o f public expenditures, independent o f the preferred development approach.
2

NICARAGUA-PUBLIC EXPENDITURE REVIEW
Executive Summary
1. Nicaragua has made impressive progress since 2001 in reducing the overall fiscal deficit. A series o f internal and external shocks (hurricane Mitch, banking crisis, elections) reopened major fiscal gaps at the end o f the 199Os, which threatened to destabilize the economy. Since then, fiscal management has remained prudent in spite o f spending pressures, resulting in an improvement o f the combined public sector balance (after grants) from a deficit o f 5.4 percent o f GDP in 2002 to a surplus o f 0.2 percent in 2006. Economic growth also recovered during this period, to average almost 4 percent, while inflation remained in single digit figures. This positive outcome was facilitated by a favorable external environment, characterized by rapid growth among Nicaragua’s trading partners, a doubling o f remittance flows, and massive external debt relief.
11. The decline in the fiscal deficit was brought about entirely through increases in public revenues, which raises some concerns about political sustainability. In spite o f substantial debt service relief (achieved through the HIPC and other initiatives), total NFPS expenditures as a share o f GDP now surpass the peak level reached in the immediate aftermath o f hurricane Mitch. Meanwhile, tax revenues have risen continuously, from 13 percent o f GDP in 2001 to almost 18 percent in 2006. This was made possible through a series o f tax reforms, followed by improvements in tax administration and a buoyant tax response to a growing economy. Recent cross-country research, however, suggests that fiscal adjustments that depend mainly on revenue increases are more difficult to sustain over time than those that depend on expenditure reductions. These concerns could be addressed through a more balanced approach when future adjustment needs emerge, combining revenue-raising measures with expenditure cuts in non-priority areas.
iii. Nicaragua exhibits a moderate, but manageable, risk of experiencing debt distress, provided that sound macroeconomic policies continue to be applied. When al l ongoing debt re l ie f initiatives have been implemented, Nicaragua external debt, in net present value terms (NPV) declines to about 35 percent o f GDP. Nicaragua also has a high level o f domestic debt, however, with an NPV o f about 19 percent o f GDP at end-2006. This adds up to a combined public debt o f approximately 54 percent o f GDP, which i s sustainable if Nicaragua can continue to grow by at least 4 percent per annum, maintain a primary fiscal surplus near the levels achieved in recent years and keep various fiscal pressures in check. Key threats to fiscal stability in the short run are the rising fiscal transfers to the municipalities mandated by Law 466 (without a coincident transfer o f spending responsibilities), growing pressures on public wages and the possibility o f an energy crisis. In the medium term, a major threat is posed by the actuarial deficit o f the pension system.
iv. Nicaragua’s long run fiscal sustainability will depend closely on how the authorities deal with the actuarial deficit of the pension system. In 2006, the pension system exhibited an actuarial deficit estimated at around 162 percent o f GDP. If the system i s allowed to remain as is, then the present fiscal framework is clearly unsustainable, even with a 2 percent primary fiscal surplus. To sustain the resulting domestic debt (including pension liabilities), would require a
..
3

substantially larger primary fiscal surplus - on the order o f 6 percent if GDP growth remains at 4 percent. This would be an extremely ambitious fiscal target, as wel l as an extremely inequitable one, considering that the beneficiaries o f the pension system generally do not comprise the poorer members o f societies. Fortunately, the pension system is not projected to generate cash deficits for a few more years, which gives adequate time to prepare an appropriate pension reform. Two other (though difficult to quantify) contingent fiscal liabilities that need to be taken account o f in assessing the r i s k o f debt distress are the liabilities originating from the current bank deposits guarantee in the event o f new bank failures and from the finance ministry’s open- ended capacity to issue new compensation bonds (BPIs) in response to new claims o f compensation for past confiscations.
v. Nicaragua’s somewhat lackluster growth performance raises questions about the effectiveness of public spending, particularly investment spending. Since the late 1 9 9 0 ~ ~ Nicaragua’s per capita GDP growth has remained consistently below the average rate seen in other lower middle income countries worldwide, even though it exhibited similar shares o f public and private investment spending as this country group. Furthermore, the pace o f growth achieved in recent years has not been sufficient to keep up the momentum in poverty reduction, which has suffered a marked deceleration. The poor link between investment and growth in Nicaragua i s explained in part by the widespread misclassification o f public consumption spending as public investment. Also, earlier research (Nicaragua DPR 2004) had revealed that Nicaragua exhibited particular shortcomings in several key determinants o f growth, notably in public infrastructure development and human capital development (education attainment and health). These shortcomings point to possible inadequacies in the level and quality o f public spending in these sectors.
vi. The total amounts of public infrastructure spending and social spending in Nicaragua are broadly in line with the country’s economic capacity, but there i s much room to improve the quality of public spending. Nicaragua has been devoting a similar or higher share o f GDP on public infrastructure spending as other countries in Latin America, but its Infrastructure Quality index (based on the Global Competitiveness Report, 2006-07) ranks among the lowest in the region and worldwide. Recent World Bank research on the efficiency o f social spending also suggests that Nicaragua is less efficient, on average, than other countries in the region. That is, Nicaragua’s average efficiency scores - derived by comparing social sector outcomes and public social expenditures - consistently rank below the regional median score.
vii. Various opportunities have been identified for improving the quality and efficiency of public expenditures in key social and infrastructure sectors. These opportunities - some o f which seek to take advantage o f market forces and private initiative - are summarized next.
0 In Transport, important efficiency gains could be achieved by (i) shifting a higher share o f sector resources toward road maintenance, preferably through the road maintenance fund (FOMAV), using least-cost public bid contractual approaches, (ii) scaling up existing adoquinado programs in the expansion o f secondary roads, as a more cost-effective alternative to asphalt or gravel roads, (iii) adapting road designs to less costly standards appropriate to local conditions, and (iv) strengthening the institutional capacities o f MTI in the areas o f planning and programming, and o f FOMAV in the areas o f contracting and procurement procedures.
4

0 In Water & Sanitation, important efficiency gains could be achieved by simultaneously allowing tariffs to adjust to cost recovery levels and improving the operating efficiency o f the water utility, while protecting the poor from price shocks in sector services. This may be achieved by (i) introducing a loss-reduction program in ENACAL, which could include a greater de-concentration o f operations, (ii) granting greater autonomy to INAA in setting tariffs based on long-run marginal costs, and (iii) revising the existing system o f subsidies to target them to the poor. Also, the introduction o f a hygiene education program in rural areas could significantly raise the impact o f sector infrastructure in reducing water-related diseases.
0 In Energy, it i s necessary to step up the level o f total sector investment. Given the limited fiscal capacity to increase public investment, this wil l require improving the investment climate facing private investors. Important measures that could help improve investor confidence in the sector are (i) a lessening o f tensions with the private distribution company, identifying common ground for improving service, and (ii) a simplified electricity pricing structure (while re-considering the existing electricity consumptions subsidy with a view to targeting i t more effectively to the poor). Since energy projects have long gestation periods, i t wil l also be important to update existing studies for hydro-electric and geothermal projects (which are more efficient than the thermal plants that currently dominate electricity generation in Nicaragua) to feed into a long-term sector expansion plan, giving priority to the development o f new projects within a regional context.
0 In Education, sector outcomes could be significantly improved by (i) shifting a higher proportion o f sector resources toward early childhood development, pre-primary education and secondary education, (ii) introducing greater cost recovery at the university level, coupled with an expanded scholarship program exclusively targeted to poor students, (iii) improving the school autonomy program by revising its financing formula and strengthening monitoring and evaluation mechanisms, applying the lessons learned so far from the program’s implementation, (iv) developing demand-side programs to reduce the direct and indirect costs that have proven to be barriers o f access to schooling for poor families, and (v) improving the quality o f education through better human resource management.
0 In Health, major efficiency gains could be had by (i) increasing the proportion o f the sector budget devoted to preventive health care and health promotion, from the current share o f 7 percent to the regional average o f 30 percent (with I N S S adopting a strong preventive health policy, since i t s current benefits do not include preventive exams), and (ii) improving the sk i l ls m i x and allocation o f personnel, toward a higher proportion o f nurses and greater concentration in rural areas, away from Managua. Significant fiscal savings to finance greater spending on preventive health care and health promotion activities could be had by (i) revising the overly generous sector wage pol icy (more on this below), (ii) reducing the over- consumption o f health services, particularly in INSS, through the implementation o f regulation, audit and quality controls in the prescription o f pharmaceuticals and other health services, as wel l as by adopting different capitation payments for INSS that account for gender and age-related costs and risks, (iii) implementing a system o f targeted health subsidies, as an alternative to offering free health services for all, and (iv) introducing more efficient drug procurement procedures.
5

viii. Many of these opportunities for improving the efficiency of public spending also are available under a more social-oriented, public sector-led development approach. As noted in the Preface, the Ortega administration does not share the same development perspective as previous administrations and i s disinclined to apply discriminatory pricing policies in the provision o f public health and education services, as well as toward greater reliance on private and non-governmental group participation, or decentralization, in the provision o f certain public services (e.g., education, water & sanitation). This means that some o f the opportunities l isted above for improving the quality and efficiency o f public services (e.g., improving the school autonomy program, de-concentrating E N A C A L operations, or a better targeting o f health subsidies) are being ruled out. It does not, however, rule out the other opportunities that have been identified, in particular those seeking to strengthen public sector management, improve regulatory systems, create monitoring and evaluation mechanisms, streamline public procurement and enhance public planning capacities. If fact, these measures become even more important in the context o f a public sector-led development approach.
Public Employment and Remuneration
ix. The public sector budget payroll has been increasing as a share of GDP, posing a potential threat to macroeconomic stability. Although the total size o f public sector employment in Nicaragua s t i l l represents a smaller share o f the population than in other countries in the region, the annual growth in public employment has been exceeding the population growth rate since 2001 (2.4 percent per annum versus 1.9 percent). At the same time, average public sector salaries have been growing faster in real terms than private sector salaries (at 3.7 percent p.a. versus -0.4 percent). The threat o f macroeconomic destabilization became more acute in mid-2006, amidst growing pressures f iom public sector unions that succeeded in raising the minimum wage and in boosting the salaries o f health sector personnel, based on regional benchmark levels that bear little relation to Nicaragua’s economic and fiscal capacity.
x. Adequate framework legislation to govern public sector remuneration i s urgently needed to ensure an orderly, transparent and efficient process of wage determination in the public sector. The absence o f such framework legislation is undermining the authorities’ efforts to manage public wage pressures in an orderly manner. Good framework legislation i s characterized by (i) broad coverage, encompassing al l public sector agencies covered by the Civ i l Service Law, (ii) transparency (which i s enhanced by maintaining a simple wage structure built around a base salary, with few bonuses and no in-kind compensation), (iii) the principle o f merit-based pay, where the remuneration system rewards good individual and team performance, subject to the prevailing fiscal constraints, (iv) non-discrimination, and (v) a responsiveness to market forces. A sensitivity to market forces i s very important for ensuring that the public sector is neither over-paying i t s employees (and thus over-taxing the economy), nor allowing the quality o f i t s work-force to deteriorate. The adequacy o f public sector wages i s best gauged by the frequency o f labor turnover and quality o f applicants for different positions, as well as by carrying out periodic market surveys o f private sector wages in Nicaragua - not by comparing them to the rates paid in other countries or to the prices o f particular commodities.
xi. The efficient implementation o f this framework legislation would be enhanced through the introduction of a uniform Reference Salary Table (RST). The pace o f introduction may need to be gradual, however, and calibrated to conform with Nicaragua’s fiscal limitations. (Prior to introducing the RST, it i s important to estimate the fiscal impact o f
6

alternative salary structures.). The RST wil l also need to be periodically revised and adapted to changing labor market conditions and relative scarcities o f different skills.
xii. A key prior action needed for the efficient implementation o f proper framework legislation and development of an RST i s the creation of a centralized data base on public employment and remuneration that covers the entire public sector. Article 8 o f the C iv i l Service Law provides a sufficient legal basis for requiring al l public sector agencies to submit such information to the Ministry o f Finance. The status o f consultants (especially those consultants that are currently occupying permanent positions) and their contractual arrangements also require special attention in the implementation o f the framework legislation and RST; both may need some adaptation to avoid fiscal problems.
xiii. There i s a need to undertake a teacher census to determine with greater precision the geographic distribution o f teachers and their work hours and serve to inform decisions on the deployment of teachers (within urban areas and across ruraYurban areas). In the longer term, there i s also a need to devise a better compensation policy for teachers within the framework legislation discussed above that includes more incentives to attract better teachers, encourage the upgrading o f unqualified teachers (“empricos”) and reward good teaching performance. In seeking to link teacher compensation to teaching performance and results, i t wil l be important to analyze the recent student assessment data (from 2006) with the objective o f identifying the main factors associated with good teacher performance and results. The education sector accounts for 44 percent o f total central government employment, which means that the impact o f the proposed public wage framework legislation wi l l largely hinge o n a successful application in this sector.
Fiscal Decentralization
xiv. Political decentralization presents, both, opportunities and fiscal challenges for poverty reduction. I t can improve the efficiency o f resource allocation under the right circumstances, but it can also lead to fiscal imbalances or gaps in the provision o f critical public services in the event that municipalities lack adequate institutional capacity. A commonly- accepted argument for decentralization is that by shifting the locus for government decision making closer to citizens, choices about the use o f public resources will be better aligned with locally-defined preferences. The experience to date in Nicaragua, however, indicates that municipal officials consider poverty reduction to be mostly a central government responsibility. In moving the decentralization agenda forward, a process o f consultation and dialogue with mayors, AMUNIC, and civ i l society organizations wil l be critical to encourage a consensus around a vision for municipal governments as key protagonists in Nicaragua’s development. Decentralization can encourage citizen-centered development that includes concerted efforts to ameliorate poverty.
xv. Defining the proper roles for different levels of government needs to be at the forefront in designing a full-fledged decentralization strategy in Nicaragua. Over the last ten years, the polemics surrounding decentralization in Nicaragua have focused primarily on the share o f national income to be transferred to municipalities. Less attention has been devoted to the appropriate roles o f each level o f government, or to an analysis o f the local government capacity required to carry out given tasks. For the decentralization process to advance in Nicaragua, producing a document o f this nature should be the first order o f business.
7

xvi. The growth of public spending on current transfers i s threatening to undermine fiscal stability. Central government spending on current transfers increased by almost 2 percent o f GDP between 2004 and 2006, in part reflecting the increase in fiscal transfers to the municipalities mandated by Law 466 o f 2003. The growth in these fiscal transfers i s set to continue under the law until they reach 10 percent o f total central government revenues by 2010. Since the law does not mandate a corresponding transfer o f expenditure responsibilities, central government expenditures are poised to increase by another 0.8 percent o f GDP over this period. Until 2006, the central government was able to “neutralize” these budget transfers by cutting capital expenditures in the areas that most closely overlap with municipal activities, and requiring the municipalities to co-finance the investment activities o f central government agencies (especially FISE and IDR) in the municipalities. This option for reducing expenditures i s more or less exhausted. It is, therefore, critically important to implement other corrective measures to neutralize the adverse fiscal consequences o f the increasing transfers. This could include raising taxes, reducing other central government expenditures o f lower priority and transferring additional expenditure responsibilities f iom the central government to the municipalities (alongside the additional revenue transfers).
xvii. T o address the fiscal imbalance triggered by the municipal transfers law, it may be necessary to revise the legal framework governing municipal responsibilities. When additional fiscal resources are transferred to the municipalities without an equal transfer o f expenditure responsibilities, there is a danger that increases in municipal spending on items o f l ow social priority wi l l crowd out spending on items o f higher social priority, as the central government is forced to make cuts in order to maintain fiscal balance. The framework that currently governs the assignation o f responsibilities to municipal governments dates from 1997, and needs to be reviewed in light o f the substantial increase in resources available to municipalities that has subsequently taken place.
xviii. As the activities to be carried out by local government are defined, it i s critical to quantify their costs, as well as the administrative demands those roles place on central and local governments. In many decentralized government systems, for example, maintenance o f physical infrastructure in education and primary health care falls to local government; but that i s not presently the case in Nicaragua. H o w much do those activities cost? H o w would (revised) municipal roles fit within the sector-specific service delivery models in Nicaragua? And how complex are the administrative demands (e.g., contracting, personnel management, oversight, accounting, etc.) for carrying out any o f these new mandates effectively?
Public Expenditure Management
xix. The PER has assessed Nicaragua’s public financial management (PFM) performance, using an international framework o f reference that addresses seven critical dimensions: (i) credibility o f the budget, (ii) comprehensiveness and transparency, (iii) budget planning, (iv) predictability and control in budget execution, (v) accounting, recording and reporting, (vi) external scrutiny and audit, and (vii) donor practices that affect PFM. The assessment reveals that significant progress has been made since January 2004 in the implementation o f the 2003 CFAA Action Plan, but that some areas require further attention. Based on that assessment, the following measures are considered critical for scaling up ongoing efforts to reform and modernize public financial management (PFM).
8

xx. The comprehensiveness and transparency of fiscal information would be significantly increased by (i) enforcing compliance with the requirements o f Law 550 on preparation and publication o f execution reports for al l budgets, as well as o f financial statements, (ii) revising the rules and their application vis-&vis current expenditures in investment projects, (iii) enforcing comprehensive publication o f procurement data through the State’s Procurement and Public Contracts Integrated System (SICCE), (iv) expanding dissemination o f audit reports, and (v) enforcing compliance by decentralized entities (by function and territory) with the requirements o f Law 550 on provision o f information, while creating capacity in the M H C P to analyze that information and monitor aggregate fiscal risk.
xxi. Budget planning would be strengthened through (i) increased budget flexibility by reducing the amount o f earmarking o f budget allocations (18.8 o f primary expenditures are currently earmarked), (ii) continued implementation o f the medium term budget framework, with an emphasis on the executing entities’ capacity to prepare or refine costed sectoral strategic plans properly reconciled with the fiscal framework, (iii) a better integration o f public investment programming (PIP) into the medium term and annual budget formulation process, with due consideration to recurrent cost implications, and development o f SNIP’S monitoring and evaluation tools, and (iv) an increased performance orientation o f the budget under proper sequencing arrangements, including the accountability framework, the dimensions and scope o f indicators, and the capacity to measure the marginal cost o f changes in performance.
xxii. The predictability and control in budget execution would be improved by (i) enforcing compliance with the timely recording o f expenditure commitments, e.g. through automatic links with the SICCE, (ii) streamlining the mechanism o f direct payments by the Treasury, through better coordination with the Central Bank, (iii) continuing the development o f the C iv i l Service Integrated System (SISEC) and the extension o f the Fiscal Payroll System (SNF) with a view o f developing a consolidated payroll system, which in turn should be subject to systematic audits, (iv) developing information to assess performance o f the Technical Internal Control Norms (NTCI) implementation, (v) building internal audit capacity, and (vi) increasing efficiency and transparency o f the procurement system through the development o f SICCE and the reform o f the legal and regulatory framework, in l ine with international good practice.
xxiii. Accounting, recording and reporting functions would be enhanced by (i) supplementing budget execution reports with data on bank balances, first, and with financial statements based on accrual accounting later, and (ii) examining with greater detail and support the efforts o f the different sectors, mainly o f the Ministries o f Education and Health, to compile and process more information on the resources received (or not) allocated to service-delivery units (schools and health centers).
xxiv. External scrutiny and auditing would be strengthened by (i) ensuring sustainability and continuous improvement o f the Controller General o f the Republic’s (CGR) external audit reporting on budget execution reports and public sector financial statements, (ii) monitoring better the timely and thorough response to audit recommendations, and (iii) fostering access by the National Assembly to external audit reports, and the development o f mechanisms to their review, discussion and monitoring.
xxv. The donor community in Nicaragua also has an important opportunity to help the Nicaragua authorities to strengthen overall public financial management by (i) aligning their assistance under the Joint Budget Financing Arrangement (JFA), (ii) ensuring the timely
9

provision o f proj ections and disbursements (and greater convergence between both), in cash and in kind, and (iii) relying increasingly on national institutions and procedures in the implementation o f investment projects. In turn, the authorities may consider introducing elements into Law 550 to better balance their capacity to receive short-term grants (which have a modest fiscal impact), and the Legislature’s right to approve budget modifications.
xxvi. Concluding Summary. Nicaragua has come a long way since the beginning o f this decade in bringing i t s overall fiscal balances under control. This puts Nicaragua in a good position for combating poverty in a sustained manner. To maintain that position, however, i t will need to overcome further challenges that threaten to undermine fiscal stability in the medium term, notably a rapidly growing public wage bill and fiscal transfers to the municipalities. Looking beyond macroeconomic stability, Nicaragua also needs to pick up the pace o f economic growth in order to generate greater momentum in poverty reduction. In this regard, the PER has identified various options for improving the quality o f public expenditures in key areas relevant for economic growth. I t also pointed out the most important measures needed to modernize public expenditure management and, thereby, facilitate the adjustments needed to improve the quality o f public spending in a cost-effective manner. It is hoped that these insights prove useful to the authorities in their efforts to promote faster growth and poverty reduction in Nicaragua.
10

CHAPTER I COUNTRY CONTEXT AND MAIN FISCAL CHALLENGES
1.1 Public Expenditure Reviews (PERs) are core diagnostic studies periodically prepared by the Wor ld Bank to analyze public sector issues, with a focus on the efficiency and equity o f public resource allocation. This PER is being prepared as part o f a package o f economic and sector work for Nicaragua, which also includes a Poverty Assessment (PA), Institutional and Governance Review (IGR) and Energy Sector Strategy Study. Its ultimate aim i s to improve the effectiveness and transparency o f public resource allocation in a way that promotes economic growth and poverty reduction.
1.2 The PER was undertaken at the request o f the administration o f President Bolafios, whose mandate ended in January 2007. The background work for this PER primarily consists o f “desk studies” that review the evolution and impact o f public expenditures since the previous PER was completed in 2001. It i s based on information up to the end o f 2006 and, therefore, does not evaluate any new programs that the current administration under President Ortega has been preparing or may be contemplating. Also, i t takes as its point o f departure the market-based and private sector-led development perspective that was broadly shared by previous administrations, but not by the current one. Nevertheless, i t is hoped that this PER may serve as a timely reference in drawing attention to some important fiscal challenges facing Nicaragua and in helping to identify various opportunities for raising the impact o f public expenditures, independent o f any particular development perspective. The PER i s also meant to provide necessary analytical foundations for the Bank-supported program in Nicaragua, including a new series o f Poverty Reduction Support Credits (PRSCs) and associated technical assistance operations contemplated in the 2007 Country Partnership Strategy for Nicaragua. By the same token, the PER should serve to facilitate donor coordination, especially in the context o f jo int budget support operations and sector-wide approaches.
1.3 The main audience o f the proposed PER are the Nicaraguan economic authorities, principally but not exclusively comprising the staffs o f the Ministry o f Finance and Public Credit (MHCP), the Technical Coordination Secretariat o f the Presidency (SECEP) and the Economic Commission o f the National Assembly. A second target audience i s the staff o f the World Bank and o f other donor agencies that participate in the Budget Support Group (BSG)’ and are involved in the design and implementation o f PRSCs. Finally, the PER may prove useful to academics and other members o f c iv i l society that have a stake in good governance and public sector management, such as the members o f the National Council on Economic and Social Planning (CONPES).
1.4 Several donor agencies have been proposing to carry out separate expenditure reviews in specific sectors over the medium term.2 To avoid overlaps and duplication, the PER has maintained a narrow focus on a few important cross-cutting public finance issues, and aims for breadth, rather than depth, in discussing sector expenditure trends. This may provide a useful L
1. The Budget Support Group consists o f 9 bilateral and multi lateral donors that are providing budgetary support t o Nicaragua under a common framework. This framework is contained in a Joint Financial Agreement and a Performance Assessment Ma t r i x that was signed by participating donors in 2005. 2. This includes IDA, which i s in the process o f preparing a Social Sector Expenditure Review, scheduled for completion in 2009.
11

backdrop for the sector reviews being contemplated by different donors. (Annex L presents a generic outline o f the main topics generally treated in sector expenditure reviews, which can serve as a model to promote a certain degree o f uniformity and consistency o f coverage across the separate sector reviews.) Depending on the response and interest o f the new authorities to this initial PER, a follow-up second volume may be considered next year, with more in-depth analyses o f public spending in specific sectors.
A. Country Context
1.5 Nicaragua i s one o f the poorest countries in Latin America, with a per capita gross national income o f only U S $ 980 in 2006 (Atlas method) and a total population o f 5.3 mi l l i~n.~ According to the 2001 Living Standards Measurement Survey (LSMS), 46 percent o f the population l ived below the national poverty line, while 15 percent lived in extreme poverty. This represented a significant decline in extreme poverty since 1993, but only a modest decline in terms o f overall poverty rates. Data from the 2005 LSMS indicate that there has been no significant change in the incidence o f poverty since 2001 , but some hrther reduction in the depth o f p ~ v e r t y . ~ Poverty i s heavily concentrated in rural areas and associated with agricultural sector activities, which still account for 12 percent o f GDP (excluding livestock and fisheries); a relatively large proportion o f by regional standards.
1.6 Nicaragua also has among the least advanced social indicators in Lat in America, which broadly corresponds to the differences in per-capita income levels. It i s notable, however, that Nicaragua’s health indicators are comparable to the averages observed across other lower-middle income economies, even though i t s average per-capita income is less than ha l f as large; Table 1.1
Table 1.1 Key Social Indicators, 2006 NIC CRI SLV GTM HND CA LAC Lower-Mid
GNI per capita (Atlas; US$) Population growth (annual rate) Education Adult Literacy Rate (%) Gross enrollment (%)
Primary Secondary
Health L i fe Expectancy at Birth (yrs) Infant Mortal i ty Rate (/1000)
980 1.9
77
112 66
70 30
4,990 1.8
95
110 79
79 11
Ave. -. 2,590 2,610 1,200 2,767
1.8 2.4 2.3 2.0
81 69 80 80
113 114 113 112 63 51 66 65
71 68 69 71 33 32 31 27
Ave. 4,767
1.3
90
118 85
73 26
Income Ave. 1,918
0.9
89
113 74
71 31
U-5 Child malnutrit ion ( %) 10 2 10 23 17 12 7 13 Source; Wor ld Bank, Development Economics LDB and WDI databases;.
L
3. Nicaragua’s population figures were revised downward after the 2005 census, which yielded a total estimated population o f 5.1 mill ion, versus an earlier estimate o f 5.5 mil l ion. This resulted in an upward revision o f the country’s GNI per capita for 2005, f rom US$9 10 to US$950. 4. The findings f rom the 2005 LSMS indicate l i t t le change in poverty indicators: the overall national poverty headcount rate increased slightly, f rom 45.8 percent in 2001 to 46.1 percent in 2005, while the extreme poverty rate fel l f rom 15.1 percent to 14.9 percent. Furthermore, the poverty gap also appears to have declined over t h i s period
12
1.7 From a macroeconomic standpoint, Nicaragua has stood out since the 1980s in both regional and worldwide comparisons on account o f its extremely high fiscal and external deficits, which have routinely exceeded 10 and 30 percent o f GDP, respectively. These large imbalances were init ial ly associated with a large accumulation o f external debt during the 1980s. Subsequently, when Nicaragua was no longer considered creditworthy for new lending on market terms, the macro-imbalances were sustained by large amounts o f foreign aid and accumulation o f debt arrears. As a result o f these imbalances, Nicaragua had become by the early 1990s one o f the most highly indebted countries in the world (with a total external debt almost reaching 400 percent o f GDP), one o f the top aid recipients, and one o f the most macro- economically unstable countries in terms o f fluctuating GDP and aggregate consumption.
1.8 Nicaragua advanced significantly in stabilizing the economy during the 1990s, but a major fiscal gap was reopened by Humcane M i t c h at the end o f 1998, a banking crisis that followed in 2000-01 and a relaxation o f fiscal control prior to the 2001 presidential elections. The banking crisis, in particular, boosted Nicaragua’s domestic public debt burden from around 20 percent o f GDP to over 30 percent. Since then, Nicaragua has succeeded in shrinking i t s fiscal and external deficits through greater fiscal discipline and tax reforms, the gradual reactivation o f economic activity and exports, and massive external debt relief, especially under the HIPC and MDFU initiative^.^ Nevertheless, the fiscal and external deficits st i l l remain high by regional standards and a source o f concern to policymakers. (The combined public sector deficit, before grants, was over 6 percent o f GDP in 2004, while the current account deficit was over 15 percent o f GDP.) Both gaps reflect the relatively large amount o f aid that Nicaragua continues to receive, coupled with a rapidly rising inf low o f private capital, most recently attracted by the improved trading opportunities offered by CAFTA.
Recent Economic Developments
1.9 After dropping to less than 1 percent in 2002, economic growth recovered to average around 4 percent in 2004-2006; Table 1.2. An important source o f growth has been the increase in exports (including maquila), which have doubled since 2002 to reach an estimated US$1,800 mi l l ion (or 33 percent o f GDP) in 2006, while aggregate demand has been stimulated by a rapid growth o f private remittances, which more than doubled since 2002 to reach an estimated US$685 mi l l ion in 2006 (or 12 percent o f GDP). Imports also increased significantly during that period, driven in part by rising o i l prices, which has had the result o f maintaining the current account deficit roughly the same in US-Dollar terms, but declining as a share o f GDP, and permitting the accumulation o f international reserves above the targeted levels.
1.10 Fiscal management has been prudent in spite o f frequently contrary political pressures. This has led to the progressive reduction in the combined public sector deficit, after grants, from -6.6 percent o f GDP in 2001 to -0.6 percent in 2006. As noted in Chapter 11, this decrease in the deficit was mainly achieved through fiscal revenue growth, some improvement in the operating balances o f public enterprises and a significant decline in the operating losses o f the Central Bank.
L
5. around 70 percent o f GDP (or 35 percent in NPV terms) in 2006.
These developments have had the effect o f reducing Nicaragua’s total external publ ic debt (in nominal terms) to
13

1.1 1 Nicaragua’s overall positive economic performance since 2002 was supported by a PRGF-arrangement approved in December 2002 and a series o f budget-support operations from the World Bank (PSAC, PRSC-I and 11) and other donors. Although progress under these arrangements has occasionally stalled, the authorities eventually succeeded in bringing the program back on track again. Accordingly, the World Bank disbursed the second tranche o f PRSC-1 in March 2006 and approved a one-tranche PRSC-2 in October 2006, while the IMF successfully concluded its Eleventh (and final) Review under the PRGF arrangement in December 2006.6
Table 1.2 Nicaragua: K e y Macroeconomic Indicators and Projections (In percent of GDP, unless indicated otherwise)
2001 2002 2003 2004 2005 2006 2007 2008 2009 2010
R i a l GDP (% change) Inf lat ion Rate (eop CPI, %) Real Effect. Exch. Rate (% change)*
Investment Public Private
Public Private
Savings and investment
Savings
Balance o f Payments Curent Account balance Gross Int. Reserves (US$ mill.)
Nominal GDP (C$ millions) Memorandum Items
3.0 0.8 2.5 5.3 4.3 3.7 3.8 4.0 4.5 5.0 4.6 4.0 6.6 9.3 9.6 9.5 16.9 9.5 7.0 7.0 2.6 2.8 3.9 0.5 -2.0 1.3 -1.0 -- -_ _-
26.8 24.9 24.8 28.0 29.6 29.5 29.2 29.2 29.1 28.6 7.4 5.0 5.4 6.7 6.9 5.8 6.9 7.8 8.0 7.9
19.4 19.9 19.4 21.3 22.7 23.7 22.3 21.4 21.1 20.7 8.8 7.0 7.6 15.4 14.7 13.7 12.2 11.2 13.8 13.9
9.0 7.4 5.6 12.5 12.6 11.9 9.8 9.6 11.4 11.6 -0.2 -0.4 2.0 2.9 2.1 1.8 2.4 1.6 2.4 2.3
-19.4 -19.1 -18.3 -12.6 -14.9 -13.2 -17.3 -25.0 -24.0 -23.0 383 454 504 670 730 924 1,103 1,192 -- _ _
55,155 57,376 61,959 71,156 81,233 93,007 105,644 124,338 138,252 155,326 GDP (US$ millions) 4,103 4,026 4,102 4,465 4,855 5,264 5,726 6,419 6,787 7,262
Source: Banco Central de Nicaragua and I M F . Notes: * (+) denotes depreciation. **Merchandise exports and imports include maqui la. ***Includes ALBA- re la ted flows as o f 2007
1.12 Nicaragua’s macroeconomic performance has remained broadly favorable during the first year o f the Ortega Administration, which has kept a tight re in on public finances and succeeded in negotiating a new PRGF program that was approved by the IMF Board in October 2007. Economic growth in 2007 is estimated to have been close to the projected level (4.2 percent) and the primary and the overall fiscal balance outcomes for 2007 are estimated to be much better than projected, though partly on account o f an under-execution o f public investment projects. However, the inflation rate (Dec-to-Dec) turned out to be considerably higher than program projections (17 percent versus 7.3 percent). This last outcome i s mainly attributable to several external shocks, which included a category 5 Hurricane (Felix) in early September 2007, followed by an unusually wet rainy season and rapidly rising international prices o f basic grains and fuels, rather than to a weakening pol icy stance. L
6. An IMF press release issued upon completion o f the Executive Board discussion o n December 11, 2006 stated that, “Nicaragua’s performance under the PRGF arrangement continues to be satisfactory, reflecting the authorities’ prudent and pro-active management. Notwithstanding the challenging circumstances o f an election year, macroeconomic stability has been maintained. Growth has remained positive, inflation has begun to decline, and the overall external position has been strengthened. International reserves have remained stable and the decline in deposits experienced in the run up to the elections i s being reversed. However, progress on structural reforms has been slow and fraught with pol i t ical diff iculty.
14

Macroeconomic Outlook and Key Fiscal Concerns
1.13 The country’s macroeconomic prospects remain broadly favorable, though fraught with much uncertainty in light o f the possible slowdown o f the global economy and rising international fuel and food prices. Economic growth i s expected to maintain the 4 percent pace averaged by Nicaragua’s economy over the last three years and gradually accelerate to 5 percent in the medium term, buoyed by continuing export growth (favorable coffee prices and growing maquila production) and a favorable investment environment supported by CAFTA, as wel l as stabilizing o i l prices. Inflation i s projected to return to within single digits. This generally positive outlook i s conditioned on the continued adherence to a prudent fiscal pol icy ~ t a n c e . ~ As indicated in Chapter I1 (Section C) and the 2007 IDA-IMF debt sustainability analysis (DSA), Nicaragua’s risk o f experiencing debt distress i s moderate, but manageable, provided that sound macroeconomic policies are applied. The HIPC and MDRI initiatives have significantly reduced the risk o f debt distress,’ but the high level o f domestic debt continues to pose a significant r isk in the medium term. Reducing that debt and the associated probability o f debt distress in the medium and long-term wil l continue to require sound macroeconomic policies, among which fiscal discipline is key.
1.14 among them,
0
Several developments over the last years have threatened to undermine fiscal discipline,
the passage o f the Municipal Transfers law in 2003, which mandates the transfer o f a growing share o f central government revenues to the municipalities without a corresponding transfer o f expenditure responsibilities, growing pressures on public sector wages and salaries from the public sector unions (a strike by the health workers crippled the health system at the beginning o f 2006, resulting in an unbudgeted increase in medical staff salaries), increasing resistance to price adjustments in transport, electricity and other public services in the face o f rising o i l prices, which required increased subsidization or reductions in service quality, and the gradual financial deterioration o f the pension system in the absence o f further reforms, which also would require increased subsidization by the central government or eventually trigger the system’s collapse.
These developments pose important challenges that the authorities wil l need to address in order for the positive outlook described above to fully materialize.
0
0
0
B. Two Key Development Issues
1.15 The 2001 Nicaragua PER drew attention to several broad issues that included the need for (i) further fiscal adjustment to restore fiscal sustainability, with primary attention to expenditure cuts in the short run and raising tax revenues in the medium term, (ii) achieving a better balance
L
’ T w o other major sources o f risk for the realization o f this positive macroeconomic scenario are a slowdown in the US. and global economies, which emerged as a significant threat in late 2007, and a deteriorating investment climate o n account o f continuing polit ical tensions between the Executive and Legislative branches o f government. 8. A second commercial debt buy-back operation, which was concluded in 2007, should contribute to the normalization o f financial relations with international creditors and help reduce fiuther the probabilities o f fbture debt distress.
15
in the composition o f public expenditures by removing the bias in favor o f capital spending and giving more attention to operating and maintenance expenditures, (iii) gradually introducing a medium term expenditure framework to permit better expenditure planning and budgeting, (iv) designing mechanisms to improve donor coordination (including through sector wide approaches) in the context o f a high aid dependence, (v) improving the mechanisms to track and target public funds designated for poverty reducing activities and, (vi) reviewing the justification for earmarking revenues and considering how it can be reduced. That PER served as analytical background for the PSAC and PRSC-I, which supported actions to address these reform needs, and the authorities have made significant progress in implementing i t s recommendations. While many o f these issues are st i l l being addressed and continue to be relevant for Nicaragua, additional issues for public sector management have gained prominence in the last few years. These include a need to devote more attention to fiscal decentralization, and to human resource management and remuneration in the public sector.
1.16 The Fiscal Transfers Law approved in 2003 mandated the transfer o f 4 percent o f tax revenues to the municipalities in 2004. Furthermore, the law also mandated that the share o f revenues to be transferred i s to increase by at least 1 percent every year - provided that GDP grows by at least 1 percent in the previous year - until i t reaches at least 10 percent. While this law is welcomed by many who emphasize the merits o f greater decentralization in public decision-making, i t also poses a sudden fiscal challenge for the central government, considering that previously the transfer share had generally averaged around 1 percent o f total central government budget, while the currently mandated revenue transfer has not been accompanied by any mandated expenditure transfers.
1.17 The Fiscal Transfers Law has been modified twice since its initial passage, and the authorities have passed executive decrees that sought to limit the fiscal impact o f the Law by reducing expenditures at the central level on items that the Municipal Law identifies as being a municipal responsibility. These corrective efforts, however, only partly succeeded in limiting the threat o f fiscal destabilization. This i s in part because the authorities relied solely on expenditure cuts as a mitigating measure, without changing any laws to ensure long-term fiscal sustainability. Furthermore, various shortcomings o f the Municipal Law limit i t s capacity to serve as a framework for guiding the decentralization process. A meaninghl decentralization process requires new legislation that establishes unambiguously the expenditure responsibilities o f the municipalities, together with complementary measures that allow the municipalities to control all the inputs needed to produce services and the transfer o f enough resources and different funding mechanisms to allow municipal governments to discharge those responsibilities, finding a balance between national and local expenditure objectives. This issue is addressed in Chapter V.
1.18 Public sector wages and salaries have been increasing as a share o f GDP since the mid-1990s. Although the size o f the public wage bill s t i l l appears to be relatively modest by the standards o f some neighboring countries, its growth has been a source o f concern as a potential threat to macroeconomic stability. That concern was heightened in mid-2006 with the passage o f an Education law that - until i t was amended - had threatened to raise total spending teacher salaries in an unsustainable manner. Related concerns are the high variation in public sector wages across entities and j o b categories within the public sector, and the lack o f a general wage and staffing pol icy framework in the government. Though the National Congress approved a C iv i l Service Law in 2004 that was designed to address these
Fiscal Decentralization.
Public Sector Salaries and Staffing.
16

two concerns, implementation o f the Law has been slow, resulting in tense annual wage negotiations that often prove disruptive and lead to outcomes that often bear little relation to the country's economic capacity.'
1.19 Another consequence o f weaknesses in the existing c iv i l service framework i s the excessive reliance on consultants, who are often paid under donor-financed projects that are registered as public investment. In addition to engendering an economic misclassification o f public expenditures, this practice also has contributed to (i) undermining the financial sustainability o f key public sector positions and even o f institutions themselves," (ii) widening existing wage disparities within agencies, with depressing consequences o n staff morale, (iii) the wasting o f training resources on temporary staff, (iv) the emergence o f potential contingent fiscal liabilities arising from consultants' rights to social benefits, and (v) decreasing the likelihood o f continuity o f projects and activities managed by consultants. These issues are addressed in Chapter N.
C. Summary Outline of the PER
1.20 This PER updates the analysis contained in the 2001 PER with respect to several key issues that remain relevant today and which are described in paragraph 1.15, while also covering new ground in terms o f analyzing the new challenges facing the authorities in the areas o f fiscal decentralization and c iv i l service reform.
1.21 Chapter I1 presents an overview o f public finances, reviewing the evolution o f total public revenues and expenditures, and discusses the nature o f the adjustment process that has taken place since 2001. I t reviews the composition o f public expenditures, along economic, institutional and functional dimensions, and provides some cross-country comparisons to assess the overall size o f public spending in Nicaragua. This chapter also reviews the progress made since 2001 in restoring fiscal sustainability, and concludes by pointing out several key fiscal challenges facing the authorities in the short and medium term.
1.22 Chapter I11 picks up from the discussion in the 2004 Nicaragua Development Policy Review, focusing on the link between public expenditures and economic growth, and drawing particular attention to the public infrastructure, education and health sectors. I t evaluates the quantity and quality o f public spending in Nicaragua, with summary assessments o f public spending and sector performance in these three key sectors. (These summary assessments draw on more extensive sector discussions contained in Annexes C through I o f the PER.). I t also summarizes the main findings on the efficiency o f public expenditures from recent cross-country comparative data compiled by the World Bank.
1.23 Chapter IV focuses on the overall size and composition o f public employment, and on the structure o f remuneration. I t discusses recent reforms to restructure and professionalize the c iv i l L
9. For instance, public sector doctors went o n strike in late 2005 to demand salaries comparable to those pa id in other Central American countries, whose per-capita GDPs are a l l higher than Nicaragua's. The strike lasted more than six months and had a perceptible impact o n the health indicators o f the poorer segments o f the population. I t eventually resulted in the passage o f legislation in December 2006 that gradually equates health sector salaries to a regional benchmark. 10. Recent cases include the Nicaraguan Municipal Support Institute (INIFOM) and the Agricultural Technology Institute (INTA), bo th o f which re ly o n donor projects to cover their salary b i l ls and which have had major difficulties in financing salaries after closure o f such projects.
17

service in Nicaragua. The size, structure and evolution o f the public wage bill are compared to that in other sectors and countries in the region. The chapter concludes with a set o f recommendations on further steps needed to modernize and streamline remuneration pol icy in Nicaragua's public sector.
1.24 Chapter V reviews the status and prospects o f fiscal decentralization in Nicaragua. While much o f the impetus for decentralizing public expenditures has been political, there are also strong reasons for seeking to decentralize on the basis o f efficiency considerations. This chapter (i) recounts key steps in the decentralization process since 1987, particularly as those relate to the assignment o f roles and resources, (ii) discusses the budget transfer ru les from central to municipal governments, followed by an analysis o f municipal expenditures, (iii) scrutinizes the accountability mechanisms for municipal expenditures, and (iv) highlights key fiscal imbalances that undermine the present system, and current efforts underway to remedy those shortcomings. The chapter concludes with a series o f pol icy options and potential areas o f World Bank support.
1.25 Chapter V I assesses the overall performance o f public financial management (PFM) institutions and systems in Nicaragua, based on an international framework o f reference that addresses seven critical dimensions: (i) credibility o f the budget; (ii) comprehensiveness and transparency; (iii) budget planning; (iv) predictability and control in budget execution; (v) accounting, recording and reporting; (vi) external scrutiny and audit; and (vii) donor practices that affect PFM." I t also reviews the progress made in modernizing public expenditure management systems in the period since the 2004 Country Financial Accountability Assessment (CFAA), spelling out the remaining obstacles in the way to improving public financial management and providing strategic recommendations on how to move forward.
Links to Other Economic and Sector Work
1.26 The 2001 Public Expenditure Review has served as the starting point for tracking fiscal developments in Nicaragua since 2000. More recent core Economic & Sector Work on Nicaragua prepared by the Bank includes the 2003 Poverty Assessment, the 2004 Development Policy Review, the 2004 Country Financial Accountability Assessment (CFAA), the 2004 Country Procurement Assessment Report (CPAR), and the 2004 Decentralization Policy Study.
1.27 In parallel to this PER, the Bank has also prepared a Poverty Assessment, an Institutional and Governance Review (IGR), and an Energy Strategy Study. The Poverty Assessment analyzes the results from the 2005 LSMS and reviews the poverty impact o f public expenditures. This PER, therefore, devotes less attention on the poverty implications and incidence o f public spending, and focuses more on aspects o f expenditure management and growth. Similarly, i t focuses on the fiscal aspects relating to the energy sector, which has become another area o f vulnerability, rather than duplicating the work o f the Energy Strategy Study.
L
1 1. T h i s chapter i s based primarily on P F M performance measurement analytics undertaken through a partnership o f the Government o f Nicaragua with the British Department for International Development (DFID), the European Commission (EC), the Inter-American Development Bank, and the Wor ld Bank. The performance measurement framework was developed by the Public Expenditure and Financial Accountability (PEFA) partnership.
18

CHAPTER I1 OVERVIEW OF PUBLIC SECTOR SPENDING AND FISCAL SUSTAINABILITY
I Domestic Resources OWn
Revenues Treasury Credits
19,915 -- -3,125 2,970 6,560 -1685
-- 5,544 -1,584 161 137 3,5 14 -256
-- 1,793 -455 98 744 175
-- 865 -134 169
23,352 10,939 -5,200
-- --
-- --
A. Overview o f the Public Sector and the Composition of Public Spending
External Resources
Grants Credits
4,017 3,349 -- -- -- -_ -- --
297 723 _ _ 283
288 383 -- 116
4,314 4,188 -- --
2.1 At the national level, Nicaragua’s public sector consists o f the central government (comprising 12 ministries, 3 powers o f the State and various subordinated agencies), over 50 decentralized institutions (including the social security institute, 10 public universities, and 2 regional governments and councils), 10 public enterprises and 4 public financial institutions. At the local level, Nicaragua i s divided into 152 municipalities, which are the most basic political administrative units. Between the local and national levels there i s an intermediate political administrative level consisting o f 15 departments and 2 autonomous regions o n the Atlantic coast (RAAN and M A S ) . In contrast to the Municipal governments, which are elected by popular vote every 4 years and have their own budget and legislative powers, the Departmental governors are appointed by the President o f the Republic (who i s elected every 5 years) and serve as an extension o f the Executive branch o f the national government. The two autonomous regions represent a mix o f the departmental and municipal forms o f governmental organization: each is led by a regional Governor appointed by the President o f the Republic and by a regional Council whose members are elected by popular vote every 4 years.
% of projected GDP 35.7%
Table 2.1 Nicaragua: Financial Structure of the National Public Sector Budget; 2007
22.2% 10.4% -4.9% 1 4.1% 4.0%
% o f Budget Total
24,156 64.3% 7,845 20.9% 3,961 10.5%
161 0.4% 4,415 11.7% 1,621 4.3% 1,687 4.5%
847 2.3% 169 0.4%
37,593 100%
2.2 The relative sizes o f the different entities comprising the national public sector are shown in Table 2.1, which is based on the 2007 draft budget that was sent to the National Assembly. By far the largest entity is the central government, which accounts for almost two-thirds o f the consolidated national public sector budget. The decentralized institutions account for another 2 1 percent o f the total budget, with the social security institute, INSS, alone responsible for ha l f o f that amount. The public enterprises account for most o f the remaining public expenditures (1 1.7 percent), with the two largest entities being the electric utility (ENEL) and the water utility (ENACAL). About 80 percent o f total central government spending i s paid for with resources
19

from the treasury, while the remainder i s paid with foreign aid, either in the form o f grants or concessional credits. Except for INSS, the decentralized and autonomous institutions, as well as the regional governments, rely mostly on transfers from the central government to finance their expenditures. The public enterprises and public financial institutions, in contrast, primarily finance their expenditures through the sale o f services.
2.3 The 2007 draft budget also gives us an approximation o f the State’s overall footprint on the economy. The economic size o f the national government i s estimated to be around 32 percent o f projected GDP (derived by netting out the central government transfers12 from the total consolidated budget in Table 2.1). In addition, the total spending by the municipalities, net o f the transfers received from the central government, is between 1 and 2 percent o f GDP. Finally, if we add the projected operating losses o f the central bank, plus the total spending by the public universities (net o f central government transfers), we arrive at a grand total o f around 35 percent o f GDP for the combined (national + local) public sector spending contemplated in the 2007 budget.13
Fiscal Balances of the Non-Financial Public Sector
2.4 During the 1980s, Nicaragua developed a massive public debt and a high dependence o f foreign aid, both o f which were reflected in huge fiscal deficits compared to other countries in Latin America. By 1998, the government had largely succeeded in reducing its fiscal deficit to sustainable levels, through a combination o f structural reforms, austerity measures and debt relief. These efforts were largely undone by hurricane Mitch, with struck the region in October 1998 and reopened a large fiscal gap. The deficit o f the non-financial public sector increased from under 2 percent o f GDP in 1998 to almost 9 percent in 2000, and was mainly financed through increases in foreign aid and concessional credits; Table 2.2. Although post-hurricane reconstruction activities and the associated aid flows had been winding down by 2001, the fiscal deficit before grants continued to grow to almost 10 percent o f GDP. This represented a primary deficit after grants o f -2.8 percent that was clearly unsustainable, forcing the incoming B o l a o s administration to make drastic adjustments in 2002 to avoid a fiscal crisis. The deficit before grants has been declining gradually since 2002, yielding a primary fiscal surplus after grants.
L
12. These transfers refer t o the treasury resources that are financing expenditures by entities other than the central government. 13.These expenditure estimates for entities excluded f rom the national budget (universities, municipalities and Central Bank) are largely based on conjecture. Data on total spending by the public universities i s not publ icly available. Considering that the cost recovery practiced by the public universities continues to be very limited, however, total spending by that sector is not l ike ly to diverge very much f rom the transfers received f rom the central government. With respect to municipal spending, the Bank’s 2004 Policy Note o n ‘Municipal Decentralization in Nicaragua’ indicates (pg. 8) that the total municipal spending financed f r o m municipal revenues i s roughly equivalent to the amount o f municipal spending financed with central government transfers - which represent 1.2 percent o f GDP in 2007 draft budget. The operating losses o f the Central Bank for 2007 are projected at 0.7 percent o f GDP in the Med ium Term Expenditure framework that accompanies the 2007 draft budget.
20

Table 2.2 Nicaragua: Fiscal Balances of the Non-Financial Public Sector (As percent of GDP, unless indicated otherwise)
1998 1999 2000 2001 2002 2003 2004 2005 2006 Revenue 21.5 21.2 21.1 20.4 21.2 22.8 25.1 25.9 27.6
Of which: Taxes 15.1 14.8 14.5 13.4 14.2 15.9 16.5 17.4 17.8
Expenditure 23.2 28.1 30.0 30.0 26.3 28.9 30.1 30.2 31.3 Of which: Interest 3.2 3.3 3.6 3.8 2.9 3.1 2.1 1.9 1.8
Overall Balance before grants -1.7 -6.9 -8.9 -9.6 -5.1 -6.1 -5.0 -4.3 -3.7 after grants 0.5 -1.8 -4.4 -6.6 -1.9 -2.3 -1.3 -0.9 0.2
Primary Balance a. grants 3.7 1.5 -0.8 -2.8 1.0 0.8 0.8 1 .o 2.0 Memo items: Primary Balance (Combined Public Sector) -2.8 -0.3 0.1 0.3 0.8 2.2 Nominal GDP (C$ million) 37,805 44,198 49,952 55,155 57,376 61,959 71,156 81,233 93,007 Source: Central Bank o f Nicaragua and IMF.
B 2 5 : (3 20 * u 0 [ 10
5
2.5 The reduction o f the fiscal deficit was brought about entirely through increases in fiscal revenues, rather than a decline in expenditures. Although total expenditures exhibited a significant decline in 2002 and 2003, they have since then g o w n again as a percent o f GDP to surpass the levels reached in the immediate aftermath o f hurricane Mitch. In contrast, tax revenues rose continuously, from 13 percent o f GDP in 2001 to almost 18 percent in 2006. This increase was made possible through a series o f tax reforms, followed by improvements in tax administration and a buoyant tax response to a growing economy.
total expenditures /- ---
total minw interest 15.''
interest payments
Economic Composition of Central Government Expenditures
2.6 The 2001 PER had noted that the GDP share o f total central government expenditures remained remarkably stable during the 1990s, prior to hurricane Mitch, and was mainly influenced by the evolution o f interest payments
Figure 2.1 Nicaragua: Evolution of Total Central Government Expenditures
I I
30 l--------
Source: Statistical Annex Tables.
on the public debt. Following hurricane Mitch, non-interest central government spending spiked up from under 15 percent o f GDP in 1996-98 to around 21 percent in 1999-2000, reflecting a surge o f investment spending associated with reconstruction activities and increased aid inflows.
21

As the reconstruction surge subsided, non-interest spending declined temporarily. Since 2002, however, i t has been drifting upward again, reaching 21 percent o f GDP in 2006;14 Figure 2.1.
2.7 The growth in non-interest central government spending after 2002 i s mainly attributable to an increase o f investment spending and an increase in current transfers. The increase in public investment i s closely linked to increases in foreign aid flows; Table 2.3. The increase in foreign aid, moreover, reflects the restoration o f macroeconomic discipline and adoption o f important structural reforms, which led to a new PRGF program with the IMF in 2003 and facilitated greater access to concessional credit^.'^ The increase in public investment spending after 2002 also coincided with the Bolaiios administration’s renewed emphasis on investment in productive activities under i t s National Development Plan (PND), which regarded the acceleration o f growth as the main ingredient for reducing poverty.
Table 2.3 Nicaragua - Economic Composition of Central Government Expenditures (As percent of GDP)
1996 1997 1998 1999 2000 2001 2002 2003 2004 2005 2006
Total Revenues 13.0 14.6 15.9 15.4 14.9 13.8 14.8 16.4 17.2 18.1 18.8 o/w Tax Revenues -_ -- 14.3 13.9 13.6 12.6 13.4 15.1 15.7 16.8 17.4
Total Expenditures Current Expenditures
Consumption Wages & Salaries Goods & Services
Internal External
Current Transfers Capital Expenditures
o/w Fixed Investment Capital Transfers
Interest
17.4 17.8 17.8 22.9 21.9 20.5 20.4 24.1 22.4 22.6 22.7 11.4 11.9 12.4 12.2 12.4 13.1 13.8 15.5 12.8 13.0 15.5 6.9 6.1 7.0 7.3 7.6 7.7 7.6 7.7 7.2 7.3 8.2 3.7 3.8 4.4 4.5 4.6 4.9 5.1 5.3 4.9 4.9 5.2 3.2 2.3 2.6 2.8 3.0 2.8 2.5 2.4 2.3 2.4 3.0 1.7 2.8 2.6 1.9 1.8 2.1 2.7 4.3 1.9 1.0 1.7 0.2 0.3 0.8 0.7 0.6 0.7 1.6 2.5 1.6 0.6 -- 1.6 2.5 1.8 1.2 1.2 1.4 1.1 1.9 0.3 0.4 -- 2.8 3.0 2.7 2.9 3.0 3.3 3.6 3.5 3.8 4.7 5.5 6.0 5.9 5.4 10.7 9.5 7.4 6.6 8.6 9.6 9.5 7.3 3.3 3.1 3.2 5.2 5.3 3.9 4.2 5.5 6.0 5.4 3.5 2.5 2.8 2.2 4.9 4.2 3.5 2.4 3.1 3.7 4.1 3.9
Overall Deficit (before grants) -4.4 -3.3 -1.9 -7.5 -7.0 -6.7 -5.6 -7.8 -5.3 -4.5 -3.9 Net Financing
External Grants 4.1 2.6 0.0 4.4 3.3 3.5 3.7 5.3 2.8 3.8 3.8 Net External Financing 3.0 0.8 1.5 5.4 2.5 1.8 2.0 4.0 5.7 3.5 2.7 Net Domestic Financing -2.8 -0.1 0.4 -2.3 1.3 1.4 -0.1 -1.5 -3.2 -2.8 -2.6
Source: Ministerio de Hacienda y Credit0 Publico. Note: Figures represent actual expenditures on a cash basis.
2.8 As shown in Table 2.4 below, the share o f total central government spending in the Infrastructure and Production sector has been stagnant since 2002, which suggests that most o f the increase in investment spending took place in other sectors. This i s corroborated by Nicaragua’s somewhat modest growth performance during the last four years. Averaging 9 percent o f GDP during 2003-06, public investment in Nicaragua i s about twice as high as in other countries in the region. At the same time, Nicaragua’s per capita growth performance in recent years has not significantly exceeded the regional average, which suggests that either the large amount o f public investment has been displacing private investment or i s not contributing to a faster accumulation o f productive capital; see paras. 3.4-3.5.
L
14. which cost over 1 percent o f GDP. 15. capital expenditures, even though they may be financing current expenditures.
The jump in expenditures to over 24 percent o f GDP in 2006 i s partly explained by the elections in 2006,
It i s important to recognize in this context that donor-financed public expenditures are generally recorded as
22

2.9 Consumption spending, on the other hand, has hard ly changed since 2002, and w h i l e interest payments on the pub l ic external debt have declined signi f icant ly as a resul t o f various debt re l ie f in i t iat ives since the mid- l990s, th is was most ly offset by increased interest payments on the domestic publ ic debt, increased current transfer payments and a n u p w a r d drift in publ ic salary expenditures as a share o f GDP; Figure 2.2. M o s t notable i s the increase in transfer payments during the last two years, w h i c h i s par t l y explained by the increase in central government transfers to the municipalit ies, as mandated by the L a w o f M u n i c i p a l Transfers (Ley No. 466) that was passed in 2004.
Figure 2.2: Nicaragua: Evolution of Central Government Wage Bill
6.0 I
s 2.0
1 .o
60%
50% E 55% E
= E 45% 0
35% v,
m c c
40% % g
30% S 25%
Source: MHCP.
2.10 E v e n though the GDP share o f actual central government spending has been steadily drifting upward since 2001, the budgets presented to Congress have been exhib i t ing a dec l in ing trend, until 2006; F igure 2.3. Another noteworthy feature o f the i n i t i a l budgets presented to Congress each year i s that they systematically under-estimate the budget execution: since 1992, actual central government expenditures have exceeded, o n average, the i n i t i a l budget presented to Congress by 1 percent o f GDP, and they have only fal len b e l o w the i n i t i a l budget in two years over that entire period, namely 2001 and 2002. l6 This pattern reveals cont inu ing problems in publ ic expenditure management, especially in the area o f budgeting.
L
16. The prevalence o f budget earmarking (e.g., the public universities are constitutionally entitled to receive 6 percent o f the total central government budget) generates an incentive to under-program the budget, and to take a very conservative approach by no t including aid-financed project expenditures in the budget until the requisite financing has been secured. Until recently, the Executive could increase the budget during the course o f the fiscal year without requiring immediate legislative approval if adequate sources o f funding (loans and grants) became available, and approval could be obtained by means o f retroactive amendments o f the budget law; see Chapter VI, paras. 6.1 13-6.1 17. With the passage o f the Financial Management and Budget Regime Management L a w (No. 550) o f 2005, however, this practice is n o longer permitted as legislative scrutiny o f any budget changes has been strengthened.
23

Figure 2.3: Total Central Government Expenditures; 1994-2006 (Budgeted versus Executed)
30% I 1 25% 20% 15% 10% 5% 0%
-5%
* - Actual
- c - - -
I ’ * - Budget I
Difference (actual - budget) -
I
Source: Min is te r io de Hacienda y Credit0 Publ ico.
Table 2.4 Nicaragua - Sector ComDosition of Central Government ExDenditures
Social Services olw Education
Health Infrastructure and Production Defense and Security General Services Others Interest on Public Debt
TOTAL
Social Services olw Education
Health Infrastructure and Production Defense and Security General Services Others Interest on Public Debt
1996 1997 1998 1999
6.5 6.5 5.9 9.0 2.8 3.1 3.0 3.9 2.6 2.4 2.2 3.2 3.5 4.2 4.7 6.8 2.1 1.7 1.6 1.6 3.5 2.3 2.5 2.8 0.0 0.3 0.2 0.6 1.7 2.8 2.6 1.9
17.4 17.8 17.6 22.8
2000 2001 2002 As percent of GDP
8.6 7.4 8.1 3.8 3.6 3.9 3.1 2.8 2.9 5.9 4.8 3.6 1.7 1.7 2.0 3.9 3.5 2.6 0.0 0.9 1.0 1.8 2.1 2.7
21.9 20.3 20.0
2003 2004 20051 2006b
9.5 10.0 10.91 9.9 4.2 4.0 4.7: 4.3 3.3 3.0 3.41 3.0 3.8 4.4 4.01 4.3 2.1 1.8 1.81 1.8 2.5 2.7 3.41 3.2 1.4 1.5 1.31 1.6 4.3 2.0 1.21 1.8
23.6 22.4 22.61 22.6 As percent of Total Expenditures
37.6 36.3 33.5 39.3 39.3 36.2 40.4 40.3 16.2 17.7 16.9 17.2 17.4 17.7 19.3 18.0 14.7 13.4 12.4 14.1 14.2 13.8 14.5 13.9 20.4 23.7 26.9 29.8 26.9 23.6 18.2 16.2 11.8 9.6 9.1 7.2 7.8 8.2 10.0 8.7 20.2 12.6 14.4 12.4 17.8 17.2 13.2 10.4
0.0 1.9 1.2 2.8 0.0 4.3 4.9 6.0 10.0 15.9 14.9 8.5 8.2 10.5 13.3 18.3
44.6 48.21 43.8 17.7 20.81 19.1 13.3 15.0; 13.4 19.6 17.71 19.0 8.1 8.0: 7.9
12.0 15.0: 14.3 6.7 5.81 7.1 8.9 5.3; 7.8
24
Sector Composition of Central Government Expenditures
2.11 The 2001 PER had noted a significant shift in the sector distribution o f central government expenditures after hurricane Mitch, with the social sectors accounting for almost two-thirds o f the total increase in non-interest expenditures and the Infrastructure and Production sectors accounting for the other third. Since 2001, social sector spending has continued to expand, both as a share o f GDP and as a share o f total central government expenditures; Table 2.4. In fact, the increase in total central government spending after 2001 i s entirely accounted for by the increase in social sector spending. Close to one-half o f the total central government spending currently takes place in the social sectors. The shares o f public spending o n the Infrastructure and Productive sectors, on the other hand, have reverted to their lower pre- hurricane M i t ch levels, and currently account for around 20 percent o f total spending.
Institutional Composition of Central Government Expenditures
2.12 The largest central government institutions are the Ministries o f Health and Education, which together account for around 30 percent o f total central government spending. The next largest institutions are the Ministries o f Governance (police) and o f Transport & Infrastructure, each o f which accounts for between 5 and 10 percent o f total central government spending. I t i s also noteworthy that about one-third o f total central government spending i s in the form o f transfers to other institutions outside the central government.
2.13 The increase in transfers to other institutions represents the most important shift in the institutional composition o f central government spending since 2002. As shown in the next-to- last column o f Table 2.5, the share o f total central government spending devoted to transfers has increased by 33 percent between 2002 and 2006 Meanwhile, spending shares have declined in al l central government institutions, except for the Ministry o f Economy, the Ministry o f the Family, the Attorney General’s office, and the Supreme Electoral Council, which coordinated the 2006 Presidential elections. Except for the Electoral Council, these latter entities spend relatively little in absolute terms, however, and therefore have only played a limited role in influencing the overall composition o f central government expenditures.
2.14 The institutions that have been most influential in the growth o f central government expenditures since 2002 have been the Ministries o f Education and Health, as wel l as the decentralized institutions. As shown in the last column o f Table 2.5, total non-interest central government expenditures increased by 2.73 percent o f GDP from 2002 to 2006. O f that increase, the Ministry o f Education contributed 0.43 percent o f GDP, and the Ministry o f Health contributed another 0.38 percent. Even though these two ministries experienced a decline in their shares o f total central government spending, they are mainly responsible among the central government agencies for the increase in public spending. The most important source o f increased public spending, however, has been the increase in transfers to decentralized and autonomous institutions outside o f the central government. Within that spending category, the transfers to the municipalities increased by 0.82 percent o f GDP, which represents the single most important source o f growth in central government expenditures over that period.
25

Table 2.5 Nicaragua - Institutional Composition of Central Government Expenditures (As percent of total central government expenditures)
1997 1998 1999 2000 2001 2002 2003 2004 2005 2006 2 0 0 6 ~ ~ 2 0 0 2 % change absolute spending change in GDP
share shares as percent of Total CG expenditures (excluding debt service) National Assembly 1.9 2.1 1.6 1.7 1.9 2.0 2.0 1.7 1.7 1.6 -16% -0.01 Supreme Court Supreme Electoral Council Comptroller General Office of the Presidency Ministry o f Governance Ministry o f External Relations Ministry o f Defense Ministry o f Finance Ministry o f Economy Ministry o f Education Ministry o f Agriculture & For. Ministry of Transport & Infrast. Ministry of Health Ministry of Labor Ministry of Environment Ministry of the Family Municipal Development Institute Attorney General Other Institutions
FISE Transfers to Universities Transfers to Municipalities
oiw IDR (PNDR)
3.2 4.0 2.8 3.2 3.7 3.8 4.0 3.4 3.7 4.4 1.1 1.3 0.7 0.8 6.7 2.1 0.8 2.2 1.4 4.8 0.6 0.7 0.4 0.4 0.6 0.7 0.6 0.6 0.6 0.6 3.7 2.3 4.7 3.1 2.2 2.4 1.8 1.4 1.3 1.4 5.5 5.8 4.4 4.1 5.3 6.4 6.2 5.4 5.4 5.4 2.8 2.6 1.9 2.2 2.5 2.6 2.2 1.9 1.8 1.8 6.0 4.9 3.4 3.4 3.7 4.9 4.4 3.6 3.3 3.4 2.9 3.6 2.4 2.3 0.9 0.9 0.7 0.6 0.6 0.6 0.7 1.6 0.7 0.8 0.9 1.1 1.4 1.4 1.4 1.8
14.8 13.4 13.8 15.2 13.6 15.1 15.0 14.2 14.9 15.2 4.7 4.4 4.9 3.7 3.4 3.4 3.3 2.9 2.6 2.8 9.7 13.1 15.9 14.3 12.1 9.3 8.7 9.2 8.2 4.6
16.0 14.6 15.3 18.5 15.3 16.5 16.8 14.7 15.3 16.1 0.5 0.5 0.6 0.9 0.6 0.5 0.4 0.4 0.5 0.5 2.5 2.6 1.7 2.4 1.9 1.7 1.8 2.3 1.6 1.5 0.4 0.6 1.5 2.2 1.2 1.3 2.5 2.9 2.2 1.6 1.1 1.3 3.7 3.3 1.4 1.1 1.0 1.1 0.9 0.0 0.3 0.3 0.2 0.2 0.2 0.1 0.2 0.1 0.1 0.2
21.8 20.2 19.2 17.3 22.0 23.9 26.2 29.9 32.6 31.7 4.0 4.5 5.6 5.6 4.6 3.1 2.9 2.7 3.0 2.6
5.9 6.2 4.5 4.9 5.8 6.7 6.6 5.2 5.4 6.5 0.0 0.0 0.3 0.7 1.0 1.5 1.2 2.8 4.9 5.4
0.8 0.8 -- 0.9 0.6 2.6 4.9 5.8 4.7 1.7
14% 0.21 131% 0.61 -14% 0.00 -44% -0.15 -16% -0.03 -30% -0.09 -32% -0.18 -34% -0.04 63% 0.17 0% 0.43
-18% -0.03 -50% -0.70 -2% 0.38 -5% 0.01
-13% 0.00 23% 0.09
-100% -0.19 18% 0.01 33% 2.23 -17% -0.03 -36% -0.12 -2% 0.14
260% 0.82
Total 100.0 100.0 100.0 100.0 100.0 100.0 100.0 100.0 100.0 100.0 0% 2.73 Source: Ministerio de Hacienda y Credit0 Publico. Note: Total CG expenditures exclude debt service.
B. The Pattern of Recent Fiscal Adjustments and Size of Government
2.15 The earlier discussion suggested that the fiscal adjustments and discipl ined pol ic ies applied over the last 5 years, coupled with external support through the HIPC and MDRI initiatives, have brought the fiscal situation largely under contro l fkom a sustainability perspective. A s shown in Table 2.2, however, the fiscal def ic i t was reduced entirely through increases on the revenue side, without any significant reductions on the expenditure side. This pattern o f adjustment raises some concerns with respect to the permanence o f past f iscal reforms.
2.16 A significant body o f research on the link between the composi t ion o f f iscal adjustments and the l ike l ihood o f successful f iscal re fo rm has questioned the permanence o f fiscal adjustments that are m a i n l y revenue based. U s i n g a sample o f OECD countries, Alesina and Perotti (1 995) find that successful adjustment^'^ have re l ied most ly on expenditure cuts (especially reductions in transfers and the publ ic wage bill), w h i l e unsuccessful ones have most ly rel ied on tax increases. U s i n g a somewhat different methodology, Von Hagen and Strauch (2001) arrive at a s imi lar conclusion. They found that ‘unsuccessful consolidations have re l ied almost exclusively on increasing revenues, wh i le successful ones put heavy emphasis on cut t ing
L
17. Alesina and Perotti (1995) “Fiscal Expansions and Fiscal Adjustments in O E C D Countries” define a successful adjustment as “a very tight fiscal stance in year t such that the gross debt/GDP ratio in year t+3 i s at least 5 percentage points o f GDP lower than in year t”.
26

government spending’. In a similar vein, a “survival analysis’’ applied to a sample o f 29 developing countries by Gupta et al. (2004) finds that a reallocation o f current expenditures to capital outlays tends to render fiscal adjustments more permanent, while large levels o f wages and salaries, transfers, and subsidies tend to have the opposite effect. Other studies, however, indicate that expenditure based adjustments are also not in themselves sufficient to maintain healthy public finances over the medium term; Gupta et a1 (2003).18 These research findings suggest that the Nicaraguan authorities must remain wary o f pressures to overturn previous fiscal reforms, and should seek to pursue a more balanced approach when new adjustment needs emerge, by combining revenue raising measures with expenditure cuts.
countries in Central America), while its to tal expenditure level was very close to the regional average; Table 2.6.19 On the basis o f such regional comp~sons, the 2001 PER had
Table 2.6 Central Government Revenues and Expenditures
in Latin America & the Caribbean Tax RevenuedGDP Total Expenditures
20001200 1 200312005 20001200 1 2003/2005 Nicaragua 13.1% 15.8% 2 1.2% 22.4% Central America 3* 12.1% 13.1% 17.5% 17.8% Latin America & Car. 14.9% 16.2% 22.4% 22.7% Source: Wor ld Bank, Development Data Platform, LDB Database. Note: Central America 3 refers to El Salvador, Guatemala, and Honduras .
I s Nicaragua ’s Public Sector Oversized?
2.18 By focusing entirely on revenue mobilization, recent fiscal adjustments have had the effect o f gradually expanding the size o f public expenditures. This raises the question o f whether Nicaragua’s public sector may have grown too large. Leaving aside for the moment considerations o f fiscal sustainability, there is little to go by in seeking to assess whether a L
18. Gupta, Sanjeev, E. Baldacci, B. Clements and E.Tiongsen (2003), “What Sustains Fiscal Consolidations in Emerging Market Countries? (IMF Work ing Paper No. 03/224). I t is also important to keep in mind that most o f the studies cited here have focused o n emerging market and OECD economies, wh ich typically have higher levels o f spending and taxation than l o w income counties such as Nicaragua. Extending this research to lower income countries i s clearly called for. 19. In 2001, Nicaragua’s national income accounts were s t i l l unrevised, reflecting a substantially undervalued GDP. As a result, the public expenditure and tax ratios based o n the off icial figures were substantially higher than the regional averages. The PER’S recommendations were based instead o n adjusted figures that reflected an estimated GDP under-valuation o f 70 percent, which was subsequently borne out by the revised national income accounts that were published in 2003.
27

country's public sector i s too large, too small or about right. National preferences for public versus private goods differ across countries, and this i s reflected in significant variations in the size o f public sectors. One way o f forming a judgment about the appropriate size o f government i s through the use o f international comparisons, as done in the previous benchmarking comparison o f central government revenues and expenditures. The top panels o f Figure 2.4 present a similar comparison o f total public revenues and expenditures across various countries and country groupings2' as shares o f GDP, using a broader measure o f government, namely the Non-Financial Public Sector. Based on these figures, Nicaragua appears to have a somewhat larger public sector than the Central American average under both measures o f government size, and in comparison to the Latin America average with respect to the expenditure-based measure.
2.19 These measures cannot be taken at face value, however, as there exists a positive and statistically significant relationship between the size o f the government and income levels across countries; shown in the middle panels o f Figure 2.4. Accordingly, the bottom panels in Figure 2.4 present the measures o f government size controlling for differences in per capita income levels. That is, they measure the size o f government as the difference between the actual size o f public sector revenues (or expenditures) and the size predicted by the income level o f that country. Based on these adjusted figures, Nicaragua continues to exhibit levels o f public spending and revenues that are higher than the regional averages, but they do not stand out in a wider global comparison.
L
20. The Lat in American average i s based o n Argentina, Mexico, Chile, Peru, and Colombia. The average for Europe i s based on Belgium, Denmark, Germany, Ireland, Italy, and Netherlands.
28

Figure 2.4: Measures of Government Size: Expenditures and Revenues of the Non-Financial Public Sector (% o f GDP)*/
Public ExpendituredGDP Public RevenuesIGDP
j 0
j 40
.. ............................. ......l....l̂ l.-.....- . 43.9l
31 7 I 35
Cross-Country Relationship ExpendituredGDP
' d '0000 20000 30000 40000 50000 6ObOO !
Actual - Predicted 15 ,-. .......................................
I'
RevenuedGDP
0 1 0 10000 20000 30000 40000 50000 60000
GDP per s a p i t s
. . . . .~ ..............
I ,/ -.
- > ~ ~ r = " & ^ 4 - " ^ " ' s g ? : I 5 d , d n , ~ z g ? k - ; : ; - ^ u .
Note: */ L e f t hand side always refers to Expenditures and right hand side to Revenues. All numbers are for (2004). Source Own calculations bases on IMF's Ar t ic le IV Staf f Reports
29
C. Fiscal Sustainability
The Evolution of Nicaragua’s Public Debt
2.20 Nicaragua has reduced its external debt substantially in recent years. From being one o f the most highly indebted countries in the world, with an external debt that almost reached 400 percent o f GDP in 1994, Nicaragua’s external public debt in nominal terms i s currently around 84 percent o f GDP. This decline in the public external debt ratio was mainly due to the debt re l ie f provided by the Paris Club and multilateral institutions, as well as increased fiscal discipline. Debt relief was provided through various mechanisms, including a commercial debt buy-back operation, bilateral debt relief, the Heavily Indebted Poor Countries (HIPC) Initiative and, most recently, the Multilateral Debt Re l ie f Initiative (MDRI).21 Total external debt reached US$4.5 bi l l ion in nominal terms at end-2006. O f that amount, about US$780 mi l l ion i s scheduled to be forgiven by the IDB as i t s contribution under the MDRI. When al l the debt relief has been awarded under these initiatives, the NPV o f external debt is projected to fal l to about 35 percent o f GDP (HIPC methodology).22 23
2.21 Although Nicaragua succeeded in getting rid o f much o f its external public debt, i t continues to be saddled with a significant domestic public debt. That debt originated mainly from two sources:
0 The largest source o f domestic debt are the Compensation Bonds (“Bonos de Pago de Indemnizacidn, BPIs) issued by the Ministry o f Finance since the early 1990s to settle the property disputes that emerged from the confiscations and land reforms carried out in the 1980s. They carry maturities o f 15 years and interest rates o f 4.5 percent (on average). The next largest source o f domestic debt are Central Bank negotiable bonds (“Certifcados Negociables de Inversidn, CENIS) issued with maturities o f up to three years and with market interest rates determined by a competitive bidding process. (Interest rates have varied with a recent range between 8 and 15 percent.) CENIS were created init ial ly to mop up liquidity through open market operations, but the bulk o f them have served to rescue public banks that encountered financial difficulties in the 1990s and to assist in the resolution o f several failed private bank failures that were intervened during 2000-01.
0
L
2 1. Nicaragua reached the H IPC Decision Point in December 2000 and the HIPC Completion point in January 2004. The IMF and Wor ld Bank have been providing additional debt re l ie f under the MDRI since January 2006 and July 2006, respectively, while the IDB agreed to participate in the MDRI in December 2006 22. The end-2006 estimate o f public external debt (US$4,527 mil l ion) includes debt forgiveness f rom the IMF and IDA o f US$203 m i l l i on and US$982 mill ion, respectively, during 2006 fol lowing the MDR Initiative. (It i s important to note that these overall debt figures refer t o actual debt levels to date, and not t o the full-delivery scenario figure that would be observed if a l l the H IPC debt rel ief were fully delivered as o f end-2006.) Adding the recently announced debt forgiveness by the IADB, public external debt at the end o f 2006 would be US$3,741 mi l l ion (or about 70 percent o f GDP in nominal terms and close to 35 percent o f GDP in net present value terms.) A fill HIPC debt rel ief delivery scenario, with a l l non-Paris Club creditors participating, would reduce the nominal debt below US$3 bil l ion. 23. A second commercial debt buy-back operation, which was concluded successfully in 2007, will eliminate external debts on the order o f US$1.3 b i l l ion in nominal terms. These commercial debts, however, mainly consist o f interest arrears and penalties that are not included in the US$4.5 b i l l i on external nominal debt figure, as estimated by the Central Bank o f Nicaragua. In other words, the elimination o f this debt does not affect the off icial debt figures.
30

2.22 The domestic debt has fallen since 2003 as a result o f declining fiscal deficits that have permitted substitution o f more expensive domestic market debt with concessional external debt. Financing requirements on domestic debt in the next few years, however, are expected to remain large, as the original BPIs are beginning to fal l due.
2.23 The domestic public debt i s dollar-indexed and currently estimated at around US$ 1.2 billion, or 23 percent o f GDP (and about 19 percent o f GDP when expressed in net present value terms). This means that the NPV o f the total public debt (after HIPC and MDRI are fully implemented) remains close to 54 percent o f GDP, which i s st i l l fairly large by developing country standards and remains a source o f fiscal vulnerability.
Debt Sustainability
2.24 The question we turn to now i s whether the fiscal adjustments carried out over the last five years, combined with the debt rel ief received, have le f t Nicaragua in a fiscally sustainable position. To address this question, we utilize a simple analytical model developed in the Nicaragua Development Policy Review (World Bank (2004))24. Broadly speaking, fiscal sustainability i s determined in this model by comparing the expected f low o f future net public revenues to the f low o f future debt payments required to service the country’s outstanding public debt. If the present value o f the future f low o f net revenues exceeds the present value o f the f low o f debt servicing requirements, then the government’s fiscal pol icy stance and debt levels are said to be sustainable. If i t falls short, they are not sustainable.
2.25 As a heavily indebted poor country, Nicaragua’s capacity to borrow externally remains severely constrained, and mostly confined to official borrowing o n concessional terms. Since concessional funding is limited, this means that the evolution o f Nicaragua’s external debt since the early 1990s has been supply-determined by donors. For the sake o f simplicity, i t is assumed that donors are prepared to continue extending concessional financing in an amount that maintains Nicaragua’s total external debt constant in U S Dollar terms at current levels.25 With this assumption about donor behavior, attention can focus entirely on the domestic debt.
2.26 The present value o f the expected future f low o f public revenues (net o f debt service payments on the concessional external debt and expressed as a share o f GDP) can be derived as a function o f the average GDP growth rate and o f the primary fiscal balance, as shown in Table 2.7.26 The figure determined for a particular combination o f growth and fiscal surplus rates can then be compared to the net present value o f the expected f low o f debt servicing requirements (also net o f debt service payments owed on the external debt). Given that this debt was mostly contracted on market terms, the present value o f those debt service flows will be much closer to the nominal value o f the underlying stock o f debt than is the case with the external, concessional debt. Accordingly, each cell in Table 2.7 can be interpreted as the maximal amount o f domestic L
24. The model i s presented in Annex A o f the Nicaragua Development Pol icy Review (Wor ld Bank 2004). 25. One implication o f this assumption i s that the ratio o f the external debt stock to GDP declines gradually over time at a speed that depends entirely o n the rate o f GDP growth. A less conservative assumption would have been to assume that the external debt stock increases at the same rate as the dollar inf lat ion rate, which means that i ts real value in US$ remains constant over time. A s long as the rate o f growth o f the external debt stock does not exceed the rate o f growth o f nominal GDP (Le., the j o in t growth rate o f inf lat ion and real GDP), i ts projected trajectory i s considered sustainable. 26. See Annex B for a more detailed description on h o w the figures in Table 2.7 were calculated.
31

debt (expressed as a share o f GDP) that can be sustained under a given combination o f the primary fiscal surplus and real GDP growth. (Note fi-om these figures that higher rates o f economic growth and higher primary fiscal surplus rates permit the public sector to sustain a higher domestic debt level.) Whether a particular combination o f fiscal surplus and economic growth i s sustainable or not then depends on whether the actual net present value o f the domestic debt lies below or above the figure corresponding to these parameters in Table 2.7.
Table 2.7: NPV o f Future Stream of Public Revenues Based on the fiscal parameters values of 2006
(percent of GDP) RealGDPgrowth 1% 2% 3% 4% 5% 6%
-42 -47 -54 -65 -82 -116 -28 -30 -34 -39 -47 -63 -14 -13 -13 -13 -12 -10 1 4 8 13 23 43 15 21 28 39 58 96 30 38 49 65 93 149 44 55 69 91 128 202 59 72 90 117 163 255 73 89 111 143 198 308 ------
Note: * The future stream o f publ ic revenues i s net o f the external
Source: Estimations based o n the model in Annex A o f the Wor ld Bank (2004), (concessional) debt service.
Nicaragua: Development Pol icy Review.
2.27 The primary fiscal surplus for Nicaragua’s combined public sector varied between 0 and 0.5 percent o f GDP during 2003-2005, before increasing to 2.2 percent in 2006. GDP growth, in turn, averaged almost 4 percent per annum during 2003-05. According to Table 2.7, a growth rate o f 4 percent together with a 0-primary fiscal surplus would sustain a domestic debt o f roughly 13 percent o f GDP. If the same growth rate i s coupled with a primary surplus o f 2.0 percent, it could sustain a domestic debt o f 65 percent o f GDP. 27
2.28 Turning now to the actual level o f Nicaragua’s domestic public debt, we noted earlier that the Net Present Value o f that debt was estimated at 19 percent o f 2006 GDP. Based on the figures in Table 2.7, this stock o f domestic debt could not be sustained with a primary surplus o f 0, but i t i s well below the maximal debt level that could be sustained with the 2 percent primary surplus achieved in 2006.
Other Public Liabilities
2.29 There are several additional public sector liabilities that also have to be taken into account in assessing a country’s fiscal sustainability, even though they are not securitized. The most important o f these liabilities is the implicit debt associated with the actuarial deficit o f L
27. I t i s worth pointing out that when this same exercise was carried out in the 2004 DPR, the same growth rate o f 4 percent and fiscal surplus ratio o f 2 percent would only have been able to sustain a much lower maximum domestic debt level (equivalent to 40 percent o f GDP). The reason for this difference i s that several other economic parameters have substantially improved during the intervening years, raising Nicaragua’s debt sustaining capacity. The most important parameter improvement in this regard has been the decline in the estimated real domestic interest rate ( f rom 10 to 8 percent), see Annex B.
32

Nicaragua’s pension system. Table 2.8 presents various estimates o f the actuarial debt arising from the pension system under the alternative parameter reforms. Using an 8 percent discount rateY2* which coincides with the estimated real interest rate for domestically issued debt, the N e t Present Value o f the pension system’s actuarial deficit under the current parameter setting i s estimated at 162 percent o f GDP. A modest reform involving only a slight increase in contributions would reduce that contingent liability to 58 percent o f GDP, while a more ambitious reform that raises both the contribution rate and retirement age would reduce that deficit further o f 34 percent o f GDP. O f course, under a sufficiently drastic parametric reform the actuarial deficit could even be brought down to zero.29
Table 2.8 Nicaragua - Total Domestic Public Liabilities (as o f November 2006)
NPV of Debt I n US$ millions As % of GDP
Domestic Debt 1,040 19% Bonos de Pago por Indemnizacion (BPI) 778 14% CENIS 209 4% Other 53 1 Yo
Actuarial Deficit of Social Security System (under alternative parametric reforms)
Option 1 (no reform) 8,700 162% Option 2 (modest reform) 3,115 58 Yo
Option 4 (drastic reform) 0 0 Option 3 (ambitious reform) 1,826 34%
Grand Total Option 1 181% Option 2 77% Option 3 53 yo Option 4 19%
Source: Nicaraguan Central Bank, Ministry o f Finance - Comision Tecnica Interinstitucional., and Wor ld Bank, Nicaragua Development Pol icy Review (2004)
2.30 From Table 2.8 we see that the long run sustainability o f the fiscal framework depends closely on how the authorities deal with the actuarial deficit o f the pension system. If the current system i s allowed to remain unreformed, then the fiscal framework i s clearly unsustainable, even with a 2 percent primary fiscal surplus. To sustain the resulting domestic debt (including pension liabilities), estimated at 182 percent o f GDP, the primary fiscal surplus would have to be raised to around 6 percent o f GDP; assuming that GDP growth remains at 4 percent. Conversely, we can conclude from the figures in Tables 2.7 and 2.8, that the 2 percent primary surplus
L
28. A real interest rate o f 8 percent may be considered high for discounting future streams with long horizons, such as those associated with pension systems. Whi le using a lower interest rate raises the net present value o f the same future stream o f pension deficits (and hence the size o f the implici t publ ic debt), i t also enhances the economy’s capacity to sustain debt under given fiscal parameters. The overall impact o n sustainability, therefore, is dif f icult to assess without engaging in a more detailed analysis. 29. These estimates are comparable to the ones discussed by the High Level Commission for re form o f the pension system in Nicaragua and the Inter-institutional Technical Committee. They have estimated that the actuarial deficit o f the pension system in N P V terms could reach as high as four times the size o f GDP if the current system remains unchanged to as l o w as no deficit at a l l with a very drastic parametric re form i s introduced. See, “Proyecciones Financieras de Reformas de Pensiones” Comision Tecnica Interinstitucional, Nicaragua, Ministry o f Finance, June 2006, and “Carta - Escenario de Reforma a1 Sistema de Pensiones” Nicaragua, Ministry o f Finance, November 2006.
33

reached in 2006 is only sustainable with a pension reform on the order o f Option 3. Under Option 3, the total domestic debt i s reduced to 53 percent o f GDP, which i s comfortably below the maximal domestic debt ratio (65 percent) that can be sustained with a 2 percent fiscal surplus and 4 percent growth. Fortunately, the pension system is not projected to generate cash deficits for a few more years, which gives adequate time to prepare an appropriate pension reform.
2.31 In addition to the liabilities associated with the pension system, there are also other contingent liabilities that need to be taken account o f in assessing the risk o f debt distress. One potential fiscal l iabi l i ty originates in the financial sector and is related to the de-jure and de-facto government guarantee o f deposits in the event o f a bank failure. Although it appears that prudential regulations and the institutional capacity o f the Superintendency o f Banks to detect imprudent behavior have been strengthened through previous financial sector reforms, the risk o f another bank crisis cannot be ignored as long as the government maintains a legal or even moral responsibility to bai l out depositors in the event o f a crisis.
2.32 Finally, another important, but difficult to quantify, contingent fiscal l iabi l i ty refers to the government’s open-ended capacity to issue BPIs in response to new claims o f compensation for past confiscations. There is a danger that the ability to issue BPIs offers a seemingly easy way out in resolving property conflicts that the judiciary i s unable or unwilling to handle.
D. Main Conclusions
2.33 The preceding review finds that Nicaragua has made impressive progress since 2001 in reducing its overall fiscal deficit. The decline o f that deficit, however, was brought about entirely through increases in public revenues, which raises some concerns with respect to the future permanence o f past fiscal reforms. To address those concerns, and considering the relative evolution o f public revenues and expenditures in recent years, the authorities may wish to consider a more balanced approach when future adjustment needs emerge, by combining revenue-raising measures with expenditure cuts.
2.34 A debt sustainability analysis found that Nicaragua’s combined public debt o f approximately 54 percent o f GDP appears sustainable as long as the country continues to grow at the average rate achieved in recent years and maintain positive fiscal surpluses on the order o f 1 to 2 percent. This result coincides with the finding that emerged from the joint IDA-IMF debt sustainability analysis carried out in August 2007, indicating that Nicaragua exhibits a moderate, but manageable, risk o f experiencing debt distress, provided that sound macroeconomic policies continue to be applied. Nevertheless, Nicaragua s t i l l remains vulnerable to destabilization from various potential developments that could undermine fiscal discipline. The most important threats in the short run were identified as the rising fiscal transfers to the municipalities mandated by Law 466, growing pressures on public wages, and the possibility o f an energy crisis.
2.35 In the long run, Nicaragua’s fiscal sustainability wil l also depend closely on how the authorities deal with the actuarial deficit o f the pension system, which is currently at an unsustainable level. To render the implicit debt associated with the pension system sustainable would require a substantially larger primary fiscal surplus - on the order o f 6 percent, if GDP growth remains at 4 percent. This would be an extremely ambitious fiscal target, as well as an
34

extremely inequi table one, considering that the beneficiaries of the pension system general ly do not comprise the poorer members o f societies (see Box 2.1). Fortunately, the pension system i s n o t projected to generate cash def ic i ts for a f e w m o r e years, w h i c h gives adequate t i m e to prepare appropriate pension reforms that would reduce the actuarial def ic i t in a social ly equitable manner to a f isca l ly sustainable level.
Box 2.1 Pension System Coverage in Nicaragua
Nicaragua exhibits very high levels o f labor market informality - about 65.7 percent (using small and micro enterprises as the marker o f informality) or 82.8 percent (using the lack of contribution to the social security system as a marker of informality) o f the economically active population. (Source: Estela Monroy 2006). Accordingly, the share o f the population that i s eligible for pension benefits i s very small. Nicaragua ranks 4th lowest in a sample o f 15 Lat in American countries in terms of the percentage o f the population covered by the pension system (only Bolivia, Paraguay and Peru have lower coverage). According to the 2005 LSMS, only 13.5 percent o f the population over 60 years o f age report receiving benefits f rom the pension system. Another notable characteristic o f the pension system in Nicaragua i s the great disparity in coverage across rural-urban areas, income quintiles, occupations and education attainment levels. As indicated in the Figure below, i t i s the richest population quintiles, most educated, urban population that benefit most f rom pension system. N o t the rural, agriculture-based segments o f the population, where most poverty i s concentrated. The coverage o f health insurance provided through INSS exhibits identical disparities n coverage; see 2005 Nicaragua Poverty Assessment.
INSS Coverage Rates; 2001 60 I--
50
40
30
Source: Rofmn and Lucchetti (2006)- from LSMS 2001.
35

36

CHAPTER I11 THE EFFICIENCY OF PUBLIC SPENDING IN NICARAGUA
A. Growth and Poverty Reduction Performance
3.1 Nicaragua’s growth performance since the mid-1990s has been reasonably good by regional standards, but somewhat lackluster in comparison to developing countries elsewhere. In fact, except for 1998-99, Nicaragua’s per capita GDP growth has remained consistently below the average rate exhibited by al l lower middle income countries worldwide; Figure 3.1. Furthermore, the pace o f growth achieved in recent years has not been sufficient to keep up the momentum in poverty reduction, which has exhibited a marked deceleration since the end o f the 1990s: following a steady decline in the extreme poverty headcount ratio f rom 19 percent in 1993 to 15 percent in 2001, the latest Living Standard Measurement Survey (LSMS) in 2005 only revealed an insignificant change vis-&vis 2001.
Figure 3.1 : Nicaragua’s Relative Growth Performance Vis-a-vis Latin America & the Caribbean Vis-a-vis all Lower Middle Income Countries
10, I
5
8 O
g -10
m - -5 E
-20 -15 I
10 , 1 5
8 0 P 3 g -10
-5
-15
Source: Wor ld Bank, Wor ld Development Indicators. Notes: The graphs present the difference between Nicaragua’s per capita GDP growth rate and the average rates in LAC, o r in al l Lower M idd le Income Countries. The underlying figures o n GDP per capita are based o n purchasing power parity (PPP).
3.2 A decomposition o f per capita GDP growth into the rate o f capital accumulation and the rate o f productivity growth can offer some insights for understanding the pattern o f growth. The findings from such a growth decomposition analysis were reported in the 2004 Nicaragua Development Policy Review (DPR), which concluded that Nicaragua’s difficulties in achieving fast sustained growth were attributable partly to insufficient rates o f capital accumulation, but more importantly to insufficient productivity growth, which i s largely related to the quality o f investment. The 2004 DPR also had pointed out that Nicaragua exhibited particular shortcomings in several o f the key determinants o f growth, namely in education attainment, public infrastructure, financial sector development and g~vernance.~’
L
30. These key determinants o f growth were identif ied in a cross-country study by Loayza, Norman, Pablo Fajnzylber and Cesar Calderon (2006) “Economic Growth in Lat in America and the Caribbean.” (Wor ld Bank , Lat in America and the Caribbean Region), which provided the analytic underpinning for the DPR.
37

3.3 These findings draw attention to the quantity and quality o f public investment, both in human and physical capital, which contributes to the accumulation o f the country’s total capital stock. This chapter seeks to assess whether Nicaragua’s public sector is devoting an adequate amount o f resources toward aggregate investment, as wel l as toward the key sectors (education and infrastructure) identified as critical for raising economic growth in Nicaragua. The second issue addressed i s the quality o f these investments. The objective o f this assessment i s to determine whether the shortfalls in development outcomes are mainly due to insufficient public spending in particular areas or to shortcomings in the efficiency o f public spending.
I
!Total GFCF
B. The Level and Efficiency of Public Investment
as percent of GDP 32.44 ! i 26.15 ; i 23.94 i 19.13
3.4 Nicaragua appears to devote a much higher share o f its GDP toward gross fixed capital formation (GFCF) than the average in Latin America; Table 3.1. This difference relative to other Latin American countries i s mainly attributable to a significantly higher rate o f public investment spending. While the share o f private investment i s roughly the same in Nicaragua as in the rest o f Latin America, the share o f public investment i s more than double the regional average. In this regard, Nicaragua resembles other lower middle income economies. Admittedly, public and private investment ratios have been significantly higher in the fast growing East Asia region, but the similarity to the ratios exhibited by other lower middle income economies suggests that Nicaragua’s relatively modest growth rate i s not primarily attributable to insufficient public investment or the crowding out o f private investment.
i Public GFCF !Average ICOR*
I I I I I 9.69 I 14.38 j I 3.96 i
3.00 5.27 i 4.98 i
7.44 7.65
3.5 Where Nicaragua does stand out i s with respect to the productivity o f total investment, as measured by the average Incremental Capital Output Ratio (ICOR). While the average ICORs observed in Latin America and other lower middle income economies are not too far apart from the average value observed in East Asia, Nicaragua’s ICOR i s nearly twice as large. That is, somehow the investments undertaken in Nicaragua are much less efficient in terms o f generating or eliminating obstacles to growth than those undertaken in the other countries. One possible
;Total GFCF/GDP !Private GFCF/GDP
38
I 0.57 0.3 1
0.78 0.78
0.21 0.08
0.57 0.54
I I !Public GFCF/GDP I -0.19 -0.29 0.15 0.23

explanation i s that Nicaragua i s not directing i t s public investments toward the most productive activities. In this regard, i t i s notable that Nicaragua exhibits a negative correlation between public investment and economic growth, which contrasts with the positive correlation observed for East Asia, as well as with the positive correlation between private investment and economic growth exhibited everywhere. Other lower middle income economies exhibit a similar correlation pattern as Nicaragua, however, indicating that this factor may not have been the most critical for explaining the differences in economic growth. Another, more compelling explanation for the difference in average ICORs i s that Nicaragua’s overall public investment figures are grossly over-estimated.
3.6 As indicated in Table 3.2, over 40 percent o f total public spending in the social sectors was classified as capital spending during 2003-05. I t i s hard to imagine such a high proportion o f capital spending in these service-delivering sectors. Furthermore, the capital spending reported for the social sectors accounted for almost ha l f o f the total central government investment expenditures. This suggests that either current expenditures are being mis-classified as capital expenditures or the public sector i s at r i s k o f investing far beyond its capacity to maintain and operate the accumulated capital. This would explain the high average ICOR rates observed earlier, as the high reported public investment rates are either not contributing to the growth o f the total capital stock or the capital stock is not being adequately maintained and operated.
Table 3.2 Nicaragua: Capital Expenditures of the Central Government, by Sector
2000 200 1 2002 2003 2004 2005 2006
Social Sectors 45% 28% 40% 47% 47% 49% 3 8%
Defense and Police 1% 1% 2% 1 Yo 1% 1% 1 Yo
Other 0% 13% 9% 11% 9% 6% 12% Total 100% 100% 100% 100% 100% 100% 100%
Social Sectors 43% 29% 33% 42% 46% 43% 28% Infrastructure & Prod. 87% 84% 83% 86% 90% 88% 78% Defense and Police 6% 6% 6% 6% 7% 7% 4% General Services 13% 11% 8% 9% 6% 17% 9% Other na 99% 49% 57% 5 8% 48% 53%
Total 42% 37% 32% 36% 43% 42% 32% Net foreign grantshedits as % of Total Public Capital Expenditures 62% 69% 85% 92% 56% 47% 55%
Sector Investment as % of Total Public Investment Expenditures
Infrastructure & Prod. 51% 53% 46% 39% 41% 37% 45%
General Services 3 % 5% 3% 3 yo 2% 6% 4%
................................................................................................................ Sector Investment as % of Total Sector Public Expenditures
................................................................................................................ memo item:
Source: Statistical Annex Tables. Figures for 2006 are preliminary
3.7 The misclassification o f current as capital expenditures arguably i s responsible for most o f the over-reporting o f public investment levels, especially in the social sectors. To begin, i t i s important to keep in mind that Nicaragua is one o f the most aid-dependent countries in the region. As indicated in Table 3.2, net foreign inflows since 2000 have averaged around two-
39

thirds o f total public capital spending.31 Furthermore, as a rule, public expenditures that are explicitly linked to these inflows are automatically classified as capital expenditures, independent o f the true economic use o f those funds.32 This pattern o f expenditure misclassification i s expected to eventually change with the introduction o f sector-wide approaches and the increasing recourse to budget-support funding.
3.8 The Infrastructure and Production sector also exhibits a high proportion o f investment spending, with over 75 percent o f total spending classified as capital expenditures. About ha l f o f total spending in this sector (the Production part) consists o f public support to agriculture, environment and rural development activities, which are highly dependent on aid and largely involve the delivery o f public services. The ratio o f investment to total public spending reported for those sub-sector activities, averaging 88 percent during 2002-2004, therefore also appears to be heavily distorted by the misclassification o f current as capital expenditures. The other ha l f o f total spending in this sector (the Infrastructure part), however, i s dominated by the transport sector, which by its very nature involves much higher proportions o f investment spending than the other, more service oriented sectors. That is, the investment figures reported for infrastructure spending are more indicative o f the true amount o f investments taking place. Therefore, to the extent that the reported infrastructure investment figures appear unusually high, they would more l ikely be reflecting true imbalances between investment and recurrent spending, rather than a misclassification o f expenditures.
Table 3.3 Infrastructure Sector Investment in Lat in America; 1991-1998
Total Public Infrastructure I Transport Infrastructure j Water Infrastructure Total Public Private j Total Public Private /Total Public Private
in percent of GDP Argentina 1.7 0.5 1.2 Bol iv ia 6.9 2.8 4.1 Brazi l 2.2 1.1 1.1 Chile 4.3 1.5 2.7 Colombia 5.1 3.9 2.2 Ecuador 4.5 3.4 1 .o Mexico 1.8 0.9 0.9 P e N 1.4 0.4 0.9 Venezuela 1 .O 0.1 0.8
3.2 1.6 1.7 Averse ________________________________________-- - - - - - - - ,
0.4 0.2 0.2 2.2 1.8 0.4 0.2 0.1 0.1 1.2 1 .o 0.3 1 .o 0.9 0.1 0.6 0.5 0.1 0.8 0.3 0.6 0.2 0.1 0.0 0.1 0.1 0.0
0.7 0.5 0.2 ________________________________________---. Nicaraeua na 3.4 na ! 1.6 1.6 0.0
0.1 0.1 0.1 0.7 0.1 0.6 0.2 0.2 0.0 0.3 0.3 0.1 0.5 0.5 0.0 0.8 0.8 0.0 0.2 0.2 0.0 0.0 0.0 0.0 0.0 0.0 0.0
0.3 0.2 0.1 0.8 0.8 0.0
______________________________________
Source: World Bank, Project Database on Infrastructure Investment in LAC, Office o f the Chief Economist for Latin America & the Caribbean. Data refers to investments in roads, railways, electricity/gas, water and telecoms. Data for Nicaragua refers to capital spending over the period 2002-05 and i s estimated on the basis o f information in the PER statistical annex and government budget.
L
3 1. N o t a l l o f these inf lows are used to finance capital spending. A significant port ion also has been provided in the f o r m o f budget support and substitutes for domestic financing o f the deficit. Even so, sector-specific external grants and credits represent almost 100 percent o f the total capital budget in education and around 68 percent in health. 32. The reasons for such a rule are we l l known: o n one hand, most donors traditionally have insisted o n restricting their development aid to investment activities o n the grounds that financing recurrent spending leads to unsustainable outcomes. O n the other hand, the national authorities generally have n o choice but to record aid- financed project expenditures as investment expenditures, given the finite time horizon and l imi ted commitment o f fimds associated with these projects.
40

Has Nicaragua been spending enough on Public Infrastructure?
3.9 Nicaragua’s public sector invests a significantly higher share o f GDP in public infrastructure than the Lat in America average; Table 3.3. Even though Nicaragua privatized the public telecommunication enterprise and much o f the electricity sector, and no longer has a railway, i t s total public infrastructure investment ratio i s over twice the regional average. Whi le reliable figures are not readily available on private investment, Nicaragua’s public investment in these sectors exceeds the combined public and private investment observed in most o f the other countries over the previous decade. In the transport and water & sanitation sub-sectors, Nicaragua’s investment ratios represent an even greater multiple o f the regional averages. Nicaragua’s GDP share o f public investment in the water & sanitation sector, for example, i s about 4 times the regional average.
3.10 The preceding finding suggests that Nicaragua’s public sector has not been investing too l i t t le in public infrastructure, or at least not in the transport and the water & sanitation sectors. On the other hand, Nicaragua also has a greater public infrastructure deficit than the average in Lat in America, and so should be investing more. In that regard, Nicaragua is comparable to the other HIPC country (Bolivia) that i s represented in Table 3.3. Also, this conclusion needs to take into consideration that not al l o f the total public investment reported for these sectors constitutes true investment expenditures, but may be disguised current expenditures. The absence o f data o n private investment expenditures in some o f these sectors adds to the dif f iculty in assessing the adequacy o f total investment spending. Although the private sector is not significantly involved in the transport and water sectors (except in terms o f road maintenance activities), i t i s very closely involved in the electricity and telecommunications sectors. The telecommunications sector appears to be expanding in a satisfactory manner. In energy, however, the growth in effective installed generation capacity has fallen behind the growth o f electricity demand since 2001 , reflecting inadequate investment levels; see Annex H.
The Efficiency of Public Infrastructure Spending
3.11 In spite o f what appears overall to be a significant level o f investment in public infrastructure, Nicaragua’s infrastructure quality indicators are among the lowest worldwide. According to the infrastructure quality index o f the World Economic Forum’s 2006/2007 Global Competitiveness Index, Nicaragua ranks 10ISt out o f a total o f 125 countries; that is, in the bottom quartile.
3.12 Nicaragua’s relatively poor performance in this area i s in part associated with i t s overall lower level o f development, as measured by per capita GDP. Even after taking into account differences in the level o f per capita income, however, Nicaragua continues to exhibit a level o f infrastructure quality that i s below the norm for countries with similar income levels; top panel o f Figure 3.2. Furthermore, Nicaragua’s shortfall in infrastructure quality i s particularly pronounced after accounting for differences in gross fixed capital formation as a share o f GDP; lower panel o f Figure 3.2. While its ratio o f gross fixed capital formation (averaged over 2001- 05) ranked in the top quartile o f the distribution o f these ratios among lower middle income countries, its infrastructure quality index ranks in the lowest quartile. These findings suggest that the quality o f investment in Nicaragua exhibits significant deficiencies, both in terms o f helping
41

to generate economic growth and in terms o f providing adequate infrastructure services. The next three sections present summary reviews o f the transport, water & sanitation, and electricity sectors in Nicaragua, with the purpose o f identifying the main sources o f deficiencies in each sector.
0 4.5 - 2 4.0 .E 3.5
E 2.5
8 1.0
d 3 2.0 0 a 1.5
g 0.5 - 0.0
L U
Figure 3.2. Per Capita GDP, Gross Fixed Capital Formation and Infrastructure Quality across Lower Middle Income Countries
.. . .. . I . I. . 3.0-->-- ... -. B. - I . rn
I I I
Nicaragua
, , ,
5.00
i! E: 3.50 3.00 2.50 2.00 1.50 1 .oo 0.50 - 0.00
0 2000 4000 6000 aooo I
~
per capita GDP (constant 2000 Int’l S)
5.0 ,
0 10 20 30 40 50
Gross Fixed Capital Formation (%of GDP)
Source: Lopez-Claros et a1 (2006), The Global Competitiveness Report 2006-2007, and World Bank, World Development Indicators. This figure i s based on data for 49 lower middle income countries.
Summary Review of Public Expenditures in Transport
3.13 Recent Sector Performance. Nicaragua’s road network had deteriorated to the point where only about 12 percent o f the network was in good condition in the early 1990s. By the end o f 1999, this proportion had r isen to 19 percent, in spite o f the setback produced by humcane Mitch, and reached 20 percent in 2006. This outcome was achieved with annual budgetary allocations to the transport ministry (MTI) o f around 2.0 percent o f GDP, (or around 10-15 percent o f total central government expenditures). In 2005 and 2006, however, M T I s budget execution declined significantly, below the level considered adequate for a country at Nicaragua’s stage o f development and recovery; see Annex F.
42
3.14 Nicaragua’s overall road sector performance is considered adequate from a resource allocation viewpoint. Noteworthy improvements in this regard are (i) the increasing reliance on a road maintenance fund (FOMAV) to maintain the most trafficked roads, and (ii) an increasing reliance on adoquines (cement paving blocks) as a cost-effective alternative to gravel-surfaced roads, especially for rural traffic.33 Although the ratio o f sector recurrent to capital expenditures has been unusually l ow over the last decade, this has been reflecting a focus o n reconstruction needs and is not expected to continue. Road improvements are now selected largely on the basis o f their economic justification (using the World Bank’s HDM model), providing further comfort in that allocations are being made on an efficient basis. Concerning the other transport sub- sectors, most transport services for roads, ports and airports in Nicaragua are concessioned, or owned and operated by the private sector, and have modest direct fiscal implication^.^^ 3.15 Key Sector Challenges. In spite o f the improvements observed over the last decade, Nicaragua s t i l l exhibits the lowest road infrastructure quality indicators in Central America. The increased regional competitiveness that is expected to emerge with C A F T A heightens the urgency to address this infrastructure deficit. The challenge i s how to close the infrastructure deficit within the constraints o f a limited fiscal budget.
3.16 Measures to Improve Allocative and ee ra t i ona l Efficiency. To meet the challenge o f closing Nicaragua’s infrastructure deficit in the road sector, i t i s important to prevent M T I s budget from declining below the average levels in 2001-2005. In the roads sub-sector, which presents the greatest infrastructure deficit, the volumes o f traffic are generally not large enough to render viable the private provision o f infrastructure. Closing this infrastructure gap, therefore, wil l continue to depend mainly on public sector provision. Before contemplating any increases in MTI’s budget, however, i t i s necessary to reverse MTI’s recent declines in budget execution. In addition, the following measures would help to raise the impact o f public expenditures.
Greater reliance on adoquinado programs. Given the success o f the trunk road rehabilitation program so far, the next order o f priority i s to improve the grid o f secondary and major rural roads (the distributor network) that link to the trunk roads and serve the productive zones. The scaling up o f existing adoquinado programs represents a cost-effective alternative to asphalt or gravel paving o f roads, especially for the secondary network.
0 Emphasizing road maintenance. I t i s essential that the rehabilitated roads are not left to deteriorate (as in the past) and once again allowed to become bottlenecks. A comprehensive maintenance program, including guaranteed funding arrangements v ia F O M A V and the use o f least-cost public bid contractual approaches for works implementation, are an indispensable part o f the strategy to increase paved road coverage.
Adapting road design to local conditions. There has been a growing tendency to design roads to meet excessively high administrative standards (e.g. insisting that al l collector roads must
L
33. The reliance o n adoquines has contributed to an increase in technical efficiency by min imiz ing the consumption o f economic resources in its construction and maintenance. Road users also realize increased savings over the gravel-surfaced alternative. In most l o w traffic volume situations, gravell ing has long been the preferred option for surfacing when upgrading earth roads because it is less costly than asphalt. However, Nicaragua i s ahead o f many countries in addressing the paradox o f improving l o w traffic volume by using the non-traditional adoquinado option, which provides an all-weather service quality similar t o asphalt but has a lower l ife-cycle cost than gravel. 34. Whi le anecdotal evidence suggests that operational efficiency vanes highly across these sub-sectors, the PER has not reviewed these other sectors in sufficient depth to emit an opinion.
43

be 7 meters wide) rather than adhere to less costly standards that are appropriate for the prevailing traffic volumes and l ikely growth rates.
Clarzfiing and strengthening sub-sector institutional arrangements: While i t s institutional capacities have improved, MTI i s s t i l l affected by overall weaknesses in planning and programming. There i s a need to develop MTI’s basic capacity to carry out road condition inventories, to fully install the Pavement Management system, to seek least cost solutions to technical and engineering problems associated with road and bridge maintenance, as wel l as to help foster the development o f the local consulting and contracting industries. Furthermore, the F O M A V needs appropriate technical assistance, particularly in contracting and procurement procedures so that i t can develop the capacity eventually to manage the maintenance o f the entire core road network. For overall sustainability and efficient road management, fbrther analytical work is needed to identify the appropriate roles and responsibilities o f the key players (both at central and local level, and including INIFOM, IDR and the municipalities) and to promote synergies while avoiding a duplication o f efforts
Improving urban mobility by restructuring public transportation services and developing improved mass transit corridor management in Managua. This could be designed as part o f an integrated bus routes development and improved traffic demand management program.
Summary Review of Public Expenditures in Water & Sanitation
3.17 Recent Sector Performance. Public investment in water and sanitation, which averaged 0.75 percent o f GDP during 2002-06, is high by regional standards. Sector outcomes have been mixed, however: while access to sanitation improved, access to water has stagnated and effective water & sanitation use has gone down; Table 4 in Annex G. Two factors are primari ly responsible for the uneven impact o f sector investments. First, the identification o f sector investments has been flawed. Decisions on expenditure priorities have been basically driven by emergency and political considerations, very rudimentary planning by E N A C A L and FISE, and donor offers o f grants and concessionary loan financing. The second important factor refers to the poor performance o f the sector’s main public operator. E N A C A L has been a loss-making public enterprise, whose financial situation has deteriorated to the verge o f illiquidity during 2003-2006, due to a high percentage (56 percent) o f unaccounted-for water (half o f which may be due to illegal connections), l ow labor productivity (7.6 employees per 1000 water connections), and low collection and micro metering rates that clearly lag behind regional standards. Also, a dramatic increase in the energy bill, combined with a tari f f freeze (in nominal Cordoba terms) that has been in place since 2003, has resulted in cost-coverage ratios between 0.69 and 0.86 that explain the negative operating cash flows since then.
3.18 Achieving 100 percent coverage in water and 95 percent coverage in Sanitation by 2015 are two important MDGs highlighted in Nicaragua’s poverty reduction strategy. They are also critical for achieving the country’s health-related MDGs. The key challenge facing Nicaragua i s to expand service coverage indicators without significantly expanding the sector budget.
3.19 Measures to Improve Allocative and Operational Efficiencv. To meet this sector challenge, Nicaragua needs to significantly improve the efficiency o f sector expenditures and sector management. The water and sanitation sector strategy developed by the sector policymaking agency, CONAPAS , provides a good starting point for addressing the problems
K e v Sector Challenge:
44

that currently constrain the sector, and the basis for a more systematic planning process. Important measures that would help to improve sector performance and efficiency are listed below:
Planning: Designating a pol icy body (such as CONAPAS) with sufficient political weight and institutional capacity is an important first step for improving sector planning. As long as the sector strategy i s operational and has adequate political backing, a Sector Wide approach would be the preferred mode o f cooperation for donors.
Regulation: Giving INAA full autonomy in tari f f setting could improve cost-coverage ratios. In terms o f political timing, the Government/ENACAL may f i rst need to improve efficiency and service before adjusting tariffs - although there i s never a perfect time for tar i f f increases. Also, I N A A ’ s power o f supervision needs to be strengthened by systematically linking any subsidies from the general budget to improvements in performance indicators, to be defined in the concession contract between E N A C A L and INAA.
Subsidization. The current system o f sector subsidies needs to be reviewed and possibly revised in order to target the direct and indirect subsidies more effectively to the poor.
Urban areas: Improving the service quality and efficiency o f E N A C A L i s one o f the most urgent priorities in the sector. Important opportunities for reducing ENACAL’s losses exist in the commercial area (through the reduction o f non-technical losses, and increase o f metering and collections), as wel l as in terms o f reducing personnel and energy cost. A greater de- concentration o f ENACAL’s operations also i s an alternative that could be considered, balancing economies o f scale and proximity to clients. The Matagalpa-Jinotega experience with de-concentrated service provision may offer useful lessons in this regard.
Rural areas: FISE has developed considerable experience in local development and in cooperating with municipalities and communities in the sustainable operation o f water systems, which leaves i t wel l placed to assume a lead responsibility for the rural sub-sector, in collaboration with municipal governments (in a supportive role) and the rural water communities (CAPS), whose legal status needs to be secured so that they can manage and operate their systems more effectively.
Integrated approach to sanitation: Hygienic behavior is critical for improving health outcomes, particularly in rural areas. As access to water and sanitation infrastructure expands, a hygiene education program could significantly leverage the impact o f this infrastructure in reducing water-related diseases.
’
Summary Review of Public Expenditures in Energy
3.20 Public spending o n electricity infrastructure has been modest, as most new generation capacity over the last decade has been provided by the private sector. There has been commendable progress in expanding access, with Nicaragua’s electrification coverage increasing from 47 percent in 2001 to 54 percent in 2005, in good measure due to the operation o f the National Electric Industry Development Fund (FODIEN). However, little progress has been made in diversifying power generation away from petroleum and distribution losses (28 percent) continue to be the highest, by far, in the region. Most importantly, there has been little new investment in electricity generation, so the power reserve
Recent Sector Performance.
45

margin has fallen to 6 percent o f total average demand, once again resulting in system-wide blackouts and power rationing. While the recent installation o f additional generation capacity with Venezuelan assistance offers a short-run remedy to this problem, additional actions are needed to ensure a long-run solution to the sector’s shortcomings.
3.21 K e y Sector Challenges: As in the case o f transport, Nicaragua lags far behind the other countries in the region in access to electricity, putting the country at a strong competitive disadvantage in the context o f CAFTA. The main challenge in the short to medium term i s to secure sufficient generation capacity to eliminate blackouts and accommodate the anticipated growth in energy demand. The longer term challenge i s to expand electrification rates to levels comparable to other countries in the region. In view o f the massive infrastructure investments needed to achieve these targets, and the limited fiscal resources, meeting this challenge will require significant private sector participation.
3.22 Measures to Improve Allocative and Operational Efficiency. To meet these challenges the recent Energy Sector Policy Note prepared by the World Bank focuses attention on the need to (i) defkse the confrontation with the private distribution company and seek a common ground for improving service, with the ultimate aim o f re-establishing investor confidence and encouraging sector investments, (ii) simplify the electricity pricing structure (and abiding by it), while re-considering the existing electricity consumption subsidy, which represents the largest single fiscal cost emerging from the sector, but may not be reaching the poorest households, (iii) extend electricity service by strengthening the rural electrification fund, FODIEN, and (iv) update existing studies for hydro-electric and geothermal projects to feed into a long-term sector expansion plan, giving priority to developing new projects within a regional context.
C. The Level of Social Sector Spending
3.23 Overall public social spending has represented a somewhat lower share o f GDP in Nicaragua than in most other countries in Latin America; Table 3.4. That difference in public spending, however, mainly reflects lower spending on social protection, especially pensions. In education and health - which are more indicative o f investments in human capital - Nicaragua spends roughly the same as other countries in the region, both as a share o f GDP and as a share o f total public spending. The distribution o f public spending within each sub-sector, however, exhibits significant variations, both in health and in education, as discussed below.
Has Nicaragua been spending enough on Education?
3.24 The aggregate social spending measures in Table 3.4 only give a partial sense o f whether Nicaragua i s investing an appropriate amount in education. Since Nicaragua has a higher proportion o f school age children than the regional average, i t would have to spend more than the average to provide the same amount o f education services per child. Table 3.5 and 3.6 provide adjusted measures o f the public expenditure effort that goes into primary and secondary education in Latin America, taking into account the respective differences in net enrollment rates and in the school-age populations.
46

Table 3.4: Social Sector Spending in Central and Latin America; 1990-2003 as % of GDP As % of Total Public Expenditures
1990/91 1994/95 1998/99 2002/03 1990/91 1994/95 1998/99 2002/03
Total Public Social Sector Spending Costa Rica 15.7 16.0 16.6 18.9 na na 63.6 64.5 El Salvador na na na 7.1 na na na 35.9 Guatemala 3.3 4.0 6.0 6.5 29.5 41.4 44.9 50.0 Honduras 7.9 7.8 7.5 13.0 36.4 32.0 31.4 51.8 Nicaragua 6.6 7.1 7.6 8.8 34.0 39.9 37.1 40.0 Panama 16.3 17.3 16.5 17.5 40.2 43.5 45.5 45.4
LAC Average 9.3 10.6 11.9 12.0 40.5 44.0 46.8 44.1
Nicaragua 2.6 2.8 3.4 4.1 13 15.8 16.7 18.5 LAC Average 2.9 3.4 3.9 4.3 13.9 15.2 15.9 16.7
Nicaragua 2.8 2.8 2.7 3.0 14.0 15.8 13.3 13.5
Source: CEPAL, Panorama Social de America Latina, 2006.
Public Spending on Education
Public Spending on Health
LAC AveraKe 2.3 2.5 2.6 2.7 9.8 10.0 10.1 9.9
3.25 These tables indicate that Nicaragua i s making a similar expenditure effort in primary education as other countries in the L A C region on average. At the secondary level, however, Nicaragua’s public expenditure effort i s little more than hal f the regional average, suggesting an important public spending shortfall in that area.35
3.26 In contrast to secondary level education spending, Nicaragua appears to be spending much more per student at the tertiary level than other countries in the region. Almost one-third o f the 4.1 percent o f GDP devoted to education spending in Nicaragua i s spent at the tertiary level. This translates into an estimated public expenditure o f a l i t t le more than US$l,OOO per student.36 This per-student transfer represents over 100 percent o f per capita GDP, or roughly 10 times the amount spent on each primary student and 8 times the amount spent per secondary student. I t i s also about 3 times higher in per-capita GDP terms than the amount spent per tertiary student in the rest o f Latin America, which averages 36 percent o f per capita GDP (World Bank, Edstats).
L
35. These preliminary conclusions should also take in to account differences in private sector involvement at each level. In Nicaragua, around 15 percent o f primary students and 28 percent o f secondary students are enrolled in private institutions (Wor ld Bank, EDStats). These ratios, however, are fair ly close to the average ratios in the other countries o f the regional sample. 36. This estimate o f per-student spending i s based o n a sample o f universities (WAN-Managua , UCA and UNA), which account for approximately one-half o f the central government transfer t o the universities; JUDENIC, “Investigacidn sobre 10s Fondos Asignados a las Universidades del Presupuesto General de la Republica.”
47

Table 3.5: Public Spending on Primary Education in 2005 Public Expenditure N e t Primary Primary Age
on Primary Enrollement Rate Population Adjusted Expenditure Effort as % o f GDP p.c. ("/.I as % o f Total Pop. = 1*2*3 Index L A C = 100
(1) (2) (3) Argentina 10.9 98.8 10.8 1.2 93 Bol iv ia 16.4 95.2 15.5 2.4 193 Brasi l 10.8 92.9 7.5 0.8 60 Chile 12.9 84.8 11.2 1.2 98 Colombia 16.7 83.2 10.8 1.5 120 Costa Rica 17.1 90.4 12.4 1.9 153 Dominican Republic 5.0 86.0 12.8 0.6 44 Ecuador 3.2 97.7 13.3 0.4 33 El Salvador 9.4 92.3 13.7 1.2 95 Guatemala 4.7 93.0 16.3 0.7 57 Jamaica 12.6 90.6 12.4 1.4 113 Mexico 16.0 97.8 13.2 2.1 165
Panama 9.9 98.2 12.2 1.2 95 Paraguay 12.6 89.3 15.2 1.7 131 Peru 6.4 97.1 13.5 0.8 67 Trinidad & Tobago 16.0 92.2 10.9 1.6 128 Uruguay 6.5 90.4 9.8 0.6 46
Nicaragua 9.1 87.9 16.0 1.3 102
L A C Average 10.9 92.1 12.6 1.3 100 Source: A. Morduchowicz & L. Duro (2007), CEPAL. Based on figures for 2005 or most recent
48

Table 3.6: Public Spending on Secondary Education in 2005 Public Expenditure Net Secondary Secondary Age
on Secondary Enrollement Rate Population Adjusted Expenditure Effort as YO o f GDP p.c. (%I as % o f Total Pop. = 1*2*3 Index L A C = 100
(1) (2) (3) Argentina 14.3 79.1 10.8 1.2 134 Bolivia 13.0 73.6 14.4 1.4 151 Brasi l 11.2 75.7 13.4 1.1 I24 Chile 14.3 80.8 11.5 1.3 145 Colombia 16.0 54.9 12.6 1.1 121 Costa Rica 17.2 52.7 10.7 1 .o 106 Dominican Republic 1.3 49.3 13.3 0.1 9 Ecuador 6.1 52.2 12.8 0.4 45 E l Salvador 9.0 48.1 13.0 0.6 62 Guatemala 3.7 33.7 12.2 0.2 17 Jamaica 21.9 79.2 10.7 1.9 203 Mexico 17.3 63.8 12.9 1.4 156
Panama 12.6 63.7 11.9 1 .o 104 Paraguay 14.1 51.1 14.4 1 .O 114 Peru 8.7 68.8 10.9 0.7 71 Trinidad & Tobago 17.2 71.9 9.2 1.1 124
Nicaragua 10.7 40.7 12.3 0.5 59
Uruguay 7.2 73.2 9.6 0.5 55
L A C Average 12.0 61.8 12.0 0.9 100 Source: A. Morduchowicz & L. Duro (2007), CEPAL. Based on figures for 2005 or most recent.
Has Nicaragua been spending enough on Health?
3.27 The Central American countries, except for Guatemala, display a uniform pattern in overall health spending, ranging between 7.1 and 8.1 percent o f GDP; Table 3.7. The distribution between private and public spending, however, exhibits considerably more variation. Costa Rica and Panama rely primarily o n the public sector to provide health services. (These are also the two richest countries in the region, with the most comprehensive social security systems.) The other countries in the region, including Nicaragua, exhibit a more evenly balanced distribution o f health spending3’ Nicaragua’s total amount o f per-capita spending on health L
37. questions about equitable access to health care services.
The higher reliance o n private health spending among the poorer countries in the region, o f course, raises
49

(US$208 in 2003) i s considerably lower than the regional average (US$363), but s t i l l well above the US$80 in spending that i s considered the minimum necessary to sustain an adequately working health system.38 Based on these findings, i t does not appear that Nicaragua’s public sector i s spending too l i t t le on public health.
Table 3.7 Population, GDP, and Health Expenditures in Central America, 2003 Total health Of which, 1 Average per Per capita Public expenditures Public Private 1 capita health Expenditures on
Spending Spending ! expenditures health As percent of GDP I (in International US$, 2003)
Costa Rica 7.3 5.8 1.5 I 616 486 El Salvador 8.1 3.7 4.4 i 378 174
Honduras 7.1 4.0 3.1 I 184 104
Panama 7.6 5.0 2.6 / 555 368
Guatemala 5.4 2.1 3.3 I 235 93
Nicaragua 7.7 3.7 4.0 1 208 101
Average 7.2 4.0 3.2 i 363 221 Source: WHO Core Indicators, 2006. Public health expenditure includes both recurrent and capital spending f r o m government (central and local) budgets, external borrowings and grants (including donations f rom international agencies and nongovernmental organizations), and social (or compulsory) health insurance funds.
D. The Efficiency o f Social Sector Spending
Some Cross-country Evidence
3.28 A general assessment o f the efficiency o f social expenditures in Nicaragua can be obtained from recent research at the World Bank on the measurement o f efficiency in public spending across c~untr ies.~’ This work involves the construction o f empirically-derived world production possibilities frontiers, relating the amounts o f public spending in particular sectors to various outcome indicators in each sector. In this context, efficiency is measured as the distance between a country’s actual combination o f public spending and sector outcomes in each sector and an efficiency frontier. This distance to the frontier can be measured, alternatively, in terms o f the amount o f public spending made in generating a particular output, or in terms o f the output generated for a particular level o f public spending. In both cases, the index measuring efficiency i s constructed in a way that countries on the frontier exhibit an index o f 1.0 and less efficient countries exhibit an index that i s between 0 and 1. See Annex A for details.
L
38. A study by Evans et al. (2006) estimated the efficiency o f the health system o f 191 countries by comparing levels o f health outcomes and health inputs (health expenditure per capita and education level). The study finds that i t i s diff icult for systems to be efficient with annual health per capita expenditures lower than US$80. 39. Herrera, Santiago and Gaobo Pang (2005), “Efficiency o f Public Spending in Developing Countries: An Efficiency Frontier Approach”, Wor ld Bank working paper, May.
50

ble 3.8: Ranking o f Efficiency Scores for Pub1 Average Efficiency Scores in Education Input-oriented Output-oriented
Uruguay 0.97 Uruguay 0.97 Dominican Rep. 0.80 Argentina 0.75 Guatemala 0.70 Barbados 0.72 El Salvador 0.66 Panama 0.70 Chile 0.63 Chile 0.67 Peru 0.62 Mexico 0.67 Trin. & Tob. 0.62 Trin. & Tob. 0.67 Argentina 0.61 Peru 0.66 Brasil 0.60 Brad 0.66 Mexico 0.57 Jamaica 0.63
Sample median Paraguay 0.52 Paraguay 0.61 Colombia 0.52 Dominican Rep. 0.61 Panama 0.52 Guyana 0.61 Nicaragua 0.52 Bolivia 0.60 Guyana 0.5 1 Colombia 0.58 Bolivia 0.50 Costa Rica 0.56 Honduras 0.50 El Salvador 0.55 Costa Rica 0.49 Honduras 0.53 Jamaica 0.44 Nicaragua 0.47 Barbados 0.36 Guatemala 0.47 Ecuador na Ecuador na Venezuela na Hai t i na Haiti na Venezuela na Yource: Annex A.
: Spending in Education and Health Average Efficiency Scores in Health
Input-oriented Output-oriented Trin. & Tob. 0.89 Chile 0.98 Chile 0.88 Mexico 0.96 Mexico 0.79 Trin. & Tob. 0.95 Dominican Rep. 0.78 Panama 0.95 Guatemala 0.71 Uruguay 0.94 Peru 0.71 Barbados 0.94 Jamaica 0.70 Jamaica 0.94 Ecuador 0.69 Costa Rica 0.93 Brasil 0.69 El Salvador 0.93 Honduras 0.68 Honduras 0.92 Paraguay 0.68 Argentina 0.9 1 Costa Rica 0.67 Peru 0.9 1
Sample median Venezuela 0.66 Nicaragua 0.90 E l Salvador 0.66 Brasil 0.90 Nicaragua 0.65 Ecuador 0.88 Hait i 0.65 Guyana 0.87 Bolivia 0.63 Colombia 0.86 Colombia 0.62 Dominican Rep. 0.85 Guyana 0.60 Paraguay 0.84 Barbados 0.58 Venezuela 0.84 Panama 0.55 Guatemala 0.81 Uruguay 0.55 Bolivia 0.75 Argentina 0.50 Ha i t i 0.57
3.29 Table 3.8 compares the average efficiency scores for public spending on education and health in the Latin American region, based on data from 1996-2002. I t indicates that the efficiency o f public spending in Nicaragua is among the lowest in the region. Nicaragua’s efficiency scores fall below the median, both for the input-oriented as we l l as output-oriented measures, and for education spending as well as for health spending (albeit somewhat less pronounced in the latter case).
3.30 These findings suggest that there is significant room for improving the efficiency o f public social spending in Nicaragua. One way to gauge the potential room for achieving greater efficiency i s by comparing Nicaragua’s efficiency scores to the scores achieved by countries ranked at the 75th percentile o f the regional and world-wide distribution o f efficiency scores. Such a comparison suggests that Nicaragua could achieve fiscal savings o n the order o f 13 to 21 percent in education spending, and o f around 9 percent in health spending, by adopting the practices o f countries that are operating closer to the efficiency frontier. The same analysis, using output oriented measures, suggest that Nicaragua could raise outcome indicators by around 50 percent in education and 5 percent in health by adopting those practices while maintaining overall spending the same. 40
L
40. See Table 3 in Annex A. The comparison with countries at the 75th percentile o f the distribution o f efficiency scores appears reasonable as a benchmark for most developing countries. While it looks beyond a simple average, it i s not as ambitious as seeking a position on the efficiency frontier. If positions on the efficiency frontier were taken
51

Summary Review of Public Expenditures in Education
3.31 Recent Evolution o f Education Expenditures. Since the late 1990s, there has been a marked upward trend in education expenditures, from 3.6 percent o f GDP in 2001 to 4.9 percent o f GDP in 2005. About two-thirds o f the total expenditure o n education i s allocated to the education ministry for pre-university education, a figure that has been constant for a decade. Excluding transfers to the universities, the bulk o f education resources are devoted to primary education (77 percent), followed by secondary education (13 percent) and adult education (5 percent). Overall, per student spending i s highest at the primary level (US$ 128) followed by secondary education (US$ 48) and pre-school education (US$ 20). External resources (grants and credits) finance around 30 percent o f total education spending. Most o f these external funds have been earmarked for primary education and for centrally executed activities and programs. Overall the rate o f budget execution in the sector i s high, averaging over 90 percent for public resources and grant financing.
3.32 The total teaching force increased by approximately 5,000 positions between 2002 and 2004, or approximately 11 percent. Teacher salaries also increased over the same time frame, although the average teacher salary (2.4 times GDP per capita) remains below the target benchmark o f 3.5 times GDP per capita established under the EFA FTI indicative framework. An in-depth study i s required to determine a more effective teacher compensation and deployment pol icy that takes into account teacher performance and promotes greater teacher accountability towards results.
3.33 Kev Sector Developments. Among the most noteworthy sector developments since 2001 are the passage o f the Education Participation Law (Law 413) and approval o f the Education for All - Fast Track Initiative (EFA-FTI). The Ortega administration has embraced the EFA FTI - which disbursed US$ 7 mi l l ion for 2004-2005 and i s projected to yield another US$ 10 mi l l ion for 2006-2007 - but has expressed concerns with aspects o f the autonomy program, particularly with the financial transfers provided to the schools. As a result, a l l financial transfers to the schools were stopped for the academic year beginning in 2007, pending a final decision by the education ministry on how to proceed. Another major development under the Ortega administration has been the abolition o f school fees and voluntary contributions. Both are discussed next.
3.34 Decentralized School Management. The school autonomy program started as a pi lot in 1993, with the participation o f 20 large, urban secondary schools on a volunteer basis. In 1995, the model was extended to primary schools with special adaptations in rural areas, and by 1997, a total o f 3,950 schools were participating in the autonomy program. The autonomy program was institutionalized with the Education Participation Law passed in 2002, along with internal regulations for its implementation. By 2006, a total o f 4,997 primary schools (or 58 percent o f the total) and 501 secondary schools (or 40 percent o f the total), enrolling almost 1 mi l l ion students, were operating under the Participation program. A key feature o f the autonomous program i s the decentralization o f decision making and financial resources directly to the schools using a per-capita financing formula.
as benchmarks, the potential fiscal savings would increase to 48 percent in education and 35 percent in health, while potential outcome gains would increase to over 100 percent in education, and 1 1 percent in health.
52

3.35 A br ief assessment o f the autonomy model yields a series o f important findings. Positive aspects include the empowerment o f parents, students and teachers in planning and decision making and better education indicators when compared to traditional schools, especially in terms o f lower repetition rates, fewer unqualified teachers and higher student test results in some subjects. Negative aspects include higher student-teacher ratios. Since 2006, the Ministry has been studying some o f the adverse effects caused with the financing formula used to determine the size o f the financial transfer to each school. Init ial findings indicate that the formula, which i s anchored o n enrollment, appears to have led to an over-statement o f school enrollment levels. In 2006 the Ministry revised the formula, on a transitional basis pending an in-depth assessment o f the formula and consultations on options to strengthen it.
3.36 School fees and voluntary contributions. The Ortega Administration feels that many potential students were excluded from attending school by the fees and voluntary contributions that had been previously charged. While the decision to abolish these fees is an important step forward in removing possible barriers to school enrollment or continued attendance, i t i s also important to recognize that concomitant allocations must be forthcoming to offset forgone revenue, which previously served to cover important operational expenses. Similarly, i t i s also important to recognize that the school fees and contributions only constituted part o f the overall costs o f schooling. Many other important costs (e.g., related to uniforms, shoes, materials, meals) have not been reduced and have been found to have an equal if not greater incidence o n enrollment and retention, particularly among the poor.
3.37 Evolution o f Sector Outcomes. While the funds channeled to education have increased since 2001 , sector outcomes exhibit a mixed performance. Overall access, internal efficiency and primary drop out indicators show improvements, but secondary drop out rates, teacher quality and studentlteacher ratios in public school exhibit little change or d e t e r i ~ r a t i o n . ~ ~
Access. Net enrollment rates increased in al l levels between 2000 and 2005: from 3 1.8 to 41.7 percent in preschool education, from 84.1 to 91.9 percent in primary education and from 36.8 to 44.3 percent in secondary education. In 2005 the official age at entry in the first grade was also reduced from 7 years to 6 years to promote an earlier entrance into the formal school system. In rural areas, however, only 54 percent were in the appropriate age bracket. In fact, a third o f first graders were 9 years or older. Internal EfJiciency. Progress has been steady since 2001, but slow. Repetition rates have remained high and virtually unchanged since 2001. However, the proportion o f students that complete primary education in the allotted time for the cycle (6 years), increased f rom 36 percent in 2001 and 41 percent in 2006; most notably in rural areas, where the proportion rose from 23 percent in 2001 and 3 1 percent in 2006.42
41. Unfortunately, there i s n o time series data available at t h i s point to assess the evolution o f student performance. The national student assessment carried out in 2002 showed that most students in the 3 rd and 6 th grades achieved basic levels o f proficiency in Spanish and Mathematics, with students in private schools generally exhibiting a margin o f 10 to 12 percentage points above public school students. An analysis o f teacher prof i le factors and their impact o n student performance indicated that only about ha l f o f the teachers feel we l l prepared to teach concepts related to mathematics. Results f r o m a national assessment in 2006 are forthcoming. 42. Improvements in the primary completion rate are hampered by school desertion, grade repetit ion and the fact that many students simply fa i l to register for the next school year. Th is last phenomenon i s most prominent in the transition f r o m f i r s t to second grade.
53

0 Drop out rates. Drop out rate at the primary level remain very high, particularly in the early grades o f the cycle, but have been declining. The average annual drop out rate in grade 1 for 2000 through 2005 was 17.5 percent compared to 20 percent 1990-2000. Since 2005 there has been a marked improvement in lowering the drop out rates in grade 2 and beyond. The immediate challenge remains in grade 1 which i s an exit point for many students. Improvements in reducing drop outs at the secondary level have been negligible or non- existent. 43
0 Teacher quality. At the primary education level, the percentage o f unqualified teachers increased slightly, from 25.8 percent44 in 2002 to 26.3 percent in 2004. At the secondary level, the increase was fairly substantial, from 37 percent to 51 percent. An in-depth study on the situation o f teacher qualification level in the education system in Nicaragua found that the highest proportion o f unqualified primary school teachers was registered in StateMunicipal, non-autonomous schools (40 percent) while autonomous schools had the lowest proportion (19 percent). At the secondary level, the proportion o f unqualified teachers i s above 50 percent, irrespective o f type o f school establishment. The proportion o f unqualified teachers remains dangerously high and warrants immediate action.
0 Student/Teacher ratio. The number o f students per teacher exhibits a declining trend for the education system overall, falling from 33.6 students per teacher in 2002 to 31.5 in 2004. However, this decline is due entirely to the fa l l in student teacher ratios at private institutions. In public institutions, the student-teacher ratio has increased, reaching 36.3 in primary and 39.7 in secondary (versus private school ratios o f 24.7 and 23.1).
3.38 Measures to Raise the Impact o f Education Spending. Nicaragua wil l need to continue its efforts to increase access and improve the quality o f primary education, particularly in rural areas and among vulnerable population groups to ensure that i t achieves the MDG o f universal completion o f primary education by 2015.45 In addition, as the primary education system expands, i t i s important to increase investments in other levels o f the system, most notably early childhood development, pre-school and secondary education. Since substantial additional fiscal resources are not available in the short to medium term (nor are the required expenditures to reach strategic milestones in those levels well defined), i t i s necessary to rely on efficiency gains in the sector to generate the fiscal savings needed to finance additional spending in early childhood and secondary education.
L
43. Findings f rom recent household surveys point t o monetary problems as the most important constraint related to high drop out rates for primary school aged children, especially students living in extremely poor households in rural areas. For the secondary school aged population, the ma in constraints are financial, work activities and lack o f in terest in schooling opportunities. 44. Radiografia del empirismo docente, JR Laguna, Diciembre, 2005 - Estadistica Escolar 2000-2005, MECD. 45. Of particular importance in this context i s the need to eliminate the bottlenecks that inhibit the supply o f education services in the Atlantic Coast, where the disparity in indicators i s most acute
54

3.39 Tracking Sector Expenditures. To ensure adequate resource flows to the sector, i t is important to (i) monitor closely the implementation o f poverty focused programs in the context o f the Poverty Reduction Strategy, (ii) develop a medium-term cost and financing framework that incorporates the poverty-focused program along with targets for additional spending in early childhood development, preschool and secondary education, (iii) identify potential fiscal savings through intra-sector resource reallocations. One potentially large source o f fiscal savings i s the transfers provided to the universities. fi
relative to the transfers received by other Education year Quintiles (QI =poorest) students in the education system and to Level Q1 42 Q3 Q! __--______________ Q5 the transfers provided in the other Primary 1993 16 21 22 22 19
Table 3.9: Distribution of Government Education This subsidy is generous, both Subsidies by Household Expenditure Quintfle (in %)
countries in the region. Since most o f 1998 23 24 23 19 10 1993 4 15 27 23 32 1998 6 15 24 30 25
0 5 24 71 country (see Table 3.9), a strategy based 1998 1 2 14 21 62
the beneficiaries o f these transfers do not belong to the poorest quintiles in the University 1993
on greater cost recovery efforts by the
Secondary
Source: World Bank, Edstats, based on LSMS 1993 & 1998. universities, coupled with scholarship programs targeted to poor students, could prove viable and would reap significant gains across the sector.
3.40 Improving Sector Administration and Management. For the process o f decentralization to move forward more effectively, i t wil l be important to evaluate the lessons learned from the accumulated experience with the Education Participation Law, including the autonomy program with a view to strengthening parts that may not be responding to the current context and changing conditions. I t i s particularly important to review the school financing formula and strengthen monitoring and evaluation mechanisms at the school level to generate t imely information with respect to their finances and outcomes.
3.41 Improving Access and Quality. To improve access and retention it will be crucial to develop or reinstate a demand-side program aimed at reducing the direct and indirect costs o f schooling for children and young people from extremely poor households for whom these schooling costs are a major barrier to enrollment or retention. Moreover, i t wil l also be important to revisit successful and cost-effective early childhood programs that have been implemented as pilots over the years to target children from vulnerable families to improve their nutrition status, cognitive development and school readiness.
3.42 Improving Personnel Management. To improve the quality o f education i t i s imperative to develop a human resource strategy with particular emphasis on raising the profile o f the teaching profession and improving the quality o f teacher education programs. In developing such a strategy, urgent attention needs to be devoted to the transformation o f pre-service teacher education programs, the introduction o f effective in-service programs to upgrade the existing stock o f unqualified teachers within a short period o f time, the design o f an efficient teaching support system to promote better teacher performance, and a reformed teacher remuneration framework that l i n k s wages to performance; see Chapter N.
55

Summary Review of Public Expenditures in Health
3.43 Recent Evolution o f Health Sector Expenditures. National public health expenditures grew by 22.5 percent in constant terms, from US$ 315 mi l l ion in 2001 to US$ 386 mi l l ion in 2004; Table 3.10. This represents an increase o f 12.5 percent, in per capita terms over this period, from US$63 per person in 2001 to US$72 in 2004.46 As a share o f GDP, health spending increased from 6.8 percent o f GDP in 2001 to 8 percent in 2004. Households accounted for around 41 percent o f total health spending during this period, while the Ministry o f Health accounted for 36 percent and N S S for 17 percent. While MOH’s per capita spending (net o f IHSS affiliates) was US$ 28, INSS spent US$ 176 per affiliate and US$ 135 per beneficiary. INSS has much higher per capita expenditures (3.9 times to 5.8 times) than the M O H
~
Institution 2001 2002 2003 2004 2001 2002 2003 2004 In constant 2006 US$ millions
Public Sector 169.8 180.2 212.3 213.7 I 53.9 52.4 56.6 55.3 Central Government 115.0 129.6 155.6 149.9 I 36.5 37.7 41.5 38.8
Min is t ry o f Health 101.1 119.8 143.3 137.6 1 32.1 34.8 38.2 35.6 Other Ministries 13.9 9.8 12.3 12.3 1 4.4 2.9 3.3 3.2
mss * 54.8 50.6 56.6 63.9 I 17.4 14.7 15.1 16.5 Private Sector 145.1 163.6 162.7 172.5 I 46.1 47.6 43.4 44.7 Households 132.6 156.2 144.3 158.9 1 42.1 45.4 38.5 41.1 Other (incl. insurance &NGOs) 12.5 7.4 18.4 13.6 1 4.0 2.2 4.9 3.6 GRAND TOTAL 314.9 343.8 375.0 386.3 100 100 100 100 Sources: MOH, DGPD, NHA. * INSS expenditure in 2001 include US$ 1.6 m i l l i on spent by PES.
I As percent of Grand Total
3.44 Composition o f Health Spending. Medical inputs and curative services comprise the lion’s share o f total health expenditures (a combined share o f 84 percent in 2002 and 77 percent in 2003), while the combined shares o f preventive services, training and research are significantly lower at 10 percent in 2002 and
costs comprise the majority o f M O H recurrent costs, increasing their share from 57 percent in
Table 3.11 14’6 percent in 2003; 3* * Shares of Total Health S ending by Function (in %) Average 2002l2003
37.4 7.8
4.5 Administration 5.1
Total 100 Sources: MOH, NHA.
Curative 2004 to 60 percent in 2006. In contrast, the Preventive semiceS share o f Non- Personnel Services declined Medica l inputs 43.3 from 16 percent to 15 percent, with the share
in 2004 to 15 percent in 2006. Others 2.1
Training and Research o f drugs decreasing the most - from 19 percent
L
46. Nicaragua keeps a good system o f National Health Accounts (NHA) but the most recently published figures only extend until 2003. This section uses 2004 unpublished NHA data and other sources, updating some o f the information up to 2006.
56

3.45 Since 2001, Nicaragua has made gradual, but steady, progress in a number o f key health indicators; Table 3.12. Infant and chi ld mortality rates and chronic malnutrition have declined. Maternal mortality rates based on MOH data also decreased from 2001 to 2005, but these are mainly facility-based data and not from nationally representative surveys. The available data for percentage o f attended births by skilled health personnel (a proxy to measure MMR) i s from 2000 at 67 percent. As for other maternal health indicators, prenatal coverage increased slightly but more progress was made in terms o f institutional births. However, family planning coverage declined significantly. Moreover although B C G coverage increased, the coverage rates for polio, DPT, and MMR vaccinations decreased.
Table 3.12: Health Outcomes and Outputs, 2001 and 2005
Evolution o f Key Health Outcomes.
Key Performance Indicators 2001 2005 Infant mortality rate (per 1,000 live births) 35a 30b Under five mortality (per 1,000 live births) 40a 37b
1 8.1 c (2004) Chronic malnutrition (children < 5 years o f age) 20.2a Maternal mortality rate (per 100,000) 107.2d 86.5d Institutional births (“A) 50.6 58 Prenatal care coverage (%) 70.2 71.6 Family planning coverage (“A) 24.5 12.9
One year old children who received polio vaccine 92.6 86.7 One year old children who received DPT (Diphtheria, Pertussis, and Tetanus) vaccine 92 86.2 One year old children who received MMR (measles, mumps, rubella) vaccine 101.6 96.3 Sources: aENDESA 2001; bWDR 2006, ‘SEVIN 2004, dMOH statistics ( INS 2004-2008 document) . Note: the 2000 M O H MMR estimate o f 87.6 deaths per 100,000 i s much lower than the WHO Core indicator estimate o f 230 per 100,000
One year old children who received BCG vaccine 98 102
3.46 The Relative Efficiency o f Health Spending. The increase in health spending appears to have resulted in improvements in a number o f indicators. However, some indicators such as coverage rates for family planning and immunization coverage rates declined, which may be reflecting the low spending on preventive care. Relative to other countries with similar PPP per capita health expenditures, Nicaragua appears to have a lower chi ld stunting rate (20) than Bolivia (27), Ecuador (26), Honduras (25), and Peru (25), but higher than Venezuela (13). Also, Nicaragua has a higher under-5 mortality rate (38) than Ecuador (26) Peru (29), Honduras (32), and Venezuela (1 9).
3.47 Nicaragua could achieve efficiency gains in health spending through the fol lowing intra- sectoral resource reallocations:
0 Increasing the focus on and budget allocated to cost effective preventive health care and health promotion (PHHP) measures especially for poor, disadvantaged segments o f the population. The 2004 expenditure share o f preventive services o f about 7 percent i s very low-especial ly when compared to the regional average o f 30 percent. Investment in health promotiodIEC i s also essential because 30 percent o f the population (LSMS 2005) resort to self-medication, which can pose health r isks if done inappropriately. Improving the mix and allocation o f personnel. Nicaragua has more doctors but fewer nurses compared to its level o f development (GDP per capita). Despite having a relatively high number o f physicians, about 50 percent o f the physicians live and work in Managua (Dussault and Franceschini, 2003). Nicaragua deploys social workers on long-term
0
57

assignments based on each region's r isks and needs; this strategy could be extended to health care workers (WB 2007)
3.48 To generate the fiscal savings that would permit shifting more resources toward preventive health care and promotion, as well as toward needed human resources such as nurses and auxiliary/PHC workers, the Government could improve operational efficiency through the following measures:
0 Revising sector wage policies. The recent legislation to equate sector salaries with those prevailing in the Region poses a major fiscal threat, considering that Nicaragua's per capita income i s the lowest in the region. At least the legislation needs to be amended so that i t refers to an equalization o f wages in terms o f per capita GDP, instead o f in absolute levels. TargetinP health subsidies. The intent to establish free health services for a l l i s laudable, but not affordable from a fiscal viewpoint. To render it fiscally viable, i t i s necessary to target this subsidy to the poor and neediest segments o f the population, with the idea o f eventually establishing a fixed fee scheme with wel l specified exemptions. Reducing the over-consumption o f health services. INSS seems to over-consume services, such as drugs with no epidemiological justification4' . This presents a need to regulate, audit, and implement quality controls in the prescription o f pharmaceuticals in the Empresas Medicas Previsionales (EMPS). A strong primary health care and preventive pol icy i s also needed because IHSS benefits currently exclude preventive exams. The Government could establish different capitation payments that account for cost and risk by age and gender, and that include cost- and overuse- containment strategies. Improving drug procurement. A study found that the average price o f a l i s t o f 35 generic medicines in Nicaragua was 10 times higher than the price paid by an IDB project in Argentina (Meerhoff, 2004a). Also, while the public drug and medical supply agency (CIPS) provides subsidizedfree drugs, only 45 percent o f the population has access to these drugs, and the rest face very high prices for non-generic drugs. The Government could consider establishing a drug-purchasing and distributing agency or look into the Ecuador experience where the MOH negotiates the prices with i t s providers, while the local health centers decide the amount and kind o f medicines they need, and buy directly f rom the provider o f their choice, based on previously agreed prices between the providers and the MOH.
0
0
0
Summary Review of Public Expenditures on Social Protection 3.49 Unlike education or health, social protection is generally not defined as i t s own sector, but rather as a sub-sector or "strategy" within the various traditional sectors making up an economy. Since i t cuts across sectors and is integrated into a wide variety o f types o f programs and projects, i t i s often difficult to identify how much o f the budget is specific to social protection. Social protection programs and activities are typically undertaken by a myriad o f actors, often within their regular operations, which are not included in the sector expenditure totals reported here. For instance, the Ministry o f Education might have a program o f
L
47. Consumption o f medication ranges from 9.8 drugs per year per beneficiary for 12 small EMPs (average size o f 2,212 members), to 24.3 drugs per year per beneficiary for the two largest EMPs (average size o f 34,154 members). Consumption by region also varies significantly.
58

scholarships for poor, high-achieving students, which could be considered a social protection program. Similarly, many municipalities run programs that are not covered in this analysis.
3.50 Evolution of Public Spending in Social Protection. Table 3.13 presents the budget executed by the core social protection programs since 1991. The main institutions in this sub- sector are the Ministry o f the Family (MIFAM) and the Social Emergency Investment Fund (FISE), as wel l as the now-defunct Social Action Secretariat (SAS) and Social Emergency Fund (FES) managed under the Presidency during the 1990s. The National Social Security Institute (INSS), a co-financier o f health and pension benefits for i t s affiliates, occupied a large share o f the sub-sector budget in the early 1 9 9 0 ~ ~ but much o f i t s current financing takes place outside o f the central government budget.48
Table 3.13: Main Social Protection Programs in the Budget (executed budget; % o f GDP) 1991 1995 2000 2001 2002 2003 2004 2005
Presidency (SAS and FES) 0.00% 0.60% 0.27% n/a 0.04% 0.03% 0.03% 0.04% Min is t ry o f Labor (w/o INATEC) 0.15% 0.05% 0.09% 0.05% 0.05% 0.05% 0.04% 0.03% Min is t ry o f the Fami ly 0.00% 0.00% 0.42% 0.22% 0.22% 0.49% 0.58% 0.30% Social Emergency Invest. Fund (FISE) 0.00% 0.09% 0.13% 0.12% 0.46% 0.95% 1.18% 0.62% National Social Security Institute (INSS) 0.38% 0.04% 0.01% 0.00% 0.00% 0.00% 0.00% 0.00% TOTAL 0.54% 0.79% 0.91% 0.38% 0.77% 1.52% 1.84% 0.98%
3.51 The sub-sector’s share o f the budget is low, typically fluctuating around 1 percent o f GDP. Expenditures on social protection programs exhibit a rather erratic pattern - with large fluctuations in the total amounts devoted to the various programs and institutions, and large fluctuations in the share o f specific programs and institutions in the total. Even fi-om one year to the next, changes can be dramatic - for instance, the sector experienced a reduction by almost 50 percent between 2004 and 2005. These fluctuations are partly linked to emergency rel ief operations, but, more generally, reflect a lack o f planning and budgeting capacity for social protection programs. Similarly, the actual execution o f programs can depart significantly f rom the planned budgets, especially in the case o f FISE. Although the variability seems to have decreased over the years, differences s t i l l persist with, for instance, FISE executing 1.65 times i ts planned expenditure in 2004.
3.52 One o f the challenges o f social protection is that i t typically requires counter-cyclical funding - larger resources are needed in times o f lower economic growth and/or disasters. At the same time, however, social protection programs typically involve lower f ixed costs (e.g. salaries) than other ministries (e.g. health or education) and hence face less resistance to budget cuts. This last aspect makes the sector a prime candidate for large cuts or shifts in times o f fiscal consolidation. It is also a sector where governments typically attempt to develop flagship programs that are strongly identified with a particular administration and hence have lower chances o f being continued after political transitions.
L
48 Since 1994, the Nicaraguan Social Security Institute (INSS) has had a surplus and has not been a burden on the budget. This might be related to the efforts in increasing the number o f insured workers - f r o m 200,000 in 1993 to 430,000 in 2006. However, the current system has a significant actuarial deficit (estimated at C $ 271,573 mill ions). A s a result, the Government i s studying alternative options for reform. The init ial re form proposal presented by the High Commission for the Reform o f the Pension system (which adjusted the contribution rate, the age o f pension, and the indexation o f benefits) st i l l involves a deficit starting in 2040 and reaching up to 6 percent o f GDP by 2065. The Inter-institutional Technical Commission i s currently studying alternative scenarios
59

3.53 The notably erratic execution o f many programs in the social protection area i s partly l inked to a high dependency on external sources o f funding for these programs. For instance, in the case o f the Ministry o f the Family, the share o f external financing in total capital expenditures averaged 88 percent in 2003-2004. Even though this share was programmed to fa l l to 75 percent in 2007, i t st i l l signals a high dependency on external funding that renders sub- sector spending vulnerable to program disruptions and to high staff turnover, both o f which limit their effectiveness and sustainability.
3.54 Evolution o f K e y Sector Outcome Indicators. Progress in poverty reduction has been disappointing. In spite o f steady, though modest, declines in poverty rates during the 1990s, poverty remains high and social indicators weak in Nicaragua (headcount o f 46.2 percent for the poor and 14.9 percent for the extremely poor in 2005). Nicaragua has experienced a reduction in inequality (Gini from 50.4 in 1993 to 41.0 in 2005) over the past decade, associated with a reduction in the depth o f poverty. However, the number o f poor has not declined. Poverty and vulnerability also are reflected in poor nutrition outcomes, where the pace o f improvement slowed down and 21.5 percent o f children under 5 are chronically malnourished in 2005.
3.55 Poverty i s particularly acute in rural areas and the Atlantic coast region. In addition, the poor in Nicaragua exhibit a relatively high vulnerability linked to the frequency o f covariate shocks, including natural disasters, commodity price shocks and household-level shocks, in particular health and labor-related shocks.
3.56 Assessment of Efficiency The disappointing human development results described earlier occurred in spite o f a growing GDP per capita and substantial public spending o n poverty reduction programs broadly defined. This suggests that much o f this spending has been inefficient. One o f the most critical issues noted in the area o f social protection i s the l o w level o f allocational efficiency, partly linked to the fragmentation o f programs across and within sectors, the duplication o f efforts, and the overlap o f programs. M I N S A and the Ministry o f the Family, for example, both manage early childhood development and nutrition programs that are similar in nature and use the same protocols, but are not coordinated. Overlaps and lack o f coordination are also common within institutions and agencies. For instance, the operations o f the Red de Proteccidn Social and o f PAININ, both in the Ministry o f the Family, were not coordinated and led to duplication in specific areas o f implementation.
3.57 Another critical issue is the poor quality o f services and outcomes. Most programs are o f a “pilot” nature, covering very small groups in the country. This raises two issues in terms o f effectiveness o f public expenditure - the targeting o f these programs could often be improved with larger-scale interventions, and the resulting services provided to different communities vary largely across the country, limiting the horizontal equity o f the programs. Even though individual social protection programs are generally wel l targeted, their fragmentation resulted in overall l ow coverage. The social protection services also suffer limitations in terms o f quality, partly due to erratic financing and uncertainty surrounding their continuity (which prevents the establishment o f strong, effective structures with a skilled and stable workforce). In addition, the efficiency o f social protection programs depends by nature on complementary investments in health, education, and other sectors, such as rural development, water, or credit.
3.58 The other critical issue for social protection programs in Nicaragua i s their limited operational efficiency. This i s attributable to fluctuations in financing, variability in the costbenefits o f different programs and large overhead costs o f central activities, partly as a result
60

o f program fragmentation (Some efforts have been made to reduce these costs, particularly in the Ministry o f the Family, which has reorganized to centralize some o f the financial management and procurement activities for al l i t s programs (GON, 2006)), introduce sector-wide monitoring and evaluation mechanisms, and address human resource bottlenecks.
3.59 Greater planning and coordination o f social protection programs, and o f social programs in general, are key ingredients for raising their impacts. Key actions that could help to improve program coordination and effectiveness are presented below:
Proa-am Consolidation. Program consolidation could start with a few programs, and gradually integrate projects and programs in a coherent way, avoiding overlaps between agencies and filling gaps, while eliminating interventions with l i t t le demonstrated impact. The social cabinet can play a key role in this effort. Strengthened analvtical foundations. Develop a sector map that includes an inventory o f existing programs and services provided in the country (public, private, c iv i l society) and identifies gaps in the supply o f services. An analysis o f targeting mechanisms, and o f the strengths and weaknesses o f selected programs, would also be useful. Strategic Planning and Monitoring. Strengthened strategic planning mechanisms and M&E systems are needed to improve coordination and program designs, and would contribute toward the development o f a sector-wide approach. Unif ied and integrated mechanisms would provide a better basis for programmatic support by international partners, which, in turn, could help to reduce fragmentation and duplication o f programs. Regional Coordination. Stronger mechanisms are needed to centrally coordinate the allocation o f programs across geographic zones. This would result in improved targeting o f resources, and greater synergies between programs. Local Coordination. There exist opportunities to consolidate earlier efforts to foster local coordination o f projects. This could include developing mechanisms to harmonize eligibility criteria for households/individuals, mechanisms to propose a unique window for social services, and mechanisms to provide accompaniment to families and individuals in accessing services.
E. Summary and Conclusions
3.60 The previous chapter had concluded that the overall size o f public spending in Nicaragua does not stand out as particularly large or small in regional and worldwide comparisons with countries at similar levels o f development. This chapter found that Nicaragua’s total public spending in key areas that are closely linked to growth and social development - namely public infrastructure investment, education and health - also does not appear to be significantly out o f l ine from the averages spent by other countries across the region. Nevertheless, Nicaragua’s performance falls short in terms o f certain important outcomes, such as per capita GDP growth, the quality o f public infrastructure, and various education and health indicators. This suggests that while the total volume o f public spending in Nicaragua may be adequate, the intra-sector composition and quality o f public spending exhibit deficiencies that manifest themselves in a l ow efficiency o f public spending.
3.61 The preceding review identified various opportunities for improving the quality and efficiency o f public expenditures in key sectors. These opportunities, which are summarized
61

below, mainly involve intra-sector resource shifts, rather than the development o f new programs that require new sources o f financing.
In Transport, important efficiency gains could be had by (i) shifting a higher share o f sector resources toward road maintenance, preferably through FOMAV, using least-cost public bid contractual approaches, (ii) scaling up existing adopinado programs in the expansion o f secondary roads, as a more cost-effective alternative to asphalt or gravel roads, (iii) adapting road designs to less costly standards appropriate to local conditions, and (iv) strengthening the institutional capacities o f MTI in the areas o f planning and programming, and o f F O M A V in the areas o f contracting and procurement procedures.
In Water & Sanitation, important efficiency gains could be had by simultaneously allowing tariffs to adjust to cost recovery levels and improving the operating efficiency o f the water utility, while protecting the poor from prices shocks in sector services. This may be achieved by (i) introducing a loss-reduction program in ENACAL, including through a greater de- concentration o f operations, (ii) granting greater autonomy to INAA in setting tariffs based on long-run marginal costs, and (iii) revising the existing system o f subsidies to target them to the poor. Also, the introduction o f a hygiene education program in rural areas could significantly raise the impact o f sector infrastructure in reducing water-related diseases.
In Energy, it is necessary to step up the level o f total sector investment. This i s best done, however, by creating a more stable pol icy environment for private investors, especially by (i) dehsing the current confrontation with the private distribution company and seeking a common ground for improving service, and (ii) simplifying the electricity pricing structure (while re-considering the existing electricity consumptions subsidy with a view to targeting it more effectively to the poor). Since energy projects have long gestation periods, i t will also be important to update existing studies for hydro-electric and geothermal projects (which are more efficient than the thermal plants that currently dominate electricity generation in Nicaragua) to feed into a long-term sector expansion plan, giving priori ty to the development o f new projects within a regional context.
In Education, sector outcomes could be significantly improved by (i) shifting a higher proportion o f sector resources toward early childhood development, pre-primary education and secondary education, (ii) introducing greater cost recovery at the university level, coupled with an expanded scholarship program exclusively targeted to poor students, (iii) improving the school autonomy program by revising its financing formula and strengthening monitoring and evaluation mechanisms, (iv) developing demand-side programs to reduce the direct and indirect costs that have proven to be barriers o f access to schooling for poor families, and (v) improving the quality o f education through better human resource management.
In Health, major efficiency gains could be had by (i) increasing the proportion o f the sector budget devoted to preventive health care and health promotion, from the current share o f 7 percent to the regional average o f 30 percent (with INSS adopting a strong preventive health policy, since its current benefits do not include preventive exams), and (ii) improving the sk i l ls mix and allocation o f personnel, toward a higher proportion o f nurses and greater concentration in rural areas, away from Managua. Significant fiscal savings to finance greater spending on preventive health care and health promotion activities could be had by (i) revising the overly generous sector wage policy, (ii) reducing the over-consumption o f health services, particularly in INSS, through the implementation o f regulation, audit and quality
62

controls in the prescription o f pharmaceuticals and other health services, as wel l as by adopting different capitation payments for I N S S that account for gender and age-related costs and risks, (iii) implementing a system o f targeted health subsidies, as an alternative to offering free health services for all, and (iv) introducing more efficient drug procurement procedures.
63

64

CHAPTER I V PUBLIC SECTOR EMPLOYMENT AND REMUNERATION POLICY
4.1 The public sector budget payroll has been increasing as a share o f GDP since the mid- 1990s, posing a potential threat to macroeconomic stability. That threat became more acute in mid-2006, amidst growing pressures from public sector unions. Meanwhile, the absence o f adequate framework legislation on public sector remuneration has undermined the authorities’ capacity to ensure that the process o f public wage determination takes place in an orderly, transparent and efficient manner. Nicaragua’s legislation on public sector employment i s fair ly recent and only partially implemented. As a result, staffing and remuneration decisions leave ample room for discretion, the public wage structure exhibits a large, unsystematic dispersion that i s not reflective o f labor market conditions, and employment instability i s more the rule than the exception, a l l o f which lead to disruption and inefficiency in government services. In key areas, these weaknesses are compensated by the extensive use o f long-term consultants occupying c iv i l service positions. Often these consultants are paid directly by foreign donors, and their compensation can be quite high compared to domestically-financed employees, further eroding staff morale and conspiring against institution-building efforts.
4.2 A lack o f systematic data collection on public employment and remuneration has contributed to discretionary decision-making, raising an additional obstacle to rational pol icy formulation. The three principal official sources o f data - the Directorate o f Public Employment (DGFP), the Directorate o f the Budget (DGP) and the National Social Security Institute (INSS) - have differing coverage and different data for the same public institutions for any given year.49 The budget payroll includes only about 40 percent o f public sector employees. Further, remuneration is hidden in numerous budget categories so that, depending on the definition used, the level can be up to 40 percent higher than the budget l ine corresponding to salaries alone.
4.3 This chapter seeks to develop a better understanding o f the overall size and composition o f public employment, and on the structure o f remuneration, pointing out important shortcomings and their implications for the fiscal budget and public sector management. I t discusses recent reforms to restructure and professionalize the c iv i l service in Nicaragua and concludes by outlining the elements o f an efficient, transparent and equitable remuneration policy framework that could help to ensure a more orderly public wage determination process and reduce the threat o f fiscal indiscipline.
L
49. The data used in this report corresponds to the years up to 2006 and does not include the recent changes to government structure introduced by the Government o f President Ortega in early 2007. The data are mostly taken from the data base o f the National Directorate o f Public Function and the computerized SIGFA system and cited in Nogales (2006). The data differs from that cited IMF, 2006, which was taken from INSS records.
65

A. The Legal Framework
4.4 given by the following pieces o f legislation:
The legal framework governing public employment and remuneration in Nicaragua i s
e
e
e
e
e
e
4.5
Labor Code (Codigo del Trabajo) - Law No. 185 o f October 30, 1996. C iv i l Service Law (Ley del Servicio C iv i l y Carrera Administrativa) Law No. 476 o f December 1 1,2003 C iv i l Service Regulations (Reglamento de l a Ley del Servicio Civil) - Decree No. 87- 2004 o f August 6,2004 L a w o f Acquired Rights (Ley de Derechos Laborales Adquiridos) - Law No. 5 16 o f January 17,2005. L a w on Hiring Professional and Technical Services (Ley que Regula l a Contratacion de Servicios Profesionales y tecnicos Nicaraguenses) - Law No. 505 o f January 26,2005. L a w on Leveling Salaries o f Doctors (Ley de Equiparacion de Salarios a Nivel Centroamericano de 10s Medicos y Odontologos que laboran para e l sector Publico de Nicaragua) - Law No. 608 o f February 7,2007
The Labor Code i s the principal legislation governing labor relations in Nicaragua and i s applicable to public sector employees. Some o f the precepts o f this Code would be highly desirable if indeed they were followed, such as those that guarantee employment stability subject to performance and equal promotion opportunities, as wel l as those mandating equal salary for equal work, without discrimination on grounds o f political or religious affiliation, gender, race or other human characteristics (see section C). Some o f its other precepts, however, threaten to raise fiscal costs, most notably those related to social benefits.
4.6 The Civ i l Service Law i s the principal piece o f legislation governing the relations o f the State as an employer and public employees. I t is the newest legislation o f i ts kind in the region5’ and, although i t s regulations were approved only a year after the L a w was passed, i t s implementation only started in 2006 and is incipient (section B). The potential fiscal cost o f full implementation o f the Law has been raised as a reason for i t s slow implementation. However, legally there i s no direct fiscal cost o f implementing the Law.
4.7 The Law o f Acquired Rights has potentially important fiscal consequences. Although the law did not initially aim to cover consultants, it has been interpreted to apply to consultant contracts as well in terms o f extending the social benefits afforded by the Labor Code and other legislation to short-term consultants. Legal recourse to this law has been taken by several consultants whose contracts expired, and al l rulings have been in favor o f the consultants. This i s so even though Article 6 o f Law 505 - which was published afterwards - explicitly indicates that consultant contracts do not generate a legal labor relationship. To achieve clarity in this matter, i t would be useful to have an estimate o f the potential fiscal cost o f this Law and a legal opinion from the Attorney General about the Law’s applicability to consultant contracts financed with domestic or foreign resources.
L
50. back to 1994 (see Iacoviello, 2006).
The oldest i s El Salvador’s, which dates back to 1961 and the second most recent i s Panama’s, which dates
66

4.8 Law 505 i s applicable to consultant contracts financed with foreign aid. I t establishes that Nicaraguan nationals are to be given preference over foreigners at the same leve l o f qualification. This law i s l i t t le known and scarcely implemented.
4.9 The Law mandating a leveling o f the salaries o f public sector doctors to the Central American average emerged f i om a six-month doctors’ strike in early 2006. I t establishes that al l public sector doctors and dentists must have their salaries raised to the Central American average level over five years. The fiscal cost o f implementing this law has been estimated at C$550 mi l l ion (about US$ 30 million) per year. Furthermore, i t s implementation would send a very negative message to the rest o f the public sector, which could also demand a similar treatment.
4.10 Finally, early in i t s government mandate, the Administration o f Daniel Ortega has passed a new law to cap the salaries o f the highest-ranking government officials. This law i s based o n a similar law that was passed in 2005, but later declared unconstitutional by the Supreme Court on the grounds that the law only applied to a subset o f Nicaraguan citizens rather than to everybody in Nicaragua.” Given that the appeal to the Supreme Court was brought by employees o f autonomous agencies, the new law limits its coverage to the central government and decentralized agencies. The law limits the salary o f the President o f the Republic to US$ 3,200 per month and establishes that no public sector employee covered by the Law can earn more than this limit. I t s implementation would represent savings o f around C$ 11 mi l l ion (about U S $ 600,000) per year to the Nicaraguan treasury. While in principle the measure i s desirable f rom the viewpoint o f reducing the dispersion o f wages (see section C), i t would have been advisable to include it as part o f more general legislation on public sector wage policies; which i s currently lacking.
B. Public Sector Employment
Size, Growth and Composition of Public Sector Employment
4.11 The public sector in Nicaragua i s not a particularly large employer. In 2005, the Nicaraguan public sector employed around 126,000 people, which represented less than 2.5 o f the total population, 5.7 percent o f the economically active population and 16.6 percent o f total formal sector employment; Figure 4.1. Central government employment, in turn, represents 1.9 percent o f the total population in Nicaragua, which i s below the L A C average o f 2.5 percent.
4.12 The current number o f public sector employees is about the same as it was in 1991, following the huge contraction o f the public sector that took place at that time; Figure 4.2. Since the early 2000’s, however, the number o f public sector employees has grown steadily by 2.4 percent per year, which i s faster than the general population growth o f 1.7 percent.
L
51. The approval o f this L a w (No. 505) was part o f the pol i t ical breakdown between the Executive and the Legislative in 2005. The National Assembly passed it, but the presidency refused to send it for publication, so its publication was ordered by the President o f the National Assembly, a legal but highly unusual procedure. I t s declaration o f unconstitutionality had probably more to do with the polit ical pact that broke the deadlock than the actual motivation stated in the Supreme Court sentence.
67

Figure 4.1 Nicaragua's Economically Active and Inactive Population
Population (5,142,098)
Economically Active Population (2,203,394)
Inactive Population
Formal (762,658)
Informal (1,318,242)
Public Sector (126,376)
Private Sector
Sub -Employed (661,790)
Unemployed (1 22,466)
Others
Source: INEC, 2005
TOTAL EUPLWOS PUBLICOS I
..I" 1.11
1988 1990 1992 1994 19% 1898 MW 2002 m4 MOB MOB I
Source: Nogales, 2006.
4.13 Public employment growth has been largest in the decentralized institutions (4.6 percent) and local governments (10.5 percent).52 This means that monitoring the decentralized institutions, especially universities, and local governments i s becoming increasingly important for understanding the fiscal pressures associated with public employment growth. It also focuses attention on the need to develop a centralized data base on the number o f employees and their remuneration. The rapid growth in employment at the local governnient level, moreover, draws attention to the process o f decentralization, and especially on the need to devolve expenditure responsibilities - including employment - from the center to local government, to avoid overlaps and an excessive fiscal burden.
4.14 O f the total number o f public sector employees in 2006, about 77 percent work in the central g~vernment.~~ O f that amount, 95 percent work in five sectors: education (which accounts for 44.4 percent), health (24 percent), defense (12.2 percent), police (1 1.3 percent) and L
52. I t has also been relatively large at public financial institutions, but this i s mostly due to h i r ing o f survey personnel at the Central Bank and these institutions have a relatively l o w weight in the total, so t h i s is less o f a concern. 53. These include the legislative, judicial and electoral powers, the Comptrollers Office, the Attorney General's Off ice and 12 ministries.
68

justice (3.3 percent); Statistical Annex Table B.I. These five institutions also comprise 87.5 percent o f the central government wage bill. This means that (i) by and large, the Nicaraguan government deploys its human and financial resources in core government services, rather than in activities that compete with the private sector, and that (ii) any concerns about fiscal pressure arising from the growth in the public sector wage bill wi l l need to pay special attention to the education and health sectors, which together account for more than two-thirds o f central government employment.
TOTAL PUBLIC SECTOR
C W R A L GOVWNMW
STATE FOWEFS
MWlSTRlES
Table 4.1 NICARAGUA: PUBLIC SECTOR EMPLOYEES
110,104 111,649 108,904 110,285 117,013 119,356 126,376 2.3%
91,158 91,749 88,114 88,177 93,584 93,622 96,854 1.0%
3,584 3,976 4,060 4,473 4,683 69%
84.530 83.815 89.153 88.838 91.821 2.1%
DECBCTRALQED INSTKUTIONS
olw UNNEFSITIES R83LIC FlNANClAL I N S T ~ l O N S
MUNICIPAL ANDLOCAL GOVWNMWS
9,409 9,853 10,148 10,619 11,116 12,103 12,294 4.6%
3,993 4,053 4,551 6.8% 859 979 986 1,021 970 988 1,468 9.3%
8,678 9,068 9,656 10,468 11,343 12,643 15,760 10.5%
Gender Equity
4.15 There are no official records o f gender decomposition o f public sector employment and the only survey information i s fairly outdated. A study commissioned by the Vice-presidency and the MHCP in 2003 covering 12 public sector institutions and covering 24,260 positions, found that two-thirds o f employees were women.54 This proportion varied according to the level o f the positions. Women accounted for 49 percent at the highest level (“sewicio directivo ”), 74 percent at the middle level (“sewicio ejecutivo”), and 64 percent at the lowest level (“sewicio opevativo”). Based on the 2001 household survey, the Economic Commission for Lat in America (ECLAC) calculates that 9.8 percent o f a l l male wage-earners in urban areas work in the public sector, which i s lower than the overall share o f urban wage-earners working in the public sector (1 1.9 percent). Conversely, the equivalent percentage for females i s 14.7 percent. This would point towards a bias in favor o f females in public sector employment.
Human Resources Management Policies
4.16 Policy attention to human resources management is weak and needs to be strengthened. The most important piece o f legislation on the subject - the Civ i l Service L a w - is very new and its implementation has been slow. Although the Law is applicable to the entire public sector (with few exceptions), and covers the large majority o f public sector employee^,^^ its main operational implication so far has been the incorporation o f employees into the administrative career. The Law i s potentially applicable to 45 public sector institutions, but those that have their L
54. Lopez Hislop, Javier , 2003. 55. Exempt f rom the L a w are employees o f publ ic enterprises, public universities, armed forces personnel and high authorities, which include: officials elected dlrectly o r indirectly, and officials legal ly named either by Congress’ rul ing directive, by the President, by the Supreme Court o r by the Supreme Electoral Council.
69
own career streams approved by law (interior, defense, foreign service and education) are exempt from the Law’s provisions regarding the administrative career. Potentially around 59,000 public sector employees,56 or about 47 percent o f the total 126,000 public sector employees are subject to incorporation into the administrative career. The process o f incorporation requires the description o f j ob positions in each public institution, including a categorization into one o f three groups (operational, executive, director), and the definition o f requisites to occupy each post. Once this process i s completed, each public employee occupying a position i s checked against the requisites and, if he/she fulfills them, i s “accredited” to occupy the p ~ s i t i o n . ~ ’ Newly hired employees must fulfill the requisites for each post. As o f end 2006, only 4,307 employees had been incorporated to the administrative career. The incorporation process has been l imited mostly to non-professional positions. This further weakens the possibility o f attaining the objectives o f the C iv i l Service Law, which i s to guarantee a core cadre o f public servants with adequate professional qualifications that i s competitively paid and remains stable across political transitions.
4.17 One reason for the slow implementation o f the Law has been the concerns about i t s fiscal cost. However, the implementation o f the C iv i l Service Law per se has no perceptible fiscal cost. A common misperception is to confuse the implementation o f the C iv i l Service Law with the application o f the Reference Salary Table (RST, see section C), which i s not even mentioned in the Law or its regulations. Because public sector employees are subject to the provisions o f the Labor Code and because the Code establishes that workers’ salaries cannot be reduced, the implementation o f the reference table only permits upwards adjustments. However, the fiscal cost o f applying the RST as i t currently stands has not been calculated, so the magnitude o f the potential fiscal impact is unknown. The second source o f concern is that many professional positions are occupied by consultants (see section E), whose remunerations are above the Reference Salary Table. The fiscal cost o f incorporating these consultants into the administrative career path and adjusting their salaries to the RST (as suggested by article 119 o f Law 476), has not been calculated either.
4.18 In spite o f these concerns, there is much room for implementing the basic principles o f the Civ i l Service Law more aggressively, but some amendments are also needed. To begin, the Law contains many desirable provisions that are not related to salaries and hence have no fiscal implications. This could be achieved by differentiating the duties and obligations o f belonging to an administrative career and those o f being a c iv i l servant. Currently the only distinction in the law between the two i s that c iv i l servants include temporary workers (less than 12 months), project personnel and “trusted” collaborators o f the current government. The Law makes no distinction between the guarantee to job stability afforded to c iv i l servants and to administrative career personnel.58 This i s a major drawback o f the Law, which needs to be modified in order to
L
56. This i s taken f r o m Statistical Annex Table B.l, by subtracting from the total number o f public sector employees, those that work in the four sectors that have their own administrative careers, except administrative employment in those sectors, and university employees. The actual number would be lower, since elected officials should also be subtracted, but this information is not available.. 57. There are 3 ways to be “accredited”: i) direct, when the person f u l f i l l s a l l requirements for the position, ii) by equivalency, when the person can compensate an inferior academic level with more years o f j o b experience, and iii) by labor experience, applicable only to operational and executive posts, and when the person compensates lack o f academic background with at least 10 years’ experience in similar posts. 58. According to article 37 o f the Law, the only difference in rights o f c i v i l servants and o f administrative career personnel is that the later are entitled to training opportunities and can participate in promotion processes.
70
provide appropriate motivations to public servants. Only those employees that have been accredited or recruited into a position according to Law 476 and i t s regulations, and hence fblfill the position’s requirements, should have guaranteed job stability and training opportunities. This could go a long way towards avoiding discretionary and politically-motivated human resource decisions, with no fiscal implication whatsoever.
4.19 There i s also a large loophole in the law, as Article 77 exempts those sectors that have their own career laws from the administrative career path. Since the procedures for competitive hiring following a definition o f duties and requirements for each post are applicable only to the administrative career, the most important results aimed for by the l aw -namely the professionalization o f public employment and the shielding o f c iv i l servants f rom the political process - are lost. In fact, an easy way to escape the discipline intended by the law i s to have a sector-specific career, as the health sector and the association o f municipalities are trying to do. While i t seems reasonable for each sector to have a different employment structure and corresponding salary scale adapted to sector-specific tasks, the provisions o f the C iv i l Service Law regarding the principles for hiring and promoting personnel should be applicable to al l public sector employees.
C. Public Sector Remuneration
Size and evolution ofpublic sector wage bill
4.20 According to the IMF Government Finance Statistics, total employment compensation during 2002-04 averaged around 30 percent o f total public expenditures in Nicaragua, which i s about the same as the L A C average o f 29.6 percent. This overall wage bill represents 6.1 percent o f GDP in Nicaragua, versus an average o f 6.6 percent in the rest o f LAC. 59 However, the accuracy and comparability o f these figures are questionable. One reason i s that the coverage o f the budget payroll is incomplete: o f the 126,000 persons working in the public sector in 2005, only 51,500 (or about 40 percent) are included in the budget payroll. The budget payroll excludes non-central government institutions (see paragraph 4.14), and also excludes about 9,091 members o f the armed forces, about 32,970 teachers working in autonomous schools, 8,000 policemen and the diplomatic corps. Employment compensation in decentralized institutions, local governments and public financial institutions i s captured within the budget l ine corresponding to “transfers.” IMF Staff have calculated that Nicaragua’s overall public sector wage bill could be as high as 7 percent o f GDP when al l these items are taken into consideration.60
4.21 The growth o f the wage and non-wage bill i s an issue o f concern for several reasons. As shown in Table 4.2, the wage bill has been increasing as a share o f GDP in recent years. This upward trend has been compounded by recent union activity pressuring for wage increases, especially in the two largest sectors - education and health. A strike by the health workers crippled the health system at the beginning o f 2006, resulting in an unbudgeted increase in medical staff salaries. Later in the year, the National Assembly passed an Education Law that -
L
59. The LAC average i s based o n a sample o f 17 countries, using figures f r o m the IMF, Government Finance Statistics on “compensation o f employees as % o f expense” as reported in the Wor ld Bank, WDI database, 2006. 60. IMF (2006), “Staff Report for the Eleventh Review Under the PRGF Program”.
71

until i t was amended - had threatened to raise total spending teacher salaries in an unsustainable manner. Early in 2007 a law on salaries o f public sector health professionals was approved, mandating that salaries o f these staff be equated to the Central American average within five years. The fiscal cost o f this law has been estimated by the Ministry o f Finance and Public Credit (MHCP) to be around U S $ 30 mi l l ion (C$ 550 million). Further, this law sets a precedent for similar demands from other sectors and poses a clear threat to fiscal stability. The largest source o f employment growth has been the decentralized institutions and local governments, which are applying hrther pressure on the budget and may be more difficult to bring under control.
Table 4.2: The Central Government Wage Bill 2002 2003 2004 2005 2006
WAGE BILL (C$ millions, current) 2,510 2,697 3,177 3,907 4,583 GDP (C$ mill ions, current) 57,376 61,959 71,661 82,162 94,318
Wage as '30 o f GDP 4.4% 4.4% 4.4% 4.8% 4.9%
Total EXPENDITURES 12,967 14,003 16,195 18,979 23,108 Wage as % o f total expenditures 19.4% 19.3% 19.6% 20.6% 19.8%
Source: Wage bill (Statistical Annex Tables based o n data from DGFP); GDP and Expenditures (IMF, 2006 Art icle IV Consultation report, based on data from M H C P and BCN)
Table 4.3 Salary Distribution in the Public Sector No. of workers Wage Bill Average Wage YO of workers YO of wage bill
(C$ per month) (C$ per month) 98,548 305,775,820 3,103 99.35% 88.19%
11.81% Total 346,697,953 100% 100%
695 40,942,133 58,910 0.065%
Source: Table 4.3 cited in Reine (2006).
4.22 There is a large disparity in the distribution o f the overall salary bill across employment categories. In 2003, a minuscule proportion o f central government employees (0.065 percent) captured 11.81 percent o f the total wage bill; Table 4.3.
4.23 Another source o f concern is the extensive reliance on non-wage compensation, which generates serious inequities and additional fiscal pressures. For example, the wage and non-wage bi l ls in the 2006 central government budget add up to a total o f C$ 6,052 million,61 or 6.4 percent o f GDP. In some cases, such as the health sector, the total remuneration bill can be up to 260 percent higher than the salary bill. These non-salary benefits are mostly the result o f political bargaining by labor unions, resulting in collective agreements that provide various types o f compensation, l ike bonuses, meals, eye glasses, more overtime, and larger trip allowances. While these non-wage benefits may reduce the dispersion o f total compensation within a public institution, they increase inequities between institutions and create perverse incentives both to individuals and to transparent human resources management.
4.24 The preceding findings allow us to conclude that, i) the rapid growth o f overall labor compensation i s a source o f fiscal concern, ii) there is a need to have a centralized data base o f public sector remuneration, including all forms o f compensation, in order to make informed
L
61. See Nogales (2006), p. 53.
72

policy decisions,62 iii) there i s a need to simplify the remuneration concepts to make pol icy decisions that are equitable for al l public sector employees, and iv) the principles o f equity and professionalization included in Law No. 476 point towards individualized salary increases based on merit and the avoidance o f across-the-board salary increases through collective union agreements.
Figure 4.3
AVERAGE INDIVIDUAL SALARY GROSS MONTHLY C$
Source: Nogales (2006)
Public sector salaries
Salary dispersion between public sel for institutions
4.25 Public sector salaries exhibit large disparities across public institutions; Figure 4.3. For example, in June 2006, the average salary in the four State Powers, plus the Comptroller's and Attorney General's Office, is C$ 12,088 per month, or almost four times larger than the average salary in the 12 line ministries, which is C$ 3,202 per month. Also, the average salary paid in the National Assembly i s 857 percent o f the average salary over al l ministries, in the Comptroller's Office i t i s 379 percent, and in the Supreme Court i t i s 313 percent. If we take the highest paid public institution (the National Assembly) in relation to the lowest (Ministry o f Defense), the relation o f average salaries was more than 10 to 1. A similar ratio i s found with
L
62. would need to be complemented with data o f public servants not covered by the Civi l Service Law.
The SISEC (Sistema de Infonnacion del Servicio Civil), created by article 32 could be a starting point, but it
73

respect to the average salary in the Ministry o f Education.63 O f course, these simple ratios can be misleading, since the proportion o f skilled to unskilled public officials differs from one institution to another, but they are s t i l l indicative o f wide disparities. The differences between ministries can also be quite large. For instance, in 2006, the average salary at the Ministry o f Industry and Commerce was 4.5 times larger than the average salary o f the Ministry o f Defense or o f the Ministry o f Education. As Nogales (2006) states, the incentive i s not to be trained, gain experience and be promoted, but rather to have the political connections necessary to be employed at a high-paying public institution.
Salary dispersion within public sector institutions
4.26 Salary dispersion within institutions can also be quite large. While the lack o f a centralized data base prevents the analysis o f a l l institutions from this dimension, we have information on two ministries - Finance and Education - shown in Figures 8.4 and 8.5 respectively. Figure 4.4 exposes several distortions in the MHCP. First, the relative difference between the lowest and the highest salary within categories varies widely from one category to the next. For instance, in category 13, the maximum salary is 7.5 larger than the lowest, while in category 16 the difference i s only 1.6 times. Second, the average salary barely changes in the first nine categories, while it follows an exponential trend in the last eight categories. Third, the average salary in a lower category can be higher than the average salary in a higher category, e.g. the average salary in category 13 i s higher than in categories 14 and 15 and equal to the average salary in category 16. In general, there is no reasonable pattern either in the minimum-maximum ranges within categories, nor in the minimum, maximum and average salaries between categories.
4.27 In the Education Ministry the distortions are similar: little variation in average salaries up to category ten and exponential growth thereafter, wide differences between minimum and maximum salaries across categories, and average salaries higher for lower categories. These distortions are o f great concern in this ministry, given that i t employs over 44 percent o f al l central government employees.
4.28 A final issue to be considered in assessing individual salaries is the number o f hours worked. Until recently, the normal work schedule in the public sector was from 7 am to 2 pm. In some cases, such as the education sector, employees may work only four hours a day.64 Hence, the above levels o f remuneration may be considerably larger if assessed on a per-hour basis. For this reason, i t is recommended that the data base o f public sector employment and remuneration include this information.
L
63. The comparison with education i s probably more relevant, since the mil i tary and the police receive in-kind remuneration in the form o f food, uniforms and housing. 64. During the 2006 health strike the press reported that most public sector doctors complemented their regular salaries with private practice for a fee and that often these private consultations took place in government premises and used public sector assets.
74

F i g u r e 4.4
MINISTER10 HACIENDAY CREDITOPUBLICO -- JUNIO 2006: TSRY RANGOS SALARlALES (C5)
~ 50,000
1 45,000
' 40,000 ' 35,000
30,000 I 1 25,000
20,000
15,000
10,000
5,000
17 16 15 14 13 12 11 I O 9 8 7 6 5 4 3 2 0
Source; Nogales (2006)
F i g u r e 4.5
MECD: NUMERO DE FUNCIONARIOS Y MASA SALARIAL BRUTA (C$/MES) # FUNCIONARIOS SALARIO BRUT0 C I I M E S
6,000
5,500
5,000
4,500
4,000
3,500
3,000
2,500
2,000
1,500
1,000
500
0 I ~
22 21 20 19 18 17 16 15 14 13 12 11 10 9 8 7 6 5 4 3 2 1 i
75

The Reference Salary Table
4.29 In 2005, the Government adopted a Reference Salary Table (RST) with the objective o f imposing greater discipline and order in the structure o f public sector salaries.65 It i s the implementation o f this table that has fiscal implications and not, as is often claimed, the implementation o f the Civ i l Service Law. In fact, the C iv i l Service Law has only a few articles referring to public sector remuneration,66 and the regulations to the law do not add significant guidance.
4.30 The implementation o f the RST i s desirable because i t would impose discipline and apply the principles for public sector remuneration adopted in Law 476. But i t s legal grounding i s weak, which has led most public sector institutions to resist its implementation. Moreover, because o f i t s fragile legal underpinnings, the universe o f institutions that are potentially subject to the RST remains unclear.
AVERAGE 2002 AVERAGE 2003 AVERAGE 2004 AVERAGE 2005
Comparisons with the private sector
2,775.6 3,150.7 211.3 4.1% 3.7% 88.1%) 3,079.6 3,320.1 222.5 5.4% 0.1% 92.8%) 3,344.5 3,481.0 241.3 0.1% -3.3% 96.1 %) 3,857.6 3,735.0 264.5 5.2% -2.1% 1 03.3%)
4.31 The application o f the principle o f competitiveness adopted by L a w 476 requires information on private sector remuneration for positions similar to those in the private sector. Yet, the public authorities responsible for determining public sector remuneration do not collect this information systematically. Table 4.4 shows average salaries for the period 2001-2005. This data, taken from INSS, show that average salaries in the public sector have recently surpassed those in the private sector, showing higher rates o f increase.
Table 4.4 Public versus Private Sector Pav
4.32 These data must be used with caution, however, given the incentives o f the private sector to understate the wages reported to the INSS. Nevertheless, other sources o f data reveal a similar pattern. PriceWaterhouseCoopers, which conducts an annual salary survey in the private sector, found the simple average salary in the private sector in 2005 to be C$ 3,584 per monthY6’ while data published by the Central Bank o f Nicaragua reveal that the average public sector salary in August 2005 was C$ 3,776.68 These data show orders o f magnitude similar to those in Table 4.4 and also point to a lower average salary in the private sector. Other sources o f data69 show L
65. See Table 4.19. 66. Art icle 30, which indicates that remuneration should be based on principles o f equality, equity and competitiveness; Articles 100 to 103 on the types o f remuneration; and Articles 117 and 118 011 considerations regarding the implementation o f remuneration pol icy 67. Price WatherhouseCoopers, 2006. 68. 69.
Banco Central de Nicaragua, 2005 By contrast, IMF (2006), paragraph 10 cites much larger public sector wage levels.
76

significantly different orders o f magnitudes for average public sector wages, indicating st i l l larger public-private wage differentials. In any case, average wage comparisons must take into account the education and ski l ls required for different positions. It can be argued that the private sector occupies a significantly larger proportion o f l o w skill workers. All this points to the need to undertake a rigorous data collection effort, identifying clearly the number o f hours worked, skill requirements and specification o f the remuneration concepts included in each indicator (base salary, 13th month, compensation in kind, and the like). The RST needs to be adjusted, taking into account this information, as well as the overall fiscal envelope.
Gender equity
4.33 As in the case o f employment levels, there are no official records o f gender decomposition o f average remuneration. But some information regarding average income o f the economically active population, by gender, can shed some light. Based o n the 2001 household survey, the Economic Commission for Latin America (ECLAC) calculates that the mean income o f public sector workers in urban areas was 4.5 times the per capita poverty line. For male public
the per capita poverty line, while for females it urban workers the mean income Was 5.8 times Table 4.5 Average Annual Remuneration, by
was 3.3 times the per capital poverty line. Assuming that the main source of income for wage-earners is wage earnings, this would
Directive 61,230 point towards a bias in favor o f males in public sector remuneration. This conclusion i s also supported by the study by Lopez (2003) on twelve public sector institutions, which finds that the average remuneration for males i s higher than for females at al l levels, with the differences becoming up to 30 percent higher in favor o f males at the highest levels (Table 4.5).
Source: Lopez (2003).
Need for Public Sector Remuneration Framework Legislation
4.34 The above findings point to a clear need for adopting an official pol icy on remuneration in the public sector, grounded in a national law, and implementing its enforcement mechanisms. Such legislation i s best based on the concepts already approved in the C i v i l Service Law, and expanded with provisions pertaining to (i) institutional coverage o f the policy, which should be as wide as possible, (ii) rules for ini t ial pay upon hire and pay increases, with the later based solely on merit, (iii) limits on the dispersion o f wages between and within public sector institutions, (iv) non-salary remuneration, which should be kept to a minimum, (v) consultants' remuneration (see section D), and (vi) reporting obligations.
Remuneration in the Education Sector
4.35 The education sector is the largest employer in the public sector. I t comprised about 43,000 employees in mid-2006 (about 44 percent o f total central government employment) and accounted for 32 percent o f the central government wage bill. Tables 4.6, 4.7, and 4.8, show the average monthly wages by type o f education employees and school modality. Several conclusions can be drawn from these tables:
77

The average wage for primary teachers i s about the same in autonomous and centralized schools, but much lower in decentralized municipalities The average wage for secondary school teachers i s highest in centralized schools and lowest in decentralized municipalities Among teaching positions, teachers’ training attracts the highest salary The average growth rate o f average salaries has been highest in autonomous schools (22 percent), followed by centralized schools (1 3 percent) and decentralized municipalities (9 percent)
Table 4.6. Monthly Salaries in Education, b y level and school modality (C$ per month)
Table 4.7
Table 4.8
Special Education
78

4.36 Simple comparisons o f monthly salaries for teachers and non-teachers can be very misleading, among other because teachers tend to work fewer hours than non-teachers (and so often have more than one job) and generally have longer vacations. A recent study by CEPAL7’ indicates that, on average, Nicaraguan teachers earn about the same monthly salary (expressed in purchasing power parity terms) as their L A C counterparts; Table 4.9. 71 Since Nicaragua i s a substantially poorer country than the average Lat in American country, however, Nicaraguan teacher monthly salaries are substantially higher in terms o f per capita GDP than the Lat in and Central American regional averages. (That is, the average annual teacher salary in Nicaragua i s equivalent to 324 percent o f per capita GDP, compared to regional averages o f 240 and 255 percent.) By this criterion, Nicaraguan teachers appear to be paid quite well.
Table 4.9: Monthly Teacher Salaries in Central America I I I
I
!Monthly Average 2005 per i i Teacher monthly salary as % o f the average monthly! / Teacher Salary capitaGDP I salary of: I I
I i salary as % o fpe r i I i All Workers
I Technicians Professionals i I i capita^^^* I Professionals & Salaried 1 I 2000 US$ PPP
Costa Rica i 1,268 8697 i 175% i 147% 87% 85% i ElSalvador i 885 4629 i 229% I 182% 93% 92% Guatemala i 752 4034 224% i 137% 73% 80% i Honduras i 936 2998 i 375% j 270% 82% 81% i Nk.?E€E _________ i _ _ _ _ _ _ _ _ _ _ _ _ _ _ _ _ _ _ _ _ _ _ ------------.I------- _____________ 1 ________________________________________--------------- Central America i 941 4,713 240% 1 174% 81% 86% 1 LatinAmerica i 858 4,044 255% 1 126% 64% 74% i Source: A. Morduchowicz & L. Duro (2007), CEPAL @age 21) and World Bank, World Development Indicators. Notes: The wage figures for Costa Rica refer to 2005, for El Salvador and Guatemala to 2004, for Honduras to 2003, and for Nicaragua to 2001. Average annual wages are calculated as the average monthly wage times 12 and do not take into account non-wage remuneration.
93% I
865 3208 I 324% I 133% 71% Regional !verages I
4.37 Nicaraguan teachers also tend to work substantially longer hours than teachers in most other L A C countries, however, which partly explains their comparatively high salaries; Table 4.10. Whereas the average teacher in Latin America works only 32.3 hours per week, Nicaraguan teachers average 41 hours o f work. This translates into a correspondingly lower hourly wage rate, with Nicaraguan teachers earning an hourly wage o f 4.9 Dollars (in constant 2000 PPP terms), while the other teachers in the region average over 6 Dollars. By this criterion, Nicaraguan workers appear to be paid relatively poorly. However, this comparison i s also misleading because it does not take into account differences in productivity and ski l l levels. To the extent that cross-country differences in per-capita GDP reflect differences in labor productivity, the shortfall in Nicaraguan teacher wages ($4.9 vs. $6.2) i s approximately equal to the shortfall in per capita GDP ($3,208 vs $4,044). That is, after adjusting for differences in national productivity levels, Nicaragua’s teachers appear to be paid a comparable wage rate to what other teachers in the region receive.72
L
70. Morduchowitz, Alejandro and Luisa Duro (2007), “La inversion educativa en America Latina y e l Caribe: Demandas de financiamiento y asignacion de recursos (Buenos Aires, CEPAL), 71. See also Hermani-Limarino, Werner, (2006), “Are Teachers W e l l Paid La t i n America and the Caribbean?: Relative Wage Structure o f Returns o f Teachers”, in Emiliana Vegas, ed. (2006), Incentives to I m r o v e Teaching, (Washington, D.C; Wor ld Bank), Figures 3.1 and 3.2. 72. Public sector teachers and health workers in Nicaragua l ike to compare their salaries with those p a i d in Honduras. Indeed, the average monthly salary o f school teachers in Honduras i s significantly higher. Th is i s no t an
79

4.38 Arguably, a more appropriate way o f assessing the adequacy o f teacher remuneration is through intra-country comparisons with other workers and professions. Table 4.9 indicates that the average Nicaraguan teacher salary i s 33 percent higher than the average salary received by al l workers in Nicaragua, but only represents 71 percent o f the average salary received by private sector professionals and technical staff and 93 percent o f the average remuneration o f salaried professionals in the private sector. I t turns out, however, that teachers in Nicaragua (as almost everywhere else in LAC) tend to put in less time than the overall average hours worked in the private sector (41.0 hours per week vs. 48.8 hours), but marginally more hours than other salaried professionals in the private sector; Table 4.10. On an hourly basis, Nicaraguan teachers earn proportionately more than all private sector workers (59 percent more according to Table 4.10), but they earn 26 percent less than other professionals and technicians, and 10 percent less when compared to al l other salaried professionals in Nicaragua.73
Table 4.10. Hourly Wage Rates in Central America i Teacher wage rate as % o f the average wage]
Salaried j
I rate of: I
1 Average Hours worked 1 Monthly hours 1 Average hourly j per month* j I I I workedby j teacherwage j
I Teachers I all non-Teachers I j PPP) I Technicians Professionals CostaRica 1 40.3 46.5 I 87% j 7.3 1 170% 104% 95% i El Salvador i 32.7 45.1 I 73% j 6.3 : 251% 120% 109% j Guatemala j 31.3 46.2 j 68% j 5.6 I 202% 101% 94% j
CentralAmerica i 36.0 47.2 I 76% I 6.1 I 228% 101% 98% ;
I all non- I Teachers versus 1 rate (2000 US$IAll Workers Professionals & Teachers
I I t
Honduras : 34.5 49.2 I 70% I 6.3 I 385% 110% 106% I I I I :
Latin America i 32.3 44.7 i 72% j 6.2 i 174% 86% 96% ! Source: A. Morduchowicz & L. Duro (2007), CEPAL @age 21-23) and World Bank, World Development Indicators. Notes: the average hours worked per month does not take into account differences in vacation time, which tends to be longer for teachers.
Nicaragua i 41.0 48.8 i 84% i 4.9 j 159% 74% 90% : Regional Averages
4.39 The differences in average wage rates paid to Nicaraguan teachers vis-a-vis professionals in the private sector are conceivably due to differences in productive endowments or o f other socio-economic factors. Such differences are taken into account in the study by Hernani- Limarino (2006), who estimates conditional wage differentials by regressing hourly pay on productive endowments (education, years o f experience), socioeconomic factors (sex, age, place o f residence) and a teacher’s dummy. The study concludes that after these differences are taken into account, teachers in most o f the countries in the region receive higher wage rates than non- teachers. Nicaragua is an exception, with teachers receiving a lower average wage than non- teachers. The magnitude o f this conditional wage difference, however, i s very sensitive to the
appropriate comparison, considering that Honduras represents a statistical outlier, with one o f the highest average hourly teacher wage rates in LAC - and the absolute highest when expressed as a share o f per capita GDP. 73. These result are broadly consistent with the findings o f Hennani-Limarino (2006, Table 3.5), who reported that the hourly earnings o f Nicaraguan teachers are, o n average, 44 percent higher than those o f a l l other workers, but 66 percent lower than those o f workers who have at least a secondary education and 68 percent lower than those o f workers in office, technical o r professional occupations, regardless o f educational level.
80

choice o f the comparison Finally, these results may also be biased by the presence o f unobserved h e t e r ~ g e n e i t y . ~ ~
4.40 In any case, the preceding findings as they pertain to Nicaragua are based on the wage structure that prevailed in 2001. Between 2001 and 2006, the average wage o f teachers has been growing by an average o f 13.3 percent per annum, while the average national wage has only been growing by 10.7 percent. This difference in wage growth rates has reduced the average wage differential by around 12 percent below what i t may have been five years ago.
4.41 So, are Nicaragua’s teachers being adequately paid? Much rests o n the answer to this question, considering that the quality of education is strongly influenced by the quality o f teachers, and the quality of teachers, in turn, i s largely determined by the persons attracted to and retained in the teaching profession, and the performance incentives that they face. As indicated by Hermani-Limarino (2006), relative wage rates play an important role in teacher recruitment, performance and retention. The preceding review suggests that Nicaraguan teachers m a y be receiving an average wage rate that i s somewhat less than that received by similarly qualified private sector employees. This observation in itself does not suffice to make a compelling case for raising teacher remuneration levels. I t does, however, suggest the need to maintain an open mind toward possible wage adjustments if warranted by overall labor market condition^.^^ In the event that such adjustments are warranted, i t i s important to consider teachers’ remuneration as a whole, and look beyond the wage alone. The reluctance to contemplate wage adjustments has frequently led to strikes that are eventually resolved through adjustments in non-wage benefits. Such non-wage benefits have an equally negative fiscal impact, but are not conducive to increased efficiency because they do not reward individual effort.77
Employment Remuneration Wage Bill
2002 2003 2004 2005 2006 2007 826,393,475 899,318,126 937,226,977 1,243,456,865 1,411,673,011 1,703,700,000 612,736,254 667,744,987 708,552,884 971,148,074 1,151,626,713
Growth Remuneration
Remuneration in the Health Sector
I 9%1 4%1 33%1 14%1 21%
4.42 In 2006, the health ministry employed 23,241 people, or 24 percent o f total central government employment, making it the second largest public sector employer after education. The social security institute, INSS, employed an additional 1,214 people. More than two-thirds o f the sector’s employees are female. In 2006 the wage bill o f the sector amounted to C$ 1,152 mi l l ion (US$ 65 million) or 25.3 percent o f the total wage bil l o f the central government, while total sector employment remuneration was C$ 1,412 mi l l ion (US$ 82 million) in 2006. L
74. Hemani-Limarino (2006, table 3.6) 75. That i s t o say that teachers may not b e a random simple o f workers whose decisions to teach are ma in l y based o n wage differentials. If teachers constitute a special group that i s attracted to the profession by non-monetary rewards, the labor market would be effectively segmented in to two markets (one for teachers and the other for non- teachers), which do not necessarily clear at the same wage rate. 76. Some important indicators o f overall labor market conditions that are most relevant in this context are the sk i l l set o f individuals applying for teaching positions and the rates o f labor turnover among teaching staff. 77. According to Nogales (2006) the 2006 teachers’ strike has cost C$41 mi l l i on in bonuses.
Growth Wage Bill
81
9%1 6%1 37%1 19%1

4.43 Wage and total compensation have grown considerably in the past two years (Table 4.1 l), with the health sector wage bill almost doubling since 2002. However, the share o f the gross wage bill assigned to health services i s only 63 percent, with the remainder going to various types o f managerial, administrative and service jobs (Table 4.12).
4.44 The salary structure o f the Health Ministry (MINSA) does not exhibit a clear, rational pattern; Table 4.20:
Table 4.12 Hea l th Sector: Share o f Gross W a g e Bill, by Type o f Service
Health Services 63% Management 15% Administration 3% Technical 6% General Services 12% Production 1% Training 0%
0
0
0
0
Of the 22 salary levels in the MINSA, the structure o f the f i rs t 14 levels i s basically flat. Subsequently, the salary dispersion becomes very large: the basic salary in the highest level (level 22) i s 43 times higher than the basic salary in level 1. Within the 22 salary levels there are 12 sub-classifications, and these sub-classifications within a salary level imply a higher salary than the basic salary o f several levels above. This salary table i s not very meaningful because the gross salary is composed o f fixed and variable salaries (with variable salaries comprising 45 percent o f the total wage bill in 2006). Only 187 employees out o f the total 2 1,365 did not earn a variable salary.
Source: Nogales (2006)
4.45 Within the expenditures for health service professionals there i s also a lot o f variation, reflecting the high variety o f skills required in health services. Table 4.13 shows the evolution o f average salaries for doctors and nurses o f different specializations. I t indicates that sector salaries have grown by an even larger margin than either the wage bill or total compensation at the overall ministerial level.
82

4.46 Table 4.14 shows that Nicaraguan doctors working in the public sector indeed earn less in absolute terms than their Central American counterparts. As noted earlier, however, this i s not an appropriate comparison, given that the overall income and productivity levels across these countries are very different.
Central American countries, except Honduras, whose indicator is well outside the regional norm (Table 4.15). In other words, there i s no economic or social justification for seeking to mandate the equalization o f sector salaries to the regional averages.
4.48 There i s a large variation in doctors and nurses
Table 4.14 Average doctors’ salaries in Central America (US$ per month)
General Doctor 408 969 1,203 740 472 1,025 Nicaragua El Salvador Honduras Costa Rica Guatemala Panamh
Table 4.15: Physician,s Base Salaries Relative to
per Ca2ita GDP Nicaragua 489% EI Salvador 477% Guatemala 455% Honduras 1,638%
Source: World Bank (2007), “Key Issues.”, Figure 1.44
Specialist 584 1,211 1,404 762 828 1,338 Resident 24 1 969 338 740 789 1,025
Source: Morales et. al. (2006) f rom data f rom ECLAC and WHO.
Figure 4.6 Base Salaries o f Health Care Providers Relative to Physicians’ Salary
100%
90% 80% 70%
60%
50% 40%
30% 20%
10%
0 % Physic ians Nurses Technic ians A u x i l i a r i e s
1 OEl Salvador U G u a t e m a i a H H o n d u r a r D N i c a r a g u a I
Source: W o r l d Bank (2007), K e y Issues in Central America Health Reforms.
4.49 Aside from levels and differences in base salaries, in the health sector i t i s particularly important to look at (i) variable wages and (ii) non-wage benefits. The issue o f variable salaries in the sector deserves careful analysis and revision. Variable salaries include bonuses for abnormal working conditions, salary complements, double turns, night shifts, recognition for years o f experience or academic record, and others. Some o f these items (like wage premiums for years o f experience or academic record) can be reflected in the basic salary structure, together with the criteria for receiving the premiums. The more important problem i s the large number o f
83

employees that are eligible for these benefits. I t i s unclear, for example, why 16,670 employees (or 71 percent o f the total) are reportedly working under abnormal conditions, what justifies giving salary supplements to 5,079 employees, and why 5,560 employees are doing double shifts.
4.50 Health employees also receive non-wage compensation from collective agreements. The latest such agreement was signed in 2006, following the health employees strike. The fiscal cost o f implementing it in 2007 has been estimated at C$ 150 million.’* Almost 40 percent o f that cost is related to clothing, footwear and protective equipment (which does not really qualify as employment compensation). A small percentage i s assigned to scholarships for employees’ children, and 60 percent i s merely “other benefits” whose composition is not known. Moreover, the procedures for assigning those benefits to individual workers are also not known.
4.51 Regarding comparability with wages in the private sector, there i s virtually no information. The only available data comes from the PriceWaterhouseCooper’s survey o f private sector pay, which includes only two health positions (“health project supervisor” and “health promoter”). I t finds that the total remuneration levels for these positions in 2006 were C$ 36,000 (US$ 2,081) and C$ 28,133 (US$ 1,596) per month, respectively. These figures are not comparable with those in Tables 4.13 and 4.14, because they include overall compensation and not just wages. As in the case o f education, the DGFP needs to conduct an in-depth survey o f salary levels in the Nicaraguan private health care market, without which the principle o f competitiveness approved in Law 476 would carry little weight.
4.52 Unlike the education sector, there is no data on the number o f hours worked that would permit ascertaining the hourly wage rate. Nogales (2006) indicates that specialized doctors work an average o f four hours a day. Numerous press reports during the last health strike have pointed out that public sector doctors generally work less than full time, and that they also attend private clients during that time - for private gain - using the assets o f the public sector. This i s an issue that needs further research and appropriate regulation.
4.53 There is some information linking overall public health expenditures to efficiency,” but l i t t le that l i n k s remuneration in the Nicaraguan public health system with efficiency. Previous analyses, however, have drawn two conclusions that are nevertheless important for human resources management in the sector: (i) the need to assign more human resources to preventive care vis-a-vis curative care and (ii) the need to assign human resources geographically according to need and risk areas; see para. 3.47.
Consultants
4.54 Number and Cost of Consultants. The use o f individual consultants in the Nicaraguan public sector is extensive, mirroring the country’s dependence on foreign aid. While many o f these consultants are assigned tasks o f a temporary nature that require a specialized expertise proper o f consultants, many others perform tasks o f a more permanent nature that should normally be assigned to c iv i l servants. Many consultants are financed through external grans and credits, and their earnings undermine any attempts to impose discipline and provide adequate incentives to public sector employees.
L
78. 79.
See Morales et. al. (2006), table 17. See World Bank (2007, section 2.D) and Chapter 111.
84

4.55 Since there is no centralized registry and the budget does not provide precise information, the exact number o f consultants i s unknown. An estimate by the DGFP calculated the total number o f consultants financed by six international agencies (up to M a y 2005) to be 77 1, with a yearly expenditure o f about US$15 mi l l ion (Table 4.1 6).80
R l A Y C E
SPANISH COOPERATION WORLD BANK CABEI I DB EUROPEAN UNION OTHER
Table 4.16 I
YO. COhS. % SALARYIMOYTH ‘/o m MAX AVERAGE
21 3 % 10,573 1 Yo 95.81 6,131,33 503 48 498 6 5 % 883,628 71% 101,56 10,000,OO 1,774 35
14 2 Yo 10,830 1% 200,oo 1,500,oo 773.56 I54 20% 228,653 18% 150,OO 6,000,OO 1,484 76 20 3 Yo 33,977 3% 74.85 4,839,26 1.698 84 64 8 Yo 72,720 6 % 10000 4,251.50 1,136 24
Contracted Personnel for Advisory / Consultations Studies, research and factibility of the projects Technical advisory and refunds for studies
4.56 Taking information from the Budget, which includes both domestic and foreign sources o f financing, Nogales (2006) calculates that about 30 mi l l ion dollars i s spent o n consultants. However, this calculation includes temporaries, which are not the main source o f public pay distortions. A similar calculation, based on individual consultants included in the public investment program (Table 4.17), shows that about US$ 28 mi l l ion were spent o n consultants in 2006,81 but this Figure 4.does not discriminate between short and long term consultants.
Table 4.17 BUDGETARY LINES UTILIZED IN THE CONTRACTING OF CONSULTANTS IUS$)
8,123,402 16,197,555 28,189,628 1,909,503 10,337,765 17,782,175
14,885,085 11,971,639 19,308,837
4.57 Based on the above, i t is roughly estimated that the Nicaraguan government spends between US$ 20 and 30 mi l l ion annually on individual consultants that perform permanent jobs. This represents 10 percent o f the public sector wage bill. Based on the average salaries paid by the six donors included in Table 4.16, the total number o f consultants working in the Nicaraguan public sector i s between 1,350 and 2,000.
Remuneration
4.58 Consultants’ salaries are generally larger than the average public sector salary, and roughly similar to the remuneration o f high-level government employees. They also exhibit wide dispersion. Using budget figures, Nogales (2006) compared average consultants’ remuneration to
L
80. This i s roughly o f the same order o f magnitude as calculations done by the W o r l d Bank in the context o f the 2004 CPPR, which found that around 10 mi l l i on dollars were spent annually in Bank-financed individual consultants. 8 1. But this figure could be considerably higher if one assumes that the code lines “Studies research and feasibility projects” (PIP code 241) or “Studies and Technical assistance” (PIP code 243) also include some individual consultants performing permanent jobs.
85

average public sector wages, and found the former to be about six times larger. Considering that consultants’ generally possess higher qualifications than the average public sector employee and are more comparable to top government officials, their average remuneration does not seem exaggerated (although they may be in some isolated cases).
4.59 To introduce greater discipline in the employment and remuneration o f consultants, the MHCP issued two directives, in 2005 and early 2006.82 The f i rs t o f these introduced a remuneration table to be applied to al l consultants performing “line positions” (Table 4.1 8). The second clarified some o f the concepts that remained vague in the first.
several directions. First, some concepts included in these directives must be
4.60
FEES co,wuxll+ ~ ~ ~ O ~ ~ l ~ A r l o ~ S DllhIYUMj M kX1HUAf
This effort needs to be pursued in
clarified; notably what i s a ‘ ‘ h e DIRECTI\ES
Table 4.18 I REFERENCE TABLE WAGE CONSULTANT WAGES I
m c r m 3,600 ,,@CII
position.” This i s easily resolved by resorting to concepts already included in the C iv i l Service Law. Second, the requirement to inform the DGFP about al l consultants’ contracts and contract extensions needs to be enforced
PRINCIPAL TECHNICAL ADVISER 2,800 4,250 COORDINATOR A 2,350 3,600
1,900 2,950 COORDINATOR B
EXECUTIVES OFFICIALA 1,450 2,300 OFFICIAL B 1,100 1,750 ANALYST 750 1,200
400 650 SUPPORT B 350 450
OPERATIVES SUPPORTA
D. Main Findings and Policy Options
4.61 There is no complete, comprehensive and up-to-date data base on public sector employment and remuneration levels. Furthermore, the budget payroll does not accurately reflect the fiscal risks associated with employment remuneration, because o f (i) the large amount o f non-wage employment compensation, linked mostly to collective agreements, (ii) employment compensation in public institutions inside and outside the central government that i s not included in the budget payroll (but i s embedded instead in budget lines related to transfers), and (iii) employment compensation in public institutions registered in the capital budget. These shortcomings render it extremely difficult to monitor adequately the evolution o f public employment and remuneration, as needed for maintaining fiscal control.
4.62 The size o f public sector employment as a proportion o f Nicaragua’s total population is somewhat below the average observed in other countries in Latin America and the Caribbean. One concern, however, pertains to the growth o f the public sector wage bill in recent years, which i s attributable, both, to increases in employment and in public wages. Most o f the public L
82. Memorandum MHCP-DM-E-23 196a-11-05 o f November 29, 2005 and MHCP-DM-1-23 196b-02-06 o f February 10,2006.
86

employment growth has come from decentralized institutions (particularly universities) and local governments. At the same time, public sector salaries have been growing faster than private sector salaries, posing r isks to fiscal sustainability.
4.63 The two largest public sector employers - the education and health sectors - raise the most concerns from a fiscal viewpoint. Salaries in both sectors have increased rapidly in the past few years, exceeding the average growth o f salaries at the national level. Whi le some o f the indicators discussed earlier (paras. 4.36-4.41) suggest that the wage rates paid in the education sector may be on the l ow side, others suggest that teachers are paid quite wel l under prevailing market conditions and considering their average ski l l levels. Moreover, i t appears that the average s k i l l level o f the current teacher corps in Nicaragua is very low, especially since so many of them are untrained (“empiricos”).83 Under these circumstances, the fundamental challenge for human resource management in the sector is not to identify the appropriate (or market) wage for the current, relatively untrained set o f teachers (except in a short-run context, when new wage contracts are being negotiated with the teachers union), but rather to identify the wage rate that would be required to attract and retain a set o f teachers with the desired teaching skills. I t i s probably safe to say that the wages currently paid to teachers in Nicaragua are far below the level that would be required to attract the type o f teachers that the country needs in order to provide an education o f significantly higher quality. The challenge facing the Nicaraguan authorities, then, i s getting from the current status quo o f low-paid and low-skilled teachers to the desired position o f better-paid, higher-skilled teachers.
4.64 Meeting this challenge wil l require implementing a carefully designed human resource strategy for the sector that encompasses, among other, a new wage policy, a better teacher training system and curriculum reforms. Even though the current wage rates paid in the sector may be inadequate from the viewpoint o f providing proper staff recruitment, performance and retention incentives, however, adjustments must be considered carefully within a medium term cost and financing framework for the education sector, while being mindful o f the overall government budget constraint. In particular, i t would not be fiscally prudent to apply a wage pol icy based on the wages paid in other countries with vastly different per capita income and labor productivity levels, and operating under different labor market conditions.
4.65 Average salaries in central government institutions are extremely dispersed both between and within institutions. This also applies to consultants’ salaries, which account for around 10 percent o f the total public sector wage bill. Their average salaries are high compared to the overall average public sector salary, but similar to those paid in the higher echelons o f public employment. In both cases, the structure o f salaries often does not exhibit a rational pattern, either in terms o f merit, skills endowment or proper work incentives.
4.66 The recent evolution and structure o f public wages in large part reflect the absence o f adequate public wage framework legislation. Furthermore, recent efforts to regulate consultant salaries have been undermined by lack o f enforcement. A s a consequence, public sector remuneration levels follow ad-hoc decision-making, are not transparent, and result in inequities that ultimately hamper the process o f c iv i l service professionalization.
L
83 See World Bank, 2007, Poverty Assessment, paragraph 2.37. In 2005, the proportion o f Nicaraguan teachers considered untrained (“empiricos”) was 24 percent at the primary level and around 50 percent at the secondary level. Th is proportions were found to be higher than in other developing countries, even after accounting for differences in per capita income levels.
87

4.67 In order to ensure an orderly, transparent and efficient determination o f wages in the public sector, adequate framework legislation i s urgently needed. A good framework legislation i s characterized by the following key elements: 0 Broad coverage - the framework legislation covers al l public sector agencies; the same as the
C iv i l Service Law. 0 Transparency - the level o f remuneration i s built around a base salary, where bonuses are
only applied in exceptional circumstances and in-kind compensation is eliminated. Merit-based pay - the remuneration policy rewards good individual and team performance, subject to the prevailing fiscal constraints.
0 Non-discrimination - the pay pol icy does not discriminate across gender, ethnic or religious lines.
0 Market-responsiveness - the structure o f salaries reflects the relative market demand and supply for the different skills required in the public sector labor force, thereby ensuring that the public sector i s neither over-paying its employees, nor allowing the quality o f its work- force to deteriorate. The adequacy o f the pay structure can be gauged by the frequency o f labor turnover and quality o f applicants for different positions, as wel l as by carrying out periodic market surveys. In contrast, basing the pay structure on the wage rates paid in other countries (as was recently done for health sector employees), or indexing i t to particular commodities (such as the canasta bcisica), would not be consistent with the principle o f market responsiveness. The implementation o f framework legislation containing these principles is best achieved with the introduction o f a uniform Reference Salary Table throughout the entire public sector. The pace o f introduction may need to be gradual, however, depending on fiscal limitations. Also, the RST would need to be periodically revised and adapted to changing labor market conditions and relative scarcities o f different skil ls.
4.68 several prior actions by the DGFP:
An efficient implementation o f the propose framework legislation also will depend on
Creation o f a centralized data base on public employment and remuneration, covering the entire public sector. Article 8 o f the Civ i l Service Law provides a sufficient legal basis for requiring all public sector agencies to submit such information to the Ministry o f Finance. By enforcing this article, the Ministry o f Finance should be able to compile a reasonably comprehensive data base within a period o f six months. After collecting the data on individual salaries throughout the public sector (including consultants) and on the pay structure for comparable positions in the private sectors, i t is necessary to estimate the fiscal impact o f alternative salary structures, to ensure that the implementation o f a particular RST does not lead to fiscal distress and, therefore becomes inoperable. With particular reference to consultants, i t i s important to enforce directives on information sharing o f consultant’s contracts, amending and complementing the directives, as needed, to clarify coverage and concepts, raise its legal status and implement enforcement mechanisms. In this context, i t is crucial to calculate the fiscal implications o f applying the law o f acquired r ights to all consultants that are currently occupying permanent positions. It may be necessary to revise the legal and regulatory framework governing wages to permit the application o f the RST to consultants in a fiscally viable manner.
88

4.69 With particular regard to the education sector, there i s a need to undertake a teacher census to determine with greater precision the geographic distribution o f teachers and the prevalence o f “ghost” teachers. This would serve as an instrument to inform decisions on the deployment o f teachers (within urban areas and across ruralhrban areas). In the longer term, there i s a need to devise a better compensation pol icy that includes more incentives to encourage the upgrading o f unqualified teachers (“empricos”) and reward good teaching performance. (Ideally, a teacher licensing and program certification system that i s linked to results i s something to strive for, but may be premature for Nicaragua at this point.) In seeking to link teacher compensation to teaching performance and results, i t wil l be important to analyze the recent student assessment data (from 2006) with the objective o f identifying the main factors (such as education profile, experience, wage rate) associated with good teacher performance and results. (The last student assessment carried out in 2002 had revealed, for example, that ha l f o f the teachers felt ill-prepared to teach mathematics.)
4.70 Finally, the adoption o f a time-bound action plan for the incorporation o f a l l public sector employees into the administrative career, as envisaged by the C iv i l Service Law, would greatly enhance the process o f professionalizing the public labor force.
DIRECTIVO 38,760
xx 3 1,604 XIX 25,770 23
XVI I I 21,013 23 XVI I 17,133 23 X V I 13.969 23 xv 11,391 23 XIV 9,287 23 XI11 7,572 23
EJECUTIVO XI1 6,174 19 X I 5,203 19 X 4,384 19 I X 3,695 19
VI11 3.1 14 19 VI1 2,625 19
OPERATIVO V I 2,211 15 V 1.928 15 Iv I 1.682 I 15 I11 1,467 15 I1 1,279 15 I 1.013
89

NGrnero de trabajadores con salario
Moda
76 1,874
785 51 0
1,084 1.390 4,847 1,236
141 457
2,089 199 59 49
755 100 207
1,323 283 220 282 45 1 145
5 37 6
97 14
127 31
0
12 8 2
18.90 1
Source: Morales et. al. (2006) from fiscal payrol l data.
90

CHAPTER V FISCAL DECENTRALIZATION IN NICARAGUA
5.1 The Nicaraguan state traditionally has been highly centralized. That tradition continues to hold sway today. Yet, over the last 20 years the country has moved, in fits and starts, against that structural legacy and toward a more decentralized political model, enabling locally-elected municipal governments to play a larger role in setting priorities and delivering services in selected pol icy arenas. This can be a good thing, insofar as it permits choices about public resources to become better aligned with locally defined preferences - the classic justification for greater decentralization. I t can also lead to problems in terms o f fiscal imbalances or gaps in the provision o f critical public services in the event that municipalities lack adequate institutional capacity.
5.2 The 1987 Constitution marked a key point o f departure, enshrining for the first time the principle o f “municipal autonomy” in Nicaragua. Since that time, and particularly since 1995, the government has undertaken a number o f legislative and regulatory measures to expand the authority and capacity o f municipal governments. Generally, however, those government actions have been ad hoc and piecemeal. They have not been part o f a well-articulated strategy providing a road map for the decentralization process.
5.3 Presently, the country faces several challenges - financial, political and administrative - concerning the respective roles and capacities o f the central government and municipalities. To move the decentralization process forward, there i s rough agreement among many government officials and external observers that an authoritative decentralization strategy document is needed, with entry points, a sequence o f action steps, and responsible actors plainly specified, a l l consistent with a clear description o f the aims o f the decentralization process in Nicaragua. Several issues will have to be balanced in devising and implementing such a program. These include the need for a common set o f rules versus recognition o f sharply divergent municipal conditions, the need for capacity building vs. the ability to realize it, and the appropriate balance between central government directives and municipal autonomy. Most importantly, steps must be taken to maintain the nation’s overall fiscal balance in the face o f growing budget allocations to municipalities.
5.4 This Chapter seeks to contribute to that broader discussion by identifying specific problems, explaining them, and then arguing that the solutions l ie in certain directions. I t does not pretend to offer single, first-best technical solutions, as effective solutions in this area demand a modicum o f political consensus, and until the nature o f that consensus becomes clear, various alternative approaches are viable.
5.5 The chapter is organized in six sections: the first recounts k e y steps in the decentralization process since 1987, particularly as those relate to the assignment o f roles and resources. Next, the budget transfer rules from central to municipal governments are discussed in detail, followed by an analysis o f municipal expenditures. Then, the accountability mechanisms for municipal expenditures are scrutinized. Having described Nicaragua’s decentralization arrangements, the next section highlights key fiscal imbalances that undermine
91

the present system, and current efforts underway to remedy those shortcomings. The chapter concludes with recommendations and potential areas o f World Bank support.
A. Municipal Government Roles & Assigned Revenues (1987-2006)
Municipal Roles
5.6 Nicaragua’s 1987 Constitution declared the importance o f municipal autonomy and founded municipal governments elected via universal Regarding their competencies, Article 177 set out the broad principle that municipal governments are responsible (“tienen competencia”) for maters relating to the socio-economic development o f their territory. The following year the National Assembly attempted to give legal effect to that provision by defining municipal government responsibilities in a Municipalities L a w (Law No 40).
5.7 Gomez Sabaini and Geffner (2006) observe that the roles named in the Municipalities Law, including revisions in 1997 (Law No 261), can usefully be arranged in three categories: service provision, regulatory functions, and promotion activities (see Table 5. 1p5 In addition, municipal competencies are one o f three types: exclusive to municipal government ((‘compentencias propias”), concurrent with the national government (“concurrentes”), or delegated roles (“deZegados”) which the national government transfers to municipalities, along with resources for their execution.
Table 5.1 Areas of Municipal Responsibility Service provision Regulatory functions Promotional activities Garbage collection and solid Hygiene and sanitation Construction and waste disposal maintenance o f health
Water, sewage and electricity Public transportation, transport terminals Emergency response centers
Drainage Cattle brands, transport routes committees Hygiene and preventive health campaigns
Markets, public washing facilities Cemeteries Culture, sports and
Public ornamentation and Land use, urban and rural development Tourism displays planning, compliance with construction
Construct and maintain streets, sidewalks, parks and plazas Municipal roads and bridges
recreation
regulations Environment and natural resources
River ports
Human rights
Street signs and signals Note: This Table includes the most prominent responsibilities, but i s no t exhaustive. Source: Sabaini and Geffner (2006), f rom Municipalities L a w No 40/261.
C iv i l registry
L
84. The 1987 Ley de Autonomia de las Regiones de l a Costa Atlantica established the Autonomous Regions o f the Atlantic Nor th (RAAN) and Atlantic South (RAAS) as an intermediate level o f government. (For administrative purposes, the national territory i s divided into 15 departments.) The f i rs t local government elections took place in 1996. 85. L a w No 261 (1997), “Reformas e Incorporaciones a l a L e y 40 de Municipios,” in Art. 7 lists a series o f competencias. See also Decree No 52-97 and Decree No 34-2000.
92

5.8 Unfortunately, Law No 40 and i t s revisions do not provide a plain, unambiguous statement o f the roles and related expenditure responsibilities o f different levels o f government. Rather, they leave ample room for differing interpretations regarding what the discharge o f each “competency” entails. (What does i t mean for municipal governments to “promote” health centers?) In addition, there are several sectors where the responsibilities o f municipal governments, l ine ministries and autonomous agencies overlap in confusing ways. In the roads sector, for instance, the tasks assigned to municipal governments readily overlap with national projects and/or the activities o f foreign donor agencies. Verkooijen (2006) refers to conversations with officials o f the Nicaraguan Institute for Municipal Development (Instituto Nicaragiiense de Fomento Municipal - INIFOM) in which these officials themselves expressed a sense o f confusion regarding exactly what each municipality is meant to do. At times those ambiguities have led to inaction, while at other times they produce an inefficient duplication o f efforts as municipal officials press claims for resources to fulfill the same responsibilities that other public sector actors are engaged in.86
5.9 As government officials and other interested parties in Nicaragua consider reassigning roles between levels o f government, there are certain decentralization principles that need to be taken into account. “Assignment o f public services to local or regional governments can be based on considerations such as economies o f scale, economies o f scope (appropriate bundling o f public services to improve efficiency through information and coordination economies and enhanced accountability through voter participation and cost recovery), cost-benefit spillovers, proximity to beneficiaries, consumer preferences, and flexibility in budgetary choices o n composition o f public pend ding."^' More broadly, the principle o f subsidiarity provides a common standard: roles should be assigned to the lowest level o f government consistent with the geographic area that internalizes the benefits and costs o f decision making for a particular public service.88
Municipal Revenues
5.10 The 1995 constitutional reforms built on the principle o f local government autonomy, mandating that the central government assign sufficient national budget resources for Nicaragua’s municipalities to develop their competencies. Also, in recognition o f the inherent differences in resource endowments across municipalities, Nicaragua’s poorer municipalities are to receive a disproportionate share o f the overall budget transfer. The constitutional changes did not specify, however, an amount or share o f the budget that should be transferred.
L
86. Shared and sometimes overlapping roles between organizations or levels of government are commonplace throughout the world. Yet, where resources are desperately scarce, as in Nicaragua, there is a greater need to minimize these overlaps - and the potential confusion they provoke. The analyses of Verkooijen (2006) and Sabaini Geffner (2006) each highlight the inefficiencies and confusion between government actors that the existing legislation enables in Nicaragua. 87. Jennie Litvack and Jessica Seddon, eds., “Decentralization Briefing Notes.” WBI Work ing Papers. W o r l d Bank Institute, p. 20. 88. Fo r further discussion o f factors that should be weighed in considering the appropriate assignment of public functions, see http:/ /wwwl .worldbank.org/wbiep/decentralization/module l/topicO 1qrinter.htm.
93

5.1 1 “Municipal autonomy” in Nicaragua does not include authority to enact local taxes or set rates. These are solely determined by the central g~ve rnmen t .~~ On the heels o f the 1995 constitutional reform, the central government assigned to munici alities the right to collect (and retain) the property tax (Impuesto de Bienes Inmuebles - IBI). Two years later, the Aleman Administration (1996-2001) expanded the tax base for the Municipal Income Tax (Impuesto Municipal sobre Ingresos - MI), but the IMI tax rate was reduced from 2.0 percent to 1.5 percent as o f January 1998, and to 1.0 percent from January 2000.91
5.12 The IBI and IMI - as wel l as lesser revenues from municipal services and licensing fees - provide a basis for municipalities to generate their own revenues. However, neither the original Municipalities Law nor i t s 1997 version assigned resources to municipalities. Only in the aftermath o f Hurricane Mi tch in 1998 were funds totaling just less than 1 percent o f the national budget transferred to municipalities for reconstruction works. The 1995 promise o f a budget transfer - sufficient for municipal governments to exercise their assigned faculties - remained unrealized.
5.13 The watershed moment for municipal finances in Nicaragua occurred in 2003 when the National Assembly approved (and President Bolaiios signed) the Budget Transfers to Municipalities Law (BTML).92 Beginning in 2004, 4 percent o f the central government revenue anticipated in the annual budget law would be transferred to municipalities. The Law further stipulated that the share o f tax revenues to be transferred would increase by at least 0.5 percent per annum (provided GDP increased by at least l%), and reach 10 percent o f revenues in 2010. For the first time, Nicaragua’s municipalities were assigned a sizeable and relatively stable f low o f resources. (Notably, however, municipal governments themselves are not responsible for generating these resources locally.)
5.14 For the central government the fiscal implications o f the BTML were alarming from the start. The B o l ~ o s Administration (2002-2006) agreed with the World Bank and IMF to “neutralize” the fiscal effect o f the transfers by making equivalent cuts in spending elsewhere in the national budget. However, in October 2004, the National Assembly revised the timetable and amounts set forth in the B T M L : the transfer was to be 6 percent o f national revenues in 2005 and 2006, and then rise directly to 10 percent from 2007
5.15 In November 2005, President Bolafios proposed legislation to freeze transfers at 6 percent o f national tax revenues, arguing that the responsibilities residing with municipal governments did not justify additional resources. The ensuing political contest between the President and the legislature resulted in the transfer ru le in effect today: transfers are to increase by 1 percent per annum until reaching 10 percent in 201 0.94
9 8
L
89. Articles 1 15 and 138 o f the Constitution declare that the creation o f taxes (“tributos”) and approval o f user fees (contained in the Planes de Arbitrio) is an exclusive authority o f the legislative branch. Likewise, L a w No 376 (article 11) prohibits under any circumstances the creation o f new municipal tax. 90. Decreto 3-95, L a Gaceta No 21 del 31 Enero 1995. The E31 i s 1% o f the property tax base, wh ich is 80% o f the market value or the value in the property registry. 91. LawNO257 92. Ley de Transferencias Presupuestarias a 10s Municipios de Nicaragua (No 466), L a Gaceta No 157, Agosto 2003. 93. L a w No 504 (2004) 94. L a w No 571 repealed L a w No 504 and reformed L a w No 466 (Art. 5).
94

B. The Budget Transfer Formula and Municipal Own-Revenues
5.16 The BTML defines the rules for the distribution o f national revenues among Nicaragua’s municipalities. O f the total resources for distribution, the Municipality o f Managua is a case apart, receiving a fixed 2.5 percent o f the total. For the remaining 97.5 percent, the allocation i s determined by four factors. Two o f these factors refer to the condition o f the municipality (population and fiscal equity). The remaining two are measures o f municipal government performance (efficiency in tax collection, and budget execution o f the transfer f rom the previous year).95 The four criteria are described in greater detail below. Each receives an equal weight in calculating the overall transfer award.
Population (25 percent). A per capita amount i s transferred to each municipality in accord with its population, as determined by the National Statistics and Census Institute
Fiscal Equity (25 percent). The potential tax income o f each municipality i s estimated. Next, that per-capita potential is compared to the national per capita average. Municipalities below the national average are to be awarded an amount to bring them up to the national average, thereby “leveling the playing field” between municipalities. (In practice, the transfer exceeds what i s required simply for equalization because o f the 25 percent weig11ting.1~~ Tax collection efficiency (25 percent). This performance measure compares the amount that each municipality collects in property tax (IBI) against its potential BI, as suggested by the municipal tax base. (For municipalities in the Atlantic Regions a complement o f taxes is assessed rather than the IBI, given that large land holdings by communal Indian goups severely limit the revenue-generating potential o f the IBI in these regions.) Execution of transfers (25 percent). This indicator i s measured as the share o f the previous year’s transfer that was executed (spent) on budget-approved projects or activities.
( N C ) .
5.17 Transfers to municipalities in 2003 (prior to the BTML) totaled C$156 million. The estimate for 2007 is C$1,278 million, an increase o f 719 percent since 2003. Two factors explain this growth. First, the revenue share allocated to municipalities has increased from 4 percent to 7 percent in accordance with the schedule approved in the BTML. Second, central govemment tax revenues have grown over this period (see Table 5.2). Tax revenues as a share o f GDP increased in Nicaragua by more than 3.5 percentage points from 2001 to 2004, reaching 16.9 percent o f GDP.97
L
95. If actual central govemment revenues exceed (or fa i l to meet) projections, then the Ministry o f Finance (Ministerio de Hacienda y Credit0 Publico - MHCP) must increase (or reduce) the transfer amount assigned to each municipality in the course o f budget execution. 96. Lacayo (2006) calculates that in 2006 the amount o f money required to bring a l l municipalit ies to the national average was equal to 11 percent o f the total amount for distribution in transfers under L a w No 466. However, the distribution formula assigns 25 percent o f the total t o this criterion. T h i s result appears to disadvantage municipalities that are only slightly above the national average. 97. International Monetary Fund (2006)
95

Table 5.2 Evolution of Central Government Transfers to Municipalities, 2003-2007
Year Central Increase in Share o f Total Munic. Total Transfers Transfers Government Income Income Transfers ifIncome were attributable to
(millions of 2003 Munic. Cordobas) (millions o f Income Cbrdobas) W) (%) Cbrdobas) Transferred
(millions o f Cbrdobas)
Income relative to Transferred to (millions of 2003 increase in share o f
2003 9,378.30 -- 1.7 156.00 156.00 0.00 2004 11,206.30 19.5 4.0 448.25 375.13 73.12 2005 13,505.00 44.0 6.0 8 10.30 562.70 247.60 2006" 16,020.70 70.8 6.0 961.20 562.70 398.50 2007b 18,257.10 94.7 7.0 1,278.00 656.48 62 1.52 Note: a/ Budgeted; b / Projected Source: Moncada (2006), compiled with data f r o m PGR and INIFOM.
5.18 H o w important is the budget transfer as a source o f municipal government revenues? In addition to this transfer, municipal current revenues include the MI, IBI, and municipal service fees and licensing fees.98 In 2005, the transfers mandated by the BTML accounted for only 12 percent o f total municipal current revenues (see Table 5.3). Have the growing budget transfers curbed own-revenue collection by municipal governments? This does not appear to be the case.99 Since 2004 when the BTML came into effect, municipal own-revenue collection has increased each year. The cumulative increase in own current revenues from 2004 to 2006 was 90 percent. 100
Table 5.3 Composition of Total Municipal Current Revenues, 2005 Category Percent o f total Municipal income tax (IMI) (sales and services) 46% Property tax (IBI) 13% Transfers L a w 12%
Licenses and school fees 9% Other 9% Total 100%
Municipal service fees 11%
Source: Compiled by author f r o m data presented in Moncada (2006); calculated f r o m INIFOM and M H C P data.
5.19 These aggregate statistics mask important differences, however, between the dozen largest municipalities in Nicaragua and the rest. The Municipality o f Managua alone accounts for more than hal f o f total own-source municipal revenues. Thus, while transfers represented only 12 percent o f total municipal revenues in 2005, for 30 municipalities the transfers that year accounted for more than 50 percent o f revenues."' Once Managua i s excluded, overall statistics L
98. Examples o f service fees include registration o f cattle brands, building permits, market rents, c i v i l registration fees, garbage collection and street cleaning. 99. The existing evidence i s insufficient t o support a firm conclusion, as it would be necessary to estimate the counterfactual: H o w much own-revenue would municipal governments have collected in the absence o f the budget transfers f rom central government? 100. 10 1. INIFOM (2004)
Moncada (2006), calculated with data f rom INIFOM and MHCP.
96

reveal a growing municipal financial dependence on central government budget transfers. As Table 5.4 shows, these transfers as a share o f municipal current revenues (excluding Managua) grew from 32 percent in 2003 to 108 percent (projected for 2007).
Table 5.4 Municipal Current Revenue and Budget Transfers, 2003-2007 (excluding Managua) Year Municipal Current Revenue, Budget Transfers, BIA
excluding Managua excluding Managua
A B (millions of Cbrdobas) (millions of C6rdobas)
2003 490.1 156.0 32 2004 575.5 387.7 67 2005 717.9 770.3 107 2006" 1,063.7 913.8 86 2007b 1,127.5 1,214.9 108
Note: a/ Budget; bl Projection Source: Moncada (2006), compiled with data from PGR and INIFOM.
C. Municipal Expenditures
5.20 The share o f total public expenditure budgeted and executed by subnational government i s one important measure o f decentralization. By that metric, as Table 5.5 shows, decentralization clearly has advanced in Nicaragua: the share o f total public expenditure by municipalities has grown from 8 percent in 2003 to 14 percent in 2006. As a share o f capital expenditure, the increase has been even more dramatic: from 13 percent to 22 percent over the same period.
5.21 The allocation o f municipal revenues between recurrent and capital expenditures i s controlled by the central government. The Municipal Budget Law lo*
Table 5.5 Share o f Municipal Expenditure in Total Public Expenditure, 2003-2006
Expenditure 2003 2004 2005 2006 Recurrent 5 7 8 8 Capital 13 14 15 22 Total 8 10 11 14 Source: Moncada (2006), from INIFOM and MHCP.
establishes eight separate municipal categories (A-H) in accordance with their annual own current revenue. The greater a municipality's own revenue, the greater the share o f i t s budget transfer that must be assigned to investment expenditure (see Table 5.6).
5.22 Municipalities can use capital transfers as counterpart funding for investment projects or for training public sector personnel. However, capital transfers cannot be allocated to recurrent expenditures. N o r can annual transfers be used as a contractual guarantee for payment or for financial investments. Overall, the share o f transfers devoted to capital expenditure (according to approved municipal budgets) grew from 72 percent in 2004 to 75 percent in 2006 (see Table 5.7).
L
102. Law No 376 (2001), modified by Law No 444 (2002).
97

Category Table 5.6 Current Revenues, Municipal Categories & Budget Allocation Rules
Criteria: Current Annual Revenue Assignment of transfer funds Min. invest- (in cordobas) Investment Recurrent ment as YO of
(min.) (max.) total revenue A 1 50,000,000 (Municipality o f Managua) 90 10 40 B > 10,000,000 & 5 50,000,000 80 20 30 C > 6,000,000 & 5 10,000,000 80 20 20 D > 2,500,000 & 5 6,000,000 80 20 20 E > 1,000,000 & 5 2,500,000 70 30 10 F > 750.000 & 5 1,000,000 70 30 10 G > 400,000 & 5 750,000 60 40 10 H 5 400,000 60 40 10 Source: Ley del Regimen Presupuestario Municipal.
Table 5.7 Allocation of Transfers according to Municipal Approved Budgets 2004 2005 2006
millions US$ Yo millions US$ % millions US$ YO CaDital 18.45 71.9 38.64 75.1 40.58 74.8 Recurrent 7.20 28.1 12.82 24.9 13.68 25.2 Total 25.65 100.0 51.46 100.0 54.26 100.0 Source: Verkooijen (2006); based o n T R A N S M U N I data.
Table 5.8 Utilization of Budget Transfer According to Municipal Approved Capital Budgets, 2004-2006
2004 2005 2006 R a n k in millions YO of total millions YO of total millions YO of total 2004 &
of C $ transfer of C$ transfer of C $ transfer (2006)" Streets, bridges, pedestrian 177.09 60.4% 331.31 51.8% 380.19 54.1% 1(1) lanes, rural roads & highways Sports, comm./cultural ctrs 32.64 11.1% Markets 7.19 2.5% Water and sanitation 8.17 2.8%
Housing 8.49 2.9% Municipal Strengthening 9.42 3.2% Drainage 4.32 1.5% Municipal Offices 10.06 3.4% Machinery and equipment 1.20 0.4% Latrines 11.45 3.9% Security 0.11 0.0% Health posts and centers 0.18 0.1%
Rural Electrif. & Lighting 6.43 2.2%
Education 3.98 1.4% Cemeteries 7.48 2.6% Telecommunications 0.61 0.2%
Other 1.23 0.4% Insufficient Information 0.16 0.1%
Environment and agriculture 3.1 1 1.1%
50.35 7.9% 18.45 2.9% 28.31 4.4% 11.37 1.8% 31.13 4.9% 37.52 5.9% 7.19 1.1%
16.18 2.5% 55.15 8.6% 8.80 1.4% 0.51 0.1% 2.86 0.5%
17.59 2.8% 4.86 0.8% 0.8 1 0.1% 4.59 0.7% 2.21 0.4% 9.37 1.5%
63.41 9.0% 2 (2) 52.09 7.4% 9 (3) 33.37 4.8% 7 (4) 33.01 4.7% 10 (5) 24.06 3.4% 6 (6) 17.31 2.5% 5 (7) 15.88 2.3% 11 (8) 13.25 1.9% 4 (9) 1 1.60 1.7% 14 (10) 9.74 1.4% 13 (11)
16 (12) 9.39 1.3% 4.5 1 0.6% 17 (13) 3.90 0.6% 13 (14)
0.38 0.1% 15 (16) 0.36 0.1% 12 (17) 6.86 1 .O% d a
22.08 3.1% d a
0.78 0.1% 8 (15)
Total 293.32 100% 638.56 100% 702.17 100% Note: * Rankings added by the author. Source: Verkooijen (2006); based o n T R A N S M U N I data.
98

5.23 Article 12 o f the Budget Transfers Law states that transfers “preferentially” should be used to fulfill the municipal competencies listed in Article 7 o f the Municipalities L a w (see Table 5.1 above). That instruction affords considerable latitude to municipal governments. In practice, as Table 5.8 shows, building and/or maintenance o f roads, highways, and related infrastructure consistently absorb over ha l f o f the capital transfer. This expenditure category i s five times larger than any other. Meanwhile, water and sanitation expenditure - a typical local government responsibility - accounts for less than 5 percent o f the transfer.
5.24 As for recurrent expenditures, the largest cost item, as anticipated, is personnel. According to data from the Nicaraguan Institute for Municipal Development (Instituto Nicaragiiense de Fomento Municipal - INIFOM), in 2004 wages and salaries accounted for approximately 60 percent o f recurrent expenditures (see Table 5.9). Meanwhile, Moncada (2006) calculates that for 2004-2006 the wage bill as a share o f recurrent expenditure was roughly 70 percent. There is womsome evidence that local government employment may have increased by more than a third between 2000 and 2005.’03 However, the fiscal impact i s not entirely clear. Wages and salaries as a share o f recurrent transfers evidently have not increased from 2004-2006.’04
Table 5.9 Municipal Expenditures by Category, 2004 A B C D E F G H Total
Total expenditure 821.4 629.7 171.0 284.1 415.8 112.7 85.2 71.2 2,591.1 (millions of cordobas)
Current dxpenditure 338.1 244.7 85.0 107.0 Wages & salaries 176.2 160.7 53.9 61.0 Products & services 106.2 60.5 18.9 29.9 Transfers & donatn. 55.7 3.9 1.3 3.3 Other 0.0 19.6 11.0 12.9
Capital Expenditure 43.3 385.0 86.0 177.0 Physical investment 329.0 353.9 79.8 166.0 Social investments 0.0 30.1 6.0 10.2 Other 154.3 1 .o 0.1 0.9
Source: Sabaini and Geffner (2006), based on INIFOM data.
118.6 70.9 29.9 2.7
15.1 297.1 268.6
18.3 10.2
33.3 28.8 23.2 19.6 16.1 14.9 9.3 7.1 5.4 0.6 0.8 0.4 3.7 4.8 2.5
79.4 56.4 48.0 73.3 53.5 40.0
6.0 2.5 3.1 0.0 0.4 4.9
978.8 573.3 267.3 68.7 69.5
1,6 12.3 1,364.1
76.3 171.9
D. Accountability for Public Expenditure
5.25 A number o f reporting requirements are embedded in the nationally-defined rules for municipal transfers and budget formulation and execution. Mayors and municipal councils are obliged by the BTML, as well as the Municipal Budget Law, to report on their annual budget execution to the Ministry o f Finance and Public Credit (Ministerio de Hacienda y Crkdito Publico - MHCP) and the Contraloria General de la Republica (CGR), as wel l as to INIFOM. Submission o f these reports i s a precondition for a municipality to receive a budget transfer for the subsequent year. Article 10 o f the BTML stipulates that by February 15 o f each year municipal governments must send the following documents to the MHCP:
a) Municipal budget, approved by the Municipal Council b) Execution o f the previous year’s budget
L
103. Gil-Diaz (2006), section IV. 104. Moncada (2006)
99

Physical and financial execution o f the PIM Plan for use o f the coming year’s financial transfer Documentation o f special bank account that wil l be used to administer the transfer Verification from the Municipal Council that the projects to be financed by the transfers are part o f the PIM, delivered to the National System o f Public Investment (Sistema Nacional de Inversi6.n Pziblica - SNIP), and duly approved and included in the Municipal Budget.
Recurrent transfers are transmitted to municipalities in monthly installments. Fol lowing the f i rst two transfers, municipal governments must report on their budget execution o f the previous trimester, demonstrating execution o f at least 65 percent o f those transfers.
5.27 Capital expenditure transfers are allocated in three annual installments (40 percent, 40 percent and 20 percent) at the end o f March, June and September, respectively. Each transfer is contingent, however, on the municipal government submitting to the M H C P a physical-financial report concerning the projects executed during the previous term.
5.28 From this analysis, i t is evident that shortcomings in financial accountability result not from a dearth o f reporting requirements, but rather from weak data systems and accounting practices. The vast majority o f municipalities maintain only cash f low accounting. Most use a schedule o f accounts (plan de cuentas) different from that o f the central government. Frequently the categorization o f expenditure is undisciplined - often with recurrent expenditures classified as capital outlay^."^ And external audits are not regularly conducted. Plus, there are a myriad o f financial management data systems in use at the municipal level in Nicaragua. A USAID study identified at least nine.lo6
Table 5.10 Municipal Debt with the INSS, By Department, as of March 31,2006
Department C6rdobas Boaco 355,303 Carazo 1,002,145 Chinandega 2,387,551 Chontales 200,265 Esteli 430,003 Granada 3,484,086 Jinotega 150,688 Leon 602,308 Madriz 17 1,544 Managua 138,201,456 Masaya 30,095 Matagalpa 4,973,280 Nueva Segovia 1,673,401 M A N 1,128,947 M A S 5.29 At present there i s no detailed accounting Sari Juan
o f municipal debt. Yet analysis o f a sample o f Rivas
31307,359 293,171 311.169
municipalities conducted in 2006 revealed that Total 158,702;77 1 these debts are significant. In 2006 the municipal debt owed to the Nicaragua Social Security Institute (Instituto Nacional de Seguridad Social - INSS) alone was equal to roughly 16 percent o f the total transfers under the Budget Transfers Law (see Table 5.10).’07 A proper accounting o f municipal debt should also include arrears to
Source: I N S S
L
105. Moncada (2006), analyzing 2005 accounts information from the Office o f Municipal Finances and the MHCP, describes as commonplace the use o f the wrong codes and missing documentation, numbers that should match and do not. 106. Casals & Associates, USAID 2004, “Modulo de Asistencia Tkcnica (TAM) Sistemas Integrados de Administracion financiera (SIAF’s) en 17 Municipios de Centroamerica.” 107. Municipalities are required by law to retain 6.25 percent from the salary o f their employees and send 15 percent o f the i r wage bill to the INSS. Many municipalities have been late in making these payments, accruing debts
100

suppliers and other public Gil-Diaz (2006) concludes to specify with precision, effectively bankrupt.”*
entities, including uti l i t ies. After estimating overall municipal debt that a significant number o f municipalities - though it was impossible as consolidated debt is not registered by al l municipalities - are
5.30 The Fiscal Decentralization Unit, created in 2005, and the M H C P are stimulating improvements in municipal accounting and improving the tracking and transparency o f municipal expenditures o f budget transfers. The System o f Municipal Transfers (Sistema de Transferencias Municipales - TRANSMUNI) registers online the use o f municipal transfers in a database managed by MHCP.lo9 The next phase, TRANSMUNI 11, i s presently under implementation. I t i s intended to incorporate full municipal budgets, consolidate accounts and link them with SIGFA to produce overall accounts on public sector expenditure. Unfortunately, tracking the quality o f municipal expenditure i s s t i l l a more remote goal.
E. Redressing Imbalances: Current and Proposed Reform Actions
The Struggle for Fiscal Neutrality
5.3 1 When expenditure responsibilities are devolved to lower levels o f government, experience suggests that maintaining fiscal responsibility can be a dif f icult challenge. Where the costs o f taxation to finance transfers are largely borne by citizens outside the municipality receiving the transfer - as in Nicaragua - the common impulse for municipal officials i s to press for larger transfers, not for fiscal restraint. The MHCP, however, must be concerned with the country’s overall fiscal balance.
5.32 The budget transfers mandated by the B T M L obviously represent a large additional outlay for the national treasury. To avoid a dramatic fiscal shortfall, the central government has sought to reduce other budget expenditures to “neutralize” the adverse fiscal effect o f the transfers. The MHCP calculates that the government has reached 97 percent o f the target agreed with the World Bank and IMF for neutralizing the municipal transfers. The percentage o f government taxes assigned to municipal transfers has increased since 2004 in accordance with the BTML schedule (6 percent in 2005 and 2006, and 7 percent in 2007). Meanwhile, according to the PRGF-supported program agreed with the IMF, the share o f transfers that must be neutralized has grown over time (33 percent in 2005; 66 percent in 2006; and 100 percent in 2007 and succeeding years). To calculate compliance, the M H C P position i s that the higher percentages for neutralizing transfers apply only to the marginal increase in the overall transfer amount from one year to the next. The lower percentages continue to apply to the transfer amounts in those respective years (see Table 5.1 1).
with the INSS. Gil-Diaz (2006) identifies 90 municipalities with debts owed t o the INSS. However, due to data limitations the study could not identify the age o f the debt. 108. The Municipal Budget Regime L a w ( N O 376) establishes that municipalities can contract medium and long- term debt only with their total debt service payments are less than 2 0 percent o f their annual current revenues (Art. 21). 109. Municipalit ies can submit their reports either electronically through the TRANSMUNI website or they can submit a physical report that i s received by the MHCP in Managua.
101

Table 5.11 Budget Cuts to “Neutralize” Transfers, 2004-2007 Year Share o f Total Munic. Percent of transfer M H C P Maximum B-A
Income Transfers to be “neutralized” interpretation of interpretation of
Munic. c6rdobas) IMF agreement required to required under (”/I (”/.) “neutralize” IMF agreement
Transferred to (millions of in accordance with budget cuts budget cuts
transfers (millions of (millions o f C6rdobas) c6rdobas) B
A 2004 4.0 448.25 0 0.00 0.00 0.00 2005 6.0 8 10.30 33 267.40 267.40 0.00 2006a 6.0 961.20 66 366.99 634.39 267.40 2007b 7.0 1,278.00 100 683.79 1,278.00 594.21 Note: a/ Budgeted; b/ Projected Source: Data f rom Table 5.2 and calculated by the author.
5.33 Where has the M H C P identified these cuts? Ideally, financial transfers to municipalities would be neutralized by transferring equivalent service responsibilities from the central government to municipalities, and then reducing the central government budget accordingly. Indeed, if the allocative efficiency o f local government expenditure is truly superior to that o f the central government, then entrusting local government with these expenditures wil l produce a higher social return. To date, however, the statutory responsibilities o f municipal governments have not increased commensurately with the fiscal transfers o f the BTML.’ lo
5.34 From 2004 to 2006, the MHCP was roughly able to “neutralize” budget transfers to municipalities by making budget cuts to capital expenditure in those areas that most closely overlap with municipal activity. For instance, in 2005, the largest share o f funds in municipal capital budgets (44 percent) arrived via transfers from other central government institutions - particularly the Emergency Social Investment Fund (Fondo de Inversidn Social de Emergencia - FISE), INIFOM, the Rural Development Institute (Instituto de Desarrollo Rural - IDR), the Ministry o f Environment and Natural Resources (Ministerio Ambiental y Recursos Naturales - MARENA), and the Ministry o f Transport and Infrastructure (Ministerio de Transportes y Infraestructura - MTI). l1 National budget funding for these institutions has been cut significantly, and will have to be reduced s t i l l further in the years ahead as the size o f the budget transfer to municipalities reaches 10 percent in 2010. Both FISE and IDR now require a degree o f co-financing o f investment projects with local governments, and increased municipal co- financing could reduce central government outlays while maintaining overall public investment levels - provided these projects are highly demanded by municipal governments. However, these options for reducing expenditure cannot fully neutralize the growing fiscal cost o f the BTML.
5.35 MHCP officials concede that for 2008 i t wil l be necessary to reduce expenditure at the national level through a clear definition o f municipal (and national) roles. One step in this direction i s the draft legislation to reform the Municipalities Law (Law No 40). The proposed L
110. The position defended by AMUNIC today i s that when transfers to municipalities reach 10 percent o f central government revenues that wi l l merely be sufficient for municipal governments to satisfy the roles assigned to them in the Municipalities Law, as revised in 1997 (Law No 40/261). There are significant ambiguities regarding the assignment o f responsibilities in the Municipalit ies Law. However, in 2002 (the year before the Transfers L a w was approved) the budget demand by municipalities for 2003 was for 4 percent o f central government revenues. 11 1. Meanwhile, the Budget Transfer L a w accounted for 41 percent o f municipal capital budgets. See Moncada (2006).
102

revisions include sharper definitions for “exclusive,” “concurrent”, and “delegated” competencies. In addition, functional responsibilities are defined with greater precision, and are explicitly assigned to one o f the three competency categories. As an illustration, the revised text covering municipal responsibility for electricity provision, in the section on “competencias propias,” would read:
Design and construct electrical distribution grids, provided the cost o f construction, repair, or extension i s not greater than four years o f projected budget transfers to the municipality.’’2
As o f June 2007, this legislation has not yet been presented to the National Assembly for consideration.
5.36 A more powerful step to achieve fiscal neutrality would be to balance (growing) budget transfers with new municipal responsibilities for public service provision. However, the present draft legislation to reform the Municipal Law does not include a new assignment o f responsibilities to municipal governments. The political and legislative hurdles to do so present a daunting challenge, as the Budget Transfers L a w itself provides that assigning new functions to municipalities should be accompanied by an additional assignment o f resources.
Simplijkation and Improvement of the Budget Transfers Law
5.37 The formula to calculate each municipality’s share o f the overall budget transfer has four elements: population, fiscal equity, tax collection efficiency, and municipal execution o f transfer funds (described in section B above). D o these factors optimize the incentives for municipal governments to deliver services effectively, with a focus o n poverty reduction? Are these factors, and the means for measuring them, perceived as legitimate by local government officials? The answer to both questions appears to be a qualified “no.”
5.38 The BTML seeks to provide each municipality with sufficient resources to promote the socio-economic development o f its territory. Distributing part o f the transfer according to municipal population is uncontroversial, in principle. However, municipal officials have raised serious questions about the reliability o f the 2005 INEC census data. Among a group o f 30 mayors surveyed by INIFOM, nearly hal f took issue with the population data.’ l3
5.39 Municipalities with less income potential receive a disproportionate share o f the national transfer; but the distribution formula does not include a measure o f poverty. In practice, the “fiscal equity” criterion i s a partial proxy for poverty. Yet i t i s very difficult to measure. I N I F O M contracted with the Boston Institute o f Developing Economies to develop a Mode l for Determining the Municipal Tax Potential (Modelo de Determinacidn del Potencial Tributario Municipal - MDPTM). The resulting MDPTM includes socio-economic, labor, and fiscal modules, demanding detailed data on changes in population, labor force, labor migration, as wel l as municipal revenues and expenditures. However, consultants quickly encountered data
L
112. Diseiiar y construir redes de distribucion de energia electrica, siempre y cuando e l costo de l a construccion, reparacion o ampliacion de estas n o sea mayor a1 monto proyectado equivalente a cuatro aiios de transferencias presupuestarias que percibe e l Municipio. 113. INIFOM. Informe Final sobre Experiencia y Aplicacion de l a L e y 466 de Transferencias Municipales en e l 2004, preparado por CINASE: Centro de Investigacion y Asesona Socioeconomica, Ba jo contrato UNCDF-GTZ, version Junio 2005.
103

limitations when attempting to apply this methodology, and thus a simplified methodology has been applied to date.’14 Still, the complexity o f measuring Municipal Tax Potential is nearly impenetrable to al l but those who apply the formula, leading a perception among some mayors that the “fiscal equity” criterion i s unjust.’ l5
5.40 In contrast, the budget execution criterion i s simple to measure. However, the incentive this factor creates i s troublesome from a poverty-reduction perspective. The measure captures only whether or not money i s spent. Neither this indictor nor any other in the distribution formula addresses what the money buys or the quality o f that expenditure. It i s often dif f icult (and relatively expensive) to measure the quality o f expenditure. However, i t is important to avoid creating an incentive that prompts municipalities to spend badly in the interest o f spending quickly - thereby ensuring the maximum possible transfer in the following year for “budget execution.”’ l6
5.41 In practice, almost al l municipalities are receiving roughly the same amount for “budget execution,’’ whether they have greater resource endowments and capacity (i.e., municipalities in categories B & C) or are among the least developed in the country (Le., categories G & H). In 2007, the standard deviation o f the monetary award for “budget execution’’ to Nicaragua’s 152 municipalities (excluding Managua) i s 0.20, by far the smallest standard deviation o f the four factors in the distribution formula (see Annex A). 5.42 L ike the budget execution measure, tax collection efficiency i s a criterion included in the distribution formula to spur improved government performance. In 2005, IBI collections were 13 percent o f total municipal revenues (see Table 5.3 above). Yet the potential revenues from this tax are much higher, comparable to the revenues earned from the IMI (46 percent o f current revenues in 2005). During field visits conducted in 2005 for a donor-financed study o n the effectiveness o f General Budget Support to Nicaragua, municipal leaders freely admitted that there was a gross under-registration o f landholdings (Gasparini, et. al. 2006). Several municipalities visited by the research team did not collect any rural property tax.
5.43 Given this broad-based underperformance in collecting local taxes, encouraging improved IBI collection i s certainly a worthwhile objective. Additionally, increasing the weight o f a tax collection indicator within the distribution formula could demonstrate to local citizens how their payment o f taxes draws additional resources to the municipality. There are, however, important concerns about the specific design and consequences o f this indicator that need to be addressed. In 2005, nearly ha l f o f the 30 mayors surveyed by INLFOM
Table 5.12 Allocations for “Tax Collection Efficiency,” 2007
Group Average (millions of c6rdobasb Municipality Group
B 2.18 C 2.93 D 2.62 E 2.16 F 1.89 G 1.16 H 0.91
Source: Own calculations using 2007 budget proposal data; Annex XX.
L
114. Jiron Z. (2005). 115. INIFOM. Informe Final sobre Experiencia y Aplicacion de la Ley 466 de Transferencias Municipales en e l 2004, preparado por CINASE: Centro de Investigacion y Asesoria Socioeconomica, Bajo contrato UNCDF-GTZ, version Junio 2005. 116. The budget execution indicator may disadvantage those municipalities with the least capacity to execute expenditures well, which i s to say the poorest municipalities.
104

criticized the measure o f tax collection efficiency, criticizing the quality o f the data in the taxable property registry.’ l7 Moreover, as applied in 2007, this distribution factor rewards relatively well-off municipalities more than i t does Nicaragua’s poorer ones. In descending order from municipal category C through H, municipal governments receive progressively less, on average, for “tax collection efficiency” (see Table 5.12). What accounts for this outcome? I s i t the (lesser) capacity o f the smaller municipal governments? H o w can the tax registries be improved? Further analysis is needed to determine steps appropriate to redress this outcome.
5.44 The B T M L established an institutional mechanism to consider improvements to the allocation formula. Article 14 states that a Budget Transfers Commission (Comisidn de Transferencias Municipales - CTM) should revisit the formula every two years. The C T M i s composed o f five voting members:
1) President o f I N I F O M
2) President o f the Association o f Municipalities o f Nicaragua (Asociacidn de Municipios de Nicaragua - AMSJNIC)
3) President o f the Municipal Association o f the Caribbean Coast (Asociacidn de Municipios de la Costa Caribe - AMURACAN)
4) SNP Director
5) President o f the National Assembly’s Municipal Affairs Commission. In addition to these voting members, a CGR delegate sits on the CTM, and al l meetings o f the Commission must be attended by a delegate o f the MHCP.
Addressing Institutional Capacity
5.45 The growing share o f municipal government expenditure within the public sector (see Table 5.5 above) raises the stakes for improving the capacity o f municipal institutions, particularly in accounting and audit. The Nicaraguan Institute for Municipal Development (INIFOM) was established in the early 1990s to provide technical assistance support to municipalities, including for accounting systems.”* However, INIFOM was charged with a diverse mandate, including support for citizen participation, harmonizing actions by other state institutions and coordinating development projects with external cooperation. INIFOM also got involved in project financing. Moving forward, i t may be important for INIFOM to refocus i t s limited resources on a more narrow set o f priorities. Budget and tax administration would be good candidates for intensive support to municipalities.
5.46 Nicaragua’s Fiscal Decentralization Unit plays an important and growing role in tracking municipal expenditures and supporting municipal governments to improve their accounting practices. With the MHCP, the Fiscal Decentralization Unit has implemented TRANSMUNI, an internet-based database that represents an important advance in accounting for municipal expenditures with national government transfers. TRANSMUNI I1 represents an additional L
117. INIFOM. Informe Final sobre Experiencia y Aplicacion de l a L e y 466 de Transferencias Municipales en e l 2004, preparado por CINASE: Centro de Investigacion y Asesoria Socioeconomica, Ba jo contrato UNCDF-GTZ, version Junio 2005. 1 18. L e y 347; Institute Nicaragiiense de Foment0 Municipal.
105

advance to organize comprehensive data on municipal budgets, and allow for national consolidation o f accounts. To institutionalize and strengthen the role o f the Fiscal Decentralization Unit i t would be worthwhile to consider linking this Unit organically to the MHCP as a Directorate.
Municipal debt
5.47 Additional analysis is needed to quantify municipal debts and diagnose their sources. To contain any increase in debt obligations the proposed reform to the Municipalities Law is a useful step, as the changes would also assert greater control over municipal debt. For example, Article 82 o f the revised law would read:
0 All public credit operations o f short, medium, and long term that the Municipal Government wishes to undertake shall comply with the norms, procedures and requirements established in Law No 477 . . . and its regulations.. . Accordingly, in general, the procedures for contracting debt shall be the following:
o Short-term debt shall be approved by the Municipal Council and may only finance expenditures included in the Municipal Budget o f the year in which the debt i s contracted.
o Medium- and long-term debt, as wel l as bond issues, shall be approved by the Ministry o f Finance and Public Credit and the Central Bank, in conformity with Articles 20 and 21 o f the Municipal Budget Regime Law, and shall only finance the provision of public goods that correspond to exclusive municipal functions (“competencias propias”).’ * (Emphasis added)
F. Concluding Considerations
5.48 Over the last ten years the polemics surrounding decentralization in Nicaragua have focused primarily on the share o f national income to be transferred to municipalities. Less attention has been devoted to the appropriate roles o f each level o f government, or to an analysis o f the local government capacity required to carry out given tasks. These issues ought to be at the forefront in designing a full-fledged decentralization strategy in Nicaragua.
L
119. Toda operation de credit0 publico de corto, mediano y largo plazo que desee tramitar e l Gobierno Munic ipa l debera sujetarse a las normas, procedimientos y requisitos establecidos en l a L e y No 477 “Ley General de Deuda Publica” y su Reglamento, publicados en L a Gaceta, Diario Oficial No 236 y No 2 1 del 12 de diciembre de 2003 y 30 de enero de 2004, respectivamente. Por l o tanto, en l o general, 10s tramites para l a contratacion de deuda seran 10s siguientes: a. Las deudas de corto plazo seran aprobadas por e l Concejo Municipal y solamente podran financiar gastos cuyo pago este previsto en e l Presupuesto Municipal del afio correspondiente a1 que se contratan. b. Las deudas de mediano y largo plazo, asi como l a emision de titulos valores, de confonnidad con l o preceptuado en 10s articulos 20 y 21 de l a Ley de Regimen Presupuestario Municipal, seran aprobadas por e l Ministerio de Hacienda y Credit0 Publico y e l Banco Central y solamente podran financiar l a provision de bienes publicos municipales de las competencias propias.
106

5.49 In its 2005 National Development Plan (NDP), the government pledged to design a “national strategy for decentralization linked to the broader process o f institutional reform and modernization.” A year later, following a period o f consultations, the government partially fulfil led that commitment by publishing “Decentralization in Action: National Decentralization Strategy for Local Development.”’20 However, that document i s limited to providing a set o f guiding principles and goals. I t i s not a strategic document enumerating the specific services subject to decentralization, the processes to be followed, with a timetable, detailed financing, and action steps for specific actors - including l ine ministries, autonomous agencies, non- governmental organizations, and municipal bodies. For the decentralization process to advance in Nicaragua, producing a strategy with al l o f these characteristics should be the first order o f business.
5.50 International experience demonstrates that without macroeconomic balance, central governments tend to cut back their transfers to municipalities, in spite o f any statutory share o f national income promised for distribution, though sometimes not before encountering major fiscal distress. Transfers to municipal government are increasing sharply in Nicaragua. Yet the responsibilities presently assigned to municipal government date from 1997. The fundamental challenge i s to balance the accepted responsibilities o f municipal governments with the funding they receive, and thereby relieve the fiscal strain on the central government treasury. The recent NDP accepts that i t i s necessary to review the Municipalities Law to make the transfers fiscally sustainable, assigning responsibilities for municipal expenditure equivalent to the resources transferred, thereby permitting a reduction in the National Budget for central government spending o n matters that are the clear competence o f municipalities.’21
5.51 As Nicaraguans consider which activities should most appropriately be carried out by local government, i t i s critical to quantify their costs, as well as the administrative demands those roles place on central and local governments. For instance, in many decentralized government systems maintenance o f physical infrastructure in education and primary health care falls to local government; but that i s not presently the case in Nicaragua. H o w much do those activities cost? H o w would (revised) municipal roles fit within the sector-specific service delivery models in Nicaragua? And how complex are the administrative demands (e.g., contracting, personnel management, oversight, accounting, etc.) for carrying out any o f these new mandates effectively?
5.52 Assigning roles to municipalities in Nicaragua is made more challenging by the country’s tremendous territorial diversity. Managua accounts for nearly 20 percent o f the country’s population, with a population density o f almost 4,000 hab/ km2. Meanwhile, municipalities in Category F average fewer than 15 hab/ km2. These statistics underscore the dramatically diverse demands for public services across Nicaragua’s municipalities, and their sharply different capacities. Naturally, this diversity has important implications for the technical assistance and training required to support weaker municipalities to develop their administrative, technical, and financial capacities. In addition, this diversity suggests flexible arrangements for service delivery should be considered. That flexibility i s already reflected in the Municipalities L
120. “Descentralizacion e n Accion: Estrategia Nacional de Descentralizacion para e l Desarrollo Local (ENDDL)”; and Decreto No. 45-2006: “Politica Nacional de Descentralizacion Orientada a1 Desarrollo Local” Cjulio 2006). 121. The Joint Financing Arrangement o f the donor-supported Partnership for General Budget Support also requires the executive to ensure fiscal neutrality b y transfemng new expenditure responsibilities to local government in l ine with the increase in the volume o f fiscal transfers to municipalities.
Fiscal issues must be a central topic o f concern in the new strategy.
107

Law, but is underutilized. Law No 40 (Art. 9) provides that Municipal governments may contract with other government actors to provide services assigned to municipalities; and they may celebrate contracts or s ign concessions to carry out services, while continuing their normative and oversight rolls.'22
5.53 A commonly-accepted argument for decentralization i s that by shifting the locus for government decision making closer to citizens, choices about the use o f public resources wil l be better aligned with locally-defined preferences. In moving the decentralization agenda forward, a process o f consultation and dialogue with mayors, AMUNIC, and c iv i l society organizations wil l be critical to encourage a consensus around a vision for municipal governments as key protagonists in Nicaragua's development. Decentralization can encourage citizen-centered development that includes concerted efforts to ameliorate poverty. 123
5.54 There are several areas where the World Bank and bi-lateral donors may be able to provide support for Nicaragua's ongoing decentralization process, should the government consider that support opportune. These areas include: (i) sharing international experience as the Ortega administration considers a detailed decentralization program, and comparative advantage o f each level o f government; (ii) carrying out costing exercises for specific competencies; (iii) benchmarking o f municipal capacities; and (iv) supporting programs to enhance the capability o f municipal governments to record, control and evaluate their expenditures.
L
122. a) Contratar con otras instituciones del Estado l a prestacion de servicios que por su naturaleza puedan ser realizados por ellas de una mejor forma, observando su correcta ejecucion; b) Celebrar contratos u otorgar concesiones previa l icitacion con personas naturales o juridicas, de caracter privado, para l a ejecucion de funciones o administracion de establecimientos o bienes que posea a cualquier titulo, s i n menoscabo de ejercer sus facultades normativas y de control. En ambos casos, 10s contratos y concesiones deberan ser otorgados de conformidad con l a Ley de Contrataciones del Estado, Municipalidades y Entes Descentralizados, ser ratificados por e l Concejo Municipal y asegurar l a calidad y equidad en l a prestacion del servicio. 123. Gasparini et. al. (2006) found there was n o strong desire among the municipal officials they interviewed to assume new responsibilities in key sectors - such as basic education and primary health care - that can have the greatest impact on poverty reduction.
L a w No 40 (Article 9): En e l ejercicio de su cornpetencia, 10s Municipios podran:
108

CHAPTER V I IMPROVING GOVERNANCE
THROUGH PUBLIC EXPENDITURE MANAGEMENT REFORM
6.1 This chapter assesses the overall performance o f public financial management (PFM) institutions and systems in Nicaragua, based on an international framework o f reference. I t begins with an overview o f the legal and institutional framework for public financial management in Nicaragua, and concludes with a review o f the progress made since 2004 in modernizing the PFM systems and discussion o f the most important shortcomings that remain.
A. The Legal and Institutional Framework of Public Financial Management
6.2 The legal instruments o f public financial management are set forth primari ly in the laws and regulations listed in Box 6.1. The legal framework was strengthened in a significant manner when the Financial Management and Budget Regime Law (Law 550 o f August o f 2005, as amended) came into effect. Law 550 governs the P F M system and procedures related to the formulation, approval, implementation, control, evaluation and execution o f the PGR and o f the budgets o f the public sector entities.
Box 6.1 Main Laws and Regulations of Public Financial Management The Polit ical Constitution o f 1987 (amended in 1995 and in 2000), in its Articles 112-115, sets forth the responsibilities o f the executive and legislative powers regarding the budget process and the creation o f taxes. In its Articles 154-157 establishes the Off ice o f the Controller General o f the Republic as the entity that governs the control system o f public administration.
The Financial Management and Budget Regime Management L a w (Law 550 o f 2005, as amended by L a w 565 o f 2005), governs the public financial management system and national budgets.
Each annual L a w o f the General Budget for the Republic (PGR) specifies the revenue and expenditure budgets (and the precise modifications that the National Assembly has included in the bill submitted by the executive power), the financing o f the deficit, and some specific rules that apply to the year in question.
The Ministry o f Finance and Public Credit (MHCP) issued every year Rules and Procedures o f Budget Implementation and Control, with detailed instructions for the implementing entities.
The State’s Public Contracting L a w (Law 323 o f 2000, as amended by L a w 349 o f 2000) sets forth the system o f procurement and public contracts.
The Public Debt General L a w (Law 477 o f 2003) regulates public indebtedness and guarantees.
The Organic L a w o f the Off ice o f the Controller General o f the Republic and the Government Control System (Decree 625 o f 1980, as amended by L a w 361 o f 2000) governs governmental audit and internal controls. The CGR issued Technical Internal Control Norms (NTCI) in 2004.
The L a w o n Organization, Competencies and Procedures o f the Executive Power (Law 290 o f 1998) governs the organizational framework o f the executive power.
The L a w on Budget Transfers to Municipalit ies (Law 466 o f 2003) sets forth the levels and the formula o f transfers f rom the PGR to the local governments.
The L a w o n the Munic ipa l Budget System (Law 376 o f 2001) contains the budget rules for the municipalities.
109

6.3 Institutional framework. Pursuant to the Constitution, the President o f the Republic formulates the Annual Bill o f Law o f the PGR, which must be submitted to the National Assembly to be discussed and approved. The Assembly can modify the Bill o f Law, but cannot create any extraordinary ex enditure if not by law and by means o f creating and f ix ing the resources to finance them.I2' The Assembly must be informed o f the execution o f the Annual Law o f the PGR.
6.4 Under the same Constitution, the budgets o f autonomous and government entities and State-owned enterprises are included in the Annual Law o f the PGR for information purposes. The budgets o f entities decentralized by function, enterprises and financial institutions o f the State, and other autonomous entities, are formulated, approved and executed according to their own laws. However, Law 550 introduced information requirements to the mentioned entities on their budgets, modifications and execution, with compliance linked to the receipt o f transfers financed by the PGR.
6.5 Municipalities (the country's political administrative division basic units) enjoy political, administrative and financial autonomy. Their financial management i s governed mainly by the Law on the Municipal Budget System (Law 376 o f 2001), which establishes that the Major i s responsible for drafting the Municipal Budget, and the approval thereof i s entrusted to the Municipal Council. O n the other hand, Law 550 sets forth information requirements similar to the other entities that do not form direct part o f the PGR (see preceding paragraph).
6.6 The governing body o f the country's public financial management system i s the Ministry o f Finance and Public Credit (MHCP), and to this end, it has four normative directorates for each o f the subsystems: budget, treasury, public credit and government accounting. As such, the MHCP is in charge o f implementing the financial management system in public sector institutions, formulating the budget pol icy and the annual laws o f the PGR, preparing rules and procedures to execute and control the budget, and issuing execution reports o f the PGR, amongst other responsibilities. Likewise, the MHCP governs the public procurement system.
6.7 According to Law 550, the MHCP i s in charge o f coordinating the annual budget formulation and the medium-term programming o f public investments, with the cooperation o f public sector entities and o f the National Public Investment System (SNIP). The SNIP encompasses the entities, mles and procedures for the formulation, implementation and evaluation o f the public investment program (PIP) and maintenance o f the investment project portfolio. According to Presidential Decree 61 o f 2001, the Office o f the Technical Secretary to the Presidency (SETEC) i s the agency in charge o f management, communication and coordination o f the SNIP, and to this end, i t has the support o f the Public Investment Unit (UP) and an inter-institutional Investment Technical Committee (CTI).'25 SETEC i s in charge o f L
124. A s with other laws, the President has the power to veto, partially o r totally, the Annual L a w o f the PGR approved by the Assembly, but the Assembly can reject the veto with the minimum vote o f h a l f plus one o f the deputies. 125. The CTI i s formed by representatives o f SETEC, the Central Bank o f Nicaragua (BCN), MHCP and the Secretariat o f Economic Affairs and Cooperation o f the Min is t ry o f Foreign Affairs (MINREX). It has the fol lowing responsibilities: (i) to assess the consistency o f projects proposed to the Budget by public institutions, against the projections on revenues and expenditures, and the anticipated availability o f external resources; (ii) to rat i fy and/or modi fy the technical recommendation issued by the specialists o f the U I P and submit t o the consideration o f SETEC the proposal o f the annual and multi-annual Public Investment Program; (iii) to review reports o f physical and financial monitoring o f projects under implementation; and (iv) to recommend intermediate and ex post evaluations for selected groups o f projects and report them to SETEC.
110

submitting the annual PIP to the economic cabinet and to the MHCP (to be incorporated into the PGR).
6.8 In accordance with the Constitution, the Office o f the Controller General o f the Republic (CGR) i s the autonomous agency that governs the system to control public management and to scrutinize Cfiscalizar) the goods and resources o f the State.’26 I t s scope o f operation comprises al l the public sector. Some o f i t s functions are the performance o f external audits (financial, compliance, operational, integral and special audits); evaluation o f internal audits; establishing rules o f internal control; setting liabilities (responsabilidades) o f an administrative (due to breaches to the legal provisions) and c iv i l (due to economic loss) nature, as we l l as criminal allegations; approving exceptions to mechanisms o f the Public Contracting Law; and the reception and verification o f asset declarations under the Integrity Law (Law 438 o f 2002).
6.9 The “National System o f Participation and Agreement” provides mechanisms for government, c iv i l society, private sector and the international community dialogue to define goals and priorities o f public policies, laws and strategic development plans. This system i s structured in three territorial levels (municipal, departmental and national) and in four areas o f governance (political-administrative, technical-executive, participation and agreement, and coordination o f c~operat ion) . ’~~ In connection to the subject-matter o f this report, the Economic and Social Planning Council (CONPES) has particular significance within the system.
6.10 The CONPES i s a consultative forum foreseen by the Constitution to support the President o f the Republic in the drafting o f economic and social plans. The President himself presides over the Council, which in turn i s formed by re resentatives o f civil, labor, entrepreneurial, guild, community and municipal organizations. Amongst its functions, the CONPES makes recommendations on the bill o f the Annual Law o f the PGR, the investment process and public expenditure. I t should be mentioned that the time span for the CONPES to review the budget before i t is submitted to the Assembly has been very limited and, when i t has made recommendations, these recommendations in general have not been implemented by the executive power or by the National Assembly.’29 The executive, in turn, has questioned the feasibility o f implementing said recommendations. Even so, the existing institutional mechanism that allows for the described communications i s a positive attribute o f the system o f participation.
6.11 Financial Manazement System. The Nicaraguan system i s based o n normative centralization and operational decentralization, with integration o f the system components. The subsystems regulated under Law 550 are those on budget, treasury, public credit and government accounting. The “correlated systems” linked to the financial management system are those regarding contract management, c iv i l service and administrative career, administration o f goods, and the SNIP.
L
126. 5 years. 127. 128. 129. CISAS (2005).
The CGR is managed by a Superior Counci l o f f ive members, elected by the National Assembly for a term o f
Government o f the Republic o f Nicaragua (2005). In January o f 2006, approximately 75 representatives formed the CONPES.
111

6.12 For the purposes described, the main facilitating instrument has been the Financial Management and Auditing Integrated System ( S I G F A ) ' 3 0 ~ h i ~ h constitutes the information system for processing transactions o f the budget cycle and al l correlated factors (rules, processes, training, technological platform, reports, etc.). SIGFA enhances budget management at different levels: (i) it contributes to fiscal discipline by providing timely information on the implementation o f the budget, and establishing limits to the level o f expenditures, according to budget and cash programming; (ii) it increases operational efficiency by streamlining and standardizing processes; (3) it supports internal and external controls through safeguard processes and audit trails; and (iv) it contributes to transparency by allowing the timely publication o f budget execution and other fiscal reports.
6.13 However, the potential o f the benefits mentioned above depends upon the coverage o f the system or its linkages with other systems in place. To this effect, SIGFA permits recording o f all revenues and expenditures o f the PGR, but at the level o f individual transactions i t basically covers the central administration. The transfers from the PGR to other entities o f the public sector are made mostly through other systems o f execution, treasury and accounting. And the coverage o f correlated systems (procurement, c iv i l service and others) i s even smaller. A s it i s normal in the implementation o f information systems, the extension o f the coverage (both in technical modules and institutions) i s supposed to happen gradually, and the M H C P i s moving in that direction.
6.14 In 2005, the Government o f Nicaragua presented the National Development Plan 2006-201 0,13' as a second generation Poverty Reduction Strategy Paper (PRSP). The PND i s based on the PRSP, but highlights economic activities and the increase o f employment, whereas the PRSP focused more in the measures to improve social indicators . 6.15 The PND focuses on four strategic areas: (i) economic growth to reduce poverty; (ii) development o f human capital and social protection; (iii) productive, social and public infrastructure; and (iv) governance and State reform. The P N D is formulated within a medium- term macro framework where sensible economic policies, including fiscal discipline, would aid in supporting an improvement o f the key indicators: growth would reach an annual average o f 4.3 percent in the period 2005-09, whereas inflation would gradually decrease approximately 3 percent per year. The PND is the product o f an extensive consultation at local and sector levels, described by the Government as a participatory formulation process.
6.16 The donors have expressed their support to the PND, and have made important gains in harmonizing external assistance. This progress includes the signature with the Government o f Nicaragua in M a y o f 2005, o f the Joint Financing Arrangement (JFA) to Support the General Budget,13* which includes a Performance Assessment Matrix (PAM) with detailed commitments made by the Government in connection to policies and indicators consistent with the PND. L
130. The SIGFA integrates budget formulation units (SIGFAFOR), o f budget expenditures implementation (SIEP), o f f iscal payroll (SNF), of revenues budget implementation (SIER), o f accounting (SICO) and o f treasury (SITE). The automatic l i n k s with other systems are still being developed: procurement and state contracting (SICCE), civil service (SISEC), properties of the public sector (SIBE), public debt (SIGADE) and public investment (SNIP). 13 1. 132. Netherlands, DFID, Sweden, Switzerland, the European Commission and the World Bank.
National Development Plan.
Government of the Republic o f Nicaragua (2005). The Budget Support Group (BSG) that subscribed the JFA i s formed by Germany, Finland, Norway, The
112

6.17 Under the area o f governance and State reform, the PND foresees the continuation o f improvements in public financial management (PFM), including mechanisms to implement and monitor poverty reduction expenditure. The specific strengthening areas were classified under: (i) financial management; (ii) formulation, implementation and monitoring o f fiscal policies; (iii) technical management o f the Government; and (iv) planning and participatory monitoring o f public policies (see Box 6.2).
6.18 The incoming authorities have indicated that they are determined to take ownership o f the reform and development agenda, and would l ike to see a more focused and feasible policy/actions matrix agreed upon for performance monitoring. In this context, they are planning to review and revise the longer term development strategies identified in the National Development Plan in order to better reflect the new administration’s development priorities. These revisions will be reflected in the next PRSP Progress Report.
Box 6.2 National Development Plan Herein are the ma in reforms contained in the National Development Plan for the period 2006-2010 that relate directly to public sector financial management.
T o strengthen financial management: i) to consolidate and extend the integrated financial management system throughout a l l levels o f the Government, including universities, autonomous entities, decentralized entities and State-owned enterprises; ii) to channel and register a l l funds f r o m donors to publ ic sector entities in the Single Treasury Account (CUT), in coordination with the signatory agencies o f the Government o f Nicaragua and providers o f external assistance; and iii) the standard procurement and contracting documents wil l b e used by a l l agencies o f the central Government, 42 municipalities, 16 autonomous agencies and other institutions.
To strengthen the formulation, implementation and monitoring of fiscal policies: i) to review pension reform to reduce fiscal impact; ii) to reform the legal framework for parametric aspects o f the social security system; iii) to approve and keep in effect (a) a Tax Code providing for a system o f fines and penalties, and specific powers to obtain and manage third-party information and (b) a Customs L a w consistent with the Tax Code and the Central American Customs Code (UAC); iv) to approve and regulate the Administrative Career L a w o f the revenue and customs directorates (DGI and DGA) consistent with the Civil Service Law, and to set forth a n e w customs technological system, including outsourcing, equipment and communications; v) to approve the Financial Management L a w according t o good international practices; vi) to enact legal framework to prevent excessive fiscal deficits, the adoption o f stable fiscal policies and the international accounting standards o f the public sector through this l a w and related laws; and vii) gradual formulation o f the medium-term budget framework.
To improve the productivity o f the technical executive management of the Government: i) to implement the Civil Service, incorporating 5,000 employees in 2007 to the Administrative Career based o n transparent procedures; ii) to update L a w 290 in order to provide the Executive Branch a more expeditious and fimctional organization, according to the PND.
To strengthen the planning and participatory monitoring of public policies with the fol lowing actions: i) improving the coordination amongst providers o f external assistance; ii) strengthening the National Public Investment System; iii) strengthening and disseminating the system to evaluate and monitor public policies; iv) strengthening coordination capacities o n communication and civic participation; and v) strengthening Departmental and Territorial Cabinets, increasing their decision-making powers.
Source: Government o f the Republic o f Nicaragua (2005).
6.19 Allocation of resources. Nicaragua has made progress in the implementation o f i t s poverty reduction strategy (PRSP).*33 Since adoption o f the PRSP in 2001, central government expenditure in poverty reduction increased from 10.4 percent o f GDP in 2002 to 12.3 percent o f L
133. IMF and W o r l d Bank (2006).
113

GDP in 2004 and 2005. Even though progress has been made, i t seems that budget programming needs to get in l ine with the goals o f the PND. Recent efforts to establish a medium-term expenditure framework and to improve the harmonization o f external assistance go in that direction. Future refinement o f the medium-term fiscal pol icy framework should help to improve the connections between budget programming and PND goals. However, these efforts are l imited due to significant earmarked budget allocations (see Section B), which, if not reduced, could limit the scope for improvements in the targeting o f programs to rel ief poverty.
B. Performance of Systems, Processes and Institutions
6.20 This section assesses the essential elements o f the public financial management (PFM) system, based on an international framework o f reference that addresses seven dimensions: i) credibility o f the budget; (ii) comprehensiveness and transparency; (iii) budget planning; (iv) predictability and control in budget execution; (v) accounting, recording and reporting; (vi) external scrutiny and audit; and (vii) donor practices that affect PFM.'34
Credibility of the Budget 6.2 1 Some parameters may indicate whether the budget i s realistic enough and implemented as planned. To that effect, this section focuses on four indicators: (i) aggregate expenditure out-turn, (ii) composition o f expenditure out-tum, (iii) aggregate revenue out-turn, and (iv) stock o f payment arrears.
6.22 Expenditures. The capacity to implement the budgeted expenditures within the total amounts originally anticipated i s a key factor in the capacity o f the government to maintain fiscal discipline. As shown in Table 6.1, recent performance in
Table 6.1: Deviation in Expenditure Budget Execution and Variance in Composition of Primary Expenditure (percentage o f the expenditure originally budgeted)
2003 2004 2005 Total expenditure deviation 9.2 1.9 16.2
projects (a) Absolute variance in composition (b) 5.0 6.4 10.4
Source: Own estimates. based o n MHCP.
Deviation in primary expenditure, net o f 4.1 5.2 10.2
Difference (b)-( a) 0.9 1.2 0.2
this regard has been reasonable: o f the three years reviewed, only in 2005 did the primary expenditure (not including projects with external financing) exceed the initial budget over 10 percent. In terms o f total expenditures, the deviations are generally greater, which is explained by the over-execution o f revenues derived from taxes (as explained herein below) and from loans and grants.'35
6.23 Composition of expenditures. Credibility o f the budget can also be assessed by the extent to which the entities receive the resources init ial ly planned. As shown in Table 6.1, in none o f
L
134. This assessment i s based primari ly o n P F M performance measurement analytics undertaken through a partnership of the Government of Nicaragua with the British Department for International Development (DFID), the European Commission (EC), the Inter-American Development Bank, and the Wor ld Bank. The performance measurement framework was developed by the Public Expenditure and Financial Accountabil ity (PEFA) partnership. 135. In 2004, the deviation in total expenditure was smaller than the deviation in primary expenditure (net o f projects) due to the significant reduction in interest spending when the HIPC completion point was reached.
114

the three years reviewed did the variance in composition o f primary e ~ p e n d i t u r e ' ~ ~ exceed a total deviation o f over 2 percent. This basically means that, setting aside the effect o f deviations from the total expenditure that affects a l l entities, the latter do not show significant changes in execution o f their expenditures with respect to the amounts originally allocated.
6.24 Revenues. The comparison between budgeted and executed receipts may give a general indication on the quality o f revenue planning. As can be seen in Table 6.2, recent performance has been good in terms o f availability o f funding: in none o f the three years reviewed did actual internal collections fall below the budgeted amounts. On the other hand, i t is clear that the forecasts have been consistently conservative, which may point at weaknesses in the preparation o f the projections reflected in the revenue budget.'37
Table 6.2 Aggregate Internal Revenue Execution (percentage o f the revenue originally budgeted)
2003 2004 2005 Tax revenues 105.8 109.9 110.9 Non-tax revenues 120.7 168.5 98.6 Total 106.8 113.2 109.9
Source: Own estimates, based o n MHCP.
6.25 Payment arrears. The identification and control o f payment arrears has great importance, because they can constitute a form o f non-transparent financing that would affect credibility in budget information -and the cost o f doing businesses with the government-. As shown in Table 6.3, the levels o f floating debt recorded at the closing o f three recent fiscal years are minimal (less than 1 percent o f total expenditure^),'^' and it is inferred that payment arrears would be even less. However, i t must be noted that: (i) no subsidiary records o f accounts payable with age profiles are produced; and (ii) transfers and subsidies o f the PGR to other entities o f the public sector are recorded simultaneously as accrued and paid when the transfers are made (as opposed to when the expenditures financed by the transfers are actually incurred).
Table 6.3 Recorded Floating Debt (percentage o f accrued expenditure)
2003 2004 2005 Accrued disbursements not Daid 0.1 0.3 0.3 at the closing o f the fiscal year
Source: MHCP.
6.26 Conclusions. I n order for the budget to be a tool for policy implementation, i t is necessary that i t is realistic and implemented as passed.
6.27 From 2003-2005, expenditure execution usually exceeded the amounts budgeted, posing a fiscal discipline risk. However, this r isk did not materialize because the over-execution o f L
136. The variance in composition o f primary expenditure (net o f projects) i s calculated as the absolute weighted average deviation between the executed and original budgets, as percentage o f the latter, o n the basis o f the administrative classification (20 budget entities). 137. Anecdotal reference points to the perverse incentive created by the high level o f earmarked funds estimated as percentage o f the budget (see Chapter I). 138. Also, L a w 550 imposes a maximum limit to floating debt, equivalent to 5 percent o f current revenues f r o m January to November o f the fiscal year.
115

expenditures corresponded mainly to domestic revenues, grants and concessional loans that also exceeded budget forecasts. Even when in both cases budget credibility was affected, i t should be noted that their effects were distributed in a relatively uniform manner among the different implementing entities, and there are no significant concerns on payment arrears.
6.28 The credibility o f the budget i s a critical feature o f the ability o f the government to control fiscal discipline and prevent shortcomings in the financing o f sectoral budgets. It i s expected that with the recent enactment o f the Financial Management and Budget Regime Law (Law 550), which sets forth strict limits to budget modifications, budget outcomes will increase the reliability o f the budget as policy tool.
Comprehensiveness and Transparency
6.29 This section examines budget comprehensiveness and the oversight o f aggregate fiscal risk, as well as public access to fiscal and budget information.
6.30 Budget Classification. A strong classification system is required for meaningful public expenditure monitoring. The system used in Nicaragua for formulation, execution and reporting is based in four main budget classifications: administrative (institutional), economic (per type o f expenditure), per source o f financing, and p r~g ra rnmat i c . ' ~~ The classification system can produce information that approximates international standards, e.g., the programs have certain similarity to functional groups under GFSM/COFOG.'40
6.31 As is wel l known, a main issue in the application o f the system i s the incorporation o f expenditures o f a current nature into investment projects classified fully as capital expenditures. In this subject matter, the rules and their application are being revised.
6.32 Budget Documentation. In order for the legislative branch to execute i t s functions o f oversight and approval, budget documentation should allow a comprehensive vision o f fiscal projections, budget proposals and the outcomes o f preceding years. L a w 550 establishes that the following budget documentation is to be submitted to the National Assembly: (i) the bill o f law, including general provisions, the revenue budget, the expenditure budget and the annexes thereto; (ii) the introductory message to the bill o f law, including the list o f objectives, estimates, statistics, macroeconomic context, projections, assumptions and other information used to prepare the budget; and (iii) the medium-term budget framework.
6.33 Apart from the detailed information on revenues and expenditures, some selective characteristics o f the budget documentation are described herein:I4'
macroeconomic assumptions include inter alia estimates o f growth, inflation and exchange rate; . the estimate on fiscal deficit describes the anticipated composition o f its financing; but not the details on debt stock and financial assets;
L
139. The classifications also al low for aggregation by general fimctions and other specific purposes, e.g., expenditures related to the poverty reduction strategy. 140. For purposes o f t h i s report, the international standard for classification systems i s the Government Finance Statistics Manual (GFSM) issued by the IMF, which incorporates the Classification o f the Functions o f Government (COFOG) supported by the UN. In Nicaragua, fiscal statistics are based on G F S M 1986. 141. The l i s t makes reference to budget documentation per se, o n the basis o f the 2006 budget. As i s usual in very country, the M H C P manages additional information to prepare the budget.
116

. even though i t i s not part o f the budget documentation per se, the information o n budget outturn o f the preceding period i s available through the respective execution report; conversely, the budget documentation does not include budget figures for the current year (modified or estimated) in the same format as the proposal; . summarized budget data on revenue and expenditure, for the current (estimated) and prior years, i s included for the main classifications used. . the budget implications o f main new policies are discussed, albeit in a very general manner.
6.34 Coverage of government overations. Fiscal information (understood as the budget, the execution reports and the financial statements) should include al l budget and extra-budget activities to allow a complete picture o f public revenues, expenditures and financing. To this effect, Law 550 requires an extensive coverage o f budget documentation, which must include the General Budget for the Republic (the PGR includes the three branches o f government and the constitutional entities) and the budgets o f decentralized entities, enterprises and financial institutions o f the State, and other autonomous agencies dependent upon the PGR. The documentation meets to a great extent with this provision, with some exception^.'^^ 6.35 However, the annual budget execution report for 2005 covered only the PGR (including transfers to other entities, but not in their revenues).143 And, as noted later in the chapter, the public sector financial statements have not been issued yet. On the other hand, budgets and execution reports do include ample information on projects financed by providers o f external assistance, even though i t i s possible that some minor grants st i l l escape the system.'44
6.36 Intergovernmental fiscal relations. Even though this report focuses o n the financial management o f the central government, i t i s worth analyzing three critical elements o f intergovernmental fiscal relations: the transparency o f rules for the horizontal allocation among sub-national governments o f transfers from the central government, the timeliness o f provision o f information to local governments for their planning processes, and the gathering o f budget data to allow the preparation o f consolidated fiscal information for the general government. As explained below, the Nicaraguan system performs inadequately in al l three aspects; see also para. 9.26.
6.37 First, while the Law on Budget Transfers to Municipalities (Law No. 466 o f 2003) provides for a formula to distribute the annual transfer to municipalities, the formula i s known to be too complex, and no significant efforts have been made to disclose better i ts application for
L
142. An outstanding absence in the 2006 budget documentation i s that o f the budgets for universities and centers o f higher technical education. The transfers f rom the PGR to these entities represented 4.3% o f the consolidated expenditure budget o f the public sector in 2006, but since there i s n o information available o n their own revenues, the percentage that escapes f rom the budget documentation cannot be measured accurately. 143. According to the budget documentation o f 2006, revenues o f decentralized entities by function and other autonomous agencies (except universities) -that are not transfers f r o m the central government- amount to C$4,877 m i l l i on (most o f them corresponding to contributions to the Nicaraguan Social Security Institute), i.e. approximately 23 percent o f central government revenues. 144. For purposes o f this report, the concept o f in-kind grants -which comprise assistance granted through direct administration by the cooperating agencies or by agreement between these agencies and non-government organizations (NG0s)- i s not covered in th is section.
117

the benefit o f oversight from c iv i l society and the beneficiaries themselves. On the other hand, the law does not devolve to municipalities the expenditure responsibilities consistent with the increase o f revenue that the same law sets forth. Therefore, a situation has arisen where, notwithstanding the existence o f the formula, the central government continues to implement local expenditures with an unclear division o f re~ponsib i l i t ies . ’~~
6.38 Second, the information on transfers to municipalities i s made available to them on October the 15th o f every year, date on which the PGR i s submitted to the National Assembly. However, since this date coincides with that o f submitting sub-national budgets to Municipal Councils, local governments are not able to introduce modifications at this stage.
6.39 Finally, Law 550 introduces requirements for the municipalities to provide data on their budgets and execution to the MHCP through the Nicaraguan Institute o f Municipal Development (INIFOM), in order to allow general government budget consolidation. But the latter has not been carried out. It should be noted, though, that the 2007 budget norms link transfers to municipalities to previous reporting on execution through a compilation platform (TRANSMUNI).
6.40 Oversight of aggregate fiscal risk. In general, the central government should monitor and take timely actions regarding the fiscal risks with national implications that could arise from the activities o f sub-national governments, autonomous government agencies and public enterprises. In this area, recent legislation (Law 550) imposes information requirements for quarterly and annual budget execution, as wel l as annual financial statements, to decentralized agencies, state- owned enterprises, other autonomous agencies dependent upon the PGR, and municipalities. The implementation o f mechanisms to facilitate compliance with these requirements i s underway, albeit not yet reaching the point where overall fiscal position and r isks are consolidated and monitored systematically.
6.41 Public access to key fiscal information. Law 550 requires that the general and sector budgets, as well as the monitoring reports should be put at the disposition o f citizens through information and communication media available, at the latest fifteen days after their issuance. An important medium that has been recently used by the MHCP to disseminate such information i s the Citizen Access Portal k), where the budget documentation, the in-year execution reports and the annual execution reports o f the PGR are published. Notwithstanding o f these advances, some critical information i s not yet easily available to the public.
6.42 To start with, the public sector financial statements have not been published yet. Second, the Office o f the Controller General (CGR) has not yet finalized an audit on the PGR execution report. Third, the information on tender processes and public contracting is fragmented, with each public institution handling award data without necessarily or obligatorily communicating them to the Contracting Directorate o f the MHCP, which makes i t difficult for the public to have access to the pertinent information. This situation is being gradually addressed through the State’s Procurement and Public Contracts Integrated System (SICCE). Finally, the information on resources available to primary service units i s scarce and uneven amongst different sectors, although certain aggregated information i s available at the central level.
L
145. See a detailed discussion o f this subject in World Bank and IMF (2004).
118

6.43 Conclusions. Comprehensiveness of budget is necessary to ensure that all activities and operations of governments are taking place within the government fiscal policy framework, and are subject to adequate budget management and reporting arrangements. Transparency is an important element that enables external scrutiny of government policies and programs and their implementation.
6.44 The budget information in Nicaragua i s ample, based on a good classification system,’46 and has a comprehensive institutional coverage as far as the budget document per se i s concerned. But that is not the case with the execution reports which, up to now, include only the General Budget o f the Republic (PGR) and not the execution o f revenues from the rest o f the central government. At the same time, public access to information i s l imited due to the absence o f certain key information (financial statements, audit reports, reports o f resources received by service-delivery units, and comprehensive publication o f procurement and contracting processes). Likewise, the l imited transparency o f the fiscal decentralization system and the difficulty o f monitoring the aggregate fiscal risk o f the public sector are areas in need o f improvement.
6.45 The ability o f the government to control aggregate fiscal discipline o f the public sector could be affected if fiscal neutrality o f transfers to municipalities i s not attained, and if the mechanisms to compile and consolidate al l public finances are not implemented. On the other hand, the scrutiny on the government’s financial management -a key element to improve the strategic allocation and operational efficiency o f the use o f funds- i s l imited in view o f the absence in the public domain o f the aforementioned key information.
6.46 In the short term, improvements can be expected with the preparation o f execution reports for al l budgets and o f financial statements (both are requirements stipulated by L a w 550), the revision o f rules and their application vis-a-vis current expenditures in investment projects, the implementation o f transparency in procurement through the State’s Procurement and Public Contracts Integrated System (SICCE), and the publication o f customized financial information on resources received and used by service-delivery units, particularly in the education and health sectors. To the extent that decentralized entities (by function and territory) comply with the requirements o f Law 550 on provision o f information, the monitoring o f aggregate fiscal r isk wil l be facilitated, although the creation o f capacity in the M H C P to carry out this task may possibly take more time. Finally, i t i s wel l known that subjecting further decentralization progress to a framework o f fiscal neutrality i s both critical and urgent.
Budget Planning 6.47 This section discusses the process o f budget formulation, based o n two principles: (i) an orderly and effective participation in the formulation process by the implementing entities and the pertinent authorities impacts the extent to which the budget will reflect macroeconomic, fiscal and sector policies; and (ii) due to its multi-annual implications, decisions on expenditure pol icy should be in l ine with the medium-term availability o f resources and sector strategies.
6.48 Annual budget formulation. The M H C P prepares a clear annual calendar that is generally observed by the entities. According to the schedule, and as required by L a w 550, the M H C P distributes the budget policy to the implementing entities by M a y 30 o f each year, allowing the entities at least six weeks to prepare their preliminary budget drafts. The budget pol icy includes L
146. Albeit not convergent with GFSM 2001.
119

the ceilings approved by the Cabinet. The formulation process is duly regulated, allowing adequate participation by the sectoral entities, even though flexibility i s limited basically to the capital budget. With the more rigorous process for budget modifications (addressed later in this report) introduced by Law 550, the implementing entities that were accustomed to simpler mechanisms to modify their budgets during the year, found themselves in need to strengthen significantly their budget formulation capacity.
6.49 According to Law 550, the National Assembly should receive the bill o f annual law o f the PGR by October 15 o f each year, and has until December 15 to consider and approve i t - with or without modifications. As with other laws, the executive has the capacity to veto, either totally or partially, the amendments proposed by the legi~lature. '~' In case the budget i s not approved within the legal schedule, the project submitted by the executive takes effect until the budget law for the fiscal year i s approved. For the three years reviewed (2004-2006), the Assembly approved the budget in a timely fashion, but for fiscal year 2005 i t was enacted after the beginning o f the fiscal year due to the veto introduced by the President on the basis o f fiscal risk concerns.
6.50 Multi-year ,vers,vective. Law 550 introduced the Medium-Term Budget Framework (MPMP), which must contain at least an estimate o f revenues, expenditures, physical and production goals, program o f public investments, programming o f external disbursements, loans and grants, evolution o f public debt, and a description o f budget policies and criteria that support the MPMP.
6.51 The budget documentation o f 2006 included the MPMP for the first time, as part o f a strategy that reasonably anticipated its development by stages. Thus, the Medium-Term Fiscal Framework (MFMP) and the MPMP were prepared using projections o f main aggregates as basis, against Medium-Term Sector Expenditure Framework (MGSMP) that started with three pi lot institutions (ministries o f education, health and transport) for the 2006 budget and was extended to other entities that form part o f the PGR for the 2007 budget. The same Law 550 provides for transitional arrangements to gradually implement the M P M P throughout three years after the law entered into force, i.e. until 2008.
6.52 The MFMP, which in turn i s founded on the Economic and Financial Program (PEFPRGF), includes the projections o f fiscal aggregates based on macro categories o f receipts and payments. The systematic l i n k s between the MFMP and the annual budgets cannot be assessed yet due to the recent implementation o f the instrument.
6.53 The MGSMP includes current and capital expenditures for the entities that form part o f the PGR, and the aggregates are consistent with those o f the MFMP. However, there is l i t t le evidence, e.g. in costed sectoral strategies, as to the process o f pol icy assessment and reconciliation between the top-down and bottom-up multi-year planning. Still, i t i s worth mentioning that certain costing exercises have been developed (e.g., in education and health care), which -subject to continuous quality enhancement- wil l provide greater support to the MGSMP.
6.54 As noted in the previous chapter, important progress has been made in the institutionalization o f the Investment Technical Committee functions and o f the National Public Investment System (SNIP), which currently has an ample coverage in the central administration. The Public Investment Program (PIP) i s part o f the MPMP, and recent years have witnessed L
147. See footnote No. 1.
120

significantly increasing compliance in securing ex-ante technical approvals f rom the Public Investment Unit (UP), as wel l as in recording public investment projects in the off icial portfolio (banco). And, in l ine with the development o f the MPMP, investment decisions are slowly but increasingly made in the context o f sectoral strategies.
6.55 Conversely, the analyses and documentation o f implications o f the PIP o n future recurrent expenditures are s t i l l incipient. The same can be said with regards to the internal capacity to monitor and evaluate PIP implementation, a function performed primari ly by providers o f external assistance with regards to their financed activities.
6.56 “Results-based budgeting”. In the context o f implementation o f L a w 550, more formal attempts have been made to project and include in budget documentation goals and indicators per program financed by the budget, with an emphasis in education, health and transport sectors. As i s normal in the introduction o f this type o f instruments, the f i rst set o f indicators deal fundamentally with figures on coverage. As in the case o f medium-term budgeting, the first efforts are worthy but a natural progression i s envisioned and required.
6.57 The set o f indicators by program could progressively reach a customized, yet manageable, mix o f dimensions (e.g., effectiveness, efficiency, quality) and scopes (e.g., process, outputs, outcomes). Similarly, the sophistication o f cost accounting systems to calculate unit standards and measure the marginal cost o f changes in performance could be gradually built. Credibility o f the new practices should rely on a formal program monitoring process that informs budget ceilings and allocations for upcoming years. In the longer term, introduction o f incentives documented in performance agreements is an option to be considered.
6.58 Earmarked fundina. Inevitably, efforts to enhance budget planning and programming are restricted by earmarked allocations mandated by the Constitution and laws. A s part o f the total expenditure, at least 6 percent must be allocated to public universities and 4 percent to the Supreme Court o f Justice. And as part o f the revenues, 6 percent was allocated in 2006 to municipalities, a figure that according to current legislation must increase at least 0.5 percent per year until reaching 10 per~ent).’~’ There are other minor mandated allocations, as wel l as miscellaneous fees and charges (rentas con destino especifco) that the entities can claim for their own use. Altogether, legally earmarked funds can amount to around 19 percent o f primary expenditures (Table 6.4).
Table 6.4: Legally Earmarked Funds (percentage of primary expenditures)
2006 Budget Universities 6.1
Supreme Court o f Justice 4.0
Entities’ “own funds” 2.7 Total 18.8
Municipal transfers 4.9
Other legal allocations 1.1
Source: (2006 budget documentation).
6.59 of resources in line with its fiscal policy and national strategy. L
148. municipalities are not fiscally neutral (IMF and World Bank, 2006).
Conclusions. A policy-based budgeting process enables the government to plan the use
The finds allocated to universities have shown to favor mostly the non-poor, while the funds allocated to
121

6.60 The annual formulation o f the budget i s made in an orderly fashion, with due participation o f the implementing entities, notwithstanding the small margin -because o f earmarked funds and "fixed" expenditures- for flexibility. Institutionalization o f the national public investment system (SNIP) i s growing, particularly at the pre-investment assessment stage, but monitoring and evaluation remain weak. As for the medium term budget framework, the steps are recent but relevant. The framework has a clear legal basis, and the M H C P has an adequate strategy in place to implement this new instrument in stages. *49
6.61 In the short to medium term, the capacity to prepare or refine costed sectoral strategic plans needs to be developed for reconciliation o f the top-down and bottom-up multi-year budget planning. The public investment program (PIP) should be based on those plans, with due consideration to recurrent cost implications. Once they are comprehensively implemented, the elements that compose the medium term framework, i.e. the fiscal framework and the sectoral expenditure framework, wil l reduce fiscal r isks and provide informative elements that wil l increase the quality and consistency o f decisions on the strategic allocation o f resources.
6.62 The effort to incorporate results elements in the budgeting process i s incipient and l imited by budget rigidities. Basic goals and budget indicators have been developed, but the accountability framework has not. Enhancements to the dimensions and scope o f indicators, and to the capacity to measure the marginal cost o f changes in performance, should be progressively built. 6.63 As is expected from such a significant overhaul o f the budget system, which should be gradually implemented over the medium and long term, there are capacity gaps in executing entities and in the MHCP that need to be addressed. And, inevitably, any effort to modernize budget planning and programming will be limited to the extent that significant legally earmarked budget allocations remain.
Predictability and control in budget execution
6.64 This section analyzes selective elements o f the budget execution systems, with an emphasis on management o f treasury and debt, and internal controls.
6.65 Availability of funds for expenditures. Planning, monitoring and management o f cash flows and balances are essential to support budget execution and prevent unnecessary financing costs. The Treasury Directorate o f the MHCP prepares an annual f low o f funds that comprises funds from the Treasury and external resources for budget support. The f l ow o f funds i s updated on a quarterly basis on the basis o f information provided by the tax collection, public credit and budget entities, and on a weekly basis according to the f low observed. These processes are, however, kept in information systems parallel to the Integrated Financial Management System (implementation o f SIGFA's financial programming module has been long overdue).
6.66 In relation to the certainty on availability o f funds to implementing entities, the f i rs t parameter i s the PGR, which sets forth the maximum limits to be spent per agency, source o f financing, and personnel expenditures. Expenditures cannot be executed in absence o f budget credits, which in turn are subject to quotas o f quarterly commitments and o f monthly accruals. These quotas affect the levels o f program, subprogram, project, group o f expenditure, and source o f financing, and are incorporated into SIGFA as soon as they are approved by the Budget Directorate o f the MHCP. L
149. MHCP (2005).
122

6.67 While the quarterly commitment quotas provide a reasonable certainty to entities to implement their expenditures, in practice their reliability could be affected by some operating problems in the issuance o f payments. The main problem affects investment projects with accounts in foreign currency, because: (i) the mechanism o f direct payment (i.e., f rom the Treasury to the supplier) i s executed “manually” between the Treasury and the Central Bank (BCN), resulting in transaction processing times significantly greater than other types o f payment; and (ii) the alternative mechanism o f payments through rotating h n d s i s l imited to a global 5 percent o f the budget for certain l ines o f expenditure, and a maximum o f C$20,000 per individual payment. In principle, the global limit for payments through rotating funds i s sound, as long as it is complemented by a functional system o f direct payments. But if the latter fails, there wil l necessarily be delays that affect the flexibility o f the entities to execute.
6.68 On the other hand, in sectors such as education and health that execute a large numbers o f small payments to or through service units spread across the country, the f low o f fund model i s in need o f customization in order to better the balance between efficiency and control.
6.69 The modifications to the budget during the year are additional factors that can affect the availability o f funds for execution. During the review period, modifications at the aggregate level have been significant (see Table 6.5), but these have increased -not diminished- the expenditure. As noted earlier, the increments were a consequence o f internal revenues that exceeded the amount budgeted (see Table 6.2 above) and o f automatic budget additions for under loans and grants for Therefore, the budget modifications, at least until 2005, did not bear a negative impact on the funds available for the entities (see Table 6.1 above).
Table 6.5 In-year Expenditure Budget Modifications (in percentage o f the total budget)
2003 2004 2005 PGR: Total, net 17.1 11.1 24.5
Source: Own estimates, based on MHCP.
6.70 Cash management, debt and guarantee records. Law 550 sets forth the principle o f centralization o f revenues and expenditures on the basis o f the Treasury Accounts System, which includes the Single Treasury Account (CUT), collection, payment and “mixed” accounts (external grants and loans). Operation o f the system allows estimating and consolidating most central government cash balances on a daily excluding rotating funds. The latter can be calculated periodically through the Implementing Units Integrated System (SIUE) or the Project Financial Management Integrated System (SIGFAPRO), but these processes are not run on a daily basis and not al l the entities use the SIUE.
6.71 The quality o f records and reports i s key to assure proper budgeting and timely payments o f debt service. In Nicaragua, the responsibility to maintain public debt databases i s shared by MHCP’s Directorate o f Public Credit (central government internal debt) and the B C N (external
L
150. 151. collecting entities have not recorded and transfened o n a t imely basis.
These automatic additions are n o longer allowed since the enactment o f L a w 550. In the context o f i t s reviews, the CGR has identif ied some “own funds” (rentas con destino especifico) that
123

debt).'52 MHCP records are seemingly complete for the central government, but not for public enterprises and municipalities. The M H C P and the B C N joint ly issue comprehensive information on a quarterly and annual basis -), usually within the next quarter fol lowing the period reported. This information includes internal and external debt, composition per debtor and creditor and per instrument and maturity, debt service, emissions and disbursements, and solvency indicators.
6.72 The legal framework to contract public debt and issue guarantees i s clearly defined in the Public Debt General Law (Law 447 o f 2003), which, inter alia, demands the annual preparation o f the Public Debt Policy (Presidential Decree). The Policy i s prepared by the M H C P o n the basis o f the Economic and Financial Program (PEF), and establishes the maximum l imits for annual contracting and net debt, the general concessional terms for external loans, the maximum rate allowed for internal loans, and the maximum amount o f contingent liabilities (guarantees) to be subscribed. According to the Law, contracting o f debt and issuance o f guarantees are valid only with the authorization o f the MHCP, even though the permanent registry o f guarantees i s s t i l l to be implemented.
6.73 Pavroll controls. MHCP's Directorate o f Public Administration (Funcidn Publica) administers the Fiscal Payroll System (SNF), which allows direct and timely linkages between the payroll and the personnel database. The latter is fed by each government entity, which in turn keeps the individual files. The authority to introduce changes in the databases i s l imited to authorized officers o f each entity, and the SNF keeps a logbook o f said changes.
6.74 However, in early 2006 the S N F covered only about ha l f o f public servants (some 52,000 employees o f 27 institutions). The rest o f the payroll is managed through unconnected individual systems that prevent, for example, to know with accuracy and timeliness the total number o f public servants and to have a general overview o f payroll preparation practices. Likewise, no payroll-specific audits are conducted systematically -when made, these are performed on an ad hoc basis in each entity.'53
6.75 Procurement controls.'54 The State's Public Contracting Law (Law 323 o f 2000, as amended) promotes competitive processes, establishes ceilings for three types o f tenders (public, by registration, and restricted) and for the use o f quotations, and describes the exception mechanisms. However, there is currently no information system that permits gathering and producing aggregate data on the number and amount o f processes under each o f the cited methods. The recent worthy introduction o f the Public Procurement and Contracting System (SICCE) aims at, among other objectives, filling the cited gap.
6.76 The Office o f the Controller General (CGR) authorizes the exceptions to the established procedures. The exceptions are presumably made according to the law ("for reasons o f urgency, safety or other reasons o f public interest", by means o f a justified petition). The CGR publishes
L
152. The BCN keeps it database in the Debt Management Financial and Analysis System ( D M F A S E I G A D E ) developed by U N C T A D . The M H C P uses i t s own system, and partially the D F M A S . Reports are shared between the two entities. 153. In the context o f i t s budget reviews, the CGR has identif ied certain deficiencies in personnel management, such as supplemental financing with donor funding to staff o n fiscal payroll, and weaknesses in management o f pa id leave and staff loans. 154. This report covers only some selective aspects o f government procurement management, a subject that i s broadly analyzed in the Country Procurement Assessment Report (CPAR).
124

monthly summaries o f the approved exceptions (www.cgr. aob.ni), but not o f the correlated justifications.’”
6.77 With respect to the complaint mechanisms available to bidders, the L a w sets forth three administrative instances: (i) recourse o f clarification before the Tender Committee;’s6 (ii) recourse o f impugnation before the Reviewing C~mmi t tee ; ”~ and (iii) recourse for annulment before the CGR.’58
6.78 In the legal front, there i s a plan -but to no concrete outcome yet- to submit to the National Assembly a project for a modem law o f public sector administrative contracting, which would bring the framework closer to international practice.
6.79 Other internal controls. As for the effectiveness o f controls to commit expenditures, L a w 550 provides for the “committed expenditure” step. Accordingly, SIGFA procedures require the recording o f this stage prior to the payment. However, i t is known that in practice the implementing entities record the commitment and accrual stages concurrently, which could affect Treasury’s cash programming and could lead to delays for expenditures that are not recorded by the institutions until the payments are ready to be made. Therefore, the commitment control system i s only partially effective.
6.80 In terms o f the overall internal control framework, in December 2004 the CGR issued the Technical Internal Control Norms (NTCI) and proceeded with their induction in 2005 through a series o f training events. The N T C I are based on international practice (COS0 framework) and thus emphasize risk management. The entities had until June 2006 to design their pertinent systems o f internal control, according to the NTCI. The CGR is in the process o f certifying implementation (about 60 certifications were issued in 2006).
6.81 Given the recent introduction o f the NTCIs, there is no data yet to assess the general level o f understanding, compliance and cost-effectiveness o f the internal control rules and procedures.
6.82 Internal audit. The Organic Law o f the CGR and the Government Control System (Decree 625 o f 1980, as amended) determines the obligation o f public sector entities to have internal audit units (UAI). In accordance with the law, the UAI i s in charge o f ex-post examination o f financial or administrative transactions as a service to the superior authority o f the entity, to which i t reports. However, internal auditors can only be dismissed with the authorization o f the CGR, which receives copies o f the UAI reports. Their independence is also granted, at least according to the law, in terms o f the unrestricted access to documentation and the prohibition to participate in administrative processes.
L
155. The CGR must receive copy o f contracts exceeding C$500,000 for review (the cei l ing for purchases by quotation is o f C$lOO,OOO, and thus, not a l l contracts by tender are submitted to the CGR). In 2005, the CGR received 699 contracts. That same year, 202 applications for exception o f procedures were approved. 156. The recourse for clarification could unnecessarily delay the procurement process, if i t i s based o n t r iv ia l arguments to affect the competition. 157. The Reviewing Committee i s presided over by a representative o f the MHCP, and formed additionally by the third-ranking officer o f the contracting entity, and a representative o f the Off ice o f the Attorney General o f the Republic (PGR). 158. According to the time periods established by Law, a complaint that goes throughout a l l administrative instances would take about 46 days.
125

6.83 and scrutiny o f the CGR, which receives copies o f their work plans and reports. The entity administrators are bound to adopt in a timely fashion the corrective measures indicated in the internal audit reports.
6.84 The legal framework i s generally adequate, but actual perfomance i s heterogeneous across the different institutions. In the absence o f statistical data, anecdotal reference points that most UAIs do not comply fully with professional norms and devote most time to special studies, as opposed to systematic reviews.16' There i s no system to monitor internal audit recommendations, but i t is presumed that administrations observe the most important matters, although not necessarily in a timely and comprehensive fashion.
6.85 Conclusions: Predictable and controlled budget execution is necessary to enable effective management of policy and program implementation.
6.86 There are strengths, especially in terms o f fiscal discipline, in the centralization o f treasury balances through the Single Treasury Account (CUT), as wel l as in the controls for contracting and recording public debt, albeit further enhancements are possible. In other areas there is more room for improvement.
6.87 Compliance with the timely recording o f expenditure commitments, e.g. through automatic links with the SICCE, needs to be ensured. Similarly, the mechanism o f direct payments by the Treasury should be improved, requiring better coordination between the M H C P and the Central Bank. The development o f the Civ i l Service Integrated System (SISEC) and the extension o f the Fiscal Payroll System (SNF) should continue with the purpose o f developing a consolidated payroll system, which in turn should be subject to systematic audits. The implementation o f the Technical Internal Control Norms (NTCI) needs to be complemented with information systems that assess their performance. Finally, internal audits require greater professionalization, more systematic risk-based approaches, greater dissemination and better follow-up to its reports.
6.88 The procurement processes and correlated statistics will be more transparent and efficient through the ongoing development o f the SICCE. There i s also a need, though, to reform procurement legislation (a draft is already available) in l ine with international practice. Specific areas for improvement include bidders' registration, guarantees, price adjustment, confidentiality o f bids, bid evaluation and award, bidder's access to review o f procurement decisions, responsive and responsible bidder, suspension o f bidders, procurement o f consulting services, sanctions regime, and options for procurement consolidation strategies (e.g. contratos marco).
6.89 Evidently, weaknesses in internal controls may diminish the operational efficiency in the use o f resources and create opportunities for corrupt practices, abuse and waste. Likewise, weaknesses in the controls o f commitments and payments may generate fiscal risks. Further attention to systems, processes and controls for budget execution are therefore necessary to ensure greater operational efficiency, fiscal discipline and transparency.
The UAIs are subject to the technical
L
159. Internal auditors must comply with the Government Auditing Norms (NAGUN) and, complementarily, with the International Standards for the Professional Practice o f Internal Auditing (ISPPIA) issued by the Institute o f Internal Auditors. 160. For the purposes o f this report, systematic reviews are those that address significant aspects of: rel iabi l i ty and integr i ty in operational and financial information; effectiveness and efficiency o f operations; safeguarding o f assets; and compliance with laws, regulations and contracts.
126

Accounting, recording and reporting
6.90 This section discusses the record keeping, preparation and issuance o f government financial information for managerial and scrutiny purposes.
6.91 Account reconciliation. The frequent and timely reconciliation o f data from different sources i s fundamental for the reliability o f financial reports. Bank reconciliations for the accounts managed by the Treasury are made on a daily basis, with the support o f SIGFA automatic processes. Monthly reconciliation reports are also produced. However, the automation o f account statement uploading i s s t i l l pending, as i s the reconciliation o f rotating funds, which must be reconciled by the implementing entities. N o aggregate information is kept on the state o f reconciliations o f the rotating funds.
6.92 Resources received by service delivew units. Monitoring o f these resources, for example, the amounts received by health care centers and schools in cash and in kind, i s important to validate whether the financial management systems effectively support the delivery o f public services. The Ministry o f Health keeps central databases on funds in cash received and used by i t s decocentrated units. So does the Ministry o f Education with respect to schools, although the information i s generally less complete and o f poorer quality. Resources in kind or provided by NGOs to service delivery units are rarely tracked. I t must be mentioned, however, that an effort is made by the local Public Investment Technical Units to monitor investments programmed in SNIP.
6.93 Hence, there are various systems in operation, but these do not yet gather complete data on the resources received by service delivery units. Moreover, the available information i s not compiled and analyzed in periodical reports.
6.94 In-year budnet reports. Timely and periodical information on budget execution i s essential for the MHCP to supervise fiscal performance and for the implementing entities to manage their budget. In this sense, Law 550 provides for adequate mechanisms: the entities that conform the PGR must record the execution o f their budgets in the financial management system and according to the rules set forth by the MHCP, whereas decentralized and autonomous entities must submit their quarterly execution reports to the M H C P thirty days after the end o f each quarter at the latest, for consolidation purposes.
6.95 In practice, with SIGFA’s platform, budget execution reports can be generated o n “real time” for internal use. Among other features, these reports: (i) allow direct comparison to the classifications o f the approved PGR; (ii) cover al l items o f the PGR (but not the detailed use o f transfers, as noted previously); and (iii) distinguish between the stages o f commitment, accrual and payment. Public reports are prepared on a quarterly basis during the thirty days fol lowing the end o f each quarter. The main concern on the quality o f the information, as mentioned before, is the usual practice o f simultaneous recording o f the stages o f commitment and accrual, which prevents a reliable timely overview o f the actual level o f committed expenditures.161
6.96 Annual reports. Law 550 presents an adequate legal framework for accrual-based government accounting, and provides for the requirement o f the M H C P to submit the Annual
L
161. Other weaknesses ident i f ied by the CGR include: (i) the lack or inadequate use o f the SIUE in some cases, which has prevented the identif ication with enough detail o f some expenditures financed through rotat ing funds; and (ii) the recording or modif icat ion o f certain transactions after the closing date. See CGR (2005).
127

Public Sector Investment Account’62 to the National Assembly and the CGR by March 3 1 o f the next year. However, the mechanisms (methodologies, training, subsidiary records) to put this requirement into effect are s t i l l under development. For this and other reasons, such as the identified but pending clean-up o f certain account balances, the public sector financial statements are not yet produced, not even for the central administration.
6.97 The M H C P does prepare, on a yearly and timely basis, a Budget Execution Report. Event though this report does not include cash balances’63 nor the accounting methodology used, i t does present ample information on revenues and expenditures o f the PGR.’64 These reports are usually published within three months after the end o f the year.
6.98 Poverty-reduction expenditure tracking. The budget documents, as well as in-year and year-end execution reports, al l identify public spending and transfers associated with poverty- reducing activities, including HIPC debt relief, as wel l as other external and internal sources o f financing for those programs. In line with international practice, poverty-reduction expenditure i s tracked through the “tagging” o f specific line items in the budget classification matrix, a process made directly in SIGFA by the MHCP on the basis o f poverty spending definition by SETEC.’65 The latter prepares periodical reports on implementation o f poverty-reduction expenditures. The described procedure helps to ensure that, in terms o f find management and monitoring, no physical fimds or other parallel structures are needed -thus strengthening institutionalization.
6.99 Conclusions. Timely, relevant and reliable financial information is required to support fiscal and budget management and decision-making processes.
6.100 The information on budget execution (per month, quarter and year) is prepared on a timely basis, supported by a good recording system and by a good system o f reconciliations o f bank accounts handled by the Treasury, a l l o f which are key features to control fiscal discipline, transparency and scrutiny. Moreover, the budget formulation, execution and recording systems allow for the tagging and monitoring o f poverty-reduction expenditure.
6.101 However, execution reports are st i l l not supplemented with data on bank balances and, even less, with accounting financial statements. These elements are necessary to corroborate the integrity o f the currently produced reports, and to increase the information and scrutiny on patrimonial elements that, due to their nature, are not reflected in the budget execution reports. The development o f mechanisms to produce financial statements is one o f the main challenges assumed by the MHCP within the framework o f its plan to implement Law 550. L
162. I t i s understood that the presentation requirements for the Annual Investment Account (article 137 o f L a w 550) also cover the Accounting Financial Statements (article 138), but the L a w i s no t completely explicit o n this point. 163. In the absence o f financial statements, a f i r s t crit ical step for transparency would b e to reconcile budget execution with bank balances at the end o f the year. For example, as mentioned by the CGR (CGR, 2005), the budget execution report o f 2004 includes expenditures o f C$1,796 m i l l i on classified as “other” under the concept o f “internal financing”. Presumably, these funds represent an increase o f financial assets, but in absence o f the reconciliation with bank balances, this presumption cannot be corroborated. In 2005, the amount o f “others” was reduced to C $ l 1.4 mill ion. 164. Among other information, the annual budget execution report presents the execution o f revenues and expenditures according to different classifications (economic, administrative, functional, per financing source), the allocations and transfers to decentralized entities, the investment projects, grants and loans, debt service, budget modifications, expenditures financed through debt re l ie f funds, and expenditures connected to the Poverty Reduction Strategy. 165. The scope o f th is P F M assessment does not cover the quality o f poverty spending definition.
128

6.102 On the other hand, i t is also necessary to examine with greater detail and support the efforts o f the different sectors, mainly o f the Ministries o f Education and Health, to compile and process more information on the resources received (or not) allocated to service-delivery units (schools and health centers). Apart from being an essential accountability tool, this type o f information i s necessary to asses the operational efficiency o f the mechanisms to transfer and use funds in decocentrated programs.
External scrutiny and auditing
6.103 This section analyzes institutional mechanisms to scrutinize public finances, with a focus on the functions o f external auditing and o f legislative oversight o f the budget and i t s implementation.
6.104 External auditinn. In principle, an effective external auditing helps to guarantee integrity o f public finance information and accountability for the efficient and legal use o f resources. In accordance with its Organic Law, the CGR i s the institution in charge o f carrying out financial, compliance and other audits, in public sector entities. These audits must adhere to the Government Auditing Norms (NAGUN).’66 Additionally, Law 550 establishes that the CGR will audit the Budget Execution Report submitted by the MHCP, and send i t to the Commission o f Economic, Financial and Budget Affairs o f the National Assembly.
6.105 Even though the members o f the Superior Council o f the CGR are elected by the National Assembly, the CGR itself is an independent and autonomous constitutional entity. In line with the provisions o f its Organic Law, the CGR submits its reports to the superior authority o f the entity audited. The National Assembly only receives the annual performance report o f the CGR in systematic manner, but can request and review special audits. According to the Constitution, the CGR must make public the results o f its investigations and, according to the NAGUN, the audit reports have a public nature once approved by the Superior Council. These can be found in the Documentation Center o f the CGR and, selectively, in its Internet page (www.cm.gob.ni).
6.106 As is evident in i t s annual performance reports, external audits made by the CGR do not comprise al l entities, and constitute mostly special examination^.'^' Financial audits are conducted primarily by private firms, subject to CGR review, but these audits are l imited to certain decentralized entities and projects with external financing. Although there are no public sector financial statements as explained before, the annual Budget Execution Report is not audited by the CGR.16* Performance audits are not conducted.
6.107 In accordance with CGR instructions, the entities must implement i ts recommendations within a maximum term o f three months. The CGR has an information system that records the number o f recommendations, officers to whom an administrative or c iv i l liability, or a criminal presumption has been determined, and the correlated amounts when an economic loss has been established. The recommendations are monitored but, in general, the responses -though formal- are delayed or not very thorough. N o annual reports are produced to give account on compliance by entities in the implementation o f recommendations o f audits previously conducted. L
166. In general, the NAGUN are consistent with the rules o f the International Organization o f Supreme Audit Institutions (INTOSAI). The NAGUN also adopt in a supplementary manner the International Auditing Standards (IAS) for financial audits. 167. See CGR (2006). 168. In 2005 an “evaluation”, not an audit, was performed on the 2004 budget execution (CGR, 2005). A plan i s underway to prepare a f i rst audit o f the Budget Execution Report, covering fiscal year 2006.
129

6.108 Legislative apuroval of the budget. The powers o f the National Assembly in budget matters are clear, known and generally respected. The pertinent legal framework is contained in the Constitution and in Law 550, which has strengthened the oversight role o f the legislature, attributin important control functions to the Commission o f Economic, Financial and Budget Affairs,16' with the support o f the General Directorate o f Analysis and Monitoring o f Public Expenditure. This unit has stable personnel devoted to analyze and monitor the budget, and to this end, prepares reports for the exclusive use o f deputies (they are not published). 170
6.109 The scope o f budget examination i s broad. I t comprises the bill o f law and the analysis o f i t s annexes, which -as indicated before- comprise the fiscal policies and the fiscal framework, the medium-term priorities o f the MPMP, and the details o f expenditures and revenues for the next fiscal year, amongst others. The Assembly has enough time (2 months, between October 15 and December 15) to carry out this review.
6.1 10 While the budget initiative belongs constitutionally to the executive, the legislature may propose amendments. Law 550 regulates the amendment procedures, both for the bil l o f the annual budget law and to the annual law itself during execution. The legislative branch cannot modify the budget ceiling, unless i t defines the sources o f revenue for such increase.171 The President has the power to totally or partially veto the amendments proposed by the Assembly, both to the annual budget (as happened for the budgets o f 2005 and 2003), as well as to subsequent amendments proposed.
6.11 1 The modifications to the budget law during its execution are made by law and, thus, are subject to legislative scrutiny.'72 Law 550 indicates that the legislative branch will process the modifications with priority, within a maximum term o f 60 days. The rules in budget reallocations are clear and set forth strict limits to the executive: the M H C P can only reallocate budget l ine items, without prior legislative approval, between the same entity and even then within certain restrictions (e.g., i t i s prohibited to reallocate from investment to current expenditures, and MHCP must inform the Commission o f Economic, Financial and Budget Affairs o f every reallocation o f the investment expenditure).
6.1 12 While Law 550 introduced greater discipline in the approval o f budget modifications, an unintended consequence has been the restrictions to receive short-term grants, which given their nature and the donors' different fiscal years, are difficult to anticipate when the budget proposals L
169. The Commission gives an opinion o n the bill o f l a w o f the PGR, issuing a majori ty opinion and a minor i ty opinion. In 2005, the plenary session adopted the minority opinion for the budget o f 2006. The Commission is formed by a non-fixed number o f deputies (1 1 in 2005 and 16 in 2006) and is renewed annually. These factors can weaken the institutionalization o f the financial and budget expertise in the legislative body. In other countries, the duration o f the mandate in permanent commissions i s usually longer. 170. I t must be stated that Nicaragua i s one o f few countries in the region that has such off ice o f technical advisory services in budget matters. 171. L a w 550 establishes the mechanisms to incorporate new sources o f revenue during the discussion and approval o f the annual budget law. I t sets forth consensual mechanisms between the executive and legislative branches, through a Technical Committee formed by the M H C P and the Commission o f Economic, Financial and Budget Affairs, which has to render a decision within a term o f 10 days. 172. L a w 550 broadened legislative control towards areas until then exempt f rom such procedure; for example, in matter o f additions due to loan and grant operations. Before, they were approved ex post facto by means o f a retroactive amendment to the budget law, usually at the end o f the fiscal year, applying the principle o f 'legislative silence' in the case o f loans and grants. The exception currently kept i s related to budget additions for entities' own revenues (rentas con destino especifico), which are reported o n a monthly basis by the MHCP to the Commission o f Economic, Financial and Budget Affairs.
130

are prepared. At the same time, there are no sufficient incentives for the executive to spend political capital in the passing o f budget modifications for small donations. Given that these grants usually bear limited impact o n fiscal discipline and public expenditure policy, a more streamlined approach such as ex-post reporting under a reasonable aggregate ceiling, could be considered so as to prevent undesirable alternatives, such as off-budget hnding implementation.
6.1 13 Legislative scrutiny of audit reports. On budget execution, the legislative branch, through the General Directorate o f Analysis and Monitoring o f Public Expenditure, maintains access to SIGFA and conducts periodical monitoring (each month through direct access to execution figures; quarterly through the in-year execution reports prepared by the MHCP; and annually through the Budget Execution Report submitted by the MHCP).
6.114 Law 550 establishes that the National Assembly i s entrusted to approve or reject the budget execution annual report (although it does not indicate if this process i s made through law, and thus, subject to veto). Previously, the executive, through the MHCP, has to substantiate such report by the second week o f May. As noted before, the same law asks the CGR to submit i t s audit on the report to the Commission o f Economic, Financial and Budget Affairs o f the National Assembly before the appearance o f the Ministry o f Finance.
6.1 15 However, there are dysfunctions in the legislative scrutiny o f the external audit reports. As explained earlier, not al l audit reports conducted by the CGR are informed to the legislative branch in a systematic or compulsorily manner. Only those audits conducted per request o f the same legislature are submitted to it. These reports are reviewed within an approximate period o f one year (there i s no fixed term to examine these reports) by the Commission o f Economic, Financial and Budget Affairs or by the specialized commissions that have required such reports. 173
6.116 The legislature performs hearings and interpellations o n an occasional manner o n the main conclusions o f the audit reports, but does not usually issue formal opinions on them or monitor their implementation. The monitoring o f audit recommendations i s done by the same CGR, but there i s no legal obligation to inform the legislative power o n their effective implementation by the government, e.g. through its annual report.
6.117 Conclusions. Effective scrutiny by the legislature and thorough external audit is an enabling factor in accountability for fiscal and expenditure policies and their implementation.
6.118 There are positive aspects in the clarity and application o f the legal framework with respect to the legislative review and approval o f the annual budget law, as well as in the mechanisms to approve in-year budget modifications, recently regularized through Law 550. I t must be noted, however, that strict ex-ante legislative approval can affect the country’s capacity to benefit from short-term grants, which given their nature are difficult to anticipate at the time o f budget formulation. Elements could be introduced into the law to better balance the capacity o f the government to receive this type o f grants (which bear little fiscal and public expenditure impact), and the legislature’s right to oversee public finances.
6.1 19 As for the ex post scrutiny o f public expenditure, although guaranteed by law, in practice is limited because the National Assembly does not receive al l external audit reports, and when i t L
173. The National Assembly, as a consequence o f the review o f CGR reports, may request special studies o n specific matters. In fact, these requests make up to great extent the regular work o f the CGR, but its effective use by the legislative branch is deficient.
131

does, their review and discussion take a significant amount o f time, with minimal subsequent monitoring.
6.120 With respect to the Office o f the Controller General o f the Republic (CGR), and important recent step was the preparation o f an evaluation o f the 2004 annual budget execution report. However, since this activity did not constitute a financial audit, its scope was l imited in comparison to international practice. On the other hand, for the audit reports that are indeed produced (most o f them o f a “special” type), the monitoring o f recommendations i s made in a formal fashion but, in general, the response from implementing entities i s delayed and not particularly thorough. The monitoring system that the CGR i s putting into practice is another important step that would help to improve monitoring during future years.
6.121 The absence o f a financial and compliance audit on budget execution limits guarantees o f information integrity and the effectiveness o f accountability for the efficient and legal use o f public resources. Consequently, emphasis should be put on the CGR’s plans to prepare the first PGR execution audit, and on the future sustainability o f the practice.
Donor practices
6.122 This section analyzes some elements o f the practices o f providers o f external assistance that impact upon the performance o f the national P F M system.
6.123 Predictabilitv of budnet supt7ort. The degree o f certainty o f annual budget support, as well as its distribution throughout the fiscal year, impacts upon the capacity o f the government to implement i t s budget plans. In this sense, two practices usually recommended to the providers o f external assistance are: (i) to send information to the government o n the annual amounts foreseen, at least six weeks before the government submits the budget to the legislative branch; and (ii) to reach an agreement with the government on the quarterly programming o f disbursements at the start, or before the start, o f the fiscal period.
6.124 In Nicaragua, an essential step in that direction was the signature, in M a y 2005, by the Government and the Budget Support Group (BSG)’74 o f a Joint Financing Arrangement (JFA) which purpose, inter alia, is to facilitate greater predictability in external aid and its alignment with the budget system. The JFA has incorporated the good practices cited in the previous paragraph through the requirements to: (i) formally communicate the intended budget support around June o f the preceding year, and i t s confirmation by September 15; and (ii) decide on a quarterly disbursement calendar in November o f the preceding year.
6.125 Given the recent implementation o f the JFA framework, there i s room for improvement, particularly in terms o f ensuring greater correspondence between the annual and quarterly commitments and actual disbursements. Granted, this i s not an easy task, knowing the different budget support approaches to which providers o f external assistance are bound in their internal regulations, e.g. broad-based vs. sectoral support, fixed vs. variable tranches, pol icy actions vs. outcomes.
6.126 I t is also important to note that the JFA does not yet include al l providers o f external assistance who provide budget support, and that the commitments are not always confirmed on
L
174. The Netherlands, Norway, Sweden, Switzerland, United K ingdom and the W o r l d Bank.
The providers o f external assistance that form the B S G are the European Commission, Finland, Germany,
132

the deadline fixed in the JFA.17’ Prior to the signing o f the JFA, in the limited cases when annual budget support projections were delivered, the discrepancies with the plans were due main ly to noncompliance with prior conditions (including adequate macroeconomic and fiscal conditions)
6.127 Financial information on investment projects. In principle, donor support to projects can be channeled in various ways, with varying degrees o f participation by the government in the planning and management o f the resources. While the government should be able to budget and report on the assistance transferred in cash, i t depends on the providers o f external assistance for budget estimates and reporting on implementation o f aid in-kind. Donor reports o n cash disbursements are also important for reconciliation between donor records and government project accounts.
6.128 In Nicaragua, donor practices on the financial information provided to the government for budgeting and reporting are not uniform. Some providers o f external assistance disburse primarily though advances to rotating finds, a procedure that gives certain autonomy to the government for budgeting execution. Others present regularly the disbursement projections, although not necessarily linked to the budget preparation cycle. The information i s not generally submitted in accordance with the detailed classifications used by the government, but their level o f aggregation allows the latter to break i t down by budget lines without major difficulty. The information o n in-kind grant projections seems scarce.’76
6.129 With respect to ex-post information on disbursements made, this information i s usually made available to the government through access to on-line systems, quarterly or biannual reports submitted within two months subsequent to each period, or in response to specific requests.177 The Ministry o f Foreign Affairs incorporates and publishes disbursement data in the Official Cooperation Information System (www.svsoda.cancilleria.gob.ni). However, this information i s not used yet in a systematic manner to reconcile financial figures against budget records.
6.130 Use of national procedures. National systems for management o f funds are those established in local legislation and regulations, and applied by the mainstream l ine management functions o f the government. The use o f different procedures (specific to providers o f external assistance) could divert capacity away from managing the national systems. Conversely, the use o f these systems by the providers o f external assistance can help to focus efforts o n strengthening and complying with the national procedures also for domestically funded operations. Direct budget support (general or sector based) will by definition use national procedures in al l respects Other types o f financing, e.g. earmarked budget support, basket f inds and discrete project funding, may use some or no elements o f national procedures.
6.13 1 In Nicaragua, the use o f national systems has increased in recent years, particularly to the extent that budget support and common funds have substituted partly the assistance provided before almost exclusively through tied projects. However, although there i s no complete
L
175. The medium-term review o f 2005 was delayed due to, inter alia, the deviation f rom the program with the IMF and the corresponding absence o f a “letter o f agreement” by the IMF on macroeconomic and fiscal aspects. 176. For purpose o f t h i s report, the concept o f in-kind grants includes assistance granted through direct administration o f the cooperating agencies or through agreement between them and NGOs. 177. Providers o f external assistance, who accounted for over 70 percent o f disbursements o f external loans and grants budgeted in 2006, provided this information periodically.
133

information to quantify the use o f national systems for external loans and grant^,"^ they presumably cover less than 50 percent o f such resource^.'^^ The preference s t i l l shown for specific project procedures reflects, in part, the concerns o f providers o f external assistance for the weaknesses described before in the country procurement and auditing systems.
6.132 Conclusions. Important agreements have been reached to try to align external funding with the national budget system. Worth highlighting i s the Joint Budget Financing Arrangement (JFA), which includes commitments on the provision o f information that wil l improve predictability o f budget support. Also worth noting is the growing use o f national systems and the prompt access o f the government to information on disbursements made by the providers o f external assistance.
6.133 On the other hand, i t must be acknowledged that the cited actions have only recently been introduced, and thus, their impact i s s t i l l not to full potential. Future actions could concentrate in the incorporation o f a greater number o f donors to the efforts underway, in terms o f timely provision o f projections and disbursements (and greater convergence between both), in cash and in kind, and greater use o f national procedures in investment projects. All o f the above i s consistent with the National Harmonization and Alignment Action Plan.
C. Reform Process
Recent Reforms
6.134 Within the framework o f dialogue around the Country Financial Accountability Assessment (CFAA) report o f 2003, an ambitious two-year action plan was prepared with the objective to address certain weaknesses found in systems and procedures. As detailed in Annex 1, and brief ly in the following paragraphs, there was a mixed record o f implementation -although in absolute terms a majority o f actions were implemented or partially implemented, evidencing the commitment to reform-.However, i t must be acknowledged that most o f the actions took place in the second year, and thus, their impact upon the performance o f the system has just recently been noted, as inferred from the conclusions o f the preceding chapter.
6.135 Implementation arrangements. In November 2003 an inter-institutional agreement18' was issued to implement the government action plan to improve Public Financial Management (PFM), based largely on the actions suggested by the C F A A that fell under the realm o f the executive branch. I t s implementation and monitoring took place under the strong leadership o f the MHCP, particularly the Directorate o f the SIGFA Project (currently the General Directorate o f Technology). However, in other entities, and even some normative directorates o f the MHCP,
L
178. For such estimate, i t i s necessary to calculate the average o f the proportion o f external funds that use national systems for each o f the four areas o f procurement, paymentsiaccounting, auditing and reporting. I t has not been possible to gather information at this level o f detail for a l l funds. 179. O f the loans and external grants incorporated in the 2006 budget, 29 percent corresponds to budget support and 3 percent to common fund-type operations (Supplementary Social Fund, FONSALUD, PRORURAL). 180. Government o f Nicaragua (2003).
134

the cited agreement was not fully owned.'*' Moreover, there was no mechanism to monitor the areas related to external scrutiny and auditing.'82
6.136 Legal framework. Based on studies about the country legal framework and comparative international legislation, the MHCP prepared a modern bill o f law o f financial management that eventually derived in Law 550 o f August o f 2005, as amended (Law 565 o f November o f 2005) As explained in the different sections o f the preceding chapter, the Law incorporated features largely consistent with good international practice for the different components o f the budget management system.
6.137 Budnet formulation. In April 2005, the M H C P adopted a strategy and action plan to develop a medium-term budget framework in N i ~ a r a g u a . ' ~ ~ The document i s based on international experience in the adoption o f this type o f instruments and provides for an adequate sequence o f gradual implementation.Additionally, the 2006 and 2007 budget documentation showed relevant improvements with respect to preceding years, most importantly the incorporation o f the medium term fiscal, budgetary and sectoral expenditure frameworks, as wel l as the budgets for almost al l public sector entities.
6.138 On the other hand, a basic methodology was prepared to estimate recurrent costs o f the public investments program, but i t was not complemented nor has been put into actual practice yet. With respect to the reclassification o f current expenditures included in the capital budget, some improvements have been made with new projects, but the criteria for -and actual- reclassification have not been developed.
6.139 Financial Management and Audit Integrated Svstem (SIGFA). In terms o f the continuous improvement o f the information tool e-SIGFA, relevant progress was made with the technological platform and certain procedures (e.g., control o f rotating funds, single collection form). Furthermore, certain administrative systems were developed (cash f low programming, procurement and contracting, c iv i l service and public assets), but their implementation and integration is s t i l l limited. The coverage o f entities that use SIGFA was extended, but not under a clear strategy to incorporate decentralized entities and "third level" implementing units. With respect to security, progress was made in the administration o f users and roles for the different subsystems, in telecommunications and partially in logbooks, but not so in the external security audit.
6.140 Treasuw. The methods to record and control rotating funds were improved, including the "APEX" and "ADEX" procedures that allowed incorporation into the PFM system o f projects financed with external loans and grants. Also, the introduction o f the single collection form facilitated the transfer and reconciliation o f information on internal revenues. On the other hand, the development o f detailed programming o f cash flows and gap management as part o f the e- SIGFA, and o f criteria to sequence the processing o f payment orders, had l i t t le progress. Likewise, the implementation o f the payment system through electronic fund transfers (ETF) has experienced delays.
L
181. under the S IGFA Project, were the ones that showed higher levels o f implementation. 182. during the two years covered by the action plan. 183. MHCP (2005).
In effect, the areas under the control o f the MHCP, particularly through technical assistance coordinated
Certain pol i t ical economy conditions prevented an effective coordination between the executive and the CGR
135
6.141 Internal control and internal auditing. In September 2004, the CGR issued new Internal Control Technical Norms for the Public Sector (NTCI), which are generally consistent with international practice. The CGR conducted induction and training activities for the implementing public sector entities. Similarly, the M H C P also conducted training activities, including for internal auditors, in areas related mainly to the information system e-SIGFA. However, instruments o f sector tracking o f public expenditure flows (e.g., “expenditure tracking surveys”) were not implemented.
6.142 Deconcentration and decentralization of budaet execution. The diagnosis o f the financial management models for decocentrated and decentralized budget execution was not performed. I t i s known, however, that the Ministry o f Health prepares on a regular basis financial execution reports that cover i t s de-concentrated units (some o f which use a sectoral financial management system called “SIAFI”. Given its complexity, more difficult has been the effective implementation o f sound procedures for adequate expenditure recording, reporting and monitoring in the decentralized uni ts o f the education sector
6.143 Accounting and financial statements. In terms o f restructuring the accounting function, progress was limited (it assumed bank reconciliations, but kept the management o f assets). The process to clean up init ial balances advanced to the level o f actual identification o f the required accounting adjustments, but i t s implementation was not officially made. N e w reports were designed, and the annual Budget Execution Report was improved, but the reconciliation against cash balances, the addition o f comparative historical revenue and expenditure data, and the identification o f accounts payable in arrears, were not added. With Law 550, the execution reports on transfers to decentralized entities are now required.
6.144 External auditing. Under i t s modernization project, the CGR prepared some studies related to i t s organizational structure, updated i t s technological tools, prepared auditing manuals and the NTCI, and trained i t s personnel. Furthermore, i t started to publish some o f i t s auditing reports in the Internet and, for the f i rst time, prepared a report to evaluate budget execution (of 2004). However, this report did not constitute a financial and compliance audit, with its pertinent opinion, on the budget execution prepared by the MHCP. There are plans underway to prepare such a f i rst audit.
6.145 Public participation. The executive adopted a strategy o f access to information (EVA) and incremented the quantity and quality o f financial information in the public domain (www.consu1taciudadana.aob.ni). Progress was also made in the publication o f procurement processes. However, these progresses have not been supplemented with a multimedia strategy that includes other means to the citizens with no Internet access.
6.146 Coordination of external aid. The maintenance o f public investment project records has been strengthened, including for projects financed with external loans and grants, which are now incorporated into the budget. There i s a linkage between the e-SIGFA and the SNIP that makes i t easy to compare the information within the two systems. However, the reconciliations are not made in a regular manner, at the stage o f budget execution, between the data in SIGFA, SNIP and SYSODA. On the other hand, progress was made in coordinated sectoral assistance (“SWAps”), particularly in the health and rural development sectors.
136

6.147 Human resources. In general, progress was made in the implementation o f the Civil Service Law (Law 476),’84 including the development o f the C iv i l Service Integrated System (SISEC) -bearing an indirect though relevant effect on PFM-.In the case o f financial management officers, both the M H C P and the CGR have implemented specific training programs, as indicated before. However, budget limitations prevented the development o f more continuous and sustainable programs.
6.148 Public debt records. The Public Debt General Law and i t s Regulations were approved, and the f i rst annual public debt policies were issued. Under the new legal framework, the coordination and exchange o f information between the M H C P (that records internal debt) and the B C N (that records external debt) has improved. Internal debt records have also improved, although in two separate databases (DMFASEIGADE and other registry developed internally). Work was undertaken on the conceptual framework for the automatic link between DMFASEIGADE and SIGFA, but i t has not been developed.
6.149 Revenue System. In general, the process to implement projects for strengthening management o f revenues and customs required more time than init ial ly anticipated by the collecting agencies. The cross-checks o f internal information have improved, but not necessarily so with external data. As for the coordination with the Treasury, the establishment o f collection accounts and the single collection forms improved the f low o f information and o f funds. In 2005, a study to estimate fiscal expenditure was concluded, but these assessments are not made yet in a systematic manner or identified in budget documents.
Continuation of the Reform
6.150 Government ownershiu and leadership. As noted in the receding paragraphs, an ambitious process o f reform in different fronts was launched, with relevant progress overall and some stumbling blocks. Commitment o f the government was formally expressed in the National Development Plan (see Chapter I). The approval o f Law 550 and i t s amendments showed a positive stance from the executive and legislative branches towards the enhancement o f transparency and management o f public finances.It i s expected that the gradual development o f the participation and consensus building system wil l improve the mechanisms o f dialogue among government, c iv i l society, private sector and international community in development matters, including PFM.
6.151 At the operational level, the key implementation instruments are the annual operating plans o f the different projects that support PFM modernization, such as Public Sector Technical Assistance, Efficiency and Transparency in State Contracting, Strengthening o f Tax and Customs Administration and -in the case o f the CGR- i t s Modernization Program.As for budget support, the public finance area o f the performance assessment matrix (PAM) o f the JFA i s aligned with the National Development Plan’s matrix to reform and modernize public administration.
6.152 Coordination. It was explained before that MHCP’s strong leadership has been a critical element to implement PFM reforms. The coordination o f providers o f external assistance in this area has also improved significantly, e.g., through the operation o f the Budget Support Group (BSG), the governance sector “table”, and the increasingly joint financing o f public programs.
L
184. though not at the pace init ial ly envisaged) and development o f the SISEC, amongst others.
Advances include the issuance o f regulations, classification o f positions, progress in accreditation (even
137

However, coordination o f the reform between the M H C P and sector entities has not been equally effective-as evidenced by the initial problems in implementation o f Law 5 50-.Likewise, coordination has been weak with regards to external audit reform, entrusted to the CGR (a constitutionally autonomous entity).
6.153 Sustainability. I t must be recognized that, to a good extent, reforms achieved have been made with strong support o f technical assistance hired under projects with external financing. Therefore, notwithstanding that the extensive use o f national financial management systems and their incorporation into the legal framework are signs o f institutionalization, their sustainability wi l l depend also upon other aspects, mainly: (i) the professionalization o f public servants, with the effective application o f merit-based human resource management, per the C iv i l Service Law; and (ii) building the government’s own capacity to formulate, implement, supervise and evaluate public sector modernization projects, particularly as external financing i s gradually aimed more towards budget support rather than specific projects.
D. Main Conclusions
6.154 Good performance o f public financial management (PFM) institutions and systems allows governments to achieve and balance the three interrelated objectives o f budget management: aggregated fiscal discipline, efficient allocation o f resources consistent with public pol icy priorities, and operational efficiency. This Chapter assessed P F M performance in Nicaragua based on an international framework o f reference that addresses seven critical dimensions: (i) credibility o f the budget; (ii) comprehensiveness and transparency; (iii) budget planning; (iv) predictability and control in budget execution; (v) accounting, recording and reporting; (vi) external scrutiny and audit; and (vii) donor practices that affect PFM.’*’
6.155 Credibility of the Budget. From 2003-2005, expenditure execution usually exceeded the amounts budgeted, posing a fiscal discipline risk. However, this r isk did not materialize because the over-execution o f expenditures corresponded mainly to domestic revenues, grants and concessional loans that also exceeded budget forecasts. Even when in both cases budget credibility was affected, i t should be noted that their effects were distributed in a relatively uniform manner among the different implementing entities, and there are no significant concerns on payment arrears.
6.156 The credibility o f the budget is a critical feature o f the ability o f the government to control fiscal discipline and prevent shortcomings in the financing o f sector budgets. I t i s expected that with the recent enactment o f the Financial Management and Budget Regime Law (Law 550), which sets forth strict limits to budget modifications, budget outcomes will increase the reliability o f the budget as pol icy tool.
6.157 Comprehensiveness and transparency. The budget information in Nicaragua i s ample, based on a good classification system (albeit not consistent with the latest international best practice), and has a comprehensive institutional coverage as far as the budget document per se i s L
185. This report i s based primari ly o n PFM performance measurement analytics undertaken through a partnership o f the Government o f Nicaragua with the British Department for International Development (DFID), the European Commission (EC), the Inter-American Development Bank, and the Wor ld Bank. The performance measurement framework was developed by the Public Expenditure and Financial Accountabil ity (PEFA) partnership.
138
concerned. But that i s not the case with the execution reports which, up to now, include only the General Budget o f the Republic (PGR) and not the execution o f revenues from the rest o f the central government. At the same time public access to information i s limited due to the absence o f certain key information (financial statements, audit reports, reports o f resources received by service-delivery units, and comprehensive publication o f procurement and contracting processes). Likewise, the limited transparency o f the fiscal decentralization system and the difficulty o f monitoring the aggregate fiscal risk o f the public sector are areas in need o f improvement.
6.158 The ability o f the government to control aggregate fiscal discipline o f the public sector could be affected if fiscal neutrality o f transfers to municipalities is not attained, and if the mechanisms to compile and consolidate al l public finances are not implemented. On the other hand, the scrutiny on the government's financial management -a key element to improve the strategic allocation and operational efficiency o f the use o f funds- is limited in view o f the absence in the public domain o f the aforementioned key information.
6.159 In the short term, improvements can be expected with the preparation o f execution reports for a l l budgets and o f financial statements (both are requirements stipulated by L a w 550), the revision o f rules and their application vis-a-vis current expenditures in investment projects, the implementation o f transparency in procurement through the State's Procurement and Public Contracts Integrated System (SICCE), and the publication o f customized financial information on resources received and used by service-delivery units, particularly in the education and health sectors. To the extent that decentralized entities (by function and territory) comply with the requirements o f L a w 550 on provision o f information, the monitoring o f aggregate fiscal risk will be facilitated, although the creation o f capacity in the M H C P to carry out this task may possibly take more time. Finally, i t is well known that subjecting further decentralization progress to a framework o f fiscal neutrality is both critical and urgent.
6.160 Budczet danninx. The annual formulation o f the budget is made in an orderly fashion, with due participation o f the implementing entities, notwithstanding the small margin -because o f earmarked funds and "fixed" expenditures- for flexibility. Institutionalization o f the national public investment system (SNIP) i s growing, particularly at the pre-investment assessment stage, but monitoring and evaluation remain weak. As for the medium term budget framework, the steps are recent but relevant. The framework has a clear legal basis, and the M H C P has an adequate strategy in place to implement this new instrument in stages, which should consider integration o f SNIP into the process.
6.161 In the short to medium term, the capacity to prepare or refine costed sectoral strategic plans needs to be developed for reconciliation o f the top-down and bottom-up multi-year budget planning. The public investment program (PIP) should be based on those plans, with due consideration to recurrent cost implications. Once they are comprehensively implemented, the elements that compose the medium term framework, i.e. the fiscal framework and the sectoral expenditure framework, wi l l reduce fiscal risks and provide informative elements that will increase the quality and consistency o f decisions on the strategic allocation o f resources.
6.162 The effort to incorporate results elements in the budgeting process i s incipient and l imited by budget rigidities. Basic goals and budget indicators have been developed, but the accountability framework has not. Enhancements to the dimensions and scope o f indicators, and
139
to the capacity to measure the marginal cost o f changes in performance, should be progressively built.
6.163 As i s expected from such a significant overhaul o f the budget system, which should be gradually implemented over the medium and long term, there are capacity gaps in executing entities and in the MHCP that need to be addressed. And, inevitably, any effort to modernize budget planning and programming wil l be limited to the extent that significant legally earmarked budget allocations remain.
6.164 Predictability and control in budget execution. There are strengths, especially in terms o f fiscal discipline, in the centralization o f treasury balances through the Single Treasury Account (CUT), as well as in the controls for contracting and recording public debt, albeit further enhancements are possible. In other areas there i s more room for improvement.
6.165 Compliance with the timely recording o f expenditure commitments, e.g. through automatic l i n k s with the SICCE, needs to be ensured. Similarly, the mechanism o f direct payments by the Treasury should be improved, requiring better coordination between the M H C P and the Central Bank. The development o f the C iv i l Service Integrated System (SISEC) and the extension o f the Fiscal Payroll System (SNF) should continue with the purpose o f developing a consolidated payroll system, which in turn should be subject to systematic audits. The implementation o f the Technical Internal Control Norms (NTCI) needs to be complemented with information systems that assess their performance. Finally, internal audits require greater professionalization, more systematic risk-based approaches, greater dissemination and better follow-up to its reports.
6.166 The procurement processes and correlated statistics wil l be more transparent and efficient through the ongoing development o f the SICCE. There is also a need, though, to reform procurement legislation (a draft is already available) in line with international practice. Specific areas for improvement include bidders’ registration, guarantees, price adjustment, confidentiality o f bids, bid evaluation and award, bidder’s access to review o f procurement decisions, responsive and responsible bidder, suspension o f bidders, procurement o f consulting services, sanctions regime, and options for procurement consolidation strategies (e.g. contratos rnarco).
6.167 Evidently, weaknesses in internal controls may diminish the operational efficiency in the use o f resources and create opportunities for corrupt practices, abuse and waste. Likewise, weaknesses in the controls o f commitments and payments may generate fiscal risks. Further attention to systems, processes and controls for budget execution are therefore necessary to ensure greater operational efficiency, fiscal discipline and transparency.
6.168 Accounting, recording and reoorting. The information on budget execution (per month, quarter and year) i s prepared on a timely basis, supported by a good recording system and by a good system o f reconciliations o f bank accounts handled by the Treasury, a l l o f which are key features to control fiscal discipline, transparency and scrutiny. Moreover, the budget formulation, execution and recording systems allow for the tagging and monitoring o f poverty-reduction expenditure.
6.169 However, execution reports are s t i l l not supplemented with data on bank balances and, even less, with accounting financial statements. These elements are necessary to corroborate the integrity o f the currently produced reports, and to increase the information and scrutiny on patrimonial elements that, due to their nature, are not reflected in the budget execution reports.
140

The development o f mechanisms to produce financial statements i s one o f the main challenges assumed by the M H C P within the framework o f i t s plan to implement Law 550.
6.170 O n the other hand, it i s also necessary to examine with greater detail and support the efforts o f the different sectors, mainly o f the Ministries o f Education and Health, to compile and process more information on the resources received (or not) allocated to service-delivery units (schools and health centers). Apart from being an essential accountability tool, this type o f information is necessary to asses the operational efficiency o f the mechanisms to transfer and use funds in decocentrated programs.
6.171 External scrutinv and auditing. There are positive aspects in the clarity and application o f the legal framework with respect to the legislative review and approval o f the annual budget law, as well as in the mechanisms to approve in-year budget modifications, recently regularized through Law 550. I t must be noted, however, that strict ex-ante legislative approval can affect the country’s capacity to benefit from short-term grants, which given their nature are dif f icult to anticipate at the time o f budget formulation. Elements could be introduced into the law to better balance the capacity o f the government to receive this type o f grants (which bear l i t t le fiscal and public expenditure impact), and the legislature’s right to oversee public finances.
6.172 As for the ex post scrutiny o f public expenditure, although guaranteed by law, in practice i s limited because the National Assembly does not receive al l external audit reports, and when it does, their review and discussion take a significant amount o f time, with minimal subsequent monitoring.
6.173 With respect to the Office o f the Controller General o f the Republic (CGR), and important recent step was the preparation o f an evaluation o f the 2004 annual budget execution report. However, since this activity did not constitute a financial audit, its scope was l imi ted in comparison to international practice. On the other hand, for the audit reports that are indeed produced (most o f them o f a “special” type), the monitoring o f recommendations is made in a formal fashion but, in general, the response from implementing entities i s delayed and not particularly thorough. The monitoring system that the CGR i s putting into practice i s another important step that would help to improve monitoring during future years.
6.174 The absence o f a financial and compliance audit on budget execution l imits guarantees o f information integrity and the effectiveness o f accountability for the efficient and legal use o f public resources. Consequently, emphasis should be put on the CGR’s plans to prepare the first PGR execution audit, and on the future sustainability o f the practice.
6.175 Donor practices that affect PFM. Important agreements have been reached to try to align external hnding with the national budget system. Worth highlighting i s the Joint Budget Financing Arrangement (JFA), which includes commitments on the provision o f information that wi l l improve predictability o f budget support. Also worth noting i s the growing use o f national systems and the prompt access o f the government to information o n disbursements made by the providers o f external assistance.
6.176 On the other hand, i t must be acknowledged that the cited actions have only recently been introduced, and thus, their impact i s still not to full potential. Future actions could concentrate in the incorporation o f a greater number o f donors to the efforts underway, in terms o f t imely provision o f projections and disbursements (and greater convergence between both), in cash and
141

in kind, and greater use o f national procedures in investment projects. All o f the above i s consistent with the National Harmonization and Alignment Action Plan.
P F M Reform
6.177 During the two years o f implementation o f the governmental action plan to improve PFM (2004-2005), * 86an ambitious process o f reform in different fronts was launched, with relevant progress overall and some stumbling blocks. Commitment o f the government was formally expressed in the National Development Plan. The approval o f Law 550 and i t s amendments showed a positive stance from the executive and legislative branches towards the enhancement o f transparency and management o f public finances. It i s expected that the gradual development o f the participation and consensus building system will improve the mechanisms o f dialogue among government, c iv i l society, private sector and international community in development matters, including PFM.
6.178 At the operational level, there i s financing available to implement the different projects that support PFM modernization.’*’ As for budget support, the public finance area o f the performance assessment matrix (PAM) o f the JFA is aligned with the National Development Plan’s matrix to reform and modernize public administration.
6.179 The strong leadership o f the M H C P has been a key element to implementation o f PFM reforms. The coordination o f the providers o f external assistance in this area has also improved significantly. However, the coordination o f the reform between the M H C P and sector entities has not been equally effective -as evidenced by the initial problems in implementation o f Law 550-. Likewise, the coordination has been weak with regards to the reform o f external auditing, entrusted to the CGR (a constitutionally autonomous entity).
6.180 On the other hand, i t must be recognized that, to a large extent, the reforms achieved have been made with the support o f technical assistance contracted under projects with external financing. Therefore, notwithstanding that the extensive use o f financial management systems and i t s incorporation into the legal framework are signs o f institutionalization, i t s sustainability wil l also depend upon other aspects, mainly: professionalization o f public servants, with the effective application o f merit-based human resource management; and (ii) development o f governmental capacity to formulate, implement, supervise and evaluate modernization projects, particularly as external financing gradually shifts from specific projects to budget support operations.
L
186. 187. Contracting, and -in the case o f the CGR- its Modernization Program.
Based o n the Country Financial Accountability Assessment Report (Wor ld Bank and IDB, 2003). Main ly financing operations for Public Sector Technical Assistance, Efficiency and Transparency in State
142

REFERENCES
Alesina, A. and R. Perotti (1995); “Fiscal expansions and fiscal adjustments in OECD countries.” Economic Policy 2 1 :205-48
Alesina, A. and R. Perotti (1996); “Fiscal adjustments in OECD countries: composition and macroeconomic effects.” IMF Working Paper No. 96/70.
Arcia, Gustavo, and Florencia T. Castro-Leal. 2003. “The Incident o f Public Education Spending in Nicaragua: The Impact o f the Education for All-Fast Track Initiative”. Consulting Report Presented to The World Bank. September 2003.
Banco Central de Nicaragua. 2005 “Mercado Laboral” Estadisticas Mensuales. Subgerencia de Investigaciones Econdmicas. Departamento de Ingresos y DeJlatores. Agosto, 2005.
Bossert, Thomas; Bowser, Diana and Leonor Corea 2001. Studies o f Decentralization o f the Health System in Nicaragua. Final Report. Harvard School of Public Health, September 2001.
Centro de Informacion y Servicios de Asesoria en Salud (CISAS) (2005). h d i c e Latinoamericano de Transparencia Presupuestaria 2005 : Versi6n Nicaragua.
Clements, Benedict, Christopher Faircloth and Mar i jn Verhoeven, 2007, “Public Expenditure in Lat in America and K e y Policy Issues,” Intemacional Monetary Fund, IMF Working Paper W/07/2 1
Contraloria General de l a Republica (2005). Informe de evaluac ih de l a ejecucibn presupuestaria del periodo de enero a diciembre del afio 2004 (l iquidacih).
Contraloria General de l a Republica (2006). Informe de Gesti6n Aiio 2005 a l a Honorable Asamblea Nacional.
Delgado Saenz, Patricia. 2006. “Decentralizacih Fiscal.” AMUNIC, unpublished paper.
ECLAC. 2006. “Panorama Social de AmCrica Latina” LC/G.2326-P/E. Naciones Unidas Informe de la
Gasparini, Paola, et. al. 2006. Evaluation of General Budget Support - Nicaragua Country Report. DFlD
Gil-Diaz, Jose. 2006. “Consultoria sobre e l Analisis de l a Deuda Municipal en Nicaragua-Informe Final.”
Gobiemo de Nicaragua (2006) Informe De Avance Reforma Institucional. Ministerio de l a Familia, D i r e c c i h General de Desarrollo Estrategico. Mayo.
Gobierno de l a Republica de Nicaragua (2003). Plan de accidn gubernamental para mejorar la administracidn de las Jinanzas publicas. Acuerdo del Ministro de Hacienda y Cr td i to Publico, Secretario de Coordinacion y Estrategia de l a Presidencia, Ministro de Educacih, Cultura y Deportes, Ministro de Salud, Director General de Ingresos, Director General de Aduanas y Presidente del Banco Central de Nicaragua.
CEPAL. December 2006
and O E C D D A C .
Gobiemo de la Republica de Nicaragua (2005). Plan Nacional de Desarrollo.
Government o f Nicaragua, Living Standards Measurement Survey, 2005.
G6mez Sabaini, Juan C., and Maximiliano Geffher. 2006. “Nicaragua: e l papel de 10s municipios como instrumento para el combate de la pobreza.” CEPAL - Serie Medio Ambiente y Desarrollo No 13 1. Santiago de Chile: Naciones Unidas.
GTZ. 2005. Informe$nal sobre experiencia y aplicacidn de la Ley 466 de transferencias municipales en el periodo enero-diciembre de 2004. In collaboration with INIFOM (Municipal Development Institute) and UNDP.
143

Gupta, Sanjeev, E. Baldacci, B. Clements and E.Tiongsen (2003), “What Sustains Fiscal Consolidations in Emerging Market Countries? (IMF Working Paper No. 03/224).
Gupta, S., B. Clements, E. Baldacci and C. Mulas-Granados (2004); “The persistence o f fiscal adjustments in developing countries” Applied Economic Letters 11 :209-212
Gupta, S., B. Clements, E. Baldacci and C. Mulas-Granados (2005); “Fiscal policy, expenditure composition, and growth in low-income countries” Journal of International Money and Finance 24:44 1-463
Haque, M., 2004, ‘The Composition o f Public Expenditure and Economic Growth in Developing Countries’, Global Journal of Finance and Economics 1( l), 97-1 17.
Hernani-Limarino, Werner, 2006, “Are Teachers Well Paid in Latin America and the Caribbean?”, Chapter 3 in Vegas, ed. (2006)
Herrera, S. and Pang, G. 2004. Efficiency of Public spending in developing countries: An efficiency frontier approach. World Bank Worlung Paper, December.
Iacovielo, Mercedes, and Laura Zuvanic. 2006. “El Servicio Civi l en 10s Paises Centroamericanos y Republica Dominicana”. Serie de Estudios Econdmicos y Sectoriales RE2-06-031. Washington, D.C. : Banco Interamericano de Desarrollo (BID,), December, 2006.
INEC (2006) “Indicatores Basicos de Pobreza. Encuesta de Medicidn de Nivel de Vida 2005 ” Managua, Deciembre 2006.
INIFOM. 2004. “Anuario de las Finanzas Municipales 2000-2004.” INIFOM y PRODELFIYGTZ.
IMF. 2006. “Nicaragua: Selected Issues” Country Report No. 06/173, Washington, D.C. May, 2006.
IMF. 2006. “Nicaragua-Eleventh Review Ander the Three-Year Arrangement Ander the Poverty Reduction and Growth Facility, Request for Waiver o f Performance Criteria, and Financing Assurances Review”. Nicaragua, Western Hemisphere Department, Approved by David J. Robinson (PED) and Carlo CottareEli (PDR), November, 28, 2006.
International Monetary Fund. 2006. “Nicaragua 2005: Ar t i c le IV Consultation.” IMF Country Report No 061174. May.
International Monetary Fund (2006). Nicaragua: 2005 Ar t i c le IV Consultations, Seventh, Eighth, and Ninth Reviews Under the Three Year Arrangement Under the Poverty Reduction and Growth Facility, Requests for Rephasing and Waiver o f Performance Criteria, Financing Assurances Review, and Request for Extension o f the Arrangement-Staff Report.
International Monetary Fund and World Bank (2004). Policy Note: Municipal Decentralization in Nicaragua: Fiscal and Institutional Issues.
International Monetary Fund and World Bank (IDA) (2006). Joint Staff Advisory Note on the Poverty Reduction Strategy Paper.
Jiron Z. Alden J. 2005. “Aplicacion para 10s 152 Municipios de: Metodologia de Chlculo de la Base Catastral Municipal con Base en Informacion Nacional y Metodologia del Modelo de Determinacion del Potencial Tributario Municipal (MDPTM).” Proyecto de Fortalecimiento Municipal NIC/O 1/CO 1 - FNUDC (Fondo de las Naciones Unidas para e l Desarrollo de la Capitalizacion).
Jir6n Z. Alden J. “Prueba del Sistema de Clasificacion de Municipios.” Proyecto de Fortalecimiento Municipal NIC/Ol/COl - FNUDC (Fondo de las Naciones Unidas para e l Desarrollo de la Capitalizacion).
JUDENIC, 2007, “Investigacion sobre 10s Fondos Asignados a las Universidades del Presupuesto General de la Republica, Nicaragua, manuscript.
144

Lacayo, Carlos. 2006. “Diseiio de Esquema de Cofinanciamiento de las Inversiones Municipales Financiadas por Entes del Nivel Central.” Informe Final. Segundo Proyecto de Desarrollo Rural Municipal (SPDRM).
Loayza, Norman, Pablo Fajnzylber and Char Calderon (2006) “Economic Growth in Latin America and the Caribbean.” World Bank, Latin America and the Caribbean Region.
Lopez Hislop, Javier. “Conclusiones de 10s Estudios del Mercado Retributivo de Doce Instituciones de la Administracion del Estado,” Managua. Diciembre 2003.
Meerhoff, R. 2005. Analisis del Financiamiento del Sector Salud de Nicaragua y de la produccidn de servicios del MINSA y del INSS. World Bank. Washington DC.
Meerhoff, R. 2007. Nicaragua: Analisis del Gasto del Sector Salud. Nicaragua.
Ministerio de Hacienda y CrCdito Publico. Libros del Presupuesto General de la Republica para 2003,
Ministerio de Hacienda y CrCdito Publico. Informes de Liquidation del Presupuesto General de la
Ministerio de Hacienda y CrCdito Publico (2005). Estrategia y plan de accion para e l desarrollo de un
Ministry o f Health. Statistical Bulletins. Nicaragua.
Ministry o f Health. Nicaragua National Health Accounts.
Moncada Laguarta, JosC Omar. 2006. “La Descentralizacion Fiscal en Nicaragua.” Unpublished paper.
Monroy, E. (2006) “Nicaragua: Avanzando hacia la equidad de Genero” Background paper, LCSPP.
Morales, Molina, Antonietta, Bayardo Salmeron and Fhtima Guevara. 2006. “Informe: Diagnostic0 de la situation salarial en el sector salud en Nicaragua”. Managua, Nicaragua. Diciembre 2006.
Morduchowicz, Alejandro and Luisa Duro, 2007, “La inversion en AmCrica Latina y e l Caribe. Las demandas de financiamiento y asignacion de recursos,” (Buenos Aires: CEPAL, febrero).
Nogales, Xavier. 2006. “Nicaragua: Politica Salarial del Gobierno Central.” NogalesdtAsociados, Study Prepared for the MHCP. Con la colaboracidn de 10s setiores Josd Antonio Caballero y Marcelo Nutiez del Prado. Managua, Nicaragua. October, 20, 2006
2004,2005,2006 y 2007.
Republica para 2003,2004 y 2005.
Marco Presupuestario de Mediano Plazo en Nicaragua.
PEFA (2005). Public Financial Management Performance Measurement Framework.
Reine, Jeffiey. 2006. “Proyecto del Servicio Civil: Insumos para la Evaluacion de Medio Termino”
Republic o f Nicaragua. “National Development Plan.” Available as IMF Country Report No. 05/440,
Rofman, R. and Lucchetti, L. (2006) Pension Systems in Latin America: Concepts and Measurements of
Strauch, R and J. Von Hagen (2001); “Fiscal consolidations: quality, economic conditions, and success”
Urnidola, D and K. Tanabe. 2007. Nicaragua Poverty Assessment: Utilization of Health Care Service.
Vegas, Emiliana, Editor. 2006 “Incentives to Improve Teaching”. The World Bank. Lesson from Latin
Proyecto de Asistencia Tdcnica a1 Sector Publico (PSTAC) Crddito 3877-NI. Nicaragua. 2006,
December 2005.
Coverage. Social Protection Discussion Paper No. 061 6, World Bank, Washington D.C.
Public Choice 109:327-46.
Powerpoint presentation. Nicaragua.
America Directions in Development.
145

Verkooijen, Leonardo. 2006. “Poverty Spending in Municipal Transfers.” Consultant report prepared for
World Bank 2001. Nicaragua: Public Expenditure Review. (Report No. 23095-NI) Washington, DC.
World Bank, 2004, Nicaragua: Development Policy Review. (Report No. 29 1 15), Washington, DC
World Bank (IDNIFC) (2005). Interim Strategy Note for the Republic o f Nicaragua.
World Bank. World Development Indicators, 2006, World Bank, Washington DC.
World Bank, 2006 “Incentives to Improve Teaching”. Lesson from Latin America. Directions in Development. Emiliana Vega, Editor.
World Bank. 2007. Key Issues in Central America Health Reforms: Diagnosis and Strategic Implications. World Bank Washington, D.C.
World Bank. 2007. “Key Issues Central America Health Reforms: Diagnosis and Strategic Implications” Volume 11: Main Report. Human Development Sector Management Unit, Latin America and the Caribbean Region. Report No. 36426-LAC. January, 20, 2007.
World Bank and Inter-American Development Bank (2003). Nicaragua: Country Financial Accountability Assessment.
World Health Organization (WHO), 2006.Core Indicators. Geneva.
Nicaragua PRSC 2 Preparation.
http://www.who.int/whr/2005/whr2005 en.pdf
“Construyendo capital social por medio de la reforma fiscal” (Proyecto Regional RS-T1009). Zapata, Juan Antonio. 2006. “El Gasto Pcblico Municipal en Nicaragua.” Paper prepared for
146

Annex A
Annex A Technical Note on the Efficiency o f Public Spending in Nicaragua
A. 1 This Annex discusses the relative efficiency o f public spending in Nicaragua compared to that in other developing countries, summarizing the findings o f ongoing research at the Wor ld Bank*@ and the Inter-American Development Bank’89 on the measurement o f efficiency in public spending.’” In this research, efficiency is measured as the distance between a country’s current input-output combination in the production o f public services and an empirically derived world production possibilities frontier. One such production possibilities frontier i s shown in Figure A.1, along with the different combinations o f Inputs (X) and Outputs (Y) observed in countries A, B and D, which l i e on the frontier, and for countries C and G, which l i e inside the frontier. The countries lying on the production possibilities frontier are characterized by either spending the least amount on inputs among al l the countries producing a similar level o f output, or by producing the greatest output among al l the countries with similar levels o f spending o n inputs.
Figures A.l: The Production Possibilities Frontier (based on Data Envelopment Analysis approach)
0 ‘ x* xc v
Inputs
A.2 Using the construct in Figure Al, efficiency can be measured in terms o f amount o f inputs used or in terms o f outputs produced. The input-oriented measure o f efficiency in country C is calculated as the distance OX* divided by the distance OXc. The output-oriented measure o f efficiency for country C i s calculated as the distance OYc divided by the distance OY*. With L
188. Herrera, Santiago and Gaobo Pang, (2004), “Efficiency o f Public Spending in Developing Countries: An Efficiency Frontier Approach”, Wor ld Bank working paper, December. 189. Machado, Roberto (2006), “El gasto en 10s paises centroamericanos y Republica Dominicana: eficiencia agregada, eficiencia-insumos y eficiencia-resultados”, IDB Work ing Paper, September. 190. The efficiency measurements discussed in this Annex focus o n the narrow concept o f technical efficiency and do not extend to the broader concept o f allocative efficiency, which would require comparable data o n input prices across countries that i s largely unavailable.
147

Annex A
this method o f calculation, all the countries that l i e on the production possibilities frontier exhibit an efficiency measure o f 1.0, while all countries lying inside the frontier (to the right and below) have efficiency measures less than 1 .O.
A.3 Herrera and Pang (2004) have constructed a set o f production possibilities frontiers for a number o f activities in the education and health sectors, using information on public expenditures and output indicators from a sample o f over 140 developing countries. There are eight output indicators in education referring to primary and secondary enrollment (gross and net), average years o f schooling, f i rst and second level completion rates and the literacy rate among youth aged 15-24 years. Each o f these output indicators i s related to total public expenditures in education to derive single-output/single-input measures o f efficiency. 19' The same i s done in health by relating total public expenditures on health and four output indicators referring to l i fe expectancy at birth, DPT immunization, Measles immunization and the disability-adjusted l i fe expectancy (DALE) index, which takes into account both mortality and morbidity.
A.4 While single-inputhingle-output measures o f efficiency are the simplest to calculate, they also have some shortcomings. One is that they do not take into account private spending on health and education. Another is that they do not take into account any factors other than direct spending on health and education that may have a significant impact on sector outcomes. Since different countries rely o n these other factors to varying extents (which may depend in part on their relative prices), single-input measures o f efficiency tend to be biased against those countries that rely least on these other inputs. Similarly, the single-input/single-output measures fai l to acknowledge the existence o f tradeoffs in the delivery o f outputs. For example, countries with the same spending on education may have widely diverging outcomes in one output indicator versus another, depending on the subs-sector emphases given in each country. Focusing o n one single outcome indicator versus another could, therefore, bias the relative measures o f efficiency depending on the outcome indicator chosen. To account for the potential biases associated with single-inputhingle-output based measures, Herrera and Pang (2004) also generate measures o f spending efficiency based on a multiple combination o f inputs and multiple combinations o f outputs. In education, the multiple combination o f inputs includes teachers per pupil and the adult literacy rate, in addition to sector spending levels. In health, the combination o f inputs includes public and private expenditures in the sector, and the adult literacy rate.19*
The Relative Efficiency of Education Spending
AS Table A1 presents the efficiency scores measured for the various outcome indicators in education, both using input-oriented measures and output-oriented measures, as wel l as the single and multiple input/output combinations, wi th data for 1996-2002. These scores are L
191. Instead o f using total public expenditures in the x-axis o f the empirically constructed production possibilities frontier, Herrera and Pang (2004) use an orthogonalized measure o f public expenditures, derived as the difference between actual public expenditures (in education o r health) and the amount predicted o n the basis o f GDP per capita. 192. These estimates o f efficiency are subject to statistical variability. The confidence intervals associated with each efficiency score are fairly easy to calculate for the single inputlsingle output case, but no t so for the case o f multiple inputs and outputs. This is one reason why this paper puts less emphasis o n those findings vis-a-vis the single inputloutput findings.
148
Annex A
presented for Nicaragua and the other Central American countries, together with the average scores exhibited by other regions around the world.
A.6 Table A1 indicates that the efficiency o f public spending on education in Nicaragua i s considerably lower than the Latin American average under the input-oriented measures. Nicaragua scores an average o f 0.52 (for single input/output measures), compared to an average o f 0.57 in Central America and 0.58 for Latin America. A similar picture also emerges from the comparisons o f output-oriented efficiency measures,’93 where Nicaragua achieves an average efficiency score o f 0.47 versus Central America and Latin America averages o f 0.54 and 0.65. Looking at the individual output-oriented measures, Nicaragua appears to exhibit the greatest inefficiencies in the indicators related to secondary education.
A.7 Using multiple inputs and outputs, a similar picture o f relative inefficiency prevails, though somewhat less pronounced than under the single input/output measures. Whi le the absolute efficiency scores in this case are higher than when using the single inputhingle output measure, Nicaragua’s score is lower than the Central and Latin American regional averages, both under the input-oriented and output-oriented measures. Overall, these findings suggest that there i s ample room for increasing the efficiency o f public education spending in Nicaragua, especially at the secondary level.
The Relative Efficiency of Health Spending
A.8 The efficiency scores o f public spending on health are presented in Table A2. Contrary to the picture that emerged in education, the efficiency o f public spending o n health in Nicaragua does not appear to be appreciably different from the average efficiency scores achieved in the Central and Latin America regions. Using the input-oriented single input/output measures, for example, Nicaragua exhibits an efficiency score o f 0.65, compared to an average o f 0.65 in Central America and o f 0.69 in Lat in America and the Caribbean. Using the output-oriented measures, Nicaragua’s average efficiency score o f 0.90 is virtually identical to the Central America and L A C averages o f 0.91 and 0.90. The same efficiency picture emerges when using multiple inputs and outputs, with Nicaragua exhibiting similar scores to the two regional averages.
L
193. A number o f countries exhibit contrary patterns in efficiency, showing a relatively high efficiency score under the input-oriented measure and a relatively l o w measure under the output-oriented measures, or vice-versa. This i s most notable in the cases o f Guatemala and Panama, and may be related to the concave curvature o f the production possibilities frontier, which reflects decreasing returns to scale. Nicaragua (and Honduras), however, exhibit very l o w efficiency scores under bo th measures.
149

Central America and Panama PAN
0.68 0.80 0.61 0.62 0.24 0.31 0.25 0.63 0.52
Other Regional Averages Ave.1 LAC AFR EAP ECA MNA SAS
0.75 0.75 0.70 0.72 0.29 0.32 0.29 0.72 0.57
0.74 0.69 0.74 0.67 0.65 0.75 0.77 0.68 0.78 0.72 0.68 0.71 0.69 0.65 0.69 0.67 0.63 0.70 0.69 0.64 0.71 0.71 0.64 0.72 0.32 0.21 0.36 0.37 0.18 0.25 0.36 0.21 0.43 0.48 0.20 0.26 0.32 0.22 0.37 0.33 0.19 0.27 0.72 0.66 0.73 0.86 0.63 0.72 0.58 0.50 0.60 0.60 0.48 0.55
EDU 22 gross 0.85 0.73 0.87 0.96 0.83 0.72 0.83 EDU 32 gross 0.88 0.75 0.94 0.99 0.85 0.78 0.87 EDU 32 net 0.87 0.78 0.94 1.00 na 0.91 0.90 EDU 33 0.86 0.91 0.98 1.00 0.92 1.00 0.94 EDU 33 BL na 0.73 0.95 1.00 0.87 1.00 0.91
Average 0.86 0.78 0.93 0.99 0.87 0.88 0.89
OUTPUT-Oriented Measures Single InpuffSingle Output
Primary Enrollment -- Gross 0.73 0.76 0.86 0.81 0.79 -- Net 0.80 0.91 0.88 0.84 0.82
Secondary Enrollment -- Gross 0.43 0.43 0.46 0.30 0.26 -- Net 0.37 0.48 0.48 0.28 na
Average Years of Schooling 0.42 0.56 0.48 0.32 0.44 First Level Complete 0.22 0.29 0.32 0.33 0.29 Second Level Complete 0.07 0.11 0.04 0.06 0.20 Youth Literacy Rate (ages 1524) 0.74 0.98 0.88 0.79 0.85
Average 0.47 0.56 0.55 0.47 0.52
0.82 0.88 0.83 0.72 0.73 0.91 0.89 0.92 0.89 0.86 0.92 0.96 0.93 0.87 0.94 0.93 0.92 1.00 0.89 0.91 0.97 0.94 0.80 0.95 0.89 0.91 0.97 0.94 0.81 0.95 0.88 0.90 0.92 0.88 0.84 0.95
0.77 0.79 0.98 0.88 0.53 0.40 0.64 0.45 0.79 0.50 0.43 0.31 0.49 0.16 0.97 0.87 0.70 0.54
Multiple Inputs & Outputs EDU 22 gross 0.77 0.77 0.86 0.81 0.79 0.78 0.80 EDU 32 gross 0.86 0.78 0.89 0.97 0.82 0.78 0.85 EDU 32 net 0.83 0.91 0.92 1.00 na 0.98 0.93 EDU 33 0.84 0.99 0.98 1.00 0.93 0.10 0.96 EDU 33 BL 0.75 0.70 0.82 1.00 0.77 1.00 0.84
Average 0.81 0.83 0.89 0.96 0.83 0.73 0.87)0.91 0.83 0.92 0.92 0.87 0.91
The combinations of multiple inputs and outputs referred to above are as follows:
EDU 22 gross pub. exp.; teachers/pupils gross primarylsecondary enroll. EDU 32 gross gross primarylsecondary enroll. EDU 32 net net primarylsecondary enroll. EDU 33 Ist/ 2nd level complete; youth lit. EDU 33 BL 1 st/ 2nd lev.comp.; ave.yrs.sch.
Note: these figures represent the measurements based o n the Data Envelopment Analysis model with varial returns to scale. Source: Based o n data for 1996-2002, f rom Herrera, S. and G. Pang (2004).
Inputs outputs
pub. exp.; teacherslpupils; adult liter. pub. exp.; teachers/pupils; adult liter. pub. exp.; teacherslpupils; adult liter. pub. exp.; teacherslpupils; adult liter.
0.82 0.62 0.79 0.72 0.67 0.93 0.64 0.93 0.90 0.79 0.61 0.23 0.50 0.70 0.54 0.66 0.26 0.58 0.84 0.60 0.60 0.32 0.63 0.79 0.53 0.36 0.19 0.49 0.50 0.22 0.24 0.09 0.37 0.38 0.26 0.94 0.72 0.95 0.99 0.88 0.65 0.38 0.66 0.73 0.56
Annex A
.e
0.72 0.78 0.39 0.44 0.38 0.20 0.22 0.66 0.47
0.85 0.68 0.83 0.80 0.71 0.79 0.89 0.82 0.88 0.89 0.91 0.90 0.96 0.79 0.97 0.96 0.92 1.00 0.98 0.98 1.00 1.00 0.99 0.99 0.86 0.86 0.94 0.93 0.80 0.89
150

Annex A
I Central America and Panama
II
Other Regional Averages
.ife Expectancy at Birth 0.63 1.00 0.63 0.71 0.65 0.56 0.70 nmunization DPT 0.63 0.53 0.66 0.71 0.68 0.55 0.63 nmunization Measles 0.72 0.53 0.69 0.71 0.73 0.53 0.65 )isabilityAdjusted Life Expectancy 0.63 0.61 0.63 0.71 0.65 0.58 0.64
Average 0.65 0.67 0.66 0.71 0.68 0.55 0.65
0.69 0.65 0.72 0.58 0.73 0.69 0.68 0.66 0.73 0.63 0.76 0.71 0.69 0.65 0.73 0.67 0.76 0.71 0.70 0.65 0.72 0.60 0.71 0.69 0.69 0.65 0.73 0.62 0.74 0.70
Multiple Inputs & Outputs iealth 22 0.81 1.00 0.79 0.88 0.81 0.80 0.85 iealth 32 DPT 0.81 1.00 0.79 0.89 0.81 0.80 0.85 iealth 32 MEA 0.91 1.00 0.79 0.89 0.82 0.80 0.87 iealth 33 0.81 1.00 0.79 0.89 0.81 0.91 0.87
Average 0.84 1.00 0.79 0.89 0.81 0.83 0.86
OUTPUT-Oriented Measures
.ife Expectancy at Birth 0.89 1.00 0.91 0.85 0.86 0.97 0.91 nmunization DPT 0.91 0.90 0.95 0.79 0.96 0.96 0.91 nmunization Measles 0.98 0.88 0.96 0.83 0.98 0.92 0.93 )isability Adjusted Life Expectancy 0.84 0.96 0.89 0.79 0.88 0.95 0.88
Average 0.90 0.93 0.93 0.81 0.92 0.95 0.91
Single InpuVSingle Output
iealth 22 0.94 1.00 0.95 0.89 0.96 0.98 0.95 iealth 32 DPT 0.94 1.00 0.95 0.89 0.96 0.98 0.95 iealth 32 MEA 0.99 1.00 0.96 0.89 0.98 0.97 0.96 iealth 33 0.94 1.00 0.96 0.89 0.96 0.99 0.96
Average 0.95 1.00 0.95 0.89 0.96 0.98 0.96
0.82 0.85 0.82 0.72 0.91 0.93 0.83 0.86 0.82 0.74 0.91 0.94 0.83 0.86 0.82 0.77 0.91 0.94 0.87 0.86 0.82 0.80 0.93 0.94 0.84 0.86 0.82 0.76 0.92 0.94
0.93 0.81 0.91 0.97 0.97 0.96 0.94 0.81 0.91 0.97 0.97 0.96 0.94 0.80 0.91 0.96 0.98 0.96 0.95 0.82 0.91 0.97 0.98 0.97 0.94 0.81 0.91 0.97 0.98 0.96
0.92 0.63 0.87 0.91 0.90 0.83 0.87 0.62 0.83 0.95 0.90 0.75 0.91 0.63 0.83 0.95 0.90 0.71 0.90 0.56 0.83 0.90 0.86 0.79 0.90 0.61 0.84 0.93 0.89 0.77
l e returns to scale. Source; Based on data for 1996-2002, from Herrera, S. and G. Pang (2004).
T h e Scope for Efficiency Gains
A.9 Based on the preceding comparisons, there i s potentially much scope for improving the efficiency o f Nicaragua’s public spending in education and to a lesser extent also in health. Considering the single-variable, input-oriented measures o f efficiency, where Nicaragua exhibits an average score o f 0.50 in public education spending under both the input and output oriented measures, there is room for raising efficiency by around 50 percentage points through the adoption o f practices applied by the countries at the efficiency frontier. According to this result, Nicaragua could in principle reduce its total public spending on education by ha l f with the adoption o f such practices, and s t i l l achieve the same education outcomes as i t currently has. Or alternatively, i t could double the value o f i t s outcome indicators by adopting such practices while maintaining the level o f public education spending the same. In health, there appears to be
151

Annex A
potential room for increasing efficiency by 35 percentage points or by 10 percenta e points, depending on whether an input-oriented or output-oriented efficiency measure is used. 1k
Efficiency Scores at 75th Percentile of: World Distribution I LAC Distribution
Potential Efficiency Gain Nicaragua w.r.t. 75th percentile of:
I I Score Country I Score Country I INPUT-Oriented Measures (Single InpuVSingle Output)
Disability Adjusted Life Expectancy Average
EDUCATION Primary Enrollment - Gross
Secondary Enrollment -- Gross
Average Years of Schooling First Level Complete Second Level Complete Youth Literacy Rate (ages 15-24)
-- Net
-- Net
Average HEALTH
Life Expectancy at Birth Immunization DPT Immunization Measles Disability Adjusted Life Expectancy
Average
0.92 Hungary 0.96 Costa Rica 0.95 0.96 0.90 0.04 0.06
0.76 Romania 0.79 Syria 0.71 Armenia 0.73 Georgia 0.31 Turkey 0.36 Mexico 0.33 Peru 0.77 Oman 0.60
0.70 Fiji 0.71 China 0.73 Honduras 0.71 St. Kitts & Nevis 0.71
0.86 El Salvador
0.73 Chile
0.39 Chile 0.40 El Salvador 0.40 El Salvador 0.81 El Salvador
0.91 PeN
0.74 PeN
0.66
0.71 Guatemala
0.73 Honduras 0.71 Guatemala 0.72
0.71 PeN
I OUTPUT-Oriented Measures (Single InpuVSingle Output) EDUCATION
-- Net
- Net
Primary Enrollment - Gross
Secondary Enrollment - Gross
Average Years of Schooling First Level Complete Second Level Complete Youth Literacy Rate (ages 15-24)
Averag HEALTH
Life Expectancy at Birth Immunization DPT Immunization Measles
0.81 Guatemala 0.96 Tonga 0.68 Czech Rep. 0.79 Tajikistan 0.64 Jordan 0.38 Philipines 0.32 Hungary 0.99 Jordan 0.70
0.94 St. Lucia 0.96 Latvia 0.96 Jordan
0.86 El Salvador 0.98 Panama 0.71 Chile 0.76 Guyana 0.72 Trinidad & Tob. 0.39 Mexiw 0.27 Peru 0.99 Argentina 0.71
0.96 Trinidad & Tob. 0.94 Trinidad & Tob. 0.96 Brasil
score
0.71 0.69 0.67 0.69 0.23 0.23 0.23 0.69 0.52
0.63 0.63 0.72 0.63 0.65
0.73 0.80 0.43 0.37 0.42 0.22 0.07 0.74 0.47
0.89 0.91 0.98 0.84
World LAC Distribution
(% reduction in cost) 0.06 0.17 0.13 0.25 0.05 0.06 0.05 0.07 0.27 0.42 0.37 0.44 0.32 0.44 0.10 0.14 0.13 0.21
0.10 0.12 0.11 0.11 0.02 0.02 0.12 0.12 0.09 0.09
(% increase in outcomes) 0.10 0.17 0.21 0.23 0.59 0.66 1.14 1.06 0.51 0.70 0.73 0.77 3.44 2.75 0.35 0.35 0.48 0.50
0.05 0.08 0.06 0.03 -0.02 -0.02 0.10 0.15
Source: Lachler, based o n data for 1996-2002 f rom Herrera and Pang (2004).
A. 10 While countries should certainly strive to position themselves on the efficiency frontier, the measures and reforms needed to achieve a position on the frontier may be beyond the present political or technological capacity o f many developing countries. I t i s more reasonable to assume that, through a concerted reform effort, a country may raise i t s efficiency scores to the levels attained by countries that rank at the 75th percentile o f the world or regional distribution o f efficiency scores. Comparing Nicaragua’s efficiency scores with the scores prevailing in these countries, therefore, would provide a more realistic measure o f potential efficiency gains than the earlier comparison with the countries at the efficiency frontier. Such a comparison i s camed out in Table A3.
L
194. These percentage point differences in health spending are derived as the simple differences between the efficiency score at the efficiency frontier (1.0) and the average score (single inpudsingle output) exhibited by Nicaragua under the input-oriented measure (0.65) and under the output-oriented measure (0.90).
152

Annex A
A.11 Table A 3 presents the scores achieved by the countries that rank at the 75'h percentile o f the world distribution and o f the L A C distribution o f efficiency scores for each social sector indicator, and compares them to the scores obtained for Nicaragua. The last two columns in Table A 3 indicate the potential efficiency gain that could be had by moving toward the top quarter o f the distribution. Using the input-oriented measures, these figures suggest that Nicaragua could reduce i t s total spending in education by between 13 and 21 percent (depending on whether the World or L A C distribution o f efficiency scores i s used as the comparator) without sacrificing education outcomes. In health spending, the fiscal savings through these potential efficiency gains are more modest, averaging 9 percent. 195
A.12 Using the output-oriented efficiency measures, the results in the lower ha l f o f Table A 3 suggest that Nicaragua could raise i t s average education outcomes by close to 50 percent, while keeping total education spending the same. Again, the potential efficiency gains in health are more limited, averaging between 4 and 6 percent.'96
Explaining Variations in Efficiency Across Countries
A.13 Herrera and Pang (2004) also have made an attempt to identify some o f the factors that explain efficiency scores across counties. This i s done by examining the statistical association between the efficiency scores discussed earlier and several explanatory variables through a Tobit regression analysis, using country sub-samples o f varying sizes over two time periods. The independent variables used in this regression analysis are (i) the overall size o f government expenditure, (ii) the size o f the public wage bill, (iii) per-capita GDP, (iv) the degree o f urbanization, (v) the prevalence o f HIV/AIDS, and (vi) the degree o f income inequality. The main findings from these regressions are the following:
Larger government expenditures are negatively associated with efficiency scores. This suggests that there is a trade-off between efficiency and size o f public expenditure, which may be reflecting eventually declining economies o f scale in the provision o f public services. Higher wage expenditures are negatively associated with efficiency scores in education, but not in the context o f health indicators. Higher wage bills may be reflecting the prevalence o f stronger unions in the public sector, which generally does not promote sector efficiency. Urbanization i s positively associated with efficiency scores in almost al l output indicators in both sectors, except for L i f e Expectancy. The positive association is possibly reflecting the greater economies o f scale in the delivery o f public services available to a more concentrated population, while the negative association with the efficiency indicator for L i f e Expectancy may be reflecting a greater incidence o f crime and opportunities for dissolute living in urban areas.
0
L
195. These potential fiscal savings were calculated as (1 - (EW E*)), where EH represents the efficiency score exhibited by Nicaragua and E* represents the efficiency score exhibited by the country at the upper 25th percentile o f the L A C or Wor ld distribution. 196. These potential percentage increases in outcome indicators were calculated as ((E*/ EH) - l), where EH represents the efficiency score exhibited by Nicaragua and E* represents the efficiency score exhibited by the country at the upper 25th percentile o f the LAC or W o r l d distribution.
153

Annex A
0
0
HIV/AIDS prevalence i s negatively associated with efficiency in the health sector, as would be expected, but yields mixed results in education. The Gini coefficient measuring income inequality i s negatively associated with efficiency in education, but shows no systematic relation in health.
Efficiency of Public Spending in Terms of Overall Performance
A. 14 Machado (2006) has recently extended the preceding analysis to measure the operational efficiency o f public spending in terms o f a country’s overall development performance, for a sample o f 19 Latin American countries over the period o f 1990-2003. In this analysis, overall economic performance is measured through a set o f indicators in seven areas: distributive equity, macroeconomic stability, economic performance, education, health, institutional development and poverty level. 97
Table A.4 Indicators o f Public Sector Performance in Lat in America Macro Economic
Argentina Belize Bolivia Brasil Chile Colorn bia Costa Rica Ecuador El Salvador G ua ternala Honduras Mexico Nicaragua Panama Paraguay Peru Dominican Rep. Uruguay Venezuela
Equity Stability Perform. Education Health Inst. Dev. Poverty
0.99 0.10 1.01 1.09 1.04 0.76 1.29 na 1.12 1.31 0.98 1 .oo 1.62 na
0.87 2.19 0.95 1.01 0.89 0.66 0.54 0.91 0.48 0.88 1.03 0.98 1.19 0.82 0.92 0.84 1.33 1.01 1.08 2.69 1.92 0.90 0.61 0.88 0.98 1.01 0.50 0.82 1.05 0.94 1.20 1.04 1.09 2.10 1.94 0.98 0.42 0.84 1.06 1.03 0.38 0.45 1 .oo 1.30 1.03 0.95 0.98 1.10 0.32 0.95 5.16 1.03 0.90 0.94 0.39 0.49 0.97 0.81 0.94 0.95 0.95 0.56 0.42 1.06 0.45 0.97 1.06 1.04 1.22 0.70 1.22 0.69 0.92 0.91 0.97 0.78 0.23 0.93 2.12 1.14 1.06 1.04 1.37 1.05 0.91 0.77 0.77 1 .oo 0.99 0.22 0.56 0.96 0.28 1.03 1.04 0.98 0.75 0.49 1.02 0.50 1.19 0.96 0.94 0.87 0.65 1.17 0.12 0.82 1.04 1.04 1.83 4.73 1.19 0.08 0.74 1.03 1.02 0.00 0.58
Performance Indexes calibrated to average 1 . O Overall
1.15 1.43 0.63 0.80 1.57 0.64 1.64 0.86 0.84 0.80 0.58 1.19 0.82 1.34 0.55 0.86 0.84 1.58 0.87
Average 1 .oo 1 .oo 1 .oo 1 .oo 1 .oo 1 .oo 1.00 I 1 .oo Source: Machado (2006), Table 5 .
A.15 Table A4 presents the performance scores for each indicator, as well as an overall performance score that i s calculated as a simple average o f the other scores. (Note that each o f L
197. 0
These performance indicators were constructed as follows: Distributive equity i s measured by the Gini index. Macroeconomic stability i s measured by the variance o f the growth rate and the inf lat ion rate over the period 1990-2003. Economic performance is measured by the average rate o f growth and the average unemployment rate (both averaged over 1990-2003), and GDP per capita in 2004 (based o n PPP). Education performance is measured by the literacy rate and the primary enrollment rate. Health performance i s measured by l i fe expectancy at birth and the infant mortality rate. Institutional development i s measured with the indicator developed in Kaufman, K r a y and Mastruzzi (2006); and Poverty is measured by the percentage o f the population living with less that 2 US$ per day in 2003.
154

Annex A
the indicator measures has been calibrated so that i t averages 1 .O across al l countries.) Nicaragua scores below the average in each one o f the performance indicators, except for the distributive equity indicator, and exhibits the largest shortfalls in the area o f poverty. Offhand, one would expect Nicaragua to score below the regional averages, as most o f these performance indicators tend to be positively correlated with the level o f per capita GDP and considering that Nicaragua represents one o f the poorest countries in Latin America; see the right hand side o f Table A5, which compares the levels o f per capita GDP in 2004 (expressed in Purchasing Power Parity terms).
Table A.5: Public Expenditure Levels Public Expenditures GDPlcapita I
Argentina Belize Bolivia Brasil Chile Colombia Costa Rica Ecuador El Salvador Guatemala Honduras Mexico Nicaragua Panama Pa rag uay Peru Dominican Rep. Uruguay Venezuela
Total Social Education Health (percent of GDP, average 1990-2003)
25.0 16.1 3.4 3.7 20.7 12.0 4.9 2.5 23.3 7.5 4.2 1 .o 45.5 25.3 5.2 4.2 20.8 13.5 3.2 2.5 18.1 6.3 2.1 1.7 21.8 13.1 3.7 4.0 17.7 5.3 2.2 0.8 13.8 5.2 2.1 1.2 11.7 4.9 2.1 1 .o 24.6 8.5 4.7 2.7 19.6 10.5 4.5 2.9 20.4 7.7 3.4 2.9 21.3 9.1 2.4 3.1 13.5 5.8 2.8 0.8 17.7 7.3 2.6 1.5 15.6 6.2 2.4 1.4 28.2 18.9 2.8 2.6 20.1 7.4 3.2 1 .I
2004 I (in PPP US$)
$1 2,222 $6,201 $2,499 $7,531 $9,994 $6,669 $8,714 $3,643 $4,633 $3,964 $2,644
$3,340 $6,689 $4,423 $5,219 $6,846 $8,658
$9,010
$5,554
Average 21 .o 10.0 3.3 2.2 $6,2341 Source: Machado (2006), Table 7 and Table 8. Total public spending refers to the consolidated general government, including social security, while social spending refers to public spending on education, health and nutrition, social security, labor and social assistance, housing and water & sanitation.
A.16 Table A5 also presents the level o f public expenditures in each country as a fraction o f GDP for different expenditure categories. Total public spending as a share o f GDP in Nicaragua is slightly below the regional average (20.4 percent versus 21 percent). Also, the share o f total social spending in Nicaragua i s below the regional average, even though the share o f public sector spending on health and education i s slightly higher than the regional average. Arguably, the performance indicators reviewed earlier are influenced by public policies and actions, which are related, in turn, to the amount o f public spending. This lends i tself to estimating the efficiency o f public spending by comparing the relative scores o n the overall performance indicators to the relative amounts o f total public spending. Similarly, the relative scores on the poverty performance indicator are compared to the relative level o f social spending, as shown next.
155

Annex A
Table A.6 Public Spending Efficiency Scores in Terms of Overall Performance (Efficiency scores are based on the Free Disposable Hull approach)
Inp ut-orien fed Outcome-oriented Guatemala Belize Ecuador Costa Rica Venezuela El Salvador Nicaragua Chile Panama Bolivia Uruguay Paraguay Mexico Honduras Peru Dominican Republic Argentina Colombia
1 .oo 1 .oo 1 .oo 1 .oo 1 .oo 1 .oo 0.94 0.91 0.90 0.80 0.78 0.78 0.73 0.71 0.70 0.60 0.42 0.38
Guatemala Belize Ecuador Costa Rica Venezuela El Salvador Peru Dominican Republic Uruguay Chile Nicaragua Panama Mexico Bolivia Colombia Argentina Paraguay Honduras
1 .oo 1 .oo 1 .oo 1 .oo 1 .oo 1 .oo 1 .oo 0.98 0.96 0.96 0.95 0.94 0.83 0.79 0.74 0.70 0.69 0.67
Brasil 0.14 Brasil 0.49 Source: Own calculations based on figures in Machado (2006)
A.17 Table A6 presents the efficiency scores obtained by dividing each country’s overall performance score in Table A4 by that country’s total amount o f public spending per capita,’98 and comparing the resulting ratio to the indicator achieved by countries situated on the efficiency frontier. Nicaragua’s efficiency scores turn out to be close to the median scores for al l the countries in the region. These findings suggest that Nicaragua does not stand out as particularly inefficient fi-om an overall public spending perspective, compared to other countries in the region. The earlier sector-specific findings, however, also suggest that Nicaragua needs to devote special attention to the quality o f education spending, which appears to have been much less efficient than other countries in the region..
L
198. The data o n publ ic spending per capita was calculated by multiplying the first and the last columns in Table A5. The resulting efficiency scores presented in Table A6 dif fer from the ones derived by Machado (2006), who uses the GDP-share o f publ ic expenditures, rather than the per-capita amounts employed here.
156

Annex B
Domestic Economic Parameters Real GDP growth (%) Nominal domestic interest rate ($ indexed. %) Real domestic interest rate (%) Inf lat ion rate (YO) Monetary base (% o f GDP)
External Economic Parameters Nominal (concessional) interest rate (%) Real (concessional) interest rate (YO) Dollar inf lat ion rate (%)
Rate o f currency depreciation (Y) Primary fiscal surplus (YO o f GDP) Base money expansion rate (%)
Nominal value o f external debt (YO o f GDP) NPV o f external debt (% o f GDP)
Policy Parameters
External Debt Level
Growth o f external debt parameter 1/
Annex B Basic Parameter Assumptions Underlying the Fiscal Sustainability Analysis
Symbol
g i r
m
i* r* A*
A
& S e
b o * B P
The figures for the NPV o f the future stream o f public revenues shown in Table 2.7 were calculated on the basis o f equation (13) o f Annex A o f the 2004 Nicaragua DPR.’99 That equation i s reproduced below:
variable 12.0 10.0 8.1 8.5
3.0 1 .o 2.0
6.0 variable - -
104.0 30.0 variable
b o = [s + me/(l+y)][(l+g)/(r-g)] + [ab,*/(l-ap)][p - (l+r*)/(l+g)].
variable 10.0 8.0 8.9 7.3
3.0 1 .o 2.0
5.0 variable - -
70 35.0 variable
Each o f the parameters contained in this equation i s defined in the table below, except for two composite parameters, a and y. The f i rst o f these i s defined as, a = (l+g)/( l+r), while the second denotes the nominal rate o f GDP growth, such that (19) = (l+g)( 1%).
The figures presented in Table 2.7 in Chapter I1 can be derived by inserting the parameter values for 2006 from the tables below, together with various combinations o f values for real GDP growth (g), the fiscal surplus ratio (s) and assumptions about donor lending behavior (p). (For reference, the parameter values that applied in 2003 are also shown.)
Kev Macroeconomic Parameter Values for Nicaragua in 2003 and 2006 Values
2003 I 2006
L
199 Wor ld Bank, (2004) “Nicaragua Development Pol icy Review: Sustaining Broad-Based Growth” (Report No. 29115-NI), December 3.
157

Annex B
158

Annex C
Annex C
Review of Public Spending on Education
Main Findings of Previous Reviews
C.l The 2001 PER recorded important accomplishments in the education sector since the 1990s, particularly with respect to expanding infrastructure and increasing access. An important milestone noted in the study was the substantive progress made on moving forward school autonomy efforts by decentralizing management and finance functions in the schools and by fostering active parental and community participation in decision-making at the school level. Despite visible gains in school enrollment and the sector’s important shift towards decentralization and school autonomy, the study highlighted the need to focus on increasing access to init ial and preschool education for the cohorts aged 0-3 and 4-6, whose participation rates were found to be wel l below regional averages.
C.2 The PER highlighted the existence o f a variety o f programs aimed at addressing similar objectives. Too often, however, programs lacked coordination and targeting. Greater selectivity in investments in infrastructure was suggested in order to strike an effective balance between building new school infrastructure and ensuring proper maintenance o f existing classrooms to reduce unusually high rates o f deterioration. For this purpose, the PER had recommended greater reliance o n the Preventive Maintenance Fund (PMF) operated by FISE as wel l as an in-depth study to ascertain with more precision the current stock and quality o f classrooms and related school infrastructure. Finally, the review found few programs targeted at improving curricula relevance, school retention at a l l levels and rural and disadvantaged populations who have the least access and survival in the formal school system.
C.3 The 2003 Poverty Assessment noted progress in improving primary education indicators, which gives some comfort in terms o f ensuring the achievement o f the Mi l lennium Development Goals (MDG) for education by 2015. At the same time, the assessment found litt le progress o n improving other key education outcomes, such as adult literacy levels or increased access to early childhood education and secondary education. In general, the assessment noted the critical role o f education in raising welfare levels in rural and urban areas, particularly among females. Female literacy was found to be a factor associated with the probability o f school attendance among children f rom extreme poor households. The assessment recommended the (i) establishment or scaling up o f programs targeted to vulnerable families with an integrated package o f services to help infants and preschool children with improvements in nutrition status and cognitive development; (ii) design programs and mechanisms to reduce the direct and indirect costs o f schooling for children and young people f rom extremely poor households for whom schooling costs are a major bamer to either enrollment or retention.
C.4 The 2004 Development Policy Review (DPR) also recorded continued improvements in education indicators and significant progress on institutionalizing management and administrative policies to improve service delivery and accountability at school level, most notably the continuation o f the school autonomy program. The review also pointed to immediate remaining challenges that needed to be addressed in order to reach the Mi l lennium Development Goals (MDGs) by 2015. Chief among these are the need to accelerate efforts to increase the completion rate o f the 6-year primary education cycle, particularly in rural areas where almost a third o f children aged 7 to 12 were not in school, improving teacher qualification levels and strengthening institutional capacity in the Ministry o f Education to monitor programs, measure impacts and improve accountability at a l l levels. Given the constrained fiscal capacity o f Nicaragua, which leaves l i t t l e room to increase expenditures education in a way that would be commensurate with current and emerging needs in post primary education, the review suggested to focus,
159

Annex C
at least in the short to medium term, on efforts to increase the efficiency o f expenditure and improve the quality o f the programs being offered in order to achieve better outcomes with the same level o f spending.
C.5 The main recommendations emanating f rom the DPR are to (i) accelerate the implementation o f the school autonomy program, (ii) develop a vision to de-concentrate sector responsibilities to municipal level, especially functions related to administrative and pedagogical support to schools, (iii) scale down redundant functions at the central level, clarify roles and responsibilities at central level and improve the technical profi le o f Ministry officials, (iv) undertake a more systemic and comprehensive development o f the various levels o f the sector, particularly at secondary education to bring enrollment and financing in Nicaragua at par with regional and international levels, (v)promote greater accountability at school level by using the results f rom national student assessments to in form parents and assist teachers to improve their performance, and (vi) develop a human resource strategy with a particular emphasis o n raising the profi le o f teaching professionals and improve the quality o f teacher education programs.
C.6 The preceding analytical studies have been consistent in their findings and recommendations: it i s clear that Nicaragua will need to continue i t s efforts towards increasing access to primary education, particularly in rural areas and amongst vulnerable population groups to ensure it achieves the MDG o f universal completion o f primary education by 2015. At the same time, improving the quality o f primary education programs i s essential to ensure the gains achieved thus far are sustained in the medium to long term. In addition, as the primary education system expands, i t i s important to increase investments in other levels o f the system, most notably early childhood development, pre-school and secondary education. Since substantial investments in the sector are not l ikely to materialize in the short to medium term, nor are the required expenditures to reach strategic milestones in those levels wel l defined, i t i s imperative that the Ministry improves the efficiency o f current expenditure, whi le additional public and external resources are sought to cover much-needed investments in early childhood and secondary education. The next section takes stock o f recent developments in sector indicators, outcomes and expenditure to shed light on the l ikely magnitude o f expenditures needed in the medium term to expand coverage in pre- and post-primary education.
C.7 Among the most noteworthy events that have taken place in the sector since the publication o f the 2001 PER, have been the passage o f the Education Participation L a w and approval o f the Education for All - Fast Track Initiative (EFA-FTI). The Education participation L a w (413) was passed in 2002 thus providing a legal framework to scale up rapidly the incorporation o f schools into the autonomous program with financial assistance from external partners. The EFA FTI Secretariat approved and disbursed financial allocations to Nicaragua worth U S D 7 mil l ion for 2004-2005 and an additional U S D 10 mi l l ion for 2006-2007. Specific activities to be financed by the EFA FTI are incorporated in the Common Work Program and i t s corresponding Annual Program o f Activities. Whi le the Ortega administration has embraced the EFA FTI, it has expressed concerns with aspects o f the Education Participation Law, particularly with the financial transfers provided to the schools. In fact, for the academic year beginning in 2007 al l financial transfers to the schools were stopped pending a final decision on MINED for a way forward. The next section will provide a more detailed description o f the concerns and possible implications for the sector in broad terms and for the current education program supported with an IDA Credit.
Trends in Education Indicators
C.8 Access and internal efficiency. Enrollment in primary education has increased in absolute terms from 838,437 students in 2000 to nearly 1 mi l l ion in 2006; representing an average annual growth rate o f about 2.1 percent over the period 2000-2006; Table C. l . The increase responds to greater efforts to increase f irst time enrollment in grade 1 to cater for the natural growth in the school age population. The positive trend i s supported by data f rom the two most recent household surveys, which highlights a
160

Annex C
Teacher Education Adult Education Total
decline in the proportion o f children aged 7-12 not attending school f rom 12.1 percent in 2001 to 9.4 percent in 2005. Whi le the decline in the proportion o f non-attendance i s most evident amongst children fi-om extremely poor households, f rom 27 percent to 21 percent f rom 2001 to 2005, respectively, the proportion o f children out o f school remains extremely high and, therefore, in need for urgent attention.
7,460 6,201 6,774 6,243 5,886 5,351 5,479
1,146,240 1 1,458,314 1,553,289 1,563,411 1,634,052 1,674,699 1,710,347 51,293 83,413 78,316 66,347 89,074 91,961 99,623
C.9 In an effort t o target programs aimed at this population, MINED i s actively working to identify needs and service gaps at municipal level to target and strengthen educational programs in underserved areas. An annual report with information on the status o f educational indicators across departments and municipalities and their relative ranking according to an index o f indicators i s being used to plan investments and design programs (Indice del Estado Educativo Municipal). According to the latest report, published in December 2006, the highest rankings were observed in the Departments o f Carazo, Chinandega, Masaya, Esteli and Leon while the lowest ranlungs were observed in the Departments o f Matagalpa, RAAN and R A A S . The five municipalities with the highest enrollment rates and efficiency were Cinco Pinos, Moyogalpa, Puerto Morazan, Jicaral and San Juan del Sur.
C.10 In terms o f the distribution across levels o f education, the primary education level holds the largest proportion o f the enrolled population, Figure C . l . Whi le the proportion changed from 1995 to 2001, f rom 66 percent to 59 percent in 2001, the proportion has remained almost constant over the last f ive years. The changes in the school pyramid are mostly due slight increases in access to preschool and secondary education.
Figure C. l - Proportion o f Enrollment by Level 1994-2006
I I I
1
m u " g s s z E g g a s " 3 3 N N W R
Preescolar Primaria Secundaria 1 Form. Docente Educ. Adultos
161

Annex C
Average Level 2001 2002 2003 2004 2005 2006 2001-2006 SDecial Education 6.38% -3.09% 6.87% -3.44% -0.39% 0.54% 1.44%
C.11 The net enrollment rate in preschool education increased from 31.8 percent in 2000 to 41.7 percent in 2005. In primary education the net enrollment rate increased from 84.1 in 2000 to 91.9 in 2005 and from 36.8 percent to 44.3 percent in secondary education over the same time period.*" In 2005 the official age at entry in the f i rs t grade was also reduced f rom 7 years to 6 years to promote an earlier entrance into the formal school system, which i s consistent with international best practice. T h e pol icy appears to be yielding results: in 2005, approximately 75 percent o f f i rs t graders in urban areas where in the appropriate age range (6 and 7). In rural areas, however, only 54 percent were in the appropriate age bracket; in fact, a third o f f i rs t graders were 9 years or older. Overall, the highest annual growth rates in enrollment for the 200 1-2006 period are preschool and secondary education, which i s consistent with the existing policy framework supported by the PRSP and the Common Work Program at the sector level.
Source: Indicadores MECD. Incluye Toda la Oferta de Cobertura del MECD
C.12 With respect to internal efficiency indicators, progress has been steady since 2001, but it has also been slow. Repetition rates have remained unchanged since 2001, at around 11 percent for in primary education and 6 percent in secondary education. The proportion o f students who complete primary education in the allotted time for the cycle (6 years), increased from 27 percent in 1997, to 36 percent in 2001 and 41 percent in 2006; Table C.3. Completion rates within six years are higher among female students and in urban areas. It i s important to note the substantive improvements o f this indicator in rural areas, f rom a l o w base o f 14 percent in 1997, to 23 percent in 2001 and 31 percent in 2006. Increasing the proportion o f students who complete without repeating a grade i s o f particular importance not only to ensure learners become confident o f their academic abilities and prospects for their educational future (the likelihood o f dropping out increases sharply for overage students) but also to increase the efficiency o f resource use by creating more places in the system.
C.13 Improvements in the primary completion rate are hampered by a high rate o f repetition and drop out, and the fact that many students simply fai l to register for the next school year. This last phenomenon i s most pronounced in the transition from f i rst to second grade. Figure C.2 shows the decline in enrollment across successive years, from 2000 to 2005. A s illustrated, in 2001 the absolute student enrollment in the f i rst grade stood at 234,001, o f whom 22,198 students were repeaters while 20,122 students dropped out at the end o f the school year. According to these numbers, the eligible population that would have been able to enroll in second grade in 2002 was 213,879, however, the actual number o f students enrolled stood at 176,310. Furthermore, if the second grade repeaters (15,005) are subtracted from the 2002 enrollment, the net first time enrollment in the second grade is only 161,313 students. That means that 28,269 students that finished the f i rst grade simply failed to register for the second L
200. indicates an inter-census rate o f 1.7 percent as opposed to the 3.1 percent estimated using the 1995 Census.
The net enrollment rate was adjusted in 2005 to reflect the latest f indings from the 2005 Census wh ich
162

A n n e x C
1997 1998 1999 2000
grade in 2002. T h i s same trend i s also observed in the transi t ion from 2002 to 2003, and from 2003 to 2004; Table C.4.
27 29 24 42.3 14.9 31 34.4 27.2 48.8 16.8
32.2 35.7 28.9 49.5 18.7 35.4 39.2 31.9 54.1 21.5
Table C.3 - Percentage of Students Completing Primary School in 6 Years Year I Total I Female I M a l e I U r b a n I R u r a l
200 1 2002 2003 2004
36.3 40.5 32.4 52.5 23.3 38.5 42.8 34.6 59.2 27.7 40.8 45.3 36.7 58.9 30.2 40.9 45.1 37 60.8 30.2
2005 2006
41.2 45.6 I 37.2 58.2 I 31.2 41 45.2 37.1 57.3 I 31.3
**2006 i s preliminary
Year First Grade Second Grade
C.14 The drop out rate in primary education remains high, particularly in the early grades o f the cycle. The average annual drop out rate in grade 1 for 2000 through 2005 was 17.5 percent compared to 20 percent 1990-2000. Since 2005 there has been a marked improvement in lowering the drop out rates in grade 2 and beyond, which i s a commendable achievement for the Ministry. Whi le there i s sti l l some way to go to eliminate drop out in primary education, the immediate challenge remains in grade 1 which i s an exit point for a number o f students, see Table C.5.
Year 1990 1995
Grade 1 Grade2 Grade 3 Grade4 Grade 5 23.5 7.5 9.8 11.9 10.9 21.2 9.2 13.7 16.5 13.1
2000
Data for 2006 are preliminary
19.9 1 10.2 I 9.6 11.9 I 8.5
163
2001 17.7 I 10.1 8.7 I 11.5 9.2

Annex C
1990
(2.15 The factors associated with high drop out rates in grade 1 are in most instances related to a mix o f demand and supply side constraints. On the demand side, important factors include poor school readiness, language barriers and directhndirect costs o f school attendance. On the supply side, there are factors such as distance to nearest school, poor quality o f education facilities/services and lack o f qualified teachers with experience o n catering for the needs o f students f rom extremely poor households many o f whom have never taken part in any kind o f early stimulation or school readiness programs. It should be noted that in 2005,2006 and 2007 the Ministry o f Education has implemented successfully various emergency programs in poor neighborhoods aimed at identifying and enrolling students aged 6-8 who were not attending school or had dropped out prematurely. These programs tend to be ad-hoc and expensive, so it i s important for the Ministry to devise strategies to retain students in grade 1 to decrease the need for annual emergency programs. T h i s would free up financial resources for other important activities to improve the quality o f education.’01 Whi le the precise magnitude o f demand or supply side constraints needs to be established, findings from recent household surveys indicate monetary problems as the most important constraint for primary school aged children especially those students living in extremely poor households in rural areas. For the secondary school aged population, the main constraints are financial, work activities and lack o f interest in schooling opportunities. T h i s translates into about 40 percent, 1 percent and 43 percent o f the populations o f reference, respectively.
21.9 I 4.2 I 1.4 I 3.8 I
C.16 The situation in secondary education i s similar o f that in primary education with respect to the high level o f drop out rates. The difference, however, i s that whereas in primary education the rates are on the decline, improvements in secondary are negligible, if any at all; Table C.6.
1995 2000 2001 2002 2003
Table C.6 - Drop out Rates in Secondary Education by Grade, 1990-2005 Year I Grade 7 I Grade 8 I Grade 9 I Grade 10 I
21.4 13.6 17.2 17.1 19.2 10.7 12.1 8.8 16.5 8.6 9.8 6.6 20.3 13.1 16.4 10.9 18.9 11.4 12.8 7.8
2005 es preliminar
C. 17 Oualitv Indicators. The total teaching force increased by approximately 5,000 positions between 2002 and 2004, equivalent to approximately an 11 percent increase in the overall teaching force. As illustrated in Table C.7, teacher salaries also increased over the same time frame, even though the average teacher salary remains below the target benchmark (3.5 times GDP per capita) established under the EFA FTI indicative framework.
(2.18 Perhaps one o f the most serious problems in the sector, with a direct effect on the quality o f education, i s the increase in the number o f unqualified teachers (‘empiricos’). At the primary education level, the percentage o f unqualified teachers had a slight increase, f rom 25.8 percen?” in 2002 to 26.3 L
201. The cost per successful student in the Programa Aprestamiento en Vacaciones carried out in December 2005 was U S D 20. Similarly, the Programa de Rescate de Matricula 2006 and the Programa Salvemos Primer Grado was U S D 65 per student. 202. Radiografia del empirismo docente, JR Laguna, Diciembre, 2005 - Estadistica Escolar 2000-2005, MECD
164

Annex C
percent in 2004, whi le in secondary education the increase was fairly substantial, f i o m 37 percent t o 51 percent. An in-depth study on the situation o f teacher qualification level in the education system in Nicaragua found that the highest proportion o f unqualified primary school teachers was registered in StateMunicipal, Non-autonomous schools (40 percent) whi le Autonomous Schools had the lowest proportion (19 percent). At the secondary level, the proportion o f unqualified teachers i s above 50 percent, irrespective o f type o f school establishment. Whi le i t would be important t o study the factors associated with the observed differences in the teacher prof i le depending on the type o f establishment, i t i s clear the proportion o f unqualified teachers remains dangerously high and warrants immediate action.
Table C.7 - Evolution o f Teacher Salaries (in nominal Cordobas)
Average primary school 1,048.48 1,232.32 1579.45 1,616.85 1,93 1.93 2,529.37 2000 2001 2002 2003 2004 2005
teacher salary (in Cdrdobas) Average primary school 1,109.61 1,293.45 1,617.87 1,655.27 1,970.35 2,615.42 teacher salary (in
Average teacher in relation 1.42 1.52 1.88 1.81 1.96 2.54 to times GDP per capita.
Source: Direccidn General de Prospeccion y Politicas (DGPP) Radiografia Empirismo 2004, Dic 2005, J.R. Laguna. Datos 2005 tornados de Estado de la Educacidn Basica y Media 2005, Gutitrrez y Laguna, MINED.
C.19 I t i s unclear the extent to which current teacher salary levels have had o n staff turnover or on the persistently high proportion o f unqualified teachers, which remain in the system despite the Ministry’s efforts to accelerate pre and in-service teacher education programs. Situation analyses and working papers point to several factors which have had an impact o n the poor quality of the teaching force, including (i) the lack o f a comprehensive teacher education reform policy; (ii) the lack o f coordination between the universities who have the responsibility o f secondary education teacher training programs and the Ministry o f Education; and (iii) the lack o f an educational pol icy o f assigning experienced teachers to the f i rs t 3 grades o f the primary education cycle, which are the most crucial years;204 and (iv) the absence o f professional development programs for teachers, including pedagogical advisory services to support and strengthen teacher practice.
C.20 The national student assessment camed out in 2002 showed that most students in the 3rd and 6th grades achieved basic levels o f proficiency in Spanish and Mathematics (Table C.8), with students in private schools generally exhibiting a margin o f 10 to 12 percentage points above public school students. The proportion o f students in basic and proficient levels also varied by type o f establishment, with private school faring better compared to public schools. An analysis o f teacher profi le factors and their impact o n student performance indicated that only about ha l f o f the teachers feel wel l prepared to teach grade school Geometry while 39 percent felt well prepared to teach concepts related to probability in the sixth grade. An assessment was carried out in October 2006 to analyze trends in student learning and investigate the impact o f school-based associated factors on learning. In addition, in October 2006 Nicaragua participated in the regional student assessment (SERCE) coordinated by UNESCO. The assessment i s expected to become a r ich database that will generate a series o f regionalhub-regional comparisons and lessons learned.
L
203. 204. percent o f a l l sixth grade teachers had th i s status; Laguna (2005).
Includes teacher salaries in private schools. I t is very revealing that in 2004, 24.6 percent o f a l l f irst grade teachers were ‘empricos’, whi le on l y 15.4
165

Annex C
Grade and Subject 3rd grade- Mathematics
3re grade-Spanish 6th grade- Mathsematics
6th grade- Spanish
YO of Students w i th Basic Proficiency 61.7 71.2 88.1 69.7
C.21 The school autonomy program started as a pi lot in 1993, with the participation o f 20 large, urban secondary schools that volunteered to participate. In 1995, the model was extended to primary schools with special adaptations in rural areas, and by 1997, a total o f 3,950 schools were participating in the autonomy program. The autonomy program was institutionalized with the Education Participation Law passed in 2002, along with i t s internal regulations for i t s operationalization. By 2006, a total o f 4,997 primary schools (or 58 percent o f the total) and 501 secondary schools (or 40 percent o f the total), enrolling a total o f 942,476 students, were operating under the Participation program,2o5
School Management.
C.22 Key elements o f the Education Participation L a w are the decentralization o f decision making and o f financial resources to schools that are incorporated to the autonomous program. Financial resources, in the form o f grants, are transferred from the Ministry o f Education to the schools based o n a capitation grant formula. On occasion, a nominal amount i s added to cover minor school repairs and rehabilitation. School fees and levies are not official in Nicaragua, however, it i s not uncommon to find schools collecting levies, fees or contributions to cover services ranging from maintenance o f school grounds to school fairs and lotteries. Although there i s n o information available o n the proportion o f school-based revenue relative to the grant sent form the Ministry o f Education, anecdotal evidence indicates that in some cases school based revenue can be substantive. Evidence from qualitative studies indicates that school fees, coupled with the indirect costs o f schooling (uniform, shoes, materials, lunch meal, etc.), have a deleterious impact on school age children from extremely poor households who are unable to afford such expenses. In 2007, the Ministry o f Education denounced the practice of collecting school fees and banned schools f rom charging students. Whi le this i s an important step forward to removing demand side barriers, i t i s equally important to ensure some o f the revenue that was used to finance educationally sound programs or grounds keeping facilities, can be offset by an increase in the Ministry’s financial resources to the school. Otherwise, there i s a risk o f deterioration to the school grounds or erosion in the quality o f service delivery.
C.23 A recent analysis o f the profi le and characteristics o f schools that have been incorporated into the autonomous model indicates these are heterogeneous with respect to size, urban or rural location, or average socio-economic level o f i t s students.206 The single most important factor positively and consistently correlated with good school management practice i s the strong and clear leadership f rom School Principals and School Councils.
C.24 While the school autonomy program has not undergone a rigorous impact evaluation, a recent analysis o f the model yields some important findings. Among the positive aspects o f the program are the empowerment o f parents, students and teachers to identify, manage and solve issues affecting their school and i t s immediate community as well as better indicators such as lower repetition rates, fewer unqualified
L
205. 206. Estudio sobre Participacion y Calidad Educativa para CERCA, AED.
School autonomy i s one o f the aspects o f the Education Participation Law. Castro, Vijil, Cuadra, Alvarez y Traa, 1998, Evaluacion del Program de Autonomia; Castro y Vijil, 2004,
166

Annex C
teachers and higher test scores in 3‘d grade Spanish as displayed in the 2002 national assessment.207 there are some less encouraging results, however, including a significantly higher than average student-teacher ratio, which i s not entirely surprising since the transfer i s based o n a capitation grant, and the lack o f proper monitoring and evaluations mechanisms to provide oversight and compliance with fiduciary agreements, including payments for utilities and teacher end-of-year bonuses. A weakness o f the grant transfer program has been the lack o f a mechanism to mitigate against the perverse incentives that capitation grants can often have on enrollment. An enrollment audieo8 carried out in 2002 by the Ministry o f Education identified inflation in the enrollment statistics in the order o f 19 percent at the primary level and o f 23 percent at the secondary level. Since then, the Ministry has adopted several measures to correct the problem and while these have been effective in reducing over reporting o f students to 16 percent at the primary level and to 6 percent at the secondary level, the persistence o f this problem, coupled with other problems, prompted the Ministry to make some changes to the transfer formula in 2005-2006.
Figure C.2. Enrollment
70%
60%
50%
40%
30%
207”
10%
0%
% Primary School Enrollment by Type of School
1998 2000 2w2 2004 2006
Estatal No Autonomo Au tonomos Municipal no Autonomo
0 Privado Con Subvenaon Pnvado S in Subvenc
,evels by Type of School
% Secondary School Enrollment by Type of School
. ._ . . . ._ . ._ . - ._. ._ . - - . . . . . , W’I - 40” -
30 ”. - .A, 2 w -
insd -
oy,, -- 1998 2000 2002 2004 2006
Estatal No Autonomo Autonomo Privado Sm Subvencion Privado Con Subvencj
C.25 Given the positive aspects as well as the challenges o f the program, it would be advisable to undertake an in-depth study o f the autonomy model to identify the aspects and factors that have contributed towards successful outcomes as wel l as the aspects that have presented challenges overtime. The study would potentially i n fo rm decision makers in the Ministry o n a possible way forward that maximizes the positive aspects/outcomes, particularly those linked to improving educational quality and eliminate those elements that have distorted the process o f decentralization and local administration. This analysis could begin by exploring the results o f the 2006 national assessment and should seek broad participation from al l sectors o f Nicaragua’s education community. I t would be advisable to modi fy the model within the existing legal framework, and tahng account the General Education Law, which stipulates that al l education reforms must be broadly consulted (Articles 63 y 64).
L
207. 208. autonomos” Managua, MECD, 2003.
J.R. Laguna, Radiografia de l empirismo, D i c 2005 Porta E. y Gutierrez R., “Estimacion del indice de veracidad de la matricula reportada por 10s centros
167

Annex C
1998 1999 2000 2001 2002 2003
Total Exnenditure on Education 1.124 1.734 1.917 2.012 2.303 2.896
Evolution of Sector Expenditures
2004 2005’p
3.109 3.934
C.26 Since the late 1990s, there has been a marked upward trend on education expenditure. As illustrated in Table C.9 total expenditure on education has increased from 3.6 percent o f GDP in 2001 to 4.9 percent o f GDP in 2005. For MINED, expenditure on education increased steadily f rom 2.5 percent o f GDP in 2001 to 2.8 percent o f GDP in 2005. About two-thirds o f the total expenditure on education i s allocated to MINED for pre-university education, a figure that has been constant for a decade. Compared to other countries in the region with similar level o f development such as Bolivia, Nicaragua allocates a lower proportion o f i t s budget for education.
C.27 Within the education sector (excluding universities), the bulk o f resources are devoted to primary education (77.3 percent), followed by secondary education (12.7 percent) and adult education (5.2 percent). The proportions have remained constant over the last f ive years, with the only exception being adult education where expenditure increased from 2.3 percent t o 5.2 percent o f the total expenditure f rom MINED in 2005. Overall, per student spending i s highest at primary level (US$ 128) followed by secondary education (US$ 48) and pre-school education (US$ 20); Figure C.4. It should be noted that Nicaragua presents a highly unusual case in which per student spending at the secondary level i s not only below that o f per student spending o n primary, but wel l below, at less than half.
As % o f Total Education lp: preliminary figures
168

Annex C
Table C.10 - Public Education Expenditure as YO o f GDP (excludes tertiarv’,
7.0
6.0
5.0
4.0
3.0
2.0
1.0
0.0
B Figure C.4 - Per Student Spending by Level 2002-2005 (in current US$)
$140 $120 $100 $80 $60 S40 $20
$0 2007 717177 711114 2005
H PREESCOLAR 0 PlUMARIA H SECUNDARIA
Source: MINED
169

Annex C
Cordobas (in ‘000)
C.28 Since 2003 the proportion o f the budget for education coming f rom the public budget has increased from 69.3 percent to almost 85 percent; Table C . l l . Similarly, the proportion o f grant resources shows an upward trend since 2003 (note that data for 2006 are s t i l l preliminary), making o f for almost one fourth o f the total resources allocated to the sector, whi le resources coming from external credits has decreased substantially. Overall the rate o f budget execution in the sector i s high, averaging over 90 percent for public resources and grant financing.
2002 I 2003 I 2004 I 2005 I 2006
Table C.ll: Budget Allocation and Actual expenditure by Source of Funds
Own Resources Total
825 900 708 1,646,227 1,817,860 2,167,733 2,612,562 2,717,797
External Grants I 240,978 I 328,108 I 463,526 661,429 I 292,134 External Credits I 273,229 I 252,163 I 328,219 I 158,222 I 177,734
Own Resources Total
0.0% I 0.0% 0.0% 0.0% 0.0% 100.0% I 100.0% 100.0% 100.0% 100.0%
Expenditure Treasury Resources I 1,120,776 I 1,229,899 I 1,373,057 1 1,784,533 I 1,550,228
Treasury Resources External Grants External Credits Own Resources
99.01% 99.44% 99.85% 99.57% 68.96% 87.60% 93.52% 81.28% 91.16% 77.55% 56.1 1% 94.03% 74.08% 91.14% 27.33%
- 98.67% 99.33% 100.00% 1 Total
C.29 The proportion o f the public budget devoted to primary education has remained constant at about 68 percent f rom 2002 to 2006, followed by an average o f about 12 percent respectively for secondary education and centrally/common projects and activities; Table C. 12. With respect t o external grants and credits, the bulk o f expenditures are allocated centrally. It i s important to highlight that the majority o f external financing, whether grants or credits, have been earmarked mainly for primary education and for centrally executed activities and programs.
170

Annex C
Cordobas (in ‘000)
2004
Total I 100.0% I 100.0% I 100.0% I 100.0% I 100.0% I 100.0% I 100.0% I 100.0% I
171

Annex C
Main Conclusions and Recommendations
C.30 Despite important gains in increasing primary school enrollment, the education system in Nicaragua continues to lag behind on key access, quality and equity indicators at a l l levels o f the system. At this juncture, i t i s imperative to accelerate efforts aimed at (i) expanding access to preschool educational programs to ensure children are prepared for enrollment and successful completion o f the primary education cycle; (ii) expanding teacher education programs to raise the technical and pedagogical standards o f unqualified teachers, improve teacher practice and promote better learning outcomes; (ii) implementing targeted programs for the school age population in rural areas and in the Atlantic cost to improve schooling outcomes; (iii) expanding access to secondary education and/or j o b training opportunities for youth aged 15 to 24 years to ensure they have the sh l l s needed to transition effectively into the wor ld o f work.
C.31 Cost. Financing. and Sector Expenditures. In order to estimate the costs and financing requirements needed to improve the quality o f education and expand access beyond the primary education cycle, i t would be useful to carry out an in-depth analysis o f sector allocations, efficiency o f resource utilization and projections o f sector requirements, takmg into account the l ikely macro fiscal envelope over the next ten years. The following specific measures are recommended:
~~
Continue to monitor the implementation o f poverty focused programs in the context o f Nicaragua’s Poverty Reducing Strategy and ensure the most effective and efficient use o f resources in the education sector. Develop a medium-term cost and financing framework for the education sector that incorporates the poverty-focused program along with targets for new investments in early childhood development, preschool and secondary education to in form decision making on what and how much to invest in the various sub-levels to achieve universal completion o f primary education as wel l as key regional targets o n enrollment in pre and post primary education levels. T h i s could be a tool to guide new versions o f the Common Work Program (CWP), which receives financing from the Government and the international cooperation, including the Wor ld Bank and the EFA FTI. Develop a monitoring an evaluation system to track the implementation o f the CWP and provide information o n sector expenditure in real time. Ideally, the system would be compatible with the country’s public financial management information system.
C.32 Sector Administration and Management. In light o f the successes with school based management and community empowerment in decision making processes, it i s important to maintain the core principles o f the decentralization program, while at the same time acknowledging that some aspects need updating based on accumulated experience and evolving social, economic and polit ical context. In that context, the following measures are recommended: 0 Support initiatives to strengthen school-based decision-making and resource allocatiodmanagement.
More specifically, link resource allocation to specific school quality improvements projects/activities, while strengthening local monitoring and implementation capacity in schools and municipalities. Strengthen the institutional capacity o f the Ministry o f Education by introducing a monitoring and evaluation system that provides timely and accurate information on education indicators, outcomes and impacts, as wel l as on the implementation o f the Common Work Program, which at this moment i s too fragmented.
0 Disseminate key education indicators on school and student performance to promote social accountability and generate support to improve service delivery. A f i rs t step could include an analysis o f the 2006 national student assessment, which could be useful t o identify schools that require additional assistance to reach a desirable standard o f quality.
0
172

Annex C
C.33 quality o f education in Nicaragua:
Imuroving Access and Oualitv. The following measures are recommended to improve access and
Develop a demand-side program that can fol low through with the recommendation made in the 2004 DPR to "design programs and mechanisms to reduce the direct and indirect costs o f schooling for children and young people f rom extremely poor households for whom schooling costs are a major barrier to either enrollment or retention". Prioritize the Atlantic Coast and the Central regions in carrying out infiastrcture investments to improve the supply o f schools and teachers in remote areas. Expand pre-school education coverage, at least at the third level (children aged 4 and 5), and fol low up o n the recommendations o f the 2004 DPR to focus on establishment or scaling up o f programs targeted to vulnerable families with an integrated package o f services to help infants and preschool children with improvements in nutrition status and cognitive development. Develop a human resource strategy in the sector with a particular emphasis o n raising teacher qualification levels. In developing such a strategy, special attention should b e given to revamping existing pre and in-service teacher education programs, establish incentives to discourage the practice o f hiring unqualified teachers and design an effective pedagogical support system to promote better teacher performance. Strengthen the f i rs t three grades o f the primary education cycle by (i) harmonizing the curriculum in these three grades to emphasize reading, writing and mathematics logic and comprehension, (ii) assigning the most experienced teachers to the f i rs t three grades, and (iv) ensuring an adequate supply o f classroom and learning materials.. Design and implement an education pol icy that i s attuned to the special issues facing rural areas and put in place an incentive system to attract qualified teachers in rural areas. Expand opportunities for secondary education, implement targeted programs to ensure that the youth aged 15 to 24 years have a second chance to complete their studies (primary or secondary) and ensure short term training courses are demand driven.
173

Annex C
174

Annex D
Annex D
Review of Public Spending on Health
Main Findings of the 2001 PER
D. 1 The PER 200 1 noted that the Nicaraguan Health Policy in the 90s was centered o n the extension o f coverage to the poor segments o f the population and high r isk groups (children and pregnant women), trying to place- more emphasis on prevention than o n the provision o f direct medical attention. The report concluded that while access to services by the poor improved during the 1990s, they also had the following shortcomings: (a) they tended to overlap with or duplicate each other (there were 8 different models o f primary health care in the public health system), (b) they were characterized by excessive investment in infrastructure and spending o n central administration spending, and (c) the programs to provide these services generated l itt le systematic information about their costs and effectiveness.
D.2 The following recommendations were offered to address these shortcomings and improve the efficiency o f sector expenditures. T o improve operational efficiency, the report recommended, (i) preparing a complete analysis o f a l l investments in sector infrastructure, evaluating the level o f utilization o f the infrastructure and the sustainability o f associated recurrent costs, (ii) reducing the duplication o f programs and administrative costs by establishing just one model o f primary health care. T h i s goal was achieved through the design and approval o f the Integrated Mode l o f Health Care (MATS or Modelo de Atencidn Integral de Salud). (iii) Reaching a consensus among donors regarding overall sectoral proposals, and (iv) developing an appropriate system o f information gathering to al low systematic monitoring and evaluation o f programs. This i s underway through a new work scheme o f the Statistical Unit.
D.3 To improve allocative efficiency, the report recommended greater focus on, (i) improving the management o f medical inputs, (ii) offering one standard primary health care package - after having identified the most cost effective one, (iii) managing personnel more efficiently, with an emphasis o n recruiting more nurses and other technical staff, instead o f physicians, and (iv) developing and extending health and nutrition programs directed to households, instead o f an infrastructure-based model o f health care delivery.
D.4 The report concluded that the implementation o f institutional reforms had been uneven and slow. Many o f the reforms faced implementation difficulties and required a concerted effort from al l key stakeholders. Although the health sector reforms had considerable support during their inception, they had lost their momentum and needed to be revitalized. As the following sections o f the present report will show, Nicaragua has made progress in some areas including sector outcomes, but most o f the efficiency and equity issues s t i l l remain to be addressed.
Health Sector Overview
Evolution of Key Sector Outcomes
D.5 Since 2001, Nicaragua has made gradual, but steady, progress in a number o f key health indicators; Table D. 1. Infant and child mortality rates have declined together with chronic malnutrition rates. Whi le maternal mortality rates based on MOH data also decreased from 2001 to 2005, it must be noted that these are mainly f rom facility-based and not nationally representative surveys.2o9 The most L
209. 100,000 i s substantially smal ler than the WHO Core indicator estimate o f 230 per 100,000.
This figure i s likely to be underestimated. For example, the 2000 MOH MMR estimate o f 87.6 deaths per
175

Annex D
recently available data for percentage o f attended births by skilled health personnel-which i s a well- recognized proxy to measure MMR i s f rom 2000 at 67 percent. With regard to other indicators that are related to maternal health, prenatal coverage increased very slightly from 70 percent to 71.6 percent although more progress was made in terms o f the percentage o f women who had four prenatal visi ts and those who gave birth in health facilities. However, family planning coverage declined. Also, while the percentage o f children who received the BCG vaccine increased, the percentage o f one-year old children who received vaccinations against polio, DPT(diphtheria, pertussis, and tetanus), and MMR (measles, mumps, and rubella) decreased.
Table D.l Health Outcomes and Outputs, 2001 and 2005 K e y Performance Indicators 2001 2005 Infant mortality rate (per 1,000 live births) 35" 30b Under five mortality (per 1,000 live births) 40" 37b Chronic malnutrition (children < 5 years o f age) 20.2a 18.1c(2004) Maternal mortality rate (per 100,000) 107.2d 86Sd Institutional births ('YO) 50.6 58 Prenatal care coverage e?) 70.2 71.6 Pregnant women who had 4 prenatal visits (%) 48.8 56 Family planning coverage e?) 24.5 12.9
One year old children who received polio vaccine 92.6 86.7 One year old children who received DPT (Diptheria, Pertussis, and Tetanus) vaccine 92 86.2 One year old children who received MMR (measles, mumps, rubella) vaccine 101.6 96.3
On year old children who received BCG vaccine 98 102
Sources: "ENDESA 2001; bWDR 2006, 'SEWN 2004, dMOH statistics (INS 2004-2008 document)
Progress in Meeting the Millennium Development Goals
D.6 Whi le Nicaragua has made progress in reducing infant and chi ld mortality rates, as shown in Figure D.l, it i s s t i l l slightly off-track in reaching i t s infant and child mortality MDGs. In terms o f maternal health, while the MOH-based estimates are promising because they indicate a declining trend in maternal mortality rates, the MOH 2005 estimate o f 86.5 per 100,000 i s s t i l l very far fkom the 2015 MDG goal set by the Government o f 20 per 100,000. I t i s also highly recommended that a nationally representative survey be conducted to make it comparable with the WHO 2000 estimates o f 230 deaths per 100,000. If undertakmg such a survey i s not feasible then the proxy-for MMR-indicator, i.e. the percentage o f women who deliver attended by a sh l led health professional should be updated because the most recently available published data for Nicaragua i s 67 percent in 2000. Moreover whi le the percentage o f children under 5 years o f age who are stunted has declined f rom 24.5 percent in 1998 to 18.1 percent in 2004 (WDI 2007) i t i s not clear whether the country i s on track with regard to meeting the 2015 MDG nutrition goal because o f the absence o f comparable 1990 data to adequately track progress. Readily available Government documents do not also appear to specify the MDG target for nutrition.
D.7 According to the latest Living Standard Measurement Study (LSMS), carried out in 2005, respiratory illnesses, followed by chronic illnesses, diarrhea, and s k m ailments are the most common types o f diseases in Nicaragua (Figure D.2a). Three o f these diseases (respiratory, diarrhea, and skm) are largely preventable ones. Respiratory diseases are relatively more prevalent among individuals in the poorest quintiles while chronic illnesses are most common among individuals in richest quintile. On the other hand, indigenous people and agnculture producers are more likely to suffer fkom diarrhea and other multiple types o f illness (Figure D.2b).
176

Annex D
Figure D. 1 Progress towards meeting the Millennium Development Goals in Health, Nicaragua 1990-2005
Infant Mortality11,OOO
I n 10 - +Actual
MOGGoal
lPI0 1995 m m ZDlS
Under 5 mortal i ty l1,000
Maternal Mor ta l i ty , 100,000
Note: MMR estimates and goals based o n Government o f Nicaragua MOH statistics 2007. Sources: Wor ld Development Indicators, D H S for 2001 data for IMR and U 5 M .
177

Annex D
Figure D.2a Figure D.2b
Morbidity in Nicaragua 2005
I 0 drmcIllness
15%
1Ph 58%
5% 0 Chronic illness 0 Otherlrnultiple Skinlaccidentlviolence
Sources: LSMS 2005, authors’ calculations
Health Services Provision
D.8 The main actor in the health sector i s the Ministry o f Health (MOH) which operates through a network consisting o f 28 general and 4 chronic disease hospitals, 868 health posts and 175 health centers. The Nicaraguan Social Security Institute (INSS) i s the second largest provider o f public health services. I N S S covered 439,000 active workers in 2006, and an estimated 296,000 dependents, although i t s coverage has been recently extended to include children from 6 to 12 years o f age o f active affiliates.
Table D.2 Health Facility accessed in previous month (2005) Type of Facility Consultations Extrapolation to total
Number YO population Health Center and Health Posts 543.341 50.9 2.776.818 Public Hospital (MOH)
Total M O H
Private Clinics Private Hospitals
Private Providers
, ,
1371208 12.8 701,220 680,549 63.7 3,478,038
189,475 17.7 968,338 12,364 1.2 63,188
201,839 18.9 1,03 1,526
INSS (Private Health Previsional Institutions 1 19,739 11.2 61 1,942
Others 65,687 6.2 335,702 Total 1,067,814 100 5,457,208
Source: LSMS Survey 2005.
D.9 The real number o f beneficiaries i s unknown, however, as I N S S has not compiled reliable figures. According to the most recent LSMS survey, 64 percent o f the population uses MOH facilities, 19 percent use the private sector, 11.2 percent use the INSS, and 6.2 percent use other providers or facilities (including traditional medicine). Extrapolating f rom the LSMS figures, the total population covered by MOH i s around 3,500,000 people.
178

Annex D
Evolution of Key Sectoral Expenditures
Overall Sectoral Expenditures
D.10 According to 2004 NHA figures, health expenses in Nicaragua are 8 percent o f GNP.210 MOH expenditures fluctuated yearly since 1997, both due to national budget restrictions and donor contribution fluctuations, reaching 2.8 percent o f GDP by 2004. I N S S expenditures as a share o f GDP increased by 62 percent, f rom 0.8 percent in 1997 to 1.3 percent in 2004. Household expenditures comprised 3.3 percent o f GDP in 2004.
g by Source. 1997-2004. - Table 4.3.
expenditures have grown in U S D. 11 National
caraeua: Contribution to Health SDend
- I R a L
49.3
37 1 35 0
0 6 1 0
0 4
0 1 12 0
0 3 50.7
0 0 49 4 0 8
0 4
LWLL
49.3
37 8
35 8 0 7
0 8 0 4
0 1 II 3
0 2 50.7
0 2
49 7
0 3
0 5
lpga
49.3 33 5
31 0 0 8
0 7
0 6 0 3
15 5 0 3
50.7 0 1
48 2
1 9
0 5
a 8 L 49.3 35 6
31 5 0 6
0 6
2 8 0 1
13 3 0 4
50.7
0 3 47 1
1 9
1 4
-?ppL
53.9
36 5 32 1 0 6 0 6
3 1
0 1 I 6 9
0 5 46.1
0 8
42 I 1 7
I 5
aJM- 55.3 38 8
35 6 0 5
0 5
2 0 0 2
16 5 0 0
44.7 0 9
41 I
2 0
0 7
100.0 - -
Dollar terms since 1997, increasing by 50 percent f rom US$ 258 mi l l ion in 1997 to U S $ 386 mi l l ion in 2004. In 2004, 55.3 percent was spent by the public sector and the remaining 44.7 percent by the private sector. The MOH spent 35.6 percent (US$ 138 mill ion) whi le INSS spent 16.5 percent (US$ 64 mill ion) o f total health expenditures. Households have a large share (41.1 percent or US$ 159 mill ion) -- exceeding that o f the MOH. The 2006 executed budget o f the MOH amounted to US$178.6million, increasing by 30 percent since 1999. T h i s executed budget i s about 3 percent o f GNP and 15 percent o f the total Government executed budget.
D.12 The total annual health expenditure per capita increased from US$ 56 in 1997 to $72 in 2004 (Figure D.3). With the exception o f INSS, the NHA do not indicate the covered population for each sub-sector. If
PUBLIC SECTOR h t r a l Govmen t
Ministry ofHealth Ministry ofGovemance Ministry ofDefense Decentralized Institutions
Other Ministries NSS 'ublic Enterprises
PRIVATE SECTOR Private Insurance Households NGO Private F h
TOTAL. GENERAL
0 0
100.0 - 100.0 - 100.0 - 100.0 - TEiF -zpae -
124.6
1197
112 I 1197
79 3 942 3 89 8
138 5 I72 5
124.9
2125 1 1189
299 5 416 3
- 124.7 -
100.0 - TEEZ - -2ML
133.6
120 4
112 1 1183
78 3 1006 9
99 8 I72 4
220 9
111.2 6085 9
104 2 259 7
421 4
- 122.2 -
EUC lB7=100 INSTlTlJTdN - Aaaa-
112.6
1149
115 6 1185
88 5 121 3 82 1 IO6 6
72 8
113.0 1091 0
I13 5 44 5
138 6
- 112.8 -
JMiL
100.0
100 0 100 0
100 0 100 0 I00 0 100 0 100 0
100 0 100.0
100 0
1000 100 0
100 0
- 100.0 -
lpBp
104.4
94 4
92 7 134 1
79 9 174 9 225 7
135 4 105 5
104.6 606 3
101 8
258 8 122 5
- 104.5 -
9009 I I
141.8 167.0 168.2
135 7 1629 1569
1329 1590 1527 1306 1275 1160
1146 912 814 4567 781 6 8003
125 1 1486 201 4 1640 1836 2070
0 0 0 0 0 0
125.4 124.7 132.2 92186 89605 80946
1227 1133 1248 1325 351 9 383 5 81 7 6839 2447
133.5 145.6 150.0
P ~ L I C SECTOR mtral Government
MinimyofHealth Ministry of Governance Ministry of Defense Dec Institutions Other Ministries
JSS ublic F i n s
PRIVATE SECTOR Private Ins
Households NGOS Private F h s
TOTAL GENERAL
Sources: MOH , NHA. DGPD. authors' calculations
one takes the total population net o f INSS affiliates then per capita spending by MOH i s about U S $ 28, but if we consider a covered population o f 3,500,000, as Table D.2. suggests, then I H S S per capita spending i s US$ 5 1 per capita. The annual average cost in the case o f INSS affiliates i s U S $ 176 in 2004 and US$ 135 if one includes both affiliates and dependents. The incorporation o f children occurred recently, plus the coverage extension o f the informal sector population decreased i t s spending per capita. The per capita costs o f I N S S are significantly higher -ranging from 3.9 times in 2003 to 6.5 times in 1999 L
210. Nicaragua keeps a good system o f National Health Accounts (NHA), although the most recently published figures only extend until 2003. T h i s section uses 2004 unpublished NHA data and other sources, updating most o f the information up to 2006.
179

Annex D
- than MOH per capita spending, if the total population net o f INSS i s considered (as indicated before, the true coverage by MOH i s not known; jus t estimated).
Figure D.3 Annual Health Spending per Capita by Institution; 1997-2004. I n US$ __ ___ - _ - - I
Sources: MOH, NHA, authors’ calculations
D.13 With respect to spending by health function, medical inputs and curative services comprise a substantial portion of expenditures (a combined share o f 84 percent in 2002 and 77 percent in 2003), while the combined shares o f preventive services and training and research are significantly lower at 10 percent in 2002 and 14.6 percent in 2003 (Table D.4)
Table D.4 Shares o f Total Health Spending by Function (%) Health Function 2002 2003 Curative Services 41.8 33 Preventive services 8.2 7.3 Medical inputs 42.7 43.8
Administration 4.4 5.7 Others 1.3 2.9 Total 100 100
Training and Research 1.6 7.3
Sources: MOH, NHA.
Ministry ofHealth
D.14 Sources o f funds. The MOH shows a high dependency on external aid, especially with regard to capital outlays. T h i s i s a concern because i t has implications for sustainability. In 2006, the Current Budget was financed mainly by the Treasury (83 percent), cost recovery (3.4 percent), debt relief (9.3 percent), and donations (4.4 percent). In early 2007 the government eliminated charging user fees for services, although n o studies have been undertaken to assess its l ikely impact.
D.15 Even though Treasury funds have increased in the last two years, especially in 2006 (rising from a l ow o f US$l.OS mi l l ion in 1998 to US$10.8 mi l l ion in 2006), investmentlcapital expenditures have depended heavily on foreign aid over the years. In 2006, donations and loans amounted to US$23 mi l l ion or 68 percent o f allotted funds for capital spending, even though national funds increased to US$10.8m.
180

Annex D
Foreign aid’s share peaked in 2001, when it reached 96 percent o f a total capital outlay o f US$43.8 mill ion. The hnds allotted for 2007 investments also reflect a similar pattern, with only US$2.0 m i l l i on f rom Treasury funds and US$46.6 mi l l ion f rom foreign funds, or 96 percent o f total.
D.16 Allocation o f MOH Funds. Even though disposable funds in MOH have increased during the decade, the trends in budget l ine i tems show reasons for concern. Personnel services increased by 33 percent - - f rom US$ 70 mi l l ion in 2004 to US$ 93.5 mi l l ion in 2006. During this period, i t s share o f the executed current budget rose from 57 percent to 60 percent. There are growing pressures on public sector wages and salaries f rom the public sector unions, which the new government i s taking into account in pol icy directives that promote increasing local health salary levels to
Figure 4.4 .MOH funds alloeat
Current Transfer: $7.3 I
B Investment
Sewbes; b24,O
1
approach those prevailing in the Region.*ll Although Non- Personnel Services increased f rom US$20 mi l l ion (2004) to US$24 mi l l ion (2006), i t s relative share has slightly declined f rom 16 percent to 15 percent. Among a l l l ine items, the share o f drugs, however, has fallen the most (from 19 percent of the current budget in 2004 to 15 percent in 2006). During this period, capital outlay shares fluctuated, ending up at US$23.4 mi l l ion in 2006.
The Nicaragua Social Security Institute (INSS)
D.17 The I N S S i s the other large health care provider in Nicaragua. I N S S began in 1955 as a direct health service provider and transferred al l i t s facilities to the MOH in 1979 when the Sandinista Government took office. In 1993 with a new administration, INSS became again autonomous and i t s financing and service provision functions were separated. Direct provision o f health services were outsourced to private and public accredited institutions, altogether 49 Empresas Medicas Previsionales (Medical Insurance Institutions, PMIs). Employers, employees and government contribute to INSS, in varying percentages based on given benefit systems. The Rigimen Integral, or full health package, receives 15 percent o f i t s financing f rom the employer salary roll, 6.25 percent f rom employees, and 0.25 percent f rom the government, totaling 2 1 S O percent.
D.18 INSS pays a uni form monthly capitation fee equal to US$ 14.4 (2005) for each active affiliate in order to provide a given package o f services for h i m h e r s e l f and h i ske r dependents. Coverage i s not universal in terms o f covered benefits, dependents and age limitations, although i t was recently extended to cover children from six to twelve years o f affiliates. The new government intends to expand benefits and to also increase service coverage to rural areas and informal sectors. Whi le this pol icy may appear sound from a long run point o f view, it also poses significant challenges in the short run. In particular, extending benefits and coverage wil l impose a financial, epidemiological and intergenerational r i s k to PMIs. Their size i s relatively small and the majority wi l l not be able to meet the financial cost o f
L
21 1. In 2006 a several months-long strike by health workers crippled the health system and resulted in a large increase in medical staff salaries. The directive to approach salary levels prevalent in neighbouring countries poses a strong fiscal threat, considering, for example, that the MOH o f El Salvador includes a 7 percent annual obligatory increase in ministry salaries in dollar terms, and that Nicaragua’s per capita income i s on l y h a l f o f the Salvadoran level.
181
Annex D
increasing health demand, triggered by more benefits, more dependents, retirees, and aging beneficiaries, and a decreasing net income due to rising costs and a fixed per capita income. Deficits will arise and bankruptcies could likely follow.
D. 19 In order to mitigate these risks, two major steps will need to be taken:
Enhanced efficiency. INSS appears to over-consume certain services, such as drugs with n o epidemiological justification--a natural consequence o f free prescriptions and delivery2I2 . In order to be more cost effective in i t s approach to health care, a strong primary health care and preventive policy would also be required.213 Whi le efficiency improvements are necessary, they also require investments in knowledge management, regulation, supervision and monitoring, a stewardship role to be taken by the M O H . Thus, in order to be able to properly carry out these responsibilities well, the MOH requires institutional strengthening. Increased capitation spending. The capitation quota has stayed almost unchanged in real terms since 1994, and the revenues generated f rom increasing it could be used to finance the proposed extra benefits and population coverage. The overall size, gender and age structure o f MPIs, as wel l as family size and the consumption o f health services would need to be carefully studied in establishing benefits and capitation schemes. Thus, minimum size requirements and an adjustment o f the capitation system to include age and gender structures should be discussed and approved. However, authorities must keep in mind that any financing increase will burden the production costs o f the private sector and therefore affect i t s competitive edge in increasingly open regional and extra- regional markets. T h i s concern suggests that users should partially contribute to financing their consumption o f health services.
D.20 Furthermore, in order to help ensure a rational use o f health services, the government’s intention to establish fi-ee health services should be reconsidered and this policy should be restricted to the poor and to the population in need. As a long-run policy, the Government could establish a fixed fee scheme with wel l specified exemptions, in order to avoid the future financial collapse o f the system.
The Relative Efficiency of Health Spending
D.21 Chapter I1 (Section B) compared the efficiency o f public spending in health in Nicaragua, based on the analytical fi-amework presented in Herrera and Pang (2004). By relating total public health expenditures and two other inputs (adult literacy and private expenditures) and four output indicators referring to l i fe expectancy at birth, DPT (Diphteria, Pertussis and Tetanus), Measles immunization and the Disability-adjusted l i fe expectancy (DALE) index, which takes into account both mortality and morbidity,214 results indicate that in contrast to the education sector, the efficiency o f public spending on health in Nicaragua i s similar to the average efficiency scores achieved in the Central and Lat in America regions. Using the input-oriented single input/output measures, for example, Nicaragua exhibits an efficiency score o f 0.65, compared to the Central America and Lat in America averages o f 0.65 and 0.69, respectively. Using the output-oriented measures, Nicaragua’s average efficiency score o f 0.90 i s virtually identical to the Central America and LAC averages o f 0.91 and 0.90. The same efficiency picture L
212. Consumption o f medication varies f rom 9.8 drugs per year per beneficiary for 12 small M P I o f an average size o f 2,212 members, to 24.3 drugs per year per beneficiary for the two largest MPIs o f 34,154 members in average. Consumption by region also shows significant variations. There i s ample need and r o o m for regulation, auditing measures and quality controls, both to oversee under- and over-prescription o f pharmaceuticals, and regulations. 213. 214. Efficiency Frontier Approach”, Wor ld Bank Work ing Paper, December.
INSS benefits exclude preventive examinations. Herrera, Santiago and Gaobo Pang, (2004), “Efficiency o f Public Spending in Developing Countries: An
182

Annex D
emerges when using multiple inputs and outputs, with Nicaragua having similar scores to the two regional averages. In health, the potential room for increasing efficiency ranges from 10 to 35 percentage points, depending on whether an output-oriented or input-oriented efficiency measure i s used.
Figure D.5a Relationship between Under-5 Mortality Rates and per capita health expenditures (PPP)
Under five mortality and per capita health expenditure (2004).
lnder 5 Mortality 80 I 1
, . 70 Duilvla
Guatemala 50
40
30
20
10
0 1 I 0 200 400 600 800 1000 1200
Health expenditure per capita ($PPP)
Source: WDR Core indicators 2006. Based on latest comparable data across countries.
Figure D.5b Relationship between Child Stunting levels and Per Capita Health Expenditures in PPP terms (2004)*
% Child stunting & per capita health expenditure (2006)
_. ," , 0 200 400 600 800 1000 1200
per capita health expenditure (US$) Note:
*Based on latest comparable data across countries. Source: WHO Core Indicators, 2006, Honduras 2004 figures estimated based on 2001 data and DHS 2005/06.
183

Annex D
35 - 2 3 0 - 0 0
2 2 5 -
A i
r - .g 2 0 - e m
1 5 - .- 0 .- p r o - s a
D.22 A study by Evans et al. (2006) estimated the efficiency o f the health system o f 191 countries by comparing levels o f health outcomes and health inputs (health expenditure per capita and education level). The study finds that i t i s diff icult for systems to be efficient with annual health per capita expenditures lower than US$80. Nicaragua’s per capita health expenditure i s higher than US$80, but it can s t i l l improve the efficiency o f health spending in terms o f some key indicators such as under-five mortality rates; Figure D.5a. Nicaragua has a higher under-5 mortality rate than Peru, Ecuador, and Venezuela although their per capita health expenditures in PPP terms are relatively similar. On the other hand, in terms o f chronic malnutrition among young children (Figure DSb), Nicaragua i s doing relatively wel l relative to other countries with similar PPP health expenditures per capita such as Ecuador, Peru and Bolivia. However, i t has higher stunting levels compared to Venezuela.
D.23 Some allocative issues that need to be addressed relate to drug procurement and provision and human resources.
0 Pricing and availabilitv o f drugs. A recent study found that the average price o f a l i s t o f 35 generic medicines in Nicaragua was 10 times higher than the price paid by an Interamerican Development Bank project in Argentina (Meerhoff, 2004a). Also, in Nicaragua, the public drug and medical supply agency (CIPS) provides subsidized or fi-ee drugs. According to MOH estimates, however, only 45 percent o f the population in need has access to these drugs, whi le the rest face prohibitively high prices for non-generic drugs. Human resources. As shown in Figure D.5, while the number o f physicians per every 10,000 habitants i s high given Nicaragua’s level o f development, the number o f nurses per 10,000 habitants i s low.
0
Figure D.6 Distribution o f Nurses and Physicians per 10,000 inhabitants in relation to GDP per capita, Nicaragua relative to other Latin American Countries
Nurses Physicians
URYZOO? 40 * PAN2033
. URY2W3 ~ W ~ W o
. B W W l
ARGZM GTM2W3
@w3
* ARG2OW
rGTM2003
PRYZOW
Log GDP per capita 2004 7 50 8 00 850 900 950
Log GDP per capita 2004
Source; Argel-Urdinola and Tanabe 2007 based on WHO, PAHO and WB indicators.
0 Despite having a relatively high number o f physicians relative to i t s level o f development, staff distribution issues remain and regions do not benefit equally. About 50 percent o f the physicians l ive and work in Managua (Dussault and Franceschini, 2003). So far, initiatives to improve health workers’ deployment have not been successful. However, Nicaragua’s experience with social services personnel deployment i s worth noting. It i s based o n an identification o f health region needs in the country and workers are to remain in their assigned positions for several years before they can move to other places. They are also replaced once they leave. Such a strategy could be extended to health care workers (WB 2007). The implementation o f an efficient incentive system that promotes health worker productivity i s a priority issue for the sector reform agenda.
184

Annex D
Institutional Issues
D.24 External Donors and the Sector Wide Amroach. Nicaragua has done a substantial amount o f work in health pol icy reform that serves as a strong foundation for the SWAP in health. In mid-2004 the M O H released the ten-year National Health Policy and i t s corresponding 2004-201 5 National Heal th Plan. During the same year, the MOH released a draft Five-Year Implementation Plan detailing h o w i t would operationalize i t s National Health Plan. The fundamental goal o f this p lan i s to increase access to health care services o f the poor people, especially to effective maternal and chi ld health care.
D.25 As a result o f this effort, a number o f important development partners (World Bank, Holland, Sweden, Austria, Finland, and Spain) and representatives o f the GON signed a Code o f Conduct (COC) in 2005, outlining the framework o f future cooperation to support the implementation o f the health sector plan for 2005-2009. During the same year, these parties signed a Joint Financing Arrangement (FA) stipulating procedures to transfer and report funds provided through (sector) budget support. Through the signing o f these documents the framework for a SWAP in the health sector in Nicaragua was established.
D.26 The signed COC and JFA provide a strong legal and procedural framework to the SWAP process. Many financial management issues sti l l need to be improved and intermediate safeguards will be necessary in several areas for the medium term (e.g. in audit, procurement). The GON’s Integrated Financial Management System, SIGFA, could have been defined better in terms o f reconciling accounts. Further reform i s being introduced on the SIGFA.
D.27 Many o f the features o f the ideal SWAP have not yet been tested since the process has jus t started. It s t i l l remains to be seen if donors will be able to align their support with the GON’s planning and budget cycle and make pledges o f medium-term financial support and disburse funds in accordance with the needs and regulations o f the Ministry o f Finance. However, the donors and GON have also learned that the SWAP depends on donor coordination in alignment with government strategies supporting the National Health Plan. Financial support f rom donors may vary according to their own mandates and operational arrangements. These available financing alternatives have enriched the pol icy dialogue within the SWAP.
D.28 Decentralization. During the 1990’s, MOH initiated a health reform process that included the organization o f Local Systems o f Integral Health Assistance (SILAIS, Sistemas Locales de Atencidn Integral a la Salud) throughout the country. The MOH established, as one o f the main health sector strategies, the strengthening o f the SILAIS and Primary Care services. The MOH focused on the integral development o f health care services at the local level, strengthening and supporting the decentralization process. The National Health Plan (NHP) for 2004-2015 includes a decentralization plan based o n the principle o f separation o f functions (stewardship, financing, provision and insurance) and the transfer o f faculties, decision-making authority and resources to health providers. The Plan states that the SILAIS will become both managers and providers o f health services, complementing the stewardship role o f the Ministry. Further, MOH has plans to redefine the functions o f the SILAIS and local health networks. SILAIS will be responsible for delivering a package o f basic health services (PBHS) in accordance with MOH’s new health care model. The delivery o f this package wil l be achieved through a capitation transfer to the SILAIS, which in turn will purchase services f rom local public providers (municipios), and qualified private providers, mainly NGOs. M O H will enter into management agreements with S ILA IS (Convenios de Gestion), which will be the basis for the capitation transfers o f the community health- financing scheme to SILAIS. These management agreements introduce a system o f performance-based evaluation as they link budget allocation to agreed upon benchmarks related to productivity, quality and patient satisfaction. Municipalities are participating actively in this programming and budget exercise by developing their annual operation plans, which then become the core o f the SILAIS annual plan.
185

Annex D
Preliminary evidence suggests that these agreements have provided more autonomy to SILAIS in the planning and allocation o f resources for their operations (World Bank 2005).
D.29 In addition, the NHP established a set o f strategies and activities to consolidate the decentralization plan, including: (i) strengthening the professional capacity o f local management staff, and the regional, departmental and municipal councils; (ii) developing accountability mechanisms and monitoring and evaluation indicators for the decentralization process; (iii) designing norms that permit the purchase o f hospital services; and (iv) developing a long t e r m plan to transfer the responsibilities and resources for health provision to municipalities. The NHP also mentions the implementation o f a decentralized human resource management, but i t does not specify the responsibilities o f the SILAIS in this area (NHP 2003).
D.30 To support the decentralization plan, the SWAP in health i s funding technical assistance necessary to develop the institutional capacity o f the SILAIS and local administration units ( r n u n i ~ i p i o s ) ~ ’ ~ for implementing the expansion of the basic package o f health care and implement the strategic lines mentioned above. Civil society will play an active role in auditing the actual delivery and quality o f services to the community. A community committee will advise and ultimately endorse the provider annual workmg plan and periodically (e.g., quarterly) provide monitoring feedback to the provider and the supervisory SILAIS. Finally, the SWAP will also support decentralization by: (i) providing advocacy and technical assistance to municipal governments and the Autonomous Governments o f the Atlantic Coast o n the organization and management o f their regional health systems; and (ii) decentralizing management o f the MOH human resource function to the SILAIS and hospitals.
D.31 In spite o f the original purpose o f decentralizing key functions to the SILAIS, the degree of power and decision-making authority transferred to them was low. In terms o f the finance function, Bossert et al. (2001), found that SILAIS administered only 19 percent o f the budget at the primary level o f care. Moreover, the SILAIS’ actual control o f expenditures was moderate since these are l imi ted to non-personnel services and material and supplies, which account for less than 10 percent o f the total SILAIS budget. This situation also contributes to the SILAIS’ l imi ted flexibil i ty to make intra-budget reallocations. Regarding user fees and the allocation o f their own revenues, the SILAIS could charge for those activities that they manage directly (i.e., inspections) since the local administration un i ts are the ones entitled to set user fees at the health facilities. In both cases, there was autonomy to allocate these revenues according to their priorities. Bo th SILAIS and the municipalities can receive direct financial aid f rom international donors to carry out specific health programs.
D.32 Bossert et al. (2001) also found a very l o w degree o f autonomy to perform service organization functions, which s t i l l applies to the present situation in Nicaragua. The SILAIS have n o influence on the management and budget o f hospitals in their regions, since MOH allocates resources to hospitals directly. The M O H st i l l controls the funding, planning and implementation o f the main public health programs, which reduces the capacity o f SILAIS to fo l low their own operational program. Another factor that reduces SILAIS’ management autonomy are the MOH imposed budget ceilings that limit their abil ity to deploy medicines and medical supplies according to their programming needs. On the other hand, the SILAIS have the right to propose hiring, transferring and dismissing personnel although they are not allowed to actually implement personnel related actions or to set salaries for their staff. SILAIS can have contracts with private providers for complementary services such as maintenance, laboratory, etc., although there i s a central office in charge o f maintenance. Similarly, with regard to governance, Bossert (2001) reports that many o f the Health Boards (Juntas de Salud) at the local level were not functioning, and the ones that were had a very limited role in the decision-making o f main SILAIS operations. However, community participation i s very high at the local health unit. Health Boards participate in the approval o f annual operation and emergency plans. In addition, both local governments and communities have already been participating in health service provision through the co-financing o f preventive L
2 15. The local health administration u n i t s are referred as “municipios” in Nicaragua.
186

Annex D
maintenance o f health centers. Municipalities can request funds to finance preventive maintenance through the presentation o f an Annual Maintenance Plan, which includes the individual projects and community maintenance committees who are responsible for carrying out the work.
D.33 Nicaragua has to strengthen management agreements with the SILAIS and introduce more incentives to make them work more effectively. In order to do this, further institutional strengthening at the local level i s needed, as wel l as the polit ical commitment to push it. Similarly, a major effort o n building up more robust monitoring and evaluation systems i s needed.
D.34 In spite o f the limitations presented here, Nicaragua has been the most ambitious in planning to further decentralize services to SILAIS and municipalities, compared to neighboring countries, such as El Salvador, Honduras and Guatemala. I t also has the longest experience with decentralization. The data o n decentralized funding suggest that those municipalities in SILAIS with higher levels o f decentralized budgets showed better health coverage rates. A key next step i s t o assess the performance o f the management agreements with SILAIS.
Conclusions and Recommendations
D.35 Nicaragua has made progress in a number o f key performance indicators including the reduction o f chi ld mortality rates and under-nutrition, as wel l as improvements in key maternal health indicators. Nevertheless, Nicaragua i s s t i l l slightly off-track in reaching i t s infant and ch i ld mortality MDGs. In terms o f maternal health, while the MOH-based estimates seem promising because they indicate a declining trend in maternal mortality rates, the MOH 2005 estimate of 86.5 per 100,000 i s s t i l l very far f rom the 2015 MDG goal set by the Government o f 20 per 100,000. It i s also recommended that a nationally representative survey be conducted to make it comparable with the WHO 2000 estimates o f 230 deaths per 100,000. If undertaking such a survey i s infeasible then another option i s to update the proxy-for MMR-indicator (percentage o f women who deliver attended by a skilled health professional) in order to determine if Nicaragua i s on track to reach the 2015 target o f 100 percent, because the most recently available published data for Nicaragua i s for 2000 (67 percent). Moreover whi le the percentage o f children under 5 years o f age who are stunted declined from 24.5 percent in 1998 to 18.1 percent in 2004 (WDI 2007) i t i s unclear whether Nicaragua i s on track because o f the absence o f comparable 1990 data to adequately track progress; readily available Government documents also do appear to specify nutrition MDG targets.
D.36 Despite progress made in a number o f key health indicators, inequities remain among income quintiles, urbadrural areas, and indigenoushon-indigenous populations. In addition, family coverage has declined by almost ha l f f rom 2001 to 2005, as well as coverage o f certain key vaccinations (DPT, MMR, and polio) for one year old children.
D.37 Total health expenditures have increased in real terms, with a significant emphasis o n curative care and medical inputs and personnel costs. Preventive care and training and research receive substantially less (7.5 percent each) and spending on drugs has remained stable in nominal terms (US$24 million) and declined as a percent o f total expenses (2004: 19 percent; 2006: 15 percent). Efficiency gains could be made in terms o f rationalizing health care and spending especially terms o f (a) improving i t s focus on cost effective preventive care and health promotion measures -together with a corresponding increase in their budgetary shares in order to make a meaningful difference in basic health, nutrition, and population indicators especially for poor and disadvantaged children and women, (b) the INSS, (c) the allocation o f personnel, and (d) procurement o f drugs.
D.38 The Government has issued policy directives that focus on three main areas: (i) the ro le of the MOH as steward o f the sector, (ii) actions on health services supply, and (iii) actions on health demand. The recommendations that fo l low take these directives as guides and build o n them based on the analysis
187

Annex D
undertaken. In addition, emphasis i s placed on the inclusion o f policies on sector financing and resource allocation.
Stewardship Role of the MOH
All health sub-sectors are subject to M O H rules, supervision and control: MOH facilities, INSS, MPIs, private sector, NGOs, others. I t follows that the MOH needs a comprehensive institutional strengthening program, to effectively address the challenges ahead. Adapt the model health care package to epidemiological, ethnic, cultural and local specifications. A team o f specialized personnel i s needed to reformulate existing definitions and protocols. Operations research has to be done, with an action and results oriented strategy. Implement quality assurance and assessment mechanisms at a l l levels and sub-systems. Strong technical support i s required in this field, and verifiable targets need to be identified and met such as reduction o f waiting lines, specific indicators o f efficiency and equity improvements. Ensure that sectoral targets are wel l aligned and consistent across programs and strategies over a specific period o f time (PRSP, National Health Plan, etc.).
Actions on health supply (with related technical and donor support)
More equitable delivery o f health services especially in the Atlantic Region, where the number o f health care facilities i s much lower while the needs are higher. T h i s usually forgotten region i s now an important focus o f the new administration. The new government intends to invest more resources in this region to improve i t s health indicators and it would be important to closely monitor if actions are on track. Conduct a thorough inventory o f health sector investments, both in terms o f hospital equipment and infrastructure, in al l sub-sectors, and assessment o f future needs from a systems based approach. Establish a drug-purchasing and distributing agency. Assessment and support to i t s development, organization, implementation and operation. Assess traditional health practices, i t s effectiveness, and whether some o f them can be integrated as part o f health promotion and provision o f services Establish health protocols at a l l levels (ambulatory and hospital care, by ailment). Ensure uniform quality standards for health services provided by MPIs for INSS. Standardize health information and management information systems, throughout the whole sector, for public and private facilities Develop MOH’s capacity to provide adequate supervision, assessment, and fol low up actions. Renew support to local participation. Assess decentralization issues and identify ways to address them. For example, Nicaragua has to strengthen management agreements with the SILAIS and introduce more incentives to make them work more effectively. A key next step i s to also assess the performance o f the management agreements with SILAIS.
Actions on health demand
Review and revise current benefit packages and their proposed extension in terms o f their impact o n health financing needs, operational costs, physical investments, human resource needs and resource usage. Extend service coverage to more segments o f the population under the Integrated Health Care Model (MAIS)
188

Annex D
Guarantee cost-free health assistance to the poor segments o f the population. Economic and financial impact need to address possible adverse equity problems (subsidies to higher income groups), and other related issues.
SectorPnancing and resource allocation: Formulate budget requests and allocate resources in accordance with health needs at the local level. T h i s underscores the need to consider local epidemiological profi le and other location- specific factors. Allocate more budget to cost-effective preventive and health, nutrition, and fami ly planning promotion services (this i s key because about 30 percent o f the population, based o n the L S M S 2005, survey resort to self-medication which can potentially pose health risks if inappropriate), as wel l as to trainindcapacity building and research/M&E activities Calculate the fiscal implications o f the pol icy directive, which states that al l health technical staff and professionals will receive salary levels that are competitive to the rest o f the Central American countries and i t s possible impact on other health-related expenditure categories such as drugs and training. Evaluate the impact o f free services o n service use and operation In the case o f INSS, consider the feasibility o f establishing different capitation payments that consider cost and risk by age and gender, and the inclusion o f cost- and overuse- containment strateges, as wel l as improving public and private partnerships arrangements. Find and propose new financing sources to increase the national health budget f rom sustainable domestic sources, and reduce reliance on external funds.
189

Annex D
190

A n n e x E
Annex E
Review o f Public Spending on Social Protection
Main Findings of Previous Reviews
E.l The 2001 PER had found that the individual social protection programs are generally we l l targeted, particularly because beneficiary identification largely relies on targeting mechanisms (geographical targeting as wel l as means-testing). But as a group, the programs are fragmented and are not guided by a clear strategy. Clear priorities for social protection are lachng, both in how to best address vulnerabilities and in defining who the priority groups among the vulnerable are. The coverage of ongoing programs was very modest. If there were n o overlap in the coverage o f different programs, i t was estimated that spending by the Ministry o f the Family could in principle reach as many as 450,000 children and adolescents. T h i s only represented around one-third o f the total poor and extreme poor children aged 0-18. To the extent that there are significant overlaps, which i s likely, coverage would be even smaller.
E.2 Given that the largest among the vulnerable population in Nicaragua are children, the focus o f the social protection programs was considered appropriate. However, the 200 1 PER also recommended that the overall social protection strategy be extended to encompass other important vulnerable groups. One o f the most important i s poor worlung-age adults affected by economic instabilities (e.g., coffee price declines), natural shocks (e.g., droughts) or individual shocks (e.g., health shocks), who need programs to protect them f rom wide income variations. There have been few programs in place that effectively address this group.
Figure E.l Poverty Trends 60
50
40
30
20
10
~ 1993 1994 1995 1996 1997 1998 1999 2000 2001 2002 2003 2004 2005 2006
Source: INEC (2006).
Evolution of Key Sector Outcome Indicators since 2001
E.3 Progress in poverty reduction has been disappointing. Indeed, in spite o f modest declines during the 199Os, poverty remains high and social indicators weak in Nicaragua. Recent poverty indicators f rom the 2005 Living Standards Measurement Survey show that progress in poverty reduction has slowed down further, with a headcount o f 46.2 percent for the poor and 14.9 percent for the extremely poor. Nicaragua has experienced a reduction in inequality (from a Gini coefficient o f 50.4 in 1993 to 41.0 in 2005) over the past decade, associated with a reduction in the depth o f poverty. The poverty depth
191

Annex E
(measure o f the average distance o f the poor’s consumption to the poverty line) o f the very poor has decreased by about 30% between 1998 and 2005. However, the actual number o f poor has not shown improvements (even if they are less poor on average). Poverty in i t s many dimensions i s particularly acute in rural areas and the Atlantic coast: in 2001, 62 percent o f the poor and 76 percent o f the extremely poor live in I
Source: INEC (2006).
E.4 In addition, the poor in Nicaragua exhibit a relatively high vulnerability, l inked to both the frequency o f covariate shocks (including natural disasters and commodity price shocks) and to household- level shocks (including health shocks). Coverage mechanisms for these r i s k s are underdeveloped in Nicaragua, leaving many household without means to insure against these risks. For instance, in terms o f coverage for health care costs (National Social Security Institute), whi le 24 and 13 percent o f the population in Managua and the Pacific have health insurance, respectively, coverage i s only 4 percent in the Center and the Atlantic, only 3.4 percent in rural areas and as l itt le as 2.5 percent for the poorest quintile
Figure E.3: Access to health insurance, 2005 ” _ I_
1
- 2 2 3 1 24 B
Income quintiles
Source: Poverty Assessment, on basis o f LSMS 2005
192

Annex E
E.5 The high level o f poverty and vulnerability i s reflected in very poor outcomes in terms o f nutrit ion in the country. Despite improvements, more than one chi ld under the age o f 5 out o f every f ive children i s chronically malnourished. The situation i s particularly dire in rural areas (27 percent prevalence) and amongst the very poor (37 percent amongst the poorest quintile)'16.
Figure E.4 Prevalence o f Stunting in Nicaragua among children aged 0-59 months, 2005
25
20 0 3 8 E 15
LF 10
5
0 0-5 6-11 12-23 24- 35 36-47 48- 59 National Urban Rural I
E.6 Many social indicators also are strongly correlated with poverty status and vulnerability. Fo r instance, the level o f maternal care i s lower in rural areas, indigenous areas and among the poorest. The level o f preventive health care for the highest quintile i s three times higher than the poorest. Similarly, literacy, enrolment, attendance and completion remain l o w in particular amongst the poor and in rural and Atlantic areas: at age 17 enrollment rates for boys in richest quintile are 4 times larger than for boys in the poorest quintiles; net secondary enrollment in rural areas i s ha l f o f that in urban areas (28.1 vs. 61.1. percent); and one out o f four young people between the ages o f 15 and 24 years i s illiterate in extremely poor households (vs. 4 percent for the n ~ n - p o o r ) ~ ' ~ .
C. Evolution o f Sector Expenditures
E.7 Unl ike education or health, social protection i s generally not defined as i t s own sector, but rather as a "strategy" that involves most sectors. Since it cuts across sectors and i s integrated into a wide variety o f types o f programs and projects, it i s often diff icult to disaggregate how much budget i s specific to social protection. In this chapter, we have aggregated expenditure from the programs and institutions fully dedicated to social protection. This includes five main actors: the President's offices, the Ministry o f the Family, the Ministry for Labor, the Social Emergency Investment Fund (FISE), and the National Social Security Institute (INSS) 218. The total allocated to social protection programs in these institutions varies greatly f rom year to year, fluctuating between less than 0.5 percent o f GDP to almost 2.0 percent o f GDP. After exhibiting large fluctuations, the share o f various institutions in this total has stabilized since 2002, with the Ministry o f the Family and FISE representing about 30 percent and over 60 percent o f the
L
Poverty Assessment (on basis o f L S M S data for 2005) Poverty Assessment (on basis o f L S M S data for 2005). As defined here, publ ic spending o n social insurance only includes central government transfers to the
Nicaraguan Social Security Institute ( INNS) as a co-financier o f health and pension benefits for i t s affiliates. INSS budgeted approximately U S 1 2 0 m i l l i on in expenditures for 2001, o f which only about US$1.7 m i l l i o n are central government transfers (approximately 1.2% o f overall financing).
216
217
218
193

Annex E
expenditure on average, respectively. A very large share o f the social protection budget as defined here i s financed with external resources (around 75 percent in the case o f the Ministry o f the Family and FISE).
Figure E.5 Public Expenditures on Social Protection (as % o f GDP) - . ._ .. 2 00% -
1 7 5 % 1 -
, Total SP spending A 150%
b 125% (3 'c : 100%
g 075% Q)
n 0 50%
0.25%
0.00% 1991 1992 1993 1994 1995 1996 1997 1998 1999 2000 2001 2002 2003 2004 2005
1991 1995 2000 2001 2002 2003 2004 Presidency (Social Action Secretariat and Social Emergency Fund) 0.00% 0.60% 0.27% n/a 0.04% 0.03% 0.03% Ministry o f Labor (wio INATEC) 0.15% 0.05% 0.09% 0.05% 0.05% 0.05% 0.04% Ministry o f the Family 0.00% 0.00% 0.42% 0.22% 0.22% 0.49% 0.58% Social Emergency Investment Fund (FISE) 0.00% 0.09% 0.13% 0.12% 0.46% 0.95% 1.18% National Social Security Institute (INSS) 0.38% 0.04% 0.01% 0.00% 0.00% 0.00% 0.00% TOTAL 0.54% 0.79% 0.91% 0.53% 0.77% 1.52% 1.84%
Figure E.6 Public Expenditures on Social Protection (Share o f institutions in total)
100%
90%
80%
70%
60%
50%
40%
30%
20%
10%
0 Yo 1991 1992 1993 1994 1995 1996 1997 1998 1999 2000 2001 2002 2003 2004 2005
2005
0.04% 0.03% 0.30% 0.62% 0.00% 0.98%
E.8 Social protection programs and activities are typically undertaken by a myriad o f actors, often within their regular operations, which are not included in the sector expenditure totals reported in the Figures above. For instance, the Ministry o f Education might have a program o f scholarships for poor
194

Annex E
high-achieving students, which could be considered a social protection program, as it helps the poorest by releasing some o f their constraints to access services. In addition, the spectrum o f activities which could be considered as part o f social protection i s very broad.
E.9 The GON has developed and adopted a Social Protection Strategy, which uses a rather broad fi-amework to define the national social protection “system”. I t encompasses activities and programs o f “Atencion Inmediata y directa para recuperar bienestar minimo”, other activities geared towards the “Entrega de beneficios para atender causas directas de vulnerabilidad”, and finally a broader set o f LLacciones de desarrollo economico y social para las causas indirectas de vulnerabilidad”. In Nicaragua, the first set o f activities would involve institutions l ike the Ministry o f the Family, M INSA, MECD and INIFOM, the second would involve FISE, INWL and INATEC in addition to the core agencies, whi le the last set would involve MAGFOR, INTA, IDR, and MIFIC. T h i s makes the analysis o f the “sector” rather diff icult and subjective. In view o f the large number o f institutions involved, the articulation o f a Social Protection Strategy represents an important step in the rationalization and coordination o f actors in the area o f social protection. However, i t s implementation has been rather l imi ted to this date.
E.10 Patterns and trends. Expenditures on social protection programs exhibit a very erratic pattern - with large fluctuations in the total amounts devoted to the various programs and institutions and large fluctuations in the share o f specific programs and institutions in the total. In terms o f percentage o f GDP, the two extremes were 2.3 percent in 1993 and 0.64 percent in 1998. Even from one year to the next, changes can be dramatic - For instance, the sector went fi-om 2.12 percent o f GDP in 2004 to 1.14 percent in 2005, a reduction by 46 percent. These fluctuations are partly l inked to particular emergency rel ief operations, but, more generally, they reflect a lack o f adequate planning and budgeting capacity for social protection programs. T h i s has an important adverse impact o n their effectiveness and continuity.
E.11 One o f the challenges o f social protection i s that i t typically requires counter-cyclical funding - larger resources are needed in times o f lower economic growth and/or disasters. On the other hand, social protection programs typically involve lower fixed costs (e.g. salaries) than other ministries (e.g. health or education) and hence face less resistance to budget cuts in times o f fiscal consolidation. This particular aspect o f the sector makes i t a prime candidate for large cuts or shifts. T h i s i s illustrated above, in Figure E.6, which shows the share o f different programs in the total. I t i s also a sector where administrations typically attempt to develop flagship programs that are strongly identified with a particular administration and hence have lower chances o f being continued after polit ical transitions.
E. 12 Executed versus planned expenditures: When focusing on the differences between planned expenditure and actual expenditure, a few programs - namely the programs run fi-om the Presidency and the FISE - appear particularly erratic. FISE executed over 700 percent o f i t s planned expenditure in 1995 and almost 400 percent in 1997. The variability seems to have decreased over the years, although large discrepancies s t i l l persist (e.g. FISE spent 1.65 times i t s planned expenditure in 2004.
E.13 Sources o f Funding: One o f the weaknesses o f the programs in the social protection area i s their uncertainty and erratic nature (in addition to fact that small, pilot-type, uncoordinated, gaps, duplication, etc.). Part o f that uncertainty i s l inked to the sources o f funding for these programs. T o illustrate the situation, Table E.l presents the sources o f funding for the Ministry o f the Family’s and FISE’s capital expenditure. The dependency on external fimding for the two institutions has improved over time. Fo r instance, for the Ministry o f the Family, the share o f external financing decreased from 90 percent in 2004 and 2005, to 74 percent in 2006 and a planned 75 percent in 2007. However, this share remains very large and the dependency s t i l l results in disruptions in programs - programs stopping before being completed, programs on hold for short periods o f time, etc. - which limit their effectiveness and sustainability.
195

Annex E
Figure E.7 Public Expenditures on Social Protection (Executed as percent o f Budget) 800% T- ___I___._ ___ _I___________II___~I_______I__I__.____ ----I_
400%
300%
200%
100%
0% 1991 1992 1993 1994 1995 1996 1997 1998 1999 2000 2001 2002 2003 2004 2005
Resldency (Social Fund)
I
E.14 The Nicaraguan Social Security Institute (INSS) covers a relatively small number o f (mostly non- poor) Nicaraguans, as illustrated in Figure E.3, but had a large impact on the budget in the early 1990s - and accounted for almost 0.4 percent o f GDP. Since 1994, however, the institute has had a surplus and has not been a burden on the budget. T h i s might be related to the efforts in increasing the number o f insured workers - from 200,000 in 1993 to 430,000 in 2006 - and to the current demographic structure o f the INSS’s participants. Indeed, the current system has a significant actuarial deficit (estimated at C$ 271,573 millions) which represents a significant contingent liability. As a result, the Government i s studying alternative options for reform. The init ial reform proposal presented by the High Commission for the Reform o f the Pension system (which adjusted the contribution rate, the age o f pension, and the indexation o f benefits) s t i l l involves a deficit starting in 2040 and reaching up to 6 percent o f GDP by 2065. The Inter-institutional Technical Commission i s currently studying alternative scenarios.
D. Assessment of Allocative and Operational Efficiency
E. 15 The disappointing human development results described earlier occurred despite gains in GDP per capita growth and substantial resources dedicated to poverty reduction programs (about h a l f o f public spending, equivalent to about 15 percent o f GDP). This suggests potentially large inefficiencies in public spending - both in terms o f their allocation, in terms o f their operational efficiency, and in terms o f their quality. The multiplicity o f programs and projects, lack o f coordination, high operational costs, lack o f targeting, and resulting gaps and duplications are often cited as keys to understanding the l imi ted impact o n poverty.
E. 16 One o f the most critical issues noted in the area o f social protection i s the l o w level o f allocational efficiency. Two important factors contributing to this are the poorly targeted social security system and program fragmentation: . Limited access to insurance mechanisms. Access to health insurance i s very limited, as described
above, with only 17 percent o f urban households and 4 percent o f rural households affiliated. Similarly, pension coverage i s relatively low, with only 20 percent o f urban elderly and 3 percent o f rural elderly receiving pension benefits. For both these elements, there i s a strong bias towards the richer segment o f the population: 40 percent o f the pension benefits are received by workers in the
196

Annex E
richest quintile versus 4 percent for the poorest quintile. Health insurance covers only about 2.5 percent o f households in the lowest q ~ i n t i l e ” ~ .
E. 17 Fragmentation of programs. Nicaragua suffers f rom a fragmentation o f i t s programs across social sectors and within each sector by levels, as wel l as duplication o f efforts and overlap o f programs. For example, M I N S A and the Ministry o f the Family both manage nutrit ion programs that use the same protocols, but are not coordinated. Overlaps and lack o f coordination are also perverse within institutions and agencies. For instance, the operations o f the Red de Proteccion Social and o f PAININ, both in the Ministry o f the Family, were not coordinated and led to duplication in particular areas o f implementation. There have been some efforts to foster local coordination o f projects (the Ministry o f the Family started reorganizing i t s programs in 2006 but coordination at the local-level remains an issue, overlaps amongst food programs and early childhood development interventions). The recently developed Social Protection Strategy provides an opportunity to work o n this issue.
Figure E.8: Sources of funding for the Ministry of the Family and FISE - 2003-2007
100%
90%
80%
70%
60%
50%
40%
30%
20%
10%
0% --
E Prestamos Extemos Donaciones Extemas Rentas del Tesoro
1 2003 1 2004 I 2005 1 2006 1 2007 2003 I 2004 j 2005 j 2006 2007 ’ 1 Emergency Social Inwstment Fund Ministry of the Family 1
CaDital exoenditure 2003 2004 2005 2006 2007 (actual) (actual) (actual) (actual) (planned)
Ministry of the Family Treasury Resources 13% 10% 10% 26% 25% External grants 14% 11% 23% 1% 2% External credits 73% 79% 67% 73% 73% F I S E Treasury Resources External grants
13% 11% 12% 30% 24% 3% 3% 10% 21% 13%
External &edits 84% 86% 78% 50% 63% Source: Ministerio de Hacienda. Debt re l ie f funding and earmarked taxes are included in the “Treasury Resources” category.
L
* I 9 These figures only refer t o the distribution o f benefits f rom health insurance and pensions. They do not take in to consideration the contributions made by workers and households towards these systems. The analysis o f the funding and contributions is necessary for a full analysis o f their distributional impacts.
197

Annex E
Another critical issue i s the poor quality o f services and outcomes: 0 Targeting and coverage. Most programs in social protection are o f a “pilot” nature, covering very
small groups in the country. T h i s raises two issues in terms o f effectiveness o f public expenditure - the targeting o f these programs could often be improved with larger-scale interventions, and the resulting services provided to different communities vary largely across the country, limiting the horizontal equity o f the programs. Coverage o f the population i s a key issue in Nicaragua’s social protection programs, as mentioned earlier. Qualitv o f services: The social protection services also suffer limitations in terms o f their quality, partly due to the erratic nature o f financing for programs and their uncertain continuity (which prevents f rom the establishment o f strong, effective structures) and partly due to the inabil ity o f the social protection programs to coordinate with other programs and service providers (for instance, the Ministry o f the Family and M I N S A have not managed to enter into service provision contracts for beneficiaries o f the Red de Proteccion Social). In addition, the efficiency o f social protection programs depends by nature on complementary investments in the sectors o f health, education, and other sectors such as rural development, water, or credit. A s a result, lack o f coordination i s more than a missed opportunity for increased efficiency/quality, i t i s actually a cause for lower efficiency.
0
E.18 operational efficiency. T h i s i s attributable to,
Finally, the other critical issue for social protection programs in Nicaragua i s their l imited
Large fluctuations in financing (see above) limits stability and continuity o f programs, High variability in the costhenefits o f different programs, Large overhead costs o f central activities: One o f the issues with multiple, small, programs i s the resulting high central activity costs. Some efforts have been made to reduce these costs, in particular in the Ministry o f the Family, which has reorganized to centralize some o f the financial management and procurement activities for a l l i t s programs (GON, 2006);
Absence o f monitoring and evaluation mechanisms to monitor inputs, outputs, processes, outcomes and impact using a sector-wide framework. T h i s i s associated with a relative lack o f transparency in the operations (partly l inked to small-scale nature o f programs and to erratic implementation); and Human resource bottlenecks (poor salaries, skewed incentives, inadequate skills/qualifications, not focused on results, high turnover).
0
0
0 Weak institutions, 0
0
E. Main Conclusions and Recommendations
E.19 Greater planning and coordination o f social protection programs and social programs in general i s a key element to increased impacts. Rationalizing some o f the existing programs would help reduce their implementation costs. The main actions recommended to improve program coordination and effectiveness are presented below:
0 Program Consolidation. The consolidation o f the programs could start with a few programs, and gradually integrate projects and programs in a coherent way, avoiding overlapping between agencies and filling gaps, while rationalizing a large amount o f interventions with litt le demonstrated impact. The social cabinet can play a role in providing guidance and coordinating these activities. Strengthened analytical foundations. Develop a map o f the social protection sector that includes an inventory o f existing programs and services provided by a l l stakeholders in the country (public, private, c iv i l society), an analysis o f the existing gaps in supply o f services, social spending analysis, an analysis o f targeting mechanisms used in service provision and service allocation in the recent past, and an analysis o f impacts, strengths and weaknesses o f selected programs.
0
198

Annex E
0 Strategic Planning and Monitoring. Stronger central strategy, planning mechanisms, and M&E systems would help implement the coordination, improve the design o f program, and develop a sector-wide approach. Unified and integrated mechanisms would provide a basis for a more programmatic support by the international partners, which could contribute to reducing the fragmentation and duplication o f programs. Stronger social accountability mechanisms are fundamental parts o f this effort, and experiences have shown how they can contribute to increased impact on the ground, in particular at the municipal level. Regional Coordination. Develop mechanisms to centrally coordinate the allocation o f programs across geographic zones. This would result in improved targeting o f resources, and to greater synergies between programs. T h i s would cut across a l l human development programs. Central coordination i s an important element to ensure the targeting o f central expenditure to the areas most in need, in particular in the context o f decentralization. Strong central institutional arrangements would be required, which are not currently in place. In addition, some central agencies would need institutional strengthening to play their roles effectively. Propose a national approach rather than an approach where each program decides where to intervene - leading to some municipalities receiving n o program whi le other similar municipalities receive 3 or 4 programs. Local Coordination. Consolidate init ial efforts to foster local coordination o f projects. This could include developing mechanisms to harmonize eligibil i ty criteria for householdshndividuals, mechanisms to propose a unique window for social services, and mechanisms to provide accompaniment to families and individuals in accessing services.
0
0
199

Annex E
200

Annex F
Annex F
Review of Public Spending on Transport
Summary of Findings from Previous Sector Reviews
F.1 The 2001 PER and 2004 DPR reported that Nicaragua’s economic performance was being restrained by an inadequate level o f transport infrastructure and services. The country n o longer has a railroad, domestic air transport i s in i t s infancy and i t s seaports were run down. Over 95 percent o f freight and passenger transport moves by road, however, so that this represents the most important transport infrastructure sector - for both domestic and international traffic - and the greatest source o f potential bottlenecks. The PER also argued that the inadequate transport infrastructure represented an important obstacle for the poor trying to escape poverty. Given the need at the time to recover fi-om the extensive damages to the road network that had been inflicted by hurricane M i t c h in 1998, the Ministry o f Transport and Infrastructure (MTI) had at one point been assigned up to 18 percent o f the total central government budget. The transport investment program was also reoriented to p lay a stronger poverty reducing role by including investments beyond the trunk segments o f the network and the start-up o f the “adoquines” (small cement paving blocks) program for rural road stabilization, which offered a much higher level o f service for rural roads than the traditional gravel alternative.
F.2 The main factors contributing to the inadequate level o f transport infrastructure were diagnosed as the following:
Limited road network coverage. Nicaragua has the largest territory in Central America and the smallest economy, and so i t i s not surprising that i s should exhibit the lowest density o f paved roads in the region. However, the 1995 transport sector reviewzz0 noted that the coverage o f Nicaragua’s transport infrastructure i s generally adequate given the country’s medium-term growth prospects, but that the existing infrastructure i s in poor condition.
Unsuitable Road Design. Inter-city roads in Nicaragua typically consist o f shoulder-less two lane roads, with under dimensioned bus stops and parkmg areas alongside the pavement and wide variety o f different users (e.g., cars, buses, trucks, cycles, pedestrians). Beyond the predominantly poor condition o f the roads themselves, the mixed traffic and the general lack o f complementary infrastructure adds a further burden to road transport.
Poor Rural Transport Infrastructure. Access to paved roads i s l imi ted and very disparate: according to the LSMS, less than one-fourth o f a l l Nicaraguans have access to paved roads. T h i s proportion declines to 7 percent for the extreme poor and 11 percent for the poor. M a n y rural roads are simply impassable during much o f the 6-month long rainy season.
Inadequate Maintenance, Planning, Funding and Implementation Arrangements. Except for routine maintenance by micro-enterprises o n selected links, the 2001 PER found that maintenance was not being carried out adequately, which resulted in premature road deterioration. Important factors contributing to poor maintenance were the inconsistent and untimely releases o f budgetary allocations, and institutional limitations in the MTI that hampered the planning and implementation o f maintenance. An important initiative to help address this problem was the creation o f a Road Maintenance Fund (FOMAV). The absence o f legislation to set up a dedicated fuel levy, however, l imited the effectiveness and sustainability o f the Road Fund.
220. Wor ld Bank, 1995, “Nicaragua: Recovery in the Transport Sector”.
201

Annex F
Weak Planning and Programming by the Transport Ministry. The MTI had made significant progress by 2001 in ranking investments in terms o f economic priority and the Government’s strategic goals, while paying adequate attention to maintenance and to their environmental and social aspects. However, there remained a need to develop the MTI’s basic capacity to carry out road condition inventories, to improve staff training, to seek least cost solutions to technical and engineering problems associated with road and bridge maintenance, as wel l as to foster the development o f the local consulting and contracting industries. Furthermore, there was a need to strengthen the procurement and contracting management functions, which are crucial to fostering the participation o f private contractors and timely completion o f the road improvement program.
Limited Implementation Capacity and the Use of Parastatals. In the mid-l990s, M T I ’ s implementation capacity was l imited to about 60 km o f major road rehabilitation per year. This poor implementation record was partly due to the continued reliance o n state construction companies (COERCOs) that lack dynamism and to a weak local construction industry. B o t h are linked: although the COERCOs represent a mechanism for rapid deployment, which proved useful after Humcane Mitch, their existence inhibited the creation o f efficient companies in the long run. Accordingly, the 2001 PER recommended that the COERCOs be downsized to the minimum needed for emergencies and remote areas, while malung greater use o f the private contractors. T h i s i s considered a more efficient way to develop the country’s implementation capacity than trying to improve the performance o f the COERCOs.
InefJicient Vehicle Fleet and Inadequate Regulatory Oversight. Nicaragua had a fleet o f about 230,000 vehicles in 2000 (an average o f 0.05 vehicles/person - one o f the lowest in the region), and it was estimated that about 50 percent o f the freight transport fleet i s more than 14 years o ld and a significant share i s over 20 years old. Freight transport services are provided entirely by the private sector. Technical and safety regulations were found to be sufficiently developed, whi le MTI lacked adequate monitoring and enforcement capabilities.
Unclear Sector Management Roles. While the MTI i s responsible for managing the entire primary and rural road network and for regulating road, sea and air transport, the division o f roles and responsibilities between the MTI, the rural development agency (IDR), and the municipalities, especially for the maintenance o f rural infrastructure and the management o f transport services, remained unclear. T o address this problem, the 2001 PER recommended the preparation o f (i) a study to help identify the appropriate roles and responsibilities o f the key players, help foster efficient sector development, and avoid the duplication o f efforts and (ii) a strategy for decentralizing the management o f the road network and transferring most o f the secondary and rural road segments o f the network f rom MTI to the municipal governments. Ineflcient Urban Transportation Services. About two-thirds o f the traffic f low (vehkm. or t odun . ) in Nicaragua i s concentrated in the urban areas. Past JICA and Bank-financed studies found that while there i s adequate urban road space for the existing vehicle fleet and population, the cities showed deficiencies in al l aspects o f traffic and transit management.
Evolution of Key Sector Outcome Indicators
F.3 There has been considerable progress made in the road transport sector after 2001, with most o f the trunk roads having been rehabilitated by 2006. However, Nicaragua s t i l l remains relatively under- endowed with road infrastructure, which could become a bottleneck to economic growth if it i s not addressed adequately.
F.4 Size o f Road Network. The size o f Nicaragua’s road network has remained more or less the same since 1999, totaling around 19,000 kms . The proportion o f paved roads has increased modestly, however,
202

Annex F
from 10 percent in 1999 to 11 percent in 2003, resulting in slight increases in the territorial density and population density o f paved road coverage; Table F. 1.
Table F.l Paved Road Infrastructure in Latin America Territorial Density Population Density
(meters road/Km2 area) (meters roadcapita) 1992 1999 2003 1992 1999 2003
Costa Rica 109.8 154.5 161.9 1.75 2.20 1.98 El Salvador 82.8 94.4 -- 0.32 0.32 -- Guatemala 32.0 44.7 -- 0.36 0.44 -- Honduras 21.4 24.8 -- 0.44 0.44 -- Nicaragua 13.2 14.0 15.8 0.44 0.37 0.39 Panamit 30.7 52.2 -- 0.94 1.40 -- Central America Ave. 48.3 64. I -- 0.71 0.86 --
Bol iv ia Ecuador Paraguay Peru
1.6 2.5 3.9 0.24 0.33 0.48 22.3 28.8 25.9 0.58 0.66 0.57
7.4 6.9 -- 0.67 0.52 -- 5.8 7.8 8.0 0.34 0.40 0.38
Uruguay 55.3 45.6 -- 3.16 2.44 -- Source: Wor ld Bank, W o r l d Development Indicators.
F.5 Condition o f Road Network. In the absence o f any resurfacing or reconstruction during the1980s, Nicaragua's road network had deteriorated to the point where only about 12 percent o f it was in good or fair condition. T h i s improved significantly during the 1990s. In spite o f the setback caused by humcane M i t c h toward the end o f the decade, the proportion o f roads in good or fair condition rose to 19 percent by 1999. Since then, this proportion has continued to improve at a more moderate pace, reaching 20 percent in 2006.
F.6 In spite o f the gains made since 1999, the quality o f road infiastructure s t i l l remains among the lowest in Central America. According to the Ministry o f Transportation and Infrastructure (MTI), more than 75 percent o f the total road network in Nicaragua i s in poor condition. As detailed in Table F.2, the trunk and collector roads have now been mostly restored to good condition, and have been essential to the economic recovery. ] However, the overall l o w share o f the network in good condition i s due mainly to the abysmal condition o f the other categories (secondary, tertiary and unclassified roads), which together represent 87 percent o f the total network. This largely reflects the l o w level o f investments, coupled with an inadequate maintenance regime that has resulted in premature road deterioration. These findings suggest that the poor quality o f roads, rather than their availability, i s the principal bottleneck in this sub- sector.
Table F.2 Road Condition by Category Road Category Length (km) Share in good/fair condition (1)
2000 2006 2000 2006 1. Trunk (asphalt) 1,752 1,752 71% 74%
3. Rural axes (gravel and adoquin) 5,015 2,052 38% 40% 4. Rural all-weather (gravevother) 3,071 16% 5. Unpaved and seasonal 11,544 11,525 0% 6% Total 19,036 19% 20%
2. Collector (asphalt and adoquin) 636 636 78% 88%
Note: (1) Roads with a Roughness Index (IRI) <7.
203

Annex F
Evolution of Expenditures in the Transport Sector
F.7 Sector expenditures rose in the hurricane M i t ch year (1998) and for two years thereafter, responding to the need for emergency reconstruction o f the road network. Since then, MTI’s expenditures have declined sharply, such that by 2005, MTI’s spending had fallen below the level o f 1996 in real terms; Table F.3. In general, annual budgetary allocations for MTI appear somewhat l o w for a country at Nicaragua’s stage o f economic recovery.
Table F.3. Evolution o f Transport Sector Expenditures; 1998-2006 1998 1999 2000 2001 2002 2003 2004 2005 2006b
in millions US Dollars Total Central Gov. Expend. 635.9 856.4 862.7 842.1 821.3 1000.1 1015.1 1117.3 1204.2
MTI Budget 70.2 124.6 107.4 91.3 65.8 70.7 85.2 87.4 101.5
Total Central Gov. Expend. 17.8% 22.9% 21.9% 20.5% 20.4% 24.1% 22.3% 22.3% 22.4% Sector Budget (Const. & Transp.) 4.7% 6.8% 5.4% 4.8% 3.6% 3.8% 4.2% 2.5% -
Sector Budget (Const. & Transp.) 169.6 253.9 213.1 196.3 146.8 159.2 191.0 124.5 -
As % of GDP
MTI Budget 2.0% 3.3% 2.7% 2.2% 1.6% 1.7% 1.9% 1.7% 1.9% As % of Total Central Government Expenditures.
Total Central Gov. Expend. 100% 100% 100% 100% 100% 100% 100% 100% 100% Sector Budget (Const. & Transp.) 27% 30% 25% 23% 18% 16% 19% 11% -
MTI Budget 11% 15% 12% 11% 8% 7% 8% 8% 8%
/Memo: exchange rate (C$/US$) 10.58 11.81 12.68 13.44 14.25 14.94 15.73 16.41 17.57 Source: Statistical Annex Tables. Note: All figures refer to actual expenditures, except for 2006, which refers to the budget.
F.8 At the post-Mitch peak in 1999, the MTI executed 15 percent o f the total central government budget, which was appropriate in view o f the massive reconstruction needs. However, this could not be maintained and even though the overall budget increased, MTI has been assigned a decreasing share since then, reaching a l o w o f 8 percent o f total budget in 2005. Details on the initial, revised and executed budgets fo l low in Table F.4. During 2002-2006, the MTI init ial budgets tended to be unrealistically small, given the emergency road restoration needs and hence the executed budget in general exceeded it by a significant margin. Still, the executed budgets were moderate and, except for 2001, were always less than 10 percent o f the total Central government executed budget. This i s quite an impressive achievement for the MTI to have managed such a major recovery program in this period with a relatively small share o f the budget. The decline in budget execution ratios in 2005 and 2006, however, are cause for concern.
Assessment of Allocative and Operational Efficiency
F.9 The overall road sector performance has been good in terms o f the allocation and use o f resources and i s improving continually. Investments are s t i l l set by the budget but users pay directly for an increasing share o f the maintenance o f the most trafficked roads via the road maintenance fund. The use o f least-cost construction techniques, such as adoquines, represent an efficient allocation o f resources and result in the provision o f higher than traditional service levels for rural traffic, as the alternative to gravel- surfaced roads. The balance between recurrent and capital expenditures reflect a focus o n reconstruction needs during the period 2001-2006, and was warranted at the time, but i s not expected to continue. The fact that road improvements are selected largely o n the basis o f their economic justification (using the Bank’s HDM model) provides hr ther comfort in that allocations are being made o n an efficient basis.
F.10 In terms o f operational efficiency, most transport services for roads, ports and airports are concessioned or owned and operated by the private sector. Anecdotally, the level o f operational efficiency varies highly. The most efficient i s probably the Managua airport which, fo l lowing i t s modernization program, now offers facilities and levels o f service that are better than i t s Central
204

Annex F
American neighbors and compare well with international airports elsewhere. Although domestic air travel has not been improved much, i t i s s t i l l quite adequate. The airports modernization has been financed largely by passenger user charges and does not have much public sector budget implications. There i s more o f a public sector expenditure implication in the port sector, but this again i s very small. The concessioned operations at Corinto and other ports are operating reasonably well.
Table F.4 Budgeted and Executed MTI Expenditures (in US$ millions)
Initial Budget Modified Budget Executed % Executed I Initial Item Current Capital Total Current Capital Total Current Capital Total Current Capital Total 2001
CG Budget 478.4 450.6 929 318.5 319.9 946.7 374.5 214.2 754.6 78% 48% 81% MTI 5.5 105 110.4 5.5 105 110.4 3.7 87.6 91.3 68% 64% 83% MT/ Share of t p U budget 17.90% 7.00% 40.90% 12.10% ._______________________________________-------------------------------------------------------------------------------------------,
2002 CG Budget 447.8 290.2 738 13.9 0 761.7 441.3 264.8 706.1 99% 91% 96% MTI 4.3 58.5 62.8 0 0 73.7 3.9 61.8 65.8 92% 106% 105%
F . l l For road transport, there i s a subsidy for urban passenger transport that i s not completely transparent and i s justified by the operators because the government supposedly sets bus fares too low. This subsidy needs to be examined carefully. Given the l o w income levels o f bus users, i t may be justified, but this needs to be demonstrated. Freight transport i s not subsidized, but operators need to be licensed by the MTI. Freight services are reasonably efficient and there are indications that operator revenues are better than in the past as modest fleet renovation activities seem to be taking place. The improvement o f the trunk road network has been a major boon to the efficiency o f freight transport operations.
F.12 In terms o f the supply o f road infrastructure, the use o f adoquines has also contributed to an increase in technical efficiency since it minimizes the consumption o f economic resources in i t s construction and maintenance. Road users also realize increased savings over the gravel surfaced alternative. In most l o w traffic volume situations, gravelling has long been the preferred option for surfacing when upgrading earth roads because i t i s less costly than asphalt. However, Nicaragua i s ahead o f many countries in addressing the paradox o f sustainably improving l o w traffic volume by using the non-traditional adoquinado option, which provides an al l weather service quality similar t o asphalt but
205

Annex F
has a lower l i fe cycle cost than gravel. T o understand why, one must examine how gravel roads are built, the highly variable level o f user service they provide and their highly demanding maintenance regimes.221
The Case for Adoquines
F.13 There are major concerns about the efficacy o f rural road gravelling/ re-gravelling, both f rom a financial and economic viewpoint as wel l as f rom a social and environmental viewpoints. The main concerns f i o m the financial and economic viewpoint can be summarized as follows:
Gravel i s depleted rapidly by heavy vehicle traffic. Gravel loss rates per annum are typically o n the order o f 30-50 mm, depending on such factors as traffic, vehicle type, climate and terrain. The top 30-50 mm wearing layer can be lost annually and hence, without frequent re-gravelling, the entire 100-12Omm o f gravel can be lost within 3-5 years. The cost o f periodic re-gravelling and routine maintenance o f gravel roads can be very high. Re- gravelling costs are typically in the range o f US$5000-30,000 per km per year depending on factors such as the thickness o f the gravel layer, gravel quality, haulage distance, haul conditions, intensity o f equipment technology used, location, increasing scarcity o f high quality gravel supplies and the resultant rising unit costs, plus budgetary, planning and organizational requirements. In addition routine maintenance costs related to gradindreshaping, patching and off-carriageway operations require a further U$2000 - 3000 per km per year. The required timely annual provision o f the financing, logistical and managerial arrangements for such maintenance programs are not usually met even in developed countries. Very often, spot improvement gravelling may be the optimum solution for unpaved road maintenance. However selective gravelling in practice i s diff icult to implement and resources are wasted. T h e attendant equipment intensive technology o f using graders for re-gravelling purposes i s not sustainable in a number o f countries where it would be preferable to employ alternative methods o f maintaining unpaved roads involving local communities to a greater extent and uti l izing local resources and management more extensively. Moreover, in many countries, the number o f graders required to maintain a large network o f gravel roads in reasonable condition i s simply not available. Technically also, even with such a high consumption o f resources, gravel roads usually have an International roughness index (IRI) considerably greater than 5 m/km and hence may not represent an optimal solution f i o m the user standpoint for vehicular traffic. Neither do they facilitate non- motorized modes such as bicycle traffic.
F.14 The main concerns f rom the social and environmental viewpoints are the following:
L
221. As part o f the construction and maintenance cycle, natural gravel materials are usually excavated f r o m borrow pits o r quarries placed on a caref i l ly engineered roadbed to a thickness o f typically 150-2OOmm to f o r m an a l l weather running surface. A gravel road surface can be appropriate and cost effective in many circumstances. These include situations where (i) sufficient quantities o f gravel are available that meet the required surfacing specifications. Also, gravel extraction should be managed in a way to minimize adverse environmental damages f rom the usually open pit min ing approach used; (ii) haul distances f i o m the quarries to the roadbed are relatively short; (iii) the terrain i s not steep and longitudinal road gradients are less than about 6 percent; (iv) rainfal l i s l o w or moderate and the seasons do not extend continually for many months. Some drymg time is needed between rains; (v) traffic i s relatively l o w or about less than 150 vpd; (vi) dust generation in the dry season i s not severe; (vii) financing and other resources wil l be available t imely and adequately for annual and periodic maintenance. However, increasingly these criteria are not being met and the concept o f managing efficiently more than 75 percent o f a national network as gravel roads is being questioned f rom both the provider and the user side.
206

A n n e x F
There i s a continuous demand associated with gravel roads ( and to large extent asphalt roads) for the use o f a non-renewable wasting layer, derived from a natural resource which i s being depleted seriously in many countries; Gravel roads require a continuous cycle o f mining or extracting rocks f rom mountainsides, rivers or pits, crushing, sorting and placing the resultant gravel in a roadbed for i t to be worn away by traffic, 8~ washed away by rain, or ground into very fine particles by passing traffic wh ich leads to the generation o f excessive dust, etc. Environmentally, this cycle i s becoming less and less desirable. Dust generation causes adverse impacts in terms o f being a health hazard for communities living adjacent to the road as wel l as causing pedestrian, animal and vehicle safety problems related to visibility and overtaking movements. In addition, dust emissions cause damage to crops and natural habitats. Gravel roads are too often slippery and dangerous in wet weather, especially in steep terrain, causing access problems for communities.
F.15 In sum, gravel in the long run may not be an appropriate or sustainable solution for many road locations in developing countries. T h i s has long been recognized, but the standard alternative option of the asphalting o f rural roads i s usually very diff icult to justify economically, given thek high investment costs and the l o w traffic volumes usually prevailing o n such roads. Still, the main alternative to gravel in many countries has been l o w cost asphalt surface dressings for roads with sufficient traffic volumes (>250vpd) and other characteristics but they remain di f f icul t to justify, even when ‘social appraisal’ approaches are considered. These l o w cost asphalt techniques s t i l l actually cost more than adoquines and mostly serve to keep the gravel in place and provide a smoother riding surface for a few years before becoming extensively potholed and requiring costly overlays. These overlays mean that good quality gravels will need to be extracted from the quarries or borrow pits once again.
F.16 A finished surface o f IRI <4 can then be maintained indefinitely v ia basic routine maintenance that can be carried out by local labor units (better organized as micro-enterprises). No more recourse i s needed to the gravel quarries for periodic maintenance as i s the case for gravel and to a lesser extent asphalt roads. The users can also expect to enjoy a continued high level o f service and reduction in vehicle operating costs. From al l considerations, adoquines are probably the most cost effective solution for many roads o f traffic levels f rom 40 -2000 vpd.222
In the case o f adoquines, the roadbed (also gravel) needs to be built only once in 30 years.
Sector Expenditure Framework
F. 17 Both the provision and maintenance o f infrastructure leave a l o t to be desired in Nicaragua. This was due to various factors in the recent past, especially inadequate maintenance funding levels, a weak construction industry and poor operations o f service companies. In recent years, IDA has maintained a high level dialogue with the Authorities on these issues, especially on the budgetary and other funding mechanisms for maintenance, the need to improve the institutional framework, and o n the advantages o f increased private sector participation in infrastructure construction, operation and maintenance to the extent feasible. The poorly maintained road network places the major investments o f the past 5 years at risk and prevents the development o f least-cost transport services, especially in rural areas. Full establishment o f the Road Maintenance Fund (FOMAV) and the use o f private contractors that are awarded contracts via a public bid process could be a major part o f an efficient solution to this problem.
F.18 The increased regional competitiveness that i s expected to arise f rom the Central America Free Trade Agreement (CAFTA) also heightens the urgency to address the road infrastructure deficit. A we l l developed and maintained road network i s essential to maximizing Nicaragua’s potential for dynamic, L
222. More infoxmation on the low traffic volume roads paradox in low income countries i s available f rom the report by the SSATP on the Roads Economic Decision Model (RED) Sept 2006 workshop.
207

Annex F
export led economic growth. T o improve i t s prospects for competing under CAFTA, Nicaragua must overcome the huge backlog o f maintenance and investment in road infrastructure. The allied agenda o f policy and institutional change in this sector will involve: (i) improving the quality o f rural roads and ensuring year-round rural accessibility. Such road improvements should be part o f a strategy aimed to strengthen rural-urban linkages and to foster commerce and agricultural development; (ii) designing mechanisms to protect infrastructure investments f rom bearing a disproportionate share o f the burden o f periodic fiscal adjustments and, conversely, to increase investments if fiscal space allows it; (iii) promoting a suitable regulatory framework for private sector participation in the construction, operation and maintenance o f transport infrastructure, and (iv) improving urban transportation systems.
F.19 The previous government had set certain targets in the Plan Nacional de Desarrollo (PND) 2005- 2009 for the road sector, the most important o f which calls for improving the quality o f 1200km o f the secondary and rural road network by adoquin stabilization. About 300 km o f this goal has been met, and a further 300km i s being financed under the Fourth IDA Roads project. However, i t seems that i t will be diff icult to achieve the 2009 goal unless a major redirection o f investment resources i s done by the government.
Conclusions and Recommendations
F.20 Sector performance has improved considerably as evidenced by the increased length o f the road network in good or fair condition and the f i rst true extensions in last 20 years in the lengths o f high quality roads as a result o f the adoquin program. A related benefit arises from the fact that these extensions were obtained at least cost both in terms o f investment and maintenance. Furthermore, they feature a higher domestic content than other technologies.
F.21 There has been a sharp reduction in MTI’s budget share in the post-hurricane M i t c h period. Government needs to take advantage o f the current window o f opportunity to make what are essentially once-in-30-years investments to extend the adoquin roads network, as rising prices for petroleum products and other raw materials will soon make other approaches even less attractive. A budget increase for MTI may be needed for this purpose. However, the fa l l in budget execution ratios during 2005 and 2006 trigger concerns about MTI’s absorption capacity. T h i s decline needs to be reversed before contemplating budget increases.
F.22 Emphasis needs to be placed on efficient planning, especially with regards to the application o f design standards that are appropriate for road traffic levels and normal rates o f growth. There has been a growing tendency to design roads to meet excessively high administrative standards (e.g. insisting that a l l collector roads must be 7 meters wide) rather than adhere to much less costly standards that would be appropriate to meet the requirements o f the prevailing traffic volumes and l ikely growth rates.
F.23 The key message, then, i s one o f continuity and expansion o f the policies and programs that have been carried out fairly wel l by the MTI during 2001-2006. In the context o f that strategy, the PER recommends that particular attention be devoted to the following measures:
Investments to improve and expand the paved road network to the levels o f other l o w income comparator countries. Given the success o f the trunk road rehabilitation program so far, the next order o f priority i s to improve the grid o f secondary and major rural roads (the distributor network) that link to the trunk roads and serve the productive zones. The scaling up o f existing adoquinado programs represents a cost-effective alternative to asphalt or gravel paving o f roads, especially for the secondary network.
Emphasizing maintenance. I t will be essential that the roads that have been rehabilitated are not lef t to deteriorate (as in the past) and once again allowed to become bottlenecks. A comprehensive program o f maintenance, including the guaranteeing o f funding arrangements v ia the FOMAV and the use o f
208

Annex F
least-cost public bid contractual approaches for works implementation represent an indispensable part o f the strategy to increase paved road coverage. Even then, i t will be many years before Nicaragua can close the gap in paved roads vis-a-vis other countries in the region;
0 Clarifying and strene;theninp; sub-sector institutional arrangements: Although the IDA project supported institutional restructuring has produced significant positive results, MTI i s sti l l affected by overall weaknesses in planning and programming. There i s s t i l l a need to develop M T I ’ s basic capacity to carry out road condition inventories, to fully install the Pavement Management system, to seek least cost solutions to technical and engineering problems associated with road and bridge maintenance, as wel l as to help foster the development o f the local consulting and contracting industries. Aside from MTI, the FOMAV needs appropriate technical assistance, particularly in contracting and procurement procedures so that it can develop the capacity eventually to manage the maintenance o f the entire core road network. For overall sustainability and efficient road management, further analytical work i s needed to identify the appropriate roles and responsibilities o f the key players (both at central and local level, and including INIFOM, IDR and the municipalities) and to promote synergies while avoiding a duplication o f efforts
Imuroving urban mobil itv by restructuring public transportation services and developing improved mass transit corridor management in Managua. T h i s could be designed as part o f an integrated bus routes development and improved traffic demand management program.
0
209

Annex F
210

Annex F
Annex G
Review of Public Spending on Water and Sanitation
Sector Organization and Governance
G. 1 The water and sanitation sector comprises the following institutions: the national water utility (ENACAL), the regulator (INAA), the Social Investment Funds (FISE), the rural water committees (CAPS) and the policy body CONAPAS which itself i s a commission with a small executive secretariat including the Presidential Secretariat (SETEC), the Health Ministry (MINSA), the Environment Ministry (MARENA), the Institute for Territorial Studies (INETER), ENACAL, INAA and FISE. ENACAL serves about 60 percent o f a l l water users, the CAPS about 30 percent, and the remaining 10 percent i s served by the departmental water companies in Matagalpa and Jinotega, as we l l as a few small municipalities.
G.2 CONAPAS i s responsible for the formulation o f sector policies. Under the Bolafios Government, CONAPAS approved a sector strategy in October 2005 that i s oriented towards reaching the sector M D G s and i s in l ine with the National Development Plan. The sector strategy identifies f ive areas o f attention: improving the legal and institutional framework; expanding the access to water and to sanitation; implementing efficient, participative and decentralized operational models; financial sustainability; and improving environmental conditions. The elaboration o f the sector strategy also gave rise to the sector round table as a coordination forum between Government, donors and NGOs. In October 2006 Government and donors agreed o n a road map to complete a SWAP, and in December 2006 signed a Code o f Conduct on Alignment and Harmonization. In order to implement the sector strategy, pending issues include the elaboration o f strategic and annual operation plans o f the key sector institutions, a sector medium-term expenditure framework as we l l as a monitoring system. This, in turn, may al low agreement on a Memorandum o f Understanding with interested donors o n a common financing mechanism.
G.3 The Ortega administration i s s t i l l in the process o f defining i t s sector strategy and deciding o n the future o f CONAPAS. Nevertheless, i t has clearly voiced i t s opposition to privatization measures in the sector and indicated that, in the framework o f the recently approved water law, a new “National Water Authority” may assume political leadership in the sector.
G.4 ENACAL operates water supply and sanitation systems in urban areas, defined as localities with more than 500 households. ENACAL’s performance has been severely hampered by both inefficiency and politicization. An DB-f inanced service contract for E N A C A L started in early 2006 after several years o f intense discussions. The business consultant presented a restructuring proposal in December 2006 and i s supposed to follow-up on i t s implementation for another two years, based o n a fee structure providing incentives to effectively improve operational efficiency in the commercial, administrative and technical areas. The new administration has questioned the service contract claiming that i t i s a “veiled privatization”, and recently decided to cancel the modernization program. Apart f rom ENACAL, the departmental water companies in Matagalpa and Jinotega are the only operators in urban areas. The experience in terms o f decentralization and private sector participation (a five year management contract) has triggered promising results in terms o f service quality, especially for the poor. The new administration views this model with scepticism, and the E N A C A L President recently dissolved the Boards (Junta Directiva) o f both water companies and subordinated them to the Board o f ENACAL.
G.5 INAA i s responsible for the regulation o f service quality and tar i f f adjustments. Ad hoc polit ical interference has up to now prevented INAA (just as the regulators for the energy and telecom sectors) f rom exercising these functions. It i s not clear how the constitutional reforms that among other things
21 1

Annex F
include the creation o f a supra-sectoral regulator SISEP under parliamentary control and that were suspended until January 2008 may affect this limitation. The new Government has stated that it will tackle ENACAL’s inefficiencies and try to improve service quality f i rs t before taking any decisions on tar i f f adjustments.
G.6 FISE, inter alia, i s in charge o f promoting access to water supply and sanitation in rural areas. The operation o f these systems i s delegated to CAPS. Whi le the municipal l aw - in contradiction to sector laws - does assign competences for the water sector to municipalities, their involvement has been limited in the past, apart f rom some support t o the CAPS.
Sector Expenditure Structure and Trends
G.7 Investments in the sector during the 2002-6 period totaled U S D 178 millions, or an average o f U S $ 35 mill ions per year. This i s equivalent to 0.75 percent o f GDP, which i s about four times the average in the L A C region during 1991-2000. Of this total, 37 percent has been assigned to urban water supply projects, 3 1 percent to urban sanitation projects and 32 percent to rural water and sanitation projects (the latter includes E N A C A L and FISE). T o allow for a correct interpretation o f these numbers, especially on urban sanitation, one has to take into account that the Sanitation o f Lake Managua Program that i s being implemented since 2004 alone i s worth about US$65 millions.
G.8 Currently, decisions on expenditure priorities, particularly investments, are basically driven by emergency and political considerations, very rudimentary planning by E N A C A L and FISE, and donor offers o f grants and concessionary loan financing. Donor contributions cover almost a l l investment financing. The Government’s and ENACAL’s counterpart financing i s limited, reflecting the latter’s very modest cost recovery capacity. In contrast, the sector strategy developed earlier by CONAPAS provides the basis for a more
Table G.l Investments in the Water and Sanitation Sector
Year Category Cost (1000 USD) Urban Water 10.970,2
2002 Urban Sewage 10.756,s Rural W&S 8.722,9
Total 30.449,5 Urban Water 12.684,s
Urban Sewage 2.868,O 2003 Rural W&S 12.313,s
Total 27.866,l Urban Water 14.736,6
Urban Sewage 2004 Rural W&S
9.127,2 16.347,6
Total 40.21 1,4 Urban Water 10.695,4
Urban Sewage 12.683,5 200s Rural W&S 12.494,8
Total 35.873,6 Urban Water 15.881,3
Urban Sewage 20.273,O 2006 Rural W&S 7.559,3
Total 43.713,7 Urban Water 64.968,O
2002-06 Urban Sewage 55.708,2 Rural W&S 57.438,l
Total 178.114,3
systematic planning process. It estimates the investments necessary to reach sector MDGs at US$ 592 mill ions during the 2005-15 period, o f which US$286 mill ions i s needed in the f i rs t f ive years.
G.9 E N A C A L i s a loss-making public enterprise whose jnanc ia l situation has deteriorated further in the last three years to the verge o f illiquidity. Structural factors include a high percentage (56 percent) o f unaccounted-for water (half o f which i s supposedly due to illegal connections) and l o w labor productivity (7.6 employees per 1000 water connections). The collection rate (88 percent) and the micro metering (some 40 percent) also clearly lag behind regional standards. Combined with the dramatic increase in the energy bill (which makes up to 40 percent o f operating costs) and given the tar i f f freeze (see below), the cost coverage ratio has fluctuated between 0.69 and 0.86. As a consequence, the operative cash f low before financing has been negative in the last three years.
212

Annex F
provisions and adjustments Depreciacion adjustments for last years other provisions Res u I t I Loss)
Table G.2 Summary Balance Sheet, Income Statement, and Cash Flow
-1 5.045 14.871 -2.939 -7.974 -9.162 -7.548 14.298 -25.421 -907 -3.299 -1.174 -2.344
-1 2.020 -20.886 -13.738
Category I 2003) 20041 2005 I I
IExchange rate: C$ to USD I 15,55151 16,3291 I 17,14551
213

Annex F
Institutions
Rest of the Country Subsidised Customers
Residential Customers I
Residential Customers II
0 a 50 856 6,76 I ,69 0,475 0,375 0,094 + 8,56 14,49 4,27 0,475 0,805 0,237
0 a 20 1,06 2,13 0,64 0,059 0,118 0,036 + 1,06 2,83 0,86 0,059 0,157 0,048
0 a 20 4,24 4,85 1,45 0,236 0,269 0,081 21 a50 4.24 6,20 1,78 0,236 0,344 0,099
+ 4,24 13,04 337 0,236 0,724 0,198 0 a 50 9,46 7,72 2.38 0,525 0,429 0,132
+ 9,46 14.68 4,OO 0,525 0,815 0,222
Exchange rate C$ to US$ on 12/31/06 16.0028
214

Annex F
G.11 below:
The sector features a complex mix o f badly targeted indirect and hidden subsidies described
The Government transfers al l donor funds, both loans and grants, to ENACAL by way o f grants. Whi le this i s a common practice in other countries, i t constitutes a substantial subsidy for the company and indirectly to al l water users irrespective o f their living standards. By the same token, the Government since 2005 transfers subsidies to E N A C A L to cover operational losses without any specific obligations regarding service quality or focalization o f investments. The b lock tar i f f system includes significant cross subsidies between user and consumption categories that in principle do provide for a redistribution f rom higher to lower income segments but are s t i l l poorly targeted due to a lack o f clear classification o f users to these categories and due to the high volume o f the f i rs t consumption block @Om3 instead o f 10m3 per month necessary to cover basic water needs). Fixed rate tariffs are applied to a high proportion o f water users because o f l o w micro metering rates, mostly without regard to poverty considerations. Retirees are offered a 30 percent discount o n their respective tariffs. Being retirees implies that the users had worked in the formal economy and, therefore, are unlikely to belong to the poorest income quintiles. So called poor districts (“asentamientos”) do not pay at a l l for water services. Again, the classification o f users i s too rough to allow for a pro-poor targeting.
G.12 There are n o exact data available to calculate the amount o f these subsidies. Overall, however, they tend to benefit the affluent consumers, who generally consume more water than the poor and who are more l ikely to be connected to sewage systems. T h i s comes at the expense o f those not connected, particularly in rural areas, who are predominantly poor and who have been penalized by l o w levels o f investment.
Sector Outcomes
G. 13 According to the 2005 census, coverage ratios for urban and rural water facilities are 94.2 percent (of which 87.5 percent are connected to piped systems) and 64.1 percent, and those for urban und rural sanitation are 95.7 percent (of which 31.1 percent are connected to sewage systems) and 69.5 percent, respectively. These data indicate an increase o f coverage for sanitation, but a stagnation o f coverage for water in the last 10 years.
G. 14 More importantly with regard to sustainability, these quantitative indicators merely concentrate on access to infrastructure, but do not reflect effective water and sanitation use. Therefore reaching the MDGs linked to the sector, i.e. effective access to water and to sanitation, as well as for reducing infant, under-five mortality and malnutrition, a l l o f which are partly caused by water related diseases, remains a major challenge. Effective use i s primarily affected by the following factors:
ENACAL suffers f rom a high degree o f inefficiency in terms o f water losses, lack o f domestic metering, l o w collection rates as wel l as labor and energy cost (see above). These performance indicators have basically remained unchanged in the last decade. As a consequence ENACAL continues to be totally dependant on donor financing for i t s investments. The lack o f financial resources has produced significant water rationing because o f the absence or delay o f reparation and rehabilitation works and also due to programmed rationing in order to save
215

Annex F
energy costs. Overall service quality i s l o w and has sparked frequent user protests in the last two years. Poor water quality i s a serious issue, especially in rural areas.
Table G.4 Water and Sanitation coverage National Urban Rural
1995 2005 1995 2005 1995 2005 Category
Water 81.4 81.8 94.3 94.2 64.9 64.1 Piped Systems 55.5 62.7 83.8 87.5 18.4 27.4 Sanitation 77.6 84.8 94.3 95.7 55.6 69.5 Sewage Systems 17.2 19.4 29.9 31.1 0.6 0.0
Table G.5 MDGs Related to the Water Sector PRSP Goals (MDGs) Base Actual Forecast PRSP 2015 Target for
2001 2015 Target 2015 will be Achieved?
Infant Mortality (per 1,000 live 58 31 27 20 Possible births) (1993) Under-Five Mortality (per 1,000 live 72 40 35 24 Possible births) (1993) Chronic Malnutrition (“A) 19.7 17.8 12.3 7 Unlikely
(1998) Access to Water (%) ... 70 85 100 Unlikely Access to Sanitation (YO) ... 85 88 95 Possible
G. 15 The described outcomes have been disappointing when viewed against the relatively high level o f sector spending. (This applies even when we exclude the Lake Managua Program, which has absorbed a significant amount o f investment, but has not yet been completed.) Donor-financed infrastructure investments have mainly concentrated o n rehabilitation o f existing systems that fa i l prematurely due to inappropriate management and have merely kept up with population growth to maintain coverage ratios. Investments, however, did not lead to improvements in service provision and quality. The reasons for this l o w spending efficiency predominantly relate to the polit ical and institutional shortcomings in the sector. Underlying factors are the discretionary polit ical interference in regulatory and operational mattes, l imi ted institutional capacities in the case o f ENACAL, CONAPAS and INAA, and an inconsistent legal framework.
Main Sector Issues and Policy Recommendations
G.16 Planning: The previous sector strategy developed by CONAPAS provided a sound basis for future sector planning and the allocation o f resources. Whi le the sector pol icy vision o f the new administration may differ f rom the one o f i t s predecessor, there appears to be room for forging a consensus on the key sector outcomes that are desired and on adequate policies for reaching them. Designating a policy body (such as CONAPAS) with sufficient political weight and institutional capacity wi l l be a key decision. As long as the sector strategy i s operational and backed by the necessary polit ical leadership, a SWAP approach would be the mode o f cooperation preferred by donors.
G.17 Regulation: I t i s important that INAA be given full autonomy in tar i f f setting. In terms o f polit ical timing, the Government/ENACAL may have to restore user’s confidence f i rs t by improving efficiency
216

Annex F
and service before adjusting tariffs - although there i s probably n o perfect timing for tar i f f increases. Furthermore, I N A A ’ s power o f supervision needs to be strengthened by systematically linking any subsidies from the general budget to improvements in performance indicators, to be defined in the concession contract between E N A C A L and INAA. Moreover, the current subsidy system needs to be reviewed and revised in order to create a more effective pro-poor targeting o f direct and indirect subsidies.
G.18 Urban areas: Improving service quality and efficiency o f E N A C A L i s one o f the most urgent priorities in the sector. It i s recommended that ENACAL take substantial measures in the commercial area (reduction o f non-technical losses, increase o f metering and collection) and in terms o f reduction o f personal and energy cost. The presented deconcentration alternatives should be considered, balancing economies o f scale and proximity to clients. The Matagalpa-Jinotega experience should be carefully evaluated.
G.19 Rural areas: In the past, FISE focused primarily on small social infrastructure investments, and less on sustainable operation o f water systems. Subsequently, however, FISE has been strongly involved in local development cooperating with municipalities and communities, and developed considerable experience in this area. That i s why the responsibility for the rural sub-sector should stay with FISE (rather than be reverted to ENACAL). Municipalities should be given a more determinate role in supporting CAPs in their communities. Alternatively, a group o f CAPs could consider to jo int ly contract micro-businesses to share the cost o f qualified administrative and technical support. Additionally CAPs need to be given a legal status to effectively manage the operation and maintenance o f their systems.
G.20 Integrated approach to sanitation: Hygienic behavior i s critical t o achieving the envisaged health outcomes. Given the past focus o n water and sanitation infrastructure, a more integrated approach to sanitation, particularly in rural areas, i s required to successfully tackle the pattern o f existing water related diseases.
217

h e x F
218

Annex H
Annex H
A Note on the Energy Sector
H.l In contrast to the Transport and WaterEanitation Sectors, the Energy sector has a modest direct fiscal impact relative to the overall economic and social impact o f this sector. Since the power sector i s largely in private hands, attention focuses mainly on the development o f a sound sector pol icy and regulatory framework, rather than on undertaking public investments. This Section highlights the main sector developments since 2001, and summarizes the main policy recommendations that emerge f rom the Wor ld Bank’s recently prepared Nicaragua Energy Sector Policy Note.
Summary of Findings from Previous Reviews
H.2 Electricity generation had become a significant development bottleneck in Nicaragua by the mid- 199Os, resulting in regular blackouts and prompting efforts to transform the sector f rom a public monopoly to a competitive, market oriented system with significant private participation. Energy distribution fimctions were mostly privatized, transmission activities remained in public hands and generation activities were split between the public and private sectors. The sector reforms in i t ia l ly succeeded in improving sector efficiency levels and in mobilizing private investments, and by 2001, nominal electricity production capacity had grown to over 600MW, while maximum demand had grown more gradually t o 400MW. As noted in the Wor ld Bank’s 2004 Nicaragua Development Policy Review (DPR), electricity production capacity was not expected to become a constraint in the medium term.
H.3 The 2004 Nicaragua DPR also identified several important shortcomings in the sector:
Nicaragua’s electricity consumption i s the lowest in the region - even lower than what would be predicted by i t s level o f development.
Nicaragua relies predominantly o n thermal generation: 82 percent o f the country’s electricity production i s based on o i l products. T h i s i s the highest ratio in the region. (A major bottleneck to the diversification o f energy sources was the legal prohibition against private investment in hydro-electric power plants with greater than 5MW capacity.)
Less than ha l f o f Nicaragua’s population had access to electricity, giving it the lowest coverage ratio in the region
Distribution-related losses for the entire system were very high, amounting to 30 percent o f net electricity production
The cost o f electricity was among the highest in Central America, especially for commercial and industrial consumers, while residential users benefited f rom cross-subsidies
The combination o f a weak regulatory framework and deficient pr ic ing policies, l imi ted the attractiveness o f Nicaragua’s energy market for potential private investors and was considered one o f the strongest barriers to the expansion o f electricity coverage.
H.4 To overcome these shortcomings, the DPR recommended, (i) increasing access to electricity services, especially in rural areas, by talung advantage o f off-gnd technologies, (ii) developing the regional electricity market to take advantage o f economies o f scale, (ii) strengthening the regulatory framework, and (iv) encouraging greater private sector participation by removing prohibitions against private investment in hydroelectric plants, correcting the asymmetric fiscal treatment o f different technologies, and fostering a more competitive market environment.
219

Annex H
Evolution of Key Sector Indicators since 2001
Suuulv and Demand
H.5 Electricity supply did not increase as expected, so that the energy sector i s once again threatening to become a major development bottleneck in Nicaragua. Although the installed nominal generation capacity increased from 638MW in 2001 to 751MW in 2006, effective capacity (i.e., power that i s actually available) only increased from 536MW to 589MW. The difference between nominal and effective installed capacity appears to have increased since 2002, and i s due mainly to the operation o f older thermal power plants that require overhaul or replacement, and the exhaustion o f the existing geothermal reservoir.
Table H.l Nicaragua: Installed Power Generation Capacity (MW) 2001 2002 2003 2004 2005 2006
Total Nominal Installed Capacity 638.1 655.2 679.7 742.2 757.2 751.2 Total Effective Installed Capacity 535.9 574.3 595.8 607.7 627.0 588.6 Difference 102.2 80.9 83.9 134.5 130.2 162.6 Source: World Bank (2007), “Nicaragua: Energy Sector Policy Note”
H.6 Whi le effective capacity increased by less than 2 percent per annum f rom 2001 to 2006, electricity demand has increased at roughly 4 percent. By mid-2006, the reserve margin was only 30 MW (or 6 percent o f total demand), which i s inadequate and resulted in the recurrence o f system-wide blackouts and power rationing. The situation improved in 2007 with the installation o f thermal plants sponsored by the Venezuelan government, which i s projected to add up to 60MW in new (albeit expensive) generation capacity.
Access and Electrification
H.7 According to data from the United Nations Economic Commission for Lat in America and the Caribbean (ECLAC), electrification in Nicaragua was around 47 percent in 2001 and 54 percent in 2005, which shows impressive progress during the last five years. This i s due in good measure to the organization o f Fondo de Desarrollo de la Industria Eldctrica Nacional (FODIEN) and i t s electrification programs, which have benefited f rom the support o f donors and multilateral organizations. Nevertheless, Nicaragua’s electrification rate remains the lowest among the Central American countries; Figure H. 1.
Figure H.l: Electrification Rates in Central America, 2005
100
8 90 1 8o
70
60
50 Costa Rica Panaml Guatemala El Salvador Honduras Nicaragua
Source: ECLAC.
220

Annex H
H.8 The data in Figure 6.1 may be under-estimating Nicaragua’s electrification rate: according to the 2005 Census, around 68 percent o f a l l dwellings have electricity service. Unl ike the E C L A C figures, which are based on data f rom the utilities, the Census figures ignore whether residential connections are legal or not. Even with the higher coverage figures f rom the Census, however, Nicaragua s t i l l exhibits the lowest electrification rate in the region, behind Honduras. The Census figures also show a great dispersion in access to electricity, with the electrification rate averaging around 92 percent in urban areas, but only 36 percent in rural areas.
Distribution Losses
H.9 Distribution losses have continued to be very high, in spite o f privatization. Energy losses currently amount to around 28 percent o f total energy injected into the distribution system; barely lower than the 30 percent losses estimated in 2001. These losses should be n o more than 14 percent under moderately efficient conditions. Of the 28 percent in total electricity losses, about ha l f corresponds to “technical losses” which are within the control o f the distribution company, though they may require additional investments to be undertaken. (Systems similar to Nicaragua’s operating with an average level o f efficiency should exhibit technical losses below 10 percent.) The other ha l f o f total electricity losses corresponds to “commercial losses”; un-metered consumption and electricity theft. I t i s estimated that these commercial losses are due in equal part to illegal connections in poor neighborhoods (and the distribution company’s inabil ity to enforce payments), and to faulty meters and electricity theft by large companies. These losses should be reduced to practically zero, but require, both, more concerted cost recovery efforts by the distribution company and greater cooperation by the Authorities.
Pricing Policies
H.10 The basic tar i f f scheme in Nicaragua i s similar to others in the region, with final consumer prices consisting o f various elements, including an allowed “pass-through” component to account for changing generation costs and a value-added component to finance investments in distribution. However, the tar i f f structure i s overly complex, involving an excess o f categories and different charges, which complicates the commercial process and confuses customers. There i s also a significant cross-subsidization in the structure o f electricity tariffs, with industrial, pumping and irrigation prices wel l below the average tariff, while commercial prices are wel l above. Residential prices are near the average electricity tar i f f in Nicaragua, which also happens to be close to the average in the region - below those observed in El Salvador, Guatemala and Panama, but above those in Costa Rica and Honduras. The price o f industrial energy in Nicaragua, however, i s among the highest in the region, which means that other countries have been cross-subsidizing this market segment even more than Nicaragua.
Regulatory and Policy Framework
H.11 A cornerstone o f the sector reforms introduced in the late 1990s was the implementation o f phased tar i f f changes to ensure cost-reflecting tariffs and focused subsidies. These measures were never systematically implemented by the regulator, however, in part because o f the unpopular consequences that the tar i f f increases mandated by sharply higher oil-based generation costs would have among consumers. Another reason has been the increased polit ical confrontation between the Executive and Legislative branches o f government that developed since 2002. Failure by the regulator t o apply the cost- reflective tar i f f rule meant that tariffs lagged and the distribution company’s financial performance suffered, which in turn, had adverse repercussions on the finances o f the generators. The absence o f predictable regulation and stable tar i f f policies, in turn, created uncertainties that discouraged private investors, and the hoped-for private investment in new generation never took place.
22 1

Annex H
H.12 The absence o f predictable regulatory and policy framework arguably represents the main factor responsible for the energy crisis that has been building since 2002. N o t surprisingly, energy pol icy figures prominently in the Government’s agenda. Among the first steps taken by the Ortega Administration upon taking office has been the creation o f a new Ministry o f Energy and Mines (MEM) in January 2007, replacing the previously l o w profi le National Energy Commission (CNE) and taking over some o f the functions f rom the energy regulator, INE. Hopefully, this institutional reform can help to reduce the hc t i ons that previously existed between CNE and INE, and to lift the ensuing pol icy stalemate.
The Fiscal Impact of the Energy Sector’s Performance
H.13 Despite recent performance shortcomings, the power sector has not been a major burden o n the government’s finances. The main source o f financial losses in the energy sector has been the gap between the tar i f f level mandated by the sector pricing rules and the actual price allowed by the regulator. Until August 2006, the actual price had been consistently below the mandated price, resulting in an estimated loss o f US$1.2 mi l l ion per month during the year ending in September 2006. (The accumulated losses from October 2003 and September 2005 amounted to an estimated US$36 million.). Whi le it would appear that this financial loss was largely privatized - effectively borne by the private distribution company - the eventual payment o f the accumulated losses by the public sector, suggests that the burden eventually does fall o n the public sector. Starting in September 2006, the actual price was aligned with the mandated tar i f f level, so that there should n o longer be any the financial losses arising f rom this source.
H.14 With the elimination o f the tar i f f gap, the direct fiscal costs associated with the power sector currently are l imited to three sources: (i) losses incurred by the government-owned electric utility, ENEL, from supplying small and isolated loads, (ii) losses incurred by the public transmission company, ENATREL, for failing to charge transmission fees that cover al l transmission costs, including capital depreciation, and (iii) the foregone revenues from waiving the value-added tax for consumers below 150kwh/month, which represents the main direct subsidy granted in the sector. These fiscal costs add up to an estimated US$15 mi l l ion per year, o f which the largest component i s the direct subsidy; Table H.2.
Table H.2: Direct Fiscal Costs from the Energy Sector ENATREL Losses US$ 3.5 mi l l ion (estimated for 2007) ENEL losses attributable to isolated systems US$ 2.5 mi l l ion (estimated for 2007) Value-Added Tax waiver (cons. < 150 kwh) Total US$ 14.9 million Source: World Bank (2007), “Nicaragua: Energy Sector Policy Note”
US$ 8.9 mi l l ion (actual in 2006) ’
D. Concluding Summary and Recommendations
H.15 Except for the commendable progress made in expanding access to electricity since 2001, the energy sector reforms introduced in the latter ha l f o f the 1990s have not had their expected impact. In particular, there has been litt le progress made in diversifying power generation away from o i l and distribution losses continue to be extremely high. Most importantly, there has been litt le new investment in electricity generation, so that the reserve margin has fallen to very l o w levels, once again resulting in system-wide blackouts and power rationing. While the recent installation o f additional generation capacity with Venezuelan assistance offers a short-run remedy to this problem, additional actions are needed to ensure a long-run solution to the sector’s shortcomings.
H.16 The Energy Sector Policy Note prepared by the Wor ld Bank focuses attention on the fol lowing four measures to improve sector performance:
222
Annex H
0 Defusing the confrontation with the private distribution company and seelung a common ground for improving service (based on the quantification o f the losses incurred in the sector, quantification o f the debts owed by the different actors in the sector, and an operational audit o f the distribution company), with the ultimate aim o f re-establishing investor confidence and encouragmg sector investments.
Simplifying the electricity pricing structure (and abiding by it), whi le reviewing the existing subsidization scheme, which represents the largest single fiscal cost emerging f rom the sector, but may not be reaching the poorest households.
Extending electricity service by strengthening the rural electrification fund, FODIEN.
Update existing studies for hydro-electric and geothermal projects to feed into a long-term sector expansion plan, giving priority to developing new projects within a regional context.
0
0
223

Annex H
224

Annex I
Annex I
Review of Public Spending on Agriculture and Rural Development
Key Findings from Previous Sector Reviews
1.1 The main finding o f the 2001 Public Expenditure Review with respect t o the Agncultural and Rural Sector ( A R S ) was to identify the absence o f a clearly articulated rural sector strategy that outlined the Government’s priorities for the sector and established indicators to monitor progress towards them. The absence o f such a strategy was found to contribute to the wide fluctuations observed in sector public spending across years. Also reflecting the lack o f strategic guidance was that many rural programs under the direction o f MAGFOR either (i) were poorly targeted, (ii) lacked data to conf i rm the effectiveness o f targeting where it existed, or (iii) were beyond the scope and mandate o f MAGFOR, whi le programs that provided compensatory assistance in response to emergencies (e.g., Hurricane Mitch) did not define an exit strategy through which beneficiaries would eventually “graduate” f rom such assistance. Moreover, some public programs appeared not to provide a public service at a l l and, as such, had n o reason for existing.
1.2 A related finding o f the 2001 PER was that the project selection process and donor coordination were very deficient. Relative to i t s population, Nicaragua ranks among the countries with the highest donors’ contributions for public spending in the rural sector. Yet, the lack o f focus, variability over t ime and space, and ever-changing agendas strongly affected the effectiveness o f these investments during the 1990s and early 2000s. T o address these issues, a two-pronged approach was recommended: (i) that the role o f the Technical Investment Committee (consistent with Decree 61 o f 2001) be strengthened to ensure that projects financed through external sources demonstrate their compatibility with expressed Government priorities; and (ii) that eligibility requirements be explicit in order for public sector projects to access external finance.223 A separate Wor ld Bank Agriculture Sector Report (2002) also concluded that, in order to improve the effectiveness o f public spending in agnculture, government needed to prioritize the strategic coordination and effective use o f donor resources.
1.3 Other key sector recommendations included the need to strengthen property rights and public policies in the A R S . An intensification o f rural titling was recommended, coupled with the modernization o f the property registry. Various fiscal incentives were also flagged for review, namely: (i) agricultural input and machinery imports, (ii) export distortions and (iii) Government intervention in factor markets (e.g., financial and marketing services).
B. Agricultural Performance, 2001-2006
1.4 The Agnculture and Forestry sector accounts for about 18 percent o f GDP and 38 percent of total employment, and generates some 65 percent o f total exports. Agriculture occupies a total area o f almost one mi l l ion hectares, o f which 80 percent i s dedicated to crops for internal consumption, with the remaining 20 percent going for traditional export crops (e.g., coffee, bananas). F rom 2000 to 2005, agricultural GDP grew at an annual rate o f 8 percent, almost double that o f total GDP.
L
223. In this context, the PER also argued in favor o f narrowing the definit ion o f poverty-reducing expenditures in the Nicaragua PRSP. In 2001, some 80 percent o f the capital budget for the ARS was registered as poverty- reducing, yet the linkages between such spending and poverty reduction were weak in many cases and non-existent in others. The Government was encouraged to priorit ize those programs with proven track records in raising rural workers’ capacity to increase incomes, as well as those programs which indirectly reduced rural poverty (e.g., technology transfer, productive infrastructure investments).
225

Annex I
1.5 Of the total population o f some 5.2 mill ion, 45 percent live in rural areas. In Nicaragua, both poverty and rural are intertwined: 64 percent o f the rural population i s poor (1.5 mi l l ion people, Wor ld Bank 2003), and 40 percent o f these l ive in extreme poverty. For these families, agriculture provides about two-thirds o f their income.
1.6 Since 2001, yields for the major commodities have been fairly constant and, in some cases, have actually declined; Table D.l. While total production has trended upward over the period, this increase i s almost exclusively a result o f an extension o f the agricultural fkontier, with litt le evidence o f an intensification having occurred. Achieving increased yields - a desirable outcome in order to enhance competitiveness o f the sector - i s a function o f both the application o f technological packages (e.g., improved seeds, fertilizers, etc.) and the know-how to effectively do so. The data indicate that Nicaragua may be lagging o n both fronts. In addition, when compared to other Lat in American countries, yields for Nicaraguan commodities are consistently below the regional mean yields; Table D.2. Conversely, the data indicate that Nicaragua i s the leader in banana yields, achieving almost twice the regional mean yield.
Table D.l Indicators for Key Export and Domestic Crops, Nicaragua 2001-2006 Crop 2001-2 2003-4 2005-6
Area Production Yield Area Production Yield Area Production Yield Export Coffee 156.1 1,469.6 9.4 165.2 1,820.0 11.0 182.0 2,100.0 11.5 Sesame Seed 11.8 92.0 7.8 11.8 118.0 10.0 16.5 129.3 7.8 Sugar Cane 58.2 3,459.1 59.4 62.8 4,510.6 71.8 66.5 4,198.2 63.1 Banana 2.7 3,349.1 1,240.4 1.4 3,089.6 2,206.9 1.6 2,614.6 1,634.1 Tobacco 1.9 40.3 21.2 2.2 49.9 22.7 2.7 65.9 24.4 Peanut 30.8 1.774.2 57.6 33.0 2.065.0 62.6 44.1 2.672.3 60.6 Domestic Rice (Gold) 120.6 3,520.7 29.2 133.3 3,826.8 28.7 137.2 4,528.5 33.0 Rice (Secano) 78.5 1,587.1 20.2 85.0 1,782.7 21.0 82.0 2,016.8 24.6
Beans 330.1 3,890.3 11.8 414.6 5,067.4 12.2 303.8 4,632.3 15.2 Corn 454.8 9,237.0 20.3 564.3 12,949.2 22.9 556.0 12,069.9 21.7 Sorghum 64.2 1,955.4 30.5 80.6 2,549.3 31.6 62.3 1,800.4 28.9 Soybean 3.0 91.5 30.5 5.5 160.0 29.1 3.8 123.7 32.6 Note: Area in ‘000 manzanas; Production in ‘000 quintales; 2005-6 figures estimated through 1013 1/2006 Source: MAGFOR Dept. o f Statistics
Rice (Irrigated) 42.1 1,933.6 45.9 48.3 2,044.1 42.3 55.2 2,511.7 45.5
C. Overview of Public Expenditures in the Agriculture and Rural Sector
1.7 The agricultural and rural public sector (SPAR) comprises four agencies: (i) the Ministry o f Agriculture, Livestock and Forestry (MAGFOR), (ii) the National Institute for Agncultural Technology (INTA), (iii) the National Forestry Institute (INAFOR); and (iv) the semi-autonomous Rural Development Institute (IDR). Additionally, the Ministry o f the Environment and Natural Resources (MARENA) has responsibility for environmental oversight and regulation, natural resource management and protected areas.224 L a w 2901, promulgated in 1998, defines the roles and responsibilities o f the agncultural public sector institutions: MAGFOR i s the lead agency, formulating agricultural, rural and forestry policies and strategies. INTA generates and transfers agncultural technology. INAFOR manages the forestry sector and maintains the National Forest Registry and Inventory. Both INTA and INAFOR are under the overall direction o f MAGFOR. IDR executes strategies, programs and projects in
L
224. MARENA i s not included in the SPAR budget.
226

Annex I
sustainable rural development with an emphasis on productive rural investments and answers directly to the Executive under the policy guidance o f MAGFOR.
Table D.2 Yield comparisons, selected countries and commodities, 2005 (in '000 kg/ha) Country Tobacco Bananas Coffee Corn Rice Sesame Sorghum Soybean Sugar
Seed Cane Argentina 2.48 21.18 - 7.36 6.34 5.19 2.73 63.28 Bolivia 0.92 10.29 0.98 2.42 2.54 0.63 3.07 1.80 47.20 Brazi l 1.78 13.56 0.94 3.04 3.34 0.78 2.02 2.32 72.85 Chile 3.19 - 11.23 4.67 Colombia 1.99 27.23 1.24 2.81 5.32 3.70 2.00 93.60 Costa Rica 1.98 53.95 1.11 2.08 3.97 0.60 73.05 Ecuador 1.92 27.67 0.42 2.06 3.90 0.87 1.49 1.96 72.76 El 1.83 10.83 0.55 2.94 7.21 0.75 1.59 2.27 81.16 Salvador Guatemala 2.22 52.52 0.88 1.78 2.41 0.63 1.23 2.69 97.37 Honduras 1.48 43.20 0.80 1.53 2.43 0.79 0.96 2.11 74.16 Mexico 1.88 29.23 0.41 2.73 5.07 0.64 3.45 1.77 69.53 Nicaragua 1.57 59.66 0.67 1.47 3.17 0.62 2.01 2.15 89.08 Panama 1.85 36.60 0.78 1.35 2.15 0.49 3.36 0.77 50.59 Mean Yield 1.93 32.16 0.80 3.29 4.04 0.68 2.55 2.05 73.72 Note: Yield leaders in bold Source: FAOSTAT
1.8 Total annual SPAR expenditures over the period 2001-2005 averaged US$41.3 million; Table D.3. Capital expenditures accounted for about 84 percent o f total expenditures, somewhat high relative to the other sectors.225 A significant decline in public spending took place in 2005, with capital expenditures fall ing by 41 percent f rom the previous year.226 There appears to be l itt le correlation between the trend lines for both current and capital expenditures: while capital expenditures grew substantially through 2004, current expenditure growth was flat, and actually turned negative f rom 2003-2005. T h i s calls into question whether adequate budgetary resources are being assigned for maintenance and upkeep o f capital acquisitions and remains an issue for further analysis.
Table D.3: The Agriculture and Rural Sector (SPAR) Budget; 2001-2006 2001 2002 2003 2004 2005 2006
Planned: Current 10.0 7.4 6.0 5.7 8.0 9.1 Capital 68.2 45.4 43.9 47.8 46.6 53.6 Total Budget 78.2 52.8 49.9 53.6 54.7 62.7 Executed: Current 7.0 7.2 6.4 6.3 6.0 0.0
Total Executed 26.0 46.4 49.6 51.6 32.7 0.0 ExecuteuBudgeted 33.2% 87.9% 99.3% 96.4% 59.8% CapitaWTotal (Executed) 73.1% 84.5% 87.1% 87.8% 81.6%" Annual Variation:
Capital 19.0 39.2 43.2 45.3 26.7 0.0
Capital 106.2% 10.1% 5.0% -41.2% 15.0% Total 78.5% 6.8% 4.1% -36.7% 14.6%
Note: Figures are for Programmed Source: PER Dataset, includes MAGFOR, INTA and IDR
L
225. 226. polarization which put a strain on relations between the legislative and executive branches.
This i s likely due to the assignment o f a l l external loans and donations as Capital Expenditures. During 2005, the country suffered a setback, reflecting in part the oil price shock and an increased political
227

Annex I
1.9 After a lackluster budget performance in 2001, primarily in regard to capital expenditures, execution remained quite strong through 2004, with minimal overshooting in 2003 and 2004. The downturn in capital expenditures in 2005 was accompanied by a nearly 50 percent reduction in budget execution.
The SPAR Budget
1.10 The combined SPAR budget for 2007 totals US$72.8 mi l l ion. M A G F O R (along with INTA and INAFOR as dependent agencies) represents 60 percent o f the total budget, while IDR comprises the remaining 40 percent; Table D.4. Since 2004, the total SPAR budget has grown (in dollar terms) by 50 percent. From 2006 to 2007, the budget grew by 16 percent (in dollars terms) despite a devaluing currency,
1.1 1 Several issues stand out in assessing the 2004-07 SPAR budget allocations, namely: (i) capital expenditures are consistently the bulk o f expenditures, ranging f rom 83 to 88 percent o f total; (ii) there has been a shift away from IDR and toward MAGFOR in resource allocations; and (iii) provision for recurrent expenditures varies widely among SPAR institutions, with IDR having virtually n o recurrent budget. T w o factors combine to explain the bias toward capital expenditures. Close to two-thirds o f the SPAR budget i s financed through external sources (i.e., international cooperation); these resources, under Nicaragua’s budget policies, are required to be channeled via the capital expenditure budget, even though a portion o f these resources may actually have been allocated for recurrent expenditures. Finally, budget weaknesses on the side o f recurrent expenditures can translate into spotty coverage or the virtual absence o f a field presence for the SPAR institutions, which makes technological uptake and progress on the part o f the rural producers more diff icult to achieve.
Table D.4 The SPAR Budget 2004-2007 (US$ million) Yo TOTAL
Current Capital Total Current Capital Total 2007 MAGFOR 11.60 32.46 44.06 15.9% 44.6% 60.5%
INTA 2.68 8.76 11.44 3.7% 12.0% 15.7% INAFOR 1.65 2.42 4.07 2.3% 3.3% 5.6%
IDR 0.12 28.62 28.74 0.2% 39.3% 39.5% TOTAL 11.72 61.08 72.80 16.1% 83.9% 100.0%
2006 MAGFOR 8.97 21.99 30.96 14.3% 35.0% 49.2% INTA 1.98 6.41 INAFOR 1.64 2.24
IDR 0.12 31.82 TOTAL 9.09 53.81
2005 MAGFOR 7.78 17.25 INTA 1.87 4.40 INAFOR 1.62 0.15
IDR 0.13 31.02
8.40 3.88
3 1.94 62.90 25.03
6.27 1.77
31.14
3.2% 2.6% 0.2%
14.5% 13.8% 3.3% 2.9% 0.2%
10.2% 13.3% 3.6% 6.2%
50.6% 50.8% 85.5% 100.0% 30.7% 44.6%
7.8% 11.2% 0.3% 3.1%
55.2% 55.4% TOTAL 7.90 48.27 56.17 14.1% 85.9% 100.0%
2004 MAGFOR 5.56 18.05 23.61 11.5% 37.2% 48.7% INTA 1.85 4.72 6.58 3.8% 9.8% 13.6% INAFOR 1.22 0.3 1 1.53 2.5% 0.6% 3.2%
IDR 0.13 24.71 24.84 0.3% 51.0% 51.3% TOTAL 5.70 42.76 48.46 11.8% 88.2% 100.0%
Source: MHCP.
228

Annex I
D. The National Program for Agricultural and Rural Development (PRORURAL)
1.12 In 2005, the SPAR, in conjunction with international a id agencies, joined in a Sector-wide Approach (SWAP) known as PRORURAL, in the context o f the National Development Plan (2005-09), which seeks three overarching objectives: (i) higher incomes and reduced poverty; (ii) higher and better employment; and (iii) increased investment and exports.227 Additionally, PRORURAL was intended to provide support for improved aid coordination and to complement the assistance f rom international cooperation agencies in sustainable agnculture and forestry. The estimated cost o f the seven components that comprise PRORURAL for the period 2005-2009 i s US$411.5 mill ion; Table D.5. T h i s implies an average annual spending under PRORURAL o f US$82.3 million, or almost double the historical average o f the annual SPAR budgets. I t wi l l be crucial to carefully accompany the absorptive capacity o f the SPAR institutions vis-&vis these budget allocation, particularly given the wide variations in budget execution since 2004; see Table D.3.
1.13 T w o overarching goals fkame the activities undertaken by PRORURAL, namely (i) annualized Agricultural GDP growth o f 6.24 percent over the period 2005-09, and (ii) annual agricultural exports growth o f 20 percent. A driving element o f PRORURAL i s the promotion o f a more efficient use o f available resources, before accessing new, additional resources. More specifically, budget allocations for MAGFOR (and their subordinate agencies: INTA and INAFOR) and IDR and the various programs already considered under the budgeting process with MHCP, would be reoriented toward the activities and objectives set forth under PRORURAL. Nonetheless, the financial resources being brought to bear o n the rural sector under PRORURAL represent a substantial increment to historical SPAR budgets. Whi le efficiency gains may be expected and, in fact, envisioned under the Program, just how the S P A R institutions will be able to effectively deploy such large budgets remains to be seen.
Table D.5 PRORURAL Budget by Components (Planned &Committed) 2005-09 (US$ million)
PRORURAL Institution 2005 2006 2007 2008 2009 Total % Total YO Component Total Planned (1) Technical INTNFUNICN 6.2 9.5 10.7 11.7 9.5 47.6 12% 10.6 22%
Planned Commitments
Innovation (2) Food Safety/ Animal Health (3) Sustainable Forest Dev. (4) Prod. Support Services (5) Infrastructure
(6) Inst. Mod. and Strengthening (7) Forest' Ag. Policy and
INAFOR
MAGFOR INAFOW 0.4 7.9 6.2 5.1 3.7 23.3 6% 7.1 30% MAGFOR
IDR
IDR MAGFOWIDR 10.3 18.7 18.8 17.4 16.4 81.6 20% 29.1 36% INAFOWINTA MAGFOW IDR 1.2 1.4 1.1 1.0 1.0 5.7 1% 2.2 39% INAFOW INTA
DGPSN 9.4 6.9 7.0 7.3 7.5 38.1 9% 23.7 62%
16.5 41.1 38.6 24.0 25.0 145.2 35% 112.9 78%
3.0 14.0 14.0 19.0 20.0 70.0 17% 14.6 21%
Strategy
Source: Multi-annual budget 2005-09, MAGFOR Total 47.0 99.5 96.4 85.5 83.1 411.5 100% 200.2 49%
L
227. the Bank withdrew and instead financed the stand-alone Second Agricultural Technology Project (ATP-11).
The World Bank initially sought to take part in the SWAP through which PRORURAL i s funded; however,
229

Annex I
1.14 Yet concerns o f absorptive capacity may prove to be moot, since actual financial commitments to PRORURAL - at about US$200 mi l l ion - so far only account for about one-half o f the Program’s planned budget. Commitments vary substantially by component, with Component 2 (Food Safety and Animal Health) and Component 4 (Financial Support Services) already at funding levels o f 62 percent and 78 percent, respectively, whereas the remaining five components show commitment levels o f 22-39 percent only.228
1.15 By institution, the largest financing gap lies with IDR: only about one-half o f i t s budget i s fully funded; Table D.6 Core commitments to MAGFOR under PRORURAL approach 80 percent, while i t s ancillary agencies - DGPSA, INTA and INAFOR - show commitments o f 62 percent, 27 percent, and 23 percent, respectively. In 2005, PRORURAL was virtually fully funded; actual performance for 2006 i s s t i l l being determined, yet the collective SPAR-PRORURAL budget was, at this writing, far in excess o f financial commitments. A similar scenario could play itself out in 2007-09.
Table D.6 PRORURAL Budget by Institution (Planned and Committed) 2005-09 (US$ million)
Implementing Agencies 2005 2006 2007 2008 2009 Total %Total MAGFOR 8.7 16.2 14.3 5.7 5.7 50.6 43%
DGPSA 9.9 7.2 7.4 7.6 7.9 40.0 10% INTA 7.9 10.4 10.7 9.9 9.2 48.1 12% INAFOR 2.2 12.7 9.9 8.3 6.7 39.8 10%
IDR 17.5 49.5 50.0 49.0 51.0 217.0 53%
Planned
Competitive Funds (FUNICA) 0.8 3.5 4.1 4.8 2.8 16.0 4% TOTAL 47.0 99.5 96.4 85.3 83.3 411.5 100%
Committed Implementing Agencies 2005 2006 2007 2008 2009 Total YO Total MAGFOR 11.9 13.6 11 2.3 2.1 40.9 20%
DGPSA INTA INAFOR
IDR
9 4.7 4.1 4.1 3 24.9 12% 3.7 2.4 2.4 2.3 2.1 12.9 6% 2.6 1.7 1.6 1.6 1.6 9.1 5%
18.3 23.3 23.2 23.2 16.6 104.6 52% Competitive Funds (FUNICA) 0.8 1.8 1.8 1.8 1.2 7.4 4%
TOTAL 46.3 47.5 44.1 35.3 26.6 199.8 100%
Financing Gap Implementing Agencies 2005 2006 2007 2008 2009 Total %Total MAGFOR -3.2 2.6 3.3 3.4 3.6 9.7 5 yo
DGPSA INTA INAFOR
IDR
0.9 2.5 3.3 3.5 4.9 15.1 7 yo 4.2 8.0 8.3 7.6 7.1 35.2 17%
-0.4 11.0 8.3 6.7 5.1 30.7 15% -0.8 26.2 26.8 25.8 34.4 112.4 53%
Competitive Funds (FUNICA) 0.0 1.7 2.3 3.0 1.6 8.6 4% TOTAL 0.7 52.0 52.3 50.0 56.7 211.7 100%
Note: Slight differences vis-a-vis Table D.5 due to rounding error. Source: Multi-annual Budget (MAGFOR)
L
228. actual) that, when confirmed, could reduce the financing gap to as l i t t le as US$83.2 mil l ion.
While not including the multi-annual budget, there appear to be other commitments (either in process or
230

Annex I
Preliminary Outcomes - PRORURAL
1.16 The SPAR institutions have made positive strides in tracking outcomes under PRORURAL. A monitoring, evaluation and learning system i s in place (SISEVA) to document results across bo th components and institutions; whi le s t i l l a work in progress, the SISEVA wil l ultimately bring together and unify results monitoring across the institutions that comprise the SPAR. For 2006, budget execution totaled US$57.45, or about 77 percent o f planned; Table D.7.
1.17 In a sector-wide program l ike PRORURAL that cuts across a large number o f institutions and i s funded by a various sources, developing relevant summary indicators i s a challenge. Figure 7.1 represents a f i rs t attempt by the SPAR institutions to gauge physical progress. The physical execution of PRORURAL was commensurate with the financial outcomes for 2006. Near ly 75 percent o f the programmed products where achieved. Across the components, achievement o f physical outcomes ranged from a l o w o f 56 percent (Technological Innovation) to nearly 90 percent (Production Support Services).
Table D.7 Budget Performance - PRORURAL (US% million) 2006
Component - PRORURAL Budgeted
(2) Food Safety and Animal Health 5.85 (3) Sustainable Forest Development 1.61 (4) Production Support Services 33.13 (5) Infrastructure 10.49 (6) Inst. Modernization and Strengthening 16.94 (7) Forest and Agricultural Policy and Strategy 0.84 TOTAL 74.45 Note: exchange rate - 18 Cordobas=US$l Source: MAGFOR - Annual Report PRORURAL
(1) Technical Innovation 5.59 Executed %Executed YO total
4.74 85% 8% 5.07 87% 9% 1.31 81% 2%
8.32 79% 14% 12.84 76% 22% 0.64 76% 1%
24.52 74% 43%
57.45 77% 100%
Figure 7.1 Physical Performance - PRORURAL, by Component (2006)
For Dev Prod Ser Tec Inn San lnf'ra Modem Pol-Strat Mean -- PRORURAL
Source: MAGFOR.
23 1

Annex I
I. 18 A major expected outcome o f the PRORURAL exercise i s greater coordination o f aid delivery, both among the SPAR institutions and among external donor agencies. Evidence o f such coordination i s the Memorandum o f Understanding that serves as a consensus statement (signed by a l l parties involved) laying out the objectives, scope and intended outcomes o f PRORURAL. An agreed set o f performance indicators are included in the Memorandum, monitoring o f which would be undertaken under the SISEVA, both annually and bi-annually, depending on the indicator in question. Table D.8 reports progress on these agreed indicators during 2006 across the seven components o f PRORURAL. In all, 25 indicators are followed, o f which 12 are provided with benchmarks for 2006. For the twelve indicators with complete information, the performance o f PRORURAL i s quite strong, with actual performance in most case significantly exceeding the benchmark. Component 1 (Technological Innovation) and Component 2 (Food Safety and Animal Health) show the most complete data among the seven components.
E. Main Findings and Recommendations
1.19 Agricultural output has been growing almost twice as fast as overall GDP during 2000-2005, but most o f that growth i s attributable to extensions o f the agricultural frontier, rather than increases in agricultural productivity. This continues a pattern that was already observed in the 1990s and that i s ultimately unsustainable. It also suggests that at least some o f the more important problems that had been undermining sector productivity in the 1990s must s t i l l be present today. T w o such problems identified in earlier sector reviews were the absence o f a clear and prioritized rural sector strategy to guide public sector interventions, and the lack o f adequate donor coordination. These were held largely responsible for the very inefficient public spending that has taken place in the sector and the uneven program execution. Moreover, the issue o f donor coordination retains i t s paramount importance, considering that two-thirds o f the sector budget i s financed with external resources.)
1.20 A major step forward toward addressing these two problems was taken in 2005 with the establishment o f a Sector-Wide Approach for the Agnculture and Rural Sector in the overall context o f the National Development Plan. This approach, named PRORURAL, commits the sector’s public institutions and the main international aid agencies to fo l lowing a single, common and coordinated strategy, focusing on raising sector output and export growth levels. T w o major outcomes expected from PRORURAL are (i) greater coordination o f aid delivery, both among sector institutions and donor agencies, and (ii) agreement on a set o f performance indicators that will serve to monitor sector performance and guide corrective interventions. PRORURAL aims to improve the efficiency o f resource allocation in the sector, before seeking to access additional resources. Nevertheless, budget plans through 2009 envisage a doubling o f annual financial resources in the sector, which draws attention to the need for raising absorptive capacities and maintaining steady program execution levels.
232

Annex I
Table D.8 Performance Indicators-PRORURAL, by Component (2006) Performance Indicators Responsible Benchmark Actual
Institution 2006 2006
1. Technological Innovation # producers receiving technical assistance
INTA’s innovation technology, portfolio increases # validated technologies supporting export commodities, food safety and food security, and environmental sustainability . Annual foundation and registered seed production o f food grains exceeds 230 metric tons, while vegetable, pasture and tuber seed production covers more than 230 ha. # producers trained in food processing, and/or business administration and marketing. #service providers certified by INTA according to accepted standards (INTA established an operational system for accreditation). % producer organizations that participate in TA activities through FAT with access to finance and linked to product markets.
INTA, 29,800 31,132 FUNICA, INAFOR
INTA 134 188
INTA 228 TM 147.5 T M 230 ha. 135 ha.
INTA 1,000 2,709
INTA
INTA, FUNICA 8 % 34%
% INTA’s indigenous people clients are women. INTA 20% 24%
for plannindmgt of forestry sector (% completed)
2. Food Safety and Animal Health
National forest inventory and valuation exercise/ information available INAFOR 100% 5%
% adforest exports not rejected DGPSA 99.9% 99.9%
#export companies HAACP-certified DGPSA 100 121
3. Sustainable Forest Development
Variation rate in value of forestry exports INAFOR -0.54
4. Production Support Services
#small and medium producers receiving finance (by gender) IDR 12,070
Finance received by small- medium scale producers (by gender) IDR C$ 168.6m.
5. Infrastructure
# direct beneficiaries from infrastructure investments IDR 104,700
6. Inst. Modernization and Strengthening
Human and financial resources deploy by territory and institution. MAGFOR H:263; F: C$101 m _ - - INTA
DGPSA H:-; F:- H:485; F:23 m.
INAFOR H:-; F:- FUNICA H:-; F:-
IDR H: -; F:- MAGFOR N:-; Ext: -
INTA N:-; Ext: __ IDR N:-; Ext: -
INAFOR N:37 m; Ext: 38 m. FUNICA N:-; Ext: -
Distribution o f PRORURAL budget financing between national and external cooperation sources (by institution and territory)
#/ TerritoriaI Delegations o f SPAR Institutions created to MAGFOR 16 implement PRORURAL. INTA
IDR INAFOR 10 FUNICA
%Government institutions involved and participating donors rate MAGFOR 80% PRORURAL’S implementation and monitoring arrangements as satisfactory..
233

Annex I
Performance Indicators Responsible Benchmark Actual Institution 2006 2006
The Planning, Monitoring and Evaluation unit of MAGFOR i s fully SPAR 6 2
T h e technical-technical staff ratio o f MAGFOR, INTA, INAFOR MAGFAOR 45/55 45/55
operational and producing regular reports.
and FUNICA has increased. INTA 4915 1 6 813 2 INAFOR 6 3 / 3 7 75/25 FUNICA 54/46 59/41
10 additional forest management plans are approved. INAFOR 3 41
and INTA's salaries and operating costs (partially financed under the project). 7. Forest and Agricultural Policy and Strategy
The Government budget integrates 75 percent of MAGFOR, INAFOR MAGFOR, 0 0 INTA
% National Council of Production members satisfied with their participation in the formulationhmplementation of PRORURAL.
% international cooperation in DRP Sub Table that have aligned cooperation strategies to the sector-wide policy.
% spending o f the institutions implementing PRORURAL that correspond to MPMP.
MAGFOR
MAGFOR
MAGFOR
64%
Source: MAGFOR - Memorandum o f Understanding, PRORURAL (2005).
234

Annex J
Annex J Budget Transfer Allocation by Municipality, 2006-2007
2007 Allocation (millions of cdrdobas) Tax Revenue (Proyecto de PGR 2007) 18,291.08 7% allotted to Transfers 2007 1,280.38 Managua share (2.5%) 32.01 Total to distribute among 152 municipalities 1,248.3 7
235

Annex J
Municipality Cat. A
2006- 2007"
+ +
2007 Budget Transfer **
El Crucero El Tuma - La Dalia La Libertad La Paz Centro
El Crucero El Tuma - La Dalia La Libertad La Paz Centro Larreynaga- Malpaisillo Masatebe + Mateare Matiguas Muel le de 10s Bueyes Muy Muy Nandaime Paiwas Potosi Rio Blanco Rosita San Carlos San Marcos Santo Doming0 Sto. T o m s Chontales Siuna Somotillo Somoto
+ +
d a + + ++ + + + + + +
Telica + Tola
Vi l la Sandino + Villanueva Waslala +
++ Altagracia Buenos Aires ++ Catarina Comalapa Condega Desemboc. Cruz de Rio Grande Dipilto Diriomo
+++ +
Dolores El Almendro El Castillo El Coral El CUB El Jicaral El Jicaro E l Realejo El Sauce
+++ El Tortuguero Esquipulas 5.90 1 1.18 1 2.69 I 2.16 I 2.08 8.11 1 38% ++
236

Annex J
2007 Budget Transfer **
237

Annex J
Cat. 2007
Municipality Cat. A
2006- 2007*
Niquinohomo Palacaguina
2007 Budget Transfer ** (millions of cordobas)
Pop. Fiscal Tax Execution 2007 equity collection of TOTAL
efficiency transfer
G San Juan de Limay G Santa Lucia + G Yalaguina H CincoPinos H Ciudad Antigua H La Conquista H La Paz de Carazo H Las Sabanas H Murra
YO dif.
2007 2006-
I H 1 Prinzapolka
Totogalpa TOTAL Standard Deviation (exc. Managua) Max. (exc. Managua
Median
2006 Total Budget
Transfer (revised)* *
3.77
1,044.54 312.09 312.09 312.09 312.09 1,280.38 -- 2.90 2.09 2.86 1.57 0.20 3.74 --
16.56 I 12.92 I 15.20 I 7.34 I 2.17 I 23.67 I 271% 1.85 I 0.00 I 0.00 I 0.00 I 0.00 I 2.27 I -51% 6.70 2.05 2.05 2.05 2.05 8.21 29% 6.19 1.32 1.11 1.48 2.16 7.43 22%
Source: * Municipal categories for 2006 from AMUNIC, for 2007 from TRANSMUNI (MHCP) ** 2007 budget proposal
238

Annex K
Annex K
Implementation Status of CFAA Action Plan, January 2006
CFAA Action Plan (Januarv. 2004) 1. Implementation arrangements 1 a. The Government, IDA and IDB agree o n a Memorandum o f Understanding for the implementation o f the Government action p lan for improving PFM lb. Sign Government interagency accord for the implementation o f the Government Act ion Plan (GAP) IC. Fully identi fy financing sources for G A P 2. Legal framework 2a. Complete inventory o f PFM laws and regulations, determine duplications and o r inconsistencies 2b. Present draft Financial Administration L a w to National Assembly 2c. The National Assemblv amroves Financial Administration L a w 3. Budget Development 3a. Calculate recurrent cost implications o f the Public Investment Program [In the context of the PRSC, the action was agreed as follows: SECEP has initiated the routine calculation of the recurrent cost implication of PIP and MCHP has initiatedplans to create MTEF on this basis.] 3b. Prepare medium term projections o f fiscal revenues and expenditures 3c. Identi fy and disclose a l l publ ic funds in the 2005 national budget document 3d. Complement the budget document with explanations o f the underlying macroeconomic framework and fiscal pol icy 3e. Initiate adequate classification o f capital and recurrent expenditures
3f. Identi fy and disclose a l l publ ic funds, and consolidate them, in the 2006 national budget document 3g. Break-down composition o f current and capital transfers, and institutional and functional classifications
3h. Relate specific outputs to budgeted costs in sector development plans, to serve as a basis for ex-ante feasibility and ex-post execution
3i. Prepare fiscal budget under a Medium-Term Expenditure Framework 3j. Classify capital and recurrent expenditures adequately
4. Integrated Financial Management System 4a. Continue implementing SIGFA’s treasury module in the central government 4b. Start implementation o f the human resources modules consistent with the Civil Services L a w 4c. Complete design and integration o f SIGFA’s procurement and physical assets module in the central Government 4d. Appraise and enhance the security system and procedures
Status as of Januarv. 2006
Completed.
Completed.
Completed.
Completed.
Comdeted. Comdeted.
Completed (i.e., in terms o f ini t iat ing the actions).
Completed.
Substantially completed with the 2006 national budget document. Completed with the 2006 national budget document. Completed (i.e., in terms o f ini t iat ing the actions). Substantially completed with the 2006 national budget document. Substantially completed. Sub-functional classification has no t been adopted, but programmatic classification i s used. N o t completed. In retrospect, the in i t ia l timetable for this action was too optimistic. Partially completed with the 2006 national budget document. N o t completed. Underlying work started, see No . 1 1, but there are important po l i t ica l economy obstacles to this action.
Completed (i.e., in terms o f continuing implementation). Completed (i.e., in terms o f starting implementation). N o t completed. W o r k in progress.
N o t completed. Systems and procedures have been enhanced, but the formal audit has no t vet been undertaken.
239

Annex K
CFAA Ac t ion P l a n (January, 2004) 4e. Prepare a strategy for extending S I G F N C U T coverage at individual transaction level to noncommercial autonomous and decentralized entities 4f. Increase third level coverage, particularly in large implementation u n i t s such as hospitals 4g. Initiate implementation o f SIGFA to INIFOM, IDR, F ISE and ENACAL
4h. Implement SIGFA’s human resource , procurement and physical assets module in the central Government
4i. Increase coverage o f other public sector entities and local governments 5. Treasury Sa. Prepare detailed cash f l ow programs for budget releases, disaggregated by institution, t o al low for planning and managing availabilities 5b. Agree and document reconciliation procedures with DGI, DGA, BCN and other banks
5c. Eliminate decision-making in scheduling individual expenses and payments at the central level, except for salaries and internal and external debt services 5d. Initiate treasury Single Account coverage at individual transaction level t o INIFOM, IDR, FISE and ENACAL.
6. I n t e r n a l C o n t r o l & I n t e r n a l Audit 6a. Prepare and fund action p lan to strengthen internal controls and internal audits in at least 10 central government institutions, including MTI, MECD and M I N S A . 6b. Initiate execution o f Government-led public expenditure tracking surveys 6c. Implement action p lan to strengthen internal controls and internal audits, and incorporate feedback f rom continued execution o f expenditure tracking surveys
6d. Clari fy roles among internal audit units, MHCP, the Off ice o f Public Ethic and the CGR 6e. Start implementation o f national internal audit coordination off ice
6f. Set up committees for control and fol low up to internal and external audit reports in a l l executive branch entities 7. Deconcentrated Budget Execution 7a. Evaluate the effectiveness o f financial management and audit arrangements under the: (i) programs for education participation (school autonomy) and de-concentration o f MECD’s territorial delegations; and (ii) MINSA‘s basic health care u n i t s and deconcentrated hospitals, and their relation to SIGFA 7b. Accordingly, design program o f recommended actions 7c. Implement program o f actions 8. M o n i t o r i n g and evaluation
Status as of January, 2006 N o t completed.
Completed (i.e., in te rms o f increasing coverage). Substantially completed. Init iated in INFOM, IDR, FISE and other entities, but not ENACAL. N o t completed (work in progress). In retrospect, the init ial timetable for this action was too optimistic. Completed (i.e., in terms o f increasing coverage).
Substantially completed. Cash f l ow programs are produced, but need to b e improved. Substantially completed. Reconcil iation procedures have been implemented, but need to b e improved. N o t completed. W o r k in progress.
Not completed. These entities fa l l under the single treasury account system, but not at the level o f individual payments.
Completed. A training action p lan (six events, 240 internal auditors o f 17 entities) was imdemented bv MHCP. N o t completed.
Partially completed. Work in progress, through the introduction o f the new internal control norms (NTCI) and correlated training by CGR (41 events in 2005, with 920 public sector officers attending). Completed.
Dropped.
Completed (in certain entities, though effort was not sustained).
N o t completed.
N o t completed. N o t completed.
240

Annex K
CFAA Action Plan (January, 2004) 8a. Implement an effective monitoring and evaluation system, yielding periodic reports 8b. Systematically take effective actions o n the basis o f the M&E reports 9. Accounting and financial reporting 9a. Restructure the government accounting function to focus o n analysis and reporting, and less o n transactional work. Segregate government asset administration f rom accounting function
9b. Complete review and determination o f 2002 init ial balances o f central government 9c. Prepare enhanced budget execution report for 2003 including a cash balance reconciliation, historical revenue/expenditure trends, and level o f payment arrears 9d. Ensure budget transfers are documented by proper accountability reports on use o f funds according to respective legal and normative framework 9e. Present enhanced budget execution report for 2004 to the same detail as the budget document
9f. Init iate reporting o f output indicators in key programs
9g. Cover a l l central government entities and consolidate them in the budget execution report 9h. Enforce audit and publication o f financial statements o f a l l public sector decentralized and autonomous entities and state enterprises 9i. Implement p lan for issuance o f government financial statements compatible with international practice
10. External Audit 1 Oa. Make satisfactory progress per the indicators o f the program for modernization o f CGR
lob. Endorse a realistic p lan for, and show progress toward, producing a comdiance. financial audit reDort o f government accounts 1Oc. Issue annual audit on the government’s budget execution report 1 Od. Implement p lan for audit o f government financial statements 10e. Independent audit fm to issue audit report o f CGR’s financial statements 11. Public Participation 1 la . Prepare a draft l aw o n public access to information after broad participatory process 1 lb. The National Assembly approves l aw o n public access to information 1 IC. Establish arrangements for access to information o n public finances 1 Id. Provide training to c i v i l servants- and awareness for the general public- on the rights o f access to government information
Status as o f January, 2006 Completed (as monitored under instruments other than the CFAA). Dropped (action to b e monitored under instruments other than the CFAA).
Partially completed. The accounting directorate participates more o n reporting and reconciliations, but the asset administration was no t separated. N o t completed off icial ly.
Not completed.
N o t completed. W o r k in progress under new FM Law.
N o t completed. The report has been enhanced, but the i tems mentioned in No . 42 have not been incorporated yet. N o t completed (work in progress under new FM Law). In retrospect, the in i t ia l timetable for this action was too optimistic. N o t completed. W o r k in progress under new FM Law. N o t completed. W o r k in progress.
N o t completed (work in progress under new FM Law). In retrospect, the in i t ia l timetable for this action was too ODtirniSt iC.
Dropped. I t was agreed with the MOF that actions under the control o f the CGR -an independent body- wou ld not b e part o f the agreed FM Ac t ion Plan. Other donors support the CGR. N o t completed (additionally see N o . 49).
N o t completed (additionally see No. 49). N o t completed (additionally see N o . 49). N o t completed (additionally see No. 49).
Completed (i.e., in terms o f preparing the draft law). N o t completed.
Completed.
Completed, in terms o f the Voluntary Strategy for Access t o Information (EVA).
24 1

Annex K
CFAA Action Plan (January, 2004) 1 le . Enhance quality, clarity and usefulness o f financial information available to public 1 If. Improve dissemination media, including posting in the internet and other means where such access i s unavailable 12. External aid coordination 12a. Put in place efficient procedures to channel multilateral loan disbursements through treasury single account (CUT)
12b. Develop internal control and accountability procedures for the use o f funds transferred f rom central implementation agencies 12c. Put in place efficient procedures to channel grants disbursements through the CUT
12d. Incorporate a l l public investment projects/ programs into the off icial registry o f public investments and reconcile systematically against government accounting records 12e. Agree o n specific financial management arrangements for SWAps for Education Fo r All fast track init iative strategy and the -_ agriculture/forestry development program 12f. Collaborate in the organization o f WB/IDB assessment and training o f audit firms 12g. Record a l l external a id funds channeled through public sector entities in the S IGFNCUT, in coordination with signatory agencies and donors. 13. Human Resources 13a. The National Assembly approves Civil Service L a w 13b. Execute training programs for financial managers and internal auditors in spending entities 13c. Begin implementation o f merit-based system for c i v i l servants in the executive branch
13d. Prepare proposals to include public administration and public audit in the universities program 13e. The CCPA strengthens accreditation framework for authorized public accountants
14. Debt management 14a. The National Assembly approves Public Debt L a w 14b. Enact Public Debt Law’s regulations, including the procedures for extension o f loans to autonomous and state-owned entities and for issuance o f government guarantees 14c. Clean up the debt databases and fully load domestic debt loans in SIGADE, including general information and individual transactions
14d. The M C H P and B C N effectively coordinate public debt management including the consolidation o f S IGADE database and i t s automatic integration to SIGFA
14e. Report debt and contingent liabilities information in the government financial statements
Status as o f January, 2006 Completed.
Partially completed.
Partially completed. Loan accounts are part o f the CUT, but the direct payment procedure i s not yet efficient. Completed through new FM L a w and annual budget execution norms. Partially completed. Budgeted grant accounts are part o f the CUT, but the direct payment procedure i s not yet efficient. Partially completed. Incorporation has been increasingly fulf i l led, but systematic reconciliations are pending. Completed (FONSALUD and PRORURAL, not education).
Dropped.
Completed.
Completed. Completed.
Completed (in terms o f beginning implementation). To be monitored under instruments other than the CFAA. Dropped.
Dropped. I t was agreed with the MOF that actions under the control o f the CCPA -an independent body- would no t be part o f the agreed FM Act ion Plan. Other organizations support the CCPA.
Completed. Completed.
Partially completed. MHCP uses a debt management information system different from and, in addition to, SIGADE. Partially completed. Coordination has been enhanced, though under separate
3ending. ?Jot completed. Debt i s reported, though l o t through financial statements (see N o . 38).
jystems. Automatic l inks to SICOIN
242

Annex K
243

Annex K
244

Annex L
Annex L
Model Outline for Sector Expenditure Reviews
This Annex presents a generic outline for Sector Expenditure Reviews that seeks to cover most o f the topics that are generally treated in such reviews. The data required to cover many o f these topics m a y not always be available for each sector, however, and the relevance o f each topic i s l ikely to vary depending on the individual sector being analyzed. The model outline i s therefore better treated as a checklist o f possible ideas to pursue in an expenditure review, rather than as a rigid blueprint that a l l reviews must follow.
I. Introduction and Sector Overview. 0
0
0
Strategic Context o f the Sector Expenditure Review 0 Role o f government versus private enterprise in the sector Definit ion o f the sector institutions to be covered by the sector review Summary o f the main findings f rom previous expenditure reviews 0 K e y sector issues to look out for in this review
11. Level and Evolution o f Sector Finances
A. Analysis o f Sector Expenditures 0 Summarize the major trends in sector resource allocation
0 Analysis by institutional classification a. Sector expenditures by level o f government (i.e., central government, department
level, provincial levels, local levels)
b. Evolution o f sector expenditures by ministries/agencies. c. Evolution o f sector expenditures by programs
i. Comparison with spending allocations/trends in other countries
i. Intra-sectoral spending allocations (e.g., Administration versus Service Delivery within ministries)
0 Analysis by economic classification (personnel, operations and maintenance, capital expenditures, interest) d. Staff remunerations and incentives, evolution o f sector employment, personnel
i. Comparison o f wage/employment levels in other countries with similar per- capita income levels
ii. Comparison o f wage/performance indicators with comparable private sector entities
i. Balance between capital and maintenance expenditures a. Comparisons with CapitaVmaintenance balance in other countries and
ii. Recurrent cost implications o f sector investment program
management issues
e. Investment expenditures versus current expenditures
sectors
. The targeting o f sector expenditures
i. Urban versus rural a. Incidence o f sector expenditures by geographic location
b. Incidence o f sector expenditures by income quintile
245

Annex L
c. Incidence o f sector expenditures by gender/age
B. Analysis o f Sector Financing
0 Sources o f financing (gov’t. budget, donor resources, localhtate level resources)
0 Cost recovery (payment for services) a. Sector subsidization policies b. Incidence analysis o f subsidies
111. Analysis of Sector Outcomes and Performance
A. Analysis o f sector outcomes: patterns and trends o f interest or concern, impact o f sector performance o n economic development . Comparisons with sector performance indicators in other comparator countries.
B. Provision o f sector services by . Region . Type o f beneficiary (income group, gender group or age group) i. Effects o f user feedcost recovery on use o f services
C. Alternative models for providing sector services . . Opportunities for decentralizing service provision Opportunities for private sector participation
IV. The Efficiency of Sector Expenditures
A. Summary o f findings from earlier cross-country efficiency analyses o f public expenditures (e.g., based on data f rom Herrera and Pang (2004) or Machado (2006), as discussed in the Wor ld Bank’s PER).
B. Discussion o f ‘production function’ linking sector expenditures with sector outcomes. . countries, or across different periods.
Comparison o f sector-specific efficiency indexes with the indexes calculated for other
V. Sector Expenditure Framework
A. Present the sector policy and expenditure priorities identified by the government in the PRSP or other policy document. a. Compare public priorities with the sector needs or service gaps identified earlier in the
discussion on sector outcomes (Section 111) b. If possible, identify the specific short and medium-term sector outcome targets envisaged
by the government
B. Develop an expenditure framework for achieving the sector targets envisaged by the authorities, and estimate the total fiscal cost o f achieving those targets with existing technologies and efficiency indexes.
246

Annex L
C. Alternatively, using the existing sector budget determine the most efficient intra-sectoral allocation o f funds in terms o f best responding to the sector priorities identified earlier without changing the overall sector expenditure amount.
D. (The findings from this section should provide useful inputs for the annual planning exercises contemplated for the ‘mesas sectoriales’ that were set up by the Nicaraguan authorities to advise o n sector policies.)
VI. Sector Organization and Governance Arrangements
A. Review o f key findings from Nicaragua C F M C P A R
B. Planning and budgeting wocesses, including procedures for allocating resources across different sector programs and activities. a. Prioritization o f policies/programs in sector plan and review o f methodology for
prioritization. i. I s reference made to national plans? ii. I s there a role for c iv i l society in the prioritization process?
b. Preparation o f the sector investment program i. Are sector investment plans coordinated with recurrent expenditure plans?
c. Correspondence between plans and budgets d. Budget preparation process; estimation o f unit costs (if any?) and existence o f a Med ium
Term Expenditure Framework within sector e. Engagement o f l ine personnel and decentralized agencies in budgeting process
C. Budget execution and fiscal transparency a. Timeliness and predictability o f disbursements to Ministry, and f rom Ministry to agencies
and local entities, and from local entities to beneficiaries b. Adequacy o f expenditure control mechanisms, including procurement
i. Importance o f internal and external audits ii. Estimates o f the extent o f ‘expenditure leakages’
D. Monitoring and evaluation arrangements a. Are arrangements in place to systematically monitor sector outcomes and evaluate sector
performance? b. D o new projects systematically develop baseline indicators?
E. Donor coordination mechanisms a. H o w wel l are donor funds integrated into the budget process? b. I s a SWAP arrangement in place?
i. What further reforms are needed to enable SWAP arrangements?
VII. Recommendations . . On expenditure allocations . . On efficiency-raising measures . On sector prioritization processes . On sector organization
On the strategic role o f the State in the sector
On sector finances (including cost recovery)
247

248

? ? ? - ? % ? ? m m m o m m m
0 m m m - m N N
- ' 9 0 9 r - m - - N m
? ? E r - m - - N m
T Y ? r - b - - N m
? a s - N m
0 2
- E ? 0 0 m N N b
m N o r - -? '? r - m m

n - t - t o o o o m t o o w coat
D ( D m r r r
d m- f (v- 4
r
@
Y IC
r
r
C IC IC 7 Y
IC c %-
c r
0
C a
s Y a
a T
c 2 IC
0
d
IC
r
r cf IC (I
C
C cf
a
U 0 U d
n 9 U Q
8
a
- c C !- c
E c -
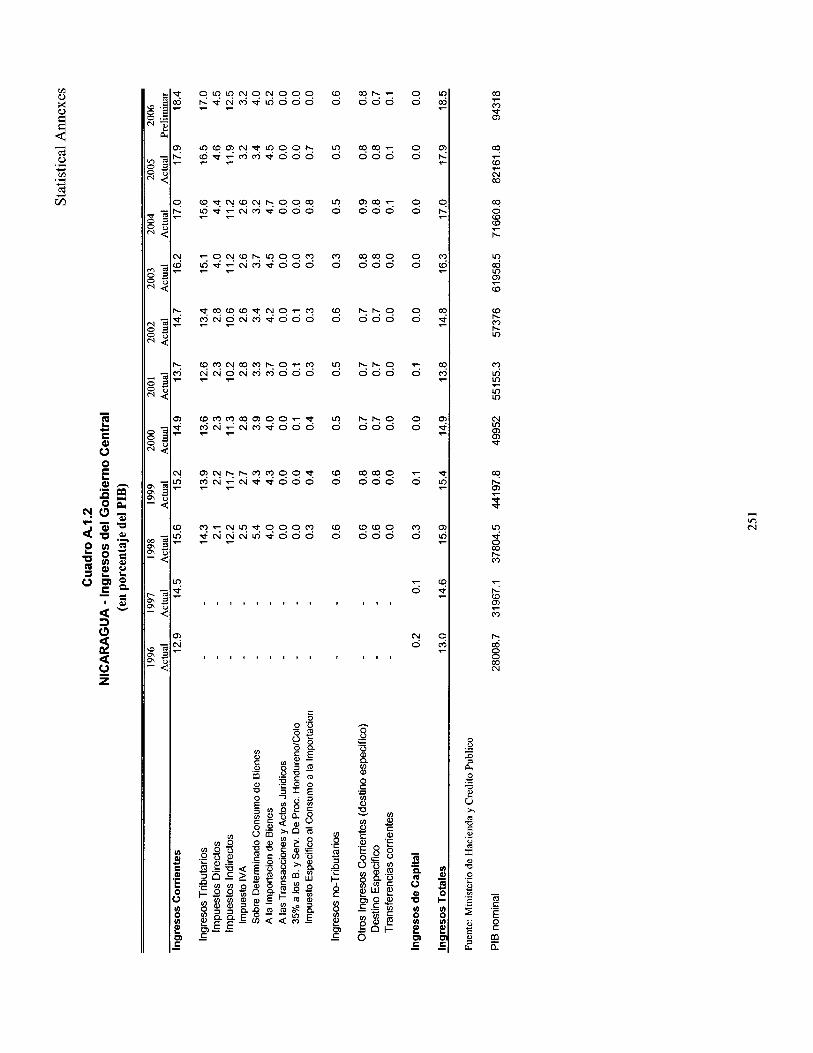
m
2 7 0
2
7
0

WJ e,
I
N rg N
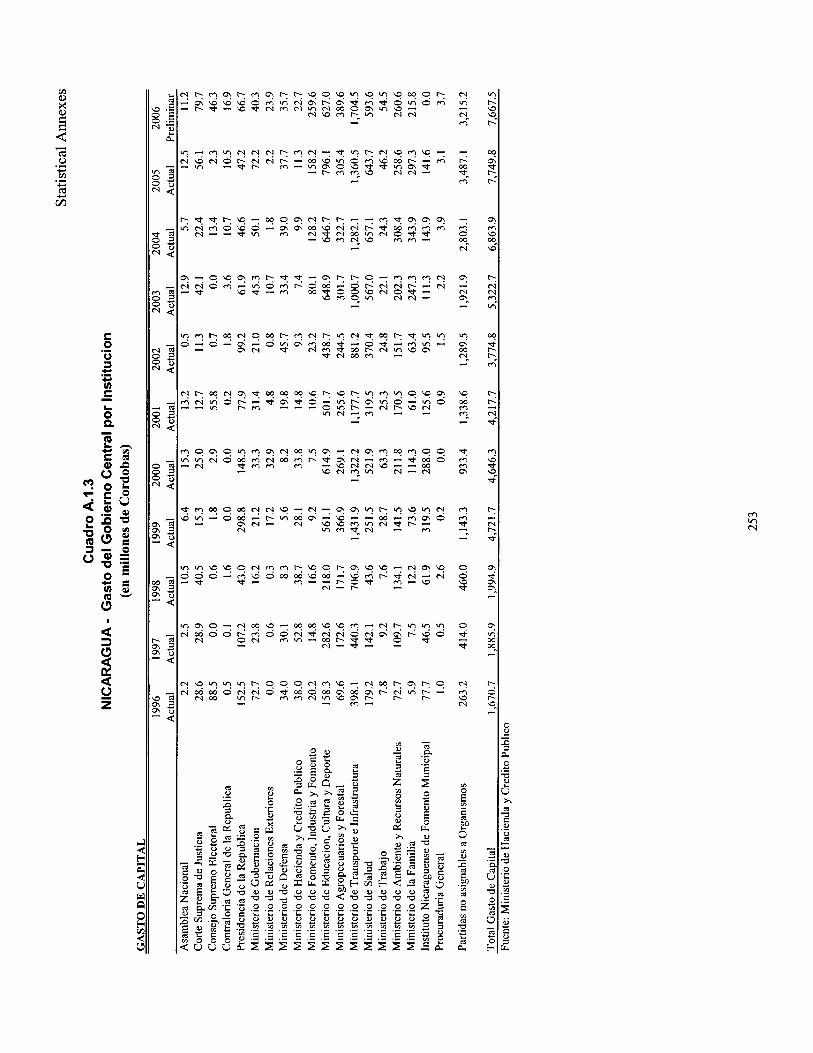
b P
I
C

b P - Q
UI
e - : 41
- 7

cd 0 .3 Y
rn .3 Y cd ;;
I
0 c
C 5
C 4
C E
C E
C 2
c 4
C E
C E
C E
C 4
- E
2 e E
G c
C
.-
C Y
- *
m m N


m - 0 0
c o b -
m c o m m w c

LI) 0)
I 3
cd 0
.r( Y v1 Y .I
cd 3i
.- 0 .- E v) x Y) a, 6 m .-
C Dc
F d 0
- Dc 7 u: hl Dc
Dc C U
t- u:
v Dc v
U z
U t- F t- Lr
F v v v Lr
7
hl v 0 a- d
oc t-
d d z
v1 d C Dc r. F
c
r- \c
F z r- W C C W N
r 3 s
g P) -0 v1 e,
0 3 3
5 L

l o m m o c o co
m 0 .- 5 a .- 0 n
E

5 P
I
a
a 0
3
3 z
c
.- s E a ,o 5
S
5 x m U C a, 0 m I a, -0
.-
.- I E v) C .- 5 . . a, C a, 3
LL
c

Statistical Annexes
261

Statistical Annexes
I STATISTICAL ANNEX TABLE 82: WAGE BILL, BY INSTITUTION (C$) t mi 20031 2oq41 m5i 20861' m.2w
2 62

Statistical Annexes
NORTH ATLANTIC REGtONAL GOVERNMENT SOUTH ATLANTIC REGIONAL GOVERNMENT REGIONAL NORTH ATLANTIC COUNCIL REGIONAL NORTH ATLANTIC COUNCIL
I STATISTICAL ANNEX TABLE 63: AVERAGE GROSS MONTHLY WAGE BILL, BY INSTITUTION (C$) [ 1- A m 0 Z l 2 W f n * 2>.'#$&! i , i , -d* ~',2@0gl
627,413
989,425
263

Statistical Annexes
hlCARAGbAh fhSTITLTE OF TERRlrOR~AL STUDIES hlCARAGLAN IYST TJTE OF STAD STICS AND CENSUS hlCARAGkAh hST TJTE OF SPORTS AND YOUTn NlrARAGllAk hOMFlu INST TbTE - . _ _ - - - . - NICARAGUAN ERERGV IhSTlTJTE hlCARAG-Ak hST TLTE OF WATER AND SEWER4GE hlCARAGLAN SOC~AL SFZJRITY IhSTlTJTE I\ CARAG 'Ah R RA D-VE Opt l E N l lhST TITE NICARAGUAN INSTITUTE OF HOUSING AND URBAN DEVELOPMENT NICARAGUAN INSTITUTE OF SME SUPPORT NICARAGUAN TOURISM INSTITUTE NATIONAL AGRICULTURAL TECHNOLOGY INSTITUTE NICARAGUAN AGRICULTURE AND FOREST INSTITUTE INTERNAL REVENUE D~RECTORATE NATIONAL CUSTOMS DIRECTORATE NICARAGLJAN RADIO NATIONAL TEATHER HUMANS RIGHTS ATTORNEY'S OFFICE
,k.VERSIT ES PUBLIC FINANCIAL INSTITUTIONS
SGdTh ATLAhT C SE.SOhA, GOLERtVldElT REGiOhA.. 1 9 R T q A T A h - C COJ\.C i
I REGIONAL NORTH ATLANTIC COUNCIL I
264