THE REPUBLIC OF KENYA MEDIUM TERM EXPENDITURE ...
164
THE REPUBLIC OF KENYA MEDIUM TERM EXPENDITURE FRAMEWORK REPORT FOR GENERAL ECONOMIC AND COMMERCIAL (GECA) AFFAIRS SECTOR NOVEMBER 2017
-
Upload
khangminh22 -
Category
Documents
-
view
1 -
download
0
Transcript of THE REPUBLIC OF KENYA MEDIUM TERM EXPENDITURE ...

THE REPUBLIC OF KENYA
MEDIUM TERM EXPENDITURE FRAMEWORK
REPORT FOR GENERAL ECONOMIC AND
COMMERCIAL (GECA) AFFAIRS SECTOR
NOVEMBER 2017

ii

i | P a g e
LIST OF ACRONYMS
ACA Anti –Counterfeit Agency
ACU AIDS Control Unit
ADB African Development Bank
AGAs Autonomous Government Agencies
AGOA African Growth and Opportunity Act
AIA Appropriation in Aid
AIDS Acquired Immuno Deficiency Syndrome
AIE Authority to Incur Expenditure
ASAL Arid and Semi-Arid lands
ASK Agricultural Society of Kenya
ASMEP Assistance to Micro and Small Enterprise Programme
BDS Business Development Services
BICs Business Information Centres
BIS Business Incubation Services
BPO Business Process Outsourcing
BPRT Business Premises Rent Tribunal
BQs Bill of Quantities
BROP Budget Review and Outlook Paper
BSCs Business Solution Centres
BSPS Business Sector Programme Support
CABs Conformity Assessment Bodies
CAMI Council on African Ministers for Industry
CAMS Computerized Audit Management System
CBA Collective Bargaining Agreement
CBOs Community Based Organizations
CDA Coast Development Authority
CET Common External Tariffs
CIDC Constituency Industrial Development Centres
CMF Common Manufacturing Facilities
CMP Common Market Protocol
CNC Computer Numerical Controlled
COMESA Common Market for Eastern and Southern Africa
CSOs Civil Society Organizations
CTDLT Catering and Tourism Development Levy Trustees
DANIDA Danish International Development Agency
DBSCs District Business Solution Centres
DDA Doha Development Agenda
DFID Sub-sector for International Development
DIT Directorate of Industrial Training
EA East Africa
EAA East African Affairs
EAACT East African Affairs, Commerce and Tourism
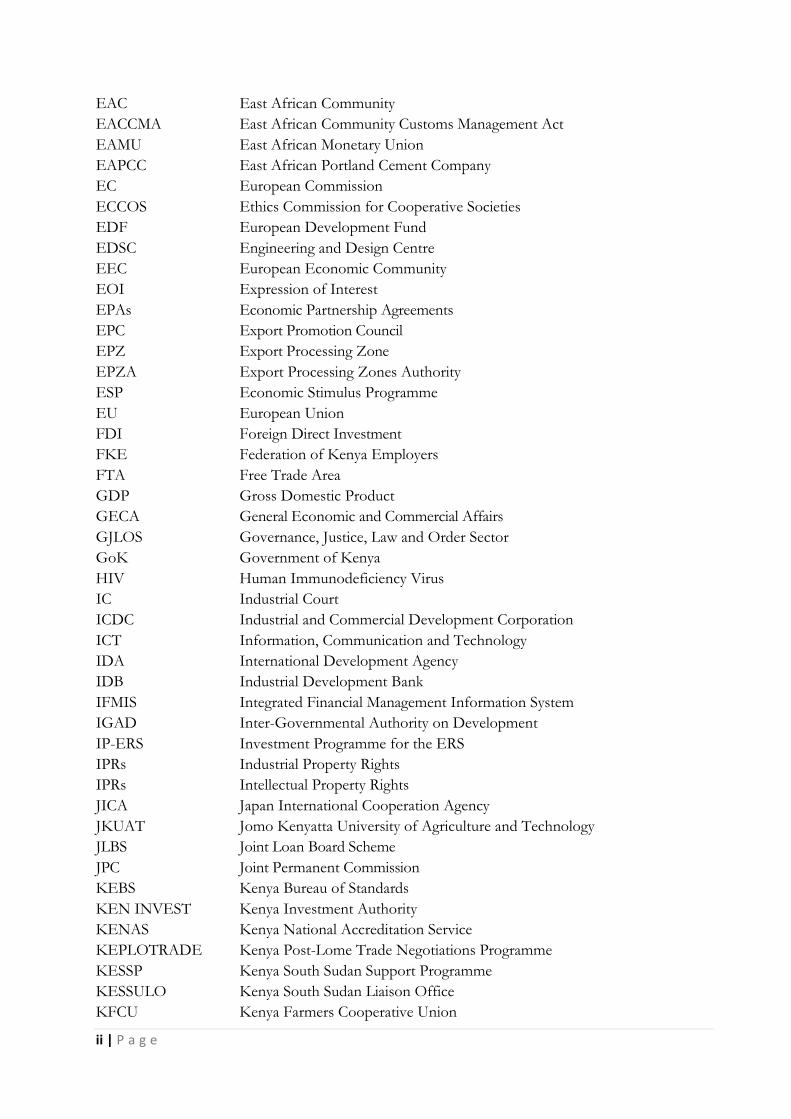
ii | P a g e
EAC East African Community
EACCMA East African Community Customs Management Act
EAMU East African Monetary Union
EAPCC East African Portland Cement Company
EC European Commission
ECCOS Ethics Commission for Cooperative Societies
EDF European Development Fund
EDSC Engineering and Design Centre
EEC European Economic Community
EOI Expression of Interest
EPAs Economic Partnership Agreements
EPC Export Promotion Council
EPZ Export Processing Zone
EPZA Export Processing Zones Authority
ESP Economic Stimulus Programme
EU European Union
FDI Foreign Direct Investment
FKE Federation of Kenya Employers
FTA Free Trade Area
GDP Gross Domestic Product
GECA General Economic and Commercial Affairs
GJLOS Governance, Justice, Law and Order Sector
GoK Government of Kenya
HIV Human Immunodeficiency Virus
IC Industrial Court
ICDC Industrial and Commercial Development Corporation
ICT Information, Communication and Technology
IDA International Development Agency
IDB Industrial Development Bank
IFMIS Integrated Financial Management Information System
IGAD Inter-Governmental Authority on Development
IP-ERS Investment Programme for the ERS
IPRs Industrial Property Rights
IPRs Intellectual Property Rights
JICA Japan International Cooperation Agency
JKUAT Jomo Kenyatta University of Agriculture and Technology
JLBS Joint Loan Board Scheme
JPC Joint Permanent Commission
KEBS Kenya Bureau of Standards
KEN INVEST Kenya Investment Authority
KENAS Kenya National Accreditation Service
KEPLOTRADE Kenya Post-Lome Trade Negotiations Programme
KESSP Kenya South Sudan Support Programme
KESSULO Kenya South Sudan Liaison Office
KFCU Kenya Farmers Cooperative Union

iii | P a g e
KIBT Kenya Institute of Business Training
KICC Kenyatta International Convention Centre
KIE Kenya Industrial Estates
KIPI Kenya Industrial Property Institute
KIRDI Kenya Industrial Research and Development Institute
KITC Kisumu Industrial Training Centre
KITI Kenya Industrial Training Institute
KLDC Kenya Leather Development Council
KNTC Kenya National Trading Corporation
KRA Kenya Revenue Authority
KSLH Kenya Safari Lodges and Hotels limited
KTB Kenya Tourism Board
KTDC Kenya Tourist Development Corporation
KTTI Kenya Textile Training Institute
KUC Kenya Utalii College
KVDA Kerio Valley Development Authority
KWAL Kenya Wine Agencies Limited
KWRC KIRDI Western Region Centre
LAPSSET Lamu Port Southern Sudan Ethiopia Transport
LDC Leather Development Centre
M&E Monitoring and Evaluation
MDGs Millennium Development Goals
MICE Meetings, Incentive, Conferences and Exhibitions
MITC Mombasa Industrial Training Centre
MoIED Ministry of Industrialization and Enterprise Development
MoU Memorandum of Understanding
MSE Micro and Small Enterprises
MSEA Micro and Small Enterprises Authority
MSMEs Micro, Small and Medium Enterprises
MSMIs Micro, Small and Medium Industries
MTEF Medium Term Expenditure Framework
MTP Medium Term Plan
NCSE National Council for Small Enterprises
NCWTO National Committee on World Trade Organization
NEMA National Environmental Management Authority
NEPAD New Partnership for Africa’s Development
NGO Non-Governmental Organization
NIP National Industrialization Policy
NITC National Industrial Training Council
NIVTC National Industrial and Vocational Training Centre
NKCC New Kenya Cooperative Creameries
NMC Numerical Machining Complex
NOCK National Oil Corporation of Kenya
NORICEMAC North Rift Cereal Marketing Cooperative
NQF National Qualification Framework

iv | P a g e
NSSF National Social Security Fund
NTBs Non-Tariff Barriers
O&M Operation and Maintenance
OVOP One Village One Product
PAS Performance Appraisal System
PBB Programme Based Budgeting
PBGs Producer Business Groups
PCK Productivity Centre of Kenya
PER Public Expenditure Review
PPP Public Private Partnership
PPR Programme Performance Review
R&D Research and Development
RDAs Regional Development Authorities
RECs Regional Economic Communities
SACCO Savings and Credit Co-operatives
SADC Southern Africa Development Corporation
SAGAs Semi-Autonomous Government Agencies
SASRA Sacco Society Regulatory Authority
SEZ Special Economic Zones
SEZA Special Economic Zones Authority
SME Small and Medium Enterprise
SMI Small and Medium Industry
STABEX Stabilization of Export Earning
TARDA Tana and Athi River Development Authority
TF Tourism Fund
TFC Tourism Finance Corporation
TRA Tourism Regulatory Authority
TRI Tourism Research Institute
TSA Tourism Satellite Account
TTF Tourism Trust Fund
TVET Technical Vocational Education and Training
UNDP United Nations Development Programme
UNESCO United Nations Education Social and Cultural Organization
UNPF United Nations Population Fund
UNWTO United Nations World Tourism Organization
USA United States of America
USAID United States Agency for International Development
VAT Value Added Tax
W&M Weights and Measures
WB World Bank
WTO World Trade Organization

v | P a g e
EXECUTIVE SUMMARY
The General Economic and Commercial Affairs (GECA) Sector budgetary categorization
integrates together five sub-sectors namely; Investment and Industry, Cooperatives Development,
Trade, East African Community Integration and Tourism. The sector aims at creating employment
opportunities and wealth creation for poverty reduction, overseeing the fast tracking of the regional
integration initiatives and promotion of equity among the Kenyan citizens in line with the sector
vision to “have a globally competitive economy with sustainable and equitable socio-economic
development”. This is expected to be achieved through creating an enabling environment for
business, mobilization of resources for investments and industrial development; promotion of
exports; promotion of sustainable tourism; and deepening of the EAC integration.
The Sector plays a critical role in the realization of the targets of the economic pillar of Vision 2030
through implementation of programmes/projects which are guided by the Third Medium Term
Plan (MTP III) and the Sector plans. It also take cognizance of Africa’s aspirations as outlined in
the African Agenda 2063 and its first ten year implementation plan, the Agenda 2030 on
Sustainable Development Goals and the Paris Agreement on Climate Change. The Sector’s
contribution to the Country’s GDP is considerable and approximated to be around 30% despite
getting only about 1.2% of the total Budget allocation. The MTEF budgeting process anchored on
Project/Programmes based Budgeting (PBB) will ensure that the MTP III 2018-2022 of the Vision
2030 is implemented within the budgetary constraint.
The Sector report is divided into four main chapters with brief conclusion and recommendations.
Chapter one(1) gives the background information of the sector and the sub-sectors, vision and
mission, goals and objectives, the mandates of the sub-sectors, the SAGAs within the sector and
the stakeholders’ analysis. The general mandates for the sector are promotion and development
trade, tourism, industrialization and entrepreneurship, innovation, savings mobilization and
investment and regional integration among others.
In Chapter two (2) the performance expenditure review is presented giving details of how the
sector performed visa a vie the budget allocation for the financial year under review. It highlights
the programme projects achievement against the planned targets. The chapter also indicates the
cumulative expenditures on projects against the budget allocations. Most projects recorded
improvement but a good number have been brought forward due to inadequate funding and
budget cuts.
Chapter three (3) covers the prioritization of programmes/projects for MTEF period 2018/19-
20/21 and analysis of the resource requirement verses allocations. The programmes prioritized for
the MTEF period are; Promotion of Industrial Development and Investment; Standards and
Business Incubation; Cooperative Development and Management; Trade Development, Tourism
Development and Promotion and regional Integration. The implementation of the sector
programmes would require around Kshs. 26,038B for financial 2018/18against the current
allocation of at Kshs. 7,1148B only.
Chapter four elaborates on the inter-relationships between GECA sector and other sectors and
how the linkages cut across the three pillars of the vision 2030 with focus on promoting balanced

vi | P a g e
sustainable socio- economic growth and development. It highlights the emerging issues such as
inadequate funding for newly established institutions, travel advisory among other. Challenges
identified include insecurity, under developed infrastructure, limited access to credit facilities and
financial services, inadequate funding of projects and programmes, climate change among others.
The report suggests recommendations to address the challenges highlighted that would help sector
achieve its strategic goals and by extension the Kenya vision 2030. The recommendations includes
enhanced funding for the Sector to at least 4% of the national budget; the National Land
Commission and County Governments to establish land banks for industrial, commerce and
tourism development; fast track the development of Public Private Partnerships (PPPs) regulations
to mitigate against budgetary constraints in capital intensive projects; expansion, modernization and
maintenance of infrastructure and ICT networks in areas with high potential for the Sector’s
development and enhance Security.

vii | P a g e
Table of Contents LIST OF ACRONYMS ....................................................................................................................................... i EXECUTIVE SUMMARY ............................................................................................................................... v Table of Contents .............................................................................................................................................. vii CHAPTER ONE: ............................................................................................................................................... 9 1. INTRODUCTION ................................................................................................................................... 9 1. Background ......................................................................................................................... 9
1.2. Sector Vision and Mission .................................................................................................. 9
1.3. Strategic goals and objectives of the Sector...................................................................... 10
1.4. Sub Sectors and their Mandates ........................................................................................ 10
1.4.1. Investment and Industry .................................................................................................... 11
1.4.2. Co-operatives ..................................................................................................................... 11
1.4.3. Trade ................................................................................................................................. 11
1.4.4. East Africa Community Integration ................................................................................... 11
1.4.5. Tourism ............................................................................................................................. 12
1.5. Autonomous and Semi-Autonomous Government Agencies ........................................... 12
1.6. Role of Sector Stakeholders/Stakeholders Analysis ......................................................... 13
CHAPTER TWO .............................................................................................................................................. 16 2. PROGRAMME PERFORMANCE REVIEW 2014/15 – 2016/17 .............................................. 16 2.0. Overview of Sector Performance .......................................................................................................... 16 2.1. Review of Sector Programme Performance ......................................................................................... 20 2.2. Analysis of Expenditure Trends ............................................................................................................. 53 Table 2.2: Analysis of Recurrent Expenditure by Sub-Sector and Vote ............................................ 55
2.3. Analysis of Development Expenditure by Sub-Sector and Vote ..................................................... 56 2.4. Analysis of Programme /Sub-Programme Expenditure by Sector and Vote................................. 58 2.5. Programme Expenditure Analysis by Economic Classification........................................................ 61 Table 2.5: Programme Expenditure Analysis by Economic Classification (Kshs. Millions) .............. 61
2.6. Analysis of performance of capital projects FY 2014/15-2016/17 ................................................. 63 Table 2.6: Analysis of Performance of Capital Projects FY 2014/15-2016/17 (Kshs. Million) ......... 63
2.7. Review of Pending Bills ........................................................................................................................... 78 Table 2.7: Summary of Pending Bills by Nature and Type (Kshs. Million) ....................................... 79
CHAPTER THREE ......................................................................................................................................... 81 3. MEDIUM TERM PRIORITIES AND FINANCIAL PLAN FY2018/19– 2020/21 ................ 81 3.1. Prioritization of Programmes and Sub-Programmes .......................................................................... 81 3.1.1. Programmes and their objectives ...................................................................................... 81
3.1.2. Programmes,Sub-Programmes, Expected Outcomes, Outputs and Key performance Indicators
(KIPs) ................................................................................................................................ 82
Table 3.1: Programmes/ Sub Programmes, outcomes, outputs and Key Performance Indicator (KIPs) for
the sub-sector ..................................................................................................................... 82
3.2. Analysis of Resources Requirement versus Allocation by Sector/Sub-sector .............................. 118 3.2.1. Analysis of Programmes and Sub-Programmes (Current and Capital) Resource Requirement
and Allocations of Resource ........................................................................................... 119
3.2.2. Programmes and Sub-Programmes by economic classification .................................... 126
3.4. Resource Allocation Criteria ................................................................................................................. 150 CHAPTER FOUR: ......................................................................................................................................... 151 4. CROSS-SECTOR LINKAGES AND EMERGING ISSUES/CHALLENGES ..................... 151 4.1. Emerging Issues and Challenges .................................................................................... 153
4.2. Emerging Issues .............................................................................................................. 155

viii | P a g e
CHAPTER FIVE ............................................................................................................................................ 156 5. CONCLUSION ..................................................................................................................................... 156 CHAPTER SIX ................................................................................................................................................ 157 6. RECOMMENDATIONS .................................................................................................................... 157

9 | P a g e
CHAPTER ONE:
1. INTRODUCTION 1. Background
The General Economic and Commercial Affairs (GECA) Sector integrates both product and service
industries. The sector comprise of five sub-sectors namely, Investment and Industry, Cooperatives
Development, Trade, East African Community Integration and Tourism. The sector plays a critical
role in job and wealth creation, infrastructure development through industrial development,
investments and promotion of trade, tourism development, savings mobilization and regional
integration, while observing the need for a clean environment. The sector’s contribution towards the
Economy is substantial and is estimated to be 30% of the Country’s GDP.
The Medium Term Expenditure Framework (MTEF) 2018/2019 -2020/2021 is being prepared
concurrently with the third Medium Term Plan 2018 -2022 (MTP III). This is in line with the
constitutional requirement that the budget process should be guided by a development plan. The
implementation of the sector programmes/projects is informed by the Kenya development blue
print, Kenya Vision2030, the Africa Agenda 2063 and Agenda 2030 on Sustainable Development.
The sector is also guided by the regional and international commitments.
The sector’s priorities for the MTEF period are be to increase tourist arrivals and earnings, industrial
development, improving trade and ease of doing business promotion, mobilize savings and widen
credit facility for investments and promote regional integration. This is intended to contribute to the
attainment of the desired sustainable economic growth of 10% p.a. in line with the country’s
development agenda of attaining newly industrialized nation providing high quality of life for all its
citizens.
The Project/Programmes based budgeting (PBB) for MTEF ensure that the MTP III will be implemented with focus to the sector achieving its strategic goals. The achievements, challenges and lessons learnt during the implementation of the MTP II have informed the preparation of the MTP III, especially where there is need for improvement or new strategies to be employed. The same will apply to the preparation of MTEF 2018/19 -2020/21 to ensure prudence in utilization and absorption of resources.
1.2. Sector Vision and Mission
Sector Vision
“A globally competitive economy with sustainable and equitable socio-economic development”
Sector Mission

10 | P a g e
“To promote, co-ordinate and implement integrated socio-economic policies and programmes for a
rapidly industrializing economy”
1.3. Strategic goals and objectives of the Sector
a. Strategic Goals
The GECA Sector strategic goals are aligned towards the promotion and development of domestic
and regional trade, regional integration, industrialization, cooperatives and tourism. The strategic
goals for the sector are to:
i. Have sustainable growth and development of trade
ii. Have vibrant and sustainable tourism industry
iii. Have a competitive cooperative movement
iv. Have sustainable industrial and entrepreneurship development
v. Deepen Kenya’s participation in an integrated EAC
vi. Create wealth and employment
vii. Build capacity for development of the Sector
b. Strategic Objectives
The sector focuses on the following strategic objectives to achieve its goals as outlined in the Kenya
Vision 2030, Second Medium Term Plan III (2018-2022);
i. To undertake policy, legal and institutional reforms for the development of the sector;
ii. To promote research and development (R&D) and adoption of innovation and
technologyto support growth and development of domestic and regional trade;
iii. To promote regional co-operation and integration;
iv. To mobilize Savings for investment, enhance business environment and promote micro,
small and medium enterprises;
v. To broaden and deepen export markets and products market access;
vi. To improve governance and accountability in the cooperative movement;
vii. To promote value addition, standardization, product diversification and productivity
improvement;
viii. To develop and promote sustainable tourism; and
ix. To mobilize savings and investment resources for industrial and enterprise development
1.4. Sub Sectors and their Mandates
The GECA sector has the following subsectors namely; Investment and industry; Co-operatives
Development; Trade; East African Community Integration; and Tourism. The mandates of the sub-
sectors are as listed below.

11 | P a g e
1.4.1. Investment and Industry
Industrial Policy and Planning
Value Addition and Agro-Processing
Investment promotion policy and facilitation
Kenya Property Rights Policy (Patents, Trade Marks, Service Marks and Innovation)
Textile sector development
Leather sector development
Ease of doing business
Special economic zones and Industrial Parks
Industrial training and capacity development
Enterprise development and innovation
SME policy and development
SME Training
Quality control including industrial standards.
1.4.2. Co-operatives
Co-operative policy, standards and implementation
Co-operative Financing Policy
Co-operative Savings, Credit and other Financial Services Policy
Co-operative legislation and support Services
Co-operative education and training
Co-operative Production, Marketing and Value Addition
Promotion of Co-operative Ventures
Co-operative Audit services
Supervision and oversight of co-operative societies
1.4.3. Trade
Trade Policy
Buy Kenya Policy
Promotion of Retail and Wholesale Markets
Exports promotion
Fair Trade Practices
Coordination of Regional Trade matters – COMESA, AGOA, IORA & IGAD
Trade Negotiations and Advisory Services
Enforcement of International Trade Laws, Registrations and Agreements
1.4.4. East Africa Community Integration
Policy on East African Community
East African Community Affairs

12 | P a g e
Implementation of the East African Community Treaty
Coordination of implementation of EAC Regional Programmes and Projects
Promotion and fast tracking of EAC Integration
Coordination of Government’s participation in East African Community Affairs
East African Community meetings and institutions.
1.4.5. Tourism
Tourism Policy and Standards
Development and Promotion of tourism
Tourism research and monitoring
Protection of tourism and regulation
Tourism financing
Training on tourism services
Marketing Kenya for local and international tourist
1.5. Autonomous and Semi-Autonomous Government Agencies
The Sector has thirty one (31) Semi-Autonomous Government Agencies and Parastatals that
operate independently but financed through the relevant Ministries which include:
1. Tourism Regulatory Authority(TRA)
2. Kenya Tourism Board (KTB)
3. Tourism Finance Corporation (TFC)
4. Kenya Utalii College (KUC)
5. Kenyatta International Convention Centre (KICC)
6. Tourism Fund (TF)
7. Tourism Research Institute (TRI)
8. Bomas of Kenya (BoK)
9. Tourism Protection Services
10. Kenya Safari Lodges and Hotels
11. Export Promotion Council (EPC)
12. Kenya National Trading Corporation (KNTC)
13. Anti-Counterfeit Agency (ACA)
14. Brand Kenya Board(BKB)
15. Export Processing Zones Authority (EPZA)
16. East African Portland Cement Company(EAPCC)
17. Industrial and Commercial Development Corporation (ICDC)
18. Kenya Bureau of Standards (KEBS)
19. Kenya Industrial Estates (KIE)
20. Kenya Industrial Property Institute (KIPI)
21. Kenya Industrial Research and Development Institute (KIRDI)

13 | P a g e
22. Kenya Investment Authority (Ken Invest)
23. Kenya Leather Development Council (KLDC)
24. Kenya National Accreditation Services (KENAS)
25. Micro and Small Enterprises Authority (MSEA)
26. Numerical Machining Complex (NMC)
27. Special Economic Zones Authority (SEZA)
28. Industrial Development Bank Capital Limited (IDB)
29. New Kenya Cooperative Creameries (NKCC)
30. Sacco Society Regulatory Authority (SASRA)
1.6. Role of Sector Stakeholders/Stakeholders Analysis
The Sector cooperates and collaborates with different stakeholders across the economy. These
comprise both the internal and external customers whose engagements are essential to formulation
of policies, implementation, monitoring and evaluation of programmes and projects as well as
promotion and development of the sector. They range from public sector institutions, private sector,
Civil Society Organisations, Regional Trading Blocs and Development Partners.
The table below illustrates the sector stakeholders and their roles:
S/NO. STAKEHOLDER ROLES OF THE STAKEHOLDER
1
The Presidency Provides the general leadership and political goodwill
Assents to Bills
Release the Executive Order that give Sub-sector’s
Mandates and core functions.
2 Cabinet Policy formulation, approval and guidance
Provision of leadership and good governance
Setting of Sector priorities
Approval of Cabinet Memoranda.
3 Cabinet Secretaries Overseeing the overall running of the Ministries
Adherence to budget allocation
Approval sector plans and oversee its implementation.
4 Principal Secretaries Ensure proper accountability of State Departments’ funds
Overseeing the implementation of programmes and
projects in the State Department.
5 The National Treasury Provide guideline and leadership in the budget making
process
Timely release of funds as per budget allocation
Resource mobilization
Management of the national budget.
6 Government Ministries, Policy formulation and generation of national development

14 | P a g e
S/NO. STAKEHOLDER ROLES OF THE STAKEHOLDER
sub-sectors and Agencies
agenda
Implementation of Government programmes and projects
Monitoring and evaluation of programmes and projects
Provision of public security, enabling legal and regulatory
frameworks (Police service, Judiciary and AG’s Office)
Resource mobilization.
7 County Governments Policy formulation and generation of county development
agenda
Collaboration in implementation of county programmes
and projects
Monitoring and Evaluation
Resource mobilization.
6 Parliament Legislation of laws
Review and Approval of the Budget
Provision of oversight in the implementation of the Budget.
7 Regional Economic and Trading Blocs
Harmonization of policies, standards and regulations
Provide accessibility to a wider range of products and
services and offer wider markets
Free movement of factors of production
8 EAC partner states Ratifying and implementing appropriate Treaties and
Protocols
Reciprocity
Ensuring consistency and clarity on policy issues.
9 Development Partners Resource mobilization
Provide technical and financial advisory services
Capacity building and creation of synergies.
10 Private Sector Advocacy for improvement of business environment
Creation of wealth and employment
Formulation and implementation of various sectoral
policies on development of industry, trade, tourism and
cooperatives
Joint Public-Private Partnership initiative for sustainable
development and investments
Provision of business information, quality goods and
services and self-regulation within the business community.
11 Civil Society Creates consumer rights awareness and protection
Contributes to policy formulation and play oversight role in
implementation process

15 | P a g e
S/NO. STAKEHOLDER ROLES OF THE STAKEHOLDER
Supports sensitization and advocacy on various sectoral
matters.
12 Education and Research Institutions
Provide information to guide policy formulation for skills
and knowledge development
Market intelligence information provision and broaden
product base
Develop innovations and technologies for value addition
Adaptation and transfer of appropriate technologies
Development of curriculum and educational standards
13 Media Dissemination of Government policies and Information
Public awareness creation
Play the role of watchdog.
14 Commission on Revenue allocation
Ensures equitable allocation of revenue raised nationally
between National and County Government and amongst
the County Governments.
15 The General Public Participates in public consultation forums
Ownership and beneficiaries of the Programmes and
projects.

16 | P a g e
CHAPTER TWO
2. PROGRAMME PERFORMANCE REVIEW 2014/15 – 2016/17
2.0. Overview of Sector Performance During the financial years under review, the Sector implemented seven (7) programmes and twenty
seven (27) sub-programmes and the following is an overview of the Sector’s performance:
Industry and Investment
During the period under review the sector put in place measures to create a conducive environment
for investment and industrial development. Subsequently, Kenya was ranked as the 3rd most
improved economy globally and the 1st in Africa as per the World Bank Report on Ease of Doing
Business for two consecutive years moving from position 136 in 2014 to position to 92 in 2017.
Further, the sector spearheaded the enactment of the Special Economic Zones (SEZ) Act and
developed the Master plan for the Dongo Kundu SEZ in Mombasa.
To address the specific sectors’ needs, the sector is developing the requisite infrastructure at Athi
River Textile hub which is 80% complete, Kinaine Leather Park is at 12% complete and
Modernization of Rivatex is at 60%. The infrastructure development is expected to attract
investors in the textile and leather industry upon completion. In addition, construction and
equipping of the research, technology and innovation laboratories at KIRDI Kisumu is at 70%
and the KIRDI South B laboratory is at 62% complete.
Co-operative
The Sector disbursed Kshs.700 Million towards the settlement of debts owed to nine (9) coffee
cooperative unions and seventeen (17) rural SACCOs by primary co-operative societies and
individual coffee farmers to revitalize the coffee sector. The Sector also cleared Kshs.1.7 Billion
coffee STABEX Fund owed to Cooperative Bank which was advanced to farmers as Farm Input
Loans (FILS). The debt waivers have enabled Coffee Cooperative Unions build new Coffee mills
which have subsequently increased their efficiency, thereby reducing milling losses from 30% to
19%. As a result, farm level prices have increased from Kshs 45 to Kshs 60 per kilo. In addition,
Kshs.442.40 million of the Kshs.500 Million owed to dairy farmers by the defunct Kenya Co-
operative Creameries has been disbursed.
The sector provided funds to modernize New KCC plants and factories in various parts of the
country which have been using obsolete milk processing machines. A total of Kshs.770 Million was
disbursed during the F/Y 2016/17 for installation of the modern machines at Eldoret, Dandora,
Nyahururu and Sotik plants. This has increased the processing efficiency and capacity of NKCC
from 110,000L/day to 300,000L/day, increased farmers’ earnings from Kshs. 23 to Kshs 35 per
litre and increased number of farmers served by the New KCC from 18,049 to 21,000.

17 | P a g e
Savings mobilized by cooperatives increased by Kshs.43 Billion from Kshs.594 Billion in 2016 to
637 Billion in June 2017. The Sector also allocated funds to SASRA to establish a Risk Based
Supervision system (RBS) that will enhance its capacity to carry out real time supervision and
interventions to safeguard members’ savings.
Trade
Trade Sector recorded improved performance in the last few years with focus geared towards
forming partnerships in trade and investment. Since launching its Commercial Diplomacy agenda,
with enhanced focus on promoting international trade and investments through Kenya Missions
abroad, value of Kenyan exports increased from Kshs. 502 billion in 2013 to Kshs. 578 billion in
2016 reflecting a 15 per cent (%) increment. In addition, the sector attracted Foreign Direct
Investments (FDI) amounting to Kshs 509 billion as FD I over the review period.
In 2016, Kenya’s balance of trade improved from a deficit of Kshs. 996 billion recorded in 2015 to a
deficit of Kshs. 853 billion. The value of imports to the country declined from Kshs. 1,577 billion to
Kshs. Kshs. 1432 billion in 2016 reflecting a 9.2 per cent (%) decline. The leading export earners
included tea, horticulture, articles of apparel and clothing accessories, coffee, titanium, tobacco, iron
and steel which collectively accounted for 63% of the total export merchandise in 2016. On the
domestic front, domestic trade grew from Kshs.473 billion in 2015 to Kshs.520 billion in 2016
reflecting a growth of 10%. The Sector developed Buy Kenya-Build Kenya Strategy to stimulate
local consumption and production of locally produced goods.
The sector promoted fair trade practices and consumer protection by ensuring standardized
weights/measurements and enforcing laws on Intellectual Property Rights and counterfeits. The
sector is at an advanced stage of establishing the Kenya Commodities Exchange (KOMEX) whose
aim is to address challenges faced by farmers/producers due to market inefficiencies leading to
exploitation by middlemen.
East African Community and Integration
During the review period, tremendous achievement was realized in the implementation of the
Customs Union (CU) provisions with on establishment of the Single Customs Territory (SCT) and
consolidation of gains thereof. However, exports to the EAC region which account for a quarter of
Kenya’s total exports, decreased marginally from Kshs. 125 billion in 2013 to Kshs. 122 billion in
2016. To reverse the trend, the Sector resolved 116 NTBs over the review period which had
impacted negatively on Kenya's exports to the region.
Further, One Network Area was introduced in October 2014 to harmonize tariffs on mobile voice
calls, SMS and data transmission within the EAC. This has led to a at least 400 per cent increase in
the volume of calls, which has improved communication and ease of doing business. The
negotiations on East Africa Community-European Union Economic Partnership Agreement (EAC-
EU EPA) were concluded and the Agreement Text initialed on 14th October 2014 in Brussels,
Belgium. The Agreement has been signed and ratified by Kenya and Rwanda.

18 | P a g e
The EAC Monetary Union (EAMU) Protocol was signed on 30th November 2013 in Kampala,
Uganda and ratified by Partner States in February 2015. During the period, the process of laying the
foundation for the Monetary Union was initiated. These included the establishment of the East
African Statistics Bureau (EASB), East African Monetary Institute (EAMI) and the East African
Surveillance, Compliance and Enforcement Commission (EASCEC). The Bills on establishment of
the EASB and the EASCEC were concluded, adopted and submitted to East African Legislative
Assembly (EALA) for consideration and enactment. A study to inform the development of the Bill
on Financial Services Commission was validated.
Tourism
The year 2016 marked the rebound of the tourism sector. The lifting of travel restrictions to Kenya
by USA, UK, France and Germany provided the much needed impetus to put the sector firmly on
the recovery trajectory. Earnings from the tourism sector improved by 17.8% from Kshs 84.6 billion
in 2015 to Kshs 99.7 billion in 2016. Similarly, the number of international visitor arrivals rose by
13.5% from 1.18Million in 2015 to 1.34 Million in 2016. Similarly the bed nights occupied by
domestic tourists grew by 9.3% to 2.95 million in 2014, 6.8% in 2015 to 3.15 Million and 10.8% in
2016 to 3.5 Million.
The Meetings Incentive Conferences and Exhibitions (MICE) recorded increased numbers from
71,620 delegates in the year 2015/16 to 101,599 international delegates in 2016/17 especially in the
wake of the high profile international conferences like the UNCTAD and TICAD VI held in
Nairobi.
The sector developed a National Tourism Blueprint 2030 which will ensure the competitiveness and
sustainability of the industry. Additionally, reports on the establishment of a National Convention
Bureau and the Tourism Protection Services were developed. The sector disbursed loans at
concessionary rates for refurbishments and construction of 3 tourism facilities.
The sector undertook inspection of tourist establishment and graded a total of 265 tourism facilities
star rated between 1-5 star. Regulations and standards to guide the development of a critical mass of
well trained personnel for the industry were also drafted. In line with this, the Kenya Utalii College
introduced two degree programmes in Hospitality Management and Travel & Tourism Management.
The number of graduates who pursued various courses at KUC stood at,350 in 2014, 2,324 in 2015
and 2,664 in 2016. The sector commenced the construction of the Practical Training Block
(laboratory) at KUC and while the construction of Ronald Ngala Utalii College in Kilifi is 47%
complete.

19 | P a g e

20 | P a g e
2.1. Review of Sector Programme Performance Table 2.1: Sector Programme Performance Review
Sub-programme Key Outputs Key performance
indicators
Planned Targets Achievement Remarks
2014/15 2015/16 2016/17 2014/15 2015/16 2016/17
State Department for Investment and Industry Programme 1: Promotion of Industrial Development and Investment
SP 1.1 Promotion of Industrial development
Development of Freeport and Industrial Parks(Special Economic Zones in DongoKundu, Mombasa)
Acres of land acquired and Resettlement of Squatters
Acquire land for SEZ in Mombasa
Resettlement Action Plan (RAP) and squatters settlement
Resettlement Action Plan (RAP) and squatters settlement
3000 acres SEZ acquired
RAP not implemented
RAP not implemented
Land acquired but squatters not yet resettled Inadequate financing to resettle the squatters
SEZ law enacted Enact the SEZ Bill in to law
Enact the SEZ Bill into law
Operationalize the SEZ Authority
Draft Special Economic Zones Bill developed
SEZ Bill enacted into law and came into force on 15th December, 2015
SEZ Board operationalized, Regulations 2016 enacted
Funds required for staff recruitment, office accommodation and other operational expenses
SEZ Master plan and SEA developed
Strategic environmental assessment (SEA) in place
Master-planning for the DongoKundu
Operationalize the SEZ Authority
The SEA undertaken
Mombasa SEZ master plan finalized and adopted
Marketing strategy developed and promotion done in 3 countries
Identification of private developer for infrastructure development under PPP framework is ongoing
Development of the integrated iron and Steel Mill
Feasibility study on Iron Ore
Feasibility study
N/A N/A Feasibility study report completed
National steering and Technical working committee inaugurated
N/A Funds required to implement the feasibility study report Suitable land is required

21 | P a g e
Sub-programme Key Outputs Key performance
indicators
Planned Targets Achievement Remarks
2014/15 2015/16 2016/17 2014/15 2015/16 2016/17
Increase in production of engineering materials & alloy steels
Amount in tonnes of Production of castings
200
210
200 92
79
80 Inadequate funding for the Foundry and fabrication workshop
No. of transmission parts produced
5,500
9,000 9000 7,305
6146
6506
Improved business environment in Kenya (Ease of Doing Business) Programme
Global ranking index in the doing business ranking (no)
139 133 90 129 108 92 Progress attained due to Interagency collaboration Private sector has supported the uptake of the business reforms
Leather sector development - Kenanie leather park
Basic infrastructure for Leather park in place (precast wall, water supply boreholes, internal roads, Common Effluent Treatment Plant (CETP), administration office and power supply)..
-Land identification and profiling
-Undertake Master planning and feasibility study Undertake Strategic environment assessment (SEA)
-Construction of 0.7 Kms Road Drilling & equipping of 3 boreholes Precast fencing of the site Construction of the site office Designing and development of CETP
-500 acres of land profiled & acquired at Kinanie, Athi River -Surveying & titling of the land
- Master plan and feasibility study Reports SEA report
-0.7 km of internal roads cleared Drilled and equipped3 Boreholes Fencing ongoing at 75% complete. Site office completed CETP designed & construction on-going
The total project cost is Kshs. 4.24 Billion out of which less than 30% has been allocated.

22 | P a g e
Sub-programme Key Outputs Key performance
indicators
Planned Targets Achievement Remarks
2014/15 2015/16 2016/17 2014/15 2015/16 2016/17
Construction of Textile Hub at Athi River
Construction of industrial sheds and basic infrastructure
Transaction Advisory & Statutory Approvals for Textile and Apparel sector -Master-planning, Physical Planning -Statutory Approvals (NEMA, NLC, NCA)
Construct 120,000 sqm industrial sheds -12.1 km of internal roads -8.3km of reticulation
-Construct 120,000 sqm industrial sheds -12.1 km of internal roads -8.3km of reticulation water supply and 6500 m3
-Approval granted -Feasibility study and -master plan report
-Construction of industrial sheds at 20% -Internal roads at 30%
-Construction of industrial sheds at 40% -Internal roads at 60% -6500 cm tank constructed
Inadequate funds to complete the projects and budgetary cuts
Modernization of Rivatex (upgrading of the machinery – Spinning, weaving & finishing sections)
Modern machines procured, installed and commissioned
Installation of weaving machines
Installation of spinning machines
Installation, testing & commissioned
3 weaving machines Weaving production capacity increased from 4,500 Meters per day to 9,000 Meters per day
2 spinning machines Spinning has enhanced production capacity from 800kg to 3 tonnes a day
1 spinning and 3 weaving machines

23 | P a g e
Sub-programme Key Outputs Key performance
indicators
Planned Targets Achievement Remarks
2014/15 2015/16 2016/17 2014/15 2015/16 2016/17
Exports by EPZ firms
Ksh. in Billions 56 66 67 58 67 63 Increased FDIs in EPZ led to exports
Investments in EPZA
Ksh. in Billions 55 57 59 61 74 51 Investments expected to grow with the completion of industrial shed
Employment by EPZ firms
Number of workers employed
52,071 52,000 53000 47,526 52,007 51,246 Jobs increased due to more firms attracted to EPZA
Investment Promotion
Increase in FDI and DDI (Ksh. Billions)
150 200 230
191 224 159.16
Improved Ease of doing business in Kenya led to increase in FDI
SP 1.2: Provision of Industrial Training
Students trained at KITI
No .of students 1700 1000 1200 1800 550 2000 Increased demand for industrial courses led more students enrollment
Programme 2: Standards, Business Incubation and Research
SP 2.1 Standards, Metrology and Conformity Assessment
Increase in the number of standards developed
Number of Standards Developed
350 440 565 436 533 749 Enhanced process of standards development led to overachievement
Increased review of standards
Number of standards reviewed
336 800 602 409 1,292 1902 Enhanced process of standards review led to overachievement
Increased conformity of products to standards in the market
Products certified under large firms
6315 7415 7873 6998 7427 8243 Increased demand from firms and improved standards infrastructure by KEBS led to overachievement.

24 | P a g e
Sub-programme Key Outputs Key performance
indicators
Planned Targets Achievement Remarks
2014/15 2015/16 2016/17 2014/15 2015/16 2016/17
Products certified under SMEs
1958 2080 2434 1962
2,296 2333 Increased demand from firms and improved standards infrastructure by KEBS led to overachievement.
Upgrading of KEBS Laboratories (Mombasa & Kisumu)
% Upgrading completion
N/A 100 100 N/A 90 100 All the laboratories have fully equipped
Accreditation of conformity assessment bodies across all sectors
Number of conformity assessment bodies accredited
50 15 15 49 14 19 Increased awareness and uptake on the accreditation
Awareness on Accreditation services undertaken
Number of awareness created
48 85 120 75 124 133 Increased awareness on the accreditation
New Patent ,utility modes & industrial designs Processed
No. Processed 300 360 410 329 404 410 Streamlined processes of approving the utility model and designs
National Trade mark Applications
No. of National Trade mark applied
4500 5430 5500 4613 4852 5500 Streamlined processes of approving trademarks
Increased IP registration
Number of IP registered
4200 4938 5000 5991 4264 5000 Streamlined processes of IP registration
SP 2.2 Business financing & incubation
Credit disbursement to MSMEs
Credit disbursed to MSMEs in million
250 270 300
252 183 269
Inadequate funds and budgetary cuts affecting the disbursement

25 | P a g e
Sub-programme Key Outputs Key performance
indicators
Planned Targets Achievement Remarks
2014/15 2015/16 2016/17 2014/15 2015/16 2016/17
Complete construction of Phase I and equipping of CIDCs
210 CIDCs constructed and equipped The CIDCs equipped include; Lurambi, Kiambaa, Kitui central, Uriri, Mumias East, Navakalo, Kisumu Town, Bomachoge, Narok East, Kericho, Bureti, Kibwezi
210 210 175 188 CIDCs constructed
13 CIDCs equipped
-For 22 CIDCs no land was provided. -188 have been constructed but not equipped -Budget cuts affected project adversely
Business development services provided
No of entrepreneurs provided with Business development services
13,000 29,000 31,500 28,071 31,453 34,576 Increased demand for BDS by the businesses
MSEs trained on entrepreneurship and management
No. Of MSEs trained on entrepreneurship and management
4112 5180 1515 4515 3797 1804 Budgetary cuts led to decreased
Facilitate to access market
No. Of MSEs facilitated to access market
1500 2000 1800 1800 2001 1667 Low funding led to non achievement of the indicator
MSMIs linked with large enterprises
Number of MSMIs linked with large
200 220 230 204 222 266
Increased demand for the subcontracting by the large firms led to

26 | P a g e
Sub-programme Key Outputs Key performance
indicators
Planned Targets Achievement Remarks
2014/15 2015/16 2016/17 2014/15 2015/16 2016/17
enterprises overachievement
Operationalizing Kariobangi Enterprise Development Centre of Excellence
Construction of workshops, syndicate room, show room, IT room and Drainage civil works
Civil works and equipping of the Centre
Undertake Civil works and procure the IT equipment
Undertake the drainage system works
Structural designs completed
IT Equipment Procured and installed
Drainage works 40% complete
Inadequate funds to complete the projects
SP 2.3: Industrial Research, Development and Innovation
Increased technologies for value addition developed
Number of Prototypes developed
20 22 22 20 17 22 Delay in disbursement of development grants and budgetary cuts
Development of Research, Technology & Innovation Laboratories and related infrastructure in Nairobi (South B)
% completion rate
45 60 80 50 60 60 Inadequate funds to complete the project resulted to having pending bills and penalties for breach of contract
Research, Technology & Innovation Laboratories equipped and operationalize the Kisumu lab
No. of laboratories equipped and operationalized (leather, Natural products, food processing and Textiles)
1 1 2 leather laboratory equipped but not operationalized
No funds allocated
1 laboratory equipped - leather
Inadequate funds to complete the leather specialized unit project and equip the remaining laboratories

27 | P a g e
Sub-programme Key Outputs Key performance
indicators
Planned Targets Achievement Remarks
2014/15 2015/16 2016/17 2014/15 2015/16 2016/17
Equip Modern Office administration block
- 1 - - Equipped the office administration
-
Technologies commercialized and transferred
Number of technologies commercialized
4 8 8 6 12 10 Inadequate funds to complete the commercialization of the technologies
Programme 3: Planning, Policy and Administrative Services
Monitoring and Evaluation
No. Of M&E Report
2 2 2 1 1 1 Limited financial resources to complete the M&E exercise
Level of funds utilization
% level Fund utilization
100 100 100 95 95 95 Delay in disbursements and exchequer releases
Customer satisfaction index
% Level of customer satisfaction
100 100 100 75 75 75 Delay in payment releases to contractors
Automation levels % Level of automation
28 40 50 28 40 40 Inadequate funding
Competency levels % Level of competencies
100 100 100 78 80 80 Delay in disbursement and inadequate funding to train the staff
Work environment and Employee satisfaction index
% Level of employee satisfaction
90 90 90 70.5 70.5 70 Delay in disbursement and inadequate funding to facilitate equipment

28 | P a g e
Sub-programme Key Outputs Key performance
indicators
Planned Targets Achievement Remarks
2014/15 2015/16 2016/17 2014/15 2015/16 2016/17
State Department for Cooperatives 1. Programme Co-operative development and Management
Sub- Programme 1.1: Governance and accountability
Governance and Anti-Corruption policy enforced in co-operatives
No. of societies complying with the policy
1,500 1632 4246 1,632 4246 4500 The target was exceeded as SDC worked in collaboration with county governments in enforcing governance
Registered audited accounts
No. of audited accounts registered
10,000 3500 2996 3,921 3000 3764 The achievement was surpassed due to new registration of cooperatives and enhanced enforcement of the audit compliance.
Inquiries of co-op societies
No of inquiries carried out
9 10 12 10 15 18 The target was exceeded as some enquiries initiated in FY 2015/16 were carried over to the period under review.
Completion of liquidation of co-op society
No of liquidations completed
2 3 2 2 3 15 The target was surpassed as previously stalled liquidations were fast tracked by a specially constituted task force.

29 | P a g e
Sub-programme Key Outputs Key performance
indicators
Planned Targets Achievement Remarks
2014/15 2015/16 2016/17 2014/15 2015/16 2016/17
Sub- Programme 1.2: Co-operative advisory services
New co-operatives Registered
No. of new co-operatives registered
1,100 1500 1861 1,174 1,800 1,430
Low funding for promotion and registration hampered the achievement of the target.
New SACCOs in Diaspora
No of Diaspora SACCOs
2 2 3 2 2 4 Enhanced Sensitization of Kenyans in Diaspora on cooperative model contributed to improved registration.These SACCOs are in USA, UK, Ire land, UAE, Qatar, Nigeria and South Africa. This is geared towards streamlining remittances.

30 | P a g e
Sub-programme Key Outputs Key performance
indicators
Planned Targets Achievement Remarks
2014/15 2015/16 2016/17 2014/15 2015/16 2016/17
Integrated information management system for co-operatives in place
Digitized co-operative services
Acquire hardware
Developed concept Note Cleaned registration register Registration data transferred to excel sheet
Concept Note Updated registration register Registration data in excel format
3 desktop 1printer and scanner acquired
Formation of project steering team Prepare Business requirements and technical designs Prepare TORs
Project steering committee formed. Phase 1-Design and development of modules for user departments- completed Data partially collected and demos/sensitization on the modules initiated
Phase 1 was completed The system is web based (https;//co-opselfservice.com;8080)
Licensed and supervised FOSA SACCOs
Number of FOSA SACCOs licensed and supervised
180 190 177 186 185 176 Some of the SACCOs, licenses were canceled due to failure to meet prudential standards.

31 | P a g e
Sub-programme Key Outputs Key performance
indicators
Planned Targets Achievement Remarks
2014/15 2015/16 2016/17 2014/15 2015/16 2016/17
Savings/deposits mobilized through SACCOs (KShs. Billions)
Amount of savings mobilized (KShs. Billions)
490 570 600 500 640 637 Target was achieved.
Outstanding remittances to SACCOs recovered (KShs. Millions)
Amount of outstanding remittances recovered ((KShs. Millions)
200 200 300 290 300 176 There was a short fall in recovery due to injunctions through courts
Cotton co-operative Strengthened to participate effectively in textile value chain
No of cotton co-operatives with ginneries strengthened
- - 4 - - 4 Target achieved Out of the four, three have no ginneries but capacity building was conducted on handlooms value chain with anticipation to invest in ginning
Transport SACCOs Streamlined
No of Matatu&Bodaboda SACCOs streamlined
- - 5 - - Capacity building was undertaken on 3 bodaboda SACCOs on pilot basis include; Kawada bodabodasacco DagoretiBodaboda
Non achievement was due low funding.

32 | P a g e
Sub-programme Key Outputs Key performance
indicators
Planned Targets Achievement Remarks
2014/15 2015/16 2016/17 2014/15 2015/16 2016/17
KariobangiBodaboda in Nairobi county.
Youth in transport co-operativesCapacity built
Number of youth co-operatives covered
100 35 50 15 60 3 Austerity measures effected in F/Y 2016/17 led to lack of funds and hence dismal performance.
Review Co-operatives Development Policy and Legislations
No of acts/ rules reviewed and disseminated
- - 1 - - 1 National Cooperative Development Policy developed awaiting Cabinet and Parliament approval.
Target achieved
Co-operative sector management tools developed
Co-operative handbook Member Recruitment manual Co-operative audit manual
-Co-operative handbook
Member Recruitment manual
Co-operative audit manual
- Co-operative audit manual
TOR developed Draft audit manual
The handbook and manuals were not developed due to austerity measures in the period under review.

33 | P a g e
Sub-programme Key Outputs Key performance
indicators
Planned Targets Achievement Remarks
2014/15 2015/16 2016/17 2014/15 2015/16 2016/17
Sub- Programme 1.3: Marketing ,Value Addition & Research
Value addition technologies promoted and adopted by co-operatives
No of co-operatives utilizing value-addition technologies
10 20 25 15 25 22 commodities coop doing value addition promoted and mapped the level of technology used
Target achieved
New ventures and innovations in co-operatives promoted
No. of new ventures promoted
4 1 2
2 1 0
Lack of funding hampered development of new ventures and innovations.
Second window for cooperatives established at NSE
Preparation of concept paper
- Draft concept paper developed
Share trading platform segment established at NSE
0 0 0 Lack of technical capacity to implement the platform hampered the establishment of the platform. There is need to engage a consultant to facilitate the process
Co-operatives linked to development partners and agencies
No of co-operative linked
25 25 30 25 25 103 Over achievement was due to newly promoted value chain coops under ASDSP and other development partnerships
International co-operative collaborations & linkages Strengthened
No of MOUs signed and implemented
- 2 2 - 2 2 Namibia signed MOU with Kenya and implementation is in progress as a working team was appointed, and they have already developed a TOR.

34 | P a g e
Sub-programme Key Outputs Key performance
indicators
Planned Targets Achievement Remarks
2014/15 2015/16 2016/17 2014/15 2015/16 2016/17
Talks are still on towards the signing of the MOU between Kenya and Zimbabwe USA (CLUSA) signed
Processing units for fruits and vegetable co-operatives established
No. of processing units established by co-operatives
- 2 2 - Sensitization and identification of youth co-operatives to participate in fruits and vegetable processing
Two youth cooperatives were capacity built to engage in fruit processing.
Malindi mangoes cooperative in Kilifi Makueni fruit processing.
Sub- Programme 4.4: Co-operative management and investment
New milk processing machinery and equipment
Modernized Eldoret, Sotik, Nyahururu and Dandora Milk processing plants
- Modern Milk processing machine and equipment
Procurement of TFA and UHT filling machines, Sterilizer, homogenizer, aseptic and CIP systems done
- Acquisition of packaging and refrigeration machines, and upgrade of Effluent plant in Sotik Acquisition of TFA filling machine for
NKCC Eldoret Factory: Machines (UHT processing and packaging line comprising of a sterilizer, aseptic tank, three filling machines (250ml, 500ml and 1
Target achieved. Specific Impacts: -Increased processing capacity from 110,000L/day to 300,000L/day -Increased farmers’ earnings from Kshs. 23 to Kshs 35 per litre. -Increased number of farmers served by the New KCC from 18,049 to 21,000

35 | P a g e
Sub-programme Key Outputs Key performance
indicators
Planned Targets Achievement Remarks
2014/15 2015/16 2016/17 2014/15 2015/16 2016/17
Nyahururu plant Roofing Dandora plant
litre) complete with downstream equipment) were delivered, installed and commissioned. Dandora NKCC factory: Civil and Installation (A mala and yoghurt processing line, Gable top packing machine) works ongoing. Nyahururu NKCC plant: Machines (TFA Conversion kit, TFA machine and Cleaning in Place system)

36 | P a g e
Sub-programme Key Outputs Key performance
indicators
Planned Targets Achievement Remarks
2014/15 2015/16 2016/17 2014/15 2015/16 2016/17
were delivered and installed.
Risk Based Supervision system (RBS)fully developed
Operational system
Development of RBS framework
RBS framework developed and tested
Acquisition and installation of RBS ICT infrastructure (software and hardware)
RBS framework automated.
Target achieved. The framework allows Saccos to submit online returns for regulatory monitoring.
Sub-Programme 4.5: General Administration, planning and support services
Monitoring & Evaluation
M&E Reports - 2 0 - 2 1 The second M&E could not take place due to lack of funds occassioned by budget cuts.
Ministerial Programme Review
PPR Reports - 1 1 - 1 1 Financial Year 2016/17 PPR was prepared
Review strategic plan Strategic plan 2016-2021
- - - - 1 1 The Strategic Plan was reviewed and is being implemented.
MTEF Sub-Sector/sector report
- 1 1 - 1 1 Financial Year 2016/17 Sub-sector/Sector reports were prepared

37 | P a g e
Sub-programme Key Outputs Key performance
indicators
Planned Targets Achievement Remarks
2014/15 2015/16 2016/17 2014/15 2015/16 2016/17
Budget Preparation Report - 1 1 - 1 1 Budget was prepared
Budget utilization Level of funds utilization%
- 100 100 - 100 99 Absorption rate of 99% (Kshs.3,619,740,500 out of Total Budget of 3,650,950,000)
A-in-A collection Amount collected KShs. Millions
- 6.5 6.5 - 6.5 8.755 Overachievement was due to increased registration of youth SACCOs. This raised an additional Kshs. 2.255M .
Refurbishment of offices
No of Refurbished offices
- 3 1 - 1 1 Cash office was refurbished
Ministry’s ISO Certification
ISO Certification - 1 0 - 1 0 Only procedures were reviewed due to lack of funds.
Work Environment Survey
Survey Report - 1 0 - 2 0 The target was not achieved due to lack of funds.
Automation of offices
Automation Level %
- 55 30 - 70 75 New ICT equipment were acquired and VPN installed.
State Department for Trade Programme1 : Trade Development and Promotion

38 | P a g e
Sub-programme Key Outputs Key performance
indicators
Planned Targets Achievement Remarks
2014/15 2015/16 2016/17 2014/15 2015/16 2016/17
SP1.1 Domestic Trade Development
Maragua Wholesale hub
% completion of master design of wholesale hub in Maragua
20 0 100 20 0 0 Scheme designs done in FY2014/15. However, no funding has been allocated since then for completion of the designs
Trade Data Bank % completion rate of trade data bank
5 0 100 5 0 0 Data collection tool developed in FY2014/15. However, no funding has been allocated since then for development of the data bank
E-trade portal % development of e- portal
30 50 100 30 50 60 E-trade portal developed and awaiting server for operationalization
Buy Kenya Build Kenya Policy
No. of Policies - - 1 - - 1 Policy developed to guide the Country in promoting buying of locally manufactured products
SP1.2 Fair Trade and Consumer Protection
Compliance and Standards
No. of Weighing and Measuring equipment approved
10 10 18 10 10 9 Negative variance due low submission of equipment
No. of Weights and Measuring standards calibrated
200 300 295 380 250 320 Positive variance as a result of increased submission of standards by County Governments

39 | P a g e
Sub-programme Key Outputs Key performance
indicators
Planned Targets Achievement Remarks
2014/15 2015/16 2016/17 2014/15 2015/16 2016/17
% completion rate of the modern laboratory’s equipment
5
10 20 5 10 0 During FY 2016/17 the allocated funds were removed during the revised budget.
Regulatory and Legal Framework
No. of Bills developed
- - 2 - - 2 Legal metrology Bill was passed by Parliament while Trade Descriptions Bill was submitted to the State Law Office
Consumer Protection
No. of policies on Consumer Protection
- - 1 - - 1 Reviewed Consumer Protection Act
No. of awareness creation forums held
4 3 2 2 2 2 Variance was due to lack of funds
No. of accredited register for consumer protection bodies reviewed
2 3 1 3 3 2 Television and Radio Viewers Association and Downtown Consumer Organization accredited in FY 2016/17
Advice reports on consumer protection issues
No. of Reports 5 5 3 5 5 0 Variance due to logistical challenges in undertaking the surveys
Compliance and Standards
No. of cases investigated and concluded
233 291 60 54 66 38 Less cases prosecuted because parties pursued Alternative Dispute Resolutions (ADR) methods

40 | P a g e
Sub-programme Key Outputs Key performance
indicators
Planned Targets Achievement Remarks
2014/15 2015/16 2016/17 2014/15 2015/16 2016/17
Investigation of Intellectual Property Rights infringement
Number of investigations conducted
233 212 252 233 291 232 Target met
Seizure and destruction counterfeit goods
Value of seized goods (Kshs. Millions)
100 100 100 223.87 235.04 610.1 Variance was due to increased awareness, reporting and increased surveillance
Value of goods destroyed (Kshs. in Millions)
100 100 100 245.02 254.93 320.4 Destruction of counterfeit goods destroyed increased because of increased surveillance
Public education and sensitization through outreach programs and media
Number of outreach programmes to create publicity about intellectual Property Rights
30 15 5 27 16 17 Implementation of the MOUs increased the achievement of collaborative activities.
SP1.3: Exports Market Development
Improved Export Earnings
Increase in Export Earnings (Kshs.)
577 617 874 537 581 578 Underperformance was due NTBs in the EAC market, the effects of BREXIT and adverse weather that affected production of agricultural products
Development of New Markets in Congo Brazzaville and Ghana
% completion rate of research on new markets development
N/A 10 30 N/A 0 10 Research for Congo Brazzaville was discontinued due to the reduction of the development budget while for Ghana market was also affected by the reduction of

41 | P a g e
Sub-programme Key Outputs Key performance
indicators
Planned Targets Achievement Remarks
2014/15 2015/16 2016/17 2014/15 2015/16 2016/17
funds
Product Development for Export Markets
% completion of agricultural and livestock export product development
100 100 100 100 100 50 Variance for 2016/2017 was occasioned by budgetary cuts
Market Research Number of completed research on new markets development and disseminated
1 1 1 1 2 1 Market research conducted in Angola, Ethiopia, Nigeria, Qatar
Enterprises supported to attend test marketing events
No. of enterprises supported in Product Development & Test Marketing
10 15 45 15 34 0 Activity not undertaken in 2016/17 due to budgetary cuts.
SMEs trained under Export Trade Training and Export Awareness
No. of SME's trained
500 340 330 603 301 394 Increase in number was occasioned by the increased interest for capacity building by SMEs
Market Research No. of market researches undertaken & disseminated
1 1 1 1 2 1 One Market undertaken in UAE, Angola, Ethiopia & Nigeria

42 | P a g e
Sub-programme Key Outputs Key performance
indicators
Planned Targets Achievement Remarks
2014/15 2015/16 2016/17 2014/15 2015/16 2016/17
SP1.4 Regional Economic Integration Initiatives
Establishment of Commodities Exchange Platform
% completion rate of establishment of commodities exchange platform
10 20 55 2 7 45 Negative variance in FY 2016/17 was due to delay in procurement of a Consulting firm due to complex nature of the project.
SP1.5 Entrepreneurship and Management Training
Trained Micro Small and Medium Enterprises operators
No. of MSME operators trained
2000 3500 3700 8875 809 2975 Negative variance due to inadequate resources for logistics in the regional offices
Trained Micro Small and Medium Enterprises operators
No. of Business firms incubated
- 6 6 - 5 8 Negative variance in 2015/16 was due withdrawal of one firm
SP2.6 International Trade
Established export market in foreign Countries
Number of Trade and investment exhibitions/meetings/trade fairs and cultural diplomacy meetings attended/organized and facilitated
10 10 6 10 10 11 Rwanda, Botswana, Sudan, Tanzania, Germany, Israel, Jordan, Azerbaijan, Burundi, Greece and World expo Development Programme
No. of missions that have established showrooms to display Kenyan products
N/A N/A 14 N/A N/A 14 This arrangement between Kenya Embassies and Kenya exporters who send their products to the Missions for display

43 | P a g e
Sub-programme Key Outputs Key performance
indicators
Planned Targets Achievement Remarks
2014/15 2015/16 2016/17 2014/15 2015/16 2016/17
Improved Kenya image and Identity
No. of international investment event participated on
2 2 2 3 4 2 Participated in Global Partnership for Effective Development Cooperation (GPEDC), Sourcing Magic Show, UNCTAD 14TH and TICAD VI.
Road to Rio No. of athletes trained on media relations and etiquette
- - 80 - - 85 Target met
County Competitiveness Index
No. of Counties adopting branding guidelines
8 2 47 9 2 47 Training workshops held for the 47 counties to identify their branding opportunities
Mark of Identity- Enhanced competitiveness of Kenyan Products
No. of firms adopting the “Mark of Identity” as a unique identifier
30 36 - 30 41 - Based on feedback from stakeholders, the Board redesigned the mark of identity and developed the new criteria for adoption of the mark in FY2016/17
SP2.7 Investment Promotion
Increased Foreign Direct Investment (FDI) and oversees development assistance Inbound and outbound meetings for investment promotion
No. of meetings held and the resolutions
17 13 20 17 13 19 The drop was due to rescheduling of meetings and inadequate funding

44 | P a g e
Sub-programme Key Outputs Key performance
indicators
Planned Targets Achievement Remarks
2014/15 2015/16 2016/17 2014/15 2015/16 2016/17
Increased market access for Kenyan products
No. of Business forums held
- - 20 - - 19 This is the total of both inbound and outbound business forums put together.
Trading Partners expanded
No. of Bilateral Trade Agreements/MOUs signed or initiated
8 7 7 8 7 9 (2) BTAs (Israel and Jordan) and (2) initiated Algeria and Angola, (4) JTC Egypt, Israel, Jordan, & Botswana, (2) Joint Technical Committee with Zambia and Uganda and (1) Joint Economic Commission with Turkey
SP3.8 General Administration, Planning and Support Services
Administrative Services
% level of automation of services
40 45.35 60 39 42.5 55 Target not met due to insufficient funds for automation
Financial Support Services
% financial services facilitation to trade programmes/Projects
100 100 100 100 100 100 Necessary facilitation was accorded to programme activities
Monitoring and Evaluation reports
No. of quarterly and annual reports
5 5 5 5 5 5 Target achieved
Development of Policies and Regulatory Framework
No. of Policies - - 2 - - 2 National Trade Policy Approved in December 2016 and Trade Development Bill forwarded to the State Law Office for legal drafting

45 | P a g e
Sub-programme Key Outputs Key performance
indicators
Planned Targets Achievement Remarks
2014/15 2015/16 2016/17 2014/15 2015/16 2016/17
State Department for East African Integration Programme: East African Affairs and Regional Integration Sub-programme
East African Customs Union
Harmonized EAC tariffs/standards
No. of EAC harmonized regional standards
50 1350 1400 384 1216 1428 Planned target exceeded due to increased donor funding
No. of EAC Harmonized standards adopted by Kenya
60 500 1010 362 643 1062
% of compliance with Common External Tariff
100% 100% 100% 50% 75% 100% Kenya fully complied with CET
EAC Rules of origin applied
No. of Certificates of Origin issued
100,000 96,789 115,674 114,124
116,448 135,702 Simplified certificate of Origin being used to facilitate cross-border trade has resulted in increase in no. of certificates issued. Elimination of NTBs has enhanced no. of traders crossing the borders.
Reduced Non-Tariff Barriers
No. of NTBs cumulatively eliminated
48 65 93 71 106 116 Establishment of National Monitoring Committee has fast-tracked the identification of New NTBs and elimination of existing ones

46 | P a g e
Sub-programme Key Outputs Key performance
indicators
Planned Targets Achievement Remarks
2014/15 2015/16 2016/17 2014/15 2015/16 2016/17
Informed and Empowered stakeholders on EAC Integration
% of cross border trade disputes resolved
100% 100% 100% 100% 100% 100% Four Regional integration centres have been operationalized to handle disputes and facilitate trade
No of joint Cross Border sensitization workshops
1 2 3 1 3 5 Establishment of Joint One Stop Border Posts committees has made it possible for increased sensitization
No. of stakeholder sensitizations undertaken
9 17 21 10 17 23
No. of media campaigns
3 4 6 3 5 6 Planned Media campaigns for the period were undertaken with the assistance of TMEA
East African Common Market
Awareness on opportunities from EAC Integration increased
No. of counties visited for publicity awareness creation on EAC
7 14 16 10 14 18 Target was marginally surpassed due to incorporation of EALA into the publicity campaigns in various Counties . Selection of participants is from Sub-counties within a County with the categories ranging from Youth, Women, PWDs, opinion leaders and business communities for purposes of inclusivity and creating multiplier effect
Students, persons and workers facilitated to get
No. of students passes issued as gratis
1,200 1389 400 1,586 1,762 406 Target surpassed due to harmonization of EAC education curricula

47 | P a g e
Sub-programme Key Outputs Key performance
indicators
Planned Targets Achievement Remarks
2014/15 2015/16 2016/17 2014/15 2015/16 2016/17
permits No. of EAC citizens moving from other Partner States granted stay
80,000 145,760 248,756 267,469 378,358 388,918 Increased sensitization and awareness creation on EAC and waiving of work permit fees between Rwanda, Uganda and Use of ID as an travel document
Integrated border management system
No. of One Stop Border Posts (OSBP) operationalized
2 2 2 0 1 3 The No. of OSBPs operationalized during the period are Busia, Namanga, Lungalunga and Taveta
Regional Integration Centers (RICs) established and constructed
No. of RICs established and constructed
1 3 0 2 2 0 Target achieved where Four RICs are operational namely Namanga, Busia, Taveta, &Lungalunga
EAC Monetary Union Monetary Institutions established to support Monetary Union
No. of Bills Finalised
1 1 2 1 2 3 The State Department initiated and followed up on the finalization of the Bills towards the establishment of the Institutions.
Ministry of Tourism Programme. 1: Tourism Development and Promotion
SP. 1:1 Tourism Promotion and Marketing
Increased International tourism arrivals
No. of International tourism arrivals
1,850,000 1,500,000 1,300,000 1,350,728 1,180,500 1,339,700 Target not met in first two years due to insecurity which led to travel advisories. Target overpassed in 2016/17 due to recovery initiatives like engagement of an international Public Relations firm, Charter
Tourism Revenues Amount of tourism revenues (Kshs. Billion)
119 94 100 87.1 84.6 99.7

48 | P a g e
Sub-programme Key Outputs Key performance
indicators
Planned Targets Achievement Remarks
2014/15 2015/16 2016/17 2014/15 2015/16 2016/17
Incentive programme, waiver of visa fee for under 16
Domestic bed nights No. of bed nights by Kenyans (Million)
3.1 3 3.4 2.95 3.154 3.496 Target was surpassed due aggressive domestic tourism campaigns such as Tembea Kenya Online Campaign, TwendeUshago Campaign, hello world relay Instagram Campaigns, SMS campaign .
Diversified tourism products
No of products diversified
8 - - 8 - - In the FY 2013/14 and 2014/15 the Ministry embarked on marketing diversified products so as to give a variety to the market apart from the traditional beach and safari. The Ministry aggressively marketed products like golf, MICE Agro tourism among others
Brand awareness index of Kenya as a preferred tourism destination
% growth in tourism brand awareness
- 55% 60% - 60% 62% ??
Growth in market share in the non-traditional markets
Increase in % of the market share in the nontraditional markets
60 62 N/A 62 49 N/A The non-traditional markets which include China, India arrivals were low hence more investment was put to raise the numbers

49 | P a g e
Sub-programme Key Outputs Key performance
indicators
Planned Targets Achievement Remarks
2014/15 2015/16 2016/17 2014/15 2015/16 2016/17
SP 1.2 Niche Tourism Product Development and Diversification
Nairabi International Convention and Exhibition Centre (NAICEC) developed
% of Completion 2
5
10
2
5
7.5 cumulative
Inadequate funding has delayed implementation of core components of the project
Due diligence Report and EIA
Feasibility Study
Master Plan Due diligence done – Repor EIA done -Report
Feasibility Study done-Report
Preliminary Master Plan
Target for master plan not met due to change in financing plan
Cultural festivals held
No. of cultural festivals held
4 5 5 5 5 5 Target was met
Traditional Foods cuisines introduced
Number of cuisines
4 4 4 4 4 4 Target met due to improved research on Cuisines
Home-stay operators sensitized
No. of Home-stay operators sensitized
- 600 - 100 400 - The variance is due to inadequacy of funds
Agro Tourism operators sensitized
No. of Agro Tourism operators sensitized
- 100 - 55 100 -
Conference Tourism No. of Conference tourism events-International
397 437 229 241 218 227 Target not met due to perceived insecurity and travel advisories

50 | P a g e
Sub-programme Key Outputs Key performance
indicators
Planned Targets Achievement Remarks
2014/15 2015/16 2016/17 2014/15 2015/16 2016/17
No. of International delegates
42,114 81,740 75,201 77,848 71,620 101,599 Target met due to high volume of international conferences hosted e.g TICAD VI, UNCTAD, WTO ministerial conference.
Local Events - - - 3,077 3,199 3,755 Local conferences steadily grew over the period under review. This cushioned the meeting sector from the effects of the decline in international meetings
KICC Modernization & Refurbishment:
% completion rate 12.5 50 62.5 12.5 37.5 16.9 Most of the modernization were a quick win towards hosting the WTO
Improved Quality and Standards of tourism product and services
No. of establishment s inspected/licensed
1,500 2,700 3,500 2,169 2,688 3,622 The target was surpassed due to improved mobility of the TRA regional officers after purchase of vehicles Sensitization of the industry further improved compliance
Revenue collected (Kshs millions)
43 63 95 61 91 103 Target surpassed due to increased awareness on need for compliance
Enhanced destination competitiveness
No. of tourism establishment s classified and certified
40 400 134 25 104 136 Target not met since hotels in the key tourism areas have been experiencing low performance hence not in the best standards required for classification.

51 | P a g e
Sub-programme Key Outputs Key performance
indicators
Planned Targets Achievement Remarks
2014/15 2015/16 2016/17 2014/15 2015/16 2016/17
Continuous improvement of tourism Services
No. of trained quality experts from hospitality establishments across the country
900 700 90 1,315
808 101 The training programme started in 2014/15 FY and has continuously exceeded the set target due to the strategies employed by the TRA
Improved Institutional capacity to regulate Tourism sector
Level of TRA Operationalization
- 100% 100% 45% 65% 90% Full operationalization slowed down by limited resource allocation.
No. of minimum standards developed and implemented
- 3 - 1 1 - On-course to developing more standards.
Ease of doing business within the Tourism Sector
Level of Automated licensing platform and tourism information systems
25% 100% 100% 30% 45% 55% Server installed and ERP in progress.
SP 1.3 Tourism Infrastructure Development
Ronald NgalaUtalii College constructed
% completion rate 25% 50% 75% 27% 42% 47% Project timelines not met due to inadequate funding
Capital lending to Hoteliers
No. of Tourism facilities financed and Amount (Million)
- - 375 - - 60 Target not met because disbursement was affected by non availability of full Board of Directors at TFC
SP 1.4 Tourism Training and Capacity Building
Kenya Utalii College graduates
No. of Enrollment at Kenya Utalii College
2,800 2,900 3,732 2,802 2,914 2,879 Target not met because of low enrolment in the satellite campuses

52 | P a g e
Sub-programme Key Outputs Key performance
indicators
Planned Targets Achievement Remarks
2014/15 2015/16 2016/17 2014/15 2015/16 2016/17
Practical training block
Increase in Yearly intake
- 5% 30% - 5% 6% Target not met due to revision of design
vehicles acquired - 100% - - 100% - Project Completed
Degree programmes Increase no of students graduates
20% - - 20% - - Ongoing
Equipped Kitchen at Satellite Campus
% Completion rate
- 100% - - 100% - Project Completed
S.P 1.5 General Administration, Planning and Support Services
Monitoring and Evaluation reports
Quarterly and annual reports
5 5 5 5 5 5 The M.E reports are able to bring out the status of tourism sector across the years
Tourism Sector Plan 2018-22
Sector Plan in Place
- - 1 - - 1 The draft tourism sector Plan is in place
National Tourism Blue Print 2016-2030
Report s - - 1 - - 1 The Blue Print has since been approved by the cabinet
Ministerial Programme Review
PPR Reports
1
1
1 1 1 These have been done as per the treasury circular
MTEF Budget MTEF budget 1 1 1 1 1 1 These have been done as per the treasury circular

53 | P a g e
Sub-programme Key Outputs Key performance
indicators
Planned Targets Achievement Remarks
2014/15 2015/16 2016/17 2014/15 2015/16 2016/17
Operationalization of Tourism Act 2011
No. of Institutions operationalized
2 1 1 1 1 1 Tourism Research Institute has been operationalized through budgetary allocation and deployment of staff.
2.2. Analysis of Expenditure Trends 2.2.1. Analysis of Recurrent and Development Budget Trend
Approved budget for GECA sector increased by Kshs. 2.4 billion from Ksh.18.04 billion in 2014/15 financial year to KShs.19.3 billion in
2016/17. The sector therefore experienced a slight increase despite its growing importance especially its contribution to the attainment of
the Vision 2030 targets. During the period, the five sub sectors shared the approved funds variedly with Investment & Industry and
Tourism Sub Sectors taking the largest share of the funds. In 2015/16, the two sub sectors shared 30% and 25.5% of the approved funds
respectively. Cooperatives and Trade had a share of 18.6% and 18.1% respectively while EAC Integration Sub Sector had the least share of
the funds at 7.8%.
Table 2.2.0. Recurrent and Development Budget Trend (Approved Budget Vs Actual Expenditure)
Approved Budget Allocation Actual Expenditure
2014/15 2015/16 2016/17 2014/15 2015/16 2016/17
Recurrent 9,305.51 8,739.14 12,563.68 8,799.26 8,393.85 12,171.32
Development 9,204.75 10,118.06 7,384.50 8,098.90 8,928.48 7,151.93
Total 18,510.26 18,857.20 19,948.18 16,898.16 17,322.33 19,323.25

54 | P a g e
The chart below illustrates the trends in funding during 2014/15 - 2016/17 period. Figure 1: Trends in Funding by Sub-sectors (In KShs. Millions)
Trends in funding during the period (Recurrent Vs Development in Kshs Millions)

55 | P a g e
Table 2.2: Analysis of Recurrent Expenditure by Sub-Sector and Vote
Vote and Vote Details Economic Classification
Approved Budget Allocation Actual Expenditure
2014/15 2015/16 2016/17 2014/15 2015/16 2016/17
Investment and Industry Sub-sector
1172
Gross 2,458 2,167 2,858 2,217 2,156 2,685
AIA 25 25 23 25 25 12
NET 2,433 2,142 2,835 2,192 2,131 2,673
Compensation to Employees 412 432 534 407 428 530
Use of Goods and Services 543 482 480.69 473 385.42 319.5
Transfers 1,479 1,218 1,824 1,324 1,322 1,824
Other Recurrent 24 34.91 19.42 13 20.58 11.19
Cooperatives Sub-sector
Vote and Vote Details
Economic Classification 2014/15 2015/16 2016/17 2014/15 2015/16 2016/17
Gross 807 719 3,159 751 713 3,096
1173
AIA 7 7 7 7 7 7
NET 800 712 3,153 744 707 3,089
Compensation of employees 108 107 5 112 110 5
Use of Goods and Services 587 48 1,796 56 40 1,784
Grants and Other Transfers 108 557 1,338 582 557 1,281
Other Recurrent 3 7 20 0 7 19
Trade Sub-sector
Approved Budget Allocation Actual Expenditure
Vote and Vote Details Economic Classification 2014/15 2015/16 2016/17 2014/15 2015/16 2016/17
1174
Gross 2,356 2,600 3,500 2,241 2,371 3,398
AIA - - 28 - - 5
NET 2,356 2,600 3,472 2,241 2,371 3,393
Compensation to Employees 403 419 197 401 392 195
Use of goods and services 1,107 1,277 1,253 1,006 1,046 1,197
Transfers 847 903 2,014 834 933 1,985
Other Recurrent - - 36 - - 22

56 | P a g e
Vote and Vote Details Economic Classification
Approved Budget Allocation Actual Expenditure
2014/15 2015/16 2016/17 2014/15 2015/16 2016/17
EAC Integration Sub-sector
Vote and Vote Details Economic Classification
Approved Budget Allocation Actual Expenditures
2014/15 2015/16 2016/17 2014/15 2015/16 2016/17
1183
Gross 1,619 1,621 1,512 1,554 1,567 1,482
AIA 2 2 - - - -
Net 1,617 1,619 1,512 1,554 1,567 1,482
Compensation to employees 189 180 182 158 171 182
Use of goods and services 426 377 318 396 334 296
Grants and other Transfers 1,003 1,056 1,002 997 1,056 998
Other Recurrent - 9 9 6 6
Tourism Sub-sector
Vote and Vote Details Economic Classification Approved Budget Allocation Actual Expenditure
2014/15 2015/16 2016/17 2014/15 2015/16 2016/17
Gross 1,707 1,412 2,453 1,657 1,395 2,178
AIA 0 0 994 - - 745
NET 1,707 1,412 1,460 1,657 1,395 1,433
Compensation to Employees 248 145 226 248 142 223
Use of goods and services 393 255 132 414 223 109
Transfers 1,066 1,013 2,095 995 1,030 1,846
Other Recurrent - - - - - -
2.3. Analysis of Development Expenditure by Sub-Sector and Vote (Approved budget vs actual expenditure)
Table 2.3: Analysis of Development expenditure by Sector and Vote (Ksh. Millions)
Vote and Vote Details Description Approved Budget Allocation Actual Expenditure
2014/15 2015/16 2016/17 2014/15 2015/16 2016/17
Investment and Industry Sub-sector
1172 Gross 5,737.63 5,308.86 3,100.00 4,965.62 4,406.21 3,277.82
GOK 5,737.34 4,762.86 2,930.00 4,965.62 4,350.44 3,168.24

57 | P a g e
Vote and Vote Details Description Approved Budget Allocation Actual Expenditure
2014/15 2015/16 2016/17 2014/15 2015/16 2016/17
Investment and Industry Sub-sector
Loans 0 220 100 0 2.4 16.19
Grants 0 0 70 0 0 58.58
Local AIA 0.29 326 0 0 53.37 34.81
Cooperatives Sub Sector
Vote and Vote Details Description
Approved Budget Actual Expenditure
2014/15 2015/16 2016/17 2014/15 2015/16 2016/17
1173
Gross 35.92 335 530 32.33 334.84 519.71
GoK 35.92 335 530 32.33 334.84 519.71
Loans 0 0 0 0 0 0
Grants 0 0 0 0 0 0
Local AIA 0 0 0 0 0 0
Trade Sub-Sector
Vote and Vote Details Description Approved Budget Allocation Actual Expenditure
2014/15 2015/16 2016/17 2014/15 2015/16 2016/17
1174
Gross 888.8 481.3 122.5 700 354.7 120.1
GOK 888.8 481.3 122.5 700 354.7 120.1
Loans 0 0 0 0 0 0
Grants 0 0 0 0 0 0
Local AIA 0 0 0 0 0 0
EAC Integration Sub Sector
Vote and Vote Details Description Approved Budget Allocation Actual Expenditures
2014/15 2015/16 2016/17 2014/15 2015/16 2016/17
1183
Gross 65 65 40 58.05 19.83 20
GOK 0 0 0 0 0 0
Loans 0 0 0 0 0 0
Grants 65 65 40 58.05 19.83 20
Local AIA 0 0 0 0 0 0
Tourism Sub Sector
Vote and Vote Details Description Approved Budget Allocation Actual Expenditure
2014/15 2015/16 2016/17 2014/15 2015/16 2016/17
Gross 2,477.40 3,927.90 3,592.00 2,342.90 3,812.90 3,214.30

58 | P a g e
Vote and Vote Details Description Approved Budget Allocation Actual Expenditure
2014/15 2015/16 2016/17 2014/15 2015/16 2016/17
Investment and Industry Sub-sector
GOK 2,477.40 3,927.90 3,592.00 2,342.90 3,812.90 3,214.30
Loans 0 0 0 0 0 0
Grants 0 0 0 0 0 0
Local AIA 0 0 0 0 0 0
2.4. Analysis of Programme /Sub-Programme Expenditure by Sector and Vote Table 2.4: Programme /Sub-Programme Expenditure Analysis (Kshs. Millions)
Programme Name Approved Budget Actual Expenditure
2014/15 2015/16 2016/17 2014/15 2015/16 2016/17
Investment and Industry Sub-sector
Programme1: General Administration and Planning, and Support Services
626.07 533.31 652.16 542.06 506.01 616.33
Sub-Programme 1: General Administration and Planning, and Support Services
626.07 533.31 652.16 542.06 506.01 616.33
Programme 2: Industrial development and investment 4,390.33 3,961.63 3,295.13 3,702.96 3,585.98 3,261.91
Sub-Programme 2.1 Promotion of Industrial Development
3,555.84 3,881.63 3,078.13 3,102.40 3,509.60 3,044.92
Sub-Programme 2.2 Promotion of Industrial Training 834.49 80 217 600.56 76.38 216.99
P3: Standardization, Business Incubation and Research
720.6 814 1,813.16 720.6 314.21 1,813.16
Sub-Programme 3.1 Standardization, Metrology and conformity assessment
327.6 30.42 115.04 327.85 30.42 115.04
Sub-Programme 3.2 Business financing & incubation for MSME
143 41 183.43 143 41 183.43
Sub-Programme .3.3 Industrial Research, Development and Innovation
250 742.58 1,514.69 249.8 242.79 1,514.69
Grand Total 5,737.00 5,308.94 5,760.45 4,960.87 4,406.20 5,691.40

59 | P a g e
Programme Name Approved Budget Actual Expenditure
2014/15 2015/16 2016/17 2014/15 2015/16 2016/17
Co-operatives Sub-sector
GENERAL ECONOMIC AND COMMERCIAL AFFAIRS SECTOR: SDC
Approved Budget Actual Expenditure
Programme : Co-operative Development and Management
2014/15 2015/16 2016/17 2014/15 2015/16 2016/17
Sub-Programme 1: Governance and Accountability 113.9 82.86 21.28 95.8 82.74 19.61
Sub-Programme 2: Co-operative Advisory Services 720.92 659.86 2,643.16 680.08 655.26 2,629.57
Sub-Programme 3: Marketing, Value Addition & Research 7.89 10.83 6.15 6.96 10.26 5.32
Sub-Programme 4: Co-operative Development and Investments
0 300 970 0 300 912.6
Sub-Programme 5:General Administration, Planning and Support Services
0 0 48.65 0 0 41.73
Total Programme 842.71 1053.55 3,689.24 782.84 1048.26 3,608.83
Total Vote 842.71 1053.55 3,689.24 782.84 1048.26 3,608.83
Trade Sub-sector
Approved Budget Actual Expenditure
PROGRAMME 1: Trade Development and Promotion
2014/15 2015/16 2016/17 2014/15 2015/16 2016/17
Sub-Programme 1: Domestic Trade Development 187.8 61.5 71.3 132.6 55.9 67.3
Sub-Programme 2: Fair Trade and Consumer Protection 414.1 538.4 346.9 353.7 482.3 308.1
Sub-Programme 3: Exports Market Development 540.6 486.7 496.9 540.6 484.3 492
Sub-Programme 4: Regional Economic Integration Initiatives
525.9 413.4 58.3 515.9 327.6 54.8
Sub-Programme 5: Entrepreneurial and Management Training
229.8 121.3 54.4 123.8 110.2 52.3
Sub-Programme 6: International Trade 301.4 310.7 2,136.30 275 326.9 2,116.00
Sub-Programme 7: Investment Promotion 102.1 753.2 89.2 101.4 583.5 89

60 | P a g e
Programme Name Approved Budget Actual Expenditure
2014/15 2015/16 2016/17 2014/15 2015/16 2016/17
Sub-Programme 8: General Administration, Planning and Support Services
943.2 395.8 368.9 897.9 355.2 338.4
TOTAL PROGRAMME 3,244.90 3,081.00 3,622.20 2,940.90 2,725.90 3,517.90
TOTAL VOTE 1174 3,244.90 3,081.00 3,622.20 2,940.90 2,725.90 3,517.90
East African Community Integration Sub-sector
Approved Budget Actual Budget
Programme 1: Coordination of EAC council decisions and implementation of projects and programmes
2014/15 2015/16 2016/17 2014/15 2015/16 2016/17
Sub-Programme 1: East African Customs Union 585.11 588.89 607.12 553.95 570.66 603.78
Sub-Programme 2: East African Common Market 772.74 988.61 867.18 760.13 958.8 845.08
Sub-Programme 3: East African Monetary union 136.71 108.8 77.52 124.56 57.09 53.07
Sub-Programme 4: General Administration Planning, Support services and Regional integration plans and Strategies
189.04 0 0 169.96 0 0
1,683.60 1,686.30 1,551.82 1,608.60 1,586.55 1,501.93
Tourism Sub-sector
Approved Budget Actual Expenditure
2014/15 2015/16 2016/17 2014/15 2015/16 2016/17
Programme 1: Tourism Development and Promotion 4,184.21 5,339.80 6,045.27 4000.03 5,207.58 5,392.04
Sub-Programme 1.1: Tourism Promotion & Marketing
1,584.33 3,518.19 1,992.49 1,204.78 3,409,91 1,992.49
Sub-Programme 1.2: Niche Tourism Product Development & Diversification
884.75 656.51 508.77 846.1 645.74 502.13
Sub-Programme 1.3: Tourism Infrastructure Development
500 687 750 811.42 687 750
Sub-Programme 1.4: Tourism Training & Capacity Building
239.78 227.79 1,054.06 239.78 227.79 807.56
Sub-Programme 1.5: General Administration, Planning & Support Services
975.35 250.31 1,739.94 897.95 237.14 1,339.85
TOTAL FOR VOTE 4,184.21 5,339.80 6,045.26 4000.03 5,207.58 5,392.04

61 | P a g e
2.5. Programme Expenditure Analysis by Economic Classification Table 2.5: Programme Expenditure Analysis by Economic Classification (Kshs. Millions)
Programme Name APPROVED ESTIMATES ACTUAL EXPENDITURE
2014/15 2015/16 2016/17 2014/15 2015/16 2016/17
Investment and Industry Sub-sector
Programme 1: General Administration and Planning, and Support Services
Current Expenditure 544.04 507.31 652.16 515.72 486.85 616.33
Compensation of employees 281.81 218.56 347.77 278.81 215.99 337.45
Use of Goods and Services 257.48 271.15 285.67 232.16 256.58 268.03
Grants and Other Transfers 0 0 0 0 0 0
Other Recurrent 4.75 17.6 18.72 4.75 14.28 10.85
Capital expenditure 82.03 26 0 26.31 19.17 0
Acquisition of Non- Financial Assets 25.63 26 0 6.9 19.17 0
Capital grants to Government Agencies 0 0 0 0 0 0
Other Development 56.4 0 0 19.41 0 0
Sub Total 626.07 533.31 652.16 542.06 506.02 616.33
Programme 2: Industrial Development and Investment
Current Expenditure 1,604.88 1,493.69 1,232.63 1,392.28 1,450.15 1,101.10
Compensation of employees 130.11 213.84 186.23 128.19 212.01 192.61
Use of Goods and Services 260.66 185.94 172.02 216.15 103.84 39.47
Grants and Other Transfers 1,195 1,076.60 873.68 1,040 1,128.00 868.68
Other Recurrent 19.11 17.31 0.7 7.94 6.3 0.34
Capital expenditure 2,785.45 2,467.86 2,062.50 2,310.68 2,135.83 2,160.81
Acquisition of Non- Financial Assets 4.9 247 317 3.4 27 258.14
Capital grants to Government Agencies 1,788.03 2,220.86 1,600.50 1,595.12 2,108.83 1,870.50
Other Development 992.52 0 145 712.16 0 32.17
Sub Total 4,390.33 3,961.63 3,295.13 3,702.96 3,585.98 3,261.91
Programme 3: Standardization, Business Incubation and Research
Current Expenditure 284 194 950.66 284 194 950.66
Compensation of employees 0 0 0 0 0 0
Use of Goods and Services 0 0 0 0 0 0
Grants and Other Transfers 284 194 950.66 284 194 950.65
Other Recurrent 0 0 0 0
Capital expenditure 436.6 620 862.5 436.6 120 862.5

62 | P a g e
Programme Name APPROVED ESTIMATES ACTUAL EXPENDITURE
2014/15 2015/16 2016/17 2014/15 2015/16 2016/17
Acquisition of Non- Financial Assets 0 0 0 0 0 0
Capital grant to Government agencies 436.6 620 862.5 436.6 120 862.5
Other Development 0 0 0 0 0 0
Sub Total 720.6 814 1,813.16 720.6 314 1,813.16
Grand Total 5,737.63 5,308.86 5,760.45. 4,965.62 4,406.21 5,691.40
Co-operatives Sub-sector
APPROVED BUDGET ACTUAL EXPENDITURE
Economic Classification 2014/15 2015/16 2016/17 2014/15 2015/16 2016/17
Programme:Co-operative Development and Management
Current Expenditure 806.71 718.55 3,159.25 750.51 713.43 3,089.10
Compensation of Employees 108.09 106.65 5 112.26 109.82 5
Use of goods and services 587.46 48.04 1,795.89 56.07 39.76 1,784.07
Grants and Other Transfers 108.1 556.6 1,338.20 581.74 556.6 1,280.80
Other Recurrent 3.06 7.26 20.16 0.44 7.25 19.23
Capital Expenditure 36 335 530 32 335 519.71
Acquisition of Non- Financial Assets 6 5 30 2 5 19.71
Capital Grants to Government Agencies 30 330 500 30 330 500
Other Development 0 0 0 0 0 0
TOTAL PROGRAMME 842.71 1,053.55 3,689.25 782.51 1,048.43 3,608.81
Trade Sub-sector
APPROVED BUDGET ACTUAL EXPENDITURE
Economic Classification 2014/15 2015/16 2016/17 2014/15 2015/16 2016/17
PROGRAMME 1: TRADE DEVELOPMENT AND PROMOTION
Current Expenditure 2,356.10 2,599.70 3,499.70 2,240.90 2,371.20 3,397.90
Compensation of Employees 402.5 419.2 196.7 401 392.4 194.5
Use of Goods and Services 1,106.70 1,277.20 1,253.00 1,005.60 1,045.80 1,196.60
Grants and Other Transfers 846.9 903.3 2,013.80 834.3 933 1,984.50
Other Recurrent - - 36.2 - - 22.3
Capital Expenditure 888.8 481.3 122.5 700 354.7 120
Acquisition of Non- Financial Assets 706.8 216.4 - 518 177.8 -
Capital Grants to Government Agencies 182 264.9 105 182 176.9 102.6
Other Development - - 17.5 - - 17.4
TOTAL PROGRAMME 3,244.90 3,081.00 3,622.20 2,940.90 2,725.90 3,517.90
TOTAL VOTE 3,244.90 3,081.00 3,622.20 2,940.90 2,725.90 3,517.90
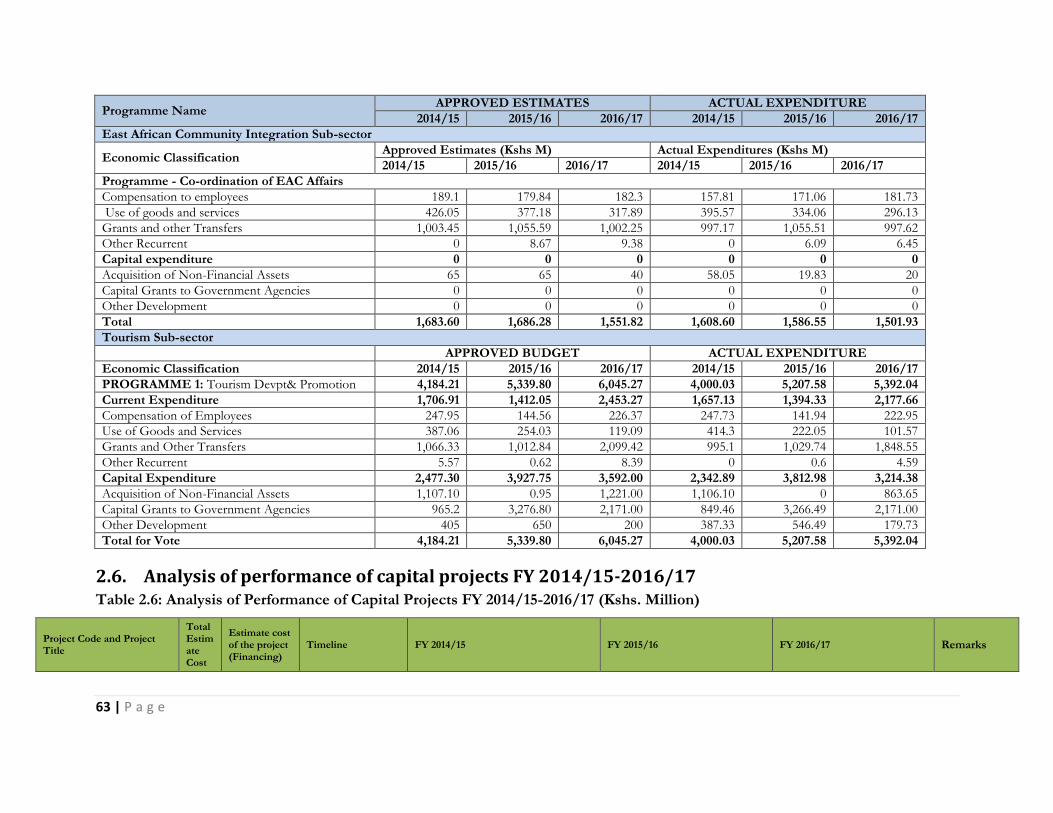
63 | P a g e
Programme Name APPROVED ESTIMATES ACTUAL EXPENDITURE
2014/15 2015/16 2016/17 2014/15 2015/16 2016/17
East African Community Integration Sub-sector
Economic Classification Approved Estimates (Kshs M) Actual Expenditures (Kshs M)
2014/15 2015/16 2016/17 2014/15 2015/16 2016/17
Programme - Co-ordination of EAC Affairs
Compensation to employees 189.1 179.84 182.3 157.81 171.06 181.73
Use of goods and services 426.05 377.18 317.89 395.57 334.06 296.13
Grants and other Transfers 1,003.45 1,055.59 1,002.25 997.17 1,055.51 997.62
Other Recurrent 0 8.67 9.38 0 6.09 6.45
Capital expenditure 0 0 0 0 0 0
Acquisition of Non-Financial Assets 65 65 40 58.05 19.83 20
Capital Grants to Government Agencies 0 0 0 0 0 0
Other Development 0 0 0 0 0 0
Total 1,683.60 1,686.28 1,551.82 1,608.60 1,586.55 1,501.93
Tourism Sub-sector
APPROVED BUDGET ACTUAL EXPENDITURE
Economic Classification 2014/15 2015/16 2016/17 2014/15 2015/16 2016/17
PROGRAMME 1: Tourism Devpt& Promotion 4,184.21 5,339.80 6,045.27 4,000.03 5,207.58 5,392.04
Current Expenditure 1,706.91 1,412.05 2,453.27 1,657.13 1,394.33 2,177.66
Compensation of Employees 247.95 144.56 226.37 247.73 141.94 222.95
Use of Goods and Services 387.06 254.03 119.09 414.3 222.05 101.57
Grants and Other Transfers 1,066.33 1,012.84 2,099.42 995.1 1,029.74 1,848.55
Other Recurrent 5.57 0.62 8.39 0 0.6 4.59
Capital Expenditure 2,477.30 3,927.75 3,592.00 2,342.89 3,812.98 3,214.38
Acquisition of Non-Financial Assets 1,107.10 0.95 1,221.00 1,106.10 0 863.65
Capital Grants to Government Agencies 965.2 3,276.80 2,171.00 849.46 3,266.49 2,171.00
Other Development 405 650 200 387.33 546.49 179.73
Total for Vote 4,184.21 5,339.80 6,045.27 4,000.03 5,207.58 5,392.04
2.6. Analysis of performance of capital projects FY 2014/15-2016/17 Table 2.6: Analysis of Performance of Capital Projects FY 2014/15-2016/17 (Kshs. Million)
Project Code and Project Title
Total Estimate Cost
Estimate cost of the project (Financing)
Timeline FY 2014/15 FY 2015/16 FY 2016/17 Remarks

64 | P a g e
Fo
reign
GO
K
Start D
ate
Exp
ected
Co
mp
letion
Date
Ap
pro
ved
Fo
reign
Bud
get
Ap
pro
ved
GO
K B
ud
get
Cum
ulativ
e E
xp
end
iture as
at 30th
June,
2015
Co
mp
letion
Stage as at
30th
Jun
e,2015
(%)
Ap
pro
ved
Fo
reign
Bud
get
Ap
pro
ved
GO
K B
ud
get
Cum
ulativ
e
Exp
end
iture as
at 30th
June,
2016
Co
mp
letion
Stage as at
30th
Jun
e,2016(%
)
Ap
pro
ved
Fo
reign
Bud
get
Ap
pro
ved
GO
K B
ud
get
Cum
ulativ
e
Exp
end
iture as
at 30th
June,
2017
Co
mp
letion
Stage as at
30th
Jun
e,2017(%
)
Ksh Million Ksh Million
STATE DEPARTMENT FOR INVESTMENTS AND INDUSTRY
Development of Freeport and Industrial Parks(Special Economic Zones in DongoKundu, Mombasa)
100B
0 500b 2,013/14 2020/21 - 45 45 5 - 100M
145 20 - 50M
195M 15 Inadequate funding to undertake the resettlement of squatters and operationalization (staff & office accommodation) of SEZ Authority
Leather sector development - Kenanie leather park
4.409 B
0 4.409 B
2014/15
2020/21
-
-
-
3 -
250M
131M 6 - 533M
519M 12 Inadequate funding and Budgetary cuts have impacted negatively the project implementation
Textile Sector Development - Athi River Textile Hub
8,240M
0 8.24B
2014/15
2019/20
0 355
M
174M 10 0 2000M
2174M
30 0 750 2924M 40% -16 units @ 1,500 SQM under construction (50% complete -

65 | P a g e
Project Code and Project Title
Total Estimate Cost
Estimate cost of the project (Financing)
Timeline FY 2014/15 FY 2015/16 FY 2016/17 Remarks
Fo
reign
GO
K
Start D
ate
Exp
ected
Co
mp
letion
Date
Ap
pro
ved
Fo
reign
Bud
get
Ap
pro
ved
GO
K B
ud
get
Cum
ulativ
e E
xp
end
iture as
at 30th
June,
2015
Co
mp
letion
Stage as at
30th
Jun
e,2015
(%)
Ap
pro
ved
Fo
reign
Bud
get
Ap
pro
ved
GO
K B
ud
get
Cum
ulativ
e
Exp
end
iture as
at 30th
June,
2016
Co
mp
letion
Stage as at
30th
Jun
e,2016(%
)
Ap
pro
ved
Fo
reign
Bud
get
Ap
pro
ved
GO
K B
ud
get
Cum
ulativ
e
Exp
end
iture as
at 30th
June,
2017
Co
mp
letion
Stage as at
30th
Jun
e,2017(%
)
Ksh Million Ksh Million
Foundations Complete & Superstructures Complete) -8 units @ 750 SQM under construction (40% complete - Foundations Complete & Superstructures Complete - 2.8 Kms of new paved roads at 70% complete – 2.6 Kms of new paved roads at 70% complete -Repair & re-carpeting of 2 Kms not done -Water Reticulation

66 | P a g e
Project Code and Project Title
Total Estimate Cost
Estimate cost of the project (Financing)
Timeline FY 2014/15 FY 2015/16 FY 2016/17 Remarks
Fo
reign
GO
K
Start D
ate
Exp
ected
Co
mp
letion
Date
Ap
pro
ved
Fo
reign
Bud
get
Ap
pro
ved
GO
K B
ud
get
Cum
ulativ
e E
xp
end
iture as
at 30th
June,
2015
Co
mp
letion
Stage as at
30th
Jun
e,2015
(%)
Ap
pro
ved
Fo
reign
Bud
get
Ap
pro
ved
GO
K B
ud
get
Cum
ulativ
e
Exp
end
iture as
at 30th
June,
2016
Co
mp
letion
Stage as at
30th
Jun
e,2016(%
)
Ap
pro
ved
Fo
reign
Bud
get
Ap
pro
ved
GO
K B
ud
get
Cum
ulativ
e
Exp
end
iture as
at 30th
June,
2017
Co
mp
letion
Stage as at
30th
Jun
e,2017(%
)
Ksh Million Ksh Million
supply network not done -6500 CBM Storage Tank construction complete. -Trunk Sewerage Network complete -Fencing of the hub is 60% complete.
Ease of doing business 1 B 0 1B 2014/15
2021/22
0 0 0 Phase 1
0 120M
120M Phase 1
0 320M
440 Phase 2
The process of implementing business reform is ongoing and its continuous process of reforming
Modernization of standards Laboratory
205 N/A
205 July 2015
June 2021
- - - - N/A
8.7 8.7 10 0 0 8.7 10 Money for the project removed

67 | P a g e
Project Code and Project Title
Total Estimate Cost
Estimate cost of the project (Financing)
Timeline FY 2014/15 FY 2015/16 FY 2016/17 Remarks
Fo
reign
GO
K
Start D
ate
Exp
ected
Co
mp
letion
Date
Ap
pro
ved
Fo
reign
Bud
get
Ap
pro
ved
GO
K B
ud
get
Cum
ulativ
e E
xp
end
iture as
at 30th
June,
2015
Co
mp
letion
Stage as at
30th
Jun
e,2015
(%)
Ap
pro
ved
Fo
reign
Bud
get
Ap
pro
ved
GO
K B
ud
get
Cum
ulativ
e
Exp
end
iture as
at 30th
June,
2016
Co
mp
letion
Stage as at
30th
Jun
e,2016(%
)
Ap
pro
ved
Fo
reign
Bud
get
Ap
pro
ved
GO
K B
ud
get
Cum
ulativ
e
Exp
end
iture as
at 30th
June,
2017
Co
mp
letion
Stage as at
30th
Jun
e,2017(%
)
Ksh Million Ksh Million
through revised budget in FY2016/17
Research, Technology and Innovation Laboratories , Nairobi South B
5500M
0 5500M
2013 2018 0 695 2119 41 0 435 2509 60 0 225 2,369 62 -Budget cuts and inadequate financing have been major impediment for the completion of the project -Time extension from 156 weeks to 271 weeks -Attraction of penalties for breach of contract
Equipping the Research, Technology and Innovation Laboratories KIRDI-Kisumu
189 M 0 189 M 2015 2020 0 150M 891M 5 0 265M
1266M 15 0 160M
1,332M 20 Budget cuts and inadequate financing have been

68 | P a g e
Project Code and Project Title
Total Estimate Cost
Estimate cost of the project (Financing)
Timeline FY 2014/15 FY 2015/16 FY 2016/17 Remarks
Fo
reign
GO
K
Start D
ate
Exp
ected
Co
mp
letion
Date
Ap
pro
ved
Fo
reign
Bud
get
Ap
pro
ved
GO
K B
ud
get
Cum
ulativ
e E
xp
end
iture as
at 30th
June,
2015
Co
mp
letion
Stage as at
30th
Jun
e,2015
(%)
Ap
pro
ved
Fo
reign
Bud
get
Ap
pro
ved
GO
K B
ud
get
Cum
ulativ
e
Exp
end
iture as
at 30th
June,
2016
Co
mp
letion
Stage as at
30th
Jun
e,2016(%
)
Ap
pro
ved
Fo
reign
Bud
get
Ap
pro
ved
GO
K B
ud
get
Cum
ulativ
e
Exp
end
iture as
at 30th
June,
2017
Co
mp
letion
Stage as at
30th
Jun
e,2017(%
)
Ksh Million Ksh Million
major impediment for the completion of the project
Modernization of Rivatex (upgrading of the machinery – Spinning, weaving & finishing sections)
2000M
0 2000M
2015 2020 0 400 400 10 0 450 850 30 0 450 1300 35 Inadequate funding to finalize the upgrading of the machinery in all sections
Construction Constituency Industrial Development Centers. ESP
0 2017 2019 30th June 2020
0 0 0 32 0 50 46.6 32 0 103 72 32 In 2015/2016, and 2016/2017 the funds allocated paid pending bills on CIDCs security bills
One Stop Centre for Investors
200 0 200 Jul-16 Dec-17 0 0 0 0 0 23.7 0 0 0 100 28 30 Budgets cuts and affected the project.

69 | P a g e
Project Code and Project Title
Total Estimate Cost
Estimate cost of the project (Financing)
Timeline FY 2014/15 FY 2015/16 FY 2016/17 Remarks
Fo
reign
GO
K
Start D
ate
Exp
ected
Co
mp
letion
Date
Ap
pro
ved
Fo
reign
Bud
get
Ap
pro
ved
GO
K B
ud
get
Cum
ulativ
e E
xp
end
iture as
at 30th
June,
2015
Co
mp
letion
Stage as at
30th
Jun
e,2015
(%)
Ap
pro
ved
Fo
reign
Bud
get
Ap
pro
ved
GO
K B
ud
get
Cum
ulativ
e
Exp
end
iture as
at 30th
June,
2016
Co
mp
letion
Stage as at
30th
Jun
e,2016(%
)
Ap
pro
ved
Fo
reign
Bud
get
Ap
pro
ved
GO
K B
ud
get
Cum
ulativ
e
Exp
end
iture as
at 30th
June,
2017
Co
mp
letion
Stage as at
30th
Jun
e,2017(%
)
Ksh Million Ksh Million
STATE DEPARTMENT FOR COOPERATIVES
Modernization of New KCC 1,565 0 1565
2015/16
2019/20 0 0 0 0 0 300 300 0 0 470 770 49%
Project ongoing
Development and Implementation of Risk Based Supervision Framework 200 0 200 2015/16 2019/20 0 0 0 0 0 30 30 15% 0 30 60 30%
Project ongoing
Cooperative Development and Management 280 0 280 2017/18 2019/20 0 0 0 0 0 0 0 0 0 0 0 0
This is a planned project which is yet to be funded
Modernization of Cooperative Cotton Ginneries 500 0 500 2018/19 2020/21 0 0 0 0 0 0 0 0 0 0 0 0
This is a planned project which is yet to be funded
Establishment of Cooperative Share Trading Platform on NSE 150 0 150 2018/19 2020/21 0 0 0 0 0 0 0 0 0 0 0 0
This is a planned project which is yet to be funded

70 | P a g e
Project Code and Project Title
Total Estimate Cost
Estimate cost of the project (Financing)
Timeline FY 2014/15 FY 2015/16 FY 2016/17 Remarks
Fo
reign
GO
K
Start D
ate
Exp
ected
Co
mp
letion
Date
Ap
pro
ved
Fo
reign
Bud
get
Ap
pro
ved
GO
K B
ud
get
Cum
ulativ
e E
xp
end
iture as
at 30th
June,
2015
Co
mp
letion
Stage as at
30th
Jun
e,2015
(%)
Ap
pro
ved
Fo
reign
Bud
get
Ap
pro
ved
GO
K B
ud
get
Cum
ulativ
e
Exp
end
iture as
at 30th
June,
2016
Co
mp
letion
Stage as at
30th
Jun
e,2016(%
)
Ap
pro
ved
Fo
reign
Bud
get
Ap
pro
ved
GO
K B
ud
get
Cum
ulativ
e
Exp
end
iture as
at 30th
June,
2017
Co
mp
letion
Stage as at
30th
Jun
e,2017(%
)
Ksh Million Ksh Million
STATE DEPARTMENT FOR TRADE
Establishment of E-Trade Portal
40 N/A
40 July
15
June 18 N/A N/A N/A N/A N/A
9.5 9.5 50 N/A
17.4 26.9 60 Project earmarked to be completed in FY2017/18
Modernization of standards Laboratory
205 N/A
205 July 2015
June 2021
- - - - N/A
8.7 8.7 10 0 0 8.7 10 Money for the project removed through revised budget in FY2016/17
Establishment of Commodities Exchange Platform
5060 3050
1210 July 2014
December 2021
- - - - 0 57.2 57.2 7 52.6 109.8 45 CMA Act amended to regulate spot trading, 18 standards for commodities reviewed, capacity building

71 | P a g e
Project Code and Project Title
Total Estimate Cost
Estimate cost of the project (Financing)
Timeline FY 2014/15 FY 2015/16 FY 2016/17 Remarks
Fo
reign
GO
K
Start D
ate
Exp
ected
Co
mp
letion
Date
Ap
pro
ved
Fo
reign
Bud
get
Ap
pro
ved
GO
K B
ud
get
Cum
ulativ
e E
xp
end
iture as
at 30th
June,
2015
Co
mp
letion
Stage as at
30th
Jun
e,2015
(%)
Ap
pro
ved
Fo
reign
Bud
get
Ap
pro
ved
GO
K B
ud
get
Cum
ulativ
e
Exp
end
iture as
at 30th
June,
2016
Co
mp
letion
Stage as at
30th
Jun
e,2016(%
)
Ap
pro
ved
Fo
reign
Bud
get
Ap
pro
ved
GO
K B
ud
get
Cum
ulativ
e
Exp
end
iture as
at 30th
June,
2017
Co
mp
letion
Stage as at
30th
Jun
e,2017(%
)
Ksh Million Ksh Million
ongoing, framework for devt of the exchange developed. Piloting in collateral management has started. KOMEX will be fully operational by Dec 2018.
Product Development for Export Markets (EPC)
40 N/A
40 July 2014
June
2015
N/A 32.3 32.3 100 N/A
40 40 100 N/A
20 37.8 50 This is an annual activity. In FY2016/17 the activity was not completed due to inadequate funding
County Competitive index (BKB)
49.56 N/A
49.56 September
2015
August 2019
- - - - N/A
9.3 9.3 18 - 2.5 11.8 24 Project entails development and execution of county branding

72 | P a g e
Project Code and Project Title
Total Estimate Cost
Estimate cost of the project (Financing)
Timeline FY 2014/15 FY 2015/16 FY 2016/17 Remarks
Fo
reign
GO
K
Start D
ate
Exp
ected
Co
mp
letion
Date
Ap
pro
ved
Fo
reign
Bud
get
Ap
pro
ved
GO
K B
ud
get
Cum
ulativ
e E
xp
end
iture as
at 30th
June,
2015
Co
mp
letion
Stage as at
30th
Jun
e,2015
(%)
Ap
pro
ved
Fo
reign
Bud
get
Ap
pro
ved
GO
K B
ud
get
Cum
ulativ
e
Exp
end
iture as
at 30th
June,
2016
Co
mp
letion
Stage as at
30th
Jun
e,2016(%
)
Ap
pro
ved
Fo
reign
Bud
get
Ap
pro
ved
GO
K B
ud
get
Cum
ulativ
e
Exp
end
iture as
at 30th
June,
2017
Co
mp
letion
Stage as at
30th
Jun
e,2017(%
)
Ksh Million Ksh Million
Mark of Identity- BKB
75.8 75.8 March 2016
March 2019
- - - - N/A
8.9 8.9 12 N/A
6.5 15.4 20 Project aims to increase consumption of locally produced goods and export of made in Kenya brands
Road to Rio-BKB 1 1 July 2016
June 2017
- - - - - - - - - 1 1 100
STATE DEPARTMENT FOR TOURISM
Tourism Recovery 6,319 -
6,319
Jul-15 Jun-19 -
-
- 0 -
2,718
2,718 43% -
1,101
866 57% On going. The sector ned to carry on with recovery to accelerate and sustain the growth in numbers and earnings
Charter Incentive Programme (CIP)
1,207 -
1,207
Jul-15 Jun-17 -
-
-
0 -
207
207 17% -
200 180 32% Ongoing. 4 new charters enrolled. The

73 | P a g e
Project Code and Project Title
Total Estimate Cost
Estimate cost of the project (Financing)
Timeline FY 2014/15 FY 2015/16 FY 2016/17 Remarks
Fo
reign
GO
K
Start D
ate
Exp
ected
Co
mp
letion
Date
Ap
pro
ved
Fo
reign
Bud
get
Ap
pro
ved
GO
K B
ud
get
Cum
ulativ
e E
xp
end
iture as
at 30th
June,
2015
Co
mp
letion
Stage as at
30th
Jun
e,2015
(%)
Ap
pro
ved
Fo
reign
Bud
get
Ap
pro
ved
GO
K B
ud
get
Cum
ulativ
e
Exp
end
iture as
at 30th
June,
2016
Co
mp
letion
Stage as at
30th
Jun
e,2016(%
)
Ap
pro
ved
Fo
reign
Bud
get
Ap
pro
ved
GO
K B
ud
get
Cum
ulativ
e
Exp
end
iture as
at 30th
June,
2017
Co
mp
letion
Stage as at
30th
Jun
e,2017(%
)
Ksh Million Ksh Million
project has been moved to recurrent
Ronald NgalaUtalii College - TF
4,923 - 4,923
Jul-2013
Jun-18 - 668 1,647 27% -
500
2,334 42% -
562 2,709 47% The project timelines are delayed due to low allocations compared to the budgeted annual requirements. The project has been scaled up by PIC to 8.96B
Open Space Office Modelling and Security System Fitting
180 -
180
Jul-16 Jun-18 -
-
-
0 -
-
-
0 -
120 -
20% The project not completed due to delays in procurement process
BICEC 11,000 - 11,0 Jul-14 Jun-19 565 565 6 160 725 7 885 10 On going. Project

74 | P a g e
Project Code and Project Title
Total Estimate Cost
Estimate cost of the project (Financing)
Timeline FY 2014/15 FY 2015/16 FY 2016/17 Remarks
Fo
reign
GO
K
Start D
ate
Exp
ected
Co
mp
letion
Date
Ap
pro
ved
Fo
reign
Bud
get
Ap
pro
ved
GO
K B
ud
get
Cum
ulativ
e E
xp
end
iture as
at 30th
June,
2015
Co
mp
letion
Stage as at
30th
Jun
e,2015
(%)
Ap
pro
ved
Fo
reign
Bud
get
Ap
pro
ved
GO
K B
ud
get
Cum
ulativ
e
Exp
end
iture as
at 30th
June,
2016
Co
mp
letion
Stage as at
30th
Jun
e,2016(%
)
Ap
pro
ved
Fo
reign
Bud
get
Ap
pro
ved
GO
K B
ud
get
Cum
ulativ
e
Exp
end
iture as
at 30th
June,
2017
Co
mp
letion
Stage as at
30th
Jun
e,2017(%
)
Ksh Million Ksh Million
00 - - - 160 timelines delayed due to change in financing plan
KICC Modernization 4,644 4,644
July 2014
June 22
151 151 3.2%
880 1,031 22.2%
- - - The project is behind schedule since only internally generated revenue has been used over the last two years
WTO Projects 1,500 0 1,500
January 2015
Dec 2015
N/A N/A
N/A N/A N/A
880 1,054 90 N/A
N/A
1,054 95 The verification of cost of the projects and validity of amounts claimed is to be carried out by various

75 | P a g e
Project Code and Project Title
Total Estimate Cost
Estimate cost of the project (Financing)
Timeline FY 2014/15 FY 2015/16 FY 2016/17 Remarks
Fo
reign
GO
K
Start D
ate
Exp
ected
Co
mp
letion
Date
Ap
pro
ved
Fo
reign
Bud
get
Ap
pro
ved
GO
K B
ud
get
Cum
ulativ
e E
xp
end
iture as
at 30th
June,
2015
Co
mp
letion
Stage as at
30th
Jun
e,2015
(%)
Ap
pro
ved
Fo
reign
Bud
get
Ap
pro
ved
GO
K B
ud
get
Cum
ulativ
e
Exp
end
iture as
at 30th
June,
2016
Co
mp
letion
Stage as at
30th
Jun
e,2016(%
)
Ap
pro
ved
Fo
reign
Bud
get
Ap
pro
ved
GO
K B
ud
get
Cum
ulativ
e
Exp
end
iture as
at 30th
June,
2017
Co
mp
letion
Stage as at
30th
Jun
e,2017(%
)
Ksh Million Ksh Million
government expert bodies..
KICC Modernization 4,644 4,644
July 2014
June 22
151 151 3.2%
880 1,031 22.2%
- - - The project is behind schedule since only internally generated revenue has been used over the last two years
1201100600 New Practicals Training Block (Kitchen & Housekeeping Laboratory) – KUC
700 - 700 Jul-14 Jul-17 700 200 200 5 Ongoing project
delayed due to revision of design.
This however does not
change the project cost

76 | P a g e
Project Code and Project Title
Total Estimate Cost
Estimate cost of the project (Financing)
Timeline FY 2014/15 FY 2015/16 FY 2016/17 Remarks
Fo
reign
GO
K
Start D
ate
Exp
ected
Co
mp
letion
Date
Ap
pro
ved
Fo
reign
Bud
get
Ap
pro
ved
GO
K B
ud
get
Cum
ulativ
e E
xp
end
iture as
at 30th
June,
2015
Co
mp
letion
Stage as at
30th
Jun
e,2015
(%)
Ap
pro
ved
Fo
reign
Bud
get
Ap
pro
ved
GO
K B
ud
get
Cum
ulativ
e
Exp
end
iture as
at 30th
June,
2016
Co
mp
letion
Stage as at
30th
Jun
e,2016(%
)
Ap
pro
ved
Fo
reign
Bud
get
Ap
pro
ved
GO
K B
ud
get
Cum
ulativ
e
Exp
end
iture as
at 30th
June,
2017
Co
mp
letion
Stage as at
30th
Jun
e,2017(%
)
Ksh Million Ksh Million
Refurbishment of wataalamu restaurant
30 30 30 100%
Completed
Contsruction of Gym & Spa KUC
72 72 102 100%
Completed
Refurbishment of Office Premises at Utalii House - TRA
60 - 60 Jul-2016
JUNE 2017
- - -
-
- - -
-
- 60 28.3
47.14
Completed during the
financial year
Sustaining New Markets & Siting Booths in Tourism Target Markets - KTB
6,669 -
6,669
Jul-15 Jun-20 - 141 141 3% - 200 341 7% - 1,001
1,342 28% Ongoing. This is a continuous initiative to support marketing
Capital Lending to Hoteliers – TFC
7,600 - 7,600
Jul-15 Jun-20 - - - - - - - - -
375
375
5
Ongoing. Target not. disbursement was affected by non availability of full Board of Directors at

77 | P a g e
Project Code and Project Title
Total Estimate Cost
Estimate cost of the project (Financing)
Timeline FY 2014/15 FY 2015/16 FY 2016/17 Remarks
Fo
reign
GO
K
Start D
ate
Exp
ected
Co
mp
letion
Date
Ap
pro
ved
Fo
reign
Bud
get
Ap
pro
ved
GO
K B
ud
get
Cum
ulativ
e E
xp
end
iture as
at 30th
June,
2015
Co
mp
letion
Stage as at
30th
Jun
e,2015
(%)
Ap
pro
ved
Fo
reign
Bud
get
Ap
pro
ved
GO
K B
ud
get
Cum
ulativ
e
Exp
end
iture as
at 30th
June,
2016
Co
mp
letion
Stage as at
30th
Jun
e,2016(%
)
Ap
pro
ved
Fo
reign
Bud
get
Ap
pro
ved
GO
K B
ud
get
Cum
ulativ
e
Exp
end
iture as
at 30th
June,
2017
Co
mp
letion
Stage as at
30th
Jun
e,2017(%
)
Ksh Million Ksh Million
TFC
Utalii House Rehabilitation-TFC
537 - 537 2011/12
2018/19
- 0 17.9 3.33%
- 0 17.9 3.33% - 0 17.9 3.33%
Project aims at enhancing security and safety as well as attracting high valued tenants.
Funded by
AIA
Mombasa Convention Center
500 - 500 2011/12
2020/21
- 0 0 0 - 0 6 1.20% - 0 6 1.20%
Project terminated

78 | P a g e
2.7. Review of Pending Bills
1. State Department of Industry
Part of pending bills has been cleared with the current budget provision, which is expected to have
an impact on the current financial year performance.
EPZA contractual obligations (work done and not yet paid) amounting to 446m
KIRDI South B Contractual obligations (work done and not yet paid) amounting to 489M.
(there is demand notice totaling to 1.38B for breach of contract and penalties)
KIE contractual obligations (work done and not yet paid) amounting to 53M
KITI food rations and water bills amounting 63M
McKenzie consultancy amounting to 234M
The state department intends to address the pending through:
a. Promptly settling of bills as they are received at the accounting units
b. Reallocation of projects funds based on the priorities
c. Early commitment of project funds and procurement of goods and services, 2 months
before the close of the FY
2. State Department of Co-operatives
The State Department has no pending bills.
3. State department of Trade
As at 30th June 2017, the sub-sector had total pending bills amounting to Kshs.55, 031,761million.
Of this, Kshs.51, 256,141 was recurrent and while Kshs.3, 775,590 was development.
Pending bills for use of goods and services amounted to Kshs.44.70 million while for personal
claims amounted to Kshs.10.33 million.
During the period under review, the sub-sector’s expenditure amounted to Kshs.3, 517.9 Million.
The pending bills were therefore 1.56% of the total sub-sector’s expenditure.
The sub-sector will settle the bills as first charge as well as seek for additional funding from the
National Treasury to cater for the short fall.
4. EAC
The Department of EAC Integration has accumulated pending bill of Kshs. 28 million during the
financial year 2016/17 occasioned by lack of liquidity as at 30th June 2017.
5. Tourism
Total pending bill as at June, 2016 amounted to Kshs 25M.All the pending bills were on the use of
goods and services economic classification. The analysis of the pending bills as a percentage of the
total ministry expenditure was 2.6% in 2014/15, 5% in 2015/16 and then dropped to 0.5% in
2016/17.

79 | P a g e
The resolution of pending bills will take the first charge of the current F/Y 2017/18 resource
allocation as per government requirements.
Table 2.7 below shows the trend in the stock of pending bills for both recurrent and development
expenditure over the review period.
Table 2.7: Summary of Pending Bills by Nature and Type (Kshs. Million)
SDI Due to lack of Exchequer Due to lack of Provision
Recurrent 2014/15 2015/16 2016/17 2014/15 2015/16 2016/17
Compensation of employees 0 0 0 0 0 0
Use of goods and services e.g. utilities, domestic or foreign travel etc.
0 0 65 0 0 0
Social benefits e.g. NHIF, NSSF
0 0 0 0 0 0
Personal Claims 0 0 0 0 0 0
Development
Acquisition on non-financialassets
0 0 0 0 0 0
Use of goods and services e.g. utilities, domestic or foreign travel etc.
0 0 0 0 0 0
Others - Specify 234 0 1222 0 0 0
Total Pending Bills 234 0 1285 0 0 0
SDC Due to lack of Exchequer Due to Lack of Provision
Recurrent 2014/15 2015/16 2016/17 2014/15 2015/16 2016/17
Compensation of Employees 0 0 0 0 0 0
Use of Goods and Services e.g. Utilities, domestic or foreign travel, etc. 0 1.5 0 0 0 0
Social Benefits e.g. NHIF, NSSF 0 0 0 0 0 0
Development
Acquisition of non-financial assets 0 0 0 0 0 0
Use of Goods and Services e.g. Utilities, domestic or foreign travel, etc. 0 0 0 0 0 0
Others-Specify 0 0 0 0 0 0
Total Pending Bills 0 1.5 0 0 0 0
Trade Due to lack of exchequer Due to lack of provision
Recurrent 2014/15 2015/16 2016/17 2014/15 2015/16 2016/17
Compensation to employees 0 0 0 0 0 0
Use of goods and services e.g. utilities, domestic or foreign travel etc.
0 0 41.34 0 0 0
Social benefits e.g. NHIF, NSSF
0 0 0 0 0 0
Other expense (Personal Claims)
0 0 9.92 0 0 0
Development
Acquisition of non-financial 0 0 0 0 0 0

80 | P a g e
assets
Use of goods and services e.g. utilities, domestic or foreign travel etc.
0 0 3.36 0 0 0
Others (Personal Claims) 0 0 0.41 0 0 0
Total Pending Bills 0 0 55.03 0 0 0
EAC Due to lack of exchequer Due to lack of provision
Recurrent 2014/15 2015/16 2016/17 2014/15 2015/16 2016/17
Compensation of employees 0 0 0 0 0 0
Use of Goods and Services 0 0 28 0 0 0
Social Benefits E.g. NSSF, NHIF
0 0 0 0 0 0
Development
Acquisition of non-financial assets
0 0 0 0 0 0
Use of Goods and Services 0 0 0 0 0 0
Total Pending Bills 0 0 28 0 0 0
TOURISM
Recurrent 2014/15 2015/16 2016/17 2014/15 2015/16 2016/17
Compensation of Employees 0 0 0 0 0 0
Use of goods and services e.g Utilities, domestic or foreign travel etc
91.89 78.00 25.00 0 0 0
Social benefits e.g NHIF,NSSF
0 0 0 0 0 0
Other Expense 0 0 0 0 0 0
Development
Acquisition of non-financial assets
0 0 0 0 0 0
Use of goods and services e.g utilities, domestic or foreign travel etc
13.81 183.00 0 0 0 0
Others Specify 0 0 0 0 0 0
Total MoT Pending Bills 105.70 261.00 25.00 0 0 0
Total Sector Pending Bills 339.7 262.5 1393.03 0 0 0

81 | P a g e
CHAPTER THREE
3. MEDIUM TERM PRIORITIES AND FINANCIAL PLAN FY2018/19– 2020/21
3.1. Prioritization of Programmes and Sub-Programmes
Promotion of Industrial Development and Investment
Standards and Business Incubation
Cooperative Development and Management
Trade Development and Promotion
East African Affairs and Regional Integration
Tourism Development and Promotion
General Administration, planning and support services
3.1.1. Programmes and their objectives
PROGRAMMES OBJECTIVE
1. Promotion of Industrial Development and Investment
To create enabling environment to promote and facilitate industrial development through value addition and investment.
2. Standards and Business Incubation To provide standards for industrial products and incubation services to support MSMEs.
3. Cooperative Development and Management
To promote co-operative sector development and improve governance and management of co-operative societies.
4. Trade Development and Promotion To promote trade, broaden export base and markets as well as undertake country branding.
5. East African Affairs and Regional Integration
To coordinate and monitor implementation of the EAC Council decisions and regional programmes
6. Tourism Development and Promotion
To develop tourism products and market Kenya as a tourist destination both locally and internationally.
7. General Administration, planning and support services
To provide efficient support service delivery.

82 | P a g e
3.1.2. Programmes,Sub-Programmes, Expected Outcomes, Outputs and Key performance Indicators (KIPs)
Table 3.1: Programmes/ Sub Programmes, outcomes, outputs and Key Performance Indicator (KIPs) for the sub-sector
Programme Delivery unit Key Outputs Key performance indicators
Target 2016/17
Actual achievement 2016/17
Target(Baseline) 2017/18
Target 2018/19
Target 2019/20
Target 2020/21
1 Programme 1:.Promotion of Industrial development and Investment
Outcome: Increased contribution of the manufacturing sector to the GDP, employment, FDI and exports
SP 1.1: Promotion of Industrial Development
1171001809
Naivasha Freeport & Industrial Park
Special Economic Zones
30,000 acres of Land for the development of the Naivasha Dry Port SEZ
Land acquired
Basic infrastructure developed (roads, water systems, power)
No. of investors attracted for operations
- - Identification and profiling of land parcels
Negotiations on the purchase
30,000 acres of Land
Feasibility studies and
Infrastructure Development
Marketing and investor promotion
Infrastructure Development
Marketing and investor promotion
Development of SEZ Regulations
SEZ Regulations
1 SEZ Regulations
SEZ Regulations published
Supplementary SEZ Regulations
N/A N/A N/A
Amendments to the SEZ Act through Finance Act
Amended SEZ Act
1 1 1 1 1 1
Operationalize the SEZ Act 2015(Authority & Fund)
% of implementation and operationalization
30 20 50 30 N/A N/A
Private SEZ licensed
No of Private SEZ licensed and approved
3 3 4 4 4 4
Detailed designs for Kundu SEZ
Designs developed
- - 1 N/A N/A N/A
Revised Resettlement - - 1 N/A N/A N/A
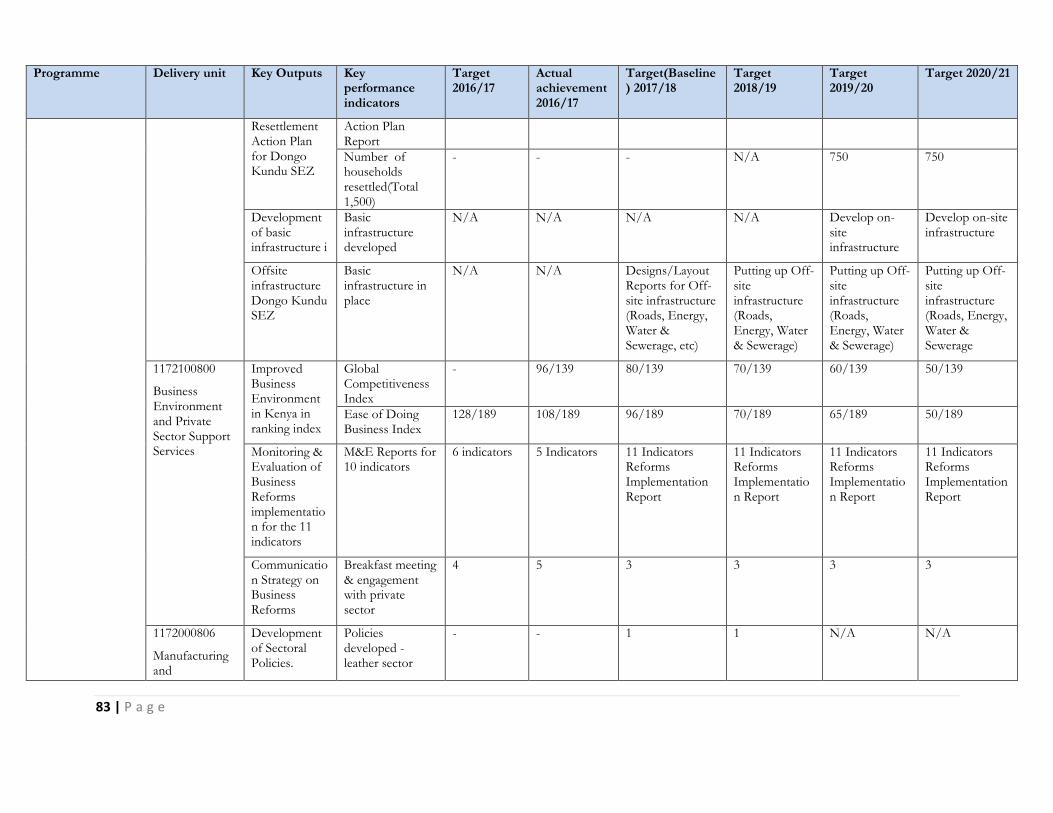
83 | P a g e
Programme Delivery unit Key Outputs Key performance indicators
Target 2016/17
Actual achievement 2016/17
Target(Baseline) 2017/18
Target 2018/19
Target 2019/20
Target 2020/21
Resettlement Action Plan for Dongo Kundu SEZ
Action Plan Report
Number of households resettled(Total 1,500)
- - - N/A 750 750
Development of basic infrastructure i
Basic infrastructure developed
N/A N/A N/A N/A Develop on-site infrastructure
Develop on-site infrastructure
Offsite infrastructure Dongo Kundu SEZ
Basic infrastructure in place
N/A N/A Designs/Layout Reports for Off-site infrastructure (Roads, Energy, Water & Sewerage, etc)
Putting up Off-site infrastructure (Roads, Energy, Water & Sewerage)
Putting up Off-site infrastructure (Roads, Energy, Water & Sewerage)
Putting up Off-site infrastructure (Roads, Energy, Water & Sewerage
1172100800
Business Environment and Private Sector Support Services
Improved Business Environment in Kenya in ranking index
Global Competitiveness Index
- 96/139 80/139 70/139 60/139 50/139
Ease of Doing Business Index
128/189 108/189 96/189 70/189 65/189 50/189
Monitoring & Evaluation of Business Reforms implementation for the 11 indicators
M&E Reports for 10 indicators
6 indicators 5 Indicators 11 Indicators Reforms Implementation Report
11 Indicators Reforms Implementation Report
11 Indicators Reforms Implementation Report
11 Indicators Reforms Implementation Report
Communication Strategy on Business Reforms
Breakfast meeting & engagement with private sector
4 5 3 3 3 3
1172000806
Manufacturing and
Development of Sectoral Policies.
Policies developed - leather sector
- - 1 1 N/A N/A

84 | P a g e
Programme Delivery unit Key Outputs Key performance indicators
Target 2016/17
Actual achievement 2016/17
Target(Baseline) 2017/18
Target 2018/19
Target 2019/20
Target 2020/21
Industrialization Services
- NIP review
Increased export volumes through AGOA
No of firms inspected & licensed
Industrial Sector Support
Aftercare service to new and existing industries
No of meetings & issues resolved
- - 20 20 20 20
Increased trade flows and market access
No of TBs & NTBs
Removed
1 1 2 2 2 2
Industrialization Secretary
Increased manufacturing contribution to GDP
% growth of the manufacturing sector
10 9.8 11 15 18 20
1172001200
Small and Micro Enterprises Development
Increased MSMEs formalization & operations
MSME Policy developed
- - 1 N/A N/A N/A
Develop SME park
SMEs parks constructed
- - - 1 Infrastructure development
Marketing and support to SMEs
Business Development Services
No. of MSEs trained on Business Management
1000 300 1200 1200 1500 1800
Vision 2030 Delivery Unit
Agro-Industrial Park
No of Agro-Industrial Park
- - Land identification
1 1 1

85 | P a g e
Programme Delivery unit Key Outputs Key performance indicators
Target 2016/17
Actual achievement 2016/17
Target(Baseline) 2017/18
Target 2018/19
Target 2019/20
Target 2020/21
constructed developed
Food Hub constructed at Dongo Kundu
Food Hub developed
- - - 1 1 1
Design master plan and feasibility studies
Master plan and feasibility studies report
3 1 2 N/A N/A N/A
Marketing and promotion of the site
Marketing and promotional strategy
N/A N/A 1 2 investment forum held
2 investment forum held
2 investment forum held
1172000600 County Industrial Support Services
County Resource endowment Mapping and Investment Profiling
No. of Counties Mapped and investments opportunities profiled
10 5 10 10 10 12
1172102001
Kenya Petroleum Technical Assistance
Demand & Supply Analysis, Skills Gap Analysis and Training
Reports and No of SMEs trained
2 studies 2 studies No. of SMEs trained & contracted
No. of SMEs trained & contracted
No. of SMEs trained & contracted
No. of SMEs trained & contracted
1172100600
Textile Development and Apparel
Athi River Textile Hub Developmen: - Construct 120,000M2 area of industrial warehouses
-Construct 14Kms of internal access roads
No. of industrial warehouses
10 0 15 15 N/A N/A
New & existing Internal roads construction
12 KM 10 KM 12 KM 13 KM 13 KM N/A
Water supply line improvement
6500M3
water tank Constructed 6500M3 water tank
4 Kms of Water Distribution lines laid
4.4 kms of Water Distribution lines laid
N/A N/A
No. of investors 2 2 5 15 20 20

86 | P a g e
Programme Delivery unit Key Outputs Key performance indicators
Target 2016/17
Actual achievement 2016/17
Target(Baseline) 2017/18
Target 2018/19
Target 2019/20
Target 2020/21
-Repair 10 kms of existing internal roads
Construct water supply system (pipeline 8.3kms & tank 6500 M3
)
-Construct 20 kms of truck sewer line
-Construct 8kms of precast wall for the zone
attracted for operations
Increase the level of direct invest from 70B to 100B
N/A N/A 70B 80B 90B 100B
Investment & Marketing Promotional Fora
1 1 2 4 4 4
Increased export earnings from ksh 64B to ksh 105B
N/A N/A 64B 75B 95B 105
Trunk sewer line constructed in Kms
N/A N/A 5 KM 7 KM 8 KM N/A
Precast wall constructed
N/A N/A 4 KM 4 KM N/A N/A
1172101100
Rivatex East Africa Limited
Modernization of all machinery including the Production, spinning, weaving and finishing
Percentage of completion of the purchase, installation and commissioning of all machinery
30%
(Production and spinning machinery)
30%
(Production and spinning machinery)
30%
(Weaving and finishing machinery)
30%
(Weaving and finishing machinery)
30%
(Finishing, warehousing and marketing)
10%
(Finishing, warehousing and marketing)
1172100500
Leather Development
Develop Basic infrastructure for leather industrial park in Kenanie:
-Construction of an
effluent treatment plant (CETP)
-water pipeline, storage and
Basic infrastructure developed
10% 10% 30% 40% 20% N/A

87 | P a g e
Programme Delivery unit Key Outputs Key performance indicators
Target 2016/17
Actual achievement 2016/17
Target(Baseline) 2017/18
Target 2018/19
Target 2019/20
Target 2020/21
sewerage systems
-power installation and distribution
-Upgrading of the internal roads to all weather
Marketing and Investment strategy and promotion for the park
Investment and marketing promotional strategy
1 Draft Strategy finalized 2 Investment promotions
2 investment promotions
2 investment promotions
Development of Common Manufacturing Facility (CMF)for Leather (Kariokor)
% of completion of the Manufacturing Facility with equipment
100 20 30 50 N/A N/A
No. of SMEs using the facility
- - - 200 200 300
EPZA
Local & Foreign Investments in EPZs
Amount of Investments in Ksh (billions)
57 71 83 90 100 110
Jobs created in EPZ enterprises
No. of jobs created
52,000 52,947 65,000 75,000 80,000 85,000
Export Earnings
value in Ksh.(billions)
66 64 70 75 90 95
KenInvest Local & Foreign Direct Investments in all sectors
Amount of Investments in Ksh (Billions)
230 159.16 200 250 300 350

88 | P a g e
Programme Delivery unit Key Outputs Key performance indicators
Target 2016/17
Actual achievement 2016/17
Target(Baseline) 2017/18
Target 2018/19
Target 2019/20
Target 2020/21
Aftercare (New and Existing Projects)
No. of Projects Facilitated
300 169 169 200 250 300
NMC Ferrous and non- ferrous foundry products Cast and sold by NMC
Value of product casts sold Million
15 15 17 18 19 20
Casting of industrial spares
No of Production castings in tonnes
210 184 220 250 300 350
Transmission parts developed
No of parts 9000 9295 9500 10,000 10,200 10,500
1.2: Skills Development
KITI Students trained in industrial skills
No .of students trained
600 650 650 700 750 800
New Training machinery and equipment installed
No of New machines installed (%)
50 25 25 25 25 N/A
2 Standards and Business Incubation
Programme outcome: Increased contribution of industry to GDP.
2.1 Standards, Metrology and Conformity Assessment
KENAS Awareness on Accreditation services undertaken
No. of awareness programmes undertaken
16 CABs
19 CABs
30 CABs 30 CABs 30 CABs 30 CABs
Conformity assessment bodies accredited
No. of conformity assessment bodies accredited
90 104 104 110 115 120

89 | P a g e
Programme Delivery unit Key Outputs Key performance indicators
Target 2016/17
Actual achievement 2016/17
Target(Baseline) 2017/18
Target 2018/19
Target 2019/20
Target 2020/21
across sectors
KEBS New standards developed
No. of new Standards Developed
440 533 430 450 460 500
Develop a standard for e-learning tablets
No. of Standards Developed
1 1 N/A N/A N/A N/A
Products conforming to standards in the market
No. of certified products for SMEs
2080
2296 2300
2400
2500
2600
No. of products certified for large firms
7415 7427 7500 7600 7660 7700
KIPI New Trade Marks applications and Registration
No. of new trade marks
3400 6400
5000 5200 5400 5600
Outreach program for IP Technical Advice
No of persons trained
6000 6000 6300 6500 6700 6900
2.2 Business Financing & incubation
KIE (1172101300)
Credit disbursed
Amount of credit disbursed (Million)
300 269 650 1,000 700 700
MSMEs job creation
No. of jobs created
14,280
22,260
4,000 8,500 10,000 10,600
Creation of New Enterprises
No. of new enterprises
476 742 750 800 850 900
MSEA Skills development
No of MSE 2000 2000 1000 5000 5000 5000

90 | P a g e
Programme Delivery unit Key Outputs Key performance indicators
Target 2016/17
Actual achievement 2016/17
Target(Baseline) 2017/18
Target 2018/19
Target 2019/20
Target 2020/21
(1172100400) for entrepreneurs
Operators trained
Increased market access for SMEs
No of exhibitor facilitated
20 20 15 200 300 300
Upgrading of utilities and complete construction works for Kariobangi Enterprise Development Centre of Excellence
Utilities and completion works done
Civil works 0 Civil works for the drainage system
Carry out phase 2 –
Carry out phase 3
Refurbishment and equipping of Constituency Industrial Development Centers (CIDC)
No. of CIDCs refurbished and equipped
24 0 56 56 56 N/A
IDB Credit disbursed
Amount Industrial credit disbursed(Million)
167 212 1627 2,240 3,867 7,734
ICDC Development of Eldoret industrial park
Feasibility studies and master planning
Feasibility studies
master planning report
Validated Feasibility studies
Marketing strategy
Promotion forums
Phase 1 Basic Infrastructure
2 promotion forums
Phase 2: Basic Infrastructure
2 promotion forums
Promotion forums
Industrial Credit to Small
Amount of 1.3 0.8 1.5 1.5 1.5 N/A

91 | P a g e
Programme Delivery unit Key Outputs Key performance indicators
Target 2016/17
Actual achievement 2016/17
Target(Baseline) 2017/18
Target 2018/19
Target 2019/20
Target 2020/21
medium & large enterprises
investments
Kshs Billion
2.3 Industrial Research, Development & Innovations
KIRDI Complete development of Research, Technology & Innovation Laboratories & related infrastructure in Nairobi (South B)
Percentage of completion (%)
75 65 65 75 100 N/A
Equipping Research, Technology and Innovation laboratories at KWRC with state of the art Research machines & equipment
Percentage completion of equipping project (%)
35 25 35 70 80 100
Undertake Industrial Research, Technology and Innovation projects
No. of Industrial Research, Technology and Innovation projects undertaken
22 0 23 25 30 20
Upgrading of Technologies Processes & products
No. of technologies upgraded
3 16 10 12 15 15

92 | P a g e
Programme Delivery unit Key Outputs Key performance indicators
Target 2016/17
Actual achievement 2016/17
Target(Baseline) 2017/18
Target 2018/19
Target 2019/20
Target 2020/21
KIPI New Trade Marks applications and Registration
No. of new trade marks
3400 6400
5000 5200 5400
Outreach program for IP Technical Advice
No of persons trained
6000 6000 6300 6500 6700 6900
3 General Administration, planning and support services Programme outcome: Effective and efficient service delivery
3.1 General Administration, planning and support services
Planning Monitoring & Evaluation
M&E Reports 2 1 4 4 4 4
Ministerial Programme Review
PPR Reports 1 1 1 1 1 1
Medium Term Expenditure Framework
Sub Sector Report
Programme Performance Based Budget
2 2 2 2 2 2
Administration Refurbishment of offices
No of Refurbished offices
3 0 1 1 1 1
Ministry’s ISO Certification
ISO Certification 1 0 1 N/A N/A N/A
Work Environment Survey
Survey Report 1 0 1 1 1 1
Automation of offices (%)
Automation Level 55 45 50 70 80 85

93 | P a g e
Programme Delivery unit Key Outputs Key performance indicators
Target
2016/17
Actual achievement 2016/17
Target (Baseline) 2017/18
Target 2018/19
Target 2019/20
Target 2020/21
1. Programme Co-operative development and Management Programme outcome: Increase contribution of co-operatives to the economy
Sub- Programme 4.1:Governance and accountability
ECCOS Governance and Anti-Corruption policy enforced in co-operatives
No. of societies complying with the policy
4246 4500 4600 4650 4700 4750
Co-operative Audit
Registered audited accounts
No. of audited accounts registered
3000 3764 4000 4200 4500 5000
Co-operative Registration
Inquiries of co-operative societies
No of inquiries carried out
15 18 20 20 20 20
Co-operative Registration
Completion of liquidation of co-operative society
No of liquidations completed
2 5 3 3 4 4
Sub- Programme 4.2: Co-operative advisory services
Co-operative Registration
New co-operatives Registered
No. of new co-operatives registered
1800 1430
1500 1600 1700 1800
New SACCOs registered in Diaspora
No of new SACCOs registered in diaspora
2 4 2 3 3 3
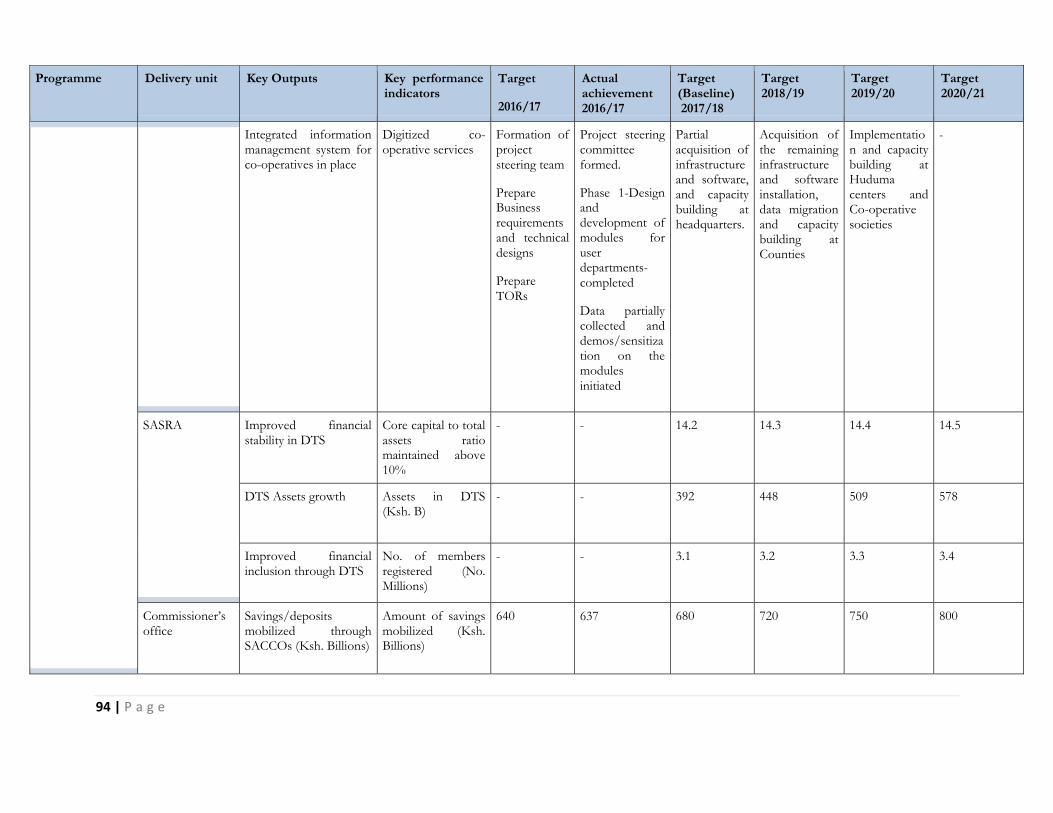
94 | P a g e
Programme Delivery unit Key Outputs Key performance indicators
Target
2016/17
Actual achievement 2016/17
Target (Baseline) 2017/18
Target 2018/19
Target 2019/20
Target 2020/21
Integrated information management system for co-operatives in place
Digitized co-operative services
Formation of project steering team
Prepare Business requirements and technical designs
Prepare TORs
Project steering committee formed.
Phase 1-Design and development of modules for user departments- completed
Data partially collected and demos/sensitization on the modules initiated
Partial acquisition of infrastructure and software, and capacity building at headquarters.
Acquisition of the remaining infrastructure and software installation, data migration and capacity building at Counties
Implementation and capacity building at Huduma centers and Co-operative societies
-
SASRA
Improved financial stability in DTS
Core capital to total assets ratio maintained above 10%
- - 14.2 14.3 14.4 14.5
DTS Assets growth Assets in DTS (Ksh. B)
- - 392 448 509 578
Improved financial inclusion through DTS
No. of members registered (No. Millions)
- - 3.1 3.2 3.3 3.4
Commissioner’s office
Savings/deposits mobilized through SACCOs (Ksh. Billions)
Amount of savings mobilized (Ksh. Billions)
640 637 680 720 750 800

95 | P a g e
Programme Delivery unit Key Outputs Key performance indicators
Target
2016/17
Actual achievement 2016/17
Target (Baseline) 2017/18
Target 2018/19
Target 2019/20
Target 2020/21
Outstanding remittances to SACCOs recovered (Ksh. Millions)
Amount of outstanding remittances recovered (Ksh. Millions)
250 170 220 200 150 120
Cotton co-operative Strengthened to participate effectively in textile value chain
No. of cotton co-operatives strengthened
4 4 4 2 3 5
Housing and Investments Co-operatives strengthened to participate in provision of 1,000,000 low cost housing units
No. of housing units constructed
- - 2,000 5,000 10,000 15,000
Concept Paper, policy and model bylaws for transport cooperatives
3 documents developed
- - 3 - - -
Transport SACCOs Streamlined
No of Transport SACCOs streamlined
3 10 20 100 200 300
Skills development in youth cooperatives
No. of youth co-operatives covered
60 3 70 80 100 150
Finalization of the Co-operatives Development Policy and review of Legislations
No of acts/ rules reviewed and disseminated
2 1 2 (Coop Societies Act &Coop Societies rules)
2 (SACCO ACT & SACCO Regulations)
1 (Model County Coop Acts)
-

96 | P a g e
Programme Delivery unit Key Outputs Key performance indicators
Target
2016/17
Actual achievement 2016/17
Target (Baseline) 2017/18
Target 2018/19
Target 2019/20
Target 2020/21
Co-operative sector management tools developed
Co-operative handbook Member Recruitment manual Co-operative audit manual Prudential guidelines for non-deposit taking SACCOs, housing and investment and coffee cooperatives. Develop Diaspora Cooperatives Policy. Co-operative Debt waiver policy
Co-operative audit manual
TOR developed
Develop audit manual Develop Diaspora Cooperatives Policy. Develop Co-operative Debt waiver policy
Develop Member Recruitment manual Review Co-operative handbook Develop Prudential guidelines for non-deposit taking SACCOs, housing and investment cooperatives.
Dissemination of manuals and policies.
-
International co-operative collaborations & linkages Strengthened
No of MOUs signed and implemented
2 2 2 2 2 2
Establishment of Co-operative Share trading platform
Share trading platform
- Concept paper in place
Feasibility study to identify the policy, legal and institutional requirements.
Review of the policy and legal framework in line with the recommendation of the study
Policy and legal framework review
Establishment of institutions and structures

97 | P a g e
Programme Delivery unit Key Outputs Key performance indicators
Target
2016/17
Actual achievement 2016/17
Target (Baseline) 2017/18
Target 2018/19
Target 2019/20
Target 2020/21
Sub- Programme 4.3: Marketing ,Value Addition & Research
Co-operative marketing /new ventures
Value addition technologies promoted and adopted by co-operatives
No of co-operatives utilizing value-addition technologies
25 22 5 7 10 15
New ventures and innovations in co-operatives promoted
No. of new ventures promoted
1 0
2 1 1
Co-operatives linked to development partners and agencies
No of co-operative linked
25
103
50
60
70
80
Co-operative Marketing Strategy in place
Marketing Strategy report
- - Concept Paper Base line Survey
Develop the Strategy
Dissemination -
Processing units for fruits and vegetable through co-operatives established
No. of processing units established by co-operatives
- 2
2 4 3 8
Sub- Programme 4.4: Co-operative management and investment
NEW KCC New milk processing machinery and equipment
Modernized Eldoret Milk processing plant
Acquisition of packaging and refrigeration machines, and upgrade of Effluent plant in Sotik Acquisition
NKCC Eldoret Factory: Machines (UHT processing and packaging line comprising of a sterilizer, aseptic tank, three filling machines (250ml, 500ml
Acquisition of new processing line complete with Pasteurizer, Separator and Homogenizer, New CIP (Cleaning –in-
Nyahururu – Roof rehabilitation (remove asbestos and raise roof to allow racking)
Sotik – Acquire
Eldoret Factory: Acquisition of Mala processing line
Kitale Factory: Acquisition of Boiler
-

98 | P a g e
Programme Delivery unit Key Outputs Key performance indicators
Target
2016/17
Actual achievement 2016/17
Target (Baseline) 2017/18
Target 2018/19
Target 2019/20
Target 2020/21
of TFA filling machine for Nyahururu plant Roofing Dandora plant
and 1 litre) complete with downstream equipment) were delivered, installed and commissioned.
Dandora NKCC factory: Civil and Installation (A mala and yoghurt processing line, Gable top packing machine) works ongoing.
Nyahururu NKCC plant: Machines (TFA Conversion kit, TFA machine and Cleaning in Place system) were delivered and installed.
place system), Tinned Powder filling line for Kiganjo plant.
Installation of New Ghee packing line, Cleaning in place system, Refrigeration system upgrade atKitale plant.
Sinking of Bore hole , setting up a water treatment plant, Rehabilitation of refrigeration system at Miritini plant.
Industrial Uninterruptable Power Supply System and CIP unit
Eldoret – Expansion of UHT stores
Miritini Factory: Acquisition of Boiler
Nyahururu Factory: Acquisition of Aseptic Tank , Air Compressor and Refrigeration compressor.

99 | P a g e
Programme Delivery unit Key Outputs Key performance indicators
Target
2016/17
Actual achievement 2016/17
Target (Baseline) 2017/18
Target 2018/19
Target 2019/20
Target 2020/21
New KCC Powdered Milk store Metric tons of powdered milk stored
1250 Metric
tons 1250 Metric
tons 1250 Metric
tons
SASRA Development of Risk Based Supervision system (RBS)
% Completion Acquisition and installation of RBS ICT infrastructure (software and hardware)
Consultant contracted to review the RBS framework
Review report, system specifications and upgrade the system.
Commission the upgraded RBS
Link the RBS to Deposit Guarantee Fund.
-
Sub-Programme 4.5: General Administration, planning and support services
Planning Monitoring & Evaluation
M&E Reports 2 1 2 2 2 2
Ministerial Programme Review
PPR Reports 1 1 1 1 1 1
Cooperative sector data and contribution to GDP
Cooperative sector report
- - - 1 - -
Finace/Planning MTEF Sub-Sector/sector report
1 1 1 1 1 1
Finance/Planning
Budget Preparation Report 1 1 1 1 1 1
Finance Budget utilization Level of funds utilization%
100 99 100 100 100 100

100 | P a g e
Programme Delivery unit Key Outputs Key performance indicators
Target
2016/17
Actual achievement 2016/17
Target (Baseline) 2017/18
Target 2018/19
Target 2019/20
Target 2020/21
Finance A-in-A collection Amount collected Ksh. millions
6.5 8.755 6.5 6.5 6.5 6.5
Administration Refurbishment of offices
No of Refurbished offices
1 1 1 6 1 1
Ministry’s ISO Certification
ISO Certification 1 0 1 1 1 -
Work Environment Survey
Survey Report 2 0 1 1 1 1
Automation of offices Automation Level %
70 75 80 90 100 100
Programme Delivery Unit Key Output Key Performance Indicators
Target 2016/ 17
Actual Achievement 2016/17
Target (Baseline) 2017/18
Target 2018/19
Target 2019/20
Target 2020/21
Programme Name: Trade Development and Promotion
Programme Outcome: Improve business environment and facilitate growth of Trade
0307010 S.P3.1 Domestic Trade Development
Internal Trade Maragua Wholesale hub and Athi-River Tier 1 retail market
% completion of
master design of
wholesale hub in
Maragua and Tier
1 retail market in
Athiriver
100 0 0 100 Building of wholesale hub in Maragua and Tier 1 retail market in Athi-river
Building of wholesale hub
in Maragua and Tier 1
retail market in Athi-river
E-trade portal % development of e- portal
100 60 80 100 Operational E-trade Portal
Operational E-trade Portal
Bi-annual interactive forums for Trade
No. of bi-annual interactive forums with Counties
4 1 2 2 2 2

101 | P a g e
Programme Delivery Unit Key Output Key Performance Indicators
Target 2016/ 17
Actual Achievement 2016/17
Target (Baseline) 2017/18
Target 2018/19
Target 2019/20
Target 2020/21
Programme Name: Trade Development and Promotion
Programme Outcome: Improve business environment and facilitate growth of Trade
Conduct a survey on ease of doing business in the Counties
No. of survey reports on ease of doing business in Counties
N/A N/A 10 10 10 10
Profile locally produced Products to be promoted under Buy Kenya Build Kenya
List of Locally Produced Products
N/A N/A N/A 1 - -
Develop e-commerce policy and Trade licensing regime
Policy in Place N/A N/A N/A 1 Implementation
Implementation
Establish integrated one stop offices for accessing National and County governments business information and licenses for wholesale and retail trade
No. of integrated one stop offices established
N/A N/A N/A 10 10 10
Trade Research and Policy
Trade Data Bank % completion rate of trade data bank
100 0 20 100
Operational Trade data bank
Operational Trade data bank
Kenya National Trading Corporation (KNTC)
Improved Warehouse Infrastructure
No. of warehouses refurbished
N/A N/A 1 1 2 1
0307020 S.P 3.2: Fair Trade and Consumer Protection
Weights and Measures
Compliance and Standards
No. of Weighing and Measuring equipment approved
18 9 7 12 14 16
No. of Weighing and Measuring County standards calibrated
295 320 300 330 370 400
% completion rate 20 0 5 20 40 80
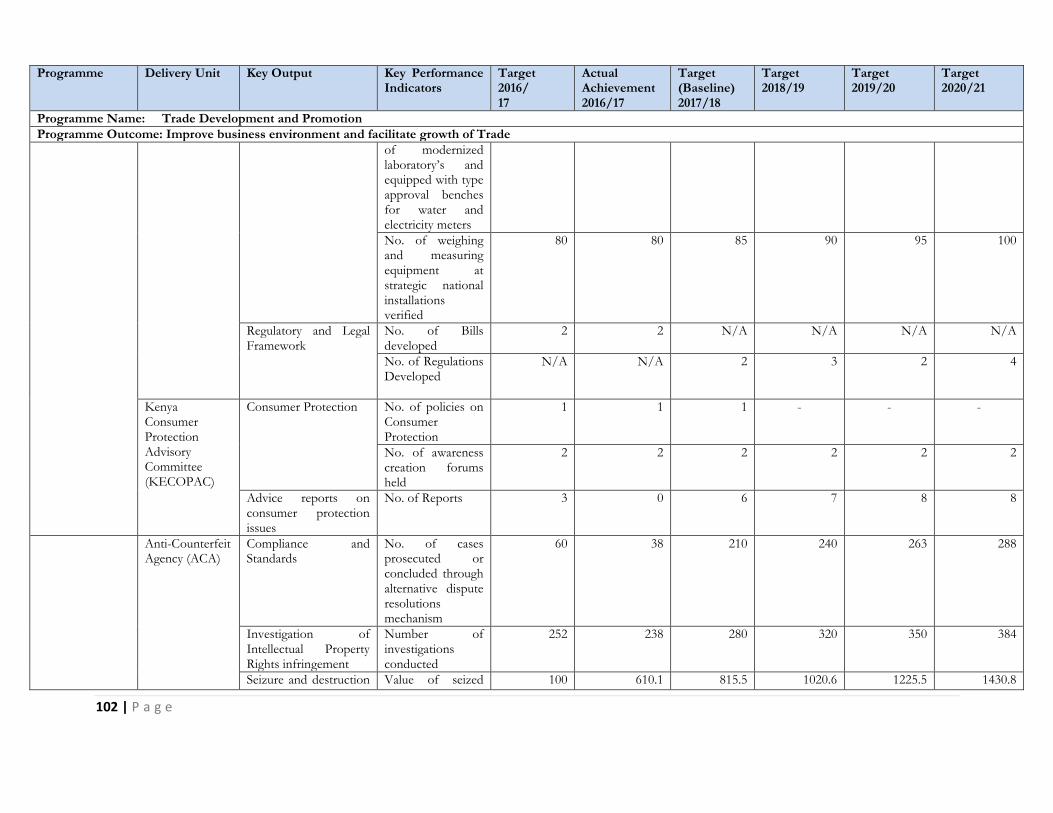
102 | P a g e
Programme Delivery Unit Key Output Key Performance Indicators
Target 2016/ 17
Actual Achievement 2016/17
Target (Baseline) 2017/18
Target 2018/19
Target 2019/20
Target 2020/21
Programme Name: Trade Development and Promotion
Programme Outcome: Improve business environment and facilitate growth of Trade
of modernized laboratory’s and equipped with type approval benches for water and electricity meters
No. of weighing and measuring equipment at strategic national installations verified
80 80 85 90 95 100
Regulatory and Legal Framework
No. of Bills developed
2 2 N/A N/A N/A N/A
No. of Regulations Developed
N/A N/A 2 3 2 4
Kenya Consumer Protection Advisory Committee (KECOPAC)
Consumer Protection No. of policies on Consumer Protection
1 1
1 - - -
No. of awareness creation forums held
2 2 2 2 2 2
Advice reports on consumer protection issues
No. of Reports 3 0 6 7 8 8
Anti-Counterfeit Agency (ACA)
Compliance and Standards
No. of cases prosecuted or concluded through alternative dispute resolutions mechanism
60 38 210 240 263 288
Investigation of Intellectual Property Rights infringement
Number of investigations conducted
252 238 280 320 350 384
Seizure and destruction Value of seized 100 610.1 815.5 1020.6 1225.5 1430.8

103 | P a g e
Programme Delivery Unit Key Output Key Performance Indicators
Target 2016/ 17
Actual Achievement 2016/17
Target (Baseline) 2017/18
Target 2018/19
Target 2019/20
Target 2020/21
Programme Name: Trade Development and Promotion
Programme Outcome: Improve business environment and facilitate growth of Trade
of counterfeit goods goods (Kshs. Millions)
Value of goods destroyed (Kshs. in Millions)
100 320.4 445.6 595.4 770.6 980.9
Purchase of seized goods holding depots
No. of seized goods holding depots
1 0 1 2 1 N/A
Development of an Anti-Counterfeit Agency Quick Response (QR) solution
% completion of ACA QR Solution
N/A N/A N/A 80 20 N/A
Development of Enforcement case management system
% completion of case management system
N/A N/A N/A 60 40 N/A
Baseline survey to establish the level of awareness and the magnitude of counterfeiting by sector
No. of Baseline surveys
N/A N/A N/A 1 N/A N/A
Public education and sensitization through outreach programs and media
Number of outreach programmes to create publicity about intellectual Property Rights
5 17 32 40 50 62
0307030 S.P3.3: Exports Market Development
Export Promotion Council
Promotional activities conducted
No. of trade promotional events conducted
10 16 15 16 11 11
Establish an Export Credit Guarantee Scheme
Operational Export Credit Guarantee Scheme
Credit Guarantee Bill Drafted
Credit Guarantee Bill Drafted
Cabinet Approval
Enactment of the Credit Guarantee Bill
Operationalization of Credit Guarantee Scheme
Operational Credit Guarantee Scheme
Develop National National Export Develop Concept Note Sectoral National NES NES

104 | P a g e
Programme Delivery Unit Key Output Key Performance Indicators
Target 2016/ 17
Actual Achievement 2016/17
Target (Baseline) 2017/18
Target 2018/19
Target 2019/20
Target 2020/21
Programme Name: Trade Development and Promotion
Programme Outcome: Improve business environment and facilitate growth of Trade
Export Strategy Strategy in place Concept Note
Developed, Adopted and Resourced.
Consultations and sectoral Strategies Developed.
Export Development Strategy Completed and Adopted.
Implemented Implemented
Establishment of an Export/ Import Financing Bank
Export/ Import Financing Bank
N/A N/A Develop Conceptual Framework
EXIM Bank
Policy
Adopted.
Exim Bank Bill enacted.
EXIM Bank Incorporated
Operationalization of Export/ Import Financing Bank
Establishment of Export Development Fund
Established N/A N/A Conceptual Framework Developed and Approved
Consultations and Development of Policy.
Legal Frameworks Developed and approved by the Cabinet
Establishment of the Fund and Resourcing.
0307040 S.P3.4 Regional Economic Integration Initiatives
Regional Trade and Exports
Establishment of Commodities Exchange Platform
% completion rate of establishment and operationalization of the commodities exchange platform
55 45 60 85 100 (Start of commodities
trading)
Commodities Exchange
fully operational
Develop Kenya Exchange Commodity Legal Framework
Bill enacted into Law
N/A N/A 1 Implementation
Implementation
Implementation
0307050 S.P3.5 Entrepreneurship and Management Training
Kenya Institute of Business Training (KIBT)
Trained Micro Small and Medium Enterprises operators
No. of MSME operators trained
3700 2975 900 1500 1800 2000
Onsite consultancy under the Homan Resource Development for Industrial Development (HRD-
No. of firms offered Consultancy
6 8 8 10 12 15

105 | P a g e
Programme Delivery Unit Key Output Key Performance Indicators
Target 2016/ 17
Actual Achievement 2016/17
Target (Baseline) 2017/18
Target 2018/19
Target 2019/20
Target 2020/21
Programme Name: Trade Development and Promotion
Programme Outcome: Improve business environment and facilitate growth of Trade
ID)/JICA Project
Establish an Entrepreneurship Training Centre (EMPRETEC)
% establishment of the EMPRETEC
N/A N/A 20 80 100 Operational EMPRETEC center
Partitioned, Fitted and furnished KIBT Parklands office Complex
% completion rate of partitioning, fitting and furnishing of KIBT Parklands office Complex
N/A N/A 30 30 20 20
0307060 S.P 3.6 International Trade
International Trade
Established export market in foreign Countries
Number of Trade and investment exhibitions/meetings/trade fairs and cultural diplomacy meetings attended/organized and facilitated
6 11 12 12 12 15
No. of missions that have established showrooms to display Kenyan products
14 14 14 20 25 30
Increased Foreign Direct Investment (FDI) and oversees development assistance
No. of attendant resolutions arising from inbound investment meetings
20 14 14 16 17 18
No. of attendant resolutions arising from outbound investment meetings
5 5 7 8 9 10

106 | P a g e
Programme Delivery Unit Key Output Key Performance Indicators
Target 2016/ 17
Actual Achievement 2016/17
Target (Baseline) 2017/18
Target 2018/19
Target 2019/20
Target 2020/21
Programme Name: Trade Development and Promotion
Programme Outcome: Improve business environment and facilitate growth of Trade
Markets for Kenyan Goods and Services
No. of Bilateral/Regional/Multilateral Trade Agreements/MOUs/ instruments/policies negotiated and concluded
7 9 7 8 9 10
Establish a Trade Remedies Agency
Operational Trade Remedy Agency
N/A N/A Trade Remedy Act enacted into Law and initiate establishment Trade Remedy Agency
Operationalize Trade Remedy Agency
Operational
Trade Remedy
Agency
Operational
Trade
Remedy
Agency
Establish Secretariat for the National Trade Facilitation Committee (NTFC)
Operational Secretariat
N/A N/A Set up NTFC Secretariat
Operational Secretariat
Operational
Secretariat
Operational
Secretariat
Establish a National Trade Negotiations Council (NTNC)
National Trade Negotiation Council gazette
N/A N/A Gazette National Trade Negotiations Council
Operational NTNC
Operational NTNC
Operational NTNC
Open Commercial Trade Missions Abroad
No. of Missions opened
N/A N/A N/A 10 10 11
Establish Commercial Centres in London, New York and Dubai
No. of Commercial Centres opened
N/A N/A N/A 1 1 1
0307080 SP.3.8: General
Headquarters Administrative Services
Provision of Administrative Services
Level of automation of services
60 55 100 100 100 100

107 | P a g e
Programme Delivery Unit Key Output Key Performance Indicators
Target 2016/ 17
Actual Achievement 2016/17
Target (Baseline) 2017/18
Target 2018/19
Target 2019/20
Target 2020/21
Programme Name: Trade Development and Promotion
Programme Outcome: Improve business environment and facilitate growth of Trade
Administration, Planning and Support Services
Finance and Procurement Services
Provision of Financial Support Services
% financial services facilitation to trade programmes/Projects
100 100 100 100 100 100
Planning Services
Monitoring and Evaluation reports
No. of quarterly and annual reports
5 5 5 5 5 5
Development of Policies and Regulatory Framework
No. of Policies and Bills
2 2 1 N/A N/A N/A
0307090 S.P 3.9 Country Branding and Marketing
Brand Kenya Board
Branding of counties based on the findings of the County Competitiveness Index survey
Number of counties branded
2 -
7 15 15 10
Dissemination of positive narrative about Kenya Brand through implementation of an integrated marketing and communication campaigns
% level of
dissemination of
positive narrative
about Kenya
- - 70 75 80 85
Increased preference of Kenyan goods and services through adoption of Made in Kenya mark of identity
Number of firms (goods and services) adopting the mark of identity
- - 45 50 55 60
Adoption of Public Service Re - Branding Guidelines
Number of MDAs adopting the guidelines
18 -
10 50 20 20

108 | P a g e
Sub Programme
Delivery Unit
Key Outputs Key Performance Indicators
Target 2016/17 Actual Achievement 2016/17
Target Baseline 2017/18
Target 2018/19 Target 2019/20
Target 2020/21
P5: East African Affairs and Regional Integration
Programme Outcome: Integrated EAC region and Improved socio-economic status of all Kenyans
Headquarters Administrative Services
Administrative services % index of work environment satisfaction
62 62 72% 74% 80% 81%
% index of work customer satisfaction
65 65 73% 75% 76% 76%
% index of work employee satisfaction
67 67 75% 77% 78% 79%
Regional Integration Centres
Regional Integration Centres (RICs) operationalized
No. RICs operationalized
0 0 1 1 1 1
Empowered stakeholders on EAC Integration
No of joint Cross Border sensitization workshops
3 5 5 8 8 8
Research /Reference Document Centre
Automation of Library Services
% level of automation of library services
30% 30% 35% 50% 55% 57%
Information Comm. & Technology Unit
Information Technology services
% Level of automation of services
56% 56% 75% 80% n 85% 85%
Central Planning Unit
Planning Services No. M&E of Reports
5 5 5 5 5 5
National Publicity and Advocacy for EAC Regional Integration
Informed & Empowered stakeholders on customs unions, common market, monetary union and
No. of sensitization workshops held with stakeholders
10 12 10 15 15 10

109 | P a g e
Sub Programme
Delivery Unit
Key Outputs Key Performance Indicators
Target 2016/17 Actual Achievement 2016/17
Target Baseline 2017/18
Target 2018/19 Target 2019/20
Target 2020/21
political federation
East African Community
Compliance with Harmonized EAC tariffs
% compliance with harmonized tariffs
100
100
100
100
100
100
% of compliance with common external tariff (CET) and EACCMA provisions
100% 100% 100%
100%
100%
100%
% Compliance with Councils and Summit Directives
100% 100% 100% 100%
100% 100%
Directorate of Economic Affairs
Increased Exports to EAC
Value of Exports (Ksh. Billion)
128
122
128 123 124 125
Monetary Union Institute
No. of EAC Monetary Union Institutes established
0
0 1
1
1 1
EAC Rules of Origin applied
No. of Certificates of Origin issued
115,674
135,702
200,000
150,000
160,000
180,000
Reduced Non-Tarriff Barriers
No. of NTBs eliminated
93
116
8
120
127
142
Cross border trade disputes resolved
No. of Cross border trade disputes resolved
100%
100%
100%
100% 100% 100%
Harmonized standards No. of EAC harmonized regional standards
1,400
1,428
1,456 1,602 1,679 1,745

110 | P a g e
Sub Programme
Delivery Unit
Key Outputs Key Performance Indicators
Target 2016/17 Actual Achievement 2016/17
Target Baseline 2017/18
Target 2018/19 Target 2019/20
Target 2020/21
No. of EAC Harmonized standards adopted by Kenya
1,010 1062 1,090 1,134 1,165 1,170
Participation in Economic Affairs Sector EAC meetings
No. of Reports
123 126 110
140
145
164
Directorate of Social affairs
Participation in Social Sector EAC meetings
No. of Reports
81 85 110
120
130
140
Establishment of EAC Clubs in Universities/ Secondary schools
No. of clubs established
55 55 18 60 65 65
Directorate of Political affairs
Citizens sensitized on EAC Anthem and Political Confederation
No. of sensitization workshops at National and County level
5 6 50
50
50
50
Participation in EAC Political Sector meetings
No. of Reports 40 42 45 45 45 45
Directorate of Productive affairs
Participation in EAC Productive and Services Sector meetings
No. of Reports 78 83 115 120 130 135
Financial Management Services
Financial Services % rate of facilitation of financial service s
100% 100% 100% 100% 100% 100%
SP. 5.2 East African Common Market
Headquarters Administrative Services
Administrative services % index of work environment satisfaction
62% 62% 72% 74% 80% 81%
% index of work customer
65% 65% 73% 75% 76% 76%

111 | P a g e
Sub Programme
Delivery Unit
Key Outputs Key Performance Indicators
Target 2016/17 Actual Achievement 2016/17
Target Baseline 2017/18
Target 2018/19 Target 2019/20
Target 2020/21
satisfaction
% index of work employee satisfaction
67% 67% 75% 77% 78% 79%
Regional Integration Centres
Operationalization One Stop Border Posts
No. One Stop Border Post operationalized
1 1 1 1 1 1
National Publicity and Advocacy for EAC Regional Integration
Informed and empowered stakeholders on EAC Common Market
No. of media campaigns
6 6 1 7 7 7
Research /Reference Document Centre
Automation of Library Services
% level of automation of library services
30% 30% 35% 50% 55% 57%
Information Comm. & Technology Unit
Information Technology services
% Level of automation of services
56% 56% 75% 80% 85% 85%
Central Planning Unit
Planning Services No. M&E of Reports
4 Quarterly and 1 Annual report
4 Quarterly and 1 Annual report
4 Quarterly and 1 Annual report
4 Quarterly and 1 Annual report
4 Quarterly and 1 Annual report
4 Quarterly and 1 Annual report
East African Community
Awareness on opportunities from EAC integration increased
No. of publicity awareness creation held in Counties
16 18 30 40 47 52
Directorate of Social Affairs
Students, persons and workers facilitated to get permits
No. of Students, persons and workers permits issued
1400 1406 2,000 2,200 2,400 2,600

112 | P a g e
Sub Programme
Delivery Unit
Key Outputs Key Performance Indicators
Target 2016/17 Actual Achievement 2016/17
Target Baseline 2017/18
Target 2018/19 Target 2019/20
Target 2020/21
Awareness on EAC trade opportunities for women, PWDs, Youth and Professionals
No. of sensitization workshops held
6 8 10 13 18 22
East African Legislative Assembly (EALA) Kenya Chapter
Awareness on opportunities from EAC integration increased
No. of publicity awareness creation held in Counties
10 8 15 18 20 26
No. of EAC citizens moving from other Partner States granted stay
3 2 120,000 130,000 140,000 150,000
Financial Management Services
Financial Services No. of financial reports prepared
6 6 4 6 6 6
S.P 5.3: EAC Monetary Union
National Publicity and Advocacy for EAC Regional Integration
Digital outdoor information screens
No. of digital outdoor information screens installed
1 0 2 2 2 2
Research /Reference Document Centre
Informed and empowered stakeholders on EAC Monetary Union
No. of joint cross border sensitization workshops held
3 3 3 4 5 5
East African Community
Regional integration process monitored and evaluated
No. of M&E reports on regional integration process
1 1 1 4 4 4
Directorate of Productive and Services Sector
Informed and empowered stakeholders on EAC matters
No. of sensitization workshops held
4 4 12 15 18 20
TradeMark East Africa Programme
Increased Capacity on EAC Integration
No. of programmes initiated
4 4 6 6 6 6

113 | P a g e
Programme Delivery unit Key Outputs Key performance indicators
Target 2016/17
Actual achievement 2016/17
Target (Baseline) 2017/18
Target 2018/19
Target 2019/20
Target 2020/21
0306000 P. 1: Tourism Development and Promotion
Outcome: Increased Tourism Sector contribution to the Gross Domestic Product (GDP)
S.P. 1.1: Tourism Promotion and Marketing
Kenya Tourism Board
Tourism earnings Earning from tourism (Ksh. Billion)
172 99.7 109 120 132 145
International tourist arrivals No. of international tourist arrivals in million
1.5 1.35 1.5 1.7 1.97 2.1
Domestic tourists No. of bed nights occupied by Kenyans in million
3.4 3.5 4 4.5 5 5.5
Tourism Regulatory Authority
Tourist establishments inspected/licensed
No. of registered establishments inspected/licensed
3,000 3,622 4,000 5,000 5,200 5,500
Revenue collected (Ksh. Million)
95 103 80 150 175 200
Improved institutional capacity to regulate tourism sector
Level of TRA operationalization
100% 90% 100% 100% - -
No. of minimum of standards developed and implemented
- - 2 3 3 2
Classified Hotels and Restaurants
No. of classified Hotels and Restaurants
134 136 100 80 50 350
Integrated Tourism Management Information System.
% level of completion
100 55 100 - - -
% of duty waivers considered
65% 70% 80% 90% 80% 90%
DoT National Tourism Blueprint 2030 implemented PHASE 1
% implementation 10% 35% 60% 80% 100%
DoT Better Visitor experience and higher tourist spend - Maasai Mara Management initiative
% completion rate - - 25 50 75 100

114 | P a g e
Programme Delivery unit Key Outputs Key performance indicators
Target 2016/17
Actual achievement 2016/17
Target (Baseline) 2017/18
Target 2018/19
Target 2019/20
Target 2020/21
DoT Coastal management programme: Diani Mombasa North Coast(Nyali, Bamburi and Shanzu), Watamu Malindi, Lamu
Number of Beaches Covered
- - - 5 8 10
DoT National Convention Bureau established
% level of operationalization
10% 10% 50% 100% - -
DoT Coastal Tourism Refurbishment fund established
Seed Capital (Ksh.Billion)
- - 50
100 50
No. of facilities funded
DoT Community-Based Tourism projects supported
No. of community enterprises
7 7 5 5 5 5
DoT Tourism Protection Service established
% Implementation status
Taskforce report
Taskforce report
30% 65% 100%
DoT Functional Tourism Crisis Centre
% Implementation status
10% 40% 100% - -
DoT Information Centres and signage in place
% completion rate 10% 40% 100%
DoT Active Tourism portal Visits to the portal -- - -
S.P. 1.2: Niche Tourism Product Development & Diversification
Tourism Services – HQs
Cultural Tourism festivals held
No. of cultural tourism festivals held
4 5 5 5 5 5
BoK New Cultural Cuisines No. of new cultural cuisines
4 4 4 4 4 4
BoK Artifacts in Place No. of Cultural artifacts
1 1 1 1 1 -
Kenyatta International Convention Centre (KICC)
Conference tourism No. of international conferences held
229 227 232 255 280 308
No. of international delegates
75,201 101,599 103,631 113,994 125,393 137,933
Number of local conferences and events
- 3,555 3,910 4,302 4,732 5,205
Number of Local - 532,674 585,941 644,536 708,989 779,888

115 | P a g e
Programme Delivery unit Key Outputs Key performance indicators
Target 2016/17
Actual achievement 2016/17
Target (Baseline) 2017/18
Target 2018/19
Target 2019/20
Target 2020/21
delegates hosted
DoT
Kenyan Experience Film produced
% production - - 20% 100% - -
DoT Mama Ngina Modern waterfront facility
% Completion rate - - 20% 70% 100% -
DoT Refurbished World class railway museum
% Completion rate - - 25% 50% 100% -
TRI
System of Tourism Statistics – Tourism Satellite Account (TSA)
Tourism Satellite Account established
1 0 1 0 0 1
Kenya Tourism Product Popularity Index
Kenya index ranking 1 0 1 1 0 0
Competitor Benchmarking Product
No of studies conducted
1 0 1 1 1 1
Improved brand awaressness Brand index
Travel Trade and Hospitality Benchmarking Studies
No. of Reports 1 0 1 1 1 0
Tourism Impact and Value Chain Studies
No. of Reports 1 - 1 0 0 1
Domestic Tourism Surveys No of reports 1 - 1 0 1
Open Data Platform (data.tourism.or.ke)
In place Inception
S.P. 1.3: Tourism Infrastructure Development
Tourism Fund Ronald Ngala Utalii College % of completion rate
75% 47% 60% 75% 85% 100%
BoK Nairobi international convention and exhibition centre
% of completion rate
Feasibility study
Feasibility study report
Master plan Contract signed with identified investors
Civil works – 15%
Civil works – 60%
DoT New Mombasa Convention Centre
Report % completion rate
Integrated master plan
30% 70% 100%
DoT New Kenyatta International Convention Centre Annex
% completion rate
Feasibility study report
30% 70% 100%

116 | P a g e
Programme Delivery unit Key Outputs Key performance indicators
Target 2016/17
Actual achievement 2016/17
Target (Baseline) 2017/18
Target 2018/19
Target 2019/20
Target 2020/21
TFC Increased lending base and portfolio
Amount of money lend (Ksh. Millions)
375 60 600 1,250 1,950 3,400
No. of tourism facilities financed
25 3 30 60 80 115
Rehabilitated/Refurbished Utalii House
% Completion 20 3.3 82.3 100
KICC Modernized KICC facility % implementation 100 42.5 100 100 100 100
Expanded KICC facility % implementation 0 0 0 75 100
S.P. 1.4: Tourism Training & Capacity building
Kenya Utalii College
KUC graduates No. of KUC graduates
3,732 2,879 2,900 2,950 3,000 3,100
Practical training block % Completion rate 30% 20% 80% 100% - -
Upgraded ICT system % Completion Rate - - - 100% - -
Branded KUC % Completion Rate - - - 100% - -
Student hostel constructed % Completion Rate - - - - 40% 40%
Utalii hotel conference facility
% Completion Rate - - - - 40% 40%
S.P 1.5: General administration planning and support services
Administrative Services
Support services to programs
ISO certification
75%
75% -
- - -
% of training needs
requirements addressed
90% 92 92 95 100
157000300 Finance and Procurement Services
Financial support services to programs
No. of days to process requests from user programs
4 days 4 days 4 days 4 days 4 days 4 days
157001600 Central Planning Unit
Monitoring and Evaluation No of monitoring and evaluation reports
4 quarterly and 1 annual reports
4 quarterly and 1 annual reports
4 quarterly and 1 annual reports
4 quarterly and 1 annual reports
4 quarterly and 1 annual reports
4 quarterly and 1 annual Reports
Tourism Development
Disbursement of tourism development fund to the
Number of tourism facilities facilitated
10 15 20 20

117 | P a g e
Programme Delivery unit Key Outputs Key performance indicators
Target 2016/17
Actual achievement 2016/17
Target (Baseline) 2017/18
Target 2018/19
Target 2019/20
Target 2020/21
Fund deserving tourism facilities for development

118 | P a g e
3.2. Analysis of Resources Requirement versus Allocation by
Sector/Sub-sector
Table 3.2: Recurrent Requirements/Allocations (Amount Kshs Million)
Table 3.2: Sector Recurrent Requirements versus Allocations (Amount Ksh Millions)
ANALYSIS OF RECURRENT RESOURCE REQUIREMENT VS ALLOCATION
REQUIREMENT ALLOCATION
Sector Name:
GECA 2017/18 2018/19 2019/20 2020/21 2018/19 2019/20 2020/21
Estimates
Vote and Vote
Details Economic Classification
Gross 9,609 18,854 19,781 22,817 9,133 9,647 9,796
AIA 1,029 2,587 2,718 2,862 1,029 1,029 1,029
NET 8,580 16,267 17,063 19,955 8,104 8,623 8,767
Compensation to
Employees
1,184 1,936 1,985 2,034 1,266 1,298 1,332
Transfers 6,119 12,694 13,370 15,900 5,801 6,115 6,114
Other Recurrent 2,306 4,224 4,426 4,883 2,067 2,234 2,350
Table 3.3 Development Resource Requirement/Allocations (Amount Ksh Million)
Table 3.3 Development Resource Requirement/Allocations (Amount Ksh Million)
ANALYSIS OF DEVELOPMENT RESOURCE REQUIREMENT VS ALLOCATION
REQUIREMENT ALLOCATION
Sector Name:
GECA
2017/18 2018/19 2019/20 2020/21 2018/19 2019/20 2020/21
Estimates
Vote and Vote
Details Economic Classification
Gross 10,080 27,585 26,503 23,727 12,014 13,341 13,776
GOK 9,207 26,712 25,630 22,853 11,140 12,467 12,902
Loans 755 755 755 755 755 755 755
Grants 119 119 119 119 119 119 119
Local AIA 0 0 0 0 0 0 0

119 | P a g e
3.2.1. Analysis of Programmes and Sub-Programmes (Current and Capital) Resource Requirement and Allocations of Resource
Table 3.4: Analysis Programmes /Sub Programmes Resource Requirements
Table 3.4: Analysis of Programmes / Sub-Programmes Resource Requirement
ANALYSIS OF PROGRAMME EXPENDITURE RESOURCE REQUIREMENT (AMOUNT KSHS MILLIONS)
2017/18 2018/19 2019/20 2020/21
Current Capital Total Current Capital Total Current Capital Total Current Capital Total
i. Investment and Industry Sub Sector
SP 1: General Administration,
Planning and Support Services 491 234 725 543 234 777 549 234 783 558 234 792
Total P1: General
Administration, Planning and
Support Services 491 234 725 543 234 777 549 234 783 558 234 792
SP2.1: Promotion of Industrial
Development 724 3,130 3,854 1,066 9,588 10,654 1,373 8,639 10,012 1,541 6,332 7,873
SP2.2: Provision of Industrial
Training 141 75 216 153 884 1,037 159 759 918 164 605 769
Total P2: Industrial
Development and Investment 865 3,205 4,070 1,219 10,472 11,691 1,532 9,398 10,930 1,705 6,937 8,642
SP3.1:Standardization,
Metrology and conformity
assessment 119 20 139 224 637 861 268 381 649 327 275 602
SP3.2 Business financing &
incubation for MSME 184 1,225 1,409 953 3,797 4,750 979 2,917 3,896 1,006 3,705 4711
SP.3.3 Industrial Research,
Development and Innovation 682 698 1,380 712 1,890 2,602 814 1,606 2,420 920 716 1636
P3: Standardization, Business
Incubation and Research 985 1,943 2,928 1,889 6,324 8,213 2,061 4,904 6,965 2,253 4,696 6,949
Total Vote: 1172 2,341 5,382 7,723 3,651 17,030 20,681 4,142 14,536 18,678 4,516 11,867 16,383
ii. Cooperatives Sub Sector
P 4: Cooperative Development and Management

120 | P a g e
Table 3.4: Analysis of Programmes / Sub-Programmes Resource Requirement
ANALYSIS OF PROGRAMME EXPENDITURE RESOURCE REQUIREMENT (AMOUNT KSHS MILLIONS)
2017/18 2018/19 2019/20 2020/21
Current Capital Total Current Capital Total Current Capital Total Current Capital Total
SP 4.1: Governance and
accountability
68
-
68
101
-
101
118
-
118
139
-
139
SP 4.2: Co-operative advisory
services
206
135
341
338
140
478
404
130
534
489
105
594
SP 4.3: Marketing, Value
Addition & Research
24
-
24
36
480
516
43
670
713
51
776
827
SP 4.4: Co-operative
management and investment
-
250
250
-
1,630
1,630
-
2,315
2,315
-
1,600
1,600
SP 4.5: General
Administration, planning and
support services
148
-
148
231
-
231
273
-
273
325
-
325
Total Vote 1173
446
385
831
706
2,250
2,956
838
3,115
3,953
1,004
2,481
3,485
iii. Trade Sub Sector
PROGRAMME 5: Trade Development and Promotion
SP 5.1: Domestic Trade
Development 125 42 167 110 240 350 113 130 243 152 180 332
SP 5.2: Fair Trade and
Consumer Protection 394 88 482 509 435 944 549 312 861 571 44 615
SP 5.3: Exports Market
Development 365 0 365 1,464 0 1464 1,908 0 1,908 3,617 0 3,617
SP 5.4: Regional Economic
Integration Initiatives 7 98 105 7 2,000 2007 7 500 507 9 500 509
SP 5.5: Entrepreneurial and
Management Training 86 100 186 126 200 326 123 130 253 131 0 131
SP 5.6: International Trade 885 0 885 2,896 100 2996 2,796 100 2,896 2,821 100 2,921
SP 5.7: General
Administration, Planning and
Support Services 375 0 375 539 0 539 579 0 579 623 0 623

121 | P a g e
Table 3.4: Analysis of Programmes / Sub-Programmes Resource Requirement
ANALYSIS OF PROGRAMME EXPENDITURE RESOURCE REQUIREMENT (AMOUNT KSHS MILLIONS)
2017/18 2018/19 2019/20 2020/21
Current Capital Total Current Capital Total Current Capital Total Current Capital Total
SP 5.8: Country Branding and
Marketing 177 0 177 1,329 0 1329 836 0 836 827 0 827
TOTAL VOTE 2,414 328 2,742 6,980 2,975 9,955 6,911 1,172 8,083 8,751 824 9,575
iv. East African Community Integration Sub Sector
Programme P 6. East African Affairs and Regional Integration
S.P .6.1: East African Customs
Union 650 0 650 746 0 746 750 0 750 804 0 804
S.P 6.2: East African Common
Market 866 0 866 1082 0 1082 1127 0 1127 1228 0 1228
S.P 6.3: EAC Monetary Union 36 65 101 57 65 122 91 65 156 146 65 211
Total Vote 1551 65 1616 1885 65 1950 1968 65 2033 2178 65 2243
v. Tourism Sub Sector
P. 7: Tourism Development and Promotion
S,P: 7.1 Tourism Promotion
and Marketing
861
1,200 2,061
1,788
1,165 2,953
1,956
2,292 4,248
2,163
2,280 4,443
S,P: 7.2 Niche Tourism
Product Development and
Diversification
423
160 583
2,121
1,600 3,721
2,251
2,500 4,751
2,449
1,910 4,359
S.P: 7.3 Tourism Infrastructure
Development
-
1,350 1,350
-
600 600
-
1,950 1,950
-
3,400 3,400
S.P: 7.4 Tourism Training &
Capacity Building
854
200 1,054
800
300 1,100
820
250 1,070
820
300 1,120
S.P: 7.5 General
Administration Planning and
Support Services
719
1,011 1,730
923
1,600 2,523
895
623 1,518
936
600 1,536
Total for Vote 2,857 3,921 6,778 5,632 5,265 10,897 5,922 7,615 13,537 6,368 8,490 14,858
TOTAL FOR THE SECTOR 9,609 10,081 19,690 18,854 27,585 46,439 19,781 26,503 46,284 22,817 23,727 46,544

122 | P a g e
Table 3.5: Programme/Sub-Programme Resource Allocation
Table 3.4: Analysis of Programmes / Sub-Programmes Resource Allocation
ANALYSIS OF PROGRAMME EXPENDITURE RESOURCE ALLOCATION (AMOUNT KSHS MILLIONS)
2017/18 2018/19 2019/20 2020/21
Current Capital Total Current Capital Total Current Capital Total Current Capital Total
i. Investment and Industry Sub Sector
SP 1: General Administration,
Planning and Support Services 491 234 725 470 234 704 502 234 736 519 234 753
Total P1: General
Administration, Planning and
Support Services
491 234 725 470 234 704 502 234 736 519 234 753
SP2.1: Promotion of Industrial
Development 724 2,880 3,604 668 4,380 5,048 734 4,745 5,479 743 4,570 5,313
SP2.2: Provision of Industrial
Training 141 75 216 139 360 499 144 360 504 149 360 509
Total P2: Industrial
Development and Investment 865 2,955 3,820 807 4,740 5,547 878 5,105 5,983 892 4,930 5,822
SP3.1:Standardization,
Metrology and conformity
assessment
119 270 389 132 0 132 150 20 170 150 47 197
SP3.2 Business financing &
incubation for MSME 184 1,225 1,409 413 2,375 2,788 457 2,275 2,732 457 2,425 2,881
SP.3.3 Industrial Research,
Development and Innovation 682 698 1,380 629 460 1,089 694 602 1,296 695 750 1,445
P3: Standardization, Business
Incubation and Research 985 2,193 3,178 1,174 2,835 4,009 1,301 2,897 4,198 1,302 3,222 4,523
Total Vote: 1172 2,341 5,382 7,723 2,451 7,809 10,260 2,681 8,236 10,917 2,713 8,386 11,099
ii. Cooperatives Sub Sector
P 4: Cooperative Development and Management

123 | P a g e
Table 3.4: Analysis of Programmes / Sub-Programmes Resource Allocation
ANALYSIS OF PROGRAMME EXPENDITURE RESOURCE ALLOCATION (AMOUNT KSHS MILLIONS)
2017/18 2018/19 2019/20 2020/21
Current Capital Total Current Capital Total Current Capital Total Current Capital Total
SP 4.1: Governance and
accountability
68
-
68
64
-
64
68
-
68
73
-
73
SP 4.2: Co-operative advisory
services
206
135
341
179
140
319
223
130
353
231
105
336
SP 4.3: Marketing, Value
Addition & Research
24
-
24
22
-
22
24
75
99
25
360
385
SP 4.4: Co-operative
management and investment
-
250
250
-
730
730
-
365
365
-
140
140
SP 4.5: General
Administration, planning and
support services
148
-
148
127
-
127
141
-
141
155
-
155
Total Vote 1173
446
385
831
392
870
1,262
456
1,070
1,526
484
1,105
1,589
iii. Trade Sub Sector
PROGRAMME 5: Trade Development and Promotion
SP 5.1: Domestic Trade
Development
125 43 168 101 10 111 105 50 155 121 50 171
SP 5.2: Fair Trade and
Consumer Protection
394 88 481 359 50 409 388 200 588 388 153 541
SP 5.3: Exports Market
Development
365 0 365 223 0 223 246 0 246 246 0 246
SP 5.4: Regional Economic
Integration Initiatives
7 98 104 7 500 507 7 550 557 9 647 656
SP 5.5: Entrepreneurial and
Management Training
86 100 186 87 90 177 89 150 239 92 200 292
SP 5.6: International Trade 886 0 886 663 0 663 679 0 679 681 0 681

124 | P a g e
Table 3.4: Analysis of Programmes / Sub-Programmes Resource Allocation
ANALYSIS OF PROGRAMME EXPENDITURE RESOURCE ALLOCATION (AMOUNT KSHS MILLIONS)
2017/18 2018/19 2019/20 2020/21
Current Capital Total Current Capital Total Current Capital Total Current Capital Total
SP 5.7: General
Administration, Planning and
Support Services
375 0 375 381 0 381 396 0 396 403 0 403
SP 5.8: Country Branding and
Marketing
177 0 177 109 0 109 121 0 121 121 0 121
Total Vote 1174 2,414 328 2,742 1,930 650 2,580 2,031 950 2,981 2,061 650 3,111
iv. East African Community Integration Sub Sector
Programme P 6. East African Affairs and Regional Integration
S.P .6.1: East African Customs
Union
650 0 650 673 0 673 650 0 650 667 0 667
S.P 6.2: East African Common
Market 866 0 866 903 0 903 881 0 881 888 0 888
S.P 6.3: EAC Monetary Union 36 65 101 28 65 93 35 65 100 43 65 108
Total Vote 1,551 65 1,616 1,604 65 1,669 1,566 65 1,631 1,598 65 1,663
v. Tourism Sub Sector
P. 7: Tourism Development and Promotion
S,P: 7.1 Tourism Promotion
and Marketing
861
1,200
2,061
812
640
1,452
891
830
1,721
891
871
1,762
S,P: 7.2 Niche Tourism
Product Development and
Diversification
423
160
583
449
400
849
479
461
940
480
484
964
S.P: 7.3 Tourism Infrastructure
Development
-
1,350
1,350
-
780
780
-
807
807
-
847
847
S.P: 7.4 Tourism Training &
Capacity Building
854
200
1,054
850
100
950
873
115
988
873
121
994
S.P: 7.5 General

125 | P a g e
Table 3.4: Analysis of Programmes / Sub-Programmes Resource Allocation
ANALYSIS OF PROGRAMME EXPENDITURE RESOURCE ALLOCATION (AMOUNT KSHS MILLIONS)
2017/18 2018/19 2019/20 2020/21
Current Capital Total Current Capital Total Current Capital Total Current Capital Total
Administration Planning and
Support Services
718 1,011 1,729 645 700 1,345 670 807 1,477 696 847 1,543
Total for Vote 2856 3921 6777
2,756
2,620
5,376
2,913
3,020
5,933
2,940
3,170
6,110
TOTAL FOR THE SECTOR 9,609 10,082 19,691 9,134 12,014 21,148 9,647 13,341 22,988 9,796 13,776 23,572

126 | P a g e
3.2.2. Programmes and Sub-Programmes by economic classification
Table 3.6: Programmes and Sub-Programmes Economic Classification (Ksh.Millions)
Table 3.6 Programmes and Sub-Programmes by Economic classification (Kshs. Million)
ANALYSIS OF PROGRAMME EXPENDITURE BY ECONOMIC CLASSIFICATION
REQUIREMENT ALLOCATION
Economic Classification 2018/19 2019/20 2020/21 2018/19 2019/20 2020/21
i. Investment and Industry Sub Sector
Programme 1: General Administration and Planning, and Support Services
Current Expenditure 543 549 558 470 502 519
Compensation to Employees 191 192 194 182 186 190
Use of goods and services 345 349 357 282 309 322
Grants and Other Transfers 7 7 7 7 7 7
Other recurrent 0 0 0 0 0 0
Capital Expenditure 234 234 234 234 234 234
Acquisition of non-financial assets 0 0 0 0 0 0
Capital grants 0 0 0 0 0 0
Other development 234 234 234 234 234 234
Total Programme 1 777 783 792 704 736 753
Programme 2: Promotion of Industrial Development and Investment
Current Expenditure 1,219 1,532 1,705 807 878 892
Compensation to Employees 187 193 198 186 192 198
Use of goods and services 103 104 107 84 92 96
Grants and Other Transfers 828 1,130 1,291 450 504 504
Other recurrent 101 105 109 87 91 94
Capital Expenditure 10,472 9,398 6,937 4,740 5,105 4,930
Acquisition of non-financial assets 0 0 0 0 0 0
Capital grants 7,396 5,047 2,232 4,280 4,545 4,370
Other development 3,076 4,351 4,705 460 560 560
Total Programme 2 11,691 10,930 8,642 5,547 5,983 5,822
Sub Programme 2.1 Promotion of Industrial Development and Investment
Current Expenditure 1,066 1,373 1,541 668 734 743
Compensation to Employees 135 139 143 134 139 143
Use of goods and services 103 104 107 84 92 96
Grants and Other Transfers 828 1,130 1,291 450 504 504
Other recurrent 0 0 0 0 0 0
Capital Expenditure 9,588 8,639 6,332 4,380 4,745 4,570
Acquisition of non-financial assets 0 0 0 0 0 0
Capital grants 7,396 5,047 2,232 4,280 4,545 4,370
Other development 2,192 3,592 4,100 100 200 200

127 | P a g e
Table 3.6 Programmes and Sub-Programmes by Economic classification (Kshs. Million)
ANALYSIS OF PROGRAMME EXPENDITURE BY ECONOMIC CLASSIFICATION
REQUIREMENT ALLOCATION
Economic Classification 2018/19 2019/20 2020/21 2018/19 2019/20 2020/21
Total Sub Programme 2.1 10,654 10,012 7,873 5,048 5,479 5,313
Sub Programme 2.2 Provision of Industrial Training
Current Expenditure 153 159 164 139 144 149
Compensation to Employees 52 54 55 52 53 55
Use of goods and services 0 0 0 0 0 0
Grants and Other Transfers 0 0 0 0 0 0
Other recurrent 101 105 109 87 91 94
Capital Expenditure 884 759 605 360 360 360
Acquisition of non-financial assets 0 0 0 0 0 0
Capital grants 0 0 0 0 0 0
Other development 884 759 605 360 360 360
Total Sub Programme 2.2 1037 918 769 499 504 509
Total Programme 2 11,691 10,930 8,642 5,547 5,983 5,822
Programme 3: Standards, Business Incubation and Research
Current Expenditure 1,889 2,061 2,253 1,173 1,301 1,303
Compensation to Employees 44 46 47 44 45 46
Use of goods and services 0 0 0 0 0 0
Grants and Other Transfers 1,835 2,003 2,186 1,128 1,251 1,250
Other recurrent 10 12 20 2 5 7
Capital Expenditure 6,324 4,904 4,696 2,835 2,897 3,222
Acquisition of non-financial assets 0 0 0 0 0 0
Capital grants 6,324 4,904 4,696 2,835 2,897 3,222
Other development 0 0 0 0 0 0
Total Programme 3 8,213 6,965 6,949 4,008 4,198 4,524
Sub Programme 3.1: Standardization, Metrology and Conformity Assessment
Current Expenditure 224 268 327 132 150 151
Compensation of Employees 0 0 0 0 0 0
Use of goods and services 0 0 0 0 0 0
Grants and Other Transfers 214 256 307 130 145 145
Other recurrent 10 12 20 2 5 7
Capital Expenditure 637 381 275 50 20 47
Acquisition of non-financial assets 0 0 0 0 0 0
Capital grants 637 381 275 50 20 47
Other development 0 0 0 0 0 0

128 | P a g e
Table 3.6 Programmes and Sub-Programmes by Economic classification (Kshs. Million)
ANALYSIS OF PROGRAMME EXPENDITURE BY ECONOMIC CLASSIFICATION
REQUIREMENT ALLOCATION
Economic Classification 2018/19 2019/20 2020/21 2018/19 2019/20 2020/21
Total Sub Programme 3.1 861 649 602 182 170 198
Sub Programme 3.2: Business financing & incubation for MSME
Current Expenditure 953 979 1,006 413 457 457
Compensation of Employees 16 17 17 16 17 17
Use of goods and services 0 0 0 0 0 0
Grants and Other Transfers 937 962 989 397 440 439
Other recurrent 0 0 0 0 0 0
Capital Expenditure 3,797 2,917 3,705 2,375 2,275 2,425
Acquisition of non-financial assets 0 0 0 0 0 0
Capital grants 3,797 2,917 3,705 2,375 2,275 2,425
Other development 0 0 0 0 0 0
Total Sub Programme 3.2 4,750 3,896 4,711 2,788 2,732 2,881
Sub Programme 3.3: Industrial Research, Development and Innovation
Current Expenditure 712 814 920 629 694 695
Compensation of Employees 28 29 30 28 28 28
Use of goods and services 0 0 0 0 0 0
Grants and Other Transfers 684 785 890 601 666 666
Other recurrent 0 0 0 0 0 0
Capital Expenditure 1,890 1,606 716 460 602 750
Acquisition of non-financial assets 0 0 0 0 0 0
Capital grants 1,890 1,606 716 460 602 750
Other development 0 0 0 0 0 0
Total Sub Programme 3.3 2,602 2,420 1,636 1,089 1,296 1,445
Total Programme 3 8,213 6,965 6,949 4,008 4,198 4,524
TOTAL VOTE 1172 20,681 18,678 16,383 10,260 10,917 11,099
ii. Cooperative Management and Development Sub Sector
Programme 4: Co-operative
Management Development
Current Expenditure 706 838 1,004 392 456 484
Compensation of Employees 203 211 219 161
165
170
Use of Goods and services 304 380 475 139
174
196
Grants and other transfers 179 223 279 83
104
104
Other Recurrent 20 24 31 10

129 | P a g e
Table 3.6 Programmes and Sub-Programmes by Economic classification (Kshs. Million)
ANALYSIS OF PROGRAMME EXPENDITURE BY ECONOMIC CLASSIFICATION
REQUIREMENT ALLOCATION
Economic Classification 2018/19 2019/20 2020/21 2018/19 2019/20 2020/21
13 14
Capital Expenditure 2250 3115 2481
870 1070 1105
Acquisition of Non-Financial Assets 580 770 881 100
225
605
Capital Grants to Government
Agencies 1670 2345 1600 770
845
500
Other Development 0 0 0 -
- -
Total Programme 4 2,956 3,953 3,485 1,262 1,526 1,589
Sub-Programme:4.1 Cooperative governance and Accountability
Current Expenditure 101 118 139 64 68 73
Compensation of Employees 39 40 42 31 31 32
Use of Goods and services 60 75 93 32 36 40
Grants and other transfers 0 0 0 0 0 0
Other Recurrent 2 3 4 1 1 1
Capital Expenditure 0 0 0 0 0 0
Acquisition of Non-Financial Assets 0 0 0 0 0 0
Capital Grants to Government
Agencies 0 0 0 0 0 0
Other Development 0 0 0 0 0 0
Total S.P 1 101 118 139 64 68 73
Sub-Programme: 4.2 Co-operative advisory Services
Current Expenditure 338 404 489
179
223 231
Compensation of Employees 81 84 88 64
66 68
Use of Goods and services 76 95 119 32
52 58
Grants and other transfers 179 223 279 83
104 104
Other Recurrent 2 2 3 1
1 1
Capital Expenditure
140 130 105 140
130 105
Acquisition of Non-Financial Assets 100 100 105 100
100 105
Capital Grants to Government
Agencies 40 30 0 40
30 0

130 | P a g e
Table 3.6 Programmes and Sub-Programmes by Economic classification (Kshs. Million)
ANALYSIS OF PROGRAMME EXPENDITURE BY ECONOMIC CLASSIFICATION
REQUIREMENT ALLOCATION
Economic Classification 2018/19 2019/20 2020/21 2018/19 2019/20 2020/21
Other Development 0 0 0 0 0 0
Total S.P: 4.2 478 534 594 319
353 336
Sub-Programme: 4.3: Co-operative Marketing, Value Addition and Research
Current Expenditure 36 43 51 22
24 25
Compensation of Employees 13 14 15 11 11 11
Use of Goods and services 23 29 36 11 13 14
Grants and other transfers 0 0 0 0 0 0
Other Recurrent 0 0 0 0 0 0
Capital Expenditure 480 670 776 0 125 500
Acquisition of Non-Financial Assets 480 670 776 0 125 500
Capital Grants to Government
Agencies
0 0 0 0 0 0
Other Development 0 0 0 0 0 0
Total S.P: 3 516 713 827 22 149 525
Sub-Programme: 4.4: Cooperative Management and Investment
Current Expenditure 0 0 0 0 0 0
Compensation of Employees 0 0 0 0 0 0
Use of Goods and services 0 0 0 0 0 0
Grants and other transfers 0 0 0 0 0 0
Other Recurrent 0 0 0 0 0 0
Capital Expenditure 1,630 2,315 1,600 730 815 500
Acquisition of Non-Financial Assets 0 0 0 0 0 0
Capital Grants to Government
Agencies
1,630 2,315 1,600 730 815 500
Other Development 0 0 0 0 0 0
Total S.P : 4.4 1,630 2,315 1,600 730 815 500
Sub-Programme:4.5: General
Administration and Support Services
Current Expenditure
231 273 325 127
141 155
Compensation of Employees 70 73 74 55
57 59

131 | P a g e
Table 3.6 Programmes and Sub-Programmes by Economic classification (Kshs. Million)
ANALYSIS OF PROGRAMME EXPENDITURE BY ECONOMIC CLASSIFICATION
REQUIREMENT ALLOCATION
Economic Classification 2018/19 2019/20 2020/21 2018/19 2019/20 2020/21
Use of goods and services 145 181 227 64
73 84
Grants and other transfers 0 0 0 0 0 0
Other Recurrent 16 19 24 8
11 12
Capital Expenditure 0 0 0 0 0 0
Acquisition of Non-Financial Assets 0 0 0 0 0 0
Capital Grants to Government
Agencies 0 0 0 0 0 0
Other Development 0 0 0 0 0 0
Total S.P : 4.5 231 273 325 127
141 155
TOTAL VOTE 1173 2,956 3,953 3,485 1,262 1,526 1,589
iii. Trade Sub Sector
Programme 5: Trade Development
Current Expenditure 6,980 6,911 8,751 1,930 2,031 2,061
Compensation Of Employees 915 930 947 322 330 338
Use Of Goods And Services 1594 1650 1740 549 580 601
Grants And Other Transfers 4042 4040 5767 1,049 1,111 1,111
Other Recurrent 429 291 297 10 10 11
Capital Expenditure 2975 1172 824 650 550 650
Acquisition Of Non-Financial Assets 2410 380 70 590 800 947
Capital Grants to Government
Agencies 130 80 80
50 150 103
Other Development 435 712 674 10 0 0
TOTAL PROGRAMME 9,955 8,083 9,575 2,580 2,981 3,111
TOTAL VOTE 9,955 8,083 9,575 2,580 2,981 3,111
SP 5.1: Domestic Trade Development
Current Expenditure 110 113 152 101 105 121
Compensation Of Employees 74 76 78 73 75 77
Use Of Goods And Services 35 36 72 28 29 43
Grants And Other Transfers 0 0 0 0 0 0
Other Recurrent 1 1 2 1 1 1
Capital Expenditure 240 130 180 10 50 50
Acquisition Of Non-Financial Assets 0 0 0 0 0 0
Capital Grants to Government
Agencies 30 30 80
0 50 50

132 | P a g e
Table 3.6 Programmes and Sub-Programmes by Economic classification (Kshs. Million)
ANALYSIS OF PROGRAMME EXPENDITURE BY ECONOMIC CLASSIFICATION
REQUIREMENT ALLOCATION
Economic Classification 2018/19 2019/20 2020/21 2018/19 2019/20 2020/21
Other Development 210 100 100 10 0 0
Total Sub- Programme 5.1 350 243 332 111 155 171
SP 5.2: Fair Trade and Consumer Protection
Current Expenditure 509 549 571 359 388 388
Compensation Of Employees 26 27 27 26 27 27
Use Of Goods And Services 51 51 52 49 49 49
Grants And Other Transfers 420 459 480 280 307 307
Other Recurrent 12 12 12 5 5 5
Capital Expenditure 435 312 44 50 200 153
Acquisition Of Non-Financial Assets 160 200 20 0 100 100
Capital Grants to Government
Agencies 100 50 0
50 100 53
Other Development 175 62 24 0 0 0
Total Sub- Programme 5.2 944 861 615 409 588 541
SP 5.3: Exports Market Development
Current Expenditure 1,464 1,908 3,617 223 246 246
Compensation Of Employees 0 0 0 0 0 0
Use Of Goods And Services 0 0 0 0 0 0
Grants And Other Transfers 1,464 1,908 3,617 223 246 246
Other Recurrent 0 0 0 0 0 0
Capital Expenditure 0 0 0 0 0 0
Acquisition Of Non-Financial Assets 0 0 0 0 0 0
Capital Grants to Government
Agencies 0 0 0 0 0 0
Other Development 0 0 0 0 0 0
Total Sub- Programme 5.3 1,464 1,908 3,617 223 246 246
SP 5.4: Regional Economic Integration Initiatives
Current Expenditure 7 7 9 7 7 9
Compensation Of Employees 4 4 6 4 4 6
Use Of Goods And Services 3 3 3 3 3 3
Grants And Other Transfers 0 0 0 0 0 0
Other Recurrent 0 0 0 0 0 0
Capital Expenditure 2,000 500 500 500 550 647
Acquisition Of Non-Financial Assets 2,000 0 0 500 550 647
Capital Grants to Government
Agencies 0 0 0 0 0 0

133 | P a g e
Table 3.6 Programmes and Sub-Programmes by Economic classification (Kshs. Million)
ANALYSIS OF PROGRAMME EXPENDITURE BY ECONOMIC CLASSIFICATION
REQUIREMENT ALLOCATION
Economic Classification 2018/19 2019/20 2020/21 2018/19 2019/20 2020/21
Other Development 0 500 500 0 0 0
Total Sub- Programme 5.4 2,007 507 509 507 557 656
SP 5.5: Entrepreneurial and Management Training
Current Expenditure 126 123 131 87 89 92
Compensation Of Employees 64 66 68 45 46 47
Use Of Goods And Services 51 55 60 40 41 43
Grants And Other Transfers 0 0 0 0 0 0
Other Recurrent 11 2 3 2 2 2
Capital Expenditure 200 130 0 90 150 200
Acquisition Of Non-Financial Assets 200 130 0 90 150 200
Capital Grants to Government
Agencies 0 0 0 0 0 0
Other Development 0 0 0 0 0 0
Total Sub- Programme 5.5 326 253 131 177 239 292
SP 5.6: International Trade
Current Expenditure 2,896 2,796 2,821 663 679 681
Compensation Of Employees 626 633 640 64 66 68
Use Of Goods And Services 1,042 1,055 1,064 160 175 174
Grants And Other Transfers 829 837 843 437 437 437
Other Recurrent 399 271 274 2 1 2
Capital Expenditure 100 100 100 0 0 0
Acquisition of Non-Financial Assets 50 50 50 0 0 0
Capital Grants to Government
Agencies 0 0 0
0 0 0
Other Development 50 50 50 0 0 0
Total Sub- Programme 5.6 2,996 2,896 2,921 663 679 681
SP 5.7: General Administration, Planning and Support Services
Current Expenditure 539 579 623 381 396 403
Compensation Of Employees 121 124 128 110 112 113
Use Of Goods And Services 412 450 489 269 283 289
Grants And Other Transfers 0 0 0 0 0 0
Other Recurrent 6 5 6 2 1 1
Capital Expenditure 0 0 0 0 0 0
Acquisition of Non-Financial Assets 0 0 0 0 0 0
Capital Grants to Government
Agencies 0 0 0 0 0 0

134 | P a g e
Table 3.6 Programmes and Sub-Programmes by Economic classification (Kshs. Million)
ANALYSIS OF PROGRAMME EXPENDITURE BY ECONOMIC CLASSIFICATION
REQUIREMENT ALLOCATION
Economic Classification 2018/19 2019/20 2020/21 2018/19 2019/20 2020/21
Other Development 0 0 0 0 0 0
Total Sub- Programme 5.7 539 579 623 381 396 403
SP 5.8: Country Branding and Marketing
Current Expenditure 1,329 836 827 109 121 121
Compensation Of Employees 0 0 0 0 0 0
Use Of Goods And Services 0 0 0 0 0 0
Grants And Other Transfers 1,329 836 827 109 121 121
Other Recurrent 0 0 0 0 0 0
Capital Expenditure 0 0 0 0 0 0
Acquisition of Non-Financial Assets 0 0 0 0 0 0
Capital Grants to Government
Agencies 0 0 0 0 0 0
Other Development 0 0 0 0 0 0
Total Sub- Programme 5.8 1,329 836 827 109 121 121
iv. East African Community Integration Sub-Sector
P 6 : East African Affairs and Regional Integration
Current Expenditure 1,885 1,968 2,178 1,604 1,566 1,598
Compensation Of Employees 211 222 233 188 193 198
Use Of Goods And Services 552 696 885 298 333 360
Grants And Other Transfers 1111 1033 1033 1,111 1033 1033
Other Recurrent 11 17 27 7 7 7
Capital Expenditure 65 65 65 65 65 65
Acquisition of Non-Financial Assets 65 65 65 65 65 65
Capital Grants to Government
Agencies 0 0 0 0
0 0
Other Development 0 0 0 0 0 0
Total Programme 1,950 2,033 2,243 1,669 1,631 1,663
S.P 6.1: East African Customs Union
Current Expenditure 746 750 804 673 650 667
Compensation Of Employees 207 217 228 184 189 194
Use Of Goods And Services 106 137 179 56 58 70
Grants And Other Transfers 431 391 391 431 401 401
Other Recurrent 3 4 7 2 2 2
Capital Expenditure 0 0 0 0 0 0
Acquisition of Non-Financial Assets 0 0 0 0 0 0
Capital Grants to Government 0 0 0 0 0 0

135 | P a g e
Table 3.6 Programmes and Sub-Programmes by Economic classification (Kshs. Million)
ANALYSIS OF PROGRAMME EXPENDITURE BY ECONOMIC CLASSIFICATION
REQUIREMENT ALLOCATION
Economic Classification 2018/19 2019/20 2020/21 2018/19 2019/20 2020/21
Agencies
Other Development 0 0 0 0 0 0
Total Sub- Programme 6.1 746 750 804 673 650 667
S.P 6.2: East African Common Market
Current Expenditure 1,082 1,127 1,228 903 881 888
Compensation Of Employees 4 5 5 4 4 4
Use Of Goods And Services 389 467 561 214 240 247
Grants And Other Transfers 680 642 642 680 632 632
Other Recurrent 8 13 20 5 5 5
Capital Expenditure 0 0 0 0 0 0
Acquisition of Non-Financial Assets 0 0 0 0 0 0
Capital Grants to Government
Agencies 0 0 0 0 0 0
Other Development 0 0 0 0 0 0
Total Sub- Programme 6.2 1,082 1,127 1,228 903 881 888
S.P 6.3: EAC Monetary Union
Current Expenditure 57 91 146 28 35 43
Compensation Of Employees 0 0 0 0 0 0
Use Of Goods And Services 57 91 146 28 35 43
Grants And Other Transfers 0 0 0 0 0 0
Other Recurrent 0 0 0 0 0 0
Capital Expenditure 65 65 65 65 65 65
Acquisition of Non-Financial Assets 65 65 65 65 65 65
Capital Grants to Government
Agencies 0 0 0 0 0 0
Other Development 0 0 0 0 0 0
Total Sub- Programme 6.3 122 156 211 93 100 108
v. Tourism Sub-Sector
P 7: Tourism Development and Promotion
Current Expenditure 5,632 5,922 6,368 2,756 2,913 2,940
Compensation Of Employees 186 191 196 183 188 193
Use Of Goods And Services 250 304 319 599 620 642
Grants And Other Transfers 4,699 4,934 5,336 1,974 2,105 2,105
Other Recurrent 497 493 517 0 0 0
Capital Expenditure 5,265 7,615 8,490 2,620 3,020 3,170

136 | P a g e
Table 3.6 Programmes and Sub-Programmes by Economic classification (Kshs. Million)
ANALYSIS OF PROGRAMME EXPENDITURE BY ECONOMIC CLASSIFICATION
REQUIREMENT ALLOCATION
Economic Classification 2018/19 2019/20 2020/21 2018/19 2019/20 2020/21
Acquisition of Non-Financial Assets 2,800 2,023 1,900 700 807 847
Capital Grants to Government
Agencies 2,365 5,592 6,590 1,920 2,213 2,323
Other Development 100 0 0 0 0 0
Total Programme 7 10,897 13,537 14,858 5,376 5,933 6,110
S.P 7.1: Tourism Promotion and Marketing
Current Expenditure 1,788 1,956 2,163 812 891 891
Compensation Of Employees 0 0 0 0 0 0
Use Of Goods And Services 0 0 0 0 0 0
Grants And Other Transfers 1,788 1,956 2163 812 891 891
Other Recurrent 0 0 0 0 0 0
Capital Expenditure 1,165 2,292 2,280 640 830 871
Acquisition of Non-Financial Assets 0 0 0 0 0 0
Capital Grants to Government
Agencies 1,165 2,292 2,280 640 830 871
Other Development 0 0 0 0 0 0
Total Sub- Programme 7.1 2,953 4,248 4,443 1,452 1,721 1,762
S.P 7.2: Niche tourism product development and diversification
Current Expenditure 2,121 2,251 2,449 449 479 480
Compensation Of Employees 41 42 43 41 42 43
Use Of Goods And Services 52 54 56 100 100 100
Grants And Other Transfers 2,028 2,155 2,350 308 337 337
Other Recurrent 0 0 0 0 0 0
Capital Expenditure 1,600 2,500 1,910 400 461 484
Acquisition of Non-Financial Assets 1,300 1,400 1,300 0 0 0
Capital Grants to Government
Agencies 300 1,100 610 400 461 484
Other Development 0 0 0 0 0 0
Total Sub- Programme 7.2 3,721 4,751 4,359 849 940 964
S.P 7.3: Tourism Infrastructure Development
Current Expenditure 0 0 0 0 0 0
Compensation Of Employees 0 0 0 0 0 0
Use Of Goods And Services 0 0 0 0 0 0
Grants And Other Transfers 0 0 0 0 0 0

137 | P a g e
Table 3.6 Programmes and Sub-Programmes by Economic classification (Kshs. Million)
ANALYSIS OF PROGRAMME EXPENDITURE BY ECONOMIC CLASSIFICATION
REQUIREMENT ALLOCATION
Economic Classification 2018/19 2019/20 2020/21 2018/19 2019/20 2020/21
Other Recurrent 0 0 0 0 0 0
Capital Expenditure 600 1,950 3,400 780 807 847
Acquisition of Non-Financial Assets 0 0 0 0 0 0
Capital Grants to Government
Agencies 600 1,950 3,400 780 807 847
Other Development 0 0 0 0 0 0
Total Sub- Programme 7.3 600 1,950 3,400 780 807 847
S.P.7.4: Tourism Training& Capacity Building
Current Expenditure 800 820 820 850 873 873
Compensation Of Employees 0 0 0 0 0 0
Use Of Goods And Services 0 0 0 0 0 0
Grants And Other Transfers 800 820 820 850 873 873
Other Recurrent 0 0 0 0 0 0
Capital Expenditure 300 250 300 100 115 121
Acquisition of Non-Financial Assets 0 0 0 0 0 0
Capital Grants to Government
Agencies 300 250 300 100 115 121
Other Development 0 0 0 0 0 0
Total Sub- Programme 7.4 1,100 1,070 1,120 950 988 994
S.P.7.5: General Administration Planning and Support Services
Current Expenditure 923 895 936 645 670 696
Compensation Of Employees 145 149 153 142 146 150
Use Of Goods And Services 198 250 263 499 520 542
Grants And Other Transfers 83 3 3 4 4 4
Other Recurrent 497 493 517 0 0 0
Capital Expenditure 1,600 623 600 700 807 847
Acquisition of Non-Financial Assets 1,500 623 600 700 807 847
Capital Grants to Government
Agencies 0 0 0 0 0 0
Other Development 100 0 0 0 0 0
Total Sub- Programme 7.5 2,523 1,518 1,536 1,345 1,477 1,543
TOTAL FOR THE SECTOR 44,892 43,936 44,442 21,148 22,988 23,572

138 | P a g e
3.3. Analysis of Resource Requirement Vs Allocation For Semi-Autonomous Government Agencies
Table 3.7: Semi-Autonomous Government Agencies
Table 3.7: Semi-Autonomous Government Agencies
ANALYSIS OF SEMI-AUTONOMOUS GOVERNMENT AGENCIES (SAGA) BY ECONOMIC CLASSIFICATION
REQUIREMENT ALLOCATION Economic Classification 2017/18
Allocation 2018/19 2019/20 2020/2
1 2018/1
9 2019/20 2020/21
Ksh. Millions Ksh. Millions Ksh. Millions
i. INVESTMENT AND INDUSTRY SUB-SECTOR
1. SPECIAL ECONOMIC ZONES AUTHORITY (SEZA)
Current Expenditure 0 100 120 140 0 0 0
Compensation of employees - 33 36 48 0 0 0
Use of Goods and Services - 68 84 92 0 0 0
Other Recurrent - - - - 0 0 0
Capital Expenditure 620 1400 1800 600 2,000 2,200 2,100
Acquisition of Non - Financial Assets 500 1,200 1,520 240 0 0 0
Other Development 120 200 280 360 2,000 2,200 2,100
TOTAL 620 1500 1920 740 2,000 2,200 2,100
SUMMARY OF EXPENDITURES AND REVENUES GENERATED
GROSS 620 1500 1920 740 2,000 2,200 2,100
A-in- A 0 0 0 0 0 0 0
Net Exchequer 620 1500 1920 740 2,000 2,200 2,100
2. KENYA INVESTMENT AUTHORITY
Current Expenditure 230 461 550 604 238 268 268
Compensation of employees 168 275 329 345 171 184 184
Use of Goods and Services 62 186 221 259 67 84 84
Other Recurrent - - - - 0 0 0
Capital Expenditure 100 64 68 72 0 45 70
Acquisition of Non - Financial Assets 100 - - - 0 0 0
Other Development - 64 68 72 0 45 70
TOTAL 330 525 618 677 238 308 338
SUMMARY OF EXPENDITURES AND REVENUES GENERATED
GROSS 330 525 618 677 238 308 338
A-in- A 5 5 5 5 5 5 5
Net Exchequer 325 520 613 672 233 303 323
3. MICRO AND SMALL ENTERPRISE AUTHORITY
Current Expenditure 76 397 404 413 120 134 134
Compensation of employees 15 277 279 285 98 100 100

139 | P a g e
Table 3.7: Semi-Autonomous Government Agencies
ANALYSIS OF SEMI-AUTONOMOUS GOVERNMENT AGENCIES (SAGA) BY ECONOMIC CLASSIFICATION
REQUIREMENT ALLOCATION Economic Classification 2017/18
Allocation 2018/19 2019/20 2020/2
1 2018/1
9 2019/20 2020/21
Use of Goods and Services 61 120 125 128 22 34 34
Other Recurrent - - - - 0 0 0
Capital Expenditure 150 960 1080 1130 800 800 750
Acquisition of Non - Financial Assets 150 960 1,080 1,130 0 0 0
Other Development - - - - 800 800 750
TOTAL 226 1357 1484 1543 920 934 884
SUMMARY OF EXPENDITURES AND REVENUES GENERATED
GROSS 226 1357 1484 1543 920 934 884
A-in- A - - - - 0 0 0
Net Exchequer 226 1357 1484 1543 920 934 884
3. KENYA INDUSTRIAL RESEARCH AND DEVELOPMENT INSTITUTE (KIRDI)
Current Expenditure 654 664 755 850 601 666 666
Compensation of employees 498 498 520 539 539 547 547
Use of Goods and Services 157 166 235 311 62 119 119
Other Recurrent - - - - 0 0 0
Capital Expenditure 698 1650 1521 717 460 602 750
Acquisition of Non - Financial Assets 698 1650 1521 717 0 0 0
Other Development - - - - 460 602 750
TOTAL 1,352 2,314 2,276 1,567 1,066 1,268 1,416
SUMMARY OF EXPENDITURES AND REVENUES GENERATED
GROSS 1,382 2,354 2,321 1,612 1,066 1,268 1,416
A-in- A 30 40 45 45
Net Exchequer 1,352 2,314 2,276 1,567 1,066 1,268 1,416
4. IDB CAPITAL LIMITED
Current Expenditure 0 239 272 357 0 0 0
Compensation of employees - 111 131 138 - - -
Use of Goods and Services - 106 122 196 - - -
Other Recurrent - 22 19 23 - - -
Capital Expenditure 0 1,003 9 9 0 0 0
Acquisition of Non - Financial Assets 0 3 9 9 - - -
Other Development 0 1,000 - - -
TOTAL 0 1,242 281 366 0 0 0
SUMMARY OF EXPENDITURES AND REVENUES GENERATED
GROSS 0 1,242 280 366 0 0 0
A-in- A 0 242 280 366 0 0 0

140 | P a g e
Table 3.7: Semi-Autonomous Government Agencies
ANALYSIS OF SEMI-AUTONOMOUS GOVERNMENT AGENCIES (SAGA) BY ECONOMIC CLASSIFICATION
REQUIREMENT ALLOCATION Economic Classification 2017/18
Allocation 2018/19 2019/20 2020/2
1 2018/1
9 2019/20 2020/21
Net Exchequer 0 1,000 0 0 0 0 0
5. KENYA INDUSTRIAL PROPERTY INSTITUTE (KIPI)
Current Expenditure 308 332 364 401 0 0 0
Compensation of employees 164 173 190 209 0 0 0
Use of Goods and Services 123 137 150 165 0 0 0
Other Recurrent 21 22 24 27 0 0 0
Capital Expenditure 0 0 0 0 0 0 0
Acquisition of Non - Financial Assets 0 0 0 0 0 0 0
Other Development 0 0 0 0 0 0 0
TOTAL 308 332 364 401 0 0 0
SUMMARY OF EXPENDITURES AND REVENUES GENERATED
GROSS 308 332 364 401 0 0 0
A-in- A 308 332 364 401 0 0 0
Net Exchequer 0 0 0 0 0 0 0
6. Kenya Accreditation Service (KENAS)
Current Expenditure 163 244 263 314 130 145 145
Compensation of employees 90 87 90 109 104 105 105
Use of Goods and Services 40 63 76 87 26 40 40
Other Recurrent 34 93 98 117 0 0 0
Capital Expenditure 20 637 381 275 0 20 47
Acquisition of Non - Financial Assets 0 0 0 0 0 0 0
Other Development 20 637 381 275 0 20 47
TOTAL 183 881 644 588 130 165 192
SUMMARY OF EXPENDITURES AND REVENUES GENERATED
GROSS 182.7 881 644 588 130 165 192
A-in- A 0 0 0 0 0 0 0
Net Exchequer 183 881 644 588 130 165 192
8. KENYA INDUSTRIAL ESTATES (KIE)
Current Expenditure 524 550 578 607 277 306 306
Compensation of employees 269 282 296 311 267 286 286
Use of Goods and Services 184 193 202 212 10 20 19
Other Recurrent 72 76 79 83 0 0 0
Capital Expenditure 723 1263 1263 2000 1,000 900 1,100
Acquisition of Non - Financial Assets 223 263 263 150

141 | P a g e
Table 3.7: Semi-Autonomous Government Agencies
ANALYSIS OF SEMI-AUTONOMOUS GOVERNMENT AGENCIES (SAGA) BY ECONOMIC CLASSIFICATION
REQUIREMENT ALLOCATION Economic Classification 2017/18
Allocation 2018/19 2019/20 2020/2
1 2018/1
9 2019/20 2020/21
Other Development 500 1,000 1,000 1,850 1,000 900 1,100
TOTAL 1,247 1,813 1,841 2,607 1,277 1,206 1,406
SUMMARY OF EXPENDITURES AND REVENUES GENERATED
GROSS 1,247 1,813 1,841 2,607 1,277 1,206 1,406
A-in- A
Net Exchequer 1,247 1,813 1,841 2,607 1,277 1,206 1,406
7. KENYA BUREAU OF STANDARDS (KEBS)
Current Expenditure 5,283 6,571 6,915 7,262 0 0 0
Compensation of employees 2,562 2,884 3,028 3,180 0 0 0
Use of Goods and Services 2,721 3,687 3,887 4,082 0 0 0
Other Recurrent 0 0 0 0 0 0 0
Capital Expenditure 706 1514 2116 2221 0 0 0
Acquisition of Non - Financial Assets 706 1,514 2,116 2,221 0 0 0
Other Development
TOTAL 5,989 8,085 9,031 9,483 0 0 0
SUMMARY OF EXPENDITURES AND REVENUES GENERATED
GROSS 5,989 8,085 9,031 9,483 0 0 0
A-in- A 5,989 6,385 9,031 9,483 0 0 0
Net Exchequer 0 1,700 0 0 0 0 0
8. NUMERICAL MACHINING COMPLEX (NMC)
Current Expenditure 345 425 410 424 152 169 169
Compensation of employees 202 212 218 223 136 100 100
Use of Goods and Services 0 0 0 0 16 69 69
Other Recurrent 144 214 192 201 0 0 0
Capital Expenditure 100 657 121 110 50 100 100
Acquisition of Non - Financial Assets 100 657 121 110 0 0 0
Other Development 0 0 0 0 50 100 100
TOTAL 445 1082 531 534 202 269 269
SUMMARY OF EXPENDITURES AND REVENUES GENERATED
GROSS 445 1082 531 534 202 269 269
A-in- A 0 0 0
Net Exchequer 445 1082 531 534 202 269 269
9. KENYA LEATHER DEVELOPMENT COUNCIL (KLDC)
Current Expenditure 68 100 121 130 56 63 63

142 | P a g e
Table 3.7: Semi-Autonomous Government Agencies
ANALYSIS OF SEMI-AUTONOMOUS GOVERNMENT AGENCIES (SAGA) BY ECONOMIC CLASSIFICATION
REQUIREMENT ALLOCATION Economic Classification 2017/18
Allocation 2018/19 2019/20 2020/2
1 2018/1
9 2019/20 2020/21
Compensation of employees 39 75 83 55 40 40 40
Use of Goods and Services 29 25 38 75 16 23 23
Other Recurrent - - - - 0 0 0
Capital Expenditure 800 2100 1009 400 1,000 1,000 1,400
Acquisition of Non - Financial Assets 67 100 100 200 0 0 0
Other Development 733 2,000 909 200 1,000 1,000 1,400
TOTAL 868 2200 1130 530 1,056 1,063 1,463
SUMMARY OF EXPENDITURES AND REVENUES GENERATED
GROSS 868 2200 1130 530 1,056 1,063 1,463
A-in- A 0 0 0
Net Exchequer 868 2200 1130 530 1,056 1,063 1,463
10. EXPORT PROCESSING ZONES AUTHORITY (EPZA)
Current Expenditure 506 555 611 672 4 5 5
Compensation of employees 245 269 296 326 0 0 0
Use of Goods and Services 44 48 53 58 4 5 5
Other Recurrent 217 238 262 288 0 0 0
Capital Expenditure 874 1764 1941 2135 400 750 400
Acquisition of Non - Financial Assets 874 1,764 1,941 2,135 0 0 0
Other Development 400 750 400
TOTAL 1,380 2,319 2,552 2,807 404 755 405
SUMMARY OF EXPENDITURES AND REVENUES GENERATED
GROSS 1,380 2,319 2,552 2,807 404 755 405
A-in- A 0 0 0 0 0 0 0
Net Exchequer 1,380 2,319 2,552 2,807 404 755 405
11. RIVATEX
Current Expenditure 188 198 215 242 0 0 0
Compensation of employees 88 92 95 98 0 0 0
Use of Goods and Services 99 106 121 144 0 0 0
Other Recurrent 0 0 0 0 0 0 0
Capital Expenditure 450 750 680 550 830 450 300
Acquisition of Non - Financial Assets 450 750 680 550 0 0 0
Other Development 0 0 0 0 830 450 300
TOTAL 638 948 895 792 830 450 300
SUMMARY OF EXPENDITURES AND REVENUES GENERATED
GROSS 450 750 680 550 830 450 300

143 | P a g e
Table 3.7: Semi-Autonomous Government Agencies
ANALYSIS OF SEMI-AUTONOMOUS GOVERNMENT AGENCIES (SAGA) BY ECONOMIC CLASSIFICATION
REQUIREMENT ALLOCATION Economic Classification 2017/18
Allocation 2018/19 2019/20 2020/2
1 2018/1
9 2019/20 2020/21
A-in- A 110 135 150 175 0 0 0
Net Exchequer 340 615 530 375 830 450 300
ii. COOPERATIVES SUB-SECTOR
1. NEW KCC
Current Expenditure
13,079 14,007 15,408 16,948 14,007 15,408 16,948
Compensation of employees
993 1,092 1,201 1,321 1,092 1,201 1,321
Use of Goods and Services
9,754 10,348 11,383 12,521 10,348 11,383 12,521
Other Recurrent
2,332 2,567 2,824 3,106 2,567 2,824 3,106
Capital Expenditure
250 730 815 500 730 815 500
Acquisition of Non - Financial Assets
250 730 815 500 730 815 500
Other Development
0 0 0 0 0 0 0
TOTAL
13,329 14,737 16,223 17,448 14,737 16,223 17,448
SUMMARY OF EXPENDITURES AND REVENUES GENERATED
GROSS
13,329 14,737 16,223 17,448 14,737 16,223 17,448
A-in- A
13,079 14,007 15,408 16,948 14,007 15,408 16,948
Net Exchequer
250 730 815 500 730 815 500
2. SASRA
Current Expenditure 423 452 496 547 452 496 547
Compensation of employees 215 238 261 288 238 261 288
Use of Goods and Services 208 214 235 259 214 235 259
Other Recurrent 0 0 0 0 0 0 0
Capital Expenditure 235 110 100 120 111 63 43
Acquisition of Non - Financial Assets 44 0 0 0 0 0 0
Other Development 191 110 100 120 111 63 43
TOTAL 658 562 596 667 563 559 590
SUMMARY OF EXPENDITURES AND REVENUES GENERATED
GROSS 658 562 596 667 563 559 590
A-in- A 385 394 400 410 394 399 451
Net Exchequer 213 133 170 222 134 134 104

144 | P a g e
Table 3.7: Semi-Autonomous Government Agencies
ANALYSIS OF SEMI-AUTONOMOUS GOVERNMENT AGENCIES (SAGA) BY ECONOMIC CLASSIFICATION
REQUIREMENT ALLOCATION Economic Classification 2017/18
Allocation 2018/19 2019/20 2020/2
1 2018/1
9 2019/20 2020/21
Donor funding 60 35 26 35 35 26 35
iii. TRADE SUB SECTOR
1. EXPORT PROMOTION COUNCIL
Current Expenditure 365 1464 1908 3617 223 246 246
Compensation of employees 177 190 210 230 155 167 167
Use of Goods and Services 188 1,274 1,698 3,387 68 79 79
Other Recurrent 0 0 0 0 0 0 0
Capital Expenditure 0 0 0 0 0 0 0
Acquisition of Non - Financial Assets 0 0 0 0 0 0 0
Other Development 0 0 0 0 0 0 0
TOTAL 365 1464 1908 3617 223 246 246
SUMMARY OF EXPENDITURES AND REVENUES GENERATED
GROSS 365 1464 1908 3617 223 246 246
A-in- A 5 5 5 5 5 5 5
Net Exchequer 360 1,459 1,903 3,612 218 241 241
2. BRAND KENYA BOARD
Current Expenditure 177 1330 837 827 110 121 121
Compensation of employees 90 100 106 111 78 84 84
Use of Goods and Services 87 1,230 731 716 32 37 37
Other Recurrent 0 0 0 0 0 0 0
Capital Expenditure 0 0 0 0 0 0 0
Acquisition of Non - Financial Assets 0 0 0 0 0 0 0
Other Development 0 0 0 0 0 0 0
TOTAL 177 1330 837 827 110 121 121
SUMMARY OF EXPENDITURES AND REVENUES GENERATED
GROSS 177 1329 836 827 110 121 121
A-in- A 2 3 4 6 2 2 2
Net Exchequer 175 1,326 832 821 108 119 119
3. ANTI-COUNTERFEIT AGENCY
Current Expenditure 254 373 411 431 238 261 261
Compensation of employees 184 263 290 298 181 195 195
Use of Goods and Services 70 110 121 133 57 66 66
Other Recurrent 0 0 0 0 0 0 0
Capital Expenditure 43 275 112 24 50 100 53

145 | P a g e
Table 3.7: Semi-Autonomous Government Agencies
ANALYSIS OF SEMI-AUTONOMOUS GOVERNMENT AGENCIES (SAGA) BY ECONOMIC CLASSIFICATION
REQUIREMENT ALLOCATION Economic Classification 2017/18
Allocation 2018/19 2019/20 2020/2
1 2018/1
9 2019/20 2020/21
Acquisition of Non - Financial Assets 43 100 50 0 50 100 53
Other Development 0 175 62 24 0 0 0
TOTAL 297 648 523 455 288 361 314
SUMMARY OF EXPENDITURES AND REVENUES GENERATED
GROSS 296 648 523 455 288 361 314
A-in- A 8 32 34 36 8 8 8
Net Exchequer 288 616 489 419 280 333 306
4. KENYA CONSUMER PROTECTION ADVISORY COMMITTEE
Current Expenditure 40 0 40 40 40 43 43
Compensation Of Employees 0 0 0 0 0 0 0
Use Of Goods And Services 40 0 40 40 40 43 43
Other Recurrent 0 0 0 0 0 0 0
Capital Expenditure 0 0 0 0 0 0 0
Acquisition Of Non-Financial Assets 0 0 0 0 0 0 0
Other Development 0 0 0 0 0 0 0
TOTAL 40 0 40 40 40 43 43
SUMMARY OF EXPENDITURES AND REVENUES GENERATED
GROSS 40 0 40 40 40 43 43
A-in- A
Net Exchequer 40 0 40 40 40 43 43
5. KENYA NATIONAL TRADING CORPORATION
Current Expenditure 139 145 152 167 0 0 0
Compensation of employees 61 63 66 73 0 0 0
Use of Goods and Services 2 2 4 4 0 0 0
Other Recurrent 76 80 82 90 0 0 0
Capital Expenditure 30 80 80 60 0 50 50
Acquisition of Non - Financial Assets 0 0 0 0 0 50 50
Other Development 30 80 80 60 0 0 0
TOTAL 169 225 232 227 0 50 50
SUMMARY OF EXPENDITURES AND REVENUES GENERATED
GROSS 168 225 231 227 145 201 217
A-in- A 138 145 151 167 145 201 217
Net Exchequer 30 80 80 60
iv. TOURISM SUB-SECTOR

146 | P a g e
Table 3.7: Semi-Autonomous Government Agencies
ANALYSIS OF SEMI-AUTONOMOUS GOVERNMENT AGENCIES (SAGA) BY ECONOMIC CLASSIFICATION
REQUIREMENT ALLOCATION Economic Classification 2017/18
Allocation 2018/19 2019/20 2020/2
1 2018/1
9 2019/20 2020/21
1. KENYA TOURISM BOARD
Current Expenditure
813 1258 1385 1522 863 908 909
Compensation of employees 263 336 351 370 292 315 315
Use of Goods and Services 402 770 874 975 353 363 358
Other Recurrent 148 152 160 177 0 0 0
Capital Expenditure 1,000 1,000 1,651 1,815 218 230 236
Acquisition of Non - Financial Assets 90 - 103 89 501 738 775
Other Development 910 1,000 1,548 1,726 44 33 30
TOTAL
1,813 2,258 3,036 3,337 1,364 1,646 1,684
SUMMARY OF EXPENDITURES AND REVENUES GENERATED
GROSS
1,813 2,258 3,036 3,337 1,364 1,646 1,684
A-in- A 103 118 132 143 103 103 103
Net Exchequer 1,710 2,140 2,904 3,194 1261 1543 1581
2. KENYA UTALII COLLEGE
Current Expenditure
1,424 1,474 1,494 1,494 1,420 1,443 1,443
Compensation of employees 641 475 550 550
471
550
550
Use of Goods and Services 633 779 724 724
687
601
601
Other Recurrent 150 220 220 220
-
- -
Capital Expenditure 200 570 250 300
262
292
292
Acquisition of Non - Financial Assets 200 570 250 300
100
115
121
Other Development - - - -
-
- -
TOTAL 1,624 2,044 1,744 1,794 1,520 1,558
1,564
SUMMARY OF EXPENDITURES AND REVENUES GENERATED
GROSS 1,624 2,044 1,744 1,794 1,529 1,558 1,564
A-in- A 704 704 704 704 704 704 704
Net Exchequer
920 1,340 1,040 1,090
816
854 860
3. TOURISM FUND
Current Expenditure
2,145 2,279 2,426 2,523
2,279
2,426 2,523
Compensation of employees 660 680 700 720
680
700
720

147 | P a g e
Table 3.7: Semi-Autonomous Government Agencies
ANALYSIS OF SEMI-AUTONOMOUS GOVERNMENT AGENCIES (SAGA) BY ECONOMIC CLASSIFICATION
REQUIREMENT ALLOCATION Economic Classification 2017/18
Allocation 2018/19 2019/20 2020/2
1 2018/1
9 2019/20 2020/21
Use of Goods and Services 1,463 1,577 1,702 1,778
453
466
480
Other Recurrent 22 22 24 25
1,124
1,236
1,298
Capital Expenditure 1,687 2,103 1,291 1,329
22
24
25
Acquisition of Non - Financial Assets 127 127 27 127
1,303
1,706 1,764
Other Development 1,560 1,976 1,264 1,202
127
49
149
TOTAL
3,832 4,382 3,717 3,852 3,582 4,132 4,287
SUMMARY OF EXPENDITURES AND REVENUES GENERATED
GROSS
3,832 4,382 3,717 3,852 3,582 4,132 4,287
A-in- A 3,082 3,182 3,717 3,852 3,182 3,717 3,852
Net Exchequer
750 1,200 - - 400
415
435
4. KICC
Current Expenditure 1,153 1,618 1,731 1,854 1,318 1,431 1,554
Compensation of employees 223 245 270 297 245 270 297
Use of Goods and Services 776 873 961 1,057 873 961 1,057
Other Recurrent 154 500 500 500 200 200 200
Capital Expenditure 308 800 1100 610 416 380 337
Acquisition of Non - Financial Assets 150 500 500 - 216 180 137
Other Development 158 300 600 610 200 200 200
TOTAL 1,461 2,418 2,831 2,464 1,734 1,811 1,891
SUMMARY OF EXPENDITURES AND REVENUES GENERATED
GROSS 1,461 2,418 2,831 2,464 1,734 1,811 1,891
A-in- A 1,461 1,534 1,611 1,691 1,534 1,611 1,691
Net Exchequer 0 884 1,220 773 200 200 200
5. TOURISM FINANCE CORPORATION Current Expenditure 350 374 387 400 374 387 400
Compensation of employees 180 189 199 208 189 199 208
Use of Goods and Services 141 153 154 157 153 154 157
Other Recurrent 29 32 34 35 - -
Capital Expenditure 644 764 2034 3518 32 34 35
Acquisition of Non - Financial Assets 44 64 84 118 444 476 530
Other Development 600 700 1,950 3,400 64 84 118

148 | P a g e
Table 3.7: Semi-Autonomous Government Agencies
ANALYSIS OF SEMI-AUTONOMOUS GOVERNMENT AGENCIES (SAGA) BY ECONOMIC CLASSIFICATION
REQUIREMENT ALLOCATION Economic Classification 2017/18
Allocation 2018/19 2019/20 2020/2
1 2018/1
9 2019/20 2020/21
TOTAL 994 1138 2421 3918 818 863 930
SUMMARY OF EXPENDITURES AND REVENUES GENERATED
GROSS
994 1138 2421 3918 818 863 930
A-in- A 394 438 471 518 438 471 518
Net Exchequer
600 700 1,950 3,400 380 392 412
6. BOMAS OF KENYA
Current Expenditure
332 410 424 496 308 337 337
Compensation of employees 176 189 198 214 198 213 213
Use of Goods and Services - - - -
-
- -
Other Recurrent 156 221 226 282
110
124
124
Capital Expenditure 160 600 600 600
800
861
884
Acquisition of Non - Financial Assets 160 600 600 600
600
600
600
Other Development - - - - 200 261 284
TOTAL
492 1010 1024 1096 1,108 1,198 1,221
SUMMARY OF EXPENDITURES AND REVENUES GENERATED
GROSS
492 1010 1024 1096 1,108 1,198 1,221
A-in- A 92 110 124 146 92 92 92
Net Exchequer 400 900 900 950 1,016 1,106 1,129
7. TOURISM REGULATORY AUTHORITY
Current Expenditure
281 530 580 650
310
337 337
Compensation of employees 180 220 242 259
190
204
204
Use of Goods and Services 101 310 338 391
120
133
133
Other Recurrent - - - -
-
- -
Capital Expenditure 120 450 527 319
140
93
96
Acquisition of Non - Financial Assets 120 450 527 319
Other Development - - - -
-
- -
TOTAL 401 980 1107 969 450 430 433
SUMMARY OF EXPENDITURES AND REVENUES GENERATED
GROSS 401 980 1107 969 450 430 433
A-in- A 80 150 175 200 80 80 80

149 | P a g e
Table 3.7: Semi-Autonomous Government Agencies
ANALYSIS OF SEMI-AUTONOMOUS GOVERNMENT AGENCIES (SAGA) BY ECONOMIC CLASSIFICATION
REQUIREMENT ALLOCATION Economic Classification 2017/18
Allocation 2018/19 2019/20 2020/2
1 2018/1
9 2019/20 2020/21
Net Exchequer 321 830 932 769 370 350 353
8. TOURISM RESEARCH INSTITUTE
Current Expenditure
47 280 300 330
39
45 45
Compensation of employees - 84 90 99
36
39
39
Use of Goods and Services 47 196 210 231
3
6
6
Other Recurrent - - - - - - -
Capital Expenditure 80 225 115 146 0 0 0
Acquisition of Non - Financial Assets 80 100 - - - - -
Other Development - 125 115 146 - - -
TOTAL 127 505 415 476 39 45 45
SUMMARY OF EXPENDITURES AND REVENUES GENERATED
GROSS 127 280 415 476 39 45 45
A-in- A 0 0 0 0
Net Exchequer 127 280 415 476 39 45 45
3.2.3. Highlights on the Sector linkage to the “Big Four” Government priorities.
The sector is key in the development agenda within the MTEF period as it has one of the “Big Four” Government priorities namely manufacturing. The drivers to manufacturing include value addition in agro-processing, textiles and apparel and leather and leather products processing. The key projects to deliver this agenda include; Development of the 30,000 acre Naivasha Industrial Park project, Revitalizing cotton production and value addition, Development of Leather Industrial Park in Kinanie, SME incubation and development (Provision of equipment to SMEs at Constituency level, SME common manufacturing facilities in agro-processing, leather and textiles, Business Development Services & lending to Micro Small and Medium Enterprises).
On the other hand the sector acts as an enabler in the realization of food and nutrition security. This will be done through boosting national food reserves (processing and storage of semi skimmed and whole milk powder) as well as streamlining commodities trading through establishment of Commodities Exchange Platform.
In the financial year 2018/19 the sector has been allocated Ksh. 4.9 billion for implementation of the “big Four” Government priorities. Driver were allocated Ksh. 4 billion (development of Naivasha Industrial Park -2b, Textile and apparel 500m, leather development 500m, Industrial incubation and financing 300m, SME development 700m). While enablers were allocated Ksh. 900m (national food reserves 500m, commodity exchange platform 400m).

150 | P a g e
3.2.4. Resource Allocation Criteria
One-offs to be flagged out A. Recurrent
B. CAPITAL
Personnel Emoluments
P.E. shortfalls Statutory payments Utilities Subscriptions Contractual Obligations Gratuities Pending bills Legal dues Presidential pronouncements Committees/taskforces Payment to interns Bilateral Agreements on Conference hosting Semi-Autonomous Government Agencies Personnel Emoluments
P.E. shortfalls SRC salary adjustments SRC approved benefits Non-Discretionary Expenditures (Latest Audited Accounts) New SAGAs Payment to interns
1. GoK Counterpart funding
2. Ongoing projects
Completion Status/Resources required to complete/
High Impact on extreme poverty/employment/strategic importance over medium to long term development agenda/support to economic growth/ absorption levels and viability & sustainability
Cost overruns/interest
PPP/Joint Ventures
3. Presidential directive/Cabinet directive/flagship projects/GoK priority projects
Ongoing
New (fully processed)
4. Pending bills/Court orders
Audited pending bills
5. Stalled/ESP projects
Completion status
Last payment certificate
Reason for stalling
6. New Projects
Fully processed
Feasibility study done
Detailed designs completed
Necessary approvals obtained
Land secured
7. Innovation
Ensure efficiency savings in MDA budgets
through reduction of operating costs and
elimination of non-core service delivery
activities
Development
Sector (GECA)
Details Budget Estimates BROP ceilings
Difference Projections
2017/18 2018/19 2019/20 2020/21
Gross 10,184.6 7,113.6 3,071.0 8,440.1 8,875.1
GOK 9,311.0 6,240.0 7,566.5 8,001.5
Loans 754.6 754.6 754.6 754.6
Grants 119.0 119.0 119.0 119.0
Local A.I.A. - - - -
S.I. - - - -

151 | P a g e
CHAPTER FOUR:
4. CROSS-SECTOR LINKAGES AND EMERGING ISSUES/CHALLENGES Cross Sector Linkages
As a major sector of the economy, the programmes and projects within the Sector are interlinked
with other Sectors and affect the performance due to forward and backward linkages.The cross
sector linkages of GECA and other sectors are explained in the table below:
Table 4.1: Sector Linkages
Sector Linkages
Agriculture, Rural
and Urban
Development
This Agriculture, Rural and Urban Development sector provides access to
suitable land for implementation of key projects in GECA sector, quality and
sufficient raw materials for processing, commodities for trade, and spatial
planning for urban development. In return, GECA provides necessary farm
inputs, machinery and markets for agricultural products.
Energy,
Infrastructure and
ICT
The Energy, Infrastructure and ICT Sector provides reliable transport
infrastructure, affordable energy, ICT services e.g. one area network
necessary for promotion of industrialization, tourism, trade, regional
integration and also e-platform necessary for trade investments and
information sharing. GECA sector provides tools and machinery for
infrastructural development and consume services from this sector.
Health A healthy workforce is critical for the employee productivity in the sector.
Health sector provides medical, nutrition, public health care services to the
general public. GECA sector provides drugs and pharmaceutical products. It
also mainstreams health Programs and coordinates combating cross border
diseases.
Education
Education sector is important to GECA in providing policy direction on
skills development for improved performance and global competitiveness. In
return GECA provides employment, industrial attachments and internship
opportunities to school graduates. The sector also facilitates the
harmonization of academic standards and a mutual recognition of academic
qualifications especially in the region. It supplements specialized skills
development through its various training and research institutes. The sector
also provides educational materials and equipment.

152 | P a g e
Governance, Justice,
Law and Order
The level of investments in GECA sector is dependent on effective justice,
law and order in the country. This sector also facilitates registration of
business entities and administration of justice particularly resolution of
conflicts and disputes. GECA provides the sector with relevant goods and
services to facilitate their operations.
Public
Administration and
International
Relations
The sector is responsible for legislations, policy approvals, financing of
projects and programs, youth empowerment and facilitation of trade
agreements and international relations. It is also responsible for overall
national development, planning and statistics including monitoring and
evaluation of programmes and projects. GECA sector is a key source of
revenue necessary for supporting the Public Administration and International
Relations. It also promotes Foreign Direct Investment necessary for
sustainable economic growth and development of the country. GECA also
spearheads sensitization to business communities on potential export markets
and available business opportunities, removal of Non-Tariff Barriers (NTB),
promotion of Kenyan products both regionally and overseas markets.
National Security The sector provides security which is paramount for investment, trade and
tourism for growth and development of the GECA sector In return, GECA
sector provides goods and services. It also provides a forum and
mechanism/framework for cooperation in regional defence, peace and
security.
Social Protection,
Culture and
Recreation
The sector formulates labor policies and legal framework necessary for
harmonious industrial relations and employees wellbeing. The sector is a
major contributor to the diversity of tourism products. GECA works closely
with the sector on implementation of relevant laws, guidelines and
programmes It is also a consumer of goods and services from GECA sector.
The sector assists in preservation of cultural heritage by packaging and
enhancing its value as a tourist product.
Environment
Protection, Water
and Natural
Resources.
The sector develops policies, laws and regulations for use of the
environment, water and natural resources by GECA. Water is a critical utility
for GECA. The sector also provides opportunities for tourism attraction. In
addition, it provides raw materials for the GECA in form of minerals, timber
and other products. GECA provides goods, services and markets. GECA is
responsible for the sustainable use of environment, water and natural
resources.

153 | P a g e
4.2. Emerging Issues and Challenges
The sector is faced with a number of challenges and emerging issues which need to be addressed.
Some of the key challenges and emerging issues include:
i. Inadequate funding
The sector contributes about 30% to the GDP, yet it receives1.2% of the total budget. The sector
also continues to experience short falls and reductions in the allocations. This has resulted in delays
in project completion, pending bills, penalties and cost overruns., , In addition, the sector has
statutory obligations which should be funded on time to avoid penalties.
ii. Land availability
The availability of adequate, affordable and accessible land is a crucial factor for implementation of
GECA programmes and projects. High cost of land discourages investment in the sector.
Inadequate spatial planning has inhibited proper growth of towns, tourism sites, industries, markets
and appropriate infrastructure to support them.
iii. Insecurity
The sector has been adversely affected by insecurity related issues. These have resulted in high
insurance costs, costly security programmes and low tourist arrivals due to travel advisories issued by
some countries.
iv. Inadequate Human Resources
The GECA sector has inadequate human resources especially in the technical departments which are
charged with the responsibility of coordinating and implementation of GECA programmes and
projects. The human resource gap is hampering effective delivery of service.
v. Unfavorable Business Environment
Unfavorable business environment affects levels of investments, business planning, employment
creation and revenue collection. Although some progress has been made through ease of doing
business initiative, businesses still face a number of challenges which includes long procedures for
starting a business, high energy costs and high taxation. In addition, the sector is also negatively
affected by lengthy and costly approval and permitting processes in construction and property
transfers, slow cargo clearing processes at the port, unfavorable regulatory framework and
inconsistent application of the common external tariff.
vi. Non-alignment of national and county policies, Legislative and Regulatory Framework

154 | P a g e
Unharmonized legislative and regulatory frame work has greatly hampered effective discharge and
enforcement of the sector’s mandate and the flow of products and services within and outside the
counties. In addition, there is duplication of levies, fees and other charges.
vii. Influx of Sub-Standard, Counterfeits and Contra-Band Goods
The influx of substandard, counterfeit and contra-band products into the local market has reduced
the market share for locally manufactured goods. This has discouraged innovation efforts, negatively
impacted on local industrial growth and reduced the government revenue base. Although Anti-
Counterfeit Agency has been established, the institution lacks adequate capacity and funding to
enforce anti-counterfeit laws and prosecution of cases. A poor standard of products and services is a
risk to the safety and health of the consumers.
viii. Multiple Trade Agreements and Regulations
Kenya is a member of various trading blocs. The East African Community Common External
Tariff (EAC-CET), Rules of Origin (RoO) and trade facilitation measures such as axle-load limits
and transport insurance requirements in these blocs are not uniform. The sector is faced with the
challenge of dealing with unfair competition that is posed by the flow of exports through other
Partner States which belong to other trading blocs where the Rules of Origin are not strictly
enforced. In addition, access to markets by Kenyan products to some countries is threatened by new
trading arrangements that require compliance with WTO rules and regulations. The growth and
development of the sector depends on the existence of a vibrant market for products and services.
ix. Low Level of Awareness on Regional Integration Opportunities/Benefits
There is generally low level of awareness among most Kenyans and business community on the
socio-economic benefits and provisions of the EAC and COMESA integration process. In addition,
although the Tripartite Summit has launched the EAC-COMESA-SADC tripartite negotiations, the
populace and business community is yet to be sensitized on the process. There is also uncertainty in
the regional integration process due to perceived fear of loss of national sovereignty, loss of
revenues and employment.
x. Climate Change
The GECA sector has been negatively impacted by climatic change manifested in severe drought,
floods and uncertain seasonal patterns. This has resulted into uncertain water and electricity supply
for the sector and destruction of infrastructure. In addition, agro-raw materials, forestry products
and food are affected.
xi. Limited Access to affordable credit facilities and financial services
The sector experiences low access to credit thus constraining growth of businesses. In addition, long
term financing which is suitable for investment is also limited.

155 | P a g e
4.3. Emerging Issues
Austerity measures, establishment of new institutions within the sector that will require funding.
Digitization of services within the sector will require funding to facilitate installation of new or
upgrading the existing systems.

156 | P a g e
CHAPTER FIVE
5. CONCLUSION The GECA sector contributes significantly to the country’s economic growth through savings
mobilization, promotion of investments that enhances employment creation, poverty reduction and
foreign exchange earnings. This is complemented by linkages with other sectors in the economy. In
cognizance of the role played by the sector, a number of programmes/projects are being
implemented by the various sub sectors in order to achieve its objectives.
The sector is, however, faced with a number of challenges and emerging issues that impacted
negatively on programmes/projects implementation hampering the realization of accruing benefits
to the society within the planned period. These include but not limited to; inadequate and unreliable
funding, land availability, inadequate human resource; unfavorable business environment,
implementation of legislative and regulatory framework at county level; insecurity, multiple trade
regulation, influx of substandard goods; counterfeit goods and climate change.
During the financial year 2018/19 th sector has prioritized a number of projects to be completed.
The sector will ensure that the projects are implemented within the MTEF period subject to
availability of reliable and sufficient funding.

157 | P a g e
CHAPTER SIX
6. RECOMMENDATIONS In order to enhance the sub-sector’s contribution and productivity to the economy and to ensure
successful implementation of projects planned in the 2018/19-2020/21 Medium Term Expenditure
Framework (MTEF) period, it is recommended as follows:
The sector funding to be enhanced to support implementation of priority programmes and projects
The Government should ensure reliable and affordable power supply.
The sector needs to explore other sources of funding other than PPP and exchequer funding.
There is need for the sector to embrace innovation for effective and efficient delivery of services.
The sector needs to address the issue of pending bills as a first charge on the subsequent year’s resource allocation.
There should be sanctions/rewards for improper/prudent financial management.

158 | P a g e
REFERENCES 1. Kenya Vision 2030, Ministry of Devolution and Planning
2. Second Medium Term Plan 2013-2017 and Sector Plans, Ministry of Devolution and Planning
3. The Executive Order, The Presidency
4. Economic survey 2015, KNBS
5. Budget Review Outlook Paper (BROP),The National Treasury
6. Recurrent and Development Printed Estimates 2017/2018, The National Treasury

159 | P a g e

160 | P a g e
Annexure
Table 3.2.3 Summary of Big Four Interventions Drivers
Sub-sector; Investment and Industry
Manufacturing
BUDGET ESTIMATES FOR MANUFACTURING - KEY PROGRAMS AND INITIATIVES 2018 - 2021 Project Output
Target
Estimate cost
Baseline Allocation 2017/18
Requirement 2018/19
Allocation 2018/19
2019/20
2020/21
TOTAL
2018/19
2019/20
2020/21
2021/22
GOK PPP/ Donor
Total GOK PPP/ Donor
Total GOK PPP/ Donor
Total
Priority Sectors
Textile & Apparel
Increase investments
32b 45b 56b 60b 2.80 -
2.80
4.00
-
4.00
0.50
0.50
0.50
0.50
1.50
Increase no. of jobs 290,0
00
350,0
00
500,0
00
800,00
0
Increase export earnings
80b 120b 160b 200b
Increase demand for local goods (%)
35 50 65 80
Leather Job creation 18,000
35,000
50,000
70,000
1.20 -
1.20
7.80
-
7.80
0.50
0.50
0.50
0.50
1.50
Complete Machakos Park CETP
50 50 0 0
Naivasha Industrial
Park
Locate 400 factories
- - 200 200
4.00 -
4.00
8.60
-
8.60
2.00
2.00
2.00
2.00
6.00
Create 240 jobs - - 120 120
Industrial Financing (KIE)
Credit disbursed 700 700 700 1,000
1.60 -
1.60
5.20
-
5.20 0.30
0.30 0.30 0.30
0.90
MSMEs job creation
4500 5000 5600 6,800

161 | P a g e
Project Output
Target
Estimate cost
Baseline Allocation 2017/18
Requirement 2018/19
Allocation 2018/19
2019/20
2020/21
TOTAL
2018/19
2019/20
2020/21
2021/22
GOK PPP/ Donor
Total GOK PPP/ Donor
Total GOK PPP/ Donor
Total
Priority Sectors
Creation of New Enterprises
800 850 900 1,300
SME Development (SDII, MSEA)
Establish 290 SME Support Program in Constituencies
58 58 58 58
0.90 -
0.90
5.00
-
5.00
0.70
0.70 0.70 0.70 2.10
Roll out 47 SME Centres of Excellence
12 12 12 11
Total 10.50 30.60 - 30.60 4.00 - 4.00 4.00 4.00 12.00

162 | P a g e
Table 3.2.4 Summary of Big Four Interventions Enablers
Sub-sector; Investment and Industry
Food and nutrition security
Project Output
Target
Estimate cost
Baseline Allocation 2017/18
Requirement 2018/19
Allocation 2018/19
2019/20
2020/21
TOTAL
2018/19
2019/20
2020/21
2021/22
GOK PPP/ Donor
Total
GOK PPP/ Donor
Total
GOK PPP/ Donor
Total
Priority Sectors
Establishment of commodities exchange platform
Completion and Operationalization of commodities exchange platform
85% (moc
k tradi
ng)
100% (
start of
commodi
ties tradi
ng)
Increased volu
me and
number
of com
modities
traded
Increased
volume and numb
er of commoditie
s trade
d
5.06
2.00 2.00 0.40 0.40 0.40 0.40 1.20
Dairy processing/ Expansion of facilities at NKCC (Strategic Food Reserve)
milk powder processed and stored
1,250,000
tonnes
processed and
stored
1,250
,000
tonne
s
proce
ssed
and
store
d
1,250
,000
tonne
s
proce
ssed
and
store
d
1,250,
000
tonnes
proces
sed
and
stored
5 0 0 0 1.40 0 1.40 0.50 0 0.50 0.50 0.50 1.50
Total
10.06
3.40
3.40 0.90
0.90 0.90 0.90 2.70