Hakonen et al. 2015: Assessing the application of laser scanning and 3D inspection in the study of...
8
Assessing the application of laser scanning and 3D inspection in the study of prehistoric cairn sites: The case study of Tahkokangas, Northern Finland Aki Hakonen ⁎, Jari-Matti Kuusela, Jari Okkonen Archaeology, Faculty of Humanities, University of Oulu, 90570, Finland abstract article info Article history: Received 16 October 2014 Received in revised form 23 January 2015 Accepted 8 February 2015 Available online 18 February 2015 Keywords: Laser scanning 3D inspection Prehistory Cairns Finland Laser scanning has the potential of becoming an indispensable documentation method in archaeology. To test its application in interpretatively challenging archaeological settings, a part of the prehistoric cemetery of Tahkokangas in Northern Finland was scanned. The site consists of stone settings of varying form whose eleva- tion and morphology indicate a date of 600–200 BC. A boulder field where six of the ten settings on the site are located was scanned. The structures were difficult to interpret on-site due to their inconspicuous nature. In this paper, in order to circumvent the problem, the gathered 3D data is processed into meshes and false colored by height. The meshes and the height colorization allow detailed structural interpretation of the settings. The 3D material allows new directions for the study of the site. Previously undetected extensions of the largest stone setting were discovered. Also the structural analysis of the setting suggests that additional support struc- tures may have been used. Along with the findings, limitations and advantages of laser scanning and 3D inspec- tion are discussed. The results and conclusions show laser scanning to be a useful documentation method even when studying indistinct sites for which the scanner was not originally designed for. Still, the method does not produce new information, but merely aids in its perception and interpretation. © 2015 Elsevier Ltd. All rights reserved. 1. Introduction Terrestrial Laser Scanning (TLS) has been successfully used in multi- ple archaeological assignments. From preservation to presentation, the reasons for its use have varied from case to case. In this paper the limits and advantages of laser scanning are studied through a scan of a Finnish Iron Age burial site. The site, Tahkokangas, is located 5 km from down- town Oulu in Northern Finland (Fig. 1). It contains ten shallow stone settings (meaning cairns formed of approximately one to three stone layers) dated to Pre-Roman Iron Age (500–1 BC in Finnish chronology). Six of them are situated in a boulder field formed alongside a ridge cre- ated during the last glaciation. In the autumn of 2011 seven of the structures were excavated (Kuusela, 2012). During the excavations the boulder field and the six structures located in it were recorded with a laser scanner, after which three of the scanned structures were completely excavated. Aside from a single piece of a flint artifact, the burials were unfurnished. A year after the excavation two unexcavated structures were damaged when metal detectorists dug after signals. The data collected with TLS contains the only three dimensional documentation of the structures prior to the unauthorized intrusion. TLS is a fairly new technique in archaeology. Perhaps because of this, and the cost of the equipment, it is often negatively seen as a novelty, its usage frequently limited in publications to atypical archaeological sites, such as architectural heritage (see e.g. Al-kheder et al., 2009; Alshawabkeh et al., 2010; Barton, 2009; Lambers et al., 2007; Schreiber et al., 2012; Szocs et al., 2006) and cave sites (see e.g. Rüther et al., 2009; Lerma et al., 2010; Burens et al., 2011; Rodríguez-Gonzálvez et al., 2012; Núñez et al., 2013; Puchol et al., 2013). Usually the application is for conservation or visualization, but some studies include actual interpre- tation derived from the 3D data itself (see e.g. Montani et al., 2012: 3351–3352; Rüther et al., 2009: 1853; Schreiber et al., 2012: 16–17). Practical interpretative use of laser scanning on sites which are difficult to interpret and whose architectural dimensions are almost nonexis- tent, i.e. most prehistoric archaeological sites, appears to have been somewhat insufficiently studied. As the equipment becomes more ac- cessible and less expensive, the use of laser scanning is going to grow exponentially, along with photogrammetric methods (for recent exam- ples see De Reu et al., 2014; Green et al., 2014). The question is can laser scanning be useful where it is not designed to be used. The most useful application of TLS is for the documentation of a uni- form surface, like the aforementioned cave walls or masonry. The meth- od has also been used in conjunction with the stratigraphic excavation method, where the surfaces of layers are documented in 3D (e.g. Doneus and Neubauer, 2006; Moser et al., 2010; see Doneus et al., Journal of Archaeological Science: Reports 2 (2015) 227–234 ⁎ Corresponding author. Tel.: +358 408449930. E-mail address: [email protected].fi (A. Hakonen). http://dx.doi.org/10.1016/j.jasrep.2015.02.001 2352-409X/© 2015 Elsevier Ltd. All rights reserved. Contents lists available at ScienceDirect Journal of Archaeological Science: Reports journal homepage: http://ees.elsevier.com/jasrep
-
Upload
independent -
Category
Documents
-
view
0 -
download
0
Transcript of Hakonen et al. 2015: Assessing the application of laser scanning and 3D inspection in the study of...
Journal of Archaeological Science: Reports 2 (2015) 227–234
Contents lists available at ScienceDirect
Journal of Archaeological Science: Reports
j ourna l homepage: ht tp : / /ees .e lsev ie r .com/ jas rep
Assessing the application of laser scanning and 3D inspection in the studyof prehistoric cairn sites: The case study of Tahkokangas,Northern Finland
Aki Hakonen ⁎, Jari-Matti Kuusela, Jari OkkonenArchaeology, Faculty of Humanities, University of Oulu, 90570, Finland
⁎ Corresponding author. Tel.: +358 408449930.E-mail address: [email protected] (A. Hako
http://dx.doi.org/10.1016/j.jasrep.2015.02.0012352-409X/© 2015 Elsevier Ltd. All rights reserved.
a b s t r a c t
a r t i c l e i n f oArticle history:Received 16 October 2014Received in revised form 23 January 2015Accepted 8 February 2015Available online 18 February 2015
Keywords:Laser scanning3D inspectionPrehistoryCairnsFinland
Laser scanning has the potential of becoming an indispensable documentationmethod in archaeology. To test itsapplication in interpretatively challenging archaeological settings, a part of the prehistoric cemetery ofTahkokangas in Northern Finland was scanned. The site consists of stone settings of varying form whose eleva-tion and morphology indicate a date of 600–200 BC. A boulder field where six of the ten settings on the siteare located was scanned. The structures were difficult to interpret on-site due to their inconspicuous nature. Inthis paper, in order to circumvent the problem, the gathered 3D data is processed into meshes and false coloredby height. The meshes and the height colorization allow detailed structural interpretation of the settings.The 3D material allows new directions for the study of the site. Previously undetected extensions of the largeststone setting were discovered. Also the structural analysis of the setting suggests that additional support struc-tures may have been used. Along with the findings, limitations and advantages of laser scanning and 3D inspec-tion are discussed. The results and conclusions show laser scanning to be a useful documentation method evenwhen studying indistinct sites for which the scanner was not originally designed for. Still, the method does notproduce new information, but merely aids in its perception and interpretation.
© 2015 Elsevier Ltd. All rights reserved.
1. Introduction
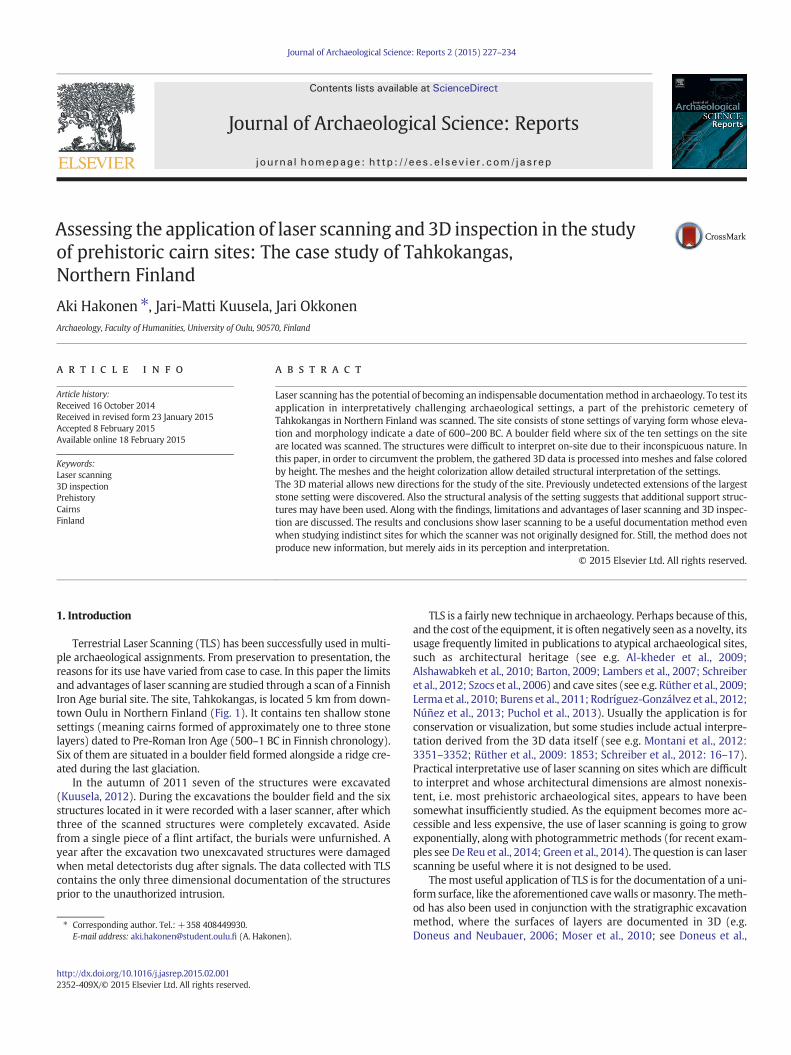
Terrestrial Laser Scanning (TLS) has been successfully used inmulti-ple archaeological assignments. From preservation to presentation, thereasons for its use have varied from case to case. In this paper the limitsand advantages of laser scanning are studied through a scan of a FinnishIron Age burial site. The site, Tahkokangas, is located 5 km from down-town Oulu in Northern Finland (Fig. 1). It contains ten shallow stonesettings (meaning cairns formed of approximately one to three stonelayers) dated to Pre-Roman Iron Age (500–1 BC in Finnish chronology).Six of them are situated in a boulder field formed alongside a ridge cre-ated during the last glaciation.
In the autumn of 2011 seven of the structures were excavated(Kuusela, 2012). During the excavations the boulder field and the sixstructures located in it were recorded with a laser scanner, after whichthree of the scanned structures were completely excavated. Asidefrom a single piece of a flint artifact, the burials were unfurnished. Ayear after the excavation two unexcavated structures were damagedwhen metal detectorists dug after signals. The data collected with TLScontains the only three dimensional documentation of the structuresprior to the unauthorized intrusion.
nen).
TLS is a fairly new technique in archaeology. Perhaps because of this,and the cost of the equipment, it is often negatively seen as a novelty, itsusage frequently limited in publications to atypical archaeological sites,such as architectural heritage (see e.g. Al-kheder et al., 2009;Alshawabkeh et al., 2010; Barton, 2009; Lambers et al., 2007; Schreiberet al., 2012; Szocs et al., 2006) and cave sites (see e.g. Rüther et al., 2009;Lerma et al., 2010; Burens et al., 2011; Rodríguez-Gonzálvez et al., 2012;Núñez et al., 2013; Puchol et al., 2013). Usually the application is forconservation or visualization, but some studies include actual interpre-tation derived from the 3D data itself (see e.g. Montani et al., 2012:3351–3352; Rüther et al., 2009: 1853; Schreiber et al., 2012: 16–17).Practical interpretative use of laser scanning on sites which are difficultto interpret and whose architectural dimensions are almost nonexis-tent, i.e. most prehistoric archaeological sites, appears to have beensomewhat insufficiently studied. As the equipment becomes more ac-cessible and less expensive, the use of laser scanning is going to growexponentially, alongwith photogrammetric methods (for recent exam-ples see De Reu et al., 2014; Green et al., 2014). The question is can laserscanning be useful where it is not designed to be used.
Themost useful application of TLS is for the documentation of a uni-form surface, like the aforementioned cavewalls ormasonry. Themeth-od has also been used in conjunction with the stratigraphic excavationmethod, where the surfaces of layers are documented in 3D (e.g.Doneus and Neubauer, 2006; Moser et al., 2010; see Doneus et al.,
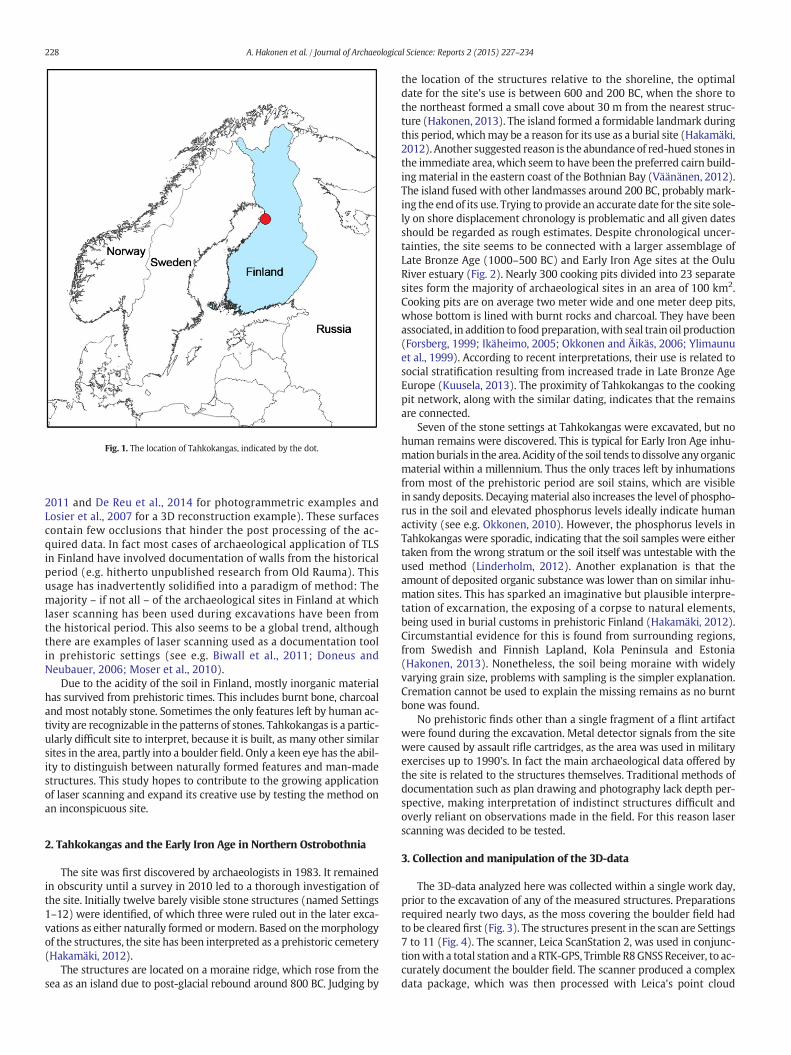
Fig. 1. The location of Tahkokangas, indicated by the dot.
228 A. Hakonen et al. / Journal of Archaeological Science: Reports 2 (2015) 227–234
2011 and De Reu et al., 2014 for photogrammetric examples andLosier et al., 2007 for a 3D reconstruction example). These surfacescontain few occlusions that hinder the post processing of the ac-quired data. In fact most cases of archaeological application of TLSin Finland have involved documentation of walls from the historicalperiod (e.g. hitherto unpublished research from Old Rauma). Thisusage has inadvertently solidified into a paradigm of method: Themajority – if not all – of the archaeological sites in Finland at whichlaser scanning has been used during excavations have been fromthe historical period. This also seems to be a global trend, althoughthere are examples of laser scanning used as a documentation toolin prehistoric settings (see e.g. Biwall et al., 2011; Doneus andNeubauer, 2006; Moser et al., 2010).
Due to the acidity of the soil in Finland, mostly inorganic materialhas survived from prehistoric times. This includes burnt bone, charcoaland most notably stone. Sometimes the only features left by human ac-tivity are recognizable in the patterns of stones. Tahkokangas is a partic-ularly difficult site to interpret, because it is built, as many other similarsites in the area, partly into a boulder field. Only a keen eye has the abil-ity to distinguish between naturally formed features and man-madestructures. This study hopes to contribute to the growing applicationof laser scanning and expand its creative use by testing the method onan inconspicuous site.
2. Tahkokangas and the Early Iron Age in Northern Ostrobothnia
The site was first discovered by archaeologists in 1983. It remainedin obscurity until a survey in 2010 led to a thorough investigation ofthe site. Initially twelve barely visible stone structures (named Settings1–12) were identified, of which three were ruled out in the later exca-vations as either naturally formed ormodern. Based on themorphologyof the structures, the site has been interpreted as a prehistoric cemetery(Hakamäki, 2012).
The structures are located on a moraine ridge, which rose from thesea as an island due to post-glacial rebound around 800 BC. Judging by
the location of the structures relative to the shoreline, the optimaldate for the site's use is between 600 and 200 BC, when the shore tothe northeast formed a small cove about 30 m from the nearest struc-ture (Hakonen, 2013). The island formed a formidable landmark duringthis period, whichmay be a reason for its use as a burial site (Hakamäki,2012). Another suggested reason is the abundance of red-hued stones inthe immediate area, which seem to have been the preferred cairn build-ingmaterial in the eastern coast of the Bothnian Bay (Väänänen, 2012).The island fused with other landmasses around 200 BC, probably mark-ing the end of its use. Trying to provide an accurate date for the site sole-ly on shore displacement chronology is problematic and all given datesshould be regarded as rough estimates. Despite chronological uncer-tainties, the site seems to be connected with a larger assemblage ofLate Bronze Age (1000–500 BC) and Early Iron Age sites at the OuluRiver estuary (Fig. 2). Nearly 300 cooking pits divided into 23 separatesites form the majority of archaeological sites in an area of 100 km2.Cooking pits are on average two meter wide and one meter deep pits,whose bottom is lined with burnt rocks and charcoal. They have beenassociated, in addition to food preparation,with seal train oil production(Forsberg, 1999; Ikäheimo, 2005; Okkonen and Äikäs, 2006; Ylimaunuet al., 1999). According to recent interpretations, their use is related tosocial stratification resulting from increased trade in Late Bronze AgeEurope (Kuusela, 2013). The proximity of Tahkokangas to the cookingpit network, along with the similar dating, indicates that the remainsare connected.
Seven of the stone settings at Tahkokangas were excavated, but nohuman remains were discovered. This is typical for Early Iron Age inhu-mation burials in the area. Acidity of the soil tends to dissolve any organicmaterial within a millennium. Thus the only traces left by inhumationsfrom most of the prehistoric period are soil stains, which are visiblein sandy deposits. Decayingmaterial also increases the level of phospho-rus in the soil and elevated phosphorus levels ideally indicate humanactivity (see e.g. Okkonen, 2010). However, the phosphorus levels inTahkokangas were sporadic, indicating that the soil samples were eithertaken from the wrong stratum or the soil itself was untestable with theused method (Linderholm, 2012). Another explanation is that theamount of deposited organic substance was lower than on similar inhu-mation sites. This has sparked an imaginative but plausible interpre-tation of excarnation, the exposing of a corpse to natural elements,being used in burial customs in prehistoric Finland (Hakamäki, 2012).Circumstantial evidence for this is found from surrounding regions,from Swedish and Finnish Lapland, Kola Peninsula and Estonia(Hakonen, 2013). Nonetheless, the soil being moraine with widelyvarying grain size, problems with sampling is the simpler explanation.Cremation cannot be used to explain the missing remains as no burntbone was found.
No prehistoric finds other than a single fragment of a flint artifactwere found during the excavation. Metal detector signals from the sitewere caused by assault rifle cartridges, as the area was used in militaryexercises up to 1990's. In fact the main archaeological data offered bythe site is related to the structures themselves. Traditional methods ofdocumentation such as plan drawing and photography lack depth per-spective, making interpretation of indistinct structures difficult andoverly reliant on observations made in the field. For this reason laserscanning was decided to be tested.
3. Collection and manipulation of the 3D-data
The 3D-data analyzed here was collected within a single work day,prior to the excavation of any of the measured structures. Preparationsrequired nearly two days, as the moss covering the boulder field hadto be cleared first (Fig. 3). The structures present in the scan are Settings7 to 11 (Fig. 4). The scanner, Leica ScanStation 2, was used in conjunc-tionwith a total station and a RTK-GPS, Trimble R8GNSS Receiver, to ac-curately document the boulder field. The scanner produced a complexdata package, which was then processed with Leica's point cloud
Fig. 2. Location of Tahkokangas compared to the Late Bronze Age/Early Iron Age site assemblage in the mouth of prehistoric Oulu River.
229A. Hakonen et al. / Journal of Archaeological Science: Reports 2 (2015) 227–234
manipulation software Cyclone. The point cloud was further processedwith open source program CloudCompare (Girardeau-Montaut, 2015)and transformed into mesh format.
The scanning was done from four opposite positions (shown inFig. 4). Six targets were used as benchmarks in unifying the separatepoint cloud scanworlds. The positioning of the scanner was dependenton visibility, as the site was located in a forested area. A point cloud ofnearly 10million coordinate points was produced, of which the boulderfield itself contained 5 million. The phases for processing the pointcloud included the following: Registration, georeferencing, vegetationreduction, division of points and creation of meshes. Registrationwas straightforward with Cyclone's own registration protocol, butgeoreferencing proved to be problematic. As the point cloud was creat-ed to an abstract coordinate system, it had to be transformed to geo-graphic coordinates. This was done with the aid of the RTK-GPS andthe total station. Three geographic benchmarks were measured withthe RTK-GPS. All the benchmarks, both geographic and those used forscanworld registration were measured with the total station. Compari-son of the benchmarks and their conversion to EUREF-FIN-coordinatesin ArcGIS allowed the point cloud to be georeferenced. Small inaccu-racies in the measurements multiplied as the benchmarks wereconformed from one medium to the next. The resulting inaccuracy isapproximately 0.5 m horizontal and 0.01 m vertical. As the accuracyof the points relative to each otherwas not affected, the horizontal inac-curacy is not a factor in this case.
In order to reduce the amount of points interfering with mesh crea-tion, vegetation had to be edited out. Undergrowth and trees left inplace during the excavation were removed as thoroughly as possible.This was done manually, since automated methods risk the accidentalremoval of structural features. The next phase was the division of thepoint cloud. The surrounding landscapewas separated from the boulder
field, after which the structures within it were assigned as differentclouds.
The clouds of the structureswere imported to CloudCompare, whichhas a tool for creating Poisson meshes. 3D Mesh Poisson ReconstructionPlugin was determined to be the most suitable automatic open sourcepoint cloud conversion tool, because of its ability to represent gaps be-tween rocks and boulders, which could not be correctly documentedby the scanner. After assigning normals, the mesh was constructedwith octree level 14 to provide the highest possible accuracy.CloudCompare also includes a height grid generation tool, which re-duces the point cloud's resolution to a level determined by the user,while taking into account only the points that are at ground level. Theelevation map in Fig. 4 was created by reducing the complete pointcloud to the resolution of a point per 0.25 m2, transforming it intoDelaunay 2Dmesh and smoothing it to reduce spikes created by vegeta-tion. The boulder field and the structureswere then assimilated into theelevation map as separate objects. Forming a solid mesh surface pro-vides assistance in interpreting a point cloud, which is by default visual-ized without depth perspective. As points at different distances arepresented as same sized, the viewer can very easily get disorientedand lose perception of the point cloud's structure. Contrary to this,when inspecting amesh false colored by height,man-made patterns be-come easily distinguishable.
4. Analysis: The site through 3D inspection
The edited point cloud and the constructed mesh form the basis fordetailed inspection of the stone structures. Settings 7, 8 and 9 are situat-ed on the slope of the ridgewhile 10 and 11 are at the bottom. Setting 7a(Fig. 5; abbreviation S7a) is a rounded rectangular depressionwith shal-low walls. It is characterized by a large immovable boulder situated on
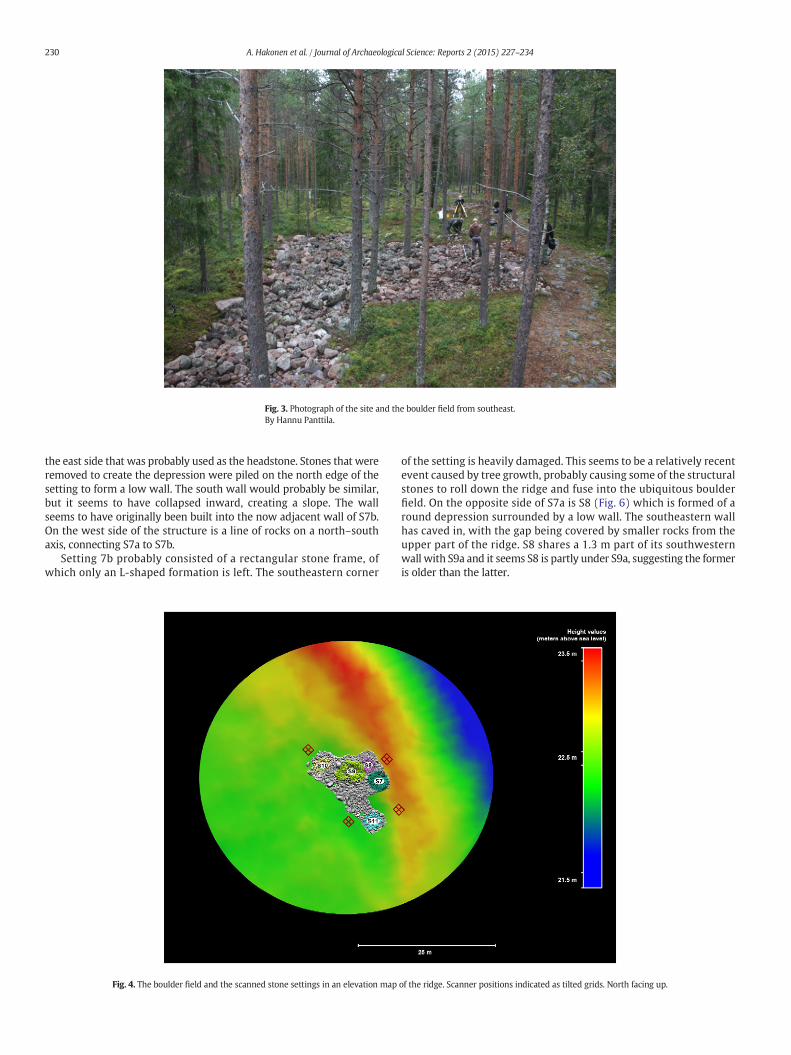
Fig. 3. Photograph of the site and the boulder field from southeast.By Hannu Panttila.
230 A. Hakonen et al. / Journal of Archaeological Science: Reports 2 (2015) 227–234
the east side that was probably used as the headstone. Stones that wereremoved to create the depression were piled on the north edge of thesetting to form a low wall. The south wall would probably be similar,but it seems to have collapsed inward, creating a slope. The wallseems to have originally been built into the now adjacent wall of S7b.On the west side of the structure is a line of rocks on a north–southaxis, connecting S7a to S7b.
Setting 7b probably consisted of a rectangular stone frame, ofwhich only an L-shaped formation is left. The southeastern corner
Fig. 4. The boulder field and the scanned stone settings in an elevation map
of the setting is heavily damaged. This seems to be a relatively recentevent caused by tree growth, probably causing some of the structuralstones to roll down the ridge and fuse into the ubiquitous boulderfield. On the opposite side of S7a is S8 (Fig. 6) which is formed of around depression surrounded by a low wall. The southeastern wallhas caved in, with the gap being covered by smaller rocks from theupper part of the ridge. S8 shares a 1.3 m part of its southwesternwall with S9a and it seems S8 is partly under S9a, suggesting the formeris older than the latter.
of the ridge. Scanner positions indicated as tilted grids. North facing up.
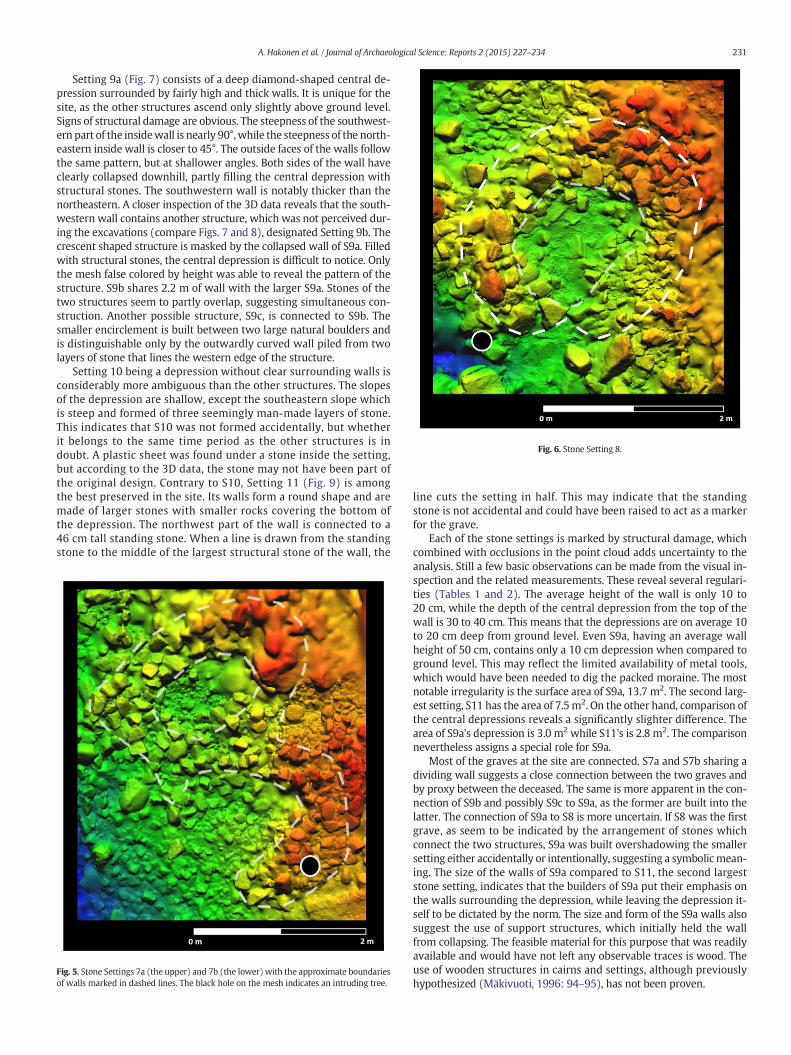
Fig. 6. Stone Setting 8.
231A. Hakonen et al. / Journal of Archaeological Science: Reports 2 (2015) 227–234
Setting 9a (Fig. 7) consists of a deep diamond-shaped central de-pression surrounded by fairly high and thick walls. It is unique for thesite, as the other structures ascend only slightly above ground level.Signs of structural damage are obvious. The steepness of the southwest-ern part of the insidewall is nearly 90°,while the steepness of the north-eastern inside wall is closer to 45°. The outside faces of the walls followthe same pattern, but at shallower angles. Both sides of the wall haveclearly collapsed downhill, partly filling the central depression withstructural stones. The southwestern wall is notably thicker than thenortheastern. A closer inspection of the 3D data reveals that the south-western wall contains another structure, which was not perceived dur-ing the excavations (compare Figs. 7 and 8), designated Setting 9b. Thecrescent shaped structure is masked by the collapsed wall of S9a. Filledwith structural stones, the central depression is difficult to notice. Onlythe mesh false colored by height was able to reveal the pattern of thestructure. S9b shares 2.2 m of wall with the larger S9a. Stones of thetwo structures seem to partly overlap, suggesting simultaneous con-struction. Another possible structure, S9c, is connected to S9b. Thesmaller encirclement is built between two large natural boulders andis distinguishable only by the outwardly curved wall piled from twolayers of stone that lines the western edge of the structure.
Setting 10 being a depression without clear surrounding walls isconsiderably more ambiguous than the other structures. The slopesof the depression are shallow, except the southeastern slope whichis steep and formed of three seemingly man-made layers of stone.This indicates that S10 was not formed accidentally, but whetherit belongs to the same time period as the other structures is indoubt. A plastic sheet was found under a stone inside the setting,but according to the 3D data, the stone may not have been part ofthe original design. Contrary to S10, Setting 11 (Fig. 9) is amongthe best preserved in the site. Its walls form a round shape and aremade of larger stones with smaller rocks covering the bottom ofthe depression. The northwest part of the wall is connected to a46 cm tall standing stone. When a line is drawn from the standingstone to the middle of the largest structural stone of the wall, the
Fig. 5. Stone Settings 7a (the upper) and 7b (the lower)with the approximate boundariesof walls marked in dashed lines. The black hole on the mesh indicates an intruding tree.
line cuts the setting in half. This may indicate that the standingstone is not accidental and could have been raised to act as a markerfor the grave.
Each of the stone settings is marked by structural damage, whichcombined with occlusions in the point cloud adds uncertainty to theanalysis. Still a few basic observations can be made from the visual in-spection and the related measurements. These reveal several regulari-ties (Tables 1 and 2). The average height of the wall is only 10 to20 cm, while the depth of the central depression from the top of thewall is 30 to 40 cm. This means that the depressions are on average 10to 20 cm deep from ground level. Even S9a, having an average wallheight of 50 cm, contains only a 10 cm depression when compared toground level. This may reflect the limited availability of metal tools,which would have been needed to dig the packed moraine. The mostnotable irregularity is the surface area of S9a, 13.7 m2. The second larg-est setting, S11 has the area of 7.5m2. On the other hand, comparison ofthe central depressions reveals a significantly slighter difference. Thearea of S9a's depression is 3.0 m2 while S11's is 2.8 m2. The comparisonnevertheless assigns a special role for S9a.
Most of the graves at the site are connected. S7a and S7b sharing adividing wall suggests a close connection between the two graves andby proxy between the deceased. The same is more apparent in the con-nection of S9b and possibly S9c to S9a, as the former are built into thelatter. The connection of S9a to S8 is more uncertain. If S8 was the firstgrave, as seem to be indicated by the arrangement of stones whichconnect the two structures, S9a was built overshadowing the smallersetting either accidentally or intentionally, suggesting a symbolicmean-ing. The size of the walls of S9a compared to S11, the second largeststone setting, indicates that the builders of S9a put their emphasis onthe walls surrounding the depression, while leaving the depression it-self to be dictated by the norm. The size and form of the S9a walls alsosuggest the use of support structures, which initially held the wallfrom collapsing. The feasible material for this purpose that was readilyavailable and would have not left any observable traces is wood. Theuse of wooden structures in cairns and settings, although previouslyhypothesized (Mäkivuoti, 1996: 94–95), has not been proven.
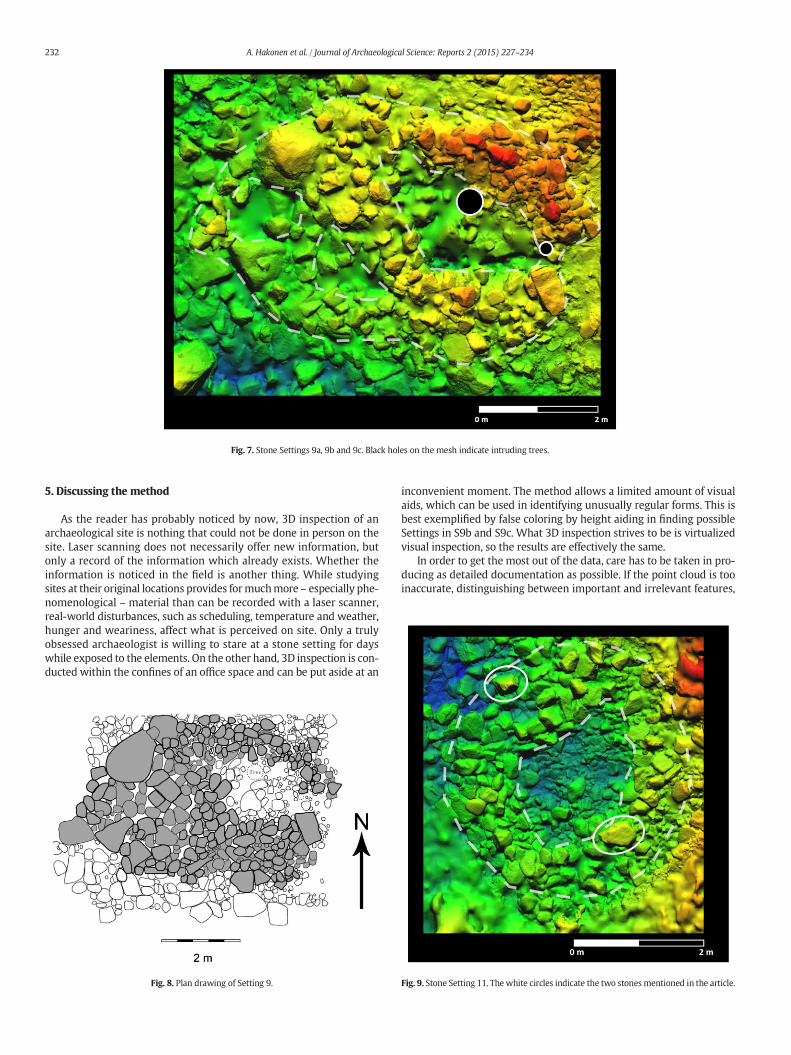
Fig. 7. Stone Settings 9a, 9b and 9c. Black holes on the mesh indicate intruding trees.
232 A. Hakonen et al. / Journal of Archaeological Science: Reports 2 (2015) 227–234
5. Discussing the method
As the reader has probably noticed by now, 3D inspection of anarchaeological site is nothing that could not be done in person on thesite. Laser scanning does not necessarily offer new information, butonly a record of the information which already exists. Whether theinformation is noticed in the field is another thing. While studyingsites at their original locations provides formuchmore – especially phe-nomenological – material than can be recorded with a laser scanner,real-world disturbances, such as scheduling, temperature and weather,hunger and weariness, affect what is perceived on site. Only a trulyobsessed archaeologist is willing to stare at a stone setting for dayswhile exposed to the elements. On the other hand, 3D inspection is con-ducted within the confines of an office space and can be put aside at an
Fig. 8. Plan drawing of Setting 9.
inconvenient moment. The method allows a limited amount of visualaids, which can be used in identifying unusually regular forms. This isbest exemplified by false coloring by height aiding in finding possibleSettings in S9b and S9c. What 3D inspection strives to be is virtualizedvisual inspection, so the results are effectively the same.
In order to get the most out of the data, care has to be taken in pro-ducing as detailed documentation as possible. If the point cloud is tooinaccurate, distinguishing between important and irrelevant features,
Fig. 9. Stone Setting 11. The white circles indicate the two stones mentioned in the article.
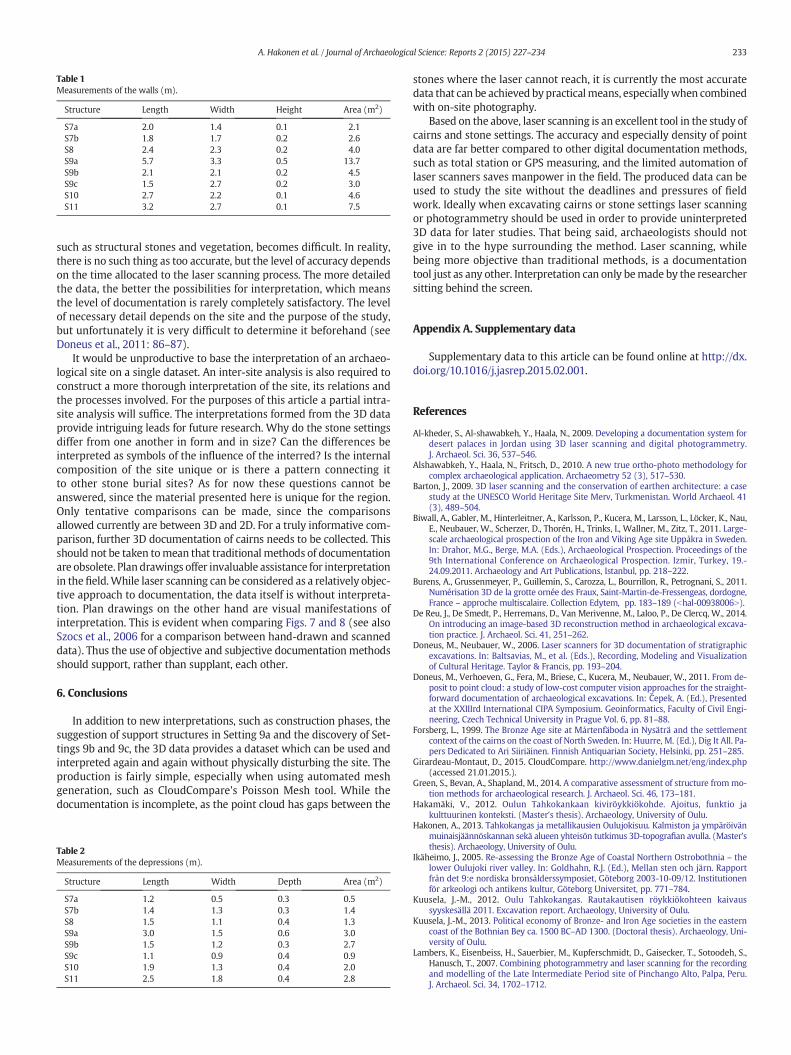
Table 1Measurements of the walls (m).
Structure Length Width Height Area (m2)
S7a 2.0 1.4 0.1 2.1S7b 1.8 1.7 0.2 2.6S8 2.4 2.3 0.2 4.0S9a 5.7 3.3 0.5 13.7S9b 2.1 2.1 0.2 4.5S9c 1.5 2.7 0.2 3.0S10 2.7 2.2 0.1 4.6S11 3.2 2.7 0.1 7.5
233A. Hakonen et al. / Journal of Archaeological Science: Reports 2 (2015) 227–234
such as structural stones and vegetation, becomes difficult. In reality,there is no such thing as too accurate, but the level of accuracy dependson the time allocated to the laser scanning process. The more detailedthe data, the better the possibilities for interpretation, which meansthe level of documentation is rarely completely satisfactory. The levelof necessary detail depends on the site and the purpose of the study,but unfortunately it is very difficult to determine it beforehand (seeDoneus et al., 2011: 86–87).
It would be unproductive to base the interpretation of an archaeo-logical site on a single dataset. An inter-site analysis is also required toconstruct a more thorough interpretation of the site, its relations andthe processes involved. For the purposes of this article a partial intra-site analysis will suffice. The interpretations formed from the 3D dataprovide intriguing leads for future research. Why do the stone settingsdiffer from one another in form and in size? Can the differences beinterpreted as symbols of the influence of the interred? Is the internalcomposition of the site unique or is there a pattern connecting itto other stone burial sites? As for now these questions cannot beanswered, since the material presented here is unique for the region.Only tentative comparisons can be made, since the comparisonsallowed currently are between 3D and 2D. For a truly informative com-parison, further 3D documentation of cairns needs to be collected. Thisshould not be taken tomean that traditional methods of documentationare obsolete. Plandrawings offer invaluable assistance for interpretationin the field.While laser scanning can be considered as a relatively objec-tive approach to documentation, the data itself is without interpreta-tion. Plan drawings on the other hand are visual manifestations ofinterpretation. This is evident when comparing Figs. 7 and 8 (see alsoSzocs et al., 2006 for a comparison between hand-drawn and scanneddata). Thus the use of objective and subjective documentation methodsshould support, rather than supplant, each other.
6. Conclusions
In addition to new interpretations, such as construction phases, thesuggestion of support structures in Setting 9a and the discovery of Set-tings 9b and 9c, the 3D data provides a dataset which can be used andinterpreted again and again without physically disturbing the site. Theproduction is fairly simple, especially when using automated meshgeneration, such as CloudCompare's Poisson Mesh tool. While thedocumentation is incomplete, as the point cloud has gaps between the
Table 2Measurements of the depressions (m).
Structure Length Width Depth Area (m2)
S7a 1.2 0.5 0.3 0.5S7b 1.4 1.3 0.3 1.4S8 1.5 1.1 0.4 1.3S9a 3.0 1.5 0.6 3.0S9b 1.5 1.2 0.3 2.7S9c 1.1 0.9 0.4 0.9S10 1.9 1.3 0.4 2.0S11 2.5 1.8 0.4 2.8
stones where the laser cannot reach, it is currently the most accuratedata that can be achieved bypracticalmeans, especiallywhen combinedwith on-site photography.
Based on the above, laser scanning is an excellent tool in the study ofcairns and stone settings. The accuracy and especially density of pointdata are far better compared to other digital documentation methods,such as total station or GPS measuring, and the limited automation oflaser scanners saves manpower in the field. The produced data can beused to study the site without the deadlines and pressures of fieldwork. Ideally when excavating cairns or stone settings laser scanningor photogrammetry should be used in order to provide uninterpreted3D data for later studies. That being said, archaeologists should notgive in to the hype surrounding the method. Laser scanning, whilebeing more objective than traditional methods, is a documentationtool just as any other. Interpretation can only bemade by the researchersitting behind the screen.
Appendix A. Supplementary data
Supplementary data to this article can be found online at http://dx.doi.org/10.1016/j.jasrep.2015.02.001.
References
Al-kheder, S., Al-shawabkeh, Y., Haala, N., 2009. Developing a documentation system fordesert palaces in Jordan using 3D laser scanning and digital photogrammetry.J. Archaeol. Sci. 36, 537–546.
Alshawabkeh, Y., Haala, N., Fritsch, D., 2010. A new true ortho-photo methodology forcomplex archaeological application. Archaeometry 52 (3), 517–530.
Barton, J., 2009. 3D laser scanning and the conservation of earthen architecture: a casestudy at the UNESCO World Heritage Site Merv, Turkmenistan. World Archaeol. 41(3), 489–504.
Biwall, A., Gabler, M., Hinterleitner, A., Karlsson, P., Kucera, M., Larsson, L., Löcker, K., Nau,E., Neubauer, W., Scherzer, D., Thorén, H., Trinks, I., Wallner, M., Zitz, T., 2011. Large-scale archaeological prospection of the Iron and Viking Age site Uppåkra in Sweden.In: Drahor, M.G., Berge, M.A. (Eds.), Archaeological Prospection. Proceedings of the9th International Conference on Archaeological Prospection. Izmir, Turkey, 19.-24.09.2011. Archaeology and Art Publications, Istanbul, pp. 218–222.
Burens, A., Grussenmeyer, P., Guillemin, S., Carozza, L., Bourrillon, R., Petrognani, S., 2011.Numérisation 3D de la grotte ornée des Fraux, Saint-Martin-de-Fressengeas, dordogne,France – approche multiscalaire. Collection Edytem, pp. 183–189 (bhal-00938006N).
De Reu, J., De Smedt, P., Herremans, D., Van Merivenne, M., Laloo, P., De Clercq, W., 2014.On introducing an image-based 3D reconstruction method in archaeological excava-tion practice. J. Archaeol. Sci. 41, 251–262.
Doneus, M., Neubauer, W., 2006. Laser scanners for 3D documentation of stratigraphicexcavations. In: Baltsavias, M., et al. (Eds.), Recording, Modeling and Visualizationof Cultural Heritage. Taylor & Francis, pp. 193–204.
Doneus, M., Verhoeven, G., Fera, M., Briese, C., Kucera, M., Neubauer, W., 2011. From de-posit to point cloud: a study of low-cost computer vision approaches for the straight-forward documentation of archaeological excavations. In: Čepek, A. (Ed.), Presentedat the XXIIIrd International CIPA Symposium. Geoinformatics, Faculty of Civil Engi-neering, Czech Technical University in Prague Vol. 6, pp. 81–88.
Forsberg, L., 1999. The Bronze Age site at Mårtenfäboda in Nysäträ and the settlementcontext of the cairns on the coast of North Sweden. In: Huurre, M. (Ed.), Dig It All. Pa-pers Dedicated to Ari Siiriäinen. Finnish Antiquarian Society, Helsinki, pp. 251–285.
Girardeau-Montaut, D., 2015. CloudCompare. http://www.danielgm.net/eng/index.php(accessed 21.01.2015.).
Green, S., Bevan, A., Shapland, M., 2014. A comparative assessment of structure frommo-tion methods for archaeological research. J. Archaeol. Sci. 46, 173–181.
Hakamäki, V., 2012. Oulun Tahkokankaan kiviröykkiökohde. Ajoitus, funktio jakulttuurinen konteksti. (Master's thesis). Archaeology, University of Oulu.
Hakonen, A., 2013. Tahkokangas ja metallikausien Oulujokisuu. Kalmiston ja ympäröivänmuinaisjäännöskannan sekä alueen yhteisön tutkimus 3D-topografian avulla. (Master'sthesis). Archaeology, University of Oulu.
Ikäheimo, J., 2005. Re-assessing the Bronze Age of Coastal Northern Ostrobothnia – thelower Oulujoki river valley. In: Goldhahn, R.J. (Ed.), Mellan sten och järn. Rapportfrån det 9:e nordiska bronsålderssymposiet, Göteborg 2003-10-09/12. Institutionenför arkeologi och antikens kultur, Göteborg Universitet, pp. 771–784.
Kuusela, J.-M., 2012. Oulu Tahkokangas. Rautakautisen röykkiökohteen kaivaussyyskesällä 2011. Excavation report. Archaeology, University of Oulu.
Kuusela, J.-M., 2013. Political economy of Bronze- and Iron Age societies in the easterncoast of the Bothnian Bey ca. 1500 BC–AD 1300. (Doctoral thesis). Archaeology, Uni-versity of Oulu.
Lambers, K., Eisenbeiss, H., Sauerbier, M., Kupferschmidt, D., Gaisecker, T., Sotoodeh, S.,Hanusch, T., 2007. Combining photogrammetry and laser scanning for the recordingand modelling of the Late Intermediate Period site of Pinchango Alto, Palpa, Peru.J. Archaeol. Sci. 34, 1702–1712.
234 A. Hakonen et al. / Journal of Archaeological Science: Reports 2 (2015) 227–234
Lerma, J.L., Navarro, S., Cabrelles, M., Villaverde, V., 2010. Terrestrial laser scanning andclose range photogrammetry for 3D archaeological documentation: the UpperPalaeolithic Cave of Parpalló as a case study. J. Archaeol. Sci. 37, 499–507.
Linderholm, J., 2012. Soil chemical and -magnetic analysis of samples from Iron Age Cem-etery at Tahkokangas, (excavation ID OTK-11), Oulu, Finland. Institutionen för idé ochsamhällstudier, Miljöarkeologiska laboratoriet. Rapport nr. 2012-005. UmeåUniversitet, Umeå.
Losier, L.-M., Pouliot, J., Fortin, M., 2007. 3D geometrical modeling of excavation units atthe archaeological site of Tell 'Acharneh (Syria). J. Archaeol. Sci. 34, 272–288.
Mäkivuoti, M., 1996. Oulun Kaakkurin Välikankaan rautakautinen kalmisto. (Licenciatethesis). History, University of Oulu.
Montani, I., Sapin, E., Sylvestre, R., Marquis, R., 2012. Analysis of Roman pottery graffiti byhigh resolution capture and 3D laser profilometry. J. Archaeol. Sci. 39, 3349–3353.
Moser, M., Hye, S., Goldenberg, G., Hanke, K., Kovács, K., 2010. Digital documentation andvisualization of archaeological excavations and finds using 3D scanning technology.Virtual Archaeol. Rev. 1 (2), 143–147.
Núñez, M.A., Buill, F., Edo, M., 2013. 3Dmodel of the Can Sadurní cave. J. Archaeol. Sci. 40,4420–4428.
Okkonen, J., 2010. Excavation of an Early Metal Age burial cairn in Ii, NorthernOstrobothnia. Faravid – Acta Societatis Historiae Finlandiae Septentrionalis XXXIV,pp. 17–28.
Okkonen, J., Äikäs, T., 2006. Oulun seudun varhaismetallikautiset keittokuopat –
käyttötarkoitus ja konteksti. Faravid – Acta Societatis Historiae FinlandiaeSeptentrionalis XXX, pp. 17–32.
Puchol, O.G., McClure, S.B., Senabre, J.B., Villa, F.C., Porcelli, V., 2013. Increasing contextualinformation by merging existing archaeological data with state of the art laser scan-ning in the prehistoric funerary deposit of Pastora Cave, Eastern Spain. J. Archaeol. Sci.40, 1593–1601.
Rodríguez-Gonzálvez, P., Mancera-Taboada, J., González-Aguilera, D., Muñoz-Nieto, Á.,2012. A hubrid approach to create an archaeological visualization system for aPalaeolithic cave. Archaeometry 54 (3), 565–580.
Rüther, H., Chazan, M., Schroeder, R., Neeser, R., Held, C., Walker, S.J., Matmon, A., Horwitz,L.K., 2009. Laser scanning for conservation and research of African cultural heritagesites: the case study of Wonderwerk Cave, South Africa. J. Archaeol. Sci. 36,1847–1856.
Schreiber, S., Hinzen, K.-G., Fleischer, C., Schütte, S., 2012. Excavation-parallel laser scan-ning of a medieval cesspit in the archaeological zone Cologne, Germany. J. Comput.Cult. Herit. 5 (3), 12.
Szocs, K., Kibedy, Z., Barsi, A., 2006. Documentation of Roman excavations bylaserscanning. Proceedings of the ISPRS Commission V Symposium ‘Image Engineer-ing and Vision Metrology’ (http://www.isprs.org/proceedings/XXXVI/part5/).
Väänänen, J., 2006. Tahkokankaan värikkäät latomukset – Uuden tutkimusmenetelmänesittely ja ensimmäiset tutkimustulokset. In: Niinimäki, S., Salmi, A.-K., Kuusela, J.-M.,Okkonen, J. (Eds.), Stones, bones & thoughts. Festschrift in honour of Milton Núñez.Bookwell Oy, pp. 77–88.
Ylimaunu, J., Ylimaunu, T., Okkonen, J., 1999. Hylkeenpyynnin kehityksestä jamerkityksestä Itämerellä esihistoriallisella ajalla. Faravid – Acta Societatis HistoriaeFinlandiae Septentrionalis XXII–XXIII, pp. 131–158.