Drinking water mutagenicity and gastrointestinal and urinary tract cancers: an ecological study in...
6
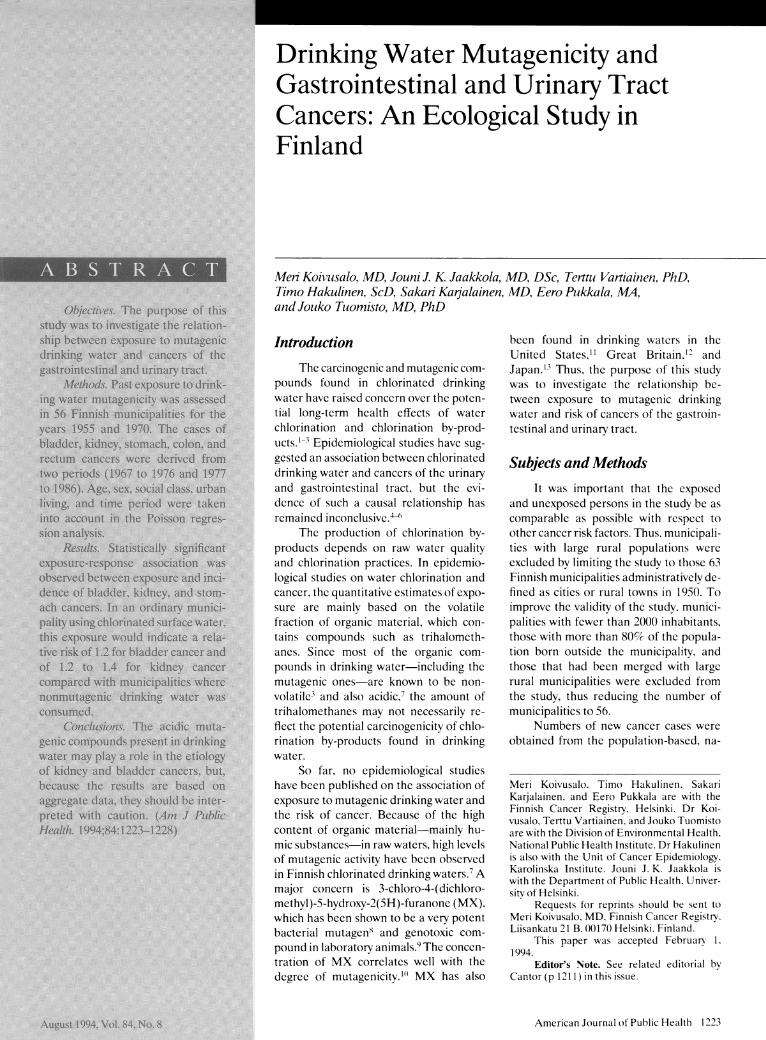
Drinking Water Mutagenicity and Gastrointestinal and Urinary Tract Cancers: An Ecological Study in Finland Men Koivusalo, MD, Jouni J. K. Jaakkola, MD, DSc, Terttu Varliainen, PhD, Timo Hakulinen, ScD, Sakari Karialainen, MD, Eero Pukkala, MA, and Jouko Tuomisto, MD, PhD Introduction The carcinogenic and mutagenic com- pounds found in chlorinated drinking water have raised conccrn over the poten- tial long-term health effects of water chlorination and chlorination by-prod- ucts.'-3 Epidemiological studies have sug- gested an association between chlorinated drinking water and cancers of the urinary and gastrointestinal tract, but the evi- dence of such a causal relationship has remained inconclusive.4' The production of chlorination by- products depends on raw water quality and chlorination practices. In epidemio- logical studies on water chlorination and cancer, the quantitative estimates of expo- sure are mainly based on the volatile fraction of organic material, which con- tains compounds such as trihalometh- anes. Since most of the organic com- pounds in drinking water-including the mutagenic ones-are known to be non- volatile3 and also acidic.7 the amount of trihalomethanes may not necessarily re- flect the potential carcinogenicity of chlo- rination by-products found in drinking water. So far, no epidemiological studies have been published on the association of exposure to mutagenic drinking water and the risk of cancer. Because of the high content of organic material-mainly hu- mic substances-in raw waters, high levels of mutagenic activity have been observed in Finnish chlorinated drinking waters.7 A major concern is 3-chloro-4-(dichloro- methyl)-5-hydroxy-2(5H)-furanone (MX), which has been shown to be a very potent bacterial mutagen' and genotoxic com- pound in laboratory animals.9 The concen- tration of MX correlates well with the degree of mutagenicity."' MX has also been found in drinking waters in the United States,"' Great Britain,'2 and Japan."' Thus, the purpose of this study was to investigate the relationship be- tween exposure to mutagenic drinking water and risk of cancers of the gastroin- testinal and urinary tract. Subjects and Methods It was important that the exposed and unexposed persons in the study be as comparable as possible with respect to other cancer risk factors. Thus, municipali- ties with large rural populations were excluded by limiting the study to those 63 Finnish municipalities administratively de- fined as cities or rural towns in 1950. To improve the validity of the study, munici- palities with fcwer than 2000 inhabitants. those with more than 80% of the popula- tion born outside the municipality, and those that had been merged with large rural municipalities were excluded from the study, thus reducing the number of municipalities to 56. Numbers of new cancer cases were obtained from the population-based, na- Mern Koivusalo. Timo Hakulinen. Sakari Karjalainen. and Eero Pukkala are with the Finnish Cancer Registry. Helsinki. Dr Koi- vusalo. Terttu Vartiainen, and Jouko Tuomisto are with the Division of Environmental Health. National Public Health Institute. Dr Hakulinen is also with the Unit of Cancer Epidemiology. Karolinska Institute. Jouni J. K. Jaakkola is with the Department of Public Health. Univer- sitv of Helsinki. Requests for reprints should be sent to Meri Koivusalo. MD. Finnish Cancer Registryv Liisankatu 21 B 0)0170 Helsinki. Finland. This paper was accepted February 1. 1994. Editor's Note. See related editorial by Cantor (p 1211 ) in this issue. American Journal of Public Health 1223 ........... .......... ... I .: ... .... .j.. .. j. -...... .; -. ..... ... . ... .. .. .... . ... ... . .. .. .. ... ... .. !: .: :: .. .:: : :.,.:.:<: ..... : : : : :.: .:: .: . :: -:: !: .: .: ..... .: ::: i
Transcript of Drinking water mutagenicity and gastrointestinal and urinary tract cancers: an ecological study in...
Drinking Water Mutagenicity andGastrointestinal and Urinary TractCancers: An Ecological Study inFinland
Men Koivusalo, MD, Jouni J. K. Jaakkola, MD, DSc, Terttu Varliainen, PhD,Timo Hakulinen, ScD, Sakari Karialainen, MD, Eero Pukkala, MA,and Jouko Tuomisto, MD, PhD
IntroductionThe carcinogenic and mutagenic com-
pounds found in chlorinated drinkingwater have raised conccrn over the poten-tial long-term health effects of waterchlorination and chlorination by-prod-ucts.'-3 Epidemiological studies have sug-gested an association between chlorinateddrinking water and cancers of the urinaryand gastrointestinal tract, but the evi-dence of such a causal relationship hasremained inconclusive.4'
The production of chlorination by-products depends on raw water qualityand chlorination practices. In epidemio-logical studies on water chlorination andcancer, the quantitative estimates of expo-sure are mainly based on the volatilefraction of organic material, which con-tains compounds such as trihalometh-anes. Since most of the organic com-pounds in drinking water-including themutagenic ones-are known to be non-volatile3 and also acidic.7 the amount oftrihalomethanes may not necessarily re-flect the potential carcinogenicity of chlo-rination by-products found in drinkingwater.
So far, no epidemiological studieshave been published on the association ofexposure to mutagenic drinking water andthe risk of cancer. Because of the highcontent of organic material-mainly hu-mic substances-in raw waters, high levelsof mutagenic activity have been observedin Finnish chlorinated drinking waters.7 Amajor concern is 3-chloro-4-(dichloro-methyl)-5-hydroxy-2(5H)-furanone (MX),which has been shown to be a very potentbacterial mutagen' and genotoxic com-pound in laboratory animals.9 The concen-tration of MX correlates well with thedegree of mutagenicity."' MX has also
been found in drinking waters in theUnited States,"' Great Britain,'2 andJapan."' Thus, the purpose of this studywas to investigate the relationship be-tween exposure to mutagenic drinkingwater and risk of cancers of the gastroin-testinal and urinary tract.
Subjects and MethodsIt was important that the exposed
and unexposed persons in the study be ascomparable as possible with respect toother cancer risk factors. Thus, municipali-ties with large rural populations wereexcluded by limiting the study to those 63Finnish municipalities administratively de-fined as cities or rural towns in 1950. Toimprove the validity of the study, munici-palities with fcwer than 2000 inhabitants.those with more than 80% of the popula-tion born outside the municipality, andthose that had been merged with largerural municipalities were excluded fromthe study, thus reducing the number ofmunicipalities to 56.
Numbers of new cancer cases wereobtained from the population-based, na-
Mern Koivusalo. Timo Hakulinen. SakariKarjalainen. and Eero Pukkala are with theFinnish Cancer Registry. Helsinki. Dr Koi-vusalo. Terttu Vartiainen, and Jouko Tuomistoare with the Division of Environmental Health.National Public Health Institute. Dr Hakulinenis also with the Unit of Cancer Epidemiology.Karolinska Institute. Jouni J. K. Jaakkola iswith the Department of Public Health. Univer-sitv of Helsinki.
Requests for reprints should be sent toMeri Koivusalo. MD. Finnish Cancer RegistryvLiisankatu 21 B 0)0170 Helsinki. Finland.
This paper was accepted February 1.1994.
Editor's Note. See related editorial byCantor (p 1211 ) in this issue.
American Journal of Public Health 1223
...........
..........
... I .: ... .... .j.. .. j. -.......; -. ..... ... . ... .. .. .... . ...... . .. .. .. ... ... ..!: .: :: .. .:: : :.,.:.:<: ..... : : : : :.:.:: .: . :: -:: !: .: .: ..... .: ::: i

Kodvusalo et aL
tionwide Finnish Cancer Registry. Themultiple sources of information availableguarantee an almost 100% coverage of allcancer cases in Finland.'4 The studyfocused on cancers of the stomach, colon,rectum, kidney, and bladder (IntemationalClassification ofDiseases, 7th edition codes151, 153, 154, 180, and 181, respectively).The observed number of cancer cases was
obtained for each municipality by sex, age
(5-year categories), and time period (1967to 1976, 1977 to 1986). The expectednumber of cancer cases (5-year catego-ries) was calculated for each stratum ofsex, age, and period using the respectiveincidence rates for the total population ofFinland. For the analysis, age was furtherpooled into four broad categories: 0 to 49,50 to 64, 65 to 74, and from 75 yearsonward. In addition, age-adjusted inci-
dence rates for all municipalities com-
bined were calculated for both time
periods (Table 1).
Assessment ofPast Exposure toMutagenic Drinking Water
The past exposure to drinking watermutagenicity was assessed with a methoddeveloped by Vartiainen et al.16 for two
time periods, using the index years 1955and 1970 to adjust for time and exposure
factors such as latency. Information on
past routinely collected water qualityparameters (e.g., permanganate consump-tion, pH, color, and ammonium and ironcontent), water treatment practices, andchemicals used (e.g., chlorine dose, pre-
or postchlorination or both) in the munici-pal waterworks was collected from a
questionnaire sent to the municipalitiesand from past surveys and archives of
administrative authorities. The past drink-ing water mutagenicity was then assessedfor both years on the basis of an equa-tionl6 giving the estimated drinking watermutagenicity level in net revertants perliter (net rev/L). The drinking water
mutagenicities for the equation were
measured according to standard proce-
dures17 in the Ames test using Salmonellatyphinurwum bacterial tester strains TA100and TA98 without enzymatic activation.
Water from different waterworksoften gets mixed when used by consumers.In those municipalities with more thanone waterworks, a mean was calculatedweighted for the volumes of water sup-
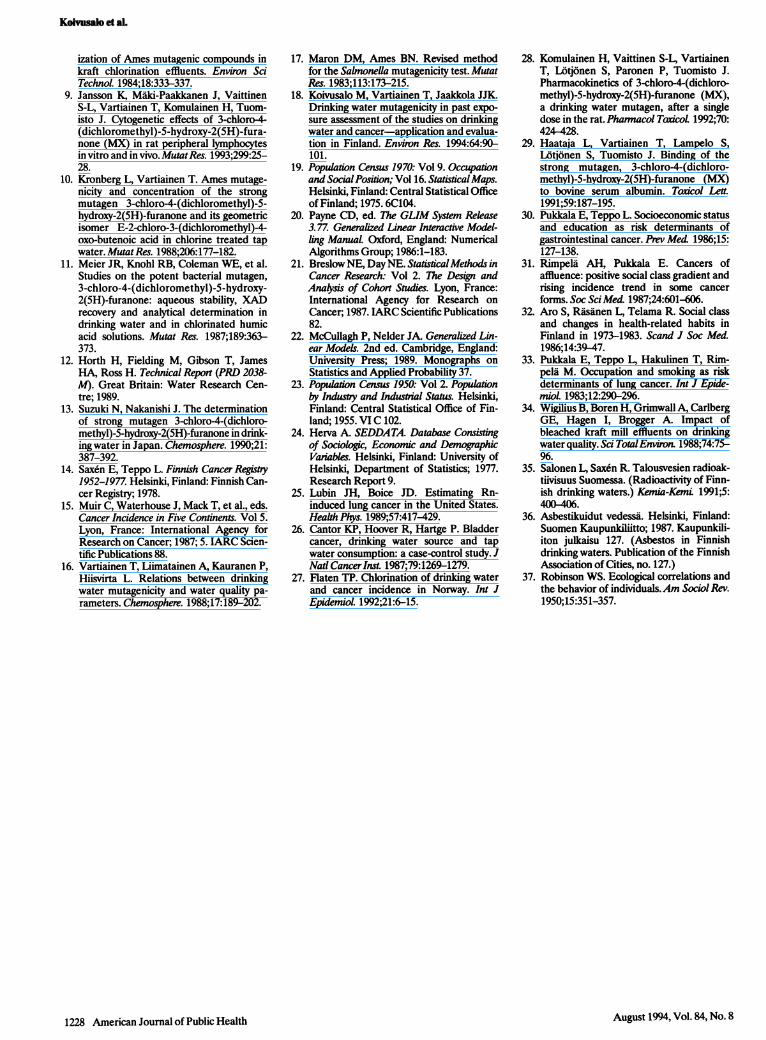
plied by the different waterworks. Theexposure to drinking water mutagenicitywas estimated to be zero for people livingoutside the public water supply system(private wells) as no mutagenicity hasbeen observed in groundwaters.16 Forboth years, 1955 and 1970, the populationexposure (wm) was calculated by multiply-ing the proportion of the populationwithin the municipal water supply system(w) by the estimated level of drinkingwater mutagenicity (m) (Table 2, Figure1). For the statistical analysis, the level ofmutagenicity was also categorized (nomutagenicity, less than 3000 net rev/L,and 3000+ net rev/L), and the average ofmutagenicities in 1955 and 1970 was used.A more detailed evaluation and descrip-tion of the past exposure assessment interms of drinking water mutagenicity hasbeen published elsewhere.18
StatisticalAnalysisThe observed numbers of cancer
cases in each municipality were comparedwith the expected numbers of cancer
cases based on the cancer incidence in theentire country in strata defined by sex,broad age group, and calendar period.The risk ratio (RR) between the observedand the corresponding expected numberof cancer cases was modeled according to
an additive relationship:
RR = a + y wm + E0i si.
The baseline risk a was allowed to differ
in strata defined by sex, age, calendar
August 1994, Vol. 84, No. 81224 American Journal of Public Health
TABLE 1-Number of Observed Cancer Cases and Age-Adjusted15 (World Standard Population) Cancer Incidence per I MillionPerson-Years in the 56 Municipalites, by Sex and Time Period
No. of Observed Cancer Cases Cancer Incidence
Men Women Men Women
1967-76 1977-86 1967-76 1977-86 1967-76 1977-86 1967-76 1977-86
Bladder 1147 1800 467 730 121 145 27 31Kidney 883 1312 783 1167 91 110 49 56Stomach 3110 2858 2877 2881 327 233 164 125Colon 1058 1708 1760 2707 112 139 104 120Rectum 939 1412 1251 1651 100 114 72 74
TABLE 2-Population Included in the Study, Percentage of Population within theWater Supply System, Average Drinking Water Mutagenicity,OPopulation Exposure,b and Range in Mutagenicitya in 1955,1970, and 1985
1955 1970 1985
Population, in millions 1.7 2.2 2.3
Population within water supply system, % 43 80 92
Average mutagenicityAll municipalities 1300 1900 1300All municipalitiesc 2200 2900 1200
Popuilation exposureAll municipalities 600 1500 1200All municipalitiesc 1600 2600 1100
Range in mutagenicity 0-5700 0-6900 0-5400
aNet revertants per liter (net rev/L).bPercentage of population within the water supply system muitiplied by the mutagenicity level.cWeighted by person-years from 1967 to 1986.

Drining Water and Cancer
period, and urban living. The parameter ythus gives the change in risk ratio relatedto a unit of change in population exposureto mutagenicity (wm). In the control ofconfounding, the relative sizes of socialclasses in each municipality were used todescribe life-style and smoking habits.The relative size of the two highest socialclasses out of four and the proportion ofthe lowest class in each municipality werederived from the 1970 census19 and wereused in the analysis as numerical variables(si, i = 1,2), with parameters Oi specifyingthe relationship with social classes. Thethree largest cities in Finland, with theircomparably more urban environmentsand life-styles, were grouped into a sepa-rate category in the analysis, and acategorical variable was created to adjustfor a different base level of risk in thesecities.
The statistical analysis was per-formed using GLIM20 with an identity linkfunction and a statistical model based onPoisson regression.2' The effect of drink-ing water mutagenicity was studied asboth a categorical and a numerical vari-able, and logarithmic transformations werealso fitted. In the final analysis, the choiceof the model with respect to mutagenicitywas based on its ability to explain thevariation in the data with fewest modelparameters. This resulted in a linearmodel with a numerical variable forexposure to mutagenicity in the finalanalysis. Overdispersion was estimated tobe of the order of 10%.22 Adjusting forthis would not have changed the confi-dence intervals (CIs) of the model param-eters to any substantial extent. For pur-poses of illustration, the transformedcoefficient, 1 + y3000 net rev/L, was usedto derive a risk ratio related to a typicalmutagenicity exposure of 3000 net rev/L(Table 2). In further study of confound-ing, separate analyses were performedwithout the three largest cities, withouteight municipalities that had 2% or moreof the population working in the chemicalindustry,23 and without six municipalitiesthat had the highest levels of migration(an average annual in-migration of morethan 8% from 1966 to 1970).24 To focusthe analysis on the exposure-responseassociation and the quantity of the biologi-cally active compounds in drinking water,the statistical analysis was also performedseparately for those 34 municipalities inwhich the population was exposed tomutagenic drinking water. The propor-tions of cancer cases attributable toexposure were calculated25 using thelinear model and the average population
exposure level of 1600 net rev/L in 1955(Table 2).
ResultsConsidering the population mutage-
nicity exposure as the only risk factor inthe model, the risk ratios of cancers of thebladder, kidney, and colon were signifi-cantly higher than 1 (Table 3). In an
average municipality with chlorinated sur-
face water, the exposure to drinking watermutagenicity for those within the munici-pal water supply system was 2700 netrev/L in 1955 and 3300 net rev/L in 1970.Thus, in colon cancer, a risk ratio of 1.31corresponded to an exposure of 3000 netrev/L, indicating a 10% unit increase foreach addition of 1000 net rev/L, accord-ing to the linear exposure-response rela-tionship used. After adjusting for thebackground variables (age, sex, time pe-riod, largest cities) and social class, therisk ratios diminished in kidney and coloncancers.
The risk of bladder cancer was
1.17-fold (95% CI = 1.03, 1.31) amongexposed as compared with unexposedpersons when adjusted for the potentialconfounders. The risk remained approxi-mately the same when the analysis was
restricted to the 34 municipalities withmutagenic drinking water. The adjustedrisk ratio for kidney cancer was 1.08 (95%CI = 0.91, 1.24) in the total study popula-tion and 1.32 (95% CI = 1.11, 1.53) in therestricted analysis. The risk of stomachcancer was also slightly higher among theexposed, with an adjusted risk ratio ofabout 1.1. The adjusted risk of colon andrectum cancer among exposed persons
did not differ from the corresponding riskfor unexposed persons by more thancould be expected by chance.
The exposure was assessed for 1955,and the cancer risk was calculated for1967 to 1986 (Table 3). Taking intoaccount cases diagnosed between 1977and 1986 only, the adjusted risk ratioswere approximately the same, with theexception of slightly higher risks in kidneycancer (RR = 1.16; 95% CI = 0.97, 1.36)(Table 4). Applying the average exposurefrom 1955 and 1970 and cases diagnosedbetween 1977 and 1986, the adjusted riskratios for bladder cancer were lower thanthose given in Table 3 (RR = 1.05; 95%CI = 0.92, 1.19 for all municipalities). Incontrast to bladder cancer, slightly higherrisks were observed in stomach cancer
(RR = 1.09; 95% CI = 1.02, 1.17 for allmunicipalities). The restricted analysis of
American Journal of Public Health 1225
Mutagenicity (net rev/I) 19556000 0 1970
5000-
4000-
3000.
2000-
1000.
Municipalities
Note. Exposures were estimated by multiplying the proportion of the population within the municipalwater supply system by the mutagenicity level.
FIGURE 1-Estimated exposures to drinking water mutagenicity in the56 municipalities In 1955 and 1970, arranged by the estimatedexposures In 1955.
August 1994, Vol. 84, No. 8

Koivusalo et aL
municipalities with mutagenic drinkingwater resulted in slightly higher risk ratiosfor bladder, kidney, and stomach cancers.
For other cancers, the change of time andexposure periods led to no major differ-ences from the risk ratios reported above.
The analyses performed after exclu-sion of the three largest cities and themunicipalities with the highest migrationlevels did not change the observed riskestimates. In kidney cancer, slightly higherrisk ratios were observed after exclusionof the municipalities with chemical indus-try (Table 4). Interaction between expo-sure and gender was statistically signifi-cant (P < .05) only in kidney and coloncancers. For colon cancer, the adjustedrisk ratios corresponding to those in Table3 were 1.14 (95% CI = 0.92, 1.36) for menand 1.01 (95% CI = 0.87,1.16) forwomen.The interaction between age and expo-sure was statistically significant (P < .05)in kidney cancer, with the greatest riskratio observed among the oldest agegroup (Table 4).
The exposure-response associationmay be converted into the proportion ofcancer cases from 1967 to 1986 attribut-able to drinking water mutagenicity. When
the adjusted relative risks from the re-
stricted analysis of municipalities withmutagenic drinking water in Table 3 are
used, the calculated attributable propor-
tions would be 10% in bladder, 15% inkidney, and 5% in stomach cancer. Therespective numbers of new cancer cases
between 1967 and 1986 may be derived byapplying these proportions to the num-
bers of cases reported in Table 1.
DiscussionThe results indicate that, in a typial
municipality using chlorinated surfacewater (3000 net rev/L), the relative riskswould be about 1.2 for bladder cancer, 1.2to 1.4 for kidney cancer, and 1.1 to 1.2 forstomach cancer as compared with thosepersons not using mutagenic drinkingwater. When the exposed population islarge, the detection and estimation ofeven small risks is important from thepublic health point of view. In the presentstudy, the existence of a method forassessing the past exposure to drinkingwater mutagenicity, an accurate system ofcancer registration, and a large variationin drinking water mutagenicities made it
possible to demonstrate small, yet statisti-cally significant excess cancer risks associ-ated with the assessed past exposure to
mutagenic drinking water.The observation of an increased risk
of bladder cancer is consistent with resultsof earlier case-control studies on drinkingwater chlorination and cancer.s26 Anassociation between the exposure to chlo-rinated water and the occurrence ofgastrointestinal cancers has also beenreported in epidemiological studies.±627Such an association was not observed inrectum and colon cancers in our study. Inkidney and colon cancers, the observeddifference in risk estimates by sex could beexplained by higher consumption ofwaterby men. Confounding by gender-relatedlife-styles and occupations or interactionwith other gender-related exposures andbiological factors may also be involved.The observation of substantially higherrelative risks for kidney cancer in theoldest age group is in line with a longerlatency time. The observed increased risksof kidney and bladder cancers are in linewith the pharmacokinetics of the strongwater mutagen MX.2- The protein-boundMX29 may be released in the kidney andtherefore may induce higher concentra-tions there than in most other tissues.28Although, according to current knowl-edge, MX is the compound of majorconcern, chlorinated compounds otherthan MX may also have a carcinogeniceffect.
Socioeconomic status has been shownto be associated with the incidence ofseveral cancers in Finland, includingcancers of the colon, rectum, and kid-ney.30'31 In the present study, social classwas determined by occupation. In earlierstudies, it has been shown to be associatedwith diet and way of life.32 Occupation hasbeen shown to be associated with smok-ing, explaining a large part of the variationin lung cancer incidence.33 Therefore,social class may be regarded as a suitablesurrogate variable for life-style, diet, andsmoking on the population level. Afterthe municipalities with the highest propor-tions of the population working in thechemical industry were excluded, the riskestimates were higher in bladder andkidney cancers. This finding may be owingto the confounding effect of chemicalexposures in these municipalities. Thepopulation density is greater and thelife-style different in the three largestcities. After social class variables were
included in the model, the risk estimateswere similar in the analyses with or
without the three largest cities, which
1226 American Journal of Public Health
TABLE 3-Estimated Risk Ratio for a Typical Exposure to Chlorinated SurfaceWater (3000 net rev/L)
Alla Mutagenic Watera
95% 95%Risk Confidence Risk Confidence
Site and Modelb Ratio Interval Ratio Interval
Bladder cancerMutagenicity 1.18 1.10,1.27 1.21 1.10,1.32Plus age, sex, period, main cities 1.20 1.08, 1.33 1.24 1.09, 1.38Plus social class 1.17 1.03,1.31 1.21 1.02,1.40
Kidney cancerMutagenicity 1.37 1.27,1.47 1.57 1.44,1.69Plus age, sex, period, main cities 1.23 1.10,1.37 1.44 1.29,1.60Plus social class 1.08 0.91, 1.24 1.32 1.11, 1.53
Stomach cancerMutagenicity 0.97 0.93,1.01 0.99 0.93,1.04Plus age, sex, period, main cities 1.03 0.97, 1.09 1.06 0.99,1.14Plus social class 1.07 1.00,1.13 1.11 1.02,1.19
Colon cancerMutagenicity 1.31 1.23, 1.39 1.39 1.30, 1.48Plus age, sex, period, main cities 1.18 1.07, 1.27 1.25 1.13, 1.38Plus social class 1.05 0.93,1.17 1.09 0.93,1.25
Rectal cancerMutagenicity 1.05 0.97,1.12 1.02 0.93,1.12Plus age, sex, period, main cities 1.02 0.92,1.12 0.94 0.87,1.12Plus social class 1.05 0.93,1.17 0.98 0.82,1.14
aThe risk ratios for cancer cases in 1967-1986 are calculated corresponding to exposure to drinkingwater mutagenicity in 1955 for all municipalities (n = 56) and municipalities with mutagenicdrinking water (n = 34).
bWithin each type of cancer, the variables listed are those added to the previous model.
August 1994, Vol. 84, No. 8

Drinking Water and Cancer
TABLE 4-Risk Ratios for a Typical 3000 net rev/L Exposure In 1955 for Kidney Cancer When Background Factors and SocialClass Are Included In the Model, Shown by Time Period and Chosen Restrictions
Cancer Cases in 1967-1986 Cancer Cases in 1977-1986
All Mutagenic Water All Mutagenic Water
Restrictions RR 95% Cl RR 95% Cl RR 95% Cl RR 95% Cl
No exclusions 1.08 0.91,1.24 1.32 1.11,1.53 1.16 0.97,1.36 1.44 1.18,1.69Nochemical industry 1.17 1.01,1.34 1.37 1.15,1.59 1.26 1.06,1.47 1.50 1.24,1.76Women 0.91 0.69,1.13 1.21 0.93,1.50 0.95 0.68,1.22 1.28 0.94,1.62Men 1.26 1.02,1.49 1.45 1.14,1.75 1.39 1.10,1.67 1.60 1.24,1.97Age group 75+ 1.61 0.92, 2.30 2.46 1.62, 3.30 1.79 0.98, 2.61 2.52 1.50, 3.53
Note. RR = risk ratio, Cl = confidence interval.
indicates that the confounding effect ofurban living was taken into account. Asthe inclusion of social class in the multipleregression model may not fully adjust forlife-style factors, the residual confoundingfrom life-style factors such as smokingmay not be totally excluded.
In a previous study of 86 drinkingwater samples, the correlation coefficientbetween the measured mutagenicity inTA100 Ames S. typhimunum tester strainand the modeled mutagenicity was 0.85.16Assessment of past exposure is based onhistorical observed raw water qualityparameters and water treatment practicesand therefore on the real historical situa-tion, even though the actual historicalmutagenicity may only be approximated.The methods for determining permanga-nate values of water samples have re-mained unchanged since the 1930s. Insurface waterworks, the water quality datahave been analyzed monthly; in groundwaterworks they are analyzed usuallyonce every four seasons. The approxima-tion of historical mutagenicity was basedon annual averages, derived from monthlymeasurements in surface waterworks.These values therefore represent poten-tial seasonal variations.
The current understanding is thatthe mutagenic compounds in drinkingwaters are predominantly produced dur-ing water chlorination.34 In an earliersurvey, only one raw water source wasshown to be mutagenic in the 1980s, andeven in this case the mutagenicity ofdrinking water grew several times higherduring water treatment.16 Other expo-sures mediated by the water supplynetwork, such as radioactive substances orasbestos from raw water or waterpipes,are unlikely,35'36 and there is no evidencethat these are related to drinking watermutagenicity. Until recently, consumption
August 1994, Vol. 84, No. 8
of bottled water and soft drinks has beenvery low in Finland, at least when com-pared with that in western and southernEurope and the United States.
The good coverage and quality of theFinnish Cancer Registry ensure the valid-ity of the outcome assessment. Finlandhas a rather homogeneous population.During the 1960s, the direction of migra-tion was from rural areas to towns, andtherefore from areas of no or low expo-sure to high-exposure regions. In the1970s and 1980s, migration between townswas also substantial. Confounding bymigration would most probably diminishthe estimated risks ratios.
Ecological studies are known toinvolve problems such as the ecologicalfallacy.37 In the present study, the propor-tion of exposed persons was taken intoaccount in each municipality, thus reduc-ing the degree of ecological fallacy but noteliminating it, as the analysis was based onaggregate data. The fact that the expectedrates were related to the whole countryrather than to the chosen municipalitieswas taken into account by including in themodel baseline risk parameters specificfor sex, age, time period, and urban living.The Poisson distribution assumption ofthe number of observed cases enabled usto take into account the different sizes ofthe municipalities, and to study theproportion of persons exposed and themutagenicity level of those exposed simul-taneously in the analyses. The observedexposure-response association in the re-stricted analysis of municipalities withexposure to mutagenic drinking waterindicated that the observed risk is moreclosely associated with the level of mutage-nicity than with drinking water chlorina-tion or mutagenicity as such.
Our findings suggest that the acidicmutagenic compounds present in chlori-
nated drinking water may play a role inthe etiology of kidney, bladder, andpossibly stomach cancer. Nevertheless, asthe study was based on aggregate data,our results should be interpreted withcaution. L
AcknowledgmentsThis study received financial support from theAcademy of Finland, the Yrjo Jahnsson Foun-dation, the Emil Aaltonen Foundation, and theFinnish Cancer Institute.
References1. Bellar TA, Lichtenberg JJ, Kroner RC.
The occurrence of organohalides in chlori-nated drinking waters. JAm Water WorksAssoc. 1974;66:703-706.
2. Rook JJ. Formation of haloforms duringchlorination of natural waters. Water Treat-ment Exam. 1974;23:234-243.
3. Cheh AM, Skochdopole J, Koski P, Cole L.Nonvolatile mutagens in drinking water:production by chlorination and destructionby sulfite. Science. 1980;207:90-92.
4. Morris RD, Audet A-M, Angelillo IF,Chalmers TC, Mosteller F. Chlorination,chlorination-byproducts and cancer: a meta-analysis. Am J Public Health. 1992;82:955-963.
5. Chlorinated drinking water; chlorinationby-products; some other halogenated com-pounds; cobalt and cobalt compounds.Lyon, France: International Agency forResearch on Cancer; 1991. IARC Mono-graphs on the Evaluation of CarcinogenicRisks to Humans 52.
6. Murphy A, Craun G. A review of recentepidemiologic studies reporting associa-tions between drinking water disinfectionand cancer. In: Jolley R, Condie L,Johnson JD, et al., eds. Water Chlorination:Chemistry, Environmental Impactand HealthEffects. Chelsea, Mich: Lewis Publishers,Inc; 1990;6:361-372.
7. Vartiainen T, Liimatainen A. High levelsof mutagenic activity in chlorinated drink-ing water in Finland. Mutat Res. 1986;169:29-34.
8. Holmbom B, Voss R, Mortimer RD, WongA. Fractionation, isolation and character-
American Journal of Public Health 1227
Koivusalo et aL
ization of Ames mutagenic compounds inkraft chlorination effluents. Environ SciTechnol. 1984;18:333-337.
9. Jansson K, Maki-Paakkanen J, VaittinenS-L, Vartiainen T, Komulainen H, Tuom-isto J. Cytogenetic effects of 3-chloro-4(dichloromethyl)-5-hydroxy-2(5H)-fura-none (MX) in rat peripheral lymphocytesin vitro and in vivo. MutatRes. 1993;299:25-28.
10. Kronberg L, Vartiainen T. Ames mutage-nicity and concentration of the strongmutagen 3-chloro-4-(dichloromethyl)-5-hydroxy-2(5H)-furanone and its geometricisomer E-2-chloro-3-(dichloromethyl)-4-oxo-butenoic acid in chlorine treated tapwater. MutatRes. 1988;206:177-182.
11. Meier JR, Knohl RB, Coleman WE, et al.Studies on the potent bacterial mutagen,3-chloro-4-(dichloromethyl)-5-hydroxy-2(5H)-furanone: aqueous stability, XADrecovery and analytical determination indrinking water and in chlorinated humicacid solutions. Mutat Res. 1987;189:363-373.
12. Horth H, Fielding M, Gibson T, JamesHA, Ross H. Technical Report (PRD 203&M). Great Britain: Water Research Cen-tre; 1989.
13. Suzuki N, Nakanishi J. The determinationof strong mutagen 3-chloro-4-(dichloro-methyl)-5-hydroxy-2(5H)-furanone in drink-ing water in Japan. Chemosphere. 1990;21:387-392.
14. Saxen E, Teppo L. Finnish Cancer Registry1952-1977. Helsinki, Finland: Finnish Can-cer Registry; 1978.
15. Muir C, Waterhouse J, Mack T, et al., eds.Cancer Incidence in Five Continents. Vol 5.Lyon, France: International Agency forResearch on Cancer; 1987; 5. IARC Scien-tific Publications 88.
16. Vartiainen T, Liimatainen A, Kauranen P,Hiisvirta L. Relations between drinkingwater mutagenicity and water quality pa-rameters. Chemosphere. 1988;17:189-202.
17. Maron DM, Ames BN. Revised methodfor the Salmonella mutagenicity test. MutatRes. 1983;113:173-215.
18. Koivusalo M, Vartiainen T, Jaakkola JJK.Drinking water mutagenicity in past expo-sure assessment of the studies on drinkingwater and cancer-application and evalua-tion in Finland. Environ Res. 1994:64:90-101.
19. Population Census 1970: Vol 9. Occupationand Social Position; Vol 16. Statistical Maps.Helsinki, Finland: Central Statistical Officeof Finland; 1975. 6C104.
20. Payne CD, ed. The GLIM System Release3. 77. Generalized Linear Interactive Model-ling Manual. Oxford, England: NumericalAlgorithms Group; 1986:1-183.
21. Breslow NE, Day NE. Statistical Methods inCancer Researrh: Vol 2. The Design andAnasis of Cohort Studies. Lyon, France:International Agency for Research onCancer; 1987. IARC Scientific Publications82.
22. McCullagh P, Nelder JA. Generalized Lin-ear Models. 2nd ed. Cambridge, England:University Press; 1989. Monographs onStatistics and Applied Probability 37.
23. Population Census 1950: Vol 2. Populationby Industy and Industuial Status. Helsinki,Finland: Central Statistical Office of Fin-land; 1955. VI C 102.
24. Herva A. SEDDATA. Database Consistingof Sociologic, Economic and DemoaphicVanables. Helsinki, Finland: University ofHelsinki, Department of Statistics; 1977.Research Report 9.
25. Lubin JH, Boice JD. Estimating Rn-induced lung cancer in the United States.Health Phys. 1989;57:417-429.
26. Cantor KP, Hoover R, Hartge P. Bladdercancer, drinking water source and tapwater consumption: a case-control study. JNatl Cancer Inst. 1987;79:1269-1279.
27. Flaten TP. Chlorination of drinking waterand cancer incidence in Norway. Int JEpideniol. 1992;21:6-15.
28. Komulainen H, Vaittinen S-L, VartiainenT, L6tjonen S, Paronen P, Tuomisto J.Pharmacokinetics of 3-chloro-4-(dichloro-methyl)-5-hydroxy-2(5H)-furanone (MX),a drinking water mutagen, after a singledose in the rat. Pharmacol ToaicoL 1992;70:424-428.
29. Haataja L, Vartiainen T, Lampelo S,Lotjonen S, Tuomisto J. Binding of thestrong mutagen, 3-chloro-4-(dichloro-methyl)-5-hydroxy-2(5H)-furanone (MX)to bovine serum albumin. Toaacol Leut.1991;59:187-195.
30. Pukkala E, Teppo L. Socioeconomic statusand education as risk determinants ofgastrointestinal cancer. Prev Med 1986;15:127-138.
31. Rimpela AH, Pukkala E. Cancers ofaffluence: positive social class gradient andrising incidence trend in some cancerforms. Soc SciMed. 1987;24:601-606.
32. Aro S, Rasanen L, Telama R. Social classand changes in health-related habits inFinland in 1973-1983. Scand J Soc Med.1986;14:39-47.
33. Pukkala E, Teppo L, Hakulinen T, Rim-pela M. Occupation and smoking as riskdeterminants of lung cancer. Int J Epide-mioL 1983;12:290-296.
34. Wigilius B, Boren H, Grimwall A, CarlbergGE, Hagen I, Brogger A. Impact ofbleached kraft mill effluents on drinkingwater quality. Sci TotalEnviron. 1988;74:75-96.
35. Salonen L, Sax6n R. Talousvesien radioak-tiivisuus Suomessa. (Radioactivity of Finn-ish drinking waters.) Kemia-Kemi 1991;5:400406.
36. Asbestikuidut vedessa. Helsinki, Finland:Suomen Kaupunkiliitto; 1987. Kaupunkili-iton julkaisu 127. (Asbestos in Finnishdrinking waters. Publication of the FinnishAssociation of Cities, no. 127.)
37. Robinson WS. Ecological correlations andthe behavior of individuals.Am Sociol Rev.1950;15:351-357.
1228 American Journal of Public Health August 1994, Vol. 84, No. 8