Annual Report - Cairn India
254
-
Upload
khangminh22 -
Category
Documents
-
view
1 -
download
0
Transcript of Annual Report - Cairn India


ABOUT VEDANTA LIMITED
OUR REPORTING SUITE
Vedanta Limited (Vedanta, VEDL), a subsidiary of Vedanta Resources Limited, is one of the world’s leading natural resources companies with significant operations in oil & gas, zinc, lead, silver, copper, iron Ore, steel, and aluminium & power, across India, South Africa, Namibia, and Australia.
Vedanta Resources Limited Sustainability Report (SR) 2018-19 Information coverage: Disclosures on triple bottom line performance
Standards/guidelines used: Global Reporting Initiative (GRI) Standards
SCOPE AND BOUNDARY This report covers the reporting period from 1 April 2019 to 31 March 2020 and provides 360o information on Vedanta Limited (Vedanta, VEDL), a subsidiary of Vedanta Resources limited.
It provides an overview of operations across our business units, namely, Zinc-Lead-Silver, Oil & Gas, Aluminium, Power, Iron Ore, Steel and Copper. Our assets are spread across India, South Africa and Namibia, and across the value chain comprising exploration, asset development, extraction, processing and value accretion activities.
This report aims to provide a concise explanation of VEDL’s performance, strategy, operating model, business outputs and outcomes using a multi-capital approach. It includes measures of engagement with identified material stakeholder groups and outlines the organisation’s governance framework, together with our risk-mitigation strategy.
APPROACH TO MATERIALITY This report contains information that we believe is of interest to our stakeholders and presents a discussion around matters that can impact our ability to create value over the short, medium and long terms.
APPROACH TO STAKEHOLDER ENGAGEMENT Our stakeholders are those individuals or
organisations who have an interest in, and/or whose actions impact our ability to execute our strategy. We periodically engage with different stakeholder groups and actively respond to their concerns and issues.
ANNUAL ACCOUNTS This report should be read in conjunction with the annual accounts (page 271 to 502) to gain a complete picture of VEDL’s financial performance.
The consolidated and standalone financial statements in our printed report have been prepared in accordance with the Indian Accounting Standards (Ind AS) notified under the Companies (Indian Accounting Standards) Rules, 2015 (as amended from time to time) and have been independently audited by by S.R.Batliboi & Co. LLP. The Independent Auditor’s Report for both consolidated and standalone financials can be found on page 271 and 376 respectively.
BOARD AND MANAGEMENT ASSURANCE The Board of Directors and the Company’s management acknowledge their responsibility to ensure the integrity of information covered in this report. They believe, to the best of their knowledge, that this report addresses all material issues and presents the integrated performance of VEDL and its impact in a fair and accurate manner. The report has therefore been authorised for release on 06 June 2020.
ABOUT THE REPORT
Inspired by our values, we remain committed to disclosing relevant information pertaining to our material issues, with highest standards of transparency and integrity. It is towards this end that we continue to communicate our annual performance and future strategy through Integrated Reporting <IR>. This is our third such report, prepared in accordance with the International Integrated Reporting <IR> Framework, outlined by the International Integrated Reporting Council (IIRC).
Our <IR> journey commenced in FY2018 and we were one of the very first natural resources companies in India to publish an integrated report. These reports are prepared to assist our stakeholders, primarily the providers of financial capital, to make an informed assessment of our ability to create value over the short, medium and long term. They strive to demonstrate our confidence, capacity to grow and our ability to deliver on set strategies that can drive significant financial and non-financial value for everyone.
Vedanta Limited Tax Transparency Report (TTR) 2018-19 Information coverage: Voluntary disclosure of profits made and taxes paid (only Indian Company to publish a TTR)
Standards/guidelines used: Indian Accounting Standards (Ind AS)
Vedanta Limited Integrated Report (IR) and Annual Accounts 2018-19 Information coverage: Holistic disclosure of performance and strategy
Standards/guidelines used: International Integrated Reporting <IR> Framework, Indian Accounting Standards (Ind AS), Indian Secretarial Standards

OUR EARTH, OUR GROWTH.THE SUSTAINABLE WAY.
At Vedanta, we unearth and harness the infinite potential of natural resources in the most sustainable manner to enable a better world for all.
Our brand promise is built on the premise that everything we enjoy on Earth comes from beneath it. It’s these resources that help us live, grow and sustain. We are in the business of exploring and transforming natural resources sustainably with a long-term growth focus. We follow sustainable & responsible exploration and mining practices, to fulfil India’s natural resource requirements and contribute to the nation’s resource sufficiency.
Our strategy is to focus on all-round operational excellence, allocate capital judiciously, maintain a resilient balance sheet, augment our Reserves and Resources (R&R) base, identify and deliver on growth opportunities. In doing so, we create lasting value, led by state-of-the-art technology, a zeal for innovation, an expert workforce and an unflinching commitment to sustainability.
TABLE OF CONTENTS
OVERVIEW Vedanta at a glance 6Group highlights 14Investment case 16Chairman’s statement 18CEO’s message 22
CASE STUDIES Vedanta Aluminium (Lanjigarh) 26Hindustan Zinc Limited 28Cairn Oil and Gas 30
INTEGRATED APPROACH Value-creation model 32Strategic framework 36Key performance indicators 40Business risks 44Board of directors 52Management committee 56Executive committee 58
SUSTAINABILITY AND ESGManaging our business sustainability 64Firm foundation for lasting value 66Our sustainability management approach 70Stakeholder engagement 72Materiality assessment 74Environmental stewardship 78Social focus 86Safety 94People and culture 98Business responsibility report mapping 104
AWARDS AND ACCOLADES 112
INTEGRATED REPORT06-115
Market review 116Management discussion and analysis 128
MANAGEMENT REVIEW116-167
Directors’ report 168Report on corporate governance 226
STATUTORY REPORTS168-270
Standalone financials 271Consolidated financials 376
FINANCIAL STATEMENTS 271-502
Women conducting maintenance work in the Rajpura Dariba Mine

INTEGRATED REPORT
06-115MANAGEMENT REVIEW
116-167STATUTORY REPORTS
168-270FINANCIAL STATEMENTS
271-502
6 VEDANTA LIMITED INTEGRATED REPORT AND ANNUAL ACCOUNTS 2019-20 VEDANTA LIMITED INTEGRATED REPORT AND ANNUAL ACCOUNTS 2019-20 7
Vedanta Limited is one of the world’s largest suppliers of natural resources, with primary operations in zinc-lead-silver, iron ore, steel, copper, aluminium, power, oil & gas. Our strategic capabilities and alliances are singularly focused on creating and preserving value for our esteemed clients and the wider stakeholder fraternity. Together, we help the world grow in a responsible manner.
Our portfolio of world-class, low-cost, scalable assets consistently generate strong profitability and deliver robust cash flows. Our core divisions have industry-leading market shares, and we continuously strive to raise the bar across our wide canvas of operations.
A WORLD-CLASS NATURAL RESOURCES POWERHOUSE
₹83,545 crore
₹6,122 crore
₹21,061 crore Largest
₹7,130 crore
3.26 million ~₹32,400 crore
Revenue
Net profit after tax before exceptional items
EBITDA Natural resources Company in India
Free cash flow (post-capex)
CSR programme beneficiaries
Total contribution to the national exchequer
9 million+ tCO2ein avoided emissions, over the last eight years, as a result of our Greenhouse Gas (GHG) reduction programme
~80,000People engaged
VEDANTA AT A GLANCE
TSPL Plant

INTEGRATED REPORT
06-115MANAGEMENT REVIEW
116-167STATUTORY REPORTS
168-270FINANCIAL STATEMENTS
271-502
8 VEDANTA LIMITED INTEGRATED REPORT AND ANNUAL ACCOUNTS 2019-20 VEDANTA LIMITED INTEGRATED REPORT AND ANNUAL ACCOUNTS 2019-20 9
WHAT WE DO
OUR VALUE CHAIN WELL-RESOURCED TO CREATE LONG-TERM VALUE
255.1 million tonnes
73.07 million tonnes
1,194 mmboe
73.07 million tonnes
Zinc ore reserves Iron ore reserves Oil & gas reserves & resources
Bauxite reserves
Our values nurture our culture and underpin our growth and success for the long term. Our ~80,000 strong workforce knows what is critical, how we work together as a team and the way in which growth and sustainable development are at the centre of what we do.
These are universal values, which guide us as we expand into unexplored markets and countries. Our people are our best brand ambassadors, who are
Refer to People & Culture Section on Page 98-103.
WHAT DRIVES US OUR PURPOSE
empowered to drive excellence and innovation and we demonstrate world-class standards of governance, safety, sustainability and social responsibility.
Our business was built with a simple mission envisioned by the Group’s Chairman, Anil Agarwal: To create a leading global natural resource Company. We also make significant contributions to society as we continue to create jobs, thus supporting our host communities through our various social programmes in the areas of childcare, health, education and women empowerment. As one of the largest contributors to the national exchequer, we create and distribute significant value along our entire supply chain.
WHAT UNDERPINS US OUR CORE VALUESTrust
Respect
EntrepreneurshipCare
Excellence
Integrity
Innovation
VEDANTA AT A GLANCE
EXPLORATIONWe have consistently added more to our Reserves and Resources (R&R) through brownfield and greenfield activities. This helps us to extend the lives of our existing mines and oilfields.
ASSET DEVELOPMENTWe have a strong track record of executing projects on time and within budget. We take special care to develop the resource base to optimise production and increase the life of the resource. We also strategically develop processing facilities.
EXTRACTIONOur operations are focused on exploring and producing metals, extracting oil & gas and generating power. We extract zinc-lead-silver, iron ore, steel, copper and aluminium. We have three operating blocks in India producing oil & gas.
PROCESSINGWe produce refined metals by processing and smelting extracted minerals at our zinc, lead, silver, copper, and aluminium smelters, and other processing facilities in India and Africa. For this purpose, we generate captive power as a best practice measure and sell any surplus power.
VALUE ADDITIONWe meet market requirements by converting the primary metals produced into value added products such as sheets, rods, bars, rolled products, etc. at our zinc, aluminium and copper businesses.

INTEGRATED REPORT
06-115MANAGEMENT REVIEW
116-167STATUTORY REPORTS
168-270FINANCIAL STATEMENTS
271-502
10 VEDANTA LIMITED INTEGRATED REPORT AND ANNUAL ACCOUNTS 2019-20 VEDANTA LIMITED INTEGRATED REPORT AND ANNUAL ACCOUNTS 2019-20 11
A SIGNIFICANT CONTRIBUTOR TO INDIA’S LARGE ECONOMYVedanta’s GDP Contribution
WELL-STRUCTURED TO DELIVER VALUE-ACCRETIVE GROWTH
Note: Shareholding as on 31 December 2019 *50% of the share in the RJ Block is held by a subsidiary of Vedanta
Listed entities Unlisted entities
79.4%
64.9% 51% 100% 100% 96%
50.1%
Division of Vedanta Limited
Subsidiaries of Vedanta Ltd
� Sesa Iron Ore
� Sterlite Copper
� Power (600 MW Jharsuguda)
� Aluminium (Odisha Aluminium and Power assets)
� Cairn Oil and Gas*
Vedanta Resources Ltd.
Konkola Copper Mines (KCM)
Bharat Aluminium
(BALCO)
Talwadi Sabo Power (TSPL)
(1,980 MW)
Zinc International (Skorpion: 100%
and Black Mountain Mine: 74%)
ElectrosteelsSteel Limited
(ESL)
Zinc India (HZL)
Vedanta Ltd.
Mangala Processing Terminal, Barmer
2.2% INDUCED IMPACT
O.40% DIRECT IMPACT
1% INDIRECT IMPACT
Vedanta influences consumption patterns of employees and suppliers by generating jobs and creating induced impact on India’s economy, equivalent to 2.20% of the country’s GDP
Vedanta directly contributes 0.40% to India’s GDP through it’s operations
The indirect impact of Vedanta through it’s supplier network is as large as 1% of India’s GDP
VEDANTA AT A GLANCE

INTEGRATED REPORT
06-115MANAGEMENT REVIEW
116-167STATUTORY REPORTS
168-270FINANCIAL STATEMENTS
271-502
12 VEDANTA LIMITED INTEGRATED REPORT AND ANNUAL ACCOUNTS 2019-20 VEDANTA LIMITED INTEGRATED REPORT AND ANNUAL ACCOUNTS 2019-20 13
Delivering value across businessesWe operate across seven key verticals and assume market-leading positions with our scale, innovation and commitment to responsible value creation.
coPPer
One of India’s largest copper producers
BusINEss Copper India
ProDucTIoN VoLuME
77 kt
EBITDA (In ₹ crore)
Tuticorin smelter and refinery currently not operational
AssET HIgHLIgHTs � One of the largest copper producers in India Note: The copper plant at Tuticorin has not been operational since March 2018.
APPLIcATIoN ArEAs � Used for making cables, transformers, castings, motors and castings and alloy-based products
Zinc-leaD-silver
market share in India’s primary zinc market77%
BusINEss Zinc India (Hindustan Zinc Limited - HZL)Zinc International
ProDucTIoN VoLuME Zinc India (HZL) • Zinc: 688 kt • Silver: 610 t• Lead: 181 kt Zinc International: 240 kt
EBITDA (In ₹ crore) • Zinc India (HZL): 8,714 • Zinc International: 380
AssET HIgHLIgHTs � World’s largest fully integrated zinc-lead producer
� World’s second largest zinc mine at Rampura Agucha, India
� 6th largest silver producer in the world
� Developing the largest undeveloped zinc deposit in the world at Gamsberg, South Africa
� Zinc India has R&R of 403 million tonnes with mine life of ~25 years
� Zinc International has R&R of 509 million tonnes, supporting mine life in excess of 30 years
� HZL is a low-cost zinc producer, which lies in the first quartile of the global zinc cost curve
APPLIcATIoN ArEAs � Galvanising for infrastructure and construction sectors
� Die-casting alloys, brass, oxides and chemicals
PoWer
diversified power portfolio 9 gW
BusINEss Power plants at Talwandi Sabo, Jharsuguda and Korba
sALEs VoLuME
c. 11 billion kWh
EBITDA (In ₹ crore)
1,649
AssET HIgHLIgHTs � One of India’s largest power generators with 9GW diversified power portfolio
� TSPL is the largest thermal power producer in of Punjab India
� 3.3 GW of commercial power generation capacity, with balance for captive usage
� Leading producers of wind power in India: 96% thermal power and 4% from renewable energy sources
APPLIcATIoN ArEAs � 63% is for captive use while 37% is used for commercial purposes; of which c.95% is backed by long-term Power Purchase Agreements with local Indian distribution companies
oil & gas
of India’s crude oil production 26%
BusINEss Cairn India
ProDucTIoN VoLuME
174 kboepd (Average Daily Gross Operated Production)
EBITDA (In ₹ crore):
7,271
AssET HIgHLIgHTs � World’s longest continuously heated pipeline from Barmer to Gujarat Coast (~670 kms)
� 136 wells drilled, 41 wells hooked up in FY2020 growth phase
� Early gas production facility ramped up to designed capacity of 90 mmscfd
� Largest private sector oil & gas producer in India
� Executing one of the largest polymer EOR projects in the world
� Footprint over a total acreage of ~65,000 sq km
� Gross proved and probable reserves and resources of 1,194 mmboe
APPLIcATIoN ArEAs � Crude oil is used by hydrocarbon refineries
� Natural gas is mainly used by the fertiliser sector
Operates
iron ore & sTeel
One of the largest iron ore miners in India
BusINEss Iron Ore India Electrosteel India
ProDucTIoN VoLuME • Pig Iron: 681 kt • Steel: 1,231 kt
EBITDA (In ₹ crore) Iron: 878 Steel: 588
AssET HIgHLIgHTsIron Ore � Karnataka iron ore mine with R&R of 73 million tonnes, and life of 17 years
� Value added business: 3 blast furnaces (0.8mtpa), 2 coke oven batteries (0.5mtpa) and 2 power plants (60MW)
Steel � Design capacity of 2.5 mtpa; � Largely long steel product
APPLIcATIoN ArEAs � Construction, infrastructure, transport, energy, packaging, appliances and industry
� Product portfolio includes pig iron, billets, TMT bars, wire rods and ductile iron pipes
veDanTa aT a glance
aluMiniuM
market share in primary Indian aluminium market37%
BusINEss Aluminium smelters at Jharsuguda and Korba (BALCO), Lanjigarh Alumina Refinery
ProDucTIoN VoLuME Aluminium: 1,904 ktAlumina: 1,811 kt
EBITDA (In ₹ crore)
1,998
AssET HIgHLIgHTs � Largest installed aluminium capacity in India: 2.3 million tonnes per annum (mtpa)
� Strategically located large-scale assets with integrated power and an alumina refinery
� 37% market share among domestic primary aluminium producers
� Emerged as the highest bidder for Jamkhani coal block, strategically located near Jharsuguda alumina smelter
APPLIcATIoN ArEAs � Used primarily in automotive, building & construction, transportation and electrical industries
� Product portfolio includes ingots, wire rods, billets, primary foundry alloys, slabs and rolled products

INTEGRATED REPORT
06-115MANAGEMENT REVIEW
116-167STATUTORY REPORTS
168-270FINANCIAL STATEMENTS
271-502
14 VEDANTA LIMITED INTEGRATED REPORT AND ANNUAL ACCOUNTS 2019-20 VEDANTA LIMITED INTEGRATED REPORT AND ANNUAL ACCOUNTS 2019-20 15
FINANCIAL HIGHLIGHTS � Revenue at ₹83,545 crore, 8% lower y-o-y
(FY2019: ₹90,901 crore) mainly driven by subdued commodity prices, lower volume at Zinc India, lower volume at Oil & Gas business and lower power sales at TSPL, partially offset by additional volumes from Gamsberg operations, higher sales volume at Aluminium business, Iron Ore Karnataka & Steel business and rupee depreciation. � EBITDA at ₹21,061 crore, 12% lower y-o-y
(FY2019: ₹24,012 crore) � Robust adjusted EBITDA margin of 29%
(FY2019: 30%) � ROCE at c.11% in FY2020 (FY2019: 13%) � Impairment relating to property, plant and
equipment, exploration assets and claims & receivables of ₹17,636 crore (net of tax ₹11,037 crore) which mainly includes impairment at Oil & Gas Business of ₹15,907 crore, Copper Business of ₹721 crore, Iron Ore Business of ₹349 crore, Avanstrate Inc (ASI) of ₹504 crore and Fujairah Gold (FG) of ₹151 crore � Profit Attributable to equity holders
(before exceptional items) at ₹3,995 crore (FY2019: ₹6,857 crore) � Free cash flow (FCF) post-capex of ₹7,130 crore
(FY2019: ₹11,553 crore), driven by lower EBITDA and working capital blockage due to COVID-19 impact partially offset by cost savings, lower capex outflow and lower tax outflow � Gross debt at ₹59,187 crore (FY2019: ₹66,225
crore), driven by repayment of debt at Vedanta Standalone, TSPL and temporary borrowing at Zinc India, partially offset by increase in borrowing at Oil & Gas Business � Net debt at ₹21,273 crore (FY2019: ₹26,956 crore),
primarily due to the repayment of debt, partially offset by working capital blockage due to COVID-19 and dividend payment during the year � Strong financial position with cash, liquid and
structured investments of ₹37,914 crore (FY2019: ₹39,269 crore) � Crisil changed the outlook on Company’s rating
(CFR) from ‘AA/Positive’ to ‘AA/Negative’ driven by subdued commodity prices. � India ratings changed the outlook on Company’s
rating (CFR) from ‘AA/Positive’ to ‘AA/Negative’ driven by delay in deleveraging on account of fall in commodity prices and delay in volume ramp-up in zinc and oil business in March 2020. In May 2020, India Ratings downgraded the company’s rating from AA to AA-, while maintaining the outlook as negative on account of higher expected balance sheet leverage due to substantial decline in economic activity due to COVID-19 related lockdown. The negative outlook reflects prolonged
subdued commodity prices in wake of COVID-19 outbreak and elevated refinancing risk. � Contribution to the exchequer of ~₹32,400 crore
in FY2020 (FY2019: ₹42,400 crore) � Realised power debtors of ~₹1,000 crore at TSPL,
as per the Supreme Court Order. � Vedanta is implementing the approved resolution
plan of acquisition of Ferro Alloys Corporation Limited (FACOR) as per NCLT approval dated January 30, 2020. FACOR is in the business of producing Ferro Alloys and owns a Ferro Chrome plant with capacity of 72,000 TPA, two operational Chrome mines and 100 MW of Captive Power Plant through its subsidiary, FACOR Power Limited (FPL). The consideration payable for the acquisition of FACOR on a cash free and debt free basis is ₹10 crore as well as an equivalent of cash balance in FACOR’s subsidiary, FPL as upfront consideration and zero coupon, secured and unlisted Non- Convertible Debentures of aggregate face value of ₹270 Crores to the Financial Creditors payable equally over 4 years commencing March 2021
BUSINESS HIGHLIGHTS FY2020Zinc India � Record ore production of 14.5 million tonnes,
despite disruptions on account of COVID-19 � Mined metal production of 917 kt, down 2% y-o-y � Refined zinc-lead production of 870 kt, down
3% y-o-yZinc International � Cost of production at US$1,665 per tonne,
down 13% y-o-y � Increase in Gamsberg production volume from
17 kt in FY2019 to 108 kt in FY2020
Employees at Cairn Oil & Gas
A YEAR OF CONSISTENT PERFORMANCE
GROUP HIGHLIGHTS
(₹crore, unless stated)
Particulars FY2020 FY2019 % Change
Net Sales/Income from Operations 83,545 90,901 (8)
EBITDA 21,061 24,012 (12)
EBITDA margina (%) 29% 30% -
Profit before Depreciation and Taxes 18,220 21,432 (15)
Profit before Exceptional items 9,127 13,240 (31)
Profit after taxes (4,743) 9,698 -
Profit after taxes (before Exceptional Items) 6,122 9,490 (36)
Attributable PAT after exceptional items (6,664) 7,065 -
Attributable PAT (before exceptional items) 3,995 6,857 (42)
Basic earnings per share (₹/share) (18.00) 19.07 -
Basic EPS before exceptional items (₹/share) 10.79 18.50 (42)
ROCE (%) 11.2% 12.8%
Total Dividend (₹/share) 3.9 18.85
a. Excludes custom smelting at Copper India and Zinc India operationsb. Exceptional Items gross of taxc. Tax includes tax gain on exceptional items of ₹6,521 crore on special items in FY2020 (FY2019: charge of ₹112 crore); DDT included in Tax Expense in FY2020 is Nil (FY2019: credit was NIL d. Previous period figures have been regrouped/rearranged wherever necessary to conform to current period presentation
� Q4FY2020 hot metal cost of production significantly better at US$1,451 per tonne, 20% lower y-o-yPower � Record Plant Availability Factor (PAF) of 91% at the
1,980 MW TSPL plant in FY2020Iron Ore � Goa operations remains suspended during the year
due to state-wide directive from the Hon’ble Supreme Court; engagement continues with the government for the resumption of mining operations � Production of saleable ore at Karnataka at 4.4 million
tonnes, up 6% y-o-y � Iron Ore sales at Karnataka at 5.8 million tonnes, up
125% y-o-ySteel � Record annual steel production at 1.23 million tonnes
for FY2020, up 3% y-o-y � Robust margin of US$127 per tonne during the last
quarter (~26% EBITDA margin)Copper India � Due legal process being followed to achieve a
sustainable restart of the operations
Oil & Gas � Average gross production of 174 kboepd for FY2020 � Early gas production facility fully commissioned to
design capacity of 90 mmscfd � Construction of new gas processing terminal in
progress to add another 90 mmscfd � Liquid handing capacity upgradation by 30% in progress � Production Sharing Contracts (PSC) signed for
Ravva block extended for 10 years � FTG survey completed in Assam and Kutch basins;
seismic survey ongoing in OALP Blocks � Capex growth projects update
� Nine rigs are currently deployed; 136 wells drilled during FY2020 � Seven appraisal wells drilled in Vijay & Vandana, DP & MBH � Two new wells hooked up in Ravva adding ~10kboepd
of incremental volumesAluminium � India’s highest aluminium production at 1,904 kt � Record alumina production from Lanjigarh refinery at
1,811 kt, up 21% y-o-y � FY2020 hot metal cost of production lower at US$1,690
per tonne, 14% lower y-o-y
REVENUE (`cr)
92,011 90,901
83,545
FY 18 FY 19 FY 20
CONSOLIDATED GROUP RESULTS
EBITDA (`cr)
FY 18 FY 19 FY 20
24,900 24,012 21,061
RETURN ON CAPITAL EmployED (RoCE) (%)
FY 18 FY 19 FY 20
16.9%
12.8% 11.2%
DIVIDEND (` per Share)
FY 18 FY 19 FY 20
21.20 18.85
3.90

INTEGRATED REPORT
06-115MANAGEMENT REVIEW
116-167STATUTORY REPORTS
168-270FINANCIAL STATEMENTS
271-502
16 VEDANTA LIMITED INTEGRATED REPORT AND ANNUAL ACCOUNTS 2019-20 VEDANTA LIMITED INTEGRATED REPORT AND ANNUAL ACCOUNTS 2019-20 17
WELL-POSITIONED for the future
INVeStMeNt CASe
Natural resources represent a critical growth engine for the economy. As India’s only diversified natural resources Company, we are very well positioned to make a significant contribution to the nation’s prosperity. Our investment case is focused on delivering sustainable, long-term returns to our shareholders and creating value for our larger stakeholder fraternity.
LARGE, LOW-COST AND DIVERSIFIED ASSET BASE WITH AN ATTRACTIVE COMMODITY MIX
IDEALLY POSITIONED TO CAPITALISE ON INDIA’S GROWTH POTENTIAL
Vedanta’s large-scale, diversified asset portfolio, with an attractive cost position in many of its core businesses, positions us to deliver strong margins and free cash flows through the commodity cycle. We have an attractive commodity mix, with strong fundamentals and leading demand growth and focus on base metals and oil. The commodity markets strengthened in the second half of this financial year, driven by improved demand
India is our core market and it has a huge growth potential, given that the current per capita metal consumption is significantly lower than the global average. The COVID-19 pandemic is inflicting significant human costs in India and the world. Protecting lives and allowing healthcare systems to cope have required isolation, lockdowns, and widespread closures to flatten the curve in India as in other parts of the world. Against this bleak backdrop, IMF predicts that the Indian economy is estimated to have grown by 1.9% in the financial year. However, the economy’s long-term potential remains robust, as it is likely to rebound to 7.4% in FY2021, provided the outbreak is contained and there is no recurrence. Once the economy reboots and the crisis blows over, strong liquidity in the economy and government impetus
in infrastructure building, housing and industrialisation will generate demand for natural resources. The country’s high resource import bill offers significant opportunities for a diversified player like us.
The government has lately announced various policy measures to support the commodity sector, which augurs well for our operations.
We are uniquely positioned to benefit from India’s growth due to: � A diversified portfolio of
established operations in India; � A strong market position as India’s
largest base metals producer and largest private sector oil producer � An operating team with an
extensive track record of executing projects and achieving growth
India’s Growth Potential
Source: IHS Markit
2019 2030
GDP (Nominal at $PPP) $11.3tn
$27.6tn
CAGR 8.4%
Per capita income (Nominal at $PPP) $8,458
$19,345CAGR 7.5%
2019 2030
1.5bnPopulation 1.4bn CAGR 0.9%
2019 2030
Urbanisation 34% 40%CAGR 1.4%
2019 2030
Source: Wood Mackenzie, IMF, IHS Markit, BMI, BP Energy Outlook 2019 Note: All commodities demand corresponds to primary demand
Commodity Demand Potential 2020
Aluminium Consumption (kg/capita)
Copper Consumption (kg/capita)
Zinc Consumption (kg/capita)
Oil Consumption (boe/capita)
India India India IndiaGlobal Global Global GlobalChina China China China
1.68.2
25.2
0.4 0.5 1.2 3.0 1.7
4.48.1 4.5 3.1
Demand 2020-2030 CAGR India demandVedanta Limited Commodity Presence
Global demand
Source: Wood Mackenzie
8.7%
5.8% 5.4% 5.1%
0.3%
5.0%4.2% 3.9%
2.8% 2.4%
0.4% 0.2%
2.7%1.3%
0.3%
2.2% 2.4%2.1%
Copper ZincMet CoalLead Aluminium Iron Ore Nickel Oil Thermal Coal
factors and continuing supply-side constraints, benefiting global commodity prices, particularly
Vedanta’s core commodities, including zinc, aluminium and oil & gas.
WELL-INVESTED ASSETS DRIVING FREE CASH FLOW GROWTH
OPERATIONAL EXCELLENCE AND TECHNOLOGY DRIVING EFFICIENCY AND SUSTAINABILITY
STRONG FINANCIAL PROFILE
PROVEN TRACK RECORD
A significant proportion of our capital investment programme has been completed, and we are now ramping up production to take advantage of our expanded capacity. We have already started seeing the results of our investments, with Zinc India and Aluminium delivering robust production in the past year, and we expect our Zinc International, particularly the Gamsberg project,
We consistently strive to improve our operations, integrate our businesses through the value chain and optimise our performance through operational efficiencies and innovative technological solutions. We also employ these tools to ensure
Our operational performance, coupled with a strong focus on optimisation of capital allocation, has helped maintain our financial resilience. During FY2020, when it was still seen as a subdued environment for commodity prices, our focus on capital discipline and profitability allowed us to deliver: � Revenues of ₹83,545 crore and
EBITDA of ₹21,061 crore � Strong ROCE of ~11.2% � Deleveraging and extension of our
Our management team has a diverse and extensive range of sector and global experience, which ensures that operations are run efficiently and responsibly, with key insights. We have taken a disciplined approach to development, growing our production steadily across our operations with an ongoing focus on operational efficiency and cost savings. Since our listing in 2003, our assets have delivered an average of 15% CAGR production growth.
to provide further impetus to our Zinc business, going forward. In the Oil & Gas business, we have begun to implement our growth projects with a gross capex of over US$3.2 billion, and this will enable us to increase volumes in the near and medium term. These increases in production will lead to strong cash flow generation through the cycle.
sustainable operations and focus on delivering a positive impact for all our stakeholders and, more broadly, the society as a whole.
debt maturities through proactive liability management exercises � Strong and robust FCF of
₹7,130 crore � Cash and liquid investments of
₹37,914 crore � A strong balance sheet, with
respect to ND/EBITDA and gearing, compared to our global diversified peers � Interim dividend of ~₹1,450 crores
paid in FY2020
Growth Capex (`crore)
FCF Post Capex (`crore)
Net Debt/EBITDA
Production Volumes
5,469
7,880
0.9
185 189
724
936 917
223
1,106
1,3881,343
569 571 561
174
7,764
11,553
1.1
6,385
7,130
1.0
FY 18
FY 18
FY 18
Oil & Gas (kboepd)
Underground mine
Zinc-lead Production
(kt)
Open-cast mine
Zinc-lead Production
(kt)
Aluminium ProductionJharsuguda
(kt)
Aluminium Production
Balco(kt)
400
0
800
1,200
1,600
FY 19
FY 19
FY 19
FY 20
FY 20
FY 20
FY2018 FY2019 FY2020

INTEGRATED REPORT
06-115MANAGEMENT REVIEW
116-167STATUTORY REPORTS
168-270FINANCIAL STATEMENTS
271-502
18 VEDANTA LIMITED INTEGRATED REPORT AND ANNUAL ACCOUNTS 2019-20 VEDANTA LIMITED INTEGRATED REPORT AND ANNUAL ACCOUNTS 2019-20 19
With ample natural, human and technological resources and strong reform-focused democratic governance, India holds out hope that in the post-COVID era global businesses and investors look at reducing dependency on China. This will mean more jobs, more investments, rapid development and a great boost to the government’s ‘Make in India’ initiative.
Anil Agarwal Chairman
ENABLING A WELL-RESOURCED FUTURE
CHAIRMAN’S STATEMENT
Fund. Your Company will also fund up to ₹200 crore in providing relief measures to communities across India. The contribution to PM-CARES Fund will complement Vedanta’s earlier commitment of creating a ₹100-crore corpus to cater to three specific areas - livelihood of the daily wage workers across the nation, preventive healthcare, support to its employees and contract partners across its plant locations.
PERFORMANCE DURING THE YEARAs we have seen, the year was challenging, which tested our organisational mettle amidst a turbulent macro environment. However, our Company emerged stronger at the end of it, paving pathways for accelerated future growth.
The year saw us accomplishing robust production volumes in multiple segments and continued building our asset base, while improving asset integrity. We have further strengthened the Company with strong operational and productivity focus, enhanced our capital allocation framework to create long-term shareholder value and delivered a sound set of financial outcomes. It is gratifying to note that we remained cashflow positive, while maintaining a resilient balance sheet. Our work continued in an uninterrupted manner across all key result areas. As a testimony to our efforts, we also
Dear Stakeholders,
It is a great honour for me to share my thoughts with you as your Company’s Chairman. This year, the Board welcomed and appointed me as the Non-Executive Chairman of Vedanta Limited. It is with great pride that I say, your Company has always been on a continuous journey of growth and expansion with best-in-class safety, benchmarked technology, and cost efficiency. We continuously ensure that we have the right management in place to drive our business and take the organisation to the next level. In line with this vision, we are pleased to announce that your Company will now be run by a guided Management Committee comprising of your Group Chief Executive Officer (CEO), Chief Financial Officer (CFO),Chief Human Resources Officer (CHRO) and Chief Commercial Officer (CCO).
I sincerely wish and pray that you all are safe at your homes. Your safety matters to us, as the world is currently grappling with an unprecedented health crisis that we all are fighting together. These are undoubtedly testing times, but it also brings to the fore the undaunted and ingenious human spirit that prevails against all challenges. We, at Vedanta, salute this human spirit and solidarity of citizens and nations across the world, and reaffirm our commitment to work towards a self-reliant and sustainable future for all.
India’s COVID response continues to be undoubtedly exemplary by global standards, and the Government of India, along with all state governments are coordinating effectively to flatten the curve. We, at Vedanta, are doing our bit in a modest way to help save lives and livelihoods. You will be happy to know that your Company has contributed ₹101 crore to the Prime Minister’s Citizen Assistance and Relief in Emergency Situations (PM-CARES)
received well-accredited recognitions across governance, safety and environmental parameters, including moving up in the rankings of in the Dow Jones Sustainability Index (DJSI).
To summarise, it was a year where we could yet again validate the confidence vested in us by everyone.
A GRADUAL ECONOMIC RECOVERYIn CY2019, the global economy seemed to be on a path to recovery. This was primarily led by the bottoming out of manufacturing activity and global trade and monetary policy easing by central banks the world over. This sentiment was further bolstered at the start of CY2020, in light of the progress in US-China trade talks and Brexit deal.
In what was expected to be a year of continued recovery, CY2020 now has a fresh challenge to combat in the form of the COVID-19 pandemic. Although it is early to ascertain its impact on global supply chains, consumer behaviour, overall business sentiment and supply-demand equations in the short term, we will have more clarity only over the medium term.
A pRo-gRowTh, pRo-BusInEss ENVIRONMENT IN INDIAFor India, FY2020 was characterised by several developments, including the re-election of the ruling party with an even larger mandate; the systemic identification, restructuring and tidying up of prevailing issues in the financial services sector; and the announcement of a slew of policy measures by the government.
While the clean-up applied temporary brakes on growth owing to a credit crunch, the fiscal and monetary policy announcements acted as a counterbalance, along with focus on keeping inflation under permissible limits. At the juncture that we are in, India faces its own unique opportunities and the priorities that come with it.
As we stand today, we have the reasons to believe that we are better positioned than any other nation with a visionary government, young working population, a conducive business environment and rising public expenditure.
Vedanta Contributed ₹101 crore to the pm-CAREs Fund. The Company will also fund up to ₹200 crores in providing relief measures to communities across India. Harnessing wind power at Hindustan Zinc

INTEGRATED REPORT
06-115MANAGEMENT REVIEW
116-167STATUTORY REPORTS
168-270FINANCIAL STATEMENTS
271-502
20 VEDANTA LIMITED INTEGRATED REPORT AND ANNUAL ACCOUNTS 2019-20 VEDANTA LIMITED INTEGRATED REPORT AND ANNUAL ACCOUNTS 2019-20 21
potential of natural resources in the most sustainable manner to fuel the nation’s progress. It is with this objective that we have reinforced our positioning as ‘Vedanta, Desh ki Zarooraton ke liye.’
ConTRIBuTIng To nATIon-BUILDING At Vedanta, our business performance contributes directly to the nation’s economy. With over 40% of revenue being contributed to the national exchequer, we continue to deliver on our commitments, in the most transparent and ethical manner. We also employ closer to 80,000 on-roll and contractual personnel, thus creating a multiplier effect on the economy. According to a recent report by Institute for Competitiveness, a subsidiary of IFC (part of the World Bank Group), Vedanta’s operations contribute around ~1% to India’s GDP.
As we grow further, we continue to play a pivotal role in India’s social development stage, and maintain a strong social engagement through our corporate responsibility initiatives. During FY2020, we spent ~US$41 million, to touch the lives of over 3.26 million people.
Our core impact areas are education, health, sustainable livelihoods, women empowerment, sports and culture, environment and community development. Each of our Group companies have their own CSR agenda and they undertake associated interventions in one or more of the above impact areas. For example, BALCO actively supports the fight against cancer through its 170-
The government’s announcements made through the year and as part of the Union Budget 2020-21 are directed at setting the stage for India’s future growth. Among these, the National Infrastructure Pipeline with a projected total investment of ₹102 lakh crore (US$1.44 trillion) during the period FY2020-2025 deserves a special mention. It reinforces the government’s commitment to build an India of the future with better connectivity and better resilience. It also has a direct and positive impact on heavy industries such as ours, with expected short- to medium-term buoyancy in demand. Other measures, such as a corporate tax cut, 100% FDI in coal mining, and merger of public sector banks are also noteworthy, which are directed at boosting the business climate in the country.
mETAls AnD mInIng – PROPELLING INDIA’S GROWTH With large-scale infrastructure spend on the horizon, the metals and mining sector is expected to receive a boost in demand both over the short as well as longer term. This growth will be further facilitated by the National Mineral Policy 2019, launched to ensure transparency, better regulation and enforcement, and to ensure a balance between social and economic growth. The Policy touches upon contemporary issues and guides on the adoption of scientific mining, technology and innovation, and environmental and social priorities. As Vedanta, we are well aligned to these guidelines and continue to set new benchmarks in good mining practices.
VEDAnTA - READy To sERVICE ThE NATION’S NEEDSAs India grows, so will its needs and aspirations. At Vedanta, we are focused on providing vital commodities that facilitate the everyday lives of Indians and service their needs. Vedanta as India’s only diversified natural resources group is presented with a unique opportunity to provide the vital commodities the country needs for infrastructure development, asset creation, mobility, housing, consumer goods and general consumption. Together with everyone, we can harness the
bed Medical Centre in Chhattisgarh, under the aegis of Vedanta Medical Research Foundation. Our flagship CSR programme, Nand Ghar, is aimed at building modern community resource centres through the length and breadth of the nation. Conceived in association with the Ministry of Women and Child Development (MoWCD), the Nand Ghar initiative targets the empowerment of 8.5 crore children and 2 crore women across 13.7 lakh Anganwadis in India. 2019 was a milestone year for this initiative, as we witnessed the inauguration of our 1,000th Nand Ghar. By FY2021, we are planning to quadruple the number of these centres, with an unwavering commitment to giving back to the society.
A FIRM FOCUS ON SUSTAINABILITYOur sustainability approach is strongly driven by the need to address the expectations of our stakeholders while delivering strong business performance. As a Company we are attuned to global expectations and endeavour to contribute to the fulfilment of the United Nations Sustainable Development Goals (UN SDGs).
Our sustainable development agenda straddles four major pillars of Responsible Stewardship, Building Strong Relationships, Adding and Sharing Value, and Strategic Communications. These are developed in line with our core values, internal and external sustainability imperatives and global relevant frameworks. Our Environmental, Social and Governance (ESG) priorities are well aligned to our enterprise goals and towards this end,
Vedanta employees participating in awareness building team activities
CHANGES IN LEADERSHIPWith a heavy heart, I would like to announce that Srinivasan Venkatakrishnan (Venkat) stepped down as the CEO and Director of the Company with effect from 5 April 2020, for personal reasons and will be re-joining his family in South Africa. Over the last two years, I have enjoyed working with Venkat to drive our vision for the Company and the country at large.
I admire Venkat for his passion, dedication, ability to connect with people and his grasp of business. Venkat is a committed leader and will be remembered for his passion for sustainability, asset integrity, development and positioning Vedanta in global markets. We would like to acknowledge and express our deep appreciation and gratitude to Venkat for his immense contribution to the Company. This year, we also had to bid adieu to Ajay Kumar Dixit, our Cairn Oil & Gas business CEO and Deshnee Naidoo, our Zinc International business CEO. Ajay superannuated from the Company at the end of his five-year term this May, while Deshnee had to leave us for personal reasons. Both led respective businesses with great zeal and passion.
We wish them the best for all their upcoming endeavours. It is my pleasure to welcome Sunil Duggal - our interim CEO, a mature and proven leader who has held key leadership positions across the Group in the last 10 years. Sunil is an industry veteran and an active member of several industry and advocacy forums. He is passionate about safety, environment and ESG. We look forward to Sunil taking the Company to greater heights. I also want to place on record my thanks to the 80,000+
we are working with a target-based approach to foster an inclusive and sustainable future for all. We ensure the safety of our workforce with its associated programmes on Visible Felt Leadership, deeper engagement on safety with our business partners, and managing critical safety tasks.
We are also managing our environmental impact through associated programmes on GHG emissions intensity reduction, tailings dam management, and recycling of our high-volume-low-effect wastes such as fly ash. We have defined a social performance framework for the organisation to secure our social licence to operate assessing the maturity of our business in the context, and driving community development activities across multiple spheres such as child education, women’s empowerment, medical infrastructure development, and sports, among others.
EMPLOYEE SAFETY, HEALTH AND WELLBEINGThe safety, health and wellbeing of our employees continue to be a highly critical focus area for us. However, I regret to inform that even with a razor-sharp focus on occupational health and safety, we witnessed seven fatalities this year. One life lost is too many for us, and we have redoubled our efforts to effectively enforce a safety culture and avoid any untoward incident, going forward.
TOGETHER WE WINEver since we began our journey, our culture has always been people-centric, because we believe we are only as resourceful, resilient and future ready as our people. We are committed to provide our people a safer, sustainable, inspiring and inclusive culture.
Our culture enshrines our core values and nurtures innovation, creativity and diversity. We align our business goals with individual goals and enable our employees to grow on the personal as well as the professional front. Being an equal opportunity employer, and a meritocracy – all our decisions regarding employees are based on their contribution, attitude and potential.
people who make up the Vedanta family and who, during this year, have innovated, broken records, and driven up our output with ever-increasing efficiency.
WAY FORWARDI sincerely believe that the post-COVID world will bring huge opportunities for India to secure a better place in the emerging global economic order. I also believe the ultimate ‘Make in India’ moment for our country is soon to arrive. With ample natural, human and technological resources and strong reform-focused democratic governance, India holds out hope in the post-COVID era global businesses and investors look at reducing dependency on China. This will mean more jobs, more investments, rapid development and a great boost to our ‘Make in India’ initiative.
As I look back at Vedanta’s journey so far, I can say with reasonable confidence that we have steadily grown and evolved to be an organisation creating disproportionate value for citizens of India. Even amidst a short-term environment of uncertainty, I have well-founded belief in our fundamentals, our strategy and our people, which taken together, is a powerful force to reckon with. My outlook remains positive for the country and for the Company and we are equipped to fulfil every commitment we have towards our stakeholders.
On behalf of the Board and the entire leadership team, I solicit your continued cooperation for all our present and future endeavours.
Best regards, Anil Agarwal
Currently, 3.1 million people benefit from Vedanta's us$ 41 million CsR programme. 2019 was a milestone year for our flagship nand ghar initiative, as we witnessed the inauguration of our 1,302nd nand ghar at Barmer, Cairn Oil & Gas.Teamwork at Barmer, Cairn Oil & Gas.
CHAIRMAN’S STATEMENT CONTINUED...

INTEGRATED REPORT
06-115MANAGEMENT REVIEW
116-167STATUTORY REPORTS
168-270FINANCIAL STATEMENTS
271-502
22 VEDANTA LIMITED INTEGRATED REPORT AND ANNUAL ACCOUNTS 2019-20 VEDANTA LIMITED INTEGRATED REPORT AND ANNUAL ACCOUNTS 2019-20 23
Vedanta has a rich legacy as India’s only diversified natural resources group. We will continue to further strengthen it in the years to come. It is a Company with a strong purpose of giving back for the greater good, a track record of achievement with an equally compelling sense of selflessness. The COVID pandemic has hit the world and us in the last quarter of the year. We have taken a pro-active approach to keep our assets and people safe while ensuring optimum operations during these difficult times. During these difficult times, our efforts are aligned to the singular vision of making our communities, the state and nation self-reliant and selfsufficient.
Sunil Duggal Chief Executive officer
PURSUING SUSTAINABLE GROWTH TO EMERGE STRONGER
CEO’S MESSAGE
focus on exploration. This is also evident by the fact that Vedanta is one of the largest employers of engineers and geologists in India. Our operating mantra remains – safety, environment, volume growth and lowest cost of production.
THE YEAR GONE BYTo describe 2020 as a dynamic year is an understatement. The macro environment has been extremely challenging with the impact of the COVID-19 pandemic. The virus outbreak which saw lockout across geographies has become one of the biggest threats to the global economy, disrupting businesses and supply chains world over. During these testing times our priority was to ensure the health and safety of our employees, contractors and stakeholders, while ensuring the business continuity to all extents possible. The full impact of this pandemic has to be further accessed in the longer term. The Company has set up a dedicated ₹100 crore fund as part of its endeavour to join ranks with the Government of India to combat the widespread outbreak of COVID-19 which will cater to three specific areas – Livelihood of the daily wage worker, employees & contract workers, preventive healthcare and will provide timely help to communities in and around various plant locations of the Company.
Upon evaluating the year, I would like to draw your attention to the following key operational highlights, which I’m particularly proud of: � Our Aluminium business continues
to benefit from improved integration, currently witnessing cost of US$1,690/t even after the macro environment impact. Lanjigarh refinery recorded the highest-ever production volumes from our Alumina refinery in Lanjigarh at 1,811 kt, up 21% y-o-y at a cost of US$275/t, down 15% � In our Zinc business, we remain on
track to become the world’s largest integrated zinc-lead-silver producer in two years while maintaining our cost leadership with record ore production of ~15 million tonnes in Zinc India, despite disruptions on account of COVID-19. At Zinc International,
Dear Stakeholders,
This is my first integrated report since assuming the role as Interim Group CEO of Vedanta Limited and I am honoured and humbled to be leading our great Company which I have proudly been a part of for last ten years. I must begin by acknowledging Mr. Srinivasan Venkatakrishnan for his leadership in our Company over the last two years. Under his guidance, we built an exceptionally strong foundation that will benefit our organization long after his departure. We are grateful for his service.
Vedanta has a rich legacy as India’s only diversified natural resources group. We will continue to further strengthen it in the years to come. It is a Company with a strong purpose of giving back for the greater good, a track record of achievement with an equally compelling sense of selflessness. We strive for a positive impact on the communities we operate in. The Company has been contributing significantly to India’s growth story. We are among the top private sector contributors to the exchequer with the contribution of ₹32,400 Crore in FY2020. Vedanta’s operations contribute 1 per cent to India’s GDP as per the IFC report. Operating responsibly and ethically is an integral part of Vedanta’s core values. We deliver on our commitments to all internal and external stakeholders by demonstrating these values through our people, actions, processes and systems.
The Company is uniquely poised to grow in commodities that have rising demand especially in India, with an enviable growth pipeline which is being brought to fruition in a disciplined manner. At the core of this growth are long life, structurally low cost and diverse assets with excellent potential, as we are market leaders in most of the commodities we produce. The Company has the finest resources that the world and country have to offer - in the form of some of the world-class deposits on one hand and importantly people with entrepreneurship, capability, drive, energy and commitment to get the most out of these deposits, on the other. There is a strong technical expertise in the group with a keen
the Gamsberg production for the year stood at 108 kt � Oil & Gas average gross production
was at 174 kboepd � Our steel business at ESL saw
record annual steel production at 1.23 million tonnes for FY2020, up 3% y-o-y at an industry-leading margin of ~US$127/t during the last quarter � In Iron Ore, our sales from
Karnataka were up 125% y-o-y at 5.8 million tonnes � Our balance sheet continues to be
strong, and with a healthy cash- flow generation, we maintain our industry-leading Net Debt-to- EBITDA ratio of 1.00, which is lowest among Indian peers � Nand Ghar, our flagship CSR
initiative, has crossed the 1,000 Anganwadi mark and is currently standing at a count of 1,250 � Continuous improvements as per
Golder recommendations are under implementation across all tailing dams
Operating responsibly and ethically is an integral part of Vedanta’s core values. We deliver on our commitments to all internal and external stakeholders by demonstrating these values through our people, actions, processes and systems.
Aluminium Smelter at Balco

INTEGRATED REPORT
06-115MANAGEMENT REVIEW
116-167STATUTORY REPORTS
168-270FINANCIAL STATEMENTS
271-502
24 VEDANTA LIMITED INTEGRATED REPORT AND ANNUAL ACCOUNTS 2019-20 VEDANTA LIMITED INTEGRATED REPORT AND ANNUAL ACCOUNTS 2019-20 25
OUR SAFETY RECORD � We began this financial year with
a strong commitment to improve our safety performance. While there have been significant gains made across our businesses, I am deeply saddened by the loss of seven lives this year. Our LTIFR stands at 0.67 in FY2020. We have completed the incident investigations for the accidents and are taking measures to ensure repeats do not occur. The learnings from the incidents are being implemented across the business. Occupational health and safety is a non-negotiable factor for us and we are determined to achieve absolute ‘Zero Harm’ in our operations. In light of our safety incidents, there is a renewed focus by the leadership team to improve our safety performance. Three safety KPIs were taken to help us improve our journey to Zero Harm. We are making steady progress in all three areas.
� In the area of Visible Felt Leadership Where leaders & support personnel are mandated to spend quality time in the field performing safety interactions
� In the area of Managing Safety Critical Tasks That could cause a fatal or a permanent injury like Fall of Ground, Working at Heights, Confined Spaces etc
� In the area of Business Partner engagement We have established a committee that has the mandate to help improve the Business Partner safety performance. The committee is currently completing work on pre- qualification requirements, and on special terms and conditions that highlight Vedanta’s safety expectations for Business Partners, especially those that do heavy maintenance and construction activities at our facilities
We are confident that these measures will help stabilise our safety performance in the short term and help us move closer towards our objective of Zero Harm and Zero Fatality. As discussed above, the last quarter of FY2020 has been a time of global crisis as a result of
the COVID-19 spread. We are fully committed to the safety of our employees.
Our strategy has been threefold: practice physical distancing for all essential workstreams, rely on early diagnosis for our workforce to prevent an outbreak and share knowledge and best practices across our business entities to ensure safe workplaces.
While the average footfall at our plants has been reduced significantly, our employees are actively involved in building homegrown solutions to the challenges created by COVID-19. For example, we now have non-touch based hand washing system which was built by our employees. Additional safety measures in terms of sanitiser fogging, social distancing measures through on ground marking are also in place to ensure minimum contact. We have also launched an healthcare helpline for our employees in partnership with Apollo Hospitals, through which they can tele-consult with a general physician or a psychologist.
SUSTAINABILITY, A BUSINESS AND SOCIAL IMPERATIVEOur unwavering focus on operating a sustainable and responsible business continued to deliver results in FY2020 which was well affirmed by third-party experts. Work on improving the stability and the management of our tailings dam facilities continues. Business Units are implementing the recommendations from the audit conducted by Golder Associates in the previous year. In addition, we
have updated the Tailings Dam Performance Standard and have added a detailed set of Guidance Notes that all our BUs must adhere to when managing their tailings facilities. With a view to de-risk our tailings dam facilities, we have embarked on a programme to de-water our tailings and store the dry tailings moving forward. Our Lanjigarh red mud pond has led the way early on this and HZL’s Zawar location has commenced operations with this approach during the year. We are exploring to adapt this to our Dariba and Rampura Agucha locations.
2020 also is the end-of-cycle for our GHG emissions intensity reduction target. We have managed to reduce our GHG emissions intensity by 13.83%. This is slightly below our targeted 16% reduction from a 2012 baseline and indicative of the stretch target we had taken. This reduction in equivalent to ~9 million tonnes in avoided GHG emissions. We have begun work on setting our next set of long-term GHG reduction targets and will be disclosing those numbers in the next fiscal cycle.
Read a detailed account of our ESG strategy, initiatives and performance on Page 64-111.
BUSINESS REVIEW AND OUTLOOK Zinc We are on track to become the world’s largest long-life, low-cost zinc-lead-silver producer in the coming two years. This is being made possible with both our Zinc India operations through HZL and our Zinc International business. At HZL, where we have fully integrated operations with matching mining and smelting capacities, we are witnessing solid output, across both zinc and silver while maintaining our cost leadership. The ramp-up of our mines is in its final phases and will significantly de-risk our future growth potential for the next few years. HZL is
Employees at Cairn Oil & Gas
2020 marks the end-of-cycle for our GHG emissions intensity reduction target. We have managed to reduce our GHG emissions intensity by 13.83%. This reduction in equivalent to ~9 million tons in avoided GHG emissions.
currently targeting an expansion of up to 1.35 MTPA and then further to 1.5 MTPA.With respect to Zinc International, the Gamsberg plant, inaugurated in 2019, is beginning to stabilize and ramp up. An expanded Gamsberg will see ore mined increase to 8 MTPA, with zinc-in-concentrate rising to 600,000 tpa. This will make Gamsberg the largest open-cast mine in South Africa, and its first fully integrated zinc manufacturing facility.
Read more on Zinc India and Zinc International on Page 132-141.
Oil & Gas In Oil & Gas, we are monetising our existing portfolio and driving growth to the next level. We currently have 136 drilled and 41 hooked up wells. The gas production facility has also been ramped up to a design capacity of 90 mmscfd. We had a planned shut down at the Mangala processing terminal in February and have been ramping up our production since then.
Our current portfolio for exploration consists of 33 offshore and 8 onshore Open Acreage Licensing Policy (OALP) blocks, with a combined acreage of ~65,000 sq km. The full potential production expectation from this portfolio is 500 kboepd and we have committed a capex of US$800 million for the exploration phase, with 192 exploratory wells to be drilled. For Production Sharing Contract (PSC) blocks, we have a committed investment of US$135 million (Rajasthan Tight Oil Appraisal and KG-Offshore). For Rajasthan exploration, we have released an EOI for an integrated exploration and appraisal work programme.
Read more Oil & Gas on Page 142-147.
Aluminium In what can be termed as the outcome of collective and conscious efforts, we have maintained the cost of production of Aluminium business at US$1,690/t, despite the macro environment. With respect to alumina, our Lanjigarh refinery achieved a record production of 1,811 tonnes up 21% y-o-y with costs down 15% y-o-y, with the local bauxite meeting more than 50% of our requirement. A key highlight for the year was also emerging as winners of the Jamkhani Coal Block auction, which will add to the energy security
for the business. For aluminium, we continue to progress on set strategic levers that comprise coal initiatives, alumina ramp up, bauxite sourcing and others. Together, these levers have brought down our per tonne cost below US$1,500.
Read more on Aluminium on Page 148-151.
Steel Electrosteel Steels Limited (ESL) has exhibited continued volume growth since its acquisition with the financial year production up 3% at 1,231 kt with industry leading margins at US$127/t during the last quarter of financial year.
During the year, we also acquired Ferro Alloys Corporation Limited (FACOR), which will complement and strengthen our existing steel vertical with its production of ferro alloys. Up to 20% of FACOR’s production will be used for our steel operations, which will drive significant efficiencies for us. In the near future, we are expecting a doubling of output from the steel vertical.
Read more on Steel on Page 160-163.
Iron Ore In our Iron Ore business the production of saleable ore at Karnataka at 4.4 million tonnes, up 6% y-o-y while sales at Karnataka was at 5.8 million tonnes, up 125% y-o-y. Goa operations remain suspended due to state-wide directive from the Hon’ble Supreme Court; engagement continues with the government for a resumption of mining operations.
Read more on Iron Ore on Page 156-159.
Copper In Tuticorin, a legal process being pursued to achieve a sustainable restart of the operations at our copper smelter.
Read more on Copper on Page 164-167.
RESOURCES AND RESERVESAs a natural resources Company, our available reserves define our value proposition and market success. As introduced at the start of this report, in our Zinc, Iron Ore and Bauxite reserves, we fall in the top decile globally for largest reserves. Further,
in our Oil & Gas business, we are the largest private sector acreage holder in India.
Refer to the detailed table on Page 09.
DIVIDENDSDuring the year, the Board declared dividends aggregating ~₹1,500 crore crore at ₹3.9 per equity share.
PEOPLEDuring my time within the Vedanta Group, I’ve been fortunate to interact with a lot of our people, who have the talent and the passion to make a difference. It is them who give me the conviction that we are going to continue our winning streak, without losing focus on our core values and the larger purpose. Our ~80,000-strong workforce leads the way forward for us, and I thank them for all their efforts.
Read more on our people practices on Page 98-103.
OUTLOOKAs I look ahead, I can say with confidence that we are positioned to grow in our key markets and service the needs of the people. Notwithstanding the current uncertainties around COVID-19 and the ensuing impacts, we will continue to invest forward and deliver superior returns to our stakeholders.
Over the next three to five years we plan to invest ~US$9 billion across our businesses, and are expecting to grow our revenues by 30% to 40%. Once the industrial and economic scenario has found a new normal, our enviable project pipeline across all our key businesses will benefit from strong signals of resumption of the accelerated growth in India, owing to pro-growth and pro-business government policy decisions. I thank the Board and the Chairman, our people and partners, and all other stakeholders for the support you have extended to help me execute my role well. Going forward, we will continue to raise the bar with everyone and deliver results as we always have. I seek your continued guidance and support in achieving the same.
Best regards,Sunil Duggal Chief Executive Officer
CEO’S MESSAGE CONTINUED...

INTEGRATED REPORT
06-115MANAGEMENT REVIEW
116-167STATUTORY REPORTS
168-270FINANCIAL STATEMENTS
271-502
26 VEDANTA LIMITED INTEGRATED REPORT AND ANNUAL ACCOUNTS 2019-20 VEDANTA LIMITED INTEGRATED REPORT AND ANNUAL ACCOUNTS 2019-20 27
UNLEASHING LANJIGARH: LINEARITY OF PERFORMANCE & INTEGRATED PLANNINGVedanta’s aluminium assets have been envisioned to be fully integrated operations with secured bauxite and coal sources, in-house alumina refinery and captive power plants.
Lanjigarh is a small town located in the eastern part of India in Odisha. Situated here is our state-of-the-art alumina refinery, led by a diverse team of global and local talent. It forms a crucial link in our value chain, as it feeds our aluminium smelters at Jharsuguda and BALCO.
In the past two years, the refinery has had an exemplary run, with alumina production volumes growing at 22% CAGR, while the cost of production has declined by 8% CAGR to sub-300 $/T levels. The refinery delivered its highest-ever production of 1.8 million tonnes of alumina in FY2020, 21% higher than FY2019.
Since its inception, the refinery has been fed by several bauxite sources globally. As a result, achieving consistent plant productivity was challenging. To mitigate this long-standing challenge, a comprehensive operational excellence programme was run at the refinery from quarry to lorry (from bauxite sources to alumina dispatch), supported by an aggressive war-room approach that examined each step in the process for revamping and optimising.
INTRODUCING LINEARITY OF PERFORMANCEAs a result of the operational excellence initiative, the multitude of bauxite sources were cut down to three to four sustainable sources, chosen based on geological similarities.
This directly enhanced plant productivity and improved alumina recovery. A second challenge was the prevalence of high atmospheric moisture levels aggravated by Indian monsoons. This adversely affected the bauxite quality and impacted our production levels.
To contain this risk, we undertook extensive sampling across the supply chain to identify points of moisture ingress and went on to mitigate the issue. This risk identification and mitigation model was replicated throughout the plant, helping us improve and evolve our operating processes.
INTEGRATED PLANNING ACROSS PROCESSES AND STAKEHOLDERSCommitted to continuous improvement, we conducted a production loss mapping exercise across various stages of the refinery, along with a relentless focus on plant maintenance. With the introduction of robust production planning across sourcing, logistics, handling, operations & maintenance, equipment availability and turnaround time improved dramatically. Detailed logistics planning and ensuing debottlenecking projects helped enable the production teams to operate with higher versatility across parameters.
hEAlTh, sAFETy AnD EnVIRonmEnT (hsE)Best-in-class HSE performance has always been at the core of the process execution at Lanjigarh. To reaffirm this, several concerted and award-winning efforts were undertaken at the unit to further enhance the overall sustainability of our operations.
The refinery delivered its highest-ever production of 1.8 million tonnes of alumina in FY2019-20, 21% higher than FY2018-19.
LEVERAGING TECHNOLOGY TO DRIVE EFFICIENCY
The Aluminium & Power Sector and General Electric (GE) signed an agreement to implement GE’s Digital Smelter solutions at its largest smelter in India at Jharsuguda to significantly increase its operational efficiency and productivity. A first-of-its-kind deployment in any aluminium plant in India, the digital twin technology is part of Vedanta’s long-term commitment to digital
transformation. Together with advanced analytics, this technology is expected to substantially reduce specific power consumption at the smelter. Typically, a one-percent reduction in specific power consumption effected by digital smelter solutions can save about US$4-5 million annually in the smelter potlines alone, for every one million tonne of aluminium produced
annually. In addition, this digital solution is expected to improve raw material utilisation, increase smelter pot life, enhance operational efficiency, maximise safety and reduce wastage, thereby delivering best-in-class performance outcomes and significant cost savings.
Mine Cutting Machine at our plant site

INTEGRATED REPORT
06-115MANAGEMENT REVIEW
116-167STATUTORY REPORTS
168-270FINANCIAL STATEMENTS
271-502
28 VEDANTA LIMITED INTEGRATED REPORT AND ANNUAL ACCOUNTS 2019-20 VEDANTA LIMITED INTEGRATED REPORT AND ANNUAL ACCOUNTS 2019-20 29
HINDUSTAN ZINC: DRIVING DIGITAL DISRUPTION IN THE MINING SECTOR HZL remains at the forefront of transformation in the mining sector, implementing best-in-class technological solutions to strengthen its competitive edge. Its journey towards digitalisation and technological excellence has led to the emergence of several consequent opportunities in 2020 and beyond.
DATA IS THE NEW GOLD, AND IN MINING IT IS A PRIORITYThis year, HZL launched a collaboration centre, which can be easily termed as one of the world’s best Internet of things (IoT) setups in the mining industry. This Centre has infused data-driven decision-making across our operations. For us, this step goes a long way in nurturing an ecosystem where our operations team, Original Equipment Manufacturers (OEMs), Subject Matter
DRIshTI - An EyE FoR DETAIl, EVEn A mIlE unDERgRounD
EVOLVING METAL SALES CHANNEL AT HZL During FY2020, HZL’s marketing team completed the Phase I development milestone for e-Volve, a first-in-the-Zinc industry, B2B online commerce platform. e-Volve is set to go-live in Q1FY21 and will transform the way metals are purchased in India – and enable ‘Buy in three clicks’.
e-Volve aims to be the digital marketplace of choice for zinc, lead and silver consumers within the country. It enables them to place orders in just three-clicks on real-time, INR prices with minimum order quantity of as low as one tonne and offers delivery from our extensive network of warehouses. This digital marketplace is expected to enable HZL reach out to over 2,000 customers of zinc, lead and silver and will reduce transaction and inventory costs for the industry.
Experts (SMEs), data scientists and senior management collaborate seamlessly towards meaningful outcomes. Relevant data from our mines, mills, smelters and power plants are integrated into a single platform, providing a holistic view and strengthening the foundation for a digital enterprise, while offering several other possibilities.
The Centre is working on advanced analytical modelling to allow accurate predictions to prevent major equipment failures and production losses, thereby optimising our assets and operations. This strategy will lead to an increase in metal recovery by ~2%, while cost optimisation in our underground operations and in the smelting process is already visible.
e-Volve: a first-inthe-Zinc industry B2B online commerce platform. It enables customers to place orders in just 3-clicks on real time INR prices with minimum order quantity of as low as one tonne and offers delivery from our extensive network of warehouses.
HZL launched a project called ‘Drishti’ to make the underground mining process more predictable, reliable and sustainable with maximum safety using state-of-the-art technology. Under ‘Drishti’, we target to improve the overall underground equipment effectiveness by over 10% this year. To achieve this, we established a high bandwidth Wi-Fi network to facilitate two-way communication with underground equipment and personnel. This enables us to track man, machine and material movement, examine
progress of tasks on real-time basis and manage data centrally. In essence, it helps us provide the right information at the right time, in the right format to the right person.
Under ‘Drishti’, we are now vested with a unique ability to monitor and predict the health of equipment, which operate as deep as a kilometre below ground. This helps us shift from the current practice of preventive to condition-based predictive maintenance. Additionally, this will also empower us with a
unique functionality of traffic management on ramp, which has the potential to significantly reduce the idling time and ensure better safety.
Employees at Operational site, Hindustan Zinc Captive Power Plant
Underground Operations at Sindesar Khurd Mine
Underground operations at Sindesar Khurd Mine

INTEGRATED REPORT
06-115MANAGEMENT REVIEW
116-167STATUTORY REPORTS
168-270FINANCIAL STATEMENTS
271-502
30 VEDANTA LIMITED INTEGRATED REPORT AND ANNUAL ACCOUNTS 2019-20 VEDANTA LIMITED INTEGRATED REPORT AND ANNUAL ACCOUNTS 2019-20 31
CAIRN OIL & GAS: EXPANDING FOOTPRINT FOR INDIA’S SELF SUFFICIENCY At Cairn, Vedanta’s Oil & Gas arm, we are passionate believers of India’s hydrocarbon potential and of our demonstrated capability to unlock oil & gas resources across India.
Producing blocks under Production Sharing Contract (PSC)
Exploring the 51 blocks we were awarded as per Open Acreage Licensing Policy (OALP) and the two blocks in Discovered Small Fields (DSF)
As our overarching objective is to contribute 50% of India’s crude oil production, we focus on driving volume growth on two fronts:
1
2
PSC BLOCKS In the PSC blocks, we are investing a gross capex of US$3.2 billion across the portfolio of projects, comprising enhanced oil recovery, tight oil, tight gas, infrastructure upgrade, exploration and appraisal. Execution of these projects through an integrated partnership model with global oil field service companies is underway. These projects shall contribute to the near-term growth in volumes.
Furthermore acquisition of 51 OALP blocks across basins in India has led to a tenfold jump in our acreage from the existing/producing blocks of ~6,000 sq km. in August 2018 to current levels of ~65,000 sq km. This has established us as one of the largest private sector acreage holders in the country. The blocks are contiguous to some of the highest oil-producing fields in Barmer, Assam, and the Krishna Godavari (KG) basin. They also possess a good mix of unconventional and conventional play, along with existing infrastructure and data capabilities to jumpstart activities on an immediate basis. The acquired blocks have a work programme commitment of ~10,620 km of 2D seismic, ~22,882 sq km of 3D seismic and over 192 exploratory wells.
OALP BLOCKSIn OALP blocks, our objective is to reduce cycle time from exploration to production through innovative technology adaption. We have implemented an innovative technology, Full Tensor Gravity Gradiometry™ (FTG) airborne survey, to prioritise area for hydrocarbon prospectivity. This is the largest onshore FTG survey programme in India covering an area of 1,200 LKM in Assam blocks and 8,000 LKM in Kutch blocks.
The seismic acquisition programme has commenced in Assam, Kutch and mobilisation of the crew is underway in Rajasthan, Cambay and Offshore blocks. We have applied satellite-based Sub-Terrain Prospecting (STeP®), which includes eight remote sensing and computational technologies within a six-month time frame covering an area of 3,650 sq km. This is the first application in oil & gas exploration in India to provide information to optimise and prioritise areas for exploration focus. Adaption of technology will enable us to commence exploratory drilling in the early part of FY2021 and drive early monetisation. Together, our approach towards PSC and OALP blocks will enable us to progress towards our vision for oil & gas, and in turn, contribute to India’s hydrocarbon security.
OFFSHORE DIGITAL OILFIELD OF THE FUTURE
As a part of digital journey, Cambay Basin Offshore at Suvali (CB/OS-2) is now integrated with corporate Historian i.e. replicating the performance of the oilfield on a computer. The implementation of digital oilfield has assisted Oil & Gas business in increasing
operational efficiency, production optimisation, collaboration, data integration, decision support, and workflow automation. Additionally, it enabled us in achieving productivity gains through improved reservoir understanding and remote monitoring of drilling and completion operations.
Satellite-based Sub-Terrain prospecting (sTep®) applied in the olAp blocks is the first application in oil & gas exploration in India to provide information to optimise & prioritise areas for exploration focus.
Largest onshore FTG survey program in India covering an area of 1200 LKM in Assam blocks and 8000 LKM in Kutch blocks.Employee at Cairn Oil & Gas
Employee at Cairn Oil & Gas

INTEGRATED REPORT
06-115MANAGEMENT REVIEW
116-167STATUTORY REPORTS
168-270FINANCIAL STATEMENTS
271-502
32 VEDANTA LIMITED INTEGRATED REPORT AND ANNUAL ACCOUNTS 2019-20 VEDANTA LIMITED INTEGRATED REPORT AND ANNUAL ACCOUNTS 2019-20 33
GROWING
WITH RESOURCES AND RELATIONSHIPS
VALUE-CREATION MODEL
FINANCIAL CAPITALWe are focused on optimising capital allocation and maintaining a strong balance sheet while generating strong free cash flows. We also review all investments, taking into account the Group’s financial resources with a view to maximising returns to shareholders.
MANUFACTURED CAPITALWe invest in best-in-class equipment and machinery to ensure we operate as efficiently and safely as possible, both at our current operations and in our expansion projects. This also supports our strong and sustainable cash flow generation.
INTELLECTUAL CAPITALAs a relatively young Company, we are keen to embrace technological developments and encourage innovation. We encourage our people to nurture and implement innovative ideas, which will lead to operational improvements across our operations.
HUMAN CAPITALWe have employees drawn from across the world, and their diverse skills and experience contribute to our operations. The mining and plant operations require specialised skills for which we employ qualified technical, engineering and geology experts. In addition, we create a culture which nurtures safety, innovation, creativity and diversity, which helps us to meet our business goals while also enabling our employees to grow personally and professionally.
SOCIAL & RELATIONSHIP CAPITALWe aim to forge strong partnerships by engaging with our key stakeholders, including shareholders and lenders, suppliers and contractors, employees, governments, communities and civil societies. These relationships help maintain and strengthen our licence to operate.
NATURAL CAPITALIndia and Africa have favourable geology and mineral potential. These regions provide us with world-class mining assets and extensive R&R. Additionally, operating our mines requires a range of resources including water and energy which we aim to use prudently and sustainably.
CREATIng VAluE FoR ouR sTAkEholDERs:
Plant at Deeps - Black Mountain Mine
Governments Generating economic value for the society and delivering sustainable growth
Communities Investment in health, education and local businesses
Shareholders A return on investment
Employees A safe and inclusive working environment
Suppliers, customers and service providers Building long-term partnerships

INTEGRATED REPORT
06-115MANAGEMENT REVIEW
116-167STATUTORY REPORTS
168-270FINANCIAL STATEMENTS
271-502
34 VEDANTA LIMITED INTEGRATED REPORT AND ANNUAL ACCOUNTS 2019-20 VEDANTA LIMITED INTEGRATED REPORT AND ANNUAL ACCOUNTS 2019-20 35
INPUTS
Equity₹372 crore
Community investment`296 crore
Employees including contractors79,378
Technology updates
Number of hours of training~548,952
Plant and equipment (in value terms) ₹107,489 crore
Retained earnings`54,263 crore
Independent Directors5
Geologists including contractors386
Safety training hours 1.55 million
HSE employees including contractors1,709
Best-in-class corporate governance practices
Highest quality safety practices
Gross debt₹59,187 crore
Rated by two domesticrating agencies CRISIL and India Ratings
Capital Work in Progress (CWIP)₹16,837 crore
Cash and cash equivalents₹37,914 crore
Capex₹6,385 crore
Net worth₹71,748 crore
Strong network of global and domestic relationship banks 25
Our value-creation model is aimed at delivering the optimum value for all our stakeholders, in various means and forms.
FINANCIAL CAPITAL
SOCIAL & RELATIONSHIP CAPITAL
R&R - Zinc India403 million tonnes, containing 31.8 million tonnes of zinc-lead metal and 898 million ounces of silver
R&R – O&G1,194 mmboe gross proved and probable reserves and resources
R&R - Zinc International 509.4 million tonnes, containing 26.6 million tonnes of metal
Energy consumption 531 million GJ
Water consumed 255 million m3
Coal used 25 million tonnes
NATURAL CAPITAL
HUMAN AND INTELLECTUAL CAPITAL
MANUFACTURED CAPITAL
O&G � World’s largest Enhanced
Oil Recovery (EOR) polymer flood project in Mangala field � New-age technology of
High Density Multi Stage Fracturing in horizontal transverse wells - first in India
Zinc International � Smart Ore is a digital
concept providing end-to-end solutions for mine performance and mine condition
Zinc India � Autonomous machines
for 24x7 mining at SK mine and remote controlled LHD (Load, Haul, Dump) for ore hauling
Aluminium � Parameters defined
for Category A pots based on power consumption, Fe content
An evening at Cairn Oil & Gas, Barmer
Turnover ₹83,545 crore
Attributable PAT (before exceptional items): ₹3,995 crore
FCF post-capex ₹7,130 crore
EBITDA ₹21,061 crore
Earnings per share (EPS) (before exceptional items): ₹10.79 /share
RoCE ~11%
Total exchequer contribution ₹32,400 crore
Dividends paid ₹3.9 per share
Net Debt to EBITDA 1.0x
Production across various businesses
Lost Time Injury Frequency Rate (LTIFR) 0.67
CSR Programme Beneficiaries C.3.26 million
Contribution to the exchequer ₹32,400 crore
Water recycled 29%Fly ash utilisation rate 105.6%
Attrition rate 7.4%
Diversity ratio 10.9%
Zinc India: Zinc: ~1.2 mtpa Silver: 610 tonnesZinc International: Scorpion and BMM: > 133 ktGamsberg: 108 kt
Oil & Gas: Gross volume: 174 kboepdAluminium: Alumina: 1.8 mtpa Aluminium: 1.9 mtpaCopper: 77 kt
Power 11.2 billion kWhPig Iron 681 ktSteel 1.2 MnT
ACTIVITIES OUTCOMES
FINANCIAL CAPITAL
MANUFACTURING CAPITAL
HUMAN AND INTELLECTUAL CAPITAL
SOCIAL & RELATIONSHIP CAPITAL
NATURAL CAPITAL
We operate across the mining value chain focusing on long-term and low-cost assets in India and Africa
EXPLORE We invest selectively in exploration and appraisal to extend mine and reservoir life.
DEVELOP We develop world-class assets, using the latest technology to optimise productivity.
EXTRACT We operate low-cost mines and oil fields, with a clear focus on safety and efficiency.
PROCESS We focus on operational excellence and high asset utilisation to deliver top quartile cost performance and strong cash flow.
MARKET We supply our commodities to customers in a wide range of industry sectors, from automotive to construction, from energy to consumer goods.
RESTORE We manage our long-life assets as effectively as possible and return them to a natural state at the end of their useful life.
Operational Nand Ghars 1,302Youth benefited from Employment based skills training 3,600+
Interim dividends paid `1,450 crore
Nand Ghars built 1,302
Water savings 2.99 million m3
GHG emitted 59 Mn tCO2e
High Volume, Low Effect Waste Recycled: 88%Refer to Page 80
VALUE-CREATION MODEL CONTINUED...

INTEGRATED REPORT
06-115MANAGEMENT REVIEW
116-167STATUTORY REPORTS
168-270FINANCIAL STATEMENTS
271-502
36 VEDANTA LIMITED INTEGRATED REPORT AND ANNUAL ACCOUNTS 2019-20 VEDANTA LIMITED INTEGRATED REPORT AND ANNUAL ACCOUNTS 2019-20 37
STRATEGIC PRIORITY
STRATEGIC PRIORITY
STRATEGIC PRIORITY
DESCRIPTION
DESCRIPTION
DESCRIPTION
RISKS
RISKS
RISKS
COMMITMENT TO THE LARGER PURPOSE WITH FOCUS ON woRlD-ClAss Esg PERFORMANCE
AUGMENT OUR RESERVES & REsouRCEs (R&R) BASE
DELIVERING ON GROWTH OPPORTUNITIES
We operate as a responsible business, focusing on achieving ‘zero harm, zero discharge and zero wastage’, and thus minimising our environmental impact. We promote social inclusion across our operations to promote inclusive growth. We establish management systems and processes in place to ensure our operations create sustainable value for all our stakeholders.
We look at ways to expand our R&R base through targeted and disciplined exploration programmes. Our exploration teams aim to discover mineral and oil deposits in a safe and responsible way, to replenish the resources that support our future growth.
We are focused on growing our operations organically by developing brownfield opportunities in our existing portfolio. Our large, well-diversified, low-cost and long-life asset portfolio offers us attractive expansion opportunities, which are evaluated based on our return criteria for long-term value creation for all stakeholders.
� Health, Safety and Environment (HSE) � Tailings dam stability � Managing relationship with stakeholders � Regulatory and legal risk
� Total 2P+2C R&R in O&G � Total R&R in Zinc India
and Zinc International
� Revenue � ROCE � FCF post-capex � Growth capex
� HSE � Discovery risk � Regulatory and legal risk
� Major project delivery � Cairn related challenges � Regulatory and legal risk
KPIs
KPIs
KPIs
� LTIFR � CSR footprint � Carbon Footprint � Gender diversity
PROGRESSING ON OUR GROWTH PATH
STRATEGIC FRAMEWORK
FY2020 UPDATE
FY2020 UPDATE
FY2020 UPDATE
� Seven fatalities occurred in the financial year; consequent commitment to increase oversight from Group Executive Committee (ExCo) to prevent future occurrences � Average Score of 72.5% achieved in ten safety
performance standards � LTIFR reported at 0.67 � Achieved water savings of 2.99 million cubic metres
(Target: 2.5 million cubic meters) � c.13.83% reduction in GHG intensity over baseline of 2012 � Achieved energy saving of 1.92 million GJ � Third-party review of tailings/ash dyke management
system and development of specific improvement plan (India operations)
Zinc India � During the year, gross additions of 14.6 million tonnes
were made to R&R, prior to depletion of 14.5 million tonnes � Combined R&R were estimated to be 403 million
tonnes, containing 31.8 million tonnes of zinc-lead metal and 898 million ounces of silver � Overall mine life continues to be more than 20 years
Zinc International � During the year, gross additions of 75.4 million tonnes
of ore and 4 million tonnes of metal were made to reserves and resources (R&R), after depletion
Oil & Gas � Early gas production facility fully commissioned with
ramped up volumes to ~127 mmscfd � Won 10 exploratory blocks in OALP II & III � To deliver the capex project, 235 wells have been
drilled and 75 wells hooked up till FY2020
� c.105% of generated fly ash is being utilised. � Baseline surveys conducted across Group, BU plans
aligned with findings/recommendation � 1,302 Nand Ghars constructed � ’Passion to serve’ - employee volunteering online
platform launched in August 2019. � A standard online community grievance record/
redressal software (NIVARAN) established across the group. � 100% new hires trained on Code of Conduct � 20% female representation on the Comapny FY2020 Board � 8.7% improvement in our campus female hiring
programme � Sustainability Committee constituted
� Combined mineral resources and ore reserves estimated at 509.4 million tonnes, containing 26.6 million tonnes of metal � The R&R support a mine life of more than
three decadesOil & Gas � Upside potential of ~5.5 billion boe of resource
across a total of 51 blocks with the addition of 10 new blocks in OLAP II & III
� The addition of 10 blocks catapults us to become one of the largest private acreage holders in India, with a tenfold jump in acreage from its existing/ producing blocks of ~6,000 sq km to ~65,000 sq km across its total 58 blocks
Aerial shot of the alumina refinery at Lanjigarh

INTEGRATED REPORT
06-115MANAGEMENT REVIEW
116-167STATUTORY REPORTS
168-270FINANCIAL STATEMENTS
271-502
38 VEDANTA LIMITED INTEGRATED REPORT AND ANNUAL ACCOUNTS 2019-20 VEDANTA LIMITED INTEGRATED REPORT AND ANNUAL ACCOUNTS 2019-20 39
DESCRIPTION
RISKS
OPTIMISE CAPITAL ALLOCATION AND MAINTAIN STRONG BALANCE SHEET
Our focus is on generating strong business cash flows and maintaining strict capital discipline in investing in profitable high IRR projects. Our aim is to maintain a strong balance sheet through proactive liability management. We also review all investments (organic and acquisitions) based on our strict capital allocation framework, with a view to maximising returns for shareholders.
� Access to capital � Fluctuation in commodity prices (including oil)
and currency exchange rates � Regulatory and legal risk � Tax related matters
KPIs � FCF post-capex � Net Debt/EBITDA (Consol) � EPS (before exceptional items) � Interest cover ratio � Dividend
DESCRIPTION
RISKS
OPERATIONAL EXCELLENCE
We strive for all-round operational excellence to achieve benchmark performance across our business, by debottlenecking our assets to enhance production, supported by improved digital and technology solutions. Our efforts are focused on enhancing profitability by optimising our cost and improving realisation through the right marketing strategies.
� EBITDA � Adj. EBITDA margin � FCF post-capex � ROCE
� Fluctuation in commodity prices (including oil) and currency exchange rates � HSE � Tailings dam stability � Loss of assets or profit due to natural calamities
KPIs
Employee at Aluminum plant
STRATEGIC PRIORITY
STRATEGIC PRIORITY
FY2020 UPDATE
� FCF reduced from 11,553 INR crore to 7,130 INR crore, down 38% y-o-y � Net debt decreased from ₹26,956 crore to ₹21,273 crore � Net Debt/EBITDA at 1.0x on a consolidated basis. � Dividend worth c.₹1,450 crore, ₹3.90/share distributed
in VEDL
FY2020 UPDATE
Zinc India � Record ore production of 14.5 million tonnes despite
disruptions on account of COVID-19 � Mined metal production of 917 kt and refined zinc-lead
production of 870 kt Zinc International � Cost of production at US$1,665/t, down 13% y-o-y � Increase in Gamsberg production volume from 17 kt in
FY2019 to 108 kt in FY2020 � During FY2020, total production stood at 240 kt, 63%
higher y-o-y. This was primarily due to ramp up of first phase of Gamsberg expansion planOil & Gas � Development rigs as on March 2020, with 136 wells
drilled and 41 wells hooked up during the year. � Two new wells hooked up in Ravva block adding
~10 kboepd of incremental volumes � Gas production for Rajasthan block increased by 122%
to 79 mmscfd as early production facility fully commissioned with ramped up volumes to ~127 mmscfd � Implemented largest Full Tensor Gravity Gradiometry™
(FTG) airborne survey in India covering an area of 1,200 LKM in Assam blocks and 8000 LKM in Kutch blocks. � Satellite-based Sub-Terrain prospecting (STeP®)
applied in Assam, which includes eight remote sensing and computational technologies covering an area of 3,650 sq km � Seismic acquisition programme commenced in Assam
and Kutch; 1,100 sq km in Kutch and 120 sq km, 265 LKM completed in Assam. � Production Sharing Contracts (PSC) signed for Ravva
block extended for 10 years
Aluminium & Power � India’s highest aluminium production at 1,904 kt � Record alumina production from Lanjigarh refinery
at 1,811 kt, up 21% y-o-y, through continued debottlenecking � Q4FY2020 Lanjigarh cost of production lowest
quarterly ever at 258 $/T � Q4FY2020 hot metal cost of production significantly
lower at US$ 1,451 per tonne, 20% lower y-o-y � CoP of alumina improved to US$ 275 per tonne, due
to benefits from increase in locally sourced bauxite, continued debottlenecking, improved plant operating parameters and rupee depreciation � Record PAF of 91% at the 1,980MW TSPL plant in
FY2020Steel � Cost decreased by 9% y-o-y from 457 $/T to 418 $/T
in FY2020 � Healthy margin of ~127 $/T during the last quarter
Copper and Iron Ore � Production of saleable ore at Karnataka at 4.4 million
tonnes, up 6% y-o-y � Iron Ore sales at Karnataka at 5.8 million tonnes, up
125% higher y-o-y due to an increase in production and stock liquidation at Karnataka by 1.4 MT. � Production of pig iron decreased by 1% to 681,000
tonnes in FY2020, mainly due to improved coke availability during the year and other operational efficiencies. � Continued engagement with the government and
local communities to restart operations at Goa and Tuticorin
STRATEGIC FRAMEWORK CONTINUED...

INTEGRATED REPORT
06-115MANAGEMENT REVIEW
116-167STATUTORY REPORTS
168-270FINANCIAL STATEMENTS
271-502
40 VEDANTA LIMITED INTEGRATED REPORT AND ANNUAL ACCOUNTS 2019-20 VEDANTA LIMITED INTEGRATED REPORT AND ANNUAL ACCOUNTS 2019-20 41
EBITDA (`cr)
INVENTORY TURNOVER RATIO
FCF posT-CApEx (`cr)
CURRENT RATIO
Description: Earnings before interest, tax, depreciation and amortisation (EBITDA) is a factor of volume, prices and cost of production. This measure is calculated by adjusting operating profit for special items and adding depreciation and amortisation.Commentary: EBITDA for FY2020 was at ₹21,061 crore, 12% lower y-o-y. This was mainly on account of subdued commodity prices, lower volume and higher cost at Zinc India and Oil & Gas business partially offset by higher volume at Aluminium business, additional volumes from Gamsberg operations, higher sales at Iron Ore Karnataka and the steel business, easing out of input commodity inflation, improved cost of production at Aluminium business, past exploration cost recovery at Oil & Gas business and rupee depreciation.
Description: The inventory turnover ratio is an efficiency ratio that shows how effectively inventory is managed. This is calculated as a ratio of cost of goods sold to average inventory.Commentary: The inventory turnover ratio for the Company was at 5.1 times in FY2020 as compared to 5.3 times in FY2019.
Description: This represents net cash flow from operations after investing in growth projects. This measure ensures that profit generated by our assets is reflected by cash flow, in order to de-lever or maintain future growth and shareholder returns.Commentary: We generated FCF of ₹7,130 crore in FY2020 (FY2019: ₹11,553 crore) driven by lower EBITDA primarily on account of lower commodity prices and working capital blockage due to COVID-19 impact partially offset by continued focus on cost savings, disciplined capex outflow and lower tax outflow.
Description: The current ratio is a liquidity ratio that measures a Company’s ability to pay short-term obligations or those due within one year. This is calculated as a ratio of Current Assets to Current Liabilities.Commentary: The current ratio of the Company increased to 0.9 times in FY2020 in comparison to 0.8 in FY2019.
7,880
0.8
24,900
6.2
24,012 21,061
5.3 5.1
11,553
7,130
0.8 0.9
FY 18
FY 18
FY 18
FY 18
FY 19
FY 19
FY 19
FY 19
GROWTH METRICSREVENUE (`cr)
Description: Revenue represents the value of goods sold and services provided to third parties during the year.Commentary: FY2020, consolidated revenue was at ₹83,545 crore compared with ₹90,901 crore in FY2019. This was driven by subdued commodity prices, lower volume at Zinc India and Oil & Gas businesses and lower power sales at TSPL, partially offset by higher volume at the Aluminum business, additional volumes from Gamsberg operations, higher sales at Iron Ore Karnataka & Electrosteel and rupee depreciation.
92,011 90,901 83,545
FY 18 FY 19 FY 20
OTHER KEY FINANCIAL RATIOSDEBTORS TURNOVER RATIO*
Description: The debtors’ turnover ratio is an accounting measure used to quantify a company’s effectiveness in collecting its receivables. This is calculated as a ratio of revenue from operation to average trade receivables.Commentary: The reduction in debtors’ turnover is mainly on account of decrease in revenue due to subdued commodity prices, lower volume at Oil & Gas business partially offset by rupee depreciation and past exploration cost recovery at Oil & Gas business.*Excluding power business
65.533.6 30.5
FY 18 FY 19 FY 20
FY 20
FY 20
FY 20
FY 20
PERFORMING TO DELIVER ATTRACTIVE RETURNS
KEY PERFORMANCE INDICATORS
RETURN ON CAPITAL EmployED (RoCE) (%)
DEBT EQUITY RATIO
ADJUSTED EBITDA MARGIN (%)
OPERATING PROFIT MARGIN
NET DEBT/EBITDA (consolidated)
NET PROFIT MARGIN
Description: This is calculated on the basis of operating profit, before special items and net of tax outflow, as a ratio of average capital employed. The objective is to earn a post-tax return consistently above the weighted average cost of capital. Commentary: ROCE down driven by lower EBIT, partially offset by lower tax outflow.
Description: It is a financial ratio indicating the relative proportion of shareholders’ equity and debt used to finance a Company’s assets. This is calculated as a ratio of total external borrowing to total equity (share capital + reserves + minority). Commentary: The ratio has decreased to 0.8 times in FY2020 primarily because of decrease in gross debt due to the repayment of debt at Vedanta Standalone, TSPL and temporary borrowing at Zinc India partially offset by increase in borrowing at Oil & Gas business.
Description: Calculated as EBITDA margin excluding EBITDA and turnover from custom smelting of Copper India and Zinc India businesses.Commentary: Adjusted EBITDA margin for FY2020 was 29% (FY2019: 30%).
Description: Operating profit margin is a profitability or performance ratio used to calculate the percentage of profit a Company produces from its operations. This is calculated as a ratio of operating profit (EBITDA less depreciation) to revenue from operations.Commentary: The operating profit margin was lower by 3% in FY2020 as compared to FY2019, primarily due to lower EBITDA on account of subdued commodity prices and increase in depreciation in the current year.
Description: This ratio represents the level of leverage of the Company. It represents the strength of the balance sheet of Vedanta Limited. Net debt is calculated in the manner as defined in Note 19(d) of the consolidated financial statements.Commentary: Net debt/EBITDA ratio as on 31 March 2020 was at 1.0x, compared to 1.1x as on 31 March 2019, primarily due to the repayment of debt partially offset by working capital blockage due to COVID-19 and dividend payment during the year.
Description: It is a measure of the profitability of the Company. This is calculated as a ratio of net profit (before exceptional items) to revenue from operations.Commentary: The net profit margin was lower in FY2020 as compared to FY2019 primarily due to lower EBITDA, higher net interest and increase in depreciation expense during the year partially offset by lower tax outflow during the year
INTEREST COVER
RETURN ON NET woRTh (Ronw)
Description: The ratio is a representation of the ability of the Company to service its debt. It is computed as a ratio of EBITDA divided by gross finance costs (including capitalised interest) less investment revenue, excluding grant income and other non-operating income.Commentary: The interest cover for the Company was at ~5.6 times, lower y-o-y on account of lower EBITDA and higher net finance costs due to decrease in interest income partially offset by reduction in finance cost on account of decrease in average borrowing due to repayment of debt and lower borrowing cost.
Description: It is a measure of the profitability of the Company. This is calculated as a ratio of net profit (before exceptional items) to average net worth (share capital + reserves + minority).Commentary: The return on net worth has decreased during the year. This was mainly on account of lower EBITDA, higher net interest and increase in depreciation expense during the year partially offset by lower tax outflow during the year.
35%
20%
30% 29%
17% 14%
0.9 1.0 10.0
15%
1.17.8
5.6
12%8%
12% 10%7%
16.9%
0.7
12.8% 11.2%
0.9 0.8
FY 18
FY 18
FY 18
FY 18
FY 18
FY 18
FY 18
FY 18
FY 19
FY 19
FY 19
FY 19
FY 19
FY 19
FY 19
FY 19
FY 20
FY 20
FY 20
FY 20
FY 20
FY 20
FY 20
FY 20

INTEGRATED REPORT
06-115MANAGEMENT REVIEW
116-167STATUTORY REPORTS
168-270FINANCIAL STATEMENTS
271-502
42 VEDANTA LIMITED INTEGRATED REPORT AND ANNUAL ACCOUNTS 2019-20 VEDANTA LIMITED INTEGRATED REPORT AND ANNUAL ACCOUNTS 2019-20 43
EPS (before exceptional items and DDT) (`)
DIVIDEND (` per Share)
Description: This represents the net profit attributable to equity shareholders and is stated before exceptional items (net of tax and minority interest impacts).Commentary: In FY2020, EPS before exceptional items was at ₹10.79 per share. This was mainly on account of lower attributable PAT.
Description: Dividend per share is the total of the final dividend recommended by the Board in relation to the year, and the interim dividend paid out during the year.Commentary: The Board has recommended a total interim dividend of ₹3.90 per share this year compared with ₹18.85 per share in the previous year.
21.2021.9618.50
10.79
18.85
3.90
FY 18 FY 18FY 19 FY 19FY 20 FY 20
Zinc International (million mt) Oil & Gas (mmboe)
Zinc International: During the year, gross additions of 75.40 million tonnes were made to R&R after depletion. The R&R support a mine life of more than 30 years.
oil & gas: During FY2020, the gross proven and probable R&R were depleted by 1 mmboe primarily due to production during the year.
304
1,263434 1,195 1,194509
FY 18 FY 18FY 19 FY 19
LONG-TERM VALUEGROWTH CAPEX (`cr)
Description: This represents the amount invested in our organic growth programme during the year.Commentary: Our stated strategy is of disciplined capital allocation on high-return, low-risk projects. Expansion capital expenditure during the year stood at ₹6,385 crore, with the majority invested in projects at Zinc India, growth projects at Oil & Gas and ramping up our aluminium capacities.
5,4697,764
6,385
FY 18 FY 19 FY 20
REsERVEs AnD REsouRCEs (R&R)
Description: Reserves and resources are based on specified guidelines for each commodity and region.
Commentary: Zinc India: During the year, gross additions of 14.6 million tonnes were made to R&R prior to depletion of 14.5 million tonnes. At current mining rates, the R&R underpins metal production for more than 20 year.
Zinc India (million mt)
411 403 403
FY 18 FY 19 FY 20 FY 20 FY 20
GENDER DIVERSITY(%)
CSR FOOTPRINT (million beneficiaries)
Description: The percentage of women in the total permanent workforce.Commentary: : We provide equal opportunities to men and women. During the year, the proportion of female employees was 10.9% of total employees.
Description: The total number of beneficiaries through our community development programmes across all our operations.Commentary: We benefited c.3.26 million people this year through our community development projects comprising community health, nutrition, education, water and sanitation, sustainable livelihood, women empowerment and bio-investment.
3.4 3.2610.6% 10.5%10.9%
3.0
FY 18 FY 18FY 19 FY 19
SUSTAINABLE DEVELOPMENTLTIFR
Description: The lost time injury frequency rate (LTIFR) is the number of lost-time injuries per million man-hours worked. This includes our employees and contractors working in our operations and projects.Commentary: This year the LTIFR was 0.67. The increase is due to improved reporting of LTIs across the organisation. Safety remains the key focus across businesses.
0.35 0.46
0.67
FY 18 FY 19 FY 20 FY 20 FY 20
Encouraging diversity in talent
KEY PERFORMANCE INDICATORS CONTINUED...

INTEGRATED REPORT
06-115MANAGEMENT REVIEW
116-167STATUTORY REPORTS
168-270FINANCIAL STATEMENTS
271-502
44 VEDANTA LIMITED INTEGRATED REPORT AND ANNUAL ACCOUNTS 2019-20 VEDANTA LIMITED INTEGRATED REPORT AND ANNUAL ACCOUNTS 2019-20 45
BUSINESS RISKS
ENTERPRISE RISK MANAGEMENT As a global natural resources company, our businesses are exposed to a variety of risks. It is therefore essential to have in place the necessary systems and a robust governance framework to manage risk, while balancing the risk-reward equation expected by stakeholders.
Our risk management framework is designed to be simple and consistent and provide clarity on managing and reporting risks to our Board. Together, our management systems, organisational structures, processes, standards and code of conduct and ethics form the system of internal control that governs how the Group conducts its business and manages the associated risks.
The Board has the ultimate responsibility for the management of risks and for ensuring the effectiveness of internal control systems. The Board’s review includes the Audit Committee’s report on the risk matrix, significant risks, and the mitigating actions we have put in place. Any weaknesses identified by the review are addressed by enhanced procedures to strengthen the relevant controls, and these are reviewed at regular intervals.
The Audit Committee is in turn assisted by the Group-level Risk Management Committee in evaluating the design and effectiveness of the risk mitigation programme and control systems.
The Group Risk Management Committee (GRMC) meets every quarter and comprises the Group Chief Executive Officer, Group Chief Financial Officer, Non-Executive Director and Director-Management Assurance. The Group Head-Health, Safety, Environment & Sustainability is invited to attend these meetings. GRMC discusses key events impacting the risk profile, key risks and uncertainties, emerging risks and progress against planned actions.
RISK GOVERNANCE FRAMEWORK
EXTERNAL
FINANCIAL
STRATEGIC
OPERATIONAL
GROUP RISK MANAGEMENT FRAMEWORK
BOARD OF DIRECTORS
AUDIT COMMITTEE
BUSINESS UNIT MANAGEMENT TEAMS
GROUP RISK MANAGEMENT
CommITTEE (gRmC)
EXECUTIVE COMMITTEE
(ExCo)
IDEN
TIFY
EVALUATE MITIG
ATE
MONITOR
In addition to the above structure, other key risk governance and oversight committees in the Group include the following: � Finance Standing Committee (FSC)
comprises Group CEO, Group CFO and Non-Executive Director and it supports the Board by considering and approving matters related to finance, investment, banking, treasury, etc. Invitees to these committee meetings are the business CFOs, Group Head Treasury and BU Treasury Heads. In addition to this, the Investment Committee reviews the investment related risks � Sustainability Committee reviews
sustainability related risks � Group Project/Capex Council
evaluates risks while reviewing any capital investment decisions as well as works on instituting risk management framework in projects
In addition to the above, there are various group-level councils such as Procurement Council, Tax Council, HSE Council, Insurance Council, CSR Committee, etc. that work on identifying risks in those specific areas and mitigating them. The Group has a consistently applied methodology for identifying risks at the individual business level for existing operations and for ongoing projects.
At a business level, formal discussions on risk management occur at review meetings at least once a quarter. The respective businesses review their major risks, and changes in their nature and extent since the last assessment and discuss the control measures which are in place and further action plans. The control measures stated in the risk matrix are also periodically reviewed by the business management teams to verify their continued effectiveness. These meetings are chaired by the respective business CEOs and attended by CXOs, senior management and appropriate functional heads.
Risk officers have been formally nominated at each of the operating businesses as well as at Group level,
whose role is to create awareness of risks at senior management level and to develop and nurture a risk management culture. Risk mitigation plans form an integral part of the performance management process. Structured discussions on risk management also happen at business level with regard to their respective risk matrix and mitigation plans. The leadership teams of the businesses are accountable for governance of the risk management framework and they provide regular updates to the GRMC.
Each of our businesses have developed their own respective risk matrix, which is reviewed by their respective management committee/executive committee, chaired by their CEOs. In addition, each business has developed its own risk register depending on the size of its operations and number of Strategic Business Units locations. Risks across these risk registers are aggregated and evaluated and the Group’s principal risks are identified based on the frequency, and potential magnitude and impact of the risks identified.
This element is an important component of the overall internal control process, from which the Board obtains assurance. The scope of work, authority and resources of Management Assurance Services (MAS) are regularly reviewed by the Audit Committee. The responsibilities of MAS include recommending improvements in the control environment and reviewing compliance with our philosophy, policies and procedures.
The planning of internal audits is approached from a risk perspective. In preparing the internal audit plan, reference is made to the risk matrix, and inputs are sought from senior management, business teams and members of the Audit Committee. In
addition, we make reference to past audit experience, financial analysis and the current economic and business environment.
The year 2020 has seen the outbreak of COVID-19 (coronavirus) pandemic. As a result of COVID-19, we have seen macro-economic uncertainty with regards to prices and demand for commodities and oil & gas. Furthermore, recent global developments and uncertainty in oil supply in March have caused further volatility in commodity markets. The scale and duration of these developments remain uncertain but could impact earnings and cash flow of resource companies.
The order in which these risks appear in the section below does not necessarily reflect the likelihood of their occurrence or the relative magnitude of their impact on our business. The risk direction of each risk has been reviewed based on events, economic conditions, changes in business environment and regulatory changes during the year. While Vedanta’s risk management framework is designed to help the organisation meet its objectives, there can be no guarantee that the Group’s risk management activities will mitigate or prevent these or other risks from occurring.
We proactively work to minimise our risks by accepting and eliminating them while identifying and taking advantage of opportunities. Our strategic priorities and strong opportunity management culture give us a competitive edge in spotting opportunities and making the best of them.

INTEGRATED REPORT
06-115MANAGEMENT REVIEW
116-167STATUTORY REPORTS
168-270FINANCIAL STATEMENTS
271-502
46 VEDANTA LIMITED INTEGRATED REPORT AND ANNUAL ACCOUNTS 2019-20 VEDANTA LIMITED INTEGRATED REPORT AND ANNUAL ACCOUNTS 2019-20 47
The Board, with the assistance of management, carries out periodic and robust assessments of the principal risks and uncertainties of the Group and tests the financial plans for each of risks and uncertainties mentioned below.
SUSTAINABILITY RISKS
Impact Mitigation Risk Direction
Health, safety and environ-ment (HSE)The resources sector is subject to extensive health, safety and environmental laws, regulations and standards. Evolving requirements and stakeholder expectations could result in increased cost or litigation or threaten the viability of operations in extreme cases.
Emissions and climate change Our global presence exposes us to a number of jurisdictions in which regulations or laws have been, or are being, considered to limit or reduce emissions. The likely effect of these changes could be to increase the cost for fossil fuels, impose levies for emissions in excess of certain permitted levels, and increase administrative costs for monitoring and reporting. Increasing regulation of greenhouse gas (GHG) emissions, including the progressive introduction of carbon emissions trading mechanisms and tighter emission reduction targets, is likely to raise costs and reduce demand growth.
� HSE is a high priority area for Vedanta. Compliance with international and local regulations and standards, protecting our people, communities and the environment from harm and our operations from business interruptions are key focus areas
� Policies and standards are in place to mitigate and minimise any HSE- related occurrences. Safety standards issued/continue to be issued to reduce risk level in high risk areas. Structured monitoring and a review mechanism and system of positive compliance reporting are in place
� BU Leadership continues to emphasise on three focus areas i.e. Visible Felt Leadership, safety critical tasks and managing business partners
� The process to improve learning from incidents is currently being improved with the aim of reducing re-occurrence of similar incidents
� A Vedanta Critical Risk Management programme has been launched to identify critical risk controls and to measure, monitor and report the control effectiveness
� The Company has implemented a set of standards to align its sustainability framework with international practice. A structured sustainability assurance programme continues to operate in the business divisions covering environment, health, safety, community relations and human rights aspects, and is designed to embed our commitment at operational level
� All businesses have appropriate policies in place for occupational health-related matters, supported by structured processes, controls and technology
� To provide incentives for safe behaviour and effective risk management, safety KPIs have been built into performance management of all employees
� Carbon forum has been re-constituted with updated Terms of Reference and representation from all businesses. It has a mandate to develop and recommend to the ExCo and Board the carbon agenda for the Group
� The Group Companies are actively working on reducing the GHG Emissions Intensity of our operations
� A task force team is formulated to assess end-to-end operational requirement for FGD plant. We continue to engage with various stakeholders on the matter
Community involvement programme
SUSTAINABILITY RISKS
Impact Mitigation Risk Direction
Managing relationship with stakeholdersThe continued success of our existing operations and future projects are in part dependent on broad support and a healthy relationship with our respective local communities. Failure to identify and manage local concerns and expectations can have a negative impact on relations and therefore affect the organisation’s reputation and social licence to operate and grow.
� CSR approach to community programmes is governed by the following key considerations: the needs of the local people and the development plan in line with the new Companies Act in India; CSR guidelines; CSR National Voluntary Guidelines of theMinistry of Corporate Affairs, Government of India; and the UN’s sustainable development goals
� Our BU teams are proactively engaging with communities and stakeholders through a proper and structured engagement plan, with the objective of working with them as partners
� Business ExCos factor in these inputs, and then decide upon focus areas of CSR and budgets while also aligning with strategic business priorities
� All BUs follow well-laid processes for recording and resolving all community grievances
� Every business has a dedicated Community Development Manager, who is a part of the BU ExCos. They are supported with dedicated teams of community professionals
� Our business leadership teams have periodic engagements with the local communities to build relations based on trust and mutual benefit. Our businesses seek to identify and minimise any potentially negative operational impacts and risks through responsible behaviour - acting transparently and ethically, promoting dialogue and complying with commitments to stakeholders
� Stakeholder engagement is driven basis stakeholder engagement plan at each BUs by CSR and cross functional teams. Regular social and environment risk assessment discussions are happening at BU level
� Strategic CSR communication is being worked upon for visibility. Efforts continue to meet with key stakeholders, showcase our state-of- the-art technology, increase the organic followers and enhance engagement through social media
� CSR communication and engagement with all stakeholders – within and outside communities
Tailings dam stabilityA release of waste material leading to loss of life, injuries, environmental damage, reputational damage, financial costs and production impacts. A tailings dam failure is considered to be a catastrophic risk – i.e. a very high severity but very low frequency event that must be given the highest priority.
� The Risk Management Committee included tailings dams on the Group Risk Register with a requirement for annual internal review and three- yearly external review
� Operation of tailings dams is executed by suitably experienced personnel within the businesses
� Third party has been engaged to review tailings dam operations, including improvement opportunities/remedial works required and the application of Operational Maintenance and Surveillance (OMS) manuals in all operations. This is an oversight role in addition to technical design and guidance arranged by respective business units. Technical guidelines are also being developed
� Vedanta Tailings Management Standard has been reviewed, augmented and reissued including an annual, independent review of every dam and half-yearly CEO sign-off that dams continue to be managed within design parameters and in accordance with the last surveillance audit. Move towards dry tailings facilities has commenced
� Those responsible for dam management received training from third party and will receive ongoing support and coaching from international consultants
� Management standard implemented with business involvement
� BU’s are expected to ensure ongoing management of all tailings facilities with ExCo oversight with independent third-partyassessment on Golder recommendations implementation status y-o-y
� Tailing management standard is updated to include latest best practices in tailing management. United Nations Environment Programme (UNEP)/ International Council on Mining & Metals (ICMM) Global Tailings Standard to be incorporated into Vedanta Standard during FY2021
BUSINESS RISKS CONTINUED...

INTEGRATED REPORT
06-115MANAGEMENT REVIEW
116-167STATUTORY REPORTS
168-270FINANCIAL STATEMENTS
271-502
48 VEDANTA LIMITED INTEGRATED REPORT AND ANNUAL ACCOUNTS 2019-20 VEDANTA LIMITED INTEGRATED REPORT AND ANNUAL ACCOUNTS 2019-20 49
OPERATIONAL RISKS
Impact Mitigation Risk Direction
Challenges in Aluminium and Power businessOur projects have been completed and may be subject to a number of challenges during operationalisation phase. These may also include challenges around sourcing raw materials and infrastructure-related aspects and concerns around ash utilisation/evacuation.
� One of the impacts of the COVID-19 slowdown has been falling Aluminium London Metal Exchange (LME) prices, partly offset by lower alumina and carbon prices
� Continue to pursue new coal linkages to ensure coal security. Operations at Chotia coal mines also started. We have received the vesting orders for Jamkhani coal block for Jharsuguda and look forward to operationalising in FY2021
� Local sourcing of Bauxite and Alumina from Odisha
� Jharsuguda facilities have ramped up satisfactorily
� Project teams in place for Ash pond, Red mud, railway infrastructure and FGD
� Dedicated teams working towards addressing the issue of new emission norms for power plants
� Global technical experts have been inducted to strengthen operational excellence
� Continuous focus on plant operating efficiency improvement programme to achieve design parameters, manpower rationalisation, logistics and cost reduction initiatives
� Continuous augmentation of power security and infrastructure
� Strong management team continues to work towards sustainable low-cost of production, operational excellence and securing key raw material linkages
� Force majeure notice dated 29 March 2020 issued by Punjab State Power Corporation Limited to over 100 plants from which it buys electricity due to lower demand on account of COVID stating (a) not to declare capacity (b) delay in payments. Ministry of Power in its direction to Central Electricity Regulatory Commission have clearly mentioned that obligation to pay for the capacity charges as per the Power purchase agreement would continue Talwandi Saboo (TSPL) power plant matters are being addressed structurally by a competent team
Discovery riskIncreased production rates from our growth-oriented operations place demand on exploration and prospecting initiatives to replace R&R at a pace faster than depletion. A failure in our ability to discover new reserves, enhance existing reserves or develop new operations in sufficient quantities to maintain or grow the current level of our reserves could negatively affect our prospects. There are numerous uncertainties inherent in estimating ore and oil & gas reserves, and geological, technical, and economic assumptions that are valid at the time of estimation. These may change significantly when new information becomes available.
� Dedicated exploration cell with continuous focus on enhancing exploration capabilities
� Appropriate organisation and adequate financial allocation in place for exploration
� Strategic priority is to add to our R&R by extending resources at a faster rate than we deplete them, through continuous focus on drilling and exploration programme
� Exploration Executive Committee (Exco) has been established to develop and implement strategy and review projects group wide
� Continue to make applications for new exploration tenements in countries in which we operate under their respective legislative regimes.
� Exploration-related systems being strengthened, and standardised group wide and new technologies being utilised wherever appropriate
� International technical experts and agencies are working closely with our exploration teams to enhance our capabilities
OPERATIONAL RISKS CONTINUED
Impact Mitigation Risk Direction
Breaches in IT / cybersecurityLike many global organisations, our reliance on computers and network technology is increasing. These systems could be subject to security breaches resulting in theft, disclosure, or corruption of key/strategic information. Security breaches could also result in misappropriation of funds or disruptions to our business operations. A cybersecurity breach could have an impact on business operations.
� Group-level focus on formulating necessary frameworks, policies, and procedures in line with best practices and international standards
� Implementation and adoption of various best-in-class tools and technologies for information security to create a robust security posture
� Special focus to strengthen the security landscape of Plant Technical Systems (PTS) through various initiatives
� Adoption of various international standards relating to Information Security, Disaster Recovery & Business Continuity Management, IT Risk Management and setting up internal IT processes and practices in line with these standards
� Work towards ensuring strict adherence to the IT related SOPs so as to improve operating effectiveness and continuous focus for employees to go through mandatory cybersecurity awareness training
� Periodic assessment of entire IT systems landscapes and governance framework from vulnerability and penetration perspective through reputed expert agencies and addressing the identified observations in a time-bound manner
loss of assets or profit due to natural calamitiesOur operations may be subject to a number of circumstances not wholly within the Group’s control. These include damage to or breakdown of equipment or infrastructure, unexpected geological variations or technical issues, extreme weather conditions and natural disasters – any of which could adversely affect production and/or costs.
� Vedanta has taken appropriate group insurance cover to mitigate this risk
� An external agency reviews the risk portfolio and adequacy of this cover and assists us in our insurance portfolio
� Our underwriters are reputed institutions and have capacity to underwrite our risk
� Established mechanism of periodic insurance review in place at all entities. However, any occurrence not fully covered by insurance could have an adverse effect on the Group’s business
� Continuous monitoring and periodic review of security function
� Continue to focus on capability building within the Group
Cairn related challengesCairn India has 70% participating interest in Rajasthan Block. The production sharing contract (PSC) of Rajasthan Block runs till 2020. The Government of India has granted its approval for ten-year extension at less favourable terms, pursuant to its policy for extension of Pre-NELP Exploration Blocks, subject to certain conditions. Ramp up of production versus envisaged may have impact on profitability.
� RJ PSC 2020 extension was issued by DGH subject to certain conditions. Ongoing dialogue and communication with the government and relevant stakeholders to address the conditions
� The applicability of the Pre-NELP Extension Policy to the RJ Block is currently sub judice
� Drop in crude price due to COVID-19 slowdown coupled with refusal by key global producers to reduce their output. Gas prices have also halved in recent months due to fall in LNG prices globally. However, in the month of May, the crude prices have started improving
� Discussions within teams as well as with partners have been initiated with an objective to optimise cost across all spheres of operations
� Constant engagement with vendors/partners to ensure minimal project delay based on the current situation and plan to ramp-up
� Government has extended the PSC for the Ravva block in Andhra Pradesh by 10 years. The growth projects are being implemented through an Integrated Contracting approach. Contracts have built in mechanism for risk and reward
� Project management committee and project operating committee have been set to provide support to the outsourcing partner and address issues on time to enable better quality control as well as timely execution for growth projects
BUSINESS RISKS CONTINUED...

INTEGRATED REPORT
06-115MANAGEMENT REVIEW
116-167STATUTORY REPORTS
168-270FINANCIAL STATEMENTS
271-502
50 VEDANTA LIMITED INTEGRATED REPORT AND ANNUAL ACCOUNTS 2019-20 VEDANTA LIMITED INTEGRATED REPORT AND ANNUAL ACCOUNTS 2019-20 51
COMPLIANCE RISKS
Impact Mitigation Risk Direction
Regulatory and legal riskWe have operations in many countries around the globe. These may be impacted because of legal and regulatory changes in the countries in which we operate resulting in higher operating costs, and restrictions such as the imposition or increase in royalties or taxation rates, export duty, impacts on mining rights/bans, and change in legislation.
� The Group and its business divisions monitor regulatory developments on an ongoing basis
� Business-level teams identify and meet regulatory obligations and respond to emerging requirements
� Focus has been to communicate our responsible mining credentials through representations to government and industry associations
� Continue to demonstrate the Group’s commitment to sustainability by proactive environmental, safety and CSR practices. Ongoing engagement with local community/media/NGOs
� SOx compliant subsidiaries
� Common compliance monitoring system being implemented in group companies. Legal requirements and a responsible person for compliance have been mapped in the system
� Legal counsels within the Group continues to work on strengthening the compliance and governance framework and the resolution of legal disputes
� Competent in-house legal organisation is in place at all the businesses and the legal teams have been strengthened with induction of senior legal professionals across all group companies
� Standard Operating Procedures (SOPs) have been implemented across our businesses for compliance monitoring
� Greater focus for timely closure of key non-compliances
� Contract management framework has been strengthened with the issue of boiler plate clauses across the Group which will form part of all contracts. All key contract types have also been standardised
� Framework for monitoring performance against anti-bribery and corruption guidelines is also in place
Tax related mattersOur businesses are in a tax regime and changes in any tax structure or any tax-related litigation may impact our profitability.
� Tax Council reviews all key tax litigations and provides advice to the Group
� Continue to engage with concerned authorities on tax matters
� Robust organisation in place at business and group-level to handle tax-related matters
� Continue to consult and obtain opinion from reputable tax consulting firms on major tax matters to mitigate the tax risks on the group and its subsidiaries
Leveraging technology for growth
FINANCIAL RISKS
Impact Mitigation Risk Direction
Fluctuation in commodity prices (including oil) and currency exchange ratesPrices and demand for the Group’s products may remain volatile/uncertain and could be influenced by global economic conditions, natural disasters, weather, pandemics, such as the COVID-19 (coronavirus) outbreak, political instability, etc. Volatility in commodity prices and demand may adversely affect our earnings, cash flow and reserves. Our assets, earnings and cash flows are influenced by a variety of currencies due to the diversity of the countries in which we operate. Fluctuations in exchange rates of those currencies may have an impact on our financials.
� The Group has a well-diversified portfolio which acts as a hedge against fluctuations in commodities and delivers cash flows through the cycle � Pursue low-cost production, allowing profitable supply throughout the
commodity price cycle � Vedanta considers exposure to commodity price fluctuations to be
an integral part of the Group’s business and its usual policy is to sell its products at prevailing market prices and not to enter into price hedging arrangements other than for businesses of custom smelting and purchased alumina, where back-to-back hedging is used to mitigate pricing risks. Strategic hedge, if any, is taken after appropriate deliberations and due approval from ExCo � Our forex policy prohibits forex speculation � Robust controls in forex management to hedge currency risk liabilities
on a back-to-back basis � Finance standing committee reviews all forex and commodity-related
risks and suggests necessary courses of action as needed by business divisions � Seek to mitigate the impact of short-term movements in currency on
the businesses by hedging short-term exposures progressively, based on their maturity. However, large, or prolonged movements in exchange rates may have a material adverse effect on the Group’s businesses, operating results, financial condition and/or prospects � Notes to the financial statements in the Annual Report give details
of the accounting policy followed in calculating the impact of currency translation
Major project deliveryShortfall in achievement of expansion projects stated objectives leading to challenges in achieving stated business milestones – existing and new growth projects.
� Empowered organisation structure has been put in place to drive growth projects. Project Management systems streamlined to ensure full accountability and value stream mapping � Strong focus on safety aspects in the project � Geo-technical audits are being carried out by independent agencies � Engaged Global engineering partner to do complete Life of Mine Planning
and Capital Efficiency analysis to ensure that the project objectives are in sync with the BP and Growth targets � Standard specifications and SOPs for all operation to avoid variability.
Reputable contractors are engaged to ensure completion of the project on indicated timelines � Mines being developed using best in class technology and equipment
and ensuring the highest level of productivity and safety. Digitalisation and Analytics to improve productivity and recovery � Stage gate process to review risks & remedy at multiple stages on
the way � Robust quality control procedures have also been implemented to check
safety and quality of services/design/actual physical work
Access to capitalThe Group may not be able to meet its payment obligations when due or may be unable to borrow funds in the market at an acceptable price to fund actual or proposed commitments. A sustained adverse economic downturn and/or suspension of its operation in any business, affecting revenue and free cash flow generation, may cause stress on the Company’s ability to raise financing at competitive terms.
� A focused team continues to work on proactive refinancing initiatives with an objective to contain cost and extend tenor � The team is actively building the pipeline for long-term funds for near-
to medium-term requirements both for refinancing and growth capex � Track record of good relations with banks, and of raising borrowings in
last few years � Regular discussions with rating agencies to build confidence in operating
performance � Business teams ensure continued compliance with the Group’s treasury
policies that govern our financial risk management practices � CRISIL and India Ratings affirmed the rating for VEDL of ‘AA’ however
changed the outlook to negative due to sharp reduction in commodity prices in wake of COVID-19 pandemic � Credit matrix trending weaker due to challenging refinancing
environment and volatility in commodity prices (COVID-19)
BUSINESS RISKS CONTINUED...

INTEGRATED REPORT
06-115MANAGEMENT REVIEW
116-167STATUTORY REPORTS
168-270FINANCIAL STATEMENTS
271-502
52 VEDANTA LIMITED INTEGRATED REPORT AND ANNUAL ACCOUNTS 2019-20 VEDANTA LIMITED INTEGRATED REPORT AND ANNUAL ACCOUNTS 2019-20 53
BOARD OF DIRECTORS**
Our Board comprises eminent personalities bringing different insights from diverse walks of life, and they collectively take onus of Vedanta’s approach to creating value. Five out of our ten Directors are independent, thereby helping us strike the right balance between outside-in and inside-out perspectives.
ANIL AGARWAL, Non Executive Chairman Mr Agarwal is the Founder and Chairman of Vedanta Resources Limited, a Company which has grown its annual revenues from $1 Million to over $15 Billion in the past decade. Vedanta group has invested over $30 Billion in India and South Africa on organic growth projects. He has over four decades of entrepreneurial and business experience. He shaped the Group’s strategic vision and now plays the role of chief mentor to a talent pool of over 100,000 direct and indirect employees. Under his
NAVIN AGARWAL, Executive Vice Chairman Mr Navin Agarwal has been with the Group since its inception and has four decades of strategic executive experience. Under his stewardship, Vedanta has enjoyed leadership position in all the major sectors in which it operates. Over the years, he has been instrumental
leadership the Vedanta Group has achieved tremendous success, the Group got its first big break in 1986, and over the years, it has achieved tremendous growth both organically and through value-generating mergers and acquisitions, creating a world-class diversified portfolio of large, structurally low-cost assets in oil & gas, zinc, silver, copper, iron ore, aluminium and steel. It is the only major natural resources Company in the entire Indian subcontinent. In the last nine years, Vedanta has contributed more than US$41.7 billion to the exchequer and currently contributes 1% to India’s GDP.
Mr Agarwal’s vision for the Company and the country is deeply interlinked, he is a strong advocate of reducing import dependency by increasing domestic production of resources that are abundantly available in our ecosystem, while maintaining the best environmental standards. The underlying fact behind his conviction is that domestic production will
in building a highly successful meritocratic organisation, anchored by an extraordinary force of 100,000 employees. He spearheads our strategy through a mix of organic growth and value-generating acquisitions leading to Vedanta’s transformation into a globally diversified natural resources Company.
He is passionate about developing leadership talent and has been responsible for creating a culture of excellence at Vedanta through the application of advanced technologies and global best practices. He drives Vedanta’s unwavering commitment to the highest standards of corporate governance and engagement with key stakeholders. His vision is to gradually unlock the enormous potential of the
create millions of jobs, save precious foreign exchange, build technological capital and push India towards mass development.
Mr Agarwal places considerable focus on safety and sustainable development for the benefit of the surrounding communities. He created the philanthropic arm of the Group - The Vedanta Foundation, with a deep-seated belief that businesses must give back to the society and help them prosper. He has generously pledged 75% of his wealth for social good. He initiated the Nand Ghar project which will transform the lives of over 100 million women and children by providing them holistic development opportunities. Similarly, there are many initiatives pertaining to medical care, sports, agriculture, nature conservation and more which are being undertaken under his guidance and direction.
natural resources sector and make it an engine of growth for India. The overarching vision of empowering the nation by achieving self-sufficiency in the resource sector remains close to his heart.
In recognition of his exceptional distinction in the fields of business and entrepreneurship and contribution to the natural resources sector, he was conferred with the ‘Industrialist of the Year’ award by the Bombay Management Association for 2018. He is a fervent advocate of sustainable development and is committed to the empowerment of women and promotion of culture and sports.
LALITA D GUPTE, Non-Executive Independent Director Ms Gupte has more than three decades of experience in the financial sector and has held various leadership positions in diverse areas. She is the former Joint Managing Director of ICICI Bank and was the Chairperson of ICICI Venture Funds Management Company Limited till October 2016. She is currently Chairperson of ICICI Lombard General Insurance Co. Ltd. and India Infradebt Ltd. and sits on other Boards. She holds a bachelor’s degree in Economics (Honours) and a master’s degree in Management Studies. She did her advanced management programme from INSEAD.
K VENKATARAMANAN, Non-Executive Independent Director Mr Venkataramanan brings with him over four decades of experience and has also been CEO & Managing Director, Larsen & Toubro Limited (L&T) from April 2012. Further, he has also served on the L&T Board from May 1999 until his retirement in September 2015. He has spearheaded L&T in the world of Engineering & Construction, strengthened every aspect of Engineering Procurement Construction value chain and transformed L&T to one of the respected names in the global EPC fraternity. He is a Graduate in Chemical Engineering from Indian Institute of Technology, Delhi. He is also a distinguished alumni awardee from IIT Delhi.
MAHENDRA KUMAR SHARMA, Non-Executive Independent Director Mr Sharma retired in May 2007 as the Vice-Chairman of Hindustan Unilever Limited. As Vice Chairman he had responsibility for H.R, Legal & Secretarial, Corporate Affairs, Corporate Communications, Corporate Real Estate functions and New Ventures, Plantations & Export businesses of the company.
He displays passion for ensuring highest standards of Corporate Governance and adherence to responsible and ethical conduct in all aspects of business operations. He holds bachelor’s degree in Arts and Bachelors of Law Degree from Canning College, University of Lucknow, completed Post Graduate Diploma in Personnel Management from Department of Business Management, University of Delhi and Diploma in Labour Laws from Indian Law Institute, Delhi. In 1999 he was nominated to attend Advanced Management Program at Harvard Business School. He served on the seven member Committee constituted by the Government of India for redrafting the Companies Act and was also a member of the Naresh Chandra Committee constituted by the Government of India which formulated norms for corporate governance in India. Mangala Processing Terminal, Barmer
UPENDRA KUMAR SINHA, Non-Executive Independent DirectorMr Sinha has served as the Chairman of Securities and Exchange Board of India (SEBI) from February 2011 to March 2017. He was instrumental in bringing about key capital market reforms. Under his leadership, SEBI introduced significant regulatory amendments to the various acts enhancing corporate governance and disclosure norms. Prior to SEBI, he was the Chairman & MD of UTI Asset Management Company Pvt. Ltd. and has also worked for the Department of Economic Affairs under the Ministry of Finance.
** As on 6 June 2020 ** As on 6 June 2020

INTEGRATED REPORT
06-115MANAGEMENT REVIEW
116-167STATUTORY REPORTS
168-270FINANCIAL STATEMENTS
271-502
54 VEDANTA LIMITED INTEGRATED REPORT AND ANNUAL ACCOUNTS 2019-20 VEDANTA LIMITED INTEGRATED REPORT AND ANNUAL ACCOUNTS 2019-20 55
Women conducting maintenance work in the Rajpura Dariba Mine
PRIYA AGARWAL, Non-Executive Non-Independent DirectorMs Agarwal brings with her experience in Public Relations with Ogilvy & Mather and in Human Resources with Korn Ferry International. She has done B.Sc. Psychology with Business Management from the University of Warwick in the UK. She anchors CSR, PR & Communications for the Group.
GR ARUN KUMAR, Whole-time Director & Chief Financial Officer Mr Arun Kumar has over 24 years of experience at global multinationals like Hindustan Unilever and General Electric. Prior to his joining Vedanta, he was the CFO for General Electric’s Asia-Pacific Lighting & Appliances businesses based out of Shanghai. He is responsible for overall health of the balance sheet, driving performance in profit and cash, treasury, investor relations, credit ratings, tax, secretarial, controllership, recording and reporting and other key strategic matters from time to time. He is a Fellow Member of the Institute of Chartered Accountants of India. ** As on 6 June 2020
Brokenhill shaft at Black Mountain
BOARD OF DIRECTORS CONTINUED...

INTEGRATED REPORT
06-115MANAGEMENT REVIEW
116-167STATUTORY REPORTS
168-270FINANCIAL STATEMENTS
271-502
56 VEDANTA LIMITED INTEGRATED REPORT AND ANNUAL ACCOUNTS 2019-20 VEDANTA LIMITED INTEGRATED REPORT AND ANNUAL ACCOUNTS 2019-20 57
mEmBERs oF ThE mAnAgEmEnT CommITTEE:
MANAGEMENT COMMITTEE**
Vedanta is on the continuous journey of growth and expansion with best-in-class safety, benchmark technology, and cost efficiency. We continuously ensure that we have the right management in place to drive our business and take the organisation to the next level.
In line with this vision, a Group Management Committee has been formed which will collectively be responsible for all key decisions taken for the growth of organisation.
SUNIL DUGGAL Chief Executive Officer - Vedanta Limited and CEO- Hindustan Zinc Limited Mr Sunil Duggal was appointed as the CEO & Whole-time Director of Hindustan Zinc Limited (HZL), a subsidiary of the Company in 2015. He had been associated with HZL
since 2010 as Executive Director and thereafter became the Chief Operating Officer in the year 2012 and Dy. CEO in 2014. He has been appointed as the Interim CEO of Vedanta Limited with effect from 6 April 2020.
He is a result oriented professional with over 36 years of experience of leading high-performance teams and more than 20+ years in leadership positions. He is known for his ability to calmly navigate through tough and challenging times, nurture and grow a business, evaluate opportunities and risks and successfully drive efficiency and productivity whilst reducing costs and inefficiencies and deliver innovative solutions to challenges. His thrust on adopting best-in-class mining and smelting
techniques, state-of-the-art, environment-friendly technologies and mechanisation, automation & digitalisation of operational activities has added great value.
He has an Electrical Engineering degree from Thapar Institute of Engineering & Technology, Patiala. He is an Alumni of IMD, Lausanne - Switzerland and IIM, Kolkata.
He is serving as Vice Chairman – International Zinc Association, President – Federation of Indian Mineral Industries, President – Indian Lead Zinc Development Association. Recently, he has been appointed as the Chair – Confederation of Indian Industry (CII) National Committee on Mining.
MADHU SRIVASTAVA Chief Human Resources Officer Ms Srivastava was appointed as the Chief Human Resources Officer for Vedanta Group in December 2018. She has been associated with the
Group for more than seven years and in her earlier role, she was the CHRO for Cairn Oil & Gas business and led the Talent Acquisition and Diversity & Inclusion functions for the Group. Under her leadership, the Group has put in place the right HR policies, progressive people practices and frameworks for talent acquisition and talent management across Vedanta. She has 20 years of experience across HR as well as Sales, Marketing and Operations, spanning the FMCG, telecom, ITES, BFSI and natural resources industries.
She started her professional journey in 1999 with Godrej where
she handled sales in Gujarat and Maharashtra and later moved to the Corporate Sales & Marketing role. Post working with companies like GE Capital and Reliance in Operations & Marketing profiles, she started her Human Resources journey in 2006 by joining Genpact as Assistant Vice President, Talent Acquisition where she led middle management hiring. She then went on to lead the recruitments for Citibank’s India operations as Vice President, HR before joining Vedanta in 2012. She has completed her PGDM in Marketing and Sales, from the IIM, Ahmedabad.
GR ARUN KUMAR Chief Financial Officer
Mr Arun Kumar has over 24 years of experience at global multinationals like Hindustan Unilever and General Electric. Prior to his joining Vedanta, he was the CFO for General Electric’s Asia-Pacific Lighting & Appliances businesses based out of Shanghai.
He is responsible for overall health of the balance sheet, driving performance in profit and cash, treasury, investor relations, credit ratings, tax, secretarial, controllership, recording & reporting
and other key strategic matters from time to time. He is a Fellow Member of the Institute of Chartered Accountants of India.
SHARAD GARGIYA Chief Commercial Officer- Vedanta Limited and CCO- Hindustan Zinc LimitedMr Gargiya has been appointed as Chief Commercial Officer of Vedanta with effect from 5 April 2020. He was appointed as Chief Commercial Officer of Hindustan Zinc Limited
(HZL), a subsidiary of the Company in February 2019. He has been associated with Vedanta Group since October 1998 and has held key senior leadership roles in both finance and commercial functions across the Group companies. He has been an integral part of Group Ethics Committee since 2016 and an active member of Group insurance council for over five years.
He is a versatile leader and has over 21 years of experience in leading high-performance teams, developing and executing strategic initiatives, driving business excellence, and cultural transformation. He has contributed significantly in unlocking the business value through his leadership and strategic roles at Telecom cable,
Copper, Aluminum and Power business and Zinc. He is a result oriented professional and is extremely passionate about sustainability and resource productivity. He has a proven track record of adopting best-in-class technologies and processes to increase efficiencies and optimise cost with a focus on building automation and digitalisation of operational activities. He believes defining ‘personal success’ as his ability to make ‘others successful’.
He is a qualified Chartered Accountant and Bachelor of Commerce. He has attended General Management Program from Harvard Business School in 2011.
Electrosteel Plant, Bokaro
** As on 6 June 2020 ** As on 6 June 2020

INTEGRATED REPORT
06-115MANAGEMENT REVIEW
116-167STATUTORY REPORTS
168-270FINANCIAL STATEMENTS
271-502
58 VEDANTA LIMITED INTEGRATED REPORT AND ANNUAL ACCOUNTS 2019-20 VEDANTA LIMITED INTEGRATED REPORT AND ANNUAL ACCOUNTS 2019-20 59
DILIP GOLANI Director - Management Assurance
Mr Golani currently heads the Group’s Management Assurance Services function. He previously headed the Sales and Marketing Division for HZL and the Group’s performance management function. Prior to joining the Group in April 2000, he was a member of the Unilever corporate audit team responsible for auditing the Unilever group companies in Central Asia, the Middle East and Africa region. Prior to that, he was responsible for managing operations and marketing functions for one of
the exports businesses of Unilever India. He has over 30 years of experience and has previously worked with organisations such as Union Carbide India Limited and Ranbaxy Laboratories Limited. He holds a bachelor’s degree in Mechanical Engineering and has completed his Post Graduate studies in Industrial Engineering and Management from the National Institute of Industrial Engineering, Mumbai, India.
ANDREW LEWIN Group Health, Safety, Environment & Sustainability Head
Mr Lewin joined us as Group Health, Safety, Environment & Sustainability Head with effect from February 2020. He has over 32 years of experience within mining and oil & gas industries. He was previously Managing Director at Spectrum Risk Consulting, Australia. He has also held a number of senior roles at BHP Billiton, Newmont Mining Corporation and other companies across USA, Australia and the UK with responsibility for health, safety, environment and sustainability assurance. He has a PhD in Chemistry
from University of Waterloo and Post Graduate Diploma in Health and Safety from Aston University. He also holds a MSc in Physics from The University of Manchester, and a BSc (Honours) in Chemistry from University of Bristol.
JAMES CARTWRIGHT Head - Investor Relations
Mr Cartwright was appointed Head of Investor Relations for Vedanta Group in October 2019. He is working towards enhancing the quality, depth and diversity of our shareholder base and investors to ensure optimum valuation for the Company. He has 25 years of rich leadership experience in capital markets, specifically across natural resources including oil & gas, utilities and handling of the ESG community. Prior to joining Vedanta, he was Managing Director of the
Institutional Equities Division of Morgan Stanley. He also has worked with UBS Investment Bank & Merrill Lynch Europe. He holds bachelor’s degree with Honours in Geology from Bristol University, England.
EXECUTIVE COMMITTEE**
The Executive Committee (ExCo) supports in the day-to-day running of the Company and meets on a monthly basis. It comprises leaders from different businesses and key verticals across the Company. It is entrusted with executing the strategy adopted by the Board, allocating resources in line with delegated authorities, managing risk and monitoring the operational and financial performance of the Company.
The authority is delegated by the Executive Committee to the respective Chief Executive Officer of each of the businesses. The Group Chief Executive Officer keeps the Board informed of the ExCos activities through his standing reports to the Board.
ARUN MISRA Deputy Chief Executive Officer- Hindustan Zinc Limited
Mr Misra was appointed as Dy. CEO, HZL on 20 November 2019. In his previous role, he was associated with TATA Steel as Vice President- Raw Materials. He has 31 years of rich and diverse experience in leading various strategic positions within TATA Steel. He has a bachelor’s degree in Electrical Engineering from IIT Kharagpur, a Diploma in Mining and Beneficiation from University of New South Wales Sydney and a diploma in general management from CEDEP, France.
PANKAJ KUMAR Chief Executive Officer- Sterlite Copper, MEL and Fujairah Gold
Mr Kumar was appointed the Chief Executive Officer of our copper operations in Tuticorin, Silvassa and Fujairah Gold FZC and Director of Malco Energy in March 2019. In his career of over 29 years, he has worked with large conglomerates like TATA Steel, Mittal Steel, Adani Ports, Gujrat Guardian Limited and United Breweries Limited. Prior to joining us at Sterlite Copper as Chief Executive Officer, he was the Chief Operating Officer at Hindustan Zinc Limited. He holds a bachelor’s
degree of Technology (Honours) in Mechanical Engineering from Indian Institute of Technology Kharagpur and Post Graduate Diploma in Business Management with specialisation in Operations Management and Information Technology from XLRI, Jamshedpur, India.
AJAY KAPUR Chief Executive Officer- Aluminium & Power Business
Mr Kapur was appointed as Chief Executive Officer, Aluminium & Power in March 2019. He leads the Aluminium & Power business for Vedanta comprising 2.3 mtpa installed smelter capacity, 8 GW of power and 2 mtpa of alumina refinery. Prior to his appointment at Vedanta Limited, he was the Managing Director & Chief Executive Officer for Ambuja Cements. He started his career as an Executive Assistant to the founder & Managing Director of Ambuja Cements Ltd. He went on to handle various strategic
positions at Ambuja Cements with his last position as Managing Director & Chief Executive Officer. He holds a Graduate degree in Economics from St. Xavier’s College, Mumbai, an MBA from KJ Somaiya Institute, Mumbai and is an alumnus of Wharton’s Advanced Management Program.
Zinc Smelter, Chanderiya, HZL
** As on 6 June 2020** As on 6 June 2020

INTEGRATED REPORT
06-115MANAGEMENT REVIEW
116-167STATUTORY REPORTS
168-270FINANCIAL STATEMENTS
271-502
60 VEDANTA LIMITED INTEGRATED REPORT AND ANNUAL ACCOUNTS 2019-20 VEDANTA LIMITED INTEGRATED REPORT AND ANNUAL ACCOUNTS 2019-20 61
PANKAJ MALHAN Chief Executive Officer- Electrosteel Steels Limited
Mr Malhan is the Chief Executive Officer of ESL and joined ESL in October 2018. He holds a Bachelor in Technology in Instrumentation & Control from National Institute of Technology, Jalandhar, India, and also has done Post Graduate Diploma in Business Management from XLRI, Jamshedpur, India. He joined ESL from TATA Steel, where he was the Head – Engineering and Project. He was responsible for leading TATA Steel’s capital expansion programmes. He was associated with TATA Group since
2000 and has held various senior management positions at TATA Steel, TATA Blue Scope Steel Limited and TATA power Limited. Prior to joining TATA group, he has worked with Indian Acrylics Limited and Fisher Rosemount Limited.
ABHIJIT PATI Chief Executive Officer- BALCO
Mr Pati was appointed as Chief Executive Officer of BALCO on 25th July 2019. Prior to this, he was CEO of our Aluminium business, Jharsuguda from March 2015. Earlier he was the president and Chief Operating Officer of our aluminium and power business at Odisha since April 2012. He has over 31 years of experience in aluminium industry. Prior to joining us, he was the Vice President with Hindalco Industries Limited. He started his career as a budding engineer with Indian Aluminium Company in the year 1989. He was awarded with the ‘Exceptional Contributor Award’ from the Aditya Birla Group Chairman, Mr Kumar Mangalam Birla for significant contribution to turn around Hirakud Aluminium Smelter in 2006 and won the prestigious British Sword of Honor for the Hirakud Smelter in
the year 1999. He is a member of the Bureau of Energy Efficiency under Ministry of Power, Government of India. He is also holding the position of Vice President in Aluminium Association of India and member of the governing body. He is two times gold medalist from prestigious institutes like Calcutta University and International Management Institute, New Delhi. He has a first class honours bachelor’s degree in Chemical Engineering from Calcutta University and a master’s in Business Administration from International Management Institute, New Delhi.
RAHUL TRIVEDI SHARMA Chief Executive Officer (Acting)- VAL- Lanjigarh
Mr Sharma joined the Vedanta Group in 1998, and is currently Chief Executive Officer of Alumina Business, effective April 2019, prior to which he was working as Director - Corporate Strategy (Aluminium and Power). He has varied experience of over 25 years and has held leadership positions at Vedanta Limited and Sterlite Technologies Ltd. Prior to joining Vedanta he was Chief Marketing Officer (Domestic and International) and Business Head - Integrated Management System at Sterlite Technologies Ltd. He has played a significant role in driving various policies and creating a strategic framework for various
government reforms for development of exploration, mining and non-ferrous metal sector in the country in the most sustainable manner and is also the Co-Chairman of the Federation of Indian Chambers of Commerce & Industry (FICCI) Mining Committee. He is an alumnus of IIM–Ahmedabad Executive General Management program, has an MBA in Marketing and a BE in Electronics and Communication.
VINEET BOSE SPOC Group - Legal
Mr Bose was appointed as Corporate Counsel for legal matters across the group, with effect from 11 October, 2019. In addition to the current responsibilities, he also continues to hold the charge as the Head – Legal, Hindustan Zinc Limited (A Vedanta Limited subsidiary). He joined our Company in February 2016 as Deputy Legal Head of Hindustan Zinc Limited. He has almost 20 years of experience in complex litigations, contract negotiations, regulatory issues, compliance assurance, advocacy and
taxation matters. Prior to joining our Company, he has experience working with organisation like DuPont, Bharti group, Vaish Associates (Law Firm), BSNL and Ministry of Corporate Affairs. He is a Law Graduate from Delhi University and holds a master’s degree in business laws from National Law University (NLU) Bangalore. He is also a qualified Company Secretary and Cost and Management Accountant.
VIKAS SHARMA Chief Executive Officer- TSPL
Mr Sharma was appointed the Chief Executive Officer of our power business TSPL on 25 July 2019, prior to which he was appointed CEO of BALCO in March 2017. He has experience of over 31 years in various national and multi-national companies. He served HMT Watches Limited, Su-Raj Diamonds India Private Limited, AMP India Private Limited (now Tyco), Praxair India Private Limited, Jindal Praxair Oxygen Company Limited and JSW Steel Limited in various key positions. He joined as Location Head of Chanderiya Smelter of HZL in 2012 and was gradually elevated to the Chief Operating Officer of smelters division
of HZL in June 2014. During his tenure at HZL, he played integral role in the growth of the Company and made significant contribution in smelter production. He holds bachelor’s degree with Honours in Mechanical Engineering from Engineering College Kota, University of Rajasthan and a master’s in Business Administration in Marketing from Sikkim Manipal University, Gangtok, India.
DHIRAJ NAYYAR Director, Economics & Policy
Mr Nayyar was appointed as Director, Economics & Policy with effect from 11 October, 2019. Prior to this, he was Chief Economist of Vedanta Ltd. since October 2018. Before joining Vedanta, he was Officer on Special Duty and Head, Economics, Finance and Commerce at NITI Aayog, Government of India between October 2015 and October 2018. In this role, functionally equivalent to Joint Secretary, Government of India, he was responsible for all policy matters related to the Departments of Economic Affairs, Revenue, Financial Services, Investment and Public Asset Management and Commerce. He was Secretary of the Inter-Ministerial Committee on Sick and Loss-Making Public-Sector Enterprises, Member-Secretary of NITI Aayog’s Committee on Strategic Disinvestment
and Member, Spices Board. Prior to joining Government, he spent several years in the media in senior positions. He was India Columnist, Bloomberg View, Managing Editor, The Quint, Editor-at-large, Firstpost.com, Deputy Editor, India Today and Opinion Editor, Financial Express. He holds a BA Honours in Economics from St. Stephen’s College, M.A. in Philosophy, Politics and Economics from Merton College, Oxford and M. Phil in Development Economics from Trinity College, Cambridge where he also pursued doctoral research in Economics and taught development economics.
** As on 6 June 2020 ** As on 6 June 2020
EXECUTIVE COMMITTEE CONTINUED...

INTEGRATED REPORT
06-115MANAGEMENT REVIEW
116-167STATUTORY REPORTS
168-270FINANCIAL STATEMENTS
271-502
62 VEDANTA LIMITED INTEGRATED REPORT AND ANNUAL ACCOUNTS 2019-20 VEDANTA LIMITED INTEGRATED REPORT AND ANNUAL ACCOUNTS 2019-20 63
LEENA VERENKAR Group Head – CSR
Ms Verenkar was appointed as Group Head – CSR, with effect from October 11, 2019. In addition to the current responsibilities, she also holds the charge as the Chief Advocacy & PR and Head – CSR for Sesa Iron Ore Business since 2015. Prior to this, she was Head – CSR of Iron Ore Goa, since 2010. She started her career with our Company in 1996, in the field of environment management & compliance and led the environment team for 12 years. She has more than 25 years of experience in environment
management, community relations, advocacy & PR. She holds master’s degree in Microbiology from Goa University and in ecology & environment from Bhopal University. She has Fulbright Scholarship by US foundation in India and LEAD fellowship by Lead India. She is also recognised as Women Leader of the year by Economic Times and 100 most impactful CSR leaders (a global listing) by World CSR in 2017.
ROMA BALWANI Director - Communications & Brand
Ms Balwani was appointed Director- Communications & Brand with effect from 11 October 2019. Earlier she was Sr. Advisor since April 2019. Her prior stint with Vedanta was as President-Group Communications, Sustainability and Corporate Social Responsibility from April 2014 to August 2017. Prior to joining our Company, she was Chief Communications Officer at Mahindra & Mahindra Limited. With over three decades of experience, she has won several Indian and International awards and accolades and she speaks at several summits on Sustainable Development & Communications
in India and overseas. She has the distinction of being included for three consecutive years in the Holmes Global Report, USA, a recognition in the Global Influence 100 listing of In-house Communicators. She is a Director of CMI FPE, and the Indian subsidiary of the Belgian Company CMI. She also chairs the CSR Committee as a Board member. She is an Economics Graduate from Mumbai University and a Post Graduate Diploma in Marketing Management and has completed Executive Management Program at Harvard Business School, Massachusetts, USA.
TSPL Plant
SAUVICK MAZUMDAR Chief Executive Officer - Iron Ore Business
Mr Mazumdar was appointed as Interim CEO of our Iron Ore Business in July 2019. Prior to this role he was the Deputy Chief Executive Officer of Iron Ore Business and Vice President since 1 October 2016. He has been associated with Vedanta for over 24 years and has held various strategic and leadership roles. He has a bachelor’s degree in Mining Engineering from NIT Surathkal.
CHHAVI NATH SINGH Chief Executive Officer- VAL- Jharsuguda
Mr Singh is the CEO of our Aluminium business- Jharsuguda since 25 July 2019. Prior to this role he was COO of TSPL. He has a rich experience of 38 years in power industry and played a pivotal role in stabilisation of TSPL operations. He has also worked for companies like National Thermal Power Corporation Ltd., Essar Power and JSW Energy Ltd. He has a Post Graduate degree PGDBM from MDI, Gurgaon and bachelor’s degree in Mechanical Engineering from MLN Regional Engineering College.
Photograph at Vizag General Cargo Berth
** As on 6 June 2020** As on 6 June 2020
EXECUTIVE COMMITTEE CONTINUED...

INTEGRATED REPORT
06-115MANAGEMENT REVIEW
116-167STATUTORY REPORTS
168-270FINANCIAL STATEMENTS
271-502
64 VEDANTA LIMITED INTEGRATED REPORT AND ANNUAL ACCOUNTS 2019-20 VEDANTA LIMITED INTEGRATED REPORT AND ANNUAL ACCOUNTS 2019-20 65
MANAGING OUR BUSINESS SUSTAINABILITY
SUSTAINABILITY AND ESG
Our sustainability strategy is driven by the need to address the expectations of our stakeholders through mutual dialogue and need-based intervention, while at the same time addressing the priorities of business performance. As a large Company creating measurable economic and other impacts, we are mindful of our commitments to society, our people and our environment. We are also well attuned to global expectations and standards regarding sustainability, such as the United Nations Sustainable Development Goals (UN SDGs).
KEY STATISTICS
3.26 million
29% ₹296 crore
59 million mt
2.99 million m3
0.67
7
1.75 million GJ Community beneficiaries of Vedanta’s social activities (FY2019: 3.1 million)
Water recycling rate (FY2019: 28%)
Community investment (FY2019: ₹291 crore)
Carbon footprint (FY2019: 58 million mt)
of water saved (target: 2.5 million m3)
LTIFR (FY2019: 0.49)
Fatalities (FY2019: 9)
of energy conserved (target: 1.75 million GJ)
Tree Plantation drive by Vedanta Employees

INTEGRATED REPORT
06-115MANAGEMENT REVIEW
116-167STATUTORY REPORTS
168-270FINANCIAL STATEMENTS
271-502
66 VEDANTA LIMITED INTEGRATED REPORT AND ANNUAL ACCOUNTS 2019-20 VEDANTA LIMITED INTEGRATED REPORT AND ANNUAL ACCOUNTS 2019-20 67
FIRM FOUNDATION FOR LASTING VALUE
SUSTAINABILITY AND ESG
Good corporate governance, which is a pre-requisite for protecting shareholder value, as well as delivering sustainable growth, underpins the delivery of our strategic objectives.
By overseeing the conduct of business with strict adherence to ethics and responsibility, the entire structure, cascading from the Board of Directors at the top, supported by processes, policies and the Vedanta Sustainability Framework, enhances the prosperity, long-term viability and sustainability of the Company.
Our governance philosophy stems from our values of Trust, Entrepreneurship, Innovation, Excellence, Integrity, Respect and Care.
COMPOSITION OF THE BOARDIn pursuance of our commitment towards responsible business in compliance with the applicable provisions of Companies Act, 2013 and Securities and Exchange Board of India (SEBI) Listing Regulations, including the amendments thereof, our Board presents an appropriate balance between Executive, Non-Executive and Independent Directors to distinct its functions of management and governance, to promote shareholder interests and to govern Vedanta effectively.
As on June 6, 2020, the Board comprises eight members as listed below:
Name Designation Gender Age
Mr. Anil Agarwal Non-Executive Chairman Male 67
Mr. Navin Agarwal Executive Vice-Chairman Male 59
Mr. K Venkataramanan Non-Executive Independent Director Male 75
Ms. Lalita D. Gupte Non-Executive Independent Director Female 71
Mr. Mahendra Kumar Sharma Non-Executive Independent Director Male 73
Mr. UK Sinha Non-Executive Independent Director Male 68
Ms. Priya Agarwal Non-Executive Director Female 30
Mr. GR Arun Kumar Whole-time Director & CFO Male 48
Age Group Less than 30 years Between 30-50 years Above 50 years
Number of Directors 0 2 6
Gender Male Female
Number of Directors 6 2
By overseeing the conduct of business with strict adherence to ethics and responsibility, the structure enhances the prosperity and long-term viability of the Company. The Board Sustainability Committee meets every six months.
Our Board provides entrepreneurial leadership for the Company and strategic direction to the management. It is collectively responsible for promoting the long-term success of the Company through the creation and delivery of sustainable shareholder value. The reporting structure, as shown below, between the Board, Board Committees and Management Executive Committees, forms the backbone of the Group’s Corporate
Our Board provides strategic perspective and steers the business in line with the commitments made to various stakeholders and sustainable growth. They are supported by: � Established committees � Sustainable development team � Vedanta Sustainability Framework
and Vedanta Sustainability � Assurance Process (VSAP) � Code of Business Conduct and Ethics
Governance framework. As part of its decision-making processes, the Board considers the long-term consequences of its decisions, the interests of various stakeholders, including employees, the impact of the Group’s operations on the environment and the need to conduct its business ethically. This is achieved through a prudent and robust risk management framework, internal controls and strong governance processes.
Diversified workforce in Wire Rod Mill and Bar Mill in ESL
SHAREHOLDERS
CEO
Management Committee & Executive Committee
Audit Committee
Sustainablity Committee
Committee of Directors
Nomination & Remuneration
Committee
Risk ManagementCommittee
Share & Debenture
Transfer Committe
Finance Standing Committee of
Directors
Stakeholder RelationshipCommittee
Corporate Social Responsibility
Committee
BOARD OF DIRECTORS

INTEGRATED REPORT
06-115MANAGEMENT REVIEW
116-167STATUTORY REPORTS
168-270FINANCIAL STATEMENTS
271-502
68 VEDANTA LIMITED INTEGRATED REPORT AND ANNUAL ACCOUNTS 2019-20 VEDANTA LIMITED INTEGRATED REPORT AND ANNUAL ACCOUNTS 2019-20 69
Aluminum Plant, Balco Cambay Oil Facility, Cairn
REVIEW OF SUSTAINABLE DEVELOPMENT TEAM AND SEGMENT BUSINESS COMMITTEE
(Monthly Operational Reviews/Business Management Group Meetings)
SUSTAINABLE DEVELOPMENT TEAMGroup (and BUs) HSE & Sustainability Teams
Chaired by
MR. SUNIL DUGGAL CEO
The Committee meets monthly and is responsible for implementing strategic plans formulated by the Board, allocating resources in line with delegated authorities and monitoring the
operational and financial performance of the Group.
EXECUTIVE COMMITTEE
SAFETYOCCUPATIONAL HEALTH
DISCLOSURE & COMMUNICATION
ENVIRONMENTCOMMUNITY RELATIONS
SUSTAINABILITY AND ESG CONTINUED...

INTEGRATED REPORT
06-115MANAGEMENT REVIEW
116-167STATUTORY REPORTS
168-270FINANCIAL STATEMENTS
271-502
70 VEDANTA LIMITED INTEGRATED REPORT AND ANNUAL ACCOUNTS 2019-20 VEDANTA LIMITED INTEGRATED REPORT AND ANNUAL ACCOUNTS 2019-20 71
OUR SUSTAINABILITY MANAGEMENT APPROACH
SUSTAINABILITY AND ESG
Our goal is to create long-term value for all our stakeholders. To deliver on this promise, we have developed the Vedanta Sustainability Framework that enables our business units to adopt sustainable business principles into their systems and procedures.
Developed in line with global standards from international bodies such as ICMM, International Finance Corporation (IFC), Global Reporting Initiative (GRI), United Nations Global Compact (UNGC) and SDGs, the Framework comprises several policies, standards and guidance notes, which help us in its execution. International consultants are also engaged to audit and provide feedback on the Framework’s strengths and weaknesses.
� Biodiversity, Energy & Carbon, HIV-AIDS, HSE, Human Rights, Social, Supplier & Contractor Sustainability Management, Water
� Covering all of the policy subject areas � In line with ICMM, IFC
Performance Standards, Global Reporting Initiative (GRI)
� Annual audit (VSAP) conducted at all Vedanta locations to check compliance with VSF � Monitored by Group ExCo
VEDANTA SUSTAINABILITY FRAMEWORK
8 POLICIES
87 STANDARDS & GUIDANCE NOTES
ROBUST MONITORING
Employees at Jharsugda
VEDANTA SUSTAINABILITY AssuRAnCE pRoCEss (VsAp) VSAP is our sustainability risk assurance tool, used to assess the compliance of all our businesses with the Vedanta Sustainability Framework. The assurance model has different modules, which cover environment, health, safety, community and human rights elements. The assurance system works on the premise of tracking corrective and preventive action by each of our businesses and commissioning periodic formal audits by external experts.
VSAP is an annual process with clear tracking of results by the Sustainability Committee and the Executive Committee, which in turn report to the Board. As per the identified gaps, respective businesses make management plans and undertake corrective gap-filling actions, which are periodically reviewed, evaluated and documented. The successes and failures are identified and highlighted, and cross-learning opportunities are created.
VSAP has been instrumental in helping us embed sustainable development into every activity that we undertake.
Gamsberg Wet Area (Flotation, Thickener)
Encouraging safety practices throughout community

INTEGRATED REPORT
06-115MANAGEMENT REVIEW
116-167STATUTORY REPORTS
168-270FINANCIAL STATEMENTS
271-502
72 VEDANTA LIMITED INTEGRATED REPORT AND ANNUAL ACCOUNTS 2019-20 VEDANTA LIMITED INTEGRATED REPORT AND ANNUAL ACCOUNTS 2019-20 73
STAKEHOLDER ENGAGEMENT
ALIGNING STAKEHOLDER EXPECTATIONS WITH BUSINESS STRATEGY Continuous engagement with our stakeholders allows us to remain responsive to their expectations, foresee emerging risks and identify opportunities. Our social responsibility performance standards help ensure effective engagement with relevant stakeholders across multiple industries and geographies; provide adequate grievance mechanisms to help resolve situations of potential conflict; and develop specialised standards for potentially vulnerable communities such as indigenous peoples. The process follows five principles of engagement:
ASK Our dialogue begins with questions that solicit feedback. Our stakeholders have access to a number of platforms to reach out to Vedanta personnel and voice concerns.
ANSWER We disclose not just because we want to be heard, but because we are responsible. We aim to provide a constructive response to feedback received.
ALIGN We work hand- in-hand with stakeholders and align our goals and actions with their high-priority areas. The feedback from all our engagement becomes part of our materiality identification process.
ACT We back up our words with demonstrable actions that move the needle towards promised outcomes.
ANALYSE We have established a robust investigation process for complaints reported via the whistleblowing mechanism, sustainability and group communications email IDs, involving senior management and relevant personnel.
OUR KEY STAKEHOLDERS
Governments Employees
Local Community
Civil Society
Industry (Suppliers, Customers,
Peers, Media)
Shareholders, Investors, &
Lenders
VEDANTA
Enhancing agricultural incomes through innovative techniques
The table below represents an overview of the ongoing engagement with our stakeholders and the manner in which Vedanta responds to their expectations.
Stakeholder Groups Types of Engagement Key Expectations Initiatives in FY2020
Local Community Community group meetings, village council meetings, community needs/social impact assessments, public hearings, grievance mechanisms, cultural events, engaging philanthropically with communities via the Vedanta Foundation
� Need-based community development projects � Increasing reach of
community development programmes � Improved grievance
mechanism for community
� ₹296 Crore invested in Social Investment � 3.26 million beneficiaries
of community development programmes � Community grievance
process followed at all operations
Employees Chairman’s workshops, Chairman’s/CEO’s town hall meetings, feedback sessions, performance management systems, various meetings at plant level, V-Connect mentor programme, event management committee and welfare committee, women’s club
� Improved training on safety � Increased opportunities for
career growth � Increasing the gender
diversity of the workforce
� 1.55 million person-hours of training on safety � 30% of all new hires are
women � Identification of top talents
and future leaders through workshops
Shareholders, Investors, & Lenders
Regular updates, investor meetings, site visits, AGM and conference, quarterly results calls, dedicated contact channel – [email protected] and [email protected]
� Consistent disclosure on economic, social, and environmental performance
� ₹83,545 Crore in revenue � Sustainability assurance
audits conducted through Vedanta Sustainability Assurance Programme (VSAP) � Investor briefings and
pro-active engagement with the investment community on ESG topics
Civil Societies Partnerships with, and membership of international organisations, working relationships with organisations on specific projects, engagement with international, national, and local NGOs, conferences and workshops, dedicated contact channel – [email protected]
� Expectation of being aligned with the global sustainability agenda � Commitment to ensuring
human rights for all
� Membership of international organisations including the United Nations Global Compact, TERI, CII, and Indian Biodiversity Business Initiative (IBBI) � Focus towards
implementing Sustainable Development Goals � Compliance to the Modern
Slavery Act
Industry (Suppliers, Customers, Peers, Media)
Customer satisfaction surveys, scorecards, in-person visits to customers, suppliers, and vendor meetings
� Consistent implementation of the cCode of Business Conduct and Ethics � Ensuring contractual
integrity
� Hotline service and email ID to receive whistle- blower complaints
Governments Participation in government consultation programmes, engagement with national, state, and regional government bodies at business and operational level
� Compliance with laws � Contributing towards the
economic development of the nation
� ~₹32,400 crore in payments to the exchequer

INTEGRATED REPORT
06-115MANAGEMENT REVIEW
116-167STATUTORY REPORTS
168-270FINANCIAL STATEMENTS
271-502
74 VEDANTA LIMITED INTEGRATED REPORT AND ANNUAL ACCOUNTS 2019-20 VEDANTA LIMITED INTEGRATED REPORT AND ANNUAL ACCOUNTS 2019-20 75
DELIVERING ON ESG PRIORITIES
MATERIALITY ASSESSMENT
In addition to the normal course of engagement, overseen by respective BUs and functions of the business, Vedanta, conducts a formal stakeholder engagement and materiality assessment exercise, once in every three years. This exercise is conducted to ensure that we have accounted for all expectations or concerns conveyed to us by our stakeholders, especially with regard to sustainability performance.
During FY2020, we completed our largest such exercise, having interacted with nearly 2,900 internal and external stakeholders via online surveys, focus group discussions, and face-to-face interactions. The results of this exercise have been distilled by our senior leadership team into areas that require our immediate attention and intervention (High); areas that can be managed using our existing frameworks and protocols (Medium); and areas that need continuous monitoring to prevent them from becoming critical for the organisation over time (Low). Classification of the areas was done using the following framework: (i) Importance to external stakeholders; (ii) Importance to the Vedanta leadership team; (iii) Potential regulatory impact; (iv) Potential reputational impact; and (v) Potential financial impact.
High Medium Low
Energy & Climate Change Noise & Vibration Land Acquisition & Rehabilitation
Water Management Tailings Dam Management
Solid Waste Management Human Rights
Air Emissions Resource Efficiency
Biodiversity Transparent Disclosure
Health & Safety Materials Management
Community Development Learning & Development
Supply Chain Sustainability Use of Recycled Material
Grievance Management Brand Salience
Compliance to Government Regulations Innovation
Upholding Rights of Indigenous People Governance for Sustainability
Ethical Business Practices
Diversity & Equal Opportunity
Act Manage Observe
Water dredging at the Red Mud Pond in Lanjigarh
These results are specific to ESG-related expectations from the Company and do not include aspects related to economic/financial expectations.
We further analysed the areas with ‘high’ expectations to explore how they are integrated with the UN Sustainable Development Goals. The final set of actions and targets, in alignment with UN SDGs, are described in the table below:
Issues Emerging as ‘High’ Priority
SDG Alignment FY2020 Targets Status Performance Proposed Targets FY2021 & Beyond
WORKFORCE SAFETY
Health & Safety
SDG 8.8. Protect labour rights and provide safe work conditions for all
Achieve score >75% in ten safety performance standards
Average score <75%
Achieve score >75% in ten safety performance standards
Zero fatal accidents and an LTIFR of 0.30
7 fatalities LTIFR: 0.67
I. Zero fatal accidentsII. Introduce TRIFR as the primary lagging metric for safety
ENVIRONMENT MANAGEMENT
Water Management
SDG 6.4. Increase water use efficiency and ensure sustainable withdrawals
SDG 12.2: Achieve sustainable management and efficient use of natural resources
Achieved 2.5 million m^3 of water savings
2.99 million m3 of water savings achieved
I. Review our water targets in alignment with global best practices.II. Achieve water savings of 0.5 million m3III. For water stressed areas - have a sustainable sourcing model by 2025
Energy & Climate Change
SDG 12.2: Achieve sustainable management and efficient use of natural resources
SDG 13.2: Integrate climate change measures into strategies, polices, and planning
Achieve 1.75 million GJ energy saving
~1.92 million GJ of energy savings achieved
Achieve energy savings of 3 million GJ
Reduce our GHG emissions intensity by 16% from a 2012 baseline by 2020
13.83% reduction in GHG emissions intensity
Develop revised 5/10-year GHG emissions intensity reduction targets
Solid Waste Management
SDG 12.5. Substantially reduce waste generation through prevention, reduction, recycling and reuse
Achieve fly ash utilisation of 80%
105% utilisation of fly ash
Sustain fly-ash utilization at 100% or more
Tailings Dam Management
NA Third-party review of tailings/ash dyke management system and development of specific improvement plan (India operations)
Completed Continue with third-Party review of our tailings dam/ash dyke structures
Biodiversity SDG 15.9. Introduce biodiversity management and planning into development processes
Completed new Target: Review of site-biodiversity risk across all our locations
AchievedPartially AchievedNot Achieved

INTEGRATED REPORT
06-115MANAGEMENT REVIEW
116-167STATUTORY REPORTS
168-270FINANCIAL STATEMENTS
271-502
76 VEDANTA LIMITED INTEGRATED REPORT AND ANNUAL ACCOUNTS 2019-20 VEDANTA LIMITED INTEGRATED REPORT AND ANNUAL ACCOUNTS 2019-20 77
Issues Emerging as ‘High’ Priority
SDG Alignment FY2020 Targets Status Performance Proposed Targets FY2021 & Beyond
SECURING OUR SOCIAL LICENCE TO OPERATE
Community Development
SDG 2.1. End hunger and ensure access to safe, nutritious, and sufficient food, all year round
SDG 2.2. End all forms of malnutrition
Ensure alignment of all BU plans with issues identified during baseline surveys
Baseline survey conducted across Group, BU plans aligned with findings/recommendation
Implementation of programmes in line with baseline and key indicators and conduct impact study after three years
new target: Focus to align programmes with 2 key SDGs across group
1,200 Nand Ghars to be constructed by FY2020
1,302 Nand Ghars constructed
4,000 Nand Ghars to be constructed by FY2021
Rollout of employee engagement platform across the Group
’Passion to serve’-employee volunteering online platform launched in August 2019
Intentionally left blank
Grievance Management
No specific SDG A standard online community grievance record/redressal software to be introduced across the Group
’Nivaran’ portal launched in March 2019
Timely redressal of grievance through unified portal across BUs
Supply Chain Sustainability
SDG 8.7. Eliminate worst forms of child labour, all forced labour
No targets. However, BUs follow Modern Slavery Act requirements to monitor suppliers and vendors for breaches of human rights
Upholding Rights of Indigenous People
No specific SDG No target, however, Vedanta is committed to FPIC & plans to undertake a Social Performance pilot in FY2021
new target: CSR advisory at Group level
Vedanta encourages leveraging advanced & sustainable technology
Issues Emerging as ‘High’ Priority
SDG Alignment FY2020 Targets Status Performance Proposed Targets FY2021 & Beyond
PEOPLE AND DIVERSITY
Ethical Business Practices
No specific SDG Continue to focus on Code of Conduct (COC) training for all employees, including new hires
All our employees sign a copy of COC as part of their joining process acknowledging that they have gone through the Code of Conduct policy. In addition, we have a digitised COC training module, which every employee must go through, at the end of which they have to answer a short quiz to complete the training
Continue to focus on COC training for all employees, including new hires
Diversity & Equal Opportunity
SDG 5.5. Ensure full & equal participation of women in all decision-making in the political, economic, and public life
Achieve 33% female representation at Vedanta Board-level by FY2020
Currently, we have 25% diversity in our Group Management Committee and 20% in Vedanta Limited’s Board. We have made significant headway since last year where we have increased diversity in the Group
Achieve 33% female representation at Vedanta across all key decision-making bodies, including the Board, Management Committee and ExCo
SDG 5.9. Adopt and enforce policies and legislation on gender equality
Executive Committee from 5% to 17% and we continue to focus on achieving 33% diversity across the table
5% improvement in our campus female hiring programme to promote gender diversity
We have improved our on-campus recruiting diversity by 8.7% from 27.7% to 36.4%
Improve diversity across the organisation with focused 50% diverse hiring from campuses
Ensuring right lead-ership (ExCo) & succession for each business
ExCo structure being reviewed by respective business CEOs and HR heads, along with top management every month – Key focus is on delivery and business impact. Status on KPIs being tracked for the ExCo leaders through a structured Scorecard process on a quarterly basis
Ensuring right Manage-ment in Place with defined deliverables in terms of Volume, Cost & EBITDA and succession for each business
ENVIRONMENTAL STEWARDSHIP CONTINUED...

INTEGRATED REPORT
06-115MANAGEMENT REVIEW
116-167STATUTORY REPORTS
168-270FINANCIAL STATEMENTS
271-502
78 VEDANTA LIMITED INTEGRATED REPORT AND ANNUAL ACCOUNTS 2019-20 VEDANTA LIMITED INTEGRATED REPORT AND ANNUAL ACCOUNTS 2019-20 79
ENVIRONMENTAL STEWARDSHIP
OPTIMISING RESOURCES FOR A SUSTAINABLE FUTURE We are committed to reduce our environmental footprint through a systematic and process-oriented approach. This includes addressing legacy issues at sites that have previously had a negative impact on the environment, retrofitting older assets with new technology and ensuring new operations are as efficient as possible by design. Additionally, all our operational sites are ISO 14001 certified.
Our Vedanta Sustainability Framework comprises policies, standards and guidance notes to manage environmental impacts. For the environmental priorities arising from the materiality process, we have developed specific objectives and targets, and review performance against these issues on a periodic basis.
ENERGY MANAGEMENT & CLIMATE CHANGEAs a large consumer of fossil-fuel based power, we recognise the climate-related risks associated with our business activities. We understand the implications of our energy consumption, both in terms of its cost to the natural environment as well as cost to the operations and are committed to meet our energy demands, while limiting our carbon emissions. We remain fully supportive of the outcomes of the Paris Agreement and have taken on carbon reduction targets in alignment with the Nationally Determined Contributions (NDC) of the Government of India.
GOVERNANCE STRUCTUREOur Energy and Carbon Management Policy and Performance Standard commit our operations to adopt and maintain global best practices in carbon and energy management and minimise Greenhouse Gas (GHG) emissions.
The primary oversight of our carbon agenda rests with the Board’s Sustainability Committee, which meets once every six months. The Committee also reviews progress on the sustainability targets, which include carbon-related goals. The operational oversight of the carbon agenda rests
with The Carbon Forum - a council chaired by the CEO of our power business and led by the Chief Operating Officers of our businesses. The forum has been mandated with developing and overseeing the implementation of Vedanta’s carbon mitigation approach.
During FY2020, the Company reconstituted the ‘Carbon Forum’ adding new members and refreshing its terms of reference.
Included in the Forum’s work are discussions related to approving Vedanta’s carbon management strategy, long-term (GHG) emissions intensity reduction targets, alignment with investor requirements, emerging regulatory risks and carbon pricing. The Forum also informs the Group ExCo, Risk Management Committee and the Board Sustainability Committee on ways to manage our carbon footprint. Executive compensation is linked to VSAP performance, which means management of our carbon footprint is also indirectly included in the compensation structure. We are in agreement with the recommendations made by the Task Force on Climate-related Financial Disclosures (TCFD). We are currently examining the best way forward on refining our carbon management and disclosure practices to be in alignment with the same.
The green lush environment at our Calciner in Lanjigarh alumina refinery
An employee at Cairn Oil & Gas
ClImATE-RElATED RIsks AnD OPPORTUNITIESVedanta’s global presence exposes us to regulatory changes aimed at limiting or reducing GHG emissions. These changes could potentially impact our operations with increased costs for fossil fuels, levies for emissions in excess of certain permitted levels, and increased administrative costs for monitoring and reporting. Further, increasing regulation of GHG emissions, including the progressive introduction of carbon emissions trading mechanisms and tighter emission reduction targets, is likely to raise costs and reduce demand growth. However, as of now, we do not anticipate any regulatory risks in India after the withdrawal of the clean energy cess in 2017.
We also anticipate physical risks related to extreme weather events and changes in the availability of water due to climate change. We have conducted a water risk assessment to evaluate the risks at 25 of our locations. Sites located in high-risk areas that are vulnerable to changes in the availability of water have begun to implement measures
to reduce their dependency on local water sources by increasing water recycling rates and improving water use efficiencies.
We also anticipate a rise is the spread of vector-borne illnesses with rising temperatures. The COVID-19 pandemic has provided a glimpse of what such an outbreak could look like. We will incorporate the possibility and impact of such an event in our future risk planning – expanding on the Business Continuity Planning SOPs that have been prepared for the current COVID-19 crisis. In terms of climate-related business opportunities, we expect to
benefit from an increase in demand for copper, zinc and silver, as the global renewable energy and electric vehicle industries expand.
We have not yet undertaken climate scenario planning and stress-testing of our projects based on internal carbon prices. There is an intention to introduce internal carbon prices in the next two years. Given the challenges related to Vedanta’s diverse business operations, which have different emission intensities, the Company is in the process of reviewing whether to apply carbon price at a group or operations level.
TARGETS & STRATEGIESVedanta’s businesses range from mining operations (surface and underground), smelting and refining units, hydrocarbon exploration, drilling and production, and product manufacturing to power generation. A significant portion of our operations are in regions where fossil-fuel based power forms the baseload of the energy grid. Additionally, due to the large and consistent requirement for power, many of our captive power
plants use coal-based thermal technologies. Given the nature and location of our businesses, switching to large-scale renewable energies has not been possible due to the current financial and technical limitations of the technologies. As a result, much of our GHG emissions reduction programmes remain focused on improving the energy efficiency of our operations. We had aligned ourselves with the Nationally Determined Contributions (NDC)
of the Government of India and had committed to reduce our GHG emissions intensity by 16% by 2020 from a 2012 baseline.
In FY2020, we have reached the end-of-cycle for this target and achieved a reduction of 13.83%. This reduction is equivalent to ~9 million tCO2e in avoided emissions. While the final number is lower than the target, it is indicative of the stretch goal that had been taken by us. We are currently in discussions internally to take the next set of mid- and long-term targets. We expect to be able to disclose these new targets by Q3FY21.We are deliberating if Science Based Targets (SBT) should be adopted for the entire group, or if each of our businesses should commit to their own SBTs. Our Zinc India business has already committed to SBTs and plans to reduce its Scope 1 and Scope 2 emissions by 14% by CY2026 from a CY2016 baseline. It has also committed to reduce its Scope 3 emissions by 20% by CY2026 from a CY2016 baseline.
Shutdown maintenance activity at Cairn
Ensuring safe and best-in-class hygiene practices at Workplace

INTEGRATED REPORT
06-115MANAGEMENT REVIEW
116-167STATUTORY REPORTS
168-270FINANCIAL STATEMENTS
271-502
80 VEDANTA LIMITED INTEGRATED REPORT AND ANNUAL ACCOUNTS 2019-20 VEDANTA LIMITED INTEGRATED REPORT AND ANNUAL ACCOUNTS 2019-20 81
PERFORMANCEThe marginal rise in GHG emissions is primarily due to the inclusion of Electrosteels Steel Limited (ESL) data from FY2020 onwards. If we remove ESL from the dataset, there is a decline in GHG emissions by 3.6%.The decline for our GHG emissions and energy use is due to the marginal slowdown of activities in Q4 due to the lockdown measures initiated as part of our COVID-19 response.
We calculate and report GHG inventory i.e. Scope 1 (process emissions and other direct emissions) and Scope 2 (purchased electricity) as defined under the World Business Council for Sustainable Development (WBCSD) and World Resource Institute (WRI) GHG Protocol.
GHG Emissions (million tCO2e) FY2020 FY2019 FY2018 FY2017
Scope 1 (direct) 57 55 51 51.7
Scope 2 (indirect) 2 3.5 1.2 1.4
Total 59 58.5 52.2 53.1
Energy Consumption (million GJ) FY2020 FY2019 FY2018 FY2017
Direct 519 483.9 424.94 411.95
Indirect 11 62.59 14.34 9.07
Total 530 546.49 439.28 421.02
WASTE & TAILINGS MANAGEMENT Responsible management of waste is the cornerstone of any sustainable operation. The safe and responsible management of hazardous, non-hazardous, and high-volume low-toxicity wastes is a key concern for our businesses. At Vedanta, the hazardous wastes include used/spent oil, waste refractories, spent pot lining and residual sludge from smelters, while the non-hazardous (high-volume, low-toxicity) wastes we generate include fly ash (from captive and merchant power plants), red mud (aluminium refinery waste), jarofix (from zinc smelting), slag, lime grit (process residues from smelters and aluminium refineries) and phosphogypsum (phosphoric acid plant).
The Resource Use and Waste Management Technical Standard and supporting guidance notes are part of the Vedanta Sustainability Framework. We follow the principle of first reducing the waste, quantitatively as well as qualitatively (reducing the toxicity), and then performing the recovery and recycle (either ourselves or sold to authorised recyclers). The last priority is disposal in landfill or by incineration, using authorised, licensed and secured landfills. In FY2020, we recycled 88% of the high-volume-low-effect wastes such as fly ash, slag, and jarosite. For the second year in a row, we could reutilise more than 100% of the fly ash generated in the year, by recycling legacy waste.
high-Volume-low-Effect waste (million MT)
RecycledGenerated
Red Mud Jarosite Slag Fly Ash
0.14
2.23
6%
27% 116%
105%
0.15 0.57
1.00
11.9211.30
0.86
Water sprinklers at the Red Mud Pond in Lanjigarh
TAILINGS DAM MANAGEMENT Tailings dams and ash ponds are integral to Vedanta’s mining operations. However, they can cause significant damage to the environment and to the neighbouring communities if they are breached.
Vedanta oversees 18 active and 5 inactive, and 1 closed Tailings Management Facilities (TMFs). Our principle concern is to ensure the safety of the people who live downstream from our dams. All but one1 tailings facilities have undergone an independent audit and assessment in the last 12 months by Golder Associates. We have also introduced a tailings dam management standard to ensure that our Group companies adhere to standard practices while managing their dam structures.
WATER MANAGEMENTWater is a shared resource. While access to a steady water supply is critical for mining and smelting operations, it is an equally critical requirement for our host communities and the natural ecosystem and biodiversity of the area. The shared nature of this resource calls for all stakeholders to use it responsibly and we have taken several measures to reduce its consumption of water.
Our Group water policy administered through our water management standard is in place and our approach is to keep it as a core factor while
Critical aspects of Vedanta’s TMF standards:• Site selection must be based on a comprehensive environmental and social impact assessment, including economic, public health and safety risk over the life cycle of the tailing facility as per Good International Industry Practice• Dam break analysis must be conducted based on the advice of the designer/consultant to quantify the TMF-related risks if the TMF is located upstream or close to communities or in sensitive environmental areas• Design must be based on best available technology, to minimise the environmental, social, and economic risks, at optimal total cost of ownership over the life cycle of the operation
making decisions, either for a new project or an existing one. Water-screening assessment to identify sensitive water resources, aquatic habitats and any known or suspected water resource constraints in proximity to each operation, is a must and has been conducted by all our businesses. It ensures that our operations have built-in measures to evade, curtail, or where required, compensate its effect on water in their respective regions.
In the last year, we have collectively saved c.2.99 million m3 water through various conservation and efficiency programmes.
In keeping with stakeholder expectations on transparency of our tailings dam facilities, Vedanta has responded to the Church of England disclosure requirements. Details of the disclosure can be found on our website: www.vedantalimited.com
Some examples of these efforts include:• Increasing cycles of concentration at Jharsuguda Thermal Power Plant• Improvement of recycling rate of treated cooling tower blowdown at TSPL• Improvement of recycling rate of raw and process waste water at Skorpion Zinc• Reuse of Thermogravimetry (TG) condensate at HZL
1 Our facility at Skorpion Zinc underwent an audit in 2016.
PERFORMANCE
Water Consumption & Recycling (million m3) FY2020 FY2019 FY2018 FY2017
Total water consumption 255.10 243.44 241.66 241.56
Water recycled/reused 73.86 66.99 71.70 64.65
% Water recycled 28.95 27.52 29.67 26.76
Water mist canons, sheep rollers, soil blanketing, coir matting are innovations towards pollution control measures
Project Jalgram
ENVIRONMENTAL STEWARDSHIP CONTINUED...

INTEGRATED REPORT
06-115MANAGEMENT REVIEW
116-167STATUTORY REPORTS
168-270FINANCIAL STATEMENTS
271-502
82 VEDANTA LIMITED INTEGRATED REPORT AND ANNUAL ACCOUNTS 2019-20 VEDANTA LIMITED INTEGRATED REPORT AND ANNUAL ACCOUNTS 2019-20 83
AIR EMISSIONS We closely monitor the extent of any impact that our operations have on air quality and the effects and implications that this may have on employees, the communities local to our operations, and the broader environment. We are committed to using processes and technology that minimises any particulate release.
As part of our ambient air quality monitoring process, we monitor
CAsE sTuDy 01: A TuRnARounD AT ElECTRosTEEl sTEEls lImITED (Esl)Vedanta has grown inorganically, through acquisition. A key to its success has been its ability to turnaround sick companies – not just economically, but also in how they manage sustainability. ESL is no exception to this practice. In the 21 months since Vedanta acquired ESL, there has been significant work done to improve the environmental performance of the unit.
Suspended Particulate Matter (SPM), SOx and NOx. We also keep in check lead emissions in our zinc operations, fluoride emissions in our copper and
aluminium operations, and Polycyclic Aromatic Hydrocarbons (PAHs) in our aluminium operations as per our Environmental Management Standard.
PERFORMANCE
ALIGNING BUSINESS PRACTICES TO UN SUSTAINABLE DEVELOPMENT GOALS
Stack Emissions (in MT) FY2020 FY2019 FY2018 FY2017
Particulate matter 9,603 8,862 8,414 9,296
SOx 255,685 242,234 189,823 174,340
NOx 66,526 67,278 56,749 44,935
goal: sDg 13 – Climate Action goal: sDg 12 – Responsible Consumption & Production goal: sDg 15 – life on land
Target: 13.2. Integrate climate change measures into strategies, polices, and planning
Target: 12.5. Substantially reduce waste generation through prevention, reduction, recycling and reuse
Target: 15.1. Conserve, restore and sustainably use all terrestrial ecosystems
Employee Cleaning the plant premises under Swaach Bharath Abhiyan
CAsE sTuDy 02: DRy TAIlIngs DIsposAl sysTEm - ZAwARSafe and sustainable management of our tailings facilities in central to our site management plan. Most tailings contain 50-65% water, forming a slurry. This introduces several risks to the tailings dam structure and the adjoining communities and environment.
The installation and commissioning of dry tailing plant at the Zawar operations of HZL, brings higher water recovery, near elimination of water losses through seepage and evaporation, virtual stoppage of any probability of groundwater contamination through seepage and significant safety improvement, thus reducing the risk of a catastrophic dam failure. It is now possible to extract excess water (recirculation for mill operation) from tailings by introduction of this filtration plants to transform solid fractions into cake containing only 16% moisture.
Increase in Fly Ash and Blast Furnace Slag Reutilisation From reutilising only 10% of the generated fly ash, ESL has been able to utilise 100% of the generated volumes. This has been achieved by establishing sales agreement for fly ash with cement companies, where the by-product is used in several blended-cement applications. In FY2020, ESL transferred ~108,000 MT of fly ash to the cement companies.
A similar success story has been achieved with Bblast furnace slag, where ESL has increased reutilisation levels from 30% to 100% of the generated waste. This too has happened by collaborating with cement manufactures.
Fly Ash Management and Land Reclamation Low-lying areas within plant-boundaries are prone to flooding and can thus disrupt operations. One such area has been reclaimed
Key advantages of this structure include: � Recirculation of >90% of the
process water � Elimination of the risks of
catastrophic tailings flow when a slurry dam (TSF) fails � Safe stacking of tailings cakes even
in areas of high seismic activity
by using nearly 300,000 MT of fly ash. The area was levelled, lined with clay at the bottom layer, before moving the fly ash. laying in the plant premises for levelling. A layer of top-soil was then added and 50,000 saplings planted, thereby aiding in the biological reclamation of the land. This solution aided in reducing the risk of flooding as well as the spread of fly ash due to wind or water-related events.
Increase in Reutilisation Rates of ETP Treated Water Less than 1000 KL of Effluent Treatment Plant (ETP) water was reutilised in the plant every day. A project to identify losses and lay additional pipeline across the plant has seen the reutilization levels of the ETP treated water increased to 4,070 KL/day. The additional water is reutilised in the coke oven, blast furnace, sinter and lime, DIP, power plant, raw material handling and storage, sprinkling and greenbelt areas of the plant.
Waste Heat Recovery Our non-recovery type coke oven releases coke oven gas during its operation, which are in the temperature range of 110500◦C–11500◦C. In normal course, this waste gas will be released to the atmosphere, contributing to our overall emissions and negatively impacting the atmosphere. However, in order to recover the waste heat, we drive this waste heat through two specially designed boilers, which generate steam to run the turbines in our captive power plant. A total of 259,255 MWh of power is generated annually from the Waste Heat Recover Boilers (WHRB). This action has allowed us to reduce our coal usage by ~82,000 MT and reduce our GHG emissions by ~69,000 tCO2e/year.
� Reduction of risk of groundwater contamination through seepage � Reduction of storage footprint by
50% and enabling fast rehabilitation when approaching mine closure
Employee underground the Sindesar Khurd Mine
SDG Alignment sDg 12: Responsible Consumption & Production, sDg 13: Climate Action sDg 15: Life on Land
SDG AlignmentsDg 12: Responsible Consumption & Production
ENVIRONMENTAL STEWARDSHIP CONTINUED...

INTEGRATED REPORT
06-115MANAGEMENT REVIEW
116-167STATUTORY REPORTS
168-270FINANCIAL STATEMENTS
271-502
84 VEDANTA LIMITED INTEGRATED REPORT AND ANNUAL ACCOUNTS 2019-20 VEDANTA LIMITED INTEGRATED REPORT AND ANNUAL ACCOUNTS 2019-20 85
Less carbon emission due to processing on client premises reducing need to transport hot dross
Lesser energy consumed as cooling of dross is not required
Zero landfill - 100% dross is recycled
Runaya’s process is a game-changer for the Aluminum sector. Not only does it have the potential to eliminate a hazardous waste-stream, but it converts that waste into value-added products. It is a sustainable solution in the truest sense – addressing environmental, economic, and social aspects.
Ajay Kapur CEO Vedanta Aluminium & Power
EXPLORING A CIRCULAR BUSINESS MODEL Every year the metals & mining industry produces ~174 billion MT of waste. Not only are these waste volumes great, but they often contain traces of heavy metals and chemicals. At best, these wastes result in large tracts of land being used to safely store them, and at worst, they can cause significant harm to environment and society, in instances of run-off or a breach in the storage areas.
For many years, the industry has been evaluating solutions to minimize and reuse these wastes, however these have been imperfect, and often-times result in the generation of alternate waste-streams. It is estimated that nearly 40% of this waste can be recycled and converted into value-added-products.
In India, the unscientific disposal of hazardous waste has become a significant environmental issue. One reason is the growing unavailability of secure landfill sites to safely store this waste.
At Vedanta, we follow the waste hierarchy principles of reduce, reuse, recycle and dispose/store responsibly. Given the large volumes of waste we generate, we are always on the lookout for technologies or partners who can help us convert this “waste to wealth”. Enter Runaya Refining and their technology-enabled sustainable solutions for mineral waste processing.
RunAyA – CREATIng CIRCulAR EConomy SOLUTIONS FOR THE METALS & MINING INDUSTRYThe world produces ~65 MMT of aluminium every year. Approximately 1.5% of the total quantity is lost in the form of aluminium dross – a by-product – that contains recoverable aluminium, aluminium nitrides and oxides, spinel, dimagnesium silicate, gupeiite, and sodium titanate. Aluminium dross is classified as a hazardous waste under the prevailing Indian Environmental regulations due to its potential environmental and health impacts. Current practice is to responsibly dispose this waste by sending it to State authorized recyclers/
A PARTNERSHIP ON THE BRINK OF A REVOLUTIONA circular economy is one that is restorative by design, aiming to keep products and components and materials at their highest utility and value at all times.
The solution being offered by Runaya is an example of what is possible for the aluminium industry and fulfills our vision of “zero waste” by eliminating a hazardous waste-stream. Vedanta is excited to partner with them and usher in a revolution for the resources sector in more ways than one.
re-processors who process the waste as per approved guidelines by the Central Pollution Control Board. Recyclers attempt to recover aluminium from the dross, but because they handle cold dross, the recovery is limited to ~20% metal by weight from the dross.
The proprietary high-end technology used by Runaya breaks up the recovery process into two-stages – (i) Recovery from the hot dross, and (ii) Recovery from the cold dross. The combined effect is that one is able to recover ~40% of the metal by weight (or 90% of the metal present in the dross). This is a significant jump, resulting in improving the economic viability of the process. Also given that it is processing the dross in its melted state in stage 1, there is a significant reduction in the energy requirements compared to other solutions in the market.
Additionally, in keeping with Vedanta’s “Zero Waste” philosophy, Runaya, which has a technological tie-up with TAHA International S.A (Luxemburg), is able to take the non-metallic portions of the residual dross and process it to produce briquettes that can be used as slag conditioner in the steel industry.
The end result is that 100% of the dross can be reutilized – through metal recovery and the creation of a value-added-product. This eliminates the amount of waste sent to secure landfills and is an environmentally safe way of utilizing a hazardous waste. It also decreases the dependence on the other raw materials used as slag conditioners in the steel industry – thereby living up to the ideals of circular manufacturing and circular economy.
Runaya Refining Site, Odisha
ENVIRONMENTAL STEWARDSHIP
Mining
Waste
Metals
Waste
Consumer
Waste
Current Linear Economy
Potential Circular Economy
Press Cooling and processing
Manual Hand
Picking
TRADITIONAL DROSS PROCESSING RUNAYA'S PROCESS INOVATION
10-15%Aluminium Recovery
10%Aluminium Recovery
35%Aluminium Recovery
5%Aluminium Recovery
60%Sag
Briquettes
-75%Landfill
0%Landfill
Hot Dross
Planted Hot Dross processing
Cold Dross processing
Steel Slag Conditioner Production

INTEGRATED REPORT
06-115MANAGEMENT REVIEW
116-167STATUTORY REPORTS
168-270FINANCIAL STATEMENTS
271-502
86 VEDANTA LIMITED INTEGRATED REPORT AND ANNUAL ACCOUNTS 2019-20 VEDANTA LIMITED INTEGRATED REPORT AND ANNUAL ACCOUNTS 2019-20 87
SOCIAL FOCUS
EMPOWERING COMMUNITIES FOR INCLUSIVE GROWTHRetaining the trust of our host communities is central to our ability to do business. In many instances, we are the primary economic driver where we operate. This places us in a unique position to significantly impact the lives of local communities, whether as employers and business partners or through our community development interventions. We take this responsibility seriously and endeavour to fulfil our role in a manner that upholds the dignity of all our stakeholders and allows us to live up to our values.
The Vedanta Sustainability Framework and its associated standards and policies guide our work on social performance. In areas with indigenous populations, we are committed to following the principles of Free, Prior, Informed Consent (FPIC). With its genesis in the UN Declarations of Rights of Indigenous Peoples, it has been adopted as a best practice by the IFC and ICMM.
Our CSR Council, led by a senior business leader, and including CSR Heads and CSR Executives from all business units, meets every month and reviews the performance, spends and outcome of CSR programmes across units. Governed by our in-house CSR Policy and Sustainability Framework, the Council is responsible for governance, synergy and cross-learning across the Group CSR efforts. The Board CSR Committee comprises senior Independent Directors; and apart from providing strategic direction for CSR activities, it also approves plans and budgets, and reviews progress of the initiatives.
Securing and retaining one’s social licence to operate is an outcome resulting from a Company’s ability to garner the trust of the communities where it operates. Social performance frameworks are a good mechanism to measure, manage, and monitor this aspect of the business.
In FY2020, we took the first steps to developing a holistic approach to improving our social performance. Taking help from experts in this
PERFORMANCE & SOCIAL LICENCE TO OPERATE
Access to affordable and quality healthcare
field, Vedanta conducted a cross-BU review of the maturity of our businesses with respect to the social performance framework. Additionally, perception surveys were also conducted at our key locations to understand the viewpoints of our local stakeholders. Learnings from both these exercises are being studied and in FY2021, we will be conducting a year-long social performance pilot programme at two of our operational sites to evolve our social performance approach.
Learning is enjoyable at Nand Ghar 49 Nand Ghars are operating in Barmer, Rajasthan
Training Youth to build a better future
Community Healthcare initiatives at BALCO
COMMUNITY DEVELOPMENT PROGRAMMESVedanta has one of the most extensive community development programmes in the country. During FY2020, we spent ₹296 crores to help communities enhance their quality of life through various interventions. An overview of these programmes is given below.
Types of InterventionsSupport to Primary Health Centres; HIV/AIDS awareness programmes; Health camps; Mobile Health Vans; Specialist doctor support; Nutrition programmes; Vedanta-run hospitals; Health awareness drives
Key Features
HEALTHCARE
35
1.9 million
initiatives across our Group companies
people benefit from these programs
More than
Nearly
Types of InterventionsAnganwadis and child-care centres; Public school infrastructure support (including sanitation); Scholarships and Teacher training; Digital classrooms & Computer-aided learning centres; Libraries; Vedanta-run Schools; Exam preparation counselling; Career counselling Science Fairs
Key Features
ChIlDREn’s wEll-BEIng AnD EDuCATIon
50
300,000
initiatives across our Group companies
children benefit from these programmes
More than
Nearly

INTEGRATED REPORT
06-115MANAGEMENT REVIEW
116-167STATUTORY REPORTS
168-270FINANCIAL STATEMENTS
271-502
88 VEDANTA LIMITED INTEGRATED REPORT AND ANNUAL ACCOUNTS 2019-20 VEDANTA LIMITED INTEGRATED REPORT AND ANNUAL ACCOUNTS 2019-20 89
A woman at Cairn Oil & Gas enabled borewell
Caption to be placed here
Types of InterventionsSelf-Help Groups (SHG); Women’s co-operatives; Micro-enterprises
Key Features
WOMEN’S EMPOWERMENT
15 initiatives across our Group companies
More than
More than women
More than
48,000
3,100 SHGs &
250+
benefit from these programs
micro-enterprises formed
Types of InterventionsProvision of drinking water; Construction of toilets; RO plant setup; Digging of borewells; Handpump repair/installation; Sanitation drives
Key Features
DRINKING WATER & SANITATION
24
388,000
initiatives across our Group companies
people benefit from these programmes
Nearly
Vocational training activities to encourage self-sustenance
SKILLING YOUTH
Types of InterventionsSewing centres; Vocational training centres; Technical & computer literacy programmes; Traditional crafts and painting training
Key Features
10 initiatives across our Group companies
More than
More than 3,900 youth trained
AGRICULTURE & ANIMAL HUSBANDRY
Types of InterventionsClimate-change adaptation; Wadi-based agriculture; Water-shed rejuvenation; Agriculture-based natural resource management; Dairy and livestock development; Farmer training; SHGs; Co-operatives; Veterinary care; Irrigation channel maintenance
Key Features
12 initiatives across our Group companies
More than
More than 90,000 farmers benefited
Project unnati-vegetable cultivation
Cairn supported dairy cooperatives are procuring close to 15,500 litres of milk daily.
CSR Initiative- Community Health Center at Amona
Poultry farming supported by Cairn Foundation in Barmer
COMMUNITY INFRASTRUCTURE
Types of InterventionsTube-wells/Open-wells/Borewells; Check-dams; Roads; Parks; Public education infrastructure; Community centres; Health centres; Village walls & gates; Renovation of sports complexes; Temples Irrigation channels; Drains; Bus stands; Street lights; Ponds; Public CCTV installations
Key Features
20 initiatives across our Group companies
More than
people and
More than 200,0004,000+ families
benefit fromthese programmes
SOCIAL FOCUS CONTINUED...
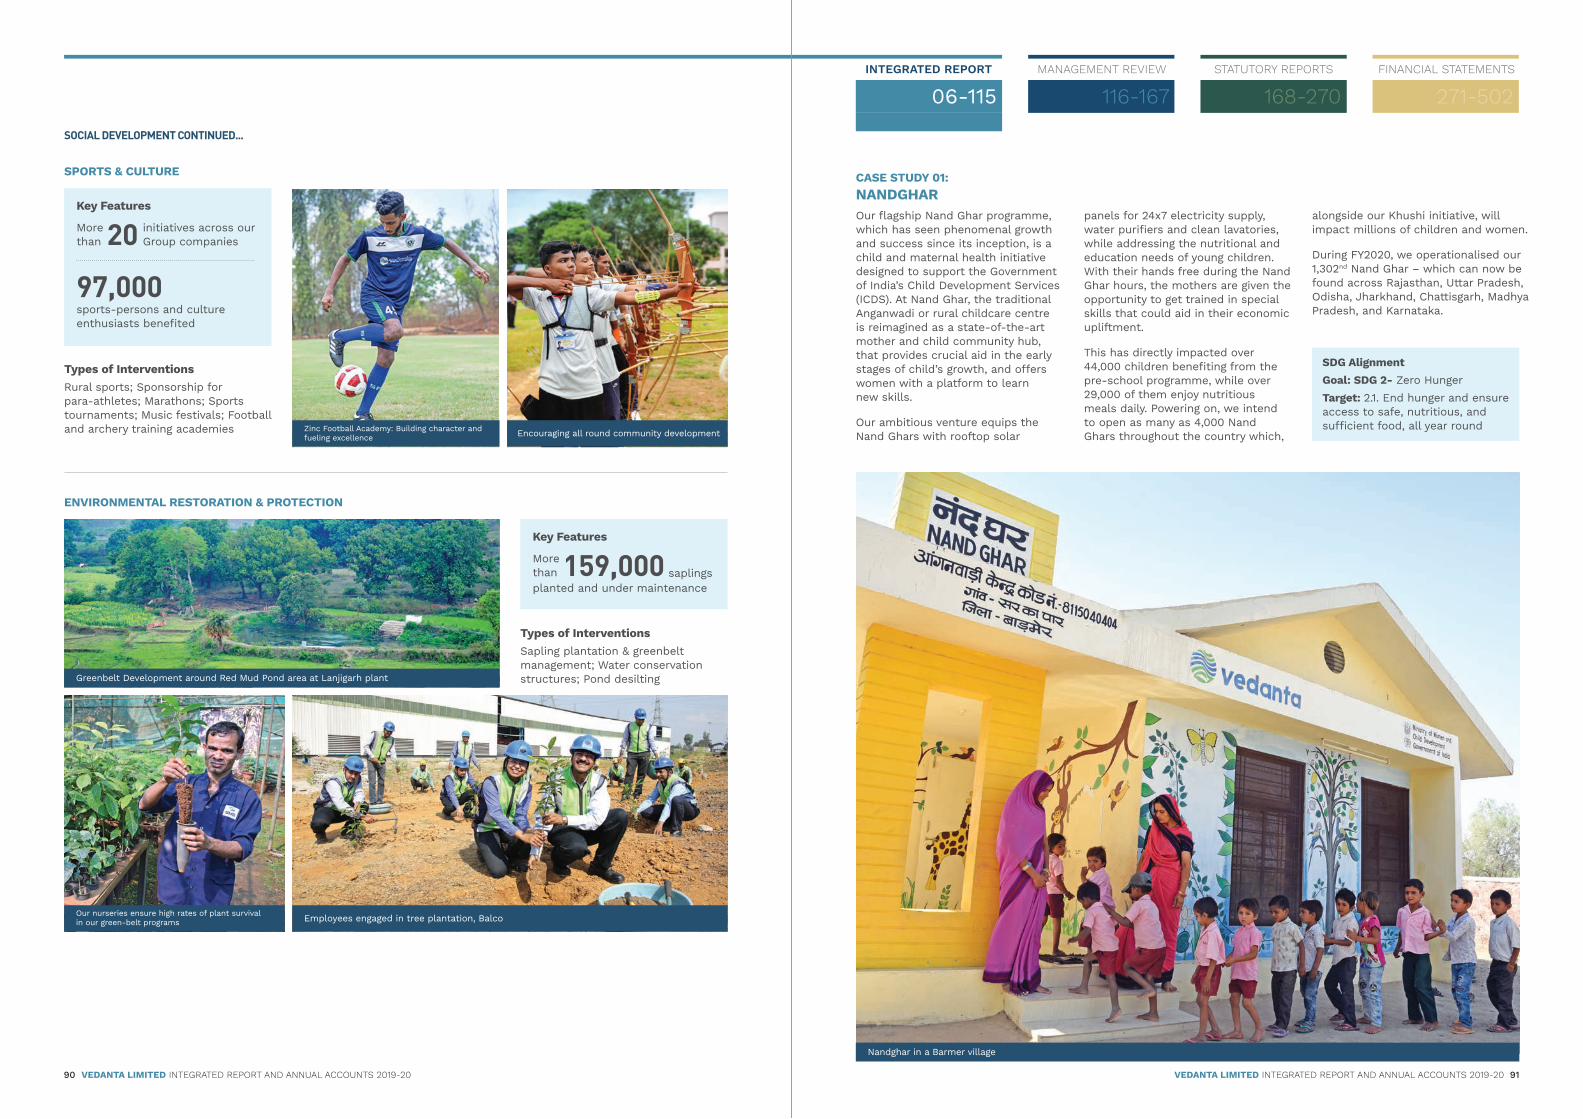
INTEGRATED REPORT
06-115MANAGEMENT REVIEW
116-167STATUTORY REPORTS
168-270FINANCIAL STATEMENTS
271-502
90 VEDANTA LIMITED INTEGRATED REPORT AND ANNUAL ACCOUNTS 2019-20 VEDANTA LIMITED INTEGRATED REPORT AND ANNUAL ACCOUNTS 2019-20 91
Zinc Football Academy: Building character and fueling excellence Encouraging all round community development
Types of InterventionsRural sports; Sponsorship for para-athletes; Marathons; Sports tournaments; Music festivals; Football and archery training academies
Key Features
SPORTS & CULTURE
20 initiatives across our Group companies
More than
97,000sports-persons and culture enthusiasts benefited
ENVIRONMENTAL RESTORATION & PROTECTION
Types of InterventionsSapling plantation & greenbelt management; Water conservation structures; Pond desilting
Key Features
159,000 planted and under maintenance
More than saplings
Greenbelt Development around Red Mud Pond area at Lanjigarh plant
Employees engaged in tree plantation, BalcoOur nurseries ensure high rates of plant survival in our green-belt programs
Our flagship Nand Ghar programme, which has seen phenomenal growth and success since its inception, is a child and maternal health initiative designed to support the Government of India’s Child Development Services (ICDS). At Nand Ghar, the traditional Anganwadi or rural childcare centre is reimagined as a state-of-the-art mother and child community hub, that provides crucial aid in the early stages of child’s growth, and offers women with a platform to learn new skills.
Our ambitious venture equips the Nand Ghars with rooftop solar
CAsE sTuDy 01:NANDGHAR
panels for 24x7 electricity supply, water purifiers and clean lavatories, while addressing the nutritional and education needs of young children. With their hands free during the Nand Ghar hours, the mothers are given the opportunity to get trained in special skills that could aid in their economic upliftment.
This has directly impacted over 44,000 children benefiting from the pre-school programme, while over 29,000 of them enjoy nutritious meals daily. Powering on, we intend to open as many as 4,000 Nand Ghars throughout the country which,
alongside our Khushi initiative, will impact millions of children and women.
During FY2020, we operationalised our 1,302nd Nand Ghar – which can now be found across Rajasthan, Uttar Pradesh, Odisha, Jharkhand, Chattisgarh, Madhya Pradesh, and Karnataka.
Nandghar in a Barmer village
SDG Alignmentgoal: sDg 2- Zero HungerTarget: 2.1. End hunger and ensure access to safe, nutritious, and sufficient food, all year round
SOCIAL DEVELOPMENT CONTINUED...

INTEGRATED REPORT
06-115MANAGEMENT REVIEW
116-167STATUTORY REPORTS
168-270FINANCIAL STATEMENTS
271-502
92 VEDANTA LIMITED INTEGRATED REPORT AND ANNUAL ACCOUNTS 2019-20 VEDANTA LIMITED INTEGRATED REPORT AND ANNUAL ACCOUNTS 2019-20 93
HZL has spearheaded significant work on water preservation, considering that its operations are located in the water stressed state of Rajasthan. In addition to the work done to reduce the dependence of its operating sites on local water bodies, HZL has also instituted water management projects in its local communities.
FATEH SAGAR LAKE DEEPENING PROJECT AT UDAIPUR Vedanta, in association with the Urban Development Trust (UIT) of Udaipur has taken up the Fateh Sagar Lake deepening initiative, by desilting the lake during dry periods.
The desilting process has deepened the lake by increasing the catchment area and allowing trapping of more water in the rainy season, helping preserve water longer in those years with weak monsoons.
This project aims at improvement of lake biodiversity and creates a safe place for migratory birds.
CAsE sTuDy 02: BEyonD ThE FEnCE - ponD DEEpEnIng pRojECT
Groundwater Recharge Study, Bhilwara
At Fatehsagar Lake, Udaipur
Livelihood programmes are central to the community development activities undertaken by Vedanta. As the largest private entity in many of the areas where we operate, community members look towards our organisation to improve their economic circumstances.
Where possible we have tried to integrate community members into our workforce or into our supplier network. For others, we have established robust, tested, livelihood programmes to help individuals gain new skills, allowing them to add new or enhanced sources of income.
Some success stories are given below:
Self-Help Groups (SHGs) are another way to empower women and enhance family incomes. Build on the community-loan model, SHGs help women entrepreneurs start their own micro-enterprises – either individually or in a group. Women who have participated in these programmes have started tailoring units, farms, toy making, among other endeavours. These activities have not only supplemented their household incomes, but also empowered them to become independent members of society.
A third model involves the setting up of technical training centres, which teach individuals the skills to become part of the modern workforce. From call centre training provided by Cairn to the vocational training programmes such as plumbing, electrician, machine operators, among others – these programmes have allowed individuals to becoming primary wage earners for their families. HZL’s skill development programmes have a wide range of options to cater to each segment of youth from those who have attended secondary
The agriculture support programme managed by the BALCO CSR team provides soil testing, fencing infrastructure, fertiliser and seed-based input support, and technical training programmes. This intervention has motivated several farmers to adopt modern farming techniques such as System of Rice Intensification (SRI), which has doubled yields and enhanced incomes. Many farmers have also diversified their crops, further enhancing family incomes.
CAsE sTuDy 03: ENHANCING LIVELIHOODS IN COMMUNITIES
Enhancing agricultural incomes through innovative techniques
Developing communities through women empowerment
Developing communities through women empowerment
Employees at integrated facility, Jharsuguda
schooling to graduates, ITI & diploma-holders. Training partnerships with automobile companies such as Maruti Suzuki have provided participants with a two-year ITI degree, along with a stipend.
SDG Alignmentgoal: sDg 6- Clean Water and SanitationTarget: 6.6. Protect and restore water-related eco-systems
SDG Alignmentgoal: sDg 8 - Economic Growth & Decent Work for AllTarget: 8.6 Reduce youth unemployment, illiteracy, unproductivity
SOCIAL DEVELOPMENT CONTINUED...

INTEGRATED REPORT
06-115MANAGEMENT REVIEW
116-167STATUTORY REPORTS
168-270FINANCIAL STATEMENTS
271-502
94 VEDANTA LIMITED INTEGRATED REPORT AND ANNUAL ACCOUNTS 2019-20 VEDANTA LIMITED INTEGRATED REPORT AND ANNUAL ACCOUNTS 2019-20 95
SAFETY
COMMITTED TO EMPLOYEE SAFETY AND WELLBEINGIt is a matter of extreme regret that we lost seven colleagues in work-related accidents during the year. We share the pain of their loved ones and are conveying our deepest condolences to them. Their loss is a hard reminder for us to continuously work to strengthen and improve our safety management systems.
Employees at Cairn Oil & Gas
At the beginning of FY2020, we observed an increasing trend in safety incidents, leading to fatalities within our workforce, over the past three years. This was a matter of grave concern, because within the same period, we had invested heavily in several systems and standards, which were introduced to ensure a safe, injury-free workplace.
To understand the rationale behind this anomaly, the Group ExCo along with our Group HSE teams went on to analyse the situation and developed a way forward.
The team determined that while the existing controls are important and development and monitoring of these needs to continue, given the nature of the safety incidents (70% repeats, >90% impacting our business partners) the following three areas required management attention:
Visible Felt LeadershipWhere the expectation for leaders and support personnel is to spend quality time in the field performing safety interactions, workplace hazard reviews, along with making proactive & hands-on safety interventions
Manage Safety Critical TasksWhere the expectation is that safety critical tasks are identified, critical competencies and controls documented in SOPs and the task leader verifies these are in place every time
Business Partner Engagement Where the expectation is that long-term business partners are treated as employees for safety purposes and
In addition, several businesses have also taken on additional work to benchmark themselves and adopt best practices from some of the leading global safety frameworks. Specifically, they have engaged with the British Safety Council (BSC) to conduct audits and follow-up capacity building programmes.
All the major locations of our Oil & Gas business have received a 5-star rating from the British Safety Council. Similarly, a majority of our businesses have undertaken and achieved 5S certification, thereby significantly improving housekeeping practices and fulfilling our FY2019 goal of achieving >90% score in 5S.
This improvement, will decrease the safety incidents from occurring. An overview of our safety performance is given below:
Ensuring safety is a top priority
short-term/project-specific business partners are managed via deployment of suitable supervisors
These management areas have been taken up to bring significant and lasting change in the manner we manage safety.
While the final outcomes will be visible over a multi-year timeframe, key improvements include: • A plateauing of our fatality count• Significant rise in the amount of time business leaders are spending on the shop-floor, making safety interventions. SOPs and training manuals have been created for these individuals so that their interventions are found to be effective• A review by businesses of their safety critical tasks followed by an update of their risk documents as well as permit-to-work process flows• A review of our business partner pre-qualification and onboarding processes and the establishment of a committee to aid our business partners enhance their safety systems, with a focus on those vendors who do heavy maintenance and construction activities at our facilities• The development of a right-to- refuse campaign, to educate our workforce on their right to refuse or stop unsafe work. The campaign will be launched in Q1FY21• Improved reporting of all safety incidents, which are recorded, investigated and actions developed to prevent re-occurrences
7
5
9 97
FY 18FY 17FY 16 FY 19 FY 20
Fatalities
Employees at Hindustan Zinc
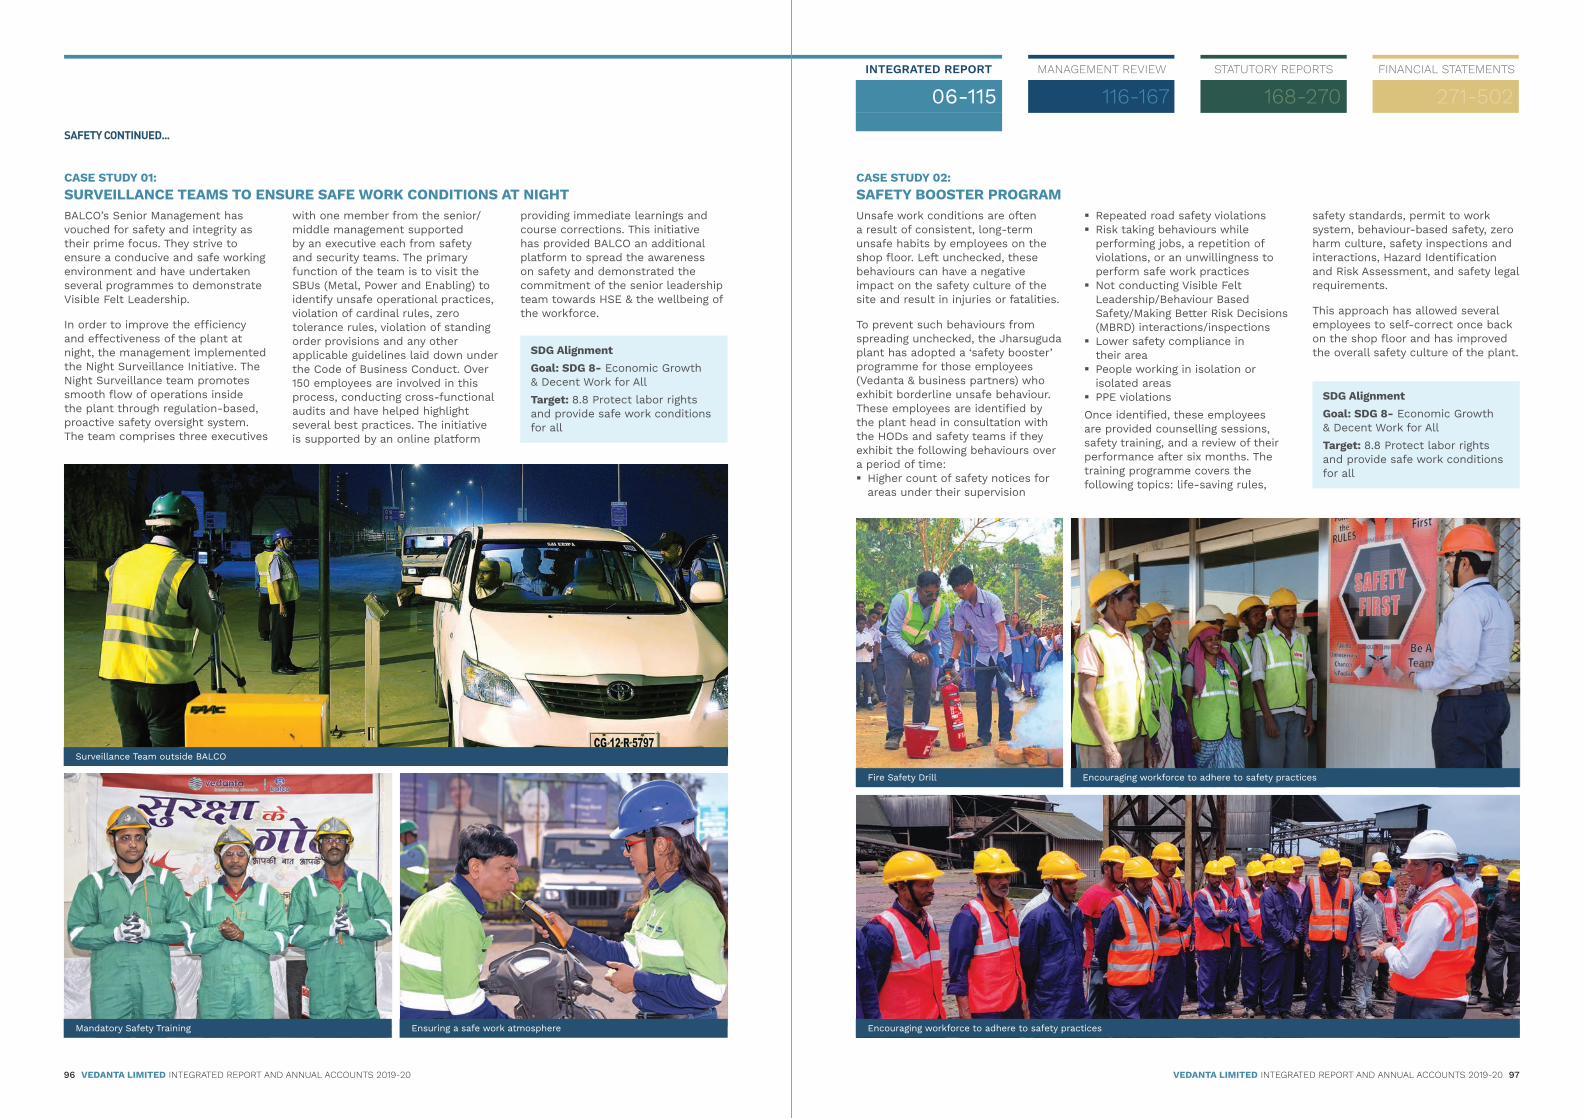
INTEGRATED REPORT
06-115MANAGEMENT REVIEW
116-167STATUTORY REPORTS
168-270FINANCIAL STATEMENTS
271-502
96 VEDANTA LIMITED INTEGRATED REPORT AND ANNUAL ACCOUNTS 2019-20 VEDANTA LIMITED INTEGRATED REPORT AND ANNUAL ACCOUNTS 2019-20 97
BALCO’s Senior Management has vouched for safety and integrity as their prime focus. They strive to ensure a conducive and safe working environment and have undertaken several programmes to demonstrate Visible Felt Leadership.
In order to improve the efficiency and effectiveness of the plant at night, the management implemented the Night Surveillance Initiative. The Night Surveillance team promotes smooth flow of operations inside the plant through regulation-based, proactive safety oversight system. The team comprises three executives
CAsE sTuDy 01: SURVEILLANCE TEAMS TO ENSURE SAFE WORK CONDITIONS AT NIGHT
Surveillance Team outside BALCO
Ensuring a safe work atmosphereMandatory Safety Training
with one member from the senior/middle management supported by an executive each from safety and security teams. The primary function of the team is to visit the SBUs (Metal, Power and Enabling) to identify unsafe operational practices, violation of cardinal rules, zero tolerance rules, violation of standing order provisions and any other applicable guidelines laid down under the Code of Business Conduct. Over 150 employees are involved in this process, conducting cross-functional audits and have helped highlight several best practices. The initiative is supported by an online platform
providing immediate learnings and course corrections. This initiative has provided BALCO an additional platform to spread the awareness on safety and demonstrated the commitment of the senior leadership team towards HSE & the wellbeing of the workforce.
Unsafe work conditions are often a result of consistent, long-term unsafe habits by employees on the shop floor. Left unchecked, these behaviours can have a negative impact on the safety culture of the site and result in injuries or fatalities.
To prevent such behaviours from spreading unchecked, the Jharsuguda plant has adopted a ‘safety booster’ programme for those employees (Vedanta & business partners) who exhibit borderline unsafe behaviour. These employees are identified by the plant head in consultation with the HODs and safety teams if they exhibit the following behaviours over a period of time: � Higher count of safety notices for
areas under their supervision
CAsE sTuDy 02: SAFETY BOOSTER PROGRAM
Encouraging workforce to adhere to safety practices
Fire Safety Drill Encouraging workforce to adhere to safety practices
� Repeated road safety violations � Risk taking behaviours while
performing jobs, a repetition of violations, or an unwillingness to perform safe work practices � Not conducting Visible Felt
Leadership/Behaviour Based Safety/Making Better Risk Decisions (MBRD) interactions/inspections � Lower safety compliance in
their area � People working in isolation or
isolated areas � PPE violations
Once identified, these employees are provided counselling sessions, safety training, and a review of their performance after six months. The training programme covers the following topics: life-saving rules,
safety standards, permit to work system, behaviour-based safety, zero harm culture, safety inspections and interactions, Hazard Identification and Risk Assessment, and safety legal requirements.
This approach has allowed several employees to self-correct once back on the shop floor and has improved the overall safety culture of the plant.SDG Alignment
goal: sDg 8- Economic Growth & Decent Work for AllTarget: 8.8 Protect labor rights and provide safe work conditions for all
SDG Alignmentgoal: sDg 8- Economic Growth & Decent Work for AllTarget: 8.8 Protect labor rights and provide safe work conditions for all
SAFETY CONTINUED...

INTEGRATED REPORT
06-115MANAGEMENT REVIEW
116-167STATUTORY REPORTS
168-270FINANCIAL STATEMENTS
271-502
98 VEDANTA LIMITED INTEGRATED REPORT AND ANNUAL ACCOUNTS 2019-20 VEDANTA LIMITED INTEGRATED REPORT AND ANNUAL ACCOUNTS 2019-20 99
PEOPLE AND CULTURE
Vedanta has always aspired to build a culture that demonstrates world-class standards in safety, environment and sustainability. People are our most valuable asset and we are committed to providing all our employees with a safe and healthy work environment.
Our culture exemplifies our core values and nurtures innovation, creativity and diversity. We align our business goals with individual goals and enable our employees to grow on a personal as well as professional front.
VEDANTA VALUES THAT DRIVE THE ORGANISATIONAL CULTURE
SEVEN PILLARS OF VEDANTA
The whole working of Vedanta is based on these seven pillars. It is a continuous process of aligning all our methodologies and way of life to these pillars.
ENTREPRENEURSHIP People are at the heart of everything we do. We create an enabling environment to support them in pursuing their goals.
RESPECTWe place an emphasis on human rights and respect the principle of free, prior, informed consent, while our engagements with stakeholders give local communities the opportunity to voice their opinions and concerns.
EXCELLENCEOur primary focus is on delivering performance of the highest standard. We are constantly looking at ways to reduce costs and increase production in our businesses through benchmarking best practices and employee participation.
TRUST We actively foster a culture of transparency in our interactions and encourage an open dialogue which ensures mutual trust and respect.
CARE We are committed to our triple bottom line of ‘People, Planet and Prosperity’ to create a sustainable future in a ‘zero-harm, zero waste and zero discharge’ environment for our communities.
INTEGRITY We engage ethically and transparently with all our stakeholders, taking accountability for our actions. We maintain the highest standards of professionalism and stringently comply with all international policies and procedures.
INNOVATION We encourage innovation that leads to zero harm, zero waste and zero discharge, and we are committed to optimising the use of our natural resources, improving efficiencies and maximising recoveries of by-products.
Sustainability, Health, Safety &
Environment
QualityPeopleGiving
back to society
Values, Ethics &
GovernanceGrowth
Digitalisation, Innovation, Technology
& Excellence
FOSTERING A VALUE-DRIVEN CULTURE
Sesa Goa Employees

INTEGRATED REPORT
06-115MANAGEMENT REVIEW
116-167STATUTORY REPORTS
168-270FINANCIAL STATEMENTS
271-502
100 VEDANTA LIMITED INTEGRATED REPORT AND ANNUAL ACCOUNTS 2019-20 VEDANTA LIMITED INTEGRATED REPORT AND ANNUAL ACCOUNTS 2019-20 101
Standing firm on the ‘Digitalisation, Innovation, Technology & Excellence’ pillar of Vedanta, various initiatives were introduced on the people front to enhance process efficiency and maintain a competitive edge.
Our recruitment programme includes a wide range of initiatives to support us in hiring skilled professionals across different functions and businesses.
Right Management in Place (RMIP)To re-emphasise the Group’s philosophy of empowering the SBUs, we have reviewed our existing businesses and SBU structures, and followed a rigorous assessment process to ensure we engage the right talent in the right role. The RMIP process also ensures that we have filled all the critical roles within our structures and any gaps in the management team are supported by strategic plans to fill vacancies. Our approach to recruitment is focused on hiring diverse, high-quality talent. We operate our businesses with global best practices and are benchmarked to global standards. Therefore, wherever needed, we also hire expats and specialists with world-class expertise and experience to manage such operations.
DIGITALISATION INITIATIVES
RECRUITMENT
Vedanta Leadership Development Programme (VLDP)VLDP is our flagship programme which aims to build organisational capability by developing talented individuals from premier management and technology institutes. It is a tailored programme which focuses on nurturing bright young minds to act as catalysts to steer our business to the next level of growth by implementing transformational new-age ideas. The programme includes induction sessions and cross-functional projects in significant roles, job rotation, development opportunities, and continuous anchoring to ensure that these individuals get an in-depth knowledge of our operations and recognise their areas of interest for a suitable role.
Campus Analytics DashboardWe partnered with a reputed analytics firm to analyse and derive insights from our experiences with various college campuses and campus recruits over the years. As a result, we now have an exhaustive dashboard which provides key insights for shaping up our campus hiring strategy and onboarding and anchoring young talent.
Diversity Hiring ProjectAt Vedanta, we see ourselves as an engine of inclusive growth that operates at scale, and ushers in prosperity for a large section of the society. In line with our vision to achieve 33% diversity across the group, we have launched a project to bring onboard diversity leaders across Technical, Operations and Enabling functions which will help us strengthen representation of women leaders in business and SBU ExCo. Through this project, we are looking at hiring ~30-40 women professionals across our various businesses and locations. In the last one year, we made significant progress in increasing the diversity representation in Group ExCo from 5% to 21%.
Employees at Hindustan ZInc Building talent through teamwork at Balco
V-AccelerateAn end-to end online Internal Job Posting (IJP) portal was launched in FY2020 which was developed inhouse. The portal will add a great value to increase transparency and significantly reduce lead time in internal movements for filling up vacancies across the Group with internal talent.
MIP DashboardAs part of our digitalisation initiatives, we developed the MIP Dashboard which provides a complete view of the ExCo structure at Group Level, ensuring that we have visibility of all leaders at the click of a button.
TALENT MANAGEMENT AND DEVELOPMENT
V-Reach: graduate Development ProgrammeAt Vedanta, we have a strong and unwavering focus on identifying and developing internal talent from within. We have a 5,000+ strong talent pool who joined us as
Mentoring and peer learning is a big part of working at Vedanta
Employees at operational site, Vedanta Limited, Jharsuguda
Employees at Cairn Oil & Gas Vedanta advocates fun team building activities
Leadership Performance ScorecardWe take great pride in our performance-driven culture where every individual is motivated to contribute to the best of his/her potential. It is with this focus that we launched the ‘Leadership Performance Scorecard’, an initiative which aims to drive accountability and performance for our senior leaders aligned to their respective business, function, role and with the overall objectives of the organisation.
Top 50 Young Talent Anchoring ProgrammeAt Vedanta, identifying and grooming business leaders for tomorrow and providing them with business exposure (in terms of higher responsibility, better visibility, differentiated rewards, focused guidance and support structure to perform) have formed a key part of our people agenda. In line with this, we launched the Top 50 Young Talent Anchoring Programme, where we have identified 50 young and high-potential candidates with digital and analytical mindset from our pool of 350+ VLDPs, Management Trainees & Chartered Accountants. These candidates have joined us
The performance scorecard covers ~570 senior leaders, diversity leaders and advisors across the Group and provides a quarterly scorecard on-the-basis of goals and achievements for rewards and development. The entire exercise is being executed in a very objective and transparent manner, aimed at recognising and further growing our top performing leaders, assisting those facing challenges and addressing any performance issues.
from campuses in the last two years, for anchoring directly by the senior leaders of the Group. This young talent
is being centrally mentored by our high-performing senior leaders to fast track their career growth into future CXOs.
graduates, who form the backbone of our businesses. To identify top 100 talent from this graduate talent pool and provide them elevated roles and opportunities, we launched V-Reach, which will fast track their career growth within the Group. The project
will be carried out in two steps. First ~300 potential leaders will be identified via desktop analysis based on objective parameters. Next, all the selected candidates will go through a structured Chairman’s Workshop to identify the Top 100 leaders.
PEOPLE AND CULTURE CONTINUED...
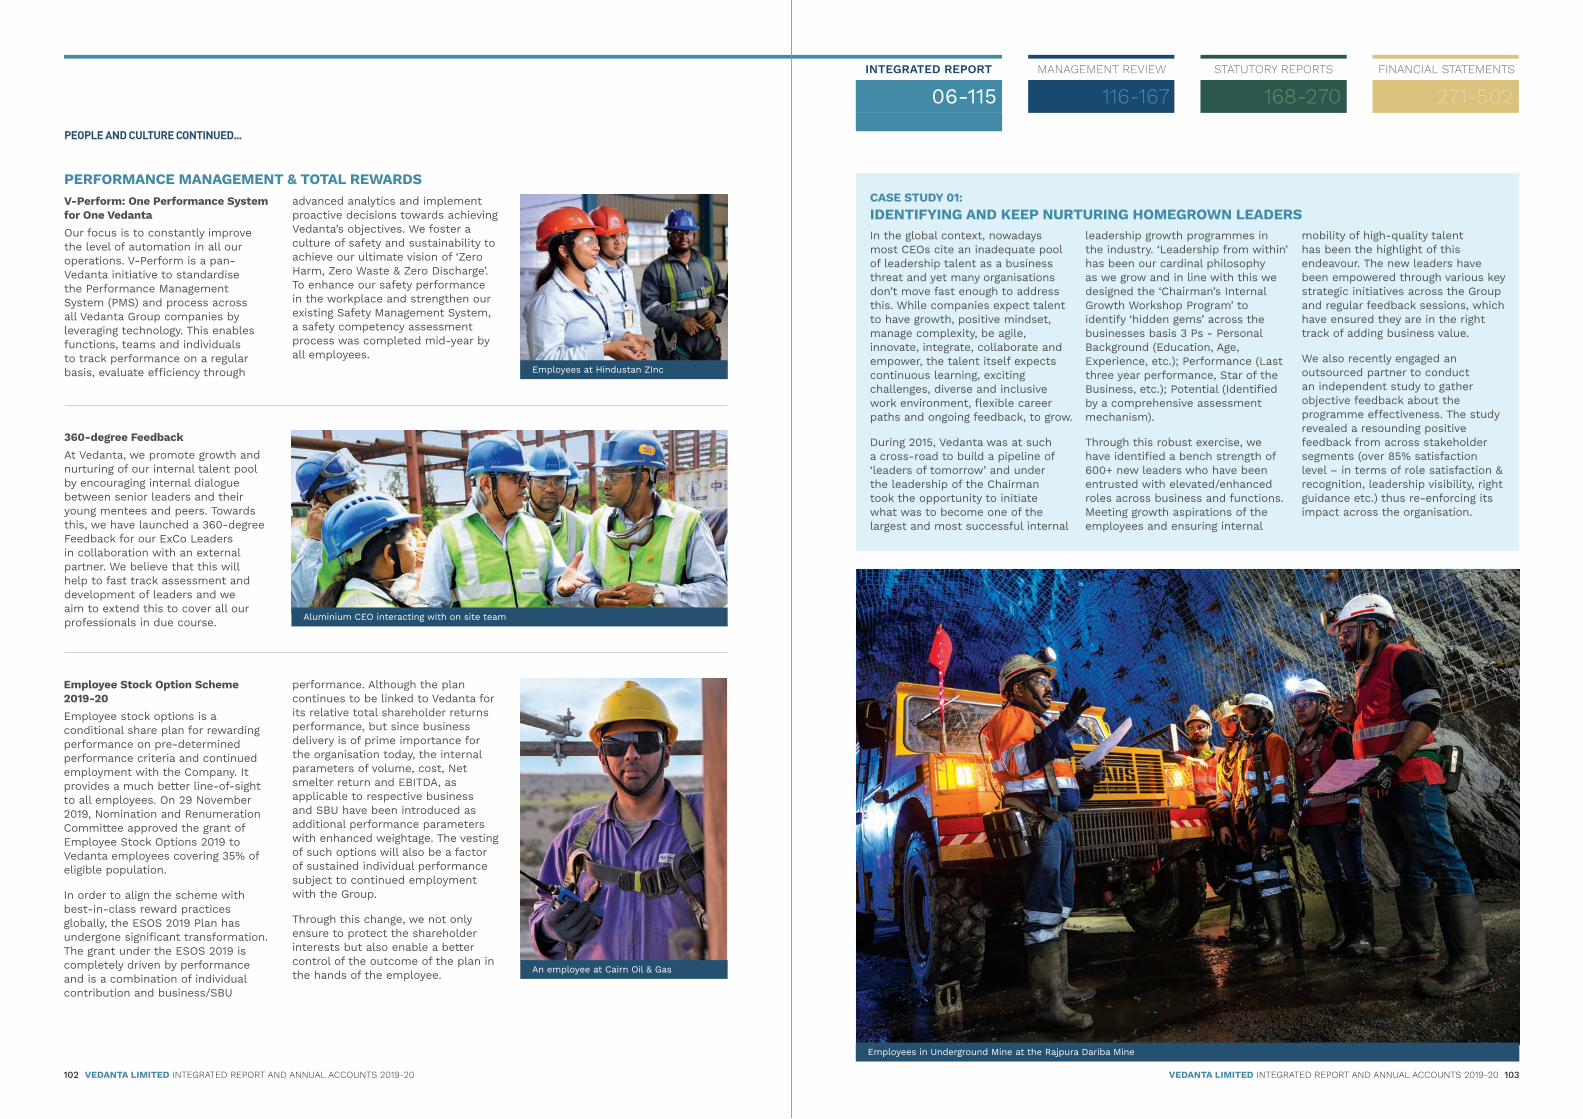
INTEGRATED REPORT
06-115MANAGEMENT REVIEW
116-167STATUTORY REPORTS
168-270FINANCIAL STATEMENTS
271-502
102 VEDANTA LIMITED INTEGRATED REPORT AND ANNUAL ACCOUNTS 2019-20 VEDANTA LIMITED INTEGRATED REPORT AND ANNUAL ACCOUNTS 2019-20 103
PERFORMANCE MANAGEMENT & TOTAL REWARDS
Employee Stock Option Scheme 2019-20Employee stock options is a conditional share plan for rewarding performance on pre-determined performance criteria and continued employment with the Company. It provides a much better line-of-sight to all employees. On 29 November 2019, Nomination and Renumeration Committee approved the grant of Employee Stock Options 2019 to Vedanta employees covering 35% of eligible population.
In order to align the scheme with best-in-class reward practices globally, the ESOS 2019 Plan has undergone significant transformation. The grant under the ESOS 2019 is completely driven by performance and is a combination of individual contribution and business/SBU
V-perform: one performance system for One VedantaOur focus is to constantly improve the level of automation in all our operations. V-Perform is a pan-Vedanta initiative to standardise the Performance Management System (PMS) and process across all Vedanta Group companies by leveraging technology. This enables functions, teams and individuals to track performance on a regular basis, evaluate efficiency through
360-degree FeedbackAt Vedanta, we promote growth and nurturing of our internal talent pool by encouraging internal dialogue between senior leaders and their young mentees and peers. Towards this, we have launched a 360-degree Feedback for our ExCo Leaders in collaboration with an external partner. We believe that this will help to fast track assessment and development of leaders and we aim to extend this to cover all our professionals in due course.
advanced analytics and implement proactive decisions towards achieving Vedanta’s objectives. We foster a culture of safety and sustainability to achieve our ultimate vision of ‘Zero Harm, Zero Waste & Zero Discharge’. To enhance our safety performance in the workplace and strengthen our existing Safety Management System, a safety competency assessment process was completed mid-year by all employees.
Employees at Hindustan ZInc
An employee at Cairn Oil & Gas
Aluminium CEO interacting with on site team
performance. Although the plan continues to be linked to Vedanta for its relative total shareholder returns performance, but since business delivery is of prime importance for the organisation today, the internal parameters of volume, cost, Net smelter return and EBITDA, as applicable to respective business and SBU have been introduced as additional performance parameters with enhanced weightage. The vesting of such options will also be a factor of sustained individual performance subject to continued employment with the Group.
Through this change, we not only ensure to protect the shareholder interests but also enable a better control of the outcome of the plan in the hands of the employee.
In the global context, nowadays most CEOs cite an inadequate pool of leadership talent as a business threat and yet many organisations don’t move fast enough to address this. While companies expect talent to have growth, positive mindset, manage complexity, be agile, innovate, integrate, collaborate and empower, the talent itself expects continuous learning, exciting challenges, diverse and inclusive work environment, flexible career paths and ongoing feedback, to grow.
During 2015, Vedanta was at such a cross-road to build a pipeline of ‘leaders of tomorrow’ and under the leadership of the Chairman took the opportunity to initiate what was to become one of the largest and most successful internal
CAsE sTuDy 01: IDENTIFYING AND KEEP NURTURING HOMEGROWN LEADERS
leadership growth programmes in the industry. ‘Leadership from within’ has been our cardinal philosophy as we grow and in line with this we designed the ‘Chairman’s Internal Growth Workshop Program’ to identify ‘hidden gems’ across the businesses basis 3 Ps - Personal Background (Education, Age, Experience, etc.); Performance (Last three year performance, Star of the Business, etc.); Potential (Identified by a comprehensive assessment mechanism).
Through this robust exercise, we have identified a bench strength of 600+ new leaders who have been entrusted with elevated/enhanced roles across business and functions. Meeting growth aspirations of the employees and ensuring internal
mobility of high-quality talent has been the highlight of this endeavour. The new leaders have been empowered through various key strategic initiatives across the Group and regular feedback sessions, which have ensured they are in the right track of adding business value.
We also recently engaged an outsourced partner to conduct an independent study to gather objective feedback about the programme effectiveness. The study revealed a resounding positive feedback from across stakeholder segments (over 85% satisfaction level – in terms of role satisfaction & recognition, leadership visibility, right guidance etc.) thus re-enforcing its impact across the organisation.
Employees in Underground Mine at the Rajpura Dariba Mine
PEOPLE AND CULTURE CONTINUED...
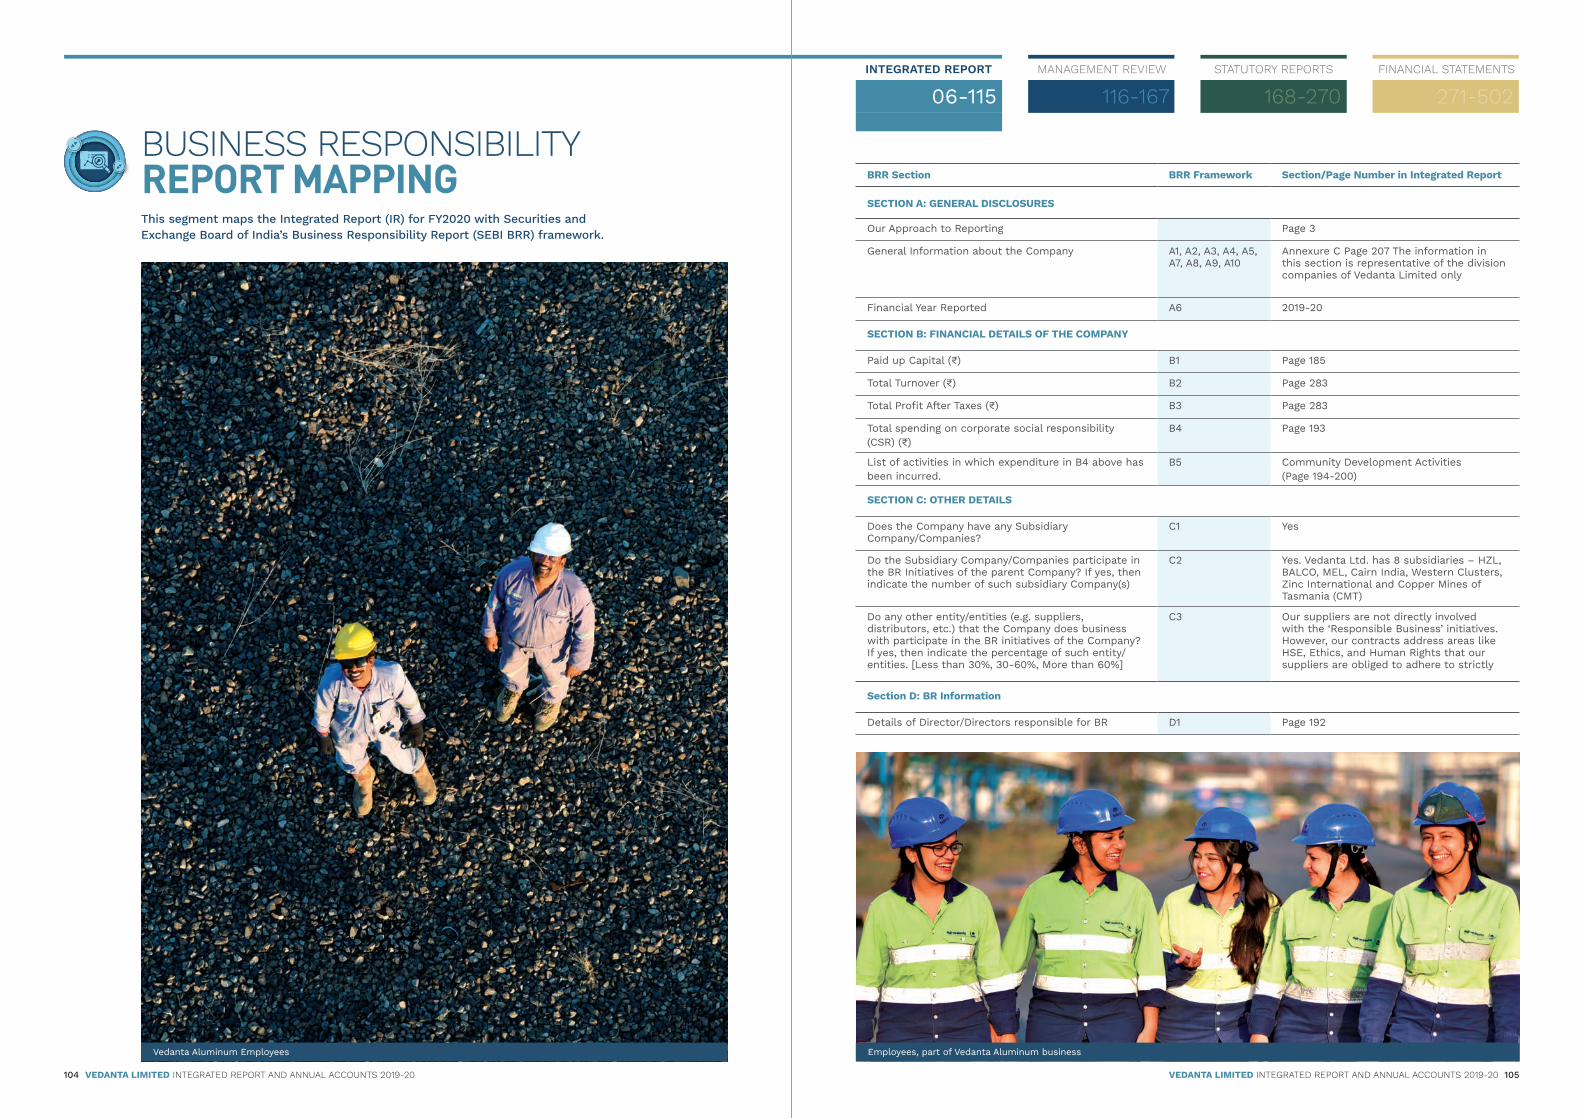
INTEGRATED REPORT
06-115MANAGEMENT REVIEW
116-167STATUTORY REPORTS
168-270FINANCIAL STATEMENTS
271-502
104 VEDANTA LIMITED INTEGRATED REPORT AND ANNUAL ACCOUNTS 2019-20 VEDANTA LIMITED INTEGRATED REPORT AND ANNUAL ACCOUNTS 2019-20 105
BUSINESS RESPONSIBILITY REPORT MAPPING This segment maps the Integrated Report (IR) for FY2020 with Securities and Exchange Board of India’s Business Responsibility Report (SEBI BRR) framework.
BRR Section BRR Framework Section/Page Number in Integrated Report
sECTIon A: gEnERAl DIsClosuREs
Our Approach to Reporting Page 3
General Information about the Company A1, A2, A3, A4, A5, A7, A8, A9, A10
Annexure C Page 207 The information in this section is representative of the division companies of Vedanta Limited only
Financial Year Reported A6 2019-20
sECTIon B: FInAnCIAl DETAIls oF ThE CompAny
Paid up Capital (₹) B1 Page 185
Total Turnover (₹) B2 Page 283
Total Profit After Taxes (₹) B3 Page 283
Total spending on corporate social responsibility (CSR) (₹)
B4 Page 193
List of activities in which expenditure in B4 above has been incurred.
B5 Community Development Activities (Page 194-200)
sECTIon C: oThER DETAIls
Does the Company have any Subsidiary Company/Companies?
C1 Yes
Do the Subsidiary Company/Companies participate in the BR Initiatives of the parent Company? If yes, then indicate the number of such subsidiary Company(s)
C2 Yes. Vedanta Ltd. has 8 subsidiaries – HZL, BALCO, MEL, Cairn India, Western Clusters, Zinc International and Copper Mines of Tasmania (CMT)
Do any other entity/entities (e.g. suppliers, distributors, etc.) that the Company does business with participate in the BR initiatives of the Company? If yes, then indicate the percentage of such entity/entities. [Less than 30%, 30-60%, More than 60%]
C3 Our suppliers are not directly involved with the ‘Responsible Business’ initiatives. However, our contracts address areas like HSE, Ethics, and Human Rights that our suppliers are obliged to adhere to strictly
section D: BR Information
Details of Director/Directors responsible for BR D1 Page 192
Employees, part of Vedanta Aluminum businessVedanta Aluminum Employees

INTEGRATED REPORT
06-115MANAGEMENT REVIEW
116-167STATUTORY REPORTS
168-270FINANCIAL STATEMENTS
271-502
106 VEDANTA LIMITED INTEGRATED REPORT AND ANNUAL ACCOUNTS 2019-20 VEDANTA LIMITED INTEGRATED REPORT AND ANNUAL ACCOUNTS 2019-20 107
2. Principle-wise (as per National Voluntary Guidelines (NVGs) BR Policy/policies (Reply in Y/N)
QUESTIONS P1 P2 P3 P4 P5 P6 P7 P8 P9
Do you have a policy/policies for: Y N Y Y Y Y Y Y Y
Has the policy been formulated in consultation with the relevant stakeholders?
Y NA Y Y Y Y Y Y Y
Does the policy conform to any national/ international standards? If yes, specify. (50 words)
Y NA Y Y Y Y Y Y Y
Has the policy been approved by the Board? Y NA Y Y Y Y Y Y Y
Has it been signed by MD/Owner/CEO/ Y NA Y Y Y Y Y Y Y
Appropriate Board Director? Y NA Y Y Y Y Y Y Y
Does the Company have a specified committee of the Board/Director/Official to oversee the implementation of the policy?
Y NA Y Y Y Y Y Y Y
Indicate the link for the policy to be viewed online? https://www.vedantalimited.com/Pages/CorporateGovernance. aspx?type=inv
Has the policy been formally communicated to all relevant internal and external stakeholders?
Y NA Y Y Y Y Y Y Y
Does the Company have in-house structure to implement the policy/policies?
Y NA Y Y Y Y Y Y Y
Does the Company have a grievance redressal mechanism related to the policy/ policies to address stakeholders’ grievances related to the policy/policies?
Y NA Y Y Y Y Y Y Y
Has the Company carried out independent audit/evaluation of the working of this policy by an internal or external agency?
Each year, the Company undertakes an audit exercise, conducted by an external agency to evaluate the workings of these policies. This audit is known as the Vedanta Sustainability Assurance Protocol (VSAP) audit. The VSAP audit is conducted across all of our significant sites.
NA = Not Applicable
Employees at Cairn Oil & Gas
BRR Section BRR Framework Section/Page Number in Integrated Report
3. GOVERNANCE RELATED TO BR
Indicate the frequency with which the Board of Directors, Committee of the Board or CEO to assess the BR performance of the Company. Within 3 months, 3-6 months, Annually, More than 1 year
D3 Sustainability and ESG (Page 66-68)
Does the Company publish a BR or a Sustainability Report? What is the hyperlink for viewing this report? How frequently it is published?
D3 Sustainability and BRR performance is detailed in the Vedanta Ltd. Annual Report. We also publish an annual Sustainability Report based on GRI Standards. Our sustainability reports can be found at: http://www.vedantalimited.com
sECTIon E – pRInCIplE-wIsE DIsClosuREs
Principle 1 - Conduct, Governance, Ethics, Transparency and Accountability
Does the policy relating to ethics, bribery and corruption cover only the Company? Yes/No. Does it extend to the Group/Joint Ventures/Suppliers/Contractors/NGOs /Others?
P1-1 No. The Business Code of Conduct and Ethics applies to all directors, officers and employees of the Company and its subsidiaries. Page 190
How many stakeholder complaints have been received in the past financial year and what percent was satisfactorily resolved by the management? If so, provide details thereof, in about 50 words or so
P2-1 Standalone numbers:Open complaints at 1st Apr19: 3Number of whistle-blower cases opened: 29Number of whistle-blower cases upheld and found correct in 2019-20: 10Number of whistle-blower cases closed in 2019-20: 31
Principle 2 - Safety and Optimal Resource Utilisation across Product Lifecycle
List up to 3 of your products or services whose design has incorporated social or environmental concerns, risks and/or opportunities.
P2-1 HZL Case Study; Page 83
For each such product, provide the following details in respect of resource use (energy, water, raw material etc.) per unit of product(optional):
P2-2 Optimising resources and managing environmental sustainability; Page 78-85
Does the Company have procedures in place for sustainable sourcing (including transportation)? If yes, what percentage of your inputs was sourced sustainably? Also, provide details thereof in 50 words or so
P2-3 Optimising resources and managing environmental sustainability; Page 78-85
Has the Company taken any steps to procure goods and services from local & small producers, including communities surrounding their place of work? If yes, what steps have been taken to improve their capacity and capability of local and small vendors?
P2-4 In view of retaining quality, the Company sources its major inputs from OEMs and large national and international manufacturers. Goods and services are procured by businesses locally is of consumable nature where feasible
Does the Company have a mechanism to recycle products and waste? If yes, what is the percentage of recycling of products and waste (separately as <5%, 5-10%, >10%). Also, provide details thereof, in about 50 words or so
P2-5 Optimising resources and managing environmental sustainability; Page 78-85
BUSINESS RESPONSIBILITY REPORT MAPPING CONTINUED...

INTEGRATED REPORT
06-115MANAGEMENT REVIEW
116-167STATUTORY REPORTS
168-270FINANCIAL STATEMENTS
271-502
108 VEDANTA LIMITED INTEGRATED REPORT AND ANNUAL ACCOUNTS 2019-20 VEDANTA LIMITED INTEGRATED REPORT AND ANNUAL ACCOUNTS 2019-20 109
Employees at Dariba Smelting Complex
BRR Section BRR Framework Section/Page Number in Integrated Report
principle 3: Employee well-being
Please indicate the total number of employees P3-1 9,220 Full-time Employees
Please indicate the total number of employees hired on temporary/contractual/casual basis
P3-2 29,658
Please indicate the number of permanent women employees
P3-3 1,156 Full-time female employees
Please indicate the number of permanent employees with disabilities
P3-4 Not tracked
Do you have an employee association that is recognised by management?
P3-5 Yes
What percentage of your permanent employees are members of this recognised employee association?
P3-6 We have recognised employee association at Sesa Iron business only. 74%, the employees are a part of association
Please indicate the number of complaints relating to child labour, forced labour, involuntary labour, sexual harassment in the last financial year and pending, as on the end of the financial year
P3-7 Child labour/forced labour/involuntary labour – NilSexual harassment cases - 8*; All cases are closed*Represents consolidated number
What number of your under mentioned employees were given safety & skill upgradation training in the last year?
P3-8 The total safety and skills upgradation training given to employees, contract workers and third-party visitors is given as below: • Employees: 232,253 hours• Contract employees: 628,434 hours • Third party: 123,242 hours
principle 4: Engaging stakeholders - sustaining Value
Has the Company mapped its internal and external stakeholders? Yes/No
P4-1 Our key stakeholders; Page 72
Out of the above, has the Company identified the disadvantaged, vulnerable & marginalised stakeholders
P4-2 Yes
Are there any special initiatives taken by the Company to engage with the disadvantaged, vulnerable and marginalised stakeholders. If so, provide details thereof in 50 words or so
P4-3 Empowering communities and enabling prosperity; Page 86-93
Medicinal garden developed on a reclaimed mine site, Sanquelim Employees participating in a plantation drive at Balco
BRR Section BRR Framework Section/Page Number in Integrated Report
principle 5: promoting human Rights
Does the policy of the Company on human rights cover only the Company or extend to the Group/Joint Ventures/Suppliers/Contractors/NGOs/Others
P5-1 Yes
How many stakeholder complaints have been received in the past financial year and what percent was satisfactorily resolved by the management?
P5-2 No complaints with respect to Human Rights were reported
principle 6: nurturing the Environment
Does the policy related to Principle 6 cover only the Company or extends to the Group/Joint Ventures/Suppliers/Contractors/NGOs/others
P6-1 Yes
Does the Company have strategies/initiatives to address global environmental issues such as climate change, global warming, etc? Y/N. If yes, please give hyperlink for webpage etc
P6-2 Yes. Energy Management & Climate Change; Page 78-80
Does the Company identify and assess potential environmental risks? Y/N
P6-3 Yes
Does the Company have any project related to Clean Development Mechanism? If so, provide details thereof, in about 50 words or so. Also, if Yes, whether any environmental compliance report is filed?
P6-4 No
Has the Company undertaken any other initiatives on – clean technology, energy efficiency, renewable energy, etc. Y/N. If yes, please give hyperlink for web page etc
P6-5 Yes. Energy Management & Climate Change; Page 78-80
Are the emissions/waste generated by the Company within the permissible limits given by Central/ State Pollution Control Board for the financial year being reported?
P6-6 Yes
Number of show cause/legal notices received from CPCB/SPCB which are pending (i.e. not resolved to satisfaction) as on end of Financial Year
P6-7
BUSINESS RESPONSIBILITY REPORT MAPPING CONTINUED...
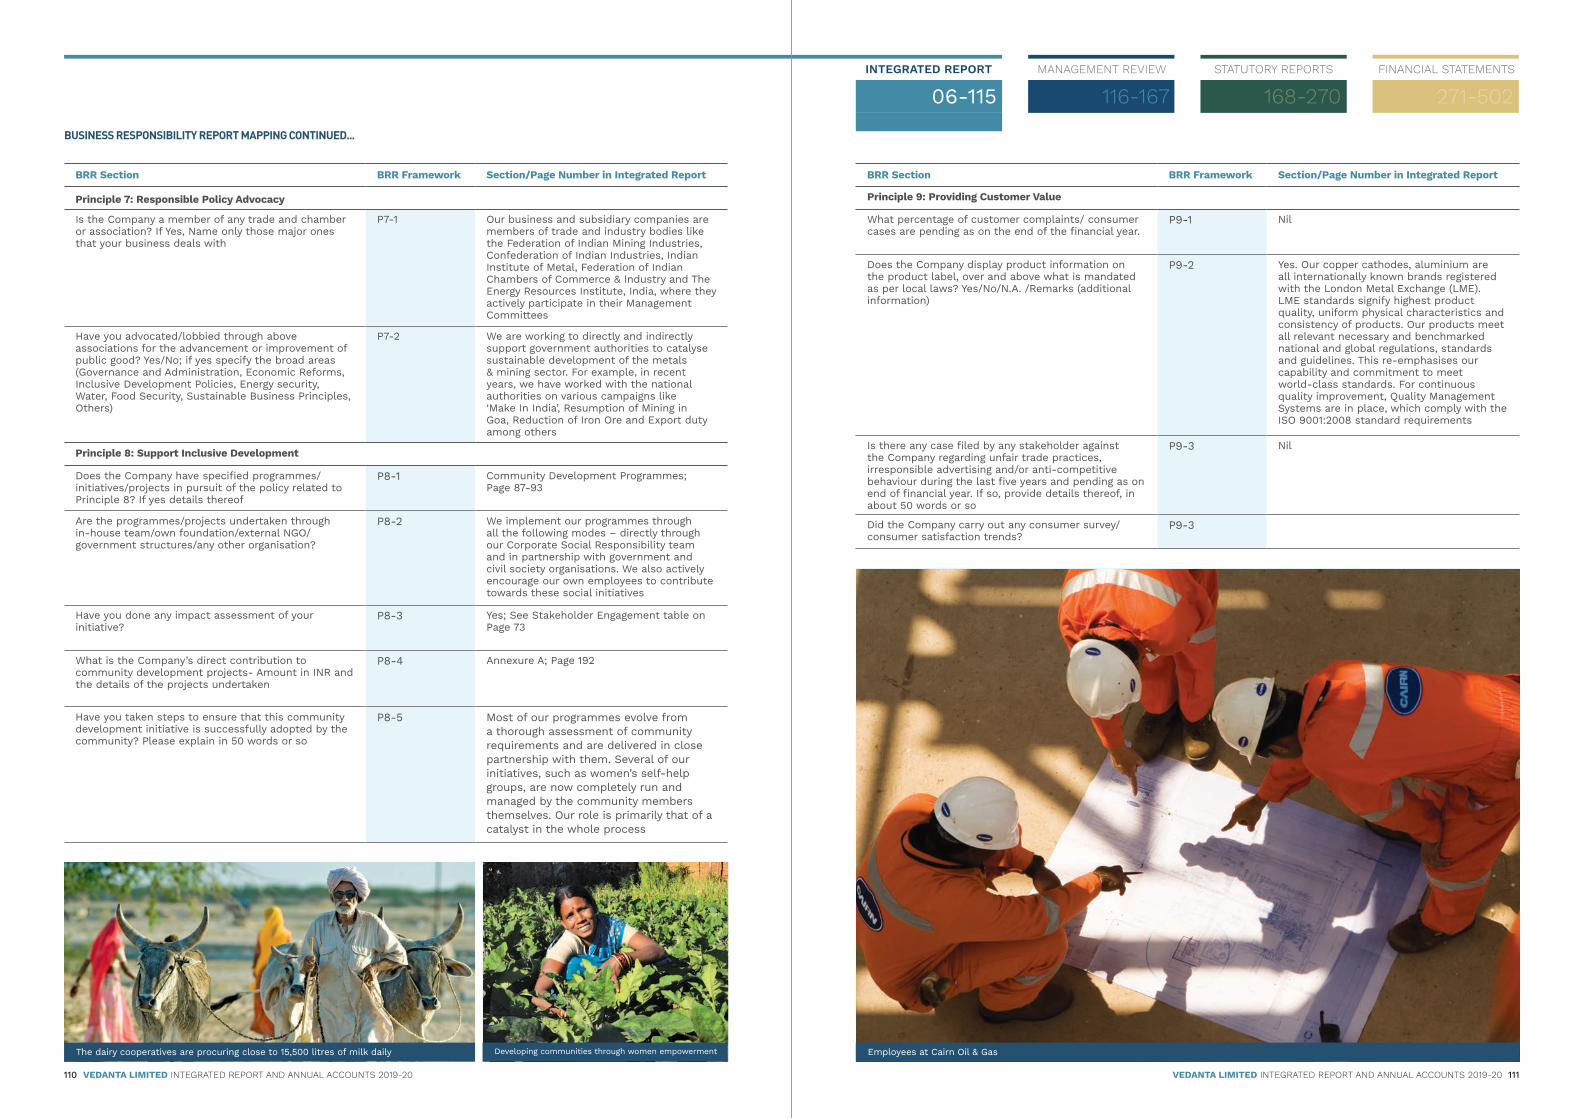
INTEGRATED REPORT
06-115MANAGEMENT REVIEW
116-167STATUTORY REPORTS
168-270FINANCIAL STATEMENTS
271-502
110 VEDANTA LIMITED INTEGRATED REPORT AND ANNUAL ACCOUNTS 2019-20 VEDANTA LIMITED INTEGRATED REPORT AND ANNUAL ACCOUNTS 2019-20 111
BRR Section BRR Framework Section/Page Number in Integrated Report
principle 7: Responsible policy Advocacy
Is the Company a member of any trade and chamber or association? If Yes, Name only those major ones that your business deals with
P7-1 Our business and subsidiary companies are members of trade and industry bodies like the Federation of Indian Mining Industries, Confederation of Indian Industries, Indian Institute of Metal, Federation of Indian Chambers of Commerce & Industry and The Energy Resources Institute, India, where they actively participate in their Management Committees
Have you advocated/lobbied through above associations for the advancement or improvement of public good? Yes/No; if yes specify the broad areas (Governance and Administration, Economic Reforms, Inclusive Development Policies, Energy security, Water, Food Security, Sustainable Business Principles, Others)
P7-2 We are working to directly and indirectly support government authorities to catalyse sustainable development of the metals & mining sector. For example, in recent years, we have worked with the national authorities on various campaigns like ‘Make In India’, Resumption of Mining in Goa, Reduction of Iron Ore and Export duty among others
principle 8: support Inclusive Development
Does the Company have specified programmes/initiatives/projects in pursuit of the policy related to Principle 8? If yes details thereof
P8-1 Community Development Programmes; Page 87-93
Are the programmes/projects undertaken through in-house team/own foundation/external NGO/government structures/any other organisation?
P8-2 We implement our programmes through all the following modes – directly through our Corporate Social Responsibility team and in partnership with government and civil society organisations. We also actively encourage our own employees to contribute towards these social initiatives
Have you done any impact assessment of your initiative?
P8-3 Yes; See Stakeholder Engagement table on Page 73
What is the Company’s direct contribution to community development projects- Amount in INR and the details of the projects undertaken
P8-4 Annexure A; Page 192
Have you taken steps to ensure that this community development initiative is successfully adopted by the community? Please explain in 50 words or so
P8-5 Most of our programmes evolve from a thorough assessment of community requirements and are delivered in close partnership with them. Several of our initiatives, such as women’s self-help groups, are now completely run and managed by the community members themselves. Our role is primarily that of a catalyst in the whole process
The dairy cooperatives are procuring close to 15,500 litres of milk daily Developing communities through women empowerment
BRR Section BRR Framework Section/Page Number in Integrated Report
principle 9: providing Customer Value
What percentage of customer complaints/ consumer cases are pending as on the end of the financial year.
P9-1 Nil
Does the Company display product information on the product label, over and above what is mandated as per local laws? Yes/No/N.A. /Remarks (additional information)
P9-2 Yes. Our copper cathodes, aluminium are all internationally known brands registered with the London Metal Exchange (LME). LME standards signify highest product quality, uniform physical characteristics and consistency of products. Our products meet all relevant necessary and benchmarked national and global regulations, standards and guidelines. This re-emphasises our capability and commitment to meet world-class standards. For continuous quality improvement, Quality Management Systems are in place, which comply with the ISO 9001:2008 standard requirements
Is there any case filed by any stakeholder against the Company regarding unfair trade practices, irresponsible advertising and/or anti-competitive behaviour during the last five years and pending as on end of financial year. If so, provide details thereof, in about 50 words or so
P9-3 Nil
Did the Company carry out any consumer survey/ consumer satisfaction trends?
P9-3
Employees at Cairn Oil & Gas
BUSINESS RESPONSIBILITY REPORT MAPPING CONTINUED...

INTEGRATED REPORT
06-115MANAGEMENT REVIEW
116-167STATUTORY REPORTS
168-270FINANCIAL STATEMENTS
271-502
112 VEDANTA LIMITED INTEGRATED REPORT AND ANNUAL ACCOUNTS 2019-20 VEDANTA LIMITED INTEGRATED REPORT AND ANNUAL ACCOUNTS 2019-20 113
RECOGNITIONS THAT SET US APART
AWARDS AND ACCOLADES
The Executive Committee, led by the Chief Executive Officer assumes responsibility for the day-to-day operations and apprises the Board of the key developments, assisting them in setting our overall strategic direction.
Name of Awards Category/ Recognition Recepient(Business Unit)
OPERATION EXCELLENCE
Great Place to Work-CertifiedTM Great Place to Work-CertifiedTM by Great Place to Work Institute (2019-20 ranking has not been declared yet, its an old one for all companies, please confirm)
Hindustan Zinc
Great Managers Award Women Leadership & Result Orientation at the Great Managers Awards
Hindustan Zinc
Asia Disclosure Index 2019 Champions in terms of Voluntary Disclosure Index by scoring 10/10 and securing position in Top 5 Indian Companies
Hindustan Zinc
Quality Circle Forum India Par Excellence Award for Kaizen Competition
Sterlite Copper - Silvassa Unit
Quality Circle Forum India Silver Award for Case study Sterlite Copper - Silvassa Unit
Express Logistics & Supply Chain Conclave Outstanding Digital Transformation In Supply Chain Award
Hindustan Zinc
Gas production team of Cairn Oil & Gas First prize at the Quality Circle Forum of India’s 5S competition. A team of five members presented a case study on ‘Implementation of ‘5S’ technique in ATR(Annual Turn Around)’, thereby 20 hours of saving with improved safety performance. QCFI, Delhi chapter, and sub-chapter Jaipur, conducted ‘CCQC 2019 Convention’ on September 20, 2019
Cairn Oil & Gas
Ravva onshore and offshore fields has been awarded ‘Five Star’ rating for the excellence in EHS (Environment, Health and Safety) practices
The large-scale industries category by Confederation of Indian Industries (CII) in the CII – SR EHS Excellence Award 2019
Cairn Oil & Gas
Platinum Prize for Raageshwari, and Certificate of Appreciation for Mangala, Bhagyam, Aishwarya and Midstream business units
8th FICCI Safety Systems Excellence Awards ceremony for safety excellence
Cairn Oil & Gas
Frost & Sullivan - India Manufacturing Excellence Award 2019
India Manufacturing Excellence Award 2019 in Gold for manufacturing processes and achieving business results
Vedanta Lanjigarh
Maritime Gateway- Smart Expoter-Aluminium Award
Smart Logistics Vedanta Jharsuguda
ISO SafetySEZ Unit (Plant II) has been certified with ISO 50001:2011 (Energy Management System)
Vedanta Jharsuguda
Transformation Business Media - Future of Procurement Summit and Awards
Procurement Transformation & Growth BALCO
Name of Awards Category/ Recognition Recepient(Business Unit)
SUSTAINABILITY & CSR
Dow Jones Sustainability Index Ranked 1st in Asia-Pacific region and 5th Globally in Metal and Mining sector
Hindustan Zinc
The Sustainability Yearbook 2020 Featured in The Sustainability Yearbook 2020 by S&P Global and RobecoSAM as Sustainability Leaders
Hindustan Zinc
FTSE4Good Emerging Index Member of FTSE4Good Emerging Index across – Environment, Social and Governance
Hindustan Zinc
CSR Health Impact Award Women & Child Health Initiative - conferred with the title of ‘Game Changer’ for its Khushi Anganwadi Program
Hindustan Zinc
ASSOCHAM Women Achievers Awards 2019 SAKHI as Best CSR initiative for Women Award
Hindustan Zinc
Best Grassroots Football Programme of 2019
Zinc Football - Best Grassroots Football Programme of 2019 at Football Delhi Awards
Zinc Football
Zee Business and World CSR Day Best Environmental Sustainability Award
Best Environmental Sustainability Award for excellence in CSR and Sustainability
Hindustan Zinc
‘Best Community Development Award’ at National CSR Leadership Congress & Awards presented by Zee Business
Excellence in CSR & Sustainability Sesa Goa Iron Ore Karnataka Division
Mining Mazma - 2019 ‘Sustainable Mining’ category Sesa Goa Iron Ore
‘Indian Chamber of Commerce Social Impact Award’
Healthcare under Large Enterprise category Vedanta Sesa Goa Iron Ore - Value Added Business Unit
India CSR Summit and Exhibition 2019 6th CSR Impact Award for Aajeevika Project in reviving Dhokra art
Vedanta Lanjigarh
ET 2 Good 4 Good Award CSR Activities BALCO
Chairman Business Award Sustainability Initiatives & Financial Results BALCO
Employees at Balco

INTEGRATED REPORT
06-115MANAGEMENT REVIEW
116-167STATUTORY REPORTS
168-270FINANCIAL STATEMENTS
271-502
114 VEDANTA LIMITED INTEGRATED REPORT AND ANNUAL ACCOUNTS 2019-20 VEDANTA LIMITED INTEGRATED REPORT AND ANNUAL ACCOUNTS 2019-20 115
Name of Awards Category/ Recognition Recepient(Business Unit)
ENVIRONMENTAL PRACTICES
Excellent Renewable Initiative under Platinum Category
22 MW Solar Power Project at Rampura Agucha Mine by Green Maple Foundation Annual Award 2019
Rampura Agucha Mine
Energy Efficient Unit at the Confederation of Indian Industry (CII) 20th National Award
Excellence in Energy Management Sesa Goa Iron Ore Value Added Business (VAB) Unit
CII Energy Efficient Unit Award 2019 Plant efficiency- Smelter I, Smelter II, CPP Vedanta Jharsuguda
SEEM National Energy Management Award 2019.
Energy Management Vedanta Jharsuguda
Energy Efficiency Summit 2019 Excellent Energy Efficient Unit award 2019 for technological advancements in energy efficiency processes
Vedanta Lanjigarh
Energy & Environment Foundation Global Environment Award
Energy & Environment BALCO
Mining Nazar 2019 Balco Mines - Sustainable Mining Practices BALCO
FIMI Misrilall Jain Environment Award Chotia Mines -Best Environment practices BALCO
Ministry of Labour & Employment- National Safety Award
Mines BALCO
Kalinga Safety Excellence Award 2018 Received bronze under the alumina sector category
Lanjigarh
Greentech Safety Award 2019 Received platinum under the Mines & Metal category for safe practices
Lanjigarh
Environmental Excellence Award (By CM, Punjab)
Environmental management TSPL
ROSPA Safety performance TSPL
PEDA annual energy efficiency awards Efficiency performance for 2018-19 TSPL
Efficient Management Fly Ash >500 MW TSPL
TRANSFORMATION & INNOVATION
Dun & Bradstreet Corporate Awards 2019 Driving force of the Indian economy for their exemplary performance in the corporate world - Non-Ferrous Metals category
Hindustan Zinc
IEI Centenary Industry Excellence Award 2019
Innovation, business strategies in manufacturing/engineering operations and services and their capacity to sustain excellence in a competitive manner
Hindustan Zinc
Kumar Dixit was awarded ABP News Leadership Excellence Award 2019
Transformational leadership CEO, Cairn Oil & Gas
GOVERNANCE
Global Golden Peacock Award For eminence in Corporate Governance Vedanta Group
Name of Awards Category/ Recognition Recepient(Business Unit)
EXCELLENCE OF SKILLED TALENT
India Procurement Leadership Forum & Awards 2020
Ms Amrita Singh conferred with ‘Woman Procurement Leader’ award
HZL
Legal Summit and Awards 2019 Legal Department was declared winner of the 'Legal Team of the Year 2019' award
Hindustan Zinc Legal team
Mines Safety Association Karnataka Zone - 3
Vedanta Sesa Goa Iron Ore KarnatakaUnit won 46 awards for different categories
Sesa Goa Iron Ore Karnataka Division
IMEA Future Factory Ready Award Operational Excellence BALCO
ET Now CEO of the Year Award Awarded to Mr. Abhijit Pati for Leadership Excellence
BALCO
Customs Department Best Importor Award Import Initiatives BALCO
People Business Great Managers Award by Economic Times and People Business
Top 50 great managers of the country Aluminium and Power
Excellence in trade finance 2nd Financial Leadership award Aluminium and Power
Bronze at the India Public Relations and Corporate Communications Awards 2019
2nd Financial Leadership award Aluminium and Power
Chairman Business award Q2 FY'20 CSR Communication (Beyond Metro) TSPL
ET Now Business Leader of the Year Award - 2020 (Mr. Ajay Kapur)
Business Performance Q2 Aluminium and Power
PEOPLE PRACTICES
10th CII National HR Excellence Award 2019-20
‘Significant Achievement in HR Excellence Award’
Hindustan Zinc
‘Top 25- India’s Best Workplaces for Women – 2019’ by Great Place To Work
Great Place to Work® is the global benchmark on building, sustaining and recognising high-trust, high-performance workplace cultures.
Cairn Oil & Gas
Great Place to Work Great Place to Work certified - High Trust & High Performance
Vedanta Lanjigarh
Great Place to Work Great Place to Work certified - High Trust & High Performance
Vedanta Jharsuguda
AON Best Employer Award HR Enagement Initiatives BALCO
World HRD Congress -ET HR Talent Management Leadership Award
Best Leadership Development Program BALCO
CII HR Excellnece Award HR Initiatives/Performance BALCO
CII national HR Excellence Award HR Excellence TSPL
TECHNOLOGICAL DISTINCTION
‘Excellence in Security Technology implementation and Preventive System’
IFSEC India on 19 December 2019 at India Expo Centre for their measures towards ensuring security disruptions in operations to ensure business continuity.
RJON crude security systems, Cairn Oil & Gas
Digitally Advanced Company of the Year Federation of Indian Petroleum Industry (FIPI) for its intensive deployment of digitalisation initiatives to drive value-creation across business operations and functions.
Cairn Oil & Gas
IMC RBNQ Performance Excellence Trophy-2019’
Manufacturing Sesa Goa Iron Ore Value Added Business Unit
CII Quality Circle recognition For developing an effective concept case study on improved traffic management
Sesa Goa Iron Ore Value Added Business (VAB) Unit
AWARDS AND ACCOLADES CONTINUED...

INTEGRATED REPORT
06-115MANAGEMENT REVIEW
116-167STATUTORY REPORTS
168-270FINANCIAL STATEMENTS
271-502
116 VEDANTA LIMITED INTEGRATED REPORT AND ANNUAL ACCOUNTS 2019-20 VEDANTA LIMITED INTEGRATED REPORT AND ANNUAL ACCOUNTS 2019-20 117
MARKET REVIEW
A DYNAMIC ENVIRONMENT, POSITIONED FOR LONG-TERM GROWTHgloBAl EConomy AnD CommoDITy mARkETs:The global economy in 2019 faced twin headwinds of geopolitical uncertainty and sluggish growth in advanced economies and emerging markets. If we take a broad perspective, economic performance remained weak across most major economies such as the Group of 7 (G-7) and BRICS nations (Brazil, Russia, India, China and South Africa) due
to a confluence of several factors, including the US and China trade tensions, Brexit and the fear of deglobalisation. The year saw tepid consumer and investor confidence and weak manufacturing and trade scenario. This significantly undercut commodity demand, thereby negatively impacting prices.
On the other hand, the start of year 2020 showed signs of recovery following the Phase I trade pact between the US and China, diminished fears of a no-deal Brexit and reduced geopolitical tensions. The effect of global central banks pursuing an accommodative monetary policy also helped partially revive the overall market sentiment.
However, these early signs of stabilisation were severely impacted by the risk posed by the ongoing global pandemic, COVID-19. The human cost of the pandemic is already immeasurable and all countries across the world are working hard in solidarity to protect people and limit the economic impact felt around the world. According to government sources, the US economy alone lost 20.5 million jobs in April. The number of just one month dwarfs the 8.6 million jobs that were lost over the entire stretch of 2008 and 2009 during the financial crisis. The US economy shrank by 4.8% at an annualised rate in April, the worst decline since the fourth quarter of 2008. The British and French economies also contracted in January 2021 compared to the previous three months.
The International Monetary Fund (IMF) has pegged global growth in 2019 at 2.9%. For 2020, however, the IMF projects a negative outlook, with a -3% de-growth in the overall global output. In one of the remarkable moves the US oil futures fell to below zero for “WTI Crude oil” for the first time in history. For the very near term the pace of the economic recovery is expected to be sluggish. Nevertheless, once the economies recover, global growth is expected to revive partially and register y-o-y growth of 5.8% in 2021. The recovery is expected in two stages - an
initial phase of social distancing and containment, and the next planned phase of revival and stability.
Globally there is an encouraging and concerted action to battle the COVID-19 pandemic. Broad-based monetary policy and government expenditure are expected to shore up economic activity in most countries and countries like India have already announced immediate economic relief and support to various strata of the population.
oppoRTunITIEs FoR VEDAnTA - GLOBALGlobally, the concerted actions of monetary and fiscal policy measures have been observed by individual countries as well as international financial institutions to help the global economy combat the slowdown. These ongoing measures are likely to provide support to improve demand for commodities. There are early signs that industrial activities in China are recovering with the Manufacturing Purchasing Managers Index (PMI) for March 2020 jumping to 52%, up from a record low of 35.7% in February 2020. Against this backdrop it is expected that global commodity prices will slowly recover, particularly across metal prices, something that Vedanta is well positioned to benefit from.
Growing urbanisation and ongoing investment in infrastructure will support the use of galvanised steel, especially in emerging economies such as China and India. In addition, China’s stringent environmental norms and efforts to improve industrial utilisation are likely to deter new capacity additions. This supportive demand-supply dynamic for zinc is likely to augur well for Vedanta, one of the world’s largest zinc producers. At Vedanta, we
remain on track to become the world’s largest integrated zinc-led silver producer in two years, while maintaining our cost leadership.
Recent developments in the sourcing of alumina have provided us with a cost advantage in the aluminium business. We have been able to reduce our costs considerably with the structural changes and enhanced backward integration. There is also significant development in our energy business. We have emerged as a successful bidder for the Jamkhani coal block in Odisha. This, along with our Chotia mine, will strengthen our coal security for the aluminium business.
Thus, our diversified commodity portfolio and relentless emphasis on costs and digital implementation positions us well to take advantage of the expected demand upswing, and the resulting improvement in commodity prices.
Machinery at work inside the Rajupra Dariba Mine
Once the economies recover, global growth is expected to revive partially and register y-o-y growth of 5.8% in 2021. The recovery is expected in two stages - an initial phase of social distancing and containment, and the next planned phase of revival and stability.
At Vedanta, we remain on track to become the world’s largest integrated zinc-led silver producer in two years, while maintaining our cost leadership.
Employees in Underground Mine at the Rajpura Dariba Mine
Unique arrangement of two rigs closely operating, Barmer, Cairn

INTEGRATED REPORT
06-115MANAGEMENT REVIEW
116-167STATUTORY REPORTS
168-270FINANCIAL STATEMENTS
271-502
118 VEDANTA LIMITED INTEGRATED REPORT AND ANNUAL ACCOUNTS 2019-20 VEDANTA LIMITED INTEGRATED REPORT AND ANNUAL ACCOUNTS 2019-20 119
aims to ease bottlenecks and stimulate the economy. It includes projects under implementation in various government schemes such as Housing for All (PMAY), Smart Cities, Dedicated Freight Corridors, Sagarmala, Bharatmala, and Jal Jeevan Mission, apart from participation from the private sector.
This is also expected to be beneficial for related sectors such as steel, base metals, cement, power transmission and distribution. The expansion of the national gas grid announced in the Union Budget 2020 and expected reforms to facilitate transparent price discovery are set to significantly enhance the domestic gas market. While India had started to witness progress in the economy by Q4FY20, the COVID-19 situation dramatically brought production and the economic activity in the country to a standstill. Prioritising the health of its people, the Union Government announced consecutive lockdowns to maintain social distancing and arrest the spread of the pandemic.
Considering the effects of COVID-19, India’s growth is expected to slow to 1.9% in FY2020. While this affects the nation’s overall growth momentum in the short-run, India is relatively better placed than most of its counterparts and will be one of fastest recovering economies once the cycle inflects. In FY2021, India can expect a recovery and is expected to grow by 7.4% (Source: IMF, World Economic Outlook April 2020). Active government spending and revival of large-scale consumer demand are expected to maintain India’s resilience.
oppoRTunITIEs FoR VEDAnTA - INDIAIndia-focused Growth AgendaDespite challenges in the global economy, India continues to outshine major economies of the world in terms of accomplishing decent growth that is sustainable and inclusive. The country’s economic growth is supported by a sound fiscal policy framework, strong regulatory mechanism, wide-ranging structural reforms undertaken by the Government of India and states and a robust democratic ecosystem that continues to underline the importance of transparency in corporate governance. Rapid adoption of technology, growing confidence of global investors in the performance of the Indian economy and a young, aspiring and productive population further helped spur growth prospects. In 2019, India became the world’s fifth largest economy, ahead of France and the UK in terms of nominal GDP. The road ahead continues to be attractive for India, despite macro headwinds.
Going forward, we expect to see emphasis on infrastructure development on account of a burgeoning workforce and wide-ranging urbanisation. The government’s vision entails over ₹100 trillion expenditure on infrastructure, coupled with concrete steps towards decarbonisation and promotion of electric mobility. These initiatives will strengthen the country’s demand for commodities, given that India’s per capita consumption of all metals including steel, aluminium, copper and zinc is much below the world average. India is the third-largest oil consumer in the world, but in per capita terms, it is only about one-third of the world’s average. Given its rising energy needs and increased dependence on crude oil imports, this also offers an opportunity for domestic oil producers.
INDIAN ECONOMYIndia is Vedanta’s primary market and we believe in its immense potential, as the fundamentals for growth remain intact. 2019 has been particularly challenging for the Indian economy with a slowing growth rate, declining exports, rising inflation and a downturn in manufacturing output. However, the Government of India and the Reserve Bank of India (RBI) have announced a slew of policy decisions, aimed at bolstering market sentiment and reviving growth.
These include the biggest corporate tax cut in 28 years to encourage private investment. The successive interest rate cuts by the RBI are important steps in the right direction. The impacts of these measures will be gradually visible, after normalcy returns in the economy, and the benefits of lower rates stimulate economic growth.
Reforms in the Insolvency and bankruptcy Code (IBC) including the enforcement of a stringent timeline for the insolvency resolution process have forced a behavioural change, leading to resolution of more cases. The Government of India has also embarked on an ambitious divestment programme, more than doubling its current target by focusing on strategic sales.
The Government of India has also announced a plethora of reforms aimed at pushing growth and investment in our specific areas of operation. The cornerstone of investment spending will come from the ₹102 trillion National Infrastructure pipeline (NIP), which
Unique arrangement of two rigs closely operating, Barmer, Cairn
Emphasis on infrastructure development coupled with rising energy needs will strengthen the country’s demand for commodities and offer opportunity for domestic oil producers.
Policy SupportThe Indian Government has announced various progressive policy measures in its Union Budget 2020 as part of its efforts to kickstart investment. These include the abolition of Dividend Distribution Tax (DDT) and the recently announced tax dispute settlement scheme – ‘Vivad Se Vishwas’, which is expected to boost the ease of doing business in India. Other measures such as lowering the effective corporate tax rate, reduction in cost of capital and simplification of regulatory and tax framework for foreign investment funds have also aided in this effort.
As part of its policy push to develop the metals, mining and oil sectors, the Government of India has drafted a framework policy for a variety of key supporting areas. These include the policy for steel clusters to resolve challenges of the ancillary, downstream and value-added steel units and unlock their growth potential.
It has also constituted a working group on the proposed new industrial policy, aimed at promoting emerging sectors, reducing regulatory hurdles and making India a robust manufacturing hub. The Government is also revamping its Foreign Trade Policy (FTP) for FY2020-25, which could be a game changer for the Indian economy by promoting exports and making Indian goods more globally competitive. A National Logistics Policy is also being proposed to drive business competitiveness through an integrated, seamless, efficient, reliable, green, sustainable and cost-effective logistics network. The proposed policy aims to reduce overall logistics cost to less than 10% of India’s GDP.
The government has allowed 100% Foreign Direct Investment (FDI) in coal mining and associated infrastructure, doing away with end-use restrictions for coal blocks – setting up the stage for commercial coal mining to take up in India in a big way. This clearly indicates that the government wants to bring competition, efficiency and transparency to the sector. The recent round of auctions in Odisha for iron ore and manganese mines is a testament to this reality. Other measures undertaken in
mining include the setting up of a committee by the Ministry of Mines to revise royalty rates and dead rent on minerals. This is expected to substantially increase mining output and invigorate the sector. In the meanwhile, the Ministry of Environment, Forests & Climate Change (MoEFCC) is also working on streamlining environmental clearance processes to increase the ease of doing business.
Apart from the Open Acreage Licensing Programme (OALP) adopted earlier, India has further liberalised its oil & gas sector in 2019 by opening up its fuel retail sector to non-oil companies, a move that will intensify competition, with private and global oil majors seeking to expand their presence here. The country has also embarked on major reforms, aimed at expanding city gas distribution (CGD) networks, to raise the share of gas in the energy basket from the current 6% to 15% by 2023.
In order to provide support to the industries in the face of COVID-19, the government and the central bank have rolled out a slew of measures to infuse liquidity in the economy. The reduced the repo rate has been cut by 75 basis points to 4.4%, reverse repo rate by 90 basis points to 4.0%, and Cash Reserve Ratio (CRR) by 100 basis points to 3.0% (as on 27 March 2020). The RBI also permitted all commercial banks to allow a moratorium of three months
on payment of instalments of all term loans outstanding as on 1 March 2020. The Reverse Repo rate was further reduced by 25 basis points to 3.75% on 17 April 2020.
To aid the economically disadvantaged sections of society, ₹1.70 Lakh Crore relief package has been announced by the Union Government under the Pradhan Mantri Garib Kalyan Yojana. The major focus areas of the relief package includes: � Increase in the MNREGA wage to
₹202 per day from the earlier ₹182 to benefit 13.62 crore families � ₹2,000 paid to farmers in the
first week of April under the existing PM Kisan Yojana to benefit 8.7 crore farmers � 5 kg wheat or rice and 1 kg of
preferred pulses distributed free- of-cost every month for the next three months to 80 crore people � The Government of India has also
allowed state governments to utilise District Mineral Foundation (DMF) fund created out of the contribution from sale of minerals to combat the COVID-19 pandemic
As exports feel the impact of the pandemic, the Indian Government has extended the validity of Foreign Trade Policy 2015-20 to 31st March 2021. In order to boost exports and make Indian exports cost competitive, India is in the process of introducing a scheme for Remission of Duties and Taxes on Exported Products (RoDTEP). It will create a mechanism to reimburse various taxes/duties/levies, at the central, state and local levels, which are incurred during manufacturing and distribution of exported products, (applicable to those which are currently not being refunded under any other mechanism).
Processing Plant at Sesa Goa Mine
The Indian Government has announced various progressive policy measures in its Union budget 2020 including policy push to develop the metals, mining and oil sectors in variety of key supporting areas to unlock their growth potential.
MARKET REVIEW CONTINUED...

INTEGRATED REPORT
06-115MANAGEMENT REVIEW
116-167STATUTORY REPORTS
168-270FINANCIAL STATEMENTS
271-502
120 VEDANTA LIMITED INTEGRATED REPORT AND ANNUAL ACCOUNTS 2019-20 VEDANTA LIMITED INTEGRATED REPORT AND ANNUAL ACCOUNTS 2019-20 121
OPPORTUNITIES AMIDST CHALLENGES
MARKET REVIEW
Overview It was a tough year for Zinc generally with LME prices on a falling streak for the majority of the year. During the financial year, LME prices fell by 38% post April 2019. The average cash settlement price was ~US$2,402/t during the year compared to last year’s $2,745/t. With the COVID-19 pandemic and concerns over global growth, the market is not expected to return to normal soon. Even so, absolute downside in Zinc looks limited from current levels particularly with so much of global production becoming uneconomic at current levels.
Global ScenarioThe trade war between the US and China began in 2018, when US President Donald Trump imposed tariffs on goods imported from China. The resulting trade uncertainties and growing protectionism between the world’s two major economies impacted base metal prices globally. In December 2019, the ‘Phase I’ of the trade agreement was signed. The market responded positively to the news. The LME prices in the base metals complex strengthened somewhat, but the news of the pandemic outbreak led to its downturn again.
In 2019, most of the smelters in China were shut down due to environmental concerns, since then many have returned online and the rest are expected to be back in operation later in 2020. Nevertheless, even with increased production in China, globally mine production is expected to contract by 3-4% in CY2020.
Countries like Peru, Canada, Mexico and Bolivia, which contribute roughly 20% of global mine production went in to lockdown and miners were forced to suspend operations. Consistent low LME pricing will mean number of mines will become uneconomic and will be forced to close. This shift will certainly provide a natural buffer to the weaker demand trends being seen; nevertheless, market challenges will persist for 2020 as uncertainty over underlying demand trends persist.
Indian Market and OpportunitiesEvery year, India loses approximately ~3-4% of GDP due to corrosion and Indian industries have now slowly started recognising the fact, leading them to seek solutions. In the construction sector, the need for corrosion protection rebars has recently been picked by few domestic rebar manufacturers, who are collaborating with the International Zinc Association (IZA) to bring Continuous Galvanized Rebar Plant in India.
Indian Railways, considering safety and longevity of rail tracks are working on different mechanisms to protect the web area of rail from corrosion. Railway electrification has been growing rapidly. Encouragingly, Indian railways have set an ambitious target to electrify the complete rail route in the next few years, which will bolster India’s zinc demand.Zinc-based fertilisers present other avenues which are yet to be explored. India as of now consume less than 2% of zinc-based fertiliser, which presents a lot of opportunities and demand in the sector.
Products and CustomersHindustan Zinc is the largest primary zinc producer in India, with an expected 77% market share in 2020. Around 72% of the refined zinc produced by our smelters is sold in the domestic market, and the rest is being exported to South-East Asian and the Middle East. Over 65% of zinc demand comes from galvanising steel, predominantly used in the construction and infrastructure sectors. We also produce Continuous Galvanising Grade (CGG), EPG (Electro Platting Grade) and two grades of zinc for use in die-casting alloys. We are working closely with our customers and to strengthen our zinc product portfolio in terms of value-added products (VAP). Our focus is to increase the supply of VAP to 25% of total zinc sales in FY2021, from 19% in FY2020.
HZL to Launch E-commerce PlatformLately, with the internet revolution, e-commerce platforms are turning out to be the new place for buyers to buy from their home and seller to reach widespread customers. HZL is planning to adapt to times by launching ‘e-volve’- an e-commerce platform, which will make HZL the first producer in the non-ferrous industry to sell the metal on e-commerce portal. It will provide our customers with real-time pricing and seamless ‘click-buy’ facility for all the metals in our portfolio (zinc, lead, and silver). This will reduce manual intervention and enhance governance by providing transparent and real-time INR pricing options to end-users.
Underground Mining in Rajpura Dariba Mine
ZINCIndia’s Oil Demand Expected to Decline in the Short Run amid COVID-19 With the outbreak of the pandemic, the year FY2020 has been marked by one of the biggest international public health emergencies. Most countries are under lockdown to curb the wide-spreading virus, disrupting the economic and social activities around the world.
As we speak, India is under a series of lockdowns, which started in March 2020. This has caused a dramatic near-term demand shock. Oil demand in India is estimated to have dropped by ~50% in April with the most impact on transport fuels. Travel restrictions, and lower industrial activity have for the time being all shown a marked slowdown.
Whilst the shock has been sharp and deep in the near term the longer-term outlook for oil demand remains positive. Whilst negative demand trends are likely to continue for at least the first half of 2020, the return to normalcy and broader economic recovery should allow oil markets to steadily rebalance over the next 12-18 months.
Market Drivers and OpportunitiesThe global demand shock caused by COVID-19 leaves traditional oil market modelling in uncharted territory. As a result of COVID-19 containment measures in 187 countries, mobility has almost come to a halt. Global oil demand is expected to fall by a record 9.3 mb/d year-on-year in 2020. Total global oil demand is now assumed at 92.82 mb/d, in 2020 with higher consumption expected in H2FY20 than
in H1FY20. Global oil supply is also set to plunge by ~12 mb/d in May, after OPEC+ forged its output deal to cut production. Additional reductions are set to come from other countries with the US and Canada seeing the largest declines. This will impact the fall in oil prices which will be felt throughout oil’s global supply chain and adjoining industries.
Whilst the pace of the rebalancing in global oil markets remains uncertain there’s little doubt of the longer-term potential of India as one of the largest sources of incremental demand growth over the coming decade. India is the world’s third largest oil consumer, the fourth-largest refiner and a leading net exporter of refined products. Without the help of local producers like Vedanta, India’s import dependency is going to increase significantly in the coming decades. The country currently meets 84% of its oil consumption and 47% of its gas consumption through imports.3
The government projects a 10% reduction in India’s imports of oil & gas by 2022. The government also aims to increase the share of natural gas in the country’s energy mix to 15% by 2030, from the current 6%.1
India has prognosticated conventional hydrocarbon resources of over 300 billion barrels of oil and oil equivalent gas, with 70% of these assets yet to find category. To improve energy security, the government has prioritised the reduction of oil and gas imports, increasing domestic upstream activities, diversifying its supply sources and increasing Indian
1 EIA India 2020: Energy Policy Review, PPAC January 2020
investments in overseas oil fields in the Middle East and Africa.
The government is cognisant that several policy reforms are needed to revitalise the exploration and production ecosystem. Along with the fast-paced implementation of the OLAP, the government introduced the Unconventional Hydrocarbon Policy (UHC) in August 2018, followed by Enhanced Recovery policy (ER) in October, to boost domestic production and improve hydrocarbon recovery.
The four OALP bid rounds, conducted till date, have been successful, with 94 blocks (1,37,000 sq km) awarded to leading E&P companies.
Vedanta has a world-class resource base, with a 58 blocks in India. With a strengthened growth pipeline in exploration and development, we are well-positioned to meet India’s growing demand by contributing significantly more to the countries domestic crude oil production in the coming years.
Products and CustomersVedanta is the largest private sector producer of crude oil in India. Our crude is sold to hydrocarbon refineries and our natural gas is used by the fertiliser industry and the city gas sector in India.
Drilling in progress at Ravva Offshore Platform,Cairn Oil & Gas Helicopters ensure surveillance and security at Cairn Oil & Gas
OIL & GAS

INTEGRATED REPORT
06-115MANAGEMENT REVIEW
116-167STATUTORY REPORTS
168-270FINANCIAL STATEMENTS
271-502
122 VEDANTA LIMITED INTEGRATED REPORT AND ANNUAL ACCOUNTS 2019-20 VEDANTA LIMITED INTEGRATED REPORT AND ANNUAL ACCOUNTS 2019-20 123
LME Prices and World Trade Scenario It was a challenging year for aluminium LME prices as they hovered between 1,700 US$/T to 1,800 US$/T for larger part of the year; averaging to 1,749 US$/T for the year, ~14% lower than FY2019 average of 2,035 US$/T. The global aluminium industry saw the dip in prices primarily due to sluggish demand and the pressure witnessed in the global automotive sector.
From a supply perspective, global aluminium capacity increased with the lifting of sanctions on UC Rusal by the US government. The restart of Alunorte Alumina Refinery in Brazil also impacted the balance of aluminium demand and supply, as alumina supply picked up globally. On the other side, the demand showed bearish sentiments triggered by trade standoff, resulting in rising exports from the country. This was exacerbated by the sharp slowdown in vehicle sales in Europe and Asia. This kept the LME aluminium prices subdued for most of the financial year. During March 2020, the LME aluminium prices touched a 4-year low in the wake of global lockdowns; consequently impacting the global demand for aluminium. All the major end use sectors for aluminium across automotive, building & construction, consumer durables and packaging have been hit hard by lockdowns, contributing to the decline in aluminium prices.
The global demand for primary aluminium in 2019 was at approximately 64.5 million tonnes, whereas the overall aluminium demand was at approximately 90 million tonnes. It was reported that the total primary demand outside of China stood at 5.3 million tonne2 for
Q1 FY21, lower by 27% year on year, which is one of the biggest quarterly declines since 2009. The total primary consumption in China had fallen to 7.2 million tonnes2 in Q4FY20, when the pandemic was at its peak in China, but the demand in China has since recovered. The global primary aluminium demand for CY2020 is estimated to be around 60 million tonnes impacted by lockdowns in various parts of the world due to COVID-19 pandemic.
Indian Market Drivers and OpportunitiesGiven the COVID-19 pandemic, there is a higher degree of uncertainty in both Indian and global markets. Total aluminium consumption in India is expected to reduce in 2020 from 2019 levels. All the major sectors like transport, electrical, building & construction have been impacted by lockdown imposed by Government of India.
However, the long-term demand for aluminium in India and the sub-continent will remain robust backed by increased industrial activity and government focus on infrastructure sector in the country. Several government initiatives like Make in India and Smart Cities project are expected to increase investment in the country. India’s government is investing over US$1 billion in its ‘Make in India’ initiative. The aluminium consumption rise in India is inevitable with these initiatives lined up in the country, which is in line with India’s five-trillion-dollar economy vision. There is a huge potential for increasing aluminium usage in India in building and construction, automotive and packaging industries. As Vedanta, we continue to expand our VAP portfolio in line with evolving market
demand, positioning us for growth in the Indian aluminium market.
Products and Customers Vedanta has a 2.3 mtpa proposed aluminium capacity in India and operates one of the largest single-location smelters in the world at its Jharsuguda facility. It is the market leader in primary aluminium with ~40% market share in the primary aluminium segment. Our product range includes aluminium ingots, primary foundry alloys, wire rods, billets, slabs and rolled products. We cater to electrical, automotive, building & construction segments, along with a host of other industries, well supported by its high-quality value-added product portfolio. Around 41% of our total aluminium sales globally were value-added products.During FY2020, ~33% of our total sales were to the Indian markets, specifically meant for electrical, construction and transportation industries, a marginal improvement, compared to that of last year; of which 68% of domestic sales were for value-added products.
During the year, we expanded our market reach in South Korea and Australia. We also entered new markets like Saudi Arabia and UAE, among others. International sales to our established customers in other key Asian, European and North and South American markets remained at the same level vis-à-vis last year at 1.26 million tonnes. Vedanta sold ~42% of its total sales as value-added products in FY2020.
Vedanta Aluminium, Jharsuguda
2 CRU’s Online Information Service for Aluminium
ALUMINIUMMarket Overview Like other base metals, lead prices were also impacted by geopolitical tensions, global economic slowdown and the downtrend in the automotive sector. Shutting down of Nrystar’s Port Pirie smelter in Australia twice during the year also kept the prices volatile. Uncertainty over the COVID-19 pandemic has unsurprisingly caused further price weakness during the last quarter as major European and American automakers were forced to shut operations as countries declared lockdowns. The replacement battery segment which is not impacted by geo-political and economic factors, contributes roughly half of global lead demand, and kept the demand intact for the metal in CY2019.
Market Drivers & OpportunitiesIn India, more than 90% of overall lead (primary + secondary) and 80% of the primary lead are consumed by the battery segment. More than half of the battery demand is driven by replacements, which are least impacted by any macro-economic and geopolitical factor, but by wear and tear of the battery’s usage. Though the economic slowdown and COVID-19 scenario might impact the
Original Equipment (OE) demand, the replacement demand is expected to remain intact.
In the recent times, several concerns have been voiced over the demand of lead due to rapid adoption of Electric Vehicles (EVs). While EVs still use lead auxiliary batteries, these are smaller in size compared to regular car batteries, thus requiring lesser lead contribution. However, the impact of it to certain extent will be offset by adoption of start-stop (idle-stop) technology for conventional vehicles, which contain around ~25% more lead.
Lead also finds application in industrial batteries, given the global push by nearly every government towards renewable energy sources such as solar and wind. This willingness to embrace renewable energy will in turn increase demand for energy storage, which in turn will drive up demand for lead acid batteries that are more economical in comparison with lithium ion batteries.
Products & CustomersIndia’s refined lead market is ~1.1 million tonnes, including both primary and secondary markets. The primary lead market, which is
Dariba Lead Smelting Complex, HZL
Machinery at work inside the Rajupra Dariba Mine
Lead Ingots
LEAD~280 kt in size, remained stagnant in 2019. During FY2020, HZL increased its domestic sales by 5% compared to last year. We sold 86% of our refined lead metal in the domestic market and the rest was exported to South-East Asian markets. Next year, we are expecting to increase our sales by 3-4% through new customers via the e-commerce platform and introducing lead alloys in our product portfolio. We are already exploring through collaboration with our customers and plan to exit Q4FY21 with 10% Lead VAP Sales.
MARKET REVIEW CONTINUED...

INTEGRATED REPORT
06-115MANAGEMENT REVIEW
116-167STATUTORY REPORTS
168-270FINANCIAL STATEMENTS
271-502
124 VEDANTA LIMITED INTEGRATED REPORT AND ANNUAL ACCOUNTS 2019-20 VEDANTA LIMITED INTEGRATED REPORT AND ANNUAL ACCOUNTS 2019-20 125
Market Drivers & OpportunitiesIn 2019, India’s silver demand was estimated to be ~7,000 tonnes and HZL roughly contributes 10% of our country’s demand. We sell 100% of the precious metal in the domestic market. India’s industrial demand for the metal has been consistent during the last five years. It contributes ~20% of total demand, which compared to global average where ~50% demand comes from the industrial sector is quite low. Demand in jewellery segment saw 10% CAGR growth in the preceding five years. However, the demand is mostly seasonal in nature. The investment demand has shown a decline in the second half of last year mainly due to sudden increase in prices. Silver prices hovered ~₹0.4 to 0.5 lakh per kg in the domestic market, a new high for the market.
The price increase can be attributed to two reasons. First escalation (10% to 12.5%) in customs duty in the last year’s Union Budget presented in July 2019 and second to the price increase in the international markets as the Fed rate cuts have diverted the attention of investors to the precious metal, often considered as safe haven. We expect India’s market to slowly accept the new price range and investors to start investing in the precious metal for portfolio diversification.
Products & CustomersHZL is India’s only primary silver producer and ranks 6th globally in terms of the top silver producing companies. We cater to various segments of markets including the industrial sector (electrical
Global ScenarioGeopolitical tensions and economic slowdown led the Federal Reserve (the Fed) to cut down rates for the first time in the last 10 years in July 2019. In 2019, the Fed cut interest rates by a total of 75 basis points. The latest one in March 2020 being an emergency cut which brought the benchmark interest rate to zero to support the economy while dealing with the COVID-19 pandemic. Rate cuts like these draw investors’ attention towards precious metals like silver, which are often considered as safe haven, to diversify their portfolio risk. Silver witnessed a wide range in prices during the financial year, from touching the high of US$18.48/oz in August 2019 to falling the low of US$12.01/oz in March 2020. Silver finds multiple applications as an industrial metal. The lockdown across countries has hit industrial demand for the metal.
contacts, solder and alloys, and pharmaceuticals), jewellery and silverware. We sell our silver in the domestic market. Last year, we started spot sales of silver through an e-auction to reduce manual intervention, providing equal opportunity to all our buyers to compete and complete price transparency during the sales.
SILVER
Aerial View of Pantnagar Metal Plant
Silver block
Dariba silver mine
Domestic Demand Driving Capacity ExpansionVedanta operates over 9,000 MW diversified power portfolio in India consisting of 96% thermal power and 4% from renewable energy sources.
India is the third largest electricity producer in the world. The electricity generation target for conventional sources for FY2020 has been fixed at 1,330 billion units (BU), 6.5% higher y-o-y. Between 2010-2019, the country’s electricity generation grew at 5% CAGR, driven by government initiatives and schemes to expand electrification and provide round-the-clock power supply.
Market Drivers and OpportunitiesIndia’s power demand is expected to grow rapidly to 1,895 TWh by 2022, from 691 TWh in 2007 at 7% CAGR, driven predominantly by the expansion in industrial activities, a growing population, rising per capita income, policy support and increasing electricity penetration.
The government has also been supportive of growth in the power sector, delicensing the electrical machinery industry and allowing 100% Foreign Direct Investment (FDI). From April 2000 to June 2018, total FDI in the sector was US$14.2 billion, of which US$6.8 billion was invested in non-conventional power sources above.
The government has recently opened the coal sector for commercial mining, with revenue sharing based model, which is expected to ease any coal availability issues during peak demand season. In the wake of surging domestic coal production, the
country’s power sector is becoming increasingly stable.
At Vedanta, we are looking at expanding the renewable energy generation portfolio. The Ministry of Power notification on biomass co-firing dated 24 November 2020 allows blending up to 5%–10% biomass , considering it as renewable power.
This has opened additional avenues for utilising renewable power in existing thermal power plants. Vedanta has completed successful pilot projects for using biomass for power generation in its thermal power plants at Jharsuguda that supply power for aluminium production.
As of January 2020, India had total installed capacity of 369 GW, of which thermal constituted 231 GW, nuclear 7 GW, hydro 45 GW and renewables at 86 GW. The total captive power installed capacity stood at 55 GW.
Currently, India has a demand-supply gap of ~0.5%, providing an encouraging headroom for growth in the power market. The target for renewable energy has also been increased to 175 GW by 2022, of which 100 GW will be produced through solar power.
Vedanta’s power portfolio is well positioned to capitalise on India’s growing demand for power.
Products and ConsumersOf our cumulative power portfolio, 37% is used for commercial power, while 63% is meant for captive use. Nearly 95% of the power generated for commercial purposes is backed by long-term Power Purchase Agreements with state distribution
companies. The Ministry of Power, Government of India issued an order dated 28 June 2019 that has directed the DISCOMs (refers to electricity distribution companies in India) to service entire payments for any power supplied since August 2019 on advance basis. This has brought down the billing payment cycle across India.
3 Ministry of Power publication on Power Sector at a glance in India as on 18 Feb 2020 around 0.5%, powermin.nic.in/en/content/power- sector-glance-all-india4 IBEF Report on Power Sector in India www.ibef.org/download/Power-June-2017.pdf5 Ministry of Coal notification on auction of coal mines for sale of coal – Discussion paper on key terms & conditions www.coal.nic.in/ sites/upload_files/coal/files/curentnotices/ Discussion-Paper-Auction-of-Coal-Mines.pdf
POWER
Integrated facility at Jharsugda
VL-J Billet Casting Facility
MARKET REVIEW CONTINUED...

INTEGRATED REPORT
06-115MANAGEMENT REVIEW
116-167STATUTORY REPORTS
168-270FINANCIAL STATEMENTS
271-502
126 VEDANTA LIMITED INTEGRATED REPORT AND ANNUAL ACCOUNTS 2019-20 VEDANTA LIMITED INTEGRATED REPORT AND ANNUAL ACCOUNTS 2019-20 127
dams identified as facing potential collapse. Three of these dams are likely to be fully decommissioned and reintegrated into the surrounding environments by 2022, with Vale increasingly focused on risk management over recent months.
Output from Vale facilities remains uneven across Brazil, with regulators having frozen output at some sites during the September quarter. Vale is currently monitoring a major dam and has revised its forecast for the first quarter of 2020 down to 68-73 million tonnes of iron ore, from a previous forecast of 70-75 million tonnes. This will contribute to tight global supply conditions in 2020.
Products and CustomersIron ore, a key ingredient in steel manufacture, is used in the construction, infrastructure and automotive sectors. Our iron ore
Iron Ore Prices Reversed from Early 2019 StrengthWeaker global steel demand and low margins for most steelmakers have fed through to the global iron ore market, constraining demand in recent months. Iron ore prices have dropped noticeably from their 2019 peak, as supply shortfalls have gradually closed. However, prices are not likely to retreat much further in the short term, as iron ore markets remain tight and iron ore stocks remain near five-year lows. The FOB Australia iron ore price (62% iron content)—at which most Australian iron ore is sold—peaked in mid-2019, following the fallout from the tailings dam collapse in Brazil, but subsequently corrected. In late 2019, iron ore prices stabilised at around the same level as in late 2018.
Market Drivers and OpportunitiesIron ore prices remain unusually high following production shortfalls. The iron ore price was expected to decline to an average US$60 a tonne (FOB Australia) by 2021, as the seaborne market gradually returned to balance. Australia’s iron ore export earnings are set to increase from US$77 billion in FY2019 to $84 billion in FY2020. Earnings are then projected to ease to US$66 billion in the final year (FY2021) of the outlook period, as seaborne prices gradually decline. Export volumes are likely to grow from 834 million tonnes in 2019 to 878 million tonnes by 2021, as new production commences in Western Australia. The Brazilian supply is also recovering, albeit at an uneven pace.
Output from Vale remains constrained, as it is focused on dismantling a further nine tailings
mining operations ceased in Goa from March 2018, pursuant to the Supreme Court order. Meanwhile, the permitted mining capacity at Karnataka has recently been increased to 4.5 million tonnes from the previous 2.29 million tonnes.
Value Added Business - Amona plant
IRON ORE
Source: REQ, December 2019, Pg 29 & 31
10 Ministry of Power notification dated 28 Jun 2019 allowing opening & maintaining adequate Letter of Credit as payment security mechanism under Power Purchase Agreements by Distribution Licensees https://powermin.nic. in/sites/default/files/webform/notices/ Opening_and_maintanig_of%20adequate_ Letter_of_Credit_as_Payment_Security_ Mechanism_under_Power_Purchase_Agreements. pdf
Hot Metal from the Blast Furnace operation
Pig Iron - Finished product
Global refined copper consumption remained unchanged in 2019 at 23.5 Mt vis-à-vis 2018, while demand in China, the largest copper consumer increased by ~1%. Geopolitical tensions and a struggling global manufacturing sector plagued refined copper consumption in 2019.
Encouraging developments in the trade dispute between the US and China was gradually bolstering
kg, way below the world average of 229.3 kg, suggesting a huge unrealised potential for steel demand growth. Recently, India has been trying to unleash this through an extensive reform agenda and an ongoing push for infrastructure development. These factors, along with favourable demographics, are improving the macroeconomic fundamentals.
India was a net exporter in FY2020 at 1.5 million tonnes net exports compared to net importer in FY2019 with exports increased to 8.3 million tonnes a growth of 31.4 % in FY2020 compared to FY2019 at 6.3 million tonnes. However, the country is to witness a sudden increase in exports in FY21 as well.
Products and CustomersWe completed the acquisition of ESL, an integrated steel plant on June 4, 2018. ESL is primarily selling Wire rod, TMT and DI pipe products in India mainly to the construction, infrastructure and automotive sectors. In India, long products consumption was increased to 52 million tonnes, a growth of 5.83% in FY2020 compared to 49 million tonnes in FY2019, whereas flat products have seen a flat of 3.06% from 49.4 million tonnes in FY2019 to 47.9 million tonnes.
consumer confidence. However, the pandemic outbreak has jeopardised recovery at least for the medium term. On the supply side, India grappled with availability constraints of refined copper due to Vedanta’s Tuticorin smelter closure for the second year in a row.
Products and CustomersRefined copper is predominantly used in manufacturing cables, transformers and motors as well as castings and alloy-based products. The Tuticorin smelter closure adversely impacted our production in India.
Market Drivers and OpportunitiesOver the medium and long term, copper consumption in India and China is likely to increase, driven by population growth, urbanisation, the rise of aspiring middle class and demand for EVs.
These trends are supported by enabling government measures and initiatives. However, these forecasts will only hold true if the virus is contained properly and there are no fears of massive disruption in socio-economic life across geographies.
On the supply side, there could be further disruptions in copper production due to the smelter upgrades in Chile following the introduction of new environmental regulations.
The extended closures at Chilean smelters (including Chuquicamata and Potrerillos) reduced smelter production in the first half of 2019. Our ability to take advantage of emerging opportunities is largely dependent on the re-opening of our smelter at Tuticorin.
Stack of Copper Cathodes, Sterlite Copper
COPPER
STEELThe construction sector is boosting steel demand
Global crude steel production reached 1,869 million tons for the year CY2019, up by 3.03% compared to 2018. Growth can be attributed to increase in production by China at 8.3% y-o-y. India’s crude steel production was 108.57 million tons, down by 2.1% on 2019, meaning that India has replaced Japan as the world’s second largest steel producing country. While the steel demand recovery seen in 2018 continued in 2019, risks have increased due to global pandemic breakdown, high debts and volatile capital flows in many emerging economies. As a result, steel prices are expected to experience volatility in 2020. India’s steel demand has shown a marginal growth of 1.4% from 98.7 million tonnes in FY2019 to 100 million tons in FY2020. But world steel consumption is expected to see a fall of 15-20% in 2020 as a result of the virus outbreak. In the medium term (2019-2024), demand is expected to grow at 0-2% CAGR with world excluding china at growing at 1-3% CAGR.
India’s steel use per capita for finished steel products stood at 74.3
Market Drivers and OpportunitiesWith COVID-19 spreading across the globe, steel demand to see a substantial decline in 2020. Speed of recovery will be influenced by containment of virus and government stimulus. The pandemic may bring further setbacks to globalization, with global supply chain disruptions and nationalistic trade/ investment measures. The automotive sector shall be hardest hit among steel using sectors followed by mechanical machinery. Deep scars from the pandemic may have a lasting impact on economies and investment recovery shall take time. Business paradigm hasto adjust to the new normal - social distancing, teleworking, changes in consumer behaviour and preferences. Social distancing may undermine productivity and increase costs. While construction sector, which is identified as the steel demand driver shall be affected by changing demand for housing v/s commercial buildings, new urbanisation patterns, weak investment, shift towards green energy, the machinery sector will suffer from low investment, but shall boost from automation. Favourable government stimulus shall be the key to economy’s revival.
MARKET REVIEW CONTINUED...

INTEGRATED REPORT
06-115MANAGEMENT REVIEW
116-167STATUTORY REPORTS
168-270FINANCIAL STATEMENTS
271-502
128 VEDANTA LIMITED INTEGRATED REPORT AND ANNUAL ACCOUNTS 2019-20 VEDANTA LIMITED INTEGRATED REPORT AND ANNUAL ACCOUNTS 2019-20 129
FINANCE REVIEWEXECUTIVE SUMMARYWe had a strong operational and financial performance in FY2020 despite of the challenging operating environment of low commodity prices and some impact on production on account of lockdown to combat COVID-19. The company continues to focus on controllable factors such as resetting cost base through diverse cost optimisation initiatives, disciplined capital investments, working capital initiatives, marketing initiatives & volume with strong control measures to ensure safe operations across businesses within framed government and corporate guidelines in view of COVID-19.
In FY2020, we recorded an EBITDA of ₹21,061 crore, 12% lower y-o-y and robust adjusted EBITDA margin of 29%. (FY2019: ₹24,012 crore, margin 30%).
Lower production volumes resulted in decrease in EBITDA by ₹102 crore, driven by lower production volumes at Zinc India (includes COVID impact) and Oil & Gas business. However, this was partially offset by higher sales volume at Iron ore of Karnataka & Steel business, additional volume from Gamsberg operations and increase in volumes at Aluminium business.
Market factors resulted in decrease in EBITDA by ₹3,672 crore compared to FY2019. This was primarily driven by downturn in the commodity prices across businesses partially offset by input
commodity deflation (mostly in alumina, thermal coal and carbon prices) and rupee depreciation. Gross debt as on 31 March 2020 was ₹59,187, crore, decreased by ₹7,038 crore since 31 March 2019 (FY19: ₹66,225 crore), primarily driven by repayment of debt at Vedanta Standalone, TSPL and temporary borrowing at Zinc India partially offset by increase in borrowing at Oil & Gas.
Net debt as on 31 March 2020 was ₹21,273 crore, decreased by ₹ 5,683 crore since 31 March 2019 (FY19: ₹26,956 crore), primarily driven by repayment of debt partially offset by working capital blockage due to Covid-19 and dividend payment during the year.
The balance sheet of Vedanta Limited continues to remain strong with cash & cash equivalents, of ₹37,914 crore and Net Debt to EBITDA ratio at 1.0x, which is the lowest among Indian peers.
CONSOLIDATED EBITDA EBITDA decreased by 12% in FY2020 to ₹21,061 crore. This was mainly driven by downturn in commodity prices, lower volume and higher cost at Zinc India & Oil & Gas business partially offset by additional volumes from Gamsberg operations and higher sales at Iron Ore Karnataka & Steel business, higher volume at Aluminium business, easing out of input commodity inflation, improved cost of production at Aluminium business, past exploration cost recovery at Oil & Gas business and rupee depreciation.
CONSOLIDATED EBITDA (₹ crore, unless stated)
Consolidated EBITDA FY2020 FY2019 % change
Zinc 9,094 11,298 (20)
-India 8,714 10,600 (18)
-International 380 698 (46)
Oil & Gas 7,271 7,656 (5)
Aluminium 1,998 2,202 (9)
Power 1,649 1,527 8
Iron Ore 878 584 50
Steel 588 791 (26)
Copper India (300) (235) 28
Others (118) 189 (28)
Total EBITDA 21,061 24,012 (12)
Key exchange rates against the US dollar:
Averageyear ended
31 March 2020
Averageyear ended
31 March 2019
% change
As at 31 March
2020
As at 31 March
2019
Indian rupee 70.86 69.89 1.4% 74.81 69.17
South African rand 14.78 13.76 7.41% 17.89 14.48
(₹ crore, unless stated)
EBITDA for FY2019 24,012
market and regulatory: ₹ (3,660) crore
a) Prices, premium / discount (7,839)
b) Direct raw material inflation 3,576
c) Foreign exchange movement 592
d) Profit petroleum to GOI at Oil & Gas 169
e) Regulatory changes (158)
operational: ₹ 708 crore
a) Volume (102)
b) Cost and marketing 422
c) Others 388
EBITDA for FY2020 21,061
CONSOLIDATED EBITDA BRIDGE
A) pRICEs, pREmIum/DIsCounTCommodity price fluctuations have a significant impact on the Group’s business. During FY2020, we saw a net negative impact of ₹7,839 crores on EBITDA due to commodity price fluctuations.
Zinc, lead and silver: Average zinc LME prices during FY2020 dropped to US$2,402 per tonne, down 12% y-o-y; lead LME prices decreased to US$1,958 per tonne, down 8% y-o-y; and silver prices increased to US$16.5 per ounce, up 7% y-o-y. The cumulative impact of these price fluctuations lowered EBITDA by ₹2,153 crore.
Aluminium: Average aluminium LME prices decreased to US$1,749 per tonne in FY2020, down 14% y-o-y, this had a negative impact of ₹3,954 crore on EBITDA.
oil & gas: The average Brent price for the year was US$60.9 per barrel, lower by 13% compared with US$70.4 per barrel during FY2019, this was further reduced by a higher discount to Brent during the year (FY2020: 7.1%; FY2019: 6.1%). This had negative impact on EBITDA by ₹1,026 crore.
B) DIRECT RAw mATERIAl INFLATIONPrices of key raw materials such as imported alumina, thermal coal, carbon and caustic have reduced significantly in FY2020, improving EBITDA by ₹3,576 crore mainly at Aluminium and Zinc India business.
C) FoREIgn ExChAngE FLUCTUATIONINR and SA Rand depreciated against the US dollar during FY2020. Stronger dollar is favourable to the Group’s
EBITDA, given the local cost base and predominantly US dollar-linked pricing. The favourable currency movements positively impacted EBITDA by ₹592 crore.
Encouraging young leaders, Vedanta Aluminum Business
MANAGEMENT DISCUSSION AND ANALYSIS

INTEGRATED REPORT
06-115MANAGEMENT REVIEW
116-167STATUTORY REPORTS
168-270FINANCIAL STATEMENTS
271-502
130 VEDANTA LIMITED INTEGRATED REPORT AND ANNUAL ACCOUNTS 2019-20 VEDANTA LIMITED INTEGRATED REPORT AND ANNUAL ACCOUNTS 2019-20 131
g) CosT AnD mARkETIngImproved costs resulted in an increase in EBITDA by ₹422 crore over FY2020, primarily due to improved cost at Aluminium business driven by globally falling input raw material indices (alumina, carbon, caustic etc.), lower power cost on account of materialization of linkage coal supply and higher production of captive alumina at Lanjigarh and Steel business driven by falling input raw material indices and operational efficiencies. This was partially offset by higher cost at Zinc India due to
volume led absorption & Oil & gas business due to higher maintenance cost and production enhancement initiatives during FY2020.
h) oThERsThis primarily includes the past exploration cost recovery at Oil & Gas business during the FY2020 partially offset by lower power EBITDA, inventory valuation at Aluminium business and lower EBITDA at Avanstrate Inc. (ASI) with a net positive impact on EBITDA of ₹388 crore.
D) pRoFIT pETRolEum To goI AT OIL & GAS The profit petroleum outflow to the Government of India (GOI), as per the production sharing contract (PSC), reduced by ₹169 crore. The reduction was primarily due to the higher recovery of capital expenditure incurred over the previous year.
E) REgulAToRyDuring FY2020, changes in regulatory levies such as electricity duty, GST credits, Renewable Power Obligation etc. had a cumulative negative impact on the Group EBITDA of ₹158 crore.
F) VolumEsLower volume led to decrease in EBITDA by ₹102 crore by following businesses:
Zinc India (negative ₹628 crore) The integrated metal sales stood at 860 kt, lower by 4%, and silver sales of 586 tonnes, lower by 13%. This had a cumulative negative impact on EBITDA of ₹628 crore.
oil & gas (negative ₹638 crore) Oil & Gas business achieved WI sales of 40.27 mmboe, down by 8% y-o-y. This had negative impact on EBITDA of ₹638 crore
Iron ore of Karnataka (positive ₹531 crore) Iron ore of Karnataka achieved sales of 5.78 mn tonnes, up 125% y-o-y. This sales volume increase had a positive impact on EBITDA of ₹531 crore.
Zinc International (positive ₹396 crore) Increased volumes at Gamsberg from 15 kt in FY2019 to 109kt in FY2020, mainly because of full year operation in FY2020. This has positively impacted EBIDTA by ₹ 396 crore.
steel business (positive ₹125 crore) ESL achieved metal sales of 1,179 KT, up 15% y-o-y. This sales volume increase had a positive impact on EBITDA of ₹125 crore.
Aluminium (positive ₹70 crore) In FY2020, the Aluminium business achieved metal sales of 1.92 million tonnes, up 3.6% y-o-y. This volume increase had a positive impact on EBITDA of ₹70 crore.
(₹ crore, unless stated)
Particulars FY2020 FY2019 % change
Net Sales/Income from Operations 83,545 90,901 (8)
Other Operating Income 902 1,147 (21)
EBITDA 21,061 24,012 (12)
EBITDA margin1 (%) 29% 30% -
Finance Cost 4,977 5,689 (13)
Investment Income 2,443 3,618 (32)
Exchange Gain /(Loss) (306) (509) (40)
Profit before Depreciation and Taxes 18,220 21,432 (15)
Depreciation and Amortisation 9,093 8,192 11
Profit before Exceptional items 9,127 13,240 (31)
Exceptional items2: credit/(expense) (17,386) 320 -
Taxes3 (3,516) 3,862 -
Profit after taxes (4,743) 9,698 -
Profit after taxes (before Exceptional Items) 6,122 9,490 36
Minority interest 1,920 2,633 27
Attributable PAT after exceptional items (6,664) 7,065 (42)
Attributable PAT (before exceptional items) 3,995 6,857 38
Basic earnings per share (₹/share) (18.00) 19.07 (42)
Basic EPS before exceptional items (₹/share) 10.79 18.50 38
Exchange Rate (₹/US$) – Average 70.86 69.89 1
Exchange Rate (₹/US$) – Closing 74.81 69.17 8
1. Excludes custom smelting at Copper India and Zinc India Operations. 2. Exceptional Items gross of tax3. Tax includes tax gain on exceptional items of ₹6,521 crore on special items in FY2020 (FY2019: charge of ₹112 crore)4. Previous period figures have been regrouped/rearranged wherever necessary to conform to current period presentation.
INCOME STATEMENT
Investment income for FY2019 stood at ₹2,443 crore, 32% lower y-o-y compared to ₹3,618 crore in FY2019.This was mainly due to mark to market loss on a treasury investment made by Vedanta’s overseas subsidiary through a purchase of an economic interest in a structured investment in Anglo American Plc from its ultimate parent, Volcan Investments Limited and one-time reclassification from other comprehensive income to profit and loss account at Zinc India during FY2019 which was partially offset by Mark to Market gain on other investment during the year.
EXCEPTIONAL ITEMSThe exceptional items for FY2020 was at ₹17,386 crore, mainly on account of impairment charge of ₹17,636 crore relating to property, plant and equipment and exploration assets and claims & receivables at Oil & Gas of ₹15,907 crore, Copper ₹721 crore, Iron ore business (IOB) of ₹349 crore, Avanstarte Inc. (ASI) of ₹504 crore and Fujairah Gold (FG) ₹151 crore partially offset by RPO liability reversal of ₹168 crore at aluminium pertaining to previous years based on revision of liability pursuant to Odisha Electricity Regulatory Commission notification and interest accrued on power debtors at TSPL ₹82 crore in line with positive Supreme court order of prior periods.
(For more information, refer note (33) set out in P&L notes of the financial statement on exceptional items).
TAXATION Tax credit for FY2020 stood at ₹ 3,516 crore (FY19: charge of ₹3,862 crore). However, normalised effective tax rate (excluding tax on undistributed reserves from Zinc India , dividend from CIHL and impact of new tax regime) for FY2020 stood at 34%, compared to 28% in FY2019 due to profit mix within entities and primarily on account of increase in weightage of Cairn Energy Hydrocarbon (CEHC) which is taxable at higher rate of 43.68%.
ATTRIBUTABLE PROFIT AFTER TAX (BEFoRE ExCEpTIonAl ITEms AnD DDT)Attributable PAT before exceptional items was ₹3,995 crore in FY2020 compared to ₹6,857 in FY2019 (lower 42% y-o-y).
EARNINGS PER SHAREEarnings per share before exceptional items for FY2020 were ₹10.79 per share as compared to ₹18.50 per share in FY2019.
DIVIDENDBoard has declared interim dividend of ₹3.90 per share during the year.
SHAREHOLDERS FUNDTotal shareholders fund as on 31 March 2020 aggregated to ₹54,635 crore as compared to ₹62,297 crore as at 31 March 2019. This was primarily net profit attributable to equity holders earned during the year partially offset by dividend paid during the year.
NET FIXED ASSETSThe net fixed assets as on 31 March 2020 were ₹107,489 crore. This comprises of ₹16,837 crore as capital work-in-progress as on 31 March 2020.
BALANCE SHEETOur financial position remains strong with cash and liquid investments of ₹37,914 crore.
The Company follows a Board approved investment policy and invests in high quality debt instruments with mutual funds, bonds and fixed deposits with banks. The portfolio is rated by CRISIL which has assigned a rating of “Tier I” (meaning highest safety) to our portfolio Further, the Company has undrawn fund based committed facilities of c.₹5,300 crore as on 31 March 2020.
Gross debt as on 31 March 2020 was ₹59,187 crore, a decrease of ₹7,038 crore since March 31, 2019.This was mainly due to the repayment of debt at Vedanta Standalone, TSPL and temporary borrowing at Zinc India partially offset by increase in borrowing at Oil & Gas business.
Gross Debt comprises term debt of c.₹46,600 crore and short-term working capital loans of c.₹12,600 crore. The loan in INR currency is 87% and balance 13% in foreign currency. Average debt maturity is of term debt is c.3.2 years as at 31 March 2020.
Crisil and India Ratings revised the outlook on Vedanta’s Rating from AA/Positive to AA/Negative.
REVENUERevenue for the year was ₹83,545 crore, 8% lower y-o-y. This was driven by subdued commodity prices, lower volume at Zinc India, lower volume at Oil & Gas business and lower power sales at TSPL partially offset by higher volume at Aluminium business, additional volumes from Gamsberg operations and higher sales at Iron Ore Karnataka & Steel business and rupee depreciation.
EBITDA AND EBITDA MARGINEBITDA for the year was ₹21,061 crore, 12% lower y-o-y. This was mainly on account of subdued commodity prices, lower volume and higher cost at Zinc India and Oil & Gas business partially offset by higher volume at Aluminium business, additional volumes from Gamsberg operations and higher sales at Iron Ore Karnataka & Steel business, easing out of input commodity inflation, improved cost of production at Aluminium business, past exploration cost recovery at Oil & Gas business and rupee depreciation.We maintained a robust adjusted EBITDA margin1 of 29% for the year (FY2019: 30%)
DEPRECIATION & AMORTIZATIONSDepreciation for the year was ₹9,093 crore compared to ₹8,192 crore in FY2019, higher by 11%, primarily on account of higher charge at Oil & Gas business due to capitalisation of new wells partially offset by lower production; higher depreciation charge at Zinc India on account of higher ore production, additional capitalisation and increase in amortization rate due to increase in cost; higher charge at Zinc international due to increased production from Gamsberg and acquisitions of Steel business in June’2018.
NET INTEREST The The blended cost of borrowings was 7.9% for FY2020 compared to with 8.1% in FY2019. Finance cost for FY2020 was ₹4,977 crore, 13% lower y-o-y compared to ₹5,689 crore in FY2019 mainly on account of decrease in average borrowing due to repayment of debt at Vedanta Standalone, TSPL, BALCO and temporary borrowings at Zinc India, repayment of preference shares at CIHL in FY2019 and lower average borrowing cost in line with market trends.
FINANCE REVIEW CONTINUED...

INTEGRATED REPORT
06-115MANAGEMENT REVIEW
116-167STATUTORY REPORTS
168-270FINANCIAL STATEMENTS
271-502
132 VEDANTA LIMITED INTEGRATED REPORT AND ANNUAL ACCOUNTS 2019-20 VEDANTA LIMITED INTEGRATED REPORT AND ANNUAL ACCOUNTS 2019-20 133
OPERATIONAL REVIEW ZINC INDIA
MANAGEMENT DISCUSSION AND ANALYSIS
THE YEAR IN SUMMARYMine production progressively improved during the year with ore production growth at Rampura Agucha and Zawar and steady production at Sindesar Khurd while Kayad and Rajpura Dariba mines operated at capacity. This led to a record ore production of 14.5 million tonnes despite disruptions related to COVID-19 towards the end of the year. Operations were halted on account of lockdown to combat COVID-19 from March 22, 2020 onwards.
Mined metal production was 917 kt, lower by 2% due to inferior ore grades and COVID-19 related shutdown. Zinc production declined marginally while lead and silver were lower due to some temporary operational issues at Dariba Lead smelter and lower silver grades.
Major projects were completed including Rampura Agucha production shaft and Sindesar Khurd production shaft was ramped up post its commissioning at the end of last year.
The first dry tailing plant was commissioned in Zawar while the fumer project at Chanderiya and two pastefill/hydrofill plants in Zawar are ready for commissioning.
OCCUPATIONAL HEALTH & SAFETYWe are deeply saddened to report two fatalities at the parking yard in Sindesar Khurd mine and Fumer project site in Chanderiya during the year. We have carried out detailed investigations of the incidents to learn and deploy our learnings across the Company and prevent any reoccurrences.
LTIFR for the year was 1.39 as compared to 0.63 a year ago. We are continuously trying to improvise our methodologies of incident investigation and categorisation with enhanced leadership focus on incident reporting. There has been greater management focus to bring a cultural change via Visible Felt Leadership programmes, safety town halls, enabling tools like safety whistle blower as well as reward & recognition for near-miss reporting.
In view of the COVID-19 health emergency, an advisory was issued
for precautionary measures along with awareness campaigns and drive for disinfecting facilities across the Company. The Company’s operations were halted during the lockdown period and employees were asked to work from home barring some employees who attended call for duty to keep production assets safe. To ensure business continuity, a committee of COVID-19 Response ‘War Room’ was organised to identify and implement urgent business decisions. We also engaged the SHG women in our communities to stitch and distribute cloth masks among the villagers, police and administration officials. Our teams worked with civil administration to ensure food reached vulnerable sections of the society.
Key safety initiatives undertaken during the year include Project Ru-ba-ru for business partner competency assessment with respect to manning, skill, qualifications, experience and gaps in organization; ‘I Support Aarohan’ wherein all employees undertook individual safety projects every quarter to improve safety of their work area; roll-out of new safety standards for molten metal and ground control management; technology enabled safety initiatives to reduce man-machine interactions; conducted Safety Perception Survey for making safety implementation system more effective and robust; and partnered with the global leader in industrial hygiene to improve hygiene with a one-year roadmap.
Employee at Operational site, Sindesar Khurd Mine. Hindustan Zinc
Employee at Operational site, Hindustan Zinc Dariba Smelting Complex
Record ore production of 14.5 million tonnesInside view of Underground ZInc Mine

INTEGRATED REPORT
06-115MANAGEMENT REVIEW
116-167STATUTORY REPORTS
168-270FINANCIAL STATEMENTS
271-502
134 VEDANTA LIMITED INTEGRATED REPORT AND ANNUAL ACCOUNTS 2019-20 VEDANTA LIMITED INTEGRATED REPORT AND ANNUAL ACCOUNTS 2019-20 135
of Nature (IUCN) ‘Leader for Nature India’ initiative. Our sustainability activities received several endorsements during the year including the CII- ITC Sustainability Award for Corporate Environment as well as Best Environmental Sustainability Award in the category of National Awards for ‘Excellence in CSR and Sustainability’ by World CSR Day.
Zinc India’s sustainability performance was ranked 5th in the Dow Jones Sustainability Index (Metal and Mining) globally, and No. 1 in Asia Pacific region and also selected as constituent of FTSE4Good Index series and the S&P Sustainability yearbook for the third consecutive year. Zinc India was also declared as ‘Disclosure Champion’ in the Asia Disclosure Index by FTI Consulting and is amongst the top 5 companies in India.
ENVIRONMENTDuring the reporting year, hazardous recycling rose to 31% compared to 28% in FY2019, and water recycling rate was 39% (FY2019: 34%).
During the year, India's first dry tailing plant was commissioned at Zawar Mine to reduce freshwater consumption by enhancing recovery of process water to 90%, improve tailing dam structural stability and reduce the water footprint.
For effective metal recovery, a second ancillary plant was commissioned for treatment of process residues at Chanderiya Lead-Zinc smelter and a project to recover sodium sulphate was commissioned at the Dariba Zinc smelter. Waste such as Jarosite, Jarofix, slag and fly ash were gainfully utilized in cement manufacturing and road construction whilst tailings were used in back-filling voids in mines.
As a part of beyond the fence initiatives for water management, a 15 MLD of sewage treatment plant is under commissioning in Udaipur city, which will take the total sewage treatment capacity to 60 MLD.
As part of commitment towards biodiversity conservation, the Company is now a member of International Union for Conservation
ZINC INDIA
Underground Operations at Sindesar Khurd Mine
Smelting operation at Dariba Smelting Complex
PRODUCTION PERFORMANCE
Production (kt) FY2020 FY2019 % change
Total mined metal 917 936 (2)
Refinery metal production 870 894 (3)
Refined zinc – integrated 688 696 (1)
Refined lead – integrated1 182 198 (8)
Production – silver (in tonnes)2 610 679 (10)
1. Excluding captive consumption of 7,088 tonnes in FY2020 versus 6,534 tonnes in FY2019. 2. Excluding captive consumption of 36.7 tonnes in FY2020 versus 34.2 tonnes in FY2019.
OPERATIONSFor the full-year, ore production was up 5% y-o-y to 14.5 million tonnes on account of strong production growth at Rampura Agucha and Zawar mines, which were up 18% and 14% respectively. Mined metal production for FY2020 was 917,000 tonnes compared to 936,000 tonnes in the prior year on account of COVID-19 related lockdown and low grades at Kayad and Sindesar Khurd mines in H1 FY2020.
Integrated metal production was down 3% to 870kt and silver production was lower by 10% to 610 MT due to COVID-19 related lockdown, lower lead production in Q2 FY20 & Q3 FY20 due to temporary operational issues and lower silver grades.
Particulars FY2020 FY2019 % change
Average zinc LME cash settlement prices US$/tonne 2,402 2,743 (12)
Average lead LME cash settlement prices US$/tonne 1,952 2,121 (8)
Average silver prices US$/ounce 16.5 15.4 7
PRICESZinc LME prices fell by 12% to end the year at an average of US$2,402 per tonne on account of trade war between the US and China and the outbreak of COVID-19 in the final quarter of the year. On the positive side, exchange stocks continue to remain low at seven days of global consumption despite inflow of stocks to exchanges as unprecedented outbreak impacted demand
The financial year started on a high note with Zinc LME price crossing US$3000 per tonne mark, but
subsequently the price witnessed downward trend before holding some ground in September and October. The signing of ‘Phase I’ of the trade agreement between the US and China in December provided some
support to the price in January but prices again tumbled as the health catastrophe struck Industrial metal prices, which took a hit as industrial activities and government spending on infrastructure projects stopped.
Zinc Global Balance (in kt) CY2020 CY2019 CY2018
Mine Production 12,853 13,363 12,953
Smelter Production 13,686 13,601 13,183
Consumption 12,984 13,924 14,322
ZInC DEmAnD - supplyAs many countries have imposed lockdown and have issued workforce curtailment advisories to tackle the spread of virus, mines are operating at reduced efficiency. Many mines in Peru, Mexico, Bolivia have suspended operations. The present low zinc price in US$1900-US$2000 has made many mines economically unviable. The new projects have been delayed and considering all these factors, global mine production is expected to witness contraction in CY2020. As per Wood Mackenzie, mine production is likely to contract by 3.8% in CY2020 compared to CY2019.
The benchmark Treatment Charge this year is US$299.5 per tonne, a substantial increase from last year’s US$245 per tonne, highest since 2008. The spot TC’s expected to remain higher for the year and would motivate smelters to continue
production. The refined metal production is expected to grow at 0.6% in CY2020 as per Wood Mackenzie.
The last two years have witnessed a contraction in global zinc consumption with 0.4% in CY2018 and 1.1% in CY2019. Further, this year demand has weakened as the world is combating the pandemic. Lockdowns of 4-8 weeks have muted the demand for zinc in downstream industries. Major auto manufacturers in Europe have closed operations amid subdued demand and there are
Source: Wood Mackenzie
raw material supply chain constraints due to boundary closures and limited cargo movements. Infrastructure spending has also halted. As per Wood Mackenzie’s initial reports, global zinc demand is expected to decline by 6.8%.
Indian government announced a 21-day nationwide lockdown which was further extended by 33 days in two steps to fight against the pandemic. Downstream industries, steel manufactures, galvanisers, alloy makers have suspended operations or are operating at reduced capacities.
Particulars FY2020 FY2019 % change
Unit costs (US$ per tonne)
Zinc (including royalty) 1,373 1,381 (1)
Zinc (excluding royalty) 1,047 1,008 4
UNIT COSTSZinc’s cost of production (excluding royalty) for FY2020 was US$1,047 per tonne, higher by 4% y-o-y. The Cost of Production (COP) during the year benefited from declining imported coal prices and higher linkage coal. The COP increase reflects higher mine development expense, lower ore grades and volume, lower acid credits, higher cement prices, and electricity duty on captive power plants which was hiked from ₹0.40
to ₹0.60 per unit starting July 2019, partly offset by lower coal costs. Government levies amounted to US$ 355 per tonne (FY2019: US$389 per
tonne). This comprised mainly of royalty payments, the Clean Energy Cess, electricity duty and other taxes.
India’s first dry tailing plant commissioned at Zawar Mine
OPERATIONAL REVIEW ZINC INDIA CONTINUED...

INTEGRATED REPORT
06-115MANAGEMENT REVIEW
116-167STATUTORY REPORTS
168-270FINANCIAL STATEMENTS
271-502
136 VEDANTA LIMITED INTEGRATED REPORT AND ANNUAL ACCOUNTS 2019-20 VEDANTA LIMITED INTEGRATED REPORT AND ANNUAL ACCOUNTS 2019-20 137
FINANCIAL PERFORMANCE Revenue for the year was ₹18,159 crore, down 12% y-o-y, primarily on account of decline in LME prices and lower volume, partly offset by higher silver prices and rupee depreciation. EBITDA in FY2020 decreased to ₹8,714 crore, down 18% y-o-y. The decrease was primarily driven by lower revenue and higher cost of production.
PROJECTS All major projects to build capacity of 1.2 mtpa mined metal were completed during the year. Capital mine development increased by 12% to 48 km in FY2020.
At Rampura Agucha, the Shaft project was commissioned along with the associated conveyor , crusher systems and hauling from shaft through ore pass commenced in the final quarter. This has increased haulage capacity allowing RA UG to achieve production level of 4.5 mtpa.
At Sindesar Khurd, shaft is fully integrated with mine and ore hauling was ramped up to about 70% of capacity. The second paste fill plant was commissioned in June 2019, allowing the mine to operate at full production capacity.
At Zawar, India’s first ever dry tail stacking plant was commissioned in the second quarter, significantly reducing water consumption & land
ZINC INDIA
(₹ crore, unless stated)
Particulars FY2020 FY2019 % change
Revenue 18,159 20,656 (12)
EBITDA 8,714 10,600 (18)
EBITDA margin (%) 48% 51% -
requirement and addressing tailing dam risk. Further, the two backfill plants are under load trials and back filling of voids is expected to commence in Q1 FY2021. This will improve mine stability and provide an opportunity for pillar mining to remove left-out high-grade ore.
At Rajpura Dariba, the existing production shaft capacity is being upgraded from 0.7 to 1.3 mtpa to debottleneck the mine. The erection process has already commenced and is expected to complete in Q3FY2021. RD mine received the environment clearance for expansion from 1.08 to 2.0 mtpa of ore production and ore beneficiation from 1.2 to 2.5 mtpa. Smelter debottlenecking to expand the capacity to 1.1 mtpa was completed during the year to maintain mines/smelter synergies at higher levels of production. The Fumer plant at Chanderiya is ready to start and production is to commence in Q1 FY2021.
EXPLORATIONZinc India’s exploration objective is to upgrade the resources to reserves and replenish every tonne of mined metal to sustain more than 20 years of metal production by fostering innovation and using new technologies. The company has an aggressive exploration program focusing on delineating and upgrading Reserves and Resources (R&R) within its licensed areas. Technology adoption and innovations play key role in enhancing exploration success.
Zinc India’s deposits remain ‘open’ and exploration identified a number of new targets on mining leases having potential to increase R&R over the next 12 months. Across all the sites, it increased its surface drilling to assist in upgrading Resources to Reserves.
In line with previous years, the Mineral Resource is reported on an exclusive basis to the Ore Reserve and all statements have been independently audited by SRK (UK).
On an exclusive basis, total ore reserves at the end of FY2020 totalled 114.7 million tonnes and exclusive mineral resources totalled 288.3 million tonnes. Total contained metal in Ore Reserves is 7.95 million tonnes of zinc, 2.07 million tonnes of lead and 256.2 million ounces of silver and the Mineral Resource contains 15.87 million tonnes of zinc, 5.93million tonnes of lead and 641.8million ounces of silver. At current mining rates, the R&R underpins metal production for more than 20 year.
Chanderia Lead Zinc Smelter, HZL
STRATEGIC PRIORITIES & OUTLOOKOur primary objective remains to concentrate on enhancing overall output, cost efficiency of our operations and disciplined capital expenditure. Whilst the current economic environment remains uncertain our goals over the medium term are unchanged.
Our key strategic priorities include: � Further ramp up of underground
mines towards their design capacity, deliver increased silver output in line with communicated strategy.
� Reduce cost of production to below US$1,000 per tonnes through efficient ore hauling, higher volume & grades and higher productivity through ongoing efforts in automation and digitization � Disciplined capital investments
in minor metal recovery to enhance profitability � Increase R&R through higher
exploration activity and new mining tenements, as well as upgrade resource to reserve
Virtual operations to ensure employee safety at HZL
Workmen at Dariba Smelting Complex, Hindustan Zinc
OPERATIONAL REVIEW ZINC INDIA CONTINUED...

INTEGRATED REPORT
06-115MANAGEMENT REVIEW
116-167STATUTORY REPORTS
168-270FINANCIAL STATEMENTS
271-502
138 VEDANTA LIMITED INTEGRATED REPORT AND ANNUAL ACCOUNTS 2019-20 VEDANTA LIMITED INTEGRATED REPORT AND ANNUAL ACCOUNTS 2019-20 139
OPERATIONAL REVIEW ZINC INTERNATIONAL
MANAGEMENT DISCUSSION AND ANALYSIS
OPERATIONSDuring FY2020, total production stood at 240,000 tonnes, 62% higher y-o-y. This was primarily due to ramp up of first phase of Gamsberg expansion plan.
Production at Skorpion stood at 67,000 tonnes during the year, slightly higher y-o-y. The plan was to produce 130,000 tonnes during the year which was predominantly impacted by a multiple bench slope failure of approximately 400 kt material on the western pushback of the open pit on 9th May 2019 and further in January 2020 by a wedge failure which extended the old slope failure to south area of mine.At BMM, production was in line with that of previous year. In spite of a slight decrease in grades (5.2% versus 5.3%), BMM performance has improved in FY2020 with higher recoveries and throughput. This was however offset
OCCUPATIONAL HEALTH & SAFETY Regrettably, Vedanta Zinc International reported a fatality at Black Mountain Mine where Mrs. Venessa Plagg a Mining Operator was fatally injured on 10 January 2020. The mine conducted a comprehensive investigation using an independent Group-led team. The lessons learned, following a thorough investigation, have been shared across the business and initiatives have been rolled out to strengthen our practices in Housekeeping, Person-Machine Interaction, Stop & Fix non-conformances and leaders engagement focusing on critical risk controls. Significant improvements have been made in the reduction of LTIs from 23 to 10 for the year (LTIFR FY2019: 0.96 and FY2020: 0.93).
Airborne particulate management remains a key focus in reducing lead and silica dust exposures of
Birdseye view of Gamsberg
THE YEAR IN SUMMARYDuring FY2020, Zinc International continued to ramp up production from its flagship project Gamsberg mine and achieved production of 108 kt.
Black Mountain continued to have a stable production of 66 kt. In May 2019, Skorpion experienced a major open pit failure which resulted in an ore gap of four months – which required the stoppage of the Refinery from November 2019 to January 2020. The open pit failure was safely and successfully dealt with. However, further (smaller) failures have since occurred with the latest one in January 2020, sterilising a significant portion of the open pit. This has resulted in an ore gap in excess of 10 months. Further technical studies have indicated the existence of similar such failure structures at depth. The safety of all employees is our first value. Therefore, we have decided to cease all mining operations at Skorpion and to put the mine under care and maintenance, while studies continue to look feasible ways to make the pit safe for mining options which would allow for the extraction of the remainder of the accessible ore.
PRODUCTION PERFORMANCE
Production (kt) FY2020 FY2019 % change
Total production 240 148 63
production– mined metal (kt)
BMM 66 65 1
Gamsberg 108 17* -
Refined metal Skorpion 67 66 2
*Includes trial run production of 10 kt
by lower ore production due to suspension of mining operations for 16 days during Q4FY20 on account of a fatality. Gamsberg’s production was at 108,000 tonnes as the operation continues to ramp up with improved performance every quarter–Q1: 23,000 tonnes, Q2: 24,000 tonnes, Q3: 31,000 tonnes and Q4: 30,000 tonnes (impacted by COVID–19). Mining has fully ramped up to 4 mtpa capacity and ~1.8 Mt of healthy ore stockpile has been built ahead of plant. Crusher is consistently running on throughput of ~700 tph (better than design of 685 tph) and milling run rates have improved significantly (average for the year was 430 tph versus 501 tph design). Recovery continues to be a focus area as the plant ramps up and is stable.
At both BMM and Gamsberg, production was also slightly impacted by COVID-19 lockdown.
Total production 240,000 tonnes, 63% higher y-o-y.
employees. Black Mountain Mine has been approached by the Department of Mineral Resources and Energy (Regulatory Authority) to be a stakeholder in the development of National Guidelines for South Africa. We have strengthened our Employee Wellness Programmes that resulted in increased participation of employees and communities in VCT for Aids/HIV, blood donation and community sporting events. A total of 2,961 employees were screened for TB during the year.
ENVIRONMENTZinc International had a good environmental performance in FY2020 with no level 3 or above environmental incidents reported. The Gamsberg Nature Reserve was proclaimed as Protected area under National Environmental Management Protected Area Act, 2003 (Act No. 57 of 2003) on 5 August 2019. The Gamsberg Nature Reserve Trust was established on 6 March 2020.
Black Mountain Mine Tailings Facility

INTEGRATED REPORT
06-115MANAGEMENT REVIEW
116-167STATUTORY REPORTS
168-270FINANCIAL STATEMENTS
271-502
140 VEDANTA LIMITED INTEGRATED REPORT AND ANNUAL ACCOUNTS 2019-20 VEDANTA LIMITED INTEGRATED REPORT AND ANNUAL ACCOUNTS 2019-20 141
ZINC INTERNATIONAL
Particulars FY2020 FY2019 % change
Zinc (US$ per tonne) unit cost 1,665 1,912 (13)
UNIT COSTSThe unit cost of production decreased by 13% to US$1,665 per tonne, from US$1,912 per tonne in the previous year. This was mainly driven by company’s strong regime to reduce the cost and including reduction through higher production
at Gamsberg, lower usage of purchased oxides at Skorpion Zinc, lower Sulphur prices, local currency depreciation, partially offset
FINANCIAL PERFORMANCE During the year, revenue increased by 14% to ₹3,128 crore, driven by higher volumes compared to FY2019, partially offset by lower price realisations. EBITDA decreased by 46% to ₹380 crore, from ₹698 crore in FY2019 mainly on account of lower price realization partially offset by improved cost and higher volume.
(₹ crore, unless stated)
Particulars FY2020 FY2019 % change
Revenue 3,128 2,738 14
EBITDA 380 698 (46)
EBITDA margin 12% 25% -
by higher treatment and refining charge, lower copper credits and annual inflation.
PROJECTS skorpion Refinery Conversion: Project activities were resumed due to the LOM getting completed at Skorpion and also being the fastest way to process Gamsberg concentrates. The previously completed feasibility study is currently being updated and based on this a project decision will be taken in the next quarter.
swartberg phase II: Mine plan and design is complete. Ore reserves have increased from 2.6 million tonnes to 25.4 million tonnes in FY20.
gamsberg phase II: The previously completed Phase 2 feasibility study was updated based on the revised mine design incorporating updated geological model post an extensive drilling programme. The new 8 mtpa mine design is complete. 54Mt Reserve has been added post completion of Feasibility which can result in additional 200ktpa MIC production over and above current production. Gamsberg Smelter- Substantial progress was made with respect to the environmental Impact Assessment process with public participation meetings getting completed and formal Environment applications submission to the government authorities.
EXPLORATIONDuring the year, we made gross additions of 71.2 million tonnes of ore and 1.6 million tonnes of metal to R&R, after depletion. As at 31 March 2020, combined mineral resources
and ore reserves were estimated at 521.4 million tonnes, containing 28 million tonnes of metal. The reserves and resources support a mine life of more than 30 years.
Mill at Gamsberg
STRATEGIC PRIORITIES & OUTLOOKZinc International continues to remain focused to improve its YoY Production by sweating its current assets beyond its design capacity, debottlenecking the existing capacity and adding capacity through Growth Projects. Our Immediate priority is to ramp up the performance of our Gamsberg Plant at Designed capacity and simultaneously develop debottlenecking plan to increase Plant capacity by 10% to 4.4Mt Ore throughput. Likewise, BMM continues to deliver stable Production performance and focus is to debottleneck its Ore volumes from 1.6Mt to 1.8Mt. Skorpion is expected to remain in ‘Care and Maintenance’ for H1 FY21 while management is
assessing feasible & safe mining methods to extract Ore from Pit 112. Zinc International continues to drive cost reduction programme to place Gamsberg operations on 1st Quartile of global cost curve with COP< US$1000 per tonne.
In addition to above, Core Growth strategic priorities include: � Complete approval process and
commence project activities of Swartberg Phase II Project and Skorpion Refinery conversion Project in FY2021 � Continue to improvise Business
case of Gamsberg Phase II and Gamsberg Smelter Project through Government support, Capex and Opex reduction
Deeps Shaft at Black Mountain Mine
Biodiversity at Gamsberg
OPERATIONAL REVIEW ZINC INTERNATIONAL CONTINUED...

INTEGRATED REPORT
06-115MANAGEMENT REVIEW
116-167STATUTORY REPORTS
168-270FINANCIAL STATEMENTS
271-502
142 VEDANTA LIMITED INTEGRATED REPORT AND ANNUAL ACCOUNTS 2019-20 VEDANTA LIMITED INTEGRATED REPORT AND ANNUAL ACCOUNTS 2019-20 143
OPERATIONAL REVIEW OIL & GAS
MANAGEMENT DISCUSSION AND ANALYSIS
THE YEAR IN SUMMARYDuring FY2020, our focus was on the growth projects driven by gross capex of US$3.2 billion to increase volumes from our prolific operating blocks. In pursuit of our vision to contribute to 50% of India’s domestic crude oil production, we have increased our block acreage by acquiring 51 blocks in Open Acreage Licensing Policy (OALP) and two blocks in Discovered Small Fields (DSF).
The acquisition has established us as one of the largest private acreage holders in the country, with a tenfold jump in acreage from 6,000 sq km in August 2018 to ~65,000 sq km.
The PSC blocks offer a rich project portfolio comprising enhanced oil recovery, tight oil, tight gas, facility
OCCUPATIONAL HEALTH & SAFETYThere were fifteen Lost Time Injuries (LTIs) in FY2020. LTIFR stood at 0.3 per million man hours (FY2019: 0.3 per million man hours) amidst increased development activities. We strengthened the HSE culture by introducing Visible Felt Leadership.
Important recognition and awards during the year are as below: � Mangala oil field received first
prize – Overall performance and rolling trophy for Best Performing Fire Fighting Unit during Mines Safety Week. � Raageshwari Oil & Gas Mine
received First Prize in 8th FICCI Safety Systems Excellence Award � HSE Excellence Safety Champion
of the year Award, at Synnex HSE Excellence Summit and Safety Awards in New Delhi. � ‘5Star’ by British Safety Council for
excellence in HSE Management for Pipeline Operation � ‘5Star’ in ‘Par Excellence’ rating
by Quality Circle Forum of India for Raageshwari Oil & Gas Mine. � ‘5Star’ by Quality Circle Forum of
India for Bhagyam, NI, Radhanpur, Viramgam and Bhogat terminal. � Suvali offshore site received
Genentech Safety Award 2019
ENVIRONMENTOur Oil & Gas business is committed to protect the environment, minimise resource consumption and drive towards our goal of ‘zero discharge’.
We have secured position in sustainability front runners’ category with scoring 912 out of 1200 in recently assessed Sustainability 4.0 Award 2020 jointly instituted by Frost & Sullivan and TERI.
Highlights for FY2019-20 are: � Environmental laboratory at
Mangala Processing Terminal (MPT), has been accredited by National Accreditation Board for Testing and Calibration Laboratories � Disposal of drilling & oily waste
through co-processing at cement industries: ~35,700 MT in FY2020 � Recycling and reusing of produced
water resulting into reduced water abstraction: 96%. IOGP av. ~80% � Natural gas was adopted at
Raageshwari Gas Terminal for power generation, thereby eliminating flaring of gas emissions by ~17, 000 tonnes of CO2e/annum. � Biodiversity Conservation:
a. Green belt development by only planting indigenous species in Rajasthan field, promoting plantation of desert-native species b. Carbon sequestration-plantation in Rajasthan field: ~23,156 tonnes of CO2e
Mangala Processing Terminal at night, Barmer
Ensuring safety standards at Cairn Oil & Gas
Production sharing contracts (PSC) signed for Ravva block extended for 10 years
upgradation and exploration and appraisal prospects. These projects are being executed under an Integrated Development strategy involving leading global oilfield service companies and are on track to deliver near-term additional volumes. During the year 136 wells were drilled and 41 wells hooked up.
In OALP blocks, our objective is to reduce the cycle time from exploration to production. We have implemented the largest onshore Full Tensor Gravity Gradiometry™ (FTG) airborne survey in India to optimise time and cost-intensive seismic data acquisition to fast track drilling. The seismic acquisition programme has been initiated and in Assam and mobilisation of the crew is underway in Rajasthan.
Oil & Gas Facility
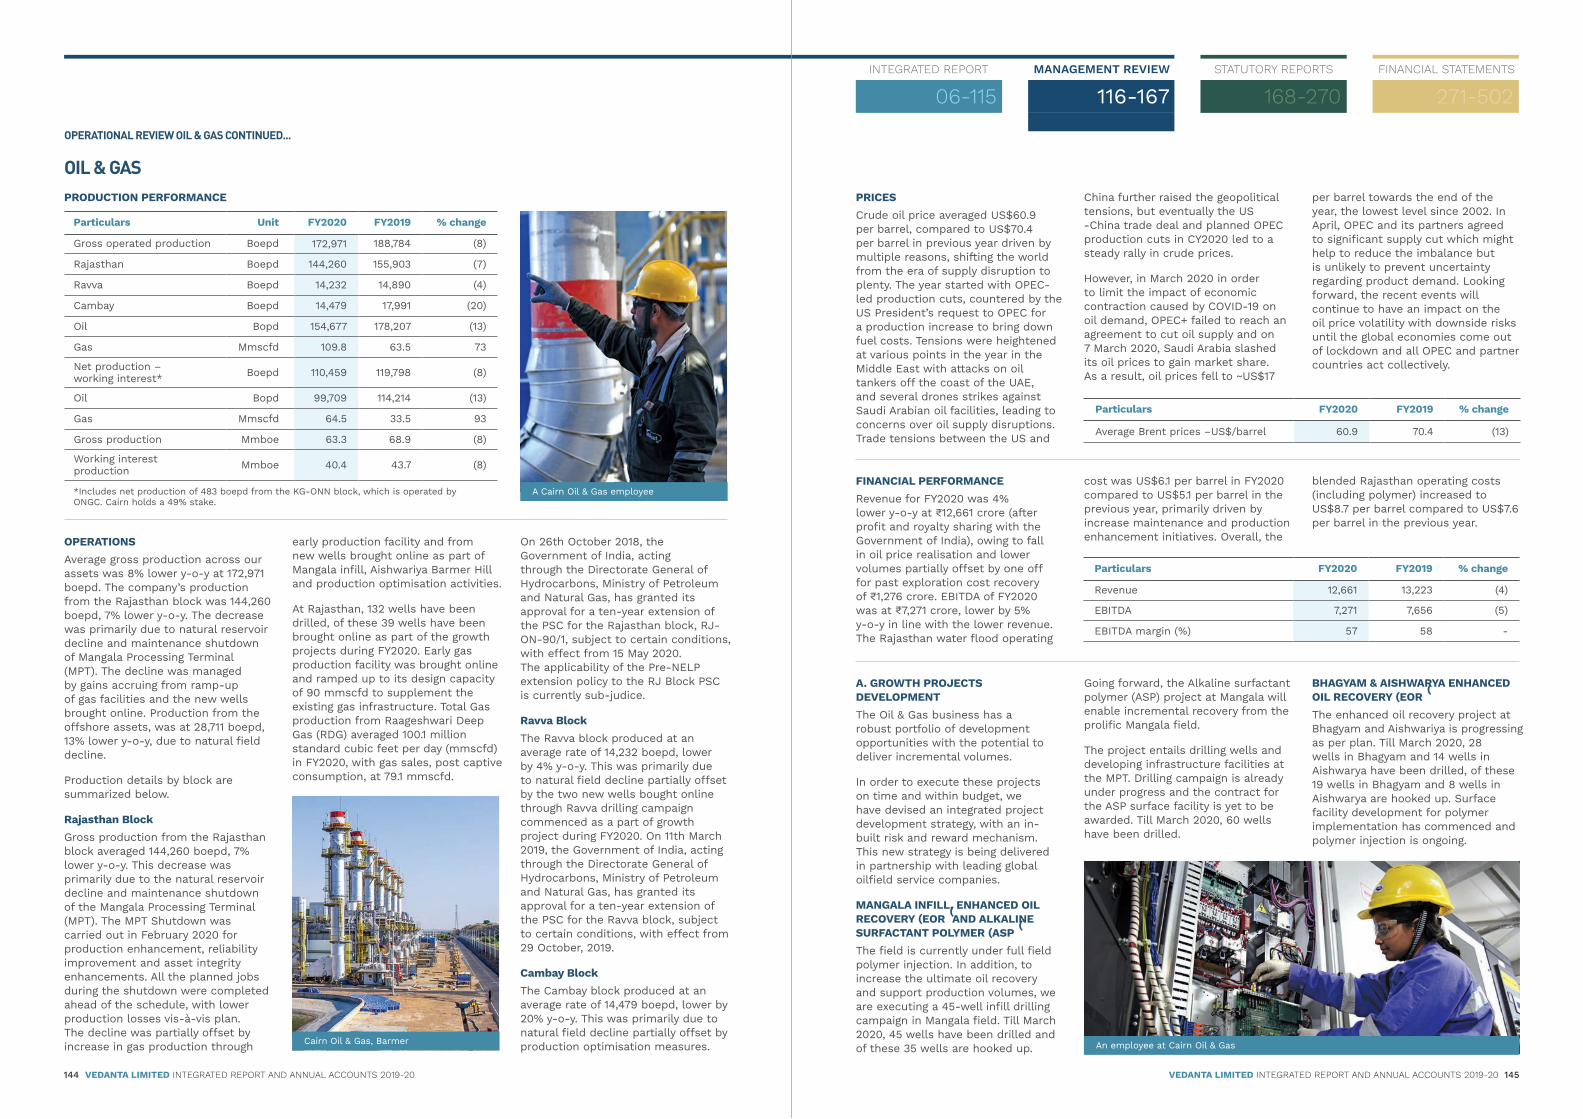
INTEGRATED REPORT
06-115MANAGEMENT REVIEW
116-167STATUTORY REPORTS
168-270FINANCIAL STATEMENTS
271-502
144 VEDANTA LIMITED INTEGRATED REPORT AND ANNUAL ACCOUNTS 2019-20 VEDANTA LIMITED INTEGRATED REPORT AND ANNUAL ACCOUNTS 2019-20 145
OIL & GAS
Particulars Unit FY2020 FY2019 % change
Gross operated production Boepd 172,971 188,784 (8)
Rajasthan Boepd 144,260 155,903 (7)
Ravva Boepd 14,232 14,890 (4)
Cambay Boepd 14,479 17,991 (20)
Oil Bopd 154,677 178,207 (13)
Gas Mmscfd 109.8 63.5 73
Net production – working interest* Boepd 110,459 119,798 (8)
Oil Bopd 99,709 114,214 (13)
Gas Mmscfd 64.5 33.5 93
Gross production Mmboe 63.3 68.9 (8)
Working interest production Mmboe 40.4 43.7 (8)
*Includes net production of 483 boepd from the KG-ONN block, which is operated by ONGC. Cairn holds a 49% stake.
PRODUCTION PERFORMANCE
OPERATIONS Average gross production across our assets was 8% lower y-o-y at 172,971 boepd. The company’s production from the Rajasthan block was 144,260 boepd, 7% lower y-o-y. The decrease was primarily due to natural reservoir decline and maintenance shutdown of Mangala Processing Terminal (MPT). The decline was managed by gains accruing from ramp-up of gas facilities and the new wells brought online. Production from the offshore assets, was at 28,711 boepd, 13% lower y-o-y, due to natural field decline.
Production details by block are summarized below.
Rajasthan BlockGross production from the Rajasthan block averaged 144,260 boepd, 7% lower y-o-y. This decrease was primarily due to the natural reservoir decline and maintenance shutdown of the Mangala Processing Terminal (MPT). The MPT Shutdown was carried out in February 2020 for production enhancement, reliability improvement and asset integrity enhancements. All the planned jobs during the shutdown were completed ahead of the schedule, with lower production losses vis-à-vis plan. The decline was partially offset by increase in gas production through
A Cairn Oil & Gas employee
Cairn Oil & Gas, Barmer
early production facility and from new wells brought online as part of Mangala infill, Aishwariya Barmer Hill and production optimisation activities.
At Rajasthan, 132 wells have been drilled, of these 39 wells have been brought online as part of the growth projects during FY2020. Early gas production facility was brought online and ramped up to its design capacity of 90 mmscfd to supplement the existing gas infrastructure. Total Gas production from Raageshwari Deep Gas (RDG) averaged 100.1 million standard cubic feet per day (mmscfd) in FY2020, with gas sales, post captive consumption, at 79.1 mmscfd.
On 26th October 2018, the Government of India, acting through the Directorate General of Hydrocarbons, Ministry of Petroleum and Natural Gas, has granted its approval for a ten-year extension of the PSC for the Rajasthan block, RJ-ON-90/1, subject to certain conditions, with effect from 15 May 2020. The applicability of the Pre-NELP extension policy to the RJ Block PSC is currently sub-judice.
Ravva BlockThe Ravva block produced at an average rate of 14,232 boepd, lower by 4% y-o-y. This was primarily due to natural field decline partially offset by the two new wells bought online through Ravva drilling campaign commenced as a part of growth project during FY2020. On 11th March 2019, the Government of India, acting through the Directorate General of Hydrocarbons, Ministry of Petroleum and Natural Gas, has granted its approval for a ten-year extension of the PSC for the Ravva block, subject to certain conditions, with effect from 29 October, 2019.
Cambay BlockThe Cambay block produced at an average rate of 14,479 boepd, lower by 20% y-o-y. This was primarily due to natural field decline partially offset by production optimisation measures.
Particulars FY2020 FY2019 % change
Average Brent prices –US$/barrel 60.9 70.4 (13)
PRICESCrude oil price averaged US$60.9 per barrel, compared to US$70.4 per barrel in previous year driven by multiple reasons, shifting the world from the era of supply disruption to plenty. The year started with OPEC-led production cuts, countered by the US President’s request to OPEC for a production increase to bring down fuel costs. Tensions were heightened at various points in the year in the Middle East with attacks on oil tankers off the coast of the UAE, and several drones strikes against Saudi Arabian oil facilities, leading to concerns over oil supply disruptions. Trade tensions between the US and
China further raised the geopolitical tensions, but eventually the US -China trade deal and planned OPEC production cuts in CY2020 led to a steady rally in crude prices.
However, in March 2020 in order to limit the impact of economic contraction caused by COVID-19 on oil demand, OPEC+ failed to reach an agreement to cut oil supply and on 7 March 2020, Saudi Arabia slashed its oil prices to gain market share. As a result, oil prices fell to ~US$17
per barrel towards the end of the year, the lowest level since 2002. In April, OPEC and its partners agreed to significant supply cut which might help to reduce the imbalance but is unlikely to prevent uncertainty regarding product demand. Looking forward, the recent events will continue to have an impact on the oil price volatility with downside risks until the global economies come out of lockdown and all OPEC and partner countries act collectively.
Particulars FY2020 FY2019 % change
Revenue 12,661 13,223 (4)
EBITDA 7,271 7,656 (5)
EBITDA margin (%) 57 58 -
FINANCIAL PERFORMANCERevenue for FY2020 was 4% lower y-o-y at ₹12,661 crore (after profit and royalty sharing with the Government of India), owing to fall in oil price realisation and lower volumes partially offset by one off for past exploration cost recovery of ₹1,276 crore. EBITDA of FY2020 was at ₹7,271 crore, lower by 5% y-o-y in line with the lower revenue.The Rajasthan water flood operating
A. GROWTH PROJECTS DEVELOPMENTThe Oil & Gas business has a robust portfolio of development opportunities with the potential to deliver incremental volumes.
In order to execute these projects on time and within budget, we have devised an integrated project development strategy, with an in-built risk and reward mechanism. This new strategy is being delivered in partnership with leading global oilfield service companies.
MANGALA INFILL, ENHANCED OIL RECoVERy (EoR) AnD AlkAlInE suRFACTAnT polymER (Asp) The field is currently under full field polymer injection. In addition, to increase the ultimate oil recovery and support production volumes, we are executing a 45-well infill drilling campaign in Mangala field. Till March 2020, 45 wells have been drilled and of these 35 wells are hooked up.
cost was US$6.1 per barrel in FY2020 compared to US$5.1 per barrel in the previous year, primarily driven by increase maintenance and production enhancement initiatives. Overall, the
Going forward, the Alkaline surfactant polymer (ASP) project at Mangala will enable incremental recovery from the prolific Mangala field.
The project entails drilling wells and developing infrastructure facilities at the MPT. Drilling campaign is already under progress and the contract for the ASP surface facility is yet to be awarded. Till March 2020, 60 wells have been drilled.
blended Rajasthan operating costs (including polymer) increased to US$8.7 per barrel compared to US$7.6 per barrel in the previous year.
BHAGYAM & AISHWARYA ENHANCED oIl RECoVERy (EoR)The enhanced oil recovery project at Bhagyam and Aishwariya is progressing as per plan. Till March 2020, 28 wells in Bhagyam and 14 wells in Aishwarya have been drilled, of these 19 wells in Bhagyam and 8 wells in Aishwarya are hooked up. Surface facility development for polymer implementation has commenced and polymer injection is ongoing.
An employee at Cairn Oil & Gas
OPERATIONAL REVIEW OIL & GAS CONTINUED...

INTEGRATED REPORT
06-115MANAGEMENT REVIEW
116-167STATUTORY REPORTS
168-270FINANCIAL STATEMENTS
271-502
146 VEDANTA LIMITED INTEGRATED REPORT AND ANNUAL ACCOUNTS 2019-20 VEDANTA LIMITED INTEGRATED REPORT AND ANNUAL ACCOUNTS 2019-20 147
OIL & GASTIGHT OIL AND GAS PROJECTSTight oil: Aishwariya Barmer hill (ABH)ABH is the first tight oil project to monetise the Barmer hill potential and drilling of the project started in Q1FY2019. All 39 wells have been successfully drilled and seven wells are hooked up. Surface facility is under construction and to be commissioned in near term.
Tight gas: Raageshwari deep gas (RDG) developmentGas development in the RGD field continues to be a strategic priority.
OTHER PROJECTSSatellite Field DevelopmentIn order to monetise the satellite fields, an integrated contract for the appraisal and development activity through global technology partnership has commenced. Till March 2020, 13 wells have been drilled.
Surface Facility UpgradationThe MPT facility upgradation is progressing in line with the schedule to handle incremental liquids. Intra-field pipeline augmentation project has been completed. The MPT surface facility augmentation project is expected to be commissioned in near term. The project will lead to the expansion in the liquid handling capacity by 30%.
Ravva developmentAn integrated development campaign has been commenced. Till March 2020, 4 wells have been drilled and 2 wells are hooked up.
B. EXPLORATION AND APPRAISALRAjAsThAn - (BloCk Rj-on-90/1)Rajasthan exploration The Rajasthan portfolio provide access to multiple play types with oil in high permeability reservoirs, tight oil and tight gas. We are evaluating opportunities to commence the drilling program.
Tight Oil AppraisalThe appraisal programme of four fields (Vijaya & Vandana, Mangala Barmer Hill, DP and Shakti) entails the drilling and extended testing of 10 new wells with multi-stage hydraulic fracturing. Till March 2020, seven wells have been drilled.
Open Acreage Licensing Policy (OALP)Under the Open Acreage Licensing Policy (OALP), revenue-sharing contracts have been signed for 51 blocks located primarily in established basins, including some optimally close to existing infrastructure.
Our objective is to reduce cycle time from exploration to production. We have implemented an innovative technology - Full Tensor Gravity Gradiometry™ (FTG) airborne survey to prioritise area of hydrocarbon prospectivity. This is the largest FTG
Early production facility has been commissioned and ramped up to its designed capacity of 90 mmscfd.
Further construction of gas terminal through integrated contract is expected to deliver additional ~90 mmscfd of gas production in near term. This will ramp up the overall Rajasthan gas production to ~240 mmscfd.
In order to realize the full potential of the gas reservoir, contract for drilling of 42 wells has been awarded and till March 2020, 25 wells have been drilled. Processing Facility, Cairn
An employee at the Mangala Processing Terminal, Barmer
survey programme in India covering an area of 1,200 LKM in Assam blocks and 8,000 LKM in Kutch blocks.
The Seismic acquisition programme has commenced in Assam, Kutch and mobilisation of the crew is underway in Rajasthan, Cambay and Offshore blocks. Further, we have applied Satellite-based Sub-Terrain Prospecting (STeP®) in Assam, which includes eight remote sensing & computational technologies within a six-month time frame covering an area of 3,650 sq km. This is the first application in oil & gas exploration in India to provide information to optimize & prioritize areas for exploration focus.
Discovered Small Fields (DSF2)Discovered Small Fields (DSF2) provide synergy with existing oil & gas blocks in the vicinity. These blocks were assessed based on the resource potential and proximity to infrastructure in prioritised sedimentary basins across India.
Two discovered small fields named as Hazarigaon and Kaza gas fields, located in Assam and Krishna Godavari basins, respectively, have been awarded under DSF2.
STRATEGIC PRIORITIES & OUTLOOK Vedanta’s Oil & Gas business has a robust portfolio mix comprising of exploration prospects spread across basins in India, development projects in the prolific producing blocks and stable operations which generate robust cash flows. The key priority ahead is to deliver our commitments from our world class resources with
‘zero harm, zero waste and zero discharge: � Commission the liquid handling
capacity upgrade facility and new gas processing terminal to deliver incremental volume � Increase recovery through full field
injection in Bhagyam & Aishwariya Fields
� Unlock the potential of the exploration portfolio comprising of OALP and PSC blocks � Continue to operate at a low cost-
base and generate free cash flow post-capex
Storage Facilities, MPT
OPERATIONAL REVIEW OIL & GAS CONTINUED...

INTEGRATED REPORT
06-115MANAGEMENT REVIEW
116-167STATUTORY REPORTS
168-270FINANCIAL STATEMENTS
271-502
148 VEDANTA LIMITED INTEGRATED REPORT AND ANNUAL ACCOUNTS 2019-20 VEDANTA LIMITED INTEGRATED REPORT AND ANNUAL ACCOUNTS 2019-20 149
OPERATIONAL REVIEW ALUMINIUM
MANAGEMENT DISCUSSION AND ANALYSIS
THE YEAR IN SUMMARYIn FY2020, the aluminium smelters achieved India’s highest production of 1.9 million tonnes (including trial run). It has been a remarkable year in our cost reduction journey across all levers. The input commodity costs have been benefited by falling alumina price indices from the all-time highs in the last year. We observed similar trends in caustic and petroleum coke prices. The coal materialisation from Coal India improved significantly this year. The improvement in operational metrics across our refinery, smelters and power plants have further contributed to cost reduction. We continue to focus on optimising our controllable costs and improving our price realisation to improve profitability in a sustainable way.
The hot metal cost of production for FY2020 was US$1,690 per tonne, on account of structural improvements in the cost.The Q4 FY2020 hot metal cost of production stood at US$1,451 per tonne. We also achieved record production of 1.81 million tonnes at the alumina refinery through continued debottlenecking. We continue to explore the feasibility of expanding the refinery’s capacity, growing through a phased programme and subject to bauxite availability.
OCCUPATIONAL HEALTH & SAFETY We report with deep regret two fatalities during the year, one at our operations in Jharsuguda as the result of a rail accident at our smelter rail logistics and the other at Chotia coal mines of BALCO. We investigated both incidents thoroughly and shared the lessons learned across the business.
This year, we experienced total 28 LTIs at our operations with a LTIFR of 0.40. To enhance competencies of our executives, engineers and supervisors of business partners, we have imparted Making Better Risk Decision (MBRD) and Safety leadership trainings. Programmes were also conducted for managing safety in high-hazard work areas like confined space, vehicle and driving and working at height through external competent agency as a measure to prevent injuries and minimise potential risks in going forward.
Moreover, to sensitize our employees towards our core values of ‘Care’, we regularly carry out programmes such as ‘Suraksha ki Goth’ and ’Suraksha Charcha’. The worldwide outbreak of COVID-19 has not impacted our operations in FY2020. As part of our Corporate Social Responsibility, our Business Units worked with the government and stakeholders including local community to provide relief measures. Mobile Health units were used for creating awareness with a clear emphasis on the importance of social distancing and maintaining personal hygiene. All our Business units provided support
Tree Plantation Drive, Aluminum Business
to District & State Health Services in terms of medical equipment including hand sanitizers, medicines, reagents, PPEs such as surgical masks, gloves, gowns and manpower such as housekeeping staff, security personnel, medical personnel etc. in addition to contribution to government’s relief fund for COVID-19. The SHGs associated with our facility at Lanjigarh and Jharsuguda were involved in preparing masks thereby creating livelihood while helping reduce the impact of COVID-19. Fire brigades at the facilities have been deployed to sanitize the premise and in the core villages near our facilities. The facilities are providing food to migrant workers, identified community groups, police personnel etc. as part of our CSR initiatives.
ENVIRONMENTJharsuguda has recycled 14.7% of the water used in the year FY2020 while BALCO has recycled nearly 10.2%. There has been a significant improvement in our water consumption of 0.69 m3/MT (FY2019: 0.72 m3/MT) at BALCO. We are consistently focusing on improving the recycled water percentage in future.
Management of the hazardous waste like spent pot line, aluminium dross, fly ash, etc. are material waste management issue for the Aluminium and Power business. Our BALCO unit disposed 3,224 MT spent pot lining and 6,129 MT of aluminium dross, to authorized recyclers this year. Both BALCO and Jharsuguda have been able to dispose 100% of its fly ash generation at the units. In our Lanjigarh operations, 98.4% of lime grit has been utilisied in FY2020 (FY2019: 97%).
Encouraging all round development at Vedanta
India’s highest production, 1.9 million tonnes in FY2020Aluminum Facility, Jharsugda

INTEGRATED REPORT
06-115MANAGEMENT REVIEW
116-167STATUTORY REPORTS
168-270FINANCIAL STATEMENTS
271-502
150 VEDANTA LIMITED INTEGRATED REPORT AND ANNUAL ACCOUNTS 2019-20 VEDANTA LIMITED INTEGRATED REPORT AND ANNUAL ACCOUNTS 2019-20 151
ALUMINIUMPRODUCTION PERFORMANCE
AlumInA REFInERy: lAnjIgARh At Lanjigarh, production was 21% higher y-o-y at 1.81 million tonnes, primarily through continued plant debottlenecking. We continue to evaluate the possible expansion of the refinery, subject to bauxite availability.
ALUMINIUM SMELTERS We ended the year with production of 1.9 million tonnes (including trial run). Both smelters at BALCO and Jharsuguda continued to show consistent performance. We continue to evaluate Line 4 of Jharsuguda II smelter.
COAL LINKAGES We continue to focus on the long-term security of our coal supply at competitive prices. We added 3.2 mtpa of coal linkages through Tranche IV and its materialisation began in March 2019. The captive coal block, Chotia, at BALCO operating at full capacity. We emerged as the highest bidder for Jamkhani coal block and have signed the Coal Mine Development and Production Agreement with the Government of India. The Jamkhani coal block is currently rated at 2.6 mtpa. This takes our coal security to 72% of our requirements.
Employees engaging in conversation in office
Production (kt) FY2020 FY2019 % change
Alumina – Lanjigarh 1,811 1,501 21
Total aluminium production 1,904 1,959 (3)
Jharsuguda I 543 545 -
Jharsuguda II1 800 843 (5)
BALCO I 256 260 (2)
BALCO II 305 311 (2)
(1) Including trial run production of nil in FY2020 versus 63 kt in FY2019
Particulars FY2020 FY2019 % change
Average LME cash settlement prices (US$ per tonne) 1,749 2,035 (14)
PRICESAverage LME prices for aluminium in FY2020 stood at US$1,749 per tonne, 14% lower y-o-y. LME prices hovered between US$1,700 per tonne – US$1,800 per tonne band for most of the year, showing a sharp decline in
the last month of FY2020. LME was stabilised after sanctions against UC Rusal were lifted and US-China trade war concerns receding. However, uncertainties over the impact of COVID-19 have caused prices to plummet in recent months.
Aluminum Rolls
(US$ per tonne)
Particulars FY2020 FY2019 % change
Alumina cost (ex-Lanjigarh) 275 322 (15)
Aluminium hot metal production cost 1,690 1,967 (14)
Jharsuguda CoP 1,686 1,970 (14)
BALCO CoP 1,700 1,962 (13)
UNIT COSTSDuring FY2020, the COP of alumina improved to US$275 per tonne, due to benefits from increase in locally sourced bauxite, continued debottlenecking, improved plant operating parameters and rupee depreciation. This was further backed by falling input commodity prices (mainly caustic soda and imported bauxite). In FY2020, the total bauxite requirement of ~5.3 million tonnes was met by captive mines (9%), Odisha (49%) and imports (42%). In the previous year, the bauxite supply mix was captive mines (10%), Odisha (31%), other domestic sources (20%) and imports (39%).
In FY2020, the COP of hot metal at Jharsuguda was US$1,686 per tonne, down by 13% from US$1,970 in FY2019. The hot metal COP at BALCO fell to US$1,700 per tonne, down
by 13% from US$1,962 per tonne in FY2019. This was primarily driven by falling global input raw material indices across alumina, carbon, caustic etc. The global alumina price indices fell from an all-time high of US$590 per tonne in September 2018 to US$280 per tonne levels in Q4 FY2020. Caustic prices also followed a similar trend. The power cost was lower as materialisation of domestic coal supply from Coal India improved, without any major supply disruptions witnessed unlike the previous year. It was further helped by higher
Lanjigarh alumina production, operational improvements at power plants and currency depreciation.
The hot metal cost of production for FY2020 was US$1,690 per tonne, significantly lower compared to previous year on account of structural improvements in the cost due to increase captive alumina production from the Lanjigarh refinery, improved coal materialisation, better processing costs and falling input commodity costs. Coal materialisation has been good throughout the year.
(₹ crore, unless stated)
Particulars FY2020 FY2019 % change
Revenue 26,577 29,229 (9)
EBITDA 1,998 2,202 (9)
EBITDA margin (%) 8 8 -
FINANCIAL PERFORMANCEDuring the year, revenue decreased by 9% to ₹26,577 crore, driven primarily by falling LME Aluminium prices. EBITDA was lower at ₹1,998 crore (FY2019: ₹2,202 crore), mainly due to improved hot metal cost of production & true up of RPO liability partially offset by lower sales realisations.
STRATEGIC PRIORITIES & OUTLOOK In wake of COVID-19 concerns, the outlook for the initial months of FY2021 is volatile with aluminium consumers either reducing or shutting production across geographies. The global maritime supply chain is also running with delayed timelines. However, all our alumina and aluminium facilities have been categorized as essential services by government authorities and continue to operate at current production levels. Our facilities have switched to limited manning, in line with government guidelines and social distancing norms. We look to dynamically adapt our product mix to cater to changing market requirements. The management is watchful of changing global and local
scenarios and is actively charting its new course with health and safety as its first priority followed by its business objectives.
The input commodity prices continue to be low and we are looking at ways to continuously optimise our costs, while also increasing the price realisation in order to improve profitability in a sustainable way.
At our power plants, we are also working towards reducing Gross Calorific Value (GCV) losses in coal as well as improving plant operating parameters which should deliver higher Plant Load Factors (PLFs) and a reduction in non-coal costs. We look forward to operationalising our Jamkhani coal block in the last quarter of FY2021.
Whilst the current market outlook remains uncertain, our core strategic priorities include: � Focus on the health & safety of our
employees, our business partners and customers � Deliver Lanjigarh refinery
production growth and stable aluminium production � Enhance our raw material security
of bauxite & alumina � Improve coal linkage security,
better materialisation � Operationalize Jamkhani coal block; � Improve our plant operating
parameters across locations; and � Improve realisations by improving
our value-added product portfolio
OPERATIONAL REVIEW ALUMINIUM CONTINUED...

INTEGRATED REPORT
06-115MANAGEMENT REVIEW
116-167STATUTORY REPORTS
168-270FINANCIAL STATEMENTS
271-502
152 VEDANTA LIMITED INTEGRATED REPORT AND ANNUAL ACCOUNTS 2019-20 VEDANTA LIMITED INTEGRATED REPORT AND ANNUAL ACCOUNTS 2019-20 153
OPERATIONAL REVIEW POWER
MANAGEMENT DISCUSSION AND ANALYSIS
THE YEAR IN SUMMARYFY2020 was a significant year for the Talwandi Sabo (TSPL) power plant, where we achieved plant availability of ~91%. The plant load factor (PLF) at BALCO were also higher on account of better coal availability.
OCCUPATIONAL HEALTH & SAFETYThe key focus area for this year was to improve leadership and develop a culture of care for which we launched the programme of ‘Visible Felt Leadership’. This allowed our experienced leaders to share their valuable knowledge with the workers on site through direct interactions thereby minimising the gap. In FY2020, we did not have any fatalities and our LTIFR was 1.51.
ENVIRONMENTOne of the main environmental challenges for power plants is the management and recycling of fly ash. At all our operations, we have a sustained 100% utilization of fly ash.Golder Associates has completed the review of our ash dyke structures and we are in process of implementing their recommendations. TSPL has recycled 14% of the water used. We are further working to enhance the recycled water percentage through measures planned during FY2021. TSPL Facility
Greater than 100% utilisation of fly ash at all our operations.
PRODUCTION PERFORMANCE
Particulars FY2020 FY2019 % change
Total power sales (MU) 11,162 13,515 (17)
Jharsuguda 600 MW 776 1,039 (25)
BALCO 300 MW* 1,726 2,168 (20)
MALCO# - - -
HZL wind power 438 449 (3)
TSPL 8,223 9,858 (17)
TSPL – availability 91% 88% -
#continues to be under care and maintenance since 26 May 2017 due to low demand in Southern India.
*We have received an order dated 1 January 2019 from Chhattisgarh State Electricity Regulatory Commission for conversion of 300MW IPP to CPP. During the Q4FY2019, 184 units were sold externally from this plant.
VL-J Billets coming out of the casting processTSPL Power Plant

INTEGRATED REPORT
06-115MANAGEMENT REVIEW
116-167STATUTORY REPORTS
168-270FINANCIAL STATEMENTS
271-502
154 VEDANTA LIMITED INTEGRATED REPORT AND ANNUAL ACCOUNTS 2019-20 VEDANTA LIMITED INTEGRATED REPORT AND ANNUAL ACCOUNTS 2019-20 155
POWER
FINANCIAL PERFORMANCE EBITDA for the year was 8% higher y-o-y at ₹1,649 crore mainly because of lower cost of production due to improved coal prices and supply in the domestic market which resulted in higher linkage materialisation. During FY2020, TSPL realised ₹1,002 crores from PSPCL on account of Gross Calorific Value matter resolution basis Hon’ble Supreme Court order.
(₹ crore, unless stated)
Particulars FY2020 FY2019 % change
Revenue 5,860 6,524 (10)
EBITDA 1,649 1,527 8
EBITDA margin (%) 28 23 -
*Excluding one-offs
OPERATIONSDuring FY2020, power sales were 11,162 million units, 17% lower y-o-y. Power sales at TSPL were 8,223 million units with 91% availability in FY2020.
At TSPL, the Power Purchase Agreement (PPA) with the Punjab State Electricity Board compensates us based on the availability of the plant. The 600 MW Jharsuguda power
plant operated at a lower PLF of 11% in FY2020.
The 300 MW BALCO Independent Power Plant (IPP) operated at a PLF of 71% in FY2020. The MALCO plant continues to be under care and maintenance, effective from 26 May 2017, due to low demand in Southern India.
VL-J_Cast House Control Room
Power generation facility, BALCO
STRATEGIC PRIORITIES & OUTLOOK During FY2021, we will remain focused on maintaining the plant availability of TSPL and achieving higher plant load factors at the BALCO and Jharsuguda IPPs.
Our focus and priorities will be to: � Resolve pending legal issues and
recover aged power debtors � Achieve higher PLFs for the
Jharsuguda and BALCO IPP
� Improve power plant operating parameters to deliver higher PLFs/ availability and reduce the non-coal cost
TSPL Facility, Side View
Particulars FY2020 FY2019 % change
Sales realisation (₹/kWh)1 3.6 3.4 9
Cost of production (₹/kWh)1 2.5 2.9 (16)
TSPL sales realisation (₹/kWh)2 3.7 4.1 (10)
TSPL cost of production (₹/kWh)2 2.7 3.1 (13)
(1) Power generation excluding TSPL
(2) TSPL sales realisation and cost of production is considered above, based on availability declared during the respective period
UNIT SALES AND COSTSAverage power sale prices, excluding TSPL, increased by 9% to ₹3.6 per kWh. This was mainly due better prices in the open access market.During the year, the average generation cost was lower at ₹2.5 per kWh (FY2019: ₹2.9 per kWh), driven mainly by a decrease in coal prices and improved linkage materialisation.
In FY2020, TSPL’s average sales price was lower at ₹3.7 per kWh (FY2019: ₹4.1 per kWh), and power generation cost was lower at ₹2.7 per kWh (FY2019: ₹3.1 per kWh).
OPERATIONAL REVIEW POWER CONTINUED...

INTEGRATED REPORT
06-115MANAGEMENT REVIEW
116-167STATUTORY REPORTS
168-270FINANCIAL STATEMENTS
271-502
156 VEDANTA LIMITED INTEGRATED REPORT AND ANNUAL ACCOUNTS 2019-20 VEDANTA LIMITED INTEGRATED REPORT AND ANNUAL ACCOUNTS 2019-20 157
OPERATIONAL REVIEW IRON ORE
MANAGEMENT DISCUSSION AND ANALYSIS
THE YEAR IN SUMMARYProduction of saleable ore at Karnataka stood at 4.51 wet million tonnes. With the order of Central Empowered Committee (Supreme Court appointed body) in March 2020, our annual mining capacity has been increased up to 5.89 mtpa. In line with this, the Government of karnataka allocated the production quantity of 4.82 wet million tonnes for the current year FY2020 onwards.
Meanwhile, operations in Goa remained in suspension in FY2020 due to a state-wide directive from the Supreme Court. However, we continue to engage with the Government to secure a resumption of mining operations.
OCCUPATIONAL HEALTH & SAFETYIn our journey towards ‘zero harm’, Iron Ore Business (IOB) had a fatality free FY2020. The LTIFR was 0.44 (FY2019: 0.30). Reporting of leading indicators has significantly improved, post the launch of Safety Mobility App, which has a real-time incident-reporting feature.
Iron Ore business has implemented a series of initiatives to improve its safety performance, including: deployment of more than 100 Safety Grid Owners across all units; focused training and certification programme by British Safety Council for Grid Owners; inclusion of business partners in Visible Felt Leadership schedules; ‘5S’ Audits at regular intervals; identification and periodic review of safety procedures of all critical safety tasks; development
of Level 2 Crane champions; Auto sampling and alarm systems for confined space entries; and development of internal trainers on defensive driving to improve vehicle and driving standards.
We have an attractive rewards & recognition scheme for safe performance. Additionally, there is an exclusive reward scheme for Grid Owners who have put exceptional effort in creating a safe workplace.
With the rising COVID-19’s positive cases and deaths across the nation, top management team of Iron Ore Business is dedicated to take preventive actions to restrict spread of the COVID-19 among our employees and business partners.
A central COVID-19 taskforce was constituted under the guidance of our CEO and unit-wise, cross-functional teams for implementation of all the preventive and precautionary measures. Travel policy was issued directing to avoid any kind of personal and business travel unless completely unavoidable. Activities like cold fumigation for common areas were carried out. There were restrictions for entry of visitors as well as employees coming from outstation. We ensured necessary stock of medicines, Personal Protective Equipment (PPEs) as well as sanitisers, Hazmat suits, masks and gloves are maintained. All meetings were conducted through conference call or telepresence. Sesa Goa Iron Ore Value Added Business (VAB), was awarded the prestigious ‘Gomant Sarvocha Suraksha Puraskar’ at Green Triangle Safety awards for outstanding performance in occupational health & safety.
Hand washing kits distributed to students at Jharkhand
Employees planting saplings at Amona temple
ENVIRONMENTIn our journey towards ‘zero discharge’, we recycle and reuse almost all of the wastewater we generate at VAB, except the non-contact type condenser cooling water of the power plant, which is cooled and treated before discharging into the Mandovi river as per the consent to operate granted by Goa State Pollution Control Board.
At VAB, we have installed continuous emission monitoring systems in all the process stacks, which are connected to State Pollution Control Board. New bag house with advanced design have been installed for reducing fugitive emission at ladle dumping chamber of blast furnace for efficient dust control mechanism. A storm water management plan has been executed by building multiple settling ponds across our Goa & Karnataka operations. At Karnataka, the organisation has constructed 38 check dams, seven settling pond and two harvesting pits having a rainwater harvesting potential of 275,805 m3 annually. Additionally, it has de-silted 10 nearby village ponds increasing their rainwater harvesting potential by 75,629 m3/annum.
During FY2020, ~3.6 Ha of mining dump slope was covered with geotextiles to prevent soil erosion and mine reclamation with natural species of ~50,000 saplings. At Karnataka, operations to reduce water consumption without affecting the effectiveness of our dust suppression measures are underway with latest technologies like the use of mist cannons, environment-friendly dust suppressants and others.These initiatives have helped us in water saving of 12%. At VAB we have implemented projects to reduce thermal energy consumption through coke and coke breeze consumption and various electrical energy reduction projects such as optimization of compressed air, replacement of conventional lamp with LED lamps and other projects to reduce specific energy consumption. Our VAB unit won “Energy Efficient Unit Award” at CII National Energy Management Awards at Hyderabad.
Annual mining capacity increased upto 5.89 mtpa in Karnataka.Iron Ore mine at Codli

INTEGRATED REPORT
06-115MANAGEMENT REVIEW
116-167STATUTORY REPORTS
168-270FINANCIAL STATEMENTS
271-502
158 VEDANTA LIMITED INTEGRATED REPORT AND ANNUAL ACCOUNTS 2019-20 VEDANTA LIMITED INTEGRATED REPORT AND ANNUAL ACCOUNTS 2019-20 159
IRON OREPRODUCTION PERFORMANCE
Employees with Pig Iron block at site
Particulars FY2020 FY2019 % change
Production (dmt)
Saleable ore 4.4 4.4 -
Goa - 0.2 -
Karnataka 4.4 4.1 6
Pig iron (kt) 681 686 (1)
Sales (dmt)
Iron ore 6.6 3.8 73
Goa 0.9 1.3 (33)
Karnataka 5.8 2.6 125
Pig iron (kt) 666 684 (3)
OPERATIONSAt Karnataka, production was 4.4 million tonnes, 6% higher y-o-y. Sales in FY2020 were 5.8 million tonnes, 125% higher y-o-y due to an increase in production and stock liquidation at
Karnataka by 1.6 wet million tonnes. Production of pig iron was 681,000 tonnes in FY2020, lower by 1% y-o-y.
Due to nationwide lockdown imposed by Central government because of
COVID-19 pandemic, we lost ~20,000 tonnes at of pig iron production at VAB in month of March 2020.
At Goa, mining was brought to a halt pursuant to the Supreme Court judgement dated 7 February 2018 directing all companies in Goa to stop mining operations with effect from 16 March 2018. We continue to engage with the Government for a resumption of mining operations.
We bought 1.4 million tonnes low grade iron ore in auctions held by Goa Government in August 2019. These ore were then beneficiated and ~0.9 million tonnes were exported, which further helped us to cover our fixed cost and some ore were used to cater to requirement of our pig iron plant at Amona.
Hot Metal from the Blast Furnace operation
FINANCIAL PERFORMANCE In FY2020, revenue increased to ₹3,463 crore, 19% higher y-o-y mainly due to two-fold increase in sales volume at Karnataka partially offset by lower pig iron prices during the year. EBITDA increased to ₹878 crore compared with ₹584 crore in FY2019, mainly due to higher volumes at Karnataka.
(₹ crore, unless stated)
Particulars FY2020 FY2019 % change
Revenue 3,463 2,911 19
EBITDA 878 584 50
EBITDA margin (%) 25 20 -
STRATEGIC PRIORITIES & OUTLOOK Looking ahead for the next 12 months our focus and priorities will be to: � Bring about a resumption of mining
operations in Goa through continuous engagement with the Government and the judiciary
� Increase our footprint in iron ore by continuing to participate in auctions across the country, including Jharkhand � Securing Environmental Clearance
for expansion & debottlenecking of Pig Iron plant to increase production capacity by 1.7 LTPA
� Advocacy for removal of e-auction/ trade barrier in Karnataka
Iron Ore mine at Codli
OPERATIONAL REVIEW IRON ORE CONTINUED...

INTEGRATED REPORT
06-115MANAGEMENT REVIEW
116-167STATUTORY REPORTS
168-270FINANCIAL STATEMENTS
271-502
160 VEDANTA LIMITED INTEGRATED REPORT AND ANNUAL ACCOUNTS 2019-20 VEDANTA LIMITED INTEGRATED REPORT AND ANNUAL ACCOUNTS 2019-20 161
OPERATIONAL REVIEW STEEL
MANAGEMENT DISCUSSION AND ANALYSIS
THE YEAR IN SUMMARYElectrosteel Steels Limited (ESL) is an Integrated Steel Plant (ISP) in Bokaro, Jharkhand, with a design capacity of 2.5 mtpa. Its current operating capacity is 1.5 mtpa with a diversified product mix of wire rod, rebar, DI pipe and pig iron.
In FY2020, ESL has achieved achieved the record volume and lowest-ever cost during the year since acquisition, however EBITDA margin was lower as compared to previous period (US$78 per tonne v/s US$115 per tonne) on account of decline in steel prices.
OCCUPATIONAL HEALTH & SAFETY We unfortunately had one fatality on 28 February 2020 at Steel Melting Shop (SMS). On 22 February 2020, Mr. Laxman Kumar, a signal man met with unfortunate accident and succumbed to his injuries on 28 February 2020. Detailed internal and external investigations were undertaken to ascertain the root cause of the incidents and control measures have been put in place.
In terms of improvement of safety journey, initiatives like positive isolation survey conducted for an entire plant by E-Square; LOTOV implementation in progress across site; grid owner concept initiated
to focus on HSE system being implemented effectively; critical risk identified across plant; HAZOP studies in progress; capability development under various module such as scaffolding safety; crane safety; defensive driving safety and others; overall 145 leaders were trained in MBRD to create awareness celebrated month-long National Safety day in February; initiated Periodic Medical Examination (PME) and Pre-employment Examination of Employees/Workers; procured advanced life support ambulance, established OHC with all latest medical equipment’s inside the plant premises and other initiatives. The LTIFR for FY2020 was 0.38.
ENVIRONMENTIn Waste Management system, more than 100% utilisation of Blast furnace granulated Slag, Fly Ash to cement industries through long term contracts and Brick manufacturers, Disposal of Biomedical waste to CBWTF, Selling of Used Oil and Zinc Dust to Pollution Control Board authorized recyclers and re-processors is being ensured.
In Water Management, we treat of around 4,000 Kl of water daily in Effluent Treatment Plant and it is being reutilized in several processes such as Coke Quenching,
BF Slag granulation, 100% Greenbelt Development, Fire Fighting, Sprinkling and in operations of Lime and Dolo, DIP and others.
In Energy Management, usage of waste heat from coke oven flue gas for generation of steam which, ultimately helps in power generation, Reduction in Auxiliary power consumption from 12% to 8% through improvement in station heat rate.
Usage of LP steam in Blast furnace to minimize the fuel requirement, LD gas and BF gas in several operations such as reheating furnace of rolling mills, Blast Furnace, DIP and lime and Dolo to reduce the fuel consumption, Running of TG through steam generated from Waste Heat recovery.
In Air Emission Management, Revamping of OG system in SMS to reduce fugitive emission, upgradation of Air pollution control equipment’s to meet the norms stipulated by the regulatory authorities, Installation of fixed sprinklers all along the haul roads and dry fog system in all the closed conveyors and deployment of mechanical sweepers for road sweeping.
Mobile Health Check- up in 25 villages
ESL’s Leadership planting trees in the plant premises for a sustainable future
Design capacity of 2.5 mtpa. ESL Facility, Bokaro
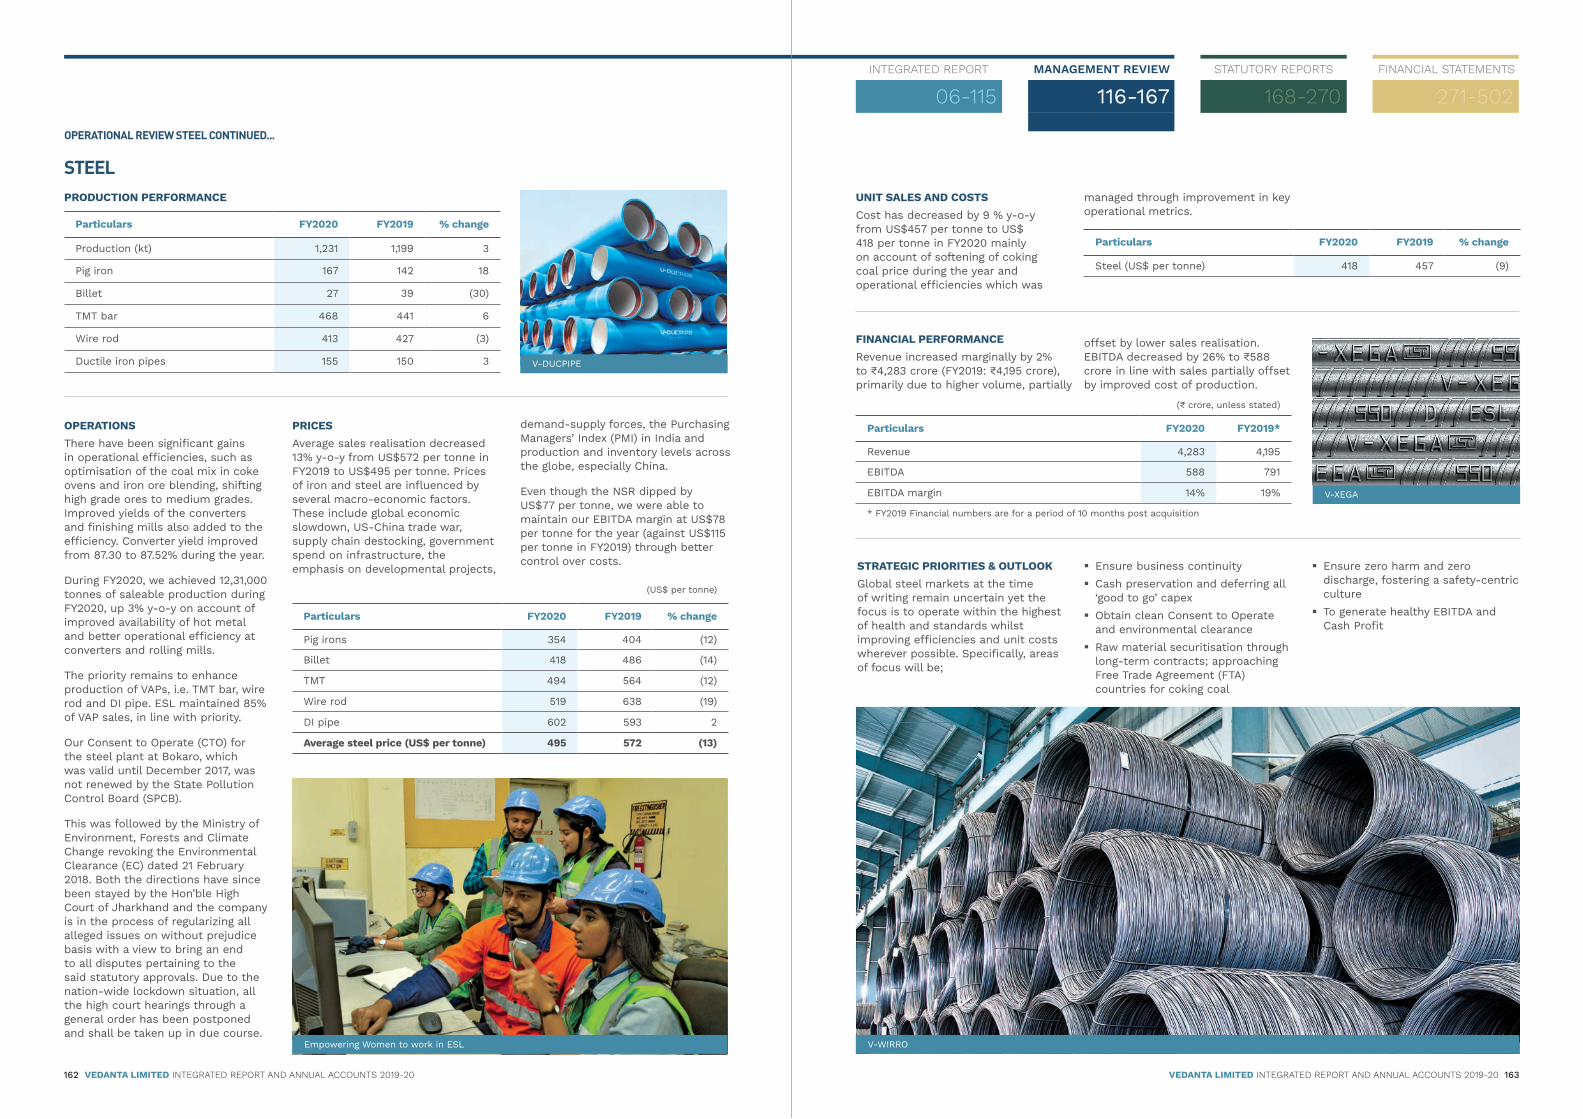
INTEGRATED REPORT
06-115MANAGEMENT REVIEW
116-167STATUTORY REPORTS
168-270FINANCIAL STATEMENTS
271-502
162 VEDANTA LIMITED INTEGRATED REPORT AND ANNUAL ACCOUNTS 2019-20 VEDANTA LIMITED INTEGRATED REPORT AND ANNUAL ACCOUNTS 2019-20 163
STEELPRODUCTION PERFORMANCE
V-DUCPIPE
Particulars FY2020 FY2019 % change
Production (kt) 1,231 1,199 3
Pig iron 167 142 18
Billet 27 39 (30)
TMT bar 468 441 6
Wire rod 413 427 (3)
Ductile iron pipes 155 150 3
OPERATIONSThere have been significant gains in operational efficiencies, such as optimisation of the coal mix in coke ovens and iron ore blending, shifting high grade ores to medium grades. Improved yields of the converters and finishing mills also added to the efficiency. Converter yield improved from 87.30 to 87.52% during the year.
During FY2020, we achieved 12,31,000 tonnes of saleable production during FY2020, up 3% y-o-y on account of improved availability of hot metal and better operational efficiency at converters and rolling mills.
The priority remains to enhance production of VAPs, i.e. TMT bar, wire rod and DI pipe. ESL maintained 85% of VAP sales, in line with priority.
Our Consent to Operate (CTO) for the steel plant at Bokaro, which was valid until December 2017, was not renewed by the State Pollution Control Board (SPCB).
This was followed by the Ministry of Environment, Forests and Climate Change revoking the Environmental Clearance (EC) dated 21 February 2018. Both the directions have since been stayed by the Hon’ble High Court of Jharkhand and the company is in the process of regularizing all alleged issues on without prejudice basis with a view to bring an end to all disputes pertaining to the said statutory approvals. Due to the nation-wide lockdown situation, all the high court hearings through a general order has been postponed and shall be taken up in due course.
(US$ per tonne)
Particulars FY2020 FY2019 % change
Pig irons 354 404 (12)
Billet 418 486 (14)
TMT 494 564 (12)
Wire rod 519 638 (19)
DI pipe 602 593 2
Average steel price (US$ per tonne) 495 572 (13)
PRICESAverage sales realisation decreased 13% y-o-y from US$572 per tonne in FY2019 to US$495 per tonne. Prices of iron and steel are influenced by several macro-economic factors. These include global economic slowdown, US-China trade war, supply chain destocking, government spend on infrastructure, the emphasis on developmental projects,
demand-supply forces, the Purchasing Managers’ Index (PMI) in India and production and inventory levels across the globe, especially China.
Even though the NSR dipped by US$77 per tonne, we were able to maintain our EBITDA margin at US$78 per tonne for the year (against US$115 per tonne in FY2019) through better control over costs.
Empowering Women to work in ESL
V-XEGA
Particulars FY2020 FY2019 % change
Steel (US$ per tonne) 418 457 (9)
UNIT SALES AND COSTSCost has decreased by 9 % y-o-y from US$457 per tonne to US$ 418 per tonne in FY2020 mainly on account of softening of coking coal price during the year and operational efficiencies which was
FINANCIAL PERFORMANCERevenue increased marginally by 2% to ₹4,283 crore (FY2019: ₹4,195 crore), primarily due to higher volume, partially
managed through improvement in key operational metrics.
(₹ crore, unless stated)
Particulars FY2020 FY2019*
Revenue 4,283 4,195
EBITDA 588 791
EBITDA margin 14% 19%
* FY2019 Financial numbers are for a period of 10 months post acquisition
STRATEGIC PRIORITIES & OUTLOOK Global steel markets at the time of writing remain uncertain yet the focus is to operate within the highest of health and standards whilst improving efficiencies and unit costs wherever possible. Specifically, areas of focus will be;
� Ensure business continuity � Cash preservation and deferring all
‘good to go’ capex � Obtain clean Consent to Operate
and environmental clearance � Raw material securitisation through
long-term contracts; approaching Free Trade Agreement (FTA)
countries for coking coal
V-WIRRO
� Ensure zero harm and zero discharge, fostering a safety-centric culture � To generate healthy EBITDA and
Cash Profit
offset by lower sales realisation. EBITDA decreased by 26% to ₹588 crore in line with sales partially offset by improved cost of production.
OPERATIONAL REVIEW STEEL CONTINUED...

INTEGRATED REPORT
06-115MANAGEMENT REVIEW
116-167STATUTORY REPORTS
168-270FINANCIAL STATEMENTS
271-502
164 VEDANTA LIMITED INTEGRATED REPORT AND ANNUAL ACCOUNTS 2019-20 VEDANTA LIMITED INTEGRATED REPORT AND ANNUAL ACCOUNTS 2019-20 165
OPERATIONAL REVIEW COPPER - INDIA / AUSTRALIA
MANAGEMENT DISCUSSION AND ANALYSIS
THE YEAR IN SUMMARYThe copper smelter plant at Tuticorin was under shutdown for the whole of FY2020. We continue to engage with the Government and relevant authorities to enable the restart of operations at Copper India.
We continued to operate our refinery and rod plant at Silvassa, catering to the domestic market.
OCCUPATIONAL HEALTH & SAFETYThe Lost Time Injury Frequency Rate (LTIFR) was zero in FY2020 (FY2019: 0.15).
ENVIRONMENTCopper Mines of Tasmania continued in care and maintenance awaiting a decision on restart. Meanwhile, a small dedicated team is maintaining the site and there were no significant safety or environmental incidents during the year.
The site retained its ISO accreditation in safety, environment and quality management systems and the opportunity of a lull in production was used to review and further improve these systems.
PRODUCTION PERFORMANCE
Particulars FY2020 FY2019 % change
Production (kt)
India – cathode 77 90 (14)%
OPERATIONSThe Tamil Nadu Pollution Control Board (TNPCB) vide order, dated 9 April 2018, rejected the consent renewal application of Vedanta Limited for its copper smelter plant at Tuticorin. It directed Vedanta not to resume production operations without formal approval/consent (vide order dated 12 April 2018), and directed the closure of the plant and the disconnection of electricity (vide order dated 23 May 2018).
The Government of Tamil Nadu also issued an order dated 28 May 2018 directing the TNPCB to permanently close and seal the existing copper smelter at Tuticorin; this was followed by the TNPCB on 28 May 2018.
Vedanta Limited filed a composite appeal before the National Green Tribunal (NGT) against all the above orders passed by the TNPCB and the Government of Tamil Nadu. In December 2018, NGT set aside the impugned orders and directed the TNPCB to renew the Consent to Operate. The order passed by the NGT was challenged by Tamil Nadu State Government in Hon’ble Supreme Court.
The Hon’ble Supreme Court of India in its order dated 18 February 2019 allowed the appeal against NGT order and directed Company to challenge all the orders cumulatively before Hon’ble Madras High Court.
Quality check of copper samples, Sterlite Copper
Encouraging diversity leaders at Sterlite Copper
Contract workers at Refinery operations, Sterlite Copper
The Company filed a writ petition before Madras High Court in February 2019 challenging the orders of the State of Tamil Nadu and TNPCB. This Petition was heard by Hon’ble Madras High Court from June 2019 to January 2020. The hearing in this matter has currently concluded and the matter is reserved for orders. The Bench assured that it will endeavour to deliver judgement as early as possible. Meanwhile, the Company’s Silvassa refinery and rod plant continues to operate as usual, enabling us to cater to the domestic market.
Our copper mine in Australia has remained under extended care and maintenance since 2013. However, we continue to evaluate various options for its profitable restart, given the government’s current favourable support and prices.
The Company’s Silvassa refinery and rod plant enabling us to cater to the domestic market.Copper Facility, Tuticorin

INTEGRATED REPORT
06-115MANAGEMENT REVIEW
116-167STATUTORY REPORTS
168-270FINANCIAL STATEMENTS
271-502
166 VEDANTA LIMITED INTEGRATED REPORT AND ANNUAL ACCOUNTS 2019-20 VEDANTA LIMITED INTEGRATED REPORT AND ANNUAL ACCOUNTS 2019-20 167
COPPER - INDIA / AUSTRALIA
Particulars FY2020 FY2019 % change
Average LME cash settlement prices (US$ per tonne) 5,855 6,337 (8)
PRICESGlobal copper demand growth in FY2020 has been weaker than expected, reflecting a deterioration in the global macro-economic landscape. The prices decline due to weak demand amidst china and US China trade dispute, supply chain de-stocking. Ex-China demand has
remained weak from auto, electronics and consumer goods sectors. Average LME copper prices decreased by 8% compared with FY2019.
FINANCIAL PERFORMANCE During the year, EBITDA was ₹(300) crore and revenue was ₹9,053 crore, a decrease of 16% on the previous year’s revenue of ₹10,739 crore. The reduction in revenue was mainly due to lower Copper LME prices and lower volume. EBITDA loss increased
(₹ crore, unless stated)
Particulars FY2020 FY2019 % change
Revenue 9,053 10,739 (16)
EBITDA (300) (235) (28)
EBITDA margin (%) (3) (2) -
STRATEGIC PRIORITIES & OUTLOOK Over the following year our focus and priorities will be to: � Engage with the government and
relevant authorities to enable the restart of operations at Copper India;
Sterlite Copper Plant
� Sustain operating efficiencies, reducing our cost profile � Upgrade technology to ensure
high-quality products and services that sustain market leadership and surpass customer expectations.
Copper bending at Sterlite Copper
to ₹300 crore on account of decrease in sales realisations by 8%.
PORT BUSINESS VIZAG GENERAL CARGO BERTH (VgCB) During FY2020, VGCB operations showed an increase of 22% in
discharge and 23% in dispatch compared to FY2019. This was mainly driven by higher availability of imported coal & railway rakes in the region.
OPERATIONAL REVIEW COPPER – INDIA / AUSTRALIA CONTINUED...

DIRECTORS’REPORTDear Members,Maintaining Vedanta’s commitment to deliver sustainable and responsible growth, your board of directors are pleased to present the Directors’ Report outlining the governance and business performance of the Company along with the audited Consolidated as well as Standalone financial statements for the financial year ended March 31, 2020.
COMPANY OVERVIEWVedanta Limited, a subsidiary of Vedanta Resources Limited, is one of the world’s leading Oil & Gas and Metals Company with significant operations in Oil & Gas, Zinc, Lead, Silver, Copper, Iron Ore, Steel, and Aluminium & Power across India, South Africa, Namibia, and Australia. For two decades, Vedanta has been contributing to India’s growth story, currently contributing 1 percent of India’s GDP. The Company is among the top private sector contributors to the exchequer with the highest ever contribution of ` 42,560 crores in FY 2019.
Governance and sustainable development are at the core of Vedanta’s strategy, with a strong focus on health, safety, and environment and on enhancing the lives of local communities. The Company has been conferred with the CII-ITC Sustainability Award, the Golden Peacock GLOBAL Award for Excellence in Corporate Governance, the FICCI CSR Award, Dun & Bradstreet Awards in Metals & Mining, and certified as a Great Place to Work. Vedanta Limited is listed on the BSE Limited and the National Stock Exchange of India Limited and has American Depository Shares (ADS) listed on the New York Stock Exchange.
COVID STRATEGYIndia’s COVID response continues to be undoubtedly exemplary by global standards, and the Government of India along with all state governments are coordinating effectively to flatten the curve. We, at Vedanta, are doing our bit in a modest way to help save lives and livelihoods.
You will be happy to know that your Company has taken a pro-active approach to keep our assets and people safe while ensuring continuity of business. During these testing times our priority is to ensure the health and safety of our employees, contractors and stakeholders, while ensuring the business continuity to the extent possible. Our strategy has been threefold: practice physical distancing for all essential workstreams, rely on early diagnosis for our workforce to prevent an outbreak and share knowledge and best practices across our business entities to ensure safe workplaces. While the average footfall at our plants has been reduced significantly, our employees are actively involved in building homegrown solutions to the challenges created by COVID-19. For example, we now have no-touch based hand washing system which was
built by our employees. Additional safety measures in terms of sanitiser fogging, social distancing measures through on ground marking etc. are also in place to ensure minimum contact. We have also launched a healthcare helpline for our employees in partnership with Apollo hospitals, through which they can tele-consult with a General Physician or a Psychologist.
Most of our operations were continuing during the lockdown period being ‘essential’ or ‘continuous’ in nature though we have had temporary disruptions leading to production being down to 80% of the capacity during lockdown which we have now been able to ramp-up to ~90% of normative levels. All of our sites are open with the requisite government permissions and adherence to highest safety standards. Our focus during these times have been to ensure that we operate optimally with lowest possible cost of production.
The future impact on operations is difficult to assess at this point, as the situation is unravelling at a fast pace. Even though the current situation is very volatile, we are confident about our ability to manage the crisis and emerge as a stronger entity.
COMPANY PERFORMANCEVedanta has a portfolio of world-class, low-cost, scalable assets that consistently generate strong profitability and robust cash flows. We continue to consolidate our position as one of the largest diversified natural resources businesses in the world. We are positioned in the commodities that have a growing demand in one of the largest, most stable and fastest growing economy in the world with a key focus on operational delivery. Asset planning, operational excellence, cost control, productivity enhancement, improvement in realisation, risk mitigation coupled with increasing use of technology, more innovation and digitisation has helped us to enhance the delivery from our assets. Our key strategic priority is to focus on ethics, governance and social licence to operate, while we continue our journey towards zero harm, zero waste and zero discharge.
The year gone by was challenging, with tremendous uncertainties in the macro environment with the advent of novel coronavirus (COVID-19), which was further compounded by the oil price war leading to reduction in oil prices. The long-term impact of these major events can only be assessed after normalcy is restored.
However, on the operational side, we saw our three large businesses: Zinc, Aluminium and Oil & Gas achieve significant milestones which give us strong base for the near-term targets that we have set for these businesses. In Zinc, we remain on track to become the world’s largest integrated Zinc-Lead-Silver producer in two years while maintaining our cost leadership, with strong sequential volume growth from Hindustan Zinc and rising volumes from Zinc
International. Our Aluminium business continues to benefit from consistent structural reduction of cost through improved backward integration. In the Oil & Gas business, we have begun to implement our growth projects with gross capex of over US$ 3.2 billion, which will enable Vedanta to increase volumes in the near term.
As we look forward to the year ahead, we are operationally well positioned to deliver. In Oil & Gas, we are India’s largest private producer of crude, and
rank with the world’s lowest-cost producers with production, development and exploration pipeline. In Aluminium, we offer India’s largest production capacity, supported by our own captive power generation and increasingly integrating backwards for our own Alumina. The strengths of our diverse portfolio, together with our focused growth strategy expanding our reserves and resource base, a strong balance sheet, strong talent base, technology and modernisation initiatives, all combine to create a truly inspirational Company.
EBITDA (` crore)
24,900
FY 18
24,012
FY 19
21,061
FY 20
Revenue (` crore)
92,011
FY 18
90,901
FY 19
83,545
FY 20
FCF Post Capex (` crore)
7,880
FY 18
11,553
FY 19
7,130
FY 20
Return of Capital Employed (%)
16.9
FY 18
12.8
FY 19
11.2
FY 20
Net Debt (` crore)
21,958
FY 18
26,956
FY 19
21,273
FY 20
Growth Capex (` crore)
5,469
FY 18
7,764
FY 19
6,385
FY 20
EBITDA down
12% y-o-y, at
` 21,061 crores;
Interim dividend of
` 3.9 per sharedeclared during FY 2020
Stable EBITDAmargin of
29%
Cash & liquid investments of
` 37,914 crores
Attributable PAT before exceptional items
` 3,995 crores
Net Debt at
` 21,273 crores,decreased by
` 5,683 crores compared to March 31, 2019;
Contribution to the ex-chequer of
c.̀ 32,400 crores
FINANCIAL HIGHLIGHTS
INTEGRATED REPORT
06-115MANAGEMENT REVIEW
116-167STATUTORY REPORTS
168-270FINANCIAL STATEMENTS
271-502
168 VEDANTA LIMITED INTEGRATED REPORT AND ANNUAL ACCOUNTS 2019-20 VEDANTA LIMITED INTEGRATED REPORT AND ANNUAL ACCOUNTS 2019-20 169

DIRECTORS’ REPORT CONTINUED...
The standalone and consolidated financial statements of the Company for the financial year ended March 31, 2020 prepared as per Indian Accounting Standards (Ind AS) and in accordance with the provisions of the Companies Act, 2013 and SEBI (Listing Obligations and Disclosure Requirements) Regulations, 2015 (Listing Regulations) forms part of this Annual Report.
The details of the business, results of operations and the significant developments have been further elucidated in Management Discussion & Analysis section of the Annual Report.
ACQUISITIONDuring the year, your Company commenced implementation of the Resolution Plan of Ferro Alloys Corporation Limited (FACOR) under the Corporate Insolvency Resolution Process (CIRP) of the Bankruptcy Code after the same was approved by the NCLT, Cuttack on January 30, 2020.
FACOR was admitted into insolvency by order dated July 6, 2017. Pursuant to the order dated January 30, 2020, Vedanta Limited implemented the Resolution Plan for completion of acquisition of FACOR. The closing of transaction is expected by Q2 FY 2021.
FACOR owns a Ferro Chrome plant with 72,000 TPA capacity with 4 Chrome mines out of which only 2 mines are operational and a 100 MW Captive Power plant in Orissa through its subsidiary Facor Power Limited (FPL).
The acquisition will complement Vedanta’s existing steel business as the vertical integration of ferro manufacturing capabilities has the potential to generate significant efficiencies and will help Vedanta to increase its portfolio in steel business.
During the year, your Company also acquired the Sindhudurg unit of Global Coke Limited, which was under liquidation in the Bankruptcy Code. The acquisition will provide backward integration opportunity for our Pig Iron facility at Amona.
CORPORATE RESTRUCTURINGYour Company acquired Electrosteel Steels Limited (ESL), a company listed on BSE Limited and National Stock Exchange of India Limited engaged in the business of manufacturing of steel pursuant to a Corporate Insolvency Resolution Process implemented by way of the Insolvency and Bankruptcy Code 2016. With the potential to generate significant efficiencies, the acquisition of ESL complemented the Company’s existing Iron Ore Business as the vertical integration of steel manufacturing capabilities.
With approval granted by NCLT, Kolkata Bench for the Scheme of Amalgamation of Vedanta Star Limited with ESL, your Company now directly hold 95.49% in ESL.
RESEARCH AND DEVELOPMENTVedanta has been an aggressive leader in terms of adopting new technologies and improving processes and standards. In Aluminium and Power Business R&D team shoulders the responsibility of inventing the next big thing in aluminium and create a competitive edge for the Company. With an eye on developments in the global markets, our R&D teams capitalise on potential opportunities and future demands with the aim of making our vision for 100% Value-Added products and best-in-class operating efficiencies at all our manufacturing facilities. Our R&D team brings together Technical, Operations and Marketing expertise to brainstorm and implement innovative ideas that can address the trio of critical business objectives – increased market share, lower cost of production and
increased profitability, thereby elevating the Company’s position in the global aluminium value chain. Hindustan Zinc Limited’s (HZL) Technology & Innovation group has enhanced its R&D activities during the last two years with R&D becoming more important than ever in this challenging environment to not only sustain our metal recoveries and reduce operating costs but also to support our long-term vision of 1.5+ mtpa metal and 1000+ TPA silver production. In Cairn we continue to operate our fields in a digital manner through unmanned well pads with remote access which drastically reduces human exposure to risk and increases operational efficiency. Centralised control rooms, remotely activated surface facilities and digital surveillance platform (BabelFish) has allowed high uptime in operation of Mangala Processing Terminal, over 500 wells spread across many acres, Centralised polymer processing farm and the world’s largest continuously heated pipeline. Our other businesses also continue to lead the industry in terms of R&D. Copper for example has created Pure Tellurium Extraction to produce copper anodes (99.5% pure) and Ferric Sulphate Extraction from Copper Slag which is our by-product. In Iron Ore Business Value Added Business team had developed a customised product, Sesa Special Grade (SSG) for a niche segment (otherwise being imported by customers) by producing high purity pig iron through blast furnace route. The Value-added business team had also come up with an innovative idea of producing Foundry Grade pig Iron outside the blast furnace using Ferro Silicon which otherwise normally gets produced in blast furnace by compromising on productivity & high fuel rate. Some other examples are automation of the charging plate insertion mechanism, employee care applications, automatic trip counting and dynamic allocation of hauling units and GPS controlled speed tracking system in dispatch trucks. Our businesses continue their tremendous work in these areas to make the group more sustainable.
PROJECTS AND EXPANSION PLANProjects are key driving factor of our Group as our aspirations for growth are very different from any of the peers globally. In HZL, we have successfully completed projects that are supporting an enhanced capacity for 1.25 mtpa Mined Metal and plan for 1.5 mtpa should get firmed up before this year ends. Our flagship Rampura Agucha mine has successfully commissioned the Production Shaft and our 1st Fumer project is about to start delivering volumes in the quarter. Our venture into Minor Metal should drive additional value from the same ore mined, giving us higher returns for the same capital employed. In VZI, the Gamsberg mine and processing facilities are about to stabilise, which will set the stage for Gamsberg Phase-1 expansion, which involves setting up of the smelter unit to give us refined metal from the mined metal of the Gamsberg ore. Gamsberg phase-2 will further enhance the mining capability, processing units and smelters units capacity to double the current volumes. In Cairn, we are still focussed on the journey to produce India’s 50% Oil & Gas production. We have seen some hiccups in the projects execution but we are trying to resolve all those issues this year and start
Return Contribution Profit Contribution - Business Segments
Zinc
Indi
a
Zinc
In
tern
atio
nal
Oil
& G
as
Alu
min
ium
Pow
er
Iron
Ore
Stee
l
Cop
per
Oth
ers
Zinc
Indi
a
Zinc
In
tern
atio
nal
Oil
& G
as
Alu
min
ium
Pow
er
Iron
Ore
Stee
l
Cop
per
Oth
ers
18,1
59
3,12
8
12,6
61
26,5
77
5,86
0
3,46
3
4,28
3 9,05
3
362
6,44
8
(253
)
4,55
7
175 97
9
777
345
(509
)
(347
)
OPERATIONAL HIGHLIGHTS & SIGNIFICANT DEVELOPMENTS
ZINC INDIA � �Mined metal production of 917kt, down 2% y-o-y
� �Refined zinc-lead production of 870 kt, down 3% y-o-y
ZINC INTERNATIONAL: � �Gamsberg production volume at 108 kt in FY 2020, up from 17kt in FY 2019
� �Improved cost of production at $1,665/t, down 13% y-o-y
STEEL � �Record annual steel production at 1.23 million tonnes for FY 2020, up 3% y-o-y
ALUMINIUM � �Aluminium production at 1,904 kt
� �Record alumina production at 1,811 kt, up 21% y-o-y
� �Alumina cost of production in Q4 FY 2020 at $258/t
COPPER � �Due legal process is being followed to achieve a sustainable restart of the Tuticorin operations
POWER � �Record plant availability of 91% at the 1,980MW TSPL plant in FY 2020
OIL & GAS � �Average gross production of 174 kboepd for FY 2020, down 8% y-o-y
� �9 rigs are currently deployed; 136 wells drilled during FY 2020
� �Early gas production facility fully commissioned to design capacity of 90 mmscfd
� �Production sharing contracts (PSC) signed for Ravva block extended for 10 years
� �FTG survey completed in Assam and Kutch basins; Seismic survey ongoing in OALP Blocks
IRON ORE � �Continued engagement with the Government for resumption of Goa mining operations
� �Saleable ore production in Karnataka at 4.4 million tonnes, up 6% y-o-y
� �Iron ore sales in Karnataka at 5.8 million tonnes, up 125% y-o-y
INTEGRATED REPORT
06-115MANAGEMENT REVIEW
116-167STATUTORY REPORTS
168-270FINANCIAL STATEMENTS
271-502
170 VEDANTA LIMITED INTEGRATED REPORT AND ANNUAL ACCOUNTS 2019-20 VEDANTA LIMITED INTEGRATED REPORT AND ANNUAL ACCOUNTS 2019-20 171

These four pillars are critical to ensuring the long-term successful future of our business – meeting our strategic goals of growth, long-term value and sustainability.
RESPONSIBLESTEWARDSHIP
ADDING ANDSHARING VALUE
BUILDING STRONG
RELATIONSHIPS
STRATEGICCOMMUNICATIONS
� �Relationships enable us to contribute to a wider society
� �Enable us becoming more transparent and responsible corporate citizen
� �Responsible governance supports relationship building
� �Value help us to maintain a licence to operate
delivering on these projects. The seismic acquisition programme and satellite-based prospecting has commenced in Open Acreage Licensing Policy (OALP). In Aluminium, Odisha Bauxite & Lanjigarh expansion are key expansion projects and Jamkhani coal block execution will be critical to deliver more value from this sector. We are set to deliver tremendous value to all our stakeholders once we successfully execute these projects across the group.
INNOVATION, DIGITALISATION & TECHNOLOGYAt Vedanta, innovation has been at the strategic forefront in every dimension of the business. With the relentless support from senior leadership, the Group has diligently instilled innovative enrichment as a corporate value and continues to incentivise employees in building a culture based on technological and creative transformation. Encompassing acquisition of best-in-class technology for fast-track digitalisation of operations, manifestation of its own innovation nurtures the Group in its drive for operational excellence, efficiency and sustainability.
Standing firm on our core values of entrepreneurship and innovation, your Company continues to discover, integrate and implement technologies through the introduction of novel systems and ideas. Across our business units, employees are encouraged to be creative in their thinking and approach with acknowledgement for their valued contributions to making a difference.
As a part of the technology-enabled operating models, the mine digitisation and automation initiatives in addition to advanced upskilling programmes and practices deployed by your Company at various locations and departments are highlighted in the Management Discussion & Analysis section of this Report.
A separate detailed report on Company’s Sustainability Development also forms part of the Annual Report.
Recognising sustainable development as a core requirement to strategically improve the value of our business, the Board of Directors constituted a Sustainability Committee effective April 1, 2019 to provide oversight and assistance in building an approach towards sustainability which mirrors our prevailing business ethos of achieving excellence through continuous improvement in our processes and outcomes, while also benchmarking ourselves against our global peers.
As per SEBI directives on Integrated Reporting (IR), the Company has followed the <IR> framework of the International Integrated Reporting Council to report on all the six capitals that are used to create long-term stakeholder value and also provided the requisite mapping of principles between the Integrated Report, the Global Reporting Initiative (‘GRI’) and the Business Responsibility Report (BRR), which forms part of the Annual Report. Hence, a separate BRR is not being published by the Company this year. The Sustainability Report of the Company can be accessed at www.vedantalimited.com.
MANAGEMENT DISCUSSION AND ANALYSISThe Management’s Discussion and Analysis Report for the year under review, as stipulated under Regulation 34 read with Schedule V of Listing Regulations is presented in a separate section, forming part of the Annual Report.
CORPORATE SOCIAL RESPONSIBILITYThe year 2019-20 has brought lot of laurels in the hats of Vedanta Group. The group companies have been recognised for socio-economic impact they have created in the communities through their large-scale CSR Programme, receiving of more than 15 National and International awards is a testimony to that. The companies won Golden Peacock award, ASSOCHAM Women Achievers Award 2019, Golden Fulcrum Award, ET NOW World CSR Award, The CSR Journal Awards, ICC Social Impact award to name a few.
Our Company works towards a larger goal of creating enduring value for the communities it works in. Towards that end, we undertake various need-based community programmes as part of our Corporate Social Responsibility (CSR). Putting the last as first being the topmost priority, the Company has committed to align its CSR activities to the priorities of its neighbourhood communities and also the national priorities including the Sustainable Development Goals.
ECONOMIC RESPONSIBILITYVedanta strives to be a responsible corporate citizen and to make a positive contribution to the communities in which we operate. Payment to exchequer viz. taxes, royalty, profit oil etc. is a vital part of our contribution to national economies and people’s lives. Vedanta supports the principles of greater transparency that increases understanding of tax systems and build public trust.
With these values being ingrained in Vedanta’s DNA, we are proud to share that we have contributed ` 32,400 crores to the public exchequer of the various countries where we operate.
Your Company publishes Tax Transparency Report which provides an overview of the tax strategy, governance and tax contributions made by the Company.
The report is available on the website at www.vedantalimited.com
SUSTAINABILITY & BUSINESS RESPONSIBILTY REPORTSustainable Development is integral to Vedanta’s core business strategy. We continue to be a transparent and responsible corporate citizen; committed to a ‘social licence to operate’ and partner with communities, local governments and academic institutions to help catalyse socio-economic development in the areas where we operate.
The Company reaffirms its core values of Trust, Entrepreneurship, Innovation, Excellence, Integrity, Respect and Care, which are the basis of our Sustainable Development Model.
The model continues to be centered on the four strategic pillars: Responsible Stewardship; Building Strong Relationships; Adding and Sharing Value; and Strategic Communications.
Details of the composition of the committee, its terms and reference and the meetings held during FY 2020 is elucidated in the Corporate Governance Report.
Your Company publishes an annual Sustainability Report prepared in accordance with the Global Reporting Initiative (GRI) Standards; mapped to the United Nations Global Compact (UNGC); and aligned to Sustainable Development Goals (SDGs). It reports our approach and disclosure towards triple bottom line principles - People, Planet and Profit.
For almost all our programmes, a bottom up community engagement approach is non-negotiable. This collaborative approach ensures community ownership, suitable project design, effective delivery and post project sustainability. Apart from communities, we also strongly believe in partnering with government agencies, corporates, civil society organisations & community-based organisations to carry out durable and meaningful interventions.
All our CSR programmes are governed by the Vedanta CSR Policy, Corporate Technical Standards and each entity specific Standard Operating Procedures for CSR. The documents are periodically revised. Further, in order to benefit from diverse perspectives, and in keeping with a culture of collective leadership, Vedanta has formed a CSR Council. The Council is led by senior business leaders comprising of CSR Heads & CSR executives from the different Business Units. The Council is responsible for governance, synergy and cross learning across the Group CSR efforts. It meets every month and reviews the performance, spends and outcome of CSR programmes for all Business Units. The Council is instrumental in implementing improvement projects to create a seamless enabling eco-system for Business Units to carry out best-in-class community development programmes.
Vedanta has a strong Board CSR Committee including senior Independent Directors. The Committee provides strategic direction for CSR activities, and approves its plans and budgets. It also reviews progress and guides the CSR teams towards running well-governed and impactful community programmes. Details of the composition of the committee, its terms and reference and the meetings held during FY 2020 is elucidated in the Corporate Governance Report.
DIRECTORS’ REPORT CONTINUED...
COMMUNITY RELATIONS AND SOCIAL
PERFORMANCE
ENVIRONMENT SAFETY OCCUPATIONAL HEALTH
REPORTING AND COMMUNICATION
INTEGRATED REPORT
06-115MANAGEMENT REVIEW
116-167STATUTORY REPORTS
168-270FINANCIAL STATEMENTS
271-502
172 VEDANTA LIMITED INTEGRATED REPORT AND ANNUAL ACCOUNTS 2019-20 VEDANTA LIMITED INTEGRATED REPORT AND ANNUAL ACCOUNTS 2019-20 173

and notifies them to take necessary actions to close the grievances or requests. In case the actions are not taken beyond the set timelines, it then escalates of its own to the respective managers for closure. It has helped in improving the grievance and requests recording and their redressal faster.
Besides this, another application was launched across Vedanta in 2019 in partnership with an IT startup – GOODERA to monitor entire Vedanta CSR Projects, provide opportunity to explore new partnerships with credible organisations, track grants and also provide platform for Vedanta Employees to volunteer in different CSR activities.
Vedanta is working towards more such IT solutions for CSR domain in coming future to improve the project governance in order to develop goodwill in the community besides their development.
IMPACT ASSESSMENTYour Company undertakes regular monitoring of all its CSR initiatives, and these include periodic third-party assessment of baseline and impact of CSR interventions with key indicators in its areas of operation every three years. In line with this, in 2019, Taru Leading Edge (“Taru”) was appointed by Vedanta towards third party assessment with the following objectives:
� �Understanding the impact of Vedanta’s CSR interventions on the community in Vedanta’s BU locations to understand the receptiveness of the programmes in the communities;
� �Understanding the baseline and socio-economic scenario of the project areas as also the community needs in the BU locations;
� �Development of a relevant CSR Strategy to assist Vedanta group in effective planning and implementation of its future CSR initiatives and Impact programmes.
This assessment was undertaken by Taru and the study collected information in the form of Household (HH) surveys, focus group discussions, village level observations, joint consultations and workshops, Key Informant Interview (KIIs), In-Depth Individual Interviews (IDIs) from 12,028 HHs in various Vedanta BU operational areas, towards understanding the socio-economic status in the project focusing on the key indicators relating to the thematic areas of sustainable livelihood, education, health and nutrition, energy use, environment, water and sanitation and women-related issues baseline and community’s needs along with assessment of impact of the ongoing CSR interventions of Vedanta Group and the community’s response.
Some of the key highlights of the assessment were: - � �Among the 12,028 survey HHs for impact assessment in the different BUs, 7,127 HHs (~60%) were identified to have been impacted from the various CSR programmes implemented by Vedanta in the different BUs. This indicated that Vedanta reached out to ~60%
masks and 75,000 surgical gloves to district hospitals across the country.
Vedanta has also collaborated with the Ministry of Textiles to import 23 machines for indigenously Personal Protective Equipment (PPEs). The imported machines, which are now operational, able to produce 50,000 PPEs per day. The Company has distributed more than 1 lakh soaps and sanitisers across communities.
BALCO Hospital has set up isolation wards. A 100-bed hospital has been commissioned at Korba in Chhattisgarh. The Cairn Centre of Excellence (CCoE) in Jodhpur has been handed over to district administration as a quarantine facility with a 120-bed capacity, with meals provided three times a day for 150 people.
More than 10 mobile health vans have been made available to district administration for use as ambulances and for distribution of essential commodities by Business Units and Nand Ghars. 10 ICU beds, 2 ventilators and 25 nebulisers have also been provided to the hospitals.
More than 1,100 women SHG members were engaged in the stitching of masks and distributing same among communities. They also contributed more than 10 tonne grains to grain banks created for supporting needy families during lockdown.
As an act of solidarity with the state governments, Vedanta has contributed ` 32.3 crores to different State’s Chief Minister Relief fund COVID-19 Mitigation Fund which includes Rajasthan, Tamil Nadu, Goa, Punjab, Karnataka, Bihar, Uttar Pradesh and Chhattisgarh. Your Company has also procured PPE kits for the Government of Odisha and also arranged food packets, sanitiser kits to migrant workers travelling back to their home states.
Vedanta employees have donated one day’s salary, which was contributed by the Company for the relief funds.
Vedanta, in collaboration with Apollo Hospitals, has established a 24x7 general helpline for the employees to ensure timely healthcare advice during the lockdown. The services are open for all employees and their families.
DIGITISATION INITIATIVES - CSRVedanta is committed towards bringing innovation & creating shared values by managing our stakeholders through different community development initiatives in various thematic areas and automation in CSR Governance.
It has developed first of its kind (in-house) application – called NIVAARAN for CSR function to manage the community request, needs or grievances and address them on time across Vedanta in 2019 (initially started in Cairn Oil & Gas in 2018 and scaled across the Group as a best practice). NIVAARAN application follows up with the internal people as per the assigned timelines
A detailed overview on the Community Development Programmes for FY 2020 is highlighted in the Sustainability & ESG section of this Annual Report.
During the year, the Company on a standalone basis spent ` 52.66 crores on CSR activities, while on a consolidated basis it spent about ` 296.46 crores on CSR.
A brief overview of CSR initiatives forms part of this Directors Report and is annexed hereto as Annexure A.
Your Company’s CSR Policy addresses the Company’s commitment to conduct its business in a socially responsible, ethical and environmentally friendly manner; and to continuously work towards improving the quality of life of the communities in the areas where it operates.
The policy may be viewed at www.vedantalimited.com.
VEDANTA’S EFFORTS TO COMBAT COVID-19 PANDEMICVedanta, which has been at the forefront of the battle to combat the COVID-19 pandemic, has reached out to communities across 9 states in India to provide them with preventive healthcare and distribute free meals to the marginalised sections.
Having taken various precautionary measures to ensure the safety and well-being of all employees and stakeholders, Vedanta has intensified its support for the people and communities it works in.
As part of the Meals for Free programme, the Company has so far provided ~9 lakh meals to daily wage earners across the country. In addition, dry packet rations have been provided to more than 13,500 families from the marginalised sections of the society. On their part, the business units have also distributed more than 48,000 dry ration packets to the local communities.
Vedanta has pledged 10 lakh meals to daily wage earners, who have been hard hit due to the COVID-19 pandemic and resultant lockdown.
Vedanta has set up a ` 100 crores corpus for daily workers, preventive healthcare and welfare of employees and contract partners. The Company has also contributed ` 101 crores to PM-CARES Fund to join forces with the government in fighting the pandemic.
Keeping in mind the poor condition of stray animals, who hardly have any access to food during the lockdown, the Company is feeding more than 50,000 stray animals every day. The Company has so far provided more than 12.70 lakh feedings to stray animals in Delhi, Mumbai and Patna.
In a bid to strengthen preventive healthcare, Vedanta has distributed more than 4.5 lakh masks across communities. The Company is in the process of handing over another 2 lakh N95 masks to the Ministry of Health and Family Welfare, Government of India. So far, the Company has provided more than 26,000 surgical
DIRECTORS’ REPORT CONTINUED...
of the HHs in their operational areas through one or the other initiatives under CSR.
� �Overall outcomes of the various CSR sustainable livelihoods interventions in the BUs showed about 61.9% HHs stating that there was an increase in HH income.
� �Majority of those who underwent skill development trainings (85.4%) felt more confident after the training and about 25% also stated that they got more respect in family and society.
� �Health programmes have good reach and these programmes have reached to 47.6% of the HHs in the localities. More than 75% of the health domain beneficiaries stated of saving money on medicine and health due to Vedanta’s interventions.
� �The reach of the education programmes to the general community has been 14.7%. The analysis of the overall outcomes of the various CSR education interventions in the BUs showed about 79.3% HHs stating of improvements in the grades of their children and about 83.3% stating of increased interest of children to go to school and 82.6% expressed an improvement in quality of education.
� �For Water, Sanitation, Energy & Environment, the overall coverage or reach of the CSR interventions was 29.4%. The impact of these programmes were quite evident and the programmes were well-received. 65.1% of the HHs reported increase in cleanliness in the local areas; 58.6% of the HHs reported Sufficient quantity of water available at home; 77.4% of the HHs reported regular use of toilet facility in House; 79.2% of the HHs reported that women now feel more safe after construction of toilet; 77.8% of the HHs reported improvement in school attendance after construction of toilet and 61.1% of the HHs reported decline in number of cases of diseases.
Some of the specific findings towards aspects which are being done well by the group companies are: -
� �Investment of sizeable amount in the community through its CSR and Vedanta Leadership support towards these initiatives;
� �Good CSR portfolio; � Overall good CSR policy framework; � �Business units on board and dedicated CSR teams in place in each BU;
� �Interest in high impact programmes; � �Proper needs assessment being done periodically; � �Good roster of NGO implementing partners; � �Increase in CSR spending envisaged for the foreseeable future amongst others.
The report also highlighted that Vedanta Group has always shown a high-level commitment towards CSR and intents as it was one of the early movers on CSR and its CSR funding and spending has increased many folds in the last few years. The leadership of the group is well committed to the community with personal commitment by the senior management.
INTEGRATED REPORT
06-115MANAGEMENT REVIEW
116-167STATUTORY REPORTS
168-270FINANCIAL STATEMENTS
271-502
174 VEDANTA LIMITED INTEGRATED REPORT AND ANNUAL ACCOUNTS 2019-20 VEDANTA LIMITED INTEGRATED REPORT AND ANNUAL ACCOUNTS 2019-20 175

The Scheme is currently administered through Vedanta Limited ESOS Trust (ESOS Trust) which is authorised by the Shareholders to acquire the Company’s shares from secondary market from time to time, for implementation of the Scheme. During the year, the ESOS Trust was re-constituted by the Nomination & Remuneration Committee in its meeting held on January 31, 2020. The details of the trustees are provided can be accessed at www.vedantalimited.com.
No employee has been issued stock options during the year, equal to or exceeding one percent of the issued capital of the Company at the time of grant.
During the year, the acquisition by the trust does not exceeded 2% of the paid-up capital of the Company. Further, the total acquisition by trust at no time exceeded 5% of the paid-up equity capital of the Company.
Pursuant to the provisions of SEBI (Share Based Employee Benefits), Regulations, 2014 (“Employee Benefits Regulations”), disclosure with respect to the ESOS Scheme of the Company as on March 31, 2020 is available on the website of the Company at www.vedantalimited.com.
The Company confirms that the Scheme complies with the SEBI Employee Benefits Regulations and there have been no material changes to the plan during the financial year.
A certificate from M/s SR Batliboi & Co LLP, Chartered Accountants, Statutory Auditors, with respect to the implementation of the Company’s ESOS schemes, would be placed before the shareholders at the ensuing Annual General Meeting (AGM). A copy of the same will also be available for inspection at the Company’s Registered Office.
MANAGERIAL REMUNERATION, EMPLOYEE INFORMATION AND RELATED DISCLOSURESThe remuneration paid to Directors, Key Managerial Personnel and Senior Management Personnel during FY 2019-20 was in accordance with the Nomination and Remuneration Policy of the Company.
Disclosures under Section 197 of the Act and Rule 5(1) of the Companies (Appointment and Remuneration of Managerial Personnel) Rules, 2014 (“Rules”) relating to the remuneration and other details as required is appended as Annexure B to the Report.
In terms of provision of Section 136 of the Act and Rule 5(2), the Report and the Financial Statements are being sent to the Members of the Company excluding the statement of particulars of employees as prescribed under Rule 5(2) of the Rules. The said information is available for inspection on all working days during business hours, at the Company’s Registered Office. Any member interested in obtaining a copy of the said statement may write to the Company Secretary and the same will be furnished upon such request.
− �Upper limits and caps defined on incentive pay-outs in the event of over-achievement of targets to avoid windfall gains.
� �We do not encourage provision of excessive perks or special clauses as part of employee contract such as: − �No provision of Severance Pay in Employment contracts of Whole-Time Directors (WTD), KMP & SMP;
− �No Tax Gross up done for executives except for expatriates as part of tax equalisation;
− �No provision of unearned Incentives/unvested Stock or Cash Options;
Any benefit provided to Key Executives are available to all the employees of the Company as per the defined Company policy.
� �We continue to corroborate the Internal Pay Equity Principles, sustained attention to equity grant practices and maintain checks & balances to confirm that the practices are legally and ethically compliant with International, national and state/regional laws.
RISK MANAGEMENTThe businesses are exposed to a variety of risks, which are inherent to a global natural resources organisation. The effective management of risk is critical to support the delivery of the Group’s strategic objectives. Risk management is embedded in the organisation’s processes and the risk framework helps the organisation meet its objectives by aligning operating controls with the mission and vision of the Group set by the Board.
As part of our governance philosophy, the Board has a Risk Management Committee to ensure a robust risk management system. The details of Committee and its terms of reference are set out in the Corporate Governance Report, which forms part of this Annual Report.
With effect from June 6, 2020, the Risk Management Committee has been consolidated with the Audit Committee comprising of only Independent Directors ensuring robust risk management systems in place with valued feedback of Independent Directors being on the Committee.
Our risk-management framework is designed to be simple, consistent and clear for managing and reporting risks from the Group’s businesses to the Board. Our management systems, organisational structures, processes, standards and code of conduct together form the system of internal controls that govern how we conduct business and manage associated risks. We have a multi-layered risk management framework to effectively mitigate the various risks, which our businesses are exposed to in the course of their operations.
HUMAN RESOURCES (HR)People & cultureYour Company has always aspired to build a culture that demonstrates world-class standards in safety, environment and sustainability. People are our most valuable asset and we are committed to provide all our employees with a safe and healthy work environment.
An update on People & Culture detailing the Company’s initiatives, recruitment strategy, hiring projects and talent management and development is elucidated in the Management Review Section of the Annual Report.
EMPLOYEE STOCK OPTION SCHEMEEmployee stock options is a conditional share plan for rewarding performance on pre-determined performance criteria and continued employment with the Company. It provides a much better line-of-sight to all the employees.
Your Company has established a share incentive schemes viz. ‘Vedanta Limited Employee Stock Option Scheme 2016’ (“the Scheme”). The Scheme was framed with a view to reward employees for their contribution in successful operation of the Company with wealth creation opportunities, encouraging high-growth performance and reinforcing employee pride.
The Scheme is a conditional share plan for rewarding performance on pre-determined performance criteria and continued employment with the Company. The pre-determined performance criteria shall focus on rewarding employees for Company performance vis a vis competition and also for achievement of internal operational metrics.
The Scheme was launched after obtaining statutory approvals, including shareholders’ approval by way of postal ballot on December 12, 2016.
On November 29, 2019, the Nomination & Remuneration Committee approved the grant of Employee Stock Options 2019 to Vedanta employees covering 35% of eligible population. In-order to align the scheme with the best-in-class reward practices globally, the ESOS 2019 plan has undergone significant transformation. The grant under the ESOS 2019 is completely driven by performance and is a combination of individual contribution and business/SBU performance. Although the plan continues to be linked to Vedanta Limited for its R-TSR performance, but since business delivery is of prime importance for the organisation today, the internal parameters of Volume, Cost, NSR & EBITDA, as applicable to respective business and SBU have been introduced as additional performance parameters with enhanced weightage. The vesting of such options will also be a factor of sustained individual performance subject to continued employment with the group. Through this change, we not only ensure to protect the shareholder interests but also enable a better control of the outcome of the plan in the hands of the employee.
COMPENSATION GOVERNANCE PRACTICES AT VEDANTAVedanta has been built on a strong foundation of governance where the Board, Key Executives and Compliance Officer have been vigilant and committed to ensure structural integrity, soundness and highest standards of compensation practices. Over the last few years we have matured many of our reward practices as an attempt to continue to raise the bar.
� �The composition of Nomination and Remuneration Committee (NRC) is in compliance with the Listing Regulations and majority of the members are Independent Directors. The Chairman of the committee is an Independent Director.
� �The members of the NRC together bring out the rich expertise, diverse perspectives and independence in decision making on all matters of remuneration for Directors, Key Managerial Personnel (KMP) & Senior Management Personnel (SMP). The Independent Directors are actively engaged throughout the year as members of the NRC in various people matters even beyond remuneration.
� �A board charter appoints and sets our primary responsibilities of NRC which includes selecting, compensating, monitoring and, when necessary, replacing key executives and overseeing succession planning.
� �Best-in-class independent consultants are engaged to advise and support the committee on matters of board evaluation and leading reward practices in the industry.
� �The Executive Compensation Philosophy is well established and benchmarked across relevant industry comparators which enables us to differentiate people on the basis of performance, potential and criticality in-order to provide a competitive advantage in the industry.
� �The Total Reward Philosophy at Vedanta is built on the core objective of driving ‘Pay for Performance’ culture. The appropriate mix of components of the Executive Compensation aim to drive the short as well as long-term interests of the Company and its shareholders through strong emphasis on operational/financial fundamentals, social licence to operate and business sustainability, strategic objectives of resource and reserve creation and wealth creation for stakeholders.
� �Timely risk assessment of compensation practices is done in addition to review of all components of compensation for consistency with stated compensation philosophy: − �Financial analysis & simulation of the long-term cost of reward plans and their Return on Investments (ROI).
− �Provision of claw back clause as part of the ground rules of our long-term incentive scheme for all our leaders.
DIRECTORS’ REPORT CONTINUED...
INTEGRATED REPORT
06-115MANAGEMENT REVIEW
116-167STATUTORY REPORTS
168-270FINANCIAL STATEMENTS
271-502
176 VEDANTA LIMITED INTEGRATED REPORT AND ANNUAL ACCOUNTS 2019-20 VEDANTA LIMITED INTEGRATED REPORT AND ANNUAL ACCOUNTS 2019-20 177

framework, a risk management framework and adequate segregation of duties to ensure an acceptable level of risk. Documented controls are in place for business processes and IT general controls. Key controls are tested by entities to assure that these are operating effectively. Besides, the Company has also adopted an SAP GRC (Governance, Risk and Compliance) framework to strengthen the internal control and segregation of duties/access. It also follows a half-yearly process of management certification through the Control Self-Assessment framework, which includes financial controls/exposures.
The Company has documented Standard Operating Procedures (SOP) for procurement, project/expansion management capital expenditure, human resources, sales and marketing, finance, treasury, compliance, Safety, Health and Environment (SHE), and manufacturing.
The Group’s internal audit activity is managed through the Management Assurance Services (‘MAS’) function. It is an important element of the overall process by which the Audit Committee and the Board obtains the assurance on the effectiveness of relevant internal controls.
The scope of work, authority and resources of MAS are regularly reviewed by the Audit Committee. Besides, its work is supported by the services of leading international accountancy firms.
The Company’s system of internal audit includes covering monthly physical verification of inventory, a monthly review of accounts and a quarterly review of critical business processes. To enhance internal controls, the internal audit follows a stringent grading mechanism, focussing on the implementation of recommendations of internal auditors. The internal auditors make periodic presentations on audit observations, including the status of follow-up to the Audit Committee.
The Company is also required to comply with the Sarbanes Oxley Act Sec 404, which pertains to Internal Controls over Financial Reporting (ICOFR). Through the SOX 404 compliance programme, which is aligned to the Committee of Sponsoring Organisations of the Treadway Commission (COSO) framework, the Audit Committee and the Board also gains assurance from the management on the adequacy and effectiveness of ICOFR.
In addition, as part of their role, the Board and its Committees routinely monitor the Group’s material business risks. Due to the limitations inherent in any risk management system, the process for identifying, evaluating, and managing the material business risks is designed to manage, rather than eliminate risk. Besides it created to provide reasonable, but not absolute assurance against material misstatement or loss.
resolved. Four employees were separated on account of complaints. Your Company has constituted Internal Complaints Committee (ICC) for various business divisions and offices, as per the requirements of the Sexual Harassment of Women at Workplace (Prevention, Prohibition and Redressal) Act, 2013.
VIGIL MECHANISMThe Company has in place a robust vigil mechanism for reporting genuine concerns through the Company’s Whistle-Blower Policy. As per the Policy adopted by various businesses in the Group, all complaints are reported to the Director – Management Assurance, who is independent of operating management and the businesses. In line with global practices, dedicated email IDs, a centralised database, a 24X7 whistle-blower hotline and a web-based portal have been created to facilitate receipt of complaints. All employees and stakeholders can register their integrity related concerns either by calling the toll-free number or by writing on the web-based portal which is managed by an independent third party. The hotline provides multiple local language options. All cases reported as part of whistle-blower mechanism are taken to their logical conclusion within a reasonable timeframe. After the investigation, established cases are brought to the Group Ethics Committee for decision-making. All Whistle-Blower cases are periodically presented and reported to the Company’s Audit Committee. The details of this process are also provided in the Corporate Governance Report and the Whistle-Blower Policy is available on the Company’s website at www.vedantalimited.com.
DIVIDENDWith consistent dividend as a healthy sign of our sustained growth, our firm belief in percolating the benefits of our business progress for widespread socio-economic welfare facilitates the equitable sharing of our economic value generated. Attaining steady operational performance and a harmonised market environment in continuation of the historical trends helped us to reaffirm the realisation of competent numbers for FY 2020.
Return to Shareholders (` per share)
21.2019.45 18.85
3.9
FY 18FY 17 FY 19 FY 20
The Risk Management Committee supports the Audit Committee and the Board in developing the group-wide risk-management framework. Risks are identified through a consistently applied methodology. The Company has put in place a mechanism to identify, assess, monitor and mitigate various risks to key business objectives.
Major risks identified by businesses and functions are systematically addressed through mitigating actions. Risk officers have also been formally nominated at operating businesses, as well as at Group level, to develop the risk-management culture within the businesses.
The Risk Management Policy of the Company revised in 2019 covers cybersecurity as well. With effect from June 6, 2020, the Risk Management Committee has been consolidated with the Audit Committee comprising of only Independent Directors.
For a detailed risk analysis, you may like to refer to the risk section in the Management Discussion Analysis Report which forms part of this Annual Report.
CYBER SECURITYThe Group has a structured framework for cybersecurity. Each of the Business Units has a CIO (Chief Information Officer) with suitable experience in Information/Cybersecurity. Every year, cybersecurity review is carried out by IT experts (belonging to IT practices of Big-4 firms). Vulnerability Assessment and Penetration Testing (VAPT) review is also carried out by cyber experts. This practice has been in place for several years now and has helped in strengthening the cyber security environment in the group. At the same time, the external environment on cybersecurity is continuously evolving. The respective CIOs are responsible for ensuring appropriate controls are in place to address the emerging cyber risks.
INTERNAL FINANCIAL CONTROLSYour Board has devised systems, policies and procedures/frameworks, which are currently operational within the Company for ensuring the orderly and efficient conduct of its business, which includes adherence to policies, safeguarding its assets, prevention and detection of frauds and errors, accuracy and completeness of the accounting records and timely preparation of reliable financial information. In line with best practices, the Audit Committee and the Board reviews these internal control systems to ensure they remain effective and are achieving their intended purpose. Where weaknesses, if any, are identified as a result of the reviews, new procedures are put in place to strengthen controls. These controls are in turn reviewed at regular intervals.
The systems/frameworks include proper delegation of authority, operating philosophies, policies and procedures, effective IT systems aligned to business requirements, an internal audit framework, an ethics
Since the Company has strong internal control systems which are further strengthened by periodic reviews as required under the Listing Regulations and SOX compliance by the Statutory Auditors, the CEO and CFO recommend to the Board continued strong internal financial controls.
Based on the information provided, nothing has come to the attention of the Directors to indicate that any material breakdown in the function of these controls, procedures or systems occurred during the year under review. There have been no significant changes in the Company’s internal financial controls during the year that have materially affected or are reasonably likely to materially affect its internal financial controls.
There are inherent limitations to the effectiveness of any system of disclosure controls and procedures, including the possibility of human error and the circumvention or overriding of the controls and procedures. Accordingly, even effective disclosure controls and procedures can only provide reasonable assurance of achieving their objectives. Moreover, in the design and evaluation of the Company’s disclosure controls and procedures, the management was required to apply its judgement in evaluating the cost-benefit relationship of possible controls and procedures.
Further, the Audit Committee annually evaluates the internal financial controls for ensuring that the Company has implemented robust systems/framework of internal financial controls viz. the policies and procedures adopted by the Company for ensuring the orderly and efficient conduct of its business, including adherence to Company’s policies, the safeguarding of its assets, the prevention and detection of frauds and errors, the accuracy and completeness of the accounting records, and the timely preparation of reliable financial information.
PREVENTION OF SEXUAL HARASSMENT AT WORKPLACEThe Company has zero tolerance for sexual harassment at workplace and has adopted a Policy on Prevention, Prohibition and Redressal of Sexual Harassment at Workplace in line with the provisions of the Sexual Harassment of Women at Workplace (Prevention, Prohibition and Redressal) Act, 2013 and the Rules thereunder for prevention and redressal of complaints of sexual harassment at workplace.
As part of Vedanta Group, your Company is an equal opportunity employer and believes in providing opportunity and key positions to women professionals. The Group has endeavoured to encourage women professionals by creating proper policies to tackle issues relating to safe and proper working conditions and create and maintain a healthy and conducive work environment that is free from discrimination. This includes discrimination on any basis, including gender, as well as any form of sexual harassment. During the period under review, eight complaints were received and
DIRECTORS’ REPORT CONTINUED...
INTEGRATED REPORT
06-115MANAGEMENT REVIEW
116-167STATUTORY REPORTS
168-270FINANCIAL STATEMENTS
271-502
178 VEDANTA LIMITED INTEGRATED REPORT AND ANNUAL ACCOUNTS 2019-20 VEDANTA LIMITED INTEGRATED REPORT AND ANNUAL ACCOUNTS 2019-20 179

The Company has declared interim dividend during the year out of the reserves of the Company and in compliance with the Dividend Distribution Policy:-
Type of Dividend Date of Declaration Record DateRate of Dividend per share (face value ` 1 per share) %
Total Payout (in crores)
1st Interim Dividend February 27, 2020 March 7, 2020 ` 3.90 390 c. ` 1,500
INVESTOR RELATIONSYour Company has an active Investor Relations (IR) function which continuously strives for excellence by engaging with international and domestic investors. Your Company benchmarks global IR standards and aims at exceeding them. The Company proactively seek feedback from all stakeholders throughout the year.
Shareholder engagementThe Investor Relations team takes both formal and informal approach to engage with shareholders. The team interacts with investors at various platforms demonstrating consistent and clear communication between internal and external parties. Some of these forums include quarterly earnings calls, hosting Investor/Analyst Day, site visits for key businesses, one-on-one as well as group meetings and participation in sell-side conferences. The leadership teams from various businesses along with promoters of the Company as well as senior management consisting of the CEO and the CFO are also invited as required for some of these engagements. These proactive investor engagement activities and openness of senior leaders to interact with investors and analysts is well appreciated by all stakeholders.
Shareholder communicationShareholders can contact us any time through our Investor Relations team, with contact details available online at www.vedantalimited.com. Shareholder and analyst feedbacks are shared in a timely and structured manner with the Board through the Chairman, the Independent Directors, the CEO, the CFO and the Company Secretary. Ongoing communication with our stakeholders keeps the board and senior management abreast of their views and helps to gain insight.
Shareholder disclosuresVedanta has set standards through the detailed and transparent disclosures on the Company’s operational and financial performance. Your Company had created its first Integrated Report (for Financial Year 2018) and continued thereafter. The Company also started a new communication initiative which involves sending a brief update about the Company’s performance and key events to its shareholders and other stakeholders on a regular basis. The dissemination of business updates through this “Investor Brief” has been well appreciated. Having a diverse shareholder base and multiple business verticals, demands enormous efforts from an IR function to manage investors, sell-side analysts as well as ensuring a timely and complete business update is provided to all. As a key milestone in this continuing
Given the current market dislocation and uncertainties caused by the coronavirus pandemic, it is important to maximise financial flexibility across the group. Your board will decide on the size and timing of any future dividend payments once there is greater clarity on the outlook for the economy and commodity markets. Your Company believe this is the correct decision for all the stakeholders as we navigate through an unprecedented period of volatility for the global economy and our business.
The Directors do not recommend final dividend for the financial year ended March 31, 2020.
DIVIDEND DISTRIBUTION POLICYIn accordance with SEBI (Listing Obligations and Disclosure Requirements) Regulations, 2015 (‘Listing Regulations’) your Company has adopted a Dividend Distribution Policy formulated by the Board specifying the financial parameters, factors and circumstances to be considered in determining the distribution of dividend to shareholders and/or retaining profits earned by the Company. The policy aims to protect the interest of investors by ensuring complete transparency.
Your Company is in compliance with the dividend distribution policy as approved by the Board.
The Policy can be accessed on the website of the Company at www.vedantalimited.com.
CREDIT RATINGYour Company is rated by CRISIL and India Rating and Research Private Limited on its various debt instruments. The details of ratings provided by the agencies is specified in the Corporate Governance Report.
POLICY AND ADVOCACYVedanta supports the mining, metal manufacturing and energy fuel extracting industry through progressive and responsible advocacy. We strive for unlocking greater value of these sectors and country’s policies achieving better shape through levers of data analytics, deep legislative understanding, thought leadership and developmental idea exchange. We engage with industry associations and actively participate in public consultations which support the development agenda of the country. Our vast experience across mineral and metal value chain and geographical reach are utilised in prescribing the best practices in various policy matters. Our focus on advocacy efforts always remains on economic development of the local, region and country where we operate, in a sustainable manner.
in their respective fields derived from dedicated service guiding large and complex organisations as executive leaders. This tapestry of qualifications and positive attributes, in alignment with the Board, facilitates the maintenance of an appropriate mix of objectivity and professional experience directed towards larger organisational growth.
During FY 2020, your Company welcomed Mr. MK Sharma as an Independent Director of the Company. In the opinion of the Board, Mr. Sharma exhibited rich veracity and diverse experience in the areas of corporate governance, ESG, mergers and acquisitions, corporate restructuring and law. Based on his multi-disciplinary stints with membership of several Committees and leadership positions in various corporates, your Board believes that Mr. Sharma’s induction continues to nurture the Board in broadening its overall efficiency and expertise.
Complementing Mr. Sharma’s detailed profile provided in the earlier section of the Annual Report, this statement forms a part of the Directors’ Report in accordance with the Companies (Accounts) Amendment Rules, 2019 notified to hold effect from December 1, 2019.
The detailed biographical information of each Board member, Key Managerial Personnel and Senior Management Personnel forms part of the Annual Report. Further, the dimensions of other directorships, skills and expertise in addition to the changes during the period under review are detailed in the Corporate Governance Report.
BOARD DIVERSITY & INCLUSIONYour Company diligently cognises a culture of diversity and inclusion in the Board as the pre-requisite for achieving long-term growth and development steered through effective strategy and governance. In a bid to ensure timely anticipation of risks and opportunities while promoting the persuasive desire of the stakeholders for greater diversity, our Board reflects an appropriate balance of skills, professional experiences, personal backgrounds and leadership perspectives. The details of the key attributes of the Board members are elucidated in the Corporate Governance Report.
DIRECTORS SEEKING RE-APPOINTMENTPursuant to the provision of Companies Act, 2013, Mr. GR Arun Kumar (DIN 01874769), Whole-Time Director & Chief Financial Officer of the Company, is liable to retire by rotation at the ensuing AGM and being eligible, has offered himself for re-appointment. Accordingly, the appointment of Mr. GR Arun Kumar is being placed for approval of the members at the AGM. A brief profile of Mr. GR Arun Kumar and other related information is provided in the AGM notice. The Board recommends his re-appointment at the AGM.
Further, Ms. Priya Agarwal, appointed as a Non-Executive Director for a period of 3 years w.e.f.
endeavour, your Company created a digital interactive microsite on the corporate website to provide an interactive experience beyond what is available in the annual and quarterly results materials.
KEY INITIATIVES WITH RESPECT TO VARIOUS STAKEHOLDERSAs a diligent driver of all-encompassing stakeholder growth, the Company undertakes significant initiatives with respect to its employees, shareholders, investors, lenders, suppliers, customers, civil society, local community and Government authorities striving to accelerate its focus on HSE and sustainability. These initiatives are enlisted with detailed specifics in the Integrated Report section of the Annual Report.
CORPORATE GOVERNANCE REPORTUpholding strong business ethics and implementing highest standards of corporate governance is an integral part of Vedanta’s core values and is of prime importance to the efficacy of our operational conduct and stakeholder management.
In our persistent endeavour to benchmark our policies and practices in the light of recent developments in the realm of corporate governance along with other regulatory reforms, your Company strives to fulfill its inherent responsibility to build sustainable growth, create value for all stakeholders, maintain investor confidence and reinforce commitment towards good governance, transparent engagement, functional integrity and objective-oriented diligence.
A separate report on Corporate Governance setting out the governance structure and principal activities of the Board and its Committees, together with a Certificate from M/s S.R. Batliboi & Co LLP, Statutory Auditors of the Company, regarding compliance of conditions of Corporate Governance as stipulated under Listing Regulations is provided as an Annexure to the Corporate Governance Report forming part of Annual Report. A Certificate from the CEO and CFO of the Company, inter alia, confirming the correctness of the financial statements and cash flow statements, adequacy of the internal control measures and timely reporting of matters to the Audit Committee, is also annexed to the Corporate Governance Report.
DIRECTORS, KEY MANAGERIAL PERSONNEL & SENIOR MANAGEMENTOur Board continues to maintain a combined wealth of extensive leadership experience representing a plethora of complementary skills, attributes and perspectives in order to be equipped to navigate the operational, social, regulatory and geopolitical complexity in which our business operates. Leveraging of institutional knowledge and diversity of oversight supports the Board in enhancing its effectiveness and contributes to better decision-making and long-term strategy of the Group.
The Senior Management, likewise, comprises of a multi-faceted group of leaders with substantial competencies
DIRECTORS’ REPORT CONTINUED...
INTEGRATED REPORT
06-115MANAGEMENT REVIEW
116-167STATUTORY REPORTS
168-270FINANCIAL STATEMENTS
271-502
180 VEDANTA LIMITED INTEGRATED REPORT AND ANNUAL ACCOUNTS 2019-20 VEDANTA LIMITED INTEGRATED REPORT AND ANNUAL ACCOUNTS 2019-20 181

an insight about the Company’s business operations and organisational conduct. The program further safeguards regular updates to the existing Directors on the significant changes, in turn, ensuring timely and informed decision-making.
The Board meetings are also meticulously planned in a coherent manner which enables keeping the Directors abreast with a wide range of topics entailing quarterly review presentations by the business CEOs; regulatory updates; and discussion proceedings on governance, risk, compliance, stakeholders, health, safety and environment among other matters.
The familiarisation programme and its methodology adopted for the Directors are construed under the Corporate Governance Report and can also be accessed on the website of the Company at www.vedantalimited.com.
BOARD EVALUATIONAn effective Board is key to the establishment and delivery of a Company’s strategy and towards the endeavour of your Board to continually assess and improve its effectiveness and performance, the Company has in place a formal and rigorous process for evaluation of the Board, its Committees, the Chairman, the Individual Directors and the governance processes that support the Board’s work.
As a step towards better governance practice, this year the Company, as a part of the rotation, has engaged another leading consultancy firm, to conduct the Board evaluation process which was facilitated through an online secured module ensuring transparent, effective and independent involvement of the management. The evaluation was conducted through a tailored questionnaire having qualitative parameters and constructive feedback based on ratings. Recommendations arising from the evaluation process were considered by the Board to optimise its effectiveness.
The outcome of the Board evaluation was discussed by the Nomination & Remuneration Committee and the Board at their meeting held on June 6, 2020.
A comprehensive disclosure on the parameters and the process of Board evaluation as well as the outcome thereof has been explicated in the Corporate Governance Report.
BOARD & COMMITTEE MEETINGSThe Board renders entrepreneurial leadership and governs business excellence for the entire Group. With the aim to operate effectively and provide complete consideration to key integral matters, the Board has established various committees with clearly agreed reporting procedures and defined scope of authority.
The Board in conjunction with its committees ensures transparency, responsibility and accountability in creating sustainable growth and long-term value for stakeholders.
May 17, 2017, has been re-appointed by the Board on May 16, 2020 for another term of 3 years effective May 17, 2020 subject to the confirmation of the shareholders at the ensuing AGM.
A brief profile of the Directors seeking re-appointment and other related information is provided in the AGM notice. Your directors recommend their re-appointment.
The detailed changes in the Board composition have been provided in the Corporate Governance report forming part of this Annual Report.
DECLARATION BY INDEPENDENT DIRECTORSThe Company has received declaration from all the Independent Directors that they continue to meet the criteria of independence as provided under the Companies Act and Listing Regulations and comply with the Code for Independent Directors as specified under Schedule IV of the Act.
The Directors have also confirmed that they are not aware of any circumstance or situation, which exists or may be reasonably anticipated, that could impair or impact their ability to discharge their duties with an objective independent judgement and without any external influence.
The Directors have further affirmed their compliance with Rule 6(1) and 6(2) of Companies (Appointment and Qualification of Directors) Rules, 2014.
POLICY ON DIRECTOR’S APPOINTMENT AND REMUNERATIONThe Nomination & Remuneration Policy adopted by the Board on the recommendation of the Nomination & Remuneration Committee enumerates the criteria for assessment and appointment/re-appointment of Directors, Key Managerial Personnel (KMP) and Senior Management Personnel (SMP) on the basis of their qualifications, knowledge, skill, industrial orientation, independence, professional and functional expertise among other parameters with no bias on the grounds of ethnicity, nationality, gender or race or any other such discriminatory factor.
The Policy also sets out the guiding principles for the compensation to be paid to the Directors, KMP and SMP; and undertakes effective implementation of Board familiarisation, diversity, evaluation and succession planning for cohesive leadership management.
With your Company continuing to comply with the Policy in true letter and spirit, the complete Policy is reproduced in full on our website at www.vedantalimited.com and a snapshot of the Policy is elucidated in the Corporate Governance Report.
FAMILIARISATION PROGRAMME FOR BOARD MEMBERSYour Company has in place, a systematic and structured programme for an edifying orientation and training of its newly inducted Directors in order to provide them with
AUDITORS AND AUDITORS’ REPORTAUDIT REPORTS: � �The Statutory Auditors’ report for FY 2019-20 does not contain any qualification, reservation or adverse remark. The Auditors’ report is enclosed with the financial statements in the Annual Report.
� �The Secretarial Auditors’ Report for FY 2019-20 does not contain any qualification, reservation or adverse remark. The report in form MR-3 along with Annual Secretarial Compliance Report is enclosed as Annexure D to the Directors’ Report.
� �As per the Listing Regulations, the auditors’ certificate on corporate governance is enclosed as an Annexure to the Corporate Governance Report forming part of the Annual Report. The Certificate does not contain any qualification, reservation or adverse remark.
� �A certificate from Company Secretary in Practice certifying that none of the directors on the Board of the Company have been debarred or disqualified from being appointed or continuing as directors of companies by the SEBI/Ministry of Corporate Affairs or any such statutory authority forms part of the Corporate Governance Report.
1.� �With effect from June 6, 2020, the Risk Management Committee has been consolidated with the Audit Committee comprising of only Independent Directors.
2.� �Effective May 16, 2020 Finance Standing Committee has been consolidated with the Committee of Directors.
In order to ensure timely and effective decision-making, the Board and its Committees meet at regular intervals and undertake all-inclusive discussions and deliberations. During the FY 2020, the Board met seven (07) times.
A comprehensive update on the Board, its committees, their composition, terms and reference, meetings held during FY 2020 and the attendance of each member is detailed in the Corporate Governance Report.
All the recommendations made by each of the Committees were accepted by the Board.
Statutory Board Committees
AUDIT COMMITTEE
Other Committees
COMMITTEE OF DIRECTORS
FINANCE STANDING
COMMITTEE OF DIRECTORS(2)
SUSTAINABILITY COMMITTEE
SHARE & DEBENTURE TRANSFER
COMMITTEE
NOMINATION & REMUNERATION
COMMITTEE
CORPORATE SOCIAL
RESPONSIBILITY COMMITTEE
STAKEHOLDERS RELATIONSHIP
COMMITTEE
RISK MANAGEMENT COMMITTEE(1)
DIRECTORS’ REPORT CONTINUED...
INTEGRATED REPORT
06-115MANAGEMENT REVIEW
116-167STATUTORY REPORTS
168-270FINANCIAL STATEMENTS
271-502
182 VEDANTA LIMITED INTEGRATED REPORT AND ANNUAL ACCOUNTS 2019-20 VEDANTA LIMITED INTEGRATED REPORT AND ANNUAL ACCOUNTS 2019-20 183

AUDITORS:
� �M/s S.R. Batliboi & Co. LLP, Chartered Accountants (Firm Registration No. 301003E) were appointed in June, 2016 as the Statutory Auditors of the Company till the conclusion of 56th AGM, to be held in calendar year 2021. The report of the Statutory Auditors along with notes to Schedules is enclosed to this Report. The report read with notes to accounts are self-explanatory and therefore, do not call for any further comments or explanation under Section 134 (3)(f) of the Act.
� �The Company has received a certificate that they are not disqualified and continue to remain eligible to act as the auditors of the Company.
� �The auditors have also furnished a declaration confirming their independence as well as their arm’s length relationship with the Company. The Audit Committee reviews the independence and objectivity of the auditors and the effectiveness of the audit process.
� The Statutory Auditors were present at the last AGM of the Company.
Statutory Auditors
� �In terms of Section 148 of Companies Act, 2013 read with rules made thereunder, your Company is required to have the audit of its cost records conducted by the Cost Accountant in Practice.
� �The Board, on recommendation of the Audit Committee had appointed the following Cost Accountants as the Cost Auditors for conducting the audit of cost records of the Company for the FY 2019-20: � � M/s Shome and Banerjee - Oil & Gas Business; and � � M/s Ramnath Iyer & Co. - other business segments
� �M/s Ramnath Iyer & Co., Cost Accountants were nominated as the Lead Cost Auditors. � �The Company had received a certificate confirming their eligibility and consent to act as the Auditors.
� �The said auditors have been re-appointed for FY 2020-21 as well. A resolution seeking ratification of the remuneration payable to the Cost Auditors for FY 2021 forms part of the notice of the ensuing AGM.
� �The cost accounts and records of the Company are duly prepared and maintained by the Company as required under Section 148(1) of the Act pertaining to cost audit.
Cost Auditors
� �The Board had appointed M/s Chandrasekaran & Associates (Firm Registration No. 002500), Practicing Company Secretaries to conduct the secretarial audit of the Company for the FY 2019-20.
� �The Secretarial Audit Report for the financial year ended March 31, 2020 is annexed as Annexure D to this Report and confirms that the Company has complied with the provisions of the Act, Rules, Regulations and Guidelines and that there were no deviations or non-compliances.
� �Pursuant to SEBI circular no. CIR/CFD/CMO1/27/2019 dated February 8, 2019, the company has also undertaken an audit for all applicable compliances as per the Listing Regulations and circular guidelines issued thereunder. The Annual Secretarial Compliance Report for the FY 2019-20 has also been submitted to the Stock Exchanges within the stipulated timeline.
� �The Company has received a certificate confirming their eligibility and consent to act as the Auditors.
� �The Board has reappointed M/s Chandrasekaran & Associates as the Secretarial Auditors for FY 2020-21.
� The Secretarial Auditors were also present at the last AGM of the Company.
Secretarial Auditors
� �The Company had appointed M/s Deloitte Haskins & Sells, LLP as the Internal Auditors of the Company for the FY 2019-20 to conduct the internal audit basis a detailed internal audit plan.
� �The Company has an independent in-house Management Assurance Services (MAS) team to manage the group’s internal audit activity and that functionally reports to the Audit Committee.
� �The Board, on recommendation of the Audit Committee, has reappointed M/s Deloitte Haskins & Sells, LLP as the Internal Auditors of the Company for the FY 2020-21.
Internal Auditors
purpose for which the loan or guarantee or security is proposed to be utilised as per the provisions of Section 186 of the Act are provided in the standalone financial statements. (Please refer to Notes to the standalone financial statements).
DEBENTURESDuring the financial year, your Company raised ` 4,920 crores through issuance of secured, rated, redeemable, non-cumulative, non-convertible debentures (NCD) of face value of ` 1,000,000 each on private placement basis as per the following details:
The details of share capital as on March 31, 2020 is provided below:-
Particulars Amount (`)
Authorised Share Capital 74,120,100,000Paid-up Capital 3,717,504,871Listed Capital 3,717,196,639Shares under Abeyance pending allotment 308,232
* Out of the total paid-up capital of 3,717,504,871 equity shares, 308,232 equity shares are pending for allotment and listing and hence kept under abeyance since they are sub-judice and further 261,780,208 equity shares are held in the form of 65,445,052 ADSs as on March 31, 2020.
UNCLAIMED SHARESPursuant to the SEBI Circular and Regulation 39 of the Listing Regulations regarding the procedure to be adopted for unclaimed shares issued in physical form in public issue or otherwise, the Company has a separate demat account in the title of ‘Vedanta Limited
REPORTING OF FRAUDS BY AUDITORSDuring the year under review, the Statutory Auditors, Cost Auditors and Secretarial Auditor have not reported any instances of frauds committed in the Company by its officers or employees to the Audit Committee under Section 143(12) of the Companies Act, 2013, details of which needs to be mentioned in this Report.
DETAILS OF LOANS/ GUARANTEES/ INVESTMENT MADE BY THE COMPANYThe particulars of loans given, investments made, guarantees given and securities provided along with the
COMMERCIAL PAPERSThe Commercial Papers issued by the Company are listed on National Stock Exchange of India Limited. The details of the Commercial Papers outstanding as of March 31, 2020 have been provided in the Corporate Governance Report.
FIXED DEPOSITSAs at March 31, 2020 deposits amounting to ` 54,000 remains unclaimed. Since the matter is sub judice, the Company is maintaining status quo.
TRANSFER TO RESERVESThe Company proposes Nil transfer to General Reserve for the financial year.
CAPITAL STRUCTUREThe Authorised Share Capital of the Company is ` 74,120,100,000 divided into 44,020,100,000 number of equity shares of ` 1/- each and 3,010,000,000 Preference Shares of ` 10/- each. There was no change in the capital structure of the Company during the period under review.
Coupon Rate Date of Allotment No. of NCDs Total Amount Tenor Maturity Date
8.90% Secured Rated Listed Redeemable Non-Convertible Debentures - Series I
09/12/19 9,000 900 2 years 09/12/21
9.20% Secured Rated Listed Redeemable Non-Convertible Debentures - Series II
09/12/19 7,500 750 3 years 09/12/22
8.75% Secured Rated Listed Redeemable Non-Convertible Debentures
30/01/20 12,700 1,270 2 years & 5 months
30/06/22
9.20% Secured Rated Listed Redeemable Non-Convertible Debentures
25/02/20 20,000 2,000 10 years 25/02/30
The aforesaid debentures are listed on BSE Limited.
Further, the details of NCDs outstanding debentures as of March 31, 2020 have been detailed in the Corporate Governance Report.
DIRECTORS’ REPORT CONTINUED...
INTEGRATED REPORT
06-115MANAGEMENT REVIEW
116-167STATUTORY REPORTS
168-270FINANCIAL STATEMENTS
271-502
184 VEDANTA LIMITED INTEGRATED REPORT AND ANNUAL ACCOUNTS 2019-20 VEDANTA LIMITED INTEGRATED REPORT AND ANNUAL ACCOUNTS 2019-20 185

TRANSFER OF UNPAID AND UNCLAIMED AMOUNTS TO INVESTOR EDUCATION AND PROTECTION FUND (IEPF)In accordance with the provisions of Companies Act and IEPF Rules, the Company is required to transfer the following amounts to IEPF:-
� �Dividend amount that remains unpaid/unclaimed for a period of seven (7) years;
� �Shares on which the dividend has not been paid/claimed for seven (7) consecutive years or more.
Your Company in its various communications to the shareholders from time to time, requests them to claim the unpaid/unclaimed amount of dividend and shares
due for transfer to the IEPF account established by Central Government. Further, in compliance with the IEPF (Accounting, Audit, Transfer and Refund) Rules, 2016 (IEPF Rules) including statutory modifications thereof, the Company publishes notice in newspapers and also sends specific letters to all the shareholders, whose shares are due to be transferred to IEPF, to enable them claim their rightful dues.
The details of dividend transferred during the financial year is provided below:-
– Unclaimed Suspense Account’ with M/s Karvy Stock Broking Limited. The details of shares lying in the unclaimed suspense account are provided below:-
DescriptionNo. of
shareholdersNo. of Equity shares
of ` 1/- each
Aggregate number of shareholders and the outstanding shares in the suspense account lying at the beginning of the year
2,717 2,650,262
Number of shares transferred to the unclaimed suspense account during the year - -Number of shareholders who approached issuer for transfer of shares from suspense account during the year
43 108,612
Number of shareholders to whom shares were transferred from suspense account during the year
- -
Number of shares transferred to IEPF account pursuant to Investor Education and Protection Fund Authority (Accounting, Audit, Transfer and Refund) Rules, 2016 read with Amendment Rules, 2017
1,898 1,606,791
Aggregate number of shareholders and the outstanding shares in the suspense account lying at the end of the year. The voting rights on these shares shall remain frozen till the rightful owner of such shares claims the shares
776 934,859
Dividend transferred to IEPF during the year
Financial Year Type of Dividend Dividend declared onAmount transferred
to IEPF (in `) Date of transfer to IEPF
2011-12 Final Dividend 23/06/12 1,812,052.00 20/08/192011-12 Final Dividend 03/07/12 9,864,428.00 27/08/192011-12 Final Dividend 14/07/12 5,971,201.00 11/09/192012-13 Interim Dividend 23/10/12 6,403,271.00 17/12/192012-13 Interim Dividend 28/10/12 1,449,220.00 20/12/192012-13 Interim Dividend 31/10/12 4,450,855.00 21/12/19Total 29,951,027.00
Unpaid dividend on the shares on which there was a specific order of court/ tribunal/ statutory authority restraining transfer of such shares and dividend thereon, were not transferred to IEPF pursuant to Section 124 of the Companies Act, 2013 and Rule 6 of IEPF (Accounting, Audit, Transfer and Refund) Rules, 2016 including statutory modifications or re-enactments thereof.
Dividend declared during the financial year transferred to IEPF
Financial Year Type of Dividend Dividend declared onAmount transferred
to IEPF (in `) Date of transfer to IEPF
2019-20 Interim Dividend (1st) 27/02/20 17,417,563.80 12/03/20Total 17,417,563.80
The shareholders whose shares/ dividends have been transferred to IEPF can claim the same from IEPF in accordance with the prescribed procedure and on submission of such documents as prescribed under the IEPF Rules. The process for claiming the unpaid dividend/shares out of the IEPF can be accessed at www.iepf.gov.in and on the website of the Company at www.vedantalimited.com.
Shares transferred/credited to IEPFDuring the year, the Company transferred 2,126,129 equity shares of ` 1/- each comprising of 3,898 shareholders to IEPF.
The Company has also uploaded the details of unpaid and unclaimed amounts lying with the Company as on July 11, 2019 (date of last AGM) on the Company’s website www.vedantalimited.com. Further, the details of equity shares transferred are available on the Company’s website www.vedantalimited.com.
Ms. Prerna Halwasiya, Company Secretary & Compliance Officer of the Company is designated as the Nodal Officer under the provisions of IEPF. The contact details can be accessed on the website of the Company at www.vedantalimited.com.
SUBSIDIARIES, JOINT VENTURES AND ASSOCIATE COMPANIESYour Company has 49 subsidiaries (15 direct and 34 indirect) as at March 31, 2020, as disclosed in the notes to accounts.
During the year and till date the following changes have taken place in subsidiary companies:
� �Vedanta Star Limited, a wholly owned subsidiary company has been merged with Electrosteel Steels Limited w.e.f. March 25, 2020.
There has been no material change in the nature of the business of the subsidiaries.
As at March 31, 2020, the Company has 6 associate companies and joint ventures.
Associate Companies and Joint Ventures: � RoshSkor Township (Proprietary) Limited � Gaurav Overseas Private Limited � Goa Maritime Private Limited � Madanpur South Coal Company Limited � Rampia Coal Mines and Energy Private Limited � Rosh Pinah Health Care (Proprietary) Limited
As required under Listing Regulations, the Consolidated Financial Statements of the Company and its subsidiaries and joint ventures, prepared in accordance with Ind AS 110 issued by the Institute of Chartered Accountants of India, form part of the Annual Report and are reflected in the Consolidated Financial Statements of the Company.
During the year, the Board of Directors have reviewed the affairs of the subsidiaries. Pursuant to Section 129(3) of the Companies Act, 2013 (the Act), a statement containing the salient features of the financial statements of the subsidiary and associate companies is attached to the financial statements in Form AOC-1. The statement also provides details of performance and financial position of each of the subsidiaries and their contribution to the overall performance of the Company.
In accordance with Section 136 of the Act, the audited Standalone and Consolidated financial statements of the Company along with relevant notes and separate audited accounts of subsidiaries are available on the website of the Company at www.vedantalimited.com. Copies of the financial statements of the Company and of the subsidiary companies shall be made available upon request by any member of the Company. Additionally, these financial statements shall also be available for inspection by members on all working days during business hours at the Registered Office of the Company.
The dates on which unclaimed dividend and their corresponding shares would become liable to be transferred to the IEPF during the financial year 2020-21 is provided below:-
Dividend to be transferred to IEPF during the financial year 2020-21
ParticularsDate of Declaration of Dividend
Date of completion of seven years
Due date for transfer to IEPF
Amount as on March 31, 2020
(in `)
Interim Dividend 2012-13 (2nd) 29/04/13 03/06/20 03/07/20 7,457,197.40Final Dividend 2012-13 06/06/13 11/07/20 10/08/20 1,846,935.00Final Dividend 2012-13 27/06/13 01/08/20 31/08/20 736,304.80Final Dividend 2012-13 24/07/13 28/08/20 27/09/20 6,005,701.00Interim Dividend 2013-14 22/10/13 26/11/20 26/12/20 4,298,472.00Interim Dividend 2013-14 31/10/13 05/12/20 04/01/21 14,271,742.50Total 34,616,352.70
DIRECTORS’ REPORT CONTINUED...
INTEGRATED REPORT
06-115MANAGEMENT REVIEW
116-167STATUTORY REPORTS
168-270FINANCIAL STATEMENTS
271-502
186 VEDANTA LIMITED INTEGRATED REPORT AND ANNUAL ACCOUNTS 2019-20 VEDANTA LIMITED INTEGRATED REPORT AND ANNUAL ACCOUNTS 2019-20 187

or tribunals against the Company impacting the going concern status and Company’s operations in future.
Iron-Ore Division – Goa OperationsSupreme Court (SC) in the Goa Mining matter in 2014 declared that the deemed mining leases of the lessees in Goa expired on November 22, 1987 and the maximum of 20 years renewal period of the deemed mining leases in Goa under the Mines and Minerals (Development and Regulation) (MMDR) Act had also expired on November 22, 2007 and directed state to grant fresh mining leases.
Thereafter, various mining leases were renewed by the state government before and on the date the MMDR Amendment Ordinance 2015 came into effect (i.e. January 12, 2015).
These renewal of mining leases were challenged before the SC by Goa Foundation and others in 2015 as being arbitrary and against the judgement of the SC in the earlier Goa mining matter. The SC passed the judgement in the matters on February 27, 2018 wherein it set aside the second renewal of the mining leases granted by the State of Goa. The court directed all lease holders operating under a second renewal to stop all mining operations with effect from March 16, 2018 until fresh mining leases (not fresh renewals or other renewals) in accordance with the provisions of the MMDR Act, 1957 and fresh environmental clearances are granted.
Subsequently, mining lessees and other mining stakeholder have filed applications in the pending Abolition Act matter for resumption of mining in the State. The Central Government has also filed an early hearing application in the long pending abolition matter.
We have now filed Special Leave Petition in the Supreme Court in appeal from the HC order against a non-consideration of our representation seeking an amendment of the mining lease till 2037 based on the provisions on the MMDR Amendment Act, 2015. This will be heard in due course. SC has on February 10, 2020 allowed the impediment of Goa foundation and another impleader. The matter will be listed in due course.
Copper DivisionCopper division of Vedanta Limited has received an order from Tamil Nadu Pollution Control Board (TNPCB) on April 9, 2018 whereby they have rejected the Company’s application for renewal of Consent to Operate (CTO) for the 400,000 Metric Tonnes Per Annum (MTPA) Copper Smelter plant in Tuticorin. In furtherance to the order of TNPCB rejecting the Company’s application, the Company decided to shut its Copper smelting operations at Tuticorin and has filed an appeal with TNPCB Appellate authority against the order. During the pendency of the appeal the TNPCB vide its order dated May 23, 2018 ordered disconnection of electricity supply and closure of the Company’s Copper Smelter plant. Post this the Government of Tamil Nadu
MATERIAL SUBSIDIARIESIn accordance with Regulation 16(1)(c) of the SEBI Listing Regulations, your Company has the following material subsidiary companies as on March 31, 2020:-
� �Hindustan Zinc Limited (HZL), a listed subsidiary of the Company; and
� �Cairn India Holdings Limited (CIHL), unlisted subsidiary
The Company has also in place a policy on determination of material subsidiaries and the same may be accessed at www.vedantalimited.com. This objective of the Policy is to determine the Material Subsidiaries and Material Unlisted Indian Subsidiary of the Company and to provide the governance framework for such subsidiaries.
RELATED PARTY TRANSACTIONSYour Company has in place a Policy on Related Party Transaction (RPT Policy) formulated in line with the provision of the Companies Act and Listing Regulations. The Policy may be accessed at www.vedantalimited.com.
The Policy sets out the philosophy and processes to be followed for approval and review of transactions with Related Party and intends to ensure that proper reporting, approval and disclosure processes are in place for all transactions with Related Parties.
A detailed landscape of all RPTs, specifying the nature, value, and terms and conditions of the transaction is presented to the Audit Committee. Also, a Related Party Transactions Manual-Standard Operating Procedures has been formulated to identify and monitor all such transactions.
During the fiscal 2019-20, all the contracts/arrangements/transactions entered into by the Company with the related parties were in the ordinary course of business and on an arm’s length basis and were in compliance with the provisions of the Companies Act and Listing Regulations.
All Related Party Transactions were subject to independent review by a reputed accounting firm to establish compliance with the requirements of Related Party Transactions under the Companies Act, 2013 and Listing Regulations.
Further, there have been no materially significant RPTs during the year pursuant to the provisions of the Companies Act and Listing Regulations. Accordingly, the disclosure required u/s 134(3)(h) of the Act in Form AOC-2 is not applicable to your Company.
SIGNIFICANT & MATERIAL ORDERS PASSED BY THE REGULATORS OR COURTS OR TRIBUNALSProvided below are the significant and material orders which have been passed by any regulators or courts
SECRETARIAL STANDARDSThe Directors state that applicable Secretarial Standards as issued by the Institute of Companies Secretaries of India have been duly followed and complied by the Company.
ANNUAL RETURNAn extract of the Annual Return in prescribed form MGT-9 is annexed hereto as ‘Annexure C’ to the Director’s Report.
MATERIAL CHANGES & COMMITMENT AFFECTING THE FINANCIAL POSITION OF THE COMPANYNo material changes and commitments have occurred subsequent to the close of the financial year till the date of this Report which may affect the financial position of the Company.
MATERIAL EVENTS SUBSEQUENT TO CLOSE OF FINANCIAL YEARYour Company vide letter dated May 12, 2020 has informed the stock exchanges that the Company has received a letter dated May 12, 2020 from one of the members of the promoter and promoter group of the Company (“Promoter Group”) namely, Vedanta Resources Limited (“VRL”) wherein VRL has expressed its intention to, either individually or along with one or more subsidiaries, acquire all fully paid-up equity shares of the Company (“Equity Shares”) that are held by the public shareholders of the Company (as defined under the Delisting Regulations, to be referred to as “Public Shareholders”) and consequently voluntarily delist the Equity Shares from BSE Limited and National Stock Exchange of India Limited, the recognised stock exchanges where the Equity Shares are presently listed (“Stock Exchanges”), in accordance with the Delisting Regulations (“Delisting Proposal”) and if such delisting is successful, then to also delist the Company’s American Depositary Shares from the New York Stock Exchange (“NYSE”) and deregister the Company from the Securities and Exchange Commission (“SEC”), subject to the requirements of the NYSE and the SEC.
Further, the board of directors of the Company in their meeting held on May 18, 2020 have considered and granted their approval for the said Delisting Proposal and to seek shareholders’ approval for the said proposal.
The complete details can be accessed at www.vedantalimited.com.
ENERGY CONSERVATION, TECHNOLOGY ABSORPTION, FOREIGN EXCHANGE EARNINGS AND OUTGOThe information on conservation of energy, technology absorption stipulated under Section 134(3)(m) of the Act read with Rule 8 of the Companies (Accounts) Rules, 2014, is annexed herewith as ‘Annexure E’
on May 28, 2018 ordered the permanent closure of the plant. The Company challenged the same in the National Green Tribunal (NGT) which passed a favorable order for reopening of the plant. The order was appealed by the TNPCB and the State of Tamil Nadu in the Supreme Court. The Supreme Court passed an order upholding the appeal and directing the Company to approach the Madras High Court for relief. The Company has filed a writ petition in the Madras High Court that is currently reserved for orders.
In the meantime, the Madurai Bench of the High Court of Madras in a public interest litigation filed against Vedanta by Fathima Babu held through its order dated May 23, 2018, that the application for renewal of the environmental clearance for the expansion project shall be processed after a mandatory public hearing and the said application shall be decided by the competent authority on or before September 23, 2018. In the interim, the High Court ordered Vedanta to cease construction and all other activities on site for the proposed expansion project with immediate effect. Currently, the Ministry of Environment, Forest and Climate Change (“MoEF”) has updated on its website that Vedanta Limited’s environmental clearance for expansion project will be considered for ToR either upon verdict of the NGT case or upon filing of a Report from the State Government/ District Collector, Thoothukudi. Separately, SIPCOT through its letter dated May 29, 2018, cancelled 342.22 acres of the land allotted to Vedanta Limited for the proposed expansion project. Further, the TNPCB issued order on June 7, 2018, directing the withdrawal of the consent to establish for the expansion project, which is valid until December 31, 2022. In a writ filed before Madras High Court Madurai Bench challenging the lease cancellation order, Madras High Court through order dated October 3, 2018 has granted an interim stay in favour of the Company cancelling on the cancellation of 342.22 acres of the land allotted.
Further, June 7, 2018, TNPCB withdrew the CTE granted for expansion project for a period of five years. The Company has filed Appeals before the TNPCB Appellate Authority challenging withdrawal of CTE by the TNPCB and the matter is next listed for hearing on June 26 2020.
CHANGE IN THE NATURE OF BUSINESS, IF ANYThere is no change in the nature of business of your Company during the year under review.
FAILURE TO IMPLEMENT ANY CORPORATE ACTIONThere were no instances where the Company failed to implement any corporate action within the specified time limit.
DIRECTORS’ REPORT CONTINUED...
INTEGRATED REPORT
06-115MANAGEMENT REVIEW
116-167STATUTORY REPORTS
168-270FINANCIAL STATEMENTS
271-502
188 VEDANTA LIMITED INTEGRATED REPORT AND ANNUAL ACCOUNTS 2019-20 VEDANTA LIMITED INTEGRATED REPORT AND ANNUAL ACCOUNTS 2019-20 189

sexual harassment, anti-bribery, anti-corruption and anti-trust laws through use of interactive learning tools.
Through our Supplier Code of Conduct, we also ensure that third parties, including their employees, agents and representatives who have a business relationship with your Company, are bound by industry standards as well as applicable statutory requirements concerning labour and human rights; health, safety and environment; and business integrity.
DIRECTORS RESPONSIBILITY STATEMENTPursuant to Section 134 of the Companies Act, 2013, your Directors, to the best of their knowledge and belief, hereby state that:-
(a)� �in the preparation of the annual accounts, the applicable accounting standards has been followed and there are no material departures from the same;
(b)� �they have selected such accounting policies and applied them consistently and made judgements and estimates that are reasonable and prudent so as to give a true and fair view of the state of affairs of the Company at the end of the financial year, i.e. March 31, 2020 and of the profit and loss of the Company for that period;
(c)� �they have taken proper and sufficient care for the maintenance of adequate accounting records in accordance with the provisions of the Companies Act, 2013 for safeguarding the Company’s assets and for preventing and detecting fraud and other irregularities;
(d)� �the annual accounts have been prepared on a going concern basis;
(e)� �they have laid down internal financial controls to be followed by the Company and that such internal financial controls are adequate and are operating effectively; and
(f)� �proper systems have been devised to ensure compliance with the provisions of all applicable laws and that such systems were adequate and operating effectively.
AWARDS AND RECOGNITIONSYour Company has maintained the highest standards of corporate governance. In its constant quest for growth and excellence, your Company has been winning accolades and is delighted to receive phenomenal share of recognitions and awards at various forums for its unique innovations and contributions towards its stakeholders & the society as a whole.
The details of the Foreign Exchange Earnings and Outgo are as follows:
(` in crore)
ParticularsYear Ended
March 31, 2020Year Ended
March 31, 2019
Expenditure in foreign currency
1,357 4,026
Earnings in foreign currency
16,462 18,596
CIF Value of Imports 13,512 19,010
LEGAL, COMPLIANCE, ETHICS AND GOVERNANCE FUNCTIONThrough its concerted efforts to generate value while keeping integrity at the forefront, the Legal function of your Company is a valued partner in providing regulatory support and gauging the viability of strategic assistance for business partnership and expansion. It ensures advisory and compliance services pertaining to existing regulations and legislative developments for facilitating business agenda in the areas of effective claims and contract management, mergers and acquisitions, dispute resolution, litigation and adherence to competition, business ethics and governance.
With the aim to ensure smooth operations and safeguard interests of your Company for business growth and sustenance in an evolving, ambiguous and complex environment, the function continues to focus on presenting areas of opportunities; mitigating risks; providing proactive assistance to other functions and departments; and bringing about policy changes based on persistent interaction with various Government bodies and industrial associations like CII and FICCI.
As newer technologies continue to transform the market, your Company ensures adeptness in mechanisms to safeguard the data security and privacy of our stakeholders with enhanced legal and security standards. Simultaneously, to meet the growing business needs, the Legal function continues to seek and identify technological opportunities while harnessing existing know-how to streamline compliance frameworks, litigation management and conduct online ethics awareness training.
Our organisational values and principles are made applicable to all our employees through our Code of Business Conduct and Ethics. In a bid to create a better understanding of its practical implications, the Legal function conducts an annual online ethics training module to necessitate all employees to mandatorily embrace the values and principles embodied as a part of the afore-mentioned Code. Additionally, the function drives an Ethics Compliance Month initiative for raising awareness by conduct of employee trainings in areas of ethical concern such as insider trading, prevention of
We would also like to take this opportunity to extend our earnest regard to all our employees for their zealous enthusiasm and interminable efforts directed towards lodging significant contributions to the growth of the Company.
We further undertake to express our heartiest gratitude to all our stakeholders for their unflinching faith in their Company.
We look forward for bestowal of your support as we diligently strive to deliver sustained value for our stakeholders and inscribe on the footprints of nation building for one of the fastest growing economies of the world.
For and on behalf of the Board of Directors
Anil AgarwalNon-Executive ChairmanDIN: 00010883
Place: MumbaiDate: June 6, 2020
These acknowledgements are testament of the Company’s progress and its commitment towards delivering value for all its stakeholders.
The details of the key honours received by the Company during the years have been elucidated in separate section in the Annual Report.
ACKNOWLEDGEMENTYour Directors wish to place on record, their sincere appreciation to the Central and State Government Authorities, Bankers, Stock Exchanges, Financial Institutions, Analysts, Advisors, Local Communities, Customers, Vendors, Business Partners, Shareholders and Investors forming part of the Vedanta family for their continued support, assistance and encouragement extended to us during the year.
Our business was built with a simple mission envisioned by the Group’s Chairman, Mr. Anil Agarwal, “To create a leading global natural resource company.” In a bid to accomplish the mission, the Company is deftly managed by an adroit set of leaders with global and diverse experience in the sector. The professionally equipped and technically sound management has set progressive policies and objectives, follows global practices, all with a pragmatic vision to take the Company ahead to the next level.
DIRECTORS’ REPORT CONTINUED...
INTEGRATED REPORT
06-115MANAGEMENT REVIEW
116-167STATUTORY REPORTS
168-270FINANCIAL STATEMENTS
271-502
190 VEDANTA LIMITED INTEGRATED REPORT AND ANNUAL ACCOUNTS 2019-20 VEDANTA LIMITED INTEGRATED REPORT AND ANNUAL ACCOUNTS 2019-20 191
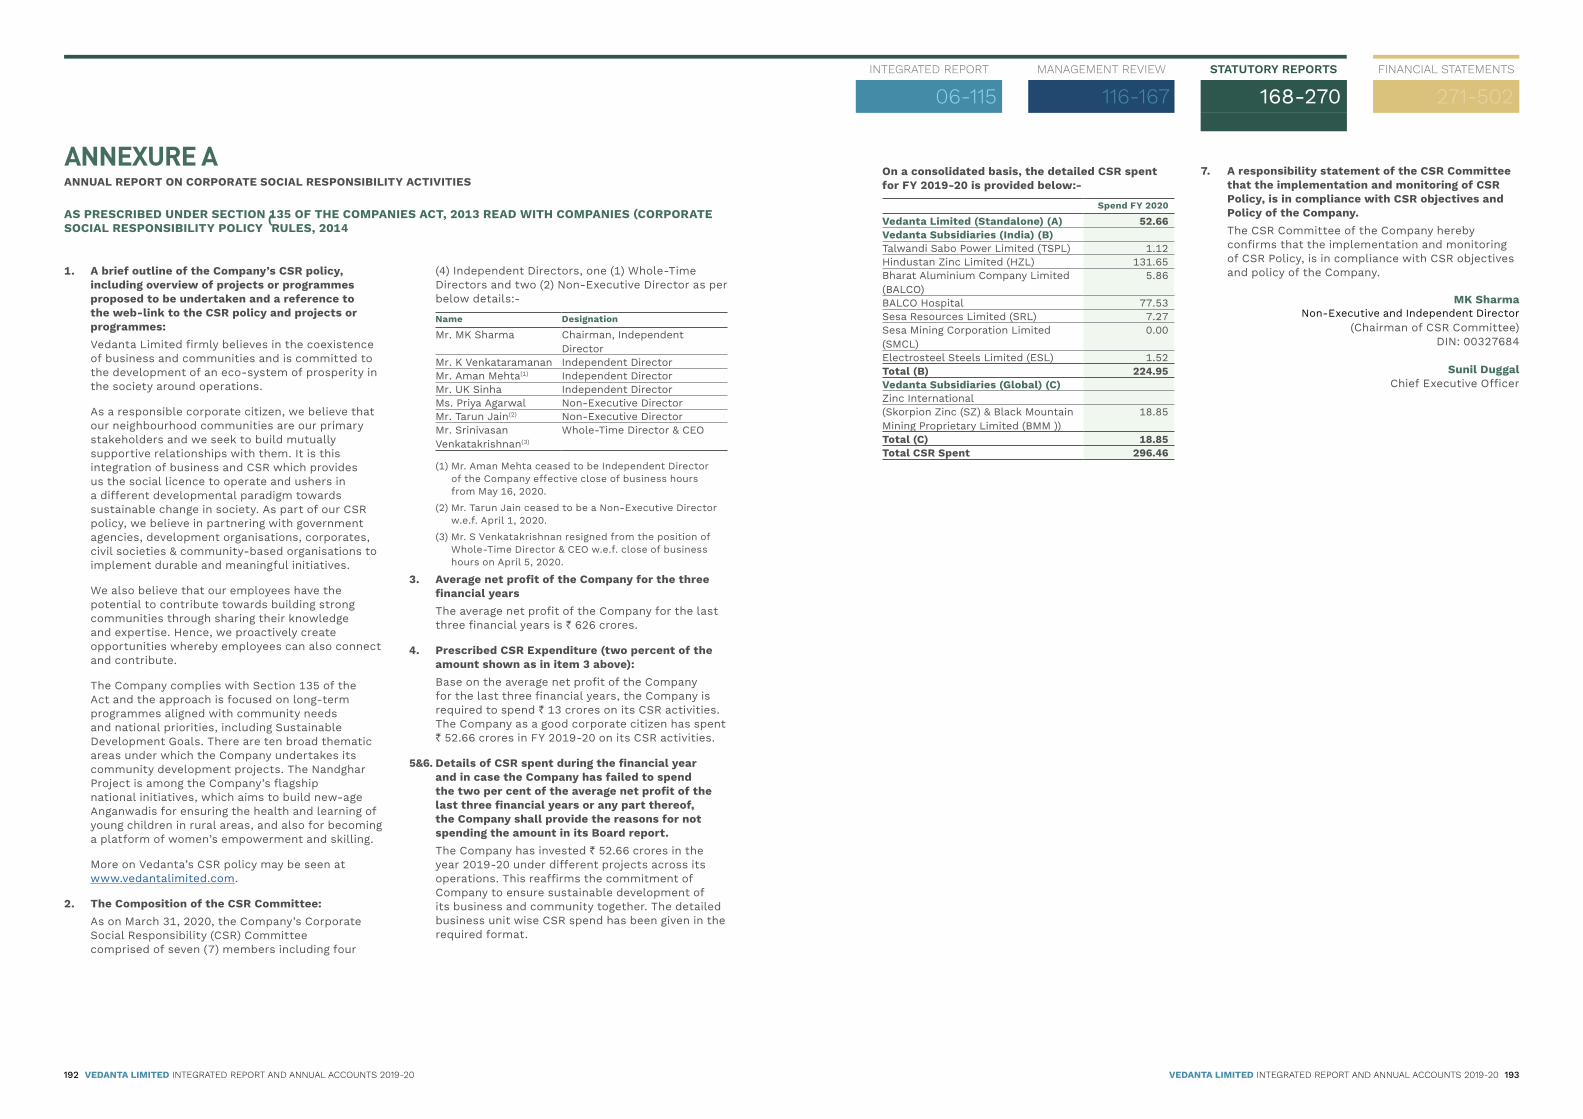
ANNEXURE AANNUAL REPORT ON CORPORATE SOCIAL RESPONSIBILITY ACTIVITIES
AS PRESCRIBED UNDER SECTION 135 OF THE COMPANIES ACT, 2013 READ WITH COMPANIES (CORPORATE SOCIAL RESPONSIBILITY POLICY) RULES, 2014
1. A brief outline of the Company’s CSR policy, including overview of projects or programmes proposed to be undertaken and a reference to the web-link to the CSR policy and projects or programmes:
� �Vedanta Limited firmly believes in the coexistence of business and communities and is committed to the development of an eco-system of prosperity in the society around operations.
� �As a responsible corporate citizen, we believe that our neighbourhood communities are our primary stakeholders and we seek to build mutually supportive relationships with them. It is this integration of business and CSR which provides us the social licence to operate and ushers in a different developmental paradigm towards sustainable change in society. As part of our CSR policy, we believe in partnering with government agencies, development organisations, corporates, civil societies & community-based organisations to implement durable and meaningful initiatives.
� �We also believe that our employees have the potential to contribute towards building strong communities through sharing their knowledge and expertise. Hence, we proactively create opportunities whereby employees can also connect and contribute.
� �The Company complies with Section 135 of the Act and the approach is focused on long-term programmes aligned with community needs and national priorities, including Sustainable Development Goals. There are ten broad thematic areas under which the Company undertakes its community development projects. The Nandghar Project is among the Company’s flagship national initiatives, which aims to build new-age Anganwadis for ensuring the health and learning of young children in rural areas, and also for becoming a platform of women’s empowerment and skilling.
� �More on Vedanta’s CSR policy may be seen at www.vedantalimited.com.
2. The Composition of the CSR Committee:� �As on March 31, 2020, the Company’s Corporate
Social Responsibility (CSR) Committee comprised of seven (7) members including four
(4) Independent Directors, one (1) Whole-Time Directors and two (2) Non-Executive Director as per below details:-
Name Designation
Mr. MK Sharma Chairman, Independent Director
Mr. K Venkataramanan Independent DirectorMr. Aman Mehta(1) Independent DirectorMr. UK Sinha Independent DirectorMs. Priya Agarwal Non-Executive DirectorMr. Tarun Jain(2) Non-Executive DirectorMr. Srinivasan Venkatakrishnan(3)
Whole-Time Director & CEO
� �(1) �Mr. Aman Mehta ceased to be Independent Director of the Company effective close of business hours from May 16, 2020.
� �(2) �Mr. Tarun Jain ceased to be a Non-Executive Director w.e.f. April 1, 2020.
� �(3) �Mr. S Venkatakrishnan resigned from the position of Whole-Time Director & CEO w.e.f. close of business hours on April 5, 2020.
3. Average net profit of the Company for the three financial years
� �The average net profit of the Company for the last three financial years is ` 626 crores.
4. Prescribed CSR Expenditure (two percent of the amount shown as in item 3 above):
� �Base on the average net profit of the Company for the last three financial years, the Company is required to spend ` 13 crores on its CSR activities. The Company as a good corporate citizen has spent ` 52.66 crores in FY 2019-20 on its CSR activities.
5&6. Details of CSR spent during the financial year and in case the Company has failed to spend
the two per cent of the average net profit of the last three financial years or any part thereof, the Company shall provide the reasons for not spending the amount in its Board report.
� �The Company has invested ` 52.66 crores in the year 2019-20 under different projects across its operations. This reaffirms the commitment of Company to ensure sustainable development of its business and community together. The detailed business unit wise CSR spend has been given in the required format.
7. A responsibility statement of the CSR Committee that the implementation and monitoring of CSR Policy, is in compliance with CSR objectives and Policy of the Company.
� �The CSR Committee of the Company hereby confirms that the implementation and monitoring of CSR Policy, is in compliance with CSR objectives and policy of the Company.
MK SharmaNon-Executive and Independent Director
(Chairman of CSR Committee)DIN: 00327684
Sunil DuggalChief Executive Officer
On a consolidated basis, the detailed CSR spent for FY 2019-20 is provided below:-
Spend FY 2020
Vedanta Limited (Standalone) (A) 52.66Vedanta Subsidiaries (India) (B)Talwandi Sabo Power Limited (TSPL) 1.12Hindustan Zinc Limited (HZL) 131.65Bharat Aluminium Company Limited (BALCO)
5.86
BALCO Hospital 77.53Sesa Resources Limited (SRL) 7.27Sesa Mining Corporation Limited (SMCL)
0.00
Electrosteel Steels Limited (ESL) 1.52Total (B) 224.95Vedanta Subsidiaries (Global) (C)Zinc International (Skorpion Zinc (SZ) & Black Mountain Mining Proprietary Limited (BMM ))
18.85
Total (C) 18.85Total CSR Spent 296.46
INTEGRATED REPORT
06-115MANAGEMENT REVIEW
116-167STATUTORY REPORTS
168-270FINANCIAL STATEMENTS
271-502
192 VEDANTA LIMITED INTEGRATED REPORT AND ANNUAL ACCOUNTS 2019-20 VEDANTA LIMITED INTEGRATED REPORT AND ANNUAL ACCOUNTS 2019-20 193

Vedanta Limited – Lanjigarh
Sl. No.
CSR Project or Activity Identified
Sector in which the project is covered
Project or Programme
Amount Outlay*
Amount Spent* Cumulative Spend till reporting
period
Amount Spent, Direct or implementing agencyArea
Name of District Direct Overheads
1 Mid Day Meal Children Well-being & Education
Lanjigarh Block
Kalahandi District
1.00 - - - NA
2 Child Welfare Project (2.5 yrs to 6 yrs)
Children Well-being & Education
Lanjigarh Block
Kalahandi District
0.65 0.58 - 0.58 Direct
3 Support to schools Children Well-being & Education
Lanjigarh Block
Kalahandi District
0.15 0.11 - 0.11 Direct
4 Scholarship Children Well-being & Education
Lanjigarh Block
Kalahandi District
0.05 0.04 - 0.04 Direct
5 Shiksha Sambal (8th, 9th & 10th Coaching)
Children Well-being & Education
Lanjigarh & Muniguda Block
Kalahandi & Rayagada District
0.20 0.15 - 0.15 FIDR
6 Magic Bus Children Well-being & Education
Lanjigarh Block
Kalahandi District
0.43 - - - Direct
7 Nandghar Children Well-being & Education
Lanjigarh Block
Kalahandi District
0.40 - - - Direct
8 Promoting Preventive Health through Vedanta Hospital, Ambulance and MHU
Health Lanjigarh & Muniguda Block
Kalahandi & Rayagada District
4.00 3.43 - 3.43 PVO
9 Maa Santoshi Jankalyan Hospital, Bankakundru
Health Lanjigarh Block
Kalahandi District
0.15 0.12 - 0.12 MSJK
10 Providing Safe Drinking Water Health, Water & Sanitation
Lanjigarh & Muniguda Block
Kalahandi & Rayagada District
0.15 0.06 - 0.06 Direct
11 Sakhi (Women SHG Promotion, Stregthening and IGA inclusion)
Women Empowerment
Lanjigarh & Muniguda Block
Kalahandi & Rayagada District
1.15 0.25 - 0.25 Mahashakti Foundation
12 Promotion sustainable Agriculture practices – SRI, Sunflower, farmers Club, Farm activity
Agriculture Lanjigarh Block
Kalahandi District
5.00 - - - NA
13 Tribal Art & Dhokra Art Livelihood Lanjigarh Block
Kalahandi District
0.30 0.16 - 0.16 Mahashakti Foundation
14 Skill Development Skill Development
Lanjigarh Block
Kalahandi District
0.10 - - - NA
15 Need based infrastructre development projects
Rural Development
Lanjigarh & Muniguda Block
Kalahandi & Rayagada District
3.00 1.31 - 1.31 Direct
16 Promotion of Sports & Culture Sports & Culture
Lanjigarh & Muniguda Block
Kalahandi & Rayagada District
0.25 0.04 - 0.04 Direct
17 Baseline/Impact studies, Audit, Magazine, Award,Travel, Village Coordinator etc.
Programme & Admin
Lanjigarh & Muniguda Block
Kalahandi District
1.46 - 0.46 0.46 Direct as well as through partners (SATTVA, Subhash Mittal & Associates)
18 Admin Salary Programme & Admin
Lanjigarh Block
Kalahandi District
1.50 - - - Direct
Sub-Total 19.94 6.26 0.46 6.72
Vedanta Limited – Jharsuguda
Sl. No.
CSR Project or Activity Identified
Sector in which the project is covered
Project or Programme
Amount Outlay*
Amount Spent* Cumulative Spend till reporting
period
Amount Spent, Direct or implementing agencyArea
Name of District Direct Overheads
19 Mobile Health Unit Health Care Jharsuguda Jharsuguda 0.52 0.34 - 0.34 Wockhardt Foundation/Dist. Health Dept.
20 Project Jagruti: Prevention of HIV / AIDS
Health Care Jharsuguda Jharsuguda OSACS/Health Institution
21 Drinking water & Sanitation initiatives: water tanker and other facilities for drinking water
Health, Water & Sanitation
Jharsuguda Jharsuguda 0.05 0.03 - 0.03 Direct through Community Member/ Municipality/ Contractor
22 Village cleanliness drive Sanitation Jharsuguda Jharsuguda 0.30 0.34 - 0.34 Direct through Contractor & Community Member
23 Vedanta DAV Scholarship Programme
Children Wellbeing & Education
Jharsuguda Jharsuguda 0.53 0.54 - 0.54 DAV institution
24 Other Educational Initiatives: VVVY Project/ Additional teacher/ Tutorial Classes/Bridge school/ Competitive exam preparation classes
Children Wellbeing & Education
Jharsuguda Jharsuguda 0.20 0.20 - 0.20 AJKA/Govt. Education Department, Village Education Department
25 Computer Literacy around periphery villages
Children Wellbeing & Education
Jharsuguda Jharsuguda 0.04 0.02 - 0.02 Vedanta Foundation
26 Promoting Smart Classes & Mini-Science lab in 5 Odiya medium school
Children Wellbeing & Education
Jharsuguda Jharsuguda 0.06 0.14 - 0.14 Stem Learning
27 Women Empowerment: Subhalaxmi Co-op, Capacity Buidling, Micro Enterprises
Sustainable Livelihood & Promotion of agriculture & Skill Dev.
Jharsuguda Jharsuguda 0.12 0.04 - 0.04 Subhalaxmi Co-op
28 Farm Activity: Project Jeevika Samridhhi & other initiative
Jharsuguda Jharsuguda 0.22 0.11 - 0.11 SEWA, Agriculture Dept, Horticulture Dept
29 Skill Development Programme
Jharsuguda Jharsuguda 0.48 - - - New Agency
30 Supporting Sports & Culture events
Sports & Culture
Jharsuguda Jharsuguda 0.13 0.18 - 0.18 Direct through Community Member
31 Plantation & its Maintenance Environment Jharsuguda Jharsuguda 0.24 0.22 - 0.22 Pvt. Organistion/ Govt.
32 Basic and Social Infrastruture Projects
Rural Development
Jharsuguda Jharsuguda 1.63 1.17 - 1.17 Direct through Contractor & Community Member
33 Programme Coordination exp, Study, MIS, Audit, Village Coordinator, Tour & Travel, EVP etc.
Programme & Admin
Jharsuguda Jharsuguda 1.43 - 0.35 0.35 NA
34 Cyclone Releif Fund/ Material – FANI, COVID-19 response
Emergency Relief Fund
BBSR/ Puri/Jharsuguda
BBSR/ Puri/Jharsuguda
- 0.64 - 0.64 Direct through Agency, Contractor
Sub-Total 5.95 3.98 0.35 4.33
INTEGRATED REPORT
06-115MANAGEMENT REVIEW
116-167STATUTORY REPORTS
168-270FINANCIAL STATEMENTS
271-502
194 VEDANTA LIMITED INTEGRATED REPORT AND ANNUAL ACCOUNTS 2019-20 VEDANTA LIMITED INTEGRATED REPORT AND ANNUAL ACCOUNTS 2019-20 195

Iron Ore Business
Sl. No.
CSR Project or Activity Identified
Sector in which the project is covered
Project or Programme
Amount Outlay*
Amount Spent* Cumulative Spend till reporting
period
Amount Spent, Direct or implementing agencyArea
Name of District Direct Overheads
35 Agriculture rejuvenation and dairy farming project
Agriculture and Animal Husbandry
Amona Navelim, Megalahalli, Bommavvanagthihalli
North Goa & Chitradurga
1.61 0.30 - 0.30 Direct
36 Evening study center Children's Well-being & Education
Megalahalli, Bommavvanagthihalli, Konanuru
Chitradurga 0.06 0.04 - 0.04 Implementing agency MYRADA
37 Support to Educational institutions & Scholarship
Children's Well-being & Education
Megalahalli, Bommavvanagthihalli, Konanuru, Amona, Navelim
North Goa, Chitradurga
0.89 0.45 - 0.45 Direct
38 Skill development for youths/Vedanta Computer Literacy Programme
Skill Development
Megalahalli, Bommavvanagthihalli & Navelim
Chitradurga & North Goa
0.42 0.07 - 0.07 Direct/Vedanta Foundation
39 Anganwadi Renovation Programme
Children's Well-being & Education
Dharwad, Manoharpur Dharwad, West Singhbum
1.95 0.29 - 0.29 Direct
40 Community Medical Centers (CMC), Mobile Health Vans
Health Amona, Navelim, Meghanhalli, Manoharpura
North Goa, Chitradurga, West Singhbum
1.34 0.76 - 0.76 Implementing agency MYRADA in Chitradurga & Voluntary Health Association of Goa in Goa & SevaMob in Manoharpur
41 Health campaigns & Awareness sessions
Health Amona, Navelim, Meghanhalli,
North Goa, Chitradurga
0.01 - - - Directly
42 Drinking water projects
Health (Drinking water)
Amona, Navelim, Meghanhalli, Sonshi, Manoharpur
North Goa, Chitradurga, West Singhbum
1.38 0.64 - 0.64 Direct
43 Sanitation units Health (Sanitation)
Amona, Navelim North Goa, Chitradurga
0.10 0.04 - 0.04 Direct
44 Women SHG formation & training
Women Empowerment
Amona, Navelim, Meghanhalli
North Goa, Chitradurga
0.44 0.06 - 0.06 Direct/ MYRADA
45 Sports & cultural programme
Sports & Culture
Amona, Navelim, Meghanhalli, Manoharpura
North Goa, Chitradurga
0.25 0.13 - 0.13 Direct
46 Environment Protection and Restoration
Environment Amona, Navelim North Goa 0.05 0.01 - 0.01 Direct
47 Need Based community infrastructures
Rural Development
Amona, Navelim, Meghanhalli, Manoharpura
North Goa, Chitradurga, Manoharpur
3.39 0.22 - 0.22 Direct
48 CSR Audit, Study and other admin
Programme & Admin
Across operational areas in Goa & Chitradurga
North Goa, South Goa & Chitradurga
2.18 - 0.06 0.06 Direct
Total 14.07 3.01 0.06 3.07
Sterlite Copper
Sl. No.
CSR Project or Activity Identified
Sector in which the project is covered
Project or Programme
Amount Outlay*
Amount Spent* Cumulative Spend till reporting
period
Amount Spent, Direct or implementing agencyArea
Name of District Direct Overheads
49 Evening study center Education Thoothukudi Thoothukudi 1.00 0.05 - 0.05 Thulasi social trust/Bell education and women empowerment society/Dhaayagam social welfare trust)
50 Girl child education promotion
Education Thoothukudi Thoothukudi 0.30 0.25 - 0.25 Humana People to People India
51 Scholarship Education Thoothukudi Thoothukudi 4.00 3.99 - 3.99 Direct52 Educational Support Education Thoothukudi Thoothukudi - 0.01 - 0.01 Direct53 Sterlite school Education Thoothukudi Thoothukudi 7.00 0.14 - 0.14 Mukesh Associates54 Summer camp Education Thoothukudi Thoothukudi - 0.02 - 0.02 Direct55 Blood donation camp Health Thoothukudi Thoothukudi 0.01 0.00 - 0.00 Direct56 Pediatric block
constructionHealth Thoothukudi Thoothukudi 0.75 - - - Direct
57 Mobile health unit Health Thoothukudi Thoothukudi 0.50 0.03 - 0.03 Direct58 Govt. Hospital
maintenanceHealth Thoothukudi Thoothukudi 0.06 0.04 - 0.04 Direct
59 Vision to all (eye camp) Health Thoothukudi Thoothukudi 0.04 - - - Aravind Eye hospital60 Special camps Health Thoothukudi Thoothukudi 0.10 - - - Direct61 Sterlite hospital Health Thoothukudi Thoothuudi 10.00 - - - Mukesh Associates62 Medical Assistance
programmeHealth Thoothukudi Thoothukudi - 0.33 - 0.33 Direct
63 Child friendly village Child Care Thoothukudi Thoothukudi 0.02 0.01 - 0.01 Direct64 Nandghar Children
Well-being & Education
Thoothukudi Thoothukudi 0.30 - - - NA
65 Tree plantation Environment Thoothukudi Thoothukudi 4.00 4.44 - 4.44 APM, Sakthi Nursery garden, royal agencies
66 Establishment of Kitchen Gardening – Distribution of seed kits to families
Agriculture Thoothukudi Thoothukudi 0.03 - - - Direct
67 Irrigation channel cleaning
Agriculture Thoothukudi Thoothukudi 0.60 0.20 - 0.20 Direct
68 Cattle Camp Animal husbandry
Thoothukudi Thoothukudi 0.05 - - - Direct
69 Youth Resource Center Youth Development
Thoothukudi Thoothukudi 2.50 0.08 - 0.08 Seetha Skill center
70 Livelihood support Livelihood Thoothukudi Thoothukudi - 0.06 - 0.06 Direct71 Sports Sports
DevelopmentThoothukudi Thoothukudi 0.20 0.17 - 0.17 Direct
72 Women Resource Center Women Empowerment
Thoothukudi Thoothukudi 3.72 0.34 - 0.34 Thulasi social trust/Bell education and women empowerment society/Dhaayagam social welfare trust)
73 Infrastructure development
Rural Development
Thoothukudi Thoothukudi 1.00 0.82 - 0.82 Direct
74 Drinking water Drinking water Thoothukudi Thoothukudi 1.30 0.90 - 0.90 Vijay enterprises, Sri sudalai enterprises, Liya francis aqua water
75 Model village Model village Thoothukudi Thoothukudi 1.00 - - - NA76 Audit, Study and others Programme &
AdminThoothukudi Thoothukudi 2.55 0 0.23 0.23 NA
77 Cultural Cultural Development
Thoothukudi Thoothukudi - 0.08 - 0.08 Direct
Sub-Total 41.03 11.95 0.23 12.18
INTEGRATED REPORT
06-115MANAGEMENT REVIEW
116-167STATUTORY REPORTS
168-270FINANCIAL STATEMENTS
271-502
196 VEDANTA LIMITED INTEGRATED REPORT AND ANNUAL ACCOUNTS 2019-20 VEDANTA LIMITED INTEGRATED REPORT AND ANNUAL ACCOUNTS 2019-20 197

Vedanta Limited – Cairn, Oil & Gas
Sl. No.
CSR Project or Activity Identified
Sector in which the project is covered
Project or Programme
Amount Outlay*
Amount Spent* Cumulative Spend till reporting
period
Amount Spent, Direct or implementing agencyArea Name of District Direct Overheads
78 Swasthya Saarthi (Mobile Health Van) in Rajasthan and Gujarat
Healthcare Rajasthan Barmer, Jalore, Patan, Dwarka, Radhanpur, Jamnagar, Rajkot, Banaskantha, Bhogat, Ahmedabad
4.02 2.91 - 2.91 Wockhardt Foundation, Helpage India and Dhara Sansthan funds routed through Cairn Foundation
79 Project Navkiran (Functionalisation of FRUs for better maternal and child care)
Healthcare Rajasthan Barmer 2.03 0.55 - 0.55 IPE Global, RACHNA
80 NRM and Farm Based Interventions in Barmer (Barmer Unnati)
Agriculture & Animal Husbandry
Rajasthan Barmer and Jalore
3.80 2.15 - 2.15 BAIF and BJSS
81 Green City project Community Infrastructure Development
Rajasthan Barmer 5.07 0.22 - 0.22 Anil Construction Company, Design Shapers, Amrit Lal Khatri, and BJSS
82 Project Tamana (Supporting differently bled children)
Children Wellbeing & Education
Gurgaon Delhi 0.26 0.35 - 0.35 Tamana
83 Shifting of 32 old RO plants
Drinking Water & Sanitation
Rajasthan Barmer and Jalore
1.96 1.59 - 1.59 Swajal
84 Support to Barmer District Hospital (3 Specialist doctors and 62 housekeepers) and Ambulance
Healthcare Rajasthan Barmer 4.37 2.12 - 2.12 Barmer Jan Sewa Samiti and Care India
85 Green Belt Maintenance Environment & Sustainability
Gurgaon Barmer 0.15 0.02 - 0.02 Nimbus Harbor
86 Skill development in CEC and CCoE in Rajasthan
Skill Development
Rajasthan Barmer, Jalore and Jodhpur
8.44 2.98 - 2.98 SEEDS and Nettur Technical Training Foundation, Mohangarh Engineering Construction Co. (MECC), Adfactor and TATA AIG Insurance
87 Project Nandghar (Green & brown field)
Children Wellbeing & Education
Rajasthan Barmer 4.45 2.14 - 2.14 CHETNA and Gujarat CSR Authority
88 Project Impact & Research
Children Wellbeing & Education, Agriculture and Animal Husbandry, Skill Development, Healthcare etc.
Rajasthan, Gujarat, Andhra Pradesh and Delhi
East Godavari (AP), Barmer, Jalore (Rajasthan), Patan, Dwarka, Radhanpur, Jamnagar, Rajkot, Banaskantha, Bhogat, Ahmedabad (Gujarat) and Delhi
2.00 1.27 - 1.27 NRMC
Vedanta Limited – Cairn, Oil & Gas
Sl. No.
CSR Project or Activity Identified
Sector in which the project is covered
Project or Programme
Amount Outlay*
Amount Spent* Cumulative Spend till reporting
period
Amount Spent, Direct or implementing agencyArea Name of District Direct Overheads
89 Jeevan Amrit (Safe Drinking Water)
Drinking Water & Sanitation
Rajasthan Barmer and Jalore
7.58 1.06 - 1.06 Waterlife, Ultrathon Electrics
90 Maru Sagar (Dairy Development) in Barmer
Agriculture & Animal Husbandry
Rajasthan Barmer 0.52 0.65 - 0.65 Society to Uplift Rural Economy (SURE)
91 Support to Primary Health Centre (S'yanam) – Support of medical staffs
Healthcare Andhra Pradesh
East Godavari 0.27 0.41 - 0.41 District Health Department
92 Annual CSR Contribution towards Rural Development projects in East Godavari
Community Infrastructure development
Andhra Pradesh
East Godavari 2.00 2.00 - 2.00 District Administration, East Godavari
93 School Sanitation Project (Improving sanitation & drinking water facilities in 28 schools)
Children Wellbeing & Education
Rajasthan Barmer and Jalore
- 0.22 - 0.22 Yuva Unstoppable
94 Cairn Pink City Half Marathon (4th Edition) focused on fitness & health programs in Barmer & Jaipur
Sports & Culture Rajasthan Barmer and Jaipur
0.30 0.50 - 0.50 GT healthcare Trust and 67th
AIP Wrestling Cluster 2018
95 Maru Samvad Project (IEC through community threatre tool)
IEC & Days of National Importance & Relief
Rajasthan Barmer - 0.16 - 0.16 BNKVS Group of Theatre Society
96 Contribution to Chief Minister's Relief Funds (Assam Flood)
IEC & Days of National Importance & Relief
Assam Assam - 0.02 - 0.02 Govt. of Assam
97 Shifting of Solar Mini Grid Plant from Rawatsar to CEC, Barmer and Solar Power back Up for Kawas RO Plant in Barmer
Environment & Sustainability
Rajasthan Barmer - 0.04 - 0.04 Sun Shakti Solar Systems and Ultrathon Electric
98 Project Divyang (Support to 10 Indian Para athletes from Rajasthan and Gujarat)
Sports & Culture Rajasthan & Gujarat
0.25 0.32 - 0.32 Paralympic Committee of India
99 Community Helpdesk Project to link communities to Govt. Safety nets and schemes
IEC & Days of National Importance & Relief
Gujarat Ahmedabad - 0.12 - 0.12 Gujarat CSR Authority
100 Education Project (Improving the learning outcomes of students in 20 govt schools in Rajasthan and 33 schools in Gujarat)
Children Wellbeing & Education
Rajasthan Barmer and Ahmedabad
1.88 2.88 - 2.88 Bodh Shiksha Samiti and Yuva Unstoppable
INTEGRATED REPORT
06-115MANAGEMENT REVIEW
116-167STATUTORY REPORTS
168-270FINANCIAL STATEMENTS
271-502
198 VEDANTA LIMITED INTEGRATED REPORT AND ANNUAL ACCOUNTS 2019-20 VEDANTA LIMITED INTEGRATED REPORT AND ANNUAL ACCOUNTS 2019-20 199

Vedanta Limited – Cairn, Oil & Gas
Sl. No.
CSR Project or Activity Identified
Sector in which the project is covered
Project or Programme
Amount Outlay*
Amount Spent* Cumulative Spend till reporting
period
Amount Spent, Direct or implementing agencyArea Name of District Direct Overheads
101 Support to 67th All India Police Wrestling Cluster for promotion of Rural Sports and Other projects
Sports & Culture
Rajasthan Jaipur 2.00 0.06 - 0.06 67th AIP Wrestling Cluster 2018
102 CSR Audit and Consultancy
Programme Admin
Rajasthan Barmer, Jalore, Patan, Dwarka, Radhanpur, Jamnagar, Rajkot, Banaskantha, Bhogat, Ahmedabad, S.Yanam, Delhi
0.60 - 0.56 0.56 Subhash Mittal Associates, KPMG, TR Chadha, Nyati Mundra, Cairn Foundation and Nimbus
103 Misc. Projects (CSR Award – CSR Health Impact Award, CII Sustainability Award, Application fee, Zee Business CSR Award, India CSR Award), CSR films
Programme Admin
Rajasthan - 0.10 - 0.04 0.04 Blue Pen Media, Fun & Joy, Registrar Trademark and The Print Hub
104 CSR Studies and Digitilisation
Programme Admin
Assam, Rajasthan, Gujarat, Andhra Pradesh and Delhi
East Godavari (AP), Jorhat in Assam, Barmer, Jalore, Patan, Dwarka, Radhanpur, Jamnagar, Rajkot, Banaskantha, Bhogat, Ahmedabad, S.Yanam, Delhi
0.95 - 1.04 1.04 NRMC, Goodera
105 Salary Programme Admin
Rajasthan, Gujarat, Andhra Pradesh and Delhi
- 3.20 - - -
Sub-Total 56.20 24.72 1.64 26.36 Total 137.18 49.91 2.74 52.66
*Difference in sum of activity wise expenditure and total expenditure is due to round off of activity wise figures.
ANNEXURE BDisclosure in Directors’ report as per provisions of Section 197 of the Companies Act, 2013 read with Rule 5(1) of the Companies (Appointment and Remuneration of Managerial Personnel) Rules, 2014
Sl. No. Requirement
DisclosureName of the Director Category Ratio
1 Ratio of the remuneration of each director to the median remuneration of the employees of the Company for the financial year
Navin Agarwal(1) Executive Chairman 263.37Srinivasan Venkatakrishnan(2) (Ceased to be Director w.e.f. close of business hours on April 5, 2020)
Whole-Time Director & Chief Executive Officer
180.19
GR Arun Kumar Whole-Time Director & Chief Financial Officer
89.70
Aman Mehta (Ceased to be an Independent Director w.e.f. May 17, 2020)
Independent Director 12.97
K Venkataramanan Independent Director 12.43Lalita D Gupte Independent Director 13.20Mahendra Kumar Sharma Independent Director 10.96Ravi Kant (Ceased to be an Independent Director w.e.f. June 1, 2020)
Independent Director 2.16
UK Sinha Independent Director 12.97Tarun Jain (Ceased to be a Director w.e.f. April 1, 2020)
Non-Executive Director 46.93
Priya Agarwal Non-Executive Director 12.20
Name CategoryIncrement
Percentage
2 Percentage increase in remuneration of each director, Chief Financial Officer, Chief Executive Officer, Company Secretary or Manager, if any, in the financial year
Navin Agarwal Executive Chairman 0%Srinivasan Venkatakrishnan (Ceased to be Director w.e.f. close of business hours on April 5, 2020)
Whole-Time Director & Chief Executive Officer
0%
GR Arun Kumar Whole-Time Director & Chief Financial Officer
15%
Prerna Halwasiya Company Secretary & Compliance Officer
15%
3 Percentage increase in the median remuneration of employees in the financial year
The median remuneration of the employees in the financial year was increased by 3.15%
4 Number of permanent employees on the rolls of Company
There were 9,405 employees of Vedanta Limited as on March 31, 2020
5 Average percentile increase already made in the salaries of employees other than the managerial personnel in the last financial year and its comparison with the percentile increase in the managerial remuneration and justification thereof and point out if there are any exceptional circumstances for increase in the managerial remuneration
Average increment in FY 2019-20 for Managerial Personnel (M4 and Above): 8.26% Average Increment in FY 2019-20 for Non-Managerial Personnel (M5 and Below): 9.20% No exceptional increase given in the managerial remuneration
6 Affirmation that the remuneration is as per the remuneration policy of the Company
Yes
Notes:1.� �The ratio inclusive of remuneration received from Vedanta Resources Limited, UK, the Holding Company, for Mr. Navin
Agarwal is 275.19.2.� �The ratio inclusive of remuneration received from Vedanta Resources Limited, UK, the Holding Company, for Mr. Srinivasan
Venkatakrishnan is 405.45.
INTEGRATED REPORT
06-115MANAGEMENT REVIEW
116-167STATUTORY REPORTS
168-270FINANCIAL STATEMENTS
271-502
200 VEDANTA LIMITED INTEGRATED REPORT AND ANNUAL ACCOUNTS 2019-20 VEDANTA LIMITED INTEGRATED REPORT AND ANNUAL ACCOUNTS 2019-20 201

ANNEXURE CFORM NO. MGT-9EXTRACT OF ANNUAL RETURNas on the financial year ended on March 31, 2020[Pursuant to Section 92(3) of the Companies Act, 2013 and Rule 12(1) of the Companies (Management and Administration) Rules, 2014]
I. REGISTRATION AND OTHER DETAILS:
1. CIN L13209MH1965PLC2913942. Registration Date June 25, 19653. Name of the Company Vedanta Limited4. Category/Sub-Category of the Company Public Listed Company5. Address of the Registered office and
contact details1st Floor, ‘C’ Wing, Unit 103, Corporate Avenue, Atul Projects, Chakala, Andheri (East), Mumbai – 400 093, MaharashtraE-mail ID : [email protected]: +91 22 6643 4500Fax: +91 22 6643 4530Website: www.vedantalimited.com
6. Whether listed company Yes7. Name, Address and Contact details of
Registrar and Transfer Agent, if anyKFin Technologies Private Limited (Erstwhile Karvy Fintech Private Limited)Selenium Building, Tower-B, Plot No.31-32, Gachibowli,Financial District, Nanakramguda, Serilingampally, Hyderabad, Rangareddi - 500 032, Telangana, IndiaEmail id: [email protected]: +91 40 3321 1000 / 6716 2222Fax: +91 40 2331 1968Website: www.kfintech.com
II. PRINCIPAL BUSINESS ACTIVITIES OF THE COMPANY All the business activities contributing 10% or more of the total turnover of the Company shall be stated:-
Sl. No. Name and Description of main products / services
NIC Code of the Product/service
% to total turnover of the Company
1. Copper & Copper products 24201 16.702. Aluminum & Aluminum products 24202 54.083. Extraction of crude petroleum / Extraction of natural gas 0610 / 0620 18.84
III. PARTICULARS OF HOLDING, SUBSIDIARY AND ASSOCIATE COMPANIESSl. No. Name of the Company* Registered Office CIN / GLN
Holding/ Subsidiary/Associate
% shares held
Applicable Section
1 Twin Star Holding Limited
C/o IQ EQ Corporate Services (Mauritius) Ltd33, Edith Cavell Street, Port Louis, 11324, Mauritius
- Holding Company 37.11 2(46)
2 Finsider International Company Limited
30 Berkeley SquareLondon, W1J 6EX
- Holding Company 10.80 2(46)
3 Westglobe Limited C/o IQ EQ Corporate Services (Mauritius) Ltd33, Edith Cavell Street, Port Louis, 11324, Mauritius
- Holding Company 1.19 2(46)
4 Welter Trading Limited 205, 28th Oktovriou Avenue, Louloupsi Court, 1st Floor, P.C. 3035, Limassol, Cyprus, P.O. Box 51625, 3507, Limassol, Cyprus
- Holding Company 1.03 2(46)
Note:* All the above entities are subsidiaries of Volcan Investment Limited, the ultimate Holding Company.
SUBSIDIARIES
Sl. No. Name of the Company Address of the Company CIN / GLN
Holding/Subsidiary/Associate
% shares
heldApplicable
Section
1 Hindustan Zinc Limited Yashad Bhavan, Yashadgarh, Udaipur, Rajasthan – 313 004
L27204RJ1966PLC001208 Subsidiary 64.92% 2(87)
2 Bharat Aluminium Company Limited
Aluminium Sadan, Core -6, Scope Office Complex, 7 Lodhi Road, New Delhi – 110 003
U74899DL1965PLC004518 Subsidiary 51% 2(87)
3 MALCO Energy Limited SIPCOT Industrial Complex, Madurai Bypass Road, T.V. Puram P.O. Tuticorin, Tami Nadu – 628 002
U31300TN2001PLC069645 Subsidiary 100% 2(87)
4 Copper Mines of Tasmania Pty Limited
Norton Rose Fulbright Australia, Grosvenor Place, Level 16, 225 George Street, Sydney, NSW, Australia
- Subsidiary 100% 2(87)
5 Thalanga Copper Mines Pty Limited
Norton Rose Fulbright Australia, Grosvenor Place, Level 16, 225 George Street, Sydney, NSW, Australia
- Subsidiary 100% 2(87)
6 Monte Cello B.V. Strawinskylaan 1143, C-11, 1077 XX Amsterdam, the Netherlands
- Subsidiary 100% 2(87)
7 Talwandi Sabo Power Limited
Village Banawala, Mansa-Talwandi Sabo Road, Mansa, Punjab – 151 302
L40101PB2007PLC031035 Subsidiary 100% 2(87)
8 Sesa Resources Limited Sesa Ghor, 20 EDC Complex, Patto, Panaji, Goa – 403 001
U13209GA1965PLC000030 Subsidiary 100% 2(87)
9 Sesa Mining Corporation Limited
Sesa Ghor, 20 EDC Complex, Patto, Panaji, Goa – 403 001
U13209GA1969PLC000091 Subsidiary 100% 2(87)
10 Sterlite Ports Limited MALCO Power Company Limited, SIPCOT Industrial Complex, Madurai, By Pass Road, Tuticorin, Thoothukudi, Tamil Nadu – 628 002
U40109TN2010PLC084216 Subsidiary 100% 2(87)
11 Maritime Ventures Private Limited
SIPCOT Industrial Complex, Madurai By Pass Road, T V Puram PO, Tuticorin, Thoothukudi, Tamil Nadu – 628 002
U61200TN2013PTC091762 Subsidiary 100% 2(87)
12 Goa Sea Port Private Limited
SIPCOT Industrial Complex, Madurai By Pass Road, T V Puram PO, Tuticorin, Thoothukudi, Tamil Nadu – 628 002
U63000TN2016PTC111287 Subsidiary 100% 2(87)
13 Vizag General Cargo Berth Private Limited
SIPCOT Industrial Complex, Madurai By Pass Road, T V Puram PO, Tuticorin, Thoothukudi, Tamil Nadu – 628 002
U35100TN2010PTC075408 Subsidiary 100% 2(87)
14 Paradip Multi Cargo Berth Private Limited
SIPCOT Industrial Complex, Madurai By Pass Road, T V Puram PO, Tuticorin, Thoothukudi, Tamil Nadu – 628 002
U35100TN2011PTC079116 Subsidiary 100% 2(87)
15 Bloom Fountain Limited C/o IQ EQ Corporate Services Mauritius Ltd, 33, Edith Cavell Street, 11324, Port Louis, Mauritius
- Subsidiary 100% 2(87)
16 Western Clusters Limited Amir Building 18th Street (Corner of Tubman Boulevard), Sinkor, Monorvia, Liberia, West Africa
- Subsidiary 100% 2(87)
17 Sterlite (USA) Inc.* 251, Little Falls Drive, Wilmington, Delaware, New Castle, Delaware – 19808
- Subsidiary 100% 2(87)
18 Fujairah Gold FZC PO Box 3992, Fujairah Free Zone II, Fujairah, UAE
- Subsidiary 100% 2(87)
19 THL Zinc Ventures Limited C/o IQ EQ Corporate Services Mauritius Ltd, 33, Edith Cavell Street, 11324, Port-Louis, Mauritius
- Subsidiary 100% 2(87)
20 THL Zinc Limited C/o IQ EQ Corporate Services Mauritius Ltd, 33, Edith Cavell Street, 11324, Port-Louis, Mauritius
- Subsidiary 100% 2(87)
INTEGRATED REPORT
06-115MANAGEMENT REVIEW
116-167STATUTORY REPORTS
168-270FINANCIAL STATEMENTS
271-502
202 VEDANTA LIMITED INTEGRATED REPORT AND ANNUAL ACCOUNTS 2019-20 VEDANTA LIMITED INTEGRATED REPORT AND ANNUAL ACCOUNTS 2019-20 203

SUBSIDIARIES
Sl. No. Name of the Company Address of the Company CIN / GLN
Holding/Subsidiary/Associate
% shares
heldApplicable
Section
21 THL Zinc Holding B.V. Strawinskylaan 1143, C-11, 1077 XX Amsterdam, the Netherlands
- Subsidiary 100% 2(87)
22 THL Zinc Namibia Holdings (Proprietary) Limited
24 Orban Street Klein Windhoek Windhoek, Namibia
- Subsidiary 100% 2(87)
23 Skorpion Zinc (Proprietary) Limited
24 Orban Street Klein Windhoek Windhoek, Namibia
- Subsidiary 100% 2(87)
24 Skorpion Mining Company (Proprietary) Limited
24 Orban Street Klein Windhoek Windhoek, Namibia
- Subsidiary 100% 2(87)
25 Namzinc (Proprietary) Limited
24 Orban Street Klein Windhoek Windhoek, Namibia
- Subsidiary 100% 2(87)
26 Amica Guesthouse (Proprietary) Limited
24 Orban Street Klein Windhoek Windhoek, Namibia
- Subsidiary 100% 2(87)
27 Black Mountain Mining (Proprietary) Limited
1 Penge Road, Aggeneys, Northern Cape, 8893
- Subsidiary 74% 2(87)
28 Vedanta Lisheen Holdings Limited
Deloitte & Touche House, Charlotte’s Quay, Limerick, Ireland
- Subsidiary 100% 2(87)
29 Vedanta Lisheen Mining Limited
Deloitte & Touche House, Charlotte’s Quay, Limerick, Ireland
- Subsidiary 100% 2(87)
30 Killoran Lisheen Mining Limited
Deloitte & Touche House, Charlotte’s Quay, Limerick, Ireland
- Subsidiary 100% 2(87)
31 Killoran Lisheen Finance Limited
Deloitte & Touche House, Charlotte’s Quay, Limerick, Ireland
- Subsidiary 100% 2(87)
32 Lisheen Milling Limited Deloitte & Touche House, Charlotte’s Quay, Limerick, Ireland
- Subsidiary 100% 2(87)
33 Vedanta Exploration Ireland Limited
Deloitte & Touche House, Charlotte’s Quay, Limerick, Ireland
- Subsidiary 100% 2(87)
34 Lisheen Mine Partnership Deloitte & Touche House, Charlotte’s Quay, Limerick, Ireland
- Subsidiary 100% 2(87)
35 Lakomasko BV Strawinskylaan 1143, C-11, 1077 XX Amsterdam, the Netherlands
- Subsidiary 100% 2(87)
36 Cairn India Holdings Limited
4th Floor, St Paul's Gate, 22-24 New Street St Helier, Jersey, JE1 4TR
- Subsidiary 100% 2(87)
37 Cairn Energy Hydrocarbons Limited
4th Floor, 115 George Street, Edinburg, United Kingdom, EH2 4JN
- Subsidiary 100% 2(87)
38 Cairn Exploration (No.2) Limited*
4th Floor, 115 George Street, Edinburg, United Kingdom, EH2 4JN
- Subsidiary 100% 2(87)
39 Cairn Energy Gujarat Block 1 Limited
4th Floor, 115 George Street, Edinburg, United Kingdom, EH2 4JN
- Subsidiary 100% 2(87)
40 Cairn Energy Discovery Limited*
4th Floor, 115 George Street, Edinburg, United Kingdom, EH2 4JN
- Subsidiary 100% 2(87)
41 Cairn Energy India Pty Limited
Vistra (Australia) Pty Ltd, Level 6 8 West Street North Sydney NSW 2060
- Subsidiary 100% 2(87)
42 CIG Mauritius Holdings Private Limited
Ocorian Corporate Services (Mauritius) Limited, 6th Floor, Tower A, 1 Cyber City, Ebene, Mauritius
- Subsidiary 100% 2(87)
43 CIG Mauritius Private Limited
Ocorian Corporate Services (Mauritius) Limited, 6th Floor, Tower A, 1 Cyber City, Ebene, Mauritius
- Subsidiary 100% 2(87)
44 Cairn Lanka (Pvt) Ltd Lanka Shipping Tower, No.99, St. Michael’s Road, Colombo 03
- Subsidiary 100% 2(87)
45 Cairn South Africa Proprietary Limited*
22, Bree Street, Cape Town, 8001, South Africa
- Subsidiary 100% 2(87)
SUBSIDIARIES
Sl. No. Name of the Company Address of the Company CIN / GLN
Holding/Subsidiary/Associate
% shares
heldApplicable
Section
46 Avanstrate Inc. (ASI) 1-11-1, Nishi - Gotanda, Shinagwa-Ku, Tokyo, Japan
- Subsidiary 51.63% 2(87)
47 Avanstrate (Korea) Inc. 84, Hyeongoksandan-ro, Cheongbuk-eup, Pyeongtaek-si, Gyeonggi-do, 17812, Republic of Korea
- Subsidiary 51.63% 2(87)
48 Avanstrate (Taiwan) Inc. No.8, Industry III Road Annan, Tainan 709-55, Taiwan, R.O.C.
- Subsidiary 51.63% 2(87)
49 Electrosteel Steels Limited (2)
801, Uma Shanti Apartments, Kanke Road, Ranchi, Jharkhand – 834 008
U27310JH2006PLC012663 Subsidiary 95.49% 2(87)
Notes:*Under liquidation;** Twinstar Energy Holding Limited, Twinstar Mauritius Holding Limited and Sesa Sterlite Mauritius Holdings Limited liquidated during the year.1.� The Group also has interest in certain trusts which are neither significant nor material to the Group.2.� Vedanta Star Limited, subsidiary of the Company has been merged with Electrosteel Steels Limited w.e.f. March 25, 2020.
ASSOCIATE
Sl. No. Name of the Company Address of the Company CIN / GLN
Holding/Subsidiary/Associate
% shares
heldApplicable
Section
1 RoshSkor Township (Pty) Ltd
24 Orban Street, Klein Windhoek, Windhoek, Namibia
- Associate 50% 2(6)
2 Gaurav Overseas Private Limited
3rd Floor, Court House, Lokmanya Tilak Marg, Dhobi Talao, Mumbai – 400 002, Maharashtra
U45200MH1989PTC052534 Associate 50% 2(6)
3 Goa Maritime Private Limited
5th Floor, Sesa Ghor 20, EDC Complex, Patto, Panaji, North Goa – 403 001
U61200GA2003PTC003250 Associate 50% 2(6)
4 Madanpur South Coal Company Limited
Vanijya Bhawan, Sai Nagar, Devendra Nagar Road, Raipur – 492 001
U10300CT2006PLC020006 Associate 17.62% 2(6)
5 Rampia Coal Mine and Energy Private Limited*
Plot No. 43, BDA Colony, Gangadhar Meher Marg, Jayadev Vihar, Bhubaneshwar, Khordha, Odisha – 751 013
U10101OR2008PTC009827 Associate 17.39% 2(6)
6 Rosh Pinah Health Care (Proprietary) Limited
7 Von Lindeque Street Mariental, Namibia - Associate 69% 2(6)
Notes:*Action initiated for striking-off.
INTEGRATED REPORT
06-115MANAGEMENT REVIEW
116-167STATUTORY REPORTS
168-270FINANCIAL STATEMENTS
271-502
204 VEDANTA LIMITED INTEGRATED REPORT AND ANNUAL ACCOUNTS 2019-20 VEDANTA LIMITED INTEGRATED REPORT AND ANNUAL ACCOUNTS 2019-20 205
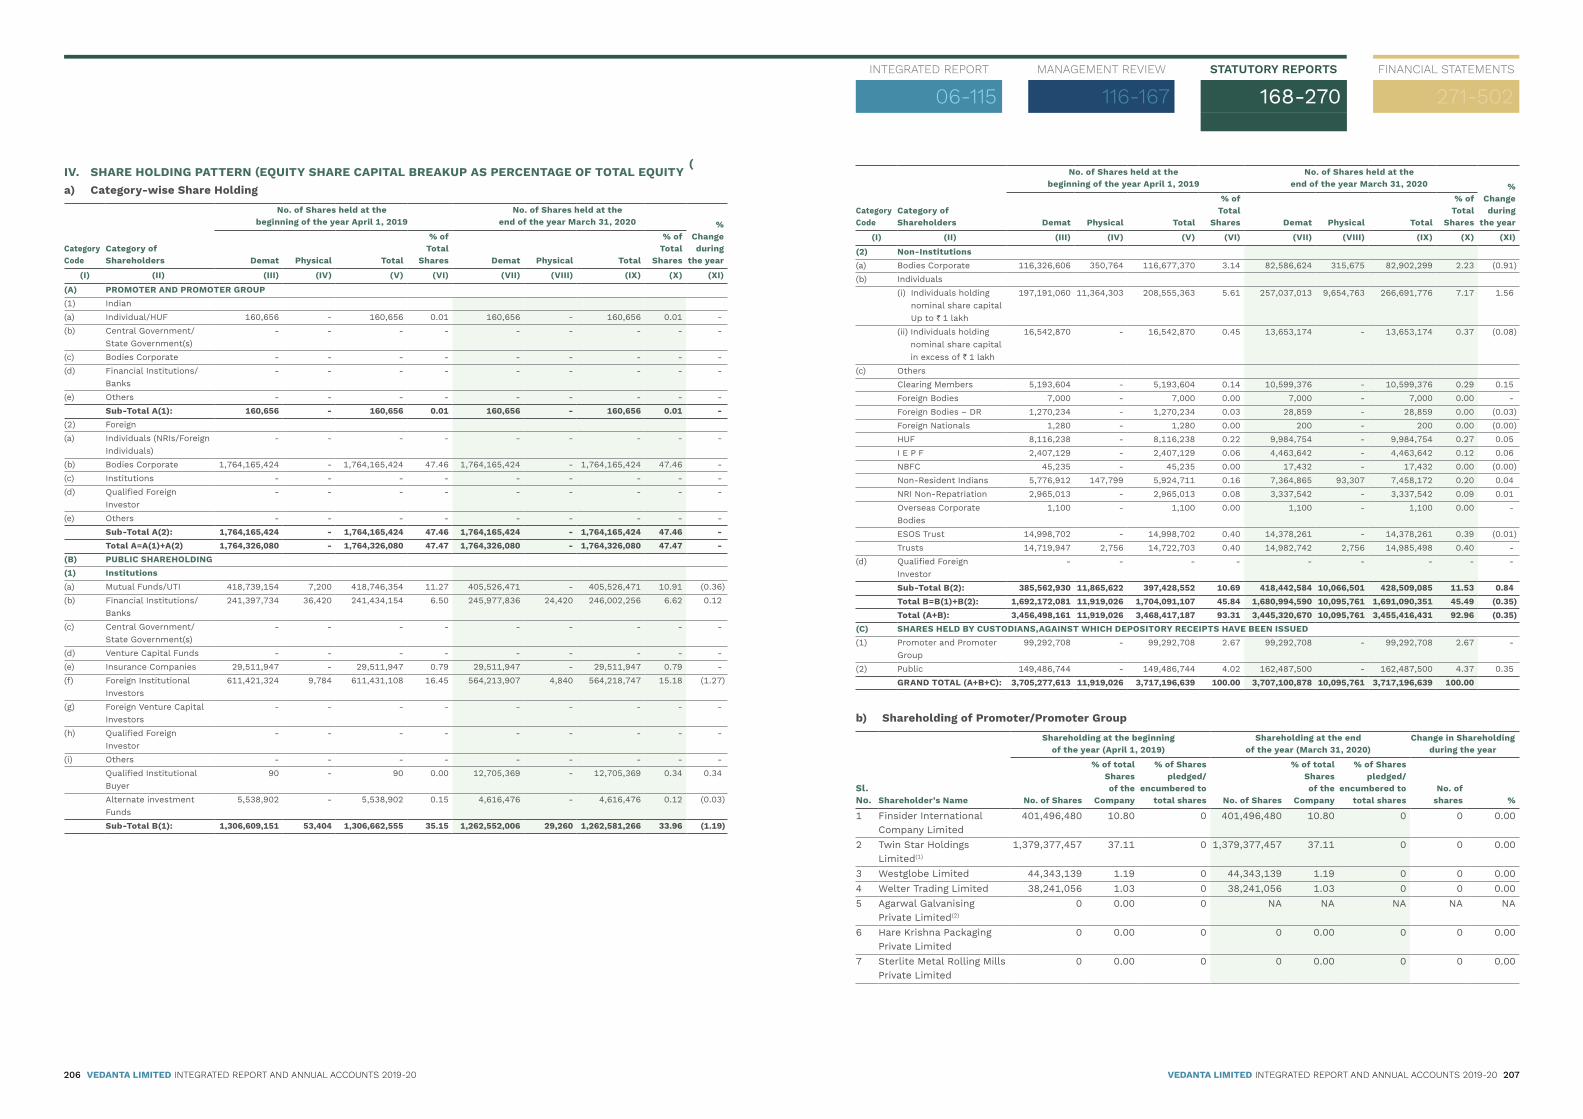
IV. SHARE HOLDING PATTERN (EQUITY SHARE CAPITAL BREAKUP AS PERCENTAGE OF TOTAL EQUITY)a) Category-wise Share Holding
Category Code
Category of Shareholders
No. of Shares held at thebeginning of the year April 1, 2019
No. of Shares held at the end of the year March 31, 2020 %
Changeduring
the yearDemat Physical Total
% ofTotal
Shares Demat Physical Total
% ofTotal
Shares
(I) (II) (III) (IV) (V) (VI) (VII) (VIII) (IX) (X) (XI)
(A) PROMOTER AND PROMOTER GROUP(1) Indian(a) Individual/HUF 160,656 - 160,656 0.01 160,656 - 160,656 0.01 -(b) Central Government/
State Government(s)- - - - - - - - -
(c) Bodies Corporate - - - - - - - - -(d) Financial Institutions/
Banks- - - - - - - - -
(e) Others - - - - - - - - -Sub-Total A(1): 160,656 - 160,656 0.01 160,656 - 160,656 0.01 -
(2) Foreign(a) Individuals (NRIs/Foreign
Individuals)- - - - - - - - -
(b) Bodies Corporate 1,764,165,424 - 1,764,165,424 47.46 1,764,165,424 - 1,764,165,424 47.46 -(c) Institutions - - - - - - - - -(d) Qualified Foreign
Investor- - - - - - - - -
(e) Others - - - - - - - - -Sub-Total A(2): 1,764,165,424 - 1,764,165,424 47.46 1,764,165,424 - 1,764,165,424 47.46 -Total A=A(1)+A(2) 1,764,326,080 - 1,764,326,080 47.47 1,764,326,080 - 1,764,326,080 47.47 -
(B) PUBLIC SHAREHOLDING(1) Institutions(a) Mutual Funds/UTI 418,739,154 7,200 418,746,354 11.27 405,526,471 - 405,526,471 10.91 (0.36)(b) Financial Institutions/
Banks241,397,734 36,420 241,434,154 6.50 245,977,836 24,420 246,002,256 6.62 0.12
(c) Central Government/ State Government(s)
- - - - - - - - -
(d) Venture Capital Funds - - - - - - - - -(e) Insurance Companies 29,511,947 - 29,511,947 0.79 29,511,947 - 29,511,947 0.79 -(f) Foreign Institutional
Investors611,421,324 9,784 611,431,108 16.45 564,213,907 4,840 564,218,747 15.18 (1.27)
(g) Foreign Venture Capital Investors
- - - - - - - - -
(h) Qualified Foreign Investor
- - - - - - - - -
(i) Others - - - - - - - - -Qualified Institutional Buyer
90 - 90 0.00 12,705,369 - 12,705,369 0.34 0.34
Alternate investment Funds
5,538,902 - 5,538,902 0.15 4,616,476 - 4,616,476 0.12 (0.03)
Sub-Total B(1): 1,306,609,151 53,404 1,306,662,555 35.15 1,262,552,006 29,260 1,262,581,266 33.96 (1.19)
Category Code
Category of Shareholders
No. of Shares held at thebeginning of the year April 1, 2019
No. of Shares held at the end of the year March 31, 2020 %
Changeduring
the yearDemat Physical Total
% ofTotal
Shares Demat Physical Total
% ofTotal
Shares
(I) (II) (III) (IV) (V) (VI) (VII) (VIII) (IX) (X) (XI)
(2) Non-Institutions(a) Bodies Corporate 116,326,606 350,764 116,677,370 3.14 82,586,624 315,675 82,902,299 2.23 (0.91)(b) Individuals
(i) �Individuals holding nominal share capital Up to ` 1 lakh
197,191,060 11,364,303 208,555,363 5.61 257,037,013 9,654,763 266,691,776 7.17 1.56
(ii) �Individuals holding nominal share capital in excess of ` 1 lakh
16,542,870 - 16,542,870 0.45 13,653,174 - 13,653,174 0.37 (0.08)
(c) OthersClearing Members 5,193,604 - 5,193,604 0.14 10,599,376 - 10,599,376 0.29 0.15Foreign Bodies 7,000 - 7,000 0.00 7,000 - 7,000 0.00 -Foreign Bodies – DR 1,270,234 - 1,270,234 0.03 28,859 - 28,859 0.00 (0.03)Foreign Nationals 1,280 - 1,280 0.00 200 - 200 0.00 (0.00)HUF 8,116,238 - 8,116,238 0.22 9,984,754 - 9,984,754 0.27 0.05I E P F 2,407,129 - 2,407,129 0.06 4,463,642 - 4,463,642 0.12 0.06NBFC 45,235 - 45,235 0.00 17,432 - 17,432 0.00 (0.00)Non-Resident Indians 5,776,912 147,799 5,924,711 0.16 7,364,865 93,307 7,458,172 0.20 0.04NRI Non-Repatriation 2,965,013 - 2,965,013 0.08 3,337,542 - 3,337,542 0.09 0.01Overseas Corporate Bodies
1,100 - 1,100 0.00 1,100 - 1,100 0.00 -
ESOS Trust 14,998,702 - 14,998,702 0.40 14,378,261 - 14,378,261 0.39 (0.01)Trusts 14,719,947 2,756 14,722,703 0.40 14,982,742 2,756 14,985,498 0.40 -
(d) Qualified Foreign Investor
- - - - - - - - -
Sub-Total B(2): 385,562,930 11,865,622 397,428,552 10.69 418,442,584 10,066,501 428,509,085 11.53 0.84Total B=B(1)+B(2): 1,692,172,081 11,919,026 1,704,091,107 45.84 1,680,994,590 10,095,761 1,691,090,351 45.49 (0.35)Total (A+B): 3,456,498,161 11,919,026 3,468,417,187 93.31 3,445,320,670 10,095,761 3,455,416,431 92.96 (0.35)
(C) SHARES HELD BY CUSTODIANS,AGAINST WHICH DEPOSITORY RECEIPTS HAVE BEEN ISSUED(1) Promoter and Promoter
Group99,292,708 - 99,292,708 2.67 99,292,708 - 99,292,708 2.67 -
(2) Public 149,486,744 - 149,486,744 4.02 162,487,500 - 162,487,500 4.37 0.35GRAND TOTAL (A+B+C): 3,705,277,613 11,919,026 3,717,196,639 100.00 3,707,100,878 10,095,761 3,717,196,639 100.00
b) Shareholding of Promoter/Promoter Group
Sl. No. Shareholder’s Name
Shareholding at the beginning of the year (April 1, 2019)
Shareholding at the end of the year (March 31, 2020)
Change in Shareholding during the year
No. of Shares
% of total Shares of the
Company
% of Shares pledged/
encumbered to total shares No. of Shares
% of total Shares of the
Company
% of Shares pledged/
encumbered to total shares
No. of shares %
1 Finsider International Company Limited
401,496,480 10.80 0 401,496,480 10.80 0 0 0.00
2 Twin Star Holdings Limited(1)
1,379,377,457 37.11 0 1,379,377,457 37.11 0 0 0.00
3 Westglobe Limited 44,343,139 1.19 0 44,343,139 1.19 0 0 0.004 Welter Trading Limited 38,241,056 1.03 0 38,241,056 1.03 0 0 0.005 Agarwal Galvanising
Private Limited(2)
0 0.00 0 NA NA NA NA NA
6 Hare Krishna Packaging Private Limited
0 0.00 0 0 0.00 0 0 0.00
7 Sterlite Metal Rolling Mills Private Limited
0 0.00 0 0 0.00 0 0 0.00
INTEGRATED REPORT
06-115MANAGEMENT REVIEW
116-167STATUTORY REPORTS
168-270FINANCIAL STATEMENTS
271-502
206 VEDANTA LIMITED INTEGRATED REPORT AND ANNUAL ACCOUNTS 2019-20 VEDANTA LIMITED INTEGRATED REPORT AND ANNUAL ACCOUNTS 2019-20 207

Sl. No. Shareholder’s Name
Shareholding at the beginning of the year (April 1, 2019)
Shareholding at the end of the year (March 31, 2020)
Change in Shareholding during the year
No. of Shares
% of total Shares of the
Company
% of Shares pledged/
encumbered to total shares No. of Shares
% of total Shares of the
Company
% of Shares pledged/
encumbered to total shares
No. of shares %
8 Richter Holdings Limited, Cyprus
0 0.00 0 0 0.00 0 0 0.00
9 Vedanta Resources Cyprus Limited
0 0.00 0 0 0.00 0 0 0.00
10 Vedanta Resources Holdings Limited
0 0.00 0 0 0.00 0 0 0.00
11 Vedanta Finance UK Limited
0 0.00 0 0 0.00 0 0 0.00
12 Monte Cello NV Netherlands
0 0.00 0 0 0.00 0 0 0.00
13 Vedanta Resources Limited, UK (Earlier Vedanta Resources Plc)
0 0.00 0 0 0.00 0 0 0.00
14 Vedanta Resources Finance Limited
0 0.00 0 0 0.00 0 0 0.00
15 Vedanta Resources Finance II Plc
0 0.00 0 0 0.00 0 0 0.00
16 Anil Agarwal Discretionary Trust
0 0.00 0 0 0.00 0 0 0.00
17 Conclave PTC Limited 0 0.00 0 0 0.00 0 0 0.0018 Volcan Investments
Limited0 0.00 0 0 0.00 0 0 0.00
19 Ankit Agarwal 36,300 0.00 0 36,300 0.00 0 0 0.0020 Suman Didwania 87,696 0.00 0 87,696 0.00 0 0 0.0021 Sakshi Mody 18,000 0.00 0 18,000 0.00 0 0 0.0022 Pravin Agarwal 18,660 0.00 0 18,660 0.00 0 0 0.0023 Pratik Pravin Agarwal 0 0.00 0 0 0.00 0 0 0.0024 Dwarka Prasad Agarwal(3) 0 0.00 0 NA NA NA NA NA25 Anil Agarwal 0 0.00 0 0 0.00 0 0 0.0026 Vedvati Agarwal 0 0.00 0 0 0.00 0 0 0.0027 Navin Agarwal 0 0.00 0 0 0.00 0 0 0.0028 Kiran Agarwal 0 0.00 0 0 0.00 0 0 0.0029 Agnivesh Agarwal 0 0.00 0 0 0.00 0 0 0.0030 Priya Agarwal 0 0.00 0 0 0.00 0 0 0.00
Total 1,863,618,788 50.14 0 1,863,618,788 50.14 0 0 0.00
(1)� �Twinstar Holdings Limited (Promoter Group) holds 24,823,177 American Depository Shares (ADS) representing 99,292,708 equity shares. One (1) ADS represents four (4) equity shares.
(2)� �Mr. Dwarka Prasad Agarwal was holding ~82% in Agarwal Galvanising Private Limited (Promoter Group). Hence this entity has been removed from Promoter Group category. This entity has also been dissolved.
(3)� Mr. Dwakra Prasad Agarwal is not a part of the Promoter Group w.e.f. January 2, 2020 subsequent to his demise.
c) Change in Promoters’ Shareholding� There has been no change in the shareholding of Promoters during the FY 2019-20.
� �Further, Mr. Dwakra Prasad Agarwal is not a part of the Promoter Group w.e.f. January 2, 2020 subsequent to his demise.
� �Mr. Dwarka Prasad Agarwal was holding ~82% in Agarwal Galvanising Private Limited (Promoter Group). Hence this entity has been removed from Promoter Group category. This entity has also been dissolved.
d) Shareholding Pattern of top ten Shareholders (other than Directors, Promoters and Holders of GDRs and ADRs):
Sl. No. Shareholder’s Name
Shareholding at the beginning of the Year April 1, 2019
Change in Shareholding(No. of shares)
Shareholding at the end of the Year March 31, 2020
No. of Shares
% of total shares of the
Company Increase Decrease No. of Shares
% of total shares of the
Company
1 Life Insurance Corporation of India 236,640,744 6.37 1,816,000 1,763,019 236,693,725 6.372 ICICI Prudential – Mutual Funds 183,639,924 4.94 27,779,469 24,523,363 186,896,030 5.033 HDFC Trustee Company Limited
Account – Mutual Funds96,269,671 2.59 4,942,533 9,230,876 91,981,328 2.47
4 PTC Cables Private Limited 42,730,200 1.15 - - 42,730,200 1.155 Unit Trust of India – Mutual Funds 33,702,384 0.91 10,632,512 18,404,991 25,929,905 0.706 State Bank of India – Mutual Funds 31,933,418 0.86 20,769,036 11,047,163 41,655,291 1.127 Reliance Capital Trustee Co. Limited
Account – Mutual Funds30,143,895 0.81 25,819,759 39,445,251 16,518,403 0.44
8 Vanguard Emerging Markets Stock Index Fund Series
26,354,101 0.71 124,503 1,962,593 24,516,011 0.66
9 Vanguard Total International Stock Index Fund
25,161,567 0.68 3,411,655 669,228 27,903,994 0.75
10 Government of Singapore 25,079,571 0.67 9,471,389 11,991,184 22,559,776 0.61
*The shares of the Company are traded on daily basis and hence the date wise increase/decrease in shareholding is not indicated. Shareholding is consolidated based on permanent account number (PAN) of the shareholder.
e) Shareholding of Directors and Key Managerial Personnel:
Sl. No.
Name of theDirector or KMP
Shareholding at the beginning of the year
Date
Increase/Decrease
in shareholding Reasons
Cumulative Shareholding during the year
No. of Shares
% of total shares of the
Company No. of Shares
% of total shares of the
Company
1 Mr. GR Arun KumarWhole-Time Director & Chief Financial Officer
8,000(equity shares)
0.00% - - - 8,000 0.00%
2 Mr. Aman Mehta(1)
Non-Executive Independent Director474 0.00% - - - 474 0.00%
Notes:*No other Directors or KMPs besides the above hold shares in the Company.(1)Ceased to be an Independent Director effective close of business hours on May 16, 2020.
V. INDEBTEDNESS Indebtedness of the Company including interest outstanding/accrued but not due for payment
Secured Loans excluding deposits Unsecured Loans Deposits
Total Indebtedness
Indebtedness at the beginning of the financial yeari) � Principal Amount 26,026 16,178 - 42,204ii)� Interest due but not paid - - - -iii)� Interest accrued but not due 889 6 - 895Total (i+ii+iii) 26,915 16,184 - 43,099Change in Indebtedness during the yearAdditions- Principal amount 11,173 40,045 - 51,218Reductions- Principal amount (6,958) (47,527) - (54,485)Net Change relating to principle amount 4,215 (7,482) - (3,267)Net movement in interest due but not paid - - - -Net movement in interest accrued but not due 151 (2) - 149Indebtedness at the end of the financial yeari)� Principal Amount 30,241 8,696 - 38,937ii)� Interest due but not paid - - - -iii)� Interest accrued but not due 1,040 4 - 1,044Total (i+ii+iii) 31,281 8,700 - 39,981
INTEGRATED REPORT
06-115MANAGEMENT REVIEW
116-167STATUTORY REPORTS
168-270FINANCIAL STATEMENTS
271-502
208 VEDANTA LIMITED INTEGRATED REPORT AND ANNUAL ACCOUNTS 2019-20 VEDANTA LIMITED INTEGRATED REPORT AND ANNUAL ACCOUNTS 2019-20 209
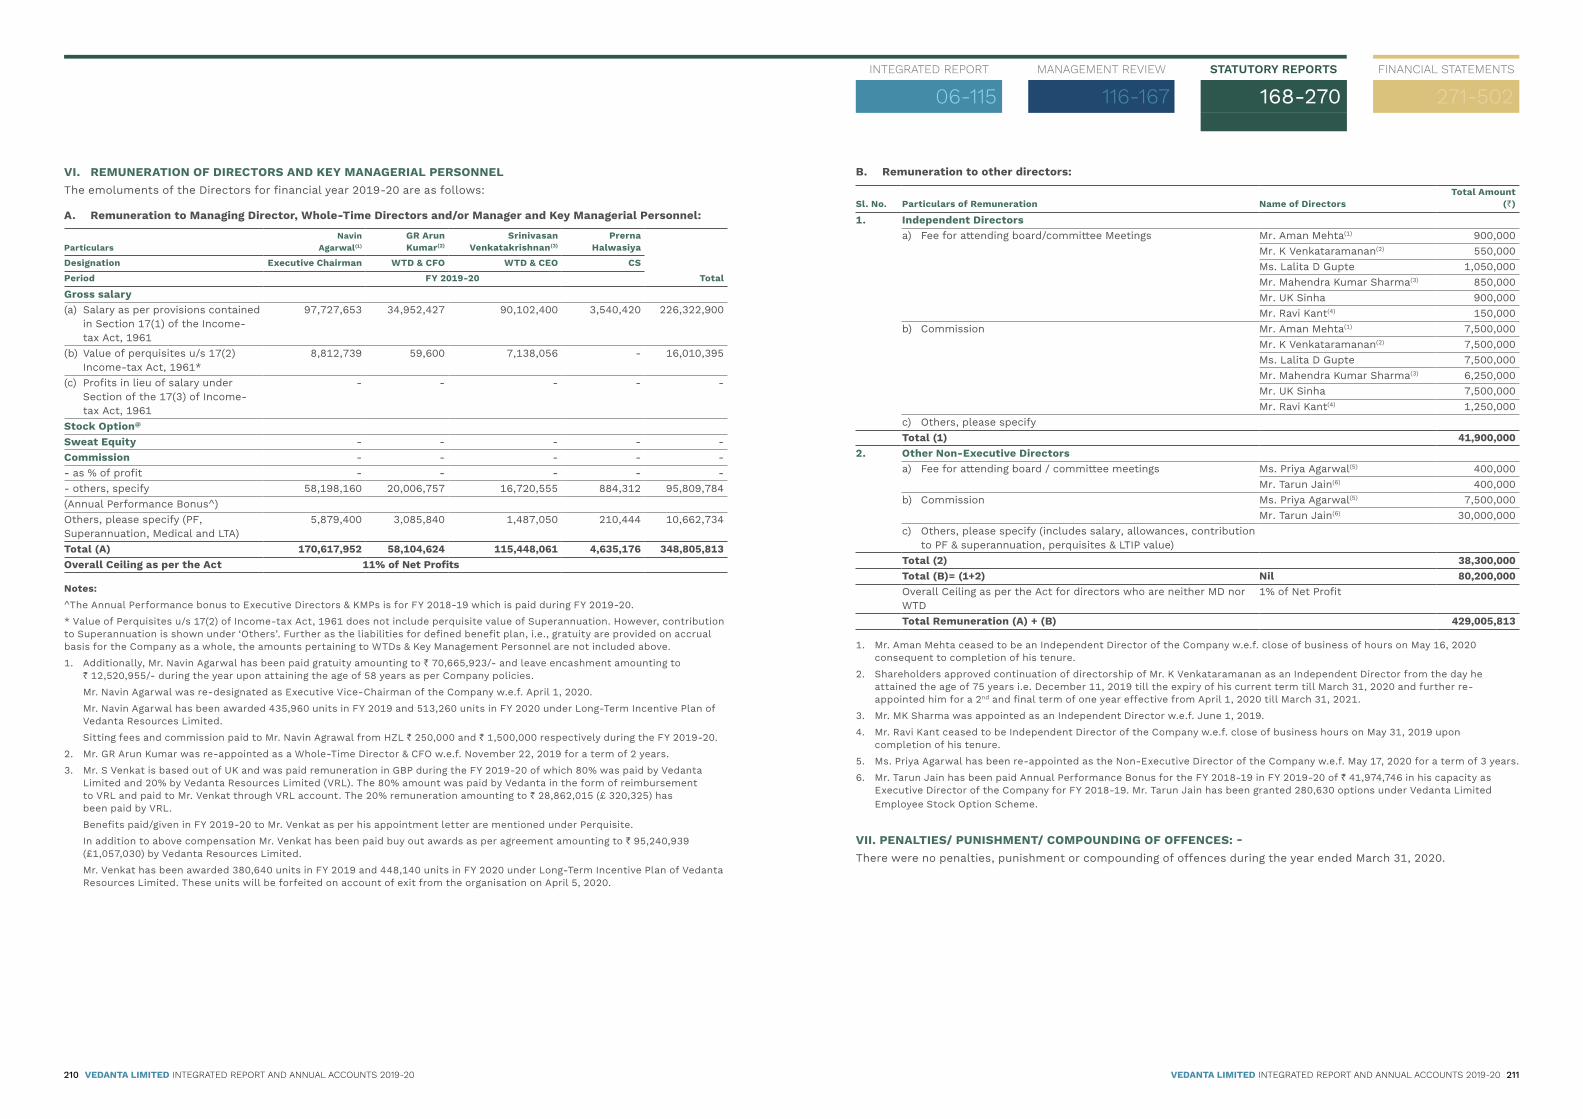
VI. REMUNERATION OF DIRECTORS AND KEY MANAGERIAL PERSONNELThe emoluments of the Directors for financial year 2019-20 are as follows:
A. Remuneration to Managing Director, Whole-Time Directors and/or Manager and Key Managerial Personnel:
ParticularsNavin
Agarwal(1)
GR Arun Kumar(2)
Srinivasan Venkatakrishnan(3)
Prerna Halwasiya
TotalDesignation Executive Chairman WTD & CFO WTD & CEO CSPeriod FY 2019-20
Gross salary(a)� �Salary as per provisions contained
in Section 17(1) of the Income-tax Act, 1961
97,727,653 34,952,427 90,102,400 3,540,420 226,322,900
(b)� �Value of perquisites u/s 17(2) Income-tax Act, 1961*
8,812,739 59,600 7,138,056 - 16,010,395
(c)� �Profits in lieu of salary under Section of the 17(3) of Income-tax Act, 1961
- - - - -
Stock Option@
Sweat Equity - - - - -Commission - - - - -- as % of profit - - - - -- others, specify 58,198,160 20,006,757 16,720,555 884,312 95,809,784(Annual Performance Bonus^)Others, please specify (PF, Superannuation, Medical and LTA)
5,879,400 3,085,840 1,487,050 210,444 10,662,734
Total (A) 170,617,952 58,104,624 115,448,061 4,635,176 348,805,813Overall Ceiling as per the Act 11% of Net Profits
Notes:^The Annual Performance bonus to Executive Directors & KMPs is for FY 2018-19 which is paid during FY 2019-20.* Value of Perquisites u/s 17(2) of Income-tax Act, 1961 does not include perquisite value of Superannuation. However, contribution to Superannuation is shown under ‘Others’. Further as the liabilities for defined benefit plan, i.e., gratuity are provided on accrual basis for the Company as a whole, the amounts pertaining to WTDs & Key Management Personnel are not included above.1.� �Additionally, Mr. Navin Agarwal has been paid gratuity amounting to ` 70,665,923/- and leave encashment amounting to
` 12,520,955/- during the year upon attaining the age of 58 years as per Company policies.� Mr. Navin Agarwal was re-designated as Executive Vice-Chairman of the Company w.e.f. April 1, 2020.� �Mr. Navin Agarwal has been awarded 435,960 units in FY 2019 and 513,260 units in FY 2020 under Long-Term Incentive Plan of
Vedanta Resources Limited.� Sitting fees and commission paid to Mr. Navin Agrawal from HZL ` 250,000 and ` 1,500,000 respectively during the FY 2019-20.2.� �Mr. GR Arun Kumar was re-appointed as a Whole-Time Director & CFO w.e.f. November 22, 2019 for a term of 2 years.3.� �Mr. S Venkat is based out of UK and was paid remuneration in GBP during the FY 2019-20 of which 80% was paid by Vedanta
Limited and 20% by Vedanta Resources Limited (VRL). The 80% amount was paid by Vedanta in the form of reimbursement to VRL and paid to Mr. Venkat through VRL account. The 20% remuneration amounting to ` 28,862,015 (£ 320,325) has been paid by VRL.
� �Benefits paid/given in FY 2019-20 to Mr. Venkat as per his appointment letter are mentioned under Perquisite.� �In addition to above compensation Mr. Venkat has been paid buy out awards as per agreement amounting to ` 95,240,939
(£1,057,030) by Vedanta Resources Limited.� �Mr. Venkat has been awarded 380,640 units in FY 2019 and 448,140 units in FY 2020 under Long-Term Incentive Plan of Vedanta
Resources Limited. These units will be forfeited on account of exit from the organisation on April 5, 2020.
B. Remuneration to other directors:
Sl. No. Particulars of Remuneration Name of DirectorsTotal Amount
(`)
1. Independent Directorsa)� �Fee for attending board/committee Meetings Mr. Aman Mehta(1) 900,000
Mr. K Venkataramanan(2) 550,000Ms. Lalita D Gupte 1,050,000Mr. Mahendra Kumar Sharma(3) 850,000Mr. UK Sinha 900,000Mr. Ravi Kant(4) 150,000
b)� Commission Mr. Aman Mehta(1) 7,500,000Mr. K Venkataramanan(2) 7,500,000Ms. Lalita D Gupte 7,500,000Mr. Mahendra Kumar Sharma(3) 6,250,000Mr. UK Sinha 7,500,000Mr. Ravi Kant(4) 1,250,000
c)� Others, please specifyTotal (1) 41,900,000
2. Other Non-Executive Directorsa)� �Fee for attending board / committee meetings Ms. Priya Agarwal(5) 400,000
Mr. Tarun Jain(6) 400,000b)� Commission Ms. Priya Agarwal(5) 7,500,000
Mr. Tarun Jain(6) 30,000,000c)� �Others, please specify (includes salary, allowances, contribution
to PF & superannuation, perquisites & LTIP value)Total (2) 38,300,000Total (B)= (1+2) Nil 80,200,000Overall Ceiling as per the Act for directors who are neither MD nor WTD
1% of Net Profit
Total Remuneration (A) + (B) 429,005,813
1.� �Mr. Aman Mehta ceased to be an Independent Director of the Company w.e.f. close of business of hours on May 16, 2020 consequent to completion of his tenure.
2.� �Shareholders approved continuation of directorship of Mr. K Venkataramanan as an Independent Director from the day he attained the age of 75 years i.e. December 11, 2019 till the expiry of his current term till March 31, 2020 and further re-appointed him for a 2nd and final term of one year effective from April 1, 2020 till March 31, 2021.
3.� �Mr. MK Sharma was appointed as an Independent Director w.e.f. June 1, 2019.4.� �Mr. Ravi Kant ceased to be Independent Director of the Company w.e.f. close of business hours on May 31, 2019 upon
completion of his tenure.5.� �Ms. Priya Agarwal has been re-appointed as the Non-Executive Director of the Company w.e.f. May 17, 2020 for a term of 3 years.6.� �Mr. Tarun Jain has been paid Annual Performance Bonus for the FY 2018-19 in FY 2019-20 of ` 41,974,746 in his capacity as
Executive Director of the Company for FY 2018-19. Mr. Tarun Jain has been granted 280,630 options under Vedanta Limited Employee Stock Option Scheme.
VII. PENALTIES/ PUNISHMENT/ COMPOUNDING OF OFFENCES: -There were no penalties, punishment or compounding of offences during the year ended March 31, 2020.
INTEGRATED REPORT
06-115MANAGEMENT REVIEW
116-167STATUTORY REPORTS
168-270FINANCIAL STATEMENTS
271-502
210 VEDANTA LIMITED INTEGRATED REPORT AND ANNUAL ACCOUNTS 2019-20 VEDANTA LIMITED INTEGRATED REPORT AND ANNUAL ACCOUNTS 2019-20 211

ANNEXURE D
To,The MembersVedanta Limited1st Floor, C Wing,Unit 103, Corporate Avenue Atul Projects,Chakala, Andheri (East), Mumbai – 400 093, Maharashtra
We have conducted the Secretarial Audit of the compliance of applicable statutory provisions and the adherence to good corporate governance practices by Vedanta Limited (hereinafter called the “Company”). Secretarial Audit was conducted in a manner that provided us a reasonable basis for evaluating the corporate conducts/statutory compliances and expressing our opinion thereon.
Based on our verification of the Company’s books, papers, minute books, forms and returns filed and other records maintained by the Company and also the information provided by the Company, its officers, agents and authorised representatives during the conduct of secretarial audit, we hereby report that in our opinion, the Company has, during the audit period covering the financial year ended on March 31, 2020 complied with the statutory provisions listed hereunder and also that the Company has proper Board-processes and compliance-mechanism in place to the extent, in the manner and subject to the reporting made hereinafter:
We have examined the books, papers, minute books, forms and returns filed and other records maintained by the Company for the financial year ended on March 31, 2020 according to the provisions of:
(i)� �The Companies Act, 2013 (the “Act”) and the rules made thereunder;
(ii)� �The Securities Contracts (Regulation) Act, 1956 (“SCRA”) and the rules made thereunder;
(iii)� �The Depositories Act, 1996 and the Regulations and Bye-laws framed thereunder to the extent of Regulation 76 of Securities and Exchange Board of India (Depositories and Participants) Regulations, 2018;
(iv)� �Foreign Exchange Management Act, 1999 and the rules and regulations made thereunder to the extent of Foreign Direct Investment, Overseas Direct Investment and External Commercial Borrowings;
(v)� �The following Regulations and Guidelines prescribed under the Securities and Exchange Board of India Act, 1992 (“SEBI Act”):-
SECRETARIAL AUDIT REPORTfor the financial year ended March 31, 2020
� (a)� �The Securities and Exchange Board of India (Substantial Acquisition of Shares and Takeovers) Regulations, 2011;
� (b)� �The Securities and Exchange Board of India (Prohibition of Insider Trading) Regulations, 2015;
� (c)� �The Securities and Exchange Board of India (Issue of Capital and Disclosure Requirements) Regulations, 2018;
� (d)� �The Securities and Exchange Board of India (Share Based Employee Benefits) Regulations, 2014;
� (e)� �The Securities and Exchange Board of India (Issue and Listing of Debt Securities) Regulations, 2008;
� (f)� �The Securities and Exchange Board of India (Registrars to an Issue and Share Transfer Agents) Regulations, 1993 regarding the Companies Act and dealing with client to the extent of securities issued;
� (g)� �The Securities and Exchange Board of India (Delisting of Equity Shares) Regulations, 2009; Not Applicable
� (h)� �The Securities and Exchange Board of India (Buyback of Securities) Regulations, 1998; Not Applicable
(vi)� �The Management has identified and confirmed the following laws as being specifically applicable to the Company:
� a)� �The Mines and Minerals (Development and Regulation) Act, 2015 and the rules and regulations made thereunder.
� b)� �Indian Boilers Act, 1923 and rules and regulations made thereunder.
� c)� �Manufacture, Storage and Import of Hazardous Chemical Rule, 1989.
We have also examined compliance with the applicable clauses/Regulations of the following:
(i)� �Secretarial Standards issued by The Institute of Company Secretaries of India and notified by Ministry of Corporate Affairs.
(ii)� �Securities and Exchange Board of India (Listing Obligations and Disclosure Requirements) Regulations, 2015.
During the period under review, the Company has substantially complied with the provisions of the Act, Rules, Regulations, Guidelines, Standards, etc. mentioned above.
We further report that:
The Board of Directors of the Company is duly constituted with proper balance of Executive Directors and Non-Executive Directors. The changes in the composition of the Board of Directors that took place during the period under review were carried out in compliance with the provisions of the Act. The Company has made an application with the Ministry of Corporate Affairs to obtain the approval for the appointment of Mr. Srinivasan Venkatakrishnan for his appointment as Whole-Time Director designated as CEO of the Company with effect from March 01, 2019 in terms of Section 196,197 read with Schedule V of the Companies Act, 2013 and the same is still awaited.
Adequate notice is given to all directors to schedule the Board/Committee Meetings. Agenda and detailed notes on agenda were sent atleast seven days in advance except in case where meetings were convened at shorter notice. A system exists for seeking and obtaining further information and clarifications on the agenda items before the meeting and for meaningful participation at the meeting.
All decisions at Board Meetings and Committee Meetings are carried out unanimously as recorded in the minutes of the meetings of the Board of Directors or Committee of the Board, as the case may be.
Notes:i.� �This report is to be read with our letter of even date which is annexed as Annexure-A and forms an integral part of this report.ii.� �Due to restricted movement amid COVID-19 pandemic, we conducted the secretarial audit by examining the Secretarial Records
including Minutes, Documents, Registers and other records etc., and some of them received by way of electronic mode from the Company and could not be verified from the original records. The management has confirmed that the records submitted to us are true and correct.
iii.� �This Report is limited to the Statutory Compliances on laws/ regulations/ guidelines listed in our report which have been complied by the Company up to the date of this Report pertaining to Financial Year 2019-2020. We are not commenting on the Statutory Compliances whose due dates are extended by Regulators from time to time due to COVID-19 or still there is time period to comply with such compliances.
We further report that there are adequate systems and processes in the Company commensurate with the size and operations of the Company to monitor and ensure compliance with applicable laws, rules, regulations and guidelines.
We further report that during the audit period, following major events have happened which are deemed to have major bearing on the Company’s affairs in pursuance of the above referred laws, rules, regulations, guidelines, standards etc.
1.� �The Company has issued Non-Convertible Debentures of ` 4,920 Crores during the period under review.
2.� �The Company has redeemed Non-Convertible Debentures of ` 1,800 Crores during the period under review.
3.� �Company commenced implementation of the Resolution Plan of Ferro Alloys Corporation Limited (FACOR) under the Corporate Insolvency Resolution Process (CIRP) of the Bankruptcy Code after the same was approved by the NCLT, Cuttack on January 30, 2020.
For Chandrasekaran AssociatesCompany Secretaries
Dr. S ChandrasekaranSenior Partner
Membership No. A1644Date: April 29, 2020� Certificate of Practice No. 715Place: Delhi � UDIN: F001644B000173959
INTEGRATED REPORT
06-115MANAGEMENT REVIEW
116-167STATUTORY REPORTS
168-270FINANCIAL STATEMENTS
271-502
212 VEDANTA LIMITED INTEGRATED REPORT AND ANNUAL ACCOUNTS 2019-20 VEDANTA LIMITED INTEGRATED REPORT AND ANNUAL ACCOUNTS 2019-20 213

ANNEXURE-A TO SECRETARIAL AUDIT REPORT
To,The MembersVedanta Limited1st Floor, C Wing,Unit 103, Corporate Avenue Atul Projects,Chakala, Andheri (East), Mumbai - 400093, Maharashtra
1.� �Maintenance of secretarial record is the responsibility of the Management of the Company. Our responsibility is to express an opinion on these secretarial records based on our audit.
2.� �We have followed the audit practices and processes as were appropriate to obtain reasonable assurance about the correctness of the contents of the secretarial records. The verification was done on the random test basis to ensure that correct facts are reflected in secretarial records. We believe that the processes and practices, we followed provide a reasonable basis for our opinion.
3.� �We have not verified the correctness and appropriateness of financial records and Books of Accounts of the Company.
4.� �Whenever required, we have obtained the Management representation about the compliance of laws, rules and regulations and happening of events etc.
5.� �The compliance of the provisions of Corporate and other applicable laws, rules, regulations, standards is the responsibility of Management. Our examination was limited to the verification of procedures on random test basis.
6.� �The Secretarial Audit Report is neither an assurance as to the future viability of the Company nor of the efficacy or effectiveness with which the Management has conducted the affairs of the Company.
For Chandrasekaran AssociatesCompany Secretaries
Dr. S ChandrasekaranSenior Partner
Membership No. A1644Date: April 29, 2020� Certificate of Practice No. 715Place: Delhi � UDIN: F001644B000173959
ANNEXURE E
(A) CONSERVATION OF ENERGY:� �Conservation of natural resources continues to be
the key focus area of your Company. Some of the important steps taken in this direction follow.
OIL & GAS BUSINESS Rajasthan Operations:� i.� �Conversion of Diesel driven engines to
electric motor at MS-01 having GHG emission reduction potential of ~1,000 tonnes of CO2e/annum.
� ii.� �Replacement of conventional lights at MBA with LEDs with saving potential of 12,000 kWh/annum.
� iii.� �Replacement of conventional 160W cellar pit lights with 60 W Flameproof LED fixtures at RGT gas well pads resulted in power saving of 12,500 kWh/annum.
� iv.� �Utilisation of Associated gas for Power generation and thereby reducing GHG emission by avoiding flaring of gas. Gas Based Engine Generators installed at RGT bridge Plant (3*1.1 MW) & MWP LSF (2*1.1 MW) resulted in reduction of GHG emission by ~16,000 tonnes of CO2e.
� v.� �A heat traced line with isolation valves to IWBH has been installed from incoming Well fluid header to Raag Oil WP#1 from Raag Oil WP#3 for maintaining the temperature > 65°C which was earlier meet by DG set operations. GHG emission reduction potential ~1,000 tonnes of CO2e/annum.
� vi.� �Installation of Electrical Boiler at Operation Base MPT Laundry by replacement of Diesel Boiler.
Ravva and Cambay Operations:� i.� �Installation of PCV in Contract-1 Gas
Treatment plant to achieve retro grade condensation. Fuel gas consumption reduced by 1360 scm per day.
� ii.� �Use of single water injection pump during lower water injection regime. Energy Savings of ~10,000 kWh/day, Fuel gas reduction of ~7,440 scm/day.
� iii.� �Installation of LED lights and replacement of fluorescent/HSPV lamps at various locations in Ravva & CB Plant premises and perimeters were carried out to save energy.
COPPER BUSINESS� i.� �VFD Installation for TLB Blower – Electric
energy reduction (Up to 140 kWhr/Day reduction).
� ii.� �Installation of Crane Main Hoist drive – Electrical energy reduction (Up to 57,000 kWhr per month reduction).
� iii.� �Replacement of existing lights in Cell house LED lights – Electrical energy reduction (Up to 28,000 kWhr annually).
� iv.� �Emulsification of FO for ACP operations – Reduction in Furnace Oil Consumption.
� v.� �Installation of VRF Units for Air conditioning system.
IRON ORE BUSINESS: VAB:� i.� �Usage of blast furnace waste dust in sinter mix
and oxygen enrichment in sinter combustion burner to reduce coke breeze consumption from 58 kg/TS to 56 Kg/TS resulting in saving of 11 million K Cal.
� ii.� �Production of foundry grade pig iron outside the blast furnace (Qty. 129,752 T) by using Ferro-silicon compound resulting in saving of 40Kg/THM coke consumption.
� iii.� �Minimising unload run hours of compressor by reducing the setting of idle runtime, achieving power saving of 78,750 kWh/annum.
� iv.� �Conducted compressed air leakage audit in PID-1, PID-2 and MCD and arrested the compressed air leaking points (Saving – 504,000 kWh/annum).
� v.� �Replacement of conventional lamps with the LED lamps in Value Addition Business in phased manner (Saving – 219,000 kWh/annum).
� vi.� �Retrofitting of compressor with energy efficient compressor in Blast furnace-3 (Saving – 126,000 kWh/annum).
� vii.� �Installation of lighting automation boxes (10 Nos.) in PID-1 (Saving – 7,300 kWh/annum).
� viii.� �Replacement of existing motors with energy efficient motors (Saving – 168,000 kWh/annum).
INTEGRATED REPORT
06-115MANAGEMENT REVIEW
116-167STATUTORY REPORTS
168-270FINANCIAL STATEMENTS
271-502
214 VEDANTA LIMITED INTEGRATED REPORT AND ANNUAL ACCOUNTS 2019-20 VEDANTA LIMITED INTEGRATED REPORT AND ANNUAL ACCOUNTS 2019-20 215

� ix.� �Elimination of 7 roll distributors in sinter plant (Saving – 58,800 kWh/annum).
� x.� �Elimination of P8 conveyor by providing chute arrangement in SP (Saving – 42,000 kWh/annum).
IOK:� i.� �Replacement of around 100 Nos. sodium
vapor lamp with LED resulting in saving of 46,080 kWh/annum.
� ii.� �Replaced 22KW motor with 18.5 KW motor for conv-3 resulting in savings of 20,160 kWh/annum.
� iii.� �Replaced 15 KW motor with 11 KW motor for conv-7 resulting in savings of 23,040 kWh/annum.
POWER BUSINESS: 2400MW Jharsuguda:� i.� �Replacement of Air preheater basket & seals
for Unit#4 units to reduce the high flue gas exit temperature to design level saving 0.9 kcal/kWh in heat rate and 2,678 kWh in PA fans consumption.
� ii.� �Replacement of Air preheater basket & seals for Unit#1 units to reduce the high flue gas exit temperature to design level saving 1.1 kcal/kWh in heat rate and 3,659 kWh in PA fans consumption.
� iii.� �Unit#4 flue gas duct leakages and Boiler air ingress rectification to reduced ID fans consumption by 6,666 kWh.
� iv.� �Unit#1 replacement of flue gas ducts to arrest air leakages to reduce ID fans consumption by 1,100 kWh.
� v.� �Arrest compressed air leakages in the plant, stopping of one compressor and saving 250 kWh.
� vi.� �Replace fluorescent and metal halide lamps with LED, saving of 0.011 MU.
� vii.� �Replaced timer-based drain valves with level sensor based drain valves in instrument air tanks/receivers.
� viii.� �CW pump running optimisation at partial loads and transition ambient situations.
� ix.� �Mill Liner Replacement, Ball segregation & Top-up in 12 Mill which results the Mill Output from 60 TPH to 85 TPH to reduce the power consumption of Mills.
CPP 1215MW Jharsuguda:� i.� �Replacement of Air preheater basket for
2 units to reduce the very high flue gas exit temperature to design level saving 1.8 kcal/kWh in heat rate and 550 kWh in PA consumption.
� ii.� �Sliding pressure operation during partial load to save 3.2 kcal/kWh in heat rate and 200 Kw in BFP consumption.
� iii.� �Reduction of unaccounted loss by 6 kcal and reduce turbine heat rate from 2,100 to 2,094 kcal.
� iv.� �Establish mill operating window to improve air fuel ratio up to 1.1.
� v.� �Rectification of Turbine internal fins and glands to achieve saving of 1.2 kcal/kWh in heat rate.
� vi.� �Replacement of Air preheater seals to reduce ID and PA fans consumption by 2.2 MU annually.
� vii.� �Optimisation of operational parameters i.e. SH,RH spray and SH,RH steam temperature, water chemistry giving saving of 0.7 gms/kWh in heat rate.
� viii.� �U#1,3,5,6,9 partial FF bag replacement with new bag (emission reduced from 42 µmg/m3 to 30 µmg/m3 and ID fan consumption reduction by 1 MU annually).
� ix.� �Sp. Raw consumption reduce from 2.03 to 2.00 by maintaining COC (Cycle of Concentration) and leakage arresting in raw water pipeline.
� x.� �Boiler Excess air optimisation by pursuance of internally developed Decision Chart to reduce extra power consumption by fans.
� xi.� Stopping of One CW pump Load <105MW.
ALUMINIUM BUSINESS Smelter Plant Jharsuguda: Electrical Energy: DC Energy saving:� i.� �Changing of non-ES pots with 100%
graphitised energy saving cathodes achieving reduction in Specific DC energy consumption.
� ii.� Reduction in stop pot voltage.
� iii.� Bolt drop reduction in potline.
AC auxiliary Energy saving� i.� �Installation of mechanical drain valves in
condensate piping of compressor.
� ii.� �VFD installation in Reduction compressor pump house, cooling tower fan motor in rodding shop & pump house cold water pump at Casthouse-2.
� iii.� �HFO consumption reduction at bake oven by implementing various Six Sigma techniques.
� iv.� �Replacement of conventional lights with LED fittings at Casthouse-2 shop floor, 600+ in potline high bay, 600+ in potline courtyard.
� v.� �Replacement of 150+ nos. of conventional streetlights and 25+ nos. of hight mast fittings with LED fittings.
� vi.� �Installation of energy power saver in place of lighting transformer at Casthouse-3.
� vii.� �Optimisation of ID fan operation in FTP.
� viii.� �Replacement of Conventional (Cylindrical) Filter bag to star type Filter Bag in potline FTP.
� ix.� �Cooling Ramp VFD installation in all baking furnace.
� x.� �Provision of an external compressor unit for seal pressure checking for Reduction of diesel consumption in MTV by prevention of idle running of engine during seal pressure check.
� xi.� �Cooling tower automation in utility Area.
Lanjigarh – Refinery:� �The following major energy conservation measures
are taken at Lanjigarh:-
� i.� �Installation of 100KWp roof top solar power plant with annual production of 1.4 lakhs unit of electrical energy.
� ii.� �Replacement of 4,000 numbers of conventional lights with LED. Annual saving of 9.6 lakhs unit of electrical energy.
� iii.� �Replacement of pulley for oversized pump motor in white-1 area.
� iv.� �Installation of 2 nos. 45KW VFD in milk of lime area.
Lanjigarh – CGPP:� i.� �Replacement of conventional lights with LED.
Annual saving of 41,786 kWh.
� ii.� �Ceramic coating in CW pump impeller. Annual saving of 28,866 kWh.
(B) ADDITIONAL INVESTMENTS AND PROPOSALS, IF ANY, BEING IMPLEMENTED FOR REDUCTION OF CONSUMPTION OF ENERGY
OIL & GAS BUSINESS: Rajasthan Operations:� i.� �Commissioning of 2 x 1.1 MW GEG’s
at NI-02 field.
� ii.� �Feasibility study completed for roof top solar power and concluded 4 MW potential.
Ravva Operations:� i.� �Procurement of 500 nos. of 20W LED light
fittings for replacing of existing 40 W fluorescent lamps in LQ & Plant and would corresponding to saving of 43,800 kWh/year.
� ii.� �Procurement of 150 nos. of 60W LED light fittings for replacing of existing 70 W HPSV lamps in Plant and would corresponding to saving of 6,570 kWh/year.
� iii.� �Procurement of 40 nos. of 150 W LED light fittings for replacing of existing 250 W HPSV Lights in Plant and would corresponding to saving of 17,520 kWh/year.
� iv.� �Water injection single pump operation (P-1509) during less water injection regime thus saving fuel gas for GTG.
� v.� �Installation of PCV in Contract-1 Gas Treatment plant to reduce power consumption for propane system.
Cambay Operations:� i.� �Installation of LED lights at Perimeter wall and
few more areas inside plant premises.
COPPER BUSINESS:� i.� �1MW Solar power Plant in Chinchpada
refinery – Project.
� ii.� �Efficiency Improvement of Boiler house from 80% to 89%.
� iii.� �Replacement of existing High mast lights with LED lights.
� iv.� �Planning to set up sewage treatment plant to treat Municipal sewage to generate fresh water for plant and nearby villagers’ use.
� v.� �Planning to setup desalinated plant to self-sustain on the water requirement.
� vi.� �Possibilities for green fuel alternative to Furnace oil.
� vii.� �Planning to implement Efficiency improvements in Air conditioning system.
INTEGRATED REPORT
06-115MANAGEMENT REVIEW
116-167STATUTORY REPORTS
168-270FINANCIAL STATEMENTS
271-502
216 VEDANTA LIMITED INTEGRATED REPORT AND ANNUAL ACCOUNTS 2019-20 VEDANTA LIMITED INTEGRATED REPORT AND ANNUAL ACCOUNTS 2019-20 217

IRON ORE BUSINESS VAB:� i.� �Replacement of all conventional light fixtures
with LED across Value Addition Business.
� ii.� �Replacement of cooling tower coupling shaft with composite fibre shaft.
� iii.� �Conducting energy audit from third party and implementation of recommendations.
IOK:� i.� �Installed Automatic change over between
Govt. supply and DG when either one is not available, resulting in reduction in diesel consumption by 48,000 L/annum.
� ii.� �Installed new high mast towers in different locations in mine and installation of new poles with LED luminaires, Increased safety, Increased illumination and decreased power usage due to usage of LED luminaires. Decreased usage of IR mobile lighting towers resulting in decreased diesel consumption of about 24,000 L/annum.
� iii.� �Replacement of 1,000 W Metal halide lights with LED 300 W in IR lights (20 nos. IR lights) resulting in savings of 0.5 Lts/day/IR/month-18,000 L/annum.
POWER BUSINESS: 2400MW Jharsuguda Proposals:� i.� �New design Eco tube replacement in boiler to
reduce forced outage.
� ii.� Steam path audit of Turbine steam flow path.
� iii.� �Chemical cleaning of condenser tubes.
� iv.� �Separation of Vacuum pump suction line from HP & LP condenser.
� v.� �TDBFP internal inspection to increase efficiency while Capital Overhauling.
1215MW Jharsuguda Proposals:� i.� �Installation of VFD’s for ID and PA
fans (HT DRIVES).
� ii.� Firing of Biomass in blending with coal.
� iii.� Green cooling tower installation.
� iv.� �Automatic condenser ball cleaning system for condenser.
� v.� �Pulveriser gearbox oil replacement with energy efficient oil
� vi.� Installation of energy efficient motors.
ALUMINIUM BUSINESS
Sl. No. Project Target Area
Estimated Savings (kWh)
1 Replacement or Maintenance of Faulty Steam traps
DIG, EVAP, White 1, Red 2
1,359,000.00
2 Installation of rooftop 100 KWp Solar Power panel
Admin building
128,109.60
3 VFD conversion of Good Quality Condensate pump: 29-PU-0001B
Evaporation 60,924.60
4 Installation of Test Liquor VFD: 26-PU-0010
Evaporation 163,080.00
5 Running combination of most efficient pumps I & II in Raw water pumping station at Lanjigarh
Lanjigarh Pump House
452,600.00
6 Pulley replacement of oversized pumps to attain BEP
White 1 3,146,400.00
7 Energy management system and SCADA implementation in entire refinery
Refinery -
8 Replacement of conventional lighting system with LED
Area lighting, Office lighting and Floodlight
272,160.00
9 Use of blowers instead of compressed air in Sump pumps
PDS, DIG 7,455,577.00
CGPP:10 Turbine #1 vacuum
improvementTurbine #1 13,453,085.00
11 Increase in pump efficiency by applying corrosion resistance coating in CW pump impellers
CW Pump 82,992.00
12 Cooling Tower performance improvement
Cooling Tower 162,000.00
13 Installation of LED lights Boiler & AVR 9,597.60
(C) IMPACT OF ABOVE MEASURES IN (A) AND (B) FOR REDUCTION OF ENERGY CONSUMPTION AND CONSEQUENT IMPACT ON COST OF PRODUCTION OF GOODS
OIL & GAS BUSINESS Rajasthan Operations:� i.� �Utilisation of associated gas for power and
thereby avoiding flaring/GHG emission.
� ii.� �Conservation of diesel and electricity by installation of GEGs at satellite fields.
Ravva Operations:� i.� Single water injection pump operation.
� � �Energy Savings of ~10,000 kWh/day, Fuel gas reduction of ~7,440 scm/day and corresponding cost savings of ` 6.7 mm per annum considering 90 days operation in a year.
� ii.� �Installation of PCV in Contract-1 Gas Treatment plant to achieve Joule Thomson effect and provide TOR to gas treatment.
� � �Fuel gas consumption reduced by 1,360 scm/day by stopping one Propane compressor in Contract-I and corresponding cost saving of 4.96 mm ` per annum.
� iii.� �Total Savings from replacement of lights: 34 mWh/annum (~170,000 ` per annum).
Cambay Operations:� i.� �Installation of LED lights at various locations
inside plant area: Total power savings due to the initiative would be 36,800 kWh/year and cost savings of ` 3.9 lakhs/year.
IRON ORE BUSINESS VAB:� i.� �The Energy Conservation measures
undertaken in various areas in 2019-20 have an annual saving potential of 1,204 mWh of Electricity per annum for VAB.
IOK:� i.� �The Energy Conservation measures
undertaken in various areas in 2019-20 have an annual saving potential of 90 KL of Diesel & 89.2 mWh of Electricity for IOK.
POWER BUSINESS 2400MW Jharsuguda:� •� �Achieved lowest ever APC of 6.43% in U4 since
commissioning in January 2020.
� •� �Reduction in Specific coal consumption by 2 gms/kWh on annual basis.
� •� �Lower SOC achieved 0.01 ml/kWh in January 2020.
� •� �Lower SCC achieved 764 gm/kWh in December 2019.
� •� �Lower DM Makeup achieved 0.37% in January 2020.
1215MW Jharsuguda:� •� �0.01% APC (Auxiliary Power Consumption)
improvement in FY 2020 compared to FY 2019.
� •� �24% reduction in DM water consumption in FY 2020 compared to FY 2019 from 1.003% to 0.766%.
� •� �0.01% APC (Auxiliary Power Consumption) improvement in FY 2020 compared to FY 2019.
� •� �0.08 ml/kWh reduction in specific oil consumption from 0.2 to .12 ml/kWh on annual basis.
� Achieved best figures in APC since commissioning
Yearly 9.21 FY 20Half Yearly 8.91 H2-20Quarterly 8.83 Q3 FY 19-20Month 8.79 Dec-19
ALUMINIUM BUSINESS: Refinery:� i.� �Reduction of Specific Electrical energy from
235 kWh/T to 216 kWh/T
� ii.� �Reduction of specific FO consumption from 71.23 kg/T to 70.59 kg/T
(D) THE STEPS TAKEN BY THE COMPANY FOR UTILISING ALTERNATE SOURCES OF ENERGY
COPPER BUSINESS� i.� �Initiated 1 MW Solar power project.
� ii.� �New Boiler procurement initiated to handle Natural Gas as well as Furnace Oil.
� iii.� �Planning to setup Sewage treatment plant to treat Municipal sewage to generate fresh water for plant & nearby villages’ usage.
� iv.� �Planning to setup a Natural gas terminal for alternate usage of FO & LPG.
� v.� �Planning to setup Desalination plant to self-sustain on the water requirement.
INTEGRATED REPORT
06-115MANAGEMENT REVIEW
116-167STATUTORY REPORTS
168-270FINANCIAL STATEMENTS
271-502
218 VEDANTA LIMITED INTEGRATED REPORT AND ANNUAL ACCOUNTS 2019-20 VEDANTA LIMITED INTEGRATED REPORT AND ANNUAL ACCOUNTS 2019-20 219

Technology Absorption, Adaptation and Innovation
Efforts in brief made towards technology absorption, adaptation and innovation
OIL & GAS BUSINESSRajasthan Operations: � Sand Guard and ADV Installation - Under polymer one of the common reasons of ESP pump failure is the broken/stuck shaft due to debris fall back. In the event of any planned/unplanned shut down, sand guard installed above the pump holds all the debris and keep the pump shaft free from any debris which is produced once the system is restarted.
� Permanent Magnetic Motor (PMM) Installation: ESP wells are conventionally completed with Induction Motor (IM) which are less efficient and generate more heat. Under polymer flood, polymer sticks onto the hotter surface reducing heat dissipation resulting in continuous rise in motor temperature. Permanent magnetic motor due to its higher efficiency operates at lower temperature hence preventing polymer deposition on body of down-hole motor. Trial of 3 system successfully completed in worst effected ESP wells.
� Advance Gas Handler (AGH) are helico axial pump which are capable of handling high percentage of free gas at pump intake and thus avoiding gas locking.
Technology pilots done in FY 2020:Pilot projects completed: � Radial Jet Drilling in Mangala, Bhagyam & Aishwariya (MBA) injector wells. � Poly-acrylic scale inhibitor dosing in Mangala ESP wells. � Power-wave pulsating tools for Coil Tubing conveyed well cleanouts. � Boronised tubing in Bhagyam.
Pilot projects in progress: � Seismic Stimulation. � Clearwell installation on Artificial lift wells. � Agitator technology to support workover fishing.
Ravva and Cambay Operations: � �Platform based stimulation of injector wells were conducted using the in-house conceived, “Mini stimulation package”. This initiative has removed the weather dependency of well stimulation and requirement of platform supply vessel in Ravva for injector well stimulation. This project has resulted in improved water injection, enabling pressure maintenance of the block and improved production performance from the producer wells.
� �Auto gas lift technique has been utilised for reviving shut-in wells. The shallow gas zones in existing wells were opened at a controlled rate to produce the wells using gas lift. E-line and tractor-stoker equipment were utilised for operations in the highly deviated wells like LB-10.
� �A straddle gas lift packer system was installed as a retrofit gas lift system in well LB-5 as the existing completion did not allow for a traditional gas lift set up. This resulted in a gain of ~250bopd.
� �A jet pump was modified and improvised for accessing auto gas lift in GA-06, the quick turn around with this modification revived the well with 900 bopd production.
IRON ORE BUSINESSVAB:i.� Pulverised coal injection in blast furnace 1 & 2.ii.� Oxygen enrichment in Sinter Plant and Blast furnace-1 & 2.iii.� Use of high thermal conductivity bricks for oven bed.iv.� Hydraulic compacting station in Met coke division.
POWER BUSINESS2400MW Jharsuguda:i.� ��Implementation of Online boiler tube leakage detection system.
1215MW Jharsuguda:ii.� Biomass feeding in blending with current coal.iii.� Sliding pressure operation.
ALUMINIUM BUSINESSi.� SMART POT GE digital project kick-off in Smelter-II aimed at improving Potroom performance.
FORM OF DISCLOSURE OF PARTICULARS WITH RESPECT TO TECHNOLOGY ABSORPTION RESEARCH AND DEVELOPMENT (R & D)
COPPER BUSINESS� �Specific areas in which R&D carried out
by the Company:
� i.� �Alternate Material for pig iron.
� ii.� �Recovering of copper sulphate from the electrolyte.
� iii.� �Minor metals recovery from slime.
IRON ORE BUSINESS: VAB:� �Specific areas in which R&D carried out
by the Company:
� i.� �Sinter plant reduction in coke breeze consumption by utilisation of blast furnace waste dust.
� ii.� �Oxygen enrichment in sinter plant.
� iii.� �Pulverised coal injection in Blast furnace-1 & 2.
Benefits as a result of R&D� i.� �Reduction in coke breeze consumption by 2
kg/tonne of sinter.
� ii.� �Reduction in coke breeze consumption and reduction in internal return fines generation.
� iii.� �Replacement of coal with coke at a ratio of 0.8.
ALUMINIUM BUSINESS: CPP Plant Jharsuguda:� i.� Biomass feeding in blending with current coal.
INTEGRATED REPORT
06-115MANAGEMENT REVIEW
116-167STATUTORY REPORTS
168-270FINANCIAL STATEMENTS
271-502
220 VEDANTA LIMITED INTEGRATED REPORT AND ANNUAL ACCOUNTS 2019-20 VEDANTA LIMITED INTEGRATED REPORT AND ANNUAL ACCOUNTS 2019-20 221

Benefits derived as a result of above efforts e.g. product improvement, cost reduction, product development, importsubstitution
OIL & GAS BUSINESSRajasthan Operations: � Sand Guard and ADV Installation in Rajasthan Operations:
− �Sand Guard installation provided better protection of ESP pump from debris fall back avoiding pre-mature pump failures.
− �Installation of sand guard also eliminates requirement of coiled tubing (saving per day cost~ 5,000 USD) which is generally required for all the ESP related stimulations.
� Permanent Magnetic Motor (PMM) Installation − �Elimination of increasing motor temperatures in ESP wells due to polymer sticking. − �Expected cost saving per year due to elimination of ESP stimulation (high MWT treatment) is approximately 2 MMUSD for the 3 wells.
� Advance Gas Handlers (AGH) − �AGH provides better gas handling capacity avoiding frequent gas locking and maximise the fluid withdrawal from reservoir.
− �It also eliminates ESP flushing stimulation required to flush out any trapped gas hence, reducing OPEX expenditure and improve overall ESP uptime.
Pilot projects completed:i.� �Radial Jet Drilling in MBA injectors – Sustenance of improved injection was twice as much as
conventional treatments. Technology is proven and can be applied on field scale.
ii.� �Poly-acrylic scale inhibitor – Scale inhibitor dosing slowed ESP motor heating & delayed ESP workovers thus providing better run life.
iii.� �Power wave cleanout tools were used to clean hard/mature Iron sulphide scale deposition inside injector well’s tubing which otherwise can’t be cleaned out with conventional jetting. This provides sustained improvement in injectivities in water/polymer injector wells.
iv.� �Boronised tubing is installed in 5 of Bhagyam PCP wells as a pilot. This has reduced the tubing wear considerably making way for improved well life and easier workovers.
Pilot projects in progress:i.� �Seismic stimulation – This technology is under trial application in Bhagyam field to improve
production in an area of one mile by virtue of transmitting low frequency high energy elastic waves.
ii.� �Clearwell - This technology is under trial application to reduce polymer deposition inside production tubing in ESP and Jet Pump oil producers through electric pulse. This can reduce the requirement of costly well intervention to improve well productivities.
iii.� �Agitator – This technology is under trial application in complicated workovers wherein the tool as part of fishing BHA supports to release stuck pipe by continuous agitation generated by hydraulics.
IRON ORE BUSINESSVAB:i.� Reduction in coke rate resulting reduced COP.ii.� Increase in productivity and reduction in coke rate.iii.� Improvement in coke oven productivity.iv.� Reduction in fines generation.
POWER BUSINESS2400MW Jharsuguda:i.� Power cost reduction by 83 $/tonne.ii.� Reduction in forced outage time by 2.3%.iii.� Increase in station availability and PLF by 2%.
1215MW Jharsuguda:i.� Power cost reduction by 64 $/tonne.ii.� Reduction in turbine heat rate by 6 kcal & DM Make up % by 24%.iii.� Reduction of APC from 9.22% to 9.21%.
ALUMINIUM BUSINESSCPP Plant Jharsuguda:i.� Power cost reduction by 64 $/tonne.ii.� Reduction in turbine heat rate by 6 kcal & DM Make up % by 24%.iii.� Reduction of APC from 9.22% to 9.21%.
Details of technology imported:
Technology imported Year of import Has technology been fully absorbed
OIL & GAS BUSINESS Rajasthan OperationsSand Guard – Equipment is manufactured outside India. The year of import FY 2020.
The trial has been successfully completed and field wise implementation is under progress.
Permanent Magnetic motors (PMM) are manufactured outside India and was imported in FY 2019-20.
Yes. The Trial has been successfully completed. Phase wise full field implementation in under progress.
Equipment is manufactured outside India. The year of import FY 2019-20.
The trial has been completed.
COPPER DIVISION No
IRON ORE – VALUE ADDITION BUSINESS:
Hydraulic compacting station in MCD Battery-1 and Battery-2
2018-19 [MCD]
YesPulverised coal injection in Blast furnace 1& 2.
2017 [PID-1]
POWER BUSINESS No
ALUMINIUM BUSINESS No
INTEGRATED REPORT
06-115MANAGEMENT REVIEW
116-167STATUTORY REPORTS
168-270FINANCIAL STATEMENTS
271-502
222 VEDANTA LIMITED INTEGRATED REPORT AND ANNUAL ACCOUNTS 2019-20 VEDANTA LIMITED INTEGRATED REPORT AND ANNUAL ACCOUNTS 2019-20 223

Part
icul
ars
Unit
Year
En
ded
M
arch
31,
20
20
Year
En
ded
M
arch
31,
20
19
Year
En
ded
M
arch
31,
20
20
Year
En
ded
M
arch
31,
20
19
Year
En
ded
M
arch
31,
20
20
Year
En
ded
M
arch
31,
20
20
Year
En
ded
M
arch
31,
20
20
Year
En
ded
M
arch
31,
20
20
Year
En
ded
M
arch
31,
20
20
Year
En
ded
M
arch
31,
20
19
Year
En
ded
M
arch
31,
20
19
Year
En
ded
M
arch
31,
20
19
Year
En
ded
M
arch
31,
20
19
Year
En
ded
M
arch
31,
20
19
Year
En
ded
M
arch
31,
20
20
Year
En
ded
M
arch
31,
20
19
Year
En
ded
M
arch
31,
20
20
Year
En
ded
M
arch
31,
20
19
Year
En
ded
M
arch
31,
20
20
Year
En
ded
M
arch
31,
20
19
Busi
ness
Uni
t
Oil &
Gas
Copp
erIro
n-Or
ePo
wer
(600
MW
)Al
umin
ium
Met
Cok
e Di
visi
onPi
g Iro
n Di
visi
on
Pow
er
Plan
t (W
hr)
Min
ing
Goa
Min
ing
Karn
atak
aM
et C
oke
Divi
sion
Pig
Iron
Divi
sion
Pow
er
Plan
t (W
hr)
Min
ing
Goa
Min
ing
Karn
atak
aLa
njig
arh
Jhar
sugu
da
A. P
ower
and
Fue
l Co
nsum
ptio
nEl
ectr
icity
Purc
hase
Uni
tm
Wh
1623
5314
3317
5934
8.72
5674
8.64
7608
.317
2569
.976
6.5
1886
.933
8.0
7664
.218
9488
.415
5.0
2695
.615
0.0
3118
5612
9067
.76
1942
.00
3573
.00
9686
2428
9043
2.34
Tota
l Am
ount
(E
xc D
eman
d Ch
gs)
` Cr
ore
115.
0210
9.60
35.6
332
.01
0.4
8.8
0.4
0.9
0.3
0.3
7.8
0.0
1.3
0.2
141.
0561
.82
1.12
2.04
503.
5618
03.3
2
Rate
/Uni
t`/
kWh
7.08
7.65
6.00
5.64
0.6
0.5
5.4
4.8
9.2
0.4
0.4
2.9
5.0
10.3
4.52
4.79
5.77
5.77
5.20
6.24
Own
gene
ratio
n Un
it*m
Wh
5567
2763
7412
157.
0036
3.55
0.1
94.0
3905
81.6
NA0.
411
3.1
4341
84.6
NA78
1505
1029
608.
9948
9655
4352
9120
4082
1619
1522
82Un
it pe
r uni
t of f
uel
`/Un
it,
gms/
Unit,
Li
t/ U
nit
0.00
0.00
0.35
0.32
810
0.00
2.90
2.76
802
802
Cost
/Uni
t`/
mW
h,
`/kW
h0.
000.
0021
.13
21.3
317
.313
.70.
0NA
22.4
18.4
0.0
NA4.
282.
823.
583.
463.
273.
78
Furn
ace
Oil
0.00
0.00
0.00
Quan
tity*
*KL
0.00
0.00
5479
.88
5093
.86
Nil
Nil
Nil
Nil
NANi
lNi
lNi
lNi
lNA
3.50
1285
19.0
410
7328
.67
3486
5.72
Tota
l Am
ount
` Cr
ore
0.00
0.00
17.0
917
.21
NANA
NANA
NANA
NANA
NANA
0.02
412.
0037
9.40
130.
36Av
erag
e Co
st p
er li
tre`/
Lit
0.00
0.00
31.1
933
.78
NANA
NANA
NANA
NANA
NANA
51.8
132
.06
35.3
537
.39
Dies
el O
il0.
000.
000.
00Qu
antit
yKL
6377
9751
.06
54.6
711
6.67
13.0
50.2
Nil
3817
.267
86.0
19.0
75.9
3.7
673.
449
97.0
511
445.
5816
9.63
1017
.05
2855
.67
8692
.54
Tota
l Am
ount
` Cr
ore
36.0
549
.80
0.34
0.73
0.1
0.3
NA21
.837
.40.
10.
50.
04.
228
.32.
741.
760.
716.
4512
.23
49.9
1Av
erag
e Co
st p
er li
tre
/ Uni
t per
litre
of O
il` /
Lit
56.5
351
.07
63.0
962
.42
61.8
62.6
NA57
.055
.165
.263
.061
.062
.956
.654
39.5
841
.79
63.4
342
.83
57.4
1
Cost
per
Uni
t0.
000.
000.
00L.
P.G.
/ LNG
/ Pr
opan
e/ IP
A0.
000.
000.
00
Quan
tity-
(LPG
)M
T0.
000.
0071
91.2
242
30.6
4Ni
l55
.3Ni
lNi
lNA
Nil
94.6
Nil
Nil
NA0.
00To
tal A
mou
nt`
Cror
e0.
000.
0028
.31
18.6
3Ni
l0.
3Ni
lNi
lNA
Nil
0.5
Nil
Nil
NA0.
00Av
erag
e Co
st p
er K
g`/
Kg0.
000.
0039
.36
44.0
4Ni
l49
.3Ni
lNi
lNA
Nil
55.5
Nil
Nil
NA0.
00L.
P.G.
/ LNG
/ Pr
opan
e/ IP
A0.
000.
000.
00
Quan
tity(
LNG)
MT
0.00
0.00
0.00
0.00
Nil
Nil
Nil
Nil
NANi
lNi
lNi
lNi
lNA
0.00
Tota
l Am
ount
` Cr
ore
0.00
0.00
0.00
0.00
NANA
NANA
NANA
NANA
NANA
0.00
Aver
age
Cost
per
MT
`0.
000.
000.
000.
00NA
NANA
NANA
NANA
NANA
NA0.
00L.
P.G.
/ LNG
/ Pr
opan
e/ IP
AQu
antit
y-(IP
A)M
T0.
000.
00To
tal A
mou
nt`
Cror
e0.
000.
00Av
erag
e Co
st p
er K
g`/
Kg0.
000.
00Na
tura
l Briq
utte
/ Co
al0.
000.
000.
00
Quan
tity
MT
0.00
0.00
0.00
0.00
Nil
Nil
Nil
Nil
NANi
lNi
lNi
lNi
lNi
l80
2329
.52
8719
17.1
778
3270
.83
1435
7641
1360
9055
.24
Tota
l Am
ount
` Cro
re0.
000.
000.
000.
00NA
NANA
NANA
NANA
NANA
NA15
8.68
352.
9430
3.77
4932
.55
5163
.47
Aver
age
Cost
per
MT
`0.
000.
000.
000.
00NA
NANA
NANA
NANA
NANA
NA19
77.7
040
47.9
038
78.1
634
35.4
937
94.1
4
Dis
clos
ure
of p
arti
cula
rs w
ith
resp
ect
to c
onse
rvat
ion
of e
nerg
y
Part
icul
ars
Unit
Year
En
ded
M
arch
31,
20
20
Year
En
ded
M
arch
31,
20
19
Year
En
ded
M
arch
31,
20
20
Year
En
ded
M
arch
31,
20
19
Year
En
ded
M
arch
31,
20
20
Year
En
ded
M
arch
31,
20
20
Year
En
ded
M
arch
31,
20
20
Year
En
ded
M
arch
31,
20
20
Year
En
ded
M
arch
31,
20
20
Year
En
ded
M
arch
31,
20
19
Year
En
ded
M
arch
31,
20
19
Year
En
ded
M
arch
31,
20
19
Year
En
ded
M
arch
31,
20
19
Year
En
ded
M
arch
31,
20
19
Year
En
ded
M
arch
31,
20
20
Year
En
ded
M
arch
31,
20
19
Year
En
ded
M
arch
31,
20
20
Year
En
ded
M
arch
31,
20
19
Year
En
ded
M
arch
31,
20
20
Year
En
ded
M
arch
31,
20
19
Busi
ness
Uni
t
Oil &
Gas
Copp
erIro
n-Or
ePo
wer
(600
MW
)Al
umin
ium
Met
Cok
e Di
visi
onPi
g Iro
n Di
visi
on
Pow
er
Plan
t (W
hr)
Min
ing
Goa
Min
ing
Karn
atak
aM
et C
oke
Divi
sion
Pig
Iron
Divi
sion
Pow
er
Plan
t (W
hr)
Min
ing
Goa
Min
ing
Karn
atak
aLa
njig
arh
Jhar
sugu
da
B. C
onsu
mpt
ion
per M
T
of P
rodu
ctio
n
0.00
0.00
0.00
Cont
inuo
us C
oppe
r Ro
d/Iro
n -O
re0.
000.
000.
00
Elec
tric
itym
Wh/
MT
0.00
0.00
0.52
0.52
0.0
0.3
0.1
NA0.
00.
00.
30.
1NA
0.0
0.00
Furn
ace
Oil
KL/M
T0.
000.
000.
050.
05Ni
lNi
lNi
lNi
lNA
Nil
Nil
Nil
Nil
Nil
0.00
Dies
elKL
/MT
0.00
0.00
0.00
0.00
0.0
0.0
0.0
0.0
0.0
0.0
0.0
0.0
0.0
0.0
0.00
L.P.
G./ P
ropa
ne/ I
PAM
T/M
T0.
000.
000.
060.
04NA
NANA
NANA
NANA
NANA
NA0.
00Pr
oduc
tion
of R
odM
T0.
000.
0011
4916
.00
1094
59.0
0NA
NANA
NANA
NANA
NANA
NA0.
00Al
umin
a0.
000.
000.
00El
ectr
icity
kWh/
MT
0.00
0.00
NANA
NANA
NANA
NANA
NANA
0.00
216.
7523
5.49
Coal
for S
team
MT/
MT
0.00
0.00
NANA
NANA
NANA
NANA
0.00
0.26
20.
261
Furn
ance
Oil
for
Calc
inat
onKg
/MT
0.00
0.00
NANA
NANA
NANA
NANA
NANA
0.00
70.5
971
.23
Hot M
etal
0.00
0.00
0.00
Elec
tric
ty
(Tot
al A
C fo
r el
ectro
lysis
and
auxil
lary
ene
rgy)
kWh/
MT
0.00
0.00
NANA
NANA
NANA
NANA
NANA
0.00
1409
0.45
1403
5.52
Bille
t (in
clud
ing
al
loy
rods
)0.
000.
000.
00
Elec
tric
itykW
h/M
T0.
000.
00NA
NANA
NANA
NANA
NANA
NA0.
0035
1.66
305.
32Fu
rnac
e Oi
lKL
0.00
0.00
NANA
NANA
NANA
NANA
NANA
0.00
Ingo
ts0.
000.
000.
00El
ectr
icity
kWh/
MT
0.00
0.00
NANA
NANA
NANA
NANA
NANA
0.00
34.2
232
.96
Furn
ace
Oil
KL0.
000.
00NA
NANA
NANA
NANA
NANA
NA0.
00W
ire R
ods
0.00
0.00
0.00
Elec
tric
itykW
h/M
T0.
000.
00NA
NANA
NANA
NANA
NANA
NA0.
0013
6.40
187.
79Fu
rnac
e Oi
lKL
0.00
0.00
NANA
NANA
NANA
NANA
NANA
0.00
Slab
sEl
ectr
icity
kWh/
MT
104.
54Fu
rnac
e Oi
lKL
Cast
Bar
Elec
tric
itykW
h/M
T27
0.61
Furn
ace
Oil
KL
* Th
is in
clud
es t
he W
HR
B G
ener
atio
n al
so.
**Th
is in
clud
es t
he F
O c
onsu
med
in C
PP a
lso.
***
This
incl
udes
Gen
erat
ion
from
DG
Set
als
o.
INTEGRATED REPORT
06-115MANAGEMENT REVIEW
116-167STATUTORY REPORTS
168-270FINANCIAL STATEMENTS
271-502
224 VEDANTA LIMITED INTEGRATED REPORT AND ANNUAL ACCOUNTS 2019-20 VEDANTA LIMITED INTEGRATED REPORT AND ANNUAL ACCOUNTS 2019-20 225

REPORT ON CORPORATE GOVERNANCE
edanta believes in wor ing towards Desh i arooraton e iye ascertaining that everything above the Earth comes from below the Earth. e, being a responsible globally diversi ed natural resources company, trust in unearthing and harnessing the in nite potential of natural resources in the most sustainable way to power the nation s progress. edanta, providing vital commodities needed for everyday life, endeavours to bring these blessings of the earth to you.
COMPANY’S PHILOSOPHY ON CODE OF GOVERNANCEOur Corporate Governance reflects the values, vision, mission and seven pillars of the Company. To perpetually ensure utmost trust and confidence of our stakeholders in us, transparency, accountability, excellence, veracity, safety and professionalism form an integral part of our functioning and practices.
The success of the Company is in consonance with the value generation for its shareholders. Vedanta, hence, believes that by ensuring highest standards of Corporate Governance and following global best practices, it is continuously evolving its performance goals and optimising sustainable yield for its shareholders.
Compliance with Global Guidelines and Best PracticesYour Company has been at the forefront in complying with global best practices in Corporate Governance.
During the financial year Vedanta Limited was awarded with the coveted Golden Peacock Global Award for Excellence in Corporate Governance in recognition of our outstanding commitment to corporate governance, transparency, ethics, risk management, diversity and inclusion, sustainability and involvement with its
Vedanta has maintained the highest standards of corporate governance all through its operations. Our sustainable development journey continues to create value for our stakeholders. We have invested our time and resources in introspecting our actions; we have achieved our targets and formulated ambitious new ones; we have adopted global best practices and taken innovative leaps; we have aligned our standards with industry benchmarks and charted some of our own. We have done all this and will continue to do it with a singular agenda: ensuring long-term growth of all stakeholders.
In addition to complying with the statutory guidelines, the Company has voluntarily adopted and evolved various practices of governance conforming to utmost ethical and responsible standards of business. These practices reflect the way business is conducted and value is generated.
Integrated ReportingSince its inception, Vedanta Limited has taken conscious efforts to operate in a manner responsible to all stakeholders. Every decision and action at the Company is taken after considering the impact they may have on the Company’s relevant stakeholder groups. This is a true reflection of the organisation’s integrated
SEVEN PILLARS OF VEDANTA
Guiding principles
Sustainability, Health, Safety &
Environment
Transparency and
Accountability
Policies & Regulatory Framework
Management/ Board and
Committees
Values & Ethics
Monitoring & Internal Control
Executing Strategy &
Managing Risk
PeopleValues, Ethics &
GovernanceGrowth
Digitalisation, Innovation, Technology
& Excellence
stakeholders and communities around the world. In a span of four years, this is the second time that the Company has been bestowed with this prestigious award by the Institute of Directors.
Golden Peacock Awards are regarded as a benchmark of corporate governance worldwide and have become a hallmark of excellence. This marks as a major milestone on our journey towards sustainably contributing to India’s growth and progress whilst maintaining transparency, reliability and integrity.
thinking, which takes into account all the resources and relationships that affect Company’s ability to create sustained value. These resources and relationships, termed ‘Capitals’, are stocks of value enabling Company’s operations.
SEBI vide circular no. SEBI/HO/CFD/CMD/CIR/P/2017/10 dated February 6, 2017 had recommended voluntary adoption of ‘Integrated Reporting’ (IR) from 2017-2018 by the top 500 listed companies in India.
While operating, your Company actively considers its external environment, the opportunities and challenges, the organisational strategy to respond to these externalities and the outputs and outcomes it produces basis its business activities. Starting FY 2017-18, the Company has proactively commenced reporting its annual performance and strategy using an integrated report, using the content elements and the guiding principles outlined in the International Integrated Reporting framework. The organisation has continued its Integrated Reporting journey and its FY 2019-20 performance and forward-looking strategy have been elucidated in the current Integrated Annual Report. The report takes into account the following six capitals while reporting:
FINANCIAL CAPITAL The Company is focussed on optimising capital allocation and maintaining a strong balance sheet while generating strong FCFs. It also reviews all investments, taking into account the Group’s financial resources with a view to maximising returns to shareholders.
HUMAN CAPITALThe Company has employees from across the world and it is committed to provide them with a safe and healthy work environment. In addition, by creating a culture that nurtures innovation, creativity and diversity, it enables them to grow personally and professionally while also helping to meet our business goals.
INTELLECTUAL CAPITALAs a relatively young Company, the Company is keen to embrace technological developments. The Company is setting up a centre of technological excellence in South Africa, enabling them to nurture and implement innovative ideas across the business, which lead to operational improvements.
MANUFACTURED CAPITALThe Company invests in assets including best-in-class equipment and machinery to ensure it operates as efficiently and safely as possible both at its current operations and in its expansion projects. This also supports its strong and sustainable cash flow generation.
NATURAL CAPITALIndia and Africa have favourable geology and mineral potential and these regions provide the Company with world-class mining assets, which are structurally at low cost and have extensive R&R. Additionally, operating the Company’s mines requires a range of resources, including water and energy, which the Company aims to use prudently and sustainably.
SOCIAL AND RELATIONSHIP CAPITALThe Company aims to forge strong partnerships by engaging with its key stakeholders, including shareholders and lenders, suppliers and contractors, employees, governments, communities and the society in general. These relationships help maintain and strengthen Vedanta’s licence to operate.
QualityGiving back to Community/
Society
INTEGRATED REPORT MANAGEMENT REVIEW STATUTORY REPORTS
168-270FINANCIAL STATEMENTS
271-50206-115 116-167
226 VEDANTA LIMITED INTEGRATED REPORT AND ANNUAL ACCOUNTS 2019-20 VEDANTA LIMITED INTEGRATED REPORT AND ANNUAL ACCOUNTS 2019-20 227

REPORT ON CORPORATE GOVERNANCE CONTINUED...
Vedanta’s Sustainability Reporting Journey Ensuring long-term growth for all stakeholders has been the cornerstone of our sustainability journey. We have embraced sustainability as a comprehensive, integrated business practice that involves collaboration, innovation, and a course of action. On the sustainability roadmap, we keep achieving our goals and formulating new ones, while continuously progressing towards lasting growth.
Your Company has been publishing the Sustainability Report for over a decade now. The Sustainability Report is prepared in accordance with the Global Reporting Initiative (GRI) Standards: Core option. It is mapped to the United Nations Global Compact (UNGC) and aligns to Sustainable Development Goals (SDGs). It reports our approach and disclosure towards triple bottom line principles – people, planet and profit.
Our sustainable development agenda is built on four pillars – Responsible Stewardship; Building Strong Relationships; Adding and Sharing Value; and Strategic Communications.
Vedanta applies its sustainability performance reporting criteria based on GRI Standards including the Mining and Metals and Oil & Gas Sector Disclosures, National Voluntary Guidelines on Social, Environmental and Economic Responsibilities of Business (NVG) framed by the Ministry of Corporate Affairs (MCA), Government of India, United Nations Global Compact (UNGC) principles, and standards set by International Council on Mining and Metals (ICMM), International Finance Corporation (IFC), Organisation for Economic Co-operation and Development (OECD) and Sustainable Development Goal frameworks for the Company.
The Sustainability Report of the Company can be accessed at https://www.vedantalimited.com
Tax Transparency Reporting We have a long-standing commitment to transparency and are proud of the value we generate and how this contributes to building trust with the communities in which we operate.
The Tax Governance and Strategy of the Company includes the following: � Substance, Transparency and Arm’s Length Principle; � Tax Risk Management; � Dynamic Tax Environment; � �Relationship with Tax Authorities and Dispute Resolution.
The Company has been publishing Tax Transparency Report (TTR) for providing an overview of the tax strategy, governance and tax contributions made by the Company and for ensuring greater transparency, and disclosure of profits made, and taxes paid. We consider this as an important part of our social license to operate. TTR is a voluntary initiative to ensure proactive transparency in tax reporting and greater accountability towards stakeholders which helps in getting detailed information about the overall economic contribution of Vedanta to the government of countries where it operates.
The report for the FY 2020 is available on the website at https://www.vedantalimited.com
BOARD OF DIRECTORSThe Board of Directors of the Company play the most pivotal role in overseeing the management, governance, performance, long-term success of business as a whole and protecting the long-term interests of all the stakeholders. The Board is entrusted with reviewing and approving the management’s strategic plan & business objectives and monitoring the Company’s strategic direction. The Board also ensures adherence to the highest standards of Corporate Governance and complete transparency in the functioning of the Company.
Company’s Board holds a fiduciary position, empowered to ensure that all the actions and decisions are aligned with the best interests of its stakeholders. It exercises independent judgement and plays a vital role in the oversight of the Company’s affairs.
To discharge its obligations effectively, the Board has constituted various board committees. Each of the committees has a clearly laid down charter and is entrusted with discharging its duties, roles and responsibilities. Further, the details pertaining to each of the committees have been provided in subsequent section of this report.
Chairman and other Key Managerial Personnel (KMPs)The Chairman’s principal responsibility is for the effective running of the Board by acting as the leader of the Board and by presiding over the meetings of the Board and the shareholders. He is entrusted with overseeing overall conduct of the Board and ensuring that it adheres to the statutory requirements and best governance practices in letter and spirit.
Effective leadership and governance of the Board allows the Directors to focus on the crucial strategic, financial and operational issues, to make informed decisions and be comfortable to challenge any uncertainties, as well as ensuring a transparent approach in communicating with Shareholders.
In our constant endeavour to adhere to the global best practices and in line with the SEBI recommendations, Mr. Anil Agarwal has been appointed as the Non-Executive Chairman of the Company effective April 1, 2020.
The roles of the Chairman of the Board and the Chief Executive Officer (CEO) have a clear division of responsibilities and duties as the positions are held by separate individuals. Apart from this, the Company also has a separately designated Chief Financial Officer and Company Secretary & Compliance Officer.
Following were the changes in the position of Directors/Key Managerial Personnel (KMPs) of the Company:
� �Mr. Tarun Jain was re-appointed as a Non-Executive Director w.e.f. April 1, 2019 for a period of 1 year and effective April 1, 2020, he ceased to be a Director of the Company;
� �Mr. Ravi Kant ceased to be Independent Director of the Company w.e.f. close of business hours on May 31, 2019 consequent to completion of his tenure;
� �Mr. MK Sharma was appointed as an Independent Director w.e.f. June 1, 2019 to May 3, 2022;
� �Mr. GR Arun Kumar was re-appointed as a Whole-Time Director & CFO w.e.f. November 22, 2019 for a term of 2 years;
� �Shareholders approved continuation of directorship of Mr. K Venkataramanan as an Independent Director from the day he attained the age of 75 years i.e. December 11, 2019 till the expiry of his current term till March 31, 2020 and further re-appointed him for a 2nd and final term of one year effective from April 1, 2020 till March 31, 2021;
� �Mr. Anil Agarwal was appointed as Non-Executive Director designated as Chairman of the Board w.e.f. April 1, 2020;
� �Mr. Navin Agarwal was re-designated as Executive Vice Chairman of the Board w.e.f. April 1, 2020;
SHAREHOLDERS
CEO
Management Committee & Executive Committee
Audit Committee
Sustainablity Committee
Committee of Directors
Nomination & Remuneration
Committee
Risk ManagementCommittee
Share & Debenture
Transfer Committe
Finance Standing Committee of
Directors
Stakeholder RelationshipCommittee
Corporate Social Responsibility
Committee
BOARD OF DIRECTORS
INTEGRATED REPORT MANAGEMENT REVIEW STATUTORY REPORTS
168-270FINANCIAL STATEMENTS
271-50206-115 116-167
228 VEDANTA LIMITED INTEGRATED REPORT AND ANNUAL ACCOUNTS 2019-20 VEDANTA LIMITED INTEGRATED REPORT AND ANNUAL ACCOUNTS 2019-20 229

� �Mr. S Venkatakrishnan resigned from the position of Whole-Time Director & CEO w.e.f. close of business hours on April 5, 2020;
� �Mr. Sunil Duggal, Whole-Time Director & CEO of Hindustan Zinc Limited (subsidiary of the Company) has taken additional charge as Interim Chief Executive Officer and Key Managerial Personnel of the Company w.e.f. April 6, 2020;
� �Mr. Aman Mehta ceased to be Independent Director of the Company w.e.f. close of business hours on May 16, 2020 consequent to completion of his tenure;
� �Ms. Priya Agarwal has been re-appointed as the Non-Executive Director of the Company w.e.f. May 17, 2020 for a term of 3 years.
Senior ManagementSound corporate governance commences with engaged, proficient, and experienced Board, KMPs and Senior Management, along with clear lines of responsibility and accountability.
Pursuant to the provisions of the Companies Act, 2013 and the Securities and Exchange Board of India (Listing Obligations and Disclosure Requirements), Regulations, 2015 (‘Listing Regulations’) and keeping in mind the critical nature of the business of the group and its strategic growth vision, the Nomination and Remuneration Committee (NRC) of the Company has identified certain positions as Senior Management.
The Senior Management, develops the business strategy, undertakes significant decisions to implement that strategy, and manages the day-to-day decisions to ensure that these decisions are in parity with the long-term objectives and policies of the Company. Further, the Board oversees the development of the overall business strategy and the decisions made by senior management in the pursuit of strategic objectives.
The appointments, removal, remuneration etc. of the Senior Managerial Personnel is evaluated and recommended by the NRC to the Board for its approval. Further, on an annual basis, the Senior Management provides their disclosures along with affirmation to the Code of Business Conduct and Ethics of the Company.
Si e, Composition and Board RefreshmentsThe Board believes that it is essential to have an appropriate balance between Executive, Non-Executive and Independent Directors to promote shareholder interests and govern the Company effectively. Hence, the Company maintains an optimum combination of Directors in compliance with the Companies Act, 2013 (‘Act’), the Listing Regulations, and is also in line with the global best practices.
As on March 31, 2020, the Board comprises of ten members, consisting of one Executive Chairman, two Executive Directors, two Non-Executive Directors including one Woman Director and five Non-Executive Independent Directors including one Woman Director.
REPORT ON CORPORATE GOVERNANCE CONTINUED...
The details of tenure of the Directors as on March 31, 2020 is given below:
Name of DirectorInitial Date of Appointment
Current Tenure From Tenure Till
Tenure as on March 31, 2020
(in years)(Months/12)
Executive DirectorsMr. Navin Agarwal(1) August 17,
2013August 1, 2018
July 31, 2023 6.58
Mr. GR Arun Kumar(2) November 22, 2016
November 22, 2019
November 21, 2021
3.33
Mr. S Venkatakrishnan(3) (Ceased to be Director w.e.f. close of business hours on April 5, 2020)
March 1, 2019
March 1, 2019
April 5, 2020 1.08
Non-Executive Independent DirectorsMr. MK Sharma(4) June 1, 2019 June 1, 2019 May 3, 2022 0.83Mr. K Venkataramanan(5) April 1,
2017April 1, 2020
March 31, 2021
3.00
Ms. Lalita D. Gupte(6) January 29, 2015
January 29, 2018
August 10, 2021
5.17
Mr. Aman Mehta(7) (Ceased to be Director w.e.f. close of business hours on May 16, 2020)
May 17, 2017
May 17, 2017
May 16, 2020
2.83
Mr. UK Sinha March 13, 2018
March 13, 2018
August 10, 2021
2.00
Non-Executive DirectorsMs. Priya Agarwal(8) May 17, 2017 May 17, 2020 May 16, 2023 2.83Mr. Tarun Jain (9) (Ceased to be Director w.e.f. April 1, 2020)
April 1, 2014 April 1, 2019 March 31, 2020
6.00
(1)� �Mr. Anil Agarwal was appointed as Non-Executive Director designated as Chairman of the Board w.e.f. April 1, 2020 pursuant to which, Mr. Navin Agarwal was re-designated as Executive Vice Chairman of the Board effective April 1, 2020.
(2)� �Mr. GR Arun Kumar has been re-appointed as a Whole-Time Director & CFO w.e.f. November 22, 2019.(3)� �Mr. S Venkatakrishnan resigned from the position of Whole-Time Director & CEO w.e.f. close of business hours on April 5, 2020.(4)� �Mr. MK Sharma was appointed as a Non-Executive Independent Director w.e.f. June 1, 2019 to May 3, 2022.(5)� �In terms of Regulation 17(1A) of SEBI Listing Regulations, the shareholders through special resolution passed by Postal Ballot on
December 6, 2019, approved continuation of directorship of Mr. K Venkataramanan as a Non-Executive Independent Director from the day he attained the age of 75 years i.e., December 11, 2019 till the expiry of his current term till March 31, 2020. Further, Mr. Venkataramanan has also been re-appointed for a 2nd and final term of one year effective from April 1, 2020 till March 31, 2021 notwithstanding that he has attained the age of 75 years.
(6)� �On March 29, 2014, Ms. Lalita D. Gupte was appointed in ‘casual vacancy’ as an Independent Director. On January 29, 2015, she was appointed as an Independent Director under Section 149 of the Companies Act, 2013 for a fixed term of 3 years. Further, the appointment was confirmed by the Shareholders by way of resolution passed through Postal Ballot on March 30, 2015.
(7)� �Mr. Aman Mehta ceased to be Independent Director of the Company w.e.f. close of business hours on May 16, 2020 consequent to completion of his tenure.
(8)� �Ms. Priya Agarwal has been re-appointed as the Non-Executive Director of the Company w.e.f May 17, 2020 for a term of 3 years.(9)� �Mr. Tarun Jain was re-appointed as a Non-Executive Director w.e.f. April 1, 2019 for a period of one year and effective April 1, 2020, he
ceased to be a Director of the Company.
Composition of Board
(%)Executive Chairman 10
Executive Director 20
Non-Executive Director 20
Independent Director 50
Tenure of Directors
0-2 years 3
2-4 years 4
4-6 years 2
Above 6 years 1
Women20%
Men80%
INTEGRATED REPORT MANAGEMENT REVIEW STATUTORY REPORTS
168-270FINANCIAL STATEMENTS
271-50206-115 116-167
230 VEDANTA LIMITED INTEGRATED REPORT AND ANNUAL ACCOUNTS 2019-20 VEDANTA LIMITED INTEGRATED REPORT AND ANNUAL ACCOUNTS 2019-20 231
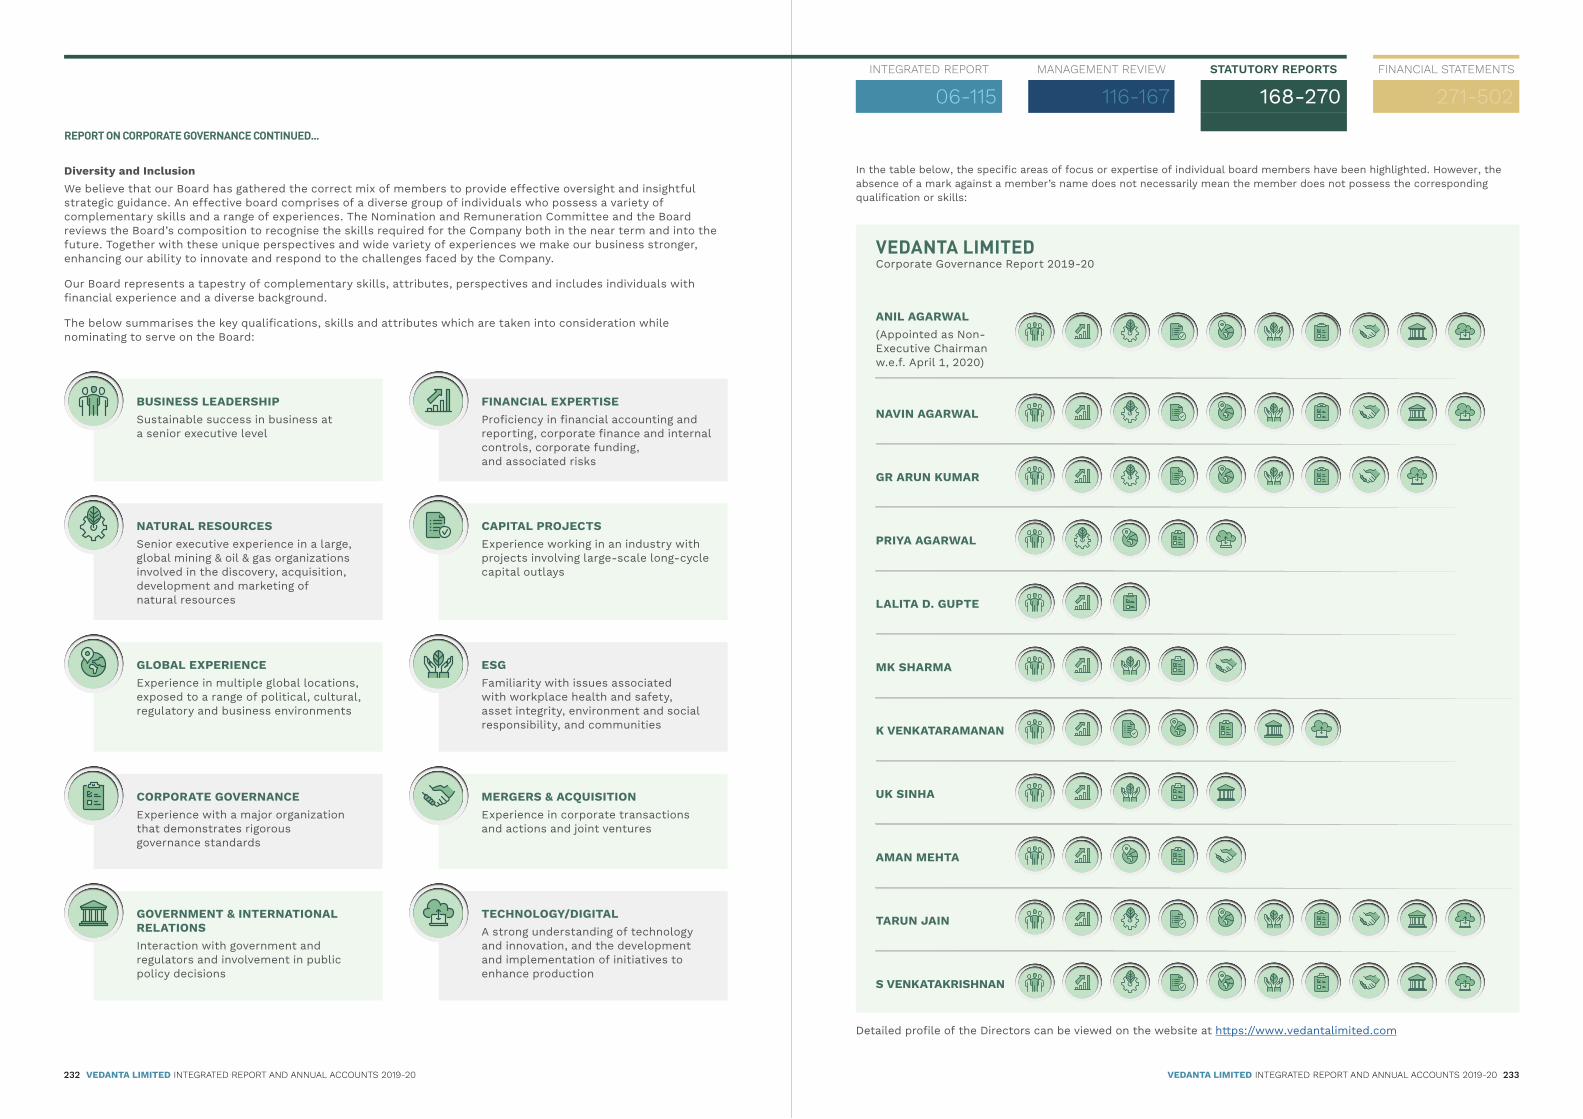
Diversity and Inclusion We believe that our Board has gathered the correct mix of members to provide effective oversight and insightful strategic guidance. An effective board comprises of a diverse group of individuals who possess a variety of complementary skills and a range of experiences. The Nomination and Remuneration Committee and the Board reviews the Board’s composition to recognise the skills required for the Company both in the near term and into the future. Together with these unique perspectives and wide variety of experiences we make our business stronger, enhancing our ability to innovate and respond to the challenges faced by the Company.
Our Board represents a tapestry of complementary skills, attributes, perspectives and includes individuals with financial experience and a diverse background.
The below summarises the key qualifications, skills and attributes which are taken into consideration while nominating to serve on the Board:
REPORT ON CORPORATE GOVERNANCE CONTINUED...
In the table below, the specific areas of focus or expertise of individual board members have been highlighted. However, the absence of a mark against a member’s name does not necessarily mean the member does not possess the corresponding qualification or skills:
BUSINESS LEADERSHIPSustainable success in business at a senior executive level
NATURAL RESOURCESSenior executive experience in a large, global mining & oil & gas organizations involved in the discovery, acquisition, development and marketing of natural resources
GLOBAL EXPERIENCEExperience in multiple global locations, exposed to a range of political, cultural, regulatory and business environments
GOVERNMENT & INTERNATIONAL RELATIONSInteraction with government and regulators and involvement in public policy decisions
CORPORATE GOVERNANCEExperience with a major organization that demonstrates rigorous governance standards
FINANCIAL EXPERTISEProficiency in financial accounting and reporting, corporate finance and internal controls, corporate funding, and associated risks
CAPITAL PROJECTSExperience working in an industry with projects involving large-scale long-cycle capital outlays
ESGFamiliarity with issues associated with workplace health and safety, asset integrity, environment and social responsibility, and communities
TECHNOLOGY/DIGITALA strong understanding of technology and innovation, and the development and implementation of initiatives to enhance production
MERGERS & ACQUISITIONExperience in corporate transactions and actions and joint ventures
Detailed profile of the Directors can be viewed on the website at https://www.vedantalimited.com
ANIL AGARWAL(Appointed as Non-Executive Chairman w.e.f. April 1, 2020)
NAVIN AGARWAL
GR ARUN KUMAR
PRIYA AGARWAL
LALITA D. GUPTE
MK SHARMA
K VENKATARAMANAN
UK SINHA
AMAN MEHTA
TARUN JAIN
S VENKATAKRISHNAN
VEDANTA LIMITEDCorporate Governance Report 2019-20
INTEGRATED REPORT MANAGEMENT REVIEW STATUTORY REPORTS
168-270FINANCIAL STATEMENTS
271-50206-115 116-167
232 VEDANTA LIMITED INTEGRATED REPORT AND ANNUAL ACCOUNTS 2019-20 VEDANTA LIMITED INTEGRATED REPORT AND ANNUAL ACCOUNTS 2019-20 233
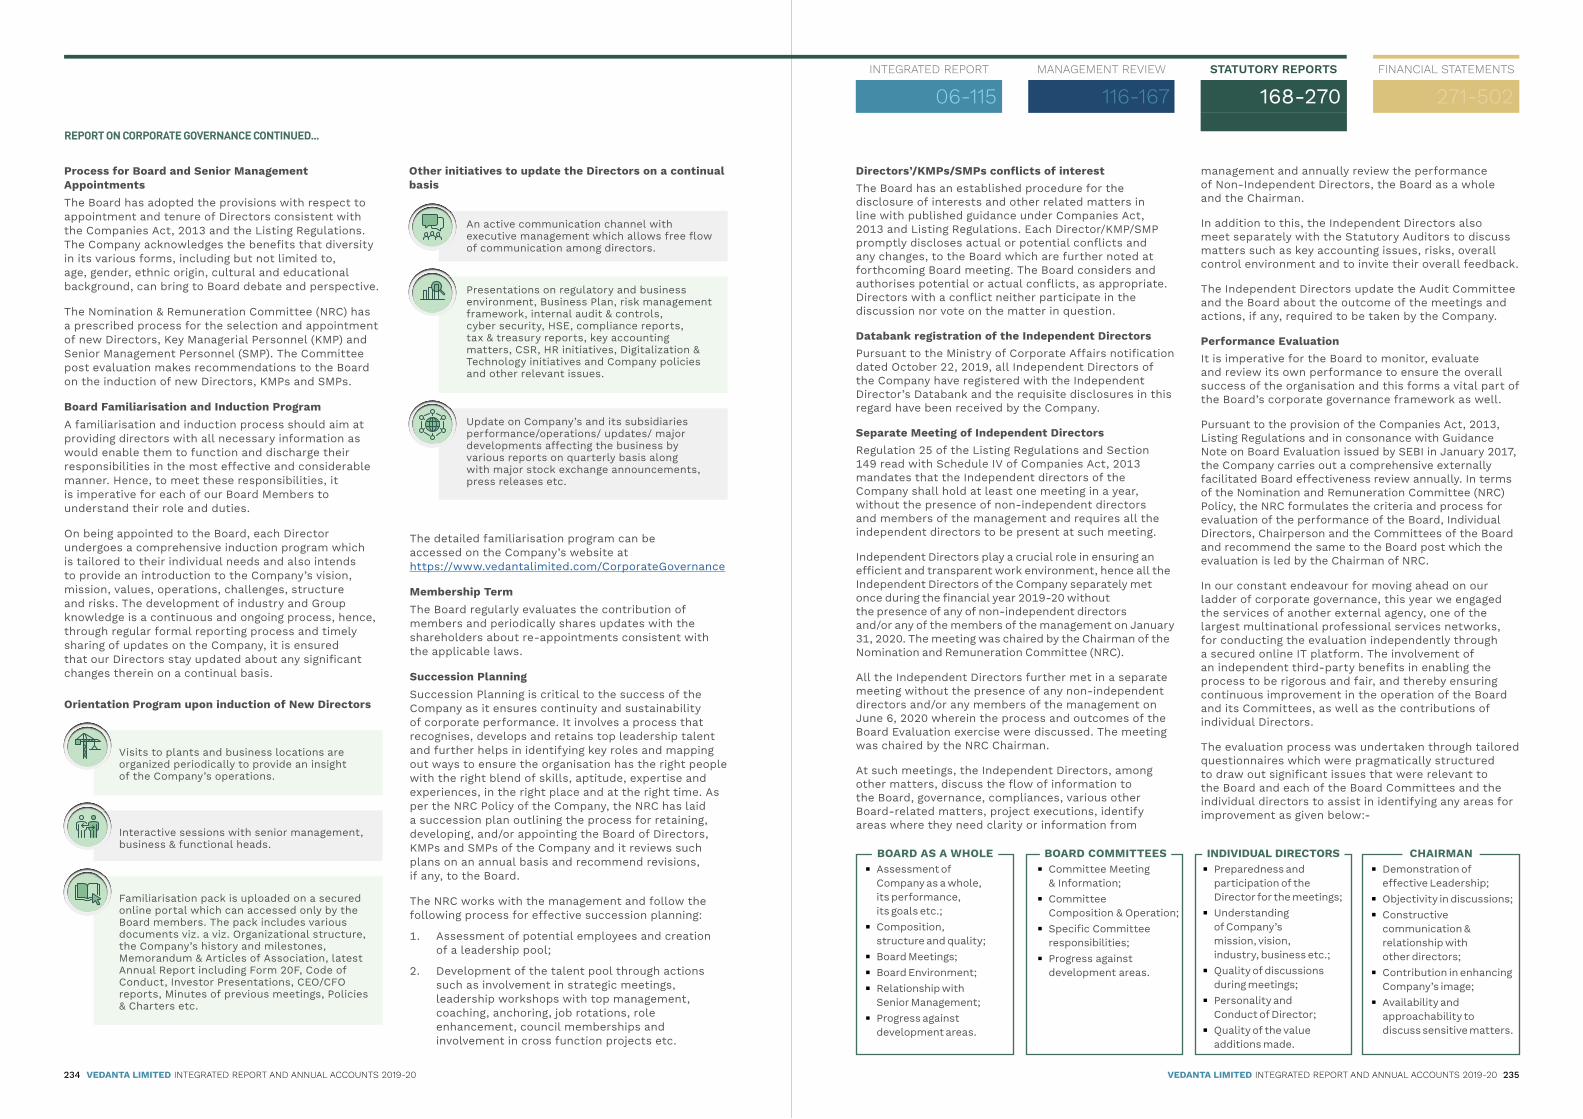
Process for Board and Senior Management Appointments The Board has adopted the provisions with respect to appointment and tenure of Directors consistent with the Companies Act, 2013 and the Listing Regulations. The Company acknowledges the benefits that diversity in its various forms, including but not limited to, age, gender, ethnic origin, cultural and educational background, can bring to Board debate and perspective.
The Nomination & Remuneration Committee (NRC) has a prescribed process for the selection and appointment of new Directors, Key Managerial Personnel (KMP) and Senior Management Personnel (SMP). The Committee post evaluation makes recommendations to the Board on the induction of new Directors, KMPs and SMPs.
Board Familiarisation and Induction ProgramA familiarisation and induction process should aim at providing directors with all necessary information as would enable them to function and discharge their responsibilities in the most effective and considerable manner. Hence, to meet these responsibilities, it is imperative for each of our Board Members to understand their role and duties.
On being appointed to the Board, each Director undergoes a comprehensive induction program which is tailored to their individual needs and also intends to provide an introduction to the Company’s vision, mission, values, operations, challenges, structure and risks. The development of industry and Group knowledge is a continuous and ongoing process, hence, through regular formal reporting process and timely sharing of updates on the Company, it is ensured that our Directors stay updated about any significant changes therein on a continual basis.
REPORT ON CORPORATE GOVERNANCE CONTINUED...
Orientation Program upon induction of New Directors
Other initiatives to update the Directors on a continual basis
The detailed familiarisation program can be accessed on the Company’s website at https://www.vedantalimited.com/CorporateGovernance
Membership TermThe Board regularly evaluates the contribution of members and periodically shares updates with the shareholders about re-appointments consistent with the applicable laws.
Succession PlanningSuccession Planning is critical to the success of the Company as it ensures continuity and sustainability of corporate performance. It involves a process that recognises, develops and retains top leadership talent and further helps in identifying key roles and mapping out ways to ensure the organisation has the right people with the right blend of skills, aptitude, expertise and experiences, in the right place and at the right time. As per the NRC Policy of the Company, the NRC has laid a succession plan outlining the process for retaining, developing, and/or appointing the Board of Directors, KMPs and SMPs of the Company and it reviews such plans on an annual basis and recommend revisions, if any, to the Board.
The NRC works with the management and follow the following process for effective succession planning:
1.� �Assessment of potential employees and creation of a leadership pool;
2.� �Development of the talent pool through actions such as involvement in strategic meetings, leadership workshops with top management, coaching, anchoring, job rotations, role enhancement, council memberships and involvement in cross function projects etc.
Directors’/KMPs/SMPs con icts of interest The Board has an established procedure for the disclosure of interests and other related matters in line with published guidance under Companies Act, 2013 and Listing Regulations. Each Director/KMP/SMP promptly discloses actual or potential conflicts and any changes, to the Board which are further noted at forthcoming Board meeting. The Board considers and authorises potential or actual conflicts, as appropriate. Directors with a conflict neither participate in the discussion nor vote on the matter in question.
Databank registration of the Independent DirectorsPursuant to the Ministry of Corporate Affairs notification dated October 22, 2019, all Independent Directors of the Company have registered with the Independent Director’s Databank and the requisite disclosures in this regard have been received by the Company.
Separate Meeting of Independent DirectorsRegulation 25 of the Listing Regulations and Section 149 read with Schedule IV of Companies Act, 2013 mandates that the Independent directors of the Company shall hold at least one meeting in a year, without the presence of non-independent directors and members of the management and requires all the independent directors to be present at such meeting.
Independent Directors play a crucial role in ensuring an efficient and transparent work environment, hence all the Independent Directors of the Company separately met once during the financial year 2019-20 without the presence of any of non-independent directors and/or any of the members of the management on January 31, 2020. The meeting was chaired by the Chairman of the Nomination and Remuneration Committee (NRC).
All the Independent Directors further met in a separate meeting without the presence of any non-independent directors and/or any members of the management on June 6, 2020 wherein the process and outcomes of the Board Evaluation exercise were discussed. The meeting was chaired by the NRC Chairman.
At such meetings, the Independent Directors, among other matters, discuss the flow of information to the Board, governance, compliances, various other Board-related matters, project executions, identify areas where they need clarity or information from
management and annually review the performance of Non-Independent Directors, the Board as a whole and the Chairman.
In addition to this, the Independent Directors also meet separately with the Statutory Auditors to discuss matters such as key accounting issues, risks, overall control environment and to invite their overall feedback.
The Independent Directors update the Audit Committee and the Board about the outcome of the meetings and actions, if any, required to be taken by the Company.
Performance EvaluationIt is imperative for the Board to monitor, evaluate and review its own performance to ensure the overall success of the organisation and this forms a vital part of the Board’s corporate governance framework as well.
Pursuant to the provision of the Companies Act, 2013, Listing Regulations and in consonance with Guidance Note on Board Evaluation issued by SEBI in January 2017, the Company carries out a comprehensive externally facilitated Board effectiveness review annually. In terms of the Nomination and Remuneration Committee (NRC) Policy, the NRC formulates the criteria and process for evaluation of the performance of the Board, Individual Directors, Chairperson and the Committees of the Board and recommend the same to the Board post which the evaluation is led by the Chairman of NRC.
In our constant endeavour for moving ahead on our ladder of corporate governance, this year we engaged the services of another external agency, one of the largest multinational professional services networks, for conducting the evaluation independently through a secured online IT platform. The involvement of an independent third-party benefits in enabling the process to be rigorous and fair, and thereby ensuring continuous improvement in the operation of the Board and its Committees, as well as the contributions of individual Directors.
The evaluation process was undertaken through tailored questionnaires which were pragmatically structured to draw out significant issues that were relevant to the Board and each of the Board Committees and the individual directors to assist in identifying any areas for improvement as given below:-
� �Assessment of Company as a whole, its performance, its goals etc.;
� �Composition, structure and quality;
� Board Meetings; � Board Environment; � �Relationship with Senior Management;
� �Progress against development areas.
� �Committee Meeting & Information;
� �Committee Composition & Operation;
� �Specific Committee responsibilities;
� �Progress against development areas.
� �Preparedness and participation of the Director for the meetings;
� �Understanding of Company’s mission, vision, industry, business etc.;
� �Quality of discussions during meetings;
� �Personality and Conduct of Director;
� �Quality of the value additions made.
� �Demonstration of effective Leadership;
� �Objectivity in discussions; � �Constructive communication & relationship with other directors;
� �Contribution in enhancing Company’s image;
� �Availability and approachability to discuss sensitive matters.
BOARD AS A WHOLE BOARD COMMITTEES INDIVIDUAL DIRECTORS CHAIRMAN
Visits to plants and business locations are organized periodically to provide an insight of the Company’s operations.
Interactive sessions with senior management, business & functional heads.
Familiarisation pack is uploaded on a secured online portal which can accessed only by the Board members. The pack includes various documents viz. a viz. Organizational structure, the Company’s history and milestones, Memorandum & Articles of Association, latest Annual Report including Form 20F, Code of Conduct, Investor Presentations, CEO/CFO reports, Minutes of previous meetings, Policies & Charters etc.
An active communication channel with executive management which allows free flow of communication among directors.
Presentations on regulatory and business environment, Business Plan, risk management framework, internal audit & controls, cyber security, HSE, compliance reports, tax & treasury reports, key accounting matters, CSR, HR initiatives, Digitalization & Technology initiatives and Company policies and other relevant issues.
Update on Company’s and its subsidiaries performance/operations/ updates/ major developments affecting the business by various reports on quarterly basis along with major stock exchange announcements, press releases etc.
INTEGRATED REPORT MANAGEMENT REVIEW STATUTORY REPORTS
168-270FINANCIAL STATEMENTS
271-50206-115 116-167
234 VEDANTA LIMITED INTEGRATED REPORT AND ANNUAL ACCOUNTS 2019-20 VEDANTA LIMITED INTEGRATED REPORT AND ANNUAL ACCOUNTS 2019-20 235

REPORT ON CORPORATE GOVERNANCE CONTINUED...
Outcome of Performance EvaluationThe evaluation process endorsed the Board’s assurance on the ethical standards of the Company, constructive relationship between the Board and the Management and ensured that Board, as a whole, has been functioning as a cohesive body, well engaged with different perspectives.
As an outcome of the evaluation process for FY 2019-20, the overall findings of the process showed that the Company’s Board and its various Committees were working well with all Board members displaying strong backgrounds and diverse complementarities, in turn, contributing to immense value addition at the meetings by making them participative and engaging.
The Board members had provided constructive suggestions in order to further enhance the effectiveness of the Board Committees and the Board had expressed overall satisfaction on the entire Board Evaluation process and further appreciated the Chairman and Vice-Chairman for being accessible, transparent, receptive to new ideas and for their productive feedback approach.
Time commitment & other DirectorshipsThe Directors are all required to commit sufficient time to fulfil their responsibilities. The Directors may serve on several other boards provided they continue to demonstrate their commitment to their role as Directors of the Company.
Directorship and Committee Membership of Directors
� The above directorships include Vedanta Limited. � �The no. of directorships excludes foreign companies but includes Private Companies and Companies under Section 8 of
Companies Act, 2013. � �For the membership and chairpersonship in Committees only Audit Committee and Stakeholder Relationship Committee have been
considered as per Regulation 26 of the Listing Regulations. Also, all public limited companies, whether listed or not, have been included and all other companies including private limited companies, foreign companies and companies under Section 8 of the Companies Act, 2013 have been excluded.
Directorship in other Listed Companies in India:
Name of DirectorName of the Listed Entity including Debt Listed EntitiesName of Entity Category
Mr. Anil Agarwal (00010883)(1)
(Appointed as Non-Executive Chairman w.e.f. April 1, 2020)
•� Sterlite Technologies Limited Non-Executive Chairman
Mr. Navin Agarwal (00006303) •� Hindustan Zinc Limited DirectorMr. Aman Mehta (00009364)(Ceased to be a Director w.e.f. close of business hours on May 16, 2020)
•� Wockhardt Limited Independent Director•� Tata Steel Limited Independent Director•� Godrej Consumer Products Limited Independent Director•� Max Financial Services Limited Independent Director
Mr. K Venkataramanan (00001647) •� Kirloskar Pneumatic Company Limited Independent Director•� Nilkamal Limited Independent Director
Ms. Lalita D. Gupte (00043559) •� Godrej Properties Limited Independent Director•� Bharat Forge Limited Independent Director•� �India InfraDebt Limited (Only Debt Listed) Chairperson & Independent Director•� �ICICI Lombard General Insurance
Company LimitedChairperson & Independent Director
•� TVS Motor Company Limited Independent DirectorMr. UK Sinha (00010336) •� Havells India Limited Independent Director
•� �Housing Development Finance Corporation Limited
Independent Director
Mr. MK Sharma (00327684) •� Wipro Limited Independent Director•� Asian Paints Limited Independent Director•� United Spirits Limited Chairperson & Independent Director•� Ambuja Cements Limited Non-Executive Non-Independent
DirectorMs. Priya Agarwal (05162177) - -Mr. GR Arun Kumar (01874769) - -Mr. Tarun Jain (00006843)(Ceased to be a Director w.e.f. April 1, 2020)
•� �Bharat Aluminium Company Limited (Only Debt Listed)
Director
Mr. S. Venkatakrishnan (08364908)(Ceased to be a Director w.e.f. close of business hours on April 5, 2020)
- -
Further, w.r.t. directorship and membership of the Directors, it is hereby confirmed that:
1.� None of the Directors:� a)� �are a Director in more than ten (10) public limited companies in terms of Section 165 of
Companies Act, 2013;� b)� �hold directorship in more than seven (07) listed entities pursuant to Regulation 17A(1) of Listing Regulations;� c)� �acts as an Independent Director in more than seven (07) listed entities pursuant to Regulation 17A(1) of
Listing Regulations;� d)� �are serving as an Independent Director in more than three (03) listed entities in case they are Whole-Time
Director of the Company pursuant to Regulation 17A(2) of Listing Regulations;� e)� �are members of more than ten (10) board level committees of Indian public limited companies;� f)� �are Chairperson of more than five (05) committees, across all companies in which they are directors;� g)� �are related to other Directors except Ms. Priya Agarwal, Mr. Navin Agarwal and Mr. Anil Agarwal. Ms. Priya
Agarwal is the daughter of Mr. Anil Agarwal and Mr. Anil Agarwal is the elder brother of Mr. Navin Agarwal; � h)� �serving as an Independent Director has resigned before the expiry of his tenure;� i)� �who are serving as a Non-Executive Director, have attained the age of seventy-five years except
Mr. K Venkataramanan. In terms of Reg 17(1A) of Listing Regulations, necessary shareholder approval has already been taken for Mr. K Venkataramanan.
2.� �Mr. GR Arun Kumar and Mr. Tarun Jain were directors and nominee members in Vedanta Star Limited (VSL), a subsidiary of Vedanta Limited. The Hon’ble National Company Law Tribunal, Kolkata Bench vide its Order dated January 31, 2020 had approved the Scheme of Amalgamation of VSL with Electrosteel Steels Limited (ESL). With effect from March 25, 2020 (Appointed Date: October 1, 2018), VSL has been merged with ESL. Accordingly, Mr. GR Arun Kumar and Mr. Tarun Jain ceased to be directors in VSL.
Tailored uestionnaires
prepared by external agency and con rmed
ith the Chairperson o NRC
ecured online plat orm or providing the responses
Results o the evaluation compiled by the external agency ithout involvement o the management
Outcome and eedbac
discussed at the RC eparate eeting o
Ds and oard eeting and
Action Plan agreed
Results ere shared as ollo s: � �Evaluation results for Executive Directors and Chairman - directly with Chairperson of NRC;
� �Evaluation results for all individual directors - directly with the Chairman of the Board and to respective directors;
� �Evaluation of the Board and Committees effectiveness - directly with all the Members.
Mr. Anil Agarwal
3
Mr. UK Sinha
6 3
Mr. Navin Agarwal
3
Ms. Priya Agarwal
1
Mr. Aman Mehta
5 6 2
Mr. GR Arun Kumar
5 1
Ms. Lalita D Gupte
6 7 2
Mr. MK Sharma
11 6 4
Mr. K Venkataramanan
5 3
Mr. Tarun Jain
6 2
Mr. S Venkatakrishnan
1 1
Appointed as Non-Executive Chairman w.e.f. April 1, 2020
Ceased to be a Director w.e.f. close of business hours on May 16, 2020
Ceased to be Director w.e.f. April 1, 2020
Ceased to be a Director w.e.f. close of business hours on April 5, 2020
No. of Directorships Membership in Committees Chairperson in Committees
INTEGRATED REPORT MANAGEMENT REVIEW STATUTORY REPORTS
168-270FINANCIAL STATEMENTS
271-50206-115 116-167
236 VEDANTA LIMITED INTEGRATED REPORT AND ANNUAL ACCOUNTS 2019-20 VEDANTA LIMITED INTEGRATED REPORT AND ANNUAL ACCOUNTS 2019-20 237

REPORT ON CORPORATE GOVERNANCE CONTINUED...
Meetings of the Board & Committees
3.� �Mr. UK Sinha is a Director in Saumitra Research & Consulting Private Limited which is under the process of Striking Off.
4.� �The Company has received declarations from all the Independent Directors of the Company confirming that they meet the criteria of independence prescribed under the Act and the Listing Regulations.
5.� �The details of shareholding of the Directors of the Company are detailed in the Directors Report forming part of the Annual Report.
Board & Executive Leadership Remuneration PolicyThe Remuneration Policy is significant in ensuring that competitive and impartial rewards are linked to key deliverables and are also in line with market practices and shareholders’ expectations.
The NRC ensures that remuneration policies and practices are framed and intended to attract, retain and encourage the Executive Directors (ED) and the senior management group, while simultaneously meeting the delivery of the Group’s strategic and business objectives. The NRC further ensures the interests of the Executive Directors and the senior management group are aligned with those of shareholders, to build a sustainable performance environment.
Remuneration Components:The ED remuneration has two components: fixed pay and annual variable pay including stock incentives (performance linked incentive). The fixed component is based upon the industry practice and benchmarks considering the experience, skill, knowledge and job
responsibilities. The performance linked incentive is linked to the achievement of the Company and individual performance goals. Such variable compensation is ‘at risk’, and rewards performance and contributions to both short-term and long-term financial performance of the Company. The remuneration of the EDs is governed by the agreements executed with them, subject to the approval of the Board and of the shareholders in general meetings and such other approvals as may be necessary.
The Non-Executive Independent Directors are paid remuneration by way of commission and sitting fees. The appointment letter detailing the terms and conditions of appointment of Non-Executive Independent Directors is available on the Company’s website https://www.vedantalimited.com. The Board decides the payment of commission within the limits approved by the members subject to the limit not exceeding 1% of the net profits of the Company. Further, it may be noted that no stock options were issued to the Non-Executive Independent Directors during the year.
The details of remuneration paid/payable to the Directors during FY 2019-20 are as follows:
Remuneration paid or payable to Directors for the year ended March 31, 2020
Name of the Director
Relationship with other Directors(1) Sitting Fees
Salary and Perquisites
Provident and Superannuation
Funds(2)
Commission to non-executive directors/
performance incentive for the
executive directors(3) Total
Vedanta Limited ESOS 2016, ESOS 2017, ESOS 2018,
ESOS 2019(4)
Executive DirectorsNavin Agarwal(1)(5) None - 106,540,392 5,879,400 58,198,160 170,617,952 -GR Arun Kumar None - 35,012,027 3,085,840 20,006,757 58,104,624 360,850S Venkatakrishnan(6) None - 97,240,456 1,487,050 16,720,555 115,448,061 -Total - 238,792,875 10,452,290 94,925,472 344,170,637 360,850Independent Non-Executive DirectorsAman Mehta None 900,000 - - 7,500,000 8,400,000 - K Venkataramanan None 550,000 - - 7,500,000 8,050,000 -Lalita D Gupte None 1,050,000 - - 7,500,000 8,550,000 -MK Sharma(7) None 850,000 - - 6,250,000 7,100,000UK Sinha None 900,000 - - 7,500,000 8,400,000 -Ravi Kant(8) None 150,000 - - 1,250,000 1,400,000 -Total 4,400,000 - - 37,500,000 41,900,000 - Non-Independent Non-Executive DirectorsPriya Agarwal(1) None 400,000 - - 7,500,000 7,900,000 - Tarun Jain(9) None 400,000 - - 30,000,000 30,400,000 -Total 800,000 - - 37,500,000 38,300,000 -Grand Total 5,200,000 238,792,875 10,452,290 169,925,472 424,370,637 360,850
otes: (1)� �Mr. Anil Agarwal has been appointed as Non-Executive
Chairman w.e.f. April 1, 2020. Ms. Priya Agarwal is the daughter of Mr. Anil Agarwal and Mr. Anil Agarwal is the elder brother of Mr. Navin Agarwal.
(2)� �Value of Perquisites u/s 17(2) of Income-tax Act, 1961 does not include perquisite value of Superannuation. However, contribution to Superannuation is shown under ‘Others’. Further as the liabilities for defined benefit plan, i.e. gratuity is provided on accrual basis for the Company as a whole, the amounts pertaining to WTDs & Key Management Personnel are not included above.
(3)� �The Annual Performance bonus to Executive Directors & KMPs is for FY 2018-19 which is paid during FY 2019-20.
(4)� �The ESOS 2016 options vested upon completion of performance period with approval from Nomination and Remuneration Committee on January 31, 2020.
� �The ESOS 2017 options vests after three years from date of grant i.e. on September 1, 2020, based on achievement of performance conditions.
� �The ESOS 2018, Cash Plan 2018 and Vedanta Resources Limited LTIP 2018 options/units will vest/be exercised after three years from date of grant i.e. on November 1, 2021, based on achievement of performance conditions.
� �The ESOS 2019, Cash Plan 2019 and Vedanta Resources Limited LTIP 2019 options/units will vest/be exercised after three years from date of grant i.e. on November 29, 2022, based on achievement of performance conditions.
(5)� �Additionally, Mr. Navin Agarwal has been paid gratuity amounting to 7,06,65,923/- and leave encashment amounting to 1,25,20,955/- during the year upon attaining the age of 58 as per company policies.
� �Mr. Navin Agarwal has been awarded 435,960 units in FY’19 and 513,260 units in FY’20 under Long-Term Incentive Plan of Vedanta Resources Limited.
� �Sitting fees and commission paid to Mr. Navin Agrawal from HZL is 250,000 and 1,500,000 respectively during the FY 2019-20.
� �The Board meets at regular intervals to discuss and decide on Company/business policy and strategy in addition to the statutory and other matters. The Board and Committee meetings are pre-scheduled and an annual calendar of the meetings is circulated to the Directors well in advance to facilitate planning of their schedule and to ensure meaningful participation in the meetings. However, in case of business exigencies/urgencies resolutions are passed through circulation or additional meetings are conducted.
� �The Board, the Audit Committee and the Nomination & Remuneration Committee are facilitated with annual agenda plan in advance in order to enable the members to focus on key areas of organisational performance and designing the future strategy. The annual agenda plans are finalised with the inputs from the board members and are approved by the Board. Additional agenda matters are taken up on requirement basis.
Schedule of meetings and agenda matters
� �The Agenda papers are finalised by the Chairman and the Company Secretary, in discussion with the CEO & CFO.
� �All the Agenda papers are disseminated electronically on a real-time basis. The papers are uploaded on a secured online platform specifically designed for this purpose, thereby eliminating circulation of printed agenda papers. The online platform also enables the Board to access the historical agendas, minutes, constitutional documents, committee charters, etc. It enables the participants to make notes and exchange notes amongst each other under a secured environment.
� �The Agenda papers other than in nature of Unpublished Price Sensitive Information (UPSI) are circulated well in advance as per statutory requirements and those in nature of UPSI are circulated at least 24 hours in advance with the approval of the Board.
Circulation of Agenda
� �The Board business generally includes consideration of important corporate actions and events including:a)�� quarterly and annual result announcements;b)�� oversight of the performance of the business;c)�� development and approval of overall business strategy;d)�� Board succession planning;e)�� review of the functioning of the Committees andf)�� �other strategic, transactional and governance matters as required under the Companies Act,
2013, Listing Regulations and other applicable laws.
Information presented at meetings
� �Majority of the meetings are conducted as physical meetings, however, at times it may not be possible for each one to be physically present at all meetings. Hence, we provide the facility of video conferencing/telepresence to the Board members and invitees at various locations across the globe.
� �All the meetings conducted through telepresence are recorded and stored as per statutory requirements. The Company Secretary records minutes of the meetings of each Board and Committees.
� �The management team is invited to present the performance on key areas such as the Company’s major business segments and their operations, subsidiary performance and key functions from time to time.
Conduct and recording of meeting
� �Post conclusion of each of the Board/Committee meeting, the Company Secretary circulates the summary of the proceedings of all meetings along with the action points, if any.
� �Various decisions taken at Board/Committee meetings are promptly communicated to the concerned departments/divisions.
� �Draft minutes and signed minutes are circulated to Board/Committee members within the timelines prescribed under Secretarial Standards
� �The matters arising from the previous meetings are taken up at the respective forthcoming Board/Committee meeting.
Post Meeting summary/Follow Up
INTEGRATED REPORT MANAGEMENT REVIEW STATUTORY REPORTS
168-270FINANCIAL STATEMENTS
271-50206-115 116-167
238 VEDANTA LIMITED INTEGRATED REPORT AND ANNUAL ACCOUNTS 2019-20 VEDANTA LIMITED INTEGRATED REPORT AND ANNUAL ACCOUNTS 2019-20 239

REPORT ON CORPORATE GOVERNANCE CONTINUED...
(6)� �Mr. S Venkat is based out of UK and was paid remuneration in GBP during the FY 2019-20 of which 80% was paid by Vedanta Limited and 20% by Vedanta Resources Limited (VRL). The 80% amount was paid by Vedanta in the form of reimbursement to VRL and paid to Mr. Venkat through VRL account. The 20% remuneration amounting to 28,862,015 (£ 320,325) has been paid by VRL.
� �Benefits paid/given in FY 2019-20 to Mr. Venkat as per his appointment letter are mentioned under Perquisite.
� �In addition to above compensation, Mr. Venkat has been paid buy out awards as per agreement amounting to 9,52,40,939 (£1,057,030) by Vedanta Resources Limited.
� �Mr. Venkat has been awarded 380,640 units in FY’19 and 448,140 units in FY’20 under Long-Term Incentive Plan of Vedanta Resources Limited. These units will be forfeited on account of exit from the organization on April 5, 2020.
(7)� �Mr. MK Sharma was appointed as an Independent Director w.e.f. June 1, 2019.
(8)� �Mr. Ravi Kant ceased to be Independent Director of the Company w.e.f. close of business hours on May 31, 2019 upon completion of his tenure.
(9)� �Mr. Tarun Jain has been paid Annual Performance Bonus for the FY 18-19 in FY 19-20 of 4,19,74,746 in his capacity as Executive Director of the Company for FY 2018-19.
� �Mr. Tarun Jain has been granted 280,630 options under Vedanta Limited Employee Stock Option Scheme.
We hereby confirm that: � �The total managerial remuneration payable in FY 2019-20 does not exceed 11% of the net profits of the Company;
� �The total remuneration received by Whole-Time Directors and Independent Directors of the Company does not exceed 10% and 1% of the Net Profits of the Company respectively;
� �At the 54th AGM, the shareholders had approved payment of remuneration to Mr. Tarun Jain,
Non-Executive Director in excess of the limits prescribed under Listing Regulations;
� �Mr. Navin Agarwal, Executive Chairman and member of Promoter Group does not receive remuneration in excess of 5 crores or 2.5% of the Net Profits of the Company, whichever is higher.
BOARD COMMITTEESThe Board of Directors play a crucial role in the governance structure of the Company and is the apex body constituted by shareholders for overseeing the Company’s overall functioning.
To enable expedient and effective emphasis on significant matter, the Company has set up various Committees with a primary aim of maintaining strong business fundamentals and delivering high performance through relentless focus on the affairs of the Company across all its geographies. These Committees are set up by the formal approval of the Board to carry out clearly defined roles under their respective Charters. The Chairperson of the respective Committees briefs the Board on the summary of the discussions held in the Committee Meetings. The minutes of all the Committee meetings are placed before the Board for its review and noting. The Company Secretary officiates as the Secretary of these Committees.
Composition of CommitteesAll the Committees have optimum composition pursuant to the Listing Regulations. Below is the composition of the Committees as on March 31, 2020:
Name of Director BoardAudit
Committee
Nomination &RemunerationCommittee(1)
StakeholderRelationshipCommittee
CorporateSocial
ResponsibilityCommittee
Committeeof Directors
FinanceStanding
Committee(2)
RiskManagementCommittee(3)
SustainabilityCommittee(4)
Mr. Navin Agarwal(1)
Mr. Aman Mehta(Ceased to be a Director w.e.f. close of business hours on May 16, 2020)
Mr. K Venkataramanan
Ms. Lalita D. Gupte
Mr. MK Sharma(1)
Mr. UK Sinha(1)
Ms. Priya Agarwal
Mr. GR Arun Kumar
Mr. S Venkatakrishnan (Ceased to be a Director w.e.f. close of business hours on April 5, 2020)Mr. Tarun Jain (Ceased to be a Director w.e.f. April 1, 2020
(1)� �Effective April 1, 2020, Mr. Navin Agarwal ceases to be member of the Nomination & Remuneration Committee upon his re-designation as Executive Vice Chairman of the Company.
� �Effective May 27, 2020, Mr. Anil Agarwal, Non-Executive Chairman and Mr. UK Sinha, Independent Director have been appointed as members of Nomination & Remuneration Committee.
� �Mr. MK Sharma, Independent Director has been designated as Chairman of Nomination & Remuneration Committee post completion of tenure of Mr. Aman Mehta.
(2)� Effective May 16, 2020, Finance Standing Committee has been consolidated with the Committee of Directors.(3)� �For Risk Management Committee, Chairman of each meeting is appointed at the start of each meeting pursuant to Regulation 21(3) of the
Listing Regulations.� �In addition to the above board members, Mr. Dilip Golani, Head Management Assurance (MAS) is also a member of the Risk Management
Committee and Mr. Deodatta Padgaonkar, SVP MAS is the Risk Officer.� �Effective June 6, 2020, the Risk Management Committee has been consolidated with the Audit Committee comprising of only
Independent Directors. (4)� �In addition to the above board members, Mr. Sunil Duggal (Interim CEO of Vedanta Limited effective April 6, 2020) is member of the
Sustainability Committee.
Board and Committee Meetings for FY 2019-20
Meeting Apr-Jun Jul-Sept Oct-Dec Jan-Mar
Board May 7, 2019 July 20, 2019 November 14, 2019 January 31, 2020July 26, 2019 December 26, 2019 March 27, 2020
Audit Committee May 7, 2019 July 10, 2019 October 24, 2019 January 30, 2020July 20, 2019 November 14, 2019July 25, 2019
Nomination & Remuneration Committee May 7, 2019 July 26, 2019 November 14, 2019 January 31, 2020November 29, 2019 March 27, 2020
Stakeholder Relationship Committee - - October 24, 2019 -Corporate Social Responsibility Committee - - - January 30, 2020Risk Management Committee May 16, 2019 August 27, 2019 October 16, 2019 -Sustainability Committee - September 19, 2019 - March 2, 2020
� The Board approved seventeen matters by passing resolution by circulation. � The Audit Committee approved nine matters by passing resolution by circulation. � The Nomination & Remuneration Committee approved four matters by passing resolution by circulation. � �The maximum interval between any two board meetings did not exceed 120 days, as prescribed in the Companies Act, 2013.
Attendance for Board & Committee Meetings held during FY 2019-20
Name of Director
Whether attended AGM
on July 11, 2019
Board Meeting
Audit Committee NRC SRC CSR Average %
(Attended/Entitled)
(Attended/Entitled)
(Attended/Entitled)
(Attended/Entitled)
(Attended/Entitled)
Mr. Navin Agarwal Yes 7/7 - 6/6 - - 100
Mr. Aman Mehta (Ceased to be a Director w.e.f. close of business hours on May 16, 2020)
Yes 6/7 6/7 5/6 - 1/1 89
Mr. K Venkataramanan Yes 7/7 - - 1/1 1/1 100
Ms. Lalita D. Gupte Yes 7/7 7/7 6/6 1/1 - 100
Mr. UK Sinha Yes 7/7 7/7 - 1/1 1/1 100
Mr. MK Sharma Yes 6/6 5/6 5/5 - 1/1 96
Mr. Ravi Kant NA 1/1 1/1 1/1 - - 100
Ms. Priya Agarwal Yes 7/7 - - - 1/1 100
Mr. GR Arun Kumar Yes 7/7 - - 1/1 - 100
Mr. S Venkatakrishnan (Ceased to be a Director w.e.f. close of business hours on April 5, 2020)
Yes 7/7 - - 1/1 1/1 100
Mr. Tarun Jain (Ceased to be a Director w.e.f. April 1, 2020)
Yes 6/7 - - 1/1 1/1 95
Member Chairperson
INTEGRATED REPORT MANAGEMENT REVIEW STATUTORY REPORTS
168-270FINANCIAL STATEMENTS
271-50206-115 116-167
240 VEDANTA LIMITED INTEGRATED REPORT AND ANNUAL ACCOUNTS 2019-20 VEDANTA LIMITED INTEGRATED REPORT AND ANNUAL ACCOUNTS 2019-20 241

AUDIT COMMITTEE The primary objective of the Audit Committee is to monitor and provide effective supervision of the financial reporting; the effectiveness of the system of risk management and robustness of internal financial controls and risk management framework including cyber security, adequacy and effectiveness of the Company’s legal, regulatory and ethical compliance & governance programmes, monitoring the qualifications, expertise, resources and independence of both the internal and external auditors; and assessing the auditors’ performance and effectiveness each year.
Members of the Audit Committee possess requisite qualifications. To carry out its responsibilities transparently and efficiently, the Committee majorly relies on the expertise and knowledge of the management, the internal auditors and the Statutory Auditor, in carrying out its oversight responsibilities. It also uses external expertise, if required. The management is responsible for the preparation, presentation and integrity of the Company’s financial statements including consolidated statements, accounting and financial reporting principles. The management is also responsible for internal control over financial reporting and all procedures are designed to ensure compliance with accounting standards, applicable laws and regulations as well as for objectively reviewing and evaluating the adequacy, effectiveness and quality of the Company’s system of internal controls. M/s SR Batliboi & Co. LLP, Chartered Accountants (FRN: 301003E) the Company’s Statutory Auditor, is responsible for performing an independent audit of the Financial Statements and expressing an opinion on the conformity of those financial statements.
The Audit Committee covers a variety of topics in its meetings. These include both standing items that the Committee considers as a matter of course, typically in relation to the quarterly unaudited financial statements, control issues, accounting policies and judgements and reporting matters, and a range of topics relevant to Vedanta’s control framework. The Committee invites the Chief Executive Officer, the Chief Financial Officer, Group Assurance Head, and the external auditor to attend each meeting. The Business and Operation Heads are invited to the meetings, as and when required. The representatives of Statutory Auditors are permanent invitees to the Audit Committee meetings. The representatives of Executives from Accounts department, Finance department, Corporate Secretarial department and Internal Audit department also attend the Audit Committee meetings.
The Committee also meets separately with the external auditor without members of management to seek the auditor’s judgement about the quality and applicability of the accounting principles, the reasonableness of significant judgement and adequacy of disclosures in financial statements.
REPORT ON CORPORATE GOVERNANCE CONTINUED...
On a quarterly basis, the Audit Committee reviews the confirmation of the Independence made by the Auditors, as also approves of the fees paid to the Auditors by the Company, or any other company in the Vedanta Group as per the Policy for Approval of Audit/Non-Audit Services to be rendered by the Auditors.
The Committee comprises solely of Independent Directors whose names, details and biographies are set out in the Board and Committees section of this Annual Report. The Committee fulfils the requirements as specified under the provisions of the Companies Act, 2013, SEBI Listing Regulations and NYSE Guidelines w.r.t composition, independence & financial expertise of its members.
The schedule of Committee meeting held during FY 2019-20 along with its members’ attendance records are detailed in the earlier sections of the Corporate Governance Report.
As part of the Board’s annual evaluation of its effectiveness and that of its Committees, as described earlier in the report, the Committee assessed its own effectiveness. The Audit Committee members agreed that its overall performance had been effective during the year.
Review of Financial Results for FY 2019-20The Committee reviewed the Standalone & Consolidated Financial Statements for FY 2019-20 and based on this review and discussions with management, the Committee was satisfied that the Financial Statements were prepared in accordance with applicable accounting standards and fairly present the Group’s financial position and results for the financial year ended March 31, 2020. The Committee therefore recommended the Financial Statements for the financial year ended March 31, 2020 be approved by the Board.
The Board accepted all the recommendations made by the Audit Committee in FY 2020.
The utilisation of Audit Committee’s time along with its major responsibilities is detailed below:
(%)Oversight of Financial reporting 40
Internal Audit, Internal financial controls, Risk management
40
Auditors 10
Governance 10
� �Overseeing the Company’s financial reporting process and disclosure of its financial information to ensure that the financial statements are true, fair, sufficient and credible;
� �Discuss and review, with the management and auditors, the annual/quarterly financial statements before submission to the Board;
� �Discuss and review earnings press releases and the financial information and guidance provided to analysts and ratings agencies;
� Review of key significant issues, tax & legal reports and management’s report; � �Review of management’s analysis of significant issues in financial reporting and judgments made in preparing the financial statements;
� �Discuss with the Management regarding pending technical and regulatory matters that could affect the financial statements, and updates on management’s plans to implement new technical or regulatory guidelines;
� Review of off-balance-sheet structures, if any; � Review of Draft limited review/audit reports and qualifications, if any, therein; � Discuss and Review the Form 20 F & Japanese Filings.
Oversight of Financial reporting
� �Appointment of Statutory, internal, secretarial, cost & tax auditors, recommending their fees and reviewing their audit reports;
� �Review of the independence of the statutory auditor and the provision of audit/non-audit services including audit/non-audit fees paid to the statutory auditor;
� Independent meetings with statutory auditors.
Auditors
� �Review of internal audit observations and monitoring of implementation of any corrective actions identified;
� Reviewing the internal financial control framework; � Review of the performance of the internal audit function & internal audit plan; � �Reviewing the risk management framework, Cyber Security, risk profile, significant risks, risk matrix and resulting action plans;
� �Review of the significant audit risks with the statutory auditor during interim review and year-end audit;
� Consideration of statutory audit findings and review of significant issues raised; � Reviewing related party transactions; � �Management discussion and analysis of financial condition and results of operations.
Internal Audit, Internal financial controls, Risk management
� Reviewing minutes summary reports from subsidiary company audit committees; � Reviewing intercorporate loans, advances, guarantees, � �Reviewing ethics (whistle blower, sexual harassment, insider Trading) and statutory compliances;
� Review of its own charter and processes; � Notices received from statutory authorities and the management’s response; � Regulatory updates; � Reviewing feedback from the Audit Committee’s performance evaluation;
Governance
INTEGRATED REPORT MANAGEMENT REVIEW STATUTORY REPORTS
168-270FINANCIAL STATEMENTS
271-50206-115 116-167
242 VEDANTA LIMITED INTEGRATED REPORT AND ANNUAL ACCOUNTS 2019-20 VEDANTA LIMITED INTEGRATED REPORT AND ANNUAL ACCOUNTS 2019-20 243

NOMINATION AND REMUNERATION COMMITTEEThe Nomination & Remuneration Committee (NRC) is responsible for overseeing key processes through which it can make recommendations to the Board on the structure, size and composition of the Board, KMP & Senior Management, ensure that the appropriate mix of skills, experience, diversity and independence is present on the Board and senior level for it to function effectively. The NRC also leads the process for new Board appointments, advises the Board on succession planning arrangements and oversees the development of management talent within the Group.
Another key objective of the Committee is to ensure that competitive and fair awards are linked to key deliverables and are also aligned with market practice and shareholders’ expectations. The Committee ensures that remuneration policies and practices are designed to attract, retain and motivate the Executive Directors and the senior management group, while focusing on the delivery of the Group’s strategic and business objectives. The Committee is also focussed on aligning the interests of the Executive Directors and the senior management group with those of shareholders, to build a sustainable performance culture. When setting remuneration for the Executive Directors, the Committee takes into account the business performance, developments in the natural resources sector and, considering that the majority of the Group’s operations are based in India, similar information for high-performing Indian companies.
The Committee also carries out the entire process of performance evaluation on an annual basis.
As on March 31, 2020 the NRC comprises three Independent Directors and the executive chairman of the Company whose names, details and biographies are set out in the Board and Committees section of this Annual Report. The Committee fulfils the composition
REPORT ON CORPORATE GOVERNANCE CONTINUED...
requirement as required under the provisions of the Companies Act, 2013 and Listing Regulations. In the event of a conflict of interest, the Executive Chairman abstains from the discussions and other members of the NRC participate and vote. Other Directors, members of the senior management team, representatives from Human Resource department and external advisers may attend meetings at the invitation of the Committee, as appropriate. In respect of each of its meetings, the Chairman of the NRC provides an update to the Board.
The schedule of NRC meetings held in FY 2019-20 along with its members’ attendance records are disclosed in the earlier sections of the Corporate Governance Report.
As part of the Board’s annual evaluation of its effectiveness and that of its Committees, as described earlier in the report, the NRC assessed its own effectiveness. The members of the NRC agreed that its overall performance had been effective during the year.
The Board accepted all the recommendations made by the Committee in FY 2019-20.
The utilisation of the Committee’s time along with its major responsibilities is detailed below:
(%)Board Composition and Nomination 40
Compensation 25
Evaluation 20
Succession Planning & Governance 15
� �Review and recommend the structure, size and composition (including the skills, knowledge, experience and diversity) of the Board and its Committees;
� �Formulate the criteria / policy for appointment of Directors, Key Managerial Personnel (KMPs) and Senior Management (as defined by the NRC) in accordance with identified criteria;
� �Review and appoint shortlisted candidates as Directors, KMPs and Senior Management (including evaluation of incumbent directors for potential re-nomination) and make recommendations to the Board;
� �Evaluate the balance of skills, knowledge, experience and diversity on the Board for description of the role and capabilities, required for an appointment;
� �Formulate and recommend to the Board the criteria for determining qualifications, positive attributes and independence of a director.
Board Composition and Nomination
� �Recommend to the Board a policy relating to the remuneration of directors (both Executive and Non-Executive Directors), KMP and Senior Management Personnel;
� �Ensuring that the level and composition of remuneration is reasonable and sufficient to attract, retain and motivate directors of the quality required to run the Company successfully;
� �Ensuring relationship of remuneration to performance is clear and meets appropriate performance benchmarks; and;
� �Remuneration to directors, KMP and senior management involves a balance between fixed and incentive pay reflecting short and long-term performance objectives appropriate to the working of the Company and its goals;
� �Determine remuneration based on the Company’s financial position, trends and practices on remuneration prevailing in the industry as considered appropriate by the NRC;
� �Review of the Company’s Share Based Employee Benefit Scheme(s), if any, including overseeing the administration of the Scheme(s), formulating the necessary terms and conditions for such Scheme(s) like quantum of options/rights to be granted, terms of vesting, grant options/rights to eligible employees, in consultation with management; and allotment of shares/other securities when options/rights are exercised etc. and recommend changes as may be necessary.
Compensation
� �Review succession planning for Executive and Non-Executive Directors and other Senior Management;
� �Establishing policies and procedures to assess the requirements for induction of new members to the Board;
� �To maintain regular interaction and collaborate with the leadership including the HR team to review the overall HR vision and people development strategy of the Company;
� �To review and reassess the adequacy of the NRC’s charter as required and recommend changes to the Board;
� To develop and recommend a policy on Board diversity.
Succession Planning & Governance
� �To develop, subject to approval of the Board, a process for an annual self-evaluation of the performance of the Board, its committees and the individual directors in the governance of the Company and to coordinate and oversee this annual self-evaluation;
� �To formulate a criterion for evaluation of independent Directors and the Board and carry out evaluation of every Director’s performance and present the results to the Board;
� �To review the performance of all the Executive Directors, on the basis of detailed performance parameters set for each of the Executive Directors at the beginning of the year and present the results to the Board;
� Action report on suggestions made on evaluation; � �To maintain regular contact with the leadership of the Company. This should include interaction with the Company’s Leadership Institute, review of data from the employee survey and regular review of the results of the annual leadership evaluation process.
Evaluation of the board, its Committees and individual directors
INTEGRATED REPORT MANAGEMENT REVIEW STATUTORY REPORTS
168-270FINANCIAL STATEMENTS
271-50206-115 116-167
244 VEDANTA LIMITED INTEGRATED REPORT AND ANNUAL ACCOUNTS 2019-20 VEDANTA LIMITED INTEGRATED REPORT AND ANNUAL ACCOUNTS 2019-20 245

REPORT ON CORPORATE GOVERNANCE CONTINUED...
CORPORATE SOCIAL RESPONSIBILITY COMMITTEEThe Company believes that while targeting to produce maximum yield for our shareholders during the year, we also focus on our responsibilities towards the society and environment. As a responsible corporate citizen, we believe that those who reside in our operational areas are our partners and we seek to foster a mutually benefitting relationship with all our stakeholders. It is this integration of business and CSR which provides us the social licence to operate and ushers in a different developmental paradigm towards sustainable change in society. As part of our CSR policy, we believe in partnering with government agencies, development organisations, corporates, civil societies & community-based organizations to carry our durable and meaningful initiatives.
The role of CSR Committee is to formulate and monitor the CSR Policy of the Company along with recommending the CSR Budget.
The schedule of CSR meetings held in FY 2019-20 along with its members’ attendance records are disclosed in the earlier sections of the Corporate Governance Report.
As part of the Board’s annual evaluation of its effectiveness and that of its Committees, as described earlier in the report, the CSR Committee assessed its own effectiveness. The members of the CSR Committee agreed that its overall performance had been effective during the year.
The Board accepted all the recommendations made by the Committee in FY 2019-20.
The utilisation of the Committee’s time along with its major responsibilities is detailed below:
(%)CSR Activities 45
CSR Budget 40
CSR Policy 15
STAKEHOLDERS’ RELATIONSHIP COMMITTEE Vedanta understands the value of sustaining continuing and long-term relations with our stakeholders to ensure a mutual understanding of the Company’s strategy, performance and governance.
The Stakeholders’ Relationship Committee (SRC) supports the Company and its Board in maintaining strong and long-lasting relationships with its stakeholders at large. The SRC majorly ensures and oversees that the security holders grievances are promptly resolved; ways to enhance shareholder experience; performance of Registrar & Transfer Agent; shareholding movement etc.
The details of SRC composition and meetings are given in the earlier section of this report. The SRC is chaired by Ms. Lalita D Gupte, Non-Executive Independent Director.
As part of the Board’s annual evaluation of its effectiveness and that of its Committees, as described
earlier in the report, the SRC assessed its own effectiveness. The members of the SRC agreed that its overall performance had been effective during the year.
The Board accepted all the recommendations made by the Committee in FY 2019-20.
The utilisation of the Committee’s time along with its major responsibilities is detailed below:
(%)Enhancing Shareholder experience 45
Shareholder Grievances 40
Shareholding Pattern 15
An analysis of investor queries and complaints received and responded/addressed during the year is provided below:
Investor ComplaintsCompany’s Registrar & Transfer Agent, KFin Technologies Private Limited (erstwhile Karvy Fintech Private Limited) (RTA) entertains and resolves investor grievances in consultation with the Compliance Officer. All grievances can be addressed either to RTA or to the Company directly. An update on the status of complaints is quarterly reported to the Board and is also filed with stock exchanges.
The details of shareholders’ complaints during FY 2019-20
S. No. Nature of complaints/letters and correspondence Received Replied Closing Balance
Complaints received through Stock Exchanges, SEBI and Ministry of Corporate Affairs1�Non-receipt of shares 7 7 02�Non-receipt of dividends 26 26 03�Miscellaneous 24 24 0Other Correspondence from Shareholders1�Letters and correspondence from shareholders 8,852 8,852 0Total 8,909 8,909 0
ote: The Company received Nil complaints w.r.t. Non-Convertible Debentures
Unclaimed shares and transfer of unpaid and unclaimed amounts to Investor Education and Protection Fund (IEPF)
The details of Unclaimed Suspense Account and IEPF are forming part of the Directors Report in this Annual Report.
Change in name of Company’s RTADuring the financial year, the name of the Company’s RTA was changed to KFin Technologies Private Limited from Karvy Fintech Private Limited.
RISK MANAGEMENT COMMITTEE The Company has a duly constituted Risk Management Committee (RMC) which supports the Board and the Audit Committee in fulfilling their Corporate Governance oversight responsibilities based on proactive identification, advanced evaluation and reasonable mitigation of risks impacting the business.
The Board undertakes to monitor the Company’s risk management exercise based on a periodic review of the effectiveness of the risk management framework. The Audit Committee aids the Board in this process by detailed assessment of the framework entailing review of principal risks and changes therein; examination of internal control measures; and assurance of cohesive remedial actions as a part of risk mitigation plans. The Audit Committee is supported by the Group Risk Management Committee in ascertaining and enhancing the design efficiency and operating effectiveness of the risk management program (including for cyber security) and the in-built control systems.
The constitution and composition of the Committee, in compliance with the requirements of Listing Regulations, is detailed in the earlier section of this report.
� �To formulate and recommend to the Board the CSR Policy indicating the activities to be undertaken by the Company pursuant to the provisions of Companies Act 2013 and the rules made thereunder;
� To review the the CSR Policy and associated frameworks, processes and practices.
� �To identify the areas of CSR activities and projects and to ensure that the Company is taking the appropriate measures to undertake and implement CSR projects successfully;
� To assess the performance and impact of CSR Activities of the Company; � To evaluate CSR communication plans.
� �To decide and recommend to the Board the amount of expenditure to be incurred on CSR activities;
� �To evaluate and monitor expenditure towards CSR Activities is in compliance with the Companies Act 2013.
CSR Policy
CSR Activities
CSR Budget
� Review shareholding distribution; � Review movement in shareholding pattern; � Comparative details on demat and physical holding.
Shareholding Pattern
� �Review and timely resolving the grievances of the Security holders related to issue, allotment, transfer/transmission, dematerialization, rematerialization etc. of shares and /or other securities of the Company;
� �Review and timely redressal of all the Security holders grievances related to non- receipt of information demanded if any, non-receipt of annual report, non-receipt of declared dividend, issue of new/duplicate share certificates, general meeting etc.;
� �Review from time to time the shares and dividend that are required to be transferred to the IEPF Authority;
� Review & closure of all Investor cases.
� Review of measures taken for effective exercise of voting rights by shareholders; � �Review of the various measures and initiatives taken by the listed entity for reducing the quantum of unclaimed dividends and ensuring timely receipt of dividend warrants/annual reports/statutory notices by the shareholders of the Company;
� Initiatives for registration of email IDs, PAN & Bank Mandates and demat of shares; � Review reports on shareholder satisfaction surveys, if any; � �Oversight of the performance and services standards of various services being rendered of/by Registrar and Transfer Agent of the Company.
Shareholder grievances
Enhancing shareholder experience/services
INTEGRATED REPORT MANAGEMENT REVIEW STATUTORY REPORTS
168-270FINANCIAL STATEMENTS
271-50206-115 116-167
246 VEDANTA LIMITED INTEGRATED REPORT AND ANNUAL ACCOUNTS 2019-20 VEDANTA LIMITED INTEGRATED REPORT AND ANNUAL ACCOUNTS 2019-20 247

REPORT ON CORPORATE GOVERNANCE CONTINUED...
Risk Management Committee is mainly entrusted with the following responsibilities:1.� �Oversight over the effective implementation
of the risk management framework across various businesses;
2.� �Assurance of appropriate measures in the organization to achieve prudent balance between risk and reward in both ongoing and new business activities;
3.� �Annual review of the risk appetite and risk management policy including cyber security procedures adopted in the Group;
4.� �Analytic validation and recommendation of necessary changes in the risk management policies and frameworks to the Audit Committee/Board, if any;
5.� �Evaluation of significant and critical risk exposures for assessing management’s action to mitigate or manage the exposures in a timely manner.
Effective June 6, 2020, the RMC has been consolidated with the Audit Committee to be called as the Audit & Risk Management Committee, comprising of only Independent Directors to ensure better value addition. Parallelly, the management team led by the CEO and MAS Head will act as a sub set of this committee and continue to run the existing risk management process. The management team shall present a detailed update to the Audit & Risk Management Committee twice a year on the same.
A separate section on principal risks and uncertainties governing the business is covered in the Management Discussion and Analysis Report.
SUSTAINABILITY COMMITTEE At Vedanta, we continue our relentless focus to embed a standardised and high-performance sustainability culture across all our businesses. With sustainability as one of our core values, we embark utmost emphasis on ensuring zero harm, zero waste and zero discharge; prioritised health and safety management; responsible environmental impact; and support to all communities. The well-being and security of our people, the community and the environment remain at the forefront and at the heart of our business strategy.
In our endeavour to follow the global best practices, the Board has constituted a Sustainability Committee effective April 1, 2019 to support the Board in:
1.� �Overseeing the Company’s Sustainability performance and ensuring adequacy of the Company’s Sustainability Framework;
2.� �Advising the Board on sustainability policies and management systems, clearly setting out the commitments of the Company to manage matters of sustainable development effectively;
3.� �Ensuring effective implementation of governance, advocacy and public relation mechanisms and practices related to Sustainability;
4.� �Outlining initiatives required to institutionalise a sustainability culture through involvement of the employees at all levels;
5.� �Evaluating emerging sustainability risks in terms of intensity and impact, in turn, guiding the management on reasonable avoidance of adversities likely to pose a threat to sustained growth;
6.� �Advising the Board to enable it to discharge its responsibilities, having regard to the law and the expected international standards of sustainability and stakeholder governance.
The details of composition and meetings are provided in the earlier section of this report.
OTHER COMMITTEESThe Board, in line with the highest standards of governance and responsibility, has constituted few other committees for ensuring smooth functioning of the business. The delegation of roles to respective committees enables the Board to ensure prompt and timely decision-making on matters important for the Company. The minutes of each committee meeting are placed before the Board for its noting.
The Board also formulates several project specific sub-committees from time to time in order to secure speedy implementation and execution of the projects to meet business needs. The Board is duly updated on each of the meetings of sub-committees also.
As on March 31, 2020, the internal Board committees have been elucidated below:
Finance Standing Committee of DirectorsThe Finance Standing Committee (FSC) supports the Board by considering and approving matters related to finance, investment, banking, treasury etc. within the overall limits approved by the Board.
The Committee is broadly entrusted with the following responsibilities:
1.� �Review and approval of all policies related to the financial matters of the Company;
2.� �Review and approval of Inter-Corporate Loans, Guarantees and Investments;
3.� �Authorisation for account operations including bank accounts, demat accounts, trading accounts etc.;
4.� �Consideration and approval of treasury related proposals; and
5.� Review and approval of security related proposals.
The composition of the Committee is detailed in the earlier section of this report. The FSC meets on a requirement basis. During FY 2019-20, the Committee met six (06) times on July 26, 2019; August 21, 2019; September 17, 2019; November 27, 2019; December 5, 2019; and January 7, 2020.
Effective May 16, 2020, Finance Standing Committee has been consolidated with the Committee of Directors.
Committee of DirectorsThe Committee of Directors (COD) supports the Board by considering, reviewing and approving all borrowing related proposals, within the overall limits approved by the Board from time to time. The COD enables seamless flow of procedures and assists the Board by catering to various routine requirements.
The details of composition of the COD are given in the earlier section to this report. The Committee meets as and when deemed necessary. The Committee met seven (07) times during FY 2019-20 on August 21, 2019; September 23, 2019; December 4, 2019; December 13, 2019; January 8, 2020; January 29, 2020 and March 30, 2020.
Share & Debenture Transfer CommitteeThe Committee comprises of three (03) members: Mr. GR Arun Kumar (Chairperson), Whole-Time Director & Chief Financial Officer; Mr. Anup Agarwal, SVP – Corporate Finance; and Mr. Jagdeep Singh, Senior Corporate Counsel. During FY 2019-20, the Committee met twenty-two (22) times.
The role of Share & Debenture Transfer Committee primarily includes the following:
� �Allotment of shares, debentures or any other securities; and
� �Review and approval of transfer, transmission, deletion and transposition of shares, debentures or any other securities.
Executive Committee The Executive Committee (EXCO) supports in the day-to-day running of the Company and meets on a monthly basis. It is entrusted with executing the strategy adopted by the Board; allocating resources in line with delegated authorities; managing risk; and monitoring the operational and financial performance of the Company. Authority is delegated by the Executive Committee to the respective Chief Executive Officers of each of the businesses. The Chief Executive Officer keeps the Board informed of the EXCO’s activities through his standing reports placed before the Board.
Group Management Committee Vedanta is on the continuous journey of growth and expansion with best-in-class safety, benchmark technology, and cost efficiency. We continuously ensure that we have the right management in place to drive our business and take the organization to the next level.
In line with our vision, effective April 1, 2020 we have formed a Group Management Committee comprising of Chief Financial Officer, Chief Executive Officer, Chief Human Resource Officer Head and Chief Commercial Officer. The Committee is collectively responsible for all key decisions, taken under the guidance of Chairman and Board. This Committee drives all important initiatives and is empowered by the Board.
GENERAL BODY MEETINGSAnnual General MeetingsThe details of the last three years Annual General Meetings/Court Convened Meeting are as follows:
Year Location Date & Time Special Resolutions passed Web Link
Court Convened Meeting
2016-17 Hotel Mandovi, D. B. Marg, Panaji, Goa – 403 001
September 8, 2016 at: � �10:00 a.m. for the Equity Shareholder of the Company.
� �2:00 p.m. for the Secured Creditors of the Company.
� �4:00 p.m. for the Unsecured Creditors of the Company.
� �For approval of the amalgamation embodied in the scheme of arrangement of Cairn India Limited with Vedanta Limited and their respective shareholders and creditors.
NoticeOutcome
52nd Annual General Meeting
2016-17 Rangsharda Auditorium, K.C. Marg, Bandra Reclamation, Bandra (West), Mumbai
July 14, 2017 at 10:30 a.m. � �Appointment of Mr. G.R. Arun Kumar as Whole Time Director & Chief Financial Officer (CFO).
� �Re-appointment of Mr. Thomas Albanese as Whole Time Director & Chief Executive Officer (CEO).
� �Offer or invitation for subscription of Non-Convertible Debentures upto 20,000 crores on a Private Placement basis.
� �Waive the excess remuneration paid to Mr. Navin Agarwal.
NoticeOutcome
INTEGRATED REPORT MANAGEMENT REVIEW STATUTORY REPORTS
168-270FINANCIAL STATEMENTS
271-50206-115 116-167
248 VEDANTA LIMITED INTEGRATED REPORT AND ANNUAL ACCOUNTS 2019-20 VEDANTA LIMITED INTEGRATED REPORT AND ANNUAL ACCOUNTS 2019-20 249

REPORT ON CORPORATE GOVERNANCE CONTINUED...
Year Location Date & Time Special Resolutions passed Web Link
53rd Annual General Meeting
2017-18 Rangsharda Auditorium, K.C. Marg, Bandra Reclamation, Bandra (West), Mumbai
August 24, 2018 at 10:30 a.m. � �Re-appointment of Ms. Lalita D. Gupte as an Independent Director for a second and final term.
� �Re-appointment of Mr. Ravi Kant as an Independent Director for a second and final term.
� �Offer or invitation for subscription of Non-Convertible Debenture upto 20,000 crores on Private Placement basis.
NoticeOutcomeMinutes
54th Annual General Meeting
2018-19 Rangsharda Auditorium, K.C. Marg, Bandra Reclamation, Bandra (West), Mumbai
July 11, 2019 at 10:30 a.m. � �Payment of remuneration to Mr. Tarun Jain in excess of limits prescribed under Listing Regulations.
NoticeOutcomeMinutesVideo
Voting LevelsThe voting levels at the Annual General Meeting have increased in 2019, accounting to ~82% of the listed capital of the Company. All resolutions were passed at the meeting with ~98% votes in favour.
Postal BallotDuring the FY 2019-20, the shareholders passed two resolutions through postal ballot as under:
Date of Postal Ballot Notice November 1, 2019
Voting period November 7, 2019 to December 6, 2019
Date of approval December 6, 2019
Date of declaration of result December 7, 2019
Web Link NoticeOutcomeMinutes
Resolution 1 To approve continuation of Directorship of Mr. Krishnamurthi Venkataramanan (DIN 00001647) as Non-Executive Independent Director beyond the age of 75 years in his current tenure
Type of resolution Special
Voting Results:
S. No. Particulars Total Forms % of Total Shares Held % of Holding Shares Voted % of Voted
1 Assent (Physical) 56 4.68 74,542 Negligible 74,542 NegligibleAssent (E-voting) 1,012 84.47 3,073,169,159 99.44 3,073,169,159 99.44Sub-Total (1) 1,068 89.15 3,073,243,701 99.44 3,073,243,701 99.44
2 Dissent (Physical) 5 0.42 2,310 Negligible 2,310 NegligibleDissent (E-voting) 125 10.43 17,290,704 0.56 17,290,704 0.56Sub-Total (2) 130 10.85 17,293,014 0.56 17,293,014 0.56Total 1,198 100 3,090,536,715 100 3,090,536,715 100
3 Invalid 4 N.A. 457 N.A. 457 N.A.
Resolution 2 To approve the re-appointment of Mr. Krishnamurthi Venkataramanan (DIN 00001647) as Non-Executive Independent Director for a second and final term of One year effective from April 1, 2020 till March 31, 2021 notwithstanding that he has attained the age of 75 years
Type of resolution Special
Voting Results:
S. No. Particulars Total Forms % of Total Shares Held % of Holding Shares Voted % of Voted
1 Assent (Physical) 55 4.60 74,527 Negligible 74,527 NegligibleAssent (E-voting) 1,014 84.63 3,073,176,408 99.44 3,073,176,408 99.44Sub-Total (1) 1,069 89.23 3,073,250,935 99.44 3,073,250,935 99.44
2 Dissent (Physical) 6 0.50 2,325 Negligible 2,325 NegligibleDissent (E-voting) 123 10.27 17,283,467 0.56 17,283,467 0.56Sub-Total (2) 129 10.77 17,285,792 0.56 17,285,792 0.56Total 1,198 100 3,090,536,727 100 3,090,536,727 100
3 Invalid 4 N.A. 457 N.A. 457 N.A.
The Board had appointed Mr. Upendra C Shukla, Practicing Company Secretary (FCS No. 2727, CP No. 1654) as Scrutiniser for conducting the Postal Ballot process (physical & e-voting) in accordance with law in a fair and transparent manner.
Proposal for Postal Ballot:Further, the Company proposes to seek shareholders consent by way of Postal Ballot for the Voluntary Delisting of the Equity Shares of the Company from BSE Limited (“BSE”) and National Stock Exchange of India Limited (“NSE”) and withdrawal of “Permitted to Trade” status on the Metropolitan Stock Exchange of India Limited (“MSE”), and Voluntary Delisting of the Company’s American Depositary Shares from the New York Stock Exchange and deregistration from the Securities and Exchange Commission.
Date of Postal Ballot Notice May 18, 2020Voting period May 26, 2020 to June 24, 2020Web Link Notice
The Board has appointed Mr. Upendra C Shukla, Practicing Company Secretary (FCS No.2727, CP No.1654) as the scrutiniser to conduct the process of the postal ballot in a fair and transparent manner.
Due to difficulty in dispatch of the Notice along with the explanatory statement and postal ballot form by post or courier, on account of threat posed by COVID-19 pandemic situation and as permitted under the General Circular No. 14/2020 dated April 8, 2020 and the General Circular No. 17/2020 dated April 13, 2020, in relation to “Clarification on passing of ordinary and special resolutions by companies under the Companies Act, 2013 and the rules made thereunder on account of the threat posed by COVID-19” issued by the Ministry of Corporate Affairs, the Company has sent the Notice in electronic form only.
The Chairman or any other person authorised by the Chairman shall declare the results of the postal ballot as per the statutory timelines.
Procedure adopted for Postal Ballot:Pursuant to 110 of the Companies Act, 2013 and other applicable provisions, read with related Rules, below is detailed procedure of postal ballot:
1.� �Matters to be passed through postal ballot are approved by the Board and subsequently any of the Whole-Time Directors or the Company Secretary of the Company are authorised to sign and issue the postal ballot notice, explanatory statement and postal ballot form. The Board also fixes the record date for reckoning voting rights and ascertaining those members to whom the notice and postal ballot forms shall be sent. Simultaneously, postal ballot notice is also placed on the website;
2.� �A Company Secretary in practice or a Chartered Accountant in practice or a Cost Accountant in practice, or an Advocate is appointed as the scrutiniser to conduct the postal ballot voting process in a fair and transparent manner;
3.� �In terms of Section 108 of the Companies Act, 2013, the Company also offers e-voting facility to its eligible shareholders, which enables them to cast votes electronically;
4.� �An advertisement containing prescribed details is published in required newspapers informing about having dispatched the notice and the ballot papers;
5.� �The postal ballot form is accompanied by a postage prepaid reply envelope addressed to the scrutiniser and accordingly the duly completed postal ballot papers are received by the scrutiniser;
6.� �Based on the scrutiniser’s report, the Chairman declares the result of the postal ballot on the date, time and venue as specified in the notice, with details of voting;
7.� �Subsequently the results are intimated to the stock exchanges and displayed on the Company’s notice board at its registered office and its corporate office as well.
INTEGRATED REPORT MANAGEMENT REVIEW STATUTORY REPORTS
168-270FINANCIAL STATEMENTS
271-50206-115 116-167
250 VEDANTA LIMITED INTEGRATED REPORT AND ANNUAL ACCOUNTS 2019-20 VEDANTA LIMITED INTEGRATED REPORT AND ANNUAL ACCOUNTS 2019-20 251

REPORT ON CORPORATE GOVERNANCE CONTINUED...
SHAREHOLDERSMeans of Communication
Green Initiatives by Company:
Correspondence Details
All the Share Transfer and Dividend Payment Requests and Investors Related queries, the shareholder can directly contact to our Registrar and Transfer Agent
KFin Technologies Private Limited(Formerly known as Karvy Fintech Private Limited )Unit: Vedanta LimitedSelenium Building, Tower-B, Plot No. 31 & 32, Financial District, Nanakramguda, Serilingampally, Hyderabad, Rangareddi, Telangana – 500 032, IndiaTel: +91 40 6716 2222Fax: +91 40 2300 1153E-mail: [email protected]
The Shareholders can reach out to the designated persons of any department in case of any query for the matters enumerated below:
Company Secretary and Compliance Officer for queries related to Corporate Governance and Secretarial matters/Details of Nodal Officer
Ms. Prerna HalwasiyaCompany Secretary & Compliance OfficerTel: +91 22 6643 4500E-mail: [email protected]
Queries and Update related to Financial Statement of the Company
Mr. James CartwrightHead - Investor RelationsTel: +44 207 499 4732E-mail: [email protected]
Corporate Communication related matters of the Company
Ms. Roma BalwaniDirector Communications & BrandTel: +91 22 6646 1000E-mail: [email protected]
Sustainability Related Matters Mr. Andrew LewinGroup Head – HSE and SustainabilityTel: +91 294 660 4000E-mail: [email protected]
Queries and Update on ADS issued by the Company Overseas Custodian for ADS: Citi- Depositary Receipt Services388 Greenwich Street, 6th Floor, New York, NY 10013Phone: 212-816-6839Website: www.citi.com/dr
Indian Custodian for ADS:Citibank N.A. Custody Services FIFC- 11th Floor, G Block, Plot C-54 and C-55, BKC,Bandra (East), Mumbai – 400 098
Queries related to Debenture issued by the Company Debenture Trustee:Axis Trustee Services LimitedThe Ruby, 2nd Floor, SW29 Senapati Bapat Marg,Dadar (West), Mumbai – 400 028
FINANCIAL RESULTS � �The quarterly / half-yearly / annual results along with audit / limited review report , press release and investor presentation is filed with the stock exchanges immediately after the approval of the Board;
� �Within 48 hours of the conclusion of the meeting, the results are then published in at least one prominent national and one regional newspaper having wide circulation viz. a viz. Financial Express, Economic Times and Maharashtra Times;
� �The Company also sends its quarterly financial results to shareholders whose email ids are registered with the Registrar & Transfer Agent;
� �Financial results are also displayed on the Company’s website and can be accessed at https://www.vedantalimited.com.
PRESENTATIONS MADE TO INSTITUTIONAL INVESTORS AND ANALYSTS � �The schedule of analyst / investor meets are filed with the stock exchanges and the presentations for the same simultaneously uploaded on the website of the Company at https://www.vedantalimited.com;
� �The Company regularly files Investor Briefs with Stock Exchanges as we intend to keep our shareholders abreast with the operational performance, the organic project pipeline and internal developments in a transparent manner from time to time.
APPEAL TO SHAREHOLDERS � �Regular reminders are sent to shareholders for updating their email ids, PAN and Bank Mandate with the Company to ensure faster communication and credit of amounts. The shareholders can update their details with the Company directly on its website https://www.vedantalimited.com;
� �Reminders are sent to shareholders to encourage them to timely claim their unclaimed dividend and shares before the same is transferred to the IEPF Account;
� �Shareholders are also encouraged to open Demat accounts which eliminates bad delivery, saves stamp duty on transfers, ensures faster settlement, eases portfolio management and provides ‘on-line’ access through internet. The Company had provided exclusive facility to its shareholders to open their Demat accounts with Nil annual maintenance charges for first year.
ANNUAL REPORT & FORM 20F � �The Company sends soft copies of Annual Reports to those shareholders whose email ids are registered with the Company, and hard copies are also sent to those shareholders whose email ids are not registered. The Form 20F filed with SEC is also available on the website of the Company.
NEWS RELEASES � �The Company regularly keeps the stock exchanges updated on any of the developments / events and the same are simultaneously displayed on the Company’s website as well;
� All the releases can be accessed on the website of the Company at https://www.vedantalimited.com.
WEBSITE � �The Company has a corporate website https://www.vedantalimited.com under which there is a dedicated section on ‘Investor Relations’ which contains all the information for the investors like financial results, policies & codes, stock exchange filings, press releases, annual reports, SEC Filings etc.
CHAIRMAN COMMUNIQUE � �Each of the shareholders at the AGM are given copy of the Chairman’s Speech. The copies are printed for shareholders at AGM as well;
� �The speech is also placed on the website of the Company and published in the newspaper for better circulation.
n all the communications sent out by the Company to its shareholders it appeals to them to support the reen initiative by:
� �Registering their email ids with the Company through which all the communications, annual reports etc. can be promptly sent to the shareholders on real time basis;
� �Registering their Bank mandate with the Company which would enable direct credit of any dividends / amounts to shareholders and can avoid printing of warrants / cheques;
� �Converting physical holdings in Dematerialised holding as all the transactions can be undertaken online without printing of physical documents;
� �Voting through remote e-voting facility provided by the Company. The Company also offered insta poll facility to its shareholders present at the AGM which eliminated printing of ballot papers.
INTEGRATED REPORT MANAGEMENT REVIEW STATUTORY REPORTS
168-270FINANCIAL STATEMENTS
271-50206-115 116-167
252 VEDANTA LIMITED INTEGRATED REPORT AND ANNUAL ACCOUNTS 2019-20 VEDANTA LIMITED INTEGRATED REPORT AND ANNUAL ACCOUNTS 2019-20 253
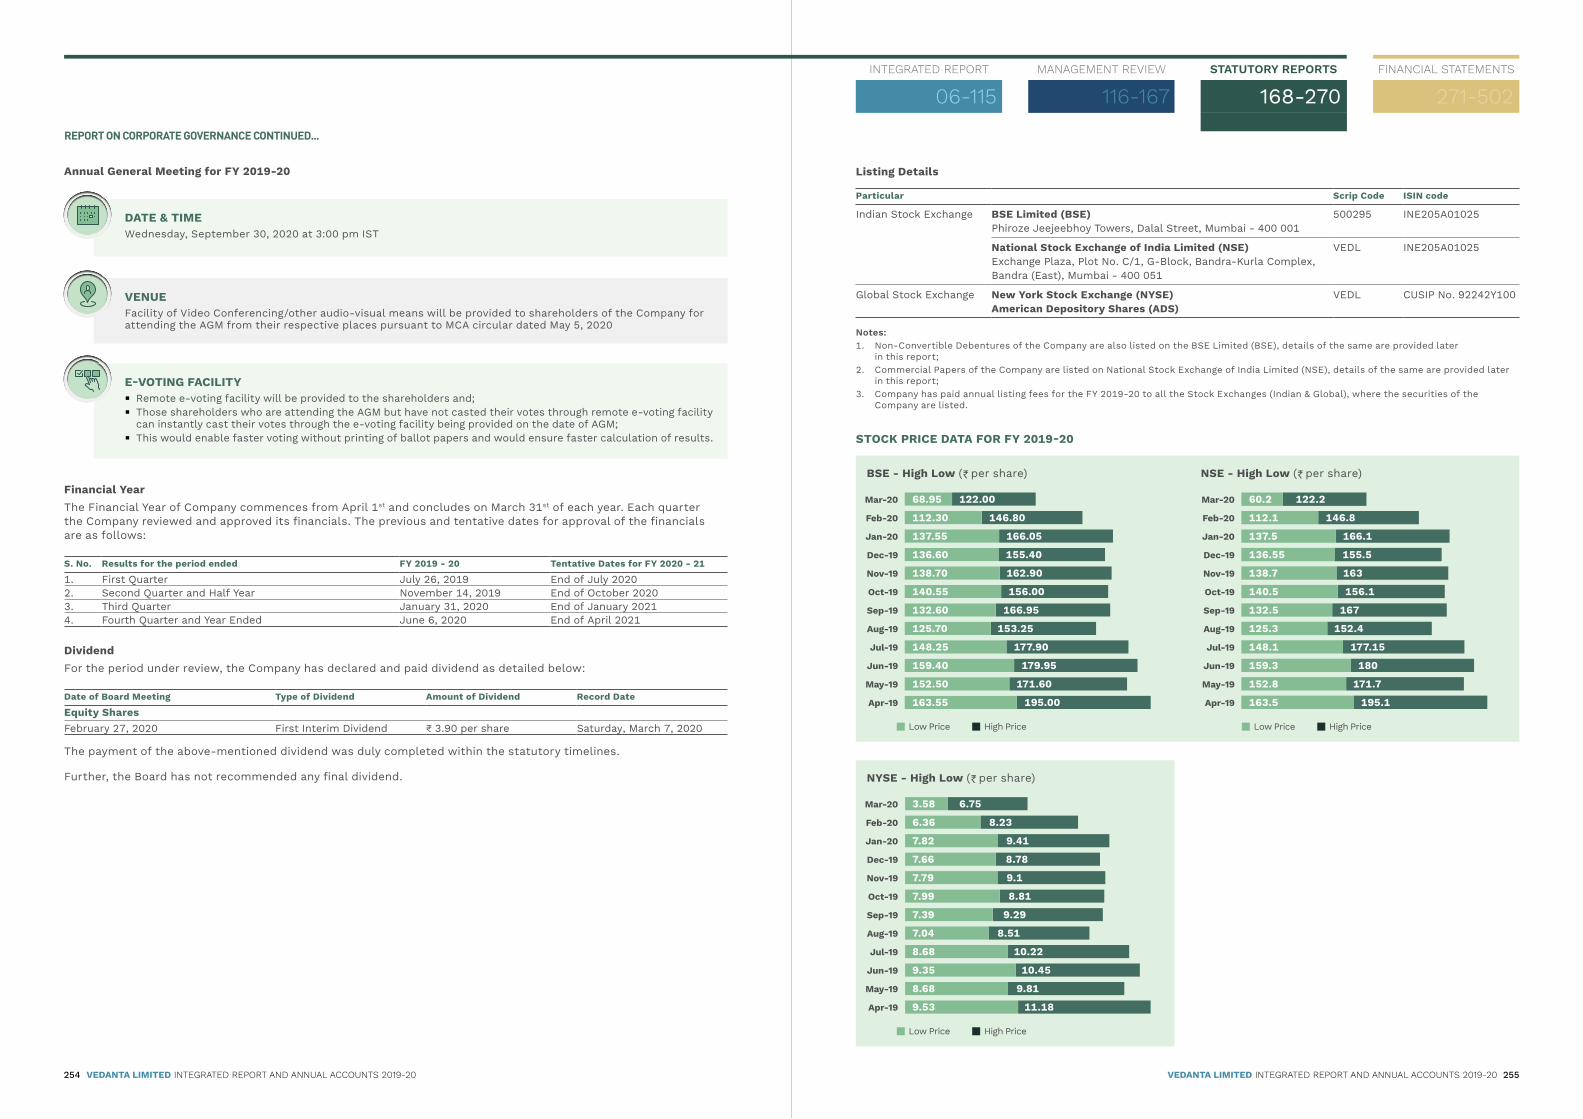
REPORT ON CORPORATE GOVERNANCE CONTINUED...
Annual General Meeting for FY 2019-20
Financial YearThe Financial Year of Company commences from April 1st and concludes on March 31st of each year. Each quarter the Company reviewed and approved its financials. The previous and tentative dates for approval of the financials are as follows:
S. No. Results for the period ended FY 2019 - 20 Tentative Dates for FY 2020 - 21
1. First Quarter July 26, 2019 End of July 20202. Second Quarter and Half Year November 14, 2019 End of October 20203. Third Quarter January 31, 2020 End of January 20214. Fourth Quarter and Year Ended June 6, 2020 End of April 2021
DividendFor the period under review, the Company has declared and paid dividend as detailed below:
Date of Board Meeting Type of Dividend Amount of Dividend Record Date
Equity SharesFebruary 27, 2020 First Interim Dividend 3.90 per share Saturday, March 7, 2020
The payment of the above-mentioned dividend was duly completed within the statutory timelines.
Further, the Board has not recommended any final dividend.
Listing Details
Particular Scrip Code ISIN code
Indian Stock Exchange BSE Limited (BSE)Phiroze Jeejeebhoy Towers, Dalal Street, Mumbai - 400 001
500295 INE205A01025
National Stock Exchange of India Limited (NSE)Exchange Plaza, Plot No. C/1, G-Block, Bandra-Kurla Complex, Bandra (East), Mumbai - 400 051
VEDL INE205A01025
Global Stock Exchange New York Stock Exchange (NYSE) American Depository Shares (ADS)
VEDL CUSIP No. 92242Y100
otes:1.� �Non-Convertible Debentures of the Company are also listed on the BSE Limited (BSE), details of the same are provided later
in this report;2.� �Commercial Papers of the Company are listed on National Stock Exchange of India Limited (NSE), details of the same are provided later
in this report;3.� �Company has paid annual listing fees for the FY 2019-20 to all the Stock Exchanges (Indian & Global), where the securities of the
Company are listed.
STOCK PRICE DATA FOR FY 2019-20
BSE - High Low (` per share)
NYSE - High Low (` per share)
NSE - High Low (` per share)
112.30
6.36
146.80
8.23
137.55
7.82
166.05
9.41
136.60
7.66
155.40
8.78
138.70
7.79
162.90
9.1
140.55
7.99
156.00
8.81
132.60
7.39
166.95
9.29
125.70
7.04
153.25
8.51
148.25
8.68
177.90
10.22
159.40
9.35
179.95
10.45
152.50
8.68
171.60
9.81
163.55
9.53
195.00
11.18
Mar-20
Mar-20
Feb-20
Feb-20
Jan-20
Jan-20
Dec-19
Dec-19
Nov-19
Nov-19
Oct-19
Oct-19
Sep-19
Sep-19
Aug-19
Aug-19
Jul-19
Jul-19
Jun-19
Jun-19
May-19
May-19
Apr-19
Apr-19
68.95
3.58
122.00
6.75
112.1 146.8
137.5 166.1
136.55 155.5
138.7 163
140.5 156.1
132.5 167
125.3 152.4
148.1 177.15
159.3 180
152.8 171.7
163.5 195.1
Mar-20
Feb-20
Jan-20
Dec-19
Nov-19
Oct-19
Sep-19
Aug-19
Jul-19
Jun-19
May-19
Apr-19
60.2 122.2
Low Price�� High Price
Low Price�� High Price
Low Price�� High Price
DATE & TIMEWednesday, September 30, 2020 at 3:00 pm IST
VENUEFacility of Video Conferencing/other audio-visual means will be provided to shareholders of the Company for attending the AGM from their respective places pursuant to MCA circular dated May 5, 2020
E-VOTING FACILITY � Remote e-voting facility will be provided to the shareholders and; � �Those shareholders who are attending the AGM but have not casted their votes through remote e-voting facility can instantly cast their votes through the e-voting facility being provided on the date of AGM;
� �This would enable faster voting without printing of ballot papers and would ensure faster calculation of results.
INTEGRATED REPORT MANAGEMENT REVIEW STATUTORY REPORTS
168-270FINANCIAL STATEMENTS
271-50206-115 116-167
254 VEDANTA LIMITED INTEGRATED REPORT AND ANNUAL ACCOUNTS 2019-20 VEDANTA LIMITED INTEGRATED REPORT AND ANNUAL ACCOUNTS 2019-20 255

REPORT ON CORPORATE GOVERNANCE CONTINUED...
Share Transfer System
A certificate by a Practicing Company Secretary is issued on a half-yearly basis pursuant to Regulation 40(9) of Listing Regulations confirming due compliance of share transfer formalities by the Company within timelines as required under law.
Quarterly audits are also carried out by the Practicing Company Secretary to reconcile the total admitted capital with NSDL and CDSL confirming that the total issued/paid up and listed capital holds agreement with the aggregate of the total number of shares in physical and dematerialised forms. The reports for Share Capital Audit Reconciliation are meticulously filed with BSE and NSE on a timely basis.
Capital EvolutionThe details of capital evolution of the Company can be accessed on the website of the Company at https://www.vedantalimited.com
Shareholding Distribution
Shareholding according to shareholders class as on March 31, 2020
Shareholding of Nominal value of E 1/- No. of shareholders % of Total shareholders No. of shares held Shareholding (%)
1-5,000 748,064 98.82 199,716,640 5.385,001- 10,000 5,165 0.68 37,216,414 1.0010,001- 20,000 2,052 0.27 28,724,449 0.7720,001- 30,000 537 0.07 13,186,882 0.3630,001- 40,000 251 0.03 8,679,439 0.2340,001- 50,000 149 0.02 6,777,017 0.1850,001- 100,000 251 0.03 17,837,275 0.48100,001 & Above 608 0.08 3,405,058,523 91.60Total 757,077 100 3,717,196,639 100
S. No. Category
March 31, 2020No. of shares
held Percentage of shareholding
Face value E 1/-
(a) Promoter’s holdingIndian promoters 160,656 0.01%Foreign promoters (including ADS) 1,863,458,132 50.13%
(b) Public Shareholding Banks, Mutual funds, Financial Institutions, Insurance Companies (Central/State Govt. Institutions/Non-Govt. Institutions)
681,040,674 18.32%
FIIs/Foreign Corporate Bodies 564,225,747 15.18%Body Corporates 82,902,299 2.23%Indian Public 280,344,950 7.54%NRIs 10,795,714 0.29%Trust 14,985,498 0.40%HUF 9,984,754 0.27%Clearing Members 10,599,376 0.29%Foreign Bodies-DR 28,859 0.00%Foreign Nationals 200 0.00%IEPF 4,463,642 0.12%NBFCs 17,432 0.00%Qualified Institutional Buyers 12,705,369 0.34%Overseas Corp Bodies 1,100 0.00%Alternate Investment Funds 4,616,476 0.12%ESOS Trust 14,378,261 0.39%
(c) American Depository Receipts 162,487,500 4.37%Grand Total 3,717,196,639 100.00%
1.� �Twinstar Holdings Limited (Promoter) holds 24,823,177 American Depository Shares (ADS) representing 99,292,708 equity shares. One (1) ADS represents four (4) equity shares.
2.� Mr. Dwarka Prasad Agarwal, promoter of the Company deceased on January 2, 2020.3.� �Mr. Dwarka Prasad Agarwal was holding ~82% in Agarwal Galvanising Private Limited (Promoter Group). Hence this entity has been
removed from Promoter Group category. This entity has also been dissolved.4.� 308,232 shares are under abeyance category, pending for allotment as they are subjudice.
Dematerialisation of Shares and LiquidityThe shares of the Company are compulsorily traded in dematerialised form on the stock exchanges. As on March 31, 2020, ~ 99% shares of the Company are held in dematerialised form.
Pursuant to the amendment in Listing Regulations, post April 1, 2019, except in case of transmission or transposition of securities, requests for effecting transfer of securities shall not be processed unless the securities are held in the dematerialised form with a depository.
The equity shares of the Company are freely tradable in the market and are among the most liquid and actively traded shares in the stock exchanges.
Outstanding ADSAs of March 31, 2020, 3,717,504,871 equity shares, par value 1 per equity share, were issued and outstanding (including 308,232 equity shares which have been issued but pending allotment), of which 261,780,208 equity shares were held in the form of 65,445,052 ADSs. Each ADSs represents four equity shares and are listed and traded on the New York Stock Exchange (NYSE). As of the year end, there were eight (8) registered holders of the ADS. Citibank N.A., New York acts as the Depository for the ADS/ADR issued by the Company.
Holding Distribution
(%)NSDL 88.09
CDSL 11.64
Physical 0.27
Shareholding Distribution
(%)Promoter & Promoter Group 50.14
Foreign Institutional Investors 19.55
Domestic Institutional Investors 18.32
Individuals (Indian Resident & NRIs) 7.83
Others - Body Corporates, HUF,Trusts, Foreign Nationals, etc.
4.16
VEDL Share price v/s BSE Sensex & BSE Metal Index VEDL Share price v/s NSE NIFY 50 & NSE Metal Index
120 120100 10080 80
0 00 0
20 20
0 0
VEDL BSE Sensex� BSE Metal VEDL Nifty 50� NSE Metal
Apr
il-19
Apr
il-19
May
-19
May
-19
June
-19
June
-19
July
-19
July
-19
Aug
-19
Aug
-19
Sep-
19
Sep-
19
Oct
-19
Oct
-19
Nov
-19
Nov
-19
Dec
-19
Dec
-19
Jan-
20
Jan-
20
Feb-
20
Feb-
20
Mar
-20
Mar
-20
� �Requests relating to transfer, transmission, transposition, change of name, deletion of name are received from shareholders having physical shareholding.
� �RTA, KFin Technologies (Erstwhile, Karvy Fintech) verifies the authenticity of documents;
� �RTA sends the request to the Company for processing.
� �The Company also checks the validity of documents;
� �Requests are then approved by the duly constituted Share & Debenture Transfer Committee.
� �Post Committee approval, RTA completes the process and the same is communicated to the respective shareholders;
� �Requests are generally processed within 15 days of receipt of the documents, if documents are clear and valid in all respects.
REQUEST RECEIVED BY RTA
DOCUMENT VERIFICATION
APPROVAL COMMUNICATION TO SHAREHOLDER
INTEGRATED REPORT MANAGEMENT REVIEW STATUTORY REPORTS
168-270FINANCIAL STATEMENTS
271-50206-115 116-167
256 VEDANTA LIMITED INTEGRATED REPORT AND ANNUAL ACCOUNTS 2019-20 VEDANTA LIMITED INTEGRATED REPORT AND ANNUAL ACCOUNTS 2019-20 257

REPORT ON CORPORATE GOVERNANCE CONTINUED...
Listing of Debt SecuritiesThe following Secured Redeemable Non-Convertible Debentures (NCDs) are listed with the BSE Limited as on March 31, 2020:
S. No. ISIN Issuance date Maturity date Coupon rate Payment frequency
No. of NCDs (Face value of
E 10 Lacs each)Amount issued
(in crores)
1 INE205A07030 Aug 17, 2015 Aug 17, 2020 9.45% Annual 20,000 2,0002 INE205A07048 Sep 30, 2016 Apr 20, 2020 8.70% Interest Compounded
Annually and payable at Maturity
6,000 600
3 INE205A07063 Oct 7, 2016 Apr 15, 2021 8.75% Interest Compounded Annually and payable at
Maturity
2,500 250
4 INE205A07071 Oct 7, 2016 Sep 15, 2021 8.75% Interest Compounded Annually and payable at
Maturity
2,500 250
5 INE205A07139 Apr 5, 2018 Apr 5, 2021 8.50% Annual 23,500 2,3506 INE205A07147 Apr 5, 2018 Jun 15, 2021 8.50% Annual 16,500 1,6507 INE205A07154 Jul 4, 2018 Jul 2, 2021 9.18% Annual 10,000 1,0008 INE205A07162 Dec 9, 2019 Dec 9, 2021 8.90% Annual 9,000 9009 INE205A07170 Dec 9, 2019 Dec 9, 2022 9.20% Annual 7,500 75010 INE205A07188 Jan 30, 2020 Jun 30, 2022 8.75% Annual 12,700 1,27011 INE205A07196 Feb 25, 2020 Feb 25, 2030 9.20% Annual 20,000 2,000
The following Commercial Papers (CPs) are listed with the National Stock Exchange of India Limited as on March 31, 2020:
S. No. ISIN Issuance date Maturity date Face Value (E)Total No. of
SecuritiesAmount Issued
(in crores)
1 INE205A14UQ4 Jan 28, 2020 Apr 27, 2020 500,000 10,000 5002 INE205A14UU6 Jan 30, 2020 Apr 29, 2020 500,000 5,000 2503 INE205A14UT8 Jan 31, 2020 Apr 30, 2020 500,000 27,000 1,3504 INE205A14UW2 Feb 5, 2020 May 5, 2020 500,000 7,000 3505 INE205A14UV4 Feb 6, 2020 May 6, 2020 500,000 15,000 7506 INE205A14UY8 Feb 7, 2020 May 8, 2020 500,000 30,000 1,5007 INE205A14UX0 Feb 12, 2020 May 11, 2020 500,000 8,500 4258 INE205A14VA6 Feb 20, 2020 May 20, 2020 500,000 31,000 1,5509 INE205A14VB4 Feb 25, 2020 May 21, 2020 500,000 5,000 25010 INE205A14UZ5 Feb 24, 2020 May 22, 2020 500,000 9,000 45011 INE205A14VC2 Mar 31, 2020 Jun 25, 2020 500,000 4,000 200
Credit Ratings
Status as on March 31, 2019 Status as on March 31, 2020 Date of Action
CRISIL India Ratings CRISIL India Ratings CRISIL India Ratings
Bank Loans CRISIL AA/Outlook Stable
IND AA/Outlook Stable
CRISIL AA/Outlook Stable
IND AA/Outlook Negative
No Change Change in Outlook on March 9, 2020
India Ratings changed the rating outlook to Negative from Stable while affirming the ratings on account of delay in deleveraging due to delay in ramp-up in Oil & Zinc and sharp fall in commodity prices.
Working Capital Lines
CRISIL AA/Outlook Stable/CRISIL A1+
- CRISIL AA/Outlook Stable/CRISIL A1+
No Change NA
Non-Convertible Debentures
CRISIL AA/Outlook Stable
- CRISIL AA/Outlook Stable
No Change NA
Commercial Paper
CRISIL A1+ IND A1+ CRISIL A1+ IND A1+ No Change No Change
Plant Locations
Division Location
Copper Anodes (Smelter), Refinery, Continuous Cast Copper Rods
� �SIPCOT Industrial Complex, Madurai By-pass Road, T.V. Puram PO, Tuticorin – 628 002 Tamil Nadu, India.
Copper Cathodes (Refinery) and Continuous Cast Copper Rods/Wire
� �1/1/2 Chinchpada, Silvassa – 396 230 Union Territory of Dadra and Nagar Haveli, India
� �Gat 201, Plot No. 2, 3, 4, 5, 6 and 7, Pune Old Highway,Takwe Khurd, Post Kamshet, Taluka Maval. Dist. Pune – 410 405, Maharashtra, India.**
Continuous Cast Copper Rods � �209-B, Piparia Industrial Estate, Piparia, Silvassa – 396 230, Union Territory of Dadra and Nagar Haveli, India
� �Ratnagiri – Y 1, R 57 Zaadzadgaon Block, MIDC, Ratnagiri – 415639, Maharashtra, India
Iron Ore – Mining � �Megalahally Office Complex, Megalahally Village, Hireguntanur, Hobli, Chitradurga Taluk and district, Karnataka, India*
Pig Iron Division 1 � �Sy No. 39, 41, 36/1 (p) 37 (P), 42/1 (p) 43/1 (p) Amona, P.O. Marcel, Bicholim, Goa - 403 107, India
Metallurgical Coke (Met Coke) � Sy No. 205, 207, Navelim, Sankhalim, Bicholim Goa - 403 505, India
� Sy No. 192, 193, Vazare, Dodamarg, Sindhudurg – 416 512, MaharashtraPIG Iron Division 2 � SY No. 177 N 120 (P) Navelim P.O. Sanquelim Bicholim Goa 403505, IndiaAluminium Smelters � �PMO Office, Bhurkahamuda, PO-Sripura, Dist. Jharsuguda, Odisha – 768 202, IndiaAlumina Refinery � �Alumina Refinery Project, At/PO – Lanjigarh, Via – Viswanathpur, Kalahandi,
Lanjigarh, Odisha – 766 027, IndiaAluminium � Post Box No. 4, Mettur Dam R.S. - 636 402, Salem District, Tamil Nadu, India
� �Gat No.924, 925, 926 and 927. Sanaswadi Taluka Shirur. Dist. Pune – 412 208 Maharashtra, India.**
Power � Bhurkahamunda, PO -Sripura, Dist. Jharsuguda, Odisha – 768 202, India
� �Power Plant 1, Plot Sy No. 44/4 & 44/5, Amona Village, Navellim, Bicholim Goa - 403 107, India
� SIPCOT Industrial Complex, Meelavitan, Tuticorin, Tamil Nadu – 628 002, IndiaOil & Gas � Assets
− RJ-ON-90/1 – Barmer Basin – India
− CB/OS-2 – Cambay Basin -India
− PKGM-1 Ravva – Krishna Godavari Basin – India
− KG-ONN-2003/1 – Krishna Godavari Basin – India
− KG-OSN-2009/3 – Krishna Godavari Basin – India
− KG/ONDSF/Kaza/2018 – Krishna Godavari Basin – India
− Block-01- Orange Basin – South Africa
� Pipeline
− Radhanpur Terminal, Patan, Gujarat
− Viramgam Terminal, Ahmedabad
− Bhogat Terminal, Dwarka, Gujarat
� Plant
− �Mangala Processing Terminal, Barmer, Rajasthan
− �Raageshwari Gas Terminal, Rajasthan
− �Suvali Onshore terminal, Gujarat
− �Raava Onshare terminal, Andhra Pradesh
− �Nagayalanka EPS Facility, Andhra PradeshPaper ** GIDC Doswada, Ta. Fort Songadh, District Tapi, GGujarat – 394 365, India
*The Supreme Court passed its final order in SLP (C) 32138/2015 (with connected matters), the M/s Goa Foundation v/s Sesa Sterlite Limited & Others on February 7, 2018 wherein it quashed the second renewals granted for the mining leases by the State of Goa. The court directed all lease holders operating under a second renewal to stop all mining operations with effect from March 16, 2018 until fresh mining leases (not fresh renewals or other renewals) are granted and fresh environmental clearances are granted.** Non-Operation Unit
INTEGRATED REPORT MANAGEMENT REVIEW STATUTORY REPORTS
168-270FINANCIAL STATEMENTS
271-50206-115 116-167
258 VEDANTA LIMITED INTEGRATED REPORT AND ANNUAL ACCOUNTS 2019-20 VEDANTA LIMITED INTEGRATED REPORT AND ANNUAL ACCOUNTS 2019-20 259

REPORT ON CORPORATE GOVERNANCE CONTINUED...
Commodity Price Risk or Foreign Exchange Risk and Hedging ActivitiesFluctuation in commodity pricesImpact: Prices and demand for the Group’s products are expected to remain volatile/uncertain and strongly influenced by global economic conditions. Volatility in commodity prices and demand may adversely affect our earnings, cash flow and reserves.
Mitigation: Our Group has a well-diversified portfolio, which acts as a hedge against fluctuations in commodities and delivers cash flows through the cycle. We consider exposure to commodity price fluctuations to be an integral part of our Group’s business and its usual policy is to sell its products at prevailing market prices, and not to enter into long-term price hedging arrangements. However, to minimise price risk for finished goods where price of raw material is also determined by same underlying base metal prices (e.g. purchase of alumina, copper concentrate for manufacturing and selling copper and aluminium products, respectively) we employ back-to-back hedging. In exceptional circumstances, we may enter into strategic hedging with prior approval of the Executive Committee. The Group monitors the commodity markets closely to determine the effect of price fluctuations on earnings, capital expenditure and cash flows.
Currency exchange rate uctuationsImpact: Our assets, earnings and cash flows are influenced by a variety of currencies due to the diversity of the countries in which we operate. Fluctuations in exchange rates of those currencies may have an impact on our financials. Although the majority of the Group’s revenue is tied to commodity prices that are typically priced by reference to the US dollar, a significant part of its expenses are incurred and paid in local currency. Moreover, some of the Group borrowings are denominated in US dollars, while a large percentage of cash and liquid investments are held in other
currencies, mainly in the Indian rupee. Any material fluctuations of these currencies against the US dollar could result in lower profitability or in higher cash outflows towards debt obligations.
Mitigation: We do not speculate in forex. We have developed robust controls in forex management to monitor, measure and hedge currency risk liabilities. The Finance Standing Committee (FSC), a committee of the Board, reviews our forex-related matters periodically and suggests necessary courses of action as may be needed by businesses from time to time, and within the overall framework of our forex policy.
Exposures on foreign currency loans are managed through the Group wide hedging policy, which is reviewed periodically to ensure that the results from fluctuating currency exchange rates are appropriately managed. The Group strives to achieve asset liability offset of foreign currency exposures and only the net position is hedged. The Group uses forward exchange contracts, currency swaps and other derivatives to hedge the effects of movements in exchange rates on foreign currency denominated assets and liabilities. The sources of foreign exchange risk are outstanding amounts payable for imported raw materials, capital goods and other supplies as well as financing transactions and loans denominated in foreign currencies. The Group is also exposed to foreign exchange risk on its net investment in foreign operations. Most of these transactions are denominated in US dollars. Short-term net exposures are hedged progressively based on their maturity. A more conservative approach has been adopted for project expenditures to avoid budget overruns, where cost of the project is calculated taking into account the hedge cost. However, all new long-term borrowing exposures are being hedged. The hedge mechanisms are reviewed periodically to ensure that the risk from fluctuating currency exchange rates is appropriately managed.
S. No.Commodity Name(1)
Exposure(2)
in INR towards the particular
commodity Units
Exposure(2) in quantity towards
the particular commodity
% of such exposure hedged through commodity derivativesDomestic market International market Total
OTC Exchange OTC Exchange
1 Aluminium 18,823 KT 1,408 0% 0% 0% 22% 22%2 Oil 6,326 mmboe 15 0% 0% 0% 0% 0%3 Gas 446 mmscf 10,226 0% 0% 0% 0% 0%4 Copper 13,453 KT 329 0% 0% 0% 95% 95%5 Silver 93 Oz 835,492 0% 0% 99% 0% 99%6 Gold 891 Oz 86,488 0% 89% 0% 0% 89%
1.� �Commodity means a commodity whose price is fixed by reference to an international benchmark and having a material effect on the financial statements.
2.� �Exposure for Aluminium and Oil is based on sales and closing stock and that for Gas is based on sales.� � �3.� �Gold and Silver are sold in the form of anode slime/copper concentrate. Anode slime is the residue formed while refining copper.
Exposure for Copper (including Gold and Silver) is based on opening stock, purchases and sales. Percentage of exposure not hedged represents unpriced transactions as at March 31, 2020 as the same will be hedged as per the Company’s policy and contractual terms once price period is fixed.� � � � � � � � �
OTHER DISCLOSURESTotal fees for all services on a consolidated basis to the statutory auditor
ParticularsMar-20
(In crores)
Audit fees (audit and review of financial statements) 25Audit-related fees (including other miscellaneous audit related certifications) 0Tax fees (tax audit, other certifications and tax advisory services) 0All other fees (certification on corporate governance and advisory services) 0Total 25
ote: All amounts are exclusive of GST
Framework for monitoring Subsidiary Companies‘Material Subsidiary’ is defined as a subsidiary, whose income or net worth exceeds ten percent of the consolidated income or net worth respectively, of the listed entity and its subsidiaries in the immediately preceding accounting year.
The Company has identified Hindustan Zinc Limited (listed) and Cairn India Holdings Limited (unlisted), subsidiaries of the Company as its material subsidiary based on the consolidated income/net worth of the Company in immediately preceding accounting year i.e. year ended March 31, 2019. Accordingly, the compliances under Listing Regulations with respect to material subsidiary have been duly met by the Company for FY 2019-20.
Confirming with the Listing Regulation, the Company has a policy on Determining Material Subsidiary, approved by the Board. The policy can be accessed at https://www.vedantalimited.com.
The subsidiary companies have their separate independent Board of Directors who are authorized to exercise all the responsibilities, duties and rights for effective monitoring and management of the subsidiaries.
The Company supervises and monitors the performance of subsidiary companies:
i.� �On a quarterly basis, placing before the Board, the minutes of each of the Board meetings of the subsidiary companies and a statement of all significant transactions of the subsidiary companies for their review and noting;
ii.� �On a quarterly basis, placing before the Audit Committee, the minutes of each of the Audit Committee meetings of the subsidiary companies;
iii.� �Presentations are made to the Company’s Board on business performance by the senior management of major subsidiaries of the Company;
iv.� �Certain matters of the subsidiaries are reserved for approval of the Board or Committee of Directors of the Company;
v.� �Subsidiaries are subject to applicable Statutory Audit and Secretarial Audit.
Further, appropriate disclosures related to subsidiaries are made in Financial Statements/Directors’ Report of the Company as per Companies Act 2013 and Listing Regulations.
Materially Significant Related Party TransactionsAll the related party transactions were in accordance with the provisions of Companies Act, 2013 and Listing Regulation and were in ordinary course of business and at arm’s length basis. A detailed information note on material significant related party transaction forms a part of Director’s Report.
The Company has a policy on Related Party Transactions, which regulates all the Related Party Transaction entered into by the Company. This policy has been approved by the Board and displayed on the Company’s website at https://www.vedantalimited.com.
Non-Compliance by the Company, Penalties, Strictures imposed by Stock Exchange or SEBI or any Statutory Authority on any matter related to capital markets during the last three years.
No penalty or strictures have been imposed by stock exchange or SEBI or any statutory authority on any matter related to capital markets on your Company during the last three years.
INTEGRATED REPORT MANAGEMENT REVIEW STATUTORY REPORTS
168-270FINANCIAL STATEMENTS
271-50206-115 116-167
260 VEDANTA LIMITED INTEGRATED REPORT AND ANNUAL ACCOUNTS 2019-20 VEDANTA LIMITED INTEGRATED REPORT AND ANNUAL ACCOUNTS 2019-20 261

REPORT ON CORPORATE GOVERNANCE CONTINUED...
Vigil Mechanism/Whistle-Blower Policy Commitment towards highest standards of morals and ethics in the conduct of business is of utmost importance to the Company. The employees have been provided access to provide any complaint in the Company’s accounting, internal accounting controls, auditing matters or any such suspected incidents of fraud or violation of the Company’s Code of Conduct that could adversely impact the Company’s operations, business performance and/or reputation.
All the employees of the Company and its subsidiaries are encouraged and expected to raise their concern. The Audit Committee has laid down procedure governing the receipt, retention and treatment of complaints. Your Company has in place a Whistle Blower Policy, as part of vigil mechanism and can be accessed at https://www.vedantalimited.com.
All the complaints are reported to the Director – Management Assurance, who is independent of operating management and the businesses. In line with global practices, dedicated email IDs ([email protected]), a centralised database, a 24X7 whistle blower hotline and a web-based portal (www.vedanta.ethicspoint.com) have been created to facilitate receipt of complaints.
Disclosure in relation to the Sexual Harassment of Women at workplace (Prevention, Prohibition and Redressal) Act, 2013The detailed disclosure forms part of the Directors Report.
COMPLIANCESDiscretionary Requirements
Corporate Governance requirements specified in Regulation 17 to 27 and Regulation 46 of Listing Regulations
S. No. Particulars RegulationCompliance Status
(Yes/No/NA) Complied with the following
1. Board of Directors 17 Yes � Composition 17(1), 17(1A) � Frequency of Meetings 17(2) � Quorum 17(2A) � Review of Compliance Report 17(3) � Orderly succession plans for appointments 17(4) � Code of Conduct 17(5) � �Fees/compensation to Non-Executive Directors 17(6) � �Minimum information to be placed before the Board 17(7) � Compliance Certificate 17(8) � Risk assessment and management 17(9) � �Performance evaluation of Independent Directors 17(10) � �Annexure in Notice for each Special item to be transacted at General Meeting 17(11)
� Item to be transacted at AGM 17(11)2. Maximum Number
of Directorship17A Yes � Other Directorship of Directors 17A (1) and (2)
3. Audit Committee 18 Yes � Composition 18(1) � Meetings and Quorum 18(2)(a) and (b) � Powers of the Committee 18(2)(c) � �Role of the Committee and review of information by the Committee 18(3)
4. Nomination and Remuneration Committee
19 Yes � Composition 19(1) � Chairperson 19(2) and (3) � Quorum 19(2A) � Meeting 19(3A) � Role of the Committee 19(4)
5. Stakeholder Relationship Committee
20 Yes � Composition 20(1) and 20(2A) � Chairperson 20(2) � Meeting 20(3A) � Role of the Committee 20(4)
6. Risk Management Committee
21 Yes � Composition 21(1) and (2) � Chairperson 21(3) � Meeting 21(3A) � Role of the Committee 21(4)
7. Vigil Mechanism 22 Yes � �Formulation of Vigil Mechanism for Directors and employees 22(1)
� �Director access to Chairperson of Audit Committee 22(2)8. Related Party
Transactions23 Yes � �Policy on Materiality of Related Party Transactions and
dealing with Related Party Transactions 23(1) � �Approval including omnibus approval of Audit Committee
23(2) and (3) � �There were no material Related Party Transactions 23(4) � �Disclosure of Related Party Transactions on consolidated basis 23(9)
9. Subsidiaries of the Entity
24 Yes � �There was no material subsidiary of the Company and as a result the other compliance in respect of material subsidiary were not applicable 24(1)
� �Review of financial statements of unlisted subsidiary by the Audit Committee 24(2)
� �Minutes of Meetings of Board of unlisted subsidiary placed at meeting of the listed entity 24(3)
� �Significant transactions and arrangements of unlisted subsidiary 24(4)
2 X7 Hotline
Dedicated email IDs
Web Based Portal
Centralised database
VEDANTA
VEDAN
EDANTATATWHISTLE
BLOWER POLICY
A non-executive chairperson may be entitled to maintain a chairperson’s office at the listed entity’s expense and also allowed reimbursement of expenses incurred in performance of his duties
A half-yearly declaration of financial performance including summary of the significant events in last six-months, may be sent to each household of shareholders
To move towards a regime of financial statements with unmodified audit opinion.
Internal auditor may report directly to the audit committee
As on March 31, 2020, the Board of the Company is chaired by an Executive Director who maintains the Chairman’s office at the Company’s expense. Effective April 1, 2020 Mr. Anil Agarwal has been appointed as a Non-Executive Chairman of the Board.
Quaterly financial Results were sent to the shareholders whose e-mail Id was registered with the Company
There was no qualification by the auditors on the financial statements of the Company.
The same is reported by briefing the Audit Committee through discussion and presentation of the observations, review, comments and recommendations, amongst others in the Internal Audit presentation by the Company’s Internal Auditor.
INTEGRATED REPORT MANAGEMENT REVIEW STATUTORY REPORTS
168-270FINANCIAL STATEMENTS
271-50206-115 116-167
262 VEDANTA LIMITED INTEGRATED REPORT AND ANNUAL ACCOUNTS 2019-20 VEDANTA LIMITED INTEGRATED REPORT AND ANNUAL ACCOUNTS 2019-20 263

REPORT ON CORPORATE GOVERNANCE CONTINUED...
S. No. Particulars RegulationCompliance Status
(Yes/No/NA) Complied with the following
10. Secretarial Audit 24A Yes � Secretarial audit report 24A
11. Obligations with respect to Independent Directors
25 Yes � �Alternate Directorship for Independent Director 25(1) � Tenure of Independent Director 25 (2) � Meetings of Independent Directors 25(3) and (4) � Replacement 25(6) � Familiarisation of Independent Directors 25(7) � Declaration of Independence 25(8) � Director and Officers Insurance 25(10)
12. Obligations with respect to Employees including Senior Management, Key Managerial Personnel, Directors and Promoters
26 Yes � �Memberships/Chairmanships in Committees 26(1) and (2) � �Affirmation on compliance of with the Code of Conduct by Directors and Senior Management 26(3)
� �Disclosure of shareholding by Non-Executive Directors in the listed entity 26(4)
� �Disclosures by Senior Management about potential conflicts of interest 26(5)
13. Other Corporate Governance Requirements
27 Yes � �Compliance with discretionary requirements 27(1) � �Filing of quarterly compliance report on Corporate Governance 27(2)
14. Website 46 Yes � Maintaining Functional Website 46(1) � Dissemination of details on website 46(2) � �Contents on website and updating the website 46(3)
Corporate Policies of the CompanyYour Company is inclined towards following highest levels of ethical standards in all our business transactions. To ensure the same, the Company has adopted various policies, codes and practices. The policies are reviewed periodically by the Board and are updated in line with amended laws and requirements. The key policies adopted are detailed below:
Category of Policy/Code Brief summary Web linkAmendments during FY 2019-20
Code of Business Conduct and Ethics
The Code details on uncompromising business ethics which is an integral part of Company’s values and method of conducting business. It’s based on the core values of Trust, Entrepreneurship, Innovation, Excellence, Integrity, Respect and Care. The Whistle Blower Policy also forms part of the Code.
The Code also covers areas such as Conflict of Interest, Gift, Competition and Fair dealings, Protection and use of Company Assets etc.
https://www.vedantalimited.com/CorporateGovernance
There has been no change in the Code
Corporate Social Responsibility Policy
The policy ensures that the conduct of Company’s business impacts the society through major thrust areas of education, women empowerment, sport & culture, drinking water & sanitation, agriculture & animal husbandry, community infrastructure, health care and disaster management and rescue and relief operations.
https://www.vedantalimited.com/CorporateGovernance
There has been no change in the policy
Nomination & Remuneration Policy
The policy details the guidelines on identification and appointment of individual as a Director, KMP and Senior Management Personnel including the criterial on their qualification and independence, manner and criteria for effective evaluation of the performance. The Policy also details the compensation principles responsibilities of senior management and succession planning.
https://www.vedantalimited.com/CorporateGovernance
There has been no change in the policy
Insider Trading Prohibition Code
The Code lays down the guideline to regulate, monitor and report trading in securities of the Company, Policy & Procedures for inquiry in case of leak of Unpublished Price Sensitive Information and Code of Practices and Procedures for Fair Disclosure & Policy for determination of Legitimate Purpose.
https://www.vedantalimited.com/CorporateGovernance
Amended the policy to include the revisions in SEBI (Prohibition of Insider Trading) (Third Amendment) Regulations, 2019 dated September 17, 2019
Dividend Distribution Policy
The policy details guidelines for dividend distribution for equity shareholders as per the requirements of the Listing Regulations.
https://www.vedantalimited.com/CorporateGovernance
There has been no change in the policy
Related Party Transaction Policy
This Policy sets out the philosophy and processes that is to be followed for approval and review in respect of transactions entered into by the Company with the identified Related Parties.
https://www.vedantalimited.com/CorporateGovernance
There has been no change in the policy
Determining Material Subsidiary Policy
The policy determines the guidelines for material subsidiaries of the Company and also provides the governance framework for such material subsidiaries.
https://www.vedantalimited.com/CorporateGovernance
There has been no change in the policy
Policy for determination of Materiality for Fair Disclosure of Material Events/Unpublished Price Sensitive Information to Stock Exchange(s)and Archival Policy
The policy determines the requirements for disclosing material events including deemed material events for the Company and its subsidiary companies which are in nature of unpublished price sensitive information.
The policy also lays the guidelines on archival and retention of records of the Company.
https://www.vedantalimited.com/CorporateGovernance
There has been no change in the policy
Policy on Prevention, Prohibition and Redressal of SexualHarassment at Workplace
The purpose to this policy is to create and maintain a healthy and conducive work environment, free of discrimination. This includes discrimination on any basis, including gender and any form of sexual harassment.
https://www.vedantalimited.com/CorporateGovernance
There has been no change in the policy
Awareness Sessions/Workshop on Compliances and EthicsVedanta as an organization strongly supports transparency and openness and believes in zero tolerance for unethical practices. Employees across the Company as well as the group are regularly sensitised about the various policies and governance practices of the Company through various interactive tools. Additionally, the Company also drives a group-wide ‘Ethics Compliance Month’ as part of its special annual initiative wherein it conducts awareness and training sessions covering on governance and internal policies such as prevention of insider trading, prevention of sexual harassment, anti-bribery and anti-corruption, anti-trust laws etc. Further, the Company has also developed an automated training module for a mandatory annual training for all its employees across
the group and reinforce the principles under the Code of Business Conduct and Ethics, the Whistle Blower Policy etc. Moreover, the senior management places great emphasis on good governance practices by setting the tone at the top and encouraging employees to educate themselves and to ensure transparency and integrity in their day-to-day activities.
Further, as part of our digital initiatives, a web-based portal for its designated employees is in place, to enable them to manage and report dealings in securities of the Company and ensure compliance with the Insider Trading Prohibition Code. Also, the Company has in place an online gift declaration portal wherein the employees are required to promptly declare the gifts received by them in compliance with the Gift Policy of the Company forming part of the Code of Ethics and Business Conduct.
INTEGRATED REPORT MANAGEMENT REVIEW STATUTORY REPORTS
168-270FINANCIAL STATEMENTS
271-50206-115 116-167
264 VEDANTA LIMITED INTEGRATED REPORT AND ANNUAL ACCOUNTS 2019-20 VEDANTA LIMITED INTEGRATED REPORT AND ANNUAL ACCOUNTS 2019-20 265

Statutory Compliance SystemThe Company has an internal standard operating procedure to manage statutory compliances across all businesses and has also deployed a top of the line automated compliance management system. This ensures best-in-class compliance monitoring and reporting with regular updates on checklists of all applicable statutory requirements including corporate laws, environmental laws, labour laws, industry laws amongst others. As a best practice, we have also made it mandatory for all CEOs to issue and sign-off compliance certificates for their respective businesses.
Declaration by Chief Executive Officer on Code of Business Conduct and Ethics of the Company A Declaration by the CEO of the Company, stating that the members of Board of Directors and Senior Management Personnel have affirmed compliance with the Code of Business Conduct and Ethics of the Company in enclosed as Annexure I to this Report.
Further, in order to ensure compliance with the Code of Ethics and Business Conduct (‘Code’) of the Company by all the employees of the Company, online
REPORT ON CORPORATE GOVERNANCE CONTINUED...
affirmations w.r.t. compliance with the Code are taken on an annual basis.
CEO CFO CertificationThe Compliance Certificate from the CEO & CFO of the Company pursuant to Regulation 17(8) of the Listing Regulations is enclosed as Annexure II to this Report.
Certificate from Company Secretary in PracticeA certificate from Chandrasekaran Associates, Company Secretary in Practice certifying that none of the directors on the Board of the Company have been debarred or disqualified from being appointed or continuing as directors of companies by the SEBI/MCA or any such statutory authority pursuant to Regulation 34(3) and Schedule V Para C clause (10)(i) of the Listing Regulations is enclosed as Annexure III to this Report.
Auditor’s Certificate on Corporate GovernanceThe auditor’s certificate regarding compliance of conditions of corporate governance pursuant to Listing Regulations is enclosed as Annexure IV to this Report.
ANNEXURE I
Declaration by Chief Executive Officer on Code of Business Conduct and Ethics of the Company
In accordance to the provisions of Securities and Exchange Board of India (Listing Obligations and Disclosure Requirements) Regulations, 2015, I, Sunil Duggal, Chief Executive Officer of Vedanta Limited, hereby declare that all members of the Board and Senior Management Personnel have affirmed compliance with the Code of Business Conduct and Ethics of the Company for FY 2019-20.
For Vedanta LimitedSunil Duggal
Date: June 6, 2020 Chief Executive Officer
ANNEXURE II
CERTIFICATION We, Sunil Duggal, Chief Executive Officer and GR Arun Kumar, Whole-Time Director & Chief Financial Officer, certify that:
A.� �We have reviewed financial statements and the cash flow statement for the year and that to the best of our knowledge and belief:
� (1)� �These statements do not contain any materially untrue statement or omit any material fact or contain statements that might be misleading;
� (2)� �These statements together present a true and fair view of the Company’s affairs and are in compliance with existing accounting standards, applicable laws and regulations.
B.� �There are, to the best of our knowledge and belief, no transactions entered into by the Company during the year, which are fraudulent, illegal or violative of the Company’s code of conduct.
C.� �We accept responsibility for establishing and maintaining internal controls for financial reporting. We have evaluated the effectiveness of internal control systems of the Company pertaining to financial reporting, and we have not noticed any deficiency in the design of operation of such internal controls, or of which we are aware that needs to be rectified, or informed to the auditors and the Audit Committee.
D.� During the year it was disclosed to the Auditors and the Audit Committee that:
� (1)� �There were no significant changes in internal control over financial reporting;
� (2)� �No significant changes in accounting policies were made during the year that require disclosure in the notes to the financial statements; and
� (3)� �No instances of significant fraud and the involvement therein, if any, of the management or an employee having a significant role in the Company’s internal control system over financial reporting, has come to our notice.
Sunil Duggal GR Arun KumarChief Executive Officer Whole-Time Director & Chief Financial OfficerPAN: AAMPD1109M DIN: 01874769
Date: June 6, 2020
INTEGRATED REPORT MANAGEMENT REVIEW STATUTORY REPORTS
168-270FINANCIAL STATEMENTS
271-50206-115 116-167
266 VEDANTA LIMITED INTEGRATED REPORT AND ANNUAL ACCOUNTS 2019-20 VEDANTA LIMITED INTEGRATED REPORT AND ANNUAL ACCOUNTS 2019-20 267

REPORT ON CORPORATE GOVERNANCE CONTINUED...
ANNEXURE III
CERTIFICATE OF NON-DISQUALIFICATION OF DIRECTORS(Pursuant to Regulation 34(3) and Schedule V Para C clause (10)(i) of the SEBI (Listing Obligations and Disclosure Requirements) Regulations, 2015)
To,The MembersVedanta Limited1st Floor, ‘C’ wing, Unit 103, Corporate Avenue, Atul Projects,Chakala, Andheri (East), Mumbai – 400 093, Maharashtra
We have examined the relevant registers, records, forms, returns and disclosures received from the Directors of Vedanta Limited and having CIN L13209MH1965PLC291394 and having Registered office at 1st Floor, C Wing, Unit 103, Corporate Avenue, Atul Projects, Chakala, Andheri (East), Mumbai – 400 093, Maharashtra (hereinafter referred to as ‘the Company’), produced before us by the Company for the purpose of issuing this Certificate, in accordance with Regulation 34(3) read with Schedule V Para-C Sub clause 10(i) of the Securities and Exchange Board of India (Listing Obligations and Disclosure Requirements) Regulations, 2015.
In our opinion and to the best of our information and according to the verifications (including Directors Identification Number (DIN) status at the portal www.mca.gov.in) as considered necessary and explanations furnished to us by the Company & its officers, We hereby certify that none of the Directors on the Board of the Company as stated below for the Financial Year ending on March 31, 2020 have been debarred or disqualified from being appointed or continuing as Directors of companies by the Securities and Exchange Board of India, Ministry of Corporate Affairs or any such other Statutory Authority:
S.No. Name of Director DIN Date of appointment in Company
1. Navin Agarwal 00006303 17.08.20132. Aman Mehta 00009364 17.05.20173. Krishnamurti Venkataramanan 00001647 01.04.20174. Lalita Dileep Gupte 00043559 29.03.20145. Mahendra Kumar Sharma 00327684 01.06.20196. Upendra Kumar Sinha 00010336 13.03.20187. Priya Agarwal 05162177 17.05.20178. Tarun Jain 00006843 01.04.20149. Guggilam Rajagopalan Arun Kumar 01874769 22.11.201610. Srinivasan Venkatakrishnan 08364908 01.03.2019
Ensuring the eligibility for the appointment/continuity of every Director on the Board is the responsibility of the management of the Company. Our responsibility is to express an opinion on these based on our verification. This certificate is neither an assurance as to the future viability of the Company nor of the efficiency or effectiveness with which the management has conducted the affairs of the Company.
For Chandrasekaran AssociatesCompany Secretaries
Dr. S. ChandrasekaranSenior Partner
Membership No. FCS No.: 1644Date: April 29, 2020 Certificate of Practice No.: 715Place: Delhi UDIN: F001644B000173992
ANNEXURE IV
Independent Auditor’s Report on compliance with the conditions of Corporate Governance as per provisions of Chapter IV of Securities and Exchange Board of India (Listing Obligations and Disclosure Requirements) Regulations, 2015, as amended
The MembersVedanta Limited1st Floor, ‘C’ WingUnit 103, Corporate Avenue, Atul ProjectsChakala, Andheri (E), Mumbai
1.� �The Corporate Governance Report prepared by Vedanta Limited (hereinafter the “Company”), contains details as specified in regulations 17 to 27, clauses (b) to (i) of sub-regulation (2) of regulation 46 and para C, D, and E of Schedule V of the Securities and Exchange Board of India (Listing Obligations and Disclosure Requirements) Regulations, 2015, as amended (“the Listing Regulations”) (‘Applicable criteria’) for the year ended March 31, 2020 as required by the Company for annual submission to the Stock exchange.
MANAGEMENT’S RESPONSIBILITY2.� �The preparation of the Corporate Governance Report is the responsibility of the Management of the Company
including the preparation and maintenance of all relevant supporting records and documents. This responsibility also includes the design, implementation and maintenance of internal control relevant to the preparation and presentation of the Corporate Governance Report.
3.� �The Management along with the Board of Directors are also responsible for ensuring that the Company complies with the conditions of Corporate Governance as stipulated in the Listing Regulations, issued by the Securities and Exchange Board of India.
AUDITOR’S RESPONSIBILITY4.� �Pursuant to the requirements of the Listing Regulations, our responsibility is to provide a reasonable assurance
in the form of an opinion whether, the Company has complied with the conditions of Corporate Governance as specified in the Listing Regulations.
5.� �We conducted our examination of the Corporate Governance Report in accordance with the Guidance Note on Reports or Certificates for Special Purposes and the Guidance Note on Certification of Corporate Governance, both issued by the Institute of Chartered Accountants of India (“ICAI”). The Guidance Note on Reports or Certificates for Special Purposes requires that we comply with the ethical requirements of the Code of Ethics issued by the Institute of Chartered Accountants of India.
6.� �We have complied with the relevant applicable requirements of the Standard on Quality Control (SQC) 1, Quality Control for Firms that Perform Audits and Reviews of Historical Financial Information, and Other Assurance and Related Services Engagements.
7.� �The procedures selected depend on the auditor’s judgement, including the assessment of the risks associated in compliance of the Corporate Governance Report with the applicable criteria. Summary of procedures performed include:
� i.� �Read and understood the information prepared by the Company and included in its Corporate Governance Report;
� ii.� �Obtained and verified that the composition of the Board of Directors with respect to executive and non-executive directors has been met throughout the reporting period;
� iii.� �Obtained and read the Register of Directors as on March 31, 2020 and verified that atleast one independent woman director was on the Board of Directors throughout the year.
INTEGRATED REPORT MANAGEMENT REVIEW STATUTORY REPORTS
168-270FINANCIAL STATEMENTS
271-50206-115 116-167
268 VEDANTA LIMITED INTEGRATED REPORT AND ANNUAL ACCOUNTS 2019-20 VEDANTA LIMITED INTEGRATED REPORT AND ANNUAL ACCOUNTS 2019-20 269

REPORT ON CORPORATE GOVERNANCE CONTINUED...
� iv.� �Obtained and read the minutes of the following committee meetings/other meetings held during April 1, 2019 to March 31, 2020:
� � (a)� Board of Directors;
� � (b)� Audit Committee;
� � (c)� Annual General Meeting (AGM);
� � (d)� Nomination and Remuneration Committee;
� � (e)� Stakeholders Relationship Committee;
� � (f)� Corporate Social Responsibility Committee;
� � (g)� Risk Management Committee
� v.� Obtained necessary declarations from the directors of the Company.
� vi.� Obtained and read the policy adopted by the Company for related party transactions.
� vii.� �Obtained the schedule of related party transactions during the year and balances at the year end. Obtained and read the minutes of the audit committee meeting where in such related party transactions have been pre-approved by the audit committee.
� viii.� �Performed necessary inquiries with the management and also obtained necessary specific representations from management.
8.� �The above-mentioned procedures include examining evidence supporting the particulars in the Corporate Governance Report on a test basis. Further, our scope of work under this report did not involve us performing audit tests for the purposes of expressing an opinion on the fairness or accuracy of any of the financial information or the financial statements of the Company taken as a whole.
OPINION 9.� �Based on the procedures performed by us, as referred in paragraph 7 above, and according to the information
and explanations given to us, we are of the opinion that the Company has complied with the conditions of Corporate Governance as specified in the Listing Regulations, as applicable for the year ended March 31, 2020, referred to in paragraph 1 above.
OTHER MATTERS AND RESTRICTION ON USE10.� �This report is neither an assurance as to the future viability of the Company nor the efficiency or effectiveness
with which the management has conducted the affairs of the Company.
11.� �This report is addressed to and provided to the members of the Company solely for the purpose of enabling it to comply with its obligations under the Listing Regulations with reference to compliance with the relevant regulations of Corporate Governance and should not be used by any other person or for any other purpose. Accordingly, we do not accept or assume any liability or any duty of care or for any other purpose or to any other party to whom it is shown or into whose hands it may come without our prior consent in writing. We have no responsibility to update this report for events and circumstances occurring after the date of this report.
For S.R. Batliboi & Co. LLPChartered Accountants
ICAI Firm Registration Number: 301003E/E300005
per Sudhir SoniPartner
Place: Mumbai Membership Number: 41870Date: June 6, 2020 UDIN: 20041870AAAAAR9434
VEDANTA LIMITED INTEGRATED REPORT AND ANNUAL ACCOUNTS 2019-20 271
INDEPENDENT AUDITOR’S REPORT
To the Members of Vedanta Limited
REPORT ON THE AUDIT OF THE STANDALONE IND AS FINANCIAL STATEMENTS
OPINIONWe have audited the accompanying standalone Ind AS financial statements of Vedanta Limited (“the Company”), which comprise the Balance sheet as at March 31 2020, the Statement of Profit and Loss, including the statement of Other Comprehensive Income, the Cash Flow Statement and the Statement of Changes in Equity for the year then ended, and notes to the standalone Ind AS financial statements, including a summary of significant accounting policies and other explanatory information
In our opinion and to the best of our information and according to the explanations given to us, the aforesaid standalone Ind AS financial statements give the information required by the Companies Act, 2013, as amended (“the Act”) in the manner so required and give a true and fair view in conformity with the accounting principles generally accepted in India, of the state of affairs of the Company as at March 31, 2020, its loss including other comprehensive income, its cash flows and the changes in equity for the year ended on that date.
BASIS FOR OPINIONWe conducted our audit of the standalone Ind AS financial statements in accordance with the Standards on Auditing (SAs), as specified under section 143(10) of the Act. Our responsibilities under those Standards are further described in the ‘Auditor’s Responsibilities for the Audit of the Standalone Ind AS Financial Statements’ section of our report. We are independent of the Company in accordance with the ‘Code of Ethics’ issued by the Institute of Chartered Accountants of India together with the ethical requirements that are relevant to our audit of the financial statements under the provisions of the Act and the Rules thereunder, and we have fulfilled our other ethical responsibilities in accordance with these requirements and the Code of Ethics. We believe that the audit evidence we have obtained is sufficient and appropriate to provide a basis for our audit opinion on the standalone Ind AS financial statements.
EMPHASIS OF MATTERWe draw attention to:
a) Note 3c(A)(viii) of the accompanying Ind AS financial statements which describes the uncertainty arising out of the demands that have been raised on the Company, with respect to government’s share of profit oil by the Director General of Hydrocarbons. Further, one of the pre-conditions for the extension of the Production Sharing Contract (PSC) for the Rajasthan oil block is the settlement of these demands. The Company, believes it is in compliance with the necessary conditions to secure an extension of this PSC, and based on the legal advice believes that the demands are untenable and hence no provision is required in respect of these demands.
b) Note 3c(A)(i) of the accompanying Ind AS financial statements which, describes the uncertainties related to Covid-19 and its consequential effects on the affairs of the Group.
Our opinion is not modified in respect of the above matters.
KEY AUDIT MATTERSKey audit matters are those matters that, in our professional judgment, were of most significance in our audit of the standalone Ind AS financial statements for the financial year ended March 31, 2020. These matters were addressed in the context of our audit of the standalone Ind AS financial statements as a whole, and in forming our opinion thereon, and we do not provide a separate opinion on these matters. For each matter below, our description of how our audit addressed the matter is provided in that context.
We have determined the matters described below to be the key audit matters to be communicated in our report. We have fulfilled the responsibilities described in the Auditor’s responsibilities for the audit of the standalone Ind AS financial statements section of our report, including in relation to these matters. Accordingly, our audit included the performance of procedures designed to respond to our assessment of the risks of material misstatement of the standalone Ind AS financial statements. The results of our audit procedures, including the procedures performed to address the matters below, provide the basis for our audit opinion on the accompanying standalone Ind AS financial statements.
INTEGRATED REPORT MANAGEMENT REVIEW STATUTORY REPORTS FINANCIAL STATEMENTS
06-115 116-167 168-270 271-502
270 VEDANTA LIMITED INTEGRATED REPORT AND ANNUAL ACCOUNTS 2019-20
272 VEDANTA LIMITED INTEGRATED REPORT AND ANNUAL ACCOUNTS 2019-20 VEDANTA LIMITED INTEGRATED REPORT AND ANNUAL ACCOUNTS 2019-20 273
Key audit matters How our audit addressed the key audit matter
Recoverability of carrying value of property plant and equipment, capital work in progress, exploration intangible assets under development and investments being carried at cost (as described in notes 3a(F),3c(A)(iii), (iv),(vii) & (x), 5, 6A and 31 of the standalone Ind AS financial statements)As at March 31, 2020, the Company had significant amounts of property, plant and equipment, capital work in progress, exploration intangible assets under development and investments being carried at cost. We focused our efforts on the Cash Generating Units (“CGUs”) of (a) Tuticorin within the copper segment; (b) Krishna Godavri block and the Rajasthan block within the oil & gas segment; and (c) assets in the aluminum segment and investment in subsidiaries holding such assets; as they had impairment indicators.
Recoverability of property plant and equipment, capital work in progress, exploration intangible assets and investment being carried at cost has been identified as a key audit matter due to:
� The significance of the carrying value of assets being assessed.
� Reduction in market prices of oil prices and metal and future uncertainty caused due to Covid-19.
� The withdrawal of the Company’s license to operate the copper plant and conditional renewal of the production sharing contract for Rajasthan oil block.
� The size of impairment charges.
� Some of the items of capital work in progress in the aluminum segment have been outstanding since long.
� The fact that the assessment of the recoverable amount of the Company’s CGUs and investments involves significant judgements about the future cash flow forecasts and the discount rate that is applied.
The key judgements and estimates centered on the likely outcome of the litigations, demands raised by the government, cash flow forecasts, prices and discount rate assumptions. Details of impairment charge amounting to ` 12,335 Crore recognised are given in note 31 of the accompanying financial statements.
Our audit procedures included the following:
� Assessed through an analysis of internal and external factors impacting the Company, whether there were any indicators of impairment in line with Ind AS 36.
� Assessed the existence and usability, through examination of third-party certificate, of aged capital work in progress (‘CWIP’) in the aluminum segment. Vouched expenses capitalized to CWIP on a sample basis.
� Specifically, in relation to the CGUs where impairment indicators were identified, obtained and evaluated the valuation models used to determine the recoverable amount by assessing the key assumptions used by the management including:
− Considering forecasted volumes in relation to asset development plans.
− Assessing management’s forecasting accuracy by comparing prior year forecasts to actual results and assessing the potential impact of any variances.
− Corroborating the sales price assumptions used in the models against analyst consensus and assessing the reasonableness of costs.
− Testing the weighted average cost of capital used to discount the impairment models.
− Testing the integrity of the models together with their clerical accuracy.
− Assessed the implications of withdrawal of Company’s license to operate the copper plants. Inspected the external legal opinions in respect of the merits of the case and assessed management’s position through discussions with the legal counsel to determine the basis of their conclusion.
− Assessed the implications and likelihood of the possible outcome of the conditions precedent to the extension of the Rajasthan oil block and management’s analysis of the same, including an assessment of how a market participant would react to the same.
− Engaged valuation experts to assist in performance of the above procedures.
� Assessed the competence and objectivity of the Company’s experts and experts engaged by us, to satisfy ourselves that these parties are suitable in their roles.
� Assessed the disclosures made by the Company in this regard.
Key audit matters How our audit addressed the key audit matter
Evaluation of Going Concern assumption of accounting (as described in note 3c(A)(xi) of the standalone Ind AS financial statements)The evaluation of the appropriateness of adoption of going concern assumption for preparation of these financial statements performed by the management of the Company is identified as a key audit matter because as at March 31, 2020, the Company had net current liabilities of ` 25,069 Crore.
The Company has prepared future cash flow forecasts which involves judgement and estimation of key variables and market conditions including future economic conditions on account of prevailing global pandemic COVID-19 and the uncertainty around the extension of the PSC of the Rajasthan oil and gas block.
The Company is confident that the net cash inflows from operating activities in conjunction with the available line of credit and normal cyclical nature of working capital receipts and payment will provide sufficient liquidity to meet its financial obligation as the fall due for the following twelve months. Hence, these financial statements have been prepared adopting the going concern assumption
Our procedures in relation to evaluation of going concern included the following:
� Obtained an understanding of the process followed by the management and tested the internal controls over the liquidity assessment, compliance with the debt covenants and preparation of the cash flow forecast, and validation of the assumptions and inputs used in the model to estimate the future cash flows.
� Tested the inputs and assumptions used by the management in the cash flow forecast against historical performance, budgets, economic and industry indicators, publicly available information, the Company’s strategic plans and benchmarking of key market related conditions.
� Assessing the key assumptions including those pertaining to revenue and the timing of significant payments in the cash flow forecast.
� Performed sensitivity analysis on key assumptions like input prices and selling prices to determine their impact on the projections of future cash flows and also on any possible cash outgo for securing the extension of the Rajasthan oil and gas block.
� Compared the details of the company’s long-term credit facilities to the supporting documentation.
� Assessed the disclosures made by the Company in this regard.Revenue recognition (as described in notes 3a(A),) 3c(B)(ii) and 26A of the standalone Ind AS financial statements)For the year ended March 31, 2020 the Company has recognized revenue from operations of ` 35,417 Crore.
Revenue recognition has been recognized as a key audit matter due to diverse and complex revenue streams across the Company.
We have identified following key areas for consideration:
� Complexity associated with the determination of items which are cost recoverable within the Oil & Gas segment.
� The variety of terms in the copper, iron ore and aluminum segments that define when control is transferred to the customer.
� Restrictions had been put in place for movement of goods close to the year-end due to the outbreak of Covid-19 pandemic. This gives rise to the risk that revenue may not have been recognised in the correct period.
Our audit procedures included the following:
� Our audit procedures included the evaluation of the Company's revenue recognition accounting policies and assessing compliance with the policies in terms of Ind AS 115.
� Performed walkthroughs and test of controls, assisted by IT specialists, of the revenue recognition processes and assessed the design and operating effectiveness of key controls.
� Inspected the terms of production sharing contracts in the Oil and Gas segment and tested the items considered for cost recovery. Also, inspected external legal opinions (where considered necessary) to evaluate the merits of the claims made by the Company in computing its own share of revenue. We also assessed the disclosures made by the Company relating to calculation of profit petroleum and revenue from joint operation partners within the Oil and Gas segment.
� Inspected the production sharing contracts and communications from the government and independent legal opinion for revenue recognized on account of recovery of past oil and gas exploration costs. Assessed the management judgement and supporting documents around timing of recovery of such costs.
� Obtained from the management the details of goods that were dispatched after restrictions were imposed on movement of goods and agreed the same to the underlying documents.
� Selected a sample of sales, in the copper, iron ore and aluminum segments, made pre and post year end, agreeing the date of revenue recognition to third party support, such as bills of lading, to confirm sales are recognized according to contract conditions.
� Examined invoice samples with various shipping terms to test whether revenue has been recognized correctly.
� Assessed the disclosures made by the Company
INTEGRATED REPORT MANAGEMENT REVIEW STATUTORY REPORTS FINANCIAL STATEMENTS
06-115 116-167 168-270 271-502

274 VEDANTA LIMITED INTEGRATED REPORT AND ANNUAL ACCOUNTS 2019-20 VEDANTA LIMITED INTEGRATED REPORT AND ANNUAL ACCOUNTS 2019-20 275
Key audit matters How our audit addressed the key audit matter
Recoverability of unutili ed Minimum Alternate Tax (MAT) credits included under deferred tax assets (as described in notes 3a(L),3c(A)(vi) and 32 of the standalone Ind AS financial statements)Deferred tax assets as at March 31, 2020 includes MAT credits of ` 3,600 Crore relating to the Company which is available for utilization against future tax liabilities. The same are expected to be utilized during the last two years of the stipulated fifteen year carry forward period from the year in which, the same arose.
The analysis of the recoverability of such deferred tax assets has been identified as a key audit matter because the assessment process involves judgement regarding the future profitability and the likelihood of the realization of these assets, in particular whether there will be taxable profits in future periods that support the recognition of these assets. This requires assumptions regarding future profitability, which is inherently uncertain. Accordingly, the same is considered as a key audit matter.
Our audit procedures included the following:
� Gained an understanding of the process and identified key controls in the process. For selected controls we have performed tests of controls.
� Obtained and analysed the future projections of taxable profits estimated by management, assessing the key assumptions used, including the analysis of the consistency of the actual results obtained by the various segments with those projected in the previous year. We further obtained evidence of the approval of the budgeted results included in the current year's projections, and the reasonableness of the future cash flow projections and the consistency of those projections with those used in other areas of estimation such as those used for assessing the recoverability of assets.
� Tested the completeness and accuracy of the MAT credits recognized as deferred tax assets.
� Assessed the disclosures made by the management in this regard.
Recoverability of advance given to Konkola Copper Mines (‘KCM’) (as described in notes 31(c) and 36 of the standalone Ind AS financial statements)As of March 31, 2020, the Company had given an advance equivalent to ` 158 Crore to Konkola Copper Mines (KCM), Zambia, for the supplies of raw material. KCM has not supplied the material during the contracted period
Judgment is involved in assessing the recoverability of advance on account of below reasons:
� The Company’s parent company has lost control over KCM and a provisional liquidator has been appointed for running the operations.
� The provisional liquidator is not responding to the communications sent by the Company regarding these advances.
Accordingly, recoverability of the aforesaid advance is considered as a key audit matter.
Our audit procedures included the following:
� Examined the agreements as per which these advances were given by the Company to KCM and verified its terms and conditions
� Examined the various communication made by Company with provisional liquidator with regard to these advances.
� Assessed management’s position through discussions with the management’s in-house legal team to determine the basis of their conclusion.
� Examined the legal opinion obtained by the Company and also the valuation report for KCM, obtained by the Company’s parent company and communications received from the parent company in this regard.
� Assessed the disclosures and provisions made by the Company in this regard.
Key audit matters How our audit addressed the key audit matter
Recoverability of disputed trade receivables in power segment (as described in notes 3c(B)(ii) and 7 of the standalone Ind AS financial statements)As of March 31,2020, the value of disputed receivables in the power segment aggregated to ` 1,349 Crore.
Due to disagreements over the quantification or timing of the receivable, the recovery of receivables from GRIDCO are subject to increased risk. Some of these balances are also subject to litigation. The risk is specifically related to receivables from GRIDCO. These receivables include long outstanding balances as well and are also subject to counter party credit risk.
Our audit procedures included the following:
� Examined the underlying power purchase agreements.
� Examined the relevant state regulatory commission, appellate tribunal and court rulings.
� Examined external legal opinions in respect of the merits of the case and assessed management’s position through discussions with the management’s in-house legal team to determine the basis of their conclusion.
� Examined management’s assessment of recoverability of receivables.
� Sought external lawyer confirmation from Legal Counsel representing the Company in these cases.
� Assessed the competence and objectivity of the Company's experts, to satisfy ourselves that these parties are suitable in their roles.
� Assessed the disclosures made by the Company in this regard.Claims and exposures relating to taxation and litigation (as described in notes 3a(O), 3c(B)(i) and 35 of the standalone Ind AS financial statements)The Company is subject to a large number of tax and legal disputes, including audit objections in the oil and gas segment, which have been disclosed / provided for in the financial statements based on the facts and circumstances of each case.
Taxation and litigation exposures have been identified as a key audit matter due to the complexities involved in these matters, timescales involved for resolution and the potential financial impact of these on the financial statements. Further, significant management judgement is involved in assessing the exposure of each case and thus a risk that such cases may not be adequately provided for or disclosed.
Our audit procedures included the following: -
� Gained an understanding of the process of identification of claims, litigations and contingent liabilities and identified key controls in the process. For selected controls we have performed tests of controls.
� Obtained the summary of Company’s legal and tax cases and assessed management’s position through discussions with the Legal Counsel, Head of Tax and operational management, on both the probability of success in significant cases, and the magnitude of any potential loss.
� Examined external legal opinions (where considered necessary) and other evidence to corroborate management’s assessment of the risk profile in respect of legal claims.
� Engaged tax specialists to technically appraise the tax positions taken by management with respect to local tax issues.
� Assessed whether management assessment of similar cases is consistent across the divisions or that differences in positions are adequately justified.
� Assessed the relevant disclosures made within the financial statements to address whether they reflect the facts and circumstances of the respective tax and legal exposures and the requirements of relevant accounting standards.
� Assessed the competence and objectivity of the Company's experts, to satisfy ourselves that these parties are suitable in their roles.
We have determined that there are no other key audit matters to communicate in our report.
INFORMATION OTHER THAN THE FINANCIAL STATEMENTS AND AUDITOR’S REPORT THEREONThe Company’s Board of Directors is responsible for the other information. The other information comprises the information included in the Annual report, but does not include the standalone Ind AS financial statements and our auditor’s report thereon.
Our opinion on the standalone Ind AS financial statements does not cover the other information and we do not express any form of assurance conclusion thereon.
In connection with our audit of the standalone Ind AS financial statements, our responsibility is to read the other information and, in doing so, consider whether such other information is materially inconsistent with the financial statements or our knowledge obtained
in the audit or otherwise appears to be materially misstated. If, based on the work we have performed, we conclude that there is a material misstatement of this other information, we are required to report that fact. We have nothing to report in this regard.
RESPONSIBILITIES OF MANAGEMENT FOR THE STANDALONE IND AS FINANCIAL STATEMENTSThe Company’s Board of Directors is responsible for the matters stated in section 134(5) of the Act with respect to the preparation of these standalone Ind AS financial statements that give a true and fair view of the financial position, financial performance including other comprehensive income, cash flows and changes in equity of the Company in accordance with the accounting principles generally accepted in India, including the Indian Accounting Standards (Ind AS) specified under section 133 of the Act read with the Companies (Indian Accounting Standards) Rules, 2015, as amended. This responsibility also includes maintenance of adequate accounting
INTEGRATED REPORT MANAGEMENT REVIEW STATUTORY REPORTS FINANCIAL STATEMENTS
06-115 116-167 168-270 271-502

276 VEDANTA LIMITED INTEGRATED REPORT AND ANNUAL ACCOUNTS 2019-20 VEDANTA LIMITED INTEGRATED REPORT AND ANNUAL ACCOUNTS 2019-20 277
of the said unincorporated joint venture not operated by the Company have not been audited and such unaudited financial statements and other unaudited financial information have been furnished to us by the management and our report on the Ind AS financial statements of the Company, in so far as it relates to the amounts and disclosures included in respect of the said unincorporated joint venture, is based solely on such unaudited information furnished to us by the management. Our opinion is not modified in respect of this matter.
REPORT ON OTHER LEGAL AND REGULATORY REQUIREMENTS1. As required by the Companies (Auditor’s Report) Order, 2016 (“the Order”), issued by the Central Government of India in terms of sub-section (11) of section 143 of the Act, we give in the “Annexure 1” a statement on the matters specified in paragraphs 3 and 4 of the Order.
2. As required by Section 143(3) of the Act, we report that:
(a) We have sought and obtained all the information and explanations which to the best of our knowledge and belief were necessary for the purposes of our audit;
(b) In our opinion, proper books of accounts as required by law have been kept by the Company so far as it appears from our examination of those books
(c) The Balance Sheet, the Statement of Profit and Loss including the Statement of Other Comprehensive Income, the Cash Flow Statement and Statement of Changes in Equity dealt with by this Report are in agreement with the books of account
(d) In our opinion, the aforesaid standalone Ind AS financial statements comply with the Accounting Standards specified under Section 133 of the Act, read with Companies (Indian Accounting Standards) Rules, 2015, as amended;
(e) On the basis of the written representations received from the directors as on March 31, 2020 taken on record by the Board of Directors, none of the directors is
records in accordance with the provisions of the Act for safeguarding of the assets of the Company and for preventing and detecting frauds and other irregularities; selection and application of appropriate accounting policies; making judgments and estimates that are reasonable and prudent; and the design, implementation and maintenance of adequate internal financial controls, that were operating effectively for ensuring the accuracy and completeness of the accounting records, relevant to the preparation and presentation of the standalone Ind AS financial statements that give a true and fair view and are free from material misstatement, whether due to fraud or error.
In preparing the standalone Ind AS financial statements, management is responsible for assessing the Company’s ability to continue as a going concern, disclosing, as applicable, matters related to going concern and using the going concern basis of accounting unless management either intends to liquidate the Company or to cease operations, or has no realistic alternative but to do so.
Those charged with governance are also responsible for overseeing the Company’s financial reporting process.
AUDITOR’S RESPONSIBILITIES FOR THE AUDIT OF THE STANDALONE IND AS FINANCIAL STATEMENTSOur objectives are to obtain reasonable assurance about whether the standalone Ind AS financial statements as a whole are free from material misstatement, whether due to fraud or error, and to issue an auditor’s report that includes our opinion. Reasonable assurance is a high level of assurance, but is not a guarantee that an audit conducted in accordance with SAs will always detect a material misstatement when it exists. Misstatements can arise from fraud or error and are considered material if, individually or in the aggregate, they could reasonably be expected to influence the economic decisions of users taken on the basis of these standalone Ind AS financial statements.
As part of an audit in accordance with SAs, we exercise professional judgment and maintain professional skepticism throughout the audit. We also:
� Identify and assess the risks of material misstatement of the standalone Ind AS financial statements, whether due to fraud or error, design and perform audit procedures responsive to those risks, and obtain audit evidence that is sufficient and appropriate to provide a basis for our opinion. The risk of not detecting a material misstatement resulting from fraud is higher than for one resulting from error, as fraud may involve collusion, forgery, intentional omissions, misrepresentations, or the override of internal control.
� Obtain an understanding of internal control relevant to the audit in order to design audit procedures that are appropriate in the circumstances. Under section 143(3)(i) of the Act, we are also responsible for expressing our opinion on whether the Company has
disqualified as on March 31, 2020 from being appointed as a director in terms of Section 164 (2) of the Act;
(f) With respect to the adequacy of the internal financial controls over financial reporting of the Company with reference to these standalone Ind AS financial statements and the operating effectiveness of such controls, refer to our separate Report in “Annexure 2” to this report;
(g) In our opinion, the managerial remuneration for the year ended March 31, 2020 has been paid/ provided by the Company to its directors in accordance with the provisions of section 197 read with Schedule V to the Act. As indicated in note 36 of the accompanying standalone Ind AS financial statements, the Company proposes to seek the approval of its shareholders at the ensuing annual general meeting for remuneration paid to one of its whole-time directors;
(h) With respect to the other matters to be included in the Auditor’s Report in accordance with Rule 11 of the Companies (Audit and Auditors) Rules, 2014, as amended in our opinion and to the best of our information and according to the explanations given to us:
i. The Company has disclosed the impact of pending litigations on its financial position in its standalone Ind AS financial statements – Refer Note 35 and 3c(A)(viii) to the standalone Ind AS financial statements;
ii. The Company did not have any material foreseeable losses in long-term contracts including derivative contracts during the year ended March 31, 2020;
iii. There has been no delay in transferring amounts, required to be transferred, to the Investor Education and Protection Fund by the Company.
For S.R. Batliboi & Co. LLPChartered Accountants
ICAI Firm Registration Number: 301003E/E300005
per Sudhir SoniPartner
Place: Mumbai Membership Number: 41870Date: June 06, 2020 UDIN: 20041870AAAAAP3193
adequate internal financial controls with reference to financial statements in place and the operating effectiveness of such controls.
� Evaluate the appropriateness of accounting policies used and the reasonableness of accounting estimates and related disclosures made by management.
� Conclude on the appropriateness of management’s use of the going concern basis of accounting and, based on the audit evidence obtained, whether a material uncertainty exists related to events or conditions that may cast significant doubt on the Company’s ability to continue as a going concern. If we conclude that a material uncertainty exists, we are required to draw attention in our auditor’s report to the related disclosures in the financial statements or, if such disclosures are inadequate, to modify our opinion. Our conclusions are based on the audit evidence obtained up to the date of our auditor’s report. However, future events or conditions may cause the Company to cease to continue as a going concern.
� Evaluate the overall presentation, structure and content of the standalone Ind AS financial statements, including the disclosures, and whether the standalone Ind AS financial statements represent the underlying transactions and events in a manner that achieves fair presentation.
We communicate with those charged with governance regarding, among other matters, the planned scope and timing of the audit and significant audit findings, including any significant deficiencies in internal control that we identify during our audit.
We also provide those charged with governance with a statement that we have complied with relevant ethical requirements regarding independence, and to communicate with them all relationships and other matters that may reasonably be thought to bear on our independence, and where applicable, related safeguards.
From the matters communicated with those charged with governance, we determine those matters that were of most significance in the audit of the standalone Ind AS financial statements for the financial year ended March 31, 2020 and are therefore the key audit matters. We describe these matters in our auditor’s report unless law or regulation precludes public disclosure about the matter or when, in extremely rare circumstances, we determine that a matter should not be communicated in our report because the adverse consequences of doing so would reasonably be expected to outweigh the public interest benefits of such communication.
OTHER MATTERWe did not audit the financial statements and other financial information, in respect of an unincorporated joint venture not operated by the Company, whose Ind AS financial statements include total assets of ` 154 Crore as at March 31, 2020. The Ind AS financial statements and other financial information
INTEGRATED REPORT MANAGEMENT REVIEW STATUTORY REPORTS FINANCIAL STATEMENTS
06-115 116-167 168-270 271-502
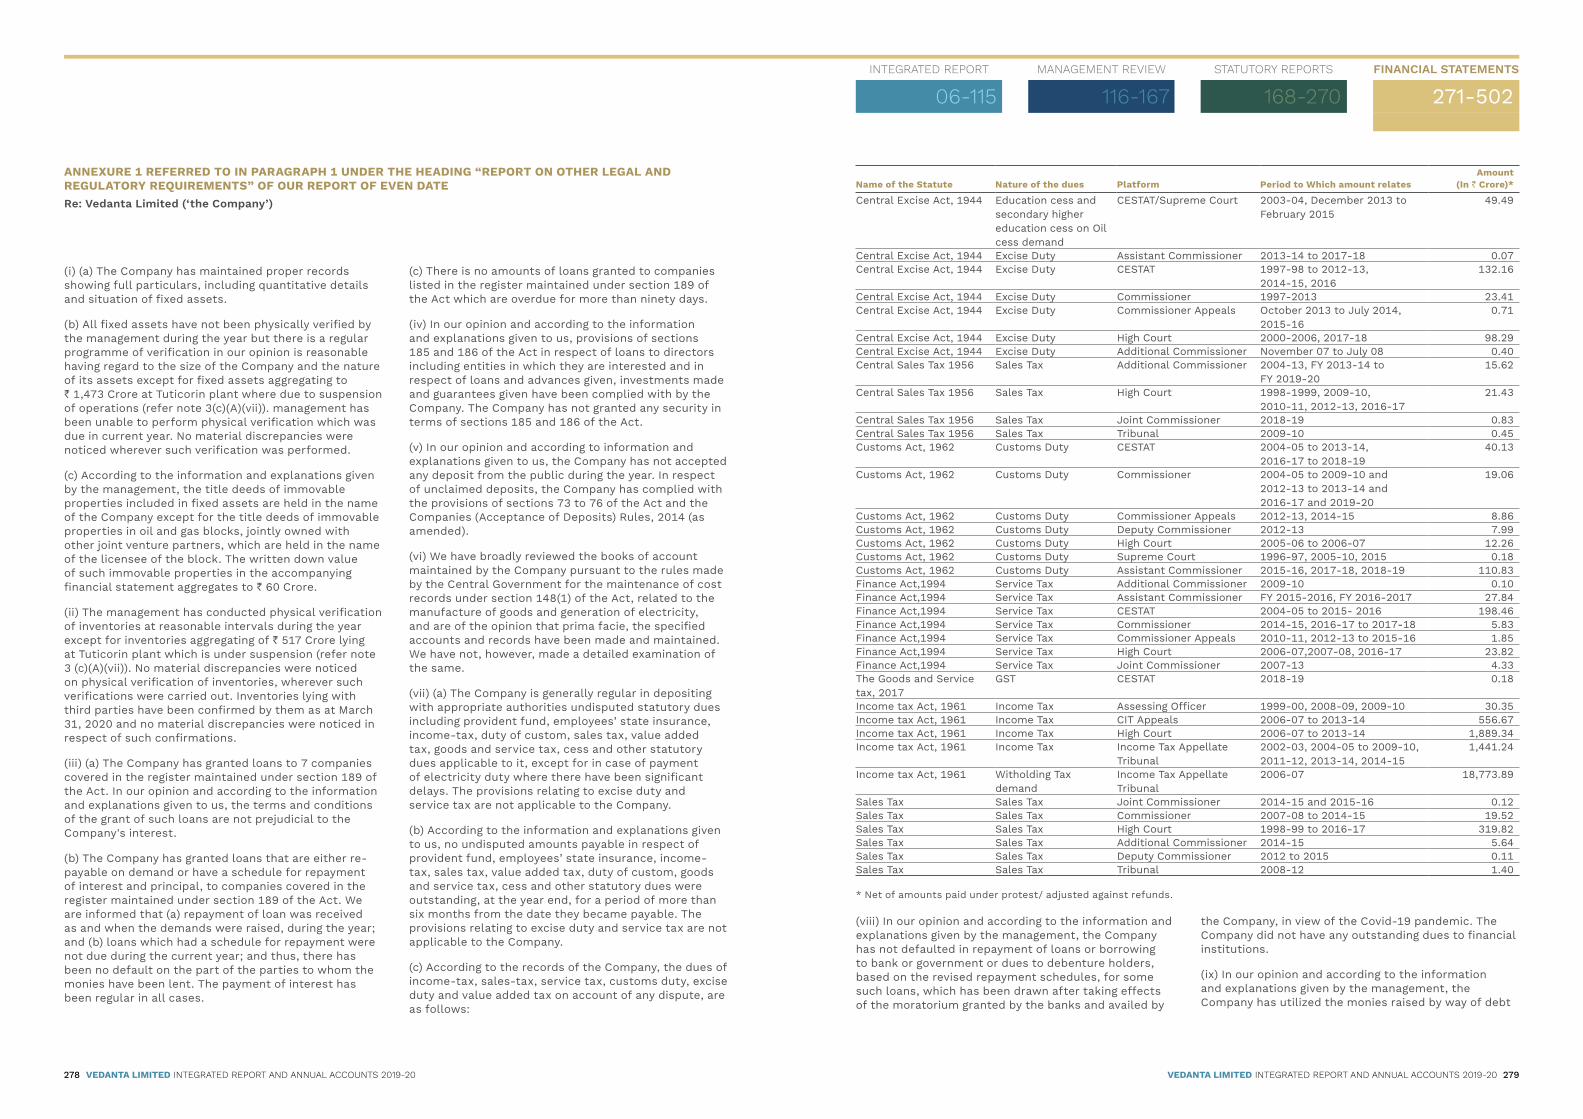
278 VEDANTA LIMITED INTEGRATED REPORT AND ANNUAL ACCOUNTS 2019-20 VEDANTA LIMITED INTEGRATED REPORT AND ANNUAL ACCOUNTS 2019-20 279
ANNEXURE 1 REFERRED TO IN PARAGRAPH 1 UNDER THE HEADING REPORT ON OTHER LEGAL AND REGULATORY REQUIREMENTS OF OUR REPORT OF EVEN DATERe: edanta imited the Company
(i) (a) The Company has maintained proper records showing full particulars, including quantitative details and situation of fixed assets.
(b) All fixed assets have not been physically verified by the management during the year but there is a regular programme of verification in our opinion is reasonable having regard to the size of the Company and the nature of its assets except for fixed assets aggregating to ` 1,473 Crore at Tuticorin plant where due to suspension of operations (refer note 3(c)(A)(vii)). management has been unable to perform physical verification which was due in current year. No material discrepancies were noticed wherever such verification was performed.
(c) According to the information and explanations given by the management, the title deeds of immovable properties included in fixed assets are held in the name of the Company except for the title deeds of immovable properties in oil and gas blocks, jointly owned with other joint venture partners, which are held in the name of the licensee of the block. The written down value of such immovable properties in the accompanying financial statement aggregates to ` 60 Crore.
(ii) The management has conducted physical verification of inventories at reasonable intervals during the year except for inventories aggregating of ` 517 Crore lying at Tuticorin plant which is under suspension (refer note 3 (c)(A)(vii)). No material discrepancies were noticed on physical verification of inventories, wherever such verifications were carried out. Inventories lying with third parties have been confirmed by them as at March 31, 2020 and no material discrepancies were noticed in respect of such confirmations.
(iii) (a) The Company has granted loans to 7 companies covered in the register maintained under section 189 of the Act. In our opinion and according to the information and explanations given to us, the terms and conditions of the grant of such loans are not prejudicial to the Company's interest.
(b) The Company has granted loans that are either re-payable on demand or have a schedule for repayment of interest and principal, to companies covered in the register maintained under section 189 of the Act. We are informed that (a) repayment of loan was received as and when the demands were raised, during the year; and (b) loans which had a schedule for repayment were not due during the current year; and thus, there has been no default on the part of the parties to whom the monies have been lent. The payment of interest has been regular in all cases.
(c) There is no amounts of loans granted to companies listed in the register maintained under section 189 of the Act which are overdue for more than ninety days.
(iv) In our opinion and according to the information and explanations given to us, provisions of sections 185 and 186 of the Act in respect of loans to directors including entities in which they are interested and in respect of loans and advances given, investments made and guarantees given have been complied with by the Company. The Company has not granted any security in terms of sections 185 and 186 of the Act.
(v) In our opinion and according to information and explanations given to us, the Company has not accepted any deposit from the public during the year. In respect of unclaimed deposits, the Company has complied with the provisions of sections 73 to 76 of the Act and the Companies (Acceptance of Deposits) Rules, 2014 (as amended).
(vi) We have broadly reviewed the books of account maintained by the Company pursuant to the rules made by the Central Government for the maintenance of cost records under section 148(1) of the Act, related to the manufacture of goods and generation of electricity, and are of the opinion that prima facie, the specified accounts and records have been made and maintained. We have not, however, made a detailed examination of the same.
(vii) (a) The Company is generally regular in depositing with appropriate authorities undisputed statutory dues including provident fund, employees’ state insurance, income-tax, duty of custom, sales tax, value added tax, goods and service tax, cess and other statutory dues applicable to it, except for in case of payment of electricity duty where there have been significant delays. The provisions relating to excise duty and service tax are not applicable to the Company.
(b) According to the information and explanations given to us, no undisputed amounts payable in respect of provident fund, employees’ state insurance, income-tax, sales tax, value added tax, duty of custom, goods and service tax, cess and other statutory dues were outstanding, at the year end, for a period of more than six months from the date they became payable. The provisions relating to excise duty and service tax are not applicable to the Company.
(c) According to the records of the Company, the dues of income-tax, sales-tax, service tax, customs duty, excise duty and value added tax on account of any dispute, are as follows:
Name of the Statute Nature of the dues Platform Period to Which amount relatesAmount
(In ` Crore)*
Central Excise Act, 1944 Education cess and secondary higher education cess on Oil cess demand
CESTAT/Supreme Court 2003-04, December 2013 to February 2015
49.49
Central Excise Act, 1944 Excise Duty Assistant Commissioner 2013-14 to 2017-18 0.07Central Excise Act, 1944 Excise Duty CESTAT 1997-98 to 2012-13,
2014-15, 2016132.16
Central Excise Act, 1944 Excise Duty Commissioner 1997-2013 23.41Central Excise Act, 1944 Excise Duty Commissioner Appeals October 2013 to July 2014,
2015-160.71
Central Excise Act, 1944 Excise Duty High Court 2000-2006, 2017-18 98.29Central Excise Act, 1944 Excise Duty Additional Commissioner November 07 to July 08 0.40Central Sales Tax 1956 Sales Tax Additional Commissioner 2004-13, FY 2013-14 to
FY 2019-2015.62
Central Sales Tax 1956 Sales Tax High Court 1998-1999, 2009-10, 2010-11, 2012-13, 2016-17
21.43
Central Sales Tax 1956 Sales Tax Joint Commissioner 2018-19 0.83Central Sales Tax 1956 Sales Tax Tribunal 2009-10 0.45Customs Act, 1962 Customs Duty CESTAT 2004-05 to 2013-14,
2016-17 to 2018-1940.13
Customs Act, 1962 Customs Duty Commissioner 2004-05 to 2009-10 and 2012-13 to 2013-14 and 2016-17 and 2019-20
19.06
Customs Act, 1962 Customs Duty Commissioner Appeals 2012-13, 2014-15 8.86Customs Act, 1962 Customs Duty Deputy Commissioner 2012-13 7.99Customs Act, 1962 Customs Duty High Court 2005-06 to 2006-07 12.26Customs Act, 1962 Customs Duty Supreme Court 1996-97, 2005-10, 2015 0.18Customs Act, 1962 Customs Duty Assistant Commissioner 2015-16, 2017-18, 2018-19 110.83Finance Act,1994 Service Tax Additional Commissioner 2009-10 0.10Finance Act,1994 Service Tax Assistant Commissioner FY 2015-2016, FY 2016-2017 27.84Finance Act,1994 Service Tax CESTAT 2004-05 to 2015- 2016 198.46Finance Act,1994 Service Tax Commissioner 2014-15, 2016-17 to 2017-18 5.83Finance Act,1994 Service Tax Commissioner Appeals 2010-11, 2012-13 to 2015-16 1.85Finance Act,1994 Service Tax High Court 2006-07,2007-08, 2016-17 23.82Finance Act,1994 Service Tax Joint Commissioner 2007-13 4.33The Goods and Service tax, 2017
GST CESTAT 2018-19 0.18
Income tax Act, 1961 Income Tax Assessing Officer 1999-00, 2008-09, 2009-10 30.35Income tax Act, 1961 Income Tax CIT Appeals 2006-07 to 2013-14 556.67Income tax Act, 1961 Income Tax High Court 2006-07 to 2013-14 1,889.34Income tax Act, 1961 Income Tax Income Tax Appellate
Tribunal2002-03, 2004-05 to 2009-10, 2011-12, 2013-14, 2014-15
1,441.24
Income tax Act, 1961 Witholding Tax demand
Income Tax Appellate Tribunal
2006-07 18,773.89
Sales Tax Sales Tax Joint Commissioner 2014-15 and 2015-16 0.12Sales Tax Sales Tax Commissioner 2007-08 to 2014-15 19.52Sales Tax Sales Tax High Court 1998-99 to 2016-17 319.82Sales Tax Sales Tax Additional Commissioner 2014-15 5.64Sales Tax Sales Tax Deputy Commissioner 2012 to 2015 0.11Sales Tax Sales Tax Tribunal 2008-12 1.40
* Net of amounts paid under protest/ adjusted against refunds.
(viii) In our opinion and according to the information and explanations given by the management, the Company has not defaulted in repayment of loans or borrowing to bank or government or dues to debenture holders, based on the revised repayment schedules, for some such loans, which has been drawn after taking effects of the moratorium granted by the banks and availed by
the Company, in view of the Covid-19 pandemic. The Company did not have any outstanding dues to financial institutions.
(ix) In our opinion and according to the information and explanations given by the management, the Company has utilized the monies raised by way of debt
INTEGRATED REPORT MANAGEMENT REVIEW STATUTORY REPORTS FINANCIAL STATEMENTS
06-115 116-167 168-270 271-502

280 VEDANTA LIMITED INTEGRATED REPORT AND ANNUAL ACCOUNTS 2019-20 VEDANTA LIMITED INTEGRATED REPORT AND ANNUAL ACCOUNTS 2019-20 281
instruments in the nature of debentures and term loans for the purposes for which they were raised. According to the information and explanations given to us, the Company has not raised monies by way of initial public offer or further public offer.
(x) Based upon the audit procedures performed for the purpose of reporting the true and fair view of the financial statements and according to the information and explanations given by the management, we report that no fraud by the Company or no material fraud on the Company by the officers and employees of the Company has been noticed or reported during the year.
(xi) According to the information and explanations given by the management, the managerial remuneration has been paid / provided in accordance with the requisite approvals mandated by the provisions of section 197 read with Schedule V to the Act. As indicated in note 36 of the accompanying standalone Ind AS financial statements, the Company proposes to seek the approval of its shareholders at the ensuing annual general meeting for remuneration paid to one of its whole-time directors.
(xii) In our opinion, the Company is not a Nidhi Company. Therefore, the provisions of clause 3(xii) of the Order are not applicable to the Company and hence not commented upon.
(xiii) According to the information and explanations given by the management, transactions with the related
parties are in compliance with sections 177 and 188 of the Act where applicable and the details have been disclosed in the notes to the financial statements, as required by the applicable accounting standards.
(xiv) According to the information and explanations given to us and on an overall examination of the balance sheet, the Company has not made any preferential allotment or private placement of shares or fully or partly convertible debentures during the year under review and hence, reporting requirements under clause 3(xiv) of the Order are not applicable to the Company and hence not commented upon.
(xv) According to the information and explanations given by the management, the Company has not entered into any non-cash transactions with directors or persons connected with them as referred to in section 192 of the Act.
(xvi) According to the information and explanations given to us, the provisions of section 45-IA of the Reserve Bank of India Act, 1934 are not applicable to the Company.
For S.R. Batliboi & Co. LLPChartered Accountants
ICAI Firm Registration Number: 301003E/E300005
per Sudhir SoniPartner
Place: Mumbai Membership Number: 41870Date: June 06, 2020 UDIN: 20041870AAAAAP3193
ANNEXURE 2 TO THE INDEPENDENT AUDITOR’S REPORT OF EVEN DATE ON THE IND AS STANDALONE FINANCIAL STATEMENTS OF VEDANTA LIMTED Report on the nternal Financial Controls under Clause i o ub section o ection o the Companies Act 20 the Act
We have audited the internal financial controls over financial reporting of Vedanta Limited (“the Company”) as of March 31, 2020 in conjunction with our audit of the standalone Ind AS financial statements of the Company for the year ended on that date.
MANAGEMENT’S RESPONSIBILITY FOR INTERNAL FINANCIAL CONTROLSThe Company’s Management is responsible for establishing and maintaining internal financial controls based on the internal control over financial reporting criteria established by the Company considering the essential components of internal control stated in the Committee of Sponsoring Organisations of the Treadway Commission (2013 Framework) (“COSO 2013 Criteria”). These responsibilities include the design, implementation and maintenance of adequate internal financial controls that were operating effectively for ensuring the orderly and efficient conduct of its business, including adherence to the Company’s policies, the safeguarding of its assets, the prevention
reference to these standalone financial statements was established and maintained and if such controls operated effectively in all material respects.
Our audit involves performing procedures to obtain audit evidence about the adequacy of the internal financial controls over financial reporting with reference to these standalone financial statements and their operating effectiveness. Our audit of internal financial controls over financial reporting included obtaining an understanding of internal financial controls over financial reporting with reference to these standalone financial statements, assessing the risk that a material weakness exists, and testing and evaluating the design and operating effectiveness of internal control based on the assessed risk. The procedures selected depend on the auditor’s judgement, including the assessment of the risks of material misstatement of the financial statements, whether due to fraud or error.
We believe that the audit evidence we have obtained is sufficient and appropriate to provide a basis for our audit opinion on the internal financial controls over financial reporting with reference to these standalone financial statements.
MEANING OF INTERNAL FINANCIAL CONTROLS OVER FINANCIAL REPORTING WITH REFERENCE TO THESE FINANCIAL STATEMENTSA company's internal financial control over financial reporting with reference to these standalone financial statements is a process designed to provide reasonable assurance regarding the reliability of financial reporting and the preparation of financial statements for external purposes in accordance with generally accepted accounting principles. A company's internal financial control over financial reporting with reference to these standalone financial statements includes those policies and procedures that (1) pertain to the maintenance of records that, in reasonable detail, accurately and fairly reflect the transactions and dispositions of the assets of the company; (2) provide reasonable assurance that transactions are recorded as necessary to permit preparation of financial statements in accordance with generally accepted accounting principles, and that receipts and expenditures of the company are
and detection of frauds and errors, the accuracy and completeness of the accounting records, and the timely preparation of reliable financial information, as required under the Companies Act, 2013.
AUDITOR’S RESPONSIBILITYOur responsibility is to express an opinion on the Company's internal financial controls over financial reporting with reference to these standalone financial statements based on our audit. We conducted our audit in accordance with the Guidance Note on Audit of Internal Financial Controls Over Financial Reporting (the “Guidance Note”) and the Standards on Auditing as specified under section 143(10) of the Companies Act, 2013, to the extent applicable to an audit of internal financial controls and, both issued by the Institute of Chartered Accountants of India. Those Standards and the Guidance Note require that we comply with ethical requirements and plan and perform the audit to obtain reasonable assurance about whether adequate internal financial controls over financial reporting with
being made only in accordance with authorisations of management and directors of the company; and (3) provide reasonable assurance regarding prevention or timely detection of unauthorised acquisition, use, or disposition of the company's assets that could have a material effect on the financial statements.
INHERENT LIMITATIONS OF INTERNAL FINANCIAL CONTROLS OVER FINANCIAL REPORTING WITH REFERENCE TO THESE STANDALONE FINANCIAL STATEMENTSBecause of the inherent limitations of internal financial controls over financial reporting with reference to these standalone financial statements, including the possibility of collusion or improper management override of controls, material misstatements due to error or fraud may occur and not be detected. Also, projections of any evaluation of the internal financial controls over financial reporting with reference to these standalone financial statements to future periods are subject to the risk that the internal financial control over financial reporting with reference to these standalone financial statements may become inadequate because of changes in conditions, or that the degree of compliance with the policies or procedures may deteriorate.
OPINIONIn our opinion, the Company has, in all material respects, adequate internal financial controls over financial reporting with reference to these standalone financial statements and such internal financial controls over financial reporting with reference to these standalone financial statements were operating effectively as at March 31, 2020 based on the internal control over financial reporting criteria established by the Company considering the essential components of internal control stated in COSO 2013 criteria.
For S.R. Batliboi & Co. LLPChartered Accountants
ICAI Firm Registration Number: 301003E/E300005
per Sudhir SoniPartner
Place: Mumbai Membership Number: 41870Date: June 06, 2020 UDIN: 20041870AAAAAP3193
INTEGRATED REPORT MANAGEMENT REVIEW STATUTORY REPORTS FINANCIAL STATEMENTS
06-115 116-167 168-270 271-502

282 VEDANTA LIMITED INTEGRATED REPORT AND ANNUAL ACCOUNTS 2019-20 VEDANTA LIMITED INTEGRATED REPORT AND ANNUAL ACCOUNTS 2019-20 283
STANDALONE STATEMENT OF PROFIT AND LOSSfor the year ended March 1 2020
(` in Crore except otherwise stated)
Particulars NoteYear ended
March 31, 2020Year ended
March 31, 2019
Revenue from operations 26A 35,417 38,098Other operating income 26B 441 546Other income 27 2,870 6,152Total Income 38,728 44,796Expenses:Cost of materials consumed 12,493 15,508Purchases of stock-in-trade 227 505Changes in inventories of finished goods, work-in-progress and stock-in-trade 28 1,430 307Power and fuel charges 7,728 9,179Employee benefits expense 24 765 862Finance costs 29 3,328 3,757Depreciation, depletion and amortisation expense 5 3,264 3,243Other expenses 30 7,388 6,812Total expenses 36,623 40,173Profit before exceptional items and tax 2,105 4,623Net exceptional (loss)/ gain 31 (12,568) 324(Loss)/Profit before tax (10,463) 4,947Tax (benefit)/expense: 32On other than exceptional itemsNet current tax expense 4 5Net deferred tax benefit (592) (245)On exceptional itemsNet deferred tax (benefit)/expense (3,143) 112Net tax benefit (3,731) (128)Net (Loss)/Profit for the year (A) (6,732) 5,075Other Comprehensive IncomeItems that will not be reclassified to profit or lossRe-measurements loss of defined benefit plans (11) (4)Tax credit 4 1Loss on FVOCI equity investment (74) (45)
(81) (48)Items that will be reclassified to profit or lossNet gain on cash flow hedges recognised during the year 82 78Tax expense (28) (27)Net gain on cash flow hedges recycled to statement of profit and loss (33) (183)Tax credit 11 64Exchange differences on translation 374 520Tax credit 59 13
465 465Total Other Comprehensive Income for the year (B) 384 417Total Comprehensive (Loss)/ Income for the year (A+B) (6,348) 5,492(Loss)/ Earnings per share (in `)- Basic & Diluted 33 (18.10) 13.65
See accompanying notes to the financial statementsAs per our report of even date For and on behalf of the Board of Directors
For S.R. Batliboi & Co. LLP Anil Agarwal Sunil DuggalChartered AccountantsICAI Firm Registration No. 301003E/E300005
Non-Executive Chairman DIN 00010883
Interim Chief Executive Officer PAN AAMPD1109M
per Sudhir Soni GR Arun Kumar Prerna HalwasiyaPartner Membership No: 41870
Whole-Time Director and Chief Financial Officer DIN 01874769
Company Secretary ICSI Membership No. A20856
Place: MumbaiDate: June 06, 2020
STANDALONE BALANCE SHEETas at March 1 2020
(` in Crore)
Particulars NoteAs at
March 31, 2020As at
March 31, 2019ASSETSNon-current assetsProperty, Plant and Equipment 5 37,087 40,972Capital work-in-progress 5 11,027 14,148Intangible assets 5 31 34Exploration intangible assets under development 5 1,059 1,583Financial assets� Investments 6A 60,787 64,204� Trade receivables 7 1,346 1,248� Loans 8 183 197� Derivatives 20 3 -� Others 9 1,673 619Deferred tax assets (net) 32 3,464 3Income tax assets (net) 32 1,682 2,175Other non-current assets 10 2,272 3,027Total non-current assets 120,614 128,210Current assetsInventories 11 5,689 7,657Financial assets� Investments 6B 2,118 4,378� Trade receivables 7 832 1,966� Cash and cash equivalents 12 1,846 3,209� Other bank balances 13 347 682� Loans 8 1,596 118� Derivatives 20 548 46� Others 9 3,826 2,630Other current assets 10 2,034 1,971Total current assets 18,836 22,657Total Assets 139,450 150,867EQUITY AND LIABILITIESEquityEquity Share Capital 14 372 372Other Equity 15 69,523 77,508Total Equity 69,895 77,880LiabilitiesNon-current liabilitiesFinancial liabilities� Borrowings 17A 21,629 20,521� Derivatives 20 9 -� Other financial liabilities 19 288 281Provisions 22 1,185 988Other non-current liabilities 21 2,539 2,468Total non-current liabilities 25,650 24,258Current LiabilitiesFinancial liabilities� Borrowings 17B 10,819 17,180� Trade payables 18� (a)� Total outstanding dues of micro, small and medium enterprises 182 59� (b)� �Total outstanding dues of creditors other than micro, small and medium enterprises 10,457 11,203� Derivatives 20 38 343� Other financial liabilities 19 14,861 11,483Provisions 22 95 140Income tax liabilities (net) 46 46Other current liabilities 21 7,407 8,275Total current liabilities 43,905 48,729Total Equity and Liabilities 139,450 150,867
See accompanying notes to the financial statementsAs per our report of even date For and on behalf of the Board of Directors
For S.R. Batliboi & Co. LLP Anil Agarwal Sunil DuggalChartered AccountantsICAI Firm Registration No. 301003E/E300005
Non-Executive Chairman DIN 00010883
Interim Chief Executive Officer PAN AAMPD1109M
per Sudhir Soni GR Arun Kumar Prerna HalwasiyaPartner Membership No: 41870
Whole-Time Director and Chief Financial Officer DIN 01874769
Company Secretary ICSI Membership No. A20856
Place: MumbaiDate: June 06, 2020
INTEGRATED REPORT MANAGEMENT REVIEW STATUTORY REPORTS FINANCIAL STATEMENTS
06-115 116-167 168-270 271-502

284 VEDANTA LIMITED INTEGRATED REPORT AND ANNUAL ACCOUNTS 2019-20 VEDANTA LIMITED INTEGRATED REPORT AND ANNUAL ACCOUNTS 2019-20 285
A. EQUITY SHARE CAPITAL
Equity shares of ` 1/- each issued, subscribed and fully paid upNumber of shares
(in Crore)Amount
(` in Crore)
As at March 31, 2020 and March 31, 2019 372 372
B. OTHER EQUITY(` in Crore)
Particulars
Reserves and Surplus Items of Other comprehensive income
Total other
equityCapital reserve
Securities premium
reserveRetained earnings
Other reserves
(Refer below)
Equity instruments through OCI
Hedging reserve
Foreign currency
translation reserve
Balance as at April 01, 2018 26,027 19,009 15,439 17,322 149 14 981 78,941Profit for the year - - 5,075 - - - - 5,075Other comprehensive income for the year, net of tax - - (3) - (45) (68) 533 417Total Comprehensive Income for the year - - 5,072 - (45) (68) 533 5,492Transfer from debenture redemption reserve (net) - - 190 (190) - - - -Recognition of share based payment - - - 82 - - - 82Stock options cancelled during the year - - 7 (7) - - - -Exercise of stock options - - 1 (3) - - - (2)Dividends including tax (Refer Note 34) - - (7,005) - - - - (7,005)Balance as at March 31, 2019 26,027 19,009 13,704 17,204 104 (54) 1,514 77,508Loss for the year - - (6,732) - - - - (6,732)Other comprehensive income for the year, net of tax - - (7) - (74) 32 433 384Total Comprehensive (Loss)/Income for the year - - (6,739) - (74) 32 433 (6,348)Transfer from debenture redemption reserve (net) - - 180 (180) - - - -Recognition of share based payment - - - 75 - - - 75Stock options cancelled during the year - - 52 (52) - - - -Exercise of stock options - - 7 (23) - - - (16)Dividends including tax (Refer Note 34) - - (1,696) - - - - (1,696)Balance as at March 31, 2020 26,027 19,009 5,508 17,024 30 (22) 1,947 69,523
Other reserves comprise of:(` in Crore)
Capital redemption
reserve
Debenture redemption
reserve
Preference share
redemption reserve
Amalgamation reserve
General reserve
Share based
payment reserve Total
Balance as at April 01, 2018 38 1,430 77 3 15,597 177 17,322 Transfer to retained earnings - (190) - - - - (190)Redemption of preference share (Refer Note 15(c)) - - 3,010 - (3,010) - - Recognition of share based payment - - - - - 82 82 Stock options forfeited/expired during the year - - - - - (7) (7)Exercise of stock options - - - - - (3) (3)Balance as at March 31, 2019 38 1,240 3,087 3 12,587 249 17,204 Transfer to retained earnings - (180) - - - - (180)Recognition of share based payment - - - - - 75 75 Stock options cancelled during the year - - - - - (52) (52)Exercise of stock options - - - - - (23) (23)Balance as at March 31, 2020 38 1,060 3,087 3 12,587 249 17,024
See accompanying notes to the financial statementsAs per our report of even date For and on behalf of the Board of Directors
For S.R. Batliboi & Co. LLP Anil Agarwal Sunil DuggalChartered AccountantsICAI Firm Registration No. 301003E/E300005
Non-Executive Chairman DIN 00010883
Interim Chief Executive Officer PAN AAMPD1109M
per Sudhir Soni GR Arun Kumar Prerna HalwasiyaPartner Membership No: 41870
Whole-Time Director and Chief Financial Officer DIN 01874769
Company Secretary ICSI Membership No. A20856
Place: MumbaiDate: June 06, 2020
STANDALONE STATEMENT OF CHANGES IN EQUITYfor the year ended March 1 2020
STANDALONE STATEMENT OF CASH FLOWSfor the year ended March 1 2020
(` in Crore)
ParticularsYear ended
March 31, 2020Year ended
March 31, 2019Cash ows from operating activities(Loss)/ Profit before taxation (10,463) 4,947 Adjustments for:Depreciation, depletion and amortisation 3,321 3,271 Impairment charge/(reversal) 12,335 (265)Other exceptional items 233 (59)Provision for doubtful debts/ advance/ bad debts written off 68 - Exploration costs written off 1 48 Fair Value gain on financial assets held at fair value through profit or loss (152) (96)Loss on sale of property, plant and equipment (net) 77 76 Foreign exchange loss (net) 123 71 Unwinding of discount on decommissioning liability 31 30 Share based payment expense 40 51 Interest and dividend Income (2,597) (5,947)Interest expenses 3,297 3,727 Deferred government grant (74) (72)Changes in assets and liabilitiesIncrease in trade and other receivables (857) (1,697)Decrease in inventories 2,088 490 Decrease/increase in trade and other payable (791) 2,819 Cash generated from operations 6,680 7,394 Income taxes refund (net) 518 305 Net cash generated from operating activities 7,198 7,699 Cash ows from investing activitiesConsideration paid for business acquisition (net of cash and cash equivalents acquired) (33) (1,770)Purchases of property, plant and equipment(including intangibles) (2,161) (2,498)Proceeds from sale of property, plant and equipment 35 60 Loans given to related parties (2,870) (380)Loans repaid by related parties 1,403 30 Short-term deposits made (913) (1,068)Proceeds from redemption of short-term deposits 547 840 Short-term investments made (34,231) (25,321)Proceeds from sale of short-term investments 36,580 26,571 Interest received 404 370 Dividends received 2,142 7,147 Payment made to site restoration fund (16) (27)Net cash from investing activities 887 3,954 Cash ows from financing activitiesRepayment of short-term borrowings (net) (7,663) (1,833)Proceeds from current borrowings 4,457 3,407 Repayment of current borrowings (3,805) (2,739)Proceeds from long-term borrowings 7,636 10,270 Repayment of long-term borrowings (4,681) (7,658)Interest paid (3,790) (4,042)Payment of dividends to equity holders of the parent, including dividend distribution tax (1,444) (7,005)Payment of lease liabilities (159) - Net cash (used in) financing activities (9,449) (9,600)Net (decrease)/increase in cash and cash equivalents (1,364) 2,053 Cash and cash equivalents at the beginning of the year 3,284 1,231 Cash and cash equivalents at the end of the year (Refer Note 12) 1,920 3,284
Notes:1.� The figures in bracket indicates outflow.2.� �The above cash flow has been prepared under the “Indirect Method” as set out in Indian Accounting Standard (Ind AS) 7 -
statement of cash flows
See accompanying notes to the financial statementsAs per our report of even date For and on behalf of the Board of Directors
For S.R. Batliboi & Co. LLP Anil Agarwal Sunil DuggalChartered AccountantsICAI Firm Registration No. 301003E/E300005
Non-Executive Chairman DIN 00010883
Interim Chief Executive Officer PAN AAMPD1109M
per Sudhir Soni GR Arun Kumar Prerna HalwasiyaPartner Membership No: 41870
Whole-Time Director and Chief Financial Officer DIN 01874769
Company Secretary ICSI Membership No. A20856
Place: MumbaiDate: June 06, 2020
INTEGRATED REPORT MANAGEMENT REVIEW STATUTORY REPORTS FINANCIAL STATEMENTS
06-115 116-167 168-270 271-502

286 VEDANTA LIMITED INTEGRATED REPORT AND ANNUAL ACCOUNTS 2019-20 VEDANTA LIMITED INTEGRATED REPORT AND ANNUAL ACCOUNTS 2019-20 287
STANDALONE NOTES FORMING PART OF THE FINANCIAL STATEMENTSas at and for the year ended March 1 2020
(b) Basis of measurementThe financial statements have been prepared on a going concern basis using historical cost convention and on an accrual method of accounting, except for certain financial assets and liabilities which are measured at fair value as explained in the accounting policies below.
3(a) SIGNIFICANT ACCOUNTING POLICIES(A) Revenue recognition � Sale of goods/rendering of services (including
revenue from contracts with customers)The Company’s revenue from contracts with customers is mainly from the sale of oil and gas, aluminium, copper, iron ore and power. Revenue from contracts with customers is recognised when control of the goods or services is transferred to the customer which usually is on delivery of the goods to the shipping agent at an amount that reflects the consideration to which the Company expects to be entitled in exchange for those goods or services. Revenue is recognised net of discounts, volume rebates, outgoing sales taxes/goods and service tax and other indirect taxes. Revenues from sale of by-products are included in revenue.
Certain of the Company’s sales contracts provide for provisional pricing based on the price on the London Metal Exchange (LME) and crude index, as specified in the contract. Revenue in respect of such contracts is recognised when control passes to the customer and is measured at the amount the entity expects to be entitled – being the estimate of the price expected to be received at the end of the measurement period. Post transfer of control of goods, provisional pricing features are accounted in accordance with Ind AS 109 ‘Financial Instruments’ rather than Ind AS 115 Revenue from contracts with customers and therefore the Ind AS 115 rules on variable consideration do not apply. These ‘provisional pricing’ adjustments i.e. the consideration adjusted post transfer of control are included in total revenue from operations on the face of the statement of profit and loss and disclosed by way of note to the financial statements. Final settlement of the price is based on the applicable price for a specified future period. The Company’s provisionally priced sales are marked to market using the relevant forward prices for the future period specified in the contract and is adjusted in revenue.
Revenue from oil, gas and condensate sales represent the Company’s share in the revenue from sale of such products, by the joint operations, and is recognised as and when control in these products gets transferred to the customers. In computing its share of revenue, the Company excludes government’s
share of profit oil which gets accounted for when the obligation in respect of the same arises.
Revenue from sale of power is recognised when delivered and measured based on rates as per bilateral contractual agreements with buyers and at a rate arrived at based on the principles laid down under the relevant Tariff Regulations as notified by the regulatory bodies, as applicable.
A contract asset is the right to consideration in exchange for goods or services transferred to the customer. If the Company performs part of its obligation by transferring goods or services to a customer before the customer pays consideration or before payment is due, a contract asset is recognised for the earned consideration when that right is conditional on the Company’s future performance.
A contract liability is the obligation to transfer goods or services to a customer for which the Company has received consideration from the customer. If a customer pays consideration before the Company transfers goods or services to the customer, a contract liability is recognised when the payment is received. The advance payments received plus a specified rate of return/discount, at the prevailing market rates, is settled by supplying respective goods over a period of up to twenty four months under an agreed delivery schedule as per the terms of the respective agreements. As these are contracts that the Company expects, and has the ability, to fulfil through delivery of a non-financial item, these are presented as advance from customers and are recognised as revenue as and when control of respective commodities is transferred to customers under the agreements. The fixed rate of return/discount is treated as finance cost. The portion of the advance where either the Company does not have a unilateral right to defer settlement beyond 12 months or expects settlement within 12 months from the balance sheet date is classified as a current liability.
� Interest incomeInterest income from debt instruments is recognised using the effective interest rate method. The effective interest rate is the rate that exactly discounts estimated future cash receipts through the expected life of the financial asset to the gross carrying amount of a financial asset. When calculating the effective interest rate, the Company estimates the expected cash flows by considering all the contractual terms of the financial instrument (for example, prepayment, extension, call and similar options) but does not consider the expected credit losses.
STANDALONE NOTES FORMING PART OF THE FINANCIAL STATEMENTSas at and for the year ended March 1 2020
1. COMPANY OVERVIEW:Vedanta Limited (“the Company”) is a diversified natural resource company engaged in exploring, extracting and processing minerals and oil and gas. The Company engages in the exploration, production and sale of oil and gas, aluminium, copper, iron ore and power.
The Company was incorporated on September 8, 1975 under the laws of the Republic of India. The registered office of the Company is situated at 1st Floor, ‘C’ wing, Unit 103, Corporate Avenue, Atul Projects, Chakala, Andheri (East), Mumbai – 400 092, Maharashtra. The Company’s shares are listed on National Stock Exchange and Bombay Stock Exchange in India. In June 2007, the Company completed its initial public offering of American Depositary Shares, or ADS, each representing four equity shares, and listed its ADSs on the New York Stock Exchange. In July 2009, the Company completed its follow-on offering of an additional 131,906,011 ADSs, each representing four equity shares, which are listed on the New York Stock Exchange.
The Company is majority owned by Twin Star Holdings Limited (“Twin Star”), Finsider International Company Limited (“Finsider”), West Globe Limited (“West Globe”) and Welter Trading Limited (“Welter”) which are in turn wholly-owned subsidiaries of Vedanta Resources PLC (“VRPLC”), which was a public limited company incorporated in the United Kingdom and listed on the London Stock Exchange (VRPLC has been delisted from London Stock Exchange on October 1, 2018 and is renamed as “Vedanta Resources Limited” (“VRL”) with effect from October 29, 2018). Twin Star, Finsider, West Globe and Welter held 37.1%, 10.8%, 1.2% and 1.0% respectively of the Company’s equity as at March 31, 2020.
Details of Company’s various businesses are as follows:
� The Company’s oil and gas business consists of business of exploration and development and production of oil and gas.
� The Company’s iron ore business consists of iron ore exploration, mining and processing of iron ore, pig iron and metallurgical coke. The Company has iron ore mining operations in the States of Goa and Karnataka. Pursuant to Honourable Supreme Court of India order, mining operations in the state of Goa are currently suspended.
� The Company’s copper business is principally one of custom smelting and includes captive power plants at Tuticorin in Southern India. The Company’s copper business in Tamil Nadu, India has received an order from the Tamil Nadu Pollution Control Board (“TNPCB”) on April 09, 2018, rejecting the Company’s
application for renewal of consent to operate under the Air and Water Acts for the 400,000 tpa copper smelter plant in Tuticorin for want of further clarification and consequently the operations were suspended. The Company has filed an appeal with TNPCB Appellate authority against the said order. During the pendency of the appeal, TNPCB through its order dated May 23, 2018 ordered for disconnection of electricity supply and closure of copper smelter plant. Post such order, the state government on May 28, 2018 ordered the permanent closure of the plant. (Refer Note 3(c)(A)(vii)).
� The Company’s aluminium business include a refinery and captive power plant at Lanjigarh and a smelter and captive power plants at Jharsuguda both situated in the State of Odisha in India.
� The Company’s power operations include a thermal coal-based commercial power facility of 600 MW at Jharsuguda in the State of Odisha in Eastern India.
Besides the above the Company has business interest in zinc, lead, silver, iron ore, steel and other products and services through its subsidiaries in India and overseas.
These are the Company’s separate financial statements. The details of Company’s material subsidiaries, associates and joint ventures is given in note 38.
2. BASIS OF PREPARATION AND BASIS OF MEASUREMENT OF FINANCIAL STATEMENTS(a) Basis of preparationThese financial statements have been prepared in accordance with Indian Accounting Standards (Ind AS) notified under the Companies (Indian Accounting Standards) Rules, 2015 and other relevant provisions of the Companies Act, 2013 (the Act) (as amended from time to time) and Guidance Note on Accounting for Oil and Gas Producing Activities issued by the Institute of Chartered Accountants of India.
These financial statements have been prepared in accordance with the accounting policies, set out below and were consistently applied to all periods presented unless otherwise stated.
These financial statements are approved for issue by the Board of Directors on June 06, 2020.
Certain comparative figures appearing in these financial statements have been regrouped and/or reclassified to better reflect the nature of those items.
All financial information presented in Indian Rupee has been rounded off to the nearest Crore except when indicated otherwise. Amounts less than ` 0.50 Crore have been presented as “0”.
INTEGRATED REPORT MANAGEMENT REVIEW STATUTORY REPORTS FINANCIAL STATEMENTS
06-115 116-167 168-270 271-502

288 VEDANTA LIMITED INTEGRATED REPORT AND ANNUAL ACCOUNTS 2019-20 VEDANTA LIMITED INTEGRATED REPORT AND ANNUAL ACCOUNTS 2019-20 289
and loss for the period during which such expenses are incurred.
Gains and losses on disposal of an item of property, plant and equipment computed as the difference between the net disposal proceeds and the carrying amount of the asset is included in the statement of profit and loss when the asset is derecognised. Major inspection and overhaul expenditure is capitalised, if the recognition criteria are met.
iv) Assets under constructionAssets under construction are capitalised in the assets under construction account. At the point when an asset is capable of operating in the manner intended by management, the cost of construction is transferred to the appropriate category of property, plant and equipment. Costs associated with the commissioning of an asset and any obligatory decommissioning costs are capitalised until the period of commissioning has been completed and the asset is ready for its intended use.
v) Depreciation, depletion and amortisation expenseMining properties and other assets in the course of development or construction and freehold land are not depreciated or amortised.
� ining propertiesThe capitalised mining properties are amortised on a unit-of-production basis over the total estimated remaining commercial proved and probable reserves of each property or group of properties and are subject to impairment review. Costs used in the unit of production calculation comprise the net book value of capitalised costs plus the estimated future capital expenditure required to access the commercial reserves. Changes in the estimates of commercial reserves or future capital expenditure are dealt with prospectively.
� Oil and gas producing acilitiesAll expenditures carried within each field are amortised from the commencement of production on a unit of production basis, which is the ratio of oil and gas production in the period to the estimated quantities of depletable reserves at the end of the period plus the production in the period, generally on a field-by-field basis or group of fields which are reliant on common infrastructure.
Depletable reserves are proved reserves for acquisition costs and proved and developed reserves for successful exploratory wells, development wells, processing facilities, distribution assets, estimated future abandonment cost and all other related costs. These assets are depleted within each cost centre.
Reserves for this purpose are considered on working interest basis which are reassessed atleast annually. Impact of changes to reserves are accounted for prospectively.
� Other assetsDepreciation on other property, plant and equipment is calculated using the straight-line method (SLM) to allocate their cost, net of their residual values, over their estimated useful lives (determined by the management) as given below.
Management’s assessment takes into account, inter alia, the nature of the assets, the estimated usage of the assets, the operating conditions of the assets, past history of replacement and maintenance support
Estimated useful lives of assets are as follows:
Asset Useful Life (in years)
Buildings (Residential, factory etc.) 3-60 Plant and equipment 15-40 Railway siding 15 Office equipment 3-6 Furniture and fixture 8-10 Vehicles 8-10
Major inspection and overhaul costs are depreciated over the estimated life of the economic benefit to be derived from such costs. The carrying amount of the remaining previous overhaul cost is charged to the statement of profit and loss if the next overhaul is undertaken earlier than the previously estimated life of the economic benefit.
The Company reviews the residual value and useful life of an asset at least at each financial year-end and, if expectations differ from previous estimates, the change is accounted for as a change in accounting estimate.
(C) Intangible assetsIntangible assets acquired separately are measured on initial recognition at cost. Subsequently, intangible assets are measured at cost less accumulated amortisation and accumulated impairment losses, if any.
Intangible assets are amortised over their estimated useful life on a straight line basis. Software is amortised over the estimated useful life ranging from 2-5 years. Amounts paid for securing mining rights are amortised over the period of the mining lease ranging from 16-25 years.
Gains or losses arising from derecognition of an intangible asset are measured as the difference
� DividendsDividend income is recognised in the statement of profit and loss only when the right to receive payment is established, provided it is probable that the economic benefits associated with the dividend will flow to the Company, and the amount of the dividend can be measured reliably.
(B) Property, plant and equipmenti) Mining properties and leasesWhen a decision is taken that a mining property is viable for commercial production (i.e. when the Company determines that the mining property will provide sufficient and sustainable return relative to the risks and the Company decided to proceed with the mine development), all further pre-production primary development expenditure other than that on land, buildings, plant, equipment and capital work-in-progress is capitalised as property, plant and equipment under the heading “Mining properties and leases” together with any amount transferred from “Exploration and evaluation” assets. The costs of mining properties and leases, include the costs of acquiring and developing mining properties and mineral rights.
The stripping cost incurred during the production phase of a surface mine is deferred to the extent the current period stripping cost exceeds the average period stripping cost over the life of mine and recognised as an asset if such cost provides a benefit in terms of improved access to ore in future periods and certain criteria are met. When the benefit from the stripping costs are realised in the current period, the stripping costs are accounted for as the cost of inventory. If the costs of inventory produced and the stripping activity asset are not separately identifiable, a relevant production measure is used to allocate the production stripping costs between the inventory produced and the stripping activity asset. The Company uses the expected volume of waste compared with the actual volume of waste extracted for a given value of ore/mineral production for the purpose of determining the cost of the stripping activity asset.
Deferred stripping costs are included in mining properties within property, plant and equipment and disclosed as a part of mining properties. After initial recognition, the stripping activity asset is depreciated on a unit of production method over the expected useful life of the identified component of the ore body.
In circumstances where a mining property is abandoned, the cumulative capitalised costs relating to the property are written-off in the period in which it occurs i.e. when the Company determines that the mining property will not provide sufficient and sustainable returns relative to
the risks and the Company decides not to proceed with the mine development.
Commercial reserves are proved and probable reserves as defined by the ‘JORC’ Code, ‘MORC’ code or ‘SAMREC’ Code. Changes in the commercial reserves affecting unit of production calculations are dealt with prospectively over the revised remaining reserves.
ii) Oil and gas assets– (developing/producing assets)For oil and gas assets a successful efforts based accounting policy is followed. Costs incurred prior to obtaining the legal rights to explore an area are expensed immediately to the statement of profit and loss.
All costs incurred after the technical feasibility and commercial viability of producing hydrocarbons has been demonstrated are capitalised within property, plant and equipment – development/producing assets on a field-by-field basis. Subsequent expenditure is capitalised only where it either enhances the economic benefits of the development/producing asset or replaces part of the existing development/producing asset. Any remaining costs associated with the part replaced are expensed.
Net proceeds from any disposal of development/producing assets are credited against the previously capitalised cost. A gain or loss on disposal of a development/producing asset is recognised in the statement of profit and loss to the extent that the net proceeds exceed or are less than the appropriate portion of the net capitalised costs of the asset.
iii) Other property, plant and equipmentThe initial cost of property, plant and equipment comprises its purchase price, including import duties and non-refundable purchase taxes, and any directly attributable costs of bringing an asset to working condition and location for its intended use. It also includes the initial estimate of the costs of dismantling and removing the item and restoring the site on which it is located.
Land acquired free of cost or at below market rate from the government is recognised at fair value with corresponding credit to deferred income.
If significant parts of an item of property, plant and equipment have different useful lives, then they are accounted for as separate items (major components) of property, plant and equipment. All other expenses on existing property, plant and equipment, including day-to-day repair and maintenance expenditure and cost of replacing parts, are charged to the statement of profit
STANDALONE NOTES FORMING PART OF THE FINANCIAL STATEMENTSas at and for the year ended March 1 2020
STANDALONE NOTES FORMING PART OF THE FINANCIAL STATEMENTSas at and for the year ended March 1 2020
INTEGRATED REPORT MANAGEMENT REVIEW STATUTORY REPORTS FINANCIAL STATEMENTS
06-115 116-167 168-270 271-502

290 VEDANTA LIMITED INTEGRATED REPORT AND ANNUAL ACCOUNTS 2019-20 VEDANTA LIMITED INTEGRATED REPORT AND ANNUAL ACCOUNTS 2019-20 291
The Company assesses at each reporting date, whether there is an indication that an asset may be impaired. The Company conducts an internal review of asset values annually, which is used as a source of information to assess for any indications of impairment or reversal of previously recognised impairment losses. Internal and external factors, such as worse economic performance than expected, changes in expected future prices, costs and other market factors are also monitored to assess for indications of impairment or reversal of previously recognised impairment losses.
If any such indication exists then an impairment review is undertaken and the recoverable amount is calculated, as the higher of fair value less costs of disposal and the asset’s value in use.
Fair value less costs of disposal is the price that would be received to sell the asset in an orderly transaction between market participants and does not reflect the effects of factors that may be specific to the Company and not applicable to entities in general. Fair value for mineral and oil and gas assets is generally determined as the present value of the estimated future cash flows expected to arise from the continued use of the asset, including any expansion prospects, and its eventual disposal, using assumptions that an independent market participant may take into account. These cash flows are discounted at an appropriate post tax discount rate to arrive at the net present value.
Value in use is determined as the present value of the estimated future cash flows expected to arise from the continued use of the asset in its present form and its eventual disposal. The cash flows are discounted using a pre-tax discount rate that reflects current market assessments of the time value of money and the risks specific to the asset for which estimates of future cash flows have not been adjusted. Value in use is determined by applying assumptions specific to the Company’s continued use and cannot take into account future development. These assumptions are different to those used in calculating fair value and consequently the value in use calculation is likely to give a different result to a fair value calculation.
The carrying amount of the CGU is determined on a basis consistent with the way the recoverable amount of the CGU is determined.
If the recoverable amount of an asset or CGU is estimated to be less than its carrying amount, the carrying amount of the asset or CGU is reduced to its recoverable amount. An impairment loss is recognised in the statement of profit and loss.
Any reversal of the previously recognised impairment loss is limited to the extent that the asset’s carrying amount does not exceed the carrying amount that would have been determined if no impairment loss had previously been recognised.
Exploration and evaluation assets:In assessing whether there is any indication that an exploration and evaluation asset may be impaired, the Company considers, as a minimum, the following indicators:
� the period for which the Company has the right to explore in the specific area has expired during the period or will expire in the near future, and is not expected to be renewed;
� substantive expenditure on further exploration for and evaluation of mineral resources in the specific area is neither budgeted nor planned;
� exploration for and evaluation of mineral resources in the specific area have not led to the discovery of commercially viable quantities of mineral resources and the Company has decided to discontinue such activities in the specific area;
� sufficient data exist to indicate that, although a development in the specific area is likely to proceed, the carrying amount of the exploration and evaluation asset is unlikely to be recovered in full from successful development or by sale; and
� reserve information prepared annually by external experts.
When a potential impairment is identified, an assessment is performed for each area of interest in conjunction with the group of operating assets (representing a cash-generating unit) to which the exploration and evaluation assets is attributed. Exploration areas in which reserves have been discovered but require major capital expenditure before production can begin, are continually evaluated to ensure that commercial quantities of reserves exist or to ensure that additional exploration work is underway or planned. To the extent that capitalised expenditure is no longer expected to be recovered, it is charged to the statement of profit and loss.
(G) Financial instrumentsA financial instrument is any contract that gives rise to a financial asset of one entity and a financial liability or equity instrument of another entity.
between the net disposal proceeds and the carrying amount of the asset and are recognised in the statement of profit and loss when the asset is derecognised.
The amortisation period and the amortisation method are reviewed at least at each financial year end. If the expected useful life of the asset is different from previous estimates, the change is accounted for prospectively as a change in accounting estimate.
(D) Exploration and evaluation intangible assetsExploration and evaluation expenditure incurred prior to obtaining the mining right or the legal right to explore are expensed as incurred.
Exploration and evaluation expenditure incurred after obtaining the mining right or the legal right to explore are capitalised as exploration and evaluation assets (intangible assets) and stated at cost less impairment, if any. Exploration and evaluation intangible assets are transferred to the appropriate category of property, plant and equipment when the technical feasibility and commercial viability has been determined. Exploration intangible assets under development are assessed for impairment and impairment loss, if any, is recognised prior to reclassification.
Exploration expenditure includes all direct and allocated indirect expenditure associated with finding specific mineral resources which includes depreciation and applicable operating costs of related support equipment and facilities and other costs of exploration activities:
� Acquisition costs - costs associated with acquisition of licenses and rights to explore, including related professional fees.
� General exploration costs - costs of surveys and studies, rights of access to properties to conduct those studies (e.g., costs incurred for environment clearance, defence clearance, etc.), and salaries and other expenses of geologists, geophysical crews and other personnel conducting those studies.
� Costs of exploration drilling and equipping exploration and appraisal wells.
Exploration expenditure incurred in the process of determining oil and gas exploration targets is capitalised within “Exploration and evaluation assets” (intangible assets) and subsequently allocated to drilling activities. Exploration drilling costs are initially capitalised on a well-by-well basis until the success or otherwise of the well has been established. The success or failure of each exploration effort is judged on a well-by-well
basis. Drilling costs are written-off on completion of a well unless the results indicate that hydrocarbon reserves exist and there is a reasonable prospect that these reserves are commercial.
Following appraisal of successful exploration wells, if commercial reserves are established and technical feasibility for extraction demonstrated, then the related capitalised exploration costs are transferred into a single field cost centre within property, plant and equipment - development/producing assets (oil and gas properties) after testing for impairment. Where results of exploration drilling indicate the presence of hydrocarbons which are ultimately not considered commercially viable, all related costs are written-off to the statement of profit and loss.
Expenditure incurred on the acquisition of a license interest is initially capitalised on a license-by-license basis. Costs are held, undepleted, within exploration and evaluation assets until such time as the exploration phase on the license area is complete or commercial reserves have been discovered.
Net proceeds from any disposal of an exploration asset are initially credited against the previously capitalised costs. Any surplus/ deficit is recognised in the statement of profit and loss.
(E) Non-current assets held for saleNon-current assets and disposal groups are classified as held for sale if their carrying amount will be recovered through a sale transaction rather than through continuing use. This condition is regarded as met only when the sale is highly probable and the asset (or disposal group) is available for immediate sale in its present condition. Management must be committed to the sale which should be expected to qualify for recognition as a completed sale within one year from the date of classification.
Non-current assets and disposal groups classified as held for sale are not depreciated and are measured at the lower of carrying amount and fair value less costs to sell. Such assets and disposal groups are presented separately on the face of the balance sheet.
(F) Impairment of non-financial assetsImpairment charges and reversals are assessed at the level of cash-generating units. A cash-generating unit (CGU) is the smallest identifiable group of assets that generate cash inflows that are largely independent of the cash inflows from other assets or group of assets.
STANDALONE NOTES FORMING PART OF THE FINANCIAL STATEMENTSas at and for the year ended March 1 2020
STANDALONE NOTES FORMING PART OF THE FINANCIAL STATEMENTSas at and for the year ended March 1 2020
INTEGRATED REPORT MANAGEMENT REVIEW STATUTORY REPORTS FINANCIAL STATEMENTS
06-115 116-167 168-270 271-502

292 VEDANTA LIMITED INTEGRATED REPORT AND ANNUAL ACCOUNTS 2019-20 VEDANTA LIMITED INTEGRATED REPORT AND ANNUAL ACCOUNTS 2019-20 293
(ii) Financial Assets – derecognitionThe Company derecognises a financial asset when the contractual rights to the cash flows from the asset expire, or it transfers the rights to receive the contractual cash flows on the financial asset in a transaction in which substantially all the risks and rewards of ownership of the financial asset are transferred.
(iii) Impairment of financial assetsIn accordance with Ind AS 109, the Company applies expected credit loss (ECL) model for measurement and recognition of impairment loss on the following financial assets:
a)�Financial assets that are debt instruments, and are measured at amortised cost e.g., loans, debt securities and deposits.
b)�Financial assets that are debt instruments and are measured as at FVOCI.
c)�Trade receivables or any contractual right to receive cash or another financial asset that result from transactions that are within the scope of Ind AS 115.
The Company follows ‘simplified approach’ for recognition of impairment loss allowance on trade receivables, contract assets and lease receivables.
The application of simplified approach does not require the Company to track changes in credit risk. Rather, it recognises impairment loss allowance based on lifetime ECLs at each reporting date, right from its initial recognition.
At each reporting date, for recognition of impairment loss on other financial assets and risk exposure, the Company determines whether there has been a significant increase in the credit risk since initial recognition. If credit risk has not increased significantly, 12-month ECL is used to provide for impairment loss. However, if credit risk has increased significantly, lifetime ECL is used. If, in a subsequent period, credit quality of the instrument improves such that there is no longer a significant increase in credit risk since initial recognition, then the Company reverts to recognising impairment loss allowance based on 12-month ECL.
Lifetime ECL are the expected credit losses resulting from all possible default events over the expected life of a financial instrument. The 12-month ECL is a portion of the lifetime ECL which results from default events that are possible within 12 months after the reporting date.
ECL is the difference between all contractual cash flows that are due to the Company in accordance with the contract and all the cash flows that the entity expects to receive, discounted at the original EIR.
ECL impairment loss allowance (or reversal) recognised during the year is recognised as income/ expense in the statement of profit and loss. The balance sheet presentation for various financial instruments is described below:
a) �Financial assets measured at amortised cost: ECL is presented as an allowance, i.e. as an integral part of the measurement of those assets. The Company does not reduce impairment allowance from the gross carrying amount.
b) �Debt instruments measured at FVOCI: Since financial assets are already reflected at fair value, impairment allowance is not further reduced from its value. Rather, ECL amount is presented as ‘accumulated impairment amount’ in the OCI.
For assessing increase in credit risk and impairment loss, the Company combines financial instruments on the basis of shared credit risk characteristics with the objective of facilitating an analysis that is designed to enable significant increases in credit risk to be identified on a timely basis.
The Company does not have any purchased or originated credit-impaired(POCI) financial assets, i.e. financial assets which are credit impaired on purchase/ origination.
(iv) Financial liabilities – Recognition & Subsequent measurementFinancial liabilities are classified, at initial recognition, as financial liabilities at fair value through profit or loss, or as loans, borrowings and payables, or as derivatives designated as hedging instruments in an effective hedge, as appropriate.
All financial liabilities are recognised initially at fair value and, in the case of financial liabilities at amortised cost, net of directly attributable transaction costs.
The Company’s financial liabilities include trade and other payables, loans and borrowings including bank overdrafts, financial guarantee contracts and derivative financial instruments.
The measurement of financial liabilities depends on their classification, as described below:
(i) Financial Assets – recognition & subsequent measurementAll financial assets are recognised initially at fair value plus, in the case of financial assets not recorded at fair value through profit or loss, transaction costs that are attributable to the acquisition of the financial asset. Purchases or sales of financial assets that require delivery of assets within a time frame established by regulation or convention in the market place (regular way trades) are recognised on the trade date, i.e. the date that the Company commits to purchase or sell the asset.
For purposes of subsequent measurement, financial assets are classified in four categories:
� Debt instruments at amortised costA ‘debt instrument’ is measured at amortised cost if both the following conditions are met:
a) �The asset is held within a business model whose objective is to hold assets for collecting contractual cash flows, and
b) �Contractual terms of the asset give rise on specified dates to cash flows that are solely payments of principal and interest (SPPI) on the principal amount outstanding.
After initial measurement, such financial assets are subsequently measured at amortised cost using the Effective Interest Rate (EIR) method. Amortised cost is calculated by taking into account any discount or premium on acquisition and fees or costs that are an integral part of the EIR. The EIR amortisation is included in interest income in the statement of profit and loss. The losses arising from impairment are recognised in the statement of profit and loss.
� Debt instruments at air value through other comprehensive income F OCA ‘debt instrument’ is classified as at FVOCI if both of the following criteria are met:
a)��The objective of the business model is achieved both by collecting contractual cash flows and selling the financial assets, and
b)��The asset’s contractual cash flows represent SPPI.
Debt instruments included within the FVOCI category are measured initially as well as at each reporting date at fair value. Fair value movements are recognised in other comprehensive income (OCI). However, interest income, impairment losses
and reversals and foreign exchange gain or loss are recognised in the statement of profit and loss. On derecognition of the asset, cumulative gain or loss previously recognised in other comprehensive income is reclassified from the equity to statement of profit and loss. Interest earned whilst holding fair value through other comprehensive income debt instrument is reported as interest income using the EIR method.
� Debt instruments at air value through pro t or loss F TP
FVTPL is a residual category for debt instruments. Any debt instrument, which does not meet the criteria for categorisation as at amortised cost or as FVOCI, is classified as at FVTPL.
In addition, the Company may elect to designate a debt instrument, which otherwise meets amortised cost or FVOCI criteria, as at FVTPL. However, such election is allowed only if doing so reduces or eliminates a measurement or recognition inconsistency (referred to as ‘accounting mismatch’). The Company has not designated any debt instrument as at FVTPL.
Debt instruments included within the FVTPL category are measured at fair value with all changes being recognised in statement of profit and loss.
� E uity instrumentsAll equity investments in the scope of Ind AS 109 are measured at fair value. Equity instruments which are held for trading and contingent consideration recognised by an acquirer in a business combination to which Ind AS 103 applies are classified as at FVTPL. For all other equity instruments, the Company may make an irrevocable election to present in other comprehensive income subsequent changes in the fair value. The Company makes such election on an instrument-by-instrument basis. The classification is made on initial recognition and is irrevocable.
If the Company decides to classify an equity instrument as at FVOCI, then all fair value changes on the instrument, excluding dividends, are recognised in the OCI. There is no recycling of the amounts from OCI to the statement of profit and loss, even on sale of investment. However, the Company may transfer the cumulative gain or loss within equity. For equity instruments which are classified as FVTPL all subsequent fair value changes are recognised in the statement of profit and loss.
STANDALONE NOTES FORMING PART OF THE FINANCIAL STATEMENTSas at and for the year ended March 1 2020
STANDALONE NOTES FORMING PART OF THE FINANCIAL STATEMENTSas at and for the year ended March 1 2020
INTEGRATED REPORT MANAGEMENT REVIEW STATUTORY REPORTS FINANCIAL STATEMENTS
06-115 116-167 168-270 271-502

294 VEDANTA LIMITED INTEGRATED REPORT AND ANNUAL ACCOUNTS 2019-20 VEDANTA LIMITED INTEGRATED REPORT AND ANNUAL ACCOUNTS 2019-20 295
on a net basis, or to realise the asset and settle the liability simultaneously.
(H) Derivative financial instruments and hedge accountingInitial recognition and subsequent measurementIn order to hedge its exposure to foreign exchange, interest rate, and commodity price risks, the Company enters into forward, option, swap contracts and other derivative financial instruments. The Company does not hold derivative financial instruments for speculative purposes.
Such derivative financial instruments are initially recognised at fair value on the date on which a derivative contract is entered into and are subsequently re-measured at fair value. Derivatives are carried as financial assets when the fair value is positive and as financial liabilities when the fair value is negative.
Any gains or losses arising from changes in the fair value of derivatives are taken directly to statement of profit and loss, except for the effective portion of cash flow hedges, which is recognised in OCI and later reclassified to statement of profit and loss when the hedge item affects profit or loss or treated as basis adjustment if a hedged forecast transaction subsequently results in the recognition of a non-financial asset or non-financial liability.
For the purpose of hedge accounting, hedges are classified as:
� Fair value hedges when hedging the exposure to changes in the fair value of a recognised asset or liability or an unrecognised firm commitment.
� Cash flow hedges when hedging the exposure to variability in cash flows that is either attributable to a particular risk associated with a recognised asset or liability or a highly probable forecast transaction or the foreign currency risk in an unrecognised firm commitment.
� Hedges of a net investment in a foreign operation.
At the inception of a hedge relationship, the Company formally designates and documents the hedge relationship to which the Company wishes to apply hedge accounting. The documentation includes the Company’s risk management objective and strategy for undertaking hedge, the hedging/economic relationship, the hedged item or transaction, the nature of the risk being hedged, hedge ratio and how the entity will assess the effectiveness of changes in the hedging instrument’s fair value in offsetting the exposure to changes in the hedged item’s fair value or cash flows
attributable to the hedged risk. Such hedges are expected to be highly effective in achieving offsetting changes in fair value or cash flows and are assessed on an ongoing basis to determine that they actually have been highly effective throughout the financial reporting periods for which they were designated.
Hedges that meet the strict criteria for hedge accounting are accounted for, as described below:
i) Fair value hedgesChanges in the fair value of derivatives that are designated and qualify as fair value hedges are recognised in statement of profit and loss immediately, together with any changes in the fair value of the hedged asset or liability that are attributable to the hedged risk.
When an unrecognised firm commitment is designated as a hedged item, the subsequent cumulative change in the fair value of the firm commitment attributable to the hedged risk is recognised as an asset or liability with a corresponding gain or loss recognised in statement of profit and loss. Hedge accounting is discontinued when the Company revokes the hedge relationship, the hedging instrument or hedged item expires or is sold, terminated, or exercised or no longer meets the criteria for hedge accounting.
ii) Cash ow hedgesThe effective portion of the gain or loss on the hedging instrument is recognised in OCI in the cash flow hedge reserve, while any ineffective portion is recognised immediately in the statement of profit and loss.
Amounts recognised in OCI are transferred to statement of profit and loss when the hedged transaction affects profit or loss, such as when the hedged financial income or financial expense is recognised or when a forecast sale occurs. When the hedged item is the cost of a non-financial asset or non-financial liability, the amounts recognised in OCI are transferred to the initial carrying amount of the non-financial asset or liability.
If the hedging instrument expires or is sold, terminated or exercised without replacement or rollover (as part of the hedging strategy), or if its designation as a hedge is revoked, or when the hedge no longer meets the criteria for hedge accounting, any cumulative gain or loss previously recognised in OCI remains separately in equity until the forecast transaction occurs or the foreign currency firm commitment is met.
(I) LeasesThe Company assesses at contract inception, all arrangements to determine whether they are, or
� Financial liabilities at air value through pro t or lossFinancial liabilities at fair value through profit or loss include financial liabilities held for trading and financial liabilities designated upon initial recognition as at fair value through profit or loss. Financial liabilities are classified as held for trading if they are incurred for the purpose of repurchasing in the near term. This category also includes derivative financial instruments entered into by the Company that are not designated as hedging instruments in hedge relationships as defined by Ind AS 109. Separated embedded derivatives are also classified as held for trading unless they are designated as effective hedging instruments.
Gains or losses on liabilities held for trading are recognised in the statement of profit and loss.
Financial liabilities designated upon initial recognition at fair value through profit or loss are designated as such at the initial date of recognition, and only if the criteria in Ind AS 109 are satisfied. For liabilities designated as FVTPL, fair value gains/ losses attributable to changes in own credit risk are recognised in OCI. These gains/losses are not subsequently transferred to statement of profit and loss. However, the Company may transfer the cumulative gain or loss within equity. All other changes in fair value of such liability are recognised in the statement of profit and loss. The Company has not designated any financial liability as at fair value through profit or loss.
� Financial liabilities at amortised cost oans orro ings and Trade and Other payables
After initial recognition, interest-bearing loans and borrowings and trade and other payables are subsequently measured at amortised cost using the EIR method. Gains and losses are recognised in the statement of profit and loss when the liabilities are derecognised as well as through the EIR amortisation process.
Amortised cost is calculated by taking into account any discount or premium on acquisition and fees or costs that are an integral part of the EIR. The EIR amortisation is included as finance costs in the statement of profit and loss.
(v) Financial liabilities – DerecognitionA financial liability is derecognised when the obligation under the liability is discharged or cancelled or expires. When an existing financial liability is replaced by another from the same lender on substantially
different terms, or the terms of an existing liability are substantially modified, such an exchange or modification is treated as the derecognition of the original liability and the recognition of a new liability. The difference in the respective carrying amounts is recognised in the statement of profit and loss.
(vi) Embedded derivativesAn embedded derivative is a component of a hybrid (combined) instrument that also includes a non-derivative host contract – with the effect that some of the cash flows of the combined instrument vary in a way similar to a standalone derivative. An embedded derivative causes some or all of the cash flows that otherwise would be required by the contract to be modified according to a specified interest rate, financial instrument price, commodity price, foreign exchange rate, index of prices or rates, credit rating or credit index, or other variable, provided in the case of a non-financial variable that the variable is not specific to a party to the contract. Reassessment only occurs if there is either a change in the terms of the contract that significantly modifies the cash flows that would otherwise be required or a reclassification of a financial asset out of the fair value through profit or loss.
If the hybrid contract contains a host that is a financial asset within the scope of Ind AS 109, the Company does not separate embedded derivatives. Rather, it applies the classification requirements contained in Ind AS 109 to the entire hybrid contract. Derivatives embedded in all other host contracts are accounted for as separate derivatives and recorded at fair value if their economic characteristics and risks are not closely related to those of the host contracts and the host contracts are not held for trading or designated at fair value though profit or loss. These embedded derivatives are measured at fair value with changes in fair value recognised in statement of profit and loss, unless designated as effective hedging instruments.
(vii) Equity instrumentsAn equity instrument is any contract that evidences a residual interest in the assets of an entity after deducting all of its liabilities. Equity instruments issued by the Company are recognised at the proceeds received, net of direct issue costs.
(viii) Offsetting of financial instrumentsFinancial assets and financial liabilities are offset and the net amount is reported in the balance sheet if there is a currently enforceable legal right to offset the recognised amounts and there is an intention to settle
STANDALONE NOTES FORMING PART OF THE FINANCIAL STATEMENTSas at and for the year ended March 1 2020
STANDALONE NOTES FORMING PART OF THE FINANCIAL STATEMENTSas at and for the year ended March 1 2020
INTEGRATED REPORT MANAGEMENT REVIEW STATUTORY REPORTS FINANCIAL STATEMENTS
06-115 116-167 168-270 271-502

296 VEDANTA LIMITED INTEGRATED REPORT AND ANNUAL ACCOUNTS 2019-20 VEDANTA LIMITED INTEGRATED REPORT AND ANNUAL ACCOUNTS 2019-20 297
� purchased copper concentrate is recorded at cost on a first-in, first-out ( FIFO ) basis; all other materials including stores and spares are valued on a weighted average basis except in Oil and Gas business where stores and spares are valued on FIFO basis;
� finished products are valued at raw material cost plus costs of conversion, comprising labour costs and an attributable proportion of manufacturing overheads based on normal levels of activity and are moved out of inventory on a weighted average basis (except in copper business where FIFO basis is followed) and
� by-products and scrap are valued at net realisable value.
Net realisable value is determined based on estimated selling price, less further costs expected to be incurred for completion and disposal.
(K) Government grantsGrants and subsidies from the government are recognised when there is reasonable assurance that (i) the Company will comply with the conditions attached to them, and (ii) the grant/subsidy will be received.
When the grant or subsidy relates to revenue, it is recognised as income on a systematic basis in the statement of profit and loss over the periods necessary to match them with the related costs, which they are intended to compensate.
Where the grant relates to an asset, it is recognised as deferred income and released to income in equal amounts over the expected useful life of the related asset and presented within other income.
When the Company receives grants of non-monetary assets, the asset and the grant are recorded at fair value amounts and released to profit or loss over the expected useful life in a pattern of consumption of the benefit of the underlying asset.
When loans or similar assistance are provided by governments or related institutions, with an interest rate below the current applicable market rate, the effect of this favourable interest is regarded as a government grant. The loan or assistance is initially recognised and measured at fair value and the government grant is measured as the difference between the initial carrying value of the loan and the proceeds received. The loan is subsequently measured as per the accounting policy applicable to financial liabilities.
(L) TaxationTax expense represents the sum of current tax and deferred tax.
Current tax is provided at amounts expected to be paid (or recovered) using the tax rates and laws that have been enacted or substantively enacted by the reporting date and includes any adjustment to tax payable in respect of previous years.
Subject to the exceptions below, deferred tax is provided, using the balance sheet method, on all temporary differences at the reporting date between the tax bases of assets and liabilities and their carrying amounts for financial reporting purposes and on carry forward of unused tax credits and unused tax losses;
� deferred income tax is not recognised on initial recognition of an asset or liability in a transaction that is not a business combination and, at the time of the transaction, affects neither the accounting profit nor taxable profit(tax loss); and
� deferred tax assets (including MAT credit entitlement) are recognised only to the extent that it is more likely than not that they will be recovered.
Deferred tax assets and liabilities are measured at the tax rates that are expected to apply to the year when the asset is realised or the liability is settled, based on tax rates (and tax laws) that have been enacted or substantively enacted at the reporting date. Tax relating to items recognised outside statement of profit and loss is recognised outside statement of profit and loss (either in other comprehensive income or equity).
The carrying amount of deferred tax assets (including MAT credit entitlement) is reviewed at each reporting date and is adjusted to the extent that it is no longer probable that sufficient taxable profit will be available to allow all or part of the asset to be recovered.
Deferred tax assets and deferred tax liabilities are offset, if a legally enforceable right exists to set off current income tax assets against current income tax liabilities and the deferred taxes relate to the same taxable entity and the same taxation authority.
(M) Retirement benefit schemesThe Company operates or participates in a number of defined benefits and defined contribution schemes, the assets of which (where funded) are held in separately administered funds. For defined benefit schemes, the cost of providing benefits under the plans is determined by actuarial valuation each year separately for each plan using the projected unit credit method by third party qualified actuaries.
contain, a lease. That is, if the contract conveys the right to control the use of an identified asset for a period of time in exchange for consideration.
(a) Company as a lessorLeases in which the Company does not transfer substantially all the risks and rewards of ownership of an asset are classified as operating leases. Rental income from operating lease is recognised on a straight-line basis over the term of the relevant lease. Initial direct costs incurred in negotiating and arranging an operating lease are added to the carrying amount of the leased asset and recognised over the lease term on the same basis as rental income. Contingent rents are recognised as revenue in the period in which they are earned.
Leases are classified as finance leases when substantially all of the risks and rewards of ownership transfer from the Company to the lessee. Amounts due from lessees under finance leases are recorded as receivables at the Company’s net investment in the leases. Finance lease income is allocated to accounting periods so as to reflect a constant periodic rate of return on the net investment outstanding in respect of the lease.
Company as a lesseeThe Company applies a single recognition and measurement approach for all leases, except for short-term leases and leases of low-value assets. The Company recognises lease liabilities towards future lease payments and right-of-use assets representing the right to use the underlying assets.
i Right o use assetsThe Company recognises right-of-use assets at the commencement date of the lease (i.e. the date when the underlying asset is available for use). Right-of-use assets are measured at cost, less any accumulated depreciation and impairment losses, and adjusted for any remeasurement of lease liabilities. The cost of right-of-use assets includes the amount of lease liabilities recognised, initial direct costs incurred, and lease payments made at or before the commencement date less any lease incentives received. The right-of-use assets are also subject to impairment.
Right-of-use assets are depreciated on a straight-line basis over the shorter of the lease term and the estimated useful lives of the assets as described in ‘B’ above.
ii ease liabilitiesAt the commencement date of the lease, the Company recognises lease liabilities measured at the present value of lease payments to be made over the lease term. The lease payments include fixed payments (and, in some instances, in-substance fixed payments) less any lease incentives receivable, variable lease payments that depend on an index or a rate, and amounts expected to be paid under residual value guarantees. The lease payments also include the exercise price of a purchase option reasonably certain to be exercised by the Company and payments of penalties for terminating the lease, if the lease term reflects the Company exercising the option to terminate. Variable lease payments that do not depend on an index or a rate are recognised as expenses (unless they are incurred to produce inventories) in the period in which the event or condition that triggers the payment occurs.
In calculating the present value of lease payments, the Company uses its incremental borrowing rate at the lease commencement date because the interest rate implicit in the lease is generally not readily determinable. After the commencement date, the amount of lease liabilities is increased to reflect the accretion of interest and reduced for the lease payments made. In addition, the carrying amount of lease liabilities is remeasured if there is a modification, a change in the lease term, a change in the lease payments (e.g., changes to future payments resulting from a change in an index or rate used to determine such lease payments) or a change in the assessment of an option to purchase the underlying asset.
The Company’s lease liabilities are included in Other Financial Liabilities.
iii hort term leases and leases o lo value assetsThe Company applies the short-term lease recognition exemption to its short-term leases of equipment (i.e. those leases that have a lease term of 12 months or less from the commencement date and do not contain a purchase option). It also applies the lease of low-value assets recognition exemption to leases of office equipment that are considered to be low value. Lease payments on short-term leases and leases of low-value assets are recognised as expense on a straight-line basis over the lease term.
(J) InventoriesInventories and work-in-progress are stated at the lower of cost and net realisable value. Cost is determined on the following basis:
STANDALONE NOTES FORMING PART OF THE FINANCIAL STATEMENTSas at and for the year ended March 1 2020
STANDALONE NOTES FORMING PART OF THE FINANCIAL STATEMENTSas at and for the year ended March 1 2020
INTEGRATED REPORT MANAGEMENT REVIEW STATUTORY REPORTS FINANCIAL STATEMENTS
06-115 116-167 168-270 271-502

298 VEDANTA LIMITED INTEGRATED REPORT AND ANNUAL ACCOUNTS 2019-20 VEDANTA LIMITED INTEGRATED REPORT AND ANNUAL ACCOUNTS 2019-20 299
The Company has significant capital commitments in relation to various capital projects which are not recognised in the balance sheet.
(P) Restoration, rehabilitation and environmental costsAn obligation to incur restoration, rehabilitation and environmental costs arises when environmental disturbance is caused by the development or ongoing production of a mine or oil fields. Such costs, discounted to net present value, are provided for and a corresponding amount is capitalised at the start of each project, as soon as the obligation to incur such costs arises. These costs are charged to the statement of profit and loss over the life of the operation through the depreciation of the asset and the unwinding of the discount on the provision. The cost estimates are reviewed periodically and are adjusted to reflect known developments which may have an impact on the cost estimates or life of operations. The cost of the related asset is adjusted for changes in the provision due to factors such as updated cost estimates, changes to lives of operations, new disturbance and revisions to discount rates. The adjusted cost of the asset is depreciated prospectively over the lives of the assets to which they relate. The unwinding of the discount is shown as finance cost in the statement of profit and loss.
Costs for the restoration of subsequent site damage, which is caused on an ongoing basis during production, are provided for at their net present value and charged to the statement of profit and loss as extraction progresses. Where the costs of site restoration are not anticipated to be material, they are expensed as incurred.
(Q) Accounting for foreign currency transactionsThe functional currency of the Company is determined as the currency of the primary economic environment in which it operates. For all principal businesses of the Company, the functional currency is Indian rupee (`) with an exception of oil and gas business operations which has a US dollar functional currency as that is the currency of the primary economic environment in which it operates. The financial statements are presented in Indian rupee (`).
In the financial statements of the Company, transactions in currencies other than the functional currency are translated into the functional currency at the exchange rates ruling at the date of the transaction. Monetary assets and liabilities denominated in other currencies are translated into the functional currency at exchange rates prevailing on the reporting date. Non-monetary assets and liabilities denominated in other currencies and measured at historical cost or fair value
are translated at the exchange rates prevailing on the dates on which such values were determined.
All exchange differences are included in the statement of profit and loss except those where the monetary item designated as an effective hedging instrument of the currency risk of designated forecasted sales or purchases, which are recognised in the other comprehensive income.
Exchange differences which are regarded as an adjustment to interest costs on foreign currency borrowings, are capitalised as part of borrowing costs in qualifying assets.
The statement of profit and loss of oil and gas business is translated into Indian Rupees (INR) at the average rates of exchange during the year / exchange rates as on the date of the transaction. The Balance Sheet is translated at the exchange rate as at the reporting date. Exchange difference arising on translation is recognised in other comprehensive income and would be recycled to the statement of profit and loss as and when these operations are disposed off.
The Company had applied paragraph 46A of AS 11 under Previous GAAP. Ind AS 101 gives an option, which has been exercised by the Company, whereby a first time adopter can continue its Indian GAAP policy for accounting for exchange differences arising from translation of long-term foreign currency monetary items recognised in the Indian GAAP financial statements for the period ending immediately before the beginning of the first Ind AS financial reporting period. Hence, foreign exchange gain/loss on long-term foreign currency monetary items recognised upto March 31, 2016 has been deferred/capitalised. Such exchange differences arising on translation/settlement of long-term foreign currency monetary items and pertaining to the acquisition of a depreciable asset are amortised over the remaining useful lives of the assets.
Exchange differences arising on translation/settlement of long-term foreign currency monetary items, acquired post April 01, 2016, pertaining to the acquisition of a depreciable asset are charged to the statement of profit and loss.
(R) Earnings per shareThe Company presents basic and diluted earnings per share (“EPS”) data for its equity shares. Basic EPS is calculated by dividing the profit or loss attributable to equity shareholders of the Company by the weighted average number of equity shares outstanding during the period. Diluted EPS is determined by adjusting the profit or loss attributable to equity shareholders and the
Remeasurement including, effects of asset ceiling and return on plan assets (excluding amounts included in interest on the net defined benefit liability) and actuarial gains and losses arising in the year are recognised in full in other comprehensive income and are not recycled to the statement of profit and loss.
Past service costs are recognised in profit or loss on the earlier of:
� the date of the plan amendment or curtailment, and
� the date that the Company recognises related restructuring costs.
Net interest is calculated by applying a discount rate to the net defined benefit liability or asset at the beginning of the period. Defined benefit costs are split into current service cost, past service cost, net interest expense or income and remeasurement and gains and losses on curtailments and settlements. Current service cost and past service cost are recognised within employee benefit expense. Net interest expense or income is recognised within finance costs.
For defined contribution schemes, the amount charged to the statement of profit and loss in respect of pension costs and other post retirement benefits is the contributions payable in the year, recognised as and when the employee renders related services.
(N) Share-based paymentsCertain employees (including executive directors) of the Company receive part of their remuneration in the form of share-based payment transactions, whereby employees render services in exchange for shares or rights over shares (‘equity-settled transactions’).
The cost of equity-settled transactions with employees is measured at fair value of share awards at the date at which they are granted. The fair value of share awards is determined with the assistance of an external valuer and the fair value at the grant date is expensed on a proportionate basis over the vesting period based on the Company’s estimate of shares that will eventually vest. The estimate of the number of awards likely to vest is reviewed at each balance sheet date up to the vesting date at which point the estimate is adjusted to reflect the current expectations.
The resultant increase in equity is recorded in share based payment reserve.
In case of cash-settled transactions, a liability is recognised for the fair value of cash-settled transactions. The fair value is measured initially and at each reporting date up to and including the settlement
date, with changes in fair value recognised in employee benefits expense. The fair value is expensed over the period until the vesting date with recognition of a corresponding liability. The fair value is determined with the assistance of an external valuer.
Additionally, VRL offered certain share based incentives under the Long-Term Incentive Plan (“LTIP”) to employees and directors of the Company. VRL recovers the proportionate cost (calculated based on the grant date fair value of the options granted) from the Company, which is charged to the statement of profit and loss.
(O) Provisions, contingent liabilities and contingent assetsThe assessments undertaken in recognising provisions and contingencies have been made in accordance with the applicable Ind AS.
Provisions represent liabilities for which the amount or timing is uncertain. Provisions are recognised when the Company has a present obligation (legal or constructive), as a result of past events, and it is probable that an outflow of resources, that can be reliably estimated, will be required to settle such an obligation.
If the effect of the time value of money is material, provisions are determined by discounting the expected future cash flows to net present value using an appropriate pre-tax discount rate that reflects current market assessments of the time value of money and, where appropriate, the risks specific to the liability. Unwinding of the discount is recognised in statement of profit and loss as a finance cost. Provisions are reviewed at each reporting date and are adjusted to reflect the current best estimate.
A contingent liability is a possible obligation that arises from past events whose existence will be confirmed by the occurrence or non-occurrence of one or more uncertain future events beyond the control of the Company or a present obligation that is not recognised because it is not probable that an outflow of resources will be required to settle the obligation. A contingent liability also arises in extremely rare cases where there is a liability that cannot be recognised because it cannot be measured reliably. The Company does not recognise a contingent liability but discloses its existence in the Balance Sheet.
Contingent assets are not recognised but disclosed in the financial statements when an inflow of economic benefit is probable.
STANDALONE NOTES FORMING PART OF THE FINANCIAL STATEMENTSas at and for the year ended March 1 2020
STANDALONE NOTES FORMING PART OF THE FINANCIAL STATEMENTSas at and for the year ended March 1 2020
INTEGRATED REPORT MANAGEMENT REVIEW STATUTORY REPORTS FINANCIAL STATEMENTS
06-115 116-167 168-270 271-502

300 VEDANTA LIMITED INTEGRATED REPORT AND ANNUAL ACCOUNTS 2019-20 VEDANTA LIMITED INTEGRATED REPORT AND ANNUAL ACCOUNTS 2019-20 301
appropriate, to the amortised cost of a financial liability. When calculating the effective interest rate, the Company estimates the expected cash flows by considering all the contractual terms of the financial instrument (for example, prepayment, extension, call and similar options).
(V) Cash and cash equivalentsCash and cash equivalents comprise cash at bank and on hand and short-term money market deposits which have a maturity of three months or less from the date of acquisition, that are readily convertible to known amounts of cash and which are subject to an insignificant risk of changes in value.
For the purpose of the statement of cash flows, cash and cash equivalents consist of cash and short-term deposits, as defined above, and additionally includes unpaid dividend account.
(W) Equity investment in subsidiaries, associates and joint venturesInvestments representing equity interest in subsidiaries, associates and joint ventures are carried at cost. A subsidiary is an entity that is controlled by the Company. Control is evidenced where the Company has the power over the investee or exposed, or has rights, to variable returns from its involvement with the investee and has the ability to affect those returns through its power over the investee. Power is demonstrated through existing rights that give the ability to direct relevant activities, which significantly affect the entity returns. An associate is an entity over which the Company has significant influence. Significant influence is the power to participate in the financial and operating policy decisions of the investee, but is not control or joint control over those policies.
Joint ArrangementsA Joint arrangement is an arrangement of which two or more parties have joint control. Joint control is considered when there is contractually agreed sharing of control of an arrangement, which exists only when decisions about the relevant activities require the unanimous consent of the parties sharing control. Investments in joint arrangements are classified as either joint operations or joint venture. The classification depends on the contractual rights and obligations of each investor, rather than the legal structure of the joint arrangement. A joint operation is a joint arrangement whereby the parties that have joint control of the arrangement have rights to the assets, and obligations for the liabilities, relating to the arrangement. A joint venture is a joint arrangement whereby the parties that have joint control of the
arrangement have rights to the net assets of the arrangement.
Joint OperationsThe Company has joint operations within its Oil and gas segment and participates in several unincorporated joint operations which involve the joint control of assets used in oil and gas exploration and producing activities. The Company accounts for its share of assets and income and expenditure of joint operations in which it holds an interest. Liabilities in unincorporated joint ventures, where the Company is the operator, is accounted for at gross values (including share of other partners) with a corresponding receivable from the venture partners. These have been included in the financial statements under the appropriate headings. [Details of joint operations are set out in note 38(b)].
(X) Common Control transactionsA business combination involving entities or businesses under common control is a business combination in which all of the combining entities or businesses are ultimately controlled by the same party or parties both before and after the business combination and the control is not transitory. The transactions between entities under common control are specifically covered by Ind AS 103. Such transactions are accounted for using the pooling-of-interest method. The assets and liabilities of the acquired entity are recognised at their carrying amounts recorded in the parent entity’s consolidated financial statements with the exception of certain income tax and deferred tax assets. No adjustments are made to reflect fair values, or recognise any new assets or liabilities. The only adjustments that are made are to harmonise accounting policies. The components of equity of the acquired companies are added to the same components within the Company’s equity. The difference, if any, between the amounts recorded as share capital issued plus any additional consideration in the form of cash or other assets and the amount of share capital of the transferor is transferred to capital reserve. The Company’s shares issued in consideration for the acquired companies are recognised from the moment the acquired companies are included in these financial statements and the financial statements of the commonly controlled entities are combined, retrospectively, as if the transaction had occurred at the beginning of the earliest reporting period presented. However, the prior year comparative information is only adjusted for periods during which entities were under common control.
(Y) Exceptional itemsExceptional items are those items that management considers, by virtue of their size or incidence (including
weighted average number of equity shares outstanding for the effects of all dilutive potential equity shares.
(S) Buyers’ Credit/Suppliers’ Credit and vendor financingThe Company enters into arrangements whereby banks and financial institutions make direct payments to suppliers for raw materials and project materials. The banks and financial institutions are subsequently repaid by the Company at a later date providing working capital timing benefits. These are normally settled up to twelve months (for raw materials) and up to 36 months (for project materials). Where these arrangements are with a maturity of up to twelve months, the economic substance of the transaction is determined to be operating in nature and these are recognised as operational buyers’ credit/ suppliers’ credit (under Trade payables). Where these arrangements are with a maturity beyond twelve months and up to thirty six months, the economic substance of the transaction is determined to be financing in nature, and these are presented within borrowings in the balance sheet. Interest expense on these are recognised in the finance cost.
(T) Current and non-current classificationThe Company presents assets and liabilities in the balance sheet based on current / non-current classification.
An asset is classified as current when it satisfies any of the following criteria:
� it is expected to be realised in, or is intended for sale or consumption in, the Company’s normal operating cycle;
� it is held primarily for the purpose of being traded;
� it is expected to be realised within 12 months after the reporting date; or
� it is cash or cash equivalent unless it is restricted from being exchanged or used to settle a liability for at least 12 months after the reporting date.
All other assets are classified as non-current.
A liability is classified as current when it satisfies any of the following criteria:
� it is expected to be settled in the Company’s normal operating cycle;
� it is held primarily for the purpose of being traded;
� it is due to be settled within 12 months after the reporting date; or
� the Company does not have an unconditional right to defer settlement of the liability for at least 12 months after the reporting date. Terms of a liability that could, at the option of the counterparty, result in its settlement by the issue of equity instruments do not affect its classification.
All other liabilities are classified as non-current.
Deferred tax assets and liabilities are classified as non-current only.
(U) Borrowing costsBorrowing cost includes interest expense as per effective interest rate (EIR) and exchange differences arising from foreign currency borrowings to the extent they are regarded as an adjustment to the interest cost.
Borrowing costs directly relating to the acquisition, construction or production of a qualifying capital project under construction are capitalised and added to the project cost during construction until such time that the assets are substantially ready for their intended use i.e. when they are capable of commercial production.
Where funds are borrowed specifically to finance a qualifying capital project, the amount capitalised represents the actual borrowing costs incurred. Where surplus funds are available out of money borrowed specifically to finance a qualifying capital project, the income generated from such short-term investments is deducted from the total capitalised borrowing cost. If any specific borrowing remains outstanding after the related asset is ready for its intended use or sale, that borrowing then becomes part of general borrowing. Where the funds used to finance a project form part of general borrowings, the amount capitalised is calculated using a weighted average of rates applicable to relevant general borrowings of the Company during the year.
All other borrowing costs are recognised in the statement of profit and loss in the year in which they are incurred.
Capitalisation of interest on borrowings related to construction or development projects is ceased when substantially all the activities that are necessary to make the assets ready for their intended use are complete or when delays occur outside of the normal course of business.
EIR is the rate that exactly discounts the estimated future cash payments or receipts over the expected life of the financial liability or a shorter period, where
STANDALONE NOTES FORMING PART OF THE FINANCIAL STATEMENTSas at and for the year ended March 1 2020
STANDALONE NOTES FORMING PART OF THE FINANCIAL STATEMENTSas at and for the year ended March 1 2020
INTEGRATED REPORT MANAGEMENT REVIEW STATUTORY REPORTS FINANCIAL STATEMENTS
06-115 116-167 168-270 271-502

302 VEDANTA LIMITED INTEGRATED REPORT AND ANNUAL ACCOUNTS 2019-20 VEDANTA LIMITED INTEGRATED REPORT AND ANNUAL ACCOUNTS 2019-20 303
Operating lease payments are recognised as an expense in the statement of profit and loss on a straight-line basis over the lease term unless the payments are structured to increase in line with general inflation to compensate for the lessor’s expected inflationary cost increase.
Company as a lessorLeases in which the Company does not transfer substantially all the risks and rewards of ownership of an asset are classified as operating leases. Rental income from operating lease is recognised on a straight-line basis over the term of the relevant lease unless the payments are structured to increase in line with the general inflation to compensate for the lessor’s expected inflationary cost increase. Initial direct costs incurred in negotiating and arranging an operating lease are added to the carrying amount of the leased asset and recognised over the lease term on the same basis as rental income. Contingent rents are recognised as revenue in the period in which they are earned.
Leases are classified as finance leases when substantially all of the risks and rewards of ownership is transferred from the Company to the lessee. Amounts due from lessees under finance leases are recorded as receivables at the Company’s net investment in the leases. Finance lease income is allocated to accounting periods so as to reflect a constant periodic rate of return on the net investment outstanding in respect of the lease.
� Appendix C of Ind AS 12 – Uncertainty over Income Tax TreatmentsAppendix C of Ind AS 12 clarifies how to apply the recognition and measurement requirements in Ind AS 12 Income Taxes when there is uncertainty over income tax treatments. The clarification did not have a material effect on the Company’s financial statements so far as the recognition and measurement of income taxes is concerned. A consequential impact of the clarification is on the disclosure of contingent liabilities. The Company previously used to consider only those cases/matters for contingent liabilities wherever demand has been raised by the authorities/ initial assessment has been completed. The contingent liabilities have now been extrapolated to other years where a similar issue exists but formal demand has not been raised by tax authorities. Considering the impact of appendix C of Ind AS 12, the amounts of Income Tax disputes disclosed in note 35 of these financial statements would have been higher by ` 42 Crore as on April 01, 2019, as against the hitherto followed practice. As per the transitional provisions of Appendix C of Ind
AS 12, the Company has not restated comparative information.
� Other AmendmentsA number of other minor amendments to existing standards also became effective on April 01, 2019 and have been adopted by the Company. The adoption of these new accounting pronouncements did not have a material impact on the accounting policies, methods of computation or presentation applied by the Company.
(B) Standards issued but not yet effectiveThe new and amended standards and interpretations that are issued, but not yet effective, up to the date of issuance of the Company’s financial statements are not expected to have a significant impact on the Company’s financial statements. The Company has not early adopted any amendment, standard or interpretation that has been issued but is not yet effective.
3(c) SIGNIFICANT ACCOUNTING ESTIMATES AND JUDGEMENTSThe preparation of financial statements in conformity with Ind AS requires management to make judgements, estimates and assumptions that affect the application of accounting policies and the reported amounts of assets, liabilities, income, expenses and disclosures of contingent assets and liabilities at the date of these financial statements and the reported amounts of revenues and expenses for the years presented. These judgements and estimates are based on management’s best knowledge of the relevant facts and circumstances, having regard to previous experience, but actual results may differ materially from the amounts included in the financial statements.
Estimates and underlying assumptions are reviewed on an ongoing basis. Revisions to accounting estimates are recognised in the period in which the estimate is revised and future periods affected.
The information about significant areas of estimation uncertainty and critical judgements in applying accounting policies that have the most significant effect on the amounts recognised in the financial statements are as given below:
(A) Significant Estimates(i) Impact of COVID-19The outbreak of novel Coronavirus (COVID-19) pandemic globally and in India and the consequent lockdown restrictions imposed by national governments is causing significant disturbance and slowdown of economic activity across the globe. The commodity
but not limited to impairment charges and acquisition and restructuring related costs), should be disclosed separately to ensure that the financial information allows an understanding of the underlying performance of the business in the year, so as to facilitate comparison with prior periods. Also tax charges related to exceptional items and certain one-time tax effects are considered exceptional. Such items are material by nature or amount to the year’s result and require separate disclosure in accordance with Ind AS.
3(b) APPLICATION OF NEW STANDARDS AND AMENDMENTS(A)� The Company has adopted, with effect from April 01, 2019, the following new and revised standards and interpretations. Their adoption has not had any significant impact on the amounts reported in the financial statements.
� Ind AS 116 – LeasesInd AS 116, Leases, replaces the existing standard on accounting for leases, Ind AS 17, with effect from April 01, 2019. This standard introduces a single lessee accounting model and requires a lessee to recognise a ‘right of use asset’ (ROU) and a corresponding ‘lease liability’ for all leases. Lease costs are to be recognised in the statement of profit and loss over the lease term in the form of depreciation on the ROU asset and finance charges representing the unwinding of the discount on the lease liability. In contrast, the accounting requirements for lessors remain largely unchanged.
The Company acts as a lessee in lease arrangements mainly involving plant and machinery, office premises and other properties. The Company has elected to apply the modified retrospective approach on transition, and accordingly the comparative numbers have not been restated. For contracts in place as at April 01, 2019, the Company has continued to apply its existing definition of leases as under Ind AS 17 (“grandfathering”), instead of reassessing whether existing contracts are or contain a lease at that date. Further, the Company has elected to avail the exemption in Ind AS 116 from applying the requirements of Ind AS 116 to short-term leases of all assets that have a lease term of 12 months or less and leases for which the underlying asset is of low value. The lease payments associated with these leases are recognised as an expense on a straight-line basis over the lease term.
Transition to Ind AS 116 did not have a material effect on the Company’s financial statements.
Prior period accounting policies: easesDetermining hether an arrangement contains leaseAt inception of an arrangement, the Company determines whether the arrangement is or contains a lease. The arrangement is, or contains, a lease if fulfilment of the arrangement is dependent on the use of a specific asset or assets and the arrangement conveys a right to use the asset or assets, even if that right is not explicitly specified in an arrangement.
At inception or on reassessment of an arrangement that contains lease, the Company separates payments and other consideration required by the arrangement into those for the lease and those for other elements on the basis of their relative fair values. If the Company concludes for a finance lease that it is impracticable to separate the payments reliably, then an asset and a liability are recognised at an amount equal to the fair value of the underlying asset; subsequently the liability is reduced as payments are made and an imputed finance cost on the liability is recognised using the Company’s incremental borrowing rate.
Company as a lesseeA lease is classified at the inception date as a finance lease or an operating lease. A lease that transfers substantially all the risks and rewards incidental to ownership to the Company is classified as a finance lease.
Finance leases are capitalised at the commencement of the lease at the inception date fair value of the leased property or, if lower, at the present value of the minimum lease payments. Lease payments are apportioned between finance charges and reduction of the lease liability so as to achieve a constant rate of interest on the remaining balance of the liability. Finance charges are recognised in finance costs in the statement of profit and loss, unless they are directly attributable to qualifying assets, in which case they are capitalised in accordance with the Company’s policy on the general borrowing costs. Contingent rentals are recognised as expenses in the periods in which they are incurred.
A leased asset is depreciated over the useful life of the asset. However, if there is no reasonable certainty that the Company will obtain ownership by the end of the lease term, the asset is depreciated over the shorter of the estimated useful life of the asset and the lease term.
STANDALONE NOTES FORMING PART OF THE FINANCIAL STATEMENTSas at and for the year ended March 1 2020
STANDALONE NOTES FORMING PART OF THE FINANCIAL STATEMENTSas at and for the year ended March 1 2020
INTEGRATED REPORT MANAGEMENT REVIEW STATUTORY REPORTS FINANCIAL STATEMENTS
06-115 116-167 168-270 271-502

304 VEDANTA LIMITED INTEGRATED REPORT AND ANNUAL ACCOUNTS 2019-20 VEDANTA LIMITED INTEGRATED REPORT AND ANNUAL ACCOUNTS 2019-20 305
the mine using the unit of production method based on proved and probable reserves. The estimate of reserves is subject to assumptions relating to life of the mine and may change when new information becomes available. Changes in reserves as a result of factors such as production cost, recovery rates, grade of reserves or commodity prices could thus impact the carrying values of mining properties and leases and environmental and restoration provisions.
Management performs impairment tests when there is an indication of impairment. The impairment assessments are based on a range of estimates and assumptions, including:
Estimates/ assumptions Basis
Future production
proved and probable reserves, resource estimates (with an appropriate conversion factor) considering the expected permitted mining volumes and, in certain cases, expansion projects
Commodity prices
management’s best estimate benchmarked with external sources of information, to ensure they are within the range of available analyst forecast
Exchange rates management best estimate benchmarked with external sources of information
�Discount rates cost of capital risk-adjusted for the risk specific to the asset/ CGU
Details of impairment charge and the assumptions used and carrying value are disclosed in note 31 and 5 respectively.
(vi) Recoverability of deferred tax and other income tax assetsThe Company has carry forward tax losses, unabsorbed depreciation and MAT credit that are available for offset against future taxable profit. Deferred tax assets are recognised only to the extent that it is probable that taxable profit will be available against which the unused tax losses or tax credits can be utilised. This involves an assessment of when those assets are likely to reverse, and a judgement as to whether or not there will be sufficient taxable profits available to offset the assets. This requires assumptions regarding future profitability, which is inherently uncertain. To the extent assumptions regarding future profitability change, there can be an increase or decrease in the amounts recognised in respect of deferred tax assets and consequential impact in the statement of profit and loss.
The total deferred tax assets recognised in these financial statement (Refer Note 32) includes MAT credit
entitlements of ` 3,600 Crore (March 31, 2019: ` 3,971 Crore) which is expected to be utilised in the fourteenth and fifteenth year, the maximum permissible time period to utilise the MAT credits.
Additionally, the Company has tax receivables on account of refund arising on account of past amalgamation and relating to various tax disputes. The recoverability of these receivables involve application of judgement as to the ultimate outcome of the tax assessment and litigations. This pertains to the application of the legislation, which in certain cases is based upon management’s interpretation of country specific tax law, in particular India, and the likelihood of settlement. Management uses in-house and external legal professionals to make informed decision.
(vii) Copper operations in IndiaIn an appeal filed by the Company against the closure order of the Tuticorin Copper smelter by Tamil Nadu Pollution Control Board (“TNPCB”), the appellate authority National Green Tribunal (“NGT”) passed an interim order on May 31, 2013 allowing the copper smelter to recommence operations and appointed an Expert Committee to submit a report on the plant operations. Post the interim order, the plant recommenced operations on June 23, 2013. Based on Expert Committee’s report on the operations of the plant stating that the plant’s emission were within prescribed standards and based on this report, NGT ruled on August 08, 2013 that the Copper smelter could continue its operations and recommendations made by the Expert Committee be implemented in a time bound manner. The Company has implemented all of the recommendations. TNPCB has filed an appeal against the order of the NGT before the Supreme Court of India.
In the meanwhile, the application for renewal of Consent to Operate (CTO) for existing copper smelter, required as per procedure established by law was rejected by TNPCB in April 2018. Vedanta Limited has filed an appeal before the TNPCB Appellate Authority challenging the Rejection Order. During the pendency of the appeal, there were protests by a section of local community raising environmental concerns and TNPCB vide its order dated May 23, 2018 ordered closure of existing copper smelter plant with immediate effect. Further, the Government of Tamil Nadu, issued orders dated May 28, 2018 with a direction to seal the existing copper smelter plant permanently. The Company believes these actions were not taken in accordance with the procedure prescribed under applicable laws. Subsequently, the Directorate of Industrial Safety and Health passed orders dated May 30, 2018, directing the immediate suspension and revocation of the Factory
prices including oil have seen significant volatility with downward price pressures due to major demand centers affected by lockdown.
The Company is in the business of metals and mining, Oil & gas and generation of power which are considered as either essential goods and services or were generally allowed to continue to carry out the operations with adequate safety measures. The Company has taken proactive measures to comply with various regulations/guidelines issued by the Government and local bodies to ensure safety of its workforce and the society in general.
The Company has considered possible effects of COVID-19 on the recoverability of its investments, property, plant and equipment (PPE), inventories, loans and receivables, etc in accordance with Ind AS. The Company has considered forecast consensus, industry reports, economic indicators and general business conditions to make an assessment of the implications of the Pandemic. The Company has also performed sensitivity analysis on the assumptions used basis the internal and external information/ indicators of future economic condition. Based on the assessment, the Company has recorded necessary adjustments, including an impairment to the extent the carrying amount exceeds the recoverable amount and has disclosed the same as exceptional items (Refer Note 31).
The actual effects of COVID-19 could be different from what is presently assessed and would be known only in due course of time.
(ii) Oil and Gas reservesSignificant technical and commercial judgements are required to determine the Company’s estimated oil and natural gas reserves. Reserves considered for computing depletion are proved reserves for acquisition costs and proved and developed reserves for successful exploratory wells, development wells, processing facilities, distribution assets, estimated future abandonment cost and all other related costs. Reserves for this purpose are considered on working interest basis which are reassessed atleast annually. Details of such reserves are given in note 40(a).
Changes in reserves as a result of change in management assumptions could impact the depreciation rates and the carrying value of assets (refer note 5).
(iii) Carrying value of exploration and evaluation assetsExploration assets are assessed by comparing the carrying value to higher of fair value less cost of
disposal or value in use if impairment indicators, as contained in Ind AS 106, exists. Change to the valuation of exploration assets is an area of judgement. Further details on the Company’s accounting policies on this are set out in accounting policy above. The amounts for exploration and evaluation assets represent active exploration projects. These amounts will be written-off to the statement of profit and loss as exploration costs unless commercial reserves are established or the determination process is not completed and there are no indications of impairment. The outcome of ongoing exploration, and therefore whether the carrying value of exploration and evaluation assets will ultimately be recovered, is inherently uncertain.
Details of carrying values and impairment charge and the assumptions used are disclosed in note 5 and 31 respectively.
(iv) Carrying value of developing/producing oil and gas assetsManagement performs impairment tests on the Company’s developing/producing oil and gas assets where indicators of impairment are identified in accordance with Ind AS 36.
The impairment assessments are based on a range of estimates and assumptions, including:
Estimates/ assumptions Basis
Future production
proved and probable reserves, production facilities, resource estimates and expansion projects
Commodity prices
management’s best estimate benchmarked with external sources of information, to ensure they are within the range of available analyst forecast
Discount to price
management’s best estimate based on historical prevailing discount and updated sales contracts
Extension of PSC
granted till 2030 on the expected commercial terms (Refer Note 3(c)(A)(viii)
Discount rates cost of capital risk-adjusted for the risk specific to the asset/ CGU
Any subsequent changes to cash flows due to changes in the above mentioned factors could impact the carrying value of the assets.
Details of carrying values and impairment charge and the assumptions used are disclosed in note 5 and 31 respectively.
(v) Mining properties and leasesThe carrying value of mining property and leases is arrived at by depreciating the assets over the life of
STANDALONE NOTES FORMING PART OF THE FINANCIAL STATEMENTSas at and for the year ended March 1 2020
STANDALONE NOTES FORMING PART OF THE FINANCIAL STATEMENTSas at and for the year ended March 1 2020
INTEGRATED REPORT MANAGEMENT REVIEW STATUTORY REPORTS FINANCIAL STATEMENTS
06-115 116-167 168-270 271-502

306 VEDANTA LIMITED INTEGRATED REPORT AND ANNUAL ACCOUNTS 2019-20 VEDANTA LIMITED INTEGRATED REPORT AND ANNUAL ACCOUNTS 2019-20 307
expansion plant, could not be physically verified, anytime during the year, as the access to the plant is presently restricted. However, since operations are suspended and access to the plant restricted, any difference between book and physical quantities is unlikely to be material.
(viii) PSC ExtensionRajasthan locOn October 26, 2018, the Government of India (GoI), acting through the Directorate General of Hydrocarbons (DGH) granted its approval for a ten-year extension of the Production Sharing Contract (PSC) for the Rajasthan Block (RJ), with effect from May 15, 2020 subject to certain conditions. The GoI had granted the extension under the Pre-NELP Extension Policy, the applicability whereof to PSC for Rajasthan Block is sub-judice and pending before the Hon’ble Delhi High Court. The key conditions stated by DGH and the Company’s position is detailed below:
a ubmission o Audited Accounts and End o year statement:The Company and one of the joint operation partners have divergent views on the cost oil entitlement and therefore the End of Year statement for the year ended March 31, 2018 and March 31, 2019 and the Investment Multiple as at March 31, 2018 and as at March 31, 2019 could not be finalised. Consequentially, profit petroleum pertaining to the said Block for the year ended March 31, 2019 and March 31, 2020 and applicable Investment Multiple calculated based on management’s cost oil computation (resulting into Government’s share of profit petroleum @ 40% for DA-1 & DA-2 and @20% for DA-3 for FY 2019 & FY 2020), remains provisional. The computation is after considering relevant independent legal advice. Pending alignment with joint operation partner, the End of Year Statement for FY 2017-18 and FY 2018-19 as per Operator’s calculations have been submitted to DGH and the joint operation partner, during the relevant financial year.
Above condition for submission of audited accounts and End of Year Statement for adoption by Management Committee of the Block has been delinked by DGH vide letter dated December 03, 2019 as a pre-condition to PSC extension.
b Pro t Petroleum:DGH, in May 2018, raised a demand for the period up to March 31, 2017 for Government’s additional share of Profit Oil based on its computation of disallowance of cost incurred over the initially approved Field Development Plan (FDP) of pipeline project for ` 1,508 Crore (US$ 202 million) and retrospective re-allocation
of certain common costs between Development Areas (DAs) of Rajasthan Block aggregating to ` 2,723 Crore (US$ 364 million), representing share of the Company and its subsidiary. DGH vide it’s letter dated May 12, 2020, reiterated its demand only with respect to the retrospective re-allocation of certain common costs between Development Areas (DAs) of Rajasthan Block of ` 2,723 Crore (US$ 364 million) for the period upto March 31, 2017.
Subsequently, the Company in January 2020 received notifications from DGH on audit exceptions arising out of its audit for the FY 2017-18, which comprises of the consequential effects on profit oil due to the aforesaid matters and certain new matters on cost allowability plus interest aggregating to ` 4,828 Crore (US$ 645 million), representing share of the Company and its subsidiary, which have been suitably responded to by the Company.
The Company believes that it has sufficient as well as reasonable basis (pursuant to PSC provisions & approvals), supported by legal advice, for having claimed such costs and for allocating common costs between different DAs. In the Company’s opinion, these computations of the aforesaid demand / audit exceptions are not appropriate and the accounting adjustments sought for issues pertaining to Year 2007 and onwards are based on assumptions that are not in consonance with the approvals already in place. The Company’s view is also supported by independent legal opinion and the Company has been following the process set out in PSC to resolve these aforesaid matters. Thus, the Company sought for appointment of a sole expert for opining on the audit exceptions by a letter dated November 14, 2019 and thereafter on May 14, 2020, Company has issued a notice of Arbitration proceeding on the above matters and is confident of resolution of matters in its favour.
Further to above stated letter from GoI on October 26, 2018, in view of pending non-finalisation of the Addendum to PSC, the extraordinary situation prevailing on account of COVID-19 and non-finalisation of issues including the aforesaid DGH demand, the GoI granted, vide letter dated May 14, 2020, permission to the Company to continue petroleum operations in RJ-ON-90/I block, till the execution of the Addendum to PSC or for a period of three months from May 15, 2020, whichever is earlier.
In our view, above mentioned condition linked to PSC extension is untenable and has not resulted in creation of any liability and cannot be a ground for non-extension. In addition, all necessary procedures prescribed in the PSC including invocation of arbitration,
License and the Registration Certificate for the existing smelter plant.
The Company has appealed this before the National Green Tribunal (NGT). NGT vide its order on December 15, 2018 has set aside the impugned orders and directed the TNPCB to pass fresh orders for renewal of consent and authorisation to handle hazardous substances, subject to appropriate conditions for protection of environment in accordance with law.
The State of Tamil Nadu and TNPCB approached Supreme Court in Civil Appeals on January 02, 2019 challenging the judgement of NGT dated December 15, 2018 and the previously passed judgement of NGT dated August 08, 2013. The Supreme Court vide its judgement dated February 18, 2019 set aside the judgements of NGT dated December 15, 2018 and August 08, 2013 on the basis of maintainability alone and directed the Company to file an appeal in High court.
The Company has filed a writ petition before Madras High Court challenging the various orders passed against the Company in 2018 and 2013. Continous hearings were conducted from June 2019 to January 2020. Rejoinder and sur-rejoinder arguments on behalf of the parties concluded on January 08, 2020 and the orders have been reserved for judgement.
Further, in October 2019, the Company has filed a writ petition in Madras High court for allowing access to plant to undertake essential care and maintenance as due to lack of care and maintenance in the last 18 months, several structures such as pipelines, cable trays etc. are in corroded state and likely to get damaged. Management believes that assessment of physical damage, if any, can be carried out once it gets access to the plant. However, the same is not expected to be material.
As per the Company’s assessment, it is in compliance with the applicable regulations and expects to get the necessary approvals in relation to the existing operations.
The Company has carried out an impairment analysis for existing plant assets during the year ended March 31, 2020 considering the key variables and concluded that there exists no impairment. The Company has done an additional sensitivity analysis with commencement of operations of the existing plant in FY 2022-23 and noted that the recoverable amount of the assets would still be in excess of their carrying values.
The carrying value of the assets as at March 31, 2020 is ` 2,328 Crore.
Expansion Plant:Separately, the Company has filed a fresh application for renewal of the Environmental Clearance for the proposed Copper Smelter Plant 2 (Expansion Project) dated March 12, 2018 before the Expert Appraisal Committee of the MoEF wherein a sub-committee was directed to visit the Expansion Project site prior to prescribing the Terms of Reference.
In the meantime, the Madurai Bench of the High Court of Madras in a Public Interest Litigation held vide its order dated May 23, 2018 that the application for renewal of the Environmental Clearance for the Expansion Project shall be processed after a mandatory public hearing and in the interim, ordered the Company to cease construction and all other activities on site for the proposed Expansion Project with immediate effect. The Ministry of Environment and Forests (MoEF) has delisted the expansion project since the matter is sub-judice. Separately, SIPCOT vide its letter dated May 29, 2018, cancelled 342.22 acres of the land allotted for the proposed Expansion Project. Further the TNPCB issued orders on June 07, 2018 directing the withdrawal of the Consent to Establish (CTE) which was valid till March 31, 2023.
The Company has approached Madras High Court by way of writ petition challenging the cancellation of lease deeds by SIPCOT pursuant to which an interim stay has been granted. The Company has also filed Appeals before the TNPCB Appellate Authority challenging withdrawal of CTE by the TNPCB, the matter is pending for adjudication.
mpairment recognised during the yearFor the expansion plant, the project activities are on halt since May 2018. Further, the project EC for the expansion plant got expired on December 31, 2018 and fresh application is filed before the competent authority, however, the process will start only after reopening of the existing plant and after obtaining all statutory approvals, the timing of which is uncertain.
Keeping in view the above factors and the fact that value in use cannot be reasonably ascertained, the Company has carried out recoverability assessment of the items of property, plant and equipment, capital work-in-progress (CWIP) and capital advances. Based on the realisable value estimate of ` 288 Crore, the Company has recognised an impairment of ` 669 Crore (comprising of CWIP balances of ` 435 Crore, capital advances of ` 196 Crore and other assets of ` 38 Crore) during the year.
Property, plant and equipment of ` 1,473 Crore and inventories of ` 517 Crore, pertaining to existing and
STANDALONE NOTES FORMING PART OF THE FINANCIAL STATEMENTSas at and for the year ended March 1 2020
STANDALONE NOTES FORMING PART OF THE FINANCIAL STATEMENTSas at and for the year ended March 1 2020
INTEGRATED REPORT MANAGEMENT REVIEW STATUTORY REPORTS FINANCIAL STATEMENTS
06-115 116-167 168-270 271-502

308 VEDANTA LIMITED INTEGRATED REPORT AND ANNUAL ACCOUNTS 2019-20 VEDANTA LIMITED INTEGRATED REPORT AND ANNUAL ACCOUNTS 2019-20 309
compliance. In the event, the request for extension of timeline is not accepted, this could lead to levy of some penalties, the impact of which is not likely to be material.
(xii) Going ConcernConsidering the uncertainties caused due to COVID-19, the Company prepared its cash flow forecasts under various scenarios and has performed additional sensitivities on certain key assumptions. Based on such an analysis and assessment of its ability to raise additional capital, the Company continues to prepare its financial statements on a going concern basis.
(B) Significant Judgement(i) ContingenciesIn the normal course of business, contingent liabilities may arise from litigation, taxation and other claims against the Company. A provision is recognised when the Company has a present obligation as a result of past events and it is probable that the Company will be required to settle that obligation.
Where it is management’s assessment that the outcome cannot be reliably quantified or is uncertain, the claims are disclosed as contingent liabilities unless the likelihood of an adverse outcome is remote. Such liabilities are disclosed in the notes but are not provided for in the financial statements.
When considering the classification of legal or tax cases as probable, possible or remote, there is judgement involved. This pertains to the application of the legislation, which in certain cases is based upon management’s interpretation of country specific applicable law, in particular India, and the likelihood of settlement. Management uses in-house and external legal professionals to make informed decision.
Although there can be no assurance regarding the final outcome of the legal proceedings, the Company does not expect them to have a materially adverse impact on the Company’s financial position or profitability. These are set out in Note 35.
(ii) Revenue recognition and receivable recovery in relation to the power divisionIn certain cases, the Company’s power customers are disputing various contractual provisions of Power Purchase Agreements (PPA). Significant judgement is required in both assessing the tariff to be charged under the PPA in accordance with Ind AS 115 and to assess the recoverability of withheld revenue currently accounted for as receivables.
In assessing this critical judgement, management considered favourable external legal opinions the Company has obtained in relation to the claims. In addition the fact that the contracts are with government owned companies implies the credit risk is low [refer note 7 (c)]
(iii) Exceptional items:Exceptional items are those items that management considers, by virtue of their size or incidence (including but not limited to impairment charges and acquisition and restructuring related costs), should be disclosed separately to ensure that the financial information allows an understanding of the underlying performance of the business in the year, so as to facilitate comparison with prior periods. Also tax charges related to exceptional items and certain one-time tax effects are considered Exceptional. Such items are material by nature or amount to the year’s result and require separate disclosure in accordance with Ind AS.
The determination as to which items should be disclosed separately requires a degree of judgement. The details of exceptional items are set out in note 31.
3(d) BUSINESS COMBINATION AND OTHERS:A. Global coke - Acquisition of global coke plantOn July 28, 2019, the Company acquired Sindhudurg plant of Global Coke Limited which was under liquidation as per the Insolvency and Bankruptcy Code 2016 (including all amendments for the time being in force) for a cash consideration of ` 33 Crore. The assets acquired mainly included Land, Building and Plant & Machinery of similar value as the cash consideration, and hence no goodwill was recorded. The acquisition will complement backward integration opportunity for the Company’s existing pig iron division and also increase Company’s footprint in met coke market in south western part of India. Detailed disclosure of fair value of the identifiable assets and liabilities of Sindhudurg plant has not been provided as the same is not material.
Acquisition costs related to same were not material.
B. Acquisition of new hydrocarbon blocksIn August 2018, the Company was awarded 41 hydrocarbon blocks out of 55 blocks auctioned under the Open Acreage Licensing Policy (OALP) by Government of India (GOI). The blocks awarded to the Company comprise of 33 onshore and 8 offshore blocks. The Company will share a specified proportion of the net revenue from each block with GOI and has entered
in respect of the stated audit observation have also been fulfilled. Accordingly, in our view, the PSC extension approval granted vide DGH letter dated October 26, 2018 upholds with all conditions addressed and no material liability would devolve upon the Company.
Ravva locThe Government of India (GoI) has granted its approval for a ten-year extension of PSC for Ravva Block with effect from October 28, 2019, in terms of the provision of the “Policy on the Grant of the extension to Production Sharing Contract Signed by Government awarding small, medium-sized and discovered field to private joint ventures” dated March 28, 2016. The PSC addendum recording this extension has been executed by all parties.
The Ravva Extension Policy, amongst others, provides for an increased share of profit petroleum of 10% for the GoI during the extended term of the Ravva PSC and payment of royalty and cess as per prevailing rate in accordance with the PNG Rules, 1959 and OIDB Act. Under the Ravva PSC, – the Company’s oil and gas business is entitled to recover 100% of cost of production and development from crude oil and natural gas sales before any profit is allocated among the parties. Cost recovery for exploration cost during extension period shall be governed as per the provision of Office Memorandum 2013, 2019 issued by MoPNG on exploration in mining lease area post expiry of the exploration period.
(ix) Impact of Taxation Laws (Amendment) Act, 2019Pursuant to the introduction of Section 115BAA of the Indian Income Tax Act, 1961 which is effective April 01, 2019, companies in India have the option to pay corporate income tax at the rate of 22% plus applicable surcharge and cess as against the earlier rate of 30% plus applicable surcharge and cess, subject to certain conditions like, the Company has to forego all benefits like tax holidays, brought forward losses generated through tax incentives/additional depreciation and outstanding MAT credit. Considering all the provisions under Section 115BAA and based on the expected timing of exercising of the option under Section 115BAA, the Company had re-measured its deferred tax balances as at March 31, 2019 leading to a deferred tax credit of ` 834 Crore being recognised during the financial year. This requires assumptions regarding future profitability, which is inherently uncertain. To the extent assumptions regarding future profitability change, there can be increase or decrease in the amounts recognised.
(x) Assessment of impairment of assets at Aluminium divisionConsidering lower sales realisation, an impairment trigger has been identified in the aluminium division of the Company. The impairment assessments are based on a range of estimates and assumptions, including:
Estimates/ assumptions Basis
Future production
Production facilities and expansion projects
Commodity prices
management’s best estimate benchmarked with external sources of information, to ensure they are within the range of available analyst forecast
Discount rates cost of capital risk-adjusted for the risk specific to the asset/ CGU
The Company has carried out an impairment analysis, based on value in use approach, considering the key variables and concluded that there exists no impairment. The Company has carried out sensitivity analysis on key assumptions including commodity price, discount rate and delay in expansion of refinery. Based on sensitivity analysis, the recoverable amount is still expected to exceed the carrying value as at March 31, 2020 of ` 36,992 Crore.
(xi) Flue-gas Desulfuri ationMinistry of Environment, Forest and Climate Change (MOEF&CC) has revised emission norms for coal-based power plants in India. Accordingly, both captive and independent coal-based power plants in India are required to comply with these revised norms for reduction of sulphur oxide (SOx) emissions for which the current plant infrastructure is to be modified or new equipment’s have to be installed. Timelines for compliance to the revised norm for various plants in the Company range from June 2020 to March 2022. Different power plants are at different stages of the implementation process. However, it is unlikely that the implementation would be completed by the stipulated date.
CPCB vide notification dated May 20, 2020 published on its website has imposed a penalty of ` 18 Lacs per month per non-compliant unit and any further directions based on the periodic review of compliance status.
Power plants of the Company are required to comply with the revised norms in the coming year(s). Company’s respective operations have been engaging with the concerned authorities to extend the timeline for
STANDALONE NOTES FORMING PART OF THE FINANCIAL STATEMENTSas at and for the year ended March 1 2020
STANDALONE NOTES FORMING PART OF THE FINANCIAL STATEMENTSas at and for the year ended March 1 2020
INTEGRATED REPORT MANAGEMENT REVIEW STATUTORY REPORTS FINANCIAL STATEMENTS
06-115 116-167 168-270 271-502

310 VEDANTA LIMITED INTEGRATED REPORT AND ANNUAL ACCOUNTS 2019-20 VEDANTA LIMITED INTEGRATED REPORT AND ANNUAL ACCOUNTS 2019-20 311
The following table presents revenue and profit information and certain assets and liabilities information regarding the Company’s business segments as at and for the year ended March 31, 2020 and March 31, 2019 respectively.
For the year ended March 31, 2020(` in Crore)
ParticularsBusiness Segments
Oil and Gas Aluminium Copper Iron Ore Power Eliminations Total
RevenueExternal revenue 6,756 19,022 5,972 3,461 206 - 35,417 Inter segment revenue - - - 2 - (2) - Segment revenue 6,756 19,022 5,972 3,463 206 (2) 35,417ResultsEBITDA a 3,884 1,539 (234) 925 (118) - 5,996Depreciation, depletion and amortisation expense
1,478 1,356 200 101 129 - 3,264
Other income b - 54 2 6 12 - 74Segment Results 2,406 237 (432) 830 (235) - 2,806Less: Unallocated expenses 122 Less: Finance costs 3,328 Add: Other income (excluding exchange difference and deferred grant)
2,749
Add: Net exceptional loss (12,568)Net loss before tax (10,463)Other informationSegment Assets 10,900 42,792 5,865 2,549 3,342 65,448 Financial asset investments 62,905 Deferred tax assets 3,464 Income tax assets (net of provisions)
1,682
Cash & cash equivalents (including other bank balances & bank deposits)
2,193
Others 7,222 Total Assets 139,450 Segment Liabilities 8,501 15,369 4,155 1,098 156 29,279 Borrowings 36,569 Income tax liabilities (net) 46 Others 3,661 Total Liabilities 69,555 Capital Expenditure c 2,627 1,182 61 102 5 - 3,980 Impairment charge - net / provision d
8,273 669 - 12,335
a) EBITDA is a non-GAAP measure.
b) Amorisation of duty benefits relating to assets recognised as government grant.
c) �Total Capital expenditure includes capital expenditure of ` 3 Crore not allocable to any segment. It also includes acquisition through business combination.
d) �Total of Impairment charge - net / provision includes net impairment charge on investment in subsidiaries of ` 3,393 Crore not allocable to any segment (Refer Note 31).
into 41 separate revenue sharing contracts (RSC) on October 01, 2018.
The bid cost of ` 4,122 Crore represents Company’s total committed capital expenditure on the blocks for the committed work programmes during the exploration phase. The Company has provided bank guarantees for minimum work programme commitments amounting to ` 2,268 Crore for the 41 exploration blocks. These have been disclosed in note 35.
In March 2019, the Company has been awarded 2 Contract Areas out of total 25 Contract Areas auctioned under Round II of the Discovered Small Field Policy (DSF) by Government of India (GOI). Both the Contract Areas awarded are onland fields. The Company will share a specified proportion of the revenue from each block with GOI and has entered into 2 separate Revenue Sharing Contracts (RSC) on March 07, 2019. There is no commitment for minimum work programme in these blocks.
In July 2019, the Company has been awarded 10 hydrocarbon blocks out of 32 blocks awarded under round II & III of Open Acreage Licensing Policy (OALP) by Government of India (GoI). The blocks awarded to the Company comprise of 7 onshore and 3 offshore blocks. To effect the transaction, the Company has entered into revenue sharing contracts ( RSCs ) with the GoI on July 16, 2019. The bid cost of ` 1,761 Crore represents the Company’s estimated cost of committed work programme in the blocks during the initial exploration phase. The Company has provided bank guarantees for minimum work programme commitments amounting to ` 512 Crore for the 10 exploration blocks.
C. Merger of ESL and VSLDuring the current year, Hon’ble National Company Law Tribunal, Kolkata Bench vide its Order dated January 31, 2020 approved the Scheme of Amalgamation of Vedanta Star Limited (VSL) into its subsidiary Electrosteel Steels Limited (ESL). Post the amalgamation becoming effective on March 25, 2020, the Company directly holds 95.49% in ESL.
4 SEGMENT INFORMATIONA) Description of segment and principal activitiesThe Company is a diversified natural resource company engaged in exploring, extracting and processing minerals and oil and gas. The Company produces oil and gas, aluminium, copper, iron ore and power. The Company has five reportable segments: oil and gas, aluminium, copper, iron ore and power. The management of the Company is organised by its main products: oil and gas, aluminium, copper, iron ore and power. Each of the reportable segments derives its revenues from these main products and hence these have been identified as reportable segments by the Company’s Chief Operating Decision Maker (“CODM”).
Segment Revenue, Results, Assets and Liabilities include the respective amounts identifiable to each of the segments and amount allocated on a reasonable basis. Unallocated expenditure consist of common expenditure incurred for all the segments and expenses incurred at corporate level. The assets and liabilities that cannot be allocated between the segments are shown as unallocated assets and unallocated liabilities respectively.
The accounting policies of the reportable segments are the same as the Company’s accounting policies described in Note 3. Earnings before Interest, Tax and Depreciation & Amortisation (EBITDA) are evaluated regularly by the CODM, in deciding how to allocate resources and in assessing performance. The operating segments reported are the segments of the Company for which separate financial information is available. The Company’s financing (including finance costs and finance income) and income taxes are reviewed on an overall basis and are not allocated to operating segments.
Pricing between operating segments are on an arm’s length basis in a manner similar to transactions with third parties.
STANDALONE NOTES FORMING PART OF THE FINANCIAL STATEMENTSas at and for the year ended March 1 2020
STANDALONE NOTES FORMING PART OF THE FINANCIAL STATEMENTSas at and for the year ended March 1 2020
INTEGRATED REPORT MANAGEMENT REVIEW STATUTORY REPORTS FINANCIAL STATEMENTS
06-115 116-167 168-270 271-502

312 VEDANTA LIMITED INTEGRATED REPORT AND ANNUAL ACCOUNTS 2019-20 VEDANTA LIMITED INTEGRATED REPORT AND ANNUAL ACCOUNTS 2019-20 313
B) Geographical segment analysisThe following table provides an analysis of the Company’s sales by region in which the customer is located, irrespective of the origin of the goods.
(` in Crore)
Geographical SegmentYear ended
March 31, 2020Year ended
March 31, 2019
Revenue by geographical segmentIndia 19,013 19,636 China 839 1,797 UAE 24 41 Malaysia 5,341 3,875 Others 10,200 12,749 Total 35,417 38,098
The following is an analysis of the carrying amount of non-current assets, excluding deferred tax assets and financial assets, analysed by the geographical area in which the assets are located:
(` in Crore)
Carrying Amount of Segment AssetsAs at
March 31, 2020As at
March 31, 2019
India 53,158 61,939Total 53,158 61,939
C) Information about major customersRevenue from one customer amounted to ` 3,589 Crore (March 31, 2019: one customer, ` 5,077 Crore), arising from sales made in the Aluminium and Copper segment. No other customer contributed to more than 10% of revenues.
D) Disaggregation of revenueBelow table summarises the disaggregated revenue from contract with customers:
(` in Crore)
ParticularsYear ended
March 31, 2020Year ended
March 31, 2019
Oil 5,853 6,763Gas 447 300Aluminium products 18,145 19,328Copper Cathode 4,291 5,375Iron Ore 1,482 693Metallurgical coke 66 57Pig Iron 1,845 2,062Power 205 299Others 2,791 3,234Revenue from contracts with customers* 35,125 38,111Gains/(losses) from provisionally priced contracts under Ind AS 109 (346) (13)JV partner's share of the exploration costs approved under the OM (Refer Note 26A) 638 -Total Revenue 35,417 38,098
*includes revenues from sale of services aggregating to ` 431 Crore (FY 2018-19: ` 338 Crore) which is recorded over a period of time and the balance revenue is recognised at a point in time.
For the year ended March 31, 2019(` in Crore)
ParticularsBusiness Segments
Oil and Gas Aluminium Copper Iron Ore Power Eliminations Total
RevenueExternal revenue 7,104 21,000 6,833 2,909 252 - 38,098Inter segment revenue - - - 2 - (2) -Segment revenue 7,104 21,000 6,833 2,911 252 (2) 38,098ResultsEBITDA a 4,119 1,246 (214) 622 (195) - 5,578Depreciation, depletion and amortisation expense
1,531 1,285 197 105 125 - 3,243
Other income b - 53 2 6 11 - 72Segment Results 2,588 14 (409) 523 (309) - 2,407Less: Unallocated expenses 70Less: Finance costs 3,757Add: Other income (excluding exchange difference and deferred grant)
6,043
Add: Net exceptional gain 324Net profit before tax 4,947Other informationSegment Assets 16,299 45,101 7,141 2,927 3,321 - 74,789Financial asset investments 68,582Income tax assets (net of provisions)
2,175
Cash & cash equivalents (including other bank balances & bank deposits)
3,891
Others 1,430Total Assets 150,867Segment Liabilities 6,961 17,499 3,743 1,235 162 29,600Borrowings 42,204Income tax liabilities (net) 46Others 1,137Total Liabilities 72,987Capital Expenditure c 2,274 1,199 291 37 2 3,806Impairment reversal/(charge) - net / provision d
261 - - - - 265
a) EBITDA is a non-GAAP measure
b) Amorisation of duty benefits relating to assets recognised as government grant.
c) Total Capital expenditure includes capital expenditure of ` 3 Crore not allocable to any segment.
d) �Total of Impairment reversal/(charge) - net / provision includes net impairment reversal on investment in subsidiaries of ` 4 Crore not allocable to any segment.
STANDALONE NOTES FORMING PART OF THE FINANCIAL STATEMENTSas at and for the year ended March 1 2020
STANDALONE NOTES FORMING PART OF THE FINANCIAL STATEMENTSas at and for the year ended March 1 2020
INTEGRATED REPORT MANAGEMENT REVIEW STATUTORY REPORTS FINANCIAL STATEMENTS
06-115 116-167 168-270 271-502

314 VEDANTA LIMITED INTEGRATED REPORT AND ANNUAL ACCOUNTS 2019-20 VEDANTA LIMITED INTEGRATED REPORT AND ANNUAL ACCOUNTS 2019-20 315
Details of Right of Use (ROU) Assets(` in Crore)
Land BuildingPlant and
Equipment Total
ROU asset as at April 01, 2019 184 224 - 408 Additions 94 35 334 463 Deductions - (196) - (196)Depreciation (20) (34) (18) (72)Impairment (22) - - (22)Exchange difference - 6 10 16 Net Book Value/Carrying amount as at March 31, 2020 236 35 326 597
Intangible Assets(` in Crore)
Software License Mining Rights Total
Gross BlockAs at April 1, 2018 247 227 474 Additions 13 - 13 Transfers from Property, Plant and Equipment 1 - 1 Disposals/ Adjustments (4) - (4)Exchange differences 9 - 9 As at March 31, 2019 266 227 493 Additions 18 - 18 Transfers from Property, Plant and Equipment 1 - 1 Disposals/ Adjustments - - - Exchange differences 15 - 15 As at March 31, 2020 300 227 527 Accumulated amortisation and impairmentAs at April 1, 2018 212 218 430 Charge for the year 22 1 23 Disposals/ Adjustments (3) - (3)Transfers from Property, Plant and Equipment 1 - 1 Exchange differences 8 - 8 As at March 31, 2019 240 219 459 Charge for the year 23 - 23 Disposals/ Adjustments - - - Transfers from Property, Plant and Equipment - - - Exchange differences 14 - 14 As at March 31, 2020 277 219 496 Net Book Value/Carrying amountAs at April 1, 2018 35 9 44 As at March 31, 2019 26 8 34 As at March 31, 2020 23 8 31
Notes:
a) Plant and equipment include refineries, smelters, power plants, railway sidings, ships, aircraft, river fleet and related facilities.
b) During the year ended March 31, 2020, interest capitalised was ` 673 Crore (March 31, 2019: ` 567 Crore).
c) �Certain property, plant and equipment are pledged as collateral against borrowings, the details related to which have been described in Note 17 on “Borrowings”.
d) �In accordance with the exemption given under Ind AS 101, which has been exercised by the Company, a first time adopter can continue its previous GAAP policy for accounting for exchange differences arising from translation of long-term foreign currency monetary items recognised in the previous GAAP financial statements for the period ending immediately before the beginning of the first Ind AS financial reporting period i.e. April 01, 2016.
5. P
RO
PER
TY,
PLA
NT
AN
D E
QU
IPM
ENT,
INTA
NG
IBLE
AS
SET
S, C
AP
ITA
L W
OR
K-IN
-PR
OG
RE
SS
AN
D E
XP
LOR
ATIO
N IN
TAN
GIB
LE
AS
SET
S U
ND
ER D
EV
ELO
PM
ENT
(` in
Cro
re)
Par
ticu
lars
Pro
pert
y, P
lant
and
equ
ipm
ent
Cap
ital
W
ork-
in-
prog
ress
(C
WIP
)
Expl
orat
ion
inta
ngib
le
asse
ts
unde
r de
velo
pem
nt
Tota
l inc
ludi
ng
capi
tal w
ork-
in-p
rogr
ess
and
expl
orat
ion
inta
ngib
le
asse
ts u
nder
de
velo
pmen
tFr
eeho
ld
land
Bui
ldin
gsPl
ant a
nd
equi
pmen
tM
inin
g pr
oper
ty
Oil
& ga
s pr
oduc
ing
faci
litie
s
Furn
itur
e an
d fi
xtur
esV
ehic
les
Offi
ce
equi
pmen
t
Rig
ht
of U
se
asse
tsTo
tal
Gro
ss B
lock
As
at A
pril
01, 2
018
1,12
36,
734
38,9
7126
25,6
5316
650
354
-73
,077
11,1
9029
,278
113,
545
Addi
tion
s3
1537
9-
153
58
22-
585
2,63
547
83,
698
Tran
sfer
s /
Recl
assi
ficat
ions
954
1,22
0-
16,8
382
237
8-
18,3
6811
,418
(29,
787)
(1)
Dis
posa
ls/
Adju
stm
ents
-(1
4)(5
25)
--
-(8
)(9
)-
(556
)(2
)-
(558
)Ex
plor
atio
n co
sts
wri
tten
-off
(R
efer
Not
e 30
)-
--
--
--
--
--
(48)
(48)
Exch
ange
diff
eren
ces
871
366
-1,
432
5-
11-
1,89
3(8
7)2,
159
3,96
5A
s at
Mar
ch 3
1, 2
019
1,14
36,
860
40,4
1126
44,0
7617
828
738
6-
93,3
6725
,154
2,08
012
0,60
1RO
U a
sset
s as
at
Apri
l 01,
201
9-
--
--
--
-40
840
8-
-40
8Ad
diti
ons
748
733
-10
76
2633
463
1,42
32,
450
351
4,22
4Ac
quis
itio
n th
roug
h bu
sine
ss
com
bina
tion
(Ref
er N
ote
3(d)
(A)
127
14-
--
--
-33
--
33
Tran
sfer
s /
Recl
assi
ficat
ions
h(3
35)
4084
7-
778
126
4-
1,36
1(1
,720
)9
(350
)D
ispo
sals
/ Ad
just
men
ts-
(6)
(269
)-
(9)
(1)
(10)
(4)
(224
)(5
23)
--
(523
)Ex
plor
atio
n co
sts
wri
tten
-off
(R
efer
Not
e 30
)-
--
--
--
--
--
(1)
(1)
Exch
ange
diff
eren
ces
1195
524
-3,
641
7-
1919
4,31
61,
301
190
5,80
7A
s at
Mar
ch 3
1, 2
020
838
7,04
442
,260
2648
,593
191
329
438
666
100,
385
27,1
852,
629
130,
199
Acc
umul
ated
dep
reci
atio
n,
depl
etio
n, a
mor
tisa
tion
and
im
pair
men
tA
s at
Apr
il 01
, 201
811
52,
174
8,96
626
24,2
2499
2831
3-
35,9
4580
421
,295
58,0
44C
harg
e fo
r th
e ye
ar11
232
1,78
9-
1,16
118
631
-3,
248
--
3,24
8D
ispo
sals
/ A
djus
tmen
ts-
(14)
(387
)-
--
(5)
(8)
-(4
14)
--
(414
)Im
pair
men
t ch
arge
/ (r
ever
sal)
for
the
year
(not
e 31
)-
--
-(2
61)
--
--
(261
)-
-(2
61)
Tran
sfer
s /
Recl
assi
ficat
ions
-42
(95)
-12
,071
248
2-
12,0
7010
,308
(22,
379)
(1)
Exch
ange
diff
eren
ces
665
324
-1,
400
2-
10-
1,80
7(1
06)
1,58
13,
282
As
at M
arch
31,
201
913
22,
499
10,5
9726
38,5
9512
177
348
-52
,395
11,0
0649
763
,898
ROU
ass
ets
as a
t Ap
ril 0
1, 2
019
--
--
--
--
--
--
-C
harg
e fo
r th
e ye
ar5
203
1,65
5-
1,29
122
2327
723,
298
--
3,29
8D
ispo
sals
/ A
djus
tmen
ts-
-(4
8)-
-(1
)(7
)(4
)(2
8)(8
8)-
-(8
8)Im
pair
men
t ch
arge
for
the
yea
r (n
ote
31)
-17
--
3,61
5-
--
223,
654
4,11
597
78,
746
Tran
sfer
s /
Recl
assi
ficat
ions
--
(7)
--
-7
--
--
--
Exch
ange
diff
eren
ces
993
480
-3,
431
6-
173
4,03
91,
037
965,
172
As
at M
arch
31,
202
014
62,
812
12,6
7726
46,9
3214
810
038
869
63,2
9816
,158
1,57
081
,026
Net
Boo
k Va
lue/
Car
ryin
g am
ount
As a
t Ap
ril 0
1, 2
018
1,00
84,
560
30,0
05-
1,42
967
2241
-37
,132
10,3
867,
983
55,5
01As
at
Mar
ch 3
1, 2
019
1,01
14,
361
29,8
14-
5,48
157
210
38-
40,9
7214
,148
1,58
356
,703
As
at M
arch
31,
202
069
24,
232
29,5
83-
1,66
143
229
5059
737
,087
11,0
271,
059
49,1
73
STANDALONE NOTES FORMING PART OF THE FINANCIAL STATEMENTSas at and for the year ended March 1 2020
STANDALONE NOTES FORMING PART OF THE FINANCIAL STATEMENTSas at and for the year ended March 1 2020
INTEGRATED REPORT MANAGEMENT REVIEW STATUTORY REPORTS FINANCIAL STATEMENTS
06-115 116-167 168-270 271-502

316 VEDANTA LIMITED INTEGRATED REPORT AND ANNUAL ACCOUNTS 2019-20 VEDANTA LIMITED INTEGRATED REPORT AND ANNUAL ACCOUNTS 2019-20 317
Particulars
As at March 31, 2020 As at March 31, 2019
No.Amount
(` in Crore) No.Amount
(` in Crore)
- �Sterlite Ports Limited, of ` 2 each (including 6 shares held jointly with nominees)
2,50,000 0 2,50,000 0
- �Talwandi Sabo Power Limited, of ` 10 each (including 6 shares held jointly with nominees)
3,20,66,09,692 3,207 3,20,66,09,692 3,207
- Sesa Resources Limited, of ` 10 each c 12,50,000 757 12,50,000 757- Bloom Fountain Limited, of US$ 1 each 2,20,10,00,001 14,734 2,20,10,00,001 14,734Less: Reduction pursuant to merger c (14,320) 414 (14,320) 414- �MALCO Energy Limited of ` 2 each
(including 6 shares held jointly with nominees)
2,33,66,406 116 2,33,66,406 116
Less: Reduction pursuant to merger c (23) 93 (23) 93- �THL Zinc Ventures Limited of US$ 100
each1,00,001 46 1,00,001 46
Less: Reduction pursuant to merger c (46) 0 (46) 0- THL Zinc Holdings BV of EURO 1 each 37,38,000 23 37,38,000 23Less: Reduction pursuant to merger c (23) 0 (23) 0- �Vedanta Star Limited of ` 10 each
(including 6 shares held jointly with nominees) d
- - 1,96,17,256 1,770
- �Electrosteel Steels Limited of ` 10 each (including 6 shares held jointly with nominees) d
1,76,55,53,040 1,770 - -
Associate companies - unquoted- �Gaurav Overseas Private Limited, of
` 10 each3,23,000 0 3,23,000 0
Joint venture - unquoted- �Rampia Coal Mines and Energy Private
Limited, of ` 1 each2,72,29,539 3 2,72,29,539 3
Investment in equity shares at fair value through other comprehensive incomeQuoted- �Sterlite Technologies Limited, of ` 2
each (including 60 shares held jointly with nominees)
47,64,295 30 47,64,295 104
Unquoted- �Sterlite Power Transmission Limited,
of ` 2 each (including 12 shares held jointly with nominees)
9,52,859 11 9,52,859 11
- Goa Shipyard Limited of ` 10 each 2,50,828 0 2,50,828 0(b) Investment in preference shares of
subsidiary companies - at costSubsidiary companies – Unquoted- �Bloom Fountain Limited, 0.25%
Optionally Convertible Redeemable Preference shares of US$ 1 each
18,59,900 907 18,59,900 907
- �Bloom Fountain Limited, 0.25% Optionally Convertible Redeemable Preference shares of US$ 100 each
3,60,500 215 3,60,500 215
�Accordingly, foreign currency exchange differences arising on translation/settlement of long-term foreign currency monetary items acquired before April 01, 2016 pertaining to the acquisition of a depreciable asset amounting to ` 13 Crore loss (March 31, 2019: ` 2 Crore loss) is adjusted to the cost of respective item of property, plant and equipment.
e) �Property, Plant and Equipment, Capital work-in-progress and exploration and evaluation assets net block includes share of jointly owned assets with the joint venture partners ` 6,229 Crore (March 31, 2019: ` 12,211 Crore). Due to the reasons mentioned in note 3(c)(A)(viii), in the previous year, the Company has recomputed its reserves till 2030 and has reclassified exploration costs of ` 4,071 Crore to property plant and equipment and ` 3,362 Crore to capital work-in-progress.
f) Reconciliation of depreciation, depletion and amortisation expense
(` in Crore)
ParticularsYear ended
March 31, 2020Year ended
March 31, 2019
Depreciation/Depletion/Amortisation expense on:� Property, Plant and equipment (Including ROU assets) 3,298 3,248� Intangible assets 23 23As per Property, Plant and Equipment and Intangible assets schedule 3,321 3,271Less: Cost allocated to joint ventures (57) (28)As per Statement of Profit and Loss 3,264 3,243
g) �Freehold Land includes ` 146 Crore (March 31, 2019 ` 129 Crore), accumulated amortisation of ` 127 Crore (March 31, 2019 ` 112 Crore), which is available for use during the lifetime of the Production Sharing Contract of the respective Oil and Gas blocks and the title deed for the same is in the name of the licensee of the block.
h) �A parcel of land aggregating to ` 349 Crore relating to Iron Ore business has been reclassified during the year, due to existing litigation, to Financial Assets and later impaired (Refer Note 31) and ` 1 Crore transferred to intangible assets from Capital Work-in-progress.
6 FINANCIAL ASSETS: INVESTMENTSA) Non-current Investments
Particulars
As at March 31, 2020 As at March 31, 2019
No.Amount
(` in Crore) No.Amount
(` in Crore)
(a) Investment in equity shares - at cost/deemed cost a
Subsidiary companiesQuoted- �Hindustan Zinc Limited, of ` 2/-each b 2,74,31,54,310 44,398 2,74,31,54,310 44,398Unquoted- �Bharat Aluminium Company Limited,
of ` 10/- each (including 5 shares held jointly with nominees) b
11,25,18,495 553 11,25,18,495 553
- �Monte Cello BV, Netherlands, of Euro 453.78 each
40 204 40 204
Less: Reduction pursuant to merger c (204) 0 (204) 0- �Sterlite (USA) Inc., of US$.01 per share
(` 42.77 at each year end)100 0 100 0
- �Cairn India Holdings Limited (CIHL) of GBP 1 each, fully paid up
42,08,10,062 28,873 42,08,10,062 28,873
Less: Reduction pursuant to merger c (15,067) 13,806 (15,067) 13,806- �Vizag General Cargo Berth Private
Limited, of ` 10 each (including 6 shares held jointly with nominees)
3,21,08,000 32 3,21,08,000 32
- �Paradip Multi Cargo Berth Private Limited, of ` 10 each (including 6 shares held jointly with nominees)
10,000 0 10,000 0
STANDALONE NOTES FORMING PART OF THE FINANCIAL STATEMENTSas at and for the year ended March 1 2020
STANDALONE NOTES FORMING PART OF THE FINANCIAL STATEMENTSas at and for the year ended March 1 2020
INTEGRATED REPORT MANAGEMENT REVIEW STATUTORY REPORTS FINANCIAL STATEMENTS
06-115 116-167 168-270 271-502

318 VEDANTA LIMITED INTEGRATED REPORT AND ANNUAL ACCOUNTS 2019-20 VEDANTA LIMITED INTEGRATED REPORT AND ANNUAL ACCOUNTS 2019-20 319
Particulars
As at March 31, 2020 As at March 31, 2019
No.Amount
(` in Crore) No.Amount
(` in Crore)
- �The Mapusa Urban Cooperative Bank Limited, of ` 25 each (March 31, 2020: ` 1,000 March 31, 2019: ` 1,000)
40 0 40 0
(f) Investment in Bonds - Unquoted at fair value through profit and loss- �Infrastructure Leasing & Financial
Services Limited51 -
Less: Provision for diminution in value of investments in:Bloom Fountain Limited (1,536) (1,536)Sesa Resources Limited (Note 31) (750) (696)Rampia Coal Mines and Energy Private Limited
(2) (2)
Cairn India Holdings Limited (CIHL) (Note 31)
(3,339) -
Total 60,787 64,204Aggregate amount of impairment (5,627) (2,234)Aggregate amount of quoted investments 44,428 44,502Market value of quoted investments 42,590 76,048Aggregate carrying amount of unquoted investments
16,359 19,702
a) �Carrying value of investment in equity shares of Hindustan Zinc Limited (HZL) is at deemed cost and for all other subsidiaries, it is at the cost of acquisition.
b) �Pursuant to the Government of India’s policy of disvestment, the Company in April 2002 acquired 26% equity interest in HZL from the Government of India. Under the terms of the Shareholder’s Agreement (‘SHA’), the Company had two call options to purchase all of the Government of India’s shares in HZL at fair market value. The Company also acquired an additional 20% of the equity capital in HZL through an open offer. The Company exercised the first call option on August 29, 2003 and acquired an additional 18.9% of HZL’s issued share capital, increasing its shareholding to 64.9%. The second call option provides the Company the right to acquire the Government of India’s remaining 29.5% share in HZL. This call option is subject to the right of the Government of India to sell 3.5% of HZL shares to HZL employees. The Company exercised the second call option on July 21, 2009. The Government of India disputed the validity of the call option and has refused to act upon the second call option. Consequently, the Company invoked arbitration which is in the early stages. The next date of hearing is to be notified. The Government of India without prejudice to the position on the Put / Call option issue has received approval from the Cabinet for divestment and the Government is looking to divest through the auction route. Meanwhile, the Supreme Court has, in January 2016, directed status quo pertaining to disinvestment of Government of India’s residual shareholding while hearing the public interest petition filed. The Company has filed an early hearing application in Supreme Court. The hearings in the matter have started and will now be listed for further arguments in due course.
�Pursuant to the Government of India’s policy of divestment, the Company in March 2001 acquired 51% equity interest in BALCO from the Government of India. Under the terms of the SHA, the Company has a call option to purchase the Government of India’s remaining ownership interest in BALCO at any point from March 02, 2004. The Company exercised this option on March 19, 2004. However, the Government of India has contested the valuation and validity of the option and contended that the clauses of the SHA violate the (Indian) Companies Act, 1956 by restricting the rights of the Government of India to transfer its shares and that as a result such provisions of the SHA were null and void. In the arbitration filed by the Company, the arbitral tribunal by a majority award rejected the claims of the Company on the grounds that the clauses relating to the call option, the right of first refusal, the “tag-along” rights and the restriction on the transfer of shares violate the erstwhile Companies Act, 1956 and are not enforceable. The Company has challenged the validity of the majority award in the Hon'ble High Court of Delhi and sought for setting aside the arbitration award to the extent that it holds these clauses ineffective and inoperative. The Government of India also filed an application before the High Court of Delhi to partially set aside the arbitral award in respect of certain matters involving valuation. The matter is currently scheduled for hearing by the Delhi High Court on August 11, 2020. Meanwhile, the Government of India without prejudice to its position on the Put / Call option issue has received approval from the Cabinet for divestment and the Government is looking to divest through the auction route.
Particulars
As at March 31, 2020 As at March 31, 2019
No.Amount
(` in Crore) No.Amount
(` in Crore)
- �THL Zinc Ventures Limited, 0.25% Optionally Convertible Redeemable Preference shares of US$ 1 each
70,00,000 3,187 70,00,000 3,187
Less: Reduction pursuant to merger c (3,187) 0 (3,187) 0- �THL Zinc Holdings BV, 0.25% Optionally
Convertible Redeemable Preference shares of EURO 1 each
55,00,000 2,495 55,00,000 2,495
Less: Reduction pursuant to merger c (2,495) 0 (2,495) 0(c) Investment in Government or Trust
securities at cost / amortised cost- �7 Years National Savings Certificates
(March 31, 2020: ` 35,450 March 31, 2019: ` 35,450) (Deposit with Sales Tax Authority)
- 0 - 0
- �UTI Master gain of ` 10 each (March 31, 2020: ` 4,072 March 31, 2019: ` 4,072)
100 0 100 0
- �Vedanta Limited ESOS Trust (March 31, 2020: ` 5,000 March 31, 2019: ` 5,000)
- 0 - 0
(d) Investments in debentures of subsidiary companies at cost / amortised cost- �Vizag General Cargo Berth Private
Limited, 0.1% compulsorily convertible debentures of ` 1,000 each
15,00,000 149 15,00,000 150
- �MALCO Energy Limited, compulsorily convertible debentures of ` 1,000 each
6,13,54,483 6,136 6,13,54,483 6,136
Less: Reduction pursuant to merger c (6,118) 18 (6,118) 18(e) Investments in Co-operative societies
at fair value through profit and loss- �Sesa Ghor Premises Holders
Maintenance Society Limited, of ` 200 each (March 31, 2020: ` 8,000 March 31, 2019: ` 8,000)
40 0 40 0
- �Sesa Goa Sirsaim Employees Consumers Co-operative Society Limited, of ` 10 each (March 31, 2020: ` 2,000 March 31, 2019: ` 2,000)
200 0 200 0
- �Sesa Goa Sanquelim Employees Consumers Co-operative Society Limited, of ` 10 each (March 31, 2020: ` 2,300 March 31, 2019: ` 2,300)
230 0 230 0
- �Sesa Goa Sonshi Employees Consumers Co-operative Society Limited, of ` 10 each (March 31, 2020: ` 4,680 March 31, 2019: ` 4,680)
468 0 468 0
- �Sesa Goa Codli Employees Consumers Co-operative Society Limited, of ` 10 each (March 31, 2020: ` 4,500 March 31, 2019: ` 4,500)
450 0 450 0
- �Sesa Goa Shipyard Employees Consumers Co-operative Society Limited, of ` 10 each (March 31, 2020: ` 5,000 March 31, 2019: ` 5,000)
500 0 500 0
STANDALONE NOTES FORMING PART OF THE FINANCIAL STATEMENTSas at and for the year ended March 1 2020
STANDALONE NOTES FORMING PART OF THE FINANCIAL STATEMENTSas at and for the year ended March 1 2020
INTEGRATED REPORT MANAGEMENT REVIEW STATUTORY REPORTS FINANCIAL STATEMENTS
06-115 116-167 168-270 271-502
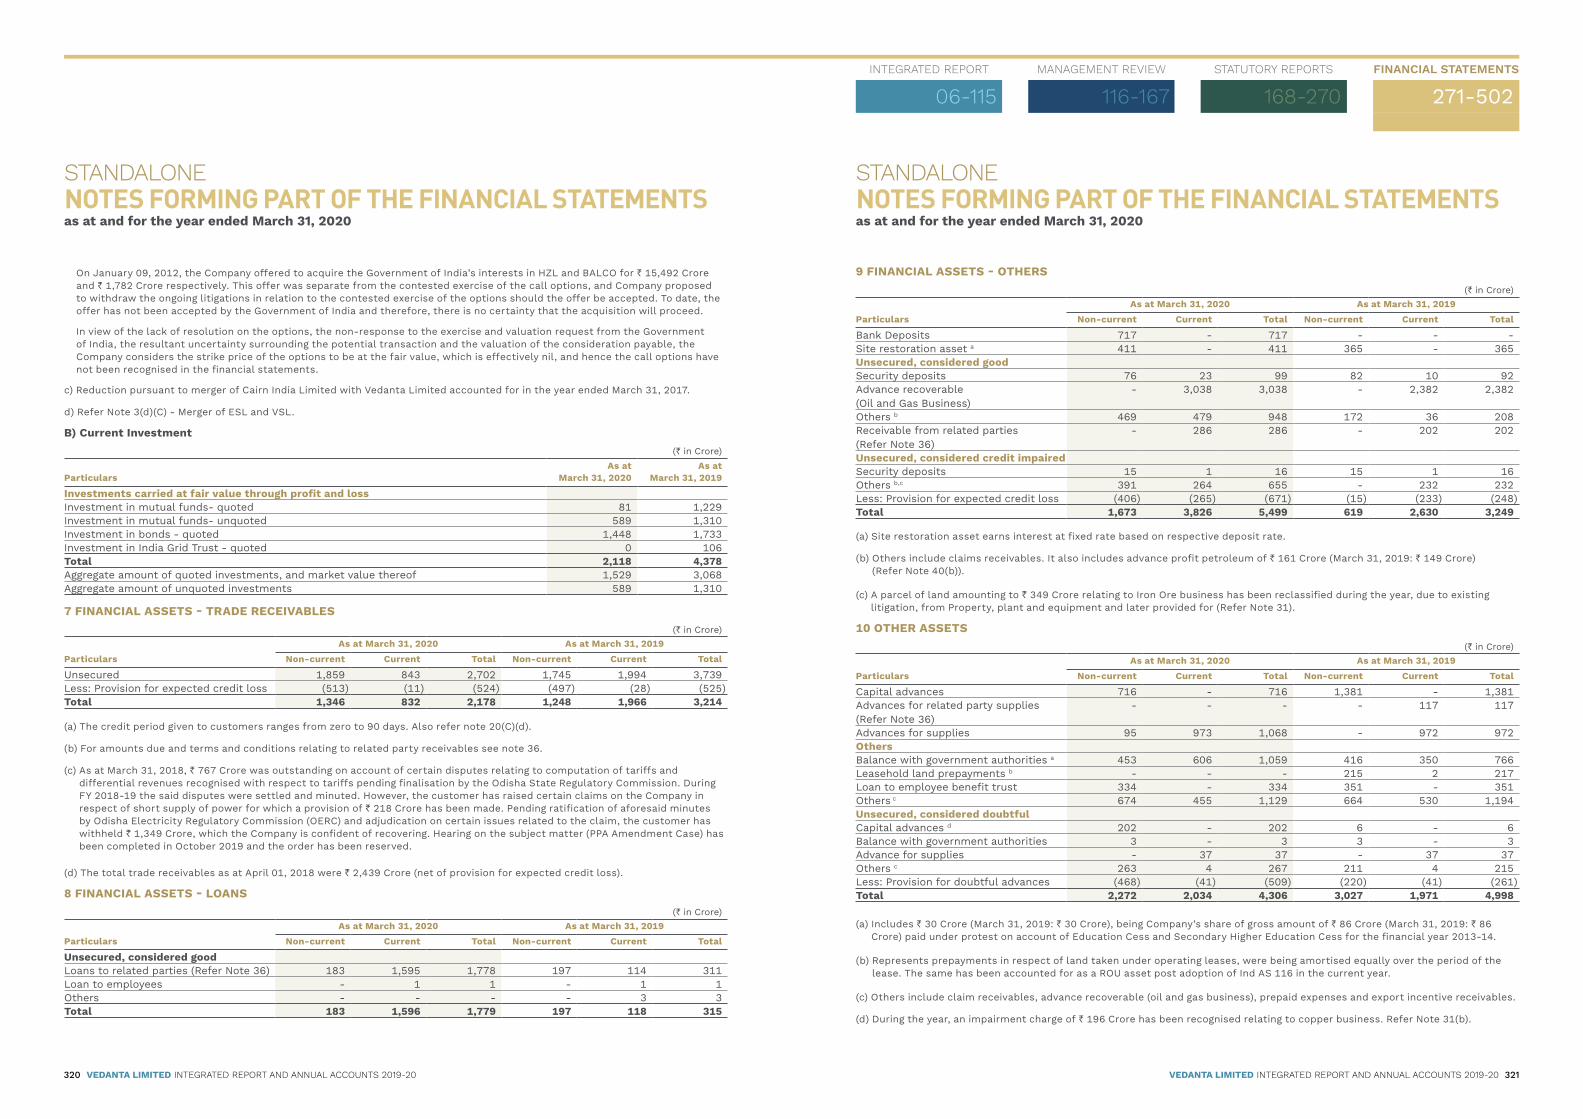
320 VEDANTA LIMITED INTEGRATED REPORT AND ANNUAL ACCOUNTS 2019-20 VEDANTA LIMITED INTEGRATED REPORT AND ANNUAL ACCOUNTS 2019-20 321
9 FINANCIAL ASSETS - OTHERS(` in Crore)
ParticularsAs at March 31, 2020 As at March 31, 2019
Non-current Current Total Non-current Current Total
Bank Deposits 717 - 717 - - -Site restoration asset a 411 - 411 365 - 365Unsecured, considered goodSecurity deposits 76 23 99 82 10 92Advance recoverable (Oil and Gas Business)
- 3,038 3,038 - 2,382 2,382
Others b 469 479 948 172 36 208Receivable from related parties (Refer Note 36)
- 286 286 - 202 202
Unsecured, considered credit impairedSecurity deposits 15 1 16 15 1 16Others b,c 391 264 655 - 232 232Less: Provision for expected credit loss (406) (265) (671) (15) (233) (248)Total 1,673 3,826 5,499 619 2,630 3,249
(a) Site restoration asset earns interest at fixed rate based on respective deposit rate.
(b) �Others include claims receivables. It also includes advance profit petroleum of ` 161 Crore (March 31, 2019: ` 149 Crore) (Refer Note 40(b)).
(c) �A parcel of land amounting to ` 349 Crore relating to Iron Ore business has been reclassified during the year, due to existing litigation, from Property, plant and equipment and later provided for (Refer Note 31).
10 OTHER ASSETS(` in Crore)
ParticularsAs at March 31, 2020 As at March 31, 2019
Non-current Current Total Non-current Current Total
Capital advances 716 - 716 1,381 - 1,381Advances for related party supplies (Refer Note 36)
- - - - 117 117
Advances for supplies 95 973 1,068 - 972 972OthersBalance with government authorities a 453 606 1,059 416 350 766Leasehold land prepayments b - - - 215 2 217Loan to employee benefit trust 334 - 334 351 - 351Others c 674 455 1,129 664 530 1,194Unsecured, considered doubtfulCapital advances d 202 - 202 6 - 6Balance with government authorities 3 - 3 3 - 3Advance for supplies - 37 37 - 37 37Others c 263 4 267 211 4 215Less: Provision for doubtful advances (468) (41) (509) (220) (41) (261)Total 2,272 2,034 4,306 3,027 1,971 4,998
(a) �Includes ` 30 Crore (March 31, 2019: ` 30 Crore), being Company’s share of gross amount of ` 86 Crore (March 31, 2019: ` 86 Crore) paid under protest on account of Education Cess and Secondary Higher Education Cess for the financial year 2013-14.
(b) �Represents prepayments in respect of land taken under operating leases, were being amortised equally over the period of the lease. The same has been accounted for as a ROU asset post adoption of Ind AS 116 in the current year.
(c) �Others include claim receivables, advance recoverable (oil and gas business), prepaid expenses and export incentive receivables.
(d) �During the year, an impairment charge of ` 196 Crore has been recognised relating to copper business. Refer Note 31(b).
� �On January 09, 2012, the Company offered to acquire the Government of India’s interests in HZL and BALCO for ` 15,492 Crore and ` 1,782 Crore respectively. This offer was separate from the contested exercise of the call options, and Company proposed to withdraw the ongoing litigations in relation to the contested exercise of the options should the offer be accepted. To date, the offer has not been accepted by the Government of India and therefore, there is no certainty that the acquisition will proceed.
�In view of the lack of resolution on the options, the non-response to the exercise and valuation request from the Government of India, the resultant uncertainty surrounding the potential transaction and the valuation of the consideration payable, the Company considers the strike price of the options to be at the fair value, which is effectively nil, and hence the call options have not been recognised in the financial statements.
c) Reduction pursuant to merger of Cairn India Limited with Vedanta Limited accounted for in the year ended March 31, 2017.
d) Refer Note 3(d)(C) - Merger of ESL and VSL.
B) Current Investment (` in Crore)
ParticularsAs at
March 31, 2020As at
March 31, 2019
Investments carried at fair value through profit and lossInvestment in mutual funds- quoted 81 1,229Investment in mutual funds- unquoted 589 1,310Investment in bonds - quoted 1,448 1,733Investment in India Grid Trust - quoted 0 106Total 2,118 4,378Aggregate amount of quoted investments, and market value thereof 1,529 3,068Aggregate amount of unquoted investments 589 1,310
7 FINANCIAL ASSETS - TRADE RECEIVABLES(` in Crore)
ParticularsAs at March 31, 2020 As at March 31, 2019
Non-current Current Total Non-current Current Total
Unsecured 1,859 843 2,702 1,745 1,994 3,739Less: Provision for expected credit loss (513) (11) (524) (497) (28) (525)Total 1,346 832 2,178 1,248 1,966 3,214
(a) The credit period given to customers ranges from zero to 90 days. Also refer note 20(C)(d).
(b) For amounts due and terms and conditions relating to related party receivables see note 36.
(c) �As at March 31, 2018, ` 767 Crore was outstanding on account of certain disputes relating to computation of tariffs and differential revenues recognised with respect to tariffs pending finalisation by the Odisha State Regulatory Commission. During FY 2018-19 the said disputes were settled and minuted. However, the customer has raised certain claims on the Company in respect of short supply of power for which a provision of ` 218 Crore has been made. Pending ratification of aforesaid minutes by Odisha Electricity Regulatory Commission (OERC) and adjudication on certain issues related to the claim, the customer has withheld ` 1,349 Crore, which the Company is confident of recovering. Hearing on the subject matter (PPA Amendment Case) has been completed in October 2019 and the order has been reserved.
(d) The total trade receivables as at April 01, 2018 were ` 2,439 Crore (net of provision for expected credit loss).
8 FINANCIAL ASSETS - LOANS(` in Crore)
ParticularsAs at March 31, 2020 As at March 31, 2019
Non-current Current Total Non-current Current Total
Unsecured, considered goodLoans to related parties (Refer Note 36) 183 1,595 1,778 197 114 311Loan to employees - 1 1 - 1 1Others - - - - 3 3Total 183 1,596 1,779 197 118 315
STANDALONE NOTES FORMING PART OF THE FINANCIAL STATEMENTSas at and for the year ended March 1 2020
STANDALONE NOTES FORMING PART OF THE FINANCIAL STATEMENTSas at and for the year ended March 1 2020
INTEGRATED REPORT MANAGEMENT REVIEW STATUTORY REPORTS FINANCIAL STATEMENTS
06-115 116-167 168-270 271-502

322 VEDANTA LIMITED INTEGRATED REPORT AND ANNUAL ACCOUNTS 2019-20 VEDANTA LIMITED INTEGRATED REPORT AND ANNUAL ACCOUNTS 2019-20 323
14 SHARE CAPITAL
Particulars
As at March 31, 2020 As at March 31, 2019Number
(in Crore)Amount
(` in Crore)Number
(in Crore)Amount
(` in Crore)
A. Authorised equity share capitalOpening and Closing balance [equity shares of ` 1 each with voting rights]
4,402 4,402 4,402 4,402
Authorised preference share capital a
Opening and Closing balance [preference shares of ` 10/- each]
301 3,010 301 3,010
B. Issued, subscribed and paid upEquity shares of ` 1/- each with voting rights b,c 372 372 372 372
372 372 372 372
(a) Redeemable preference shares of ` 3,010 Crore were redeemed on October 27, 2018 i.e. 18 months from the date of allotment as per the scheme of amalgamation of Cairn India Limited with Vedanta Limited. An equivalent amount of ` 3,010 Crore has been transferred from general reserve to preference share redemption reserve.
(b) Includes 3,08,232 (March 31, 2019: 3,08,232) equity shares kept in abeyance. These shares are not part of listed equity capital and pending allotment as they are sub-judice.
(c) Includes 1,43,78,261 (March 31, 2019: 1,49,98,702) equity shares held by Vedanta Limited ESOS Trust (Refer Note 25).
C. Shares held by the Ultimate holding company and its subsidiaries*
Particulars
As at March 31, 2020 As at March 31, 2019No. of
Shares held (in Crore)
% of holding
No. of Shares held
(in Crore) % of
holding
Twin Star Holdings Limited 128.01 34.44 128.01 34.44Twin Star Holdings Limited 2 9.93 2.67 9.93 2.67Finsider International Company Limited 40.15 10.80 40.15 10.80Westglobe Limited 4.43 1.19 4.43 1.19Welter Trading Limited 3.82 1.03 3.82 1.03Total 186.34 50.13 186.34 50.13
* The % of holding has been calculated on the issued and subscribed share capital as at the respective balance sheet date.
(1) All the above entities are subsidiaries of Volcan Investments Limited, the ultimate holding Company.
(2) Represented by 2,48,23,177 American Depository Shares ( ADS ).
D. Aggregate number of bonus shares issued, shares issued for consideration other than cash and shares bought back during the period of five years immediately preceding the reporting date
(` in Crore)
ParticularsAs at
March 31, 2020As at
March 31, 2019
Equity shares issued pursuant to Scheme of Amalgamation (in FY 2017-18) 75 75 Preference shares issued pursuant to Scheme of Amalgamation (in FY 2017-18)* 301 301
*These were redeemed on October 27, 2018.
E. Details of shareholders holding more than 5% shares in the Company *
Particulars
As at March 31, 2020 As at March 31, 2019No. of
Shares held (in Crore)
% of holding
No. of Shares held
(in Crore) % of
holding
Twin Star Holdings Limited 128.01 34.44 128.01 34.44 Twin Star Holdings Limited # 9.93 2.67 9.93 2.67 Finsider International Company Limited 40.15 10.80 40.15 10.80 ICICI Prudential Equity Arbitrage Fund 18.69 5.03 18.36 4.94 Life Insurance Corporation of India 23.67 6.37 23.66 6.37
11 INVENTORIES(` in Crore)
ParticularsAs at
March 31, 2020As at
March 31, 2019Raw Materials 1,370 3,024Goods-in transit 595 1,154
Work-in-progress 1,835 1,195
Finished goods 465 880
Fuel Stock 608 440Goods-in-transit 258 413
Stores and Spares 557 547Goods-in transit 1 4Total 5,689 7,657
(a) For method of valuation for each class of inventories, refer note 3(a)(J).
(b) Inventory held at net realisable value amounted to ` 2,263 Crore (March 31, 2019: ` 3,584 Crore).
(c) �The write down of inventories amounting to ` 56 Crore (March 31, 2019: ` 152 Crore) has been charged to the Statement of Profit and Loss during the year.
12 CURRENT FINANCIAL ASSETS - CASH AND CASH EQUIVALENTS(` in Crore)
ParticularsAs at
March 31, 2020As at
March 31, 2019
Balances with banks 1,661 3,026 Deposits with original maturity of less than 3 months (including interest accrued thereon) a 185 183 Cash on hand 0 0 Total 1,846 3,209
(a) Bank deposits earns interest at fixed rate based on respective deposit rate.
(b) Cash & Cash equivalents for the purpose of Statement of Cash Flows comprises the following:(` in Crore)
ParticularsAs at
March 31, 2020As at
March 31, 2019
Cash and cash equivalents as above 1,846 3,209 Earmarked unpaid dividend accounts (Refer Note 13) 74 75 Total 1,920 3,284
13 CURRENT FINANCIAL ASSETS - OTHER BANK BALANCES(` in Crore)
ParticularsAs at
March 31, 2020As at
March 31, 2019
Bank deposits with original maturity of more than 12 months (including interest accrued thereon) a
0 3
Bank deposits with original maturity of more than 3 months but less than 12 months (including interest accrued thereon) a,b
271 602
Earmarked unpaid dividend accounts c 74 75 Earmarked escrow account d 2 2 Total 347 682
(a) Bank deposits earns interest at fixed rate based on respective deposit rate.
(b) Includes ` 256 Crore (March 31, 2019: ` 591 Crore) on lien with banks and margin money ` 12 Crore (March 31, 2019: ` 11 Crore).
(c) Earmarked unpaid dividend accounts are restricted in use as it relates to unclaimed or unpaid dividend.
(d) Earmarked escrow account is restricted in use as it relates to unclaimed redeemable preference shares.
STANDALONE NOTES FORMING PART OF THE FINANCIAL STATEMENTSas at and for the year ended March 1 2020
STANDALONE NOTES FORMING PART OF THE FINANCIAL STATEMENTSas at and for the year ended March 1 2020
INTEGRATED REPORT MANAGEMENT REVIEW STATUTORY REPORTS FINANCIAL STATEMENTS
06-115 116-167 168-270 271-502

324 VEDANTA LIMITED INTEGRATED REPORT AND ANNUAL ACCOUNTS 2019-20 VEDANTA LIMITED INTEGRATED REPORT AND ANNUAL ACCOUNTS 2019-20 325
16 CAPITAL MANAGEMENTThe Company’s objectives when managing capital is to safeguard continuity, maintain a strong credit rating and healthy capital ratios in order to support its business and provide adequate return to shareholders through continuing growth. The Company’s overall strategy remains unchanged from previous year.
The Company sets the amount of capital required on the basis of annual business and long-term operating plans which include capital and other strategic investments.
The funding requirements are met through a mixture of equity, internal fund generation and borrowings. The Company’s policy is to use current and non-current borrowings to meet anticipated funding requirements.
The Company monitors capital on the basis of the gearing ratio which is net debt divided by total capital (equity plus net debt). The Company is not subject to any externally imposed capital requirements.
Net debt are non-current and current debts as reduced by cash and cash equivalents, other bank balances and current investments. Equity comprises all components including other comprehensive income.
The following table summarises the capital of the Company:
(` in Crore except otherwise stated)
ParticularsAs at
March 31, 2020As at
March 31, 2019
Cash and cash equivalents (Refer Note 12) 1,846 3,209 Other bank balances (Refer Note 13) 347 682 Non-current bank deposits (Refer Note 9) 717 - Current investments (Refer Note 6B) 2,118 4,378 Total cash (a) 5,028 8,269 Non-current borrowings (Refer Note 17A) 21,629 20,521 Current borrowings (Refer Note 17B) 10,819 17,180 Current maturities of long-term debt (Refer Note 19) 6,489 4,503 Total borrowings (b) 38,937 42,204 Net debt c=(b-a) 33,909 33,935 Total equity 69,895 77,880 Total capital (equity + net debt) (d) 1,03,804 1,11,815 Gearing ratio (times) (c/d) 0.33 0.30
17 FINANCIAL LIABILITIES - BORROWINGSA) Non-current borrowings
(` in Crore)
ParticularsAs at
March 31, 2020As at
March 31, 2019
At amortised costSecuredNon-convertible debentures 13,013 9,898 Term loans from banks- Rupee term loans 11,724 15,037 - Foreign currency term loans 3,227 - Others 75 - UnsecuredDeferred sales tax liability 77 87 Redeemable preference shares 2 2 Non-current borrowings (A) 28,118 25,024 Less: Current maturities of long-term debt (Refer Note 19) (6,489) (4,503)Total Non-current borrowings (Net) 21,629 20,521 Current borrowings (B) (Refer Note 17 B) 10,819 17,180 Total borrowings (A+B) 38,937 42,204
* The % of holding has been calculated on the issued and subscribed share capital as at the respective balance sheet date.
# 2,48,23,177 ADS, held by CITI Bank N.A. New York as a depository.
As per the records of the Company, including its register of shareholders/members, the above shareholding represents legal ownership of shares.
F. Other disclosures
(i) �The Company has one class of equity shares having a par value of ` 1 per share. Each shareholder is eligible for one vote per share held and dividend as and when declared by the Company. The dividend proposed by the Board of Directors is subject to the approval of the shareholders in the ensuing Annual General Meeting, except in case of interim dividend which is paid as and when declared by the Board of Directors. In the event of liquidation of the Company, the holders of equity shares will be entitled to receive any of the remaining assets of the Company, after distribution of all preferential amounts, in proportion to their shareholding.
(ii) �The Company had one class of 7.5% non-cumulative redeemable preference shares having a par value of ` 10 per share. Each preference shareholder is eligible for one vote per share as per terms of Section 47(2) of the Companies Act, 2013 and dividend as and when declared by the Company. As per the terms of preference shares, these shares are redeemable at par on expiry of 18 months from the date of their allotment. In the event of winding up of Vedanta Limited, the holders of Preference Shares shall have a right to receive repayment of capital paid up and arrears of dividend, whether declared or not, up to the commencement of winding up, in prioirty to any payment of capital on the equity shares out of the surplus of Vedanta Limited.
(iii) �ADS shareholders do not have right to attend General meetings in person and also do not have right to vote. They are represented by depository, CITI Bank N.A. New York. As at March 31, 2020 - 26,17,80,208 equity shares were held in the form of 6,54,45,052 ADS (March 31, 2019 - 24,87,79,452 equity shares were held in the form of 6,21,94,863 ADS).
(iv) �In terms of Scheme of Arrangement as approved by the Hon'ble High Court of Judicature at Mumbai, vide its order dated April 19, 2002, the erstwhile Sterlite Industries (India) Limited (merged with the Company during 2013-14) during 2002-2003 reduced its paid up share capital by ` 10 Crore. There are 2,01,711 equity shares (March 31, 2019: 2,01,085 equity shares) of ` 1 each pending clearance from NSDL. The Company has filed an application in Hon'ble High Court of Mumbai to cancel these shares, the final decision on which is pending. Hon'ble High Court of Judicature at Mumbai, vide its interim order dated September 06, 2002 restrained any transaction with respect to subject shares.
15 OTHER EQUITY (REFER STATEMENT OF CHANGES IN EQUITY)a) General reserve: Under the erstwhile Companies Act, 1956, general reserve was created through an annual transfer of net income at a specified percentage in accordance with applicable regulations. The purpose of these transfers was to ensure that if a dividend distribution in a given year is more than 10% of the paid-up capital of the Company for that year, then the total dividend distribution is less than the total distributable reserves for that year. Consequent to introduction of Companies Act, 2013, the requirement to mandatorily transfer a specified percentage of the net profit to general reserve has been withdrawn.
b) Debenture redemption reserve: As per the earlier provision under the Indian Companies Act, companies that issue debentures were required to create debenture redemption reserve from annual profits until such debentures are redeemed. Companies are required to maintain 25% as a reserve of outstanding redeemable debentures. The amounts credited to the debenture redemption reserve may not be utilised except to redeem debentures. The MCA vide its Notification dated August 16, 2019, had amended the Companies (Share Capital and Debenture) Rules, 2014, wherein the requirement of creation of Debenture Redemption Reserve has been exempted for certain class of companies, hence, in view of the same, Vedanta Limited is not required to create Debenture Redemption Reserve.
c) Preference share redemption reserve: The Companies Act provides that companies that issue preference shares may redeem those shares from profits of the Company which otherwise would be available for dividends, or from proceeds of a new issue of shares made for the purpose of redemption of the preference shares. If there is a premium payable on redemption, the premium must be provided for, either by reducing the additional paid in capital (securities premium account) or net income, before the shares are redeemed. If profits are used to redeem preference shares, the value of the nominal amount of shares redeemed should be transferred from profits (retained earnings) to the preference share redemption reserve account. This amount should then be utilised for the purpose of redemption of redeemable preference shares. This reserve can be used to issue fully paid-up bonus shares to the shareholders of the Company. During the previous year, on redemption of preference share, ` 3,010 Crore has been transferred from general reserve to preference share redemption reserve.
d) Capital reserve: The balance in capital reserve has mainly arisen consequent to merger of Cairn India Limited with the Company.
STANDALONE NOTES FORMING PART OF THE FINANCIAL STATEMENTSas at and for the year ended March 1 2020
STANDALONE NOTES FORMING PART OF THE FINANCIAL STATEMENTSas at and for the year ended March 1 2020
INTEGRATED REPORT MANAGEMENT REVIEW STATUTORY REPORTS FINANCIAL STATEMENTS
06-115 116-167 168-270 271-502

326 VEDANTA LIMITED INTEGRATED REPORT AND ANNUAL ACCOUNTS 2019-20 VEDANTA LIMITED INTEGRATED REPORT AND ANNUAL ACCOUNTS 2019-20 327
b) Vedanta Limited has taken borrowings towards funding of its acquisitions, capital expenditure and working capital requirements. The borrowings comprise of funding arrangements from various banks and financial institution. The details of security provided by the Company to various lenders on the assets of the Company are as follows:
(` in Crore)
ParticularsAs at
March 31, 2020As at
March 31, 2019
Secured long-term borrowings 28,039 24,935Secured short-term borrowings 2,202 1,091Total secured borrowings 30,241 26,026
(` in Crore)
Facility Category Security detailsAs at
March 31, 2020As at
March 31, 2019
Working capital loans*
First pari passu charge on all rights, title, claim and benefit in all the whole of the current assets of Vedanta Limited, both present and future, including stock and raw material, stock in process, semi finished and finished goods, stores and spares not relating to plant and machinery (consumable stores and spares)
1 -
First pari passu charge on current assets of Vedanta Limited 3 -Secured by hypothecation of inventory of Vedanta Limited including other movables like book debts and bills outstanding
11 -
Secured by receivables on sale of crude oil of Vedanta Limited 8 -Other secured working capital loans - 1,075
Non-Convertible Debentures
Secured by the whole of the movable fixed assets of (i) Alumina Refinery having output of 1 MTPA along with co-generation captive power plant with an aggregate capacity of 90 MW at Lanjigarh, Odisha and (ii) Aluminium Smelter having output of 1.6 MTPA along with 1215 (9*135) MW CPP at Jharsuguda, Odisha
4,914 -
Secured by way of “movable fixed assets” in relation to the 1.6 MTPA aluminium smelter alongwith 1215 MW (135MW * 9) captive power plant located in Jharsuguda and 1 MTPA Alumina Refinery alongwith 90 MW co-generation power plant located at Lanjigarh in Odisha State and shall include all present movable plant and machinery, machinery spares, tools and accessories, fixtures, mechanical and electrical equipments, machinery and all other movable fixed assets and all estate, right, title, interest, property, claims and demands whatsoever in relation to assets
2,000 2,000
Secured by a first pari passu charge on the whole of the present and future of the movable fixed assets of 2400 MW (600 MW*4) Power Plant of Vedanta Limited at Jharsuguda location
3,999 3,998
Secured by way of first ranking pari passu charge on movable fixed assets in relation to the Lanjigarh Refinery Expansion Project (having capacity beyond 2 MTPA and upto 6 MTPA) situated at Lanjigarh, Odisha. The Lanjigarh Refinery Expansion Project shall specifically exclude the 1 MTPA alumina refinery of Vedanta Limited along with 90 MW power plant in Lanjigarh and all its related capacity expansions
1,100 1,250
Secured by way of first pari passu charge on all present and future of the movable fixed assets of 2400 MW (600 MW*4) Power Plant of Vedanta Limited at Jharsuguda location, as may be identified and notified by the Issuer to the Security Trustee from time to time, with minimum asset coverage of 1 time of the aggregate face value of debentures outstanding at any point of time
1,000 1,000
Other secured non-convertible debentures - 1,650
B) Current borrowings(` in Crore)
ParticularsAs at
March 31, 2020As at
March 31, 2019
At amortised costSecuredTerm loans from banks (Foreign currency) 1,041 - Project buyers credit from banks - 16 Loans repayable on demand from banks 1 715 Working capital loan 12 - Amounts due on factoring 10 360 Others 1,138 - UnsecuredCommercial paper 7,524 14,555 Packing credit in foreign currencies from banks - 492 Working capital loan - 325 Amounts due on factoring 16 717 Loans repayable on demand from banks 1,077 - Total 10,819 17,180
The Company has discounted trade receivables on recourse basis of ` 26 Crore (March 31, 2019: ` 1,077 Crore). Accordingly, the monies received on this account are shown as borrowings as the trade receivables does not meet de-recognition criteria. The above borrowings pertaining to trade receivables discounted has been reinstated on account of foreign exchange fluctuation.
a) Details of Non-convertible debentures issued by the Company have been provided below (Carrying Value):(` in Crore)
ParticularsAs at
March 31, 2020As at
March 31, 2019
9.2% due February-2030 2,000 - 9.2% due December-2022 748 - 8.75% due June-2022 1,268 - 8.9% due December-2021 898 - 8.75% due September-2021 250 250 9.18% due July-2021 1,000 1,000 8.5% due June-2021 1,650 1,649 8.75% due April-2021 250 250 8.5% due April-2021 2,349 2,349 9.45% due August-2020 2,000 2,000 8.7% due April-2020 600 600 7.8% due December-2020* - 500 7.95% due April-2020** - 300 7.5% due November-2019 - 200 8.25% due October-2019 - 300 8.65% due September-2019 - 150 7.6% due May-2019 - 350 Total 13,013 9,898
* Repaid during the year.
** Put option was excercised by the NCD holders, basis which NCDs became due for repayment.
STANDALONE NOTES FORMING PART OF THE FINANCIAL STATEMENTSas at and for the year ended March 1 2020
STANDALONE NOTES FORMING PART OF THE FINANCIAL STATEMENTSas at and for the year ended March 1 2020
INTEGRATED REPORT MANAGEMENT REVIEW STATUTORY REPORTS FINANCIAL STATEMENTS
06-115 116-167 168-270 271-502

328 VEDANTA LIMITED INTEGRATED REPORT AND ANNUAL ACCOUNTS 2019-20 VEDANTA LIMITED INTEGRATED REPORT AND ANNUAL ACCOUNTS 2019-20 329
(` in Crore)
Facility Category Security detailsAs at
March 31, 2020As at
March 31, 2019
Secured by first pari passu charge by way of hypothecation over all the movable assets(save and except Current Assets) of Vedanta Limited, present or future, pertaining to Lanjigarh refinery expansion project beyond 1.7 MTPA to 6.0 MTPA located at Lanjigarh Odisha including but not limited to plant and machinery, machinery spares, tools and accessories in relation to aforementioned expansion project. Among others, the Lanjigarh Refinery Expansion Project shall specifically exclude the alumina refinery upto 1.7 MTPA of the Company along with 90 MW power plant in Lanjigarh and all its related expansions
736 -
Secured by charge on investment of Vedanta Limited in INR bonds 1,041 -Secured by first pari passu charge by way of whole of the movable fixed assets of (i) Alumina Refinery having output of 1 MTPA along with co-generation captive power plant with an aggregate capacity of 90MW at Lanjigarh, Odisha and (ii) Aluminium Smelter having output of 1.6 MTPA along with 1215 (9*135) MW CPP at Jharsuguda, Odisha
1,487 -
Others First charge by way of hypothecation on the entire stocks of raw materials, semi-finished and finished goods, consumable stores and spares and such other movables including book-debts, bills whether documentary or clean, outstanding monies, receivables and all other current assets of Vedanta limited, both present and future, ranking pari passu with other participating banks
1,145 -
First pari passu charge on all existing and future current assets of Vedanta Limited
68 -
Project Buyers credit from banks
Other secured project buyer's credit - 16
Total 30,241 26,026
* Includes loans repayable on demand from banks, export packing credit and amounts due on factoring.
c) The Company facilities are subject to certain financial and non-financial covenants. The primary covenants which must be complied with include interest service coverage ratio, current ratio, debt service coverage ratio, total outside liabilities to total net worth, fixed assets coverage ratio, ratio of total term liabilities to net worth and return on fixed assets. The Company has complied with the covenants as per the terms of the loan agreement.
d) Terms of repayment of total borrowings outstanding as at March 31, 2020 are provided below -(` in Crore)
Borrowings
Weighted average interest
rate as at March 31, 2020
Total carrying
value 1 year 1-3 years
3-5 years 5 years Remarks
Foreign Currency term Loan
4.40% 4,268 1,970 1,609 150 540 Repayable in 69 quarterly repayments and one bullet payment
Rupee term loan 8.84% 11,724 2,912 3,641 2,331 2,876 Repayable in 264 quarterly instalments and 3 half yearly instalments
Non-convertible debentures
8.92% 13,013 2,600 8,420 - 2,000 Repayable in 11 bullet payments
Commercial paper 6.20% 7,524 7,524 - - - Repayable in 29 bullet paymentsWorking capital loan*
7.91% 1,090 1,090 - - - Export packing credit & Loan repayable on demand is repayable within 1-6 months from the date of drawal and also includes working capital loan which is repayable in one bullet payment
Amounts due on factoring
4.79% 26 26 - - - Repayable within one month
(` in Crore)
Facility Category Security detailsAs at
March 31, 2020As at
March 31, 2019
Term loans from banks (includes rupee term loans and foreign currency term loans)
First pari passu charge by way of hypothecation/ equitable mortgage on the movable/ immovable assets of the Aluminium division comprising of alumina refinery having output of 1 MTPA along with co-generation captive power plant with an aggregate capacity of 90 MW at Lanjigarh, Odisha; aluminium smelter having output of 1.6 MTPA along with 1215 (9x135) MW CPP at Jharsuguda, Odisha, both present and future
3,384 5,102
Secured by a pari passu charge by way of hypothecation of all the movable fixed assets of Vedanta Limited pertaining to its Aluminium division project consisting of (i) alumina refinery having output of 1 MTPA (Refinery) along with co-generation captive power plant with an aggregate capacity of 90 MW at Lanjigarh, Odisha (Power Plant) and (ii) aluminium smelter having output of 1.6 MTPA along with 1215 (9x135) MW CPP at Jharsuguda, Odisha (Smelter) (the Refinery, Power Plant and Smelter). Also, a first pari passu charge by way of equitable mortgage on the land pertaining to the mentioned project of aluminium division
2,885 3,551
Secured by a pari passu charge by way of hypothecation on the movable fixed assets of the Lanjigarh Refinery Expansion Project including 210 MW Power Project. Lanjigarh Refinery Expansion Project shall specifically exclude 1 MTPA alumina refinery of the Company along with 90 MW power plant in Lanjigarh and all its related expansions
458 482
Secured by a pari passu charge by way of hypothecation on the movable fixed assets of Vedanta Limited pertaining to its Aluminium division comprising of 1 MTPA alumina refinery plant with 90 MW captive power plant at Lanjigarh, Odisha and 1.6 MTPA aluminium smelter plant with 1215 MW captive power plant at Jharsuguda, Odisha
1,380 1,734
Secured by a pari passu charge by way of hypothecation/equitable mortgage of the movable/immovable fixed assets of Vedanta Limited pertaining to its Aluminium Division comprising of 1 MTPA alumina refinery plant with 90 MW captive power plant at Lanjigarh, Odisha and 1.6 MTPA aluminium smelter plant with 1215 MW captive power plant at Jharsuguda, Odisha
2,984 2,984
First pari passu charge by way of hypothecation/ equitable mortgage on the movable/ immovable assets of the Aluminium division of Vedanta Limited comprising of alumina refinery having output of 1 MTPA along with co-generation captive power plant with an aggregate capacity of 90 MW at Lanjigarh, Odisha; aluminium smelter having output of 1.6 MTPA along with 1215 (9x135) MW CPP at Jharsuguda, Odisha and additional charge on Lanjigarh Expansion project, both present and future
1,137 1,184
Secured by a pari passu charge on the whole of the movable fixed assets of 1.6 MTPA Aluminium smelter including 1215 MW power plant of Vedanta Limited situated at Jharsuguda and movable fixed assets of 1 MTPA Alumina refinery including 90 MW thermal power plant (operating capacity) situated at Lanjigarh, including movable plant and machinery, machinery spares, tools and accessories, condensers, generators, cooling systems, pumps, tanks, transformers and all other equipment’s, furniture, fittings, fixtures, vehicles and all other movable fixed assets both present and future
500 -
STANDALONE NOTES FORMING PART OF THE FINANCIAL STATEMENTSas at and for the year ended March 1 2020
STANDALONE NOTES FORMING PART OF THE FINANCIAL STATEMENTSas at and for the year ended March 1 2020
INTEGRATED REPORT MANAGEMENT REVIEW STATUTORY REPORTS FINANCIAL STATEMENTS
06-115 116-167 168-270 271-502

330 VEDANTA LIMITED INTEGRATED REPORT AND ANNUAL ACCOUNTS 2019-20 VEDANTA LIMITED INTEGRATED REPORT AND ANNUAL ACCOUNTS 2019-20 331
f) Movement in borrowings during the year is provided below-(` in Crore)
ParticularsShort-term
borrowing Long-term borrowing* Total debt
Opening balance at April 01, 2018 18,320 22,393 40,713 Cash flow (1,165) 2,612 1,447 Other non-cash changes 25 19 44 As at April 01, 2019 17,180 25,024 42,204 Cash flow (7,011) 2,955 (4,056)Other non Cash Changes 650 139 789 As at March 31, 2020 10,819 28,118 38,937
*including Current maturities of Long-term borrowing
Other non-cash changes comprises of amortisation of borrowing costs, foreign exchange difference on borrowings and reclassification between borrowings due within one year and borrowings due after one year.
18 FINANCIAL LIABILITIES - TRADE PAYABLES a
(` in Crore)
ParticularsAs at March 31, 2020 As at March 31, 2019
Non-current Current Total Non-current Current Total
Total outstanding dues of micro, small and medium enterprises (Refer Note 39(b))
- 182 182 - 59 59
Total outstanding dues of creditors other than micro, small and medium enterprises
- 3,300 3,300 - 5,173 5,173
Total outstanding dues of related parties b - 27 27 - 13 13 Operational buyers' credit / suppliers' credit c
- 7,130 7,130 - 6,017 6,017
Total - 10,639 10,639 - 11,262 11,262
(a) Trade payables are non-interest bearing and are normally settled upto 180 days terms.
(b) For terms and conditions relating to related party payables, see note 36.
(c) �Operational Buyers' /Suppliers' Credit is availed in foreign currency from offshore branches of Indian banks or foreign banks at an interest rate ranging from 2.5% to 3.5% per annum and in rupee from domestic banks at interest rate ranging from 7.5%-8.5% per annum. These trade credits are largely repayable within 180 days from the date of draw down. Operational Buyers' credit availed in foreign currency is backed by Standby Letter of Credit issued under working capital facilities sanctioned by domestic banks. Part of these facilities are secured by first pari passu charge over the present and future current assets of the Company.
19 FINANCIAL LIABILITIES - OTHERS(` in Crore)
ParticularsAs at March 31, 2020 As at March 31, 2019
Non-current Current Total Non-current Current Total
Liability for capital expenditure 47 5,203 5,250 42 3,379 3,421Security deposits and retentions - 28 28 - 14 14Interest Accrued but not due 170 911 1,081 239 710 949Current maturities of long-term debt a - 6,489 6,489 - 4,503 4,503Unpaid/unclaimed dividend b - 74 74 - 75 75Unpaid matured deposits and interest accrued thereon c
- 0 0 - 0 0
Profit petroleum payable - 396 396 - 624 624Dues to related parties (Refer Note 36) - 68 68 - 84 84Lease liabilities e 71 231 302 - - -Other Liabilities d - 1,461 1,461 - 2,094 2,094Total 288 14,861 15,149 281 11,483 11,764
(` in Crore)
Borrowings
Weighted average interest
rate as at March 31, 2020
Total carrying
value 1 year 1-3 years
3-5 years 5 years Remarks
Deferred sales tax liability
NA 77 20 42 28 1 Repayable in 78 monthly instalments
Redeemable preference shares
NA 2 2 - - - The redemption and dividend paid to the preference shares unclaimed if any, is payable on claim
Others 7.90% 1,213 1,179 34 - - Repayable within 6-12 months and 6 suppliers credit LC repayable in more than 12 months upto 36 months
Total 38,937 17,323 13,746 2,509 5,417
The above maturity is based on the total principal outstanding gross of issue expenses and discounting impact of deferred sales tax liability.
* Includes loans repayable on demand from banks for ` 1,078 Crore.
e) Terms of repayment of total borrowings outstanding as at March 31, 2019 are provided below -
Borrowings
Weighted average interest rate as at March
31, 2019
Total carrying
value 1 year 1-3 years
3-5 years 5 years Remarks
Rupee term loan 8.79% 15,037 3,199 5,294 2,271 4,319 Repayable in 404 quarterly instalments and 5 instalments payable in the gap of 5 months and 7 months
Non-convertible debentures
8.68% 9,898 1,300 8,600 - - Repayable in 13 bullet payments
Commercial paper 7.50% 14,555 14,555 - - - Repayable in 72 bullet paymentsWorking capital loan*
8.50% 1,532 1,532 - - - Export packing credit is repayable within 1-6 months from the date of drawal, cash credit can be repaid anytime as per the availability of business surplus during the validity of the facility and working capital loan is repayable in one bullet payment
Project buyers' credit from banks
3.51% 16 16 - - - Repayable in 2 bullet payments
Amounts due on factoring
3.16% 1,077 1,077 - - - Repayable within one month
Deferred sales tax liability
NA 87 17 32 46 12 Repayable in 90 monthly instalments
Redeemable preference shares
NA 2 2 - - - The redemption and dividend paid to the preference shares unclaimed if any, is payable on claim
Total 42,204 21,698 13,926 2,317 4,331
The above maturity is based on the total principal outstanding gross of issue expenses and discounting impact of deferred sales tax liability.
* Includes loans repayable on demand from banks for ` 715 Crore and packing credit in foreign currencies from banks.
STANDALONE NOTES FORMING PART OF THE FINANCIAL STATEMENTSas at and for the year ended March 1 2020
STANDALONE NOTES FORMING PART OF THE FINANCIAL STATEMENTSas at and for the year ended March 1 2020
INTEGRATED REPORT MANAGEMENT REVIEW STATUTORY REPORTS FINANCIAL STATEMENTS
06-115 116-167 168-270 271-502

332 VEDANTA LIMITED INTEGRATED REPORT AND ANNUAL ACCOUNTS 2019-20 VEDANTA LIMITED INTEGRATED REPORT AND ANNUAL ACCOUNTS 2019-20 333
(` in Crore)
Financial Assets
Fair value through
profit or loss
Derivatives designated as hedging
instruments Amortised costTotal
carrying value Total fair value
Borrowings - - 38,937 38,937 38,912Trade payables 343 - 10,296 10,639 10,639Derivatives 9 38 - 47 47Other financial liabilities* - - 8,660 8,660 8,660Total 352 38 57,893 58,283 58,258
*Include lease liabilities of ` 302 Crore as at March 31, 2020.
As at March 31, 2019(` in Crore)
Financial Assets
Fair value through
profit or loss
Fair value through other
comprehensive income
Derivatives designated as hedging
instruments Amortised costTotal
carrying value Total fair value
Investments* 4,378 115 - - 4,493 4,493Trade receivables 170 - - 3,044 3,214 3,214Cash and cash equivalents
- - - 3,209 3,209 3,209
Other bank balances - - - 682 682 682Loans - - - 315 315 315Derivatives 6 - 40 - 46 46Other financial assets - - - 3,249 3,249 3,249Total 4,554 115 40 10,499 15,208 15,208
(` in Crore)
Financial Assets
Fair value through
profit or loss
Derivatives designated as hedging
instruments Amortised costTotal
carrying value Total fair value
Borrowings - - 42,204 42,204 42,169Trade payables 909 - 10,353 11,262 11,262Derivatives 342 1 - 343 343Other financial liabilities - - 7,261 7,261 7,261Total 1,251 1 59,818 61,070 61,035
* Investment in note 6 also includes investments (in equity and preference shares) in subsidiaries, associates and joint ventures which are carried at cost and hence are not required to be disclosed as per Ind AS 107 “Financial Instruments Disclosures”. Hence, the same have been excluded from the above table.
B. Fair value hierarchyThe Company uses the following hierarchy for determining and/or disclosing the fair value of financial instruments by valuation techniques:
(i) Level 1: quoted prices (unadjusted) in active markets for identical assets or liabilities.
(ii) Level 2: inputs other than quoted prices included within Level 1 that are observable for the asset or liability, either directly (i.e. as prices) or indirectly (i.e. derived from prices).
(iii) Level 3: inputs for the asset or liability that are not based on observable market data (unobservable inputs).
(a) Current Maturities of long-term debt consists of:
(` in Crore)
ParticularsAs at
March 31, 2020As at
March 31, 2019
Non-convertible debentures 2,596 1,300 Deferred sales tax liability 20 17 Term loans from banks- Rupee term loans 2,901 3,184 - Foreign currency term loans 929 - Redeemable preference shares 2 2 Others 41 - Total 6,489 4,503
(b) �Does not include any amounts, due and outstanding, to be credited to Investor Education and Protection Fund except ` 0.10 Crore (March 31, 2019: ` 0.11 Crore) which is held in abeyance due to a pending legal case.
(c) �Matured deposits of ` 0.01 Crore (March 31,2019: ` 0.01 Crore) due for transfer to Investor Education and Protection Fund have not been transferred in view of pending litigation between the beneficiaries.
(d) �Includes revenue received in excess of entitlement interest of ` 765 Crore (March 31, 2019: ` 1,439 Crore), reimbursement of expenses, provision for expenses, liabilities related to compensation/claim etc.
(e) The movement in lease liabilities is as follows:(` in Crore)
At April 01, 2019 191Additions during the year 463Interest on lease liabilities 16Payments made 159Deletions 209At March 31, 2020 302
20 FINANCIAL INSTRUMENTSA. Financial assets and liabilities:The accounting classification of each category of financial instruments, and their carrying amounts, are set out below:
As at March 31, 2020(` in Crore)
Financial Assets
Fair value through
profit or loss
Fair value through other
comprehensive income
Derivatives designated as hedging
instruments Amortised costTotal
carrying value Total fair value
Investments* 2,169 41 - - 2,210 2,210Trade receivables 9 - - 2,169 2,178 2,178Cash and cash equivalents
- - - 1,846 1,846 1,846
Other bank balances - - - 347 347 347Loans - - - 1,779 1,779 1,779Derivatives 222 - 329 - 551 551Other financial assets - - - 5,499 5,499 5,499Total 2,400 41 329 11,640 14,410 14,410
STANDALONE NOTES FORMING PART OF THE FINANCIAL STATEMENTSas at and for the year ended March 1 2020
STANDALONE NOTES FORMING PART OF THE FINANCIAL STATEMENTSas at and for the year ended March 1 2020
INTEGRATED REPORT MANAGEMENT REVIEW STATUTORY REPORTS FINANCIAL STATEMENTS
06-115 116-167 168-270 271-502

334 VEDANTA LIMITED INTEGRATED REPORT AND ANNUAL ACCOUNTS 2019-20 VEDANTA LIMITED INTEGRATED REPORT AND ANNUAL ACCOUNTS 2019-20 335
The below table summarises the fair value of borrowings which are carried at amortised cost as at March 31, 2020 and March 31, 2019:
As at March 31, 2020(` in Crore)
Financial liabilities Level 1 Level 2 Level 3
Borrowings - 38,912 -Total - 38,912 -
As at March 31, 2019(` in Crore)
Financial liabilities Level 1 Level 2 Level 3
Borrowings - 42,169 - Total - 42,169 -
The fair value of the financial assets and liabilities are at the amount that would be received to sell an asset and paid to transfer a liability in an orderly transaction between market participants at the measurement date. The following methods and assumptions were used to estimate the fair values:
Investments traded in active markets are determined by reference to quotes from the financial institutions; for example: Net asset value (NAV) for investments in mutual funds declared by mutual fund house. For other listed securities traded in markets which are not active, the quoted price is used wherever the pricing mechanism is same as for other marketable securities traded in active markets. Other current investments are valued on the basis of market trades, poll and primary issuances for securities issued by the same or similar issuer and for similar maturities or based on the applicable spread movement for the security derived based on the aforementioned factor(s).
Trade receivables, cash and cash equivalents, other bank balances, loans, other financial assets, current borrowings, trade payables and other current financial liabilities: fair values approximate their carrying amounts largely due to the short-term maturities of these instruments.
Other non-current financial assets and liabilities: Fair value is calculated using a discounted cash flow model with market assumptions, unless the carrying value is considered to approximate to fair value.
Non-current fixed-rate and variable-rate borrowings: Fair value has been determined by the Company based on parameters such as interest rates, specific country risk factors, and the risk characteristics of the financed project.
Derivative financial assets/liabilities: The Company enters into derivative financial instruments with various counterparties. Interest rate swaps, foreign exchange forward contracts and commodity forward contracts are valued using valuation techniques, which employs the use of market observable inputs. The most frequently applied valuation techniques include the forward pricing and swap models, using present value calculations. The models incorporate various inputs including foreign exchange spot and forward rates, yield curves of the respective currencies, currency basis spreads between the respective currencies, interest rate curves and forward rate curves of the underlying commodity. Commodity contracts are valued using the forward LME rates of commodities actively traded on the listed metal exchange i.e. London Metal Exchange, United Kingdom (U.K.).
For all other financial instruments, the carrying amount is either the fair value, or approximates the fair value.
The changes in counterparty credit risk had no material effect on the hedge effectiveness assessment for derivatives designated in hedge relationship and the value of other financial instruments recognised at fair value.
The estimated fair value amounts as at March 31, 2020 have been measured as at that date. As such, the fair values of these financial instruments subsequent to reporting date may be different than the amounts reported at each year-end.
There were no significant transfers between Level 1, Level 2 and Level 3 during the year.
The below table summarises the categories of financial assets and liabilities as at March 31, 2020 and March 31, 2019 measured at fair value:
As at March 31, 2020(` in Crore)
Financial Assets Level 1 Level 2 Level 3
At fair value through profit or loss- Investments 589 1,529 51 - Derivative financial assets* - 222 - - Trade receivables - 9 - At fair value through other comprehensive income- Investments 30 - 11 Derivatives designated as hedging instruments- Derivative financial assets* - 329 - Total 619 2,089 62
(` in Crore)Financial liabilities Level 1 Level 2 Level 3
At fair value through profit or loss- Derivative financial liabilities* - 9 -- Trade payables - 343 -Derivatives designated as hedging instruments- Derivative financial liabilities* - 38 -Total - 390 -
As at March 31, 2019(` in Crore)
Financial Assets Level 1 Level 2 Level 3
At fair value through profit or loss- Investments 1,416 2,881 81 - Derivative financial assets* - 6 - - Trade receivables - 170 - At fair value through other comprehensive income- Investments 104 - 11 Derivatives designated as hedging instruments- Derivative financial assets* - 40 -Total 1,520 3,097 92
(` in Crore)Financial liabilities Level 1 Level 2 Level 3
At fair value through profit or loss- Derivative financial liabilities* - 342 - - Trade payables - 909 - Derivatives designated as hedging instruments- Derivative financial liabilities* - 1 - Total - 1,252 -
* Refer “D” below.
STANDALONE NOTES FORMING PART OF THE FINANCIAL STATEMENTSas at and for the year ended March 1 2020
STANDALONE NOTES FORMING PART OF THE FINANCIAL STATEMENTSas at and for the year ended March 1 2020
INTEGRATED REPORT MANAGEMENT REVIEW STATUTORY REPORTS FINANCIAL STATEMENTS
06-115 116-167 168-270 271-502

336 VEDANTA LIMITED INTEGRATED REPORT AND ANNUAL ACCOUNTS 2019-20 VEDANTA LIMITED INTEGRATED REPORT AND ANNUAL ACCOUNTS 2019-20 337
The Company is also exposed to the movement of international crude oil price and the discount in the price of Rajasthan crude oil to Brent price.
Financial instruments with commodity price risk are entered into in relation to following activities:
� economic hedging of prices realised on commodity contracts
� cash flow hedging of revenues, forecasted highly probable transactions
AluminiumThe requirement of the primary raw material, alumina, is partly met from own sources and the rest is purchased primarily on negotiated price terms. Sales prices are linked to the LME prices. At present the Company on selective basis hedges the aluminium content in outsourced alumina to protect its margins. The Company also enters into hedging arrangements for its aluminium sales to realise average month of sale LME prices.
CopperThe Company’s custom refining copper operations at Silvassa is benefitted by a natural hedge except to the extent of a possible mismatch in quotational periods between the purchase of anodes/blisters and the sale of finished copper. The Company’s policy on custom smelting is to generate margins from Refining charges or Rc”, improving operational efficiencies, minimising conversion cost, generating a premium over LME on sale of finished copper, sale of by-products and from achieving import parity on domestic sales. Hence, mismatches in quotational periods are managed to ensure that the gains or losses are minimised. The Company hedges this variability of LME prices through forward contracts and tries to make the LME price a pass-through cost between purchases of anodes / blisters and sales of finished products, both of which are linked to the LME price.
Rcs are a major source of income for the Indian copper refining operations. Fluctuations in Rcs are influenced by factors including demand and supply conditions
prevailing in the market for smelters output. The Company’s copper business has a strategy of securing a majority of its anodes/ blisters feed requirement under long-term contracts with smelters/ traders.
Iron oreThe Company sells its Iron Ore production from Goa on the prevailing market prices and from Karnataka through e-auction route as mandated by State Government of Karnataka in India.
Oil and GasThe prices of various crude oils are based upon the price of the key physical benchmark crude oil such as Dated Brent, West Texas Intermediate, and Dubai/Oman etc. The crude oil prices move based upon market factors like supply and demand. The regional producers price their crude basis these benchmark crude with a premium or discount over the benchmark based upon quality differential and competitiveness of various grades.
Natural gas markets are evolving differently in important geographical markets. There is no single global market for natural gas. This could be owing to difficulties in large-scale transportation over long distances as compared to crude oil. Globally, there are three main regional hubs for pricing of natural gas, which are USA (Henry Hub Prices), UK (NBP Price) and Japan (imported gas price, mostly linked to crude oil).
Provisionally priced financial instrumentsOn March 31, 2020, the value of net financial liabilities linked to commodities (excluding derivatives) accounted for on provisional prices was ` 677 Crore (March 31, 2019: liabilities of ` 15 Crore). These instruments are subject to price movements at the time of final settlement and the final price of these instruments will be determined in the financial year beginning April 01, 2020.
Set out below is the impact of 10% increase in LME prices on pre-tax profit/ (loss) for the year and pre-tax total equity as a result of changes in value of the Company’s commodity financial instruments:
For the year ended arch 2020(` in Crore)
Total ExposureEffect on profit/(loss) of a 10%
increase in the LMEEffect on total equity of a 10%
increase in the LME
Copper (794) (79) -
For the year ended arch 20(` in Crore)
Total ExposureEffect on profit/(loss) of a 10%
increase in the LMEEffect on total equity of a 10%
increase in the LME
Copper (53) (5) -
C. Risk management frameworkThe Company’s businesses are subject to several risks and uncertainties including financial risks.
The Company’s documented risk management policies act as an effective tool in mitigating the various financial risks to which the businesses are exposed in the course of their daily operations. The risk management policies cover areas such as liquidity risk, commodity price risk, foreign exchange risk, interest rate risk, counterparty credit risk and capital management. Risks are identified at both the corporate and individual subsidiary level with active involvement of senior management. Each operating subsidiary in the Company has in place risk management processes which are in line with the Company’s policy. Each significant risk has a designated ‘owner’ within the Company at an appropriate senior level. The potential financial impact of the risk and its likelihood of a negative outcome are regularly updated.
The risk management process is coordinated by the Management Assurance function and is regularly reviewed by the Company’s Audit Committee. The Audit Committee is aided by the other Committees of the Board including the Risk Management Committee, which meets regularly to review risks as well as the progress against the planned actions. Key business decisions are discussed at the periodic meetings of the Executive Committee. The overall internal control environment and risk management programme including financial risk management is reviewed by the Audit Committee on behalf of the Board.
The risk management framework aims to:
- improve financial risk awareness and risk transparency
- identify, control and monitor key risks
- identify risk accumulations
- �provide management with reliable information on the Company’s risk situation
- improve financial returns
Treasury managementTreasury management focuses on liability management, capital protection, liquidity maintenance and yield maximisation. The treasury policies are approved by the Committee of the Board. Daily treasury operations of the business units are managed by their respective finance teams within the framework of the overall Group treasury policies. Long-term fund raising including strategic treasury initiatives are managed jointly by the business treasury team and the central
team at corporate treasury while short-term funding for routine working capital requirements is delegated to business units. A monthly reporting system exists to inform senior management of the Company’s investments and debt position, exposure to currency, commodity and interest rate risk and their mitigants including the derivative position. The Company has a strong system of internal control which enables effective monitoring of adherence to Company’s policies. The internal control measures are effectively supplemented by regular internal audits.
The investment portfolio at the Company is independently reviewed by CRISIL Limited and Company portfolio has been rated as Tier I or “Very Good” meaning highest safety. The investments are made keeping in mind safety, liquidity and yield maximisation.
The Company uses derivative instruments to manage the exposure in foreign currency exchange rates, interest rates and commodity prices. The Company does not acquire or issue derivative financial instruments for trading or speculative purposes. The Company does not enter into complex derivative transactions to manage the treasury and commodity risks. Both treasury and commodities derivative transactions are normally in the form of forward contracts, interest rate and currency swaps and these are in line with the Company's policies.
Commodity price riskThe Company is exposed to the movement of base metal commodity prices on the London Metal Exchange. Any decline in the prices of the base metals that the Company produces and sells will have an immediate and direct impact on the profitability of the businesses. As a general policy, the Company aims to sell the products at prevailing market prices. The commodity price risk in imported input commodity such as of Alumina, anodes, etc., for our aluminium and copper business respectively, is hedged on back-to-back basis ensuring no price risk for the business. Hedging is used primarily as a risk management tool and, in some cases, to secure future cash flows in cases of high volatility by entering into forward contracts or similar instruments. The hedging activities are subject to strict limits set out by the Board and to a strictly defined internal control and monitoring mechanism. Decisions relating to hedging of commodities are taken at the Executive Committee level, basis clearly laid down guidelines.
Whilst the Company aims to achieve average LME prices for a month or a year, average realised prices may not necessarily reflect the LME price movements because of a variety of reasons such as uneven sales during the year and timing of shipments.
STANDALONE NOTES FORMING PART OF THE FINANCIAL STATEMENTSas at and for the year ended March 1 2020
STANDALONE NOTES FORMING PART OF THE FINANCIAL STATEMENTSas at and for the year ended March 1 2020
INTEGRATED REPORT MANAGEMENT REVIEW STATUTORY REPORTS FINANCIAL STATEMENTS
06-115 116-167 168-270 271-502

338 VEDANTA LIMITED INTEGRATED REPORT AND ANNUAL ACCOUNTS 2019-20 VEDANTA LIMITED INTEGRATED REPORT AND ANNUAL ACCOUNTS 2019-20 339
As at arch 20(` in Crore)
Payments due by year 1 year 1-3 years 3-5 years 5 years Total
Borrowings * 24,348 16,599 3,281 5,334 49,562Derivative financial liabilities 343 - - - 343Trade Payables and other financial liabilities **
17,612 42 - - 17,654
Total 42,303 16,641 3,281 5,334 67,559
*Includes Non-current borrowings, current borrowings, current maturities of non-current borrowings and committed interest payments on borrowings and interest accrued on borrowings.
**Includes both Non-current and current financial liabilities and committed interest payment, as applicable. Excludes current maturities of non-current borrowings and interest accrued on borrowings.
The Company had access to ollo ing unding acilities:As at arch 2020
(` in Crore)Funding facilities Total Facility Drawn Undrawn
Fund/non-fund based 40,620 33,281 7,339
As at arch 20(` in Crore)
Funding facilities Total Facility Drawn Undrawn
Fund/non-fund based 42,378 31,582 10,796
CollateralThe Company has pledged financial instruments with carrying amount of ` 11,069 Crore and inventories with carrying amount of ` 5,689 Crore as per the requirements specified in various financial facilities in place. The counterparties have an obligation to release the securities to the Company when financial facilities are surrendered.
b Foreign exchange risFluctuations in foreign currency exchange rates may have an impact on the statement of profit and loss, the statement of changes in equity, where any transaction references more than one currency or where assets/liabilities are denominated in a currency other than the functional currency of the Company.
Exposures on foreign currency loans are managed through the Company wide hedging policy, which is reviewed periodically to ensure that the results from fluctuating currency exchange rates are appropriately managed. The Company strives to achieve asset liability offset of foreign currency exposures and only the net position is hedged.
The Company’s presentation currency is the Indian Rupee (INR). The assets are located in India and the Indian Rupee is the functional currency except for Oil and Gas business operations which have a dual functional currency. Natural hedges available in the business are identified at each entity level and hedges are placed only for the net exposure. Short-term net exposures are hedged progressively based on their maturity. A more conservative approach has been adopted for project expenditures to avoid budget overruns, where cost of the project is calculated taking into account the hedge cost. The hedge mechanisms are reviewed periodically to ensure that the risk from fluctuating currency exchange rates is appropriately managed.
The following analysis is based on the gross exposure as at the reporting date which could affect the statement of profit and loss. The exposure is mitigated by some of the derivative contracts entered into by the Company as disclosed under the section on “Derivative financial instruments .
The above sensitivities are based on volumes, costs, exchange rates and other variables and provide the estimated impact of a change in LME prices on profit and equity assuming that all other variables remain constant. A 10% decrease in LME prices would have an equal and opposite effect on the Company’s financial statements.
The impact on pre-tax profit/(loss) mentioned above includes the impact of a 10% increase in closing copper LME for provisionally priced copper concentrate purchased at Copper division custom smelting operations in India of ` 79 Crore loss (March 31, 2019: ` 74 Crore loss), which is pass through in nature and as such will not have any impact on the profitability.
Financial riskThe Company’s Board approved financial risk policies include monitoring, measuring and mitigating the liquidity, currency, interest rate and counterparty risk. The Company does not engage in speculative treasury activity but seeks to manage risk and optimise interest and commodity pricing through proven financial instruments.
a i uidityThe Company requires funds both for short-term operational needs as well as for long-term investment programmes mainly in growth projects. The Company generates sufficient cash flows from the current operations which together with the available cash and cash equivalents and short-term investments provide liquidity both in the short-term as well as in the long-term. The Company has been rated by CRISIL Limited (CRISIL) and India Ratings and Research Private Limited (India Rating) for its capital market issuance in the form of CPs and NCDs and for its banking facilities in line with Basel II norms.
CRISIL affirmed our rating for the Company’s long-term bank facilities and its Non-Convertible Debentures (NCD) programme to CRISIL AA / Stable during the year. India Ratings has revised the outlook on Vedanta Limited’s ratings to IND AA / Negative from IND AA/ Stable on account of delay in deleveraging due to sharp fall in commodity prices and delay in volume ramp-up in key business segments. Vedanta Limited has the highest short-term rating on its working capital and Commercial Paper Programme at A1+ from CRISIL and India Ratings.
On April 3, 2020, CRISIL has revised the rating outlook on the long-term bank facilities and Non-Convertible Debentures (NCD) programme from Stable to Negative, while reaffirming the rating at AA on account of weaker commodity prices in wake of COVID-19 pandemic. On May 22, 2020, India Ratings downgraded Vedanta Ltd to AA-/ Negative outlook from AA / Negative outlook on account of higher expected balance sheet leverage due to substantial decline in economic activity in the wake of COVID-19 lockdown and elevated refinancing risk.
Anticipated future cash flows, together with undrawn fund based committed facilities of ` 820 Crore, and cash, bank and current investments of ` 5,028 Crore as at March 31, 2020, are expected to be sufficient to meet the liquidity requirement of the Company in the near future.
The Company remains committed to maintaining a healthy liquidity, a low gearing ratio, deleveraging and strengthening our balance sheet. The maturity profile of the Company’s financial liabilities based on the remaining period from the date of balance sheet to the contractual maturity date is given in the table below. The figures reflect the contractual undiscounted cash obligation of the Company.
As at arch 2020(` in Crore)
Payments due by year 1 year 1-3 years 3-5 years 5 years Total
Borrowings * 20,416 16,105 3,725 7,033 47,279 Derivative financial liabilities 38 9 - - 47 Lease liability 231 26 23 22 302 Trade Payables and other financial liabilities **
17,937 47 - - 17,984
Total 38,622 16,187 3,748 7,055 65,612
STANDALONE NOTES FORMING PART OF THE FINANCIAL STATEMENTSas at and for the year ended March 1 2020
STANDALONE NOTES FORMING PART OF THE FINANCIAL STATEMENTSas at and for the year ended March 1 2020
INTEGRATED REPORT MANAGEMENT REVIEW STATUTORY REPORTS FINANCIAL STATEMENTS
06-115 116-167 168-270 271-502

340 VEDANTA LIMITED INTEGRATED REPORT AND ANNUAL ACCOUNTS 2019-20 VEDANTA LIMITED INTEGRATED REPORT AND ANNUAL ACCOUNTS 2019-20 341
The exposure of the Company’s financial assets as at March 31, 2020 to interest rate risk is as follows:(` in Crore)
As at March 31, 2020 TotalFloating rate
Financial assetsFixed rate
financial assets
Non-interest bearing financial
assets
Financial Assets 14,410 1,121 4,466 8,823
The exposure of the Company’s financial liabilities as at March 31, 2020 to interest rate risk is as follows:(` in Crore)
As at March 31, 2020 TotalFloating rate
Financial assetsFixed rate
financial assets
Non-interest bearing financial
assets
Financial Liabilities 58,283 19,174 27,260 11,849
The exposure of the Company’s financial assets as at March 31, 2019 to interest rate risk is as follows:(` in Crore)
As at March 31, 2019 TotalFloating rate
Financial assetsFixed rate
financial assets
Non-interest bearing financial
assets
Financial Assets 15,208 2,937 2,941 9,330
The exposure of the Company’s financial liabilities as at March 31, 2019 to interest rate risk is as follows:(` in Crore)
As at March 31, 2019 TotalFloating rate
Financial assetsFixed rate
financial assets
Non-interest bearing financial
assets
Financial Liabilities 61,070 15,589 32,544 12,937
Considering the net debt position as at March 31, 2020 and the investment in bank deposits, corporate bonds and debt mutual funds, any increase in interest rates would result in a net loss and any decrease in interest rates would result in a net gain. The sensitivity analysis below has been determined based on the exposure to interest rates for financial instruments at the balance sheet date.
The table below illustrates the impact of a 0.5% to 2.0% movement in interest rates on floating rate financial assets/ liabilities (net) on profit/(loss) and equity assuming that the changes occur at the reporting date and has been calculated based on risk exposure outstanding as of that date. The year end balances are not necessarily representative of the average debt outstanding during the year. This analysis also assumes that all other variables, in particular foreign currency rates, remain constant.
(` in Crore)
Increase in interest rates
Effect on pre-tax profit/(loss) during the year ended
March 31, 2020
Effect on pre-tax profit/(loss) during the year ended
March 31, 2019
0.50% (90) (63)1.00% (181) (127)2.00% (361) (253)
An equivalent reduction in interest rates would have an equal and opposite effect on the Company’s financial statements.
(d) Counterparty and concentration of credit riskCredit risk refers to the risk that counterparty will default on its contractual obligations resulting in financial loss to the Company. The Company has adopted a policy of only dealing with creditworthy counterparties and obtaining sufficient collateral, where appropriate, as a means of mitigating the risk of financial loss from defaults.
The Company is exposed to credit risk from trade receivables, contract assets, investments, loans, other financial assets, and derivative financial instruments.
Credit risk on receivables is limited as almost all credit sales are against letters of credit and guarantees of banks of national standing.
The carrying amount of the Company's financial assets and liabilities in different currencies are as follows:(` in Crore)
CurrencyAs at March 31, 2020 As at March 31, 2019
Financial Assets Financial liabilities Financial Assets Financial liabilities
INR 8,611 40,961 8,355 46,288 USD 5,648 17,290 6,850 14,502 Others 151 32 3 280 Total 14,410 58,283 15,208 61,070
The Company’s exposure to foreign currency arises where an entity holds monetary assets and liabilities denominated in a currency different to the functional currency of the respective business, with US dollar being the major non-functional currency.
The foreign exchange rate sensitivity is calculated by the aggregation of the net foreign exchange rate exposure with a simultaneous parallel foreign exchange
rates shift in the foreign currencies by 10% against the functional currency of the respective businesses.
Set out below is the impact of a 10% strengthening in the functional currencies of the respective businesses on pre-tax profit/(loss) and pre-tax equity arising as a result of the revaluation of the Company’s foreign currency monetary financial assets/liabilities:
For the year ended arch 2020(` in Crore)
Effect of 10% strengthening of functional
currency on pre-tax profit/ (loss)Effect of 10% strengthening
of foreign currency on equity
USD 860 0 INR 93 -
For the year ended arch 20(` in Crore)
Effect of 10% strengthening of functional
currency on pre-tax profit/ (loss)Effect of 10% strengthening
of foreign currency on equity
USD 481 0 INR 46 -
A 10% weakening of functional currencies of the respective businesses would have an equal and opposite effect on the Company’s financial statements.
c nterest rate risAt March 31, 2020, the Company’s net debt of 33,909 Crore (March 31, 2019: 33,935 Crore) comprises cash, bank and investments of 5,028 Crore (March 31, 2019: 8,269 Crore) offset by debt of 38,937 Crore (March
31, 2019: 42,204 Crore).
The Company is exposed to interest rate risk on short-term and long-term floating rate instruments and on the refinancing of fixed rate debt. The Company’s policy is to maintain a balance of fixed and floating interest rate borrowings and the proportion of fixed and floating rate debt is determined by current market interest rates. The borrowings of the Company are principally denominated in Indian Rupees and US dollars with mix of fixed and floating rates of interest. The USD
floating rate debt is linked to US dollar LIBOR and INR Floating rate debt to Bank’s base rate. The Company has a policy of selectively using interest rate swaps, option contracts and other derivative instruments to manage its exposure to interest rate movements. These exposures are reviewed by appropriate levels of management on a monthly basis. The Company invests cash and liquid investments in short-term deposits and debt mutual funds, some of which generate a tax-free return, to achieve the Company’s goal of maintaining liquidity, carrying manageable risk and achieving satisfactory returns.
Floating rate financial assets are largely mutual fund investments which have debt securities as underlying assets. The returns from these financial assets are linked to market interest rate movements; however the counterparty invests in the agreed securities with known maturity tenure and return and hence has manageable risk.
STANDALONE NOTES FORMING PART OF THE FINANCIAL STATEMENTSas at and for the year ended March 1 2020
STANDALONE NOTES FORMING PART OF THE FINANCIAL STATEMENTSas at and for the year ended March 1 2020
INTEGRATED REPORT MANAGEMENT REVIEW STATUTORY REPORTS FINANCIAL STATEMENTS
06-115 116-167 168-270 271-502

342 VEDANTA LIMITED INTEGRATED REPORT AND ANNUAL ACCOUNTS 2019-20 VEDANTA LIMITED INTEGRATED REPORT AND ANNUAL ACCOUNTS 2019-20 343
D. Derivative financial instrumentsThe Company uses derivative instruments as part of its management of exposure to fluctuations in foreign currency exchange rates, interest rates and commodity prices. The Company does not acquire or issue derivative financial instruments for trading or speculative purposes. The Company does not enter into complex derivative transactions to manage the treasury and commodity risks. Both treasury and commodities derivative transactions are normally in the form of forward contracts and these are subject to the Company guidelines and policies.
The fair values of all derivatives are separately recorded in the balance sheet within current and non-current assets and liabilities. Derivatives that are designated as hedges are classified as current or non-current depending on the maturity of the derivative.
The use of derivatives can give rise to credit and market risk. The Company tries to control credit risk as far as possible by only entering into contracts with reputable banks and financial institutions. The use of derivative instruments is subject to limits, authorities and regular monitoring by appropriate levels of management. The limits, authorities and monitoring systems are periodically reviewed by management and the Board. The market risk on derivatives is mitigated by changes in the valuation of the underlying assets, liabilities or transactions, as derivatives are used only for risk management purposes.
(i) Cash ow hedgesThe Company enters into forward exchange and commodity price contracts for hedging highly probable forecast transaction and account for them as cash flow hedges and states them at fair value. Subsequent changes in fair value are recognised in equity through OCI until the hedged transaction occurs, at which time, the respective gain or losses are reclassified to profit or loss. These hedges have been effective for the year ended March 31, 2020.
The Company uses foreign exchange contracts from time to time to optimise currency risk exposure on its foreign currency transactions. The Company hedged part of its foreign currency exposure on capital commitments during the year ended 2020. Fair value changes on such forward contracts are recognised in other comprehensive income.
The majority of cash flow hedges taken out by the Company during the year comprise non-derivative hedging instruments for hedging the foreign exchange rate of highly probable forecast transactions and commodity price contracts for hedging the commodity price risk of highly probable forecast transactions.
The cash flows related to above are expected to occur during the year ended March 31, 2021 and consequently may impact profit or loss for that year depending upon the change in the commodity prices and foreign exchange rates movements. For cash flow hedges regarded as basis adjustments to initial carrying value of the property, plant and equipment, the depreciation on the basis adjustments made is expected to affect profit or loss over the expected useful life of the property, plant and equipment.
(ii) Fair value hedgeThe fair value hedges relate to forward covers taken to hedge currency exposure and commodity price risks.
The Company’s sales are on a quotational period basis, generally one month to three months after the date of delivery at a customer’s facility. The Company enters into forward contracts for the respective quotational period to hedge its commodity price risk based on average LME prices. Gains and losses on these hedge transactions are substantially offset by the amount of gains or losses on the underlying sales. Net gains and losses are recognised in the statement of profit and loss.
The Company uses foreign exchange contracts from time to time to optimise currency risk exposure on its foreign currency transactions. Fair value changes on such forward contracts are recognised in the statement of profit and loss.
(iii) Non-designated economic hedgeThe Company enters into derivative contracts which are not designated as hedges for accounting purposes, but provide an economic hedge of a particular transaction risk or a risk component of a transaction. Hedging instruments include copper, aluminium future contracts on the LME and certain other derivative instruments. Fair value changes on such derivative instruments are recognised in the statement of profit and loss.
Moreover, given the diverse nature of the Company’s businesses trade receivables are spread over a number of customers with no significant concentration of credit risk. The history of trade receivables shows a negligible provision for bad and doubtful debts. Therefore, the Company does not expect any material risk on account of non-performance by any of the Company’s counterparties.
The Company has clearly defined policies to mitigate counterparty risks. For current investments, counterparty limits are in place to limit the amount of credit exposure to any one counterparty. This, therefore, results in diversification of credit risk for our mutual fund and bond investments. For derivative and financial instruments, the Company attempts to limit the credit risk by only dealing with reputable banks and financial institutions.
The carrying value of the financial assets represents the maximum credit exposure. The Company’s maximum exposure to credit risk is 14,410 Crore and 15,208
Crore as at March 31, 2020 and March 31, 2019 respectively.
The maximum credit exposure on financial guarantees given by the Company for various financial facilities is described in Note 35 on “Commitments, contingencies, and guarantees”.
None of the Company’s cash equivalents, including time deposits with banks, are past due or impaired. Regarding trade receivables, loans and other financial assets (both current and non-current), there were no indications as at March 31, 2020, that defaults in payment obligations will occur except as described in Note 7 and 9 on allowance for impairment of trade receivables and other financial assets.
Of the year end trade receivables, loans and other financial assets (excluding bank deposits, site restoration fund and derivatives) balance the following, though overdue, are expected to be realised in the normal course of business and hence, are not considered impaired as at March 31, 2020 and March 31, 2019:
(` in Crore)
ParticularsAs at
March 31, 2020As at
March 31, 2019
Neither impaired nor past due 5,792 4,514 Past due but not impaired- Less than 1 month 523 292 - Between 1–3 months 664 140 - Between 3–12 months 195 728 - Greater than 12 months 1,154 739 Total 8,328 6,413
Receivables are deemed to be past due or impaired with reference to the Company’s normal terms and conditions of business. These terms and conditions are determined on a case to case basis with reference to the customer’s credit quality and prevailing market conditions. Receivables that are classified as ‘past due’ in the above tables are those that have not been settled within the terms and conditions that have been
agreed with that customer. The Company based on past experiences does not expect any material loss on its receivables.
The credit quality of the Company’s customers is monitored on an ongoing basis. Where receivables have been impaired, the Group actively seeks to recover the amounts in question and enforce compliance with credit terms.
Movement in allowances for Financial Assets (Trade receivables and financial assets - others)The changes in the allowance for financial assets (current and non-current) is as follows:
(` in Crore)
ParticularsTrade
receivablesFinancial
assets - others
As at April 1, 2018 521 198 Allowance made during the year 4 48 Reversals/write-off during the year 0 (5)Exchange differences 0 7 As at March 31, 2019 525 248Allowance made during the year 16 401 Reversals/write-off during the year (17) - Exchange differences 0 22 As at March 31, 2020 524 671
STANDALONE NOTES FORMING PART OF THE FINANCIAL STATEMENTSas at and for the year ended March 1 2020
STANDALONE NOTES FORMING PART OF THE FINANCIAL STATEMENTSas at and for the year ended March 1 2020
INTEGRATED REPORT MANAGEMENT REVIEW STATUTORY REPORTS FINANCIAL STATEMENTS
06-115 116-167 168-270 271-502
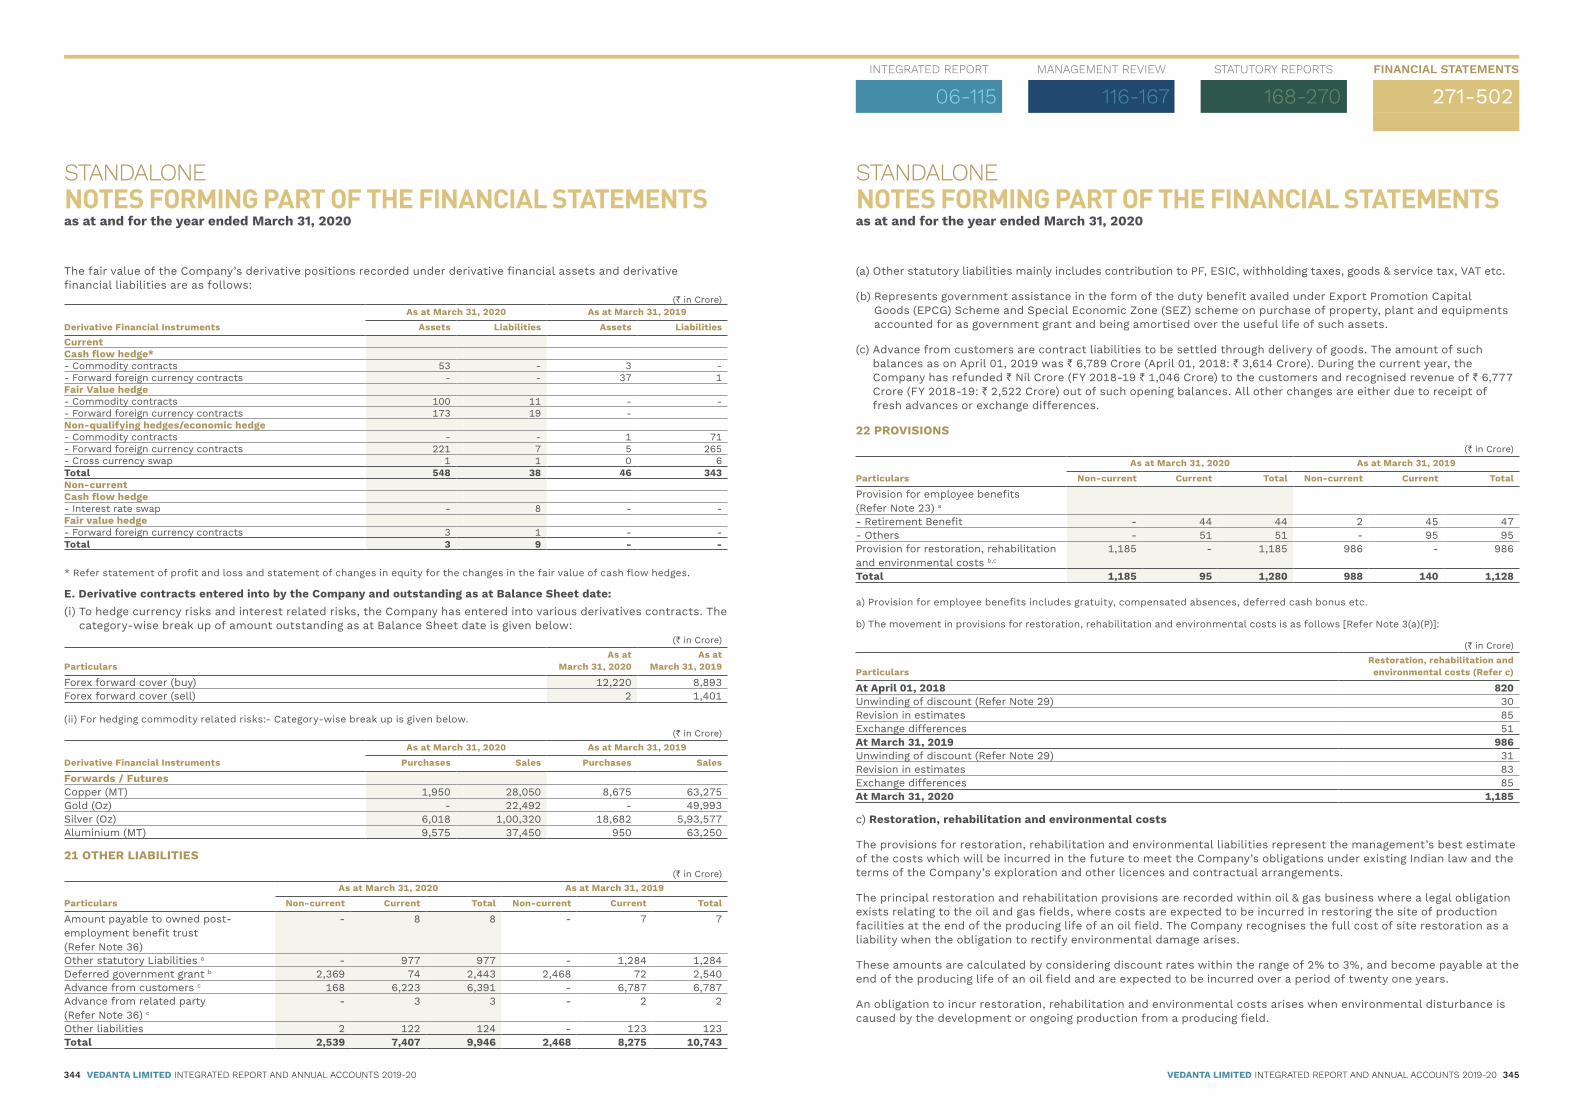
344 VEDANTA LIMITED INTEGRATED REPORT AND ANNUAL ACCOUNTS 2019-20 VEDANTA LIMITED INTEGRATED REPORT AND ANNUAL ACCOUNTS 2019-20 345
(a) Other statutory liabilities mainly includes contribution to PF, ESIC, withholding taxes, goods & service tax, VAT etc.
(b) �Represents government assistance in the form of the duty benefit availed under Export Promotion Capital Goods (EPCG) Scheme and Special Economic Zone (SEZ) scheme on purchase of property, plant and equipments accounted for as government grant and being amortised over the useful life of such assets.
(c) �Advance from customers are contract liabilities to be settled through delivery of goods. The amount of such balances as on April 01, 2019 was ` 6,789 Crore (April 01, 2018: ` 3,614 Crore). During the current year, the Company has refunded ` Nil Crore (FY 2018-19 ` 1,046 Crore) to the customers and recognised revenue of ` 6,777 Crore (FY 2018-19: ` 2,522 Crore) out of such opening balances. All other changes are either due to receipt of fresh advances or exchange differences.
22 PROVISIONS(` in Crore)
ParticularsAs at March 31, 2020 As at March 31, 2019
Non-current Current Total Non-current Current Total
Provision for employee benefits (Refer Note 23) a
- Retirement Benefit - 44 44 2 45 47- Others - 51 51 - 95 95Provision for restoration, rehabilitation and environmental costs b,c
1,185 - 1,185 986 - 986
Total 1,185 95 1,280 988 140 1,128
a) Provision for employee benefits includes gratuity, compensated absences, deferred cash bonus etc.
b) The movement in provisions for restoration, rehabilitation and environmental costs is as follows [Refer Note 3(a)(P)]:
(` in Crore)
ParticularsRestoration, rehabilitation and environmental costs (Refer c)
At April 01, 2018 820 Unwinding of discount (Refer Note 29) 30 Revision in estimates 85 Exchange differences 51 At March 31, 2019 986 Unwinding of discount (Refer Note 29) 31 Revision in estimates 83 Exchange differences 85 At March 31, 2020 1,185
c) Restoration, rehabilitation and environmental costs
The provisions for restoration, rehabilitation and environmental liabilities represent the management’s best estimate of the costs which will be incurred in the future to meet the Company’s obligations under existing Indian law and the terms of the Company’s exploration and other licences and contractual arrangements.
The principal restoration and rehabilitation provisions are recorded within oil & gas business where a legal obligation exists relating to the oil and gas fields, where costs are expected to be incurred in restoring the site of production facilities at the end of the producing life of an oil field. The Company recognises the full cost of site restoration as a liability when the obligation to rectify environmental damage arises.
These amounts are calculated by considering discount rates within the range of 2% to 3%, and become payable at the end of the producing life of an oil field and are expected to be incurred over a period of twenty one years.
An obligation to incur restoration, rehabilitation and environmental costs arises when environmental disturbance is caused by the development or ongoing production from a producing field.
The fair value of the Company’s derivative positions recorded under derivative financial assets and derivative financial liabilities are as follows:
(` in Crore)
Derivative Financial InstrumentsAs at March 31, 2020 As at March 31, 2019
Assets Liabilities Assets LiabilitiesCurrentCash ow hedge*- Commodity contracts 53 - 3 - - Forward foreign currency contracts - - 37 1 Fair Value hedge- Commodity contracts 100 11 - - - Forward foreign currency contracts 173 19 - Non-qualifying hedges/economic hedge- Commodity contracts - - 1 71 - Forward foreign currency contracts 221 7 5 265 - Cross currency swap 1 1 0 6 Total 548 38 46 343 Non-currentCash ow hedge- Interest rate swap - 8 - - Fair value hedge- Forward foreign currency contracts 3 1 - - Total 3 9 - -
* Refer statement of profit and loss and statement of changes in equity for the changes in the fair value of cash flow hedges.
E. Derivative contracts entered into by the Company and outstanding as at Balance Sheet date:(i) �To hedge currency risks and interest related risks, the Company has entered into various derivatives contracts. The
category-wise break up of amount outstanding as at Balance Sheet date is given below:(` in Crore)
ParticularsAs at
March 31, 2020As at
March 31, 2019
Forex forward cover (buy) 12,220 8,893 Forex forward cover (sell) 2 1,401
(ii) For hedging commodity related risks:- Category-wise break up is given below.(` in Crore)
Derivative Financial InstrumentsAs at March 31, 2020 As at March 31, 2019
Purchases Sales Purchases Sales
Forwards / FuturesCopper (MT) 1,950 28,050 8,675 63,275 Gold (Oz) - 22,492 - 49,993 Silver (Oz) 6,018 1,00,320 18,682 5,93,577 Aluminium (MT) 9,575 37,450 950 63,250
21 OTHER LIABILITIES(` in Crore)
ParticularsAs at March 31, 2020 As at March 31, 2019
Non-current Current Total Non-current Current Total
Amount payable to owned post-employment benefit trust (Refer Note 36)
- 8 8 - 7 7
Other statutory Liabilities a - 977 977 - 1,284 1,284Deferred government grant b 2,369 74 2,443 2,468 72 2,540Advance from customers c 168 6,223 6,391 - 6,787 6,787Advance from related party (Refer Note 36) c
- 3 3 - 2 2
Other liabilities 2 122 124 - 123 123Total 2,539 7,407 9,946 2,468 8,275 10,743
STANDALONE NOTES FORMING PART OF THE FINANCIAL STATEMENTSas at and for the year ended March 1 2020
STANDALONE NOTES FORMING PART OF THE FINANCIAL STATEMENTSas at and for the year ended March 1 2020
INTEGRATED REPORT MANAGEMENT REVIEW STATUTORY REPORTS FINANCIAL STATEMENTS
06-115 116-167 168-270 271-502

346 VEDANTA LIMITED INTEGRATED REPORT AND ANNUAL ACCOUNTS 2019-20 VEDANTA LIMITED INTEGRATED REPORT AND ANNUAL ACCOUNTS 2019-20 347
ii) Defined benefit plans(a) Contribution to provident fund trust (the trust )The provident fund of the Iron Ore division is exempted under Section 17 of The Employees Provident Fund and Miscellaneous Provisions Act, 1952. Conditions for grant of exemption stipulates that the employer shall make good deficiency, if any, between the return guaranteed by the statute and actual earning of the Fund. Based on actuarial valuation in accordance with Ind AS 19 and Guidance note issued by Institute of Actuaries of India for interest rate guarantee of exempted provident fund
liability of employees, there is no interest shortfall in the funds managed by the trust and hence there is no further liability as on March 31, 2020 and March 31, 2019. Having regard to the assets of the Fund and the return on the investments, the Company does not expect any deficiency in the foreseeable future.
The Company contributed a total of ` 4 Crore for the year ended March 31,2020 and ` 9 Crore for the year ended March 31, 2019, The present value of obligation and the fair value of plan assets of the trust are summarised below.
(` in Crore)
ParticularsYear ended
March 31, 2020Year ended
March 31, 2019
Fair value of plan assets 208 193 Present value of defined benefit obligations (202) (187)Net liability arising from defined benefit obligation of trust Nil Nil
Percentage allocation o plan assets o trust
Assets by categoryAs at
March 31, 2020As at
March 31, 2019
Government Securities 59% 59%Debentures / bonds 36% 37%Equity 5% 4%Fixed deposits 0% 0%
The remeasurement loss of ` 7 Crore has been charged to other comprehensive income (OCI) during the year.
(b) Gratuity planIn accordance with the Payment of Gratuity Act, 1972, the Company contributes to a defined benefit plan (the “Gratuity Plan”) covering certain categories of employees. The Gratuity Plan provides a lump sum payment to vested employees at retirement, disability or termination of employment being an amount based on the respective employee’s last drawn salary and the number of years of employment with the Company. The
Gratuity plan is a funded plan and the Company makes contribution to recognised funds in India.
Based on actuarial valuations conducted as at year end using the projected unit credit method, a provision is recognised in full for the benefit obligation over and above the funds held in the Gratuity Plan.
The iron ore and oil & gas division of the Company have constituted a trust recognised by Indian Income Tax Authorities for gratuity to employees, contributions to the trust are funded with Life Insurance Corporation of India (LIC) and ICICI Prudential Life Insurance Company Limited.
Principal actuarial assumptionsPrincipal actuarial assumptions used to determine the present value of the Gratuity plan obligation are as follows:
ParticularsAs at
March 31, 2020As at
March 31, 2019
Discount rate 6.80% 7.80%Expected rate of increase in compensation level of covered employees 2%-10% 2%-10%In service mortality IALM (2012-14) IALM (2006-08)Post retirement mortality LIC(1996-98)
UltimateLIC(1996-98)
Ultimate
23 EMPLOYEE BENEFIT PLANSThe Company participates in defined contribution and benefit plans, the assets of which are held (where funded) in separately administered funds.
For defined contribution plans the amount charged to the statement of profit and loss is the total amount of contributions payable in the year.
For defined benefit plans, the cost of providing benefits under the plans is determined by actuarial valuation
separately each year for each plan using the projected unit credit method by independent qualified actuaries as at the year end. Remeasurement gains and losses arising in the year are recognised in full in other comprehensive income for the year.
i) Defined contribution plansThe Company contributed a total of ` 68 Crore for the year ended March 31, 2020 and ` 63 Crore for the year ended March 31, 2019 to the following defined contribution plans.
(` in Crore)
ParticularsYear ended
March 31, 2020Year ended
March 31, 2019
Employer’s contribution to recognised provident fund and family pension fund 50 46 Employer’s contribution to superannuation and National Pension Scheme 18 17 Total 68 63
Central recognised provident fundIn accordance with the ‘The Employees Provident and Miscellaneous Provisions Act, 1952’, employees are entitled to receive benefits under the Provident Fund. Both the employee and the employer make monthly contributions to the plan at a predetermined rate (12% for the year ended March 31, 2020 and March 31, 2019) of an employee’s basic salary. All employees have an option to make additional voluntary contributions. These contributions are made to the fund administered and managed by the Government of India (GOI) or to independently managed and approved funds. The Company has no further obligations under the fund managed by the GOI beyond its monthly contributions which are charged to the statement of profit and loss in the period they are incurred.
Family pension fundThe Pension Fund was established in 1995 and is managed by the Government of India. The employee makes no contribution to this fund but the employer makes a contribution of 8.33% of salary each month subject to a specified ceiling per employee. This is provided for every permanent employee on the payroll.
At the age of superannuation, contributions ceases and the individual receives a monthly payment based on the level of contributions through the years, and on their salary scale at the time they retire, subject to a maximum ceiling of salary level. The Government funds these payments, thus the Company has no additional liability beyond the contributions that it makes, regardless of whether the central fund is in surplus or deficit.
uperannuationSuperannuation, another pension scheme applicable in India, is applicable only to senior executives. The Company holds a policy with Life Insurance Corporation of India (“LIC”), to which it contributes a fixed amount relating to superannuation and the pension annuity is met by LIC as required, taking into consideration the contributions made. The Company has no further obligations under the scheme beyond its monthly contributions which are charged to the statement of profit and loss in the year they are incurred.
ational Pension chemeNational Pension Scheme is a retirement savings account for social security and welfare applicable for executives covered under the superannuation benefit of Vedanta Limited, on a choice basis. It was introduced to enable employees to select the treatment of superannuation component of their fixed salaries and avail the benefits offered by National Pension Scheme launched by Government of India. Vedanta Limited holds a corporate account with one of the pension fund managers authorised by the Government of India to which the Company contributes a fixed amount relating to superannuation and the pension annuity will be met by the fund manager as per rules of National Pension Scheme. The Company has no further obligations under the scheme beyond its monthly contributions which are charged to the statement of profit and loss in the year they are incurred.
STANDALONE NOTES FORMING PART OF THE FINANCIAL STATEMENTSas at and for the year ended March 1 2020
STANDALONE NOTES FORMING PART OF THE FINANCIAL STATEMENTSas at and for the year ended March 1 2020
INTEGRATED REPORT MANAGEMENT REVIEW STATUTORY REPORTS FINANCIAL STATEMENTS
06-115 116-167 168-270 271-502

348 VEDANTA LIMITED INTEGRATED REPORT AND ANNUAL ACCOUNTS 2019-20 VEDANTA LIMITED INTEGRATED REPORT AND ANNUAL ACCOUNTS 2019-20 349
ensitivity analysisBelow is the sensitivity analysis determined for significant actuarial assumptions for the determination of defined benefit obligations and based on reasonably possible changes of the respective assumptions occurring at the end of the reporting period while holding all other assumptions constant.
(` in Crore)
Increase / (Decrease) in defined benefit obligationAs at
March 31, 2020As at
March 31, 2019
Discount rateIncrease by 0.50% (8) (7)Decrease by 0.50% 9 8 Expected rate of increase in compensation level of covered employeesIncrease by 0.50% 9 8 Decrease by 0.50% (8) (7)
The above sensitivity analysis may not be representative of the actual benefit obligation as it is unlikely that the change in assumptions would occur in isolation of one another as some of the assumptions may be correlated.
In presenting the above sensitivity analysis, the present value of defined benefit obligation has been calculated using the projected unit credit method at the end of reporting period, which is the same as that applied in calculating the defined benefit obligation liability recognised in the balance sheet.
Ris analysisCompany is exposed to a number of risks in the defined benefit plans. Most significant risks pertaining to defined benefit plans and management's estimation of the impact of these risks are as follows:
nvestment risThe Gratuity plan is funded with Life Insurance Corporation of India (LIC) and ICICI Prudential Life (ICICI). Company does not have any liberty to manage the fund provided to LIC and ICICI.
The present value of the defined benefit plan obligation is calculated using a discount rate determined by reference to Government of India bonds. If the return on plan asset is below this rate, it will create a plan deficit.
nterest risA decrease in the interest rate on plan assets will increase the net plan obligation.
ongevity ris i e expectancyThe present value of the defined benefit plan obligation is calculated by reference to the best estimate of the mortality of plan participants both during and at the end of the employment. An increase in the life expectancy of the plan participants will increase the plan obligation.
alary gro th risThe present value of the defined benefit plan obligation is calculated by reference to the future salaries of plan participants. An increase in the salary of the plan participants will increase the plan obligation.
24 EMPLOYEE BENEFITS EXPENSE a, b
(` in Crore)
ParticularsYear ended
March 31, 2020Year ended
March 31, 2019
Salaries and Wages 1,119 1,257 Share based payments (Refer Note 25) 40 62 Contributions to provident and other funds (Refer Note 23) 90 89 Staff welfare expenses 92 95 Less: Cost allocated/directly booked in Joint ventures (576) (641)Total 765 862
a) Net of recoveries of ` 66 Crore (March 31, 2019: ` 83 Crore) from subsidiaries.
b) Net of capitalisation of ` 59 Crore (March 31, 2019: Nil Crore).
Amount recognised in the balance sheet consists of:(` in Crore)
ParticularsAs at
March 31, 2020As at
March 31, 2019
Fair value of plan assets 145 131 Present value of defined benefit obligations (189) (178)Net liability arising from defined benefit obligation (44) (47)
Amount recognised in the statement of profit and loss in respect of the Gratuity plan are as follows:(` in Crore)
ParticularsYear ended
March 31, 2020Year ended
March 31, 2019
Current service cost 18 17 Net interest cost 4 3 Components of defined benefit costs recognised in profit or loss 22 20
Amount recognised in other comprehensive income in respect of the Gratuity plan are as follows:(` in Crore)
ParticularsYear ended
March 31, 2020Year ended
March 31, 2019
Re-measurement of the net defined benefit obligation:-Actuarial losses / (gains) arising from demographic adjustments (1) - Actuarial losses / (gains) arising from experience adjustments (6) 3 Actuarial losses / (gains) arising from changes in financial assumptions 10 0 Losses / (gains) on plan assets 1 1 Components of defined benefit costs recognised in other comprehensive income 4 4
Movement in present value of the Gratuity plan:(` in Crore)
ParticularsYear ended
March 31, 2020Year ended
March 31, 2019
Opening balance 178 161 Current service cost 18 17 Benefits paid (24) (15)Interest cost 14 12 Actuarial losses / (gains) arising from changes in assumptions 3 3 Closing balance 189 178
Movement in the fair value of Gratuity plan assets is as follows:(` in Crore)
ParticularsYear ended
March 31, 2020Year ended
March 31, 2019
Opening balance 131 123Contributions received 29 16Benefits paid (24) (16)Re-measurement loss arising from return on plan assets (1) (1)Interest income 10 9Closing balance 145 131
The above plan assets have been invested in the qualified insurance policies.
The actual return on plan assets was ` 9 Crore for the year ended March 31, 2020 and ` 8 Crore for the year ended March 31, 2019.
The weighted average duration of the defined benefit obligation is 16.50 years and 16.98 years as at March 31, 2020 and March 31, 2019 respectively.
The Company expects to contribute ` 22 Crore to the funded defined benefit plans in during the year ended March 31, 2021.
STANDALONE NOTES FORMING PART OF THE FINANCIAL STATEMENTSas at and for the year ended March 1 2020
STANDALONE NOTES FORMING PART OF THE FINANCIAL STATEMENTSas at and for the year ended March 1 2020
INTEGRATED REPORT MANAGEMENT REVIEW STATUTORY REPORTS FINANCIAL STATEMENTS
06-115 116-167 168-270 271-502

350 VEDANTA LIMITED INTEGRATED REPORT AND ANNUAL ACCOUNTS 2019-20 VEDANTA LIMITED INTEGRATED REPORT AND ANNUAL ACCOUNTS 2019-20 351
The fair value of all options has been determined at the date of grant of the option allowing for the effect of any market-based performance conditions. This fair value, adjusted by the Group’s estimate of the number of options that will eventually vest as a result of non-market conditions, is expensed over the vesting period.
Business Performance-Based and Sustained Individual Performance-Based Options:The fair values of stock options following these types of vesting conditions have been estimating using the Black-Scholes-Merton Option Pricing model. The value arrived at under this model has been then multiplied by the expected % vesting based on business performance conditions (only for business performance-based options) and the expected multiplier on account of sustained individual performance (for both type of options). The inputs used in the Black-Scholes-Merton Option Pricing model include the share price considered as of the valuation date, exercise price as per the scheme/ plan of the options, expected dividend yield (estimated based on actual/ expected dividend trend of the Company), expected tenure (estimated as the remaining vesting period of the options), the risk-free rate (considered as the zero coupon yield as of the valuation date for a term commensurate with the expected tenure of the options) and expected volatility (estimated based on the historical volatility of the return in company’s share prices for a term commensurate with the expected tenure of the options). The exercise period of 6 months post vesting period has not been considered as the options are
expected to be exercised immediately post the completion of the vesting period.
Total Shareholder Returns-Based Options:The fair values of stock options following this type of vesting condition has been estimated using the Monte Carlo Simulation method. This method has been used to simulate the expected share prices for Vedanta Limited and the companies of the comparator group over the vesting period of the options. Based on the simulated prices, the expected pay-off at the end of the vesting period has been estimated and present valued to the valuation date. Further, based on the simulated share prices and expected dividends the relative rank of Vedanta Limited’s share price return has been estimated vis- -vis the Indian and Global Group of the comparator group. This rank has been used to estimate expected % vesting of the options under this type of vesting condition. The inputs to the monte carlo simulation method include expected tenure (estimated as the remaining vesting period of the options), the risk-free rate (considered as the zero coupon yield as of the valuation date for a term commensurate with the expected tenure of the options), expected dividend yield (estimated based on the actual dividend trend of the companies), expected volatility (estimated based on the historical volatility of the return in the Company’s share prices for a term commensurate with the expected tenure of the options). The exercise period of 6 months post the vesting period has not been considered as the options are expected to be exercised immediately post the completion of the vesting period.
The assumptions used in the calculations of the charge in respect of the ESOS options granted during the year ended March 31, 2020 and March 31, 2019 are set out below:
ParticularsYear ended March 31, 2020 Year ended March 31, 2019
ESOS 2019 ESOS November 2018
Number of Options Cash settled - 847,830 equity settled - 1,67,13,640
Cash settled - 2,47,870 equity settled - 1,37,93,980
Exercise Price ` 1 ` 1Share Price at the date of grant ` 144.60 ` 195.00Contractual Life 3 years 3 yearsExpected Volatility 36.64% 44.3%Expected option life 3 years 3 yearsExpected dividends 7.96% 6.50%Risk free interest rate 5.68% 7.70%Expected annual forfeitures 10%p.a. 10%p.a.Fair value per option granted (Non-market performance based and market performance based)
` 102.30/ ` 72.12 ` 159.9/` 96.3
Weighted average share price at the date of exercise of stock options was ` 126.02 (March 31, 2019: NA).
The weighted average remaining contractual life for the share options outstanding was 2.28 years (March 31, 2019: 2.32 years).
25 SHARE BASED PAYMENTSThe Company offers equity based and cash based option plans to its employees, officers and directors through the Company's stock option plan introduced in 2016, Cairn India's stock option plan now administered by the Company pursuant to merger with the Company and Vedanta Resources Limited (earlier known as Vedanta Resources Plc) plans [Vedanta Resources Long-Term Incentive Plan ( LTIP ), Employee Share Ownership Plan ( ESOP ), Performance Share Plan (“PSP”) and Deferred Share Bonus Plan ( DSBP )] collectively referred as 'VRL ESOP' scheme.
The Vedanta Limited Employee Stock Option Scheme (ESOS) 2016The Company introduced an Employee Stock Option Scheme 2016 (“ESOS”), which was approved by the Vedanta Limited shareholders to provide equity settled incentive to all employees of the Company including subsidiary companies. The ESOS scheme includes tenure based, business performance based(EBITDA) and market performance based stock options. The maximum value of options that can be awarded to members of the wider management group is calculated
by reference to the grade average cost-to-company ( CTC ) and individual grade of the employee. The performance conditions attached to the option is measured by comparing Company’s performance in terms of Total Shareholder Return ( TSR ) over the performance period with the performance of two group of comparator companies (i.e. Indian and global comparator companies) defined in the scheme. The extent to which an option vests will depend on the Company's TSR rank against a group or groups of peer companies at the end of the performance period and as moderated by the Remuneration Committee.
Options granted during the year ended March 31, 2020 includes business performance based, sustained individual performance based and market performance based stock options. Business performances will be measured using Volume, Cost, Net Sales Realisation, EBITDA or a combination of these for the respective business/ SBU entities.
The exercise price of the options is ` 1 per share and the performance period is three years, with no re-testing being allowed.
The details of share options for the year ended March 31, 2020 is presented below:
Financial Year of Grant Exercise Period
Options outstanding
April 01, 2019
Options granted
during the year
Options transferred
from Parent/ fellow
subsidiaries
Options forfeited
during the year
Options exercised
during the year*
Options outstanding
March 31, 2020
Options exercisable
March 31, 2020
2016-17 December 15, 2019 -June 14, 2020 65,08,226 - - 48,19,269 6,20,441 10,68,516 10,68,5162017-18 September 1, 2020 - February 28, 2021 82,74,393 - - 12,46,468 - 70,27,925 -2017-18 October 16, 2020 - April 15, 2021 11,126 - - - - 11,126 -2017-18 November 1, 2020 - April 30, 2021 27,638 - - 27,638 - - -2018-19 November 1, 2021 - April 30, 2022 1,35,66,200 - - 21,46,154 - 1,14,20,046 -2018-19 Cash settled 2,24,840 - 1,00,470 1,46,984 - 1,78,326 -2019-20 November 29, 2022 - May 28, 2023 - 1,67,13,640 - 8,32,310 - 1,58,81,330 -2019-20 Cash settled - 8,47,830 - 1,12,460 - 7,35,370 -
2,86,12,423 1,75,61,470 1,00,470 93,31,283 6,20,441 3,63,22,639 10,68,516
*Excludes 58,420 options exercised during the year regarding which the transaction could not be completed before March 31, 2020 and hence, the corresponding shares were not transferred to the concerned employees.
The details of share options for the year ended March 31, 2019 is presented below:
Financial Year of Grant Exercise Period
Options outstanding
April 01, 2018
Options granted
during the year
Options transferred
from Parent/ fellow
subsidiaries
Options forfeited
during the year
Options exercised
during the year
Options outstanding
March 31, 2019
Options exercisable
March 31, 2019
2016-17 December 15, 2019 -June 14, 2020 70,98,602 - - 5,90,376 - 65,08,226 - 2017-18 September 1, 2020 - February 28, 2021 96,17,340 - - 13,42,947 - 82,74,393 - 2017-18 October 16, 2020 - April 15, 2021 11,570 - - 444 - 11,126 - 2017-18 November 1, 2020 - April 30, 2021 28,740 - - 1,102 - 27,638 - 2018-19 November 1, 2021 - April 30, 2022 - 1,37,93,980 - 2,27,780 - 1,35,66,200 - 2018-19 Cash settled - 2,47,870 - 23,030 - 2,24,840 -
1,67,56,252 1,40,41,850 - 21,85,679 - 2,86,12,423 -
STANDALONE NOTES FORMING PART OF THE FINANCIAL STATEMENTSas at and for the year ended March 1 2020
STANDALONE NOTES FORMING PART OF THE FINANCIAL STATEMENTSas at and for the year ended March 1 2020
INTEGRATED REPORT MANAGEMENT REVIEW STATUTORY REPORTS FINANCIAL STATEMENTS
06-115 116-167 168-270 271-502

352 VEDANTA LIMITED INTEGRATED REPORT AND ANNUAL ACCOUNTS 2019-20 VEDANTA LIMITED INTEGRATED REPORT AND ANNUAL ACCOUNTS 2019-20 353
26 A) REVENUE FROM OPERATIONS(` in Crore)
ParticularsYear ended
March 31, 2020Year ended
March 31, 2019
Sale of products 34,986 37,760Sale of services 431 338Total 35,417 38,098
a) Revenue from sale of products and from sale of services for the year ended March 31, 2020 includes revenue from contracts with customers of ` 35,125 Crore (FY 2018-19: ` 38,111 Crore) and a net loss on mark-to-market of ` 346 Crore (FY 2018-19: ` 13 Crore) on account of gains/ losses relating to sales that were provisionally priced as at March 31, 2019 with the final price settled in the current year, gains/ losses relating to sales fully priced during the year, and marked to market gains/ losses relating to sales that were provisionally priced as at March 31, 2020.
b) Government of India (GoI) vide Office Memorandum (“OM”) No. O-19025/10/2005-ONG-DV dated February 01, 2013 allowed for Exploration in the Mining Lease Area after expiry of Exploration period and prescribed the mechanism for recovery of such Exploration Cost incurred. Vide another Memorandum dated October 24, 2019, GoI clarified that all approved Exploration costs incurred on Exploration activities, both successful and unsuccessful, are recoverable in the manner as prescribed in the OM and as per the provisions of PSC. Accordingly, during the current year, the Company has recognised revenue of ` 638 Crore, for past exploration costs, through increased share in the joint operations revenue as the Company believes that cost recovery mechanism prescribed under OM for profit petroleum payable to GoI is not applicable to its Joint operation partner, view which is also supported by an independent legal opinion. However, the Joint operation partner carries a different understanding and the matter is pending resolution.
c) Majority of the Company’s sales are against advance or are against letters of credit/ cash against documents/ guarantees of banks of national standing. Where sales are made on credit, the amount of consideration does not contain any significant financing component as payment terms are within three months.
As per the terms of the contract with its customers, either all performance obligations are to be completed within one year from the date of such contracts or the Company has a right to receive consideration from its customers for all completed performance obligations. Accordingly, the Company has availed the practical expedient available under paragraph 121 of Ind AS 115 and dispensed with the additional disclosures with respect to performance obligations that remained unsatisfied (or partially unsatisfied) at the balance sheet date. Further, since the terms of the contracts directly identify the transaction price for each of the completed performance obligations there are no elements of transaction price which have not been included in the revenue recognised in the financial statements. Further, there is no material difference between the contract price and the revenue from contract with customers.
B) OTHER OPERATING INCOME
(` in Crore)
ParticularsYear ended
March 31, 2020Year ended
March 31, 2019
Export incentives 291 322Scrap sales 76 87Miscellaneous income 74 137Total 441 546
The Company recognised total expenses of ` 75 Crore (March 31, 2019: ` 82 Crore) related to equity settled share-based payment transactions for the year ended March 31, 2020 out of which ` 33 Crore (March 31, 2019: ` 30 Crore) was recovered from group companies. The total expense recognised on account of cash settled share based plan during the year ended March 31, 2020 is ` 0 Crore (March 31, 2019: ` 0 Crore) and the carrying value of cash settled share based compensation liability as at March 31, 2020 is ` 0 Crore (March 31, 2019: ` 0 Crore).
Employee stock option plans of erstwhile Cairn India Limited:The Company has provided CIESOP share based payment scheme to its employees.
CIESOP planThere are no specific vesting conditions under CIESOP plan other than completion of the minimum service period of 3 years from the date of grant. Phantom options are exercisable proportionate to the period of service rendered by the employee subject to completion of one year. The exercise period is 7 years from the vesting date.
Details of employees stock option plans is presented below:
CIESOP Plan
Year ended March 31, 2020 Year ended March 31, 2019
Number of options
Weighted average exercise
price in `Number of
options
Weighted average exercise
price in `
Outstanding at the beginning of the year 64,77,059 279.2 71,30,625 275.5Granted during the year Nil NA Nil NAExpired during the year 6,58,663 200.1 90,896 187.0Exercised during the year Nil NA 2,35,169 189.0Forfeited / cancelled during the year 4,76,656 288.1 3,27,501 287.2Outstanding at the end of the year 53,41,740 288.2 64,77,059 279.2Exercisable at the end of the year 53,41,740 288.2 64,77,059 279.2
Weighted average share price at the date of exercise of stock options is ` NA (March 31, 2019: ` 232.7).
SchemeRange of exercise
price in `
Weighted average remaining contractual life
of options (in years)
Weighted average exercise
price in `
The details of exercise price for stock options outstanding as at March 31, 2020 are:CIESOP Plan 286.85-291.25 1.46 288.2The details of exercise price for stock options outstanding as at March 31, 2019 are:CIESOP Plan 200.05-291.25 2.24 279.2
Employee share option plan of Vedanta Resources Limited (earlier known as Vedanta Resources Plc)The value of shares that are awarded to members of the Company is calculated by reference to the individual fixed salary and share-based remuneration consistent with local market practice. ESOP scheme of Vedanta Resources Limited is both tenure and performance based share schemes. The options are indexed to and settled by Parent’s shares (Vedanta Resources Limited shares as defined in the scheme). The options have a fixed exercise price denominated in Parent's functional currency (10 US cents per share), the performance period of each option is three years and is exercisable within a period of six months from the date of vesting beyond which the option lapses.
During the previous year, through an open offer all the outstanding equity settled options were bought back by Vedanta Resources Limited's parent, Volcan Investments Limited. On account of delisting of Vedanta Resources Limited, the cash based options were also early settled. The accelerated charge on account of early settlement of both the equity settled and cash settled options was recognised in the Statement of Profit and Loss.
Amount recovered by the Parent and recognised by the Company for the year ended March 31, 2019 is ` 11 Crore. The Company considers these amounts as not material and accordingly has not provided further disclosures.
Out of the total expense of ` 42 Crore (March 31, 2019: ` 63 Crore) pertaining to above options for the year ended March 31, 2020, the Company has capitalised ` 2 Crore (March 31, 2019: ` 1 Crore) expense for the year ended March 31, 2020.
STANDALONE NOTES FORMING PART OF THE FINANCIAL STATEMENTSas at and for the year ended March 1 2020
STANDALONE NOTES FORMING PART OF THE FINANCIAL STATEMENTSas at and for the year ended March 1 2020
INTEGRATED REPORT MANAGEMENT REVIEW STATUTORY REPORTS FINANCIAL STATEMENTS
06-115 116-167 168-270 271-502

354 VEDANTA LIMITED INTEGRATED REPORT AND ANNUAL ACCOUNTS 2019-20 VEDANTA LIMITED INTEGRATED REPORT AND ANNUAL ACCOUNTS 2019-20 355
30 OTHER EXPENSES *(` in Crore)
ParticularsYear ended
March 31, 2020Year ended
March 31, 2019
Cess on crude oil 1,174 1,492 Royalty 242 175 Consumption of stores and spare parts 720 560 Repairs to plant and equipment 404 276 Carriage 424 550 Mine Expenses 136 82 Net loss on foreign currency transactions and translation 494 319 Other Selling Expenses 2 13 Repairs to building 56 101 Insurance 76 72 Repairs others 77 72 Loss on sale/ discard of property, plant and equipment (net) 77 76 Rent d 11 45 Rates and taxes 25 13 Amortisation of prepaid lease charges 0 3 Exploration costs written-off (Refer Note 5) 1 48 Directors sitting fees and commission 8 5 Remuneration to Auditors a 12 12 Provision for doubtful advances/ expected credit loss 51 (6)Bad debts written off 17 6 Share of expenses in producing oil & gas 1,323 1,227 Donation 115 61 Miscellaneous expenses b,c 2,247 1,998 Less: Cost allocated/directly booked in Joint ventures (304) (388)Total 7,388 6,812
* Net of recoveries of ` 56 Crore (March 31, 2019: ` 62 Crore) from subsidiaries
a) Remuneration to auditors comprises of:
(` in Crore)
ParticularsYear ended
March 31, 2020Year ended
March 31, 2019
Payment to auditors� For statutory audit (including quarterly reviews and international reporting) 9 9 � For parent company reporting 2 2 � For certification services 1 0 � For other services 0 1 � For reimbursement of expenses 0 0 Total 12 12
b) Includes Corporate social responsibility expenses of ` 53 Crore (March 31, 2019: ` 52 Crore) as detailed in note 39(a).
c) �The Company made contributions through electoral bonds of ` 114 Crore (March 31, 2019: ` 65 Crore) and to an electoral trust ` 0 Crore (March 31, 2019: ` 3 Crore) for the year ended March 31, 2020, which is included in Miscellaneous expenses.
d) Rent for the year ended March 31, 2020 represents expense on short-term/ low value leases.
27 OTHER INCOME(` in Crore)
ParticularsYear ended
March 31, 2020Year ended
March 31, 2019
Net gain on investments measured at FVTPL 152 96 Interest income from investments measured at FVTPL 119 124 Interest income from financial assets at amortised cost- Bank Deposits 71 67 - Loans 102 27 - Others 163 122 Interest on income tax refund - 106 Dividend income from- financial assets at FVTPL 15 15 - financial assets at FVOCI 2 1 - investment in Subsidiaries 2,125 5,485 Deferred government grant income 74 72 Miscellaneous income 47 37 Total 2,870 6,152
28 CHANGES IN INVENTORIES OF FINISHED GOODS, WORK-IN-PROGRESS AND STOCK-IN-TRADE(` in Crore)
ParticularsYear ended
March 31, 2020Year ended
March 31, 2019
Opening Stock:Finished Goods 880 364 Work-in-progess 1,195 1,811 Total 2,075 2,175 Add / (Less): Foreign exchange translation difference 4 4 Less: Closing StockFinished Goods 465 880 Work-in-progess 1,835 1,195 Total 2,300 2,075 Sub-total (221) 104 Add / (Less): Copper Concentrate (raw material) sold during the year 1,651 203 Changes in Inventory 1,430 307
29 FINANCE COST(` in Crore)
ParticularsYear ended
March 31, 2020Year ended
March 31, 2019
Interest expense on financial liabilities at amortised cost a,c 3,863 4,076 Other finance costs 111 215 Net interest on defined benefit arrangement 4 3 Unwinding of discount on provisions (Refer Note 22) 31 30 Less: Allocated to Joint venture (8) 0 Less: Capitalisation of finance costs b (Refer Note 5) (673) (567)Total 3,328 3,757
a) Includes NIL Crore (March 31, 2019: ` 130 Crore) on redeemable preference shares.
b) Interest rate of 7.71% (March 31, 2019: 7.50%) was used to determine the amount of general borrowing costs eligible for capitalisation in respect of qualifying asset for the year ended March 31, 2020.
c) Includes interest expense on lease liabilities for the year ended March 31, 2020 ` 16 Crore.
STANDALONE NOTES FORMING PART OF THE FINANCIAL STATEMENTSas at and for the year ended March 1 2020
STANDALONE NOTES FORMING PART OF THE FINANCIAL STATEMENTSas at and for the year ended March 1 2020
INTEGRATED REPORT MANAGEMENT REVIEW STATUTORY REPORTS FINANCIAL STATEMENTS
06-115 116-167 168-270 271-502

356 VEDANTA LIMITED INTEGRATED REPORT AND ANNUAL ACCOUNTS 2019-20 VEDANTA LIMITED INTEGRATED REPORT AND ANNUAL ACCOUNTS 2019-20 357
iii) Impairment charge of ` 532 Crore in exploration block KG-OSN-2009/3, was provided for as the Government of India approval on extension and grant of excusable delay is awaited for.
iv) During the year ended March 31, 2019, the Company has recognised impairment reversal of ` 261 Crore in respect of Oil & Gas Block KG-ONN-2003/1 (CGU) on booking of commercial reserves and subsequent commencement of commercial production. The impairment reversal has been recorded against Oil & Gas producing facilities. The recoverable amount of the Company’s share in KG-ONN-2003/1 (CGU) was determined to be ` 208 Crore (US$ 30 million).
The recoverable amount of the KG-ONN-2003/1 CGU was determined based on the fair value less costs of disposal approach, a level-3 valuation technique in the fair value hierarchy, as it more accurately reflects the recoverable amount based on Company’s view of the assumptions that would be used by a market participant. This is based on the cash flows expected to be generated by the projected oil and natural gas production profiles up to the expected dates of cessation of production sharing contract (PSC)/cessation of production from each producing field based on the current estimates of reserves and risked resources. Reserves assumptions for fair value less costs of disposal tests consider all reserves that a market participant would consider when valuing the asset, which are usually broader in scope than the reserves used in a value-in-use test. Discounted cash flow analysis used to calculate fair value less costs of disposal uses assumption for short-term oil price of US$ 62 per barrel for the year ended March 31, 2019 and scales upto long-term nominal price of US$ 65 per barrel by year ended March 31, 2022 derived from a consensus of various analyst recommendations. Thereafter, these have been escalated at a rate of 2.5% per annum. The cash flows are discounted using the post-tax nominal discount rate of 11.8% derived from the post-tax weighted average cost of capital. The sensitivities around change in crude price and discount rate are not material to the financial statements.
b) Refer Note 3(c)(A)(vii) for impairment in copper segment.
c) As at March 31, 2020, the Company has an outstanding receivable equivalent to ` 106 Crore (net of provision of ` 52 Crore) from Konkola Copper Mines Plc (KCM), predominantly regarding monies advanced against future purchase of copper cathode/anode.
A provisional liquidator was appointed to manage KCM’s affairs on May 21, 2019, after ZCCM Investments Holdings Plc (ZCCM-IH), an entity majorly owned by the Government of Zambia and a 20.6% shareholder in KCM, filed a winding up petition against KCM. KCM’s majority shareholder, Vedanta Resources Holdings Limited (VRHL), and its parent company, Vedanta Resources Limited (VRL), are contesting the winding up petition in the Zambian courts. The appeal was listed for hearing on March 25, 2020 but has been adjourned due to COVID-19 pandemic. In the meantime, the winding up petition continues to be stayed, pending the decision on VRHL’s application regarding arbitration.
VRHL and VRL had also commenced arbitration proceedings against ZCCM-IH with seat in Johannesburg consistent with their position that arbitration is the agreed dispute resolution process. Hearing is expected in January 2021. Meanwhile, KCM has not been supplying goods to the Company, which it was supposed to as per the terms of the advance.
The Company has recognised provision of ` 52 Crore during the current year and based on its assessment considering the actions taken by VRL and VRHL, believes that there is a high probability of success and has thus continued to treat balance receivables as recoverable.
d) During the year ended March 31, 2020, a parcel of land relating to the Iron Ore business having carrying value of ` 349 Crore was reclassified from freehold land to other financial asset due to an ongoing legal dispute relating to title of the land. Subsequently, during the year, the financial asset was fully provided for and recognised under exceptional items.
e) During the year ended March 31, 2020 and March 31, 2019 the Company has recognised net impairment charge of ` 3,393 Crore and reversal of ` 4 Crore respectively, on its investment in subsidiaries, comprising of:
(` in Crore)
ParticularsYear ended
March 31, 2020Year ended
March 31, 2019
Impairment (charge)/reversal on investment in Cairn India Holdings Limited (Refer (i) below) (3,339) 52 Impairment charge on investment in Sesa Resources Limited (Refer (ii) below) (54) (48)Net Impairment (Charge)/reversal on investment in subsidiaries (3,393) 4
(i) During the year ended March 31, 2020, the Company has provided for diminution in value of its investment in CIHL (a 100% subsidiary of the Company) of ` 3,339 Crore consequent to a reduction in recoverable value of PPE in RJ block held through its step-down 100% subsidiary Cairn Energy Hydrocarbon Limited (CEHL) due to reduction in crude prices and also due to reduction in value of its investment in AvanStrate Inc. (ASI).
(ii) During the year ended March 31, 2020, the Company has made a provision for impairment relating to investment in Sesa Resources Limited of ` 54 Crore based on expected realisation in view of prevailing mining ban in Goa pursuant to an order passed by the Hon’ble Supreme Court of India on February 7, 2018.
31 EXCEPTIONAL ITEMS(` in Crore)
Particulars
Year ended March 31, 2020 Year ended March 31, 2019
Exceptional Items
Tax effect of exceptional
items
Exceptional items
after tax Exceptional
Items
Tax effect of exceptional
items
Exceptional items
after tax
Impairment (charge)/ reversal- relating to property, plant and equipment and exploration assets - Oil & gas segment a
(8,273) 2,875 (5,398) 261 (91) 170
- relating to property, plant and equipment and other assets - Copper segment b
(669) 234 (435) - - -
Provision on receivables subject to litigations c,d
(401) 93 (308) - - -
Net (Charge) /reversal of impairment on investment in subsidiaries e
(3,393) - (3,393) 4 - 4
Revision of Renewable Purchase Obligation (RPO) pursuant to the Odisha Electricity Regulatory Commission notification f
168 (59) 109 - - -
Reversal pursuant to Supreme Court order/ arbitration order g
- - - 59 (21) 38
Total (12,568) 3,143 (9,425) 324 (112) 212
a) During the year ended March 31, 2020 and March 31, 2019, the Company has recognised impairment charge of ` 8,273 Crore and reversal of ` 261 Crore respectively, on its assets in the oil and gas segment comprising of:
i) Impairment charge of ` 7,516 Crore relating to Rajasthan oil and gas block (“RJ CGU”) triggered by the significant fall in the crude oil prices. Of this charge, ` 7,071 Crore impairment charge has been recorded against oil and gas producing facilities and ` 445 Crore impairment charge has been recorded against exploration intangible assets under development. The valuation remains dependent on price and further changes in long-term prices may result in changes to impairment.
For oil & gas assets, CGU's identified are on the basis of a production sharing contract (PSC) level, as it is the smallest group of assets that generates cash inflows that are largely independent of the cash inflows from other assets or group of assets.
The recoverable amount of the RJ CGU of ` 5,585 Crore (US$ 747 million) was determined based on the fair value less costs of disposal approach, a level-3 valuation technique in the fair value hierarchy, as it more accurately reflects the recoverable amount based on our view of the assumptions that would be used by a market participant. This is based on the cash flows expected to be generated by the projected oil and natural gas production profiles up to the expected dates of cessation of production sharing contract (PSC)/cessation of production from each producing field based on the current estimates of reserves and risked resources. Reserves assumptions for fair value less costs of disposal tests consider all reserves that a market participant would consider when valuing the asset,
which are usually broader in scope than the reserves used in a value-in-use test. Discounted cash flow analysis used to calculate fair value less costs of disposal uses assumption for short-term oil price of US$ 38 per barrel for the next one year and scales upto long-term nominal price of US$ 57 per barrel, three years thereafter, derived from a consensus of various analyst recommendations. Thereafter, these have been escalated at a rate of 2% per annum. The cash flows are discounted using the post-tax nominal discount rate of 10.35% derived from the post-tax weighted average cost of capital after factoring the risks ascribed to PSC extension and the successful implementation of key growth projects. Additionally, in computing the recoverable value, the effects of market participant’s response on production sharing contract matters have also been appropriately considered. Based on the sensitivities carried out by the Company, change in crude price assumptions by US$ 1/bbl and changes to discount rate by 1% would lead to a change in recoverable value by ` 181 Crore (US$ 24 million) and ` 257 Crore (US$ 34 million) respectively.
ii) Impairment charge of ` 225 Crore relating to KG-ONN-2003/1 CGU mainly due to the reduction in crude oil price forecast.
The recoverable amount of the CGU was determined to be ` 147 Crore (US $ 20 million) based on fair value less cost of disposal approach as described in above paragraph. Discounted cash flow analysis used to calculate fair value less costs of disposal uses assumption for oil price as described in above paragraph. The cash flows are discounted using the post-tax nominal discount rate of 11.1% derived from post-tax weighted average cost of capital. The sensitivities around change in crude price and discount rate are not material to the financial statements.
STANDALONE NOTES FORMING PART OF THE FINANCIAL STATEMENTSas at and for the year ended March 1 2020
STANDALONE NOTES FORMING PART OF THE FINANCIAL STATEMENTSas at and for the year ended March 1 2020
INTEGRATED REPORT MANAGEMENT REVIEW STATUTORY REPORTS FINANCIAL STATEMENTS
06-115 116-167 168-270 271-502

358 VEDANTA LIMITED INTEGRATED REPORT AND ANNUAL ACCOUNTS 2019-20 VEDANTA LIMITED INTEGRATED REPORT AND ANNUAL ACCOUNTS 2019-20 359
Certain businesses of the Company are eligible for specified tax incentives which are included in the table above as tax holidays and similar exemptions. These are briefly described as under:
The location based exemption: SEZ OperationsIn order to boost industrial development and exports, provided certain conditions are met, profits of undertaking located in Special Economic Zone ('SEZ') may benefit from tax holiday. Such tax holiday works to exempt 100% of the profits for the first five years from the commencement of the tax holiday, 50% of profits for five years thereafter and 50% of the profits for further five years provided the amount allowable in respect of deduction is credited to Special Economic Zone Re-Investment Reserve account. However, such undertaking would continue to be subject to the Minimum Alternative tax ('MAT').
The Company has setup SEZ Operations in its aluminium division (where no benefit has been drawn).
Sectoral Benefit - Power PlantsTo encourage the establishment of certain power plants, provided certain conditions are met, tax incentives exist to exempt 100% of profits and gains for any ten consecutive years within the 15 years period following commencement of the power plant’s operation subject to certain conditions under Section 80IA of the Income Tax Act, 1961. However, such undertakings generating power would continue to be subject to the MAT provisions.
(c) Deferred tax assets/liabilitiesThe Company has accrued significant amounts of deferred tax. The majority of the deferred tax liability represents accelerated tax relief for the depreciation of property, plant and equipment, net of losses carried forward by Vedanta Limited (post the re-organisation) and unused tax credit in the form of MAT credits carried forward. Significant components of Deferred tax (assets) & liabilities recognised in the balance sheet are as follows:
For the year ended March 31, 2020(` in Crore)
Significant components of Deferred tax (assets) & liabilities
Opening balance as at April 01, 2019
Charged / (credited) to statement of
profit and loss
Charged / (credited)
to other comprehensive
income
Exchange difference
transferred to translation
of foreign operation
Charged / (credited) to
equity
Closing balance as
at March 31,2020
Property, Plant and Equipment 7,766 (3,691) - 68 - 4,143Voluntary retirement scheme (3) 2 - - - (1)Employee benefits (19) 2 (4) - - (21)Fair valuation of derivative asset/liability (33) - 17 - - (16)Fair valuation of other asset/liability 112 (27) - - - 85Unused tax asset MAT credit entitlement (3,971) 119 - - 252 (3,600)Unabsorbed depreciation and tax losses (3,524) (128) - - - (3,652)Other temporary differences (331) (12) (59) - - (402)Total (3) (3,735) (46) 68 252 (3,464)
For the year ended March 31, 2019(` in Crore)
Significant components of Deferred tax (assets) & liabilities
Opening balance as at April 1, 2018
Charged / (credited) to statement of
profit and loss
Charged / (credited) to other
comprehensive income
Exchange difference
transferred to translation of
foreign operation
Closing balance as at
March 31,2019
Property, Plant and Equipment 7,195 416 - 155 7,766 Voluntary retirement scheme (6) 3 - - (3)Employee benefits (16) (2) (1) - (19)Fair valuation of derivative asset/liability 4 - (37) - (33)Fair valuation of other asset/liability 138 (26) - - 112 Unused tax asset MAT credit entitlement (3,971) - - - (3,971)Unabsorbed depreciation and tax losses (2,985) (539) - - (3,524)Other temporary differences (333) 15 (13) - (331)Total 26 (133) (51) 155 (3)
f) During the current year, the Company has restated its Renewable Power Obligation (RPO) liability pursuant to Odisha Electricity Regulatory Commission (OERC) notification dated December 31, 2019 which clarified that for CPP’s commissioned before April 01, 2016, RPO should be pegged at the RPO obligation applicable for 2015-16. Based on the notification, liability of the Company's Jharsuguda and Lanjigarh plants have been revised and ` 168 Crore reversal relating to previous years have been recognised under exceptional items.
g) During the year ended March 31, 2019, the Company has partly reversed the provision for interest of ` 59 Crore for dues towards a vendor pursuant to the Hon’ble Supreme Court of India order.
32 TAX EXPENSE(a) Tax (credit)/charge recognised in profit or loss (including on exceptional items)
(` in Crore)
ParticularsYear ended
March 31, 2020Year ended
March 31, 2019
Current tax:Current tax on profit for the year 4 5 Total Current Tax (a) 4 5 Deferred tax:Origination and reversal of temporary differences (592) (244)Credit in respect of deferred tax for earlier years - (1)(Credit)/ Charge in respect of exceptional items (Refer Note 31) (3,143) 112 Total Deferred Tax (b) (3,735) (133)Net tax (benefit) (a+b) (3,731) (128)(Loss)/Profit before tax (10,463) 4,947 Effective income tax rate (%) 36% (3%)
Tax expense(` in Crore)
ParticularsYear ended
March 31, 2020Year ended
March 31, 2019
Tax effect on exceptional items (3,143) 112 Tax expense – others (588) (240)Net tax benefit (3,731) (128)
(b) A reconciliation of income tax (credit)/expense applicable to (loss)/profit before tax at the Indian statutory income tax rate to recognised income tax expense for the year indicated are as follows:
(` in Crore)
ParticularsYear ended
March 31, 2020Year ended
March 31, 2019
(Loss)/Profit before tax (10,463) 4,947 Indian statutory income tax rate 34.944% 34.944%Tax at statutory income tax rate (3,656) 1,729 Disallowable expenses 69 88 Non-taxable income* (49) (1,984)Tax holidays 58 9 Change in deferred tax balances due to change in tax law** (865) - Income subject to lower tax rate (372) - Credit in respect of earlier years - (1)Unrecognised tax assets (Net) 1,185 (30)Charge transferred to Equity (Refer Note 34) (252) - Other permanent differences 151 61 Total (3,731) (128)
*PY includes dividend income received from subsidiary.
** Deferred tax charge for the year ended March 31, 2020 includes deferred tax credit of ` 834 Crore on deferred tax balances as at March 31, 2019 being recognised during the current year (refer note 3(c)(A)(ix)).
STANDALONE NOTES FORMING PART OF THE FINANCIAL STATEMENTSas at and for the year ended March 1 2020
STANDALONE NOTES FORMING PART OF THE FINANCIAL STATEMENTSas at and for the year ended March 1 2020
INTEGRATED REPORT MANAGEMENT REVIEW STATUTORY REPORTS FINANCIAL STATEMENTS
06-115 116-167 168-270 271-502

360 VEDANTA LIMITED INTEGRATED REPORT AND ANNUAL ACCOUNTS 2019-20 VEDANTA LIMITED INTEGRATED REPORT AND ANNUAL ACCOUNTS 2019-20 361
Estimated amount of contracts remaining to be executed on capital accounts and not provided for:(` in Crore)
ParticularsAs at
March 31, 2020As at
March 31, 2019
Oil & Gas sectorCairn India 1,816 2,781 Aluminium sectorLanjigarh Refinery (Phase II) 1,573 1,443 Jharsuguda 1.25 MTPA smelter 414 460 Copper sectorTuticorin Smelter 400 KTPA* 2,791 2,794 Others 732 589 Total 7,326 8,067
*currently contracts are under suspension under the force majeure clause as per the contract
Committed work programme (Other than capital commitment)(` in Crore)
ParticularsAs at
March 31, 2020As at
March 31, 2019
Oil & Gas sectorCairn India (OALP - New Oil and Gas blocks) 5,841 3,811
Other CommitmentsPower Division of the Company has signed a long-term power purchase agreement (PPA) with Gridco Limited for supply of 25% of power generated from the power station with additional right to purchase power (5%/ 7%) at variable cost as per the conditions referred to in PPA. The PPA has a tenure of twenty five years.
B) GuaranteesThe aggregate amount of indemnities and other guarantees on which the Company does not expect any material losses was ` 16,544 Crore (March 31, 2019: `22,074 Crore). The Company has given guarantees in the normal course of business as stated below:
a) Guarantees and bonds advanced to the customs authorities in India of ` 362 Crore relating to the export and payment of import duties on purchases of raw material and capital goods (March 31, 2019: ` 547 Crore).
b) Guarantees issued for Company’s share of minimum work programme commitments of ` 2,906 Crore (March 31, 2019: ` 2,367 Crore).
c) Guarantees of ` 54 Crore issued under bid bond (March 31, 2019: ` 535 Crore).
d) Bank guarantees of ` 115 Crore (March 31, 2019: ` 115 Crore) has been provided by the Company on behalf of Volcan Investments Limited to Income tax department, India as a collateral in respect of certain tax disputes.
e) The Company has given corporate guarantees, bank guarantees and also assigned its bank limits to other group companies majorly in respect of certain short-term and long-term borrowings amounting to ` 10,816 Crore (March 31, 2019: ` 17,004 Crore). Refer Note 36
f) Other guarantees worth ` 2,291 Crore (March 31, 2019: ` 1,506 Crore) issued for securing supplies of materials and services, in lieu of advances received from customers, litigation, for provisional valuation of custom duty and also to various agencies, suppliers and government authorities for various purposes. The Company does not anticipate any liability on these guarantees.
C) Export ObligationsThe Company has export obligations of ` 612 Crore (March 31, 2019: ` 1,211 Crore) on account of concessional rates of import duty paid on capital goods under the Export Promotion Capital Goods Scheme and under the Advance Licence Scheme for the import of raw material laid down by the Government of India.
In the event of the Company’s inability to meet its obligations, the Company’s liability would be ` 84 Crore (March 31, 2019: ` 115 Crore) reduced in proportion to actual exports, plus applicable interest.
The Company has given bonds of ` 88 Crore (March 31, 2019: ` 126 Crore) to custom authorities against these export obligations.
Recognition of deferred tax assets on MAT credit entitlement is based on the Company's present estimates and business plans as per which the same is expected to be utilised within the stipulated fifteen year period from the date of origination. (Refer Note 3(c)(A)(vi))
In addition to above, the Company has not recognised deferred tax asset on deductible temporary differences aggregating to ` 3,393 Crore on account of Impairment of investment in subsidiaries (Refer Note 31(e)) as the timing of realisation of the same is not known as of the balance sheet date.
(d) Non-current tax assetsNon-current tax assets of ` 1,682 Crore and ` 2,175 Crore as at March 31, 2020 and March 31, 2019 respectively mainly represents income tax receivable from Indian tax authorities by Vedanta Limited relating to the refund arising consequent to the Scheme of Amalgamation & Arrangement made effective in August 2013 pursuant to approval by the jurisdiction High Court and receivables relating to matters in tax disputes including tax holiday claim.
33 EARNINGS PER EQUITY SHARE(` in Crore, except otherwise stated)
ParticularsYear ended
March 31, 2020Year ended
March 31, 2019
(Loss)/ Profit after tax attributable to equity share holders for Basic and Diluted EPS (6,732) 5,075 Weighted Average no. of equity shares outstanding during the year for Basic and Dilutive EPS (in Crore)
372 372
Basic and Diluted (Loss)/ Earnings per share (in `) (18.10) 13.65 Nominal value per share (in `) 1.00 1.00
34 DIVIDENDS(` in Crore)
ParticularsYear ended
March 31, 2020Year ended
March 31, 2019
Amounts recognised as distributions to equity shareholders:Interim dividend (March 31, 2020: ` 3.90/- per share, March 31, 2019: ` 17.00/- and ` 1.85/- per share) a
1,444 7,005
Attributable tax on dividend 252 0 Total 1,696 7,005 Preference dividends on redeemable preference shares:Preference dividends for the year: 7.5% p.a b - 130 Dividend distribution tax (DDT) on preference dividend b - - Total - 130
a) The Board of Directors of the Company through resolution passed by circulation on February 27, 2020 have approved first interim dividend of ` 3.90 per equity share i.e. 390% on face value of ` 1/- per share for the financial year 2019-20.
b) Dividend @ 7.5% p.a. on the redeemable preference shares of face value of ` 10/- per preference share for the period from April 01, 2018 to October 27, 2018 as per their terms of issuance was declared during the year ended March 31, 2019. The same has been accounted for as interest cost and has been recorded in the Statement of Profit and Loss. These preference shares were redeemed, along with dividend on October 26, 2018. (Refer Note 29)
35 COMMITMENTS, CONTINGENCIES AND GUARANTEESA) CommitmentsThe Company has a number of continuing operational and financial commitments in the normal course of business including:
� Exploratory mining commitments;
� Oil & gas commitments;
� Mining commitments arising under production sharing agreements; and
� Completion of the construction of certain assets.
STANDALONE NOTES FORMING PART OF THE FINANCIAL STATEMENTSas at and for the year ended March 1 2020
STANDALONE NOTES FORMING PART OF THE FINANCIAL STATEMENTSas at and for the year ended March 1 2020
INTEGRATED REPORT MANAGEMENT REVIEW STATUTORY REPORTS FINANCIAL STATEMENTS
06-115 116-167 168-270 271-502

362 VEDANTA LIMITED INTEGRATED REPORT AND ANNUAL ACCOUNTS 2019-20 VEDANTA LIMITED INTEGRATED REPORT AND ANNUAL ACCOUNTS 2019-20 363
Malaysia i.e. Malaysian Court of Appeal. GOI then filed an appeal at Federal Court of Malaysia. The matter was heard on February 28, 2019 and the Federal Court dismissed GOI’s leave to appeal. The Company has also filed for the enforcement of the Partial Award and Final Award before the Hon'ble Delhi High Court.
ase Development CostRavva joint operations had received a claim from the Ministry of Petroleum and Natural Gas, Government of India (GOI) for the period from 2000-2005 for ` 892 Crore (US$ 129 million) for an alleged underpayment of profit petroleum (by recovering higher Base Development Costs (“BDC”) against the cap imposed in the PSC) to the Government of India (GOI), out of which, Vedanta Limited’s (Cairn India Limited which subsequently merged with Vedanta Limited, accordingly now referred to as Vedanta Limited) share will be ` 201 Crore (US$ 29 million) plus interest. Joint venture partners initiated the arbitration proceedings and Arbitration Tribunal published the Award in January 2011 allowing claimants (including the Company) to recover the development costs spent to the tune of ` 2,080 Crore (US$ 278 million) and disallowed over run of ` 165 Crore (US$ 22 million) spent in respect of BDC along with 50% legal costs. The High Court of Kuala Lumpur as well as the Court of Appeal dismissed GOI’s application of setting aside the part of the Award. GOI challenge to the same before the Federal Court of Malaysia was also dismissed on May 17, 2016. The Company has filed an application for enforcement of award before the Hon'ble Delhi High Court.
In connection with the above two matters, the Company has received an order dated October 22, 2018 from the GOI directing oil marketing companies (OMCs) who are the offtakers of Ravva Crude to divert the sale proceeds to GOI’s account. GOI alleges that the Ravva Joint Operations (consisting of four joint venture partners) has short paid profit petroleum of ` 2,349 Crore (US$ 314 million) (the Company’s share approximately - ` 696 Crore (US$ 93 million)) on account of the two disputed issues of ONGC Carry and BDC matters, out of which ` 479 Crore (US$ 64 million) pertains to ONGC Carry and ` 217 Crore (US$ 29 million) pertains to BDC Matter. Against an interim application, filed by the Company along with one of its joint venture partner, seeking stay of such action from GOI, before the Hon'ble Delhi High Court, where enforcement petitions for both matters are pending, the Court directed the OMCs to deposit above sums to the Court for both BDC and ONGC Carry matters. However, the Company (and other joint venture partner) has been given the liberty to seek withdrawal of the proportionate amounts (fallen due as of the date of Court order) from the Court upon furnishing a
bank guarantee of commensurate value. As on date, the Company has submitted bank guarantee of ` 628 Crore (US$ 84 million) and received the corresponding proceeds.
During the proceedings of the above matter, GOI has also filed an interim application seeking deposit by the said OMCs of an amount of ` 651 Crore (US$ 87 million) (Company’s share of ` 419 Crore (US$ 56 million)) towards interest on the alleged short payment of profit petroleum by the petitioners i.e. the Company (and other joint venture partner). The Hon’ble Delhi High Court vide its order dated February 19, 2020 allowed the petition for enforcement of the arbitration award in relation to BDC including declaratory relief and rejected the objections of GOI.
The interim application filed by GOI and the ONGC Carry matter has been listed for hearing on June 22, 2020. While the Company does not believe the GOI will be successful in its challenge, if the Arbitral Awards in above matters are reversed and such reversals are binding, Company would be liable for approximately ` 479 Crore (US$ 64 million) plus interest. (March 31, 2019: ` 643 Crore (US$ 93 million plus interest)).
c) Proceedings related to the imposition of entry taxThe Company challenged the constitutional validity of the local statutes and related notifications in the states of Odisha and Rajasthan pertaining to the levy of entry tax on the entry of goods brought into the respective states from outside. Post some contradictory orders of High Courts across India adjudicating on similar challenges, the Supreme Court referred the matters to a nine judge bench. Post a detailed hearing, although the bench rejected the compensatory nature of tax as a ground of challenge, it maintained status quo with respect to all other issues which have been left open for adjudication by regular benches hearing the matters.
Following the order of the nine judge bench, the regular bench of the Supreme Court proceeded with hearing the matters. The regular bench remanded the entry tax matters relating to the issue of discrimination against domestic goods bought from other States to the respective High Courts for final determination but retained the issue of jurisdiction for levy on imported goods, for determination by the regular bench of the Supreme Court. Following the order of the Supreme Court, the Company filed writ petitions in respective High Courts.
On October 09, 2017, the Supreme Court has held that states have the jurisdiction to levy entry tax on imported goods. With this Supreme Court judgement, imported goods will rank pari-passu with domestic
D) Contingent LiabilitiesThe Company discloses the following legal and tax cases as contingent liabilities:
a) Vedanta Limited: Income taxIn March 2014, Vedanta Limited (notice was served on Cairn India Limited which subsequently merged with Vedanta Limited, accordingly now referred to as Vedanta Limited) received a show cause notice from the Indian Tax Authorities (‘Tax Authorities’) for not deducting withholding tax on the payments made to Cairn UK Holdings Limited (CUHL), for acquiring shares of Cairn India Holdings Limited (CIHL), as part of their internal reorganisation. The Tax Authorities have stated in the notice that a short-term capital gain has accrued to CUHL on transfer of the shares of CIHL to Vedanta Limited, in the financial year 2006–2007, on which tax should have been withheld by the Company. Pursuant to this, various replies were filed with the Tax Authorities. After several hearings, the Income Tax Authority, in March 2015, issued an order holding the Company as ‘assessee in default’ and raised a demand totalling ` 20,495 Crore (including interest of ` 10,247 Crore). The Company had filed an appeal before the First Appellate Authority, Commissioner of Income Tax (Appeals) which vide order dated July 03, 2017 confirmed the tax demand against the Company. The Company has challenged the Commissioner of Income Tax’s (Appeals) order before the Income Tax Appellate Tribunal (ITAT).
The Company also filed a writ petition before the Delhi High Court wherein it has raised several points for assailing the aforementioned Income Tax Authority’s order. The matter came up for hearing on February 05, 2020 before Delhi High Court but adjourned and the next date of hearing is September 28, 2020.
Separately CUHL, on whom the primary liability of tax lies, had received an Order from the ITAT in the financial year 2016-17 holding that the transaction is taxable in view of the clarification made in the Act but also acknowledged that being a retrospective transaction, interest would not be levied. Hence affirming a demand of ` 10,247 Crore excluding the interest portion that had previously been claimed. The tax department has appealed this order before the Delhi High Court. As a result of the above order from ITAT, the Company considers the risk in respect of the interest portion of claim to be remote. Further, as per the recent recovery notice dated October 12, 2018 received from the Tax Recovery Officer (TRO) appointed for CUHL, tax demand of CUHL of approx. ` 4,996 Crore along with interest is outstanding. Further, in the said notice, tax department had also instructed to remit the preference shares redemption amount including dividend payable thereon to the TRO. Accordingly, amount aggregating
to ` 607 Crore has been paid to the TRO on October 26, 2018 thus reducing the liability to ` 4,389 Crore. The Company has also paid interim dividend of ` 5 Crore to the TRO. Accordingly, the Company has revised the contingent liability to ` 4,384 Crore (March 31, 2019: ` 4,385 Crore). In the event, the case is finally decided against the Company, the demand payable along with interest as per the above mentioned order would be ` 20,495 Crore, of which only ` 4,384 Crore is considered as possible. Separately, but in connection with this litigation, Vedanta Resources Limited has filed a Notice of Claim against the Government of India (‘GOI’) under the UK India Bilateral Investment Treaty (the BIT). The International Arbitration Tribunal passed a favourable order on jurisdiction and Transparency and hearing on merits have been completed in May 2019 and order will be passed in due course. The Government of India has challenged the Jurisdiction and Transparency orders of Arbitration Tribunal before the High Court of Singapore. The Singapore High Court heard the Transparency matter on February 24, 2020 and passed favourable order and held that it will take up the Jurisdiction issue after receiving Tribunal’s award on merits. GOI has appealed the above High Court order before Singapore Supreme Court.
b) Ravva Joint Operations arbitration proceedingsO C CarryThe Ravva Production Sharing Contract (PSC) obliges the contractor parties to pay a proportionate share of ONGC’s exploration, development, production and contract costs in consideration for ONGC’s payment of costs related to the construction and other activities it conducted in Ravva prior to the effective date of the Ravva PSC (the ONGC Carry). The question as to how the ONGC Carry is to be recovered and calculated, along with other issues, was submitted to an International Arbitration Tribunal in August 2002 which rendered a decision on the ONGC Carry in favour of the contractor parties (including Vedanta Limited (Cairn India Limited which subsequently merged with Vedanta Limited, accordingly now referred to as Vedanta Limited)) whereas four other issues were decided in favour of Government of India (GOI) in October 2004 (Partial Award). The GOI then proceeded to challenge the ONGC Carry decision before the Malaysian courts, as Kuala Lumpur was the seat of the arbitration. The Federal Court of Malaysia upheld the Partial Award. As the Partial Award did not quantify the sums, therefore, contractor parties approached the same Arbitration Tribunal to pass a Final Award in the subject matter since it had retained the jurisdiction to do so. The Arbitral Tribunal was reconstituted and the Final Award was passed in October 2016 in Company’s favour. GOI’s challenge of the Final Award has been dismissed by the Malaysian High Court and the next appellate court in
STANDALONE NOTES FORMING PART OF THE FINANCIAL STATEMENTSas at and for the year ended March 1 2020
STANDALONE NOTES FORMING PART OF THE FINANCIAL STATEMENTSas at and for the year ended March 1 2020
INTEGRATED REPORT MANAGEMENT REVIEW STATUTORY REPORTS FINANCIAL STATEMENTS
06-115 116-167 168-270 271-502

364 VEDANTA LIMITED INTEGRATED REPORT AND ANNUAL ACCOUNTS 2019-20 VEDANTA LIMITED INTEGRATED REPORT AND ANNUAL ACCOUNTS 2019-20 365
36 RELATED PARTY DISCLOSURESList of related parties and relationships
A) Entities controlling the Company (Holding Companies) Volcan Investments LimitedVolcan Investments Cyprus LimitedIntermediate Holding CompaniesFinsider International Company LimitedRichter Holdings LimitedTwin Star Holdings LimitedVedanta Resources Cyprus LimitedVedanta Resources Finance LimitedVedanta Resources Holdings LimitedVedanta Resources Limited Welter Trading LimitedWestglobe Limited
B) Fellow Subsidiaries (with whom transactions have taken place)Konkola Copper Mines Plc #Sterlite Iron and Steel Company LimitedSterlite Technologies LimitedSterlite Power Grid Ventures LimitedSterlite Power Transmission limited
C) Associates and Joint ventures (Refer Note 38)
D) SubsidiariesAmica Guesthouse (Proprietary) Limited AvanStrate Inc, JapanAvanStrate Korea Inc, KoreaAvanStrate Taiwan Inc, TaiwanBharat Aluminium Company Limited Black Mountain Mining (Proprietary) Limited Bloom Fountain LimitedCairn Energy Discovery Limited *Cairn Energy Gujarat Block 1 LimitedCairn Energy Hydrocarbons LimitedCairn Energy India (Proprietary) LimitedCairn Exploration (No. 2) Limited *Cairn India Holdings LimitedCairn Lanka (Private) LimitedCairn South Africa (Pty) Limited *CIG Mauritius Holdings Private LimitedCIG Mauritius Private LimitedCopper Mines of Tasmania (Proprietary) Limited Electrosteel Steels LimitedFujairah Gold FZC Goa Sea Port Private LimitedHindustan Zinc Limited Killoran Lisheen Finance Limited Killoran Lisheen Mining Limited Lakomasko BV Lisheen Milling Limited Lisheen Mine Partnership
Malco Energy LimitedMaritime Ventures Private LimitedMonte Cello BVNamzinc (Proprietary) Limited Paradip Multi Cargo Berth Private Limited Sesa Mining Corporation LimitedSesa Resources LimitedSesa Sterlite Mauritius Holdings Limited**Skorpion Mining Company (Proprietary) Limited Skorpion Zinc (Proprietary) Limited Sterlite Ports Limited Talwandi Sabo Power LimitedThalanga Copper Mines (Proprietary) Limited THL Zinc Holding BVTHL Zinc LimitedTHL Zinc Ventures LimitedTHL Zinc Namibia Holdings (Proprietary) LimitedTwin Star Energy Holdings Limited**Vedanta Exploration Ireland Limited Vedanta Lisheen Holdings LimitedTwin Star Mauritius Holdings Limited**Vedanta Lisheen Mining Limited Vizag General Cargo Berth Private Limited Western Cluster LimitedVedanta Star Limited ***
E) Post retirement benefit planSesa Group Employees Provident FundSesa Group Employees Gratuity Fund and Sesa Group Executives Gratuity FundSesa Group Executives Superannuation Scheme Fund
F) Others (with whom transactions have taken place)Vedanta FoundationSesa Community Development FoundationRampia Coal Mines & Energy Private LimitedVedanta Limited ESOS TrustCairn FoundationIndia Grid Trust ****Runaya Refinery LLPJanhit Electoral Trust
* Under liquidation
** Liquidated during the year
*** During the year Vedanta Star Limited (VSL) has been merged with Electrosteel Steels Limited (ESL) w.e.f. March 25, 2020.
**** Ceased to be related party during the year
# Konkola Copper Mines Plc (KCM) ceased to be a related party w.e.f. May 21, 2019. In March, 2020, a provision of ` 52 Crore was recognised in relation to monies advanced to KCM against future purchase of copper cathode/ anode. Refer Note 31(c) for details.
goods for the purpose of levy of Entry tax. The Company has amended its appeal (writ petitions) in Odisha to include imported goods as well. With respect to Rajasthan, the State Government has filed a counter petition in the Rajasthan High Court, whereby it has admitted that it does not intend to levy the entry tax on imported goods.
The issue pertaining to the levy of entry tax on the movement of goods into a Special Economic Zone (SEZ) remains pending before the Odisha High Court. The Company has challenged the levy of entry tax on any movement of goods into SEZ based on the definition of ‘local area’ under the Odisha Entry Tax Act which is very clear and does not include a SEZ. In addition, the Government of Odisha further through its SEZ Policy 2015 and the operational guidelines for administration of this policy dated August 22, 2016, exempted the entry tax levy on SEZ operations.
The total claims against the Company are ` 1,112 Crore (March 31, 2019: ` 1,065 Crore) net of provisions made.
d) Miscellaneous disputes- Income taxThe Company is involved in various tax disputes amounting to ` 527 Crore (March 31, 2019: ` 486 Crore) relating to income tax for the periods for which initial assessments have been completed. These mainly relate to the disallowance of tax holiday for 100% Export Oriented Undertaking under Section 10B of the Income Tax Act, 1961, disallowance of tax holiday benefit on production of gas under Section 80IB of the Income Tax Act, 1961, on account of depreciation disallowances under the Income Tax Act and interest thereon which are pending at various appellate levels.
The Company believes that these disallowances are not tenable and accordingly no provision is considered necessary.
e) Miscellaneous disputes- OthersThe Company is subject to various claims and exposures which arise in the ordinary course of conducting and financing its business from the excise, indirect tax authorities and others. These claims and exposures mostly relate to the assessable values of sales and purchases or to incomplete documentation supporting the Company’s returns or other claims.
The approximate value of claims (excluding the items as set out separately above) against the Company totals to ` 2,139 Crore (March 31, 2019: ` 1,957 Crore)
The Company considers that it can take steps such that the risks can be mitigated and that there are no significant unprovided liabilities arising.
Except as described above, there are no pending litigations which the Company believes could reasonably be expected to have a material adverse effect on the results of operations, cash flows or the financial position of the Company.
E) Operating LeaseRefer to note 3(b) for details of the Company's transition to Ind AS 116 Leases . Commitments disclosed as non-cancellable operating leases under Ind AS 17 Leases have been recorded as lease liabilities from April 1, 2019, with the exception of short-term and low-value leases. Refer to note 20 for the maturity profile of the Company's lease liabilities.
The aggregate amounts of minimum lease payments under non-cancellable operating leases at March 31, 2019, prepared and reported under Ind AS 17 “Leases”, were as follows:
(` in Crore)
ParticularsAs at
March 31, 2019
Within one year 5 Later than one year but not later than five years 6 Later than five years - Total 11
STANDALONE NOTES FORMING PART OF THE FINANCIAL STATEMENTSas at and for the year ended March 1 2020
STANDALONE NOTES FORMING PART OF THE FINANCIAL STATEMENTSas at and for the year ended March 1 2020
INTEGRATED REPORT MANAGEMENT REVIEW STATUTORY REPORTS FINANCIAL STATEMENTS
06-115 116-167 168-270 271-502

366 VEDANTA LIMITED INTEGRATED REPORT AND ANNUAL ACCOUNTS 2019-20 VEDANTA LIMITED INTEGRATED REPORT AND ANNUAL ACCOUNTS 2019-20 367
Remuneration of key management personnel(` in Crore)
ParticularsFor the Year ended
March 31, 2020
Short-term employee benefits* 40Post employment benefits** 8Share based payments 1Total 49
*This includes reimbursement to the parent company for remuneration paid to the CEO and Whole Time Director of the Company aggregating to ` 11 Crore for the year ended March 31, 2020. The Company intends to seek approval of it’s shareholders for this payment at the ensuing annual general meeting. The said KMP has left the Company, subsequent to the Balance sheet date.
** Does not include the provision made for gratuity and leave benefits, as they are determined on an actuarial basis for all the employees together.
II) For the year ended March 31, 2019(` in Crore)
Particulars
Entities controlling the
Company/ Fellow Subsidiaries Subsidiaries Others Total
Income:(i)� Revenue from operations 864 1,860 - 2,724(ii)� Other Income� a)� Interest and guarantee commission 6 63 - 69� b)� Dividend income 1 5,485 15 5,501� c)� Outsourcing service fees 3 - - 3Expenditure and other transactions:(i)� Purchase of goods/ Services 351 766 1 1,118(ii)� Stock options expenses/(recovery) 19 (43) - (24)(iii)�Allocation of Corporate Expenses - (121) - (121)(iv)�Management and Brand Fees paid/ (recovered) 311 - - 311(v)� (Recovery of) / Reimbursement to /for other expenses (net) (3) (101) - (104)(vi)�Corporate Social Responsibility expenditure/ Donation - - 27 27(vii)�Contribution to Post retirement employee benefit trust - - 7 7(viii)�Transfer of Assets� a)� Purchase of Assets - 7 - 7(ix) Dividend paid� - To Holding companies 3,513 - 26 3,539� - To other KMP - - 0 0� - To relatives of KMP - - 0 0(x)� Commission/ Sitting fees� - To Independent directors - - 4 4� - To other KMP - - 1 1(xi)�Financial guarantees given - 7,528 - 7,528(xii)�Financial guarantees relinquised - 2,920 - 2,920(xiii)�Banking Limits assigned to/utilised/renewed for group companies - 350 - 350Balances as at year end:a)� Trade Receivables 0 75 - 75b)� Loans Given 4 307 351 662c)� Other receivables and advances 139 181 - 320d)� Trade Payables 1 3 8 12e)� Other paybles 84 (0) 7 91f)� Other Current liabilities- Advance from Customers 2 - - 2g)� Banking Limits assigned to/utilised/renewed for group companies 115 388 - 503h)� Financial guarantee given - 16,686 - 16,686i)� Commission Payable to KMP - - 5 5
Ultimate Controlling partyVedanta Limited is a majority-owned and controlled subsidiary of Vedanta Resources Limited (‘VRL’). Volcan Investments Limited (‘Volcan’) and its wholly-owned subsidiary together hold 100% of the share capital
and 100% of the voting rights of VRL. Volcan is 100% beneficially owned and controlled by the Anil Agarwal Discretionary Trust (‘Trust’). Volcan Investments Limited, Volcan Investments Cyprus Limited and other intermediate holding companies except VRL do not produce Group financial statements.
I) For the year ended March 31, 2020(` in Crore)
Particulars
Entities controlling the
Company/ Fellow Subsidiaries Subsidiaries Others Total
Income:(i)� Revenue from operations 671 969 - 1,640(ii)� Other Income� a)� Interest and guarantee commission 17 135 0 152� b)� Dividend income 2 2,125 4 2,131� c)� Outsourcing service fees 3 - - 3Expenditure and other transactions:(i)� Purchase of goods/ Services 56 651 7 714(ii)� Stock options expenses/(recovery) (0) (37) (0) (37)(iii)�Allocation of Corporate Expenses - (87) - (87)(iv)�Management and Brand Fees paid/ (recovered) 313 - - 313(v)� (Recovery of)/ Reimbursement to/for other expenses 48 (104) 0 (56)(vi)�Corporate Social Responsibility expenditure/ Donation - - 25 25(vii)�Contribution to Post retirement employee benefit trust - - 6 6(viii)�Sale/ (Purchase) of fixed assets - 1 - 1(ix)�Dividend paid.� -To Holding companies 727 - - 727� -To key management personnel - - 0 0� -To relatives of key management personnel - - 0 0(x)� Commission/Sitting Fees� -To Independent directors - - 4 4� -To key management personnel - - 4 4Transactions during the year:a)� Financial guarantees given - 91 - 91b)� Financial guarantees relinquished - 6,233 - 6,233c)� Banking Limits assigned/utilised/renewed/ � (relinquished) to/for group companies
- (100) - (100)
d)� Loans given during the year 0 2,870* - 2,870e)� Loans repaid during the year - (1,403) (17) (1,420)Balances as at year end:a)� Trade Receivables 0 42 - 42b)� Loans given 5 1,773 334 2,112c)� Other receivables and advances 17 267 2 286d)� Trade Payables 19 7 1 27e)� Other payables 43 16 17 76f)� Other Current liabilities- Advance from Customers 3 - - 3g)� Financial guarantee given - 10,526 - 10,526h)� �Banking Limits assigned/utilised to/for group companies 115** 290 - 405i)� �Commission and consultancy fees payable to KMP and their relatives - - 5 5
*The Company reduced its loan receivable from Vedanta Limited ESOS Trust by ` 17 Crore on exercise of stock options by employees during the year ended March 31, 2020.
** Bank gaurantee given by Vedanta Limited on behalf of Volcan Investments Limited in favour of Income Tax department, India as collateral in respect of certain tax disputes of Volcan Investments Limited.
STANDALONE NOTES FORMING PART OF THE FINANCIAL STATEMENTSas at and for the year ended March 1 2020
STANDALONE NOTES FORMING PART OF THE FINANCIAL STATEMENTSas at and for the year ended March 1 2020
INTEGRATED REPORT MANAGEMENT REVIEW STATUTORY REPORTS FINANCIAL STATEMENTS
06-115 116-167 168-270 271-502

368 VEDANTA LIMITED INTEGRATED REPORT AND ANNUAL ACCOUNTS 2019-20 VEDANTA LIMITED INTEGRATED REPORT AND ANNUAL ACCOUNTS 2019-20 369
38 INTEREST IN OTHER ENTITIESa) SubsidiariesThe Group consists of a parent company, Vedanta Limited, incorporated in India and a number of subsidiaries held directly and indirectly by the Group which operate and are incorporated around the world. Following are the details of shareholdings in the subsidiaries.
(` in Crore)
Sr. No. Subsidiaries Principal activities
Country of Incorporation
Immediate holding company
The Company s / Immediate holding company s percentage holding (in %)
As at March 31, 2020
As at March 31, 2019
1 Cairn Energy India Pty Limited
Oil and gas exploration, development and production
Australia Cairn India Holdings Limited
100.00 100.00
2 Copper Mines of Tasmania Pty Limited ( CMT )
Copper mining Australia Monte Cello BV 100.00 100.00
3 Thalanga Copper Mines Pty Limited ( TCM )
Copper mining Australia Monte Cello BV 100.00 100.00
4 Bharat Aluminium Company Limited ( BALCO )
Aluminium mining and smelting
India Vedanta Limited 51.00 51.00
5 Electrosteel Steels Limited2
Manufacturing of Steel & DI Pipe
India Vedanta Limited 95.49 90.00
6 Goa Sea Port Private Limited
Infrastructure India Sterlite Ports Limited 100.00 100.00
7 Hindustan Zinc Limited ( HZL )
Zinc mining and smeltingIndia Vedanta Limited 64.92 64.92
8 MALCO Energy Limited ( MEL )
Power generation India Vedanta Limited 100.00 100.00
9 Maritime Ventures Private Limited
Infrastructure India Sterlite Ports Limited 100.00 100.00
10 Paradip Multi Cargo Berth Private Limited
Infrastructure India Vedanta Limited 100.00 100.00
11 Sesa Mining Corporation Limited
Iron ore mining India Sesa Resources Limited
100.00 100.00
12 Sesa Resources Limited ( SRL )
Iron ore mining India Vedanta Limited 100.00 100.00
13 Sterlite Ports Limited Infrastructure India Vedanta Limited 100.00 100.00 14 Talwandi Sabo Power
Limited ( TSPL )Power generation India Vedanta Limited 100.00 100.00
15 Vedanta Star Limited2 Operating and holding Company
India Vedanta Limited - 100.00
16 Vizag General Cargo Berth Private Limited
Infrastructure India Vedanta Limited 100.00 100.00
17 Killoran Lisheen Finance Limited
Investment company Ireland Vedanta Lisheen Holdings Limited
100.00 100.00
18 Killoran Lisheen Mining Limited
Zinc and lead mining Ireland Vedanta Lisheen Holdings Limited
100.00 100.00
19 Lisheen Milling Limited Manufacturing Ireland Vedanta Lisheen Holdings Limited
100.00 100.00
20 Lisheen Mine Partnership Mining Partnership Firm Ireland 50% each held by Killoran Lisheen Mining Limited & Vedanta Lisheen Mining Limited
100.00 100.00
(` in Crore)
Particulars
Entities controlling the
Company/ Fellow Subsidiaries Subsidiaries Others Total
Transactions during the yeara)� Loans Given during the year 0 332* 117 449b)� Loans Repaid during the year 0 - 30** 30c)� Investments made during the year - 1,770 - 1,770
* includes ` 80 Crore as advance converted to loan during the previous year.
** The Company reduced its loan receivable from Vedanta Limited ESOS Trust by ` 2 Crore on exercise of stock options by employees during the year March 31, 2019.
Remuneration of key management personnel(` in Crore)
ParticularsFor the Year ended
March 31, 2019
Short-term employee benefits 41Post employment benefits* 1Share based payments 5Total 47
* Does not include the provision made for gratuity and leave benefits, as they are determined on an actuarial basis for all the employees together.
Terms and conditions of transactions with related partiesAll transactions with related parties are done in the ordinary course of business. Except as disclosed above, the Group has not recorded any impairment of receivables relating to amounts owed by related parties, for the year ended March 31, 2020. This assessment is undertaken each financial year through examining the financial position of the related party and the market in which the related party operates.
There are no outstanding debts or loans due from directors or other officers (as defined under Section 2(59) of the Companies Act, 2013) of the Company.
37 SUBSEQUENT EVENTSThe Company vide letter dated May 12, 2020 has informed the stock exchanges that it has received a letter dated May 12, 2020 from its Holding Company, Vedanta Resources Ltd. (“VRL”), wherein VRL has expressed its intention to, either individually or along with one or more subsidiaries, acquire all fully paid-up equity shares of the Company (“Equity Shares”) that are held by the public shareholders of the Company (as defined under the Delisting Regulations, to be referred to as “Public Shareholders”) and consequently voluntarily delist the Equity Shares from BSE Limited and National Stock Exchange of India Limited, the recognised stock exchanges where the Equity Shares are presently listed (“Stock Exchanges”), in accordance with the Delisting Regulations (“Delisting Proposal”) and if such delisting is successful, then to also delist the Company’s American Depositary Shares from the New York Stock Exchange (“NYSE”) and deregister the Company from the Securities and Exchange Commission (“SEC”), subject to the requirements of the NYSE and the SEC.
Further, the board of directors of the Company in their meeting held on May 18, 2020 have considered and granted their approval for the said Delisting Proposal and to seek shareholders’ approval for the said proposal.
There are no other material adjusting or non-adjusting subsequent events, except as already disclosed.
STANDALONE NOTES FORMING PART OF THE FINANCIAL STATEMENTSas at and for the year ended March 1 2020
STANDALONE NOTES FORMING PART OF THE FINANCIAL STATEMENTSas at and for the year ended March 1 2020
INTEGRATED REPORT MANAGEMENT REVIEW STATUTORY REPORTS FINANCIAL STATEMENTS
06-115 116-167 168-270 271-502

370 VEDANTA LIMITED INTEGRATED REPORT AND ANNUAL ACCOUNTS 2019-20 VEDANTA LIMITED INTEGRATED REPORT AND ANNUAL ACCOUNTS 2019-20 371
(` in Crore)
Sr. No. Subsidiaries Principal activities
Country of Incorporation
Immediate holding company
The Company s / Immediate holding company s percentage holding (in %)
As at March 31, 2020
As at March 31, 2019
45 Cairn Energy Hydrocarbons Limited
Oil and gas exploration, development and production
Scotland*** Cairn India Holdings Limited
100.00 100.00
46 Cairn Exploration (No. 2) Limited*
Oil and gas exploration, development and production
Scotland Cairn India Holdings Limited
100.00 100.00
47 Black Mountain Mining (Proprietary) Limited
Exploration, development, production and sale of zinc, lead, copper and associated mineral concentrates
South Africa THL Zinc Ltd 74.00 74.00
48 Cairn South Africa Pty Limited*
Oil and gas exploration, development and production
South Africa Cairn Energy Hydrocarbons Limited
100.00 100.00
49 AvanStrate Korea Inc Manufacturer of LCD glass substrate
South Korea Avanstrate (Japan) Inc.
100.00 100.00
50 Cairn Lanka Private Limited
Oil and gas exploration, development and production
Sri Lanka CIG Mauritius Private Limited
100.00 100.00
51 AvanStrate Taiwan Inc Manufacturer of LCD glass substrate
Taiwan Avanstrate (Japan) Inc.
100.00 100.00
52 Fujairah Gold FZC Manufacturing of Copper Rod and Refining of Precious Metals (Gold & Silver)
United Arab Emirates
Malco Energy Limited 100.00 100.00
53 Sterlite (USA) Inc.* Investment company United States of America
Vedanta Limited 100.00 100.00
*Under liquidation **Liquidated during the year***Principal place of business is in India1. The Group also has interest in certain trusts which are neither significant nor material to the Group.2. Vedanta star Limited has been merged with Electrosteels steel Limited w.e.f. March 25, 2020. (Refer Note 3(d)(C))
b) Joint operationsThe Company participates in several unincorporated joint operations which involve the joint control of assets used in oil and gas exploration and producing activities which are as follows:
Oil & Gas blocks/fields Area
Participating interest (%)
As at March 31, 2020
As at March 31, 2019
Operating BlocksRavva block-Exploration, Development and Production Krishna Godavari 22.50 22.50 CB-OS/2 – Exploration Cambay Offshore 60.00 60.00 CB-OS/2 - Development & production Cambay Offshore 40.00 40.00 RJ-ON-90/1 – Exploration Rajasthan Onshore 50.00 50.00 RJ-ON-90/1 – Development & production Rajasthan Onshore 35.00 35.00 Non-Operating BlocksKG-ONN-2003/1 Krishna Godavari Onshore 49.00 49.00
(` in Crore)
Sr. No. Subsidiaries Principal activities
Country of Incorporation
Immediate holding company
The Company s / Immediate holding company s percentage holding (in %)
As at March 31, 2020
As at March 31, 2019
21 Vedanta Exploration Ireland Limited
Exploration company Ireland Vedanta Lisheen Holdings Limited
100.00 100.00
22 Vedanta Lisheen Holdings Limited
Investment company Ireland THL Zinc Holing BV 100.00 100.00
23 Vedanta Lisheen Mining Limited
Zinc and lead mining Ireland Vedanta Lisheen Holdings Limited
100.00 100.00
24 AvanStrate Inc. ('ASI') Operating & holding Company
Japan Cairn India Holdings Limited
51.63 51.63
25 Cairn India Holdings Limited
Investment company Jersey Vedanta Limited 100.00 100.00
26 Western Cluster Limited Iron ore mining Liberia Bloom Fountain Limited
100.00 100.00
27 Bloom Fountain Limited Operating (Iron ore) and Investment Company
Mauritius Vedanta Limited 100.00 100.00
28 CIG Mauritius Holdings Private Limited
Investment Company Mauritius Cairn Energy Hydrocarbons Limited
100.00 100.00
29 CIG Mauritius Private Limited
Investment Company Mauritius CIG Mauritius Holdings Private Limited
100.00 100.00
30 Sesa Sterlite Mauritius Holdings Limited **
Investment Company Mauritius Bloom Fountain Limited
- 100.00
31 THL Zinc Ltd Investment company Mauritius THL Zinc Ventures Ltd 100.00 100.0032 THL Zinc Ventures Limited Investment company Mauritius Vedanta Limited 100.00 100.0033 Twin Star Energy Holdings
Limited ( TEHL ) **Investment company Mauritius Bloom Fountain
Limited- 100.00
34 Twin Star Mauritius Holdings Limited ( TMHL ) **
Investment company Mauritius Twin Star Energy Holdings Limited
- 100.00
35 Amica Guesthouse (Proprietary) Limited
Accommodation and catering services
Namibia Skorpion Zinc (Proprietary) Limited
100.00 100.00
36 Namzinc (Proprietary) Limited
Owns and operates zinc refinery
Namibia Skorpion Zinc (Proprietary) Limited
100.00 100.00
37 Skorpion Mining Company (Proprietary) Limited ('NZ')
Exploration, development, production and sale of zinc ore
Namibia Skorpion Zinc (Proprietary) Limited
100.00 100.00
38 Skorpion Zinc (Proprietary) Limited ( SZPL )
Operating (Zinc) and Investment Company
Namibia THL Zinc Namibia Holdings (Proprietary) Limited
100.00 100.00
39 THL Zinc Namibia Holdings (Proprietary) Limited (“VNHL”)
Mining and Exploration and Investment company
Namibia THL Zinc Ltd 100.00 100.00
40 Lakomasko BV Investment company Netherlands THL Zinc Holding BV 100.00 100.0041 Monte Cello BV (“MCBV”) Investment company Netherlands Vedanta Limited 100.00 100.0042 THL Zinc Holding BV Investment company Netherlands Vedanta Limited 100.00 100.0043 Cairn Energy Discovery
Limited*Oil and gas exploration, development and production
Scotland Cairn India Holdings Limited
100.00 100.00
44 Cairn Energy Gujarat Block 1 Limited
Oil and gas exploration, development and production
Scotland Cairn India Holdings Limited
100.00 100.00
STANDALONE NOTES FORMING PART OF THE FINANCIAL STATEMENTSas at and for the year ended March 1 2020
STANDALONE NOTES FORMING PART OF THE FINANCIAL STATEMENTSas at and for the year ended March 1 2020
INTEGRATED REPORT MANAGEMENT REVIEW STATUTORY REPORTS FINANCIAL STATEMENTS
06-115 116-167 168-270 271-502

372 VEDANTA LIMITED INTEGRATED REPORT AND ANNUAL ACCOUNTS 2019-20 VEDANTA LIMITED INTEGRATED REPORT AND ANNUAL ACCOUNTS 2019-20 373
(c) Loans and Advance(s) in the nature of Loan (Regulation 34 of Listing Obligations & Disclosure Requirements):(` in Crore)
(a) Name of the Company RelationshipBalance as at
March 31, 2020
Maximum Amount
Outstanding during the year
Balance as at March 31, 2019
Paradip Multi Cargo Berth Private Limited Wholly-owned Subsidiary 0 0 0 Sterlite Ports Limited Wholly-owned Subsidiary 4 4 4 Sterlite Iron and Steel Company Limited Fellow Subsidiary 5 5 5 Sesa Resources Limited Wholly-owned Subsidiary 87 87 79 Vedanta Star Limited* Wholly-owned Subsidiary - - 197 Electrosteel Steels Limited Wholly-owned Subsidiary 197 197 - Sesa Mining Corporation Limited Wholly-owned Subsidiary 45 45 26 Talwandi Sabo Power Limited Wholly-owned Subsidiary 1,440 2,115 -
*Refer Note 3(d)(C) - Business Combination.
(b) None of the loanee have made, per se, investment in the shares of the Company.
(c) Investments made by Sterlite Ports Limited in Maritime Ventures Private Limited - 10,000 equity shares and Goa Sea Port - 50,000 equity shares
Investments made by Sesa Resources Limited in Sesa Mining Corporation Limited - 11,50,000 equity shares and Goa Maritime Private Limited- 5,000 Shares
40 (a) Oil & gas reserves and resourcesThe Company's gross reserve estimates are updated atleast annually based on the forecast of production profiles, determined on an asset-by-asset basis, using appropriate petroleum engineering techniques. The estimates of reserves and resources have been derived in accordance with the Society for Petroleum Engineers “Petroleum Resources Management System (2018) . The changes to the reserves are generally on account of future development projects, application of technologies such as enhanced oil recovery techniques and true up of the estimates. The management’s internal estimates of hydrocarbon reserves and resources at the year end, are as follows:
Particulars Country
Gross proved and probable hydrocarbons initially in place
Gross proved and probable reserves and resources
Net working interest proved and probable reserves and
resources(mmboe) (mmboe) (mmboe)
As at March 31,
2020
As at March 31,
2019
As at March 31,
2020
As at March 31,
2019
As at March 31,
2020
As at March 31,
2019
Rajasthan MBA Fields India 2,288 2,288 317 362 111 127 Rajasthan MBA EOR India - - 317 293 111 103 Rajasthan Block Other Fields India 3,535 3,405 449 428 157 150 Ravva Fields India 692 724 28 39 6 9 CBOS/2 Fields India 292 254 40 33 16 13 Other fields India 348 335 43 40 25 22 Total 7,155 7,006 1,194 1,195 426 424
c) Interest in associates and joint venturesSet out below are the associates and joint ventures of the Company as at March 31, 2020 which, in the opinion of the management, are not material to the Company. The country of incorporation or registration is also their principal place of business, and the proportion of ownership interest is the same as the proportion of voting rights held.
Sr. No. Associates Country of incorporation
% ownership interestAs at
March 31, 2020 As at
March 31, 2019
1 RoshSkor Township (Pty) Limited Namibia 50.00 50.002 Gaurav Overseas Private Limited India 50.00 50.00
Sr. No. Jointly controlled entities Country of incorporation
% ownership interest
As at March 31, 2020
As at March 31, 2019
1 Rampia Coal Mines and Energy Private Limited* India 17.39 17.39 2 Madanpur South Coal Company Limited India 17.62 17.62 3 Goa Maritime Private Limited India 50.00 50.00 4 Rosh Pinah Health Care (Proprietary) Limited Namibia 69.00 69.00
*action initiated for striking-off.
39 (a) The Company has incurred an amount of ` 53 Crore (March 31, 2019: ` 52 Crore) towards Corporate Social Responsibility (CSR) as per Section 135 of the Companies Act, 2013 and is included in other expenses:
(` in Crore)
Particulars
Year ended March 31, 2020 Year ended March 31, 2019
In-CashYet to be
Paid in Cash In-CashYet to be
Paid in Cash
(a)� �Gross amount required to be spend by the Company during the year
13 13
(b)� Amount spent on: *� i)� Construction/acquisition of assets - - - -� ii)� �On purposes other than (i) above (for CSR projects) 39 14 36 16Total 39 14 36 16
* includes ` 25 Crore (March 31, 2019: ` 24 Crore) paid to related party (Refer Note 36)
(b) Disclosures under Section 22 of the Micro, Small and Medium Enterprises Development Act, 2006(` in Crore)
ParticularsYear ended
March 31, 2020Year ended
March 31, 2019
(i)� Principal amount remaining unpaid to any supplier as at the end of the accounting year 182 59 (ii)� �Interest due thereon remaining unpaid to any supplier as at the end of the accounting year - - (iii)��The amount of interest paid along with the amounts of the payment made to the
supplier beyond the appointed day - -
(iv)�The amount of interest due and payable for the year - - (v)� The amount of interest accrued and remaining unpaid at the end of the accounting year - - (vi)��The amount of further interest due and payable even in the succeeding year, until such
date when the interest dues as above are actually paid - -
STANDALONE NOTES FORMING PART OF THE FINANCIAL STATEMENTSas at and for the year ended March 1 2020
STANDALONE NOTES FORMING PART OF THE FINANCIAL STATEMENTSas at and for the year ended March 1 2020
INTEGRATED REPORT MANAGEMENT REVIEW STATUTORY REPORTS FINANCIAL STATEMENTS
06-115 116-167 168-270 271-502

374 VEDANTA LIMITED INTEGRATED REPORT AND ANNUAL ACCOUNTS 2019-20 VEDANTA LIMITED INTEGRATED REPORT AND ANNUAL ACCOUNTS 2019-20 375
41 OTHER MATTERSIn terms of various notifications issued by the Ministry of Environment, Forest and Climate Change (MoEF&CC), ash produced from thermal power plant is required to be disposed of by the Company in the manner specified in those notifications. However compliance with manner of disposal as specified in those notifications is not fully achieved due to lack of demand from user agencies. Consequently, the Company is storing some of the ash produced in ash dyke in accordance with conditions of the Environmental Clearance & Consent to Operate granted by the MOEF&CC & Odisha State Pollution Control Board (OSPCB) respectively while giving preference to supplying the same to user agencies. Management believes storage of ash in ash dykes/ash pond in accordance with environmental clearances received by the Company are sufficient compliance with the applicable notifications issued by MoEF&CC which is supported by a legal opinion obtained.
The National Green Tribunal (NGT) has also taken cognizance of the matter and vide its order dated February 12, 2020 has ordered for levy of environmental compensation on generating companies on account of their failure to comply the aforesaid notifications. The Company has already filed an appeal against the said order on May 20, 2020 with the Hon’ble Supreme Court of India (Apex Court) on the grounds that it is not in accordance with directions given by the Apex Court vide orders dated December 13, 2018 and February 04, 2019 and methodology for determination of compensation is not reasonable. Management believes that the outcome of the appeal will not have any significant adverse financial impact on the Company which is supported by a legal opinion obtained.
As per our report of even date For and on behalf of the Board of Directors
For S.R. Batliboi & Co. LLP Anil Agarwal Sunil DuggalChartered AccountantsICAI Firm Registration No. 301003E/E300005
Non-Executive Chairman DIN 00010883
Interim Chief Executive Officer PAN AAMPD1109M
per Sudhir Soni GR Arun Kumar Prerna HalwasiyaPartner Membership No: 41870
Whole-Time Director and Chief Financial Officer DIN 01874769
Company Secretary ICSI Membership No. A20856
Place: MumbaiDate: June 06, 2020
The Company’s net working interest proved and probable reserves is as follows:
Particulars
Proved and probable reserves
Proved and probable reserves (developed)
Oil Gas Oil Gas(mmstb) (bscf) (mmstb) (bscf)
Reserves as of March 31, 2018* 55 31 39 19 Additions / (revision) during the year # 132 117 78 60Production during the year (23) (8) (23) (8)Reserves as of March 31, 2019** 164 140 94 71 Additions / (revision) during the year 12 30 12 20 Production during the year (20) (13) (20) (13)Reserves as of March 31, 2020*** 156 157 86 78
* Includes probable oil reserves of 15.43 mmstb (of which 2.97 mmstb is developed) and probable gas reserves of 14.51 bscf (of which 3.91 bscf is developed).
** Includes probable oil reserves of 60.77 mmstb (of which 9.80 mmstb is developed) and probable gas reserves of 47.86 bscf (of which 15.07 bscf is developed).
*** Includes probable oil reserves of 67.78 mmstb (of which 12.36 mmstb is developed) and probable gas reserves of 59.36 bscf (of which 23.29 bscf is developed).
# The increase in reserve is on account of PSC extension for the Rajasthan and Ravva block. For more details, refer note 3(c)(A)(viii).
mmboe million barrels of oil equivalent
mmstb million stock tank barrels
bscf billion standard cubic feet
1 million metric tonnes 7.4 mmstb
1 standard cubic meter 35.315 standard cubic feet
MBA Mangala, Bhagyam & Aishwarya
EOR Enhanced Oil Recovery
(b) Pursuant to Management Committee recommendation and minutes of Empowered Committee of Secretaries (ECS) filed by GoI, Vedanta Limited had considered cost recovery of ` 567 Crore (US$ 88 million) in FY 2017-18, being the cost incurred over the initially approved FDP of Pipeline Project. Vedanta Limited's claim for the resultant profit petroleum of ` 161 Crore (US$ 22 million) as at March 31, 2020 (March 31, 2019:` 149 Crore (US$ 22 million)) (Refer Note 9), which had been previously paid, has been disputed by the GoI. The Company believes that it has a good case on merits to recover the amount and has therefore treated it as a non-current recoverable amount.
STANDALONE NOTES FORMING PART OF THE FINANCIAL STATEMENTSas at and for the year ended March 1 2020
STANDALONE NOTES FORMING PART OF THE FINANCIAL STATEMENTSas at and for the year ended March 1 2020
INTEGRATED REPORT MANAGEMENT REVIEW STATUTORY REPORTS FINANCIAL STATEMENTS
06-115 116-167 168-270 271-502

376 VEDANTA LIMITED INTEGRATED REPORT AND ANNUAL ACCOUNTS 2019-20 VEDANTA LIMITED INTEGRATED REPORT AND ANNUAL ACCOUNTS 2019-20 377
INDEPENDENT AUDITOR’S REPORT
To the Members of Vedanta Limited
REPORT ON THE AUDIT OF THE CONSOLIDATED IND AS FINANCIAL STATEMENTS
OPINIONWe have audited the accompanying consolidated Ind AS financial statements of Vedanta Limited (hereinafter referred to as “the Holding Company”), its subsidiaries (the Holding Company and its subsidiaries together referred to as “the Group”) its associates and joint ventures comprising of the consolidated Balance sheet as at March 31 2020, the consolidated Statement of Profit and Loss, including other comprehensive income, the consolidated Cash Flow Statement and the consolidated Statement of Changes in Equity for the year then ended, and notes to the consolidated Ind AS financial statements, including a summary of significant accounting policies and other explanatory information (hereinafter referred to as “the consolidated Ind AS financial statements”).
In our opinion and to the best of our information and according to the explanations given to us and based on the consideration of reports of other auditors on separate financial statements and on the other financial information of the subsidiaries, associates and joint ventures, the aforesaid consolidated Ind AS financial statements give the information required by the Companies Act, 2013, as amended (“the Act”) in the manner so required and give a true and fair view in conformity with the accounting principles generally accepted in India, of the consolidated state of affairs of the Group, its associates and joint ventures as at March 31, 2020, their consolidated loss including other comprehensive income, their consolidated cash flows and the consolidated statement of changes in equity for the year ended on that date.
BASIS FOR OPINIONWe conducted our audit of the consolidated Ind AS financial statements in accordance with the Standards on Auditing (SAs), as specified under section 143(10) of the Act. Our responsibilities under those Standards are further described in the ‘Auditor’s Responsibilities for the Audit of the Consolidated Ind AS Financial Statements’ section of our report. We are independent of the Group, its associates and joint ventures in accordance with the ‘Code of Ethics’ issued by the Institute of Chartered Accountants of India together with the ethical requirements that are relevant to our audit of the financial statements under the provisions of the Act and the Rules thereunder, and we have fulfilled our other ethical responsibilities in accordance with these requirements and the Code of Ethics. We believe that the audit evidence we have obtained is sufficient
and appropriate to provide a basis for our audit opinion on the consolidated Ind AS financial statements.
EMPHASIS OF MATTERWe draw attention to:
a) Note 3c(A)(viii) of the accompanying consolidated Ind AS financial statements which describes the uncertainty arising out of the demands that have been raised on the Group, with respect to government’s share of profit oil by the Director General of Hydrocarbons. Further, one of the pre-conditions for the extension of the Production Sharing Contract (PSC) for the Rajasthan oil block is the settlement of these demands. The Group, believes it is in compliance with the necessary conditions to secure an extension of this PSC, and based on the legal advice believes that the demands are untenable and hence no provision is required in respect of these demands.
b) Note 3c(A)(i) of the accompanying consolidated Ind AS financial statements which, describes the uncertainties related to Covid-19 and its consequential effects on the affairs of the Group.
Our opinion is not modified in respect of the above matters.
KEY AUDIT MATTERSKey audit matters are those matters that, in our professional judgment, were of most significance in our audit of the consolidated Ind AS financial statements for the financial year ended March 31, 2020. These matters were addressed in the context of our audit of the consolidated Ind AS financial statements as a whole, and in forming our opinion thereon, and we do not provide a separate opinion on these matters. For each matter below, our description of how our audit addressed the matter is provided in that context.
We have determined the matters described below to be the key audit matters to be communicated in our report. We have fulfilled the responsibilities described in the Auditor’s responsibilities for the audit of the consolidated Ind AS financial statements section of our report, including in relation to these matters. Accordingly, our audit included the performance of procedures designed to respond to our assessment of the risks of material misstatement of the consolidated Ind AS financial statements. The results of audit procedures performed by us and by other auditors of components not audited by us, as reported by them in their audit reports furnished to us by the management, including those procedures performed to address the matters below, provide the basis for our audit opinion on the accompanying consolidated Ind AS financial statements.
Key audit matters How our audit addressed the key audit matter
Recoverability of carrying value of property plant and equipment, capital work in progress and exploration intangible assets under development (as described in notes 3a(H), 3c(A)(iii), 3c(A)(iv), 3c(A)(vii), 3c(A)(xi), 3c(A)(xii), 3c(A)(xiii), 6 and 33 of the consolidated Ind AS financial statements)As at March 31, 2020, the Group had significant amounts of property, plant and equipment, capital work in progress and exploration intangible assets under development which were carried at historical cost less depreciation. We focused our efforts on the Cash Generating Units (“CGUs”) of (a) Tuticorin within the copper segment; (b) Krishna Godavri block and the Rajasthan block within the oil and gas segment, (c) assets in the aluminum segment in Odisha, (d) assets in the steel segment and (e) assets in the substrate glass segment; as they have impairment indicators.
Recoverability of property plant and equipment, capital work in progress and exploration intangible assets under development has been identified as a key audit matter due to:
� The significance of the carrying value of assets being assessed.
� Reduction of global oil and metal prices and reduction in demand and future uncertainty caused due to Covid-19.
� The withdrawal of the Holding Company’s licenses to operate the copper plant, conditional renewal of the production sharing contract for Rajasthan oil block and denial of consent to operate the steel plant.
� The size of impairment charges.
� Some of the items of capital work in progress in the aluminum segment have been outstanding since long.
� The fact that the assessment of the recoverable amount of the Group’s CGUs involves significant judgements about the future cash flow forecasts and the discount rate that is applied.
The key judgements and estimates centered on the likely outcome of the litigations, demands raised by the government, cash flow forecasts, prices and discount rate assumptions. Details of impairment charge amounting to ` 17,080 crore recognised are given in note 33 of the accompanying financial statements.
Our audit procedures included the following:
� Assessed through an analysis of internal and external factors impacting the Company, whether there were any indicators of impairment in line with Ind AS 36.
� Assessed the existence and usability, through examination of third-party certificate, of aged capital work in progress (‘CWIP’) in the aluminum segment. Vouched expenses capitalized to CWIP on a sample basis.
� Specifically, in relation to the CGUs where impairment indicators were identified, obtained and evaluated the valuation models used to determine the recoverable amount by assessing the key assumptions used by management including:
− Considering forecasted volumes in relation to asset development plans.
− Assessing management’s forecasting accuracy by comparing prior year forecasts to actual results and assessing the potential impact of any variances.
− Corroborating the price assumptions used in the models against analyst consensus and assessing the reasonableness of costs.
− Testing the weighted average cost of capital used to discount the impairment models.
− Testing the integrity of the models together with their clerical accuracy.
− Assessed the implications of withdrawal of Company’s license to operate the copper plant.
− Inspected the external legal opinions in respect of the merits of the case and assessed management’s position through discussions with the legal counsel to determine the basis of their conclusion.
− Assessed the implications and likelihood of the possible outcome of the conditions precedent to the extension of the Rajasthan oil block and management’s analysis of the same, including an assessment of how a market participant would react to the same.
− Assessed the implications and likelihood of the possible outcome of the litigation with respect to the denial of consent to operate the steel plant and management’s analysis of the same, including a discussion with the legal counsel to assess the basis of conclusion.
− Engaged valuation experts to assist in performance of the above procedures.
� Assessed the competence and objectivity of the external experts and experts engaged by us, to satisfy ourselves that these parties are suitable in their roles.
� Assessed the disclosures made by the Group in this regard.
INTEGRATED REPORT
06-115MANAGEMENT REVIEW
116-167STATUTORY REPORTS
168-270FINANCIAL STATEMENTS
271-502

378 VEDANTA LIMITED INTEGRATED REPORT AND ANNUAL ACCOUNTS 2019-20 VEDANTA LIMITED INTEGRATED REPORT AND ANNUAL ACCOUNTS 2019-20 379
Key audit matters How our audit addressed the key audit matter
Recoverability of disputed trade receivables in Power segment (as described in notes 3c(B)(iii) and 8 of the consolidated Ind AS financial statements)As of March 31, 2020, the value of disputed receivables in the power segment aggregated to ` 3,564 crore.
Due to disagreements over the quantification or timing of the receivables, the recovery of said receivables are subject to increased risk. Some of these balances are also subject to litigation. The risk is specifically related to receivables from Punjab State Power Corporation Limited (PSPCL), GRIDCO and Tamil Nadu Electricity Board. These receivables include long outstanding balances as well and are also subject to counter party credit risk.
Our audit procedures included the following:
� Examined the underlying power purchase agreements.
� Examined the relevant state regulatory commission, appellate tribunal and court rulings.
� Examined external legal opinions in respect of the merits of the case and assessed management’s position through discussions with the management’s in-house legal team to determine the basis of their conclusion.
� Examined management’s assessment of recoverability of receivables.
� Obtained external lawyer confirmation from Legal Counsel of the Group who is contesting the cases.
� Assessed the competence and objectivity of the Group’s experts, to satisfy ourselves that these parties are suitable in their roles.
� Assessed the disclosures made by the Group in this regard.Claims and exposures relating to taxation and litigation (as described in notes 3a(Q), 3c(B)(ii), 34 and 37 of the consolidated Ind AS financial statements)The Group is subject to a large number of tax and legal disputes, including audit objections in the oil and gas segment, which have been disclosed / provided for in the financial statements based on the facts and circumstances of each case.
Taxation and litigation exposures have been identified as a key audit matter due to the complexities involved in these matters, timescales involved for resolution and the potential financial impact of these on the financial statements. Further, significant management judgement is involved in assessing the exposure of each case and thus a risk that such cases may not be adequately provided for or disclosed.
Our audit procedures included the following:
� Gained an understanding of the process of identification of claims, litigations and contingent liabilities and identified key controls in the process. For selected controls we have performed tests of controls.
� Obtained the summary of Group’s legal and tax cases and critically assessed management’s position through discussions with the Legal Counsel, Head of Tax and operational management, on both the probability of success in significant cases, and the magnitude of any potential loss.
� Examined external legal opinions (where considered necessary) and other evidence to corroborate management’s assessment of the risk profile in respect of legal claims.
� Engaged tax specialists to technically appraise the tax positions taken by management with respect to local tax issues.
� Assessed whether management assessment of similar cases is consistent across the divisions or that differences in positions are adequately justified.
� Assessed the relevant disclosures made within the financial statements to address whether they reflect the facts and circumstances of the respective tax and legal exposures and the requirements of relevant accounting standards.
� Assessed the competence and objectivity of the Group’s experts, to satisfy ourselves that these parties are suitable in their roles.
Key audit matters How our audit addressed the key audit matter
Evaluation of Going Concern assumption of accounting (as described in notes 2(B) and 3c(A)(xiv) of the consolidated Ind AS financial statements)The evaluation of the appropriateness of adoption of going concern assumption for preparation of these financial statements performed by the management of the Group is identified as a key audit matter because as at March 31, 2020, the Group had net current liabilities of ` 5,802 crore.
The Group has prepared future cash flow forecasts which involves judgement and estimation of key variables and market conditions including future economic conditions on account of prevailing global pandemic COVID-19 and the uncertainty around the extension of the PSC of the Rajasthan oil and gas block.
The Group is confident that the net cash inflows from operating activities in conjunction with the available line of credit and normal cyclical nature of working capital receipts and payment will provide sufficient liquidity to meet its financial obligation as the fall due for the following twelve months. Hence, these financial statements have been prepared adopting the going concern assumption.
Our procedures in relation to evaluation of going concern included the following:
� Obtained an understanding of the process followed by the management and tested the internal controls over the liquidity assessment, compliance with the debt covenants and preparation of the cash flow forecast, and validation of the assumptions and inputs used in the model to estimate the future cash flows.
� Tested the inputs and assumptions used by the management in the cash flow forecast against historical performance, budgets, economic and industry indicators, publicly available information, the Group’s strategic plans and benchmarking of key market related conditions.
� Assessing the key assumptions including those pertaining to revenue and the timing of significant payments in the cash flow forecast for the following eighteen months.
� Performed sensitivity analysis on key assumptions like input prices, discount rate and selling prices to determine their impact on the projections of future cash flows also on any possible cash outgo for securing the extension of the Rajasthan oil and gas block.
� Compared the details of the Group’s long-term credit facilities to the supporting documentation.
� Assessed the disclosures made by the Group in this regard.Revenue recognition (as described in notes 3a(C), 3c(B)(iii) and 25A of the consolidated Ind AS financial statements)For the year ended March 31, 2020 the Group has recognized revenue from operations of ` 83,545 crore.
Revenue recognition has been recognized as a key audit matter due to diverse and complex revenue streams across the Group.
We have identified following key areas for consideration:
� Complexity associated with the determination of items which are cost recoverable in the Oil & Gas segment.
� The variety of terms in the zinc, iron ore, copper, aluminum and steel segments that define when control is transferred to the customer.
� Restrictions had been put in place for movement of goods close to the year-end due to the outbreak of Covid-19 pandemic. This gives rise to the risk that revenue may not have been recognised in the correct period.
Our audit procedures included the following:
� Our audit procedures included evaluation of the Group’s revenue recognition accounting policies and assessing compliance with the policies in terms of Ind AS 115.
� Performed walkthroughs and test of controls, assisted by IT specialists, of the revenue recognition processes and assessed the design and operating effectiveness of key controls.
� Inspected the terms of production sharing contracts in the Oil and Gas segment and tested the underlying cost recovery and profit petroleum calculations used by the management. Also, inspected external legal opinions (where considered necessary) to evaluate the merits of the claims made by the Group in computing it’s own share of revenue. We also assessed the disclosures made by the Group relating to calculation of profit petroleum and revenue from joint operation partners within the Oil and Gas segment.
� Inspected the production sharing contracts and communications from the government and independent legal opinion for revenue recognized on account of recovery of exploration costs within oil and gas segment. Assessed the management judgement and supporting documents around timing of recovery of exploration costs.
� Obtained from the management the details of goods that were dispatched after restrictions were imposed on movement of goods and agreed the same to the underlying documents.
� Selected a sample of sales, in the zinc, steel, copper, iron ore and aluminum segments, made pre and post year end, agreeing the date of revenue recognition to third party support, such as bills of lading, to confirm sales are recognized according to contract conditions.
� Examined invoice samples with various shipping terms to test whether revenue has been recognized correctly.
� Assessed the disclosures made by the Group.
INTEGRATED REPORT
06-115MANAGEMENT REVIEW
116-167STATUTORY REPORTS
168-270FINANCIAL STATEMENTS
271-502
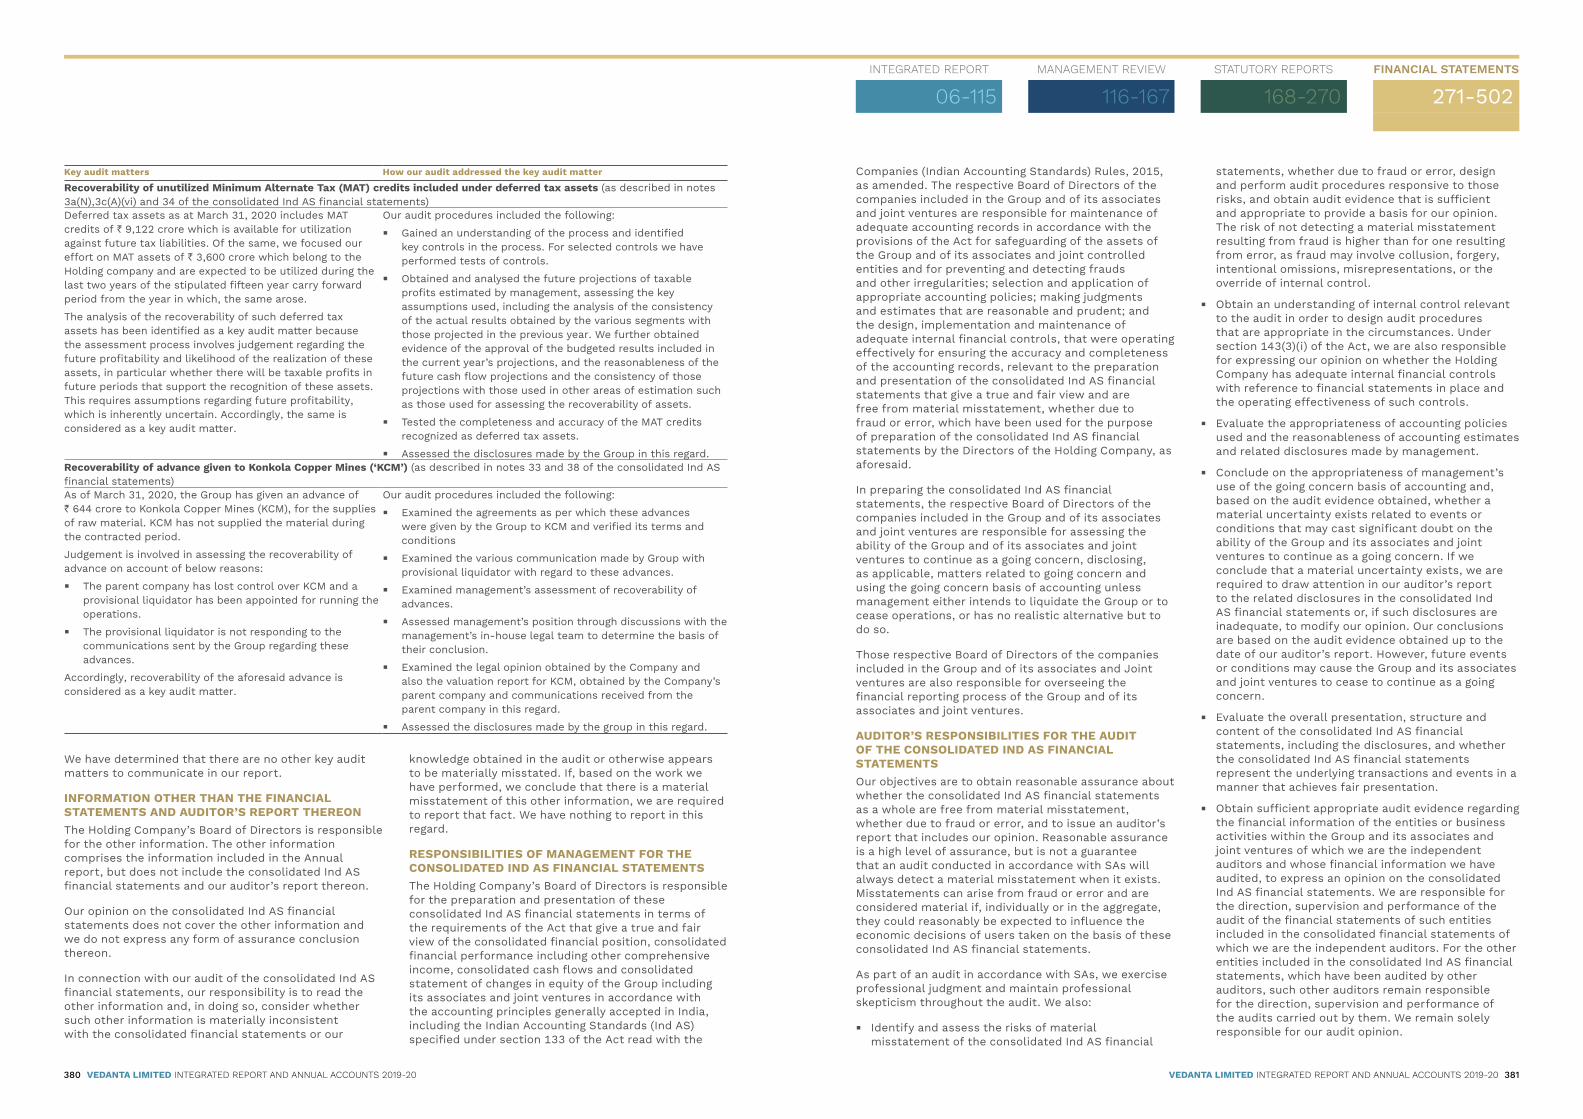
380 VEDANTA LIMITED INTEGRATED REPORT AND ANNUAL ACCOUNTS 2019-20 VEDANTA LIMITED INTEGRATED REPORT AND ANNUAL ACCOUNTS 2019-20 381
Key audit matters How our audit addressed the key audit matter
Recoverability of unutili ed Minimum Alternate Tax (MAT) credits included under deferred tax assets (as described in notes 3a(N),3c(A)(vi) and 34 of the consolidated Ind AS financial statements)Deferred tax assets as at March 31, 2020 includes MAT credits of ` 9,122 crore which is available for utilization against future tax liabilities. Of the same, we focused our effort on MAT assets of ` 3,600 crore which belong to the Holding company and are expected to be utilized during the last two years of the stipulated fifteen year carry forward period from the year in which, the same arose.
The analysis of the recoverability of such deferred tax assets has been identified as a key audit matter because the assessment process involves judgement regarding the future profitability and likelihood of the realization of these assets, in particular whether there will be taxable profits in future periods that support the recognition of these assets. This requires assumptions regarding future profitability, which is inherently uncertain. Accordingly, the same is considered as a key audit matter.
Our audit procedures included the following:
� Gained an understanding of the process and identified key controls in the process. For selected controls we have performed tests of controls.
� Obtained and analysed the future projections of taxable profits estimated by management, assessing the key assumptions used, including the analysis of the consistency of the actual results obtained by the various segments with those projected in the previous year. We further obtained evidence of the approval of the budgeted results included in the current year’s projections, and the reasonableness of the future cash flow projections and the consistency of those projections with those used in other areas of estimation such as those used for assessing the recoverability of assets.
� Tested the completeness and accuracy of the MAT credits recognized as deferred tax assets.
� Assessed the disclosures made by the Group in this regard.Recoverability of advance given to Konkola Copper Mines (‘KCM’) (as described in notes 33 and 38 of the consolidated Ind AS financial statements)As of March 31, 2020, the Group has given an advance of ` 644 crore to Konkola Copper Mines (KCM), for the supplies of raw material. KCM has not supplied the material during the contracted period.
Judgement is involved in assessing the recoverability of advance on account of below reasons:
� The parent company has lost control over KCM and a provisional liquidator has been appointed for running the operations.
� The provisional liquidator is not responding to the communications sent by the Group regarding these advances.
Accordingly, recoverability of the aforesaid advance is considered as a key audit matter.
Our audit procedures included the following:
� Examined the agreements as per which these advances were given by the Group to KCM and verified its terms and conditions
� Examined the various communication made by Group with provisional liquidator with regard to these advances.
� Examined management’s assessment of recoverability of advances.
� Assessed management’s position through discussions with the management’s in-house legal team to determine the basis of their conclusion.
� Examined the legal opinion obtained by the Company and also the valuation report for KCM, obtained by the Company’s parent company and communications received from the parent company in this regard.
� Assessed the disclosures made by the group in this regard.
Companies (Indian Accounting Standards) Rules, 2015, as amended. The respective Board of Directors of the companies included in the Group and of its associates and joint ventures are responsible for maintenance of adequate accounting records in accordance with the provisions of the Act for safeguarding of the assets of the Group and of its associates and joint controlled entities and for preventing and detecting frauds and other irregularities; selection and application of appropriate accounting policies; making judgments and estimates that are reasonable and prudent; and the design, implementation and maintenance of adequate internal financial controls, that were operating effectively for ensuring the accuracy and completeness of the accounting records, relevant to the preparation and presentation of the consolidated Ind AS financial statements that give a true and fair view and are free from material misstatement, whether due to fraud or error, which have been used for the purpose of preparation of the consolidated Ind AS financial statements by the Directors of the Holding Company, as aforesaid.
In preparing the consolidated Ind AS financial statements, the respective Board of Directors of the companies included in the Group and of its associates and joint ventures are responsible for assessing the ability of the Group and of its associates and joint ventures to continue as a going concern, disclosing, as applicable, matters related to going concern and using the going concern basis of accounting unless management either intends to liquidate the Group or to cease operations, or has no realistic alternative but to do so.
Those respective Board of Directors of the companies included in the Group and of its associates and Joint ventures are also responsible for overseeing the financial reporting process of the Group and of its associates and joint ventures.
AUDITOR’S RESPONSIBILITIES FOR THE AUDIT OF THE CONSOLIDATED IND AS FINANCIAL STATEMENTSOur objectives are to obtain reasonable assurance about whether the consolidated Ind AS financial statements as a whole are free from material misstatement, whether due to fraud or error, and to issue an auditor’s report that includes our opinion. Reasonable assurance is a high level of assurance, but is not a guarantee that an audit conducted in accordance with SAs will always detect a material misstatement when it exists. Misstatements can arise from fraud or error and are considered material if, individually or in the aggregate, they could reasonably be expected to influence the economic decisions of users taken on the basis of these consolidated Ind AS financial statements.
As part of an audit in accordance with SAs, we exercise professional judgment and maintain professional skepticism throughout the audit. We also:
� Identify and assess the risks of material misstatement of the consolidated Ind AS financial
We have determined that there are no other key audit matters to communicate in our report.
INFORMATION OTHER THAN THE FINANCIAL STATEMENTS AND AUDITOR’S REPORT THEREONThe Holding Company’s Board of Directors is responsible for the other information. The other information comprises the information included in the Annual report, but does not include the consolidated Ind AS financial statements and our auditor’s report thereon.
Our opinion on the consolidated Ind AS financial statements does not cover the other information and we do not express any form of assurance conclusion thereon.
In connection with our audit of the consolidated Ind AS financial statements, our responsibility is to read the other information and, in doing so, consider whether such other information is materially inconsistent with the consolidated financial statements or our
statements, whether due to fraud or error, design and perform audit procedures responsive to those risks, and obtain audit evidence that is sufficient and appropriate to provide a basis for our opinion. The risk of not detecting a material misstatement resulting from fraud is higher than for one resulting from error, as fraud may involve collusion, forgery, intentional omissions, misrepresentations, or the override of internal control.
� Obtain an understanding of internal control relevant to the audit in order to design audit procedures that are appropriate in the circumstances. Under section 143(3)(i) of the Act, we are also responsible for expressing our opinion on whether the Holding Company has adequate internal financial controls with reference to financial statements in place and the operating effectiveness of such controls.
� Evaluate the appropriateness of accounting policies used and the reasonableness of accounting estimates and related disclosures made by management.
� Conclude on the appropriateness of management’s use of the going concern basis of accounting and, based on the audit evidence obtained, whether a material uncertainty exists related to events or conditions that may cast significant doubt on the ability of the Group and its associates and joint ventures to continue as a going concern. If we conclude that a material uncertainty exists, we are required to draw attention in our auditor’s report to the related disclosures in the consolidated Ind AS financial statements or, if such disclosures are inadequate, to modify our opinion. Our conclusions are based on the audit evidence obtained up to the date of our auditor’s report. However, future events or conditions may cause the Group and its associates and joint ventures to cease to continue as a going concern.
� Evaluate the overall presentation, structure and content of the consolidated Ind AS financial statements, including the disclosures, and whether the consolidated Ind AS financial statements represent the underlying transactions and events in a manner that achieves fair presentation.
� Obtain sufficient appropriate audit evidence regarding the financial information of the entities or business activities within the Group and its associates and joint ventures of which we are the independent auditors and whose financial information we have audited, to express an opinion on the consolidated Ind AS financial statements. We are responsible for the direction, supervision and performance of the audit of the financial statements of such entities included in the consolidated financial statements of which we are the independent auditors. For the other entities included in the consolidated Ind AS financial statements, which have been audited by other auditors, such other auditors remain responsible for the direction, supervision and performance of the audits carried out by them. We remain solely responsible for our audit opinion.
knowledge obtained in the audit or otherwise appears to be materially misstated. If, based on the work we have performed, we conclude that there is a material misstatement of this other information, we are required to report that fact. We have nothing to report in this regard.
RESPONSIBILITIES OF MANAGEMENT FOR THE CONSOLIDATED IND AS FINANCIAL STATEMENTSThe Holding Company’s Board of Directors is responsible for the preparation and presentation of these consolidated Ind AS financial statements in terms of the requirements of the Act that give a true and fair view of the consolidated financial position, consolidated financial performance including other comprehensive income, consolidated cash flows and consolidated statement of changes in equity of the Group including its associates and joint ventures in accordance with the accounting principles generally accepted in India, including the Indian Accounting Standards (Ind AS) specified under section 133 of the Act read with the
INTEGRATED REPORT
06-115MANAGEMENT REVIEW
116-167STATUTORY REPORTS
168-270FINANCIAL STATEMENTS
271-502

382 VEDANTA LIMITED INTEGRATED REPORT AND ANNUAL ACCOUNTS 2019-20 VEDANTA LIMITED INTEGRATED REPORT AND ANNUAL ACCOUNTS 2019-20 383
We communicate with those charged with governance of the Holding Company and such other entities included in the consolidated Ind AS financial statements of which we are the independent auditors regarding, among other matters, the planned scope and timing of the audit and significant audit findings, including any significant deficiencies in internal control that we identify during our audit.
We also provide those charged with governance with a statement that we have complied with relevant ethical requirements regarding independence, and to communicate with them all relationships and other matters that may reasonably be thought to bear on our independence, and where applicable, related safeguards.
From the matters communicated with those charged with governance, we determine those matters that were of most significance in the audit of the consolidated Ind AS financial statements for the financial year ended March 31, 2020 and are therefore the key audit matters. We describe these matters in our auditor’s report unless law or regulation precludes public disclosure about the matter or when, in extremely rare circumstances, we determine that a matter should not be communicated in our report because the adverse consequences of doing so would reasonably be expected to outweigh the public interest benefits of such communication.
OTHER MATTER(a) We did not audit the financial statements and other financial information, in respect of 14 subsidiaries, whose Ind AS financial statements include total assets of ` 17,206 crore as at March 31, 2020, and total revenues of ` 7,531 crore and net cash outflows of ` 427 crore for the year ended on that date. These Ind AS financial statement and other financial information have been audited by other auditors, which financial statements, other financial information and auditor’s reports have been furnished to us by the management. The consolidated Ind AS financial statements also include the Group’s share of net profit of ` Nil for the year ended March 31, 2020, as considered in the consolidated Ind AS financial statements, in respect of 1 associate whose financial statements, other financial information have been audited by other auditors and whose reports have been furnished to us by the Management. Our opinion on the consolidated Ind AS financial statements, in so far as it relates to the amounts and disclosures included in respect of these subsidiaries and associate, and our report in terms of sub-sections (3) of Section 143 of the Act, in so far as it relates to the aforesaid subsidiaries, and associate, is based solely on the report(s) of such other auditors.
Certain of these subsidiaries and associates are located outside India whose financial statements and other financial information have been prepared in accordance with accounting principles generally accepted in their respective countries and which have been audited by other auditors under generally accepted auditing standards applicable in their respective countries. The
Holding Company’s management has converted the financial statements of such subsidiaries and associate located outside India from accounting principles generally accepted in their respective countries to accounting principles generally accepted in India. We have audited these conversion adjustments made by the Holding Company’s management. Our opinion in so far as it relates to the balances and affairs of such subsidiaries and associates located outside India is based on the report of other auditors and the conversion adjustments prepared by the management of the Holding Company and audited by us.
(b) The accompanying consolidated Ind AS financial statements include unaudited financial statements and other unaudited financial information in respect of 3 subsidiaries whose financial statements and other financial information reflect total assets of ` 2,294 crore as at March 31, 2020, and total revenues of ` 293 crore and net cash outflows of ` 76 crore for the year ended on that date. These unaudited financial statements and other unaudited financial information have been furnished to us by the management. The consolidated Ind AS financial statements also include the Group’s share of net loss of ` Nil for the year ended March 31, 2020, as considered in the consolidated Ind AS financial statements, in respect of 1 associate and 3 joint ventures , whose financial statements other financial information have not been audited and whose unaudited financial statements and other unaudited financial information have been furnished to us by the Management. The consolidated Ind AS financial statements also include the Group’s share of total assets of ` 154 crore as at March 31, 2020 in respect of an unincorporated joint venture not operated by the Group. The Ind AS financial statements and other financial information of the said unincorporated joint venture have not been audited and such unaudited financial statements and other unaudited financial information have been furnished to us by the management.
Our opinion, in so far as it relates amounts and disclosures included in respect of these subsidiaries, unincorporated joint venture, associate and joint ventures, and our report in terms of sub-sections (3) of Section 143 of the Act in so far as it relates to the aforesaid subsidiaries, unincorporated joint venture, associate and joint ventures, is based solely on such unaudited financial statements and other unaudited financial information. In our opinion and according to the information and explanations given to us by the Management, these financial statements and other financial information are not material to the Group.
Our opinion above on the consolidated Ind AS financial statements, and our report on Other Legal and Regulatory Requirements below, is not modified in respect of the above matters with respect to our reliance on the work done and the reports of the other auditors and the unaudited financial statements and unaudited other financial information certified by the Management.
REPORT ON OTHER LEGAL AND REGULATORY REQUIREMENTSAs required by Section 143(3) of the Act, based on our audit and on the consideration of report of the other auditors on separate financial statements and the other financial information of subsidiaries, associates and joint ventures, as noted in the ‘other matter’ paragraph we report, to the extent applicable, that:
(a) We/the other auditors whose report we have relied upon have sought and obtained all the information and explanations which to the best of our knowledge and belief were necessary for the purposes of our audit of the aforesaid consolidated Ind AS financial statements;
(b) In our opinion, proper books of account as required by law relating to preparation of the aforesaid consolidation of the financial statements have been kept so far as it appears from our examination of those books and reports of the other auditors;
(c) The Consolidated Balance Sheet, the Consolidated Statement of Profit and Loss including the Statement of Other Comprehensive Income, the Consolidated Cash Flow Statement and Consolidated Statement of Changes in Equity dealt with by this Report are in agreement with the books of account maintained for the purpose of preparation of the consolidated Ind AS financial statements;
(d) In our opinion, the aforesaid consolidated Ind AS financial statements comply with the Accounting Standards specified under Section 133 of the Act, read with Companies (Indian Accounting Standards) Rules, 2015, as amended;
(e) On the basis of the written representations received from the directors of the Holding Company as on March 31, 2020 taken on record by the Board of Directors of the Holding Company and the reports of the statutory auditors who are appointed under Section 139 of the Act, of its subsidiary companies, associate companies and joint ventures, none of the directors of the Group’s companies, its associates and joint controlled entities, incorporated in India, is disqualified as on March 31, 2020 from being appointed as a director in terms of Section 164 (2) of the Act;
(f) With respect to the adequacy and the operating effectiveness of the internal financial controls over financial reporting with reference to these consolidated Ind AS financial statements of the Holding Company and its subsidiary companies, associate companies and joint
ventures , incorporated in India, refer to our separate Report in “Annexure 1” to this report;
(g) In our opinion and based on the consideration of reports of other statutory auditors of the subsidiaries, associates and joint ventures in India, the managerial remuneration for the year ended March 31, 2020 has been paid / provided by the Holding Company, its subsidiaries, associates and joint ventures incorporated in India to their directors in accordance with the provisions of section 197 read with Schedule V to the Act. As indicated in note 38 of the accompanying standalone Ind AS financial statements, the Holding Company proposes to seek the approval of its shareholders at its ensuing annual general meeting for remuneration paid to one of its whole-time directors;
(h) With respect to the other matters to be included in the Auditor’s Report in accordance with Rule 11 of the Companies (Audit and Auditors) Rules, 2014, as amended, in our opinion and to the best of our information and according to the explanations given to us and based on the consideration of the report of the other auditors on separate financial statements as also the other financial information of the subsidiaries, associates and joint ventures , as noted in the ‘Other matter’ paragraph:
i. The consolidated Ind AS financial statements disclose the impact of pending litigations on its consolidated financial position of the Group, its associates and joint ventures in its consolidated Ind AS financial statements – Refer Notes 3c(A)(viii), 34 and 37 to the consolidated Ind AS financial statements;
ii. The Group, its associates and joint ventures did not have any material foreseeable losses in long-term contracts including derivative contracts during the year ended March 31, 2020;
iii. There has been no delay in transferring amounts, required to be transferred, to the Investor Education and Protection Fund by the Holding Company, its subsidiaries, associates and joint ventures, incorporated in India during the year ended March 31, 2020.
For S.R. Batliboi & Co. LLPChartered Accountants
ICAI Firm Registration Number: 301003E/E300005
per Sudhir SoniPartner
Place: Mumbai Membership Number: 41870Date: June 06, 2020 UDIN: 20041870AAAAAQ9715
INTEGRATED REPORT
06-115MANAGEMENT REVIEW
116-167STATUTORY REPORTS
168-270FINANCIAL STATEMENTS
271-502

384 VEDANTA LIMITED INTEGRATED REPORT AND ANNUAL ACCOUNTS 2019-20 VEDANTA LIMITED INTEGRATED REPORT AND ANNUAL ACCOUNTS 2019-20 385
ANNEXURE 1 TO THE INDEPENDENT AUDITOR’S REPORT OF EVEN DATE ON THE CONSOLIDATED IND AS FINANCIAL STATEMENTS OF VEDANTA LIMTED Report on the nternal Financial Controls under Clause i o ub section o ection o the Companies Act 20 the Act
1. In conjunction with our audit of the consolidated Ind AS financial statements of Vedanta Limited as of and for the year ended March 31, 2020, we have audited the internal financial controls over financial reporting of Vedanta Limited (hereinafter referred to as the “Holding Company”) and its subsidiary companies, its associate companies and joint ventures, which are companies incorporated in India, as of that date.
MANAGEMENT’S RESPONSIBILITY FOR INTERNAL FINANCIAL CONTROLS2. The respective Board of Directors of the Holding Company, its 12 subsidiary companies, its 1 associate company and 3 joint ventures, which are companies incorporated in India, are responsible for establishing and maintaining internal financial controls based on the internal control over financial reporting criteria established by the Holding Company considering the essential components of internal control stated in the Committee of Sponsoring Organisations of the Treadway Commission (2013 Framework) (“COSO 2013 Criteria”). These responsibilities include the design, implementation and maintenance of adequate internal financial controls that were operating effectively for ensuring the orderly and efficient conduct of its business, including adherence to the respective company’s policies, the safeguarding of its assets, the prevention and detection of frauds and errors, the accuracy and completeness of the accounting records, and the timely preparation of reliable financial information, as required under the Act.
AUDITOR’S RESPONSIBILITY3. Our responsibility is to express an opinion on the company’s internal financial controls over financial reporting with reference to these consolidated financial statements based on our audit. We conducted our audit in accordance with the Guidance Note on Audit of Internal Financial Controls Over Financial Reporting (the “Guidance Note”) and the Standards on Auditing, both, issued by Institute of Chartered Accountants of India, and deemed to be prescribed under section 143(10) of the Act, to the extent applicable to an audit of internal financial controls. Those Standards and the Guidance Note require that we comply with ethical requirements and plan and perform the audit to obtain reasonable assurance about whether adequate internal financial controls over financial reporting with reference to these consolidated Ind AS financial statements was established and maintained and if such controls operated effectively in all material respects.
4. Our audit involves performing procedures to obtain audit evidence about the adequacy of the internal financial controls over financial reporting with reference to these consolidated Ind AS financial statements and their operating effectiveness. Our audit of internal financial controls over financial reporting included obtaining an understanding of internal financial controls over financial reporting with reference to these consolidated Ind AS financial statements, assessing the risk that a material weakness exists, and testing and evaluating the design and operating effectiveness of internal control based on the assessed risk. The procedures selected depend on the auditor’s judgement, including the assessment of the risks of material misstatement of the financial statements, whether due to fraud or error.
5. We believe that the audit evidence we have obtained and the audit evidence obtained by the other auditors in terms of their reports referred to in the Other Matters paragraph below, is sufficient and appropriate to provide a basis for our audit opinion on the internal financial controls over financial reporting with reference to these consolidated Ind AS financial statements.
MEANING OF INTERNAL FINANCIAL CONTROLS OVER FINANCIAL REPORTING WITH REFERENCE TO THESE CONSOLIDATED IND AS FINANCIAL STATEMENTS6. A company’s internal financial control over financial reporting with reference to these consolidated Ind AS financial statements is a process designed to provide reasonable assurance regarding the reliability of financial reporting and the preparation of financial statements for external purposes in accordance with generally accepted accounting principles. A company’s internal financial control over financial reporting with reference to these consolidated financial statements includes those policies and procedures that (1) pertain to the maintenance of records that, in reasonable detail, accurately and fairly reflect the transactions and dispositions of the assets of the company; (2) provide reasonable assurance that transactions are recorded as necessary to permit preparation of financial statements in accordance with generally accepted accounting principles, and that receipts and expenditures of the company are being made only in accordance with authorisations of management and directors of the company; and (3) provide reasonable assurance regarding prevention or timely detection of unauthorised acquisition, use, or disposition of the company’s assets that could have a material effect on the financial statements.
INHERENT LIMITATIONS OF INTERNAL FINANCIAL CONTROLS OVER FINANCIAL REPORTING WITH REFERENCE TO THESE CONSOLIDATED FINANCIAL STATEMENTS7. Because of the inherent limitations of internal financial controls over financial reporting with reference to these consolidated Ind AS financial statements, including the possibility of collusion or improper management override of controls, material misstatements due to error or fraud may occur and not be detected. Also, projections of any evaluation of the internal financial controls over financial reporting with reference to these consolidated Ind AS financial statements to future periods are subject to the risk that the internal financial control over financial reporting with reference to these consolidated financial statements may become inadequate because of changes in conditions, or that the degree of compliance with the policies or procedures may deteriorate.
OPINION8. In our opinion, the Holding Company, its subsidiary companies, its associate company and joint ventures, which are companies incorporated in India, have, maintained in all material respects, adequate internal financial controls over financial reporting with reference
to these consolidated Ind AS financial statements and such internal financial controls over financial reporting with reference to these consolidated Ind AS financial statements were operating effectively as at March 31,2020, based on the internal control over financial reporting criteria established by the Holding Company considering the essential components of internal control stated in the COSO 2013 criterion.
OTHER MATTERS9. Our report under Section 143(3)(i) of the Act on the adequacy and operating effectiveness of the internal financial controls over financial reporting with reference to these consolidated financial statements of the Holding Company, insofar as it relates to one subsidiary company, which is a company incorporated in India, is based on the corresponding reports of the auditors of such subsidiary.
For S.R. Batliboi & Co. LLPChartered Accountants
ICAI Firm Registration Number: 301003E/E300005
per Sudhir SoniPartner
Place: Mumbai Membership Number: 41870Date: June 06, 2020 UDIN: 20041870AAAAAQ9715
INTEGRATED REPORT
06-115MANAGEMENT REVIEW
116-167STATUTORY REPORTS
168-270FINANCIAL STATEMENTS
271-502

386 VEDANTA LIMITED INTEGRATED REPORT AND ANNUAL ACCOUNTS 2019-20 VEDANTA LIMITED INTEGRATED REPORT AND ANNUAL ACCOUNTS 2019-20 387
CONSOLIDATED BALANCE SHEETas at March 1 2020
CONSOLIDATED STATEMENT OF PROFIT AND LOSSfor the year ended March 1 2020
(` in Crore)
Particulars NoteAs at
March 31, 2020As at
March 31, 2019ASSETSNon-current assetsProperty, Plant and Equipment 6 88,022 95,515 Capital work-in-progress 6 16,837 22,236 Intangible assets 6 882 882 Exploration intangible assets under development 6 1,748 2,723 Financial assets� Investments 7A 95 4,891 � Trade receivables 8 3,111 3,688 � Loans 9 17 20 � Derivatives 3 - � Others 10 2,523 1,083 Deferred tax assets (net) 34 6,889 3,475 Income tax assets (net) 34 2,645 3,484 Other non-current assets 11 3,330 4,218 Total non-current assets 1,26,102 1,42,215 Current assetsInventories 12 11,335 13,198 Financial assets� Investments 7B 24,658 28,174 � Trade receivables 8 2,697 3,982 � Cash and cash equivalents 13 5,117 7,289 � Other bank balances 14 7,385 1,080 � Loans 9 85 82 � Derivatives 692 78 � Others 10 2,406 2,482 Income tax assets (net) 7 8 Other current assets 11 3,138 3,455 Total current assets 57,520 59,828 Total Assets 1,83,622 2,02,043 EQUITY AND LIABILITIESEquityEquity Share Capital 15 372 372 Other Equity 16 54,263 61,925 Equity attributable to owners of Vedanta Limited 54,635 62,297 Non-controlling interests 17 17,112 15,227 Total Equity 71,747 77,524 LiabilitiesNon-current liabilitiesFinancial liabilities� Borrowings 19 36,724 34,721 � Derivatives 45 99 � Other financial liabilities 21 1,501 1,569 Provisions 23 2,828 2,596 Deferred tax liabilities (net) 34 2,885 4,484 Other non-current liabilities 24 4,570 4,409 Total non-current liabilities 48,553 47,878 Current LiabilitiesFinancial liabilities� Borrowings 19 13,076 22,982 � Trade payables 20 16,972 17,352 � Derivatives 96 451 � Other financial liabilities 21 21,162 22,288 Provisions 23 355 387 Income tax liabilities (net) 188 409 Other current liabilities 24 11,473 12,772 Total current liabilities 63,322 76,641 Total Equity and Liabilities 1,83,622 2,02,043
See accompanying notes to the financial statementsAs per our report of even date For and on behalf of the Board of DirectorsFor S.R. Batliboi & Co. LLP Anil Agarwal Sunil DuggalChartered AccountantsICAI Firm Registration No. 301003E/E300005
Non-Executive Chairman DIN: 00010883
Interim Chief Executive Officer PAN AAMPD1109M
per Sudhir Soni GR Arun Kumar Prerna HalwasiyaPartner Membership No: 41870
Whole-Time Director and Chief Financial Officer DIN: 01874769
Company Secretary ICSI Membership No. A20856
Place: MumbaiDate: June 06, 2020
(` in Crore except otherwise stated)
Particulars NoteYear ended
March 31, 2020Year ended
March 31, 2019
Revenue from operations 25A 83,545 90,901 Other operating income 25B 902 1,147 Other income 26 2,510 4,018 Total Income 86,957 96,066 Expenses:Cost of materials consumed 21,261 25,490 Purchases of stock-in-trade 225 588 Changes in inventories of finished goods, work-in-progress and stock in trade 27 1,017 72 Power & fuel charges 16,392 18,144 Employee benefits expense 28 2,672 3,023 Finance costs 31 4,977 5,689 Depreciation, depletion and amortisation expense 6 9,093 8,192 Other expenses 32 22,193 21,628 Total expenses 77,830 82,826 Profit before exceptional items and tax 9,127 13,240 Net exceptional (loss)/ gain 33 (17,386) 320 (Loss)/ Profit before tax (8,259) 13,560 Tax (benefit)/ expense:On other than exceptional itemsNet current tax expense 1,788 2,677 Net deferred tax (benefit)/expense (484) 1,073 Deferred tax on intra group profit distribution 1,701 - On exceptional itemsNet deferred tax (benefit)/expense (6,521) 112 Net tax (benefit)/ expense (3,516) 3,862 (Loss)/ Profit after tax for the year before share in profit/ (loss) of jointly controlled entities and associates and non-controlling interests
(4,743) 9,698
Add: Share in (loss)/ profit of jointly controlled entities and associates (1) 0 (Loss)/ Profit for the year after share in profit/ (loss) of jointly controlled entities and associates (A)
(4,744) 9,698
Other Comprehensive Income / (loss)Items that will not be reclassified to profit or lossRe-measurements loss of defined benefit plans (210) (40)Tax credit 71 25 Loss on FVOCI equity investment (74) (45)
(213) (60)Items that will be reclassified to profit or lossNet loss on cash flow hedges recognised during the year 127 113 Tax credit (44) (51)Net gain on cash flow hedges recycled to profit or loss (33) (184)Tax expense 12 60 Net loss on FVOCI investments - (150)Tax credit - 17 Exchange differences on translation 833 737 Tax expense 34 (25)
929 517 Total other comprehensive (loss)/ income (B) 716 457 Total comprehensive (loss)/ income for the year (A+B) (4,028) 10,155
INTEGRATED REPORT
06-115MANAGEMENT REVIEW
116-167STATUTORY REPORTS
168-270FINANCIAL STATEMENTS
271-502

388 VEDANTA LIMITED INTEGRATED REPORT AND ANNUAL ACCOUNTS 2019-20 VEDANTA LIMITED INTEGRATED REPORT AND ANNUAL ACCOUNTS 2019-20 389
CONSOLIDATED STATEMENT OF CASH FLOWSfor the year ended March 1 2020
(` in Crore)
ParticularsYear ended
March 31, 2020Year ended
March 31, 2019
Cash ows from operating activities(Loss)/ Profit before taxation (8,259) 13,560 Adjustments for:Depreciation, depletion and amortisation 9,152 8,220 Impairment charge /(reversal) 17,080 (261)Other exceptional items 306 (59)Provision for doubtful debts/ advance/ bad debts written off 121 - Exploration costs written off 3 50 Fair Value gain on financial assets held at fair value through profit or loss (558) (1,988)Loss on sale/ discard of property, plant and equipment (net) 56 68 Foreign exchange loss (net) 317 512 Unwinding of discount 96 93 Share based payment expense 72 81 Interest and dividend Income (1,683) (1,447)Interest expenses 4,874 5,593 Deferred government grant (205) (183)Changes in assets and liabilitiesDecrease/(increase) in trade and other receivables 462 (2,690)Decrease/(increase) in inventories 1,990 (418)(Decrease)/ increase in trade and other payable (3,391) 5,236 Cash generated from operation 20,433 26,367 Income taxes paid (net) (1,135) (2,613)Net cash generated from operating activities 19,298 23,754 Cash ows from investing activitiesConsideration paid for business acquisition (net of cash and cash equivalents acquired) (33) (5,075)Purchases of property, plant and equipment (including intangibles) (7,814) (8,942)Proceeds from sale of property, plant and equipment 145 125 Short-term deposits made (11,190) (1,926)Proceeds from redemption short-term deposits 4,564 4,406 Short-term investments made (98,358) (81,523)Proceeds from sale of short-term investments 1,03,339 83,362 Interest received 830 884 Dividends received 18 30 Payment made to Site Restoration fund (37) (55)Proceeds on liquidation of structured investments 3,077 - Payment towards Structured Investments (435) (1,816)Net cash (used in) investing activities (5,894) (10,530)
(` in Crore except otherwise stated)
Particulars NoteYear ended
March 31, 2020Year ended
March 31, 2019
(Loss)/ Profit attributable to:Owners of Vedanta Limited (6,664) 7,065 Non-controlling interests 17 1,920 2,633 Other comprehensive (loss)/ income attributable to:Owners of Vedanta Limited 839 585 Non-controlling interests 17 (123) (128)Total comprehensive (loss)/ income attributable to:Owners of Vedanta Limited (5,825) 7,650 Non-controlling interests 17 1,797 2,505 (Loss)/ Earnings per share (in )- Basic 35 (18.00) 19.07- Diluted (18.00) 18.98
See accompanying notes to the financial statements
As per our report of even date For and on behalf of the Board of Directors
For S.R. Batliboi & Co. LLP Anil Agarwal Sunil DuggalChartered AccountantsICAI Firm Registration No. 301003E/E300005
Non-Executive Chairman DIN: 00010883
Interim Chief Executive Officer PAN AAMPD1109M
per Sudhir Soni GR Arun Kumar Prerna HalwasiyaPartner Membership No: 41870
Whole-Time Director and Chief Financial Officer DIN: 01874769
Company Secretary ICSI Membership No. A20856
Place: Mumbai
Date: June 06, 2020
CONSOLIDATED STATEMENT OF PROFIT AND LOSSfor the year ended March 1 2020
INTEGRATED REPORT
06-115MANAGEMENT REVIEW
116-167STATUTORY REPORTS
168-270FINANCIAL STATEMENTS
271-502

390 VEDANTA LIMITED INTEGRATED REPORT AND ANNUAL ACCOUNTS 2019-20 VEDANTA LIMITED INTEGRATED REPORT AND ANNUAL ACCOUNTS 2019-20 391
A. EQUITY SHARE CAPITAL
Equity shares of ` 1/- each issued, subscribed and fully paid upNumber of shares
(in Crore)Amount
(` in Crore)
As at March 31, 2020 and March 31, 2019 372 372
B. OTHER EQUITY(` in Crore)
Particulars
Reserves and Surplus Items of OCI
Total other
equity
Non-controlling
interests TotalCapital reserve
Securities premium
reserveRetained earnings
Other reserves
(refer note
below)
Foreign currency
translation reserve
Equity instruments through OCI
Debt instruments through OCI
Effective portion of cash ow
hedges
Balance as at April 01, 2018 18,964 19,009 2,887 20,635 1,220 149 86 (10) 62,940 15,961 78,901 Profit for the year - - 7,065 - - - - - 7,065 2,633 9,698 Other comprehensive income for the year (net of tax impact)
- - (12) - 791 (45) (86) (63) 585 (128) 457
Total Comprehensive Income for the year - - 7,053 - 791 (45) (86) (63) 7,650 2,505 10,155
Purchase of treasury shares - - - (144) - - - - (144) - (144)Recognition of share based payment - - - 82 - - - - 82 - 82
Stock options cancelled during the year - - 7 (7) - - - - - - -
Exercise of stock option - - 1 3 - - - - 4 - 4 Transfer from debenture redemption reserve (net) - - 174 (174) - - - - - - -
Recognition of put option liability/derecognition of non controlling interest
(196) - - - - - - - (196) 139 (57)
Acquisition of ESL (refer note 4(c)) - - - - - - - - - 196 196
Dividend, including tax on dividend (Refer note 36) - - (8,411) - - - - - (8,411) (3,574) (11,985)
Balance as at March 31, 2019 18,768 19,009 1,711 20,395 2,011 104 - (73) 61,925 15,227 77,152
Loss for the year - - (6,664) - - - - - (6,664) 1,920 (4,744)Other comprehensive income for the year (net of tax impact) - - (92) - 959 (74) - 46 839 (123) 716
Total comprehensive income for the year - - (6,756) - 959 (74) - 46 (5,825) 1,797 (4,028)
Recognition of share based payment - - - 75 - - - - 75 - 75
Stock options cancelled during the year - - 52 (52) - - - - - - -
Exercise of stock option - - 7 (7) - - - - - - 0 Transfer from debenture redemption reserve (net) - - 191 (191) - - - - - - -
Recognition of put option liability/derecognition of non controlling interest
(343) - - - - - - - (343) 322 (21)
Acquisition of non -controlling interests in Electrosteel Steel Limited
127 - - - - - - - 127 (234) (107)
Dividend, including tax on dividend (Refer note 36) - - (1,696) - - - - - (1,696) - (1,696)
Balance as at March 31, 2020 18,552 19,009 (6,491) 20,220 2,970 30 - (27) 54,263 17,112 71,375
CONSOLIDATED STATEMENT OF CHANGES IN EQUITYfor the year ended March 1 2020
(` in Crore)
ParticularsYear ended
March 31, 2020Year ended
March 31, 2019
Cash ows from financing activitiesRepayment of short-term loan (net) (11,264) (626)Proceeds from current borrowings 4,473 4,429 Repayment of current borrowings (4,397) (3,179)Proceeds from long-term borrowings 11,826 16,835 Repayment of long-term borrowings (8,996) (9,760)Interest paid (5,322) (6,009)Payment of dividends to equity holders of the parent, including dividend distribution tax (1,444) (8,076)Payment of dividends to non-controlling interests, including dividend distribution tax - (3,716) Excersice of Stock Options 0 4 Purchase of Treasury Shares for Stock options - (144) Payment for acquiring non-controlling interest (107) - Payment of lease liabilities (316) - Net cash (used in) financing activities (15,547) (10,242)Effect of exchange rate changes on cash and cash equivalents (31) (64)Net (decrease)/ increase in cash and cash equivalents (2,174) 2,918 Cash and cash equivalents at the beginning of the year (Refer note 13(c)) 7,385 4,467 Cash and cash equivalents at end of the year (Refer note 13(c)) 5,211 7,385
Notes:1.� The figures in brackets indicate outflows� �2.� �The above cash flow has been prepared under the “Indirect Method” as set out in Indian Accounting Standard (Ind AS) 7 -
statement of cash flows� �
See accompanying notes to the financial statements
As per our report of even date For and on behalf of the Board of Directors
For S.R. Batliboi & Co. LLP Anil Agarwal Sunil DuggalChartered AccountantsICAI Firm Registration No. 301003E/E300005
Non-Executive Chairman DIN: 00010883
Interim Chief Executive Officer PAN AAMPD1109M
per Sudhir Soni GR Arun Kumar Prerna HalwasiyaPartner Membership No: 41870
Whole-Time Director and Chief Financial Officer DIN: 01874769
Company Secretary ICSI Membership No. A20856
Place: Mumbai
Date: June 06, 2020
CONSOLIDATED STATEMENT OF CASH FLOWSfor the year ended March 1 2020
INTEGRATED REPORT
06-115MANAGEMENT REVIEW
116-167STATUTORY REPORTS
168-270FINANCIAL STATEMENTS
271-502

VEDANTA LIMITED INTEGRATED REPORT AND ANNUAL ACCOUNTS 2019-20 393
CONSOLIDATED NOTES FORMING PART OF THE FINANCIAL STATEMENTSas at and for the year ended March 31, 2020
392 VEDANTA LIMITED INTEGRATED REPORT AND ANNUAL ACCOUNTS 2019-20
1. COMPANY OVERVIEW:Vedanta Limited (“the Company”) and its consolidated subsidiaries (collectively, the “Group”) is a diversified natural resource group engaged in exploring, extracting and processing minerals and oil and gas. The Group engages in the exploration, production and sale of zinc, lead, silver, copper, aluminium, iron ore and oil and gas and have a presence across India, South Africa, Namibia, Ireland, Australia, Liberia and UAE. The Group is also in the business of commercial power generation, steel manufacturing and port operations in India and manufacturing of glass substrate in South Korea and Taiwan.� � � � � � �
The Company was incorporated on September 8, 1975 under the laws of the Republic of India. The registered office of the Company is situated at 1st Floor, ‘C’ wing, Unit 103, Corporate Avenue, Atul Projects, Chakala, Andheri (East), Mumbai-400092, Maharashtra. The Company’s shares are listed on National Stock Exchange and Bombay Stock Exchange in India. In June 2007, the Company completed its initial public offering of American Depositary Shares, or ADS, each representing four equity shares, and listed its ADSs on the New York Stock Exchange. In July 2009, the Company completed its follow-on offering of an additional 131,906,011 ADSs, each representing four equity shares, which are listed on the New York Stock Exchange.
The Company is majority owned by Twin Star Holdings Limited (“Twin Star”), Finsider International Company Limited (“Finsider”), West Globe Limited (“West Globe”) and Welter Trading Limited (“Welter”) which are in turn wholly-owned subsidiaries of Vedanta Resources PLC (“VRPLC”), which was a public limited company incorporated in the United Kingdom and listed on the London Stock Exchange (VRPLC has been delisted from London Stock Exchange on October 1, 2018 and is renamed as “Vedanta Resources Limited” (“VRL”) with effect from October 29, 2018). Twin Star, Finsider, West Globe and Welter held 37.1%, 10.8%, 1.2% and 1.0% respectively of the Company’s equity as at March 31, 2020.� � � � � � �
Details of Group’s various businesses are as follows. The Group’s percentage holdings in each of the below businesses are disclosed in note 40.� � � � �
� Zinc India business is owned and operated by Hindustan Zinc Limited (“HZL”).� � � � � � �
� Zinc international business is comprised of Skorpion mine and refinery in Namibia operated through THL Zinc Namibia Holdings (Proprietary) Limited (“Skorpion”), Lisheen mine in Ireland operated through Vedanta Lisheen Holdings Limited (“Lisheen”) (Lisheen mine ceased operations in December 2015) and Black
Mountain Mining (Proprietary) Limited (“BMM”), whose assets include the operational Black Mountain mine and the Gamsberg mine project located in South Africa.� � � � � � �
� The Group’s oil and gas business is owned and operated by the Company and its subsidiary, Cairn Energy Hydrocarbons Limited and consists of exploration and development and production of oil and gas.�� � � � � �
� The Group’s iron ore business is owned by the Company, and by two wholly owned subsidiaries of the Company i.e. Sesa Resources Limited and Sesa Mining Corporation Limited and consists of exploration, mining and processing of iron ore, pig iron and metallurgical coke and generation of power for captive use. Pursuant to Honourable Supreme Court of India order, mining operations in the state of Goa are currently suspended. The Group’s iron ore business includes Western Cluster Limited (“WCL”) in Liberia which has iron ore assets and is wholly owned by the Group. WCL’s assets include development rights to Western Cluster and a network of iron ore deposits in West Africa. WCL’s assets have been fully impaired.� �
� The Group’s copper business is owned and operated by the Company, Copper Mines of Tasmania Pty Ltd (“CMT”) and Fujairah Gold FZC and is principally one of custom smelting and includes captive power plants at Tuticorin in Southern India.� � � � � � �
The Group’s copper business in Tamil Nadu, India has received an order from the Tamil Nadu Pollution Control Board (“TNPCB”) on April 09, 2018, rejecting the Company’s application for renewal of consent to operate under the Air and Water Acts for the 400,000 tpa copper smelter plant in Tuticorin for want of further clarification and consequently the operations were suspended. The Company has filed an appeal with TNPCB Appellate authority against the said order. During the pendency of the appeal, TNPCB through its order dated May 23, 2018 ordered for disconnection of electricity supply and closure of copper smelter plant. Post such order, the state government on May 28, 2018 ordered the permanent closure of the plant [Refer note 3(c)(A)(vii)].
In addition, the Group owns and operates the Mt. Lyell copper mine in Tasmania, Australia through its subsidiary, CMT and a precious metal refinery and copper rod plant in Fujairah, UAE through its subsidiary Fujairah Gold FZC. The operations of Mt Lyell copper mine were suspended in January 2014 following a mud slide incident and were put into care and maintenance since July 09, 2014 following a rock fall incident in June 2014.
� The Group’s Aluminium business is owned and operated by the Company and by Bharat Aluminium
Note:Other reserves comprise of:
(` in Crore)
Particulars
Capital redemption
reserve
Debenture redemption
reserve
Preference share
redemption reserve
Capital reserve on
consolidation
Share based
payment reserve
Legal reserve
Treasury shares
General reserve Total
Balance as at April 01, 2018 23 1,477 77 10 177 25 (259) 19,105 20,635 Purchase of treasury shares - - - - - - (144) - (144)Recognition of share based payment - - - - 82 - - - 82 Stock options cancelled during the year - - - - (7) - - - (7)Exercise of stock options - - - - (3) - 6 - 3 Redemption of preference shares (Refer note 15) - - 3,010 - - - - (3,010) -
Transfer to retained earnings - (174) - - - - - - (174)Balance as at March 31, 2019 23 1,303 3,087 10 249 25 (397) 16,095 20,395 Recognition of share based payment - - - - 75 - - - 75 Stock options cancelled during the year - - - - (52) - - - (52)Exercise of stock options - - - - (23) - 16 - (7)Transfer to retained earnings - (191) - - - - - - (191)Balance as at March 31, 2020 23 1,112 3,087 10 249 25 (381) 16,095 20,220
See accompanying notes to the financial statements
As per our report of even date For and on behalf of the Board of Directors
For S.R. Batliboi & Co. LLP Anil Agarwal Sunil DuggalChartered AccountantsICAI Firm Registration No. 301003E/E300005
Non-Executive Chairman DIN 00010883
Interim Chief Executive Officer PAN AAMPD1109M
per Sudhir Soni GR Arun Kumar Prerna HalwasiyaPartner Membership No: 41870
Whole-Time Director and Chief Financial Officer DIN 01874769
Company Secretary ICSI Membership No. A20856
Place: MumbaiDate: June 06, 2020
CONSOLIDATED STATEMENT OF CHANGES IN EQUITYfor the year ended March 1 2020
INTEGRATED REPORT MANAGEMENT REVIEW STATUTORY REPORTS FINANCIAL STATEMENTS
06-115 116-167 168-270 271-502

394 VEDANTA LIMITED INTEGRATED REPORT AND ANNUAL ACCOUNTS 2019-20 VEDANTA LIMITED INTEGRATED REPORT AND ANNUAL ACCOUNTS 2019-20 395
CONSOLIDATED NOTES FORMING PART OF THE FINANCIAL STATEMENTSas at and for the year ended March 31, 2020
CONSOLIDATED NOTES FORMING PART OF THE FINANCIAL STATEMENTSas at and for the year ended March 31, 2020
Company Limited (“BALCO”). The aluminium operations include a refinery and captive power plant at Lanjigarh and a smelter and captive power plants at Jharsuguda both situated in the State of Odisha in India. BALCO’s partially integrated aluminium operations are comprised of two bauxite mines, captive power plants, smelting and fabrication facilities in the State of Chhattisgarh in central India.
� The Group’s power business is owned and operated by the Company, BALCO, and Talwandi Sabo Power Limited (“TSPL”), a wholly owned subsidiary of the Company, which are engaged in the power generation business in India. The Company’s power operations include a thermal coal- based commercial power facility of 600 MW at Jharsuguda in the State of Odisha in Eastern India. BALCO power operations included 600 MW (2 units of 300 MW each) thermal coal based power plant at Korba, of which a unit of 300 MW was converted to be used for captive consumption vide order from Central Electricity Regulatory Commission (CERC) dated January 1, 2019. Talwandi Sabo Power Limited (“TSPL”) power operations include 1,980 MW (three units of 660 MW each) thermal coal- based commercial power facilities. Power business also includes the wind power plants commissioned by HZL and a power plant at MALCO Energy Limited (“MEL”) (under care and maintenance) situated at Mettur Dam in the State of Tamil Nadu in southern India.
� The Group’s other activities include Electrosteel Steels Limited (“ESL”) acquired on June 4, 2018. ESL is engaged in the manufacturing and supply of billets, TMT bars, wire rods and ductile iron pipes in India.
� The Group’s other activities also include Vizag General Cargo Berth Private Limited (“VGCB”) and Maritime Ventures Private Limited (“MVPL”). Vizag port project includes mechanization of coal handling facilities and upgradation of general cargo berth for handling coal at the outer harbour of Visakhapatnam Port on the east coast of India. MVPL is engaged in the business of rendering logistics and other allied services inter alia rendering stevedoring, and other allied services in ports and other allied sectors. VGCB commenced operations in the fourth quarter of fiscal 2013. The Group’s other activities also include AvanStrate Inc. (“ASI”). ASI is involved in the manufacturing of glass substrate in South Korea and Taiwan.
2. BASIS OF PREPARATION AND BASIS OF MEASUREMENT OF FINANCIAL STATEMENTS(A) Basis of preparationThese consolidated financial statements have been prepared in accordance with Indian Accounting Standards (Ind AS) notified under the Companies (Indian Accounting Standards) Rules, 2015 and other relevant
provisions of the Companies Act, 2013 (the “Act”) (as amended from time to time) and Guidance Note on Accounting for Oil and Gas Producing Activities issued by the Institute of Chartered Accountants of India.�
These consolidated financial statements have been prepared in accordance with the accounting policies, set out below and were consistently applied to all periods presented unless otherwise stated.
These financial statements are approved for issue by the Board of Directors on June 06, 2020.
Certain comparative figures appearing in these consolidated financial statements have been regrouped and/or reclassified to better reflect the nature of those items.� � � � � � �
All financial information presented in Indian Rupees has been rounded off to the nearest crore except when indicated otherwise. Amounts less than ` 0.50 Crore have been presented as “0”.� � � � � � �
(B) Basis of measurementThe consolidated financial statements have been prepared on a going concern basis using historical cost convention and on an accrual method of accounting, except for certain financial assets and liabilities which are measured at fair value as explained in the accounting policies below.
3(a) SIGNIFICANT ACCOUNTING POLICIES(A) Revenue recognitioni) Subsidiaries:The consolidated financial statements incorporate the results of the Company and all its subsidiaries (the “Group”), being the entities that it controls. Control is evidenced where the Group has power over the investee, is exposed, or has rights, to variable returns from its involvement with the investee and has the ability to affect those returns through its power over the investee. Power is demonstrated through existing rights that give the ability to direct relevant activities, which significantly affect the entity’s returns.
The financial statements of subsidiaries are prepared for the same reporting year as the parent company. Where necessary, adjustments are made to the financial statements of subsidiaries to align the accounting policies in line with accounting policies of the Group.
For non-wholly owned subsidiaries, a share of the profit/(loss) for the financial year and net assets is attributed to the non-controlling interests as shown in the consolidated statement of profit and loss and consolidated balance sheet.
Liability for put option issued to non-controlling interests which do not grant present access to ownership interest to the Group is recognised at present value of the redemption amount and is reclassified from equity. At the end of each reporting period, the non-controlling interests subject to put option is derecognised and the difference between the amount derecognised and present value of the redemption amount, which is recorded as a financial liability, is accounted for as an equity transaction.
For acquisitions of additional interests in subsidiaries, where there is no change in control, the Group recognises a reduction to the non-controlling interest of the respective subsidiary with the difference between this figure and the cash paid, inclusive of transaction fees, being recognised in equity. Similarly, upon dilution of controlling interests the difference between the cash received from sale or listing of the subsidiary shares and the increase to non-controlling interest is also recognised in equity. The results of subsidiaries acquired or disposed off during the year are included in the consolidated statement of profit and loss from the effective date of acquisition or up to the effective date of disposal, as appropriate.
Intra-Group balances and transactions, and any unrealised profit arising from intra-Group transactions, are eliminated. Unrealised losses are eliminated unless costs cannot be recovered.
ii) Joint arrangementsA Joint arrangement is an arrangement of which two or more parties have joint control. Joint control is considered when there is contractually agreed sharing of control of an arrangement, which exists only when decisions about the relevant activities require the unanimous consent of the parties sharing control. Investments in joint arrangements are classified as either joint operations or joint venture. The classification depends on the contractual rights and obligations of each investor, rather than the legal structure of the joint arrangement. A joint operation is a joint arrangement whereby the parties that have joint control of the arrangement have rights to the assets, and obligations for the liabilities, relating to the arrangement. A joint venture is a joint arrangement whereby, the parties that have joint control of the arrangement have rights to the net assets of the arrangement.
The Group has both joint operations and joint ventures.
oint operationsThe Group has joint operations within its Oil and gas segment. It participates in several unincorporated joint operations which involve the joint control of assets used in oil and gas exploration and producing activities. The
Group accounts for its share of assets, liabilities, income and expenditure of joint operations in which the Group holds an interest. Liabilities in unincorporated joint operations, where the Group is the operator, is accounted for at gross values (including share of other partners) with a corresponding receivable from the venture partner. These have been included in the consolidated financial statements under the appropriate headings.
Details of joint operations are set out in Note 40.
oint ventureThe Group accounts for its interest in joint venture using the equity method (see (iv) below), after initially being recognised at cost in the consolidated balance sheet. Goodwill arising on the acquisition of joint venture is included in the carrying value of investments in joint venture.
iii) Investments in associatesAn associate is an entity over which the Group has significant influence. Significant influence is the power to participate in the financial and operating policy decisions of the investee, but is not control or joint control over those policies. Investments in associates are accounted for using the equity method (see (iv) below). Goodwill arising on the acquisition of associate is included in the carrying value of investments in associate.
iv) Equity method of accountingUnder the equity method of accounting applicable for investments in associates and joint ventures, investments are initially recorded at the cost to the Group and then, in subsequent periods, the carrying value is adjusted to reflect the Group’s share of the post-acquisition profits or losses of the investee, and the Group’s share of other comprehensive income of the investee, other changes to the investee’s net assets and is further adjusted for impairment losses, if any. Dividend received or receivable from associates and joint-ventures are recognised as a reduction in carrying amount of the investment.
The consolidated statement of profit and loss include the Group’s share of investee’s results, except where the investee is generating losses, share of such losses in excess of the Group’s interest in that investee are not recognised. Losses recognised under the equity method in excess of the Group’s investment in ordinary shares are applied to the other components of the Group’s interest that forms part of Group’s net investment in the investee in the reverse order of their seniority (i.e. priority in liquidation).
If the Group’s share of losses in an associate or joint venture equals or exceeds its interests in the associate or joint venture, the Group discontinues the recognition
INTEGRATED REPORT MANAGEMENT REVIEW STATUTORY REPORTS FINANCIAL STATEMENTS
06-115 116-167 168-270 271-502

396 VEDANTA LIMITED INTEGRATED REPORT AND ANNUAL ACCOUNTS 2019-20 VEDANTA LIMITED INTEGRATED REPORT AND ANNUAL ACCOUNTS 2019-20 397
CONSOLIDATED NOTES FORMING PART OF THE FINANCIAL STATEMENTSas at and for the year ended March 31, 2020
CONSOLIDATED NOTES FORMING PART OF THE FINANCIAL STATEMENTSas at and for the year ended March 31, 2020
of further losses. Additional losses are provided for, only to the extent that the Group has incurred legal or constructive obligations or made payments on behalf of the associate/joint venture.
Unrealised gains arising from transactions with associates and joint ventures are eliminated against the investment to the extent of the Group’s interest in these entities. Unrealised losses are eliminated in the same way as unrealised gains, but only to the extent that there is no evidence of impairment of the asset transferred. Accounting policies of equity accounted investees is changed where necessary to ensure consistency with the policies adopted by the Group.
The carrying amount of equity accounted investments are tested for impairment in accordance with the policy described in Note below 3(a)(H).
(B) Business combinationBusiness combinations are accounted for under the purchase method. The acquiree’s identifiable assets, liabilities and contingent liabilities that meet the conditions for recognition under Ind AS 103 ‘Business Combinations’ are recognised at their fair value at the acquisition date, except certain assets and liabilities required to be measured as per the applicable standards.
Excess of fair value of purchase consideration and the acquisition date non-controlling interest over the acquisition date fair value of identifiable assets acquired and liabilities assumed is recognised as goodwill. Goodwill arising on acquisitions is reviewed for impairment annually. Where the fair values of the identifiable assets and liabilities exceed the purchase consideration, the Group re-assesses whether it has correctly identified all of the assets acquired and all of the liabilities assumed and reviews the procedures used to measure the amounts to be recognised at the acquisition date. If the reassessment still results in an excess of the fair value of net assets acquired over the aggregate consideration transferred, then the gain is recognised in other comprehensive income and accumulated in equity as capital reserve. However, if there is no clear evidence of bargain purchase, the Group recognises the gain directly in equity as capital reserve, without routing the same through other comprehensive income.
Where it is not possible to complete the determination of fair values by the date on which the first post-acquisition financial statements are approved, a provisional assessment of fair value is made and any adjustments required to those provisional fair values are finalised within 12 months of the acquisition date.
Those provisional amounts are adjusted through goodwill during the measurement period, or additional assets
or liabilities are recognised, to reflect new information obtained about facts and circumstances that existed at the acquisition date that, if known, would have affected the amounts recognised at that date. These adjustments are called as measurement period adjustments. The measurement period does not exceed twelve months from the acquisition date.
Any non-controlling interest in an acquiree is measured at fair value or at the non-controlling interest’s proportionate share of the acquiree’s net identifiable assets. This accounting choice is made on a transaction by transaction basis.
Acquisition expenses are charged to the consolidated statement of profit and loss.
If the Group acquires a group of assets in a company that does not constitute a business combination in accordance with Ind AS 103 ‘Business Combinations’, the cost of the acquired group of assets is allocated to the individual identifiable assets acquired based on their relative fair value.
Common control transactionsA business combination involving entities or businesses under common control is a business combination in which all of the combining entities or businesses are ultimately controlled by the same party or parties both before and after the business combination and the control is not transitory. The transactions between entities under common control are specifically covered by Ind AS 103. Such transactions are accounted for using the pooling-of-interest method. The assets and liabilities of the acquired entity are recognised at their carrying amounts recorded in the parent entity’s consolidated financial statements with the exception of certain income tax and deferred tax assets. No adjustments are made to reflect fair values, or recognise any new assets or liabilities. The only adjustments that are made are to harmonise accounting policies.
The components of equity of the acquired companies are added to the same components within Group equity. The difference, if any, between the amounts recorded as share capital issued plus any additional consideration in the form of cash or other assets and the amount of share capital of the transferor is transferred to capital reserve and is presented separately from other capital reserves. The company’s shares issued in consideration for the acquired companies are recognised from the moment the acquired companies are included in these financial statements and the financial statements of the commonly controlled entities would be combined, retrospectively, as if the transaction had occurred at the beginning of the earliest reporting period presented. However, the prior year comparative information is only
adjusted for periods during which entities were under common control.
(C) Revenue recognition
� Sale of goods/rendering of services (Including Revenue from contracts with customers)
The Group’s revenue from contracts with customers is mainly from the sale of copper, aluminium, iron ore, zinc, oil and gas, power, steel, glass substrate and port operations. Revenue from contracts with customers is recognised when control of the goods or services is transferred to the customer which usually is on delivery of the goods to the shipping agent at an amount that reflects the consideration to which the Group expects to be entitled in exchange for those goods or services. Revenue is recognised net of discounts, volume rebates, outgoing sales taxes/ goods and service tax and other indirect taxes. Revenues from sale of by-products are included in revenue.
Certain of the Group’s sales contracts provide for provisional pricing based on the price on the London Metal Exchange (LME) and crude index, as specified in the contract. Revenue in respect of such contracts is recognised when control passes to the customer and is measured at the amount the entity expects to be entitled – being the estimate of the price expected to be received at the end of the measurement period. Post transfer of control of goods, provisional pricing features are accounted in accordance with Ind AS 109 ‘Financial Instruments’ rather than Ind AS 115 ‘Revenue from contracts with customers’ and therefore the Ind AS 115 rules on variable consideration do not apply. These ‘provisional pricing’ adjustments i.e. the consideration adjusted post transfer of control are included in total revenue from operations on the face of the consolidated statement of profit and loss and disclosed by way of note to the financial statements. Final settlement of the price is based on the applicable price for a specified future period. The Group’s provisionally priced sales are marked to market using the relevant forward prices for the future period specified in the contract and is adjusted in revenue.
Revenue from oil, gas and condensate sales represent the Group’s share in the revenue from sale of such products, by the joint operations, and is recognised as and when control in these products gets transferred to the customers. In computing its share of revenue, the Group excludes government’s share of profit oil which gets accounted for when the obligation in respect of the same arises.
Revenue from sale of power is recognised when delivered and measured based on rates as per bilateral contractual agreements with buyers and at a rate arrived at based on the principles laid down under the relevant Tariff
Regulations as notified by the regulatory bodies, as applicable.
Where the Group acts as a port operator, revenues relating to operating and maintenance phase of the port contract are measured at the amount that Group expects to be entitled to for the services provided.�
A contract asset is the right to consideration in exchange for goods or services transferred to the customer. If the Group performs part of its obligation by transferring goods or services to a customer before the customer pays consideration or before payment is due, a contract asset is recognised for the earned consideration when that right is conditional on the Group’s future performance.
A contract liability is the obligation to transfer goods or services to a customer for which the Group has received consideration from the customer. If a customer pays consideration before the Group transfers goods or services to the customer, a contract liability is recognised when the payment is received. The advance payments received plus a specified rate of return/ discount, at the prevailing market rates, is settled by supplying respective goods over a period of up to twenty four months under an agreed delivery schedule as per the terms of the respective agreements. As these are contracts that the Group expects, and has the ability, to fulfil through delivery of a non-financial item, these are presented as advance from customers and are recognised as revenue as and when control of respective commodities is transferred to customers under the agreements. The fixed rate of return/discount is treated as finance cost. The portion of the advance where either the Group does not have a unilateral right to defer settlement beyond 12 months or expects settlement within 12 months from the balance sheet date is classified as current liability.
� nterest income
Interest income from debt instruments is recognised using the effective interest rate method. The effective interest rate is the rate that exactly discounts estimated future cash receipts through the expected life of the financial asset to the gross carrying amount of a financial asset. When calculating the effective interest rate, the Group estimates the expected cash flows by considering all the contractual terms of the financial instrument (for example, prepayment, extension, call and similar options) but does not consider the expected credit losses.
� Dividends
Dividend income is recognised in the consolidated statement of profit and loss only when the right to receive payment is established, provided it is probable that the economic benefits associated with the dividend
INTEGRATED REPORT MANAGEMENT REVIEW STATUTORY REPORTS FINANCIAL STATEMENTS
06-115 116-167 168-270 271-502

398 VEDANTA LIMITED INTEGRATED REPORT AND ANNUAL ACCOUNTS 2019-20 VEDANTA LIMITED INTEGRATED REPORT AND ANNUAL ACCOUNTS 2019-20 399
CONSOLIDATED NOTES FORMING PART OF THE FINANCIAL STATEMENTSas at and for the year ended March 31, 2020
CONSOLIDATED NOTES FORMING PART OF THE FINANCIAL STATEMENTSas at and for the year ended March 31, 2020
will flow to the Group, and the amount of the dividend can be measured reliably.
(D) Property, Plant and Equipmenti) Mining properties and leasesWhen a decision is taken that a mining property is viable for commercial production (i.e. when the Group determines that the mining property will provide sufficient and sustainable return relative to the risks and the Group decided to proceed with the mine development), all further pre-production primary development expenditure other than that on land, buildings, plant, equipment and capital work in progress is capitalised as property, plant and equipment under the heading “Mining properties and leases” together with any amount transferred from “Exploration and evaluation” assets. The costs of mining properties and leases include the costs of acquiring and developing mining properties and mineral rights.
The stripping cost incurred during the production phase of a surface mine is deferred to the extent the current period stripping cost exceeds the average period stripping cost over the life of mine and recognised as an asset if such cost provides a benefit in terms of improved access to ore in future periods and certain criteria are met. When the benefit from the stripping costs are realised in the current period, the stripping costs are accounted for as the cost of inventory. If the costs of inventory produced and the stripping activity asset are not separately identifiable, a relevant production measure is used to allocate the production stripping costs between the inventory produced and the stripping activity asset. The Group uses the expected volume of waste compared with the actual volume of waste extracted for a given value of ore/ mineral production for the purpose of determining the cost of the stripping activity asset.
Deferred stripping costs are included in mining properties within property, plant and equipment and disclosed as a part of mining properties. After initial recognition, the stripping activity asset is depreciated on a unit of production method over the expected useful life of the identified component of the ore body.
In circumstances where a mining property is abandoned, the cumulative capitalised costs relating to the property are written off in the period in which it occurs i.e. when the Group determines that the mining property will not provide sufficient and sustainable returns relative to the risks and the Group decides not to proceed with the mine development.
Commercial reserves are proved and probable reserves as defined by the ‘JORC’ Code, ‘MORC’ code or ‘SAMREC’ Code. Changes in the commercial reserves affecting unit
of production calculations are dealt with prospectively over the revised remaining reserves.
ii) Oil and gas assets- (developing/producing assets)For oil and gas assets a successful efforts based accounting policy is followed. Costs incurred prior to obtaining the legal rights to explore an area are expensed immediately to the consolidated statement of profit and loss.
All costs incurred after the technical feasibility and commercial viability of producing hydrocarbons has been demonstrated are capitalised within property, plant and equipment - development/producing assets on a field-by-field basis. Subsequent expenditure is capitalised only where it either enhances the economic benefits of the development/producing asset or replaces part of the existing development/producing asset. Any remaining costs associated with the part replaced are expensed.
Net proceeds from any disposal of development/producing assets are credited against the previously capitalised cost. A gain or loss on disposal of a development/producing asset is recognised in the consolidated statement of profit and loss to the extent that the net proceeds exceed or are less than the appropriate portion of the net capitalised costs of the asset.
iii) Other property, plant and equipmentThe initial cost of property, plant and equipment comprises its purchase price, including import duties and non-refundable purchase taxes, and any directly attributable costs of bringing an asset to working condition and location for its intended use. It also includes the initial estimate of the costs of dismantling and removing the item and restoring the site on which it is located.
Land acquired free of cost or at below market rate from the government is recognised at fair value with corresponding credit to deferred income.
If significant parts of an item of property, plant and equipment have different useful lives, then they are accounted for as separate items (major components) of property, plant and equipment. All other expenses on existing property, plant and equipment, including day-to-day repair and maintenance expenditure and cost of replacing parts, are charged to the consolidated statement of profit and loss for the period during which such expenses are incurred.
Gains and losses on disposal of an item of property, plant and equipment computed as the difference between the net disposal proceeds and the carrying amount of the asset is included in the consolidated statement of profit and loss when the asset is derecognised. Major
inspection and overhaul expenditure is capitalised, if the recognition criteria are met.
iv) Assets under constructionAssets under construction are capitalised in the assets under construction account. At the point when an asset is capable of operating in the manner intended by management, the cost of construction is transferred to the appropriate category of property, plant and equipment. Costs associated with the commissioning of an asset and any obligatory decommissioning costs are capitalised until the period of commissioning has been completed and the asset is ready for its intended use.
v) Depreciation, depletion and amortisation expenseMining properties and other assets in the course of development or construction and freehold land and goodwill are not depreciated or amortised.
� ining properties
The capitalised mining properties are amortised on a unit-of-production basis over the total estimated remaining commercial proved and probable reserves of each property or group of properties and are subject to impairment review. Costs used in the unit of production calculation comprise the net book value of capitalised costs plus the estimated future capital expenditure required to access the commercial reserves. Changes in the estimates of commercial reserves or future capital expenditure are dealt with prospectively.
� Oil and gas producing acilities
All expenditures carried within each field are amortised from the commencement of production on a unit of production basis, which is the ratio of oil and gas production in the period to the estimated quantities of depletable reserves at the end of the period plus the production in the period, generally on a field-by-field basis or group of fields which are reliant on common infrastructure.
Depletable reserves are proved reserves for acquisition costs and proved and developed reserves for successful exploratory wells, development wells, processing facilities, distribution assets, estimated future abandonment cost and all other related costs. These assets are depleted within each cost centre. Reserves for this purpose are considered on working interest basis which are reassessed atleast annually. Impact of changes to reserves are accounted for prospectively.
� Other assets
Depreciation on other Property, plant and equipment is calculated using the straight-line method (SLM) to allocate their cost, net of their residual values, over their
estimated useful lives (determined by the management) as given below.
Management’s assessment takes into account, inter alia, the nature of the assets, the estimated usage of the assets, the operating conditions of the assets, past history of replacement and maintenance support.
Estimated useful life of assets are as follows:
Asset Useful life (in years)Buildings (Residential; factory etc.) 3-60Plant and equipment 15-40Railway siding 15Office equipment 3-6Furniture and fixture 8-10Vehicles 8-10
Major inspection and overhaul costs are depreciated over the estimated life of the economic benefit to be derived from such costs. The carrying amount of the remaining previous overhaul cost is charged to the consolidated statement of profit and loss if the next overhaul is undertaken earlier than the previously estimated life of the economic benefit.
The Group reviews the residual value and useful life of an asset at least at each financial year-end and, if expectations differ from previous estimates, the change is accounted for as a change in accounting estimate.
(E) Intangible assetsIntangible assets acquired separately are measured on initial recognition at cost. Subsequently, intangible assets are measured at cost less accumulated amortisation and accumulated impairment losses, if any.
The Group recognises port concession rights as “Intangible Assets” arising from a service concession arrangements, in which the grantor controls or regulates the services provided and the prices charged, and also controls any significant residual interest in the infrastructure such as property, plant and equipment, irrespective whether the infrastructure is existing infrastructure of the grantor or the infrastructure is constructed or purchased by the Group as part of the service concession arrangement. Such an intangible asset is recognised by the Group initially at cost determined as the fair value of the consideration received or receivable for the construction service delivered and is capitalised when the project is complete in all respects. Port concession rights are amortised on straight line basis over the balance of license period. The concession period is 30 years from the date of the award. Any addition to the port concession rights are measured at fair value on recognition. Port concession rights also include certain property, plant and equipment
INTEGRATED REPORT MANAGEMENT REVIEW STATUTORY REPORTS FINANCIAL STATEMENTS
06-115 116-167 168-270 271-502

400 VEDANTA LIMITED INTEGRATED REPORT AND ANNUAL ACCOUNTS 2019-20 VEDANTA LIMITED INTEGRATED REPORT AND ANNUAL ACCOUNTS 2019-20 401
CONSOLIDATED NOTES FORMING PART OF THE FINANCIAL STATEMENTSas at and for the year ended March 31, 2020
CONSOLIDATED NOTES FORMING PART OF THE FINANCIAL STATEMENTSas at and for the year ended March 31, 2020
in accordance with Appendix C of Ind AS 115 “service concession arrangements”.
Intangible assets are amortised over their estimated useful life on a straight line basis. Software is amortised over the estimated useful life ranging from 2-5 years. Amounts paid for securing mining rights are amortised over the period of the mining lease ranging from 16-25 years. Technological know-how and acquired brand are amortised over the estimated useful life of ten years.
Gains or losses arising from derecognition of an intangible asset are measured as the difference between the net disposal proceeds and the carrying amount of the asset and are recognised in the consolidated statement of profit and loss when the asset is derecognised.
The amortisation period and the amortisation method are reviewed at least at each financial year end. If the expected useful life of the asset is different from previous estimates, the change is accounted for prospectively as a change in accounting estimate.
(F) Exploration and evaluation intangible assetsExploration and evaluation expenditure incurred prior to obtaining the mining right or the legal right to explore are expensed as incurred.
Exploration and evaluation expenditure incurred after obtaining the mining right or the legal right to explore are capitalised as exploration and evaluation assets (intangible assets) and stated at cost less impairment, if any. Exploration and evaluation intangible assets are transferred to the appropriate category of property, plant and equipment when the technical feasibility and commercial viability has been determined. Exploration intangible assets under development are assessed for impairment and impairment loss, if any, is recognised prior to reclassification.
Exploration expenditure includes all direct and allocated indirect expenditure associated with finding specific mineral resources which includes depreciation and applicable operating costs of related support equipment and facilities and other costs of exploration activities:
� Acquisition costs - costs associated with acquisition of licenses and rights to explore, including related professional fees.
� General exploration costs - costs of surveys and studies, rights of access to properties to conduct those studies (e.g., costs incurred for environment clearance, defence clearance, etc.), and salaries and other expenses of geologists, geophysical crews and other personnel conducting those studies.
� Costs of exploration drilling and equipping exploration and appraisal wells.
Exploration expenditure incurred in the process of determining oil and gas exploration targets is capitalised within “Exploration and evaluation assets” (intangible assets) and subsequently allocated to drilling activities. Exploration drilling costs are initially capitalised on a well-by-well basis until the success or otherwise of the well has been established. The success or failure of each exploration effort is judged on a well-by-well basis. Drilling costs are written off on completion of a well unless the results indicate that hydrocarbon reserves exist and there is a reasonable prospect that these reserves are commercial.
Following appraisal of successful exploration wells, if commercial reserves are established and technical feasibility for extraction demonstrated, then the related capitalised exploration costs are transferred into a single field cost centre within property, plant and equipment - development/producing assets (oil and gas properties) after testing for impairment. Where results of exploration drilling indicate the presence of hydrocarbons which are ultimately not considered commercially viable, all related costs are written off to the consolidated statement of profit and loss.
Expenditure incurred on the acquisition of a license interest is initially capitalised on a license-by-license basis. Costs are held, undepleted, within exploration and evaluation assets until such time as the exploration phase on the license area is complete or commercial reserves have been discovered.
Net proceeds from any disposal of an exploration asset are initially credited against the previously capitalised costs. Any surplus/ deficit is recognised in the consolidated statement of profit and loss.
(G) Non-current assets held for saleNon-current assets and disposal groups are classified as held for sale if their carrying amount will be recovered through a sale transaction rather than through continuing use. This condition is regarded as met only when the sale is highly probable and the asset (or disposal group) is available for immediate sale in its present condition. Management must be committed to the sale which should be expected to qualify for recognition as a completed sale within one year from the date of classification.
Non-current assets and disposal groups classified as held for sale are not depreciated and are measured at the lower of carrying amount and fair value less costs to sell. Such assets and disposal groups are presented separately on the face of the consolidated balance sheet.
(H) Impairment of non-financial assetsImpairment charges and reversals are assessed at the level of cash-generating units. A cash-generating unit
(CGU) is the smallest identifiable group of assets that generate cash inflows that are largely independent of the cash inflows from other assets or group of assets.
The Group assesses at each reporting date, whether there is an indication that an asset may be impaired. The Group conducts an internal review of asset values annually, which is used as a source of information to assess for any indications of impairment or reversal of previously recognised impairment losses. Internal and external factors, such as worse economic performance than expected, changes in expected future prices, costs and other market factors are also monitored to assess for indications of impairment or reversal of previously recognised impairment losses.
If any such indication exists or in case of goodwill where annual testing of impairment is required, then an impairment review is undertaken and the recoverable amount is calculated, as the higher of fair value less costs of disposal and the asset’s value in use.
Fair value less costs of disposal is the price that would be received to sell the asset in an orderly transaction between market participants and does not reflect the effects of factors that may be specific to the Group and not applicable to entities in general. Fair value for mineral and oil and gas assets is generally determined as the present value of the estimated future cash flows expected to arise from the continued use of the asset, including any expansion prospects, and its eventual disposal, using assumptions that an independent market participant may take into account. These cash flows are discounted at an appropriate post tax discount rate to arrive at the net present value.
Value in use is determined as the present value of the estimated future cash flows expected to arise from the continued use of the asset in its present form and its eventual disposal. The cash flows are discounted using a pre-tax discount rate that reflects current market assessments of the time value of money and the risks specific to the asset for which estimates of future cash flows have not been adjusted. Value in use is determined by applying assumptions specific to the Group’s continued use and cannot take into account future development. These assumptions are different to those used in calculating fair value and consequently the value in use calculation is likely to give a different result to a fair value calculation.
The carrying amount of the CGU is determined on a basis consistent with the way the recoverable amount of the CGU is determined. The carrying value is net of deferred tax liability recognised in the fair value of assets acquired in the business combination.
If the recoverable amount of an asset or CGU is estimated to be less than its carrying amount, the carrying amount of the asset or CGU is reduced to its recoverable amount. An impairment loss is recognised in the consolidated statement of profit and loss.
Any reversal of the previously recognised impairment loss is limited to the extent that the asset’s carrying amount does not exceed the carrying amount that would have been determined if no impairment loss had previously been recognised except if initially attributed to goodwill.
Exploration and evaluation intangible assets:
In assessing whether there is any indication that an exploration and evaluation asset may be impaired, the Group considers, as a minimum, the following indicators:
� the period for which the Group has the right to explore in the specific area has expired during the period or will expire in the near future, and is not expected to be renewed;
� substantive expenditure on further exploration for and evaluation of mineral resources in the specific area is neither budgeted nor planned;
� exploration for and evaluation of mineral resources in the specific area have not led to the discovery of commercially viable quantities of mineral resources and the Group has decided to discontinue such activities in the specific area;
� sufficient data exist to indicate that, although a development in the specific area is likely to proceed, the carrying amount of the exploration and evaluation asset is unlikely to be recovered in full from successful development or by sale; and
� reserve information prepared annually by external experts.
When a potential impairment is identified, an assessment is performed for each area of interest in conjunction with the group of operating assets (representing a cash-generating unit) to which the exploration and evaluation assets is attributed. Exploration areas in which reserves have been discovered but require major capital expenditure before production can begin, are continually evaluated to ensure that commercial quantities of reserves exist or to ensure that additional exploration work is underway or planned. To the extent that capitalised expenditure is no longer expected to be recovered, it is charged to the consolidated statement of profit and loss.
(I) Financial instrumentsA financial instrument is any contract that gives rise to a financial asset of one entity and a financial liability or equity instrument of another entity.
INTEGRATED REPORT MANAGEMENT REVIEW STATUTORY REPORTS FINANCIAL STATEMENTS
06-115 116-167 168-270 271-502

402 VEDANTA LIMITED INTEGRATED REPORT AND ANNUAL ACCOUNTS 2019-20 VEDANTA LIMITED INTEGRATED REPORT AND ANNUAL ACCOUNTS 2019-20 403
CONSOLIDATED NOTES FORMING PART OF THE FINANCIAL STATEMENTSas at and for the year ended March 31, 2020
CONSOLIDATED NOTES FORMING PART OF THE FINANCIAL STATEMENTSas at and for the year ended March 31, 2020
(i) Financial Assets - recognition & subsequent measurementAll financial assets are recognised initially at fair value plus, in the case of financial assets not recorded at fair value through profit or loss, transaction costs that are attributable to the acquisition of the financial asset. Purchases or sales of financial assets that require delivery of assets within a time frame established by regulation or convention in the market place (regular way trades) are recognised on the trade date, i.e., the date that the Group commits to purchase or sell the asset.
For purposes of subsequent measurement, financial assets are classified in four categories:
� Debt instruments at amortised cost
A ‘debt instrument’ is measured at amortised cost if both the following conditions are met:
a) The asset is held within a business model whose objective is to hold assets for collecting contractual cash flows, and
b) Contractual terms of the asset give rise on specified dates to cash flows that are solely payments of principal and interest (SPPI) on the principal amount outstanding.
After initial measurement, such financial assets are subsequently measured at amortised cost using the Effective Interest Rate (EIR) method. Amortised cost is calculated by taking into account any discount or premium on acquisition and fees or costs that are an integral part of the EIR. The EIR amortisation is included in interest income in consolidated statement of profit and loss. The losses arising from impairment are recognised in consolidated statement of profit and loss.
� Debt instruments at air value through other comprehensive income F OC
A ‘debt instrument’ is classified as at FVOCI if both of the following criteria are met:
a) The objective of the business model is achieved both by collecting contractual cash flows and selling the financial assets, and
b) The asset’s contractual cash flows represent SPPI.
Debt instruments included within the FVOCI category are measured initially as well as at each reporting date at fair value. Fair value movements are recognised in other comprehensive income (OCI). However, interest income, impairment losses and reversals and foreign exchange gain or loss are recognised in the consolidated statement of profit and loss. On derecognition of the asset, cumulative gain or loss previously recognised in
other comprehensive income is reclassified from the equity to consolidated statement of profit and loss. Interest earned whilst holding fair value through other comprehensive income debt instrument is reported as interest income using the EIR method.
� Debt instruments at air value through pro t or loss F TP
FVTPL is a residual category for debt instruments. Any debt instrument, which does not meet the criteria for categorisation as at amortised cost or as FVOCI, is classified as at FVTPL.
In addition, the Group may elect to designate a debt instrument, which otherwise meets amortised cost or FVOCI criteria, as at FVTPL. However, such election is allowed only if doing so reduces or eliminates a measurement or recognition inconsistency (referred to as ‘accounting mismatch’). The Group has not designated any debt instrument as at FVTPL.
Debt instruments included within the FVTPL category are measured at fair value with all changes being recognised in consolidated statement of profit and loss.
� E uity instruments
All equity investments in the scope of Ind AS 109 are measured at fair value. Equity instruments which are held for trading and contingent consideration recognised by an acquirer in a business combination to which Ind AS 103 applies are classified as at FVTPL. For all other equity instruments, the Group may make an irrevocable election to present in other comprehensive income subsequent changes in the fair value. The Group makes such election on an instrument-by-instrument basis. The classification is made on initial recognition and is irrevocable.
If the Group decides to classify an equity instrument as at FVOCI, then all fair value changes on the instrument, excluding dividends, are recognised in the OCI. There is no recycling of the amounts from OCI to profit and loss, even on sale of investment. However, the Group may transfer the cumulative gain or loss within equity. For equity instruments which are classified as FVTPL, all subsequent fair value changes are recognised in the consolidated statement of profit and loss.
(ii) Financial Assets - derecognitionThe Group derecognises a financial asset when the contractual rights to the cash flows from the asset expire, or it transfers the rights to receive the contractual cash flows on the financial asset in a transaction in which substantially all the risks and rewards of ownership of the financial asset are transferred.
(iii) Impairment of financial assetsIn accordance with Ind AS 109, the Group applies expected credit loss (“ECL”) model for measurement and recognition of impairment loss on the following financial assets:
a) Financial assets that are debt instruments, and are measured at amortised cost e.g., loans, debt securities and deposits
b) Financial assets that are debt instruments and are measured as at FVOCI
c) Trade receivables or any contractual right to receive cash or another financial asset that result from transactions that are within the scope of Ind AS 115.
The Group follows ‘simplified approach’ for recognition of impairment loss allowance on trade receivables, contract assets and lease receivables. The application of simplified approach does not require the Group to track changes in credit risk. Rather, it recognises impairment loss allowance based on lifetime ECLs at each reporting date, right from its initial recognition.
At each reporting date, for recognition of impairment loss on other financial assets and risk exposure, the Group determines whether there has been a significant increase in the credit risk since initial recognition. If credit risk has not increased significantly, 12-month ECL is used to provide for impairment loss. However, if credit risk has increased significantly, lifetime ECL is used. If, in a subsequent period, credit quality of the instrument improves such that there is no longer a significant increase in credit risk since initial recognition, then the Group reverts to recognising impairment loss allowance based on 12-month ECL.
Lifetime ECL are the expected credit losses resulting from all possible default events over the expected life of a financial instrument. The 12-month ECL is a portion of the lifetime ECL which results from default events that are possible within 12 months after the reporting date.
ECL is the difference between all contractual cash flows that are due to the Group in accordance with the contract and all the cash flows that the entity expects to receive, discounted at the original EIR.
ECL impairment loss allowance (or reversal) during the year is recognised as income/ expense in consolidated statement of profit and loss. The balance sheet presentation for various financial instruments is described below:
a) Financial assets measured at amortised cost: ECL is presented as an allowance, i.e., as an integral part of
the measurement of those assets. The Group does not reduce impairment allowance from the gross carrying amount.
b) Debt instruments measured at FVOCI: Since financial assets are already reflected at fair value, impairment allowance is not further reduced from its value. Rather, ECL amount is presented as ‘accumulated impairment amount’ in the OCI.
For assessing increase in credit risk and impairment loss, the Group combines financial instruments on the basis of shared credit risk characteristics with the objective of facilitating an analysis that is designed to enable significant increases in credit risk to be identified on a timely basis.
The Group does not have any purchased or originated credit-impaired (POCI) financial assets, i.e., financial assets which are credit impaired on purchase/ origination.
(iv) Financial liabilities – Recognition & Subsequent measurementFinancial liabilities are classified, at initial recognition, as financial liabilities at fair value through profit or loss, or as loans and borrowings, payables, or as derivatives designated as hedging instruments in an effective hedge, as appropriate.
All financial liabilities are recognised initially at fair value, and in the case of financial liabilities at amortised cost, net of directly attributable transaction costs.
The Group’s financial liabilities include trade and other payables, loans and borrowings including bank overdrafts, financial guarantee contracts and derivative financial instruments.
The measurement of financial liabilities depends on their classification, as described below:
� Financial liabilities at air value through pro t or loss
Financial liabilities at fair value through profit or loss include financial liabilities held for trading and financial liabilities designated upon initial recognition as at fair value through profit or loss. Financial liabilities are classified as held for trading if they are incurred for the purpose of repurchasing in the near term. This category also includes derivative financial instruments entered into by the Group that are not designated as hedging instruments in hedge relationships as defined by Ind AS 109. Separated embedded derivatives are also classified as held for trading unless they are designated as effective hedging instruments.
INTEGRATED REPORT MANAGEMENT REVIEW STATUTORY REPORTS FINANCIAL STATEMENTS
06-115 116-167 168-270 271-502

404 VEDANTA LIMITED INTEGRATED REPORT AND ANNUAL ACCOUNTS 2019-20 VEDANTA LIMITED INTEGRATED REPORT AND ANNUAL ACCOUNTS 2019-20 405
CONSOLIDATED NOTES FORMING PART OF THE FINANCIAL STATEMENTSas at and for the year ended March 31, 2020
CONSOLIDATED NOTES FORMING PART OF THE FINANCIAL STATEMENTSas at and for the year ended March 31, 2020
Gains or losses on liabilities held for trading are recognised in the consolidated statement of profit and loss.
Financial liabilities designated upon initial recognition at fair value through profit or loss are designated as such at the initial date of recognition, and only if the criteria in Ind AS 109 are satisfied. For liabilities designated as FVTPL, fair value gains/ losses attributable to changes in own credit risk are recognised in OCI. These gains/ losses are not subsequently transferred to consolidated income statement. However, the Group may transfer the cumulative gain or loss within equity. All other changes in fair value of such liability are recognised in the consolidated statement of profit and loss. The Group has not designated any financial liability as at fair value through profit or loss.
� Financial liabilities at amortised cost oans and orro ings and Trade and Other payables
After initial recognition, interest-bearing loans and borrowings and trade and other payables are subsequently measured at amortised cost using the EIR method. Gains and losses are recognised in the consolidated statement of profit and loss when the liabilities are derecognised as well as through the EIR amortisation process.
Amortised cost is calculated by taking into account any discount or premium on acquisition and fees or costs that are an integral part of the EIR. The EIR amortisation is included as finance costs in the consolidated statement of profit and loss.
(v) Financial liabilities - DerecognitionA financial liability is derecognised when the obligation under the liability is discharged or cancelled or expires. When an existing financial liability is replaced by another from the same lender on substantially different terms, or the terms of an existing liability are substantially modified, such an exchange or modification is treated as the derecognition of the original liability and the recognition of a new liability. The difference in the respective carrying amounts is recognised in the consolidated statement of profit and loss.
(vi) Embedded derivativesAn embedded derivative is a component of a hybrid (combined) instrument that also includes a non-derivative host contract - with the effect that some of the cash flows of the combined instrument vary in a way similar to a stand-alone derivative. An embedded derivative causes some or all of the cash flows that otherwise would be required by the contract to be modified according to a specified interest rate, financial
instrument price, commodity price, foreign exchange rate, index of prices or rates, credit rating or credit index, or other variable, provided in the case of a non-financial variable that the variable is not specific to a party to the contract. Reassessment only occurs if there is either a change in the terms of the contract that significantly modifies the cash flows that would otherwise be required or a reclassification of a financial asset out of the fair value through profit or loss.
If the hybrid contract contains a host that is a financial asset within the scope of Ind AS 109, the Group does not separate embedded derivatives. Rather, it applies the classification requirements contained in Ind AS 109 to the entire hybrid contract. Derivatives embedded in all other host contracts are accounted for as separate derivatives and recorded at fair value if their economic characteristics and risks are not closely related to those of the host contracts and the host contracts are not held for trading or designated at fair value though profit or loss. These embedded derivatives are measured at fair value with changes in fair value recognised in consolidated statement of profit and loss, unless designated as effective hedging instruments.
(vii) Equity instrumentsAn equity instrument is any contract that evidences a residual interest in the assets of an entity after deducting all of its liabilities. Equity instruments issued by the Group are recognised at the proceeds received, net of direct issue costs.
(viii) Offsetting of financial instrumentsFinancial assets and financial liabilities are offset and the net amount is reported in the consolidated balance sheet if there is a currently enforceable legal right to offset the recognised amounts and there is an intention to settle on a net basis or to realise the asset and settle the liability simultaneously.
(J) Derivative financial instruments and hedge accountingnitial recognition and subse uent measurement
In order to hedge its exposure to foreign exchange, interest rate, and commodity price risks, the Group enters into forward, option, swap contracts and other derivative financial instruments. The Group does not hold derivative financial instruments for speculative purposes.
Such derivative financial instruments are initially recognised at fair value on the date on which a derivative contract is entered into and are subsequently re-measured at fair value. Derivatives are carried as financial assets when the fair value is positive and as financial liabilities when the fair value is negative.
Any gains or losses arising from changes in the fair value of derivatives are taken directly to consolidated statement of profit and loss, except for the effective portion of cash flow hedges, which is recognised in OCI and later reclassified to consolidated statement of profit and loss when the hedge item affects profit or loss or treated as basis adjustment if a hedged forecast transaction subsequently results in the recognition of a non-financial asset or non-financial liability.
For the purpose of hedge accounting, hedges are classified as:
� Fair value hedges when hedging the exposure to changes in the fair value of a recognised asset or liability or an unrecognised firm commitment
� Cash flow hedges when hedging the exposure to variability in cash flows that is either attributable to a particular risk associated with a recognised asset or liability or a highly probable forecast transaction or the foreign currency risk in an unrecognised firm commitment
� Hedges of a net investment in a foreign operation
At the inception of a hedge relationship, the Group formally designates and documents the hedge relationship to which the Group wishes to apply hedge accounting. The documentation includes the Group’s risk management objective and strategy for undertaking hedge, the hedging/ economic relationship, the hedged item or transaction, the nature of the risk being hedged, hedge ratio and how the Group will assess the effectiveness of changes in the hedging instrument’s fair value in offsetting the exposure to changes in the hedged item’s fair value or cash flows attributable to the hedged risk. Such hedges are expected to be highly effective in achieving offsetting changes in fair value or cash flows and are assessed on an ongoing basis to determine that they actually have been highly effective throughout the financial reporting periods for which they were designated.
Hedges that meet the strict criteria for hedge accounting are accounted for, as described below:
(i) Fair value hedgesChanges in the fair value of derivatives that are designated and qualify as fair value hedges are recognised in consolidated statement of profit and loss immediately, together with any changes in the fair value of the hedged asset or liability that are attributable to the hedged risk.
When an unrecognised firm commitment is designated as a hedged item, the subsequent cumulative change in the fair value of the firm commitment attributable to
the hedged risk is recognised as an asset or liability with a corresponding gain or loss recognised in consolidated statement of profit and loss. Hedge accounting is discontinued when the group revokes the hedge relationship, the hedging instrument or hedged item expires or is sold, terminated, or exercised or no longer meets the criteria for hedge accounting.
(ii) Cash ow hedgesThe effective portion of the gain or loss on the hedging instrument is recognised in OCI in the cash flow hedge reserve, while any ineffective portion is recognised immediately in the consolidated statement of profit and loss.
Amounts recognised in OCI are transferred to consolidated statement of profit and loss when the hedged transaction affects profit or loss, such as when the hedged financial income or financial expense is recognised or when a forecast sale occurs. When the hedged item is the cost of a non-financial asset or non-financial liability, the amounts recognised in OCI are transferred to the initial carrying amount of the non-financial asset or liability.
If the hedging instrument expires or is sold, terminated or exercised without replacement or rollover (as part of the hedging strategy), or if its designation as a hedge is revoked, or when the hedge no longer meets the criteria for hedge accounting, any cumulative gain or loss previously recognised in OCI remains separately in equity until the forecast transaction occurs or the foreign currency firm commitment is met.
(iii) Hedges of a net investmentHedges of a net investment in a foreign operation, including a hedge of a monetary item that is accounted for as part of the net investment, are accounted for in a way similar to cash flow hedges. Gains or losses on the hedging instrument relating to the effective portion of the hedge are recognised in OCI while any gains or losses relating to the ineffective portion are recognised in the consolidated statement of profit and loss. On disposal of the foreign operation, the cumulative value of any such gains or losses recorded in equity is reclassified to the consolidated statement of profit and loss (as a reclassification adjustment).
(K) LeasesThe Group assesses at contract inception, all arrangements to determine whether they are, or contain, a lease. That is, if the contract conveys the right to control the use of an identified asset for a period of time in exchange for consideration.
INTEGRATED REPORT MANAGEMENT REVIEW STATUTORY REPORTS FINANCIAL STATEMENTS
06-115 116-167 168-270 271-502
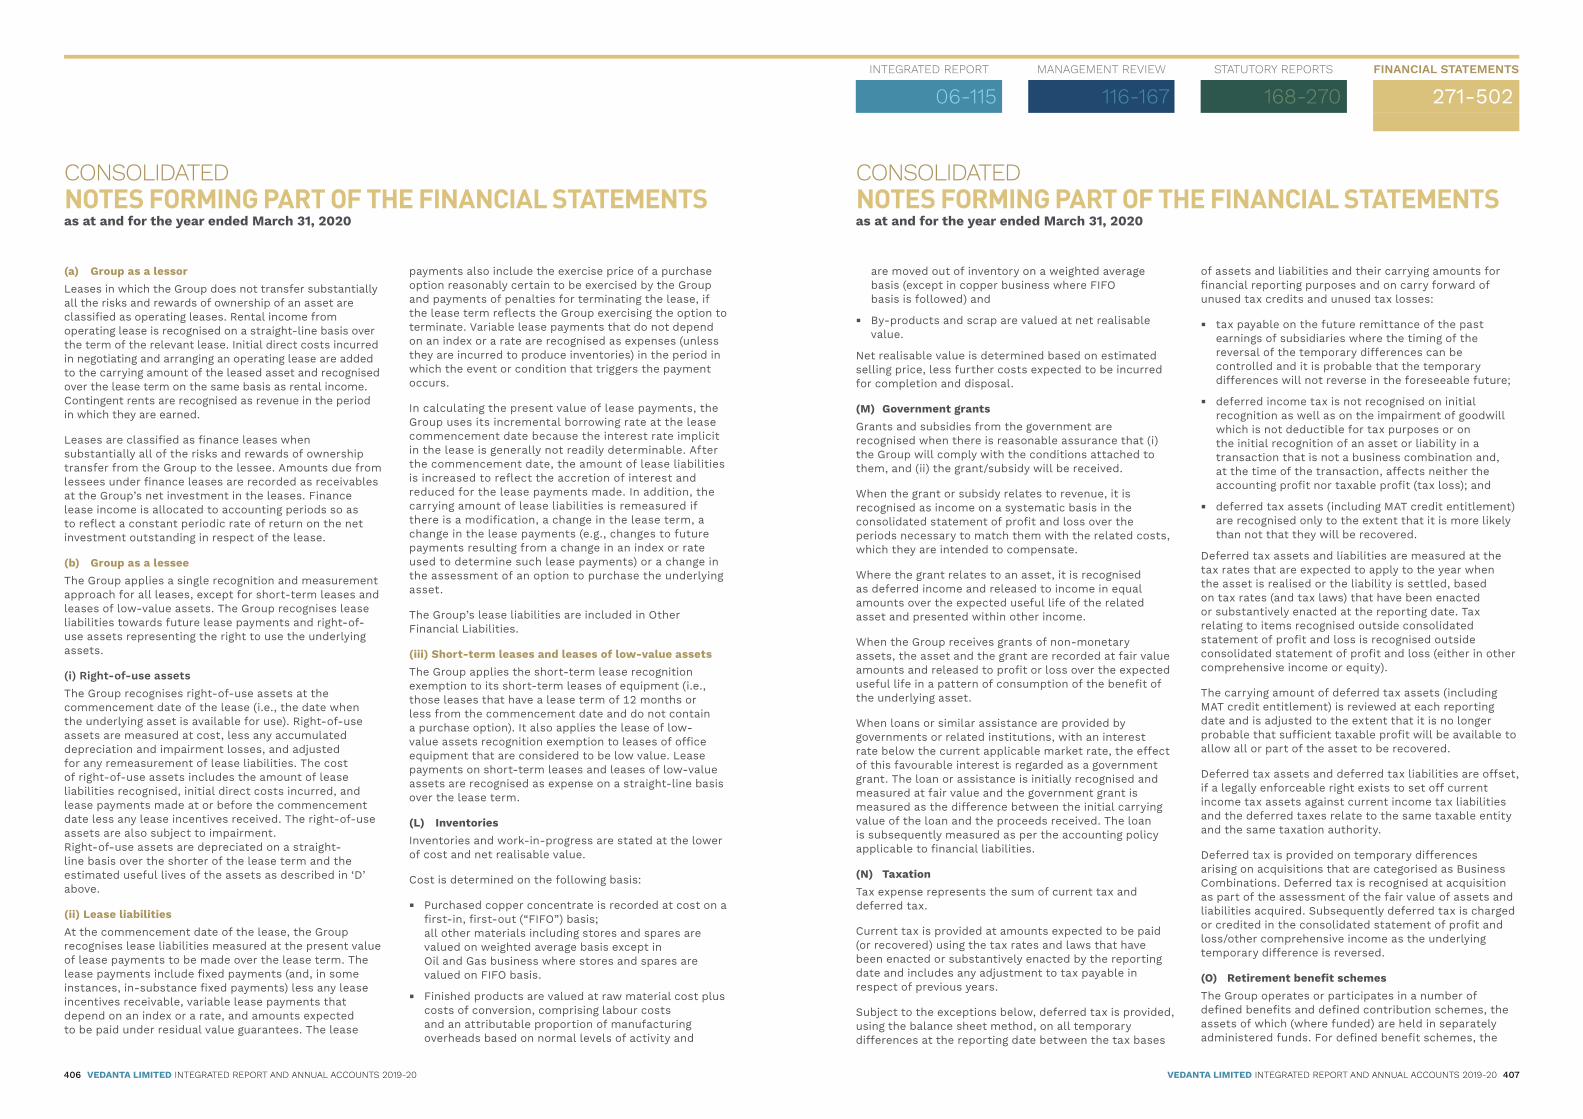
406 VEDANTA LIMITED INTEGRATED REPORT AND ANNUAL ACCOUNTS 2019-20 VEDANTA LIMITED INTEGRATED REPORT AND ANNUAL ACCOUNTS 2019-20 407
CONSOLIDATED NOTES FORMING PART OF THE FINANCIAL STATEMENTSas at and for the year ended March 31, 2020
CONSOLIDATED NOTES FORMING PART OF THE FINANCIAL STATEMENTSas at and for the year ended March 31, 2020
(a) Group as a lessorLeases in which the Group does not transfer substantially all the risks and rewards of ownership of an asset are classified as operating leases. Rental income from operating lease is recognised on a straight-line basis over the term of the relevant lease. Initial direct costs incurred in negotiating and arranging an operating lease are added to the carrying amount of the leased asset and recognised over the lease term on the same basis as rental income. Contingent rents are recognised as revenue in the period in which they are earned.
Leases are classified as finance leases when substantially all of the risks and rewards of ownership transfer from the Group to the lessee. Amounts due from lessees under finance leases are recorded as receivables at the Group’s net investment in the leases. Finance lease income is allocated to accounting periods so as to reflect a constant periodic rate of return on the net investment outstanding in respect of the lease.
(b) Group as a lesseeThe Group applies a single recognition and measurement approach for all leases, except for short-term leases and leases of low-value assets. The Group recognises lease liabilities towards future lease payments and right-of-use assets representing the right to use the underlying assets.
i Right o use assetsThe Group recognises right-of-use assets at the commencement date of the lease (i.e., the date when the underlying asset is available for use). Right-of-use assets are measured at cost, less any accumulated depreciation and impairment losses, and adjusted for any remeasurement of lease liabilities. The cost of right-of-use assets includes the amount of lease liabilities recognised, initial direct costs incurred, and lease payments made at or before the commencement date less any lease incentives received. The right-of-use assets are also subject to impairment. Right-of-use assets are depreciated on a straight-line basis over the shorter of the lease term and the estimated useful lives of the assets as described in ‘D’ above.
(ii) Lease liabilitiesAt the commencement date of the lease, the Group recognises lease liabilities measured at the present value of lease payments to be made over the lease term. The lease payments include fixed payments (and, in some instances, in-substance fixed payments) less any lease incentives receivable, variable lease payments that depend on an index or a rate, and amounts expected to be paid under residual value guarantees. The lease
payments also include the exercise price of a purchase option reasonably certain to be exercised by the Group and payments of penalties for terminating the lease, if the lease term reflects the Group exercising the option to terminate. Variable lease payments that do not depend on an index or a rate are recognised as expenses (unless they are incurred to produce inventories) in the period in which the event or condition that triggers the payment occurs.
In calculating the present value of lease payments, the Group uses its incremental borrowing rate at the lease commencement date because the interest rate implicit in the lease is generally not readily determinable. After the commencement date, the amount of lease liabilities is increased to reflect the accretion of interest and reduced for the lease payments made. In addition, the carrying amount of lease liabilities is remeasured if there is a modification, a change in the lease term, a change in the lease payments (e.g., changes to future payments resulting from a change in an index or rate used to determine such lease payments) or a change in the assessment of an option to purchase the underlying asset.
The Group’s lease liabilities are included in Other Financial Liabilities.
(iii) Short-term leases and leases of low-value assetsThe Group applies the short-term lease recognition exemption to its short-term leases of equipment (i.e., those leases that have a lease term of 12 months or less from the commencement date and do not contain a purchase option). It also applies the lease of low-value assets recognition exemption to leases of office equipment that are considered to be low value. Lease payments on short-term leases and leases of low-value assets are recognised as expense on a straight-line basis over the lease term.
(L) InventoriesInventories and work-in-progress are stated at the lower of cost and net realisable value.
Cost is determined on the following basis:
� Purchased copper concentrate is recorded at cost on a first-in, first-out (“FIFO”) basis; all other materials including stores and spares are valued on weighted average basis except in Oil and Gas business where stores and spares are valued on FIFO basis.
� Finished products are valued at raw material cost plus costs of conversion, comprising labour costs and an attributable proportion of manufacturing overheads based on normal levels of activity and
are moved out of inventory on a weighted average basis (except in copper business where FIFO basis is followed) and
� By-products and scrap are valued at net realisable value.
Net realisable value is determined based on estimated selling price, less further costs expected to be incurred for completion and disposal.
(M) Government grantsGrants and subsidies from the government are recognised when there is reasonable assurance that (i) the Group will comply with the conditions attached to them, and (ii) the grant/subsidy will be received.
When the grant or subsidy relates to revenue, it is recognised as income on a systematic basis in the consolidated statement of profit and loss over the periods necessary to match them with the related costs, which they are intended to compensate.
Where the grant relates to an asset, it is recognised as deferred income and released to income in equal amounts over the expected useful life of the related asset and presented within other income.
When the Group receives grants of non-monetary assets, the asset and the grant are recorded at fair value amounts and released to profit or loss over the expected useful life in a pattern of consumption of the benefit of the underlying asset.
When loans or similar assistance are provided by governments or related institutions, with an interest rate below the current applicable market rate, the effect of this favourable interest is regarded as a government grant. The loan or assistance is initially recognised and measured at fair value and the government grant is measured as the difference between the initial carrying value of the loan and the proceeds received. The loan is subsequently measured as per the accounting policy applicable to financial liabilities.
(N) TaxationTax expense represents the sum of current tax and deferred tax.
Current tax is provided at amounts expected to be paid (or recovered) using the tax rates and laws that have been enacted or substantively enacted by the reporting date and includes any adjustment to tax payable in respect of previous years.
Subject to the exceptions below, deferred tax is provided, using the balance sheet method, on all temporary differences at the reporting date between the tax bases
of assets and liabilities and their carrying amounts for financial reporting purposes and on carry forward of unused tax credits and unused tax losses:
� tax payable on the future remittance of the past earnings of subsidiaries where the timing of the reversal of the temporary differences can be controlled and it is probable that the temporary differences will not reverse in the foreseeable future;
� deferred income tax is not recognised on initial recognition as well as on the impairment of goodwill which is not deductible for tax purposes or on the initial recognition of an asset or liability in a transaction that is not a business combination and, at the time of the transaction, affects neither the accounting profit nor taxable profit (tax loss); and
� deferred tax assets (including MAT credit entitlement) are recognised only to the extent that it is more likely than not that they will be recovered.
Deferred tax assets and liabilities are measured at the tax rates that are expected to apply to the year when the asset is realised or the liability is settled, based on tax rates (and tax laws) that have been enacted or substantively enacted at the reporting date. Tax relating to items recognised outside consolidated statement of profit and loss is recognised outside consolidated statement of profit and loss (either in other comprehensive income or equity).
The carrying amount of deferred tax assets (including MAT credit entitlement) is reviewed at each reporting date and is adjusted to the extent that it is no longer probable that sufficient taxable profit will be available to allow all or part of the asset to be recovered.
Deferred tax assets and deferred tax liabilities are offset, if a legally enforceable right exists to set off current income tax assets against current income tax liabilities and the deferred taxes relate to the same taxable entity and the same taxation authority.
Deferred tax is provided on temporary differences arising on acquisitions that are categorised as Business Combinations. Deferred tax is recognised at acquisition as part of the assessment of the fair value of assets and liabilities acquired. Subsequently deferred tax is charged or credited in the consolidated statement of profit and loss/other comprehensive income as the underlying temporary difference is reversed.
(O) Retirement benefit schemesThe Group operates or participates in a number of defined benefits and defined contribution schemes, the assets of which (where funded) are held in separately administered funds. For defined benefit schemes, the
INTEGRATED REPORT MANAGEMENT REVIEW STATUTORY REPORTS FINANCIAL STATEMENTS
06-115 116-167 168-270 271-502

408 VEDANTA LIMITED INTEGRATED REPORT AND ANNUAL ACCOUNTS 2019-20 VEDANTA LIMITED INTEGRATED REPORT AND ANNUAL ACCOUNTS 2019-20 409
CONSOLIDATED NOTES FORMING PART OF THE FINANCIAL STATEMENTSas at and for the year ended March 31, 2020
CONSOLIDATED NOTES FORMING PART OF THE FINANCIAL STATEMENTSas at and for the year ended March 31, 2020
cost of providing benefits under the plans is determined by actuarial valuation each year separately for each plan using the projected unit credit method by third party qualified actuaries.
Remeasurement including, effects of asset ceiling and return on plan assets (excluding amounts included in interest on the net defined benefit liability) and actuarial gains and losses arising in the year are recognised in full in other comprehensive income and are not recycled to the consolidated statement of profit and loss.
Past service costs are recognised in the consolidated statement of profit and loss on the earlier of:- the date of the plan amendment or curtailment, and- the date that the Group recognises related restructuring costs
Net interest is calculated by applying a discount rate to the net defined benefit liability or asset at the beginning of the period. Defined benefit costs are split into current service cost, past service cost, net interest expense or income and remeasurement and gains and losses on curtailments and settlements. Current service cost and past service cost are recognised within employee benefit expense. Net interest expense or income is recognised within finance costs. For defined contribution schemes, the amount charged to the consolidated statement of profit and loss in respect of pension costs and other post retirement benefits is the contributions payable in the year, recognised as and when the employee renders related services.
(P) Share-based paymentsCertain employees (including executive directors) of the Group receive part of their remuneration in the form of share-based payment transactions, whereby employees render services in exchange for shares or rights over shares (‘equity-settled transactions’).
The cost of equity-settled transactions with employees is measured at fair value of share awards at the date at which they are granted. The fair value of share awards is determined with the assistance of an external valuer and the fair value at the grant date is expensed on a proportionate basis over the vesting period based on the Group’s estimate of shares that will eventually vest. The estimate of the number of awards likely to vest is reviewed at each balance sheet date up to the vesting date at which point the estimate is adjusted to reflect the current expectations.
The resultant increase in equity is recorded in share-based payment reserve.
In case of cash-settled transactions, a liability is recognised for the fair value of cash-settled transactions. The fair value is measured initially and at each reporting date up to and including the settlement date, with changes in fair value recognised in employee benefits expense. The fair value is expensed over the period until the vesting date with recognition of a corresponding liability. The fair value is determined with the assistance of an external valuer.
Additionally, VRL offered certain share-based incentives under the Long-Term Incentive Plan (“LTIP”) to employees and directors of the Company and its subsidiaries. VRL recovers the proportionate cost (calculated based on the grant date fair value of the options granted) from the respective group companies, which is charged to the consolidated statement of profit and loss.
(Q) Provisions, contingent liabilities and contingent assetsThe assessments undertaken in recognising provisions and contingencies have been made in accordance with the applicable Ind AS.
Provisions represent liabilities for which the amount or timing is uncertain. Provisions are recognised when the Group has a present obligation (legal or constructive), as a result of past events, and it is probable that an outflow of resources, that can be reliably estimated, will be required to settle such an obligation.
If the effect of the time value of money is material, provisions are determined by discounting the expected future cash flows to net present value using an appropriate pre-tax discount rate that reflects current market assessments of the time value of money and, where appropriate, the risks specific to the liability. Unwinding of the discount is recognised in consolidated statement of profit and loss as a finance cost. Provisions are reviewed at each reporting date and are adjusted to reflect the current best estimate.
A contingent liability is a possible obligation that arises from past events whose existence will be confirmed by the occurrence or non-occurrence of one or more uncertain future events beyond the control of the Group or a present obligation that is not recognised because it is not probable that an outflow of resources will be required to settle the obligation. A contingent liability also arises in extremely rare cases where there is a liability that cannot be recognised because it cannot be measured reliably. The Group does not recognise a contingent liability but discloses its existence in the consolidated balance sheet.
Contingent assets are not recognised but disclosed in the financial statements when an inflow of economic benefit is probable.
The Group has significant capital commitments in relation to various capital projects which are not recognised in the balance sheet.
(R) Restoration, rehabilitation and environmental costsAn obligation to incur restoration, rehabilitation and environmental costs arises when environmental disturbance is caused by the development or ongoing production of a mine or oil fields. Such costs, discounted to net present value, are provided for and a corresponding amount is capitalised at the start of each project, as soon as the obligation to incur such costs arises. These costs are charged to the consolidated statement of profit and loss over the life of the operation through the depreciation of the asset and the unwinding of the discount on the provision. The cost estimates are reviewed periodically and are adjusted to reflect known developments which may have an impact on the cost estimates or life of operations. The cost of the related asset is adjusted for changes in the provision due to factors such as updated cost estimates, changes to lives of operations, new disturbance and revisions to discount rates. The adjusted cost of the asset is depreciated prospectively over the lives of the assets to which they relate. The unwinding of the discount is shown as finance cost in the consolidated statement of profit and loss.
Costs for the restoration of subsequent site damage, which is caused on an ongoing basis during production, are provided for at their net present value and charged to the consolidated statement of profit and loss as extraction progresses. Where the costs of site restoration are not anticipated to be material, they are expensed as incurred.
(S) Accounting for foreign currency transactions and translationsThe functional currency for each entity in the Group is determined as the currency of the primary economic environment in which it operates. For all principal operating subsidiaries, the functional currency is normally the local currency of the country in which it operates with the exception of oil and gas business operations which have a US dollar functional currency as that is the currency of the primary economic environment in which it operates. The financial statements are presented in Indian rupee (`).
In the financial statements of individual group companies, transactions in currencies other than the respective functional currencies are translated into their functional currencies at the exchange rates ruling
at the date of the transaction. Monetary assets and liabilities denominated in other currencies are translated into functional currencies at exchange rates prevailing on the reporting date. Non-monetary assets and liabilities denominated in other currencies and measured at historical cost or fair value are translated at the exchange rates prevailing on the dates on which such values were determined.
All exchange differences are included in the consolidated statement of profit and loss except those where the monetary item is designated as an effective hedging instrument of the currency risk of designated forecasted sales or purchases, which are recognised in the other comprehensive income.
Exchange differences which are regarded as an adjustment to interest costs on foreign currency borrowings, are capitalised as part of borrowing costs in qualifying assets.
For the purposes of the consolidation of financial statements, items in the consolidated statement of profit and loss of those businesses for which the Indian Rupees is not the functional currency are translated into Indian Rupees at the average rates of exchange during the year/ exchange rates as on the date of transaction. The related consolidated balance sheet is translated into Indian rupees at the rates as at the reporting date. Exchange differences arising on translation are recognised in consolidated statements of other comprehensive income. On disposal of such entities the deferred cumulative exchange differences recognised in equity relating to that particular foreign operation are recognised in the consolidated statement of profit and loss.
The Group had applied paragraph 46A of AS 11 under Previous GAAP. Ind AS 101 gives an option, which has been exercised by the Group, whereby a first time adopter can continue its Indian GAAP policy for accounting for exchange differences arising from translation of long-term foreign currency monetary items recognised in the Indian GAAP financial statements for the period ending immediately before the beginning of the first Ind AS financial reporting period. Hence, foreign exchange gain/loss on long-term foreign currency monetary items recognised upto March 31, 2016 has been deferred/capitalised. Such exchange differences arising on translation/settlement of long-term foreign currency monetary items and pertaining to the acquisition of a depreciable asset are amortised over the remaining useful lives of the assets.
Exchange differences arising on translation/ settlement of long-term foreign currency monetary items, acquired post April 01, 2016, pertaining to the acquisition of
INTEGRATED REPORT MANAGEMENT REVIEW STATUTORY REPORTS FINANCIAL STATEMENTS
06-115 116-167 168-270 271-502

410 VEDANTA LIMITED INTEGRATED REPORT AND ANNUAL ACCOUNTS 2019-20 VEDANTA LIMITED INTEGRATED REPORT AND ANNUAL ACCOUNTS 2019-20 411
CONSOLIDATED NOTES FORMING PART OF THE FINANCIAL STATEMENTSas at and for the year ended March 31, 2020
CONSOLIDATED NOTES FORMING PART OF THE FINANCIAL STATEMENTSas at and for the year ended March 31, 2020
a depreciable asset are charged to the consolidated statement of profit and loss.
(T) Earnings per shareThe Group presents basic and diluted earnings per share (“EPS”) data for its equity shares. Basic EPS is calculated by dividing the profit or loss attributable to equity shareholders of the Company by the weighted average number of equity shares outstanding during the period. Diluted EPS is determined by adjusting the profit or loss attributable to equity shareholders and the weighted average number of equity shares outstanding for the effects of all dilutive potential equity shares.
(U) Buyers’ Credit/ Suppliers’ Credit and vendor financingThe Group enters into arrangements whereby banks and financial institutions make direct payments to suppliers for raw materials and project materials. The banks and financial institutions are subsequently repaid by the Group at a later date providing working capital timing benefits. These are normally settled up to twelve months (for raw materials) and up to 36 months (for project and materials). Where these arrangements are with a maturity of up to twelve months, the economic substance of the transaction is determined to be operating in nature and these are recognised as operational buyers’ credit/ suppliers’ credit (under Trade payables). Where these arrangements are with a maturity beyond twelve months and up to thirty six months, the economic substance of the transaction is determined to be financing in nature, and these are presented within borrowings in the consolidated balance sheet. Interest expense on these are recognised in the finance cost.
(V) Current and non-current classificationThe Group presents assets and liabilities in the consolidated balance sheet based on current / non-current classification.
An asset is classified as current when it satisfies any of the following criteria:
- �it is expected to be realised in, or is intended for sale or consumption in, the Group’s normal operating cycle.
- it is held primarily for the purpose of being traded;
- �it is expected to be realised within 12 months after the reporting date; or
- �it is cash or cash equivalent unless it is restricted from being exchanged or used to settle a liability for at least 12 months after the reporting date.
All other assets are classified as non-current.
A liability is classified as current when it satisfies any of the following criteria:
- �it is expected to be settled in the Group’s normal operating cycle;
- it is held primarily for the purpose of being traded;
- �it is due to be settled within 12 months after the reporting date; or
- �the Group does not have an unconditional right to defer settlement of the liability for at least 12 months after the reporting date. Terms of a liability that could, at the option of the counterparty, result in its settlement by the issue of equity instruments do not affect its classification.
All other liabilities are classified as non-current.
Deferred tax assets and liabilities are classified as non current only.
(W) Borrowing costsBorrowing cost includes interest expense as per effective interest rate (EIR) and exchange differences arising from foreign currency borrowings to the extent they are regarded as an adjustment to the interest cost.
Borrowing costs directly relating to the acquisition, construction or production of a qualifying capital project under construction are capitalised and added to the project cost during construction until such time that the assets are substantially ready for their intended use i.e. when they are capable of commercial production. Borrowing costs relating to the construction phase of a service concession arrangement is capitalised as part of the cost of the intangible asset. Where funds are borrowed specifically to finance a qualifying capital project, the amount capitalised represents the actual borrowing costs incurred. Where surplus funds are available out of money borrowed specifically to finance a qualifying capital project, the income generated from such short-term investments is deducted from the total capitalised borrowing cost. If any specific borrowing remains outstanding after the related asset is ready for its intended use or sale, that borrowing then becomes part of general borrowing. Where the funds used to finance a project form part of general borrowings, the amount capitalised is calculated using a weighted average of rates applicable to relevant general borrowings of the Group during the year.
All other borrowing costs are recognised in the consolidated statement of profit and loss in the year in which they are incurred.
Capitalisation of interest on borrowings related to construction or development projects is ceased when substantially all the activities that are necessary to make the assets ready for their intended use are complete or when delays occur outside of the normal course of business.
EIR is the rate that exactly discounts the estimated future cash payments or receipts over the expected life of the financial liability or a shorter period, where appropriate, to the amortised cost of a financial liability. When calculating the effective interest rate, the Group estimates the expected cash flows by considering all the contractual terms of the financial instrument (for example, prepayment, extension, call and similar options).
(X) Treasury sharesThe Group has created an Employee Benefit Trust (EBT) for providing share-based payment to its employees. The Group uses EBT as a vehicle for distributing shares to employees under the employee remuneration schemes. The EBT buys shares of the company from the market, for giving shares to employees. The shares held by EBT are treated as treasury shares.
Own equity instruments that are reacquired (treasury shares) are recognised at cost and deducted from equity. No gain or loss is recognised in profit or loss on the purchase, sale, issue or cancellation of the Group’s own equity instruments. Any difference between the carrying amount and the consideration, if reissued, is recognised in equity. Share options whenever exercised, would be satisfied with treasury shares.
(Y) Cash and cash equivalentsCash and cash equivalents comprise cash at bank and on hand and short-term money market deposits which have maturity of three months or less from the date of acquisition, that are readily convertible to known amounts of cash and which are subject to an insignificant risk of changes in value.
For the purpose of the consolidated statement of cash flows, cash and cash equivalents consist of cash and short-term deposits, as defined above and additionally includes unpaid dividend account.
(Z) Exceptional itemsExceptional items are those items that management considers, by virtue of their size or incidence (including but not limited to impairment charges and acquisition and restructuring related costs), should be disclosed separately to ensure that the financial information allows an understanding of the underlying performance of the business in the year, so as to facilitate comparison with
prior periods. Also tax charges related to exceptional items and certain one-time tax effects are considered exceptional. Such items are material by nature or amount to the year’s result and require separate disclosure in accordance with Ind AS.
3(b) APPLICATION OF NEW AND REVISED STANDARDS(A)� The Group has adopted, with effect from April 01, 2019, the following new and revised standards and interpretations. Their adoption has not had any significant impact on the amounts reported in the consolidated financial statements.
Ind AS 116 – LeasesInd AS 116, Leases, replaces the existing standard on accounting for leases, Ind AS 17, with effect from April 01, 2019. This standard introduces a single lessee accounting model and requires a lessee to recognise a ‘right of use asset’ (ROU) and a corresponding ‘lease liability’ for all leases. Lease costs are to be recognised in the statement of profit and loss over the lease term in the form of depreciation on the ROU asset and finance charges representing the unwinding of the discount on the lease liability. In contrast, the accounting requirements for lessors remain largely unchanged.
The Group acts as a lessee in lease arrangements mainly involving plant and machinery, office premises and other properties. The Group has elected to apply the modified retrospective approach on transition, and accordingly the comparative numbers have not been restated. For contracts in place as at April 01, 2019, the Group has continued to apply its existing definition of leases as under Ind AS 17 (“grandfathering”), instead of reassessing whether existing contracts are or contain a lease at that date. Further, the Group has elected to avail the exemption in Ind AS 116 from applying the requirements of Ind AS 116 to short-term leases of all assets that have a lease term of 12 months or less and leases for which the underlying asset is of low value. The lease payments associated with these leases are recognised as an expense on a straight-line basis over the lease term.
Transition to Ind AS 116 did not have a material effect on the Group’s financial statements.
Previous period accounting policy: easesDetermining hether an arrangement contains leaseAt inception of an arrangement, the Group determines whether the arrangement is or contains a lease. The arrangement is, or contains, a lease if fulfilment of the arrangement is dependent on the use of a specific asset or assets and the arrangement conveys a right to use the asset or assets, even if that right is not explicitly specified in an arrangement.
INTEGRATED REPORT MANAGEMENT REVIEW STATUTORY REPORTS FINANCIAL STATEMENTS
06-115 116-167 168-270 271-502

412 VEDANTA LIMITED INTEGRATED REPORT AND ANNUAL ACCOUNTS 2019-20 VEDANTA LIMITED INTEGRATED REPORT AND ANNUAL ACCOUNTS 2019-20 413
CONSOLIDATED NOTES FORMING PART OF THE FINANCIAL STATEMENTSas at and for the year ended March 31, 2020
CONSOLIDATED NOTES FORMING PART OF THE FINANCIAL STATEMENTSas at and for the year ended March 31, 2020
At inception or on reassessment of an arrangement that contains lease, the Group separates payments and other consideration required by the arrangement into those for the lease and those for other elements on the basis of their relative fair values. If the Group concludes for a finance lease that it is impracticable to separate the payments reliably, then an asset and a liability are recognised at an amount equal to the fair value of the underlying asset; subsequently the liability is reduced as payments are made and an imputed finance cost on the liability is recognised using the Group’s incremental borrowing rate.
roup as a lesseeA lease is classified at the inception date as a finance lease or an operating lease. A lease that transfers substantially all the risks and rewards incidental to ownership to the Group is classified as a finance lease.
Finance leases are capitalised at the commencement of the lease at the inception date fair value of the leased property or, if lower, at the present value of the minimum lease payments. Lease payments are apportioned between finance charges and reduction of the lease liability so as to achieve a constant rate of interest on the remaining balance of the liability. Finance charges are recognised in finance costs in the consolidated statement of profit and loss, unless they are directly attributable to qualifying assets, in which case they are capitalised in accordance with the Group’s policy on the general borrowing costs. Contingent rentals are recognised as expenses in the periods in which they are incurred.
A leased asset is depreciated over the useful life of the asset. However, if there is no reasonable certainty that the Group will obtain ownership by the end of the lease term, the asset is depreciated over the shorter of the estimated useful life of the asset and the lease term.
Operating lease payments are recognised as an expense in the consolidated statement of profit and loss on a straight-line basis over the lease term unless the payments are structured to increase in line with general inflation to compensate for the lessor’s expected inflationary cost increase.
roup as a lessorLeases in which the Group does not transfer substantially all the risks and rewards of ownership of an asset are classified as operating leases. Rental income from operating lease is recognised on a straight-line basis over the term of the relevant lease unless the payments are structured to increase in line with general inflation to compensate for the lessor’s expected inflationary cost increase. Initial direct costs incurred in
negotiating and arranging an operating lease are added to the carrying amount of the leased asset and recognised over the lease term on the same basis as rental income. Contingent rents are recognised as revenue in the period in which they are earned.
Leases are classified as finance leases when substantially all of the risks and rewards of ownership transfer from the Group to the lessee. Amounts due from lessees under finance leases are recorded as receivables at the Group’s net investment in the leases. Finance lease income is allocated to accounting periods so as to reflect a constant periodic rate of return on the net investment outstanding in respect of the lease.
Appendix C of Ind AS 12 – Uncertainty over Income Tax TreatmentsAppendix C of Ind AS 12 clarifies how to apply the recognition and measurement requirements in Ind AS 12 Income Taxes when there is uncertainty over income tax treatments. The clarification did not have a material effect on the Group’s financial statements so far as the recognition and measurement of income taxes is concerned. A consequential impact of the clarification is on the disclosure of contingent liabilities. The Group previously used to consider only those cases/matters for contingent liabilities wherever demand has been raised by the authorities/ initial assessment has been completed. The contingent liabilities have now been extrapolated to other years where a similar issue exists but formal demand has not been raised by tax authorities. Considering the impact of appendix C of Ind AS 12, the amounts of Income Tax disputes disclosed in note 34 and 37 of these financial statements would have been higher by ` 3,877 crore as on April 01, 2019, as against the hitherto followed practice. As per the transitional provisions of Appendix C of Ind AS 12, the Group has not restated comparative information.
Other AmendmentsA number of other minor amendments to existing standards also became effective on April 01, 2019 and have been adopted by the Group. The adoption of these new accounting pronouncements did not have a material impact on the accounting policies, methods of computation or presentation applied by the Group.”
(B) tandards issued but not yet e ective The new and amended standards and interpretations that are issued, but not yet effective, up to the date of issuance of the Group’s financial statements are not expected to have a significant impact on the Group’s financial statements. The Group has not early adopted any amendment, standard or interpretation that has been issued but is not yet effective.
3(c) SIGNIFICANT ACCOUNTING ESTIMATES AND JUDGEMENTSThe preparation of consolidated financial statements in conformity with Ind AS requires management to make judgements, estimates and assumptions that affect the application of accounting policies and the reported amounts of assets, liabilities, income, expenses and disclosures of contingent assets and liabilities at the date of these consolidated financial statements and the reported amounts of revenues and expenses for the years presented. These judgements and estimates are based on management’s best knowledge of the relevant facts and circumstances, having regard to previous experience, but actual results may differ materially from the amounts included in the financial statements.
Estimates and underlying assumptions are reviewed on an ongoing basis. Revisions to accounting estimates are recognised in the period in which the estimate is revised and future periods affected.
The information about significant areas of estimation uncertainty and critical judgements in applying accounting policies that have the most significant effect on the amounts recognised in the financial statements are as given below:
(A) Significant estimatesi) Impact of COVID-19The outbreak of novel Coronavirus (COVID-19) pandemic globally and in India and the consequent lockdown restrictions imposed by national governments is causing significant disturbance and slowdown of economic activity across the globe. The commodity prices including oil have seen significant volatility with downward price pressures due to major demand centers affected by lockdown.
The Group is in the business of metals and mining, Oil & gas and generation of power which are considered as either essential goods and services or were generally allowed to continue to carry out the operations with adequate safety measures. The Group has taken proactive measures to comply with various regulations/guidelines issued by the Government and local bodies to ensure safety of its workforce and the society in general.
The Group has considered possible effects of Covid-19 on the recoverability of its investments, property, plant and equipment (PPE), inventories, loans and receivables, etc in accordance with Ind AS. The Group has considered forecast consensus, industry reports, economic indicators and general business conditions to make an assessment of the implications of the Pandemic. The Group has also performed sensitivity analysis on the assumptions used basis the internal and external information/ indicators of future economic condition.
Based on the assessment, the Group has recorded necessary adjustments, including impairment to the extent the carrying amount exceeds the recoverable amount and has disclosed the same as exceptional item in these financial statements. The actual effects of COVID-19 could be different from what is presently assessed and would be known only in due course of time.
ii) Oil and gas reservesSignificant technical and commercial judgements are required to determine the Group’s estimated oil and natural gas reserves. Reserves considered for computing depletion are proved reserves for acquisition costs and proved and developed reserves for successful exploratory wells, development wells, processing facilities, distribution assets, estimated future abandonment cost and all other related costs. Reserves for this purpose are considered on working interest basis which are reassessed atleast annually. Details of such reserves are given in note 42.
Changes in reserves as a result of change in management assumptions could impact the depreciation rates and the carrying value of assets (refer note 6).
iii) Carrying value of exploration and evaluation assetsExploration assets are assessed by comparing the carrying value to higher of fair value less cost of disposal or value in use if impairment indicators, as contained in Ind AS 106, exists. Change to the valuation of exploration assets is an area of judgement. Further details on the Group’s accounting policies on this are set out in accounting policy above. The amounts for exploration and evaluation assets represent active exploration projects. These amounts will be written off to the consolidated statement of profit and loss as exploration costs unless commercial reserves are established or the determination process is not completed and there are no indications of impairment. The outcome of ongoing exploration, and therefore whether the carrying value of exploration and evaluation assets will ultimately be recovered, is inherently uncertain.
Details of carrying values and impairment charge/ reversal and the assumptions used are disclosed in note 6 and 33 respectively.
iv) Carrying value of developing / producing oil and gas assets:Management performs impairment tests on the Company’s developing/producing oil and gas assets where indicators of impairment are identified in accordance with Ind AS 36.
The impairment assessments are based on a range of estimates and assumptions, including:
INTEGRATED REPORT MANAGEMENT REVIEW STATUTORY REPORTS FINANCIAL STATEMENTS
06-115 116-167 168-270 271-502

414 VEDANTA LIMITED INTEGRATED REPORT AND ANNUAL ACCOUNTS 2019-20 VEDANTA LIMITED INTEGRATED REPORT AND ANNUAL ACCOUNTS 2019-20 415
CONSOLIDATED NOTES FORMING PART OF THE FINANCIAL STATEMENTSas at and for the year ended March 31, 2020
CONSOLIDATED NOTES FORMING PART OF THE FINANCIAL STATEMENTSas at and for the year ended March 31, 2020
Estimates/ assumptions Basis
Future Production
proved and probable reserves, production facilities, resource estimates and expansion projects
Commodity Prices
management’s best estimate benchmarked with external sources of information, to ensure they are within the range of available analyst forecast� � � �
Discount to price
management’s best estimate based on historical prevailing discount and updated sales contracts�
Extension of PSC
granted till 2030 on the expected commercial terms (Refer note 3(c)(A)(viii)�� � �
Discount rates
cost of capital risk-adjusted for the risk specific to the asset/ CGU
Any subsequent changes to cash flows due to changes in the above mentioned factors could impact the carrying value of the assets.
Details of carrying values and impairment charge/ reversal and the assumptions used are disclosed in note 6 and 33 respectively.
v) Mining properties and leasesThe carrying value of mining property and leases is arrived at by depreciating the assets over the life of the mine using the unit of production method based on proved and probable reserves. The estimate of reserves is subject to assumptions relating to life of the mine and may change when new information becomes available. Changes in reserves as a result of factors such as production cost, recovery rates, grade of reserves or commodity prices could thus impact the carrying values of mining properties and leases and environmental and restoration provisions.
Management performs impairment tests when there is an indication of impairment. The impairment assessments are based on a range of estimates and assumptions, including:
Estimates/ assumptions Basis
Future Production
Proved and probable reserves, resource estimates (with an appropriate conversion factor) considering the expected permitted mining volumes and, in certain cases, expansion projects.
Commodity Prices
Management’s best estimate benchmarked with external sources of information, to ensure they are within the range of available analyst forecast
Exchange Rates
Management best estimate benchmarked with external sources of information
Discount Rates
Cost of capital risk-adjusted for the risk specific to the asset/CGU
Details of impairment charge and the assumptions used and carrying values are disclosed in note 33 and 6 respectively.
vi) Recoverability of deferred tax and other income tax assetsThe Group has carry forward tax losses, unabsorbed depreciation and MAT credit that are available for offset against future taxable profit. Deferred tax assets are recognised only to the extent that it is probable that taxable profit will be available against which the unused tax losses or tax credits can be utilised. This involves an assessment of when those assets are likely to reverse, and a judgement as to whether or not there will be sufficient taxable profits available to offset the assets. This requires assumptions regarding future profitability, which is inherently uncertain. To the extent assumptions regarding future profitability change, there can be an increase or decrease in the amounts recognised in respect of deferred tax assets and consequential impact in the consolidated statement of profit and loss.
The total deferred tax assets recognised in these financial statement (refer note 34) includes MAT credit entitlements of ` 9,122 Crore (Previous year ` 10,321 Crore), of which ` 3,600 Crore is expected to be utilised in the fourteenth and the fifteenth year, the maximum permissible time period to utilise the MAT credits.
Additionally, the Group has tax receivables on account of refund arising on account of past amalgamation and relating to various tax disputes. The recoverability of these receivables involve application of judgement as to the ultimate outcome of the tax assessment and litigations. This pertains to the application of the legislation, which in certain cases is based upon management’s interpretation of country specific tax law, in particular India, and the likelihood of settlement. Management uses in-house and external legal professionals to make informed decision.
(vii) Copper operations IndiaIn an appeal filed by the Group against the closure order of the Tuticorin Copper smelter by Tamil Nadu Pollution Control Board (“TNPCB”), the appellate authority National Green Tribunal (“NGT”) passed an interim order on May 31, 2013 allowing the copper smelter to recommence operations and appointed an Expert Committee to submit a report on the plant operations. Post the interim order, the plant recommenced operations on June 23, 2013. Based on Expert Committee’s report on the operations of the plant stating that the plant’s emission were within prescribed standards and based on this report, NGT ruled on August 08, 2013 that the Copper smelter could continue its operations and recommendations made by the Expert Committee be implemented in a time bound manner. The Group has
implemented all of the recommendations. TNPCB has filed an appeal against the order of the NGT before the Supreme Court of India.
In the meanwhile, the application for renewal of Consent to Operate (CTO) for existing copper smelter, required as per procedure established by law was rejected by TNPCB in April 2018. Vedanta Limited has filed an appeal before the TNPCB Appellate Authority challenging the Rejection Order. During the pendency of the appeal, there were protests by a section of local community raising environmental concerns and TNPCB vide its order dated May 23, 2018 ordered closure of existing copper smelter plant with immediate effect. Further, the Government of Tamil Nadu, issued orders dated May 28, 2018 with a direction to seal the existing copper smelter plant permanently. The Company believes these actions were not taken in accordance with the procedure prescribed under applicable laws. Subsequently, the Directorate of Industrial Safety and Health passed orders dated May 30, 2018, directing the immediate suspension and revocation of the Factory License and the Registration Certificate for the existing smelter plant.
The Company has appealed this before the National Green Tribunal (NGT). NGT vide its order on December 15, 2018 has set aside the impugned orders and directed the TNPCB to pass fresh orders for renewal of consent and authorisation to handle hazardous substances, subject to appropriate conditions for protection of environment in accordance with law. The State of Tamil Nadu and TNPCB approached Supreme Court in Civil Appeals on January 02, 2019 challenging the judgement of NGT dated December 15, 2018 and the previously passed judgement of NGT dated August 08, 2013. The Supreme Court vide its judgement dated February 18, 2019 set aside the judgements of NGT dated December 15, 2018 and August 08, 2013 on the basis of maintainability alone and directed the Company to file an appeal in High court.
The Company has filed a writ petition before Madras High Court challenging the various orders passed against the Company in 2018 and 2013. Continuous hearings were conducted from June 2019 to January 2020. Rejoinder and sur-rejoinder arguments on behalf of all the parties concluded on January 08, 2020 and the orders have been reserved for Judgement. Further, in October 2019, the Company has filed a writ petition in Madras High court for allowing access to plant to undertake essential care and maintenance as due to lack of care and maintenance in the last 18 months, several structures such as pipelines, cable trays etc. are in corroded state and likely to get damaged. Management believes that assessment of physical damage, if any, can be carried out once it gets access to the plant. However, the same is not expected to be material.
As per the Company’s assessment, it is in compliance with the applicable regulations and expects to get the necessary approvals in relation to the existing operations.
The Company has carried out an impairment analysis for existing plant assets during the year ended March 31, 2020 considering the key variables and concluded that there exists no impairment. The Company has done an additional sensitivity analysis with commencement of operations of the existing plant in FY 2022-23 and noted that the recoverable amount of the assets would still be in excess of their carrying values.
The carrying value of the assets as at March 31, 2020 is ` 2,328 Crore.
Expansion Plant:Separately, the Company has filed a fresh application for renewal of the Environmental Clearance for the proposed Copper Smelter Plant 2 (Expansion Project) dated March 12, 2018 before the Expert Appraisal Committee of the MoEF wherein a sub-committee was directed to visit the Expansion Project site prior to prescribing the Terms of Reference.
In the meantime, the Madurai Bench of the High Court of Madras in a Public Interest Litigation held vide its order dated May 23, 2018 that the application for renewal of the Environmental Clearance for the Expansion Project shall be processed after a mandatory public hearing and in the interim, ordered the Company to cease construction and all other activities on site for the proposed Expansion Project with immediate effect. The Ministry of Environment and Forests (MoEF) has delisted the expansion project since the matter is sub-judice. Separately, SIPCOT vide its letter dated May 29, 2018, cancelled 342.22 acres of the land allotted for the proposed Expansion Project. Further the TNPCB issued orders on June 07, 2018 directing the withdrawal of the Consent to Establish (CTE) which was valid till March 31, 2023.
The Company has approached Madras High Court by way of writ petition challenging the cancellation of lease deeds by SIPCOT pursuant to which an interim stay has been granted. The Company has also filed Appeals before the TNPCB Appellate Authority challenging withdrawal of CTE by the TNPCB, the matter is pending for adjudication.
mpairment recognised during the yearFor the expansion plant, the project activities are on halt since May 2018. Further, the project EC for the expansion plant got expired on December 31, 2018 and fresh application is filed before the competent authority, however, the process will start only after reopening of the existing plant and after obtaining all statutory approvals, the timing of which is uncertain.
INTEGRATED REPORT MANAGEMENT REVIEW STATUTORY REPORTS FINANCIAL STATEMENTS
06-115 116-167 168-270 271-502

416 VEDANTA LIMITED INTEGRATED REPORT AND ANNUAL ACCOUNTS 2019-20 VEDANTA LIMITED INTEGRATED REPORT AND ANNUAL ACCOUNTS 2019-20 417
CONSOLIDATED NOTES FORMING PART OF THE FINANCIAL STATEMENTSas at and for the year ended March 31, 2020
CONSOLIDATED NOTES FORMING PART OF THE FINANCIAL STATEMENTSas at and for the year ended March 31, 2020
Keeping in view the above factors and the fact that value in use cannot be reasonably ascertained, the Company has carried out recoverability assessment of the items of property, plant and equipment, capital work in progress (CWIP) and capital advances. Based on the realisable value estimate of ` 288 Crore, the Company has recognised an impairment of ` 669 Crore (comprising of CWIP balances of ` 435 Crore, capital advances of ` 196 Crore and other assets of ` 38 Crore) during the year.
Property, plant and equipment of ` 1,473 Crore and inventories of ` 517 Crore, pertaining to existing and expansion plant, could not be physically verified, anytime during the year, as the access to the plant is presently restricted. However, since operations are suspended and access to the plant restricted, any difference between book and physical quantities is unlikely to be material.
(viii) PSC ExtensionRajasthan locOn October 26, 2018, the Government of India (GoI), acting through the Directorate General of Hydrocarbons (DGH) granted its approval for a ten-year extension of the Production Sharing Contract (PSC) for the Rajasthan Block (RJ), with effect from May 15, 2020 subject to certain conditions. The GoI had granted the extension under the Pre-NELP Extension Policy, the applicability whereof to PSC for Rajasthan Block is sub-judice and pending before the Hon’ble Delhi High Court. The key conditions stated by DGH and the Group’s position is detailed below:
a) Submission of Audited Accounts and End of year statement:
The Company and one of the joint operation partners have divergent views on the cost oil entitlement and therefore the End of Year statement for the year ended March 31, 2018 & March 31, 2019 and the Investment Multiple as at March 31, 2018 and as at March 31, 2019 could not be finalised. Consequentially, profit petroleum pertaining to the said Block for the year ended March 31, 2019 and March 31, 2020 and applicable Investment Multiple calculated based on management’s cost oil computation (resulting into Government’s share of profit petroleum @ 40% for DA-1 & DA-2 and @20% for DA-3 for FY 2019 & FY 2020), remains provisional. The computation is after considering relevant independent legal advice. Pending alignment with joint operation partner, the End of Year Statement for FY 2017-18 and FY 2018-19 as per Operator’s calculations have been submitted to DGH and the joint operation partner, during the relevant financial year.
Above condition for submission of audited accounts and End of Year Statement for adoption by Management Committee of the Block has been delinked by DGH vide
letter dated December 03, 2019 as a pre-condition to PSC extension.
b) Profit Petroleum:
DGH, in May 2018, has raised a demand for the period up to March 31, 2017 for Government’s additional share of Profit oil based on its computation of disallowance of cost incurred over the initially approved Field Development Plan (FDP) of pipeline project for ` 1,508 Crore (US$ 202 million) and retrospective re-allocation of certain common costs between Development Areas (DAs) of Rajasthan Block aggregating to ` 2,723 Crore (US$ 364 million), representing share of the Company and its subsidiary. DGH vide it’s letter dated May 12, 2020, reiterated its demand only with respect to the retrospective re-allocation of certain common costs between Development Areas (DA’S) of Rajasthan block of ` 2,723 Crore (US$ 364 million) for the period upto March 31, 2017.
Subsequently, the Company in January 2020 received notifications from DGH on audit exceptions arising out of its audit for the FY 2017-18, which comprises of the consequential effects on profit oil due to the aforesaid matters and certain new matters on cost allowability plus interest aggregating to ` 4,828 Crore (US$ 645 million), representing share of the Company and its subsidiary, which have been suitably responded to by the Company.
The Company believes that it has sufficient as well as reasonable basis (pursuant to PSC provisions & approvals), supported by legal advice, for having claimed such costs and for allocating common costs between different DAs. In the Company’s opinion, these computations of the aforesaid demand / audit exceptions are not appropriate and the accounting adjustments sought for issues pertaining to Year 2007 and onwards are based on assumptions that are not in consonance with the approvals already in place. The Company’s view is also supported by independent legal opinion and the Company has been following the process set out in PSC to resolve these aforesaid matters. Thus, the Company sought for appointment of a sole expert for opining on the audit exceptions by a letter dated November 14, 2019 and thereafter on May 14, 2020, Company has issued a notice of Arbitration proceeding on the above matters and is confident of resolution of matters in its favor.
Further to above stated letter from GoI on October 26,2018, in view of pending non-finalisation of the Addendum to PSC, the extraordinary situation prevailing on account of COVID-19 and non-finalisation of issues including the aforesaid DGH demand, the GoI granted, vide letter dated May 14, 2020, permission to the Group to continue petroleum operations in RJ-ON-90/I block,
till the execution of the Addendum to PSC or for a period of three months from May 15, 2020, whichever is earlier.
In our view, above mentioned condition linked to PSC extension is untenable and has not resulted in creation of any liability and cannot be a ground for non-extension. In addition, all necessary procedures prescribed in the PSC including invocation of arbitration, in respect of the stated audit observation have also been fulfilled. Accordingly, in our view, the PSC extension approval granted vide DGH letter dated October 26, 2018 upholds with all conditions addressed and no material liability would devolve upon the Group.
Ravva locThe Government of India (GoI) has granted its approval for a ten-year extension of PSC for Ravva Block with effect from October 28, 2019, in terms of the provision of the “Policy on the Grant of the extension to Production Sharing Contract Signed by Government awarding small, medium-sized and discovered field to private joint ventures” dated March 28, 2016. The PSC addendum recording this extension has been executed by all parties.
The Ravva Extension Policy, amongst others, provides for an increased share of profit petroleum of 10% for the GoI during the extended term of the Ravva PSC and payment of royalty and cess as per prevailing rate in accordance with the PNG Rules, 1959 and OIDB Act. Under the Ravva PSC, –the Company’s oil and gas business is entitled to recover 100% of cost of production and development from crude oil and natural gas sales before any profit is allocated among the parties. Cost recovery for exploration cost during extension period shall be governed as per the provision of Office Memorandum 2013, 2019 issued by MoPNG on exploration in mining lease area post expiry of the exploration period.
(ix) Impact of Taxation Laws (Amendment) Act, 2019Pursuant to the introduction of Section 115BAA of the Indian Income Tax Act, 1961 which is effective April 01, 2019, companies in India have the option to pay corporate income tax at the rate of 22% plus applicable surcharge and cess as against the earlier rate of 30% plus applicable surcharge and cess, subject to certain conditions like, the company has to forego all benefits like tax holidays, brought forward losses generated through tax incentives/additional depreciation and outstanding MAT credit. Considering all the provisions under Section 115BAA and based on the expected timing of exercising of the option under Section 115BAA, the Group has re-measured its deferred tax balances leading to a deferred tax credit of ` 1,774 Crore on deferred tax balances as at March 31, 2019 being recognised during the financial year. This computation required assessment of assumptions regarding future profitability, which is inherently uncertain. To the extent assumptions
regarding future profitability change, there can be increase or decrease in the amounts recognised.
(x) Flue-gas desulfurisation (FGD) implementation:Ministry of Environment, Forest and Climate Change (MOEF&CC) has revised emission norms for coal-based power plants in India. Accordingly, both captive and independent coal-based power plants in India are required to comply with these revised norms for reduction of sulphur oxide (SOx) emissions for which the current plant infrastructure is to be modified or new equipment’s have to be installed. Timelines for compliance to the revised norm for various plants in the Group range from December 2019 to March 2022. Different power plants are at different stages of the implementation process. However, it is unlikely that the implementation would be completed by the stipulated date.
TSPL for which the last date of compliance was December 31, 2019, has issued Letter of Intent (LOI) to the successful bidder and continues to operate the plant in absence of any directions from Central Pollution Control Board (CPCB) or MOEF&CC. TSPL is confident that authorities would take considerate stand in view of stringent timelines and earnest efforts taken by the plant to meet the environmental norms. TSPL has received show cause notice from Punjab Pollution Control Board (PPCB), which was favourably disposed of by PPCB with a recommendation to CPCB for extension of timeline. Subsequently, a show cause notice has been issued by CPCB to TSPL and other power plants which were required to meet December 31, 2019 deadline. CPCB vide notice dated May 20, 2020 published on its website, has imposed penalty of ` 18 Lacs per month per non-compliant unit and any further directions based on the periodic review of compliance status.
Similarly, other power plants of the Group in India are required to comply with the revised norms in the coming year(s). Group’s respective operations have been engaging with the concerned authorities to extend the timeline for compliance. In the event, the request for extension of timeline is not accepted, this could lead to levy of some penalties, the impact of which is not likely to be material.
(xi)� Electrosteel Steels Limited had filed application for renewal of Consent to Operate (‘CTO’) on August 24, 2017 for the period of five years which was denied by Jharkhand State Pollution Control Board (‘JSPCB’) on August 23, 2018. Hon’ble High Court of Jharkhand has granted stay on August 25, 2018 against said order of denial of CTO by JSPCB and the stay has been extended by the Court to allow the operations till next date of hearing, which is now fixed on June 19, 2020. Hon’ble High Court has also extended stay against order of Ministry of Environment, Forest and Climate Change
INTEGRATED REPORT MANAGEMENT REVIEW STATUTORY REPORTS FINANCIAL STATEMENTS
06-115 116-167 168-270 271-502

418 VEDANTA LIMITED INTEGRATED REPORT AND ANNUAL ACCOUNTS 2019-20 VEDANTA LIMITED INTEGRATED REPORT AND ANNUAL ACCOUNTS 2019-20 419
CONSOLIDATED NOTES FORMING PART OF THE FINANCIAL STATEMENTSas at and for the year ended March 31, 2020
CONSOLIDATED NOTES FORMING PART OF THE FINANCIAL STATEMENTSas at and for the year ended March 31, 2020
(MOEF&CC) dated September 20, 2018 in respect of revocation of environmental clearance (EC) till next date of hearing on June 19, 2020. In December 2019, ESL has been granted the stage I forest clearance by MOEF&CC. The company is working out appropriate solution to secure the revised EC in due course and does not expect a material liability in this regard.
(xii) Assessment of impairment at Avanstrate Inc (ASI)Significant changes in the market and economic environment in which ASI operates has led to decrease in demand and profitability in the glass substrate business. Accordingly, the Group had assessed the recoverable value of all its assets and liabilities which led to a non-cash impairment charge during the year ended March 31, 2020 (refer note 33).
The impairment assessments are based on a range of estimates and assumptions, including:
Estimates/ assumption Basis
Future sales volume Existing customer relationships, unperformed contracts and expected wins
Commodity prices Management’s best estimate �Discount rates Cost of capital risk-adjusted for
the risk specific to the asset/ CGU
The projections of future sales volume are based on the existing customer relationships, unperformed contracts and revenue from contracts with new customers which are in the advanced stage of discussions or are probable wins based on management judgement. Any subsequent changes to cash flows due to changes in the above-mentioned factors could impact the carrying value of the assets.
(xiii) Assessment of impairment of assets at Aluminium divisionConsidering lower sales realisation, an impairment trigger has been identified in the aluminium division of the Company. The impairment assessments are based on a range of estimates and assumptions, including:Estimates/assumptions Basis
Future production Proved and probable reserves, production facilities, resource estimates and expansion projects
Commodity prices management’s best estimate benchmarked with external sources of information, to ensure they are within the range of available analyst forecast
Discount rates cost of capital risk-adjusted for the risk specific to the asset/CGU
The Group has carried out an impairment analysis, based on value in use approach, considering the key
variables and concluded that there exists no impairment. The Group has carried out sensitivity analysis on key assumptions including commodity price, discount rate and delay in expansion of refinery. Based on sensitivity analysis, the recoverable amount is still expected to exceed the carrying value as at March 31, 2020 of ` 36,992 Crore.
(xiv) Going ConcernConsidering the uncertainties caused due to Covid-19, the Group prepared its cash flow forecasts under various scenarios and has performed additional sensitivities on certain key assumptions. Based on such an analysis and assessment of its ability to raise additional capital, the Group continues to prepare its financial statements on a going concern basis.
(B) Significant judgements(i) Determining whether an arrangement contains a lease:The Group has ascertained that the Power Purchase Agreement (PPA) entered into between one of the subsidiaries and a State grid qualifies to be an operating lease under Ind AS 116 “Leases”. Accordingly, the consideration receivable under the PPA relating to recovery of capacity charges towards capital cost have been recognised as operating lease rentals and in respect of variable cost that includes fuel costs, operations and maintenance, etc. is considered as revenue from sale of products/services.
Significant judgement is required in segregating the capacity charges due from the State grid, between fixed and contingent payments. The Group has determined that since the capacity charges under the PPA are based on the number of units of electricity made available by its Subsidiary which would be subject to variation on account of various factors like availability of coal and water for the plant, there are no fixed minimum payments under the PPA, which requires it to be accounted for on a straight line basis. The contingent rents recognised are disclosed in Note 25(A).
(ii) ContingenciesIn the normal course of business, contingent liabilities may arise from litigation, taxation and other claims against the Group. A provision is recognised when the Group has a present obligation as a result of past events and it is probable that the Group will be required to settle that obligation. Where it is management’s assessment that the outcome cannot be reliably quantified or is uncertain, the claims are disclosed as contingent liabilities unless the likelihood of an adverse outcome is remote. Such liabilities are disclosed in the notes but are not provided for in the financial statements.
When considering the classification of legal or tax cases as probable, possible or remote, there is judgement involved. This pertains to the application of the legislation, which in certain cases is based upon management’s interpretation of country specific applicable law, in particular India, and the likelihood of settlement. Management uses in-house and external legal professionals to make informed decision. Although there can be no assurance regarding the final outcome of the legal proceedings, the Group does not expect them to have a materially adverse impact on the Group’s financial position or profitability. These are set out in note 37.
(iii) Revenue recognition and receivable recovery in relation to the power divisionIn certain cases, the Group’s power customers are disputing various contractual provisions of Power Purchase Agreements (PPA). Significant judgement is required in both assessing the tariff to be charged under the PPA in accordance with Ind AS 115 and to assess the recoverability of withheld revenue currently accounted for as receivables.
In assessing this critical judgement, management considered favourable external legal opinions the Group has obtained in relation to the claims. In addition, the fact that the contracts are with government owned companies implies the credit risk is low [refer note 8(c)].
(iv) Exceptional ItemsExceptional items are those items that management considers, by virtue of their size or incidence (including but not limited to impairment charges and acquisition and restructuring related costs), should be disclosed separately to ensure that the financial information allows an understanding of the underlying performance of the business in the year, so as to facilitate comparison with prior periods. Also tax charges related to exceptional items and certain one-time tax effects are considered exceptional. Such items are material by nature or amount to the year’s result and require separate disclosure in accordance with Ind AS.
The determination as to which items should be disclosed separately requires a degree of judgement. The details of exceptional items are set out in note 33.
4 BUSINESS COMBINATION AND OTHERSa) Ferro Alloys Corporation Limited - Business Combination (proposed)Pursuant to the order dated January 30, 2020 of the National Company Law Tribunal (NCLT), Vedanta Limited is implementing the approved Resolution Plan for acquisition of Ferro Alloys Corporation Limited (“FACOR”) which was under liquidation as per the Insolvency and Bankruptcy Code 2016 (including all amendments for
the time being in force). The closing of the transaction requires certain substantive actions to be taken whereupon the transaction would qualify for accounting under Ind AS 103 Business Combinations.
FACOR is a company in the business of producing Ferro Alloys and owns a Ferro Chrome plant with capacity of 72,000 TPA, two operational Chrome mines and 100 MW of Captive Power Plant through its subsidiary, FACOR Power Limited (FPL). The consideration payable for the acquisition of FACOR on debt and cash free basis under the approved Resolution Plan is ` 10 Crore as well as equivalent of cash balance in FPL as upfront payment and zero coupon, secured and unlisted Non-Convertible Debentures of aggregate face value of ` 270 Crore to the Financial Creditors payable equally over 4 years commencing March 2021.
b) Acquisition of Global coke plantOn July 28, 2019, the Company acquired Sindhudurg plant of Global Coke Limited which was under liquidation as per the Insolvency and Bankruptcy Code 2016 (including all amendments for the time being in force) for a cash consideration of ` 33 Crore. The assets acquired mainly included Land, Building and Plant & Machinery of similar value as the cash consideration. The acquisition complements backward integration opportunity for the Company’s existing pig iron division and also increase Company’s footprint in met coke market in south western part of India. Detailed disclosure of fair value of the identifiable assets and liabilities of Sindhudurg plant has not been provided as the same is not material.
Acquisition costs related to the same were not material.
c) Electrosteel Steels Limited - Business CombinationDuring the previous year ended March 31, 2019, the Group, through its subsidiary Vedanta Star Limited (VSL) acquired control over Electrosteel Steels Limited (ESL). Based on completion of the closing conditions, the Group concluded the acquisition date as June 04, 2018. ESL has been included in “Others” segment. If ESL had been acquired at the beginning of the comparative period, revenue and profit before taxation of the Group for the year ended March 31, 2019 would have been ` 91,559 Crore and ` 13,540 Crore respectively.
Further, during the current year, Hon’ble National Company Law Tribunal, Kolkata Bench vide its Order dated January 31, 2020 approved the Scheme of Amalgamation of VSL with its subsidiary ESL. Post the amalgamation becoming effective on March 25, 2020, the Company directly holds 95.49% in ESL.
INTEGRATED REPORT MANAGEMENT REVIEW STATUTORY REPORTS FINANCIAL STATEMENTS
06-115 116-167 168-270 271-502

420 VEDANTA LIMITED INTEGRATED REPORT AND ANNUAL ACCOUNTS 2019-20 VEDANTA LIMITED INTEGRATED REPORT AND ANNUAL ACCOUNTS 2019-20 421
CONSOLIDATED NOTES FORMING PART OF THE FINANCIAL STATEMENTSas at and for the year ended March 31, 2020
CONSOLIDATED NOTES FORMING PART OF THE FINANCIAL STATEMENTSas at and for the year ended March 31, 2020
d) Acquisition of new hydrocarbon blocksIn August, 2018, Vedanta Limited was awarded 41 hydrocarbon blocks out of 55 blocks auctioned under the Open Acreage Licensing Policy (OALP) by Government of India (GOI). The blocks awarded to Vedanta Limited comprise of 33 onshore and 8 offshore blocks. Vedanta Limited will share a specified proportion of the net revenue from each block with GOI and has entered into 41 separate revenue sharing contracts (RSC) on October 01, 2018. The bid cost of ` 4,122 Crore represents Vedanta Limited’s total committed capital expenditure on the blocks for the committed work programs during the exploration phase. Vedanta Limited has provided bank guarantees for minimum work programme commitments amounting to ` 2,268 Crore for the 41 exploration blocks. These have been disclosed in note 37.
In March 2019, the Company has been awarded 2 Contract Areas out of total 25 Contract Areas auctioned under Round II of the Discovered Small Field Policy (DSF) by Government of India (GOI). Both the Contract Areas awarded are onland fields. The Group will share a specified proportion of the revenue from each block with GOI and has entered into 2 separate Revenue Sharing Contracts (RSC) on March 07, 2019. There is no commitment for minimum work programme in these blocks.
In July 2019, the Company has been awarded 10 hydrocarbon blocks out of 32 blocks awarded under round II & III of Open Acreage Licensing Policy (OALP) by Government of India (GoI). The blocks awarded to the Group comprise of 7 onshore and 3 offshore blocks. To effect the transaction, the Company has entered into revenue sharing contracts (“RSCs”) with the GoI on July 16, 2019. The bid cost of ` 1,761 Crore represents the Group’s estimated cost of committed work program in the blocks during the initial exploration phase. The Company has provided bank guarantees for minimum work programme commitments amounting to ` 512 Crore for the 10 exploration blocks.
5 SEGMENT INFORMATIONA) Description of segment and principal activitiesThe Group is a diversified natural resource group engaged in exploring, extracting and processing minerals and oil and gas. The Group produces zinc, lead, silver, copper, aluminium, iron ore, oil and gas and commercial power and has a presence across India, South Africa, Namibia, U.A.E, Ireland, Australia, Japan, South Korea, Taiwan and Liberia. The Group is also in the business of port
operations and manufacturing of glass substrate and steel. The Group has seven reportable segments: copper, aluminium, iron ore, power, Zinc India (comprises of zinc and lead India), Zinc international, oil and gas and others. The management of the Group is organised by its main products: copper, Zinc (comprises of zinc and lead India, silver India and zinc international), aluminium, iron ore, oil and gas, power and others. Each of the reportable segments derives its revenues from these main products and hence these have been identified as reportable segments by the Group’s chief operating decision maker (“CODM”).
Segment Revenue, Results, Assets and Liabilities include the respective amounts identifiable to each of the segments and amount allocated on a reasonable basis. Unallocated expenditure consist of common expenditure incurred for all the segments and expenses incurred at corporate level. The assets and liabilities that cannot be allocated between the segments are shown as unallocated assets and unallocated liabilities respectively.
The accounting policies of the reportable segments are the same as the Group’s accounting policies described in Note 3. The operating segments reported are the segments of the Group for which separate financial information is available. Earnings before interest, depreciation and amortisation and tax (EBITDA) are evaluated regularly by the CODM in deciding how to allocate resources and in assessing performance. The Group’s financing (including finance costs and finance income) and income taxes are reviewed on an overall basis and are not allocated to operating segments.
Pricing between operating segments are on an arm’s length basis in a manner similar to transactions with third parties except from power segment sales amounting to Nil and ` 67 Crore, which is at cost, for the year ended March 31, 2020 and March 31, 2019 respectively.
The following table presents revenue and profit information and certain assets and liabilities information regarding the Group’s business segments as at and for the year ended March 31, 2020 and March 31, 2019 respectively.
For the year ended March 31, 2020(` in Crore)
Particulars
Business Segments Zinc India
Zinc International
Oil & Gas Aluminium Copper Iron Ore Power Others Eliminations Total
RevenueExternal revenue 18,159 3,128 12,661 26,544 9,053 3,450 5,860 4,690 - 83,545 Inter segment revenue - - - 33 - 13 - 92 (138) - Segment revenue 18,159 3,128 12,661 26,577 9,053 3,463 5,860 4,782 (138) 83,545 ResultsEBITDA* 8,714 380 7,271 1,998 (300) 878 1,649 471 - 21,061 Depreciation, depletion and amortisation
2,367 633 2,714 1,896 214 109 687 473 - 9,093
Other income ** 101 - - 73 5 8 17 1 - 205 Segment Results 6,448 (253) 4,557 175 (509) 777 979 (1) - 12,173 Less: Unallocated expenses (307)Less: Finance costs 4,977 Add: Other income (excluding exchange difference and those included in segment results)
2,238
Add: Net exceptional loss (17,386)Net profit/(loss) before tax (8,259)Other informationSegment assets 21,989 5,175 15,474 55,876 6,867 2,738 18,712 8,087 - 1,34,918 Financial Assets investments
24,753
Deferred tax Assets 6,889 Income tax Assets 2,652 Cash and bank balances (Including restricted cash and bank balances)
13,256
Others 1,154 Total assets 1,83,622 Segment liabilities 5,996 1,226 10,206 20,811 4,599 1,268 1,942 1,574 - 47,622 Deferred tax liabilities 2,885 Borrowing 59,187 Income tax liabilities (net of payments)
188
Others 1,993 Total liabilities 1,11,875 Capital expenditure*** 4,220 721 4,610 1,406 61 105 66 238 - 11,430 Impairment reversal/(charge) - net / provision
- - (15,907) - (669) - - (504) - (17,080)
* EBITDA is a non-GAAP measure
** Amortisation of duty benefits relating to assets recognised as government grant.
*** Total of capital expenditure includes capital expenditure of ` 3 Crore which is not allocable to any segment. It also includes acquisition through business combination.
INTEGRATED REPORT MANAGEMENT REVIEW STATUTORY REPORTS FINANCIAL STATEMENTS
06-115 116-167 168-270 271-502

422 VEDANTA LIMITED INTEGRATED REPORT AND ANNUAL ACCOUNTS 2019-20 VEDANTA LIMITED INTEGRATED REPORT AND ANNUAL ACCOUNTS 2019-20 423
CONSOLIDATED NOTES FORMING PART OF THE FINANCIAL STATEMENTSas at and for the year ended March 31, 2020
CONSOLIDATED NOTES FORMING PART OF THE FINANCIAL STATEMENTSas at and for the year ended March 31, 2020
For the year ended March 31, 2019(` in Crore)
Particulars
Business Segments Zinc India
Zinc International
Oil & Gas Aluminium Copper Iron Ore Power Others Eliminations Total
RevenueExternal revenue 20,656 2,738 13,223 29,208 10,739 2,903 6,456 4,978 - 90,901 Inter segment revenue - - - 21 - 8 68 45 (142) - Segment revenue 20,656 2,738 13,223 29,229 10,739 2,911 6,524 5,023 (142) 90,901 ResultsEBITDA* 10,600 698 7,656 2,202 (235) 584 1,527 980 - 24,012 Depreciation, depletion and amortisation
1,959 429 2,492 1,874 209 118 712 399 - 8,192
Other income ** 78 - - 71 6 8 17 3 - 183 Segment Results 8,719 269 5,164 399 (438) 474 832 584 - 16,003 Less: Unallocated expenses (509)Less: Finance costs 5,689 Add: Other income (excluding exchange difference and those included in segment results)
3,435
Add: Net exceptional loss 320 Net profit/(loss) before tax 13,560 Other informationSegment assets 19,884 6,034 28,519 58,422 8,347 3,122 19,573 8,844 - 1,52,745 Financial Assets investments
33,065
Deferred tax Assets 3,475 Income tax Assets 3,492 Cash and bank balances (Including restricted cash and bank balances)
8,392
Others 874 Total assets 2,02,043 Segment liabilities 6,155 1,361 9,851 23,062 4,163 1,367 2,045 1,463 - 49,467 Deferred tax liabilities 4,484 Borrowing 66,226 Income tax liabilities (net of payments)
409
Others 3,933 Total liabilities 1,24,519 Capital expenditure*** 3,883 1,575 3,876 1,552 304 36 60 5,191 - 16,490 Impairment reversal/(charge) - net / provision
- - 261 - - - - - - 261
* EBITDA is a non-GAAP measure
** Amortisation of duty benefits relating to assets recognised as government grant.
*** Total of capital expenditure includes capital expenditure of ` 3 Crore which is not allocable to any segment. It also includes acquisition through business combination.
B) Geographical segment analysisThe following table provides an analysis of the Group’s sales by region in which the customer is located, irrespective of the origin of the goods.
(` in Crore)
Geographical SegmentsYear ended
March 31, 2020Year ended
March 31, 2019
Revenue by geographical segmentIndia 54,226 59,160 China 2,694 3,787 UAE 820 1,015 Malaysia 7,648 4,866 Others 18,157 22,073 Total 83,545 90,901
The following is an analysis of the carrying amount of non-current assets, excluding deferred tax assets and financial assets, analysed by the geographical area in which the assets are located:
(` in Crore)
Geographical SegmentsYear ended
March 31, 2020Year ended
March 31, 2019
Carrying amount of non-current assetsIndia 1,06,844 1,21,676South Africa 3,723 4,186Namibia 750 995Taiwan 1,162 1,220Others 985 981Total 1,13,464 1,29,058
C) Information about major customersNo single customer has accounted for more than 10% of the Group’s revenue for the years ended March 31, 2020 and March 31, 2019.
D) Disaggregation of revenueBelow table summarises the disaggregated revenue from contracts with customers
(` in Crore)
ParticularsYear ended
March 31, 2020Year ended
March 31, 2019
Oil 10,906 12,643 Gas 795 527 Zinc Metal 15,756 17,205 Lead Metal 3,470 3,757 Silver Metals and bars 2,476 2,583 Iron Ore 1,482 691 Metallurgical coke 55 53 Pig Iron 2,239 2,061 Copper products 7,349 9,293 Aluminium products 25,429 28,073 Power 4,406 4,784 Steel products 3,785 4,186 Others 3,748 4,219 Revenue from contracts with customers* 81,896 90,075 Revenue from contingent rents 1,673 1,672 (Loss) on provisionally priced contracts under Ind AS 109 (1,300) (846)JV partner’s share of the exploration costs approved under the OM (Refer note 25A) 1,276 - Total Revenue 83,545 90,901
*includes revenues from sale of services aggregating to ` 216 Crore ( March 31, 2019: ` 220 Crore) which is recorded over a period of time and the balance revenue is recognised at a point in time.
INTEGRATED REPORT MANAGEMENT REVIEW STATUTORY REPORTS FINANCIAL STATEMENTS
06-115 116-167 168-270 271-502

424 VEDANTA LIMITED INTEGRATED REPORT AND ANNUAL ACCOUNTS 2019-20 VEDANTA LIMITED INTEGRATED REPORT AND ANNUAL ACCOUNTS 2019-20 425
CONSOLIDATED NOTES FORMING PART OF THE FINANCIAL STATEMENTSas at and for the year ended March 31, 2020
CONSOLIDATED NOTES FORMING PART OF THE FINANCIAL STATEMENTSas at and for the year ended March 31, 2020
Details of Right of Use (ROU) Assets
Land BuildingPlant and
Equipment Total
For the FY 2019-20ROU asset as at April 01, 2019 311 239 26 576 Additions 302 40 679 1,021 Deductions - (196) - (196)Depreciation (51) (42) (40) (133)Impairment (22) - - (22)Exchange difference 8 7 26 41 Net book value/ carrying amount as on March 31, 2020 548 48 691 1,287
Intangible Assets(` in Crore)
Software License
Right to use*
Mining Rights
Port concession
rights (refer note k)
Brand & Technological
know-how Total
Gross BlockAs at April 1, 2018 321 69 381 677 220 1,668 Additions 15 - - 4 - 19 Transfers from Property, Plant and Equipment 1 - - - - 1 Disposals/ Adjustments (4) - - (3) - (7)Exchange differences 9 - - - 4 13 As at March 31, 2019 342 69 381 678 224 1,694 Additions 21 6 - 6 - 33 Transfers from Property, Plant and Equipment 1 37 - - - 38 Disposals/ Adjustments - - - (1) - (1)Exchange differences 15 - - - 23 38 As at March 31, 2020 379 112 381 683 247 1,802 Accumulated amortisation and impairmentAs at April 1, 2018 262 11 319 122 5 719 Charge for the year 35 3 5 24 22 89 Disposals/ Adjustments (4) - - (1) - (5)Transfers from Property, Plant and Equipment 1 - - - - 1 Exchange differences 8 - - - (0) 8 As at March 31, 2019 302 14 324 145 27 812 Charge for the year 32 5 4 25 23 89 Disposals/ Adjustments - - - - - - Transfers from Property, Plant and Equipment - - - - - - Exchange differences 15 - - - 4 19 As at March 31, 2020 349 19 328 170 54 920 Net Book Value/Carrying amountAs at April 1, 2018 59 58 62 555 215 949 As at March 31, 2019 40 55 57 533 197 882 As at March 31, 2020 30 93 53 513 193 882
*CSR Asset
a)� �Plant and equipment include refineries, smelters, power plants, railway sidings, ships, aircrafts, river fleets and related facilities.
b)� During the year ended March 31, 2020, interest capitalised was ` 1,017 Crore (March 31, 2019: ` 834 Crore).
c)� �Freehold land includes ` 293 Crore (March 31, 2019 ` 259 Crore), accumulated depreciation ` 254 Crore (March 31, 2019 ` 226 Crore), which is available for use during the lifetime of the Production Sharing Contract of the respective Oil and Gas blocks and title deed for the same is in the name of the licensee of the block.6.
PR
OP
ERT
Y, P
LAN
T A
ND
EQ
UIP
MEN
T, IN
TAN
GIB
LE A
SS
ETS
, CA
PIT
AL
WO
RK-
IN-P
RO
GR
ES
S A
ND
EX
PLO
RAT
ION
INTA
NG
IBLE
A
SS
ETS
UN
DER
DE
VEL
OP
MEN
T(`
in C
rore
)
Par
ticu
lars
Free
hold
la
ndB
uild
ings
Plan
t and
eq
uipm
ent
Min
ing
prop
erty
Oil
& ga
s pr
oduc
ing
faci
litie
s
Furn
itur
e an
d fi
xtur
esV
ehic
les
Offi
ce
equi
pmen
t
Rig
ht
of U
se
asse
tsTo
tal
Capi
tal
wor
k-in
-pr
ogre
ss(C
WIP
)
Expl
orat
ion
inta
ngib
le
asse
ts u
nder
de
velo
pmen
t
Tota
l inc
ludi
ng
capi
tal w
ork-
in-p
rogr
ess
and
Exp
lora
tion
in
tang
ible
as
sets
und
er
deve
lopm
ent
Pro
pert
y, P
lant
& e
quip
men
tG
ross
Blo
ckA
s at
Apr
il 01
, 201
82,
156
12,5
4390
,752
10,0
3446
,715
336
126
722
-1,
63,3
8417
,639
62,0
832,
43,1
06Ad
diti
ons
3948
42,
248
1,14
724
918
2010
9-
4,31
47,
061
500
11,8
75Tr
ansf
ers/
Rec
lass
ifica
tion
s11
399
3,88
12,
073
32,8
6720
236
8-
39,4
9519
,673
(59,
169)
(1)
Acqu
isit
ion
thro
ugh
busi
ness
co
mbi
nati
on (R
efer
not
e 4(
c))
332
559
3,49
0-
-4
-3
-4,
388
457
-4,
845
Dis
posa
ls/
Adju
stm
ents
-(1
6)(9
34)
(53)
-(3
)(1
4)(2
5)-
(1,0
45)
(58)
-(1
,103
)U
nsuc
cess
ful E
xplo
rati
on c
ost
(Ref
er n
ote
32)
--
--
--
--
--
-(5
0)(5
0)
Exch
ange
diff
eren
ces
2061
416
(464
)2,
603
9(9
)14
-2,
650
(277
)4,
542
6,91
5A
s at
Mar
ch 3
1, 2
019
2,55
814
,030
99,8
5312
,737
82,4
3438
435
983
1-
2,13
,186
44,4
957,
906
2,65
,587
ROU
Ass
ets
as a
t A
pril
01, 2
019
--
(16)
--
--
-57
756
1-
-56
1Ad
diti
ons
1035
72,
335
1,49
118
612
4112
31,
021
5,57
65,
800
509
11,8
85Ac
quis
itio
n th
roug
h bu
sine
ss
com
bina
tion
(Ref
er n
ote
4(b)
)12
714
--
--
--
33-
-33
Tran
sfer
s/ R
ecla
ssifi
cati
ons
n(3
30)
611,
545
693
1,40
02
2610
-3,
407
(3,8
12)
18(3
87)
Dis
posa
ls/
Adju
stm
ents
-(6
)(7
24)
(126
)(1
4)(4
)(2
2)(8
)(2
24)
(1,1
28)
(3)
(84)
(1,2
15)
Uns
ucce
ssfu
l Exp
lora
tion
cos
t (R
efer
not
e 32
)-
--
--
--
--
--
(3)
(3)
Exch
ange
diff
eren
ces
2817
577
3(5
26)
6,81
216
(10)
1846
7,33
22,
588
663
10,5
83A
s at
Mar
ch 3
1, 2
020
2,27
814
,624
1,03
,780
14,2
6990
,818
410
394
974
1,42
02,
28,9
6749
,068
9,00
92,
87,0
44A
ccum
ulat
ed d
epre
ciat
ion,
de
plet
ion,
am
orti
sati
on a
nd
impa
irm
ent
As
at A
pril
01, 2
018
284
4,83
727
,714
5,47
744
,891
222
3659
3-
84,0
541,
499
46,1
681,
31,7
21C
harg
e fo
r th
e ye
ar23
569
4,35
31,
305
1,75
045
1878
-8,
141
--
8,14
1D
ispo
sals
/ Ad
just
men
ts-
(15)
(668
)-
-(2
)(9
)(2
4)-
(718
)-
-(7
18)
Impa
irm
ent
char
ge/(
reve
rsal
) for
th
e ye
ar (R
efer
not
e 33
)-
--
-(2
61)
--
--
(261
)-
-(2
61)
Tran
sfer
s/ R
ecla
ssifi
cati
on2
40(6
5)-
23,3
962
48(2
8)-
23,3
9520
,975
(44,
371)
(1)
Exch
ange
diff
eren
ces
1382
474
(115
)2,
588
6(6
)18
-3,
060
(215
)3,
386
6,23
1A
s at
Mar
ch 3
1, 2
019
322
5,51
331
,808
6,66
772
,364
273
8763
7-
1,17
,671
22,2
595,
183
1,45
,113
ROU
Ass
ets
as a
t A
pril
01, 2
019
--
(1)
--
--
-1
--
--
Cha
r ge
for
the
year
1054
74,
181
1,63
42,
359
4637
116
133
9,06
3-
-9,
063
Dis
posa
ls/
Adju
stm
ents
-(1
)(4
07)
--
(3)
(16)
(7)
(28)
(462
)-
-(4
62)
Impa
irm
ent
char
ge/(
reve
rsal
) for
th
e ye
ar (R
efer
not
e 33
)-
1750
7-
6,91
2-
--
227,
458
7,85
71,
569
16,8
84
Tran
sfer
s/ R
ecla
ssifi
cati
on-
-(6
)-
--
6-
--
--
-Ex
chan
ge d
iffer
ence
s21
166
805
(216
)6,
406
14(6
)20
57,
215
2,11
550
99,
839
As
at M
arch
31,
202
035
36,
242
36,8
878,
085
88,0
4133
010
876
613
31,
40,9
4532
,231
7,26
11,
80,4
37N
et B
ook
Valu
e/C
arry
ing
Am
ount
As a
t A
pril
01, 2
018
1,87
27,
706
63,0
384,
557
1,82
411
490
129
-79
,330
16,1
4015
,915
1,11
,385
As a
t M
arch
31,
201
92,
236
8,51
768
,045
6,07
010
,070
111
272
194
-95
,515
22,2
362,
723
1,20
,474
As
at M
arch
31,
202
01,
925
8,38
266
,893
6,18
42,
777
8028
620
81,
287
88,0
2216
,837
1,74
81,
06,6
07
INTEGRATED REPORT MANAGEMENT REVIEW STATUTORY REPORTS FINANCIAL STATEMENTS
06-115 116-167 168-270 271-502

426 VEDANTA LIMITED INTEGRATED REPORT AND ANNUAL ACCOUNTS 2019-20 VEDANTA LIMITED INTEGRATED REPORT AND ANNUAL ACCOUNTS 2019-20 427
CONSOLIDATED NOTES FORMING PART OF THE FINANCIAL STATEMENTSas at and for the year ended March 31, 2020
CONSOLIDATED NOTES FORMING PART OF THE FINANCIAL STATEMENTSas at and for the year ended March 31, 2020
d)� �Certain property, plant and equipment are pledged as collateral against borrowings, the details related to which have been described in Note 19 on “Borrowings”.
e)� �Freehold land includes 40 quarters at Bidhan Bagh Unit and 300.88 acres of land at Korba and Bidhan Bagh which have been occupied without authorisation for which Group is evaluating evacuation options and the Group has filed the civil suits for the same.
f)� �The land transferred to BALCO by National Thermal Power Corporation Ltd. (NTPC) vide agreement dated June 20, 2002 comprising of 171.44 acres land for BALCO’s 270 MW captive power plant and it’s allied facilities and 34.74 acres land for staff quarters of the said captive power plant is yet to be registered in favour of BALCO due to non availability of title deeds from NTPC. The arbitration is pending between Balco and NTPC (presently in appeal before Delhi High Court), in which transfer of title deeds is also sub-judice and is posted for hearing on July 27, 2020.
g)� �The Division Bench of the Hon’ble High Court of Chhattisgarh has vide its order dated February 25, 2010, upheld that BALCO is in legal possession of 1,804.67 acres of Government land. Subsequent to the said order, the State Government has decided to issue the lease deed in favour of BALCO after the issue of forest land is decided by the Hon’ble Supreme Court. In the proceedings before the Hon’ble Supreme Court, pursuant to public interest litigations filed, it has been alleged that land in possession of BALCO is being used in contravention of the Forest Conservation Act, 1980 even though the said land has been in its possession prior to the promulgation of the Forest Conservation Act, 1980 on which its Aluminium complex, allied facilities and township were constructed between 1971-76. The Central Empowered Committee of the Supreme Court has already recommended ex-post facto diversion of the forest land in possession of BALCO. BALCO has also filed two IA before the Supreme Court, 1st challenging the order of the Tehsildar Korba whereby he rejected BALCO’S applications for eviction of illegal encroachers on BALCO’S land on the ground that land matter is subjudice before the Supreme Court and the other application whereby BALCO has challenged the state government’s action for allotment of land to illegal encroachers under the Rajiv Ashray Yojna. No next date is there and the matter is to be listed in due course.
h) � �Property, Plant and Equipment, Capital work-in-progress and exploration and evaluation assets net block includes share of jointly owned assets with the joint venture partners ` 11,154 Crore (March 31, 2019: ` 23,387 Crore). Due to the reasons mentioned in note 3(c)(A)(viii), in the previous year, the Group has recomputed its reserves till 2030 and has reclassified exploration costs of ` 8,126 Crore to property plant and equipment and ` 6,724 Crore to capital work-in-progress.
i)� �In accordance with the exemption given under Ind AS 101, which has been exercised by the Group, a first time adopter can continue its previous GAAP policy for accounting for exchange differences arising from translation of long-term foreign currency monetary items recognised in the previous GAAP financial statements for the period ending immediately before the beginning of the first Ind AS financial reporting period i.e. April 01, 2016. Accordingly, foreign currency exchange loss arising on translation/settlement of long-term foreign currency monetary items acquired before April 01, 2016 pertaining to the acquisition of a depreciable asset amounting to ` 65 Crore (March 31, 2019: ` 85 Crore) are adjusted to the cost of respective item of property, plant and equipment.
j) Reconciliation of depreciation, depletion and amortisation expense(` in Crore)
ParticularsYear ended
March 31, 2020Year ended
March 31, 2019
Depreciation/Depletion/Amortisation expense on: � Property, Plant and equipment 9,063 8,141� Intangible assets 89 89As per Property, Plant and Equipment and Intangibles schedule 9,152 8,230Less: Depreciation capitalised - (10)Less: Cost allocated to joint ventures (59) (28)As per Consolidated Statement of Profit and Loss 9,093 8,192
k)� �Vizag General Cargo Berth Private Limited (VGCB), a special purpose vehicle and wholly owned by the Company, was incorporated for the coal berth mechanisation and upgradation at Visakhapatnam port. The project was to be carried out on a design, build, finance, operate and transfer basis and the concession agreement between Visakhapatnam Port and VGCB was signed in 2010. Visakhapatnam Port has provided, in lieu of Royalty, an exclusive license to VGCB for designing, engineering, financing, constructing, equipping, operating, maintaining,
and transferring the project/project facilities and services. The concession period is 30 years from the date of the award of the concession. The capacity of upgraded berth is 10.18 mmtpa and that the Vishakhapatnam Port is entitled to receive 38.10% share of the gross revenue as royalty. VGCB is entitled to recover a tariff from the user(s) of the project facilities and services as per Tariff Authority for Major Project (TAMP) notification. The changes in tariff rates are linked to the variation in Wholesale Price Index (WPI) and would accordingly be adjusted as specified in the concession agreement every year. The ownership of all infrastructure assets, buildings, structures, berths, wharfs, equipment and other immovable and movable assets constructed, installed, located, created or provided by VGCB at the project site and/or in the port’s assets pursuant to concession agreement would be with VGCB until expiry of this concession agreement. The cost of any repair, replacement or restoration of the project facilities and services shall be borne by VGCB during the concession period. VGCB has to transfer all its rights, titles and interest in the project facilities and services free of cost to Visakhapatnam Port at the end of the concession period. The project is in commercial operations since 2013.
l)� �Title deeds of freehold land of 264 acres relating to Electrosteel Steels Limited is not available with the Group. The Group is in the process of having the same regularised.
m)� �As at March 31, 2020, TSPL’s assets consisting of land (including ROU land), building and plant and machinery having net carrying value of ` 397 Crore (March 31, 2019: ` 391 Crore), ` 200 Crore (March 31, 2019: ` 211 Crore) and ` 9,435 Crore (March 31, 2019: ` 9,861 Crore) respectively have been given on operating lease (refer note 3(c)(B)(i)).
n)� �A parcel of land aggregating to ` 349 Crores relating to Iron Ore business has been reclassified during the year, due to existing litigation, to Financial Assets and later impaired (Refer note 33) and ` 38 Crore transferred to intangible assets from CWIP.
7. FINANCIAL ASSETS: INVESTMENTSA) Non-Current Investments
(` in Crore)As at
March 31, 2020 As at
March 31, 2019
(I) Investments at fair value through other comprehensive incomeInvestment in Equity Shares - QuotedSterlite Technologies Limited- 47,64,295 shares of ` 2 each (including 60 shares held jointly with nominees)
30 104
Investment in Equity Shares - unquotedSterlite Power Transmission Limited - 9,52,859 equity shares of ` 2 each (including 12 shares held jointly with nominees)
11 11
Other Investments 0 0 (II) Investments at fair value through profit and loss
Investment in structured instrument - Unquoted (Refer note 38) - 4,772 Investment in Bonds - Quoted- Infrastructure Leasing & Financial Services Limited 50 -
(III) Investment in Equity Shares (fully paid)Associate Companies – UnquotedGaurav Overseas Private Limited - 3,23,000 equity shares of ` 10 each 0 0 RoshSkor Township (Proprietary) Limited- 50 equity shares of NAD 1 each 4 4 Joint ventures – UnquotedRampia Coal Mines and Energy Private Limited - 2,72,29,539 equity shares of ` 1 each 3 3 Madanpur South Coal Company Limited - 1,14,421 equity shares of ` 10 each 2 2 Goa Maritime Private Limited: 5,000 equity shares of ` 10 each 0 0 Rosh Pinah Health Care (Proprietary) Limited-69 equity shares of NAD 1 each 0 0 Less: Impairment in the value of investment in joint ventures (5) (5)Total 95 4,891
a) ParticularsAs at
March 31, 2020 As at
March 31, 2019
Aggregate amount of quoted investments, and market value thereof 80 104 Aggregate amount of unquoted investments 20 4,792 Aggregate amount of impairment in the value of investments (5) (5)Total 95 4,891
INTEGRATED REPORT MANAGEMENT REVIEW STATUTORY REPORTS FINANCIAL STATEMENTS
06-115 116-167 168-270 271-502

428 VEDANTA LIMITED INTEGRATED REPORT AND ANNUAL ACCOUNTS 2019-20 VEDANTA LIMITED INTEGRATED REPORT AND ANNUAL ACCOUNTS 2019-20 429
CONSOLIDATED NOTES FORMING PART OF THE FINANCIAL STATEMENTSas at and for the year ended March 31, 2020
CONSOLIDATED NOTES FORMING PART OF THE FINANCIAL STATEMENTSas at and for the year ended March 31, 2020
B) Current Investment (` in Crore)
ParticularsAs at
March 31, 2020As at
March 31, 2019
Investments carried at fair value through profit and loss (fully paid)Investment in mutual funds - quoted 5,149 7,782 Investment in mutual funds - unquoted 7,597 7,010 Investment in bonds - quotedb 11,911 13,276 Investment in India Grid trust - quotedb 1 106 Total 24,658 28,174
a) ParticularsAs at
March 31, 2020As at
March 31, 2019
Aggregate amount of quoted investments, and market value thereof 17,061 21,164 Aggregate amount of unquoted investments 7,597 7,010 Total 24,658 28,174
b)� Includes investment in related parties ` 101 Crore (March 31, 2019: ` 329 Crore). Refer note 38.
8. FINANCIAL ASSETS - TRADE RECEIVABLES(` in Crore)
ParticularsAs at March 31, 2020 As at March 31, 2019
Non-current Current Total Non-current Current Total
Unsecured 3,658 2,720 6,378 4,219 4,020 8,239 Less: Provision for expected credit loss (547) (23) (570) (531) (38) (569)Total 3,111 2,697 5,808 3,688 3,982 7,670
a)� The interest free credit period given to customer is up to 90 days. Also refer note 22C(d)
b)� For amount due and terms and conditions of related party receivables refer note 38.
c)� �In July 2017, the Appellate Tribunal for Electricity dismissed the appeal filed by one of the Group’s subsidiaries, Talwandi Sabo Power Limited (TSPL) with respect to the interpretation of how the calorific value of coal and costs associated with it should be determined. However, APTEL had allowed payment of shunting and unloading charges. TSPL filed an appeal before the Honourable Supreme Court (SC), which by an order dated March 07, 2018 has decided the matter in favour of TSPL. PSPCL has not paid the due amount as per the direction of the Supreme court. Therefore, TSPL filed its contempt petition before the SC. On August 07, 2019, SC has passed order in the contempt petition in favour of TSPL and ordered PSPCL to pay the due amount in 8 weeks. PSPCL has paid ` 1,002 Crore during the current financial year. PSPCL has filed an application in Supreme Court on October 10, 2019 seeking direction to designate an appropriate authority for arriving at the final amount as per its order. On November 25, 2019 the application has been dismissed and SC directed PSPCL to pay the remaining amount within 12 weeks (i.e. by February 17, 2020). On February 13, 2020, PSPCL has filed a miscellaneous application seeking additional time for compliance of order dated November 25, 2019. TSPL has also filed a second contempt petition on November 13, 2019 in Supreme Court regarding the remaining amount receivable from PSCPL. PSPCL has filed counter affidavit in reply to the second contempt petition. TSPL has filed rejoinder to the counter affidavit on February 24, 2020 and the next date of hearing has been deferred due to the lockdown pursuant to Covid-19. The outstanding dues (included in trade receivables above) and interest receivable (included in Note 11) in relation to this dispute as at 31 March 2020 is ` 247 Crore (March 31, 2019: ` 1,135 Crore) and ` 139 Crore (March 31, 2019: NIL) respectively.
� �In another matter relating to assessment of whether there has been a change in law following the execution of the Power Purchase Agreement, the Appellate Tribunal for Electricity has dismissed the appeal in July 2017 filed by TSPL. TSPL filed an appeal before the Honourable Supreme Court to seek relief which is yet to be listed. The outstanding trade receivables in relation to this dispute and other matters is ` 1,298 Crore as at 31 March 2020
(31 March 2019: ` 1,065 Crore). The Group, based on external legal opinion and its own assessment of the merits of the case, remains confident that it is highly probable that the Supreme court will uphold TSPL’s appeal and has thus continued to treat these balances as recoverable.� � � � �
� �Additionally, As at March 31, 2018, ` 767 Crore was outstanding on account of certain disputes relating to computation of tariffs and differential revenues recognised with respect to tariffs pending finalisation by the Odisha State Regulatory Commission. During FY 2018-19 the said disputes were settled and minuted. However, the customer has raised certain claims on the Company in respect of short supply of power for which a provision of ` 218 Crore has been made. Pending ratification of aforesaid minutes by Odisha Electricity Regulatory Commission (OERC) and adjudication on certain issues related to the claim, the customer has withheld ` 1,349 Crore, which the Company is confident of recovering. Hearing on the subject matter (PPA Amendment Case) has been completed in October 2019 and the order has been reserved.
d)� �The total trade receivables as at April 01, 2018 were ` 5,316 Crore (net of provision for expected credit loss).
9. FINANCIAL ASSETS - LOANS(` in Crore)
ParticularsAs at March 31, 2020 As at March 31, 2019
Non-current Current Total Non-current Current Total
Unsecured, considered goodLoans to related parties 4 80 84 5 74 79 Loans to employees 1 5 6 1 8 9 Security Deposit 12 - 12 14 - 14 Total 17 85 102 20 82 102
10. FINANCIAL ASSETS - OTHERS(` in Crore)
ParticularsAs at March 31, 2020 As at March 31, 2019
Non-current Current Total Non-current Current Total
Bank deposits a,b 754 - 754 23 - 23 Site Restoration assetb 617 - 617 546 - 546 Unsecured, considered goodReceivables from related parties (Refer note 38)
- 115 115 - 47 47
Security deposits 157 28 185 165 23 188 OthersAdvance recoverable (oil and gas business)
- 1,371 1,371 - 2,166 2,166
Othersc 995 892 1,887 349 246 595 Unsecured, considered credit impairedSecurity deposits 42 1 43 42 1 43 Balance with government authorities - 2 2 - 18 18 Othersc,d 444 477 921 - 415 415 Less: Provision for expected credit loss (486) (480) (966) (42) (434) (476)Total 2,523 2,406 4,929 1,083 2,482 3,565
a)� �Bank deposits includes fixed deposit with maturity more than twelve months of ` 25 Crore (March 31, 2019: ` 20 Crore) under lien with bank and margin money of ` 5 Crore (March 31, 2019: ` 2 Crore).� � � � � �
b)� �Bank deposits and site restoration asset earns interest at fixed rate based on respective deposit rate.�� � � � �
c)� �Others include claims receivables. It also includes advance profit petroleum of ` 322 Crore (March 31, 2019: ` 297 Crore) (Refer note 41(c)).�� � � � �
d)� �A parcel of land amounting to ` 349 Crore relating to Iron Ore business has been reclassified during the year, due to existing litigation, from Property, plant and equipment and later provided for (Refer note 33).
INTEGRATED REPORT MANAGEMENT REVIEW STATUTORY REPORTS FINANCIAL STATEMENTS
06-115 116-167 168-270 271-502

430 VEDANTA LIMITED INTEGRATED REPORT AND ANNUAL ACCOUNTS 2019-20 VEDANTA LIMITED INTEGRATED REPORT AND ANNUAL ACCOUNTS 2019-20 431
CONSOLIDATED NOTES FORMING PART OF THE FINANCIAL STATEMENTSas at and for the year ended March 31, 2020
CONSOLIDATED NOTES FORMING PART OF THE FINANCIAL STATEMENTSas at and for the year ended March 31, 2020
11. OTHER ASSETS(` in Crore)
ParticularsAs at March 31, 2020 As at March 31, 2019
Non-current Current Total Non-current Current Total
Unsecured, considered good Capital advances 1,230 - 1,230 2,132 - 2,132 Advances other than capital advancesSecurity deposits 0 - 0 0 - 0 Advances for supplies to related party - 21 21 - 558 558 Advances for supplies - 1,400 1,400 - 1,348 1,348 OthersBalance with government authorities a 553 976 1,529 521 739 1,260 Leasehold land prepayments b - - - 431 14 445 Others c 1,547 741 2,288 1,134 796 1,930 Unsecured, considered doubtfulCapital advances d 208 - 208 12 - 12 Advance for supplies - 48 48 - 48 48 Balance with government authorities 3 - 3 3 - 3 Others c 602 5 607 390 5 395 Less: Provision for doubtful advances (813) (53) (866) (405) (53) (458)Total 3,330 3,138 6,468 4,218 3,455 7,673
(a) ��Includes ` 58 Crore (March 31, 2019: ` 58 Crore), being Company’s share of gross amount of ` 86 crore (March 31, 2019: ` 86 Crore) paid under protest on account of Education Cess and Secondary Higher Education Cess for the year ended 2013-14.
b) �Represents prepayments in respect of land taken under operating leases, were being amortised equally over the period of the lease. The same has been accounted for as a ROU asset post adoption of Ind AS 116 in the current year.
c) �Others include claim receivables, advance recoverable (oil and gas business), prepaid expenses and export incentive receivables. This also includes amounts receivable from KCM (Refer note 33).
d) �During the year, an impairment charge of ` 196 Crore has been recognised relating to copper business (Refer note 33 (c)).�
12. INVENTORIES(` in Crore)
ParticularsAs at
March 31, 2020As at
March 31, 2019
Raw materials 2,013 3,860 Goods-in transit 1,010 1,732
Work-in-progress 3,319 2,481 Goods-in transit 4 46
Finished good 1,222 1,329 Goods-in transit 48 109
Fuel stock 1,386 1,080 Goods-in transit 352 652
Stores and spares 1,955 1,838 Goods-in transit 26 71 Total 11,335 13,198
(a) �Inventory held at net realisable value ` 2,358 Crore (March 31, 2019: ` 3,760 Crore) as at March 31, 2020.
b) �The write down of inventories amounting to ` 118 Crore (March 31, 2019: ` 172 Crore) has been charged to the consolidated statement of profit and loss during the year.
c) For method of valuation for each class of inventories, refer Note 3(a)(L).
13. CASH AND CASH EQUIVALENTS(` in Crore)
ParticularsAs at
March 31, 2020As at
March 31, 2019
Balances with banks 2,392 4,236 Bank deposits with original maturity of less than 3 months (including interest accrued thereon) a,b
2,725 3,052
Cash on Hand 0 1 Total 5,117 7,289
(a) Bank deposits include restricted funds of ` 57 Crore (March 31, 2019: ` 60 Crore) held as collateral in respect of closure costs.
b) �Bank deposits earns interest at fixed rate based on respective deposit rate.� � � � � �
c) �Cash and cash equivalents for the purpose of Statement of Cash Flows comprise the following:�
(` in Crore)
ParticularsAs at
March 31, 2020As at
March 31, 2019
Cash and cash equivalents as above 5,117 7,289 Earmarked unpaid dividend accounts (Refer Note 14) 94 96 Total 5,211 7,385
14. OTHER BANK BALANCES(` in Crore)
ParticularsAs at
March 31, 2020As at
March 31, 2019
Bank deposits with original maturity of more than 3 months but less than 12 months (including interest accrued thereon) a
7,249 845
Bank deposits with original maturity of more than 12 months (including interest accrued thereon)b,c
40 131
Earmarked unpaid dividend accounts e 94 96 Earmarked escrow account f 2 8 Total 7,385 1,080
(a) �The above bank deposits includes ` 256 Crore (March 31, 2019: ` 591 Crore) on lien with banks and margin money of ` 99 Crore (March 31, 2019: ` 134 Crore).
b) Includes ` 40 Crore (March 31, 2019: ` NIL) margin money with banks.
c) �Restricted funds of Nil (March 31, 2019: ` 127 Crore) held as interest reserve created against interest payment on loans from banks.
d) Bank deposits earn interest at fixed rate based on respective deposit rate.
e) Earmarked unpaid dividend accounts are restricted in use as it relates to unclaimed dividends or unpaid dividend.
f) �Earmarked escrow account includes amount restricted in use as it relates to unclaimed redeemable preference shares.�� � � � �
INTEGRATED REPORT MANAGEMENT REVIEW STATUTORY REPORTS FINANCIAL STATEMENTS
06-115 116-167 168-270 271-502

432 VEDANTA LIMITED INTEGRATED REPORT AND ANNUAL ACCOUNTS 2019-20 VEDANTA LIMITED INTEGRATED REPORT AND ANNUAL ACCOUNTS 2019-20 433
CONSOLIDATED NOTES FORMING PART OF THE FINANCIAL STATEMENTSas at and for the year ended March 31, 2020
CONSOLIDATED NOTES FORMING PART OF THE FINANCIAL STATEMENTSas at and for the year ended March 31, 2020
15. SHARE CAPITAL
Particulars
As at March 31, 2020 As at March 31, 2019Number
(in Crore)Amount
(` in Crore)Number
(in Crore)Amount
(` in Crore)
A. Authorised equity share capitalOpening and Closing balance [equity shares of ` 1 each with voting rights]
4,402 4,402 4,402 4,402
Authorised preference share capitalOpening and closing balance (preference shares of ` 10 each)a
301 3,010 301 3,010
B. Issued, subscribed and paid upEquity shares of ` 1/- each with voting rights b,c 372 372 372 372
372 372 372 372
a) �Redeemable Preference Shares of ` 3,010 Crore were redeemed on October 27, 2018 i.e. 18 months from the date of allotment as per the scheme of amalgamation of Cairn India Limited with Vedanta Limited. An equivalent amount of ` 3,010 Crore had been transferred from general reserve to preference share redemption reserve.� � � � � �
b) �Includes 3,08,232 (March 31, 2019: 3,08,232) equity shares kept in abeyance. These shares are not part of listed equity capital and pending allotment as they are sub-judice.� � � � � �
c) �Includes 1,43,78,261 (March 31, 2019: 1,49,98,702) equity shares held by Vedanta Limited ESOS Trust (Refer Note 16).
C. Shares held by the Ultimate holding company and its subsidiaries*
Particulars
As at March 31, 2020 As at March 31, 2019No. of
Shares held (in Crore)
% of holding
No. of Shares held
(in Crore) % of
holding
Twin Star Holdings Limited 128.01 34.44 128.01 34.44 Twin Star Holdings Limited(2) 9.93 2.67 9.93 2.67 Finsider International Company Limited 40.15 10.80 40.15 10.80 Westglobe Limited 4.43 1.19 4.43 1.19 Welter Trading Limited 3.82 1.03 3.82 1.03 Total 186.34 50.13 186.34 50.13
* The % of holding has been calculated on the issued and subscribed share capital as at the respective balance sheet date.
(1) All the above entities are subsidiaries of Volcan Investments Limited, the ultimate holding Company.
(2) Represented by 2,48,23,177 American Depository Shares (“ADS”).
D. Aggregate number of bonus shares issued, shares issued for consideration other than cash and shares bought back during the period of five years immediately preceding the reporting date
(` in Crore)
ParticularsAs at
March 31, 2020As at
March 31, 2019
Equity shares issued pursuant to Scheme of Amalgamation (in FY 2017-18) 75 75 Preference shares issued pursuant to Scheme of Amalgamation (in FY 2017-18)* 301 301
* These were redeemed on October 27, 2018.
E. Details of shareholders holding more than 5% shares in the Company *
Particulars
As at March 31, 2020 As at March 31, 2019No. of
Shares held (in Crore)
% of holding
No. of Shares held
(in Crore) % of
holding
Twin Star Holdings Limited 128.01 34.44 128.01 34.44 Twin Star Holdings Limited # 9.93 2.67 9.93 2.67 Finsider International Company Limited 40.15 10.80 40.15 10.80 ICICI Prudential Equity Arbitrage Fund 18.69 5.03 18.36 4.94 Life Insurance Corporation of India 23.67 6.37 23.66 6.37
# 2,48,23,177 ADS, held by CITI Bank N.A. New York as a depository.� � � � � �
* The % of holding has been calculated on the issued and subscribed share capital as at respective balance sheet date. As per the records of the Company, including its register of shareholders/members, the above shareholding represents legal ownership of shares.
F. Other disclosures
(i) �The Company has one class of equity shares having a par value of ` 1 per share. Each shareholder is eligible for one vote per share held and dividend as and when declared by the Company. The dividend proposed by the Board of Directors is subject to the approval of the shareholders in the ensuing Annual General Meeting, except in case of interim dividend which is paid as and when declared by the Board of Directors. In the event of liquidation of the Company, the holders of equity shares will be entitled to receive any of the remaining assets of the Company, after distribution of all preferential amounts, in proportion to their shareholding.
ii) �The Company had one class of 7.5% non-cumulative redeemable preference shares having a par value of ` 10 per share. Each preference shareholder is eligible for one vote per share as per terms of Section 47(2) of the Companies Act 2013 and dividend as and when declared by the Company. As per the terms of preference shares, these shares are redeemable at par on expiry of 18 months from the date of their allotment. In the event of winding up of Vedanta Limited, the holders of Preference Shares shall have a right to receive repayment of capital paid up and arrears of dividend, whether declared or not, up to the commencement of winding up, in prioirty to any payment of capital on the equity shares out of the surplus of Vedanta Limited
iii) �ADS shareholders do not have right to attend General meetings in person and also do not have right to vote. They are represented by depository, CITI Bank N.A. New York. As at March 31, 2020 - 26,17,80,208 equity shares were held in the form of 6,54,45,052 ADS (March 31, 2019 - 24,87,79,452 equity shares were held in the form of 6,21,94,863 ADS).
iv) �In terms of Scheme of Arrangement as approved by the Hon’ble High Court of Judicature at Mumbai, vide its order dated April 19, 2002, the erstwhile Sterlite Industries (India) Limited (merged with the Company during 2013-14) during 2002-2003 reduced its paid up share capital by ` 10 Crore. There are 2,01,711 equity shares (March 31, 2019: 2,01,305 equity shares) of ` 1 each pending clearance from NSDL. The Company has filed an application in Hon’ble High Court of Mumbai to cancel these shares, the final decision on which is pending. Hon’ble High Court of Judicature at Mumbai, vide its interim order dated September 06, 2002 restrained any transaction with respect to subject shares.
16. OTHER EQUITY (REFER STATEMENT OF CHANGES IN EQUITY)a) General reserve: Under the erstwhile Companies Act 1956, a general reserve was created through an annual
transfer of net income at a specified percentage in accordance with applicable regulations. The purpose of these transfers was to ensure that if a dividend distribution in a given year is more than 10.0% of the paid-up capital of the Company for that year, then the total dividend distribution is less than the total distributable reserves for that year. Consequent to introduction of Companies Act 2013, the requirement to mandatory transfer a specified percentage of the net profit to general reserve has been withdrawn.
b) Debenture redemption reserve: As per the earlier provision under the Indian Companies Act, companies that issue debentures were required to create debenture redemption reserve from annual profits until such debentures are redeemed. Companies are required to maintain 25% as a reserve of outstanding redeemable debentures.
�The amounts credited to the debenture redemption reserve may not be utilised except to redeem debentures. The MCA vide its Notification dated August 16, 2019, had amended the Companies (Share Capital and Debenture) Rules, 2014, wherein the requirement of creation of Debenture Redemption Reserve has been exempted for certain class of companies, hence, in view of the same, Vedanta Limited is not required to create Debenture Redemption Reserve.
INTEGRATED REPORT MANAGEMENT REVIEW STATUTORY REPORTS FINANCIAL STATEMENTS
06-115 116-167 168-270 271-502

434 VEDANTA LIMITED INTEGRATED REPORT AND ANNUAL ACCOUNTS 2019-20 VEDANTA LIMITED INTEGRATED REPORT AND ANNUAL ACCOUNTS 2019-20 435
CONSOLIDATED NOTES FORMING PART OF THE FINANCIAL STATEMENTSas at and for the year ended March 31, 2020
CONSOLIDATED NOTES FORMING PART OF THE FINANCIAL STATEMENTSas at and for the year ended March 31, 2020
c) Preference share redemption reserve: The Companies Act, 2013 provides that companies that issue preference shares may redeem those shares from profits of the Company which otherwise would be available for dividends, or from proceeds of a new issue of shares made for the purpose of redemption of the preference shares. If there is a premium payable on redemption, the premium must be provided for, either by reducing the additional paid in capital (securities premium account) or net income, before the shares are redeemed. If profits are used to redeem preference shares, the value of the nominal amount of shares redeemed should be transferred from profits (retained earnings) to the preference share redemption reserve account. This amount should then be utilised for the purpose of redemption of redeemable preference shares. This reserve can be used to issue fully paid-up bonus shares to the shareholders of the Company. During the previous year, on redemption of preference shares, ` 3,010 Crore has been transferred from General reserve to Preference share redemption reserve.
d) Capital reserve: The balance in capital reserve has mainly arisen pursuant to extinguishment of non-controlling interests of erstwhile Cairn India Limited and acquisition of ASI. Further, changes in capital reserve are due to recognition/derecognition of put option liability and non controlling interests pertaining to ASI.
e) �Legal reserve is created at Fujairah Gold FZC in accordance with free zone regulations.
f) �Treasury share represents 1,43,78,261 (March 31, 2019: 1,49,98,702) equity shares (face value of ` 1 each) of the Company purchased by Vedanta Limited ESOP Trust pursuant to the Company’s stock option scheme as detailed in note 29.
17. NON-CONTROLLING INTERESTS (NCI) The Non-controlling interests that are material to the Group relate to Hindustan Zinc Limited (HZL) and Bharat Aluminium Company Limited (“BALCO”).� � � � � � � � � �
As at March 31, 2020, NCIs hold an economic interest by virtue of their shareholding of 35.08%, 49.00%, 26.00%, 48.37% and 4.51% in Hindustan Zinc Limited (HZL), Bharat Aluminium Company Limited (BALCO), Black Mountain Mining (BMM), Avanstrate Inc. (ASI) and Electrosteel Steels Limited (ESL) respectively (Refer Note 4(c)). As at March 31, 2019 NCIs hold an economic interest by virtue of their shareholding of 35.08%, 49.00%, 26.00% ,48.37% and 10.00% in HZL, BALCO, BMM, ASI and Electrosteel Steels Limited (ESL) respectively.�
The principal place of business of HZL, BALCO and ESL is in India, that of BMM is in South Africa, that of Avanstrate Inc. is in Japan, South Korea and Taiwan.�
The table below shows summarised financial information of subsidiaries of the Group that have non-controlling interests. The amounts are presented before inter-company elimination.
ParticularsAs at March 31, 2020
HZL BALCO Others Total
Non-current assets 22,665 12,617 9,963 45,245 Current assets 24,815 2,724 3,389 30,928 Non-current liabilities 1,306 4,201 7,380 12,887 Current liabilities 5,413 6,229 3,155 14,797 Equity attributable to owners of the Group 26,462 2,505 2,807 31,774 Non-controlling interests* 14,299 2,406 407 17,112
*` 397 Crore loss attributable to NCI of ASI transferred to put option liability. Refer note 21.�
ParticularsAs at March 31, 2019
HZL BALCO Others Total
Non-current assets 21,427 12,965 11,166 45,558 Current assets 21,575 2,728 3,461 27,764 Non-current liabilities 1,168 4,686 8,363 14,217 Current liabilities 7,744 5,928 1,986 15,658 Equity attributable to owners of the Group 22,131 2,591 3,571 28,293 Non-controlling interests* 11,959 2,488 780 15,227
*` 73 Crore loss attributable to NCI of ASI transferred to put option liability. Refer note 21.
ParticularsAs at March 31, 2020
HZL BALCO Others Total
Revenue 20,499 8,926 7,170 36,595 Profit/ (loss) after tax for the year 6,771 (171) (846) 5,754 Profit/ (loss) attributable to the equity shareholders of the Company
4,396 (87) (475) 3,834
Profit/ (loss) attributable to the non-controlling interests 2,375 (84) (371) 1,920 Other comprehensive income during the year (100) 4 (299) (395)Other comprehensive income attributable to the equity shareholders of the Company
(65) 2 (209) (272)
Other comprehensive income attributable to non-controlling interests
(35) 2 (90) (123)
Total comprehensive income during the year 6,671 (167) (1,145) 5,359 Total comprehensive income attributable to the equity shareholders of the Company
4,331 (85) (684) 3,562
Total comprehensive income attributable to non-controlling interests
2,340 (82) (461) 1,797
Dividends paid/payable to non-controlling interests, including dividend tax
- - - -
Net cash inflow from operating activities 6,957 155 2,568 9,680 Net cash outflow from investing activities (3,154) (339) (3,000) (6,493)Net cash (outflow)/ inflow from financing activities (1,928) 13 3 (1,912)Net cash inflow/(outflow) 1,875 (171) (429) 1,275
ParticularsAs at March 31, 2019
HZL BALCO Others Total
Revenue 22,909 10,554 6,482 39,945 Profit/ (loss) after tax for the year 7,892 (96) 128 7,924 Profit/ (loss) attributable to the equity shareholders of the Company
5,123 (49) 217 5,291
Profit/ (loss) attributable to the non-controlling interests 2,769 (47) (89) 2,633 Other comprehensive income during the year (94) (36) (307) (437)Other comprehensive income attributable to the equity shareholders of the Company
(61) (18) (230) (309)
Other comprehensive income attributable to non-controlling interests
(33) (18) (77) (128)
Total comprehensive income during the year 7,798 (132) (181) 7,485 Total comprehensive income attributable to the equity shareholders of the Company
5,062 (67) (15) 4,980
Total comprehensive income attributable to non-controlling interests
2,736 (65) (166) 2,505
Dividends paid/payable to non-controlling interests, including dividend tax
3,574 - - 3,574
Net cash inflow from operating activities 8,781 2,061 1,428 12,270 Net cash outflow from investing activities (1,092) (574) (1,903) (3,569)Net cash (outflow)/ inflow from financing activities (9,630) (1,155) 671 (10,114)Net cash inflow/(outflow) (1,941) 332 196 (1,413)
The effect of changes in ownership interests in subsidiaries that did not result in a loss of control is as follows:
ParticularsAs at March 31, 2020
HZL BALCO Others Total
Changes in NCI - - (234) (234)
ParticularsAs at March 31, 2019
HZL BALCO Others Total
Changes in NCI - - - -
INTEGRATED REPORT MANAGEMENT REVIEW STATUTORY REPORTS FINANCIAL STATEMENTS
06-115 116-167 168-270 271-502

436 VEDANTA LIMITED INTEGRATED REPORT AND ANNUAL ACCOUNTS 2019-20 VEDANTA LIMITED INTEGRATED REPORT AND ANNUAL ACCOUNTS 2019-20 437
CONSOLIDATED NOTES FORMING PART OF THE FINANCIAL STATEMENTSas at and for the year ended March 31, 2020
CONSOLIDATED NOTES FORMING PART OF THE FINANCIAL STATEMENTSas at and for the year ended March 31, 2020
18. CAPITAL MANAGEMENTThe Group’s objectives when managing capital is to safeguard continuity, maintain a strong credit rating and healthy capital ratios in order to support its business and provide adequate return to shareholders through continuing growth. The Group’s overall strategy remains unchanged from previous year.
The Group sets the amount of capital required on the basis of annual business and long-term operating plans which include capital and other strategic investments.
The funding requirements are met through a mixture of equity, internal fund generation and borrowings. The Group’s policy is to use current and non-current borrowings to meet anticipated funding requirements.
The Group monitors capital on the basis of the net gearing ratio which is Net debt / Total Capital (equity + net debt) . The Group is not subject to any externally imposed capital requirements.
Net debt are non-current and current debt as reduced by cash and cash equivalents, other bank balances and current investments. Equity comprises all components including other comprehensive income.
The following table summarises the capital of the Group:
(` in Crore except otherwise stated)
ParticularsAs at
March 31, 2020As at
March 31, 2019
Cash and cash equivalents (Note 13) 5,117 7,289 Other bank balances (Note 14) 7,385 1,080 Non-current Bank deposits (Note 10) 754 23 Current investments (Note 7B) 24,658 28,174 Structured investment net of related liabilities (Note 38) - 2,702 Total (a) 37,914 39,268 Non-current borrowings (Note 19) 36,724 34,721 Current borrowings (Note 19) 13,076 22,982 Current maturities of long term debt (Note 21) 9,387 8,523 Total (b) 59,187 66,226 Net debt (c=(b-a)) 21,273 26,958 Total equity (d) 71,747 77,524 Total capital (e = equity + net debt) 93,020 1,04,482 Gearing ratio (times) (c/e) 0.23 0.26
19. FINANCIAL LIABILITIES - BORROWINGSA) Non-current borrowings
(` in Crore)
ParticularsAs at
March 31, 2020As at
March 31, 2019
At amortised costSecuredNon-convertible debentures 16,387 14,072 Term loans from banks� - Rupee term loans 20,918 24,185 � - Foreign currency term loans 7,824 3,543 � - External commercial borrowings 611 653 Others 75 516 UnsecuredDeferred sales tax liability 77 87 Non-convertible bonds 146 126 Term loans from banks (Foreign currency) 71 60 Redeemable preference shares 2 2 Non-current borrowings (A) 46,111 43,244 Less: Current maturities of long term debt (Refer note 21(b)) (9,387) (8,523)Total non-current Borrowings (Net) 36,724 34,721 Current Borrowings (Refer Note 19B) 13,076 22,982 Total Borrowings (A+B) 59,187 66,226
B) Current borrowings(` in Crore)
ParticularsAs at
March 31, 2020As at
March 31, 2019
At amortised costSecuredProject buyers credit from banks - 16 Loans repayable on demand from banks 1 798 Working capital loan 513 42 Term loans from banks (Foreign currency) 1,041 - Amounts due on factoring 14 640 Others 1,884 41 UnsecuredLoans repayable on demand from banks 1,077 24 Commercial paper 7,524 18,456 Packing credit in foreign currencies from banks - 492 Working capital loan 918 1,690 Amounts due on factoring 16 718 Others 88 65 Total 13,076 22,982
The Group has discounted trade receivables on recource basis of ` 30 Crore (March 31, 2019: ` 1,358 Crore). Accordingly, the monies received on this account are shown as borrowings as the trade receivables do not meet de-recognition criteria.
INTEGRATED REPORT MANAGEMENT REVIEW STATUTORY REPORTS FINANCIAL STATEMENTS
06-115 116-167 168-270 271-502

438 VEDANTA LIMITED INTEGRATED REPORT AND ANNUAL ACCOUNTS 2019-20 VEDANTA LIMITED INTEGRATED REPORT AND ANNUAL ACCOUNTS 2019-20 439
CONSOLIDATED NOTES FORMING PART OF THE FINANCIAL STATEMENTSas at and for the year ended March 31, 2020
CONSOLIDATED NOTES FORMING PART OF THE FINANCIAL STATEMENTSas at and for the year ended March 31, 2020
a) Details of Non-convertible debentures issued by Group have been povided below (Carrying value) -(` in Crore)
ParticularsAs at
March 31, 2020As at
March 31, 2019
9.2% due February-2030 2,000 - 9.2% due December-2022 748 - 8.75% due June-2022 1,268 - 8.9% due December-2021 898 - 8.75% due September-2021 250 250 9.18% due July-2021 1,000 1,000 9.27% due July-2021 999 999 8.5% due June-2021 1,650 1,649 8.75% due April-2021 250 250 8.5% due April-2021 2,349 2,349 8.55% due April-2021 1,000 1,000 9% due November-2020* 150 200 8.25% due September-2020 425 425 7.85% due August-2020 500 500 9.45% due August-2020 2,000 2,000 7.9% due July-2020 300 300 8.7% due April-2020 600 600 7.95% due April-2020** - 300 7.8% due December-2020*** - 500 8% due June-2020** - 200 7.5% due November-2019 - 200 8.2% due November-2019 - 300 8.25% due October-2019 - 300 7.75% due September-2019 - 250 8.65% due September-2019 - 150 7.6% due May-2019 - 350 Total 16,387 14,072
* The debenture holders of these NCDs and the Company have put and call option at the end of 1 year from the respective date of the allotment of the NCDs.
** Put option was excercised by the NCD holders, basis which NCDs became due for repayment.
***Repaid during the year.
b) The Group has taken borrowings in various countries towards funding of its acquisitions, capital expenditure and working capital requirements. The borrowings comprise of funding arrangements from various banks and financial institutions taken by the parent and subsidiaries. The details of security provided by the Group in various countries, to various lenders on the asset of the parent and subsidiaries are as follows:
(` in Crore)
ParticularsAs at
March 31, 2020As at
March 31, 2019
Secured long-term borrowings 45,815 42,969 Secured short-term borrowings 3,453 1,537 Total 49,268 44,506
(` in Crore)
Facility Category Security detailsAs at
March 31, 2020As at
March 31, 2019
Working capital loans*
First pari passu charge on all rights, title, claim and benefit in all the whole of the current assets of Vedanta Limited, both present and future, including stock and raw material, stock in process, semi finished and finished goods, stores and spares not relating to plant and machinery (consumable stores and spares)
1 -
First pari passu charge on current assets of Vedanta Limited 3 - Secured by hypothecation of inventory of Vedanta Limited including other movables like book debts and bills outstanding
11 -
Secured by receivables on sale of crude oil of Vedanta Limited 11 - Secured by hypothecation of stock of raw materials, work-in-progress, semi-finished, finished products, consumable stores and spares, bills receivables, book debts and all other movables, both present and future in BALCO. The charges rank pari passu among banks under the multiple banking arrangements, for fund based facilities
255 83
Secured by a first pari passu charge on all present and future inventories, book debts and all other current assets of TSPL
247 280
Other secured working capital loans - 1,117 External Commercial Borrowings
The facility is secured by first pari passu charge on all movable property, plant and equipments related to power plants and aluminium smelters of BALCO located at Korba both present and future along with secured lenders
335 309
The facility is secured by first pari passu charge on all movable project assets related to 1200 MW power project and 3.25 LTPA smelter project both present and future along with secured lenders at BALCO
276 344
Non-Convertible Debentures
First pari passu charge over the immovable property (excluding of leasehold land and coal block assets) of BALCO. First pari passu charge on the hypothecated assets (excluding current assets) of BALCO.�
300 500
Secured by way of first pari passu charge on the specific movable and/or immovable Fixed Assets of VGCB, as may be identified and notified by the Issuer to the Security Trustee from time to time, with minimum asset coverage of 1 time of the aggregate face value of Bonds outstanding at any point of time.
425 425
Secured by the whole of the movable fixed assets of (i) Alumina Refinery having output of 1 MTPA along with co-generation captive power plant with an aggregate capacity of 90 MW at Lanjigarh, Odisha and (ii) Aluminium Smelter having output of 1.6 MTPA along with 1215 (9*135) MW CPP at Jharsuguda, Odisha.
4,914 -
Secured by way of “movable fixed assets” in relation to the 1.6 MTPA Aluminium Smelter alongwith 1215 MW (135MW * 9) captive power plant located in Jharsuguda and 1 MTPA Alumina Refinery alongwith 90 MW Co-generation power plant located at Lanjigarh in Odisha State and shall include all present movable plant and machinery, machinery spares, tools and accessories, fixtures, mechanical and electrical equipments, machinery and all other movable fixed assets and all estate, right, title, interest, property, claims and demands whatsoever in relation to assets.�
2,000 2,000
Secured by a first pari passu charge on the whole of the present and future of the movable fixed assets of 2400 MW (600 MW*4) Power Plant of Vedanta Limited at Jharsuguda location.
3,998 3,998
INTEGRATED REPORT MANAGEMENT REVIEW STATUTORY REPORTS FINANCIAL STATEMENTS
06-115 116-167 168-270 271-502

440 VEDANTA LIMITED INTEGRATED REPORT AND ANNUAL ACCOUNTS 2019-20 VEDANTA LIMITED INTEGRATED REPORT AND ANNUAL ACCOUNTS 2019-20 441
CONSOLIDATED NOTES FORMING PART OF THE FINANCIAL STATEMENTSas at and for the year ended March 31, 2020
CONSOLIDATED NOTES FORMING PART OF THE FINANCIAL STATEMENTSas at and for the year ended March 31, 2020
(` in Crore)
Facility Category Security detailsAs at
March 31, 2020As at
March 31, 2019
Non-Convertible Debentures
Secured by way of first ranking pari passu charge on movable fixed assets in relation to the Lanjigarh Refinery Expansion Project (having capacity beyond 2 MTPA and upto 6 MTPA) situated at Lanjigarh, Orissa. The Lanjigarh Refinery Expansion Project shall specifically exclude the 1 MTPA alumina refinery of Vedanta Limited along with 90 MW power plant in Lanjigarh and all its related capacity expansions.� � �
1,100 1,250
Secured by way of first pari passu charge on all present and future of the movable fixed assets of 2400 MW (600 MW*4) Power Plant of Vedanta Limited at Jharsuguda location, as may be identified and notified by the Issuer to the Security Trustee from time to time, with minimum asset coverage of 1 time of the aggregate face value of debentures outstanding at any point of time.� � �
1,000 1,000
Secured by first pari passu charge on movable and/or immovable fixed assets of TSPL with a minimum asset cover of 1 time during the tenure of NCD� � �
2,650 3,249
Other secured non-convertible debentures - 1,650 Term loans from banks (Includes rupee term loans and foreign currency term loans)
Secured by first pari passu charge on fixed assets of TSPL both present and future�
3,190 3,623
First pari passu charge by way of hypothecation/ equitable mortgage on the movable/ immovable assets of the Aluminium division of Vedanta Limited comprising of alumina refinery having output of 1 MTPA along with co-generation captive power plant with aggregate capacity of 90 MW at Lanjigarh, Odisha; aluminium smelter having output of 1.6 MTPA along with 1215 (9x135) MW CPP at Jharsuguda , Odisha, both present and future
3,384 5,102
Secured by a pari passu charge by way of hypothecation of all the movable fixed assets of Vedanta Limited pertaining to its Aluminium division project consisting of (i) alumina refinery having output of 1 MTPA (Refinery) along with co-generation captive power plant with aggregate capacity of 90 MW at Lanjigarh, Odisha (Power Plant); and (ii) aluminium smelter having output of 1.6 MTPA along with 1215 (9x135) MW CPP at Jharsuguda, Odisha (Smelter) (the Refinery, Power Plant and Smelter). Also, a first pari passu charge by way of equitable mortgage on the land pertaining to the mentioned project of aluminium division�
2,885 3,551
Secured by a pari passu charge by way of hypothecation on the movable fixed assets of the Lanjigarh Refinery Expansion Project including 210 MW Power Project. Lanjigarh Refinery Expansion Project shall specifically exclude 1 MTPA alumina refinery of the company along with 90 MW power plant in Lanjigarh and all its related expansions� � �
458 482
Secured by a pari-passu charge by way of hypothecation on the movable fixed assets of Vedanta Limited pertaining to its Aluminium division comprising of 1 mtpa alumina refinery plant with 90 MW captive power plant at Lanjigarh, Odisha and 1.6 MTPA aluminium smelter plant with 1215 MW captive power plant at Jharsuguda, Odisha� ��
1,379 1,734
First pari passu charge by way of hypothecation/ equitable mortgage on the movable/ immovable assets of the Aluminium division of Vedanta Limited comprising of alumina refinery having output of 1 MTPA along with co-generation captive power plant with an aggregate capacity of 90 MW at Lanjigarh, Odisha; aluminium smelter having output of 1.6 MTPA along with 1215 (9x135) MW CPP at Jharsuguda , Odisha and additional charge on Lanjigarh Expansion project, both present and future� �
1,137 1,184
(` in Crore)
Facility Category Security detailsAs at
March 31, 2020As at
March 31, 2019
Term loans from banks (Includes rupee term loans and foreign currency term loans)
Secured by a pari passu charge by way of hypothecation/equitable mortgage of the movable/immovable fixed assets of Vedanta Limited pertaining to its Aluminium division comprising of 1 MTPA alumina refinery plant with 90 MW captive power plant at Lanjigarh, Odisha and 1.6 MTPA aluminium smelter plant with 1215 MW captive power plant at Jharsuguda, Odisha
2,985 2,984
Secured by charge on Cairn Energy Hydrocarbons Limited’s (CEHL) all banks accounts, cash & investments, all receivables and current assets (but excluding any shares issued to CEHL by its subsidaries, all of its right, title and interest in and to Production Sharing Contract and all of its fixed assets of any nature)
3,692 2,624
Pledge of 49% of shares & other securities and rights to any claims held by THL Zinc Limited in and against BMM
404 415
The facility is secured by first pari passu charge on all movable property, plant and equipments related to power plants and aluminium smelters of BALCO located at Korba both present and future along with secured lenders
224 206
Secured by first pari passu charge on all present and future movable fixed assets including but not limited to plant & machinery ,spares, tools and accessories of BALCO by way of a deed of hypothecation.
1,293 -
Secured by first pari passu charge on all present and future movable fixed assets including but not limited to plant & machinery ,spares, tools and accessories of BALCO (excluding coal block assets ) by way of a deed of hypothecation.
1,615 968
First ranking pari passu charge by way of hypothecation/mortgage on all fixed/ immovable assets of Electrosteel Steels Limited but excluding any current assets or pledge over any shares
3,373 3,375
Secured by a pari passu charge on the whole of the movable fixed assets of 1.6 MTPA Aluminium smelter including 1215 MW power plant of Vedanta Limited situated at Jharsuguda and movable fixed assets of 1 MTPA Alumina refinery including 90 MW thermal power plant (operating capacity) situated at Lanjigarh, including movable plant and machinery, machinery spares, tools and accessories, condensers, generators, cooling systems, pumps, tanks, transformers and all other equipment’s, furniture, fittings, fixtures, vehicles and all other movable fixed assets both present and future
500 -
Secured by first pari passu charge by way of hypothecation over all the movable assets(save and except Current Assets) of Vedanta Limited, present or future, pertaining to Lanjigarh refinery expansion project beyond 1.7 MTPA to 6.0 MTPA located at Lanjigarh Odisha including but not limited to plant and machinery, machinery spares, tools and accessories in relation to aforementioned expansion project. Among others, the Lanjigarh Refinery Expansion Project shall specifically exclude the alumina refinery upto 1.7 MTPA of the company along with 90 MW power plant in Lanjigarh and all its related expansions
736 -
Secured by charge on investment of Vedanta Limited in INR bonds. 1,041 - Secured by first pari passu charge by way of whole of the movable fixed assets of (i) Alumina Refinery having output of 1 MTPA along with co-generation captive power plant with an aggregate capacity of 90MW at Lanjigarh, Odisha and (ii) Aluminium Smelter having output of 1.6 MTPA along with 1215 (9*135) MW CPP at Jharsuguda, Odisha.
1,487 -
Other secured term loans - 1,480
INTEGRATED REPORT MANAGEMENT REVIEW STATUTORY REPORTS FINANCIAL STATEMENTS
06-115 116-167 168-270 271-502

442 VEDANTA LIMITED INTEGRATED REPORT AND ANNUAL ACCOUNTS 2019-20 VEDANTA LIMITED INTEGRATED REPORT AND ANNUAL ACCOUNTS 2019-20 443
CONSOLIDATED NOTES FORMING PART OF THE FINANCIAL STATEMENTSas at and for the year ended March 31, 2020
CONSOLIDATED NOTES FORMING PART OF THE FINANCIAL STATEMENTSas at and for the year ended March 31, 2020
(` in Crore)
Facility Category Security detailsAs at
March 31, 2020As at
March 31, 2019
Others First charge by way of hypothecation on the entire stocks of raw materials, semi-finished and finished goods, consumable stores and spares and such other movables including book-debts, bills whether documentary or clean, outstanding monies, receivables and all other current assets of Vedanta limited, both present and future, ranking pari passu with other participating banks
1,146 -
First pari passu charge on all existing and future current assets of Vedanta Limited
68 -
Secured by way of hypothecation of stock of raw materials, work-in-progress, finished products, consumable stores and spares, bills receivables, book debts and all other movables, both present and future in BALCO. The charges rank pari passu among banks under the multiple banking arrangements, both for fund based and non fund based facilities.
179 41
Secured by Fixed asset (rare metals) of AvanStrate 566 516 Project buyers’ credit from banks
Other secured project buyer’s credit�� � - 16
Total 49,268 44,506
* Includes loans repayable on demand from banks, export packing credit from banks and amounts due on factoring.�
c) The Company facilities are subject to certain financial and non- financial convenants. The primary convenants which must be complied with include interest service coverage ratio, current ratio, debt service coverage ratio, total outside liabilities to total net worth, fixed assets coverage ratio, ratio of total term liabilities to net worth, debt to EBITDA ratio and return on fixed assets. The Group has complied with the covenants as per the terms of the loan agreement.
d) Terms of repayment of total borrowings outstanding as at March 31, 2020 are provided below -(` in Crore)
Borrowings
Weighted average interest rate as at March
31, 2020
Total carrying
value 1 year 1-3 years
3-5 years 5 years Remarks
Foreign Currency term Loan
4.49% 8,936 2,169 3,135 2,903 779 Repayable in 130 quarterly installments , 13 annual installments and one bullet payment
Rupee term loan 9.00% 20,918 3,839 6,081 4,795 6,256 Repayable in 724 quarterly installments, 3 half yearly installments and 2 bullet payments
External Commercial Borrowings
4.34% 611 217 396 - - Repayable in 8 annual installments for three external commercial borrowings
Non-convertible debentures
8.85% 16,387 3,975 10,420 - 2,000 Repayable in 17 bullet payments
Commercial paper 6.20% 7,524 7,524 - - - Repayable in 29 bullet paymentsWorking capital loan *
7.45% 2,509 2,509 - - - Export packing credit and loan repayable on demand is repayable within 1-6 months from the date of drawal, overdraft can be paid anytime as per the availability of business surplus during the validity of the facility and working capital loan is repayable in 5 bullet payment.
Amounts due on factoring
4.50% 30 30 - - - Repayable within one month
Deferred sales tax liability
NA 77 20 42 28 1 Repayable in 78 monthly installments
(` in Crore)
Borrowings
Weighted average interest rate as at March
31, 2020
Total carrying
value 1 year 1-3 years
3-5 years 5 years Remarks
Redeemable preference shares
NA 2 2 - - - The redemption and dividend paid to the preference shares unclaimed if any, is payable on claim.
Non-convertible bonds
0.00%** 146 - 7 28 111 Repayable in 10 annual installment starting from FY 2023-24
Others 7.09% 2,047 2,013 34 - - Suppliers credit is repayable within 6-12 months ,6 suppliers credit LC repayable in more than 12 months upto 36 months; Loan repayable within one year on demand and others repayable within one month
Total 59,187 22,299 20,115 7,754 9,147
The above maturity is based on the total principal outstanding gross of issue expenses and discounting impact of deferred sales tax liability.
*Includes loans repayable on demand from banks for 1,078 Crore and packing credit in foreign currency from banks.
** Increasing interest rate from 0.00% to 0.50% till maturity.
e) Terms of repayment of total borrowings outstanding as at March 31, 2019 are provided below -(` in Crore)
Borrowings
Weighted average interest rate as at March
31, 2019
Total carrying
value 1 year 1-3 years
3-5 years 5 years Remarks
Foreign Currency term Loan
3.96% 3,603 2,684 555 105 261 Repayable in 4 monthly installments, 44 quarterly installments, 13 annual installments
Rupee Term Loan 8.97% 24,185 3,694 7,452 4,630 8,497 Repayable in 757 quarterly installments, 5 installments payable in the gap of 5 months and 7 months, 2 half yearly installments and 2 bullet payments
External Commercial Borrowings
5.32% 653 90 463 104 - Repayable in 4 annual installments for three external commercial borrowings.
Non-convertible debentures
8.62% 14,072 2,049 12,025 - - Repayable in 21 bullet payments
Commercial paper 6.09% 18,456 18,456 - - - Repayable in 99 bullet paymentsWorking capital loan *
6.15% 3,046 3,046 - - - Export packing credit is repayable within 1-6 months from the date of drawal, cash credit can be repaid anytime as per the availability of business surplus during the validity of the facility and working capital loan is repayable in one bullet payment.
Project Buyers' credit from banks
3.51% 16 16 - - - Repayable in 15 bullet payments
Amounts due on factoring and Others (Current)
9.36% 1,464 1,464 - - - Repayable within 6 months
Deferred sales tax liability
NA 87 17 32 46 12 Repayable in 90 monthly installments
INTEGRATED REPORT MANAGEMENT REVIEW STATUTORY REPORTS FINANCIAL STATEMENTS
06-115 116-167 168-270 271-502

444 VEDANTA LIMITED INTEGRATED REPORT AND ANNUAL ACCOUNTS 2019-20 VEDANTA LIMITED INTEGRATED REPORT AND ANNUAL ACCOUNTS 2019-20 445
CONSOLIDATED NOTES FORMING PART OF THE FINANCIAL STATEMENTSas at and for the year ended March 31, 2020
CONSOLIDATED NOTES FORMING PART OF THE FINANCIAL STATEMENTSas at and for the year ended March 31, 2020
(` in Crore)
Borrowings
Weighted average interest rate as at March
31, 2019
Total carrying
value 1 year 1-3 years
3-5 years 5 years Remarks
Redeemable Preference shares
NA 2 2 - - - The redemption and dividend paid to the preference shares unclaimed if any, is payable on claim.
Non-convertible bonds
0.00%** 126 - - 6 406 Repayable in 10 annual installments
Other (Non-current) 5.00% 516 - 172 344 - Repayable in 6 Half yearly installments starting from April 2021.
Total 66,226 31,518 20,699 5,235 9,176
The above maturity is based on the total principal outstanding gross of issue expenses and discounting impact of deferred sales tax liability.
*Includes loans repayable on demand from banks for ` 822 Crore and packing credit in foreign currency from banks.
** Increasing interest rate from 0.00% to 0.50% till maturity.
f) Movement in borrowings during the year is provided below-(` in Crore)
ParticularsShort-term
borrowing Long-term borrowing* Total
Opening balance at 1 April 2018 21,951 36,207 58,158 Cash flow 624 7,075 7,699 Borrowings on acquisition through business combination 7 - 7 Other non-cash changes 43 40 83 Foreign exchange Currency Translation differences 357 (78) 279 As at 1 April 2019 22,982 43,244 66,226 Cash flow (11,188) 2,830 (8,358) Other non Cash Changes 1,211 (206) 1,005 Foreign exchange Currency Translation differences 71 243 314 As at 31 March 2020 13,076 46,111 59,187
*including current maturities of Long-term borrowing.
Other non-cash changes comprises of amortisation of borrowing costs, foreign exchange difference on borrowings.
20. FINANCIAL LIABILITIES - TRADE PAYABLES a
(` in Crore)
ParticularsAs at
March 31, 2020As at
March 31, 2019
Trade Payables 7,906 9,211 Trade Payables to related party 121 25 Operational buyers' credit / suppliers' creditc 8,945 8,116 Total 16,972 17,352
(a) Trade Payables are majorly non-interest bearing and are normally settled upto 180 days terms.
b) �For amount due and terms and conditions of related party payables refer note 38.
c) �Operational Buyers’ /Suppliers’ Credit is availed in foreign currency from offshore branches of Indian banks or foreign banks at an interest rate ranging from 2.5% to 4% per annum and in rupee from domestic banks at interest rate ranging from 8%-9% per annum. These trade credits are largely repayable within 180 days from the date of draw down. Operational Buyers’ credit availed in foreign currency is backed by Standby Letter of Credit issued under working capital facilities sanctioned by domestic banks. Part of these facilities are secured by first pari passu charge over the present and future current assets of the Group.�
21. FINANCIAL LIABILITIES - OTHERS(` in Crore)
ParticularsAs at March 31, 2020 As at March 31, 2019
Non-current Current Total Non-current Current Total
Liability for capital expenditure 811 5,910 6,721 52 6,011 6,063 Security deposits from vendors and others
- 202 202 11 162 173
Interest Accrued but not due 171 1,277 1,448 255 1,036 1,291 Put option liability with non-controlling interesta
247 - 247 195 - 195
Current maturities of long term debt b - 9,387 9,387 - 8,523 8,523 Unpaid/unclaimed dividend - 94 94 - 96 96 Profit petroleum payable - 689 689 - 1,025 1,025 Dues to related parties (Refer note 38) - 56 56 - 96 96 Lease liabilitiesd 203 457 660 - - - Liability for Structured Investment - - - 994 1,076 2,070 Other Liabilitiesc 69 3,090 3,159 62 4,263 4,325 Total 1,501 21,162 22,663 1,569 22,288 23,857
a) �The non-controlling shareholders of ASI have an option to o oad their shareholding to the Group. The option is exercisable at any time within the period of three years following the fifth anniversary of the date of shareholders’ agreement (December 22, 2017) at a price higher of ` 52 (US$ 0.757) per share and the fair market value of the share. Therefore, the liability is carried at higher of the two. Subsequent changes to the put option liability are treated as equity transaction and hence accounted for in equity.
b) Current maturities of long-term debt consist of:
(` in Crore)
ParticularsAs at
March 31, 2020As at
March 31, 2019
Deferred sales tax liability 20 17 Term loans from banks - Rupee term loans 3,829 3,681 -Foreign currency term loans 1,307 2,684 External commercial borrowings 217 90 Non-convertible debentures 3,971 2,049 Others 41 - Redeemable preference shares 2 2 Total 9,387 8,523
c) �Includes revenue received in excess of entitlement interest of ` 1,594 Crore (March 31, 2019: ` 2,878 Crore) and reimbursement of expenses, interest accrued on other than borrowings, liabilities related to claim etc.
d) Movement in Lease liabilites is as follows:(` in Crore)
At April 01, 2019 139 Additions during the year 1,021 Interest on Lease Liabilities 25 Payments made (316)Deletions (209)At March 31, 2020 660
INTEGRATED REPORT MANAGEMENT REVIEW STATUTORY REPORTS FINANCIAL STATEMENTS
06-115 116-167 168-270 271-502

446 VEDANTA LIMITED INTEGRATED REPORT AND ANNUAL ACCOUNTS 2019-20 VEDANTA LIMITED INTEGRATED REPORT AND ANNUAL ACCOUNTS 2019-20 447
CONSOLIDATED NOTES FORMING PART OF THE FINANCIAL STATEMENTSas at and for the year ended March 31, 2020
CONSOLIDATED NOTES FORMING PART OF THE FINANCIAL STATEMENTSas at and for the year ended March 31, 2020
22. FINANCIAL INSTRUMENTSA. Financial assets and liabilities:The accounting classification of each category of financial instruments, their carrying amounts and their fair values are set out below:�
As at March 31, 2020(` in Crore)
Financial Assets
Fair value through
profit or loss
Fair value through other
comprehensive income
Derivatives designated as hedging
instruments Amortised costTotal
carrying value Total fair value
Investments* 24,708 41 - - 24,749 24,749 Trade receivables 51 - - 5,757 5,808 5,808 Loans - - - 102 102 102 Other financial assets - - - 4,929 4,929 4,929 Derivatives 279 - 416 - 695 695 Cash and cash equivalents
- - - 5,117 5,117 5,117
Other bank balances - - - 7,385 7,385 7,385 Total 25,038 41 416 23,290 48,785 48,785
(` in Crore)
Financial Assets
Fair value through profit or
loss
Derivatives designated as hedging
instruments Amortised cost Others**Total carrying
value Total fair value
Borrowings - - 59,187 - 59,187 59,292 Trade payables 517 - 16,455 - 16,972 16,972 Derivatives 83 58 - - 141 141 Other financial liabilities*
- - 13,029 247 13,276 13,276
Total 600 58 88,671 247 89,576 89,681
*includes lease liability of ` 660 Crore as at March 31, 2020.
As at March 31, 2019(` in Crore)
Financial Assets
Fair value through
profit or loss
Fair value through other
comprehensive income
Derivatives designated as hedging
instruments Amortised costTotal
carrying value Total fair value
Investments* 32,946 115 - - 33,061 33,061 Trade receivables 227 - - 7,443 7,670 7,670 Loans - - - 102 102 102 Other financial assets - - - 3,565 3,565 3,565 Derivatives 30 - 48 - 78 78 Cash and cash equivalents
- - - 7,289 7,289 7,289
Other bank balances - - - 1,080 1,080 1,080 Total 33,203 115 48 19,479 52,845 52,845
(` in Crore)
Financial Assets
Fair value through profit or
loss
Derivatives designated as hedging
instruments Amortised cost Others**Total carrying
value Total fair value
Borrowings - - 66,226 - 66,226 66,185 Trade payables 1,064 - 16,288 - 17,352 17,352 Other financial liabilities
- - 15,139 195 15,334 15,334
Derivatives 543 7 - - 550 550 Total 1,607 7 97,653 195 99,462 99,421
* Investments exclude equity investment in associates and joint ventures which are accounted as per the equity method of accounting and hence not considered.
** Represents net put option liability with non-controlling interests accounted for at fair value. (Refer note 21).
B. Fair value hierarchyThe Group uses the following hierarchy for determining and disclosing the fair value of financial instruments by valuation technique:
(i) � Level 1: quoted prices (unadjusted) in active markets for identical assets or liabilities.
(ii) �Level 2: inputs other than quoted prices included within Level 1 that are observable for the asset or liability, either directly (i.e., as prices) or indirectly (i.e., derived from prices).
(iii) �Level 3: inputs for the asset or liability that are not based on observable market data (unobservable inputs)
The below table summarises the categories of financial assets and liabilities as at March 31, 2020 and March 31, 2019 measured at fair value:
As at March 31, 2020(` in Crore)
Financial Assets Level 1 Level 2 Level 3
At fair value through profit or lossInvestments 7,598 17,060 50 Derivative financial assets** - 279 - Trade receivables - 51 - At fair value through other comprehensive incomeInvestments 30 - 11 Derivatives designated as hedging instrumentsDerivative financial assets** - 416 - Total 7,628 17,806 61
(` in Crore)Financial liabilities Level 1 Level 2 Level 3
At fair value through profit or lossDerivative financial liabilities** - 83 - Trade payables - 517 - Derivatives designated as hedging instrumentsDerivative financial liabilities** - 58 - Other financial liabilities - Net put option liability with non-controlling interests accounted for at fair value. (Refer note 21).
- - 247
Total - 658 247
INTEGRATED REPORT MANAGEMENT REVIEW STATUTORY REPORTS FINANCIAL STATEMENTS
06-115 116-167 168-270 271-502

448 VEDANTA LIMITED INTEGRATED REPORT AND ANNUAL ACCOUNTS 2019-20 VEDANTA LIMITED INTEGRATED REPORT AND ANNUAL ACCOUNTS 2019-20 449
CONSOLIDATED NOTES FORMING PART OF THE FINANCIAL STATEMENTSas at and for the year ended March 31, 2020
CONSOLIDATED NOTES FORMING PART OF THE FINANCIAL STATEMENTSas at and for the year ended March 31, 2020
As at March 31, 2019(` in Crore)
Financial Assets Level 1 Level 2 Level 3
At fair value through profit or lossInvestments* 6,712 26,153 81 Derivative financial assets** - 30 - Trade receivables - 227 - At fair value through other comprehensive incomeInvestments 104 - 11 Derivatives designated as hedging instrumentsDerivative financial assets** - 48 - Total 6,816 26,458 92
(` in Crore)Financial liabilities Level 1 Level 2 Level 3
At fair value through profit or lossDerivative financial liabilities** - 543 - Trade payables - 1,064 - Derivatives designated as hedging instrumentsDerivative financial liabilities** - 7 - Other financial liabilities - Net put option liability with non-controlling interests accounted for at fair value. (Refer note 21).�
- - 195
Total - 1,614 195
* Includes structured investment (Refer note 38)
** Refer D below
The below table summarises the fair value of borrowings which are carried at amortised cost as at March 31, 2020 and March 31, 2019:
As at March 31, 2020(` in Crore)
Financial liabilities Level 1 Level 2 Level 3
Borrowings - 59,292 - Total - 59,292 -
As at March 31, 2019(` in Crore)
Financial liabilities Level 1 Level 2 Level 3
Borrowings - 66,185 -Total - 66,185 -
The fair value of the financial assets and liabilities are at the amount that would be received to sell an asset and paid to transfer a liability in an orderly transaction between market participants at the measurement date. The following methods and assumptions were used to estimate the fair values:
� Investments traded in active markets are determined by reference to quotes from the financial institutions; for example: Net asset value (NAV) for investments in mutual funds declared by mutual fund house. For other listed securities traded in markets which are not active, the quoted price is used wherever the pricing mechanism is same as for other marketable securities traded in active markets. Other current investments and structured investments are valued by referring to market inputs including quotes, trades, poll, primary issuances for securities and /or underlying securities issued by the same or similar issuer for similar maturities and movement in benchmark security etc.
� Trade receivables, cash and cash equivalents, other bank balances, loans, other financial assets, current borrowings, trade payables and other current financial liabilities: Fair values approximate their carrying amounts largely due to the short-term maturities of these instruments.
� Non-current fixed-rate and variable-rate borrowings: Fair value has been determined by the Group based on parameters such as interest rates, specific country risk factors, and the risk characteristics of the financed project.
� Derivative financial assets/liabilities: The Group enters into derivative financial instruments with various counterparties. Interest rate swaps, foreign exchange forward contracts and commodity forward contracts are valued using valuation techniques, which employs the use of market observable inputs. The most frequently applied valuation techniques include the forward pricing and swap models, using present value calculations. The models incorporate various inputs including foreign exchange spot and forward rates, yield curves of the respective currencies, currency basis spreads between the respective currencies, interest rate curves and forward rate curves of the underlying commodity. Commodity contracts are valued using the forward LME rates of commodities actively traded on the listed metal exchange i.e. London Metal Exchange, United Kingdom (U.K.).
� Other non-current financial assets and liabilities: Fair value is calculated using a discounted cash flow model with market assumptions, unless the carrying value is considered to approximate to fair value.
For all other financial instruments, the carrying amount is either the fair value, or approximates the fair value.
The changes in counterparty credit risk had no material effect on the hedge effectiveness assessment for derivatives designated in hedge relationship and the value of other financial instruments recognised at fair value.
The estimated fair value amounts as at March 31, 2020 and March 31, 2019 have been measured as at respective date. As such, the fair values of these financial instruments subsequent to reporting date may be different than the amounts reported at each year-end.
There were no significant transfers between Level 1, Level 2 and Level 3 during the year.
C. Risk management frameworkThe Group’s businesses are subject to several risks and uncertainties including financial risks.
The Group’s documented risk management policies act as an effective tool in mitigating the various financial risks to which the businesses are exposed in the course of their daily operations. The risk management policies cover areas such as liquidity risk, commodity price risk, foreign exchange risk, interest rate risk, counterparty credit risk and capital management. Risks are identified at both the corporate and individual subsidiary level with active involvement of senior management. Each operating subsidiary in the Group has in place risk management processes which are in line with the Group’s policy. Each significant risk has a designated ‘owner’ within the Group at an appropriate senior level. The potential financial impact of the risk and its likelihood of a negative outcome are regularly updated.
The risk management process is coordinated by the Management Assurance function and is regularly reviewed by the Group’s Audit Committee. The Audit Committee is aided by the other Committees of the Board including the Risk Management Committee, which meets regularly to review risks as well as the progress against the planned actions. Key business decisions are discussed at the periodic meetings of the Executive Committee. The overall internal control environment and risk management programme including financial risk management is reviewed by the Audit Committee on behalf of the Board.
The risk management framework aims to:
- improve financial risk awareness and risk transparency�
INTEGRATED REPORT MANAGEMENT REVIEW STATUTORY REPORTS FINANCIAL STATEMENTS
06-115 116-167 168-270 271-502

450 VEDANTA LIMITED INTEGRATED REPORT AND ANNUAL ACCOUNTS 2019-20 VEDANTA LIMITED INTEGRATED REPORT AND ANNUAL ACCOUNTS 2019-20 451
CONSOLIDATED NOTES FORMING PART OF THE FINANCIAL STATEMENTSas at and for the year ended March 31, 2020
CONSOLIDATED NOTES FORMING PART OF THE FINANCIAL STATEMENTSas at and for the year ended March 31, 2020
- identify, control and monitor key risks
- identify risk accumulations
- provide management with reliable information on the Group’s risk situation
- improve financial returns
Treasury managementTreasury management focuses on liability management, capital protection, liquidity maintenance and yield maximisation. The treasury policies are approved by the Committee of the Board. Daily treasury operations of the subsidiary companies are managed by their respective finance teams within the framework of the overall Group treasury policies. Long-term fund raising including strategic treasury initiatives are managed jointly by the business treasury team and the central team at corporate treasury while short-term funding for routine working capital requirements is delegated to subsidiary companies. A monthly reporting system exists to inform senior management of the Group’s investments and debt position, exposure to currency, commodity and interest rate risk and their mitigants including the derivative position. The Group has a strong system of internal control which enables effective monitoring of adherence to Group’s policies. The internal control measures are effectively supplemented by regular internal audits.
The investment portfolio at the Group is independently reviewed by CRISIL Limited and Group portfolio has been rated as Tier I or “Very Good” meaning highest safety. The investments are made keeping in mind safety, liquidity and yield maximisation.
The Group uses derivative instruments to manage the exposure in foreign currency exchange rates, interest rates and commodity prices. The Group does not acquire or issue derivative financial instruments for trading or speculative purposes. The Group does not enter into complex derivative transactions to manage the treasury and commodity risks. Both treasury and commodities derivative transactions are normally in the form of forward contracts, interest rate and currency swaps and these are in line with the Group’s policies.
Equity price riskAs at March 31, 2019, the Group held economic interest in a structured investment for the equity shares of Anglo American Plc (AA Plc), a company listed on the London Stock Exchange, having fair value of ` 4,772 Crore. The instrument is exposed to equity price movements of AA Plc, subject to a put option embedded therein (Refer note 38).
Set out below is the impact of 10% increase/ decrease in equity prices on pre-tax profit/ (loss) for the year ended March 31, 2019 and pre-tax equity as a result of changes in value of the investment:
For the year ended arch 20(` in Crore)
Financial asset investmentTotal Exposure
(fair value)
Effect on pre-tax profit/(loss) of a 10% increase in the equity price
Effect on pre-tax equity of a 10% increase in the
equity price
Effect on pre-tax profit/(loss) of a 10% decrease in the equity price
Effect on pre-tax equity of a 10% decrease in the
equity price
Structured investment 4,772 412 - (193) -
The above sensitivities are based on change in price of the underlying equity shares of AA plc and provide the estimated impact of the change on profit and equity assuming that all other variables remain constant.
There are no material equity risk exposures as at March 31, 2020.
Commodity price riskThe Group is exposed to the movement of base metal commodity prices on the London Metal Exchange. Any decline in the prices of the base metals that the Group produces and sells will have an immediate and direct impact on the profitability of the businesses. As a general policy, the Group aims to sell the products at prevailing market prices. The commodity price risk in imported input commodity such as Alumina,
anodes, etc., for our aluminium and Copper business respectively, is hedged on back-to-back basis ensuring no price risk for the business. Hedging is used primarily as a risk management tool and, in some cases, to secure future cash flows in cases of high volatility by entering into forward contracts or similar instruments. The hedging activities are subject to strict limits set out by the Board and to a strictly defined internal control and monitoring mechanism. Decisions relating to hedging of commodities are taken at the Executive Committee level, basis clearly laid down guidelines.
“Whilst the Group aims to achieve average LME prices for a month or a year, average realised prices may not necessarily reflect the LME price movements because of a variety of reasons such as uneven sales during the year and timing of shipments.
Group is also exposed to the movement of international crude oil price and the discount in the price of Rajasthan crude oil to Brent price.
Financial instruments with commodity price risk are entered into in relation to following activities:
� economic hedging of prices realised on commodity contracts
� cash flow hedging of revenues, forecasted highly probable transactions
AluminiumThe requirement of the primary raw material, alumina, is partly met from own sources and the rest is purchased primarily on negotiated price terms. Sales prices are linked to the LME prices. At present the Group on selective basis hedges the aluminium content in outsourced alumina to protect its margins. The Group also enters into hedging arrangements for its aluminium sales to realise average month of sale LME prices.
CopperThe Group’s custom refining copper operations at Silvassa is benefitted by a natural hedge except to the extent of a possible mismatch in quotational periods between the purchase of anodes / blisters and the sale of finished copper. The Group’s policy on custom smelting is to generate margins from Refining charges or “ Rc”, improving operational efficiencies, minimising conversion cost, generating a premium over LME on sale of finished copper, sale of by-products and from achieving import parity on domestic sales. Hence, mismatches in quotational periods are managed to ensure that the gains or losses are minimised. The Group hedges this variability of LME prices through forward contracts and tries to make the LME price a pass-through cost between purchases of anodes / blisters and sales of finished products, both of which are linked to the LME price.
Rcs are a major source of income for the Indian copper refining operations. Fluctuations in Rcs are influenced by factors including demand and supply conditions prevailing in the market for smelters output. The Group’s copper business has a strategy of securing a majority of its anodes / blisters feed requirement under long-term contracts with smelters / traders.
Zinc, lead and silverThe sales prices are linked to the LME prices. The Group also enters into hedging arrangements for its Zinc, Lead and Silver sales to realise average month of sale LME prices.
Zinc InternationalRaw material for zinc and lead is mined in Namibia and South Africa with sales prices linked to the LME prices.
Iron oreThe Group sells its Iron Ore production from Goa on the prevailing market prices and from Karnataka through e-auction route as mandated by State Government of Karnataka in India.
Oil and gasThe prices of various crude oils are based upon the price of the key physical benchmark crude oil such as Dated Brent, West Texas Intermediate, and Dubai/Oman etc. The crude oil prices move based upon market factors like supply and demand. The regional producers price their crude basis these benchmark crude with a premium or discount over the benchmark based upon quality differential and competitiveness of various grades.
Natural gas markets are evolving differently in important geographical markets. There is no single global market for natural gas. This could be owing to difficulties in large-scale transportation over long distances as compared to crude oil. Globally, there are three main regional hubs for pricing of natural gas, which are USA (Henry Hub Prices), UK (NBP Price) and Japan (imported gas price, mostly linked to crude oil).
Provisionally priced financial instrumentsOn March 31, 2020, the value of net financial liabilities linked to commodities (excluding derivatives) accounted for on provisional prices was ` 442 Crore (March 31, 2019: ` 186 Crore). These instruments are subject to price movements at the time of final settlement and the final price of these instruments will be determined in the financial year beginning April 01, 2020.
Set out below is the impact of 10% increase in LME prices on pre-tax profit/ (loss) for the year and pre-tax equity as a result of changes in value of the Group’s commodity financial instruments:
INTEGRATED REPORT MANAGEMENT REVIEW STATUTORY REPORTS FINANCIAL STATEMENTS
06-115 116-167 168-270 271-502

452 VEDANTA LIMITED INTEGRATED REPORT AND ANNUAL ACCOUNTS 2019-20 VEDANTA LIMITED INTEGRATED REPORT AND ANNUAL ACCOUNTS 2019-20 453
CONSOLIDATED NOTES FORMING PART OF THE FINANCIAL STATEMENTSas at and for the year ended March 31, 2020
CONSOLIDATED NOTES FORMING PART OF THE FINANCIAL STATEMENTSas at and for the year ended March 31, 2020
For the year ended arch 2020(` in Crore)
Total ExposureEffect on profit/(loss) of a 10%
increase in the LMEEffect on total equity of a 10%
increase in the LME
Copper (1,028) (103) -
For the year ended arch 20(` in Crore)
Total ExposureEffect on profit/(loss) of a 10%
increase in the LMEEffect on total equity of a 10%
increase in the LME
Copper (185) (19) -
The above sensitivities are based on volumes, costs, exchange rates and other variables and provide the estimated impact of a change in LME prices on profit and equity assuming that all other variables remain constant. A 10% decrease in LME prices would have an equal and opposite effect on the Group’s financial statements.
The impact on pre-tax profit/(loss) mentioned above includes the impact of a 10% increase in closing copper LME for provisionally priced copper concentrate purchased at Copper division custom smelting operations in India of ` 79 Crore loss (March 31, 2019: ` 74 Crore loss), which is pass through in nature and as such will not have any impact on the profitability.
(a) Financial riskThe Group’s Board approved financial risk policies include monitoring, measuring and mitigating the liquidity, currency, interest rate and counterparty risk. The Group does not engage in speculative treasury activity but seeks to manage risk and optimise interest and commodity pricing through proven financial instruments.
i uidity risThe Group requires funds both for short-term operational needs as well as for long-term investment programmes mainly in growth projects. The Group generates sufficient cash flows from the current operations which together with the available cash and cash equivalents, short-term investments and structured investment net of deferred consideration payable for such investments provide liquidity both in the short-term as well as in the long-term. The Group has been rated by CRISIL Limited (CRISIL) and India Ratings and Research Private Limited (India Rating) for
its capital market issuance in the form of CPs and NCDs and for its banking facilities in line with Basel II norms.
CRISIL affirmed our rating for the Company’s long-term bank facilities and its Non-Convertible Debentures (NCD) programme to CRISIL AA / Stable during the year. India Ratings has revised the outlook on Vedanta Limited’s ratings to IND AA / Negative from IND AA/ Stable on account of delay in deleveraging due to sharp fall in commodity prices and delay in volume ramp-up in key business segments. Vedanta Limited has the highest short-term rating on its working capital and Commercial Paper Programme at A1+ from CRISIL and India Ratings. On April 03, 2020, CRISIL has revised the rating outlook on the long term bank facilities and Non-Convertible Debentures (NCD) programme from Stable to Negative, while reaffirming the rating at AA on account of weaker commodity prices in wake of Covid 19 pandemic. On May 22, 2020, India Ratings downgraded Vedanta Ltd to AA-/ Negative outlook from AA / Negative outlook on account of higher expected balance sheet leverage due to substantial decline in economic activity in the wake of Covid 19 lockdown and elevated refinancing risk.
Anticipated future cash flows, together with undrawn fund based committed facilities of ` 3,174 Crore and cash, bank and current investments of ` 37,914 Crore as at March 31, 2020, are expected to be sufficient to meet the liquidity requirement of the Group in the near future.
The Group remains committed to maintaining a healthy liquidity, a low gearing ratio, deleveraging and strengthening our balance sheet. The maturity profile of the Group’s financial liabilities based on the remaining period from the date of balance sheet to the contractual maturity date is given in the table below. The figures reflect the contractual undiscounted cash obligation of the Group.
As at arch 2020(` in Crore)
Payments due by year 1 year 1-3 years 3-5 years 5 years Total
Borrowings * 27,156 24,482 9,547 11,536 72,721 Derivative financial liabilities 96 45 - - 141 Lease liability 457 95 40 68 660 Trade Payables and other financial liabilities **
27,100 1,132 0 - 28,232
Total 54,809 25,754 9,587 11,604 1,01,754
As at arch 20(` in Crore)
Payments due by year 1 year 1-3 years 3-5 years 5 years Total
Borrowings * 35,591 25,591 7,374 11,148 79,704 Derivative financial liabilities 451 99 - - 550 Trade Payables and other financial liabilities **
30,239 1,119 195 - 31,553
Total 66,281 26,809 7,569 11,148 1,11,807
*Includes Non-current borrowings, current borrowings, current maturities of non-current borrowings, committed interest payments on borrowings and interest accrued on borrowings.� � � � � �
**Includes both Non-current and current financial liabilities and committed interest payment, as applicable. Excludes current maturities of non-current borrowings and interest accrued on borrowings.� � � � � �
The Group had access to following funding facilities:
As at arch 2020(` in Crore)
Funding facilities Total Facility Drawn Undrawn
Fund/non-fund based 63,726 52,611 11,115
As at arch 20(` in Crore)
Funding facilities Total Facility Drawn Undrawn
Fund/non-fund based 66,793 51,780 15,013
CollateralThe Group has pledged financial instruments with carrying amount of ` 21,595 Crore and inventories with carrying amount of ` 8,514 Crore as per the requirements specified in various financial facilities in place. The counterparties have an obligation to release the securities to the Group when financial facilities are surrendered.� � � � � �
(b) Foreign exchange riskFluctuations in foreign currency exchange rates may have an impact on the consolidated statement of profit and loss, the consolidated statement of change in equity, where any transaction references more than one currency or where assets/liabilities are denominated in a currency other than the functional currency of the respective consolidated entities.
Considering the countries and economic environment in which the Group operates, its operations are subject
to risks arising from the fluctuations primarily in the US dollar, Australian dollar, Namibian dollar, AED, ZAR, GBP, JPY, INR and Euro against the functional currencies of Vedanta Limited and its subsidiaries.
Exposures on foreign currency loans are managed through the Group wide hedging policy, which is reviewed periodically to ensure that the results from fluctuating currency exchange rates are appropriately managed. The Group strives to achieve asset liability offset of foreign currency exposures and only the net position is hedged.
The Group’s presentation currency is the Indian Rupee (INR). The majority of the assets are located in India and the Indian Rupee is the functional currency for the Indian operating subsidiaries except for Oil and Gas business operations which have a US dollar functional currency. Natural hedges available in the business are identified at each entity level and hedges are placed
INTEGRATED REPORT MANAGEMENT REVIEW STATUTORY REPORTS FINANCIAL STATEMENTS
06-115 116-167 168-270 271-502

454 VEDANTA LIMITED INTEGRATED REPORT AND ANNUAL ACCOUNTS 2019-20 VEDANTA LIMITED INTEGRATED REPORT AND ANNUAL ACCOUNTS 2019-20 455
CONSOLIDATED NOTES FORMING PART OF THE FINANCIAL STATEMENTSas at and for the year ended March 31, 2020
CONSOLIDATED NOTES FORMING PART OF THE FINANCIAL STATEMENTSas at and for the year ended March 31, 2020
only for the net exposure. Short-term net exposures are hedged progressively based on their maturity. A more conservative approach has been adopted for project expenditures to avoid budget overruns, where cost of the project is calculated taking into account the hedge cost. The hedge mechanisms are reviewed periodically to ensure that the risk from fluctuating currency exchange rates is appropriately managed.
The following analysis is based on the gross exposure as at the reporting date which could affect the consolidated statement of profit and loss. The exposure is mitigated by some of the derivative contracts entered into by the Group as disclosed under the section on “Derivative financial instruments”.
The carrying amount of the Group’s financial assets and liabilities in different currencies are as follows:
CurrencyAs at March 31, 2020 As at March 31, 2019
Financial Assets Financial liabilities Financial Assets Financial liabilities
INR 35,297 60,539 33,001 69,524 USD 12,762 26,764 14,186 25,782 Others 726 2,273 5,658 4,156 Total 48,785 89,576 52,845 99,462
The Group’s exposure to foreign currency arises where a Group entity holds monetary assets and liabilities denominated in a currency different to the functional currency of the respective business, with US dollar being the major non-functional currency.� � � � � �
The foreign exchange rate sensitivity is calculated by the aggregation of the net foreign exchange rate exposure with a simultaneous parallel foreign exchange rates shift in the foreign currencies by 10% against the functional currency of the respective entities.�� � � � �
Set out below is the impact of a 10% strengthening in the functional currencies of the respective businesses on pre-tax profit/(loss) and pre-tax equity arising as a result of the revaluation of the Group’s foreign currency monetary financial assets/liabilities:� � � � � �
For the year ended arch 2020(` in Crore)
Effect of 10% strengthening of functional
currency on pre-tax profit/ (loss)Effect of 10% strengthening
of foreign currency on equity
USD 1,321 - INR 28 -
For the year ended arch 20(` in Crore)
Effect of 10% strengthening of functional
currency on pre-tax profit/ (loss)Effect of 10% strengthening
of foreign currency on equity
USD 1,029 -INR (101) -
A 10% weakening of functional currencies of the respective businesses would have an equal and opposite effect on the Group’s financial statements. �
c nterest rate risAt March 31, 2020, the Group’s net debt of ` 21,273 Crore (March 31, 2019: ` 26,958 Crore) comprises debt of ` 59,187 Crore (March 31, 2019: ` 66,226 Crore) offset by cash, bank and current investments of ` 37,914 Crore (March 31, 2019: ` 39,268 Crore).� � � � � �
The Group is exposed to interest rate risk on short-term and long-term floating rate instruments and on the refinancing of fixed rate debt. The Group’s policy is to maintain a balance of fixed and floating interest rate
borrowings and the proportion of fixed and floating rate debt is determined by current market interest rates. The borrowings of the Group are principally denominated in Indian Rupees and US dollars with mix of fixed and floating rates of interest. The USD floating rate debt is linked to US dollar LIBOR and INR Floating rate debt to Bank’s base rate. The Group has a policy of selectively using interest rate swaps, option contracts and other derivative instruments to manage its exposure to interest rate movements. These exposures are reviewed by appropriate levels of management on a monthly basis. The Group invests cash and liquid investments in short-term deposits and debt mutual funds, some of which generate a tax-free return, to achieve the Group’s goal of maintaining liquidity, carrying manageable risk and achieving satisfactory returns.
Floating rate financial assets are largely mutual fund investments which have debt securities as underlying assets. The returns from these financial assets are linked to market interest rate movements; however the counterparty invests in the agreed securities with known maturity tenure and return and hence has manageable risk.�
The exposure of the Group’s financial assets as at March 31, 2020 to interest rate risk is as follows:�(` in Crore)
As at March 31, 2020 TotalFloating rate
Financial assetsFixed rate
financial assets
Non-interest bearing financial
assets
Financial Assets 48,785 12,105 24,434 12,246
The exposure of the Company’s financial liabilities as at March 31, 2020 to interest rate risk is as follows:(` in Crore)
As at March 31, 2020 TotalFloating rate
Financial assetsFixed rate
financial assets
Non-interest bearing financial
assets
Financial Liabilities 89,576 31,354 37,415 20,807
The exposure of the Group’s financial assets as at March 31, 2019 to interest rate risk is as follows:(` in Crore)
As at March 31, 2019 TotalFloating rate
Financial assetsFixed rate
financial assets
Non-interest bearing financial
assets
Financial Assets 52,845 14,674 19,226 18,945
The exposure of the Group’s financial liabilities as at March 31, 2019 to interest rate risk is as follows:�(` in Crore)
As at March 31, 2019 TotalFloating rate
Financial assetsFixed rate
financial assets
Non-interest bearing financial
assets
Financial Liabilities 99,462 30,923 43,691 24,848
Considering the net debt position as at March 31, 2020 and the investment in Bank deposits, corporate bonds and debt mutual funds, any increase in interest rates would result in a net loss and any decrease in interest rates would result in a net gain. The sensitivity analysis below has been determined based on the exposure to interest rates for financial instruments at the balance sheet date.� � � � � �
The table below illustrates the impact of a 0.5% to 2.0% movement in interest rates on floating rate financial assets/ liabilities (net) on profit/(loss) and equity assuming that the changes occur at the reporting date and has been calculated based on risk exposure outstanding as of that date. The year end balances are not necessarily representative of the average debt outstanding during the year. This analysis also assumes that all other variables, in particular foreign currency rates, remain constant.�
INTEGRATED REPORT MANAGEMENT REVIEW STATUTORY REPORTS FINANCIAL STATEMENTS
06-115 116-167 168-270 271-502

456 VEDANTA LIMITED INTEGRATED REPORT AND ANNUAL ACCOUNTS 2019-20 VEDANTA LIMITED INTEGRATED REPORT AND ANNUAL ACCOUNTS 2019-20 457
CONSOLIDATED NOTES FORMING PART OF THE FINANCIAL STATEMENTSas at and for the year ended March 31, 2020
CONSOLIDATED NOTES FORMING PART OF THE FINANCIAL STATEMENTSas at and for the year ended March 31, 2020
(` in Crore)
Increase in interest rates
Effect on pre-tax profit/(loss) during the year ended
March 31, 2020
Effect on pre-tax profit/(loss) during the year ended
March 31, 2019
0.50% (96) (81)1.00% (192) (162)2.00% (385) (325)
An equivalent reduction in interest rates would have an equal and opposite effect on the Company’s financial statements.
(d) Counterparty and concentration of credit riskCredit risk refers to the risk that counterparty will default on its contractual obligations resulting in financial loss to the Group. The Group has adopted a policy of only dealing with creditworthy counterparties and obtaining sufficient collateral, where appropriate, as a means of mitigating the risk of financial loss from defaults.
The Group is exposed to credit risk from trade receivables, contract assets, investments, loans, other financial assets, and derivative financial instruments.
Credit risk on receivables is limited as almost all credit sales are against letters of credit and guarantees of banks of national standing.
Moreover, given the diverse nature of the Group’s businesses, trade receivables are spread over a number of customers with no significant concentration of credit risk. No single customer accounted for 10% or more of revenue on a consolidated basis in any of the years presented. The history of trade receivables shows a negligible provision for bad and doubtful debts. Therefore, the Group does not expect any material risk on account of non-performance by any of the Group’s counterparties.
The Group has clearly defined policies to mitigate counterparty risks. For short-term investments, counterparty limits are in place to limit the amount of credit exposure to any one counterparty. This, therefore, results in diversification of credit risk for our mutual fund and bond investments. For derivative and financial instruments, the Group attempts to limit the credit risk by only dealing with reputable banks and financial institutions.
The carrying value of the financial assets represents the maximum credit exposure. The Group’s maximum exposure to credit risk as at March 31, 2020 and March 31, 2019 is ` 48,785 Crore and ` 52,845 Crore respectively.
The maximum credit exposure on financial guarantees given by the Group for various financial facilities is described in Note 37 on “Contingent liability and capital commitments”.
None of the Group’s cash equivalents, including time deposits with banks, are past due or impaired. Regarding trade receivables, loans and other financial assets (both current and non-current), there were no indications as at March 31, 2020, that defaults in payment obligations will occur except as described in Note 8 and 10 on allowance for impairment of trade receivables and other financial assets.
Of the year end trade receivables, loans and other financial assets (excluding Bank deposits, site restoration fund and derivatives) balance the following, though overdue, are expected to be realised in the normal course of business and hence, are not considered impaired as at March 31, 2020 and March 31, 2019:
(` in Crore)
ParticularsAs at
March 31, 2020As at
March 31, 2019
Neither impaired nor past due 2,964 6,428Past due but not impaired- Less than 1 month 794 873- Between 1–3 months 1,427 336- Between 3–12 months 1,686 599- Greater than 12 months 2,597 2,532Total 9,468 10,768
Receivables are deemed to be past due or impaired with reference to the Group’s normal terms and conditions of business. These terms and conditions are determined on a case to case basis with reference to the customer’s credit quality and prevailing market conditions. Receivables that are classified as ‘past due’ in the above tables are those that have not been settled within the terms and conditions that have been agreed with that customer. The Group based on past experiences does not expect any material loss on its receivables.
The credit quality of the Group’s customers is monitored on an ongoing basis. Where receivables have been impaired, the Group actively seeks to recover the amounts in question and enforce compliance with credit terms.
Movement in allowances for Financial Assets (Trade receivables and Financial assets - others)
The change in the allowance for financial assets (current and non-current) is as follows:(` in Crore)
ParticularsTrade
receivablesFinancial
assets - others
As at April 1, 2018 565 417 Allowance made during the year 4 45 Reversals/ write-off during the year 0 (5)Exchange differences 0 19 As at March 31, 2019 569 476 Allowance made during the year 18 470 Reversals/ write-off during the year (17) (18)Exchange differences 0 38 As at March 31, 2020 570 966
D. Derivative financial instrumentsThe Group uses derivative instruments as part of its management of exposure to fluctuations in foreign currency exchange rates, interest rates and commodity prices. The Group does not acquire or issue derivative financial instruments for trading or speculative purposes. The Group does not enter into complex derivative transactions to manage the treasury and commodity risks. Both treasury and commodities derivative transactions are normally in the form of forward contracts and these are subject to the Group guidelines and policies.
The fair values of all derivatives are separately recorded in the consolidated balance sheet within current and non-current assets and liabilities. Derivatives that are designated as hedges are classified as current or non-current depending on the maturity of the derivative.
The use of derivatives can give rise to credit and market risk. The Group tries to control credit risk as far as possible by only entering into contracts with reputable banks and financial institutions. The use of derivative instruments is subject to limits, authorities and regular monitoring by appropriate levels of management. The limits, authorities and monitoring systems are periodically reviewed by management and the Board. The market risk on derivatives is mitigated by changes in the valuation of the underlying assets, liabilities or transactions, as derivatives are used only for risk management purposes.� � � � � �
(i) Cash ow hedgesThe Group enters into forward exchange and commodity price contracts for hedging highly probable forecast transaction and account for them as cash flow hedges and states them at fair value. Subsequent changes in fair value are recognised in equity through OCI until the hedged transaction occurs, at which time, the respective gain or losses are reclassified to profit or loss. These hedges have been effective for the year ended March 31, 2020.�� � � � �
The Group uses foreign exchange contracts from time to time to optimise currency risk exposure on its foreign currency transactions. The Group hedged part of its foreign currency exposure on capital commitments during the year ended 2020. Fair value changes on such forward contracts are recognised in other comprehensive income.
The majority of cash flow hedges taken out by the Group during the year comprise non-derivative hedging instruments for hedging the foreign exchange rate of highly probable forecast transactions and commodity price contracts for hedging the commodity price risk of highly probable forecast transactions.
The cash flows related to above are expected to occur during the year ending March 31, 2021 and consequently may impact profit or loss for that year depending upon the change in the commodity prices and foreign exchange rates movements. For cash flow hedges
INTEGRATED REPORT MANAGEMENT REVIEW STATUTORY REPORTS FINANCIAL STATEMENTS
06-115 116-167 168-270 271-502

458 VEDANTA LIMITED INTEGRATED REPORT AND ANNUAL ACCOUNTS 2019-20 VEDANTA LIMITED INTEGRATED REPORT AND ANNUAL ACCOUNTS 2019-20 459
CONSOLIDATED NOTES FORMING PART OF THE FINANCIAL STATEMENTSas at and for the year ended March 31, 2020
CONSOLIDATED NOTES FORMING PART OF THE FINANCIAL STATEMENTSas at and for the year ended March 31, 2020
regarded as basis adjustments to initial carrying value of the property, plant and equipment, the depreciation on the basis adjustments made is expected to affect profit or loss over the expected useful life of the property, plant and equipment.
(ii) Fair value hedgeThe fair value hedges relate to forward covers taken to hedge currency exposure and commodity price risks.
The Group’s sales are on a quotational period basis, generally one month to three months after the date of delivery at a customer’s facility. The Group enters into forward contracts for the respective quotational period to hedge its commodity price risk based on average LME prices. Gains and losses on these hedge transactions are substantially offset by the amount of gains or losses on the underlying sales. Net gains and losses are recognised in the consolidated statement of profit and loss.
The Group uses foreign exchange contracts from time to time to optimise currency risk exposure on its foreign currency transactions. Fair value changes on such forward contracts are recognised in the consolidated statement of profit and loss.
(iii) Non-designated economic hedgeThe Group enters into derivative contracts which are not designated as hedges for accounting purposes, but provide an economic hedge of a particular transaction risk or a risk component of a transaction. Hedging instruments include copper, aluminium future contracts on the LME and certain other derivative instruments. Fair value changes on such derivative instruments are recognised in the consolidated statement of profit and loss.
The fair value of the Group’s derivative positions recorded under derivative financial assets and derivative financial liabilities are as follows:
(` in Crore)
Derivative Financial InstrumentsAs at March 31, 2020 As at March 31, 2019
Assets Liabilities Assets Liabilities
CurrentCash ow hedge*- Commodity contracts 104 - 3 6 - Forward foreign currency contracts - - 37 1 - Interest rate swap - 3 - - Fair Value hedge- Commodity contracts 100 11 3 - - Forward foreign currency contracts 212 36 5 - Non-qualifying hedges/economic hedge- Commodity contracts 6 20 5 72 - Forward foreign currency contracts 269 25 25 366 - Cross currency swap 1 1 0 6 Total 692 96 78 451 Non-currentCash ow hedge*- Interest rate swap - 8 - - Non-qualifying hedges/economic hedge- Forward foreign currency contracts 3 37 - 99 Total 3 45 - 99
* Refer consolidated statements of profit and loss and consolidated statement of changes in equity for the change in the fair value of cash flow hedges.
23. PROVISIONS(` in Crore)
ParticularsAs at March 31, 2020 As at March 31, 2019
Non-current Current Total Non-current Current Total
Provision for employee benefits a (Refer note 30) - Retirement Benefit 156 112 268 145 122 267 - Others 14 170 184 10 200 210 Provision for restoration, rehabilitation and environmental costs b
2,658 19 2,677 2,441 13 2,454
Other provisions b - 54 54 - 52 52 Total 2,828 355 3,183 2,596 387 2,983
a) Provision for employee benefits includes gratuity, compensated absences, deferred cash bonus etc.
(` in Crore)
b) ParticularsRestoration, rehabilitation and environmental costs (Refer c)
Others (Refer d)
As at April 1, 2018 2,201 51 Additions 18 1 Amounts Utilised (13) - Unused amounts reversed (8) - Unwinding of discount (Refer note 31) 93 - Revision in estimates 136 - Exchange differences 27 - As at March 31, 2019 2,454 52 Additions 69 2 Amounts Utilised (14) - Unused amounts reversed - - Unwinding of discount (Refer note 31) 96 - Revision in estimates (50) - Exchange differences 122 - As at March 31, 2020 2,677 54
c) Restoration, rehabilitation and environmental costsThe provisions for restoration, rehabilitation and environmental liabilities represent the management’s best estimate of the costs which will be incurred in the future to meet the Group’s obligations under existing Indian, Australian, Namibian, South African and Irish law and the terms of the Group’s exploration and other licences and contractual arrangements.
Within India, the principal restoration and rehabilitation provisions are recorded within Oil & Gas business where a legal obligation exists relating to the oil and gas fields, where costs are expected to be incurred in restoring the site of production facilities at the end of the producing life of an oil field. The Group recognises the full cost of site restoration as a liability when the obligation to rectify environmental damage arises.
These amounts are calculated by considering discount rates within the range of 2% to 10%, and become payable on closure of mines and are expected to be incurred over a period of one to thirty years . The lower range of discount rate is at Cairn India & Zinc International operations in Ireland and higher range is at Zinc International operations in African Countries. An obligation to incur restoration, rehabilitation and environmental costs arises when environmental disturbance is caused by the development or ongoing production from a producing field.
d) Other provisions Other provisions include provision for disputed cases and claims.� � � � �
INTEGRATED REPORT MANAGEMENT REVIEW STATUTORY REPORTS FINANCIAL STATEMENTS
06-115 116-167 168-270 271-502
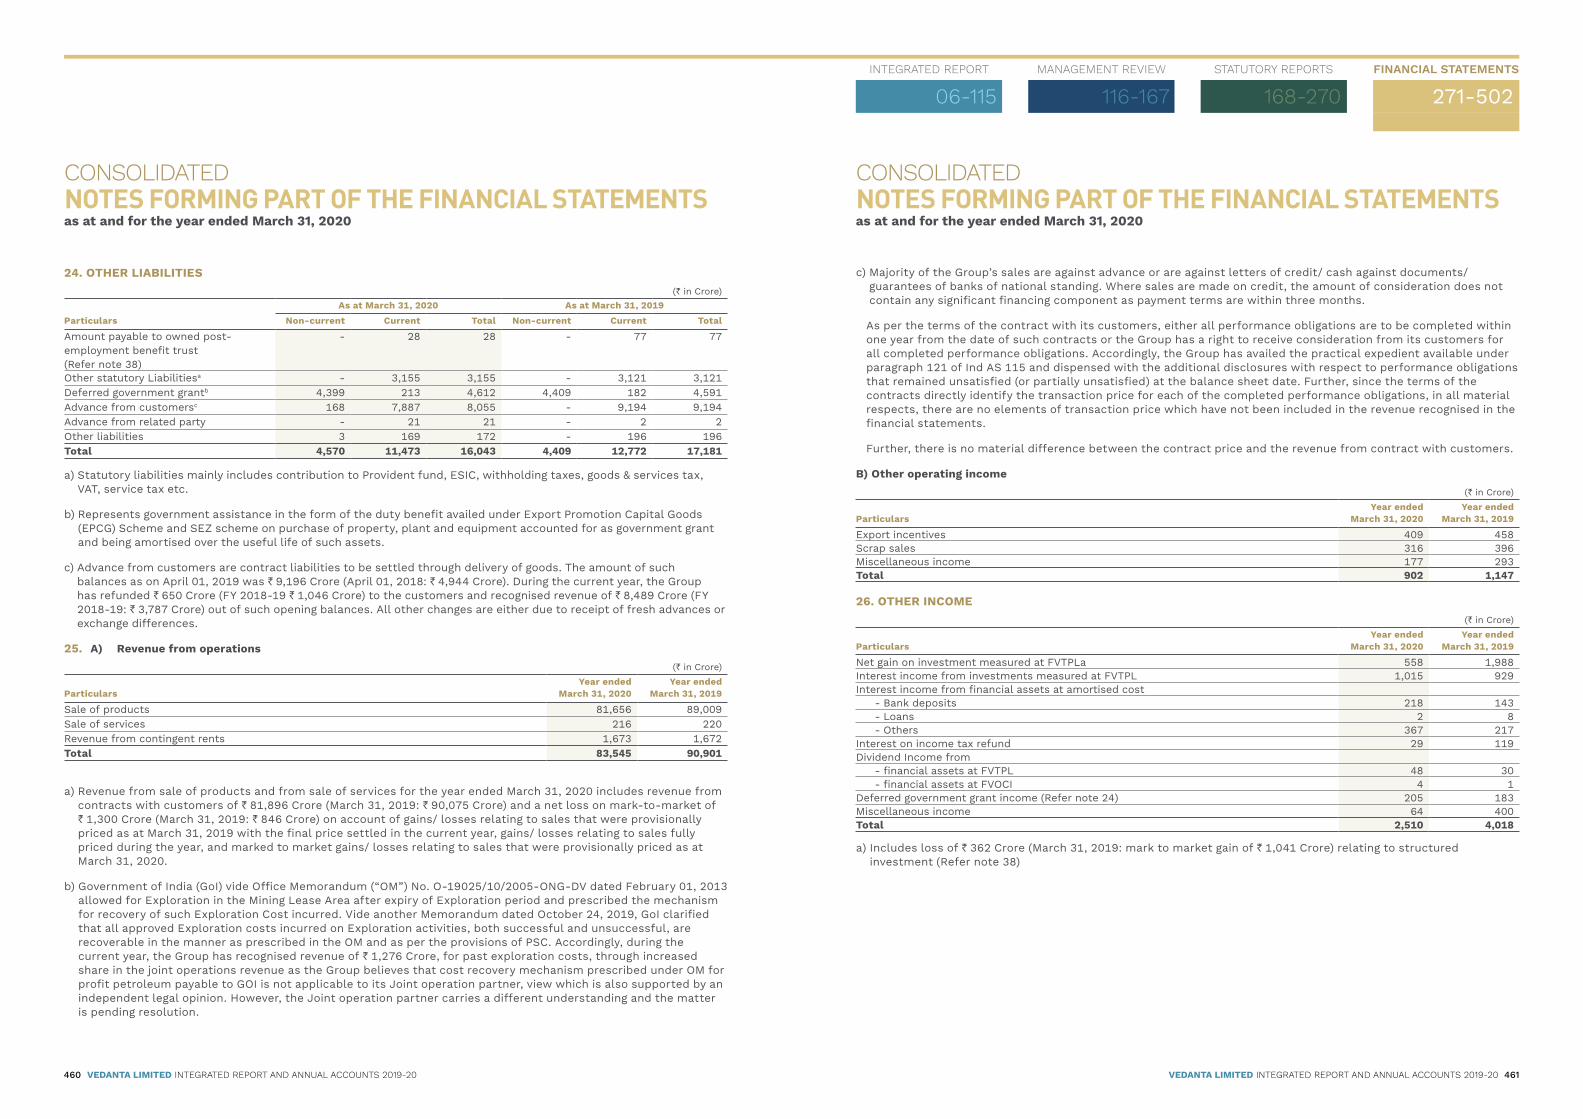
460 VEDANTA LIMITED INTEGRATED REPORT AND ANNUAL ACCOUNTS 2019-20 VEDANTA LIMITED INTEGRATED REPORT AND ANNUAL ACCOUNTS 2019-20 461
CONSOLIDATED NOTES FORMING PART OF THE FINANCIAL STATEMENTSas at and for the year ended March 31, 2020
CONSOLIDATED NOTES FORMING PART OF THE FINANCIAL STATEMENTSas at and for the year ended March 31, 2020
24. OTHER LIABILITIES(` in Crore)
ParticularsAs at March 31, 2020 As at March 31, 2019
Non-current Current Total Non-current Current Total
Amount payable to owned post-employment benefit trust (Refer note 38)
- 28 28 - 77 77
Other statutory Liabilitiesa - 3,155 3,155 - 3,121 3,121 Deferred government grantb 4,399 213 4,612 4,409 182 4,591 Advance from customersc 168 7,887 8,055 - 9,194 9,194 Advance from related party - 21 21 - 2 2 Other liabilities 3 169 172 - 196 196 Total 4,570 11,473 16,043 4,409 12,772 17,181
a) �Statutory liabilities mainly includes contribution to Provident fund, ESIC, withholding taxes, goods & services tax, VAT, service tax etc.
b) �Represents government assistance in the form of the duty benefit availed under Export Promotion Capital Goods (EPCG) Scheme and SEZ scheme on purchase of property, plant and equipment accounted for as government grant and being amortised over the useful life of such assets.
c) �Advance from customers are contract liabilities to be settled through delivery of goods. The amount of such balances as on April 01, 2019 was ` 9,196 Crore (April 01, 2018: ` 4,944 Crore). During the current year, the Group has refunded ` 650 Crore (FY 2018-19 ` 1,046 Crore) to the customers and recognised revenue of ` 8,489 Crore (FY 2018-19: ` 3,787 Crore) out of such opening balances. All other changes are either due to receipt of fresh advances or exchange differences.
25. A) Revenue from operations(` in Crore)
ParticularsYear ended
March 31, 2020Year ended
March 31, 2019
Sale of products 81,656 89,009 Sale of services 216 220 Revenue from contingent rents 1,673 1,672 Total 83,545 90,901
a) �Revenue from sale of products and from sale of services for the year ended March 31, 2020 includes revenue from contracts with customers of ` 81,896 Crore (March 31, 2019: ` 90,075 Crore) and a net loss on mark-to-market of ` 1,300 Crore (March 31, 2019: ` 846 Crore) on account of gains/ losses relating to sales that were provisionally priced as at March 31, 2019 with the final price settled in the current year, gains/ losses relating to sales fully priced during the year, and marked to market gains/ losses relating to sales that were provisionally priced as at March 31, 2020.
b) �Government of India (GoI) vide Office Memorandum (“OM”) No. O-19025/10/2005-ONG-DV dated February 01, 2013 allowed for Exploration in the Mining Lease Area after expiry of Exploration period and prescribed the mechanism for recovery of such Exploration Cost incurred. Vide another Memorandum dated October 24, 2019, GoI clarified that all approved Exploration costs incurred on Exploration activities, both successful and unsuccessful, are recoverable in the manner as prescribed in the OM and as per the provisions of PSC. Accordingly, during the current year, the Group has recognised revenue of ` 1,276 Crore, for past exploration costs, through increased share in the joint operations revenue as the Group believes that cost recovery mechanism prescribed under OM for profit petroleum payable to GOI is not applicable to its Joint operation partner, view which is also supported by an independent legal opinion. However, the Joint operation partner carries a different understanding and the matter is pending resolution.
c) �Majority of the Group’s sales are against advance or are against letters of credit/ cash against documents/ guarantees of banks of national standing. Where sales are made on credit, the amount of consideration does not contain any significant financing component as payment terms are within three months.
�As per the terms of the contract with its customers, either all performance obligations are to be completed within one year from the date of such contracts or the Group has a right to receive consideration from its customers for all completed performance obligations. Accordingly, the Group has availed the practical expedient available under paragraph 121 of Ind AS 115 and dispensed with the additional disclosures with respect to performance obligations that remained unsatisfied (or partially unsatisfied) at the balance sheet date. Further, since the terms of the contracts directly identify the transaction price for each of the completed performance obligations, in all material respects, there are no elements of transaction price which have not been included in the revenue recognised in the financial statements.
�Further, there is no material difference between the contract price and the revenue from contract with customers.
B) Other operating income(` in Crore)
ParticularsYear ended
March 31, 2020Year ended
March 31, 2019
Export incentives 409 458 Scrap sales 316 396 Miscellaneous income 177 293 Total 902 1,147
26. OTHER INCOME(` in Crore)
ParticularsYear ended
March 31, 2020Year ended
March 31, 2019
Net gain on investment measured at FVTPLa 558 1,988 Interest income from investments measured at FVTPL 1,015 929 Interest income from financial assets at amortised cost� - Bank deposits 218 143 � - Loans 2 8 � - Others 367 217 Interest on income tax refund 29 119 Dividend Income from� - financial assets at FVTPL 48 30 � - financial assets at FVOCI 4 1 Deferred government grant income (Refer note 24) 205 183 Miscellaneous income 64 400 Total 2,510 4,018
a) �Includes loss of ` 362 Crore (March 31, 2019: mark to market gain of ` 1,041 Crore) relating to structured investment (Refer note 38)�
INTEGRATED REPORT MANAGEMENT REVIEW STATUTORY REPORTS FINANCIAL STATEMENTS
06-115 116-167 168-270 271-502

462 VEDANTA LIMITED INTEGRATED REPORT AND ANNUAL ACCOUNTS 2019-20 VEDANTA LIMITED INTEGRATED REPORT AND ANNUAL ACCOUNTS 2019-20 463
CONSOLIDATED NOTES FORMING PART OF THE FINANCIAL STATEMENTSas at and for the year ended March 31, 2020
CONSOLIDATED NOTES FORMING PART OF THE FINANCIAL STATEMENTSas at and for the year ended March 31, 2020
27. CHANGES IN INVENTORIES OF FINISHED GOODS AND WORK-IN-PROGRESS*(` in Crore)
ParticularsYear ended
March 31, 2020Year ended
March 31, 2019
Opening Stock:Finished Goods 1,438 626Work in Progress 2,527 3,012
3,965 3,638Add: Foreign exchange translation (6) (9)Add: Finished Goods acquired as part of business combination - 205Less: Closing StockFinished Goods 1,270 1,438Work in Progress 3,323 2,527
4,593 3,965Sub-total (634) (131)Add / (Less): Copper Concentrate (raw material) sold during the year 1,651 203Total 1,017 72
* Inventories include goods-in-transit
28. EMPLOYEE BENEFITS EXPENSE a
(` in Crore)
ParticularsYear ended
March 31, 2020Year ended
March 31, 2019
Salaries and Wages 2,760 3,121 Share based payments (Refer note 29) 73 118 Contributions to provident and other funds (Refer note 30) 173 180 Staff welfare expenses 242 245 Less: Cost allocated/directly booked in joint ventures (576) (641)Total 2,672 3,023
(a) net of capitalisation of ` 159 Crore (March 31, 2019: ` 78 Crore)
29. SHARE BASED PAYMENTSThe Company offers equity based and cash based option plans to its employees, officers and directors through the Company’s stock option plan introduced in 2016, Cairn India’s stock option plan now administered by the Company pursuant to merger with the Company and Vedanta Resources Limited (earlier known as Vedanta Resources Plc) plans [Vedanta Resources Long-Term Incentive Plan (“LTIP”), Employee Share Ownership Plan (“ESOP”), Performance Share Plan (“PSP”) and Deferred Share Bonus Plan (“DSBP”)] collectively referred as ‘VRL ESOP’ scheme.
The Vedanta Limited Employee Stock Option Scheme (ESOS) 2016The Company introduced an Employee Stock Option Scheme 2016 (“ESOS”), which was approved by the Vedanta Limited shareholders to provide equity settled incentive to all employees of the Company including subsidiary companies. The ESOS scheme includes tenure based, business performance (EBITDA) based and market performance based stock options. The
maximum value of options that can be awarded to members of the wider management group is calculated by reference to the grade average cost-to-company (“CTC”) and individual grade of the employee. The performance conditions attached to the option is measured by comparing Company’s performance in terms of Total Shareholder Return (“”TSR””) over the performance period with the performance of two group of comparator companies (i.e. Indian and global comparator companies) defined in the scheme. The extent to which an option vests will depend on the Company’s TSR rank against a group or groups of peer companies at the end of the performance period and as moderated by the Remuneration Committee.
Options granted during the year ended March 31, 2020 includes business performance based, sustained individual performance based and market performance based stock options. Business performances will be measured using Volume, Cost, Net Sales Realisation, EBITDA, free cash flow or a combination of these for the respective business/ SBU entities.
The exercise price of the options is ` 1 per share and the performance period is three years, with no re-testing being allowed. �� � � � � � � �
The details of share options for the year ended March 31, 2020 is presented below:
Financial Year of Grant Exercise Period
Options outstanding April 1, 2019
Options granted
during the year
Options transferred from Parent
/ fellow subsidiaries
Options forfeited
during the year
Options exercised
during the year*
Options expired
during the year
Options outstanding
March 31, 2020
Options exercisable
March 31, 2020
2016-17 December 15, 2019 -June 14, 2020
65,08,226 - - 48,19,269 6,20,441 - 10,68,516 10,68,516
2017-18 September 1, 2020 - February 28, 2021
82,74,393 - - 12,46,468 - - 70,27,925 -
2017-18 October 16, 2020 - April 15, 2021
11,126 - - - - - 11,126 -
2017-18 November 1, 2020 - April 30, 2021
27,638 - - 27,638 - - - -
2018-19 November 1, 2021 - April 30, 2022
1,35,66,200 - - 21,46,154 - - 1,14,20,046 -
2018-19 Cash settled 10,47,660 - 2,11,170 1,89,674 - - 10,69,156 - 2019-20 November 29, 2022 - May 28,
2023 - 1,67,13,640 - 8,32,310 - - 1,58,81,330 -
2019-20 Cash settled - 20,37,690 - 1,40,990 - - 18,96,700 - 2,94,35,243 1,87,51,330 2,11,170 94,02,503 6,20,441 - 3,83,74,799 10,68,516
*excludes 58,420 options exercised during the year regarding which the transaction could not be completed before March 31, 2020 and hence, the corresponding shares were were not transferred to the concerned employees.
The details of share options for the year ended March 31, 2019 is presented below:
Financial Year of Grant Exercise Period
Options outstanding April 1, 2018
Options granted
during the year
Options transferred
from Parent/ fellow
subsidiaries
Options forfeited
during the year
Options exercised
during the year
Options expired
during the year
Options outstanding
March 31, 2019
Options exercisable
March 31, 2019
2016-17 December 15, 2019 -June 14, 2020
70,98,602 - - 5,90,376 - - 65,08,226 -
2017-18 September 1, 2020 - February 28, 2021
96,17,340 - - 13,42,947 - - 82,74,393 -
2017-18 October 16, 2020 - April 15, 2021
11,570 - - 444 - - 11,126 -
2017-18 November 1, 2020 - April 30, 2021
28,740 - - 1,102 - - 27,638 -
2018-19 November 1, 2021 - April 30, 2022
- 1,37,93,980 - 2,27,780 - - 1,35,66,200 -
2018-19 Cash settled - 10,76,120 - 28,460 - - 10,47,660 - 1,67,56,252 1,48,70,100 - 21,91,109 - - 2,94,35,243 -
The fair value of all options has been determined at the date of grant of the option allowing for the effect of any market-based performance conditions. This fair value, adjusted by the Group’s estimate of the number of options that will eventually vest as a result of non-market conditions, is expensed over the vesting period.
INTEGRATED REPORT MANAGEMENT REVIEW STATUTORY REPORTS FINANCIAL STATEMENTS
06-115 116-167 168-270 271-502

464 VEDANTA LIMITED INTEGRATED REPORT AND ANNUAL ACCOUNTS 2019-20 VEDANTA LIMITED INTEGRATED REPORT AND ANNUAL ACCOUNTS 2019-20 465
CONSOLIDATED NOTES FORMING PART OF THE FINANCIAL STATEMENTSas at and for the year ended March 31, 2020
CONSOLIDATED NOTES FORMING PART OF THE FINANCIAL STATEMENTSas at and for the year ended March 31, 2020
Business Performance-Based and Sustained Individual Performance-Based Options:The fair values of stock options following these types of vesting conditions have been estimating using the Black-Scholes-Merton Option Pricing model. The value arrived at under this model has been then multiplied by the expected % vesting based on business performance conditions (only for business performance-based options) and the expected multiplier on account of sustained individual performance (for both type of options). The inputs used in the Black-Scholes-Merton Option Pricing model include the share price considered as of the valuation date, exercise price as per the scheme/ plan of the options, expected dividend yield (estimated based on actual/ expected dividend trend of the company), expected tenure (estimated as the remaining vesting period of the options), the risk-free rate (considered as the zero coupon yield as of the valuation date for a term commensurate with the expected tenure of the options) and expected volatility (estimated based on the historical volatility of the return in company’s share prices for a term commensurate with the expected tenure of the options). The exercise period of 6 months post vesting period has not been considered as the options are expected to be exercised immediately post the completion of the vesting period.
Total Shareholder Returns-Based Options:The fair values of stock options following this type of vesting condition has been estimated using the Monte Carlo Simulation method. This method has been used to simulate the expected share prices for Vedanta Limited and the companies of the comparator group over the vesting period of the options. Based on the simulated prices, the expected pay-off at the end of the vesting period has been estimated and present valued to the valuation date. Further, based on the simulated share prices and expected dividends the relative rank of Vedanta Limited’s share price return has been estimated vis- -vis the Indian and Global Group of the comparator group. This rank has been used to estimate expected % vesting of the options under this type of vesting condition. The inputs to the monte carlo simulation method include expected tenure (estimated as the remaining vesting period of the options), the risk-free rate (considered as the zero coupon yield as of the valuation date for a term commensurate with the expected tenure of the options), expected dividend yield (estimated based on the actual dividend trend of the companies), expected volatility (estimated based on the historical volatility of the return in the company’s share prices for a term commensurate with the expected tenure of the options). The exercise period of 6 months post the vesting period has not been considered as the options are expected to be exercised immediately post the completion of the vesting period.
The assumptions used in the calculations of the charge in respect of the ESOS options granted during the year ended March 31, 2020 and March 31, 2019 are set out below:
(` in Crore)
ParticularsYear ended March 31, 2020 Year ended March 31, 2019
ESOS 2019 ESOS November 2018
Number of Options Cash settled - 20,37,690 Equity settled - 1,67,13,640
Cash settled - 10,76,120 Equity settled - 1,37,93,980
Exercise Price ` 1 ` 1Share Price at the date of grant ` 144.60 ` 195.00Contractual Life 3 years 3 yearsExpected Volatility 36.64% 44.3%Expected option life 3 years 3 yearsExpected dividends 7.96% 6.50%Risk free interest rate 5.68% 7.70%Expected annual forfeitures 10%p.a. 10%p.a.Fair value per option granted (Non-market performance based and market performance based)
` 102.30/ ` 72.12 ` 159.9/` 96.3
Weighted average share price at the date of exercise of stock options was ` 126.02 (March 31, 2019: NA)
The weighted average remaining contractual life for the share options outstanding was 2.28 years (March 31, 2019: 2.32 years).
The Group recognised total expenses of ` 75 Crore (March 31, 2019 ` 82 Crore) related to equity settled
share-based payment transactions for the year ended March 31, 2020. The total expense recognised on account of cash settled share based plan during the year ended March 31, 2020 is ` 2 Crore (March 31, 2019: 1 Crore) and the carrying value of cash settled share based compensation liability as at March 31, 2020 is ` 1 Crore (March 31, 2019: 1 Crore).
Employee stock option plans of erstwhile Cairn India Limited:The Company has provided CIESOP share based payment scheme to its employees.
CIESOP plan There are no specific vesting conditions under CIESOP plan other than completion of the minimum service period of 3 years from the date of grant. Phantom options are exercisable proportionate to the period of service rendered by the employee subject to completion of one year. The exercise period is 7 years from the vesting date.Details of employees stock option plans is presented below:
CIESOP Plan
Year ended March 31, 2020 Year ended March 31, 2019
Number of options
Weighted average exercise
price in `Number of
options
Weighted average exercise
price in `
Outstanding at the beginning of the year 64,77,059 279.2 71,30,625 275.5Granted during the year Nil NA Nil NAExpired during the year 6,58,663 200.1 90,896 187.0Exercised during the year Nil NA 2,35,169 189.0Forfeited / cancelled during the year 4,76,656 288.1 3,27,501 287.2Outstanding at the end of the year 53,41,740 288.2 64,77,059 279.2Exercisable at the end of the year 53,41,740 288.2 64,77,059 279.2
Weighted average share price at the date of exercise of stock options is ` NA (March 31, 2019: ` 232.7)
SchemeRange of exercise
price in `
Weighted average remaining contractual life
of options (in years)
Weighted average exercise
price in `
The details of exercise price for stock options outstanding as at March 31, 2020 are:
286.85-291.25 1.46 288.2
CIESOP PlanThe details of exercise price for stock options outstanding as at March 31, 2019 are:CIESOP Plan 200.05-291.25 2.24 279.2
Employee share option plan of Vedanta Resources Limited (earlier known as Vedanta Resources Plc)The value of shares that are awarded to members of the Group is calculated by reference to the individual fixed salary and share-based remuneration consistent with local market practice. ESOP scheme of Vedanta Resources Limited is both tenure and performance based share schemes. The options are indexed to and settled by Parent’s shares (Vedanta Resources Limited shares as defined in the scheme). The options have a fixed exercise price denominated in Parent’s functional currency (10 US cents per share), the performance period of each option is three years and is exercisable within a period of six months from the date of vesting beyond which the option lapses.
During the previous year, through an open offer all the outstanding equity settled options were bought back by Vedanta Resources Limited’s parent, Volcan Investments Limited. On account of delisting of Vedanta Resources Limited, the cash based options were also early settled. The accelerated charge on account of early settlement of both the equity settled and cash settled options was recognised in the Consolidated Statement of Profit and Loss.
Amount recovered by the Parent and recognised by the Group for the year ended March 31, 2019 is ` 15 Crore. The Group considers these amounts as not material and accordingly has not provided further disclosures.
The Group has awarded certain cash settled share based options indexed to Parents’ shares (Vedanta Resources Limited shares) and shares of any of its subsidiaries. The total expense recognised on account of cash settled share based plan during the year ended March 31, 2020 is ` 21 Crore (March 31, 2019: ` 21 Crore) and the carrying value of cash settled share based compensation liability as at March 31, 2020 is ` 51 Crore (March 31, 2019: ` 34 Crore).
Out of the total expense of ` 98 Crore (March 31,2019: ` 119 Crore) pertaining to equity settled and cash settled options for the year ended March 31, 2020, the Group has capitalised ` 25 Crore (March 31, 2019: ` 1 Crore) expense for the year ended March 31, 2020.� � � � � � � � �
INTEGRATED REPORT MANAGEMENT REVIEW STATUTORY REPORTS FINANCIAL STATEMENTS
06-115 116-167 168-270 271-502
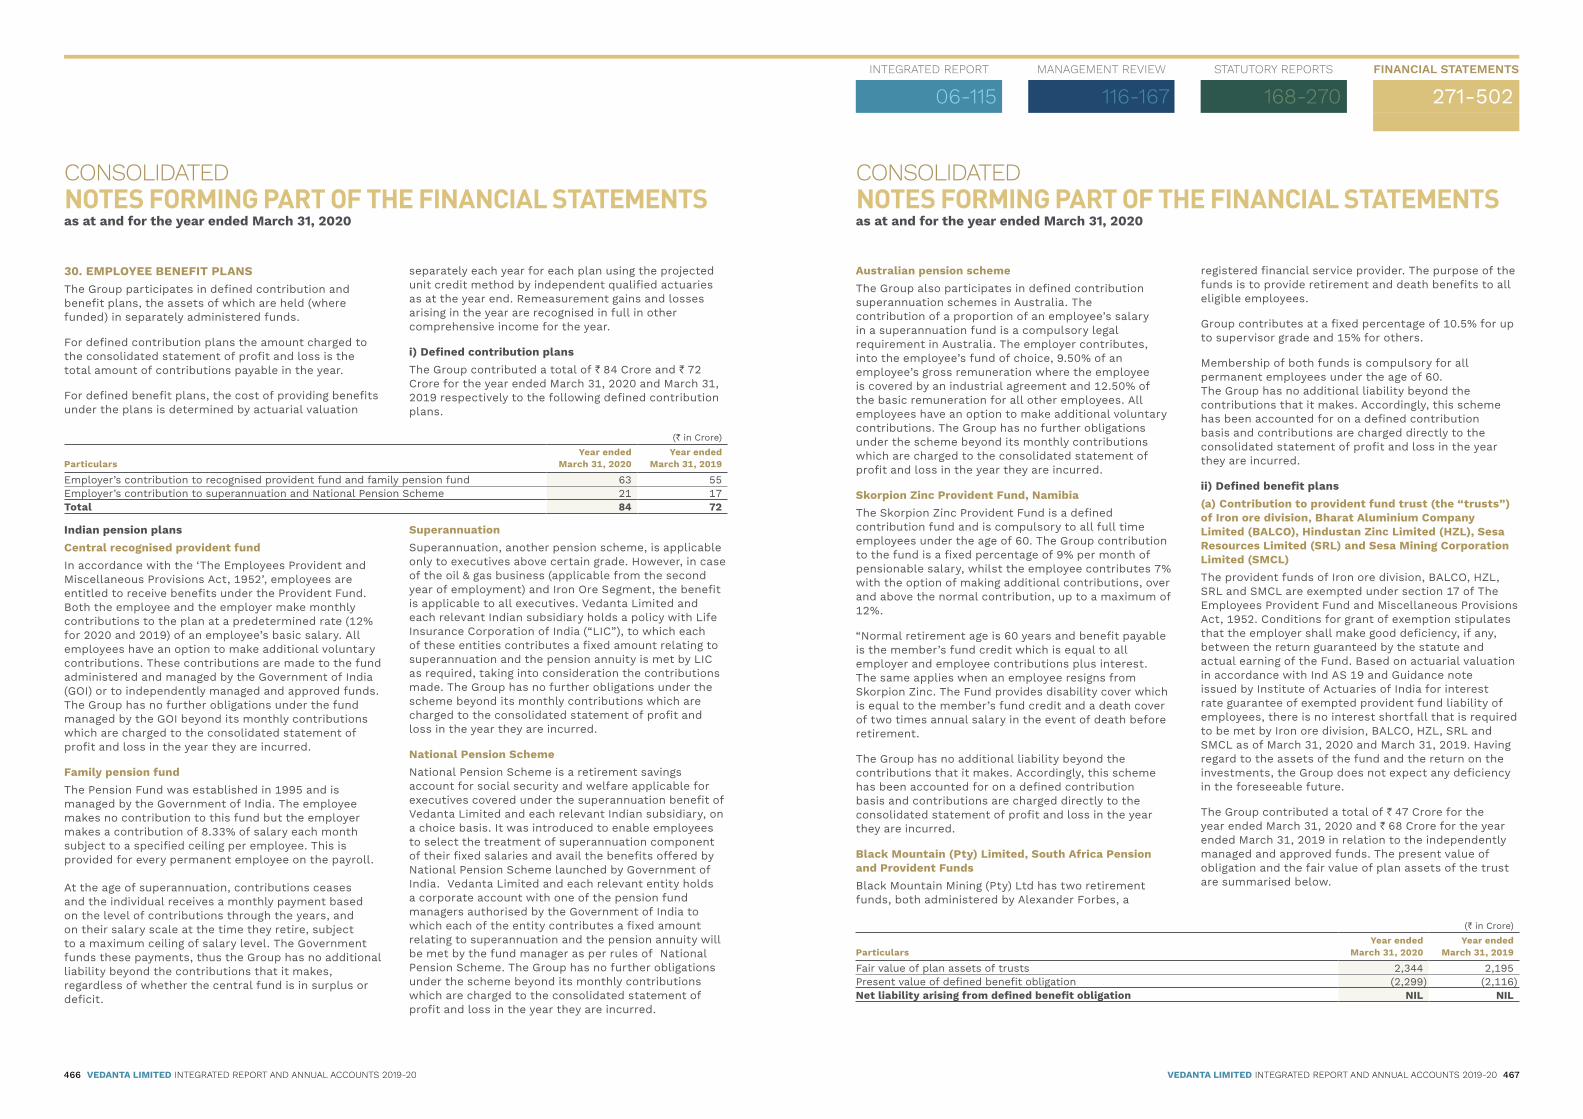
466 VEDANTA LIMITED INTEGRATED REPORT AND ANNUAL ACCOUNTS 2019-20 VEDANTA LIMITED INTEGRATED REPORT AND ANNUAL ACCOUNTS 2019-20 467
CONSOLIDATED NOTES FORMING PART OF THE FINANCIAL STATEMENTSas at and for the year ended March 31, 2020
CONSOLIDATED NOTES FORMING PART OF THE FINANCIAL STATEMENTSas at and for the year ended March 31, 2020
30. EMPLOYEE BENEFIT PLANSThe Group participates in defined contribution and benefit plans, the assets of which are held (where funded) in separately administered funds.�
For defined contribution plans the amount charged to the consolidated statement of profit and loss is the total amount of contributions payable in the year.
For defined benefit plans, the cost of providing benefits under the plans is determined by actuarial valuation
separately each year for each plan using the projected unit credit method by independent qualified actuaries as at the year end. Remeasurement gains and losses arising in the year are recognised in full in other comprehensive income for the year.
i) Defined contribution plansThe Group contributed a total of ` 84 Crore and ` 72 Crore for the year ended March 31, 2020 and March 31, 2019 respectively to the following defined contribution plans.
(` in Crore)
ParticularsYear ended
March 31, 2020Year ended
March 31, 2019
Employer’s contribution to recognised provident fund and family pension fund 63 55 Employer’s contribution to superannuation and National Pension Scheme 21 17 Total 84 72
Indian pension plansCentral recognised provident fundIn accordance with the ‘The Employees Provident and Miscellaneous Provisions Act, 1952’, employees are entitled to receive benefits under the Provident Fund. Both the employee and the employer make monthly contributions to the plan at a predetermined rate (12% for 2020 and 2019) of an employee’s basic salary. All employees have an option to make additional voluntary contributions. These contributions are made to the fund administered and managed by the Government of India (GOI) or to independently managed and approved funds. The Group has no further obligations under the fund managed by the GOI beyond its monthly contributions which are charged to the consolidated statement of profit and loss in the year they are incurred.
Family pension fundThe Pension Fund was established in 1995 and is managed by the Government of India. The employee makes no contribution to this fund but the employer makes a contribution of 8.33% of salary each month subject to a specified ceiling per employee. This is provided for every permanent employee on the payroll. At the age of superannuation, contributions ceases and the individual receives a monthly payment based on the level of contributions through the years, and on their salary scale at the time they retire, subject to a maximum ceiling of salary level. The Government funds these payments, thus the Group has no additional liability beyond the contributions that it makes, regardless of whether the central fund is in surplus or deficit.
SuperannuationSuperannuation, another pension scheme, is applicable only to executives above certain grade. However, in case of the oil & gas business (applicable from the second year of employment) and Iron Ore Segment, the benefit is applicable to all executives. Vedanta Limited and each relevant Indian subsidiary holds a policy with Life Insurance Corporation of India (“LIC”), to which each of these entities contributes a fixed amount relating to superannuation and the pension annuity is met by LIC as required, taking into consideration the contributions made. The Group has no further obligations under the scheme beyond its monthly contributions which are charged to the consolidated statement of profit and loss in the year they are incurred.
National Pension SchemeNational Pension Scheme is a retirement savings account for social security and welfare applicable for executives covered under the superannuation benefit of Vedanta Limited and each relevant Indian subsidiary, on a choice basis. It was introduced to enable employees to select the treatment of superannuation component of their fixed salaries and avail the benefits offered by National Pension Scheme launched by Government of India. Vedanta Limited and each relevant entity holds a corporate account with one of the pension fund managers authorised by the Government of India to which each of the entity contributes a fixed amount relating to superannuation and the pension annuity will be met by the fund manager as per rules of National Pension Scheme. The Group has no further obligations under the scheme beyond its monthly contributions which are charged to the consolidated statement of profit and loss in the year they are incurred.
Australian pension schemeThe Group also participates in defined contribution superannuation schemes in Australia. The contribution of a proportion of an employee’s salary in a superannuation fund is a compulsory legal requirement in Australia. The employer contributes, into the employee’s fund of choice, 9.50% of an employee’s gross remuneration where the employee is covered by an industrial agreement and 12.50% of the basic remuneration for all other employees. All employees have an option to make additional voluntary contributions. The Group has no further obligations under the scheme beyond its monthly contributions which are charged to the consolidated statement of profit and loss in the year they are incurred.
Skorpion Zinc Provident Fund, NamibiaThe Skorpion Zinc Provident Fund is a defined contribution fund and is compulsory to all full time employees under the age of 60. The Group contribution to the fund is a fixed percentage of 9% per month of pensionable salary, whilst the employee contributes 7% with the option of making additional contributions, over and above the normal contribution, up to a maximum of 12%.
“Normal retirement age is 60 years and benefit payable is the member’s fund credit which is equal to all employer and employee contributions plus interest. The same applies when an employee resigns from Skorpion Zinc. The Fund provides disability cover which is equal to the member’s fund credit and a death cover of two times annual salary in the event of death before retirement.
The Group has no additional liability beyond the contributions that it makes. Accordingly, this scheme has been accounted for on a defined contribution basis and contributions are charged directly to the consolidated statement of profit and loss in the year they are incurred.
Black Mountain (Pty) Limited, South Africa Pension and Provident FundsBlack Mountain Mining (Pty) Ltd has two retirement funds, both administered by Alexander Forbes, a
registered financial service provider. The purpose of the funds is to provide retirement and death benefits to all eligible employees.
Group contributes at a fixed percentage of 10.5% for up to supervisor grade and 15% for others.
Membership of both funds is compulsory for all permanent employees under the age of 60. The Group has no additional liability beyond the contributions that it makes. Accordingly, this scheme has been accounted for on a defined contribution basis and contributions are charged directly to the consolidated statement of profit and loss in the year they are incurred.� � � � � �
ii) Defined benefit plans(a) Contribution to provident fund trust (the trusts ) of Iron ore division, Bharat Aluminium Company Limited (BALCO), Hindustan Zinc Limited (HZL), Sesa Resources Limited (SRL) and Sesa Mining Corporation Limited (SMCL)The provident funds of Iron ore division, BALCO, HZL, SRL and SMCL are exempted under section 17 of The Employees Provident Fund and Miscellaneous Provisions Act, 1952. Conditions for grant of exemption stipulates that the employer shall make good deficiency, if any, between the return guaranteed by the statute and actual earning of the Fund. Based on actuarial valuation in accordance with Ind AS 19 and Guidance note issued by Institute of Actuaries of India for interest rate guarantee of exempted provident fund liability of employees, there is no interest shortfall that is required to be met by Iron ore division, BALCO, HZL, SRL and SMCL as of March 31, 2020 and March 31, 2019. Having regard to the assets of the fund and the return on the investments, the Group does not expect any deficiency in the foreseeable future.�
The Group contributed a total of ` 47 Crore for the year ended March 31, 2020 and ` 68 Crore for the year ended March 31, 2019 in relation to the independently managed and approved funds. The present value of obligation and the fair value of plan assets of the trust are summarised below.
(` in Crore)
ParticularsYear ended
March 31, 2020Year ended
March 31, 2019
Fair value of plan assets of trusts 2,344 2,195 Present value of defined benefit obligation (2,299) (2,116)Net liability arising from defined benefit obligation NIL NIL
INTEGRATED REPORT MANAGEMENT REVIEW STATUTORY REPORTS FINANCIAL STATEMENTS
06-115 116-167 168-270 271-502

468 VEDANTA LIMITED INTEGRATED REPORT AND ANNUAL ACCOUNTS 2019-20 VEDANTA LIMITED INTEGRATED REPORT AND ANNUAL ACCOUNTS 2019-20 469
CONSOLIDATED NOTES FORMING PART OF THE FINANCIAL STATEMENTSas at and for the year ended March 31, 2020
CONSOLIDATED NOTES FORMING PART OF THE FINANCIAL STATEMENTSas at and for the year ended March 31, 2020
Percentage allocation o plan assets o trust
Assets by categoryAs at
March 31, 2020As at
March 31, 2019
Government Securities 61.68% 65.66%Debentures / bonds 36.67% 33.09%Equity 1.65% 1.25%Fixed deposits 0.00% 0.00%
The remeasurement loss of ` 152 Crore has been charged to Other Comprehensive Income (OCI) during the year.
(b) Post-Retirement Medical Benefits: The Group has a scheme of medical benefits for employees at BMM and BALCO subsequent to their retirement on completion of tenure including retirement on medical grounds and voluntary retirement on contributory basis. The scheme includes employee’s spouses as well. Based on an actuarial valuation conducted as at year-end, a provision is recognised in full for the benefit obligation. The obligation relating to post-retirement medical benefits as at March 31, 2020 was ` 79 Crore (March 31, 2019: ` 65 Crore). The obligation under this plan is unfunded. The Group considers these amounts as not material and accordingly has not provided further disclosures as required by Ind AS 19 ‘Employee benefits’. The current service cost for the year ending March 31, 2020 of ` 1 Crore (March 31, 2019: ` 1 Crore) has been recognised in consolidated statement of profit and loss. The remeasurement losses / (gains) and net interest on the obligation of post-retirement medical benefits of ` 14 Crore (March 31, 2019: ` 1 Crore loss) and ` 6 Crore (March 31, 2019: ` 5 Crore) for the year ended March 31, 2020 have been recognised in other comprehensive income and finance cost respectively.
(c) Other Post-employment Benefits:ndia ratuity plan
In accordance with the Payment of Gratuity Act of 1972, Vedanta Limited and its Indian subsidiaries contribute to a defined benefit plan (the “Gratuity Plan”) covering certain categories of employees. The Gratuity Plan provides a lump sum payment to vested employees at retirement, disability or termination of employment being an amount based on the respective employee’s last drawn salary and the number of years of employment with the Group.
Based on actuarial valuations conducted as at year end using the projected unit credit method, a provision is recognised in full for the benefit obligation over and above the funds held in the Gratuity Plan. For entities where the plan is unfunded, full provision is recognised in the consolidated balance sheet.
The iron ore and oil & gas division of Vedanta Limited SRL, SMCL and HZL have constituted a trust recognised by Income Tax Authorities for gratuity to employees and contributions to the trust are funded with Life Insurance Corporation of India (LIC), ICICI Prudential Life Insurance Company Limited and HDFC Standard Life Insurance.
Principal actuarial assumptionsPrincipal actuarial assumptions used to determine the present value of the Other post-employment benefit Plan obligation are as follows:
ParticularsAs at
March 31, 2020As at
March 31, 2019
Discount rate 6.80% 7.80%Expected rate of increase in compensation level of covered employees 2%-15% 2%-15%Mortality table IALM (2012-14) IALM (2006-08)
Amount recognised in the consolidated balance sheet consists of:(` in Crore)
ParticularsAs at
March 31, 2020As at
March 31, 2019
Fair value of plan assets 442 387 Present value of defined benefit obligations (631) (589)Net liability arising from defined benefit obligation (189) (202)
Amounts recognised in consolidated statement of profit and loss in respect of Other post-employment benefit plan are as follows:
(` in Crore)
ParticularsYear ended
March 31, 2020Year ended
March 31, 2019
Current service cost 41 39 Net interest cost 15 16 Components of defined benefit costs recognised in consolidated statement of profit and loss
56 55
Amounts recognised in other comprehensive income in respect of Other post-employment benefit plan are as follows:
(` in Crore)
ParticularsYear ended
March 31, 2020Year ended
March 31, 2019
Re-measurement of the net defined benefit obligation:-Actuarial losses/ (gains) arising from changes in financial assumptions 16 (6)Actuarial losses arising from experience adjustments 28 41 Actuarial (gains)/ losses arising from changes in demographic assumptions (1) 2 Actuarial losses on plan assets (excluding amounts included in net interest cost) 1 2 Components of defined benefit costs recognised in other comprehensive income 44 39
The movement of the present value of the Other post-employment benefit plan obligation is as follows:(` in Crore)
ParticularsYear ended
March 31, 2020Year ended
March 31, 2019
Opening balance 589 546 Acquired in business combination - 15 Current service cost 41 39 Benefits paid (87) (90)Interest cost 45 42 Actuarial losses / (gains) arising from changes in assumptions 43 37 Closing balance 631 589
The movement in the fair value of Other post-employment benefit plan assets is as follows:(` in Crore)
ParticularsYear ended
March 31, 2020Year ended
March 31, 2019
Opening balance 387 339 Acquired in business combination - 16 Contributions received 86 82 Benefits paid (60) (74)Re-measurement gain/(loss) arising from return on plan assets (1) (2)Interest income 30 26 Closing balance 442 387
The above plan assets have been invested in the qualified insurance policies.
The actual return on plan assets was ` 29 Crore for the year ended March 31, 2020 and ` 24 Crore for the year ended March 31, 2019.
The weighted average duration of the defined benefit obligation is 14.3 years and 14.7 years as at March 31, 2020 and March 31, 2019 respectively.
The Group expects to contribute ` 57 Crore to the funded defined benefit plans during the year ending March 31, 2021.� � � � � � �
INTEGRATED REPORT MANAGEMENT REVIEW STATUTORY REPORTS FINANCIAL STATEMENTS
06-115 116-167 168-270 271-502

470 VEDANTA LIMITED INTEGRATED REPORT AND ANNUAL ACCOUNTS 2019-20 VEDANTA LIMITED INTEGRATED REPORT AND ANNUAL ACCOUNTS 2019-20 471
CONSOLIDATED NOTES FORMING PART OF THE FINANCIAL STATEMENTSas at and for the year ended March 31, 2020
CONSOLIDATED NOTES FORMING PART OF THE FINANCIAL STATEMENTSas at and for the year ended March 31, 2020
ensitivity analysis or De ned ene t PlanBelow is the sensitivity analysis determined for significant actuarial assumptions for the determination of defined benefit obligation and based on reasonably possible changes of the respective assumptions occurring at the end of the reporting period while holding all other assumptions constant.
(` in Crore)
Increase / (Decrease) in defined benefit obligationAs at
March 31, 2020As at
March 31, 2019
Discount rateIncrease by 0.50% (21) (18)Decrease by 0.50% 23 20 Expected rate of increase in compensation level of covered employeesIncrease by 0.50% 20 20 Decrease by 0.50% (20) (17)
The above sensitivity analysis may not be representative of the actual benefit obligation as it is unlikely that the change in assumptions would occur in isolation of one another as some of the assumptions may be correlated.
In presenting the above sensitivity analysis, the present value of defined benefit obligation has been calculated using the projected unit credit method at the end of reporting period, which is the same as that applied in calculating the defined obligation liability recognised in the consolidated balance sheet.
Ris analysisGroup is exposed to a number of risks in the defined benefit plans. Most significant risks pertaining to defined benefit plans and management estimation of the impact of these risks are as follows:
nvestment risMost of the Indian defined benefit plans are funded with Life Insurance Corporation of India (LIC), ICICI Prudential Life (ICICI) and HDFC Standard Life. Group does not have any liberty to manage the fund provided to LIC, ICICI prudential and HDFC Standard Life.
The present value of the defined benefit plan obligation is calculated using a discount rate determined by reference to Government of India bonds for Group’s Indian operations. If the return on plan asset is below this rate, it will create a plan deficit.
nterest risA decrease in the interest rate on plan assets will increase the net plan obligation.
ongevity ris i e expectancyThe present value of the defined benefit plan obligation is calculated by reference to the best estimate of the mortality of plan participants both during and at the end of the employment. An increase in the life expectancy of the plan participants will increase the plan obligation.
alary gro th risThe present value of the defined benefit plan obligation is calculated by reference to the future salaries of plan participants. An increase in the salary of the plan participants will increase the plan obligation.
31. FINANCE COST(` in Crore)
ParticularsYear ended
March 31, 2020Year ended
March 31, 2019
Interest expense on financial liabilities at amortised cost a,c,d 5,617 6,042 Other finance costs 261 364 Net interest on defined benefit arrangement 21 21 Unwinding of discount on provisions (Refer note 23) 96 93 Exchange difference regarded as an adjustment to borrowing cost 7 3 Less : Capitalisation of finance cost/borrowing cost b (Refer note 6) (1,017) (834)Less: Cost allocated/directly booked in joint ventures (8) (0)Total 4,977 5,689
a) Includes Nil (March 31, 2019: ` 157 Crore) on redeemable preference shares (including dividend distribution tax).
b) �Interest rate of 7.49% (March 31, 2019: 7.30%) was used to determine the amount of general borrowing costs eligible for capitalisation in respect of qualifying asset for the year ended March 31, 2020.
c) �Interest expense on income taxes is ` 0 Crore (March 31, 2019: ` 17 Crore).
d)� Interest expense on lease liabilities for the year ended March 31, 2020 is ` 25 Crore.
32. OTHER EXPENSES
(` in Crore)
ParticularsYear ended
March 31, 2020Year ended
March 31, 2019
Cess on crude oil 2,315 2,971 Royalty 2,670 2,891 Consumption of stores and spare parts 2,601 2,456 Share of expenses in producing oil and gas blocks 2,471 2,299 Repairs to Plant and equipment 2,517 2,153 Repairs to building 196 203 Repairs others 161 168 Carriage 1,539 1,568 Mine Expenses 2,242 1,934 Net loss on foreign currency transactions and translation 733 809 Other Selling Expenses 16 25 Insurance 193 185 Loss on sale/disposal of fixed asset (net) 56 68 Rent* 42 93 Rates and taxes 80 55 Amortisation of prepaid lease charges - 9 Exploration costs written off (Refer note 6) 3 50 Bad trade receivables and advances written off 17 33 Provision for doubtful advances/ expected credit loss 104 (33)Miscellaneous expenses 4,542 4,079 Less: Cost allocated/directly booked in joint ventures (305) (388)Total 22,193 21,628
*Rent for the year ended March 31, 2020 represents expense on short-term/ low value leases.
INTEGRATED REPORT MANAGEMENT REVIEW STATUTORY REPORTS FINANCIAL STATEMENTS
06-115 116-167 168-270 271-502
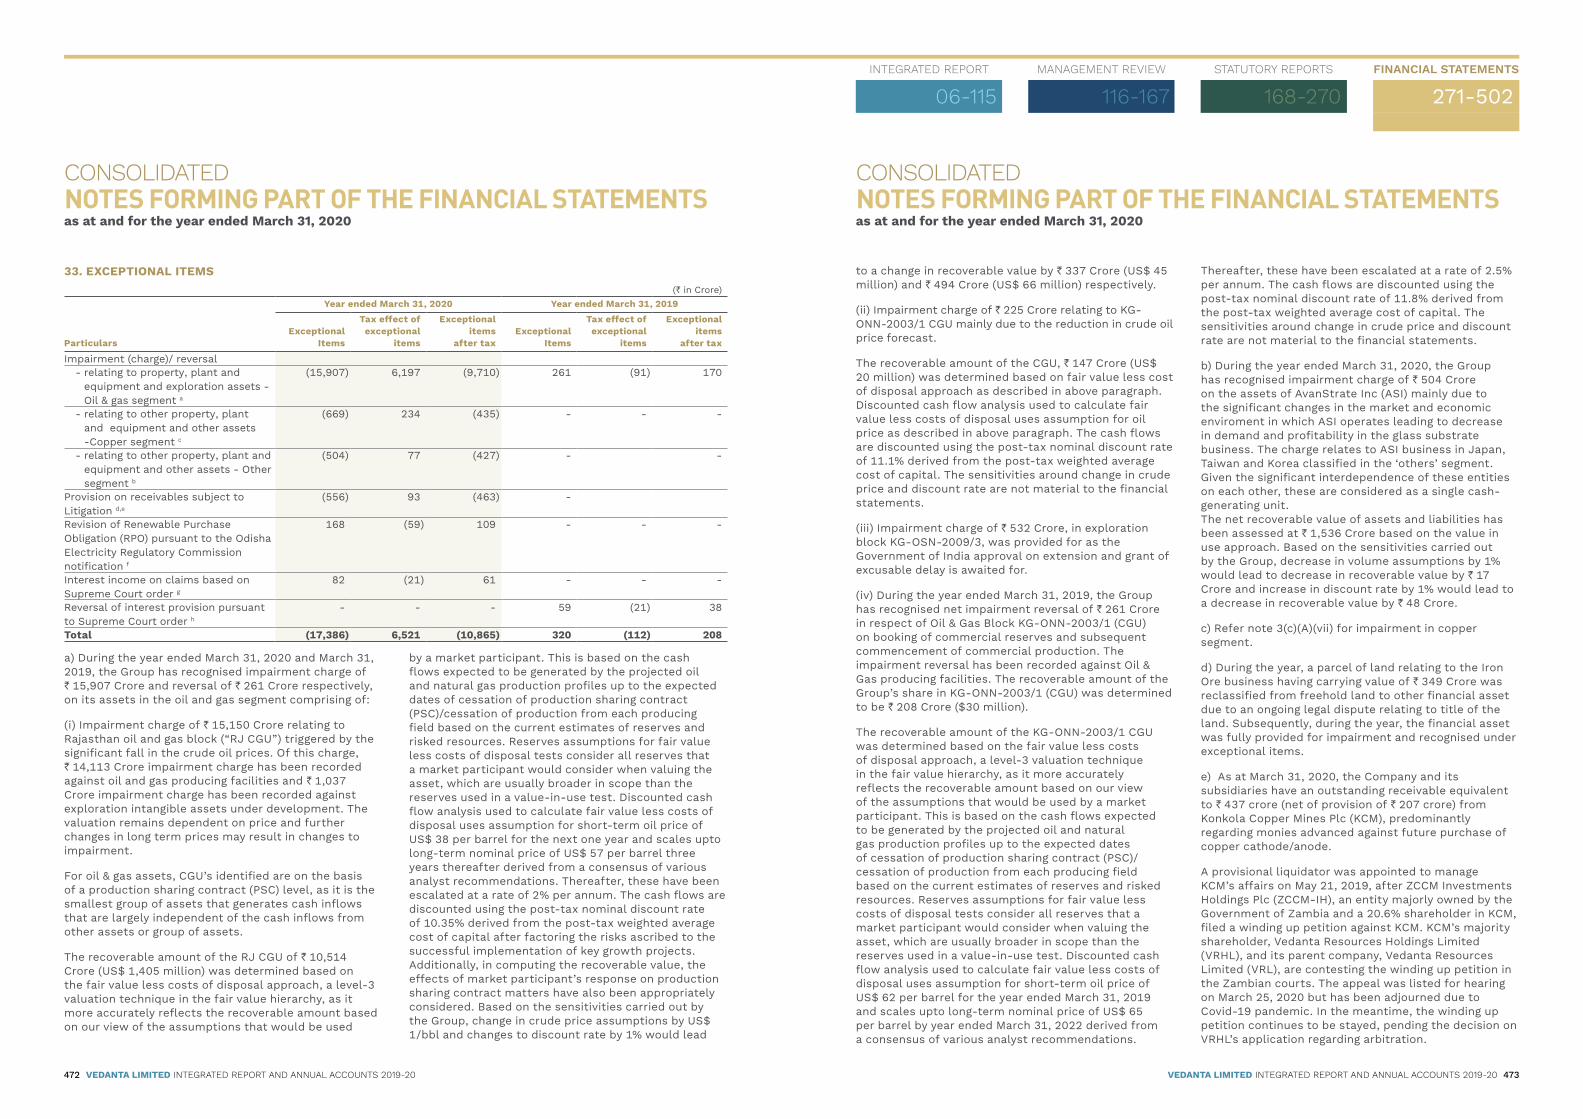
472 VEDANTA LIMITED INTEGRATED REPORT AND ANNUAL ACCOUNTS 2019-20 VEDANTA LIMITED INTEGRATED REPORT AND ANNUAL ACCOUNTS 2019-20 473
CONSOLIDATED NOTES FORMING PART OF THE FINANCIAL STATEMENTSas at and for the year ended March 31, 2020
CONSOLIDATED NOTES FORMING PART OF THE FINANCIAL STATEMENTSas at and for the year ended March 31, 2020
33. EXCEPTIONAL ITEMS(` in Crore)
Particulars
Year ended March 31, 2020 Year ended March 31, 2019
Exceptional Items
Tax effect of exceptional
items
Exceptional items
after tax Exceptional
Items
Tax effect of exceptional
items
Exceptional items
after tax
Impairment (charge)/ reversal � - �relating to property, plant and
equipment and exploration assets - Oil & gas segment a
(15,907) 6,197 (9,710) 261 (91) 170
� - �relating to other property, plant and equipment and other assets -Copper segment c
(669) 234 (435) - - -
� - �relating to other property, plant and equipment and other assets - Other segment b
(504) 77 (427) - -
Provision on receivables subject to Litigation d,e
(556) 93 (463) -
Revision of Renewable Purchase Obligation (RPO) pursuant to the Odisha Electricity Regulatory Commission notification f
168 (59) 109 - - -
Interest income on claims based on Supreme Court order g
82 (21) 61 - - -
Reversal of interest provision pursuant to Supreme Court order h
- - - 59 (21) 38
Total (17,386) 6,521 (10,865) 320 (112) 208
a) During the year ended March 31, 2020 and March 31, 2019, the Group has recognised impairment charge of ` 15,907 Crore and reversal of ` 261 Crore respectively, on its assets in the oil and gas segment comprising of:
(i) Impairment charge of ` 15,150 Crore relating to Rajasthan oil and gas block (“RJ CGU”) triggered by the significant fall in the crude oil prices. Of this charge, ` 14,113 Crore impairment charge has been recorded against oil and gas producing facilities and ` 1,037 Crore impairment charge has been recorded against exploration intangible assets under development. The valuation remains dependent on price and further changes in long term prices may result in changes to impairment.
For oil & gas assets, CGU’s identified are on the basis of a production sharing contract (PSC) level, as it is the smallest group of assets that generates cash inflows that are largely independent of the cash inflows from other assets or group of assets.
The recoverable amount of the RJ CGU of ` 10,514 Crore (US$ 1,405 million) was determined based on the fair value less costs of disposal approach, a level-3 valuation technique in the fair value hierarchy, as it more accurately reflects the recoverable amount based on our view of the assumptions that would be used
by a market participant. This is based on the cash flows expected to be generated by the projected oil and natural gas production profiles up to the expected dates of cessation of production sharing contract (PSC)/cessation of production from each producing field based on the current estimates of reserves and risked resources. Reserves assumptions for fair value less costs of disposal tests consider all reserves that a market participant would consider when valuing the asset, which are usually broader in scope than the reserves used in a value-in-use test. Discounted cash flow analysis used to calculate fair value less costs of disposal uses assumption for short-term oil price of US$ 38 per barrel for the next one year and scales upto long-term nominal price of US$ 57 per barrel three years thereafter derived from a consensus of various analyst recommendations. Thereafter, these have been escalated at a rate of 2% per annum. The cash flows are discounted using the post-tax nominal discount rate of 10.35% derived from the post-tax weighted average cost of capital after factoring the risks ascribed to the successful implementation of key growth projects. Additionally, in computing the recoverable value, the effects of market participant’s response on production sharing contract matters have also been appropriately considered. Based on the sensitivities carried out by the Group, change in crude price assumptions by US$ 1/bbl and changes to discount rate by 1% would lead
to a change in recoverable value by ` 337 Crore (US$ 45 million) and ` 494 Crore (US$ 66 million) respectively.
(ii) Impairment charge of ` 225 Crore relating to KG-ONN-2003/1 CGU mainly due to the reduction in crude oil price forecast.
The recoverable amount of the CGU, ` 147 Crore (US$ 20 million) was determined based on fair value less cost of disposal approach as described in above paragraph. Discounted cash flow analysis used to calculate fair value less costs of disposal uses assumption for oil price as described in above paragraph. The cash flows are discounted using the post-tax nominal discount rate of 11.1% derived from the post-tax weighted average cost of capital. The sensitivities around change in crude price and discount rate are not material to the financial statements.
(iii) Impairment charge of ` 532 Crore, in exploration block KG-OSN-2009/3, was provided for as the Government of India approval on extension and grant of excusable delay is awaited for.
(iv) During the year ended March 31, 2019, the Group has recognised net impairment reversal of ` 261 Crore in respect of Oil & Gas Block KG-ONN-2003/1 (CGU) on booking of commercial reserves and subsequent commencement of commercial production. The impairment reversal has been recorded against Oil & Gas producing facilities. The recoverable amount of the Group’s share in KG-ONN-2003/1 (CGU) was determined to be ` 208 Crore ($30 million).
The recoverable amount of the KG-ONN-2003/1 CGU was determined based on the fair value less costs of disposal approach, a level-3 valuation technique in the fair value hierarchy, as it more accurately reflects the recoverable amount based on our view of the assumptions that would be used by a market participant. This is based on the cash flows expected to be generated by the projected oil and natural gas production profiles up to the expected dates of cessation of production sharing contract (PSC)/cessation of production from each producing field based on the current estimates of reserves and risked resources. Reserves assumptions for fair value less costs of disposal tests consider all reserves that a market participant would consider when valuing the asset, which are usually broader in scope than the reserves used in a value-in-use test. Discounted cash flow analysis used to calculate fair value less costs of disposal uses assumption for short-term oil price of US$ 62 per barrel for the year ended March 31, 2019 and scales upto long-term nominal price of US$ 65 per barrel by year ended March 31, 2022 derived from a consensus of various analyst recommendations.
Thereafter, these have been escalated at a rate of 2.5% per annum. The cash flows are discounted using the post-tax nominal discount rate of 11.8% derived from the post-tax weighted average cost of capital. The sensitivities around change in crude price and discount rate are not material to the financial statements.
b) During the year ended March 31, 2020, the Group has recognised impairment charge of ` 504 Crore on the assets of AvanStrate Inc (ASI) mainly due to the significant changes in the market and economic enviroment in which ASI operates leading to decrease in demand and profitability in the glass substrate business. The charge relates to ASI business in Japan, Taiwan and Korea classified in the ‘others’ segment. Given the significant interdependence of these entities on each other, these are considered as a single cash-generating unit. The net recoverable value of assets and liabilities has been assessed at ` 1,536 Crore based on the value in use approach. Based on the sensitivities carried out by the Group, decrease in volume assumptions by 1% would lead to decrease in recoverable value by ` 17 Crore and increase in discount rate by 1% would lead to a decrease in recoverable value by ` 48 Crore.
c) Refer note 3(c)(A)(vii) for impairment in copper segment.
d) During the year, a parcel of land relating to the Iron Ore business having carrying value of ` 349 Crore was reclassified from freehold land to other financial asset due to an ongoing legal dispute relating to title of the land. Subsequently, during the year, the financial asset was fully provided for impairment and recognised under exceptional items.
e) As at March 31, 2020, the Company and its subsidiaries have an outstanding receivable equivalent to ` 437 crore (net of provision of ` 207 crore) from Konkola Copper Mines Plc (KCM), predominantly regarding monies advanced against future purchase of copper cathode/anode.
A provisional liquidator was appointed to manage KCM’s affairs on May 21, 2019, after ZCCM Investments Holdings Plc (ZCCM-IH), an entity majorly owned by the Government of Zambia and a 20.6% shareholder in KCM, filed a winding up petition against KCM. KCM’s majority shareholder, Vedanta Resources Holdings Limited (VRHL), and its parent company, Vedanta Resources Limited (VRL), are contesting the winding up petition in the Zambian courts. The appeal was listed for hearing on March 25, 2020 but has been adjourned due to Covid-19 pandemic. In the meantime, the winding up petition continues to be stayed, pending the decision on VRHL’s application regarding arbitration.
INTEGRATED REPORT MANAGEMENT REVIEW STATUTORY REPORTS FINANCIAL STATEMENTS
06-115 116-167 168-270 271-502

474 VEDANTA LIMITED INTEGRATED REPORT AND ANNUAL ACCOUNTS 2019-20 VEDANTA LIMITED INTEGRATED REPORT AND ANNUAL ACCOUNTS 2019-20 475
CONSOLIDATED NOTES FORMING PART OF THE FINANCIAL STATEMENTSas at and for the year ended March 31, 2020
CONSOLIDATED NOTES FORMING PART OF THE FINANCIAL STATEMENTSas at and for the year ended March 31, 2020
VRHL and VRL had also commenced arbitration proceedings against ZCCM-IH with seat in Johannesburg consistent with their position that arbitration is the agreed dispute resolution process. Hearing is expected in January 2021. Meanwhile, KCM has not been supplying goods to the Company and/or its subsidiaries, which it was supposed to as per the terms of the advance.
The Group has recognised provision of ` 207 Crore during the current year and based on its assessment considering the actions taken by VRL and VRHL, believes that there is a high probability of success and has thus continued to treat balance receivables as recoverable.
f) During the current year, the Company has restated its Renewable Power Obligation (RPO) liability pursuant to Odisha Electricity Regulatory Commission (OERC) notification dated December 31, 2019 which clarified that for CPP’s commissioned before April 01, 2016, RPO should be pegged at the RPO obligation applicable for 2015-16. Based on the notification, liability of Vedanta Limited Jharsuguda and Lanjigarh plants have been
revised and ` 168 Crore reversal relating to previous years have been recognised under exceptional items.
g) On the contempt petition filed by TSPL, the Hon’ble Supreme Court of India vide its order dated August 07, 2019 allowed gross calorific value (GCV) on as received basis (ARB) and actual cost of coal in the Energy Charge Formula and directed Punjab State Power Corporation Limited (PSPCL) to make the payments within 8 weeks. Pursuant to the order, PSPCL has paid ` 1,002 Crore in September 2019 and October 2019. TSPL has booked an interest of ` 140 Crore due to the delay in receipt of payment as per the Supreme Court order dated March 07, 2018 allowing the interest on delay in payment. Of this interest ` 82 Crore pertaining to period prior to March 31, 2019 is booked under exceptional items and amount of ` 58 Crore for current period is booked in Other income.
h) During the year ended March 31, 2019, the Company has partly reversed the provision for interest of ` 59 Crore for dues towards a vendor pursuant to the Honorable Supreme Court of India order.
34. TAX(a) Tax (credit)/charge recognised in profit or loss (including on exceptional items)
(` in Crore)
ParticularsYear ended
March 31, 2020Year ended
March 31, 2019
Current tax:Current tax on profit for the year 1,791 2,683 Credit in respect of current tax for earlier years (3) (6)Total Current Tax (a) 1,788 2,677 Deferred tax:Origination and reversal of temporary differences (475) 1,075 Credit in respect of deferred tax for earlier years (9) (2)(Credit)/ Charge in respect of exceptional items (Refer Note 33) (6,521) 112 Deferred Tax (b) (7,005) 1,185 Deferred Tax on distributable reserve of/ dividend from subsidiary (c) 1,701 - Total Deferred Tax (d)=(b+c) (5,304) 1,185 Total income tax (benefit)/expense for the year (a+d) (3,516) 3,862 (Loss)/Profit before tax (8,259) 13,560 Effective income tax rate (%) 43% 28%
Tax (benefit)/ expense(` in Crore)
ParticularsYear ended
March 31, 2020Year ended
March 31, 2019
Tax effect on exceptional items (6,521) 112 Tax expense- others 3,005 3,750 Net tax (benefit)/ expense (3,516) 3,862
(b) A reconciliation of income tax expense/ (credit) applicable to profit/ (loss) before tax at the Indian statutory income tax rate to recognise income tax expense for the year indicated are as follows:
(` in Crore)
ParticularsYear ended
March 31, 2020Year ended
March 31, 2019
(Loss) / Profit before tax (8,259) 13,560 Indian statutory income tax rate 34.944% 34.944%Tax at statutory income tax rate (2,886) 4,739 Disallowable expenses 189 241 Non-taxable income (141) (192)Tax holidays and similar exemptions (501) (808)Effect of tax rate differences of subsidiaries operating at other tax rates (107) (43)Deferred Tax on distributable reserve of/ dividend from subsidiary 1,701 - Unrecognised tax assets (net) (70) (73)Change in deferred tax balances due to change in tax law* (1,912) - Capital Gains subject to lower tax rate (273) (206)Credit in respect of earlier years (12) (8)Other permanent differences 496 212 Total (3,516) 3,862
* Deferred tax charge for the year ended 31 March 2020 includes deferred tax credit of ` 1,774 crore on deferred tax balances as at March 31, 2019 being recognised during the current year (refer note 3(c)(A)(ix)).�� � � � � � � �
Certain businesses of the Group within India are eligible for specified tax incentives which are included in the table above as tax holidays and similar exemptions. Most of such tax exemptions are relevant for the companies operating in India. These are briefly described as under:
The location based exemptionIn order to boost industrial and economic development in undeveloped regions, provided certain conditions are met, profits of newly established undertakings located in certain areas in India may benefit from tax holiday under section 80IC of the Income Tax Act, 1961. Such tax holiday works to exempt 100% of the profits for the first five years from the commencement of the tax holiday, and 30% of profits for the subsequent five years. This deduction is available only for units established up to March 31, 2012. However, such undertaking would continue to be subject to the Minimum Alternative tax (‘MAT’).�
In the current year, undertaking at Pantnagar, which is part of Hindustan Zinc Limited (Zinc India), is the only unit eligible for deduction at 30% of taxable profit.�
The location based exemption: SEZ Operations In order to boost industrial development and exports, provided certain conditions are met, profits of undertaking located in Special Economic Zone (‘SEZ’) may benefit from tax holiday. Such tax holiday works to exempt 100% of the profits for the first five years from the commencement of the tax holiday, 50% of profits for five years thereafter and 50% of the profits
for further five years provided the amount allowable in respect of deduction is credited to Special Economic Zone Re-Investment Reserve account. However, such undertaking would continue to be subject to the Minimum Alternative tax (‘MAT’).The Group has setup SEZ Operations in its aluminium division of Vedanta Limited (where no benefit has been drawn).
Sectoral Benefit - Power Plants and Port OperationsTo encourage the establishment of infrastructure certain power plants and ports have been offered income tax exemptions of upto 100% of profits and gains for any ten consecutive years within the 15 year period following commencement of operations subject to certain conditions under section 80IA of the Income Tax Act, 1961. The Group currently has total operational capacity of 8.4 Giga Watts (GW) of thermal based power generation facilities and wind power capacity of 274 Mega Watts (MW) and port facilities. However, such undertakings would continue to be subject to MAT provisions.
The Group has power plants which benefit from such deductions, at various locations of Hindustan Zinc Limited (where such benefits has been drawn), Talwandi Sabo Power Limited, Vedanta Limited and Bharat Aluminium Company Limited (where no benefit has been drawn).
The Group operates a zinc refinery in Export Processing Zone, Namibia which has been granted tax exempt status by the Namibian government.
INTEGRATED REPORT MANAGEMENT REVIEW STATUTORY REPORTS FINANCIAL STATEMENTS
06-115 116-167 168-270 271-502

476 VEDANTA LIMITED INTEGRATED REPORT AND ANNUAL ACCOUNTS 2019-20 VEDANTA LIMITED INTEGRATED REPORT AND ANNUAL ACCOUNTS 2019-20 477
CONSOLIDATED NOTES FORMING PART OF THE FINANCIAL STATEMENTSas at and for the year ended March 31, 2020
CONSOLIDATED NOTES FORMING PART OF THE FINANCIAL STATEMENTSas at and for the year ended March 31, 2020
In addition, the subsidiaries incorporated in Mauritius are eligible for tax credit to the extent of 80% of the applicable tax rate on foreign source income.
The total effect of such tax holidays and exemptions was ` 501 Crore for the year ended March 31, 2020 (March 31, 2019: ` 808 Crore).
(c) Deferred tax assets/liabilitiesThe Group has accrued significant amounts of deferred tax. The majority of the deferred tax liability represents accelerated tax relief for the depreciation of property, plant and equipment, the depreciation of mining reserves and the fair value uplifts created on acquisitions, net of losses carried forward by Vedanta Limited (post the re-organisation) and unused tax credits in the form of MAT credits carried forward in Vedanta Limited, Cairn Energy Hydrocarbons Limited and Hindustan Zinc Limited. Significant components of Deferred tax (assets) and liabilities recognised in the consolidated balance sheet are as follows:
For the year ended 31 March 2020
(` in Crore)
Significant components of Deferred tax (assets) & liabilities
Opening balance as at April 01, 2019
Charged / (credited) to statement of
profit and loss
Charged / (credited)
to other comprehensive
income
Charged / (credited) to
equity
Exchange difference
transferred to translation
of foreign operation
Closing balance as
at March 31,2020
Property, Plant and Equipment 15,958 (6,783) - - 7 9,182 Voluntary retirement scheme (40) 11 - - - (29)Employee benefits (120) 1 (71) - 4 (186)Fair valuation of derivative asset/liability (45) (7) 32 - - (20)Fair valuation of other asset/liability 820 91 1 - 58 970 MAT credit entitlement (10,321) 910 23 252 14 (9,122)Unabsorbed depreciation and business losses
(4,560) (922) - - - (5,482)
Taxes on distributable reserve of subsidiary - 1,582 - - - 1,582 Other temporary differences (683) (187) (58) - 29 (899)Total 1,009 (5,304) (73) 252 112 (4,004)
For the year ended 31 March 2019
(` in Crore)
Significant components of Deferred tax (assets) & liabilities
Opening balance as at April 01, 2019
Charged / (credited) to statement of
profit and loss
Charged / (credited)
to other comprehensive
income
Charged / (credited) to
equity
Exchange difference
transferred to translation
of foreign operation
Closing balance as
at March 31,2020
Property, Plant and Equipment 14,032 1,712 - - 214 15,958 Voluntary retirement scheme (42) 2 - - - (40)Employee benefits (97) (2) (25) - 4 (120)Fair valuation of derivative asset/liability (78) 42 (9) - - (45)Fair valuation of other asset/liability 955 (126) (17) - 8 820 MAT credit entitlement (11,084) 727 37 - (1) (10,321)Unabsorbed depreciation and business losses
(3,462) (1,098) - - - (4,560)
Dividend distribution tax* (338) - - 338 - - Other temporary differences (602) (72) (12) - 3 (683)Total (716) 1,185 (26) 338 228 1,009
*represents dividend distribution tax paid by a subsidiary for which credit has been availed.
Deferred tax assets and liabilities have been offset where they arise in the same taxing jurisdiction with a legal right to offset current income tax assets against current income tax liabilities but not otherwise. Accordingly the net deferred tax (assets)/liability has been disclosed in the Consolidated Balance Sheet as follows:
(` in Crore)
ParticularsYear ended
March 31, 2020Year ended
March 31, 2019
Deferred tax assets (6,889) (3,475)Deferred tax liabilities 2,885 4,484 Net Deferred tax (assets) / Liabilities (4,004) 1,009
Recognition of deferred tax assets on MAT credit entitlement is based on the respective legal entity’s present estimates and business plans as per which the same is expected to be utilised within the stipulated fifteen year period from the date of origination (Refer note 3(c)(A)(vi)).
Deferred tax assets in the Group have been recognised to the extent there are sufficient taxable temporary differences relating to the same taxation authority and the same taxable entity which are expected to reverse. For certain components of the Group, deferred tax assets on carry forward unused tax losses have been recognised to the extent of deferred tax liabilities on taxable temporary differences available. It is expected that any reversals of the deferred tax liability would be offset against the reversal of the deferred tax asset at respective entities.
Unused tax losses / unused tax credit for which no deferred tax asset has been recognised amount to ` 17,658 Crore and ` 12,114 Crore as at March 31, 2020 and March 31, 2019 respectively.
As at March 31, 2020
(` in Crore)
Unused tax losses/ unused tax credit Within one year
Greater than one year, less
than five years Greater than
five years No expiry date TotalUnutilised business losses 555 2,588 4,916 1,574 9,633 Unabsorbed depreciation - - - 8,016 8,016 Unutilised R&D credit - - - 9 9 Total 555 2,588 4,916 9,599 17,658
(` in Crore)
Unused tax losses/ unused tax credit Within one year
Greater than one year, less
than five years Greater than
five years No expiry date TotalUnutilised business losses 128 1,094 628 1,527 3,377 Unabsorbed depreciation - - - 8,728 8,728 Unutilised R&D credit - - - 9 9 Total 128 1,094 628 10,264 12,114
No deferred tax assets has been recognised on these unused tax losses/ unused tax credit as there is no evidence that sufficient taxable profit will be available in future against which these can be utilised by the respective entities.
MAT credits are taxes paid to Indian tax authorities which can be offset against future tax liabilities, subject to certain restrictions, within a period of 15 years from the year of origination. The Group recognises MAT assets only to the extent it expects to realise the same within the prescribed period.
INTEGRATED REPORT MANAGEMENT REVIEW STATUTORY REPORTS FINANCIAL STATEMENTS
06-115 116-167 168-270 271-502

478 VEDANTA LIMITED INTEGRATED REPORT AND ANNUAL ACCOUNTS 2019-20 VEDANTA LIMITED INTEGRATED REPORT AND ANNUAL ACCOUNTS 2019-20 479
CONSOLIDATED NOTES FORMING PART OF THE FINANCIAL STATEMENTSas at and for the year ended March 31, 2020
CONSOLIDATED NOTES FORMING PART OF THE FINANCIAL STATEMENTSas at and for the year ended March 31, 2020
Further, the Group has unused MAT credit amounting to ` 400 crore as at March 31, 2020 and March 31, 2019. Such tax credits have not been recognised on the basis that recovery is not probable in the foreseeable future. Unrecognised MAT credit expires, if unutilised, based on the year of origination as follows:
(` in Crore)
Year of ExpiryAs at
March 31, 2020As at
March 31, 2019
2022 104 104 2023 14 14 2024 52 52 2025 52 52 2026 103 103 2027 63 63 2028 8 8 2029 4 4 Total 400 400
The Group has not recognised any deferred tax liabilities for taxes that would be payable on the Group’s share in unremitted earnings of certain of its subsidiaries because the Group controls when the liability will be incurred and it is probable that the liability will not be incurred in the foreseeable future. The amount of unremitted earnings are ` 33,618 crore and ` 32,485 crore as at March 31, 2020 and March 31, 2019 respectively.
(d) Non- current tax assets Non- current tax assets of ` 2,645 crore (March 31, 2019: ` 3,484 crore) mainly represents income tax receivable from Indian tax authorities by Vedanta Limited relating to the refund arising consequent to the Scheme of Amalgamation & Arrangement made effective in August 2013 pursuant to approval by the jurisdiction High Court and receivables relating to matters in tax disputes in Group companies including tax holiday claim.
(e) The tax department had raised demands on account of remeasurement of certain tax incentives, as described below, under section 80IA and 80 IC of the Income tax Act. During the current year, based on the favorable orders from Income Tax Appellate Tribunal relating to AY 09-10 to AY 12-13, the Commissioner of Income Tax (Appeals) has allowed these claims for AY 14-15 to AY 15-16, which were earlier disallowed and has granted refund of amounts deposited under protest. Against the Tribunal order, department had filed an appeal in Hon’ble Rajasthan High Court in financial year 17-18 which is yet to be admitted. As per the view of external legal counsel, Department’s appeal seeks re-examination of facts rather than raising any substantial question of law and hence it is unlikely that appeal will be admitted by the High Court. Due to this there is a strong prima facie case that ITAT order will stand confirmed and department’s appeal would be dismissed. The amount involved in this dispute as of March 31, 2020 is ` 10,566 crore (March 31, 2019: ` 6,017 crore) plus applicable interest upto the date of settlement of the dispute.�
35. EARNINGS PER EQUITY SHARE(` in Crore, except otherwise stated)
ParticularsYear ended
March 31, 2020Year ended
March 31, 2019
(Loss)/ Profit after tax attributable to equity share holders for Basic and Diluted EPS
A (6,664) 7,065
Computation of weighted average number of shares (in Crore)Weighted average number of ordinary shares outstanding during the year excluding shares acquired for ESOP for basic earnings per share
B 370.26 370.55
Effect of dilution:Potential ordinary shares relating to share option awards * 2.12 1.59 Adjusted weighted average number of shares of the Company in issue C 370.26 372.14 Basic earnings/ (loss) per equity share ( ) A / B (18.00) 19.07 Diluted earnings/ (loss) per equity share ( ) A / C (18.00) 18.98 Nominal Value per Share (in ) 1.00 1.00
*Potential dilutive shares have been considered as anti dilutive for year ended March 31, 2020
36. DISTRIBUTIONS MADE AND PROPOSED (` in Crore, except otherwise stated)
ParticularsYear ended
March 31, 2020Year ended
March 31, 2019
Amounts recognised as distributions to equity share holders:Interim dividend (March 31, 2020: ` 3.90/- per share, March 31, 2019: ` 17.00/- and ` 1.85/- per share) a
1,444 7,005
Dividend distribution tax (DDT) on above a 252 1,437 1,696 8,442
Preference dividend on redeemable preference shares: Preference dividends for the year: 7.5% p.a b - 130 Dividend distribution tax on preference dividend� � - 27
- 157
a. An interim dividend of ` 3.90 per share was declared during the current year ended March 31, 2020 (March 31, 2019: Two interim dividends of ` 17.00 and ` 1.85 per share).
For the previous year , this includes interim dividend of ` 17.00 per share amounting to ` 26 Crore and dividend distribution tax of ` 5 Crore payable on 1,49,98,802 equity shares held by Vedanta Limited through ESOP trust for its stock options. (Refer note 16)
b. Dividend @ 7.5% p.a. on the redeemable preference shares of face value of ` 10/- per preference share for the period from April 01, 2018 to October 27, 2018 , as per their terms of issuance was declared during the year ended March 31, 2019. The same has been accounted for as interest cost and has been recorded in the Consolidated Statement of Profit and Loss. These preference shares were redeemed, along with dividend on October 26, 2018.�
37. COMMITMENTS, CONTINGENCIES AND GUARANTEESA) CommitmentsThe Group has a number of continuing operational and financial commitments in the normal course of business including:
� Exploratory mining commitments;
� Oil & gas commitments;
� Mining commitments arising under production sharing agreements; and
� Completion of the construction of certain assets.
a) Estimated amount of contracts remaining to be executed on capital accounts and not provided for:(` in Crore)
ParticularsAs at
March 31, 2020As at
March 31, 2019
Oil & Gas sectorCairn India 3,360 5,510 Aluminium sectorLanjigarh Refinery (Phase II) 1,573 1,443 Jharsuguda 1.25 MTPA smelter 414 460 Zinc sectorZinc India (mines expansion, solar and smelter) 912 1,935 Gamsberg mining & milling project 131 183 Copper sectorTuticorin Smelter 400 KTPA* 2,791 2,794 Others 1,611 1,362 Total 10,792 13,687
*currently contracts are under suspension under the force majeure clause as per the contract.
INTEGRATED REPORT MANAGEMENT REVIEW STATUTORY REPORTS FINANCIAL STATEMENTS
06-115 116-167 168-270 271-502

480 VEDANTA LIMITED INTEGRATED REPORT AND ANNUAL ACCOUNTS 2019-20 VEDANTA LIMITED INTEGRATED REPORT AND ANNUAL ACCOUNTS 2019-20 481
CONSOLIDATED NOTES FORMING PART OF THE FINANCIAL STATEMENTSas at and for the year ended March 31, 2020
CONSOLIDATED NOTES FORMING PART OF THE FINANCIAL STATEMENTSas at and for the year ended March 31, 2020
b) Commitments related to the minimum work programme (Other than capital commitment):(` in Crore)
ParticularsAs at
March 31, 2020As at
March 31, 2019
Oil & Gas sectorCairn India (OALP - New Oil and Gas blocks) 5,841 3,811
c) Other Commitments(i) �Power Division of the Company has signed a long
term power purchase agreement (PPA) with Gridco Limited for supply of 25% of power generated from the power station with additional right to purchase power (5%/7%) at variable cost as per the conditions referred to in PPA . The PPA has a tenure of twenty five years.
(ii) �TSPL has signed a long term power purchase agreement (PPA) with Punjab State Power Corporation Limited (PSPCL) [formerly known as Punjab State Electricity Board (PSEB)] for supply of power generated from the power plant. The PPA has tenure of twenty five years.�
B) GuaranteesThe aggregate amount of indemnities and other guarantees on which the Group does not expect any material losses, was ` 6,487 Crore (March 31, 2019: ` 7,745 Crore). The Group has given guarantees in the normal course of business as stated below:
a) �Guarantees and bonds advanced to the customs authorities in India of ` 471 Crore relating to the export and payment of import duties on purchases of raw material and capital goods (March 31, 2019: ` 676 Crore).
b) �Guarantees issued for Group’s share of minimum work programme commitments of ` 2,906 Crore (March 31, 2019: ` 2,367 Crore).
c) �Guarantee issued against liabilities for structured investment (refer note 38 for details of the transactions) worth ` 1,916 Crore as at March 31, 2019 (relinquished during the year due to liquidation of these investments)
d) �Guarantees of ` 54 Crore issued under bid bond (March 31, 2019: ` 543 Crore).
e) �Bank guarantees of ` 115 Crore (March 31, 2019: ` 115 Crore) has been provided by the Group on behalf of Volcan Investments Limited to Income tax department, India as a collateral in respect of certain tax disputes.
f) �Other guarantees worth ` 2,941 Crore (March 31, 2019: ` 2,128 Crore) issued for securing supplies of
materials and services, in lieu of advances received from customers, litigation, for provisional valuation of custom duty and also to various agencies, suppliers and government authorities for various purposes. The Group does not anticipate any liability on these guarantees.
C) Export ObligationsThe Indian entities of the Group have export obligations of ` 3,827 Crore (March 31, 2019: ` 3,234 Crore) on account of concessional rates of import duty paid on capital goods under the Export Promotion Capital Goods Scheme and under the Advance Licence Scheme for the import of raw material laid down by the Government of India.
In the event of the Group’s inability to meet its obligations, the Group’s liability would be ` 607 Crore (March 31, 2019: ` 433 Crore) reduced in proportion to actual exports, plus applicable interest.
The Group has given bonds of ` 1,695 Crore (March 31, 2019: ` 1,557 Crore) to custom authorities against these export obligations.
D) Contingent Liabilitiesa) Hindustan Zinc Limited: Department of Mines and GeologyThe Department of Mines and Geology of the State of Rajasthan issued several show cause notices in August, September and October 2006 to HZL, amounting to ` 334 Crore. These notices alleged unlawful occupation and unauthorised mining of associated minerals other than zinc and lead at HZL’s Rampura Agucha, Rajpura Dariba and Zawar mines in Rajasthan during the period from July 1968 to March 2006. HZL believes that the likelihood of this claim is not probable and thus no provision has been made in the financial statements. HZL had filed writ petitions in the High Court of Rajasthan in Jodhpur and had obtained a stay in respect of these demands. The High Court restrained the Department of Mines and Geology from undertaking any coercive measures to recover the penalty. In January 2007, the High Court issued another order granting the Department of Mines and Geology additional time to file their reply and also ordered the Department of Mines and Geology not to issue any order cancelling the lease. The case is yet to be listed in the Rajasthan High Court.
b) Vedanta Limited: Income taxIn March 2014, Vedanta Limited (notice was served on Cairn India Limited which subsequently merged with Vedanta Limited, accordingly now referred to as Vedanta Limited) received a show cause notice from the Indian Tax Authorities (‘Tax Authorities’) for not deducting withholding tax on the payments made to Cairn UK Holdings Limited (CUHL), for acquiring shares of Cairn India Holdings Limited (CIHL), as part of their internal reorganisation. The Tax Authorities have stated in the notice that a short-term capital gain has accrued to CUHL on transfer of the shares of CIHL to Vedanta Limited, in the financial year 2006–2007, on which tax should have been withheld by the Company. Pursuant to this, various replies were filed with the Tax Authorities. After several hearings, the Income Tax Authority, in March 2015, issued an order holding the Company as ‘assessee in default’ and raised a demand totalling ` 20,495 Crore (including interest of ` 10,247 Crore). The Company had filed an appeal before the First Appellate Authority, Commissioner of Income Tax (Appeals) which vide order dated July 03, 2017 confirmed the tax demand against the Company. The Company has challenged the Commissioner of Income Tax’s (Appeals) order before the Income Tax Appellate Tribunal (ITAT).
The Group also filed a writ petition before the Delhi High Court wherein it has raised several points for assailing the aforementioned Income Tax Authority’s order. The matter came up for hearing on February 05, 2020 before Delhi High Court but adjourned and the next date of hearing is September 28, 2020.
Separately CUHL, on whom the primary liability of tax lies, had received an Order from the ITAT in the financial year 2016-17 holding that the transaction is taxable in view of the clarification made in the Act but also acknowledged that being a retrospective transaction, interest would not be levied. Hence affirming a demand of ` 10,247 Crore excluding the interest portion that had previously been claimed. The tax department has appealed this order before the Delhi High Court. As a result of the above order from ITAT, the Group considers the risk in respect of the interest portion of claim to be remote. Further, as per the recent recovery notice dated October 12, 2018 received from the Tax Recovery Officer (TRO) appointed for CUHL, tax demand of CUHL of approx. ` 4,996 Crore along with interest is outstanding. Further, in the said notice, tax department had also instructed to remit the preference shares redemption amount including dividend payable thereon to the TRO. Accordingly, amount aggregating to ` 607 Crore has been paid to the TRO on October 26, 2018 thus reducing the liability to ` 4,389 Crore.
Vedanta has also paid interim dividend of ` 5 Crore to the TRO. Accordingly, the Group has revised the contingent liability to ` 4,384 Crore (March 31, 2019: ` 4,385 Crore). In the event, the case is finally decided against the Company, the demand payable along with interest as per the above mentioned order would be ` 20,495 Crore, of which only ` 4,384 Crore is considered as possible. Separately, but in connection with this litigation, Vedanta Resources Limited has filed a Notice of Claim against the Government of India (‘GOI’) under the UK India Bilateral Investment Treaty (the BIT). The International Arbitration Tribunal passed a favourable order on jurisdiction and Transparency and hearing on merits have been completed in May 2019 and order will be passed in due course. The Government of India has challenged the Jurisdiction and Transparency orders of Arbitration Tribunal before the High Court of Singapore. The Singapore High Court heard the Transparency matter on February 24, 2020 and passed favorable order and held that it will take up the Jurisdiction issue after receiving Tribunal’s award on merits. GOI has appealed the above High Court order before Singapore Supreme Court.
c) Ravva Joint Operations arbitration proceedingsO C CarryThe Ravva Production Sharing Contract (PSC) obliges the contractor parties to pay a proportionate share of ONGC’s exploration, development, production and contract costs in consideration for ONGC’s payment of costs related to the construction and other activities it conducted in Ravva prior to the effective date of the Ravva PSC (the ONGC Carry). The question as to how the ONGC Carry is to be recovered and calculated, along with other issues, was submitted to an International Arbitration Tribunal in August 2002 which rendered a decision on the ONGC Carry in favour of the contractor parties (including Vedanta Limited (Cairn India Limited which subsequently merged with Vedanta Limited, accordingly now referred to as Vedanta Limited)) whereas four other issues were decided in favour of Government of India (GOI) in October 2004 (Partial Award).
The GOI then proceeded to challenge the ONGC Carry decision before the Malaysian courts, as Kuala Lumpur was the seat of the arbitration. The Federal Court of Malaysia upheld the Partial Award. As the Partial Award did not quantify the sums, therefore, contractor parties approached the same Arbitration Tribunal to pass a Final Award in the subject matter since it had retained the jurisdiction to do so. The Arbitral Tribunal was reconstituted and the Final Award was passed in October 2016 in Group’s favour. GOI’s challenge of the Final Award has been dismissed by the Malaysian High Court and the next appellate court in Malaysia i.e.
INTEGRATED REPORT MANAGEMENT REVIEW STATUTORY REPORTS FINANCIAL STATEMENTS
06-115 116-167 168-270 271-502

482 VEDANTA LIMITED INTEGRATED REPORT AND ANNUAL ACCOUNTS 2019-20 VEDANTA LIMITED INTEGRATED REPORT AND ANNUAL ACCOUNTS 2019-20 483
CONSOLIDATED NOTES FORMING PART OF THE FINANCIAL STATEMENTSas at and for the year ended March 31, 2020
CONSOLIDATED NOTES FORMING PART OF THE FINANCIAL STATEMENTSas at and for the year ended March 31, 2020
Malaysian Court of Appeal. GOI then filed an appeal at Federal Court of Malaysia. The matter was heard on February 28, 2019 and the Federal Court dismissed GOI’s leave to appeal. The Group has also filed for the enforcement of the Partial Award and Final Award before the Hon’ble Delhi High Court.
ase Development CostRavva joint operations had received a claim from the Ministry of Petroleum and Natural Gas, Government of India (GOI) for the period from 2000-2005 for ` 892 Crore (US$ 129 million) for an alleged underpayment of profit petroleum (by recovering higher Base Development Costs (“BDC”) against the cap imposed in the PSC) to the Government of India (GOI), out of which, Vedanta Limited’s (Cairn India Limited which subsequently merged with Vedanta Limited, accordingly now referred to as Vedanta Limited) share will be ` 201 Crore (US$ 29 million) plus interest. Joint venture partners initiated the arbitration proceedings and Arbitration Tribunal published the Award in January 2011 allowing claimants (including the Group) to recover the development costs spent to the tune of ` 2,080 Crore (US$ 278 million) and disallowed over run of ` 165 Crore (US$ 22 million) spent in respect of BDC along with 50% legal costs. The High Court of Kuala Lumpur as well as the Court of Appeal dismissed GOI’s application of setting aside the part of the Award. GOI challenge to the same before the Federal Court of Malaysia was also dismissed on May 17, 2016. The Group has filed an application for enforcement of award before the Hon’ble Delhi High Court.
In connection with the above two matters, the Group has received an order dated October 22, 2018 from the GOI directing oil marketing companies (OMCs) who are the offtakers of Ravva Crude to divert the sale proceeds to GOI’s account. GOI alleges that the Ravva Joint Operations (consisting of four joint venture partners) has short paid profit petroleum of ` 2,349 Crore (US$ 314 million) (the Group’s share approximately - ` 696 Crore (US$ 93 million)) on account of the two disputed issues of ONGC Carry and BDC matters, out of which ` 479 Crore (US$ 64 million) pertains to ONGC Carry and ` 217 Crore (US$ 29 million) pertains to BDC Matter. Against an interim application, filed by the Group along with one of its joint venture partner, seeking stay of such action from GOI, before the Hon’ble Delhi High Court, where enforcement petitions for both matters are pending, the Court directed the OMCs to deposit the above sums to the Court for both BDC and ONGC Carry matters. However, the Group (and other joint venture partner) has been given the liberty to seek withdrawal of the proportionate amounts (fallen due as of the date of Court order) from the Court upon furnishing a
bank guarantee of commensurate value. As on date, the Group has submitted bank guarantee of ` 628 Crore (US$ 84 million) and received the corresponding proceeds.
During the proceedings of the above matter, GOI has also filed an interim application seeking deposit by the said OMCs of an amount of ` 651 Crore (US$ 87 million) (Group’s share of ` 419 Crore (US$ 56 million)) towards interest on the alleged short payment of profit petroleum by the petitioners i.e. the Company (and other joint venture partner). The Hon’ble Delhi High Court vide its order dated February 19, 2020 allowed the petition for enforcement of the arbitration award in relation to BDC including declaratory relief and rejected the objections of GOI. The interim application filed by GOI and the ONGC Carry matter has been listed for hearing on June 22, 2020. While the Group does not believe the GOI will be successful in its challenge, if the Arbitral Awards in above matters are reversed and such reversals are binding, Group would be liable for approximately ` 479 Crore (US$ 64 million) plus interest. (March 31, 2019: ` 643 Crore (US$ 93 million plus interest)).
d) Proceedings related to the imposition of entry taxVedanta Limited and other Group companies i.e. Bharat Aluminium Company Limited (BALCO) and Hindustan Zinc Limited (HZL) challenged the constitutional validity of the local statutes and related notifications in the states of Odisha and Rajasthan pertaining to the levy of entry tax on the entry of goods brought into the respective states from outside.
Post some contradictory orders of High Courts across India adjudicating on similar challenges, the Supreme Court referred the matters to a nine judge bench. Post a detailed hearing, although the bench rejected the compensatory nature of tax as a ground of challenge, it maintained status quo with respect to all other issues which have been left open for adjudication by regular benches hearing the matters. Following the order of the nine judge bench, the regular bench of the Supreme Court proceeded with hearing the matters. The regular bench remanded the entry tax matters relating to the issue of discrimination against domestic goods bought from other States to the respective High Courts for final determination but retained the issue of jurisdiction for levy on imported goods, for determination by the regular bench of the Supreme Court. Following the order of the Supreme Court, the Group filed writ petitions in respective High Courts.
On October 09, 2017, the Supreme Court has held that states have the jurisdiction to levy entry tax on imported goods. With this Supreme Court judgement, imported goods will rank pari-passu with domestic goods for the purpose of levy of Entry tax. Vedanta Limited and its subsidiaries have amended their appeals (writ petitions) in Odisha and Chhattisgarh to include imported goods as well. With respect to Rajasthan, the State Government has filed a counter petition in the Rajasthan High Court, whereby it has admitted that it does not intend to levy the entry tax on imported goods. The issue pertaining to the levy of entry tax on the movement of goods into a Special Economic Zone (SEZ) remains pending before the Odisha High Court. The Group has challenged the levy of entry tax on any movement of goods into SEZ based on the definition of ‘local area’ under the Odisha Entry Tax Act which is very clear and does not include a SEZ. In addition, the Government of Odisha further through its SEZ Policy 2015 and the operational guidelines for administration of this policy dated August 22, 2016, exempted the entry tax levy on SEZ operations.
The total claims against Vedanta Limited and its subsidiaries are ` 1,366 Crore (March 31, 2019: ` 1,065 Crore) net of provisions made.
e) BALCO: Challenge against imposition of Energy Development CessBALCO challenged the imposition of Energy Development Cess levied on generators and distributors of electrical energy @ 10 paise per unit on the electrical energy sold or supplied before the High Court on the grounds that the Cess is effectively on production and not on consumption or sale since the figures of consumption are not taken into account and the Cess is discriminatory since captive power plants are required to pay @ 10 paise while the State Electricity Board is required to pay @ 5 paise. The High Court of Chhattisgarh by order dated December 15, 2006 declared the provisions imposing ED Cess on CPPs as discriminatory and therefore ultra vires the Constitution. BALCO has sought refund of ED Cess paid till March 2006 amounting to ` 35 Crore.
The State of Chhattisgarh moved an SLP in the Supreme Court and whilst issuing notice has stayed the refund of the Cess already deposited and the Supreme Court has also directed the State of Chhattisgarh to raise the bills but no coercive action be taken for recovery for the same. Final argument in this matter started before the Supreme Court. In case the Supreme Court overturns the decision of the High Court, the Group would be liable to pay an additional amount of ` 841 Crore (March 31, 2019: ` 750 Crore). Accordingly the total exposure
on the Group would be ` 876 Crore (March 31, 2019: ` 785 Crore)
f) Miscellaneous disputes- Income taxThe Group is involved in various tax disputes amounting to ` 1,909 Crore (March 31, 2019: ` 1,374 Crore) relating to income tax. It also includes similar matters where initial assessment is pending for subsequent periods and where the Group has made claims and assessments are in progress. These mainly relate to the disallowance of tax holiday for 100% Export Oriented Undertaking under section 10B of the Income Tax Act, 1961, disallowance of tax holiday benefit on production of gas under section 80IB of the Income Tax Act, 1961, on account of depreciation disallowances under the Income Tax Act and interest thereon which are pending at various appellate levels. Interest and penalty, if any would be additional. Refer note 34 for other income tax disputes. The Group believes that these disallowances are not tenable and accordingly no provision is considered necessary.
g) Miscellaneous disputes- Others
The Group is subject to various claims and exposures which arise in the ordinary course of conducting and financing its business from the excise, indirect tax authorities and others. These claims and exposures mostly relate to the assessable values of sales and purchases or to incomplete documentation supporting the companies’ returns or other claims.
The approximate value of claims (excluding the items as set out separately above) against the Group companies total ` 3,996 Crore (March 31, 2019: ` 3,691 Crore).
The Group considers that it can take steps such that the risks can be mitigated and that there are no significant unprovided liabilities arising.
Except as described above, there are no pending litigations which the Group believes could reasonably be expected to have a material adverse effect on the results of operations, cash flows or the financial position of the Group.
Based on reassessments and developments during the year, the following matter that was reported as contingent liability as at March 31, 2019 is no more considered as contingent liability: South Africa Carry Cost of ` 428 Crore basis the acceptance of closure application by Petroleum Agency South Africa (PASA) to exit from South Africa block.
INTEGRATED REPORT MANAGEMENT REVIEW STATUTORY REPORTS FINANCIAL STATEMENTS
06-115 116-167 168-270 271-502

484 VEDANTA LIMITED INTEGRATED REPORT AND ANNUAL ACCOUNTS 2019-20 VEDANTA LIMITED INTEGRATED REPORT AND ANNUAL ACCOUNTS 2019-20 485
CONSOLIDATED NOTES FORMING PART OF THE FINANCIAL STATEMENTSas at and for the year ended March 31, 2020
CONSOLIDATED NOTES FORMING PART OF THE FINANCIAL STATEMENTSas at and for the year ended March 31, 2020
E) Operating LeaseRefer to note 3(b) for details of the Group’s transition to Ind AS 116 “Leases”. Commitments disclosed as non-cancellable operating leases under Ind AS 17 “Leases”
have been recorded as lease liabilities from April 1, 2019, with the exception of short-term and low-value leases. Refer to note 22 for the maturity profile of the Group’s lease liabilities.
The aggregate amounts of minimum lease payments under non-cancellable operating leases at March 31, 2019, prepared and reported under Ind AS 17 “Leases”, were as follows:
(` in Crore)
ParticularsAs at
March 31, 2019
Within one year 14Later than one year but not later than five years 20Later than five years 0Total 34
38. RELATED PARTY DISCLOSURES� List of related parties and relationships
A) Entities controlling the Company (Holding Companies) Volcan Investments Limited (Volcan)Volcan Investments Cyprus LimitedIntermediate Holding CompaniesFinsider International Company Limited Richter Holdings Limited Twin Star Holdings Limited Vedanta Resources Cyprus Limited Vedanta Resources Finance Limited Vedanta Resources Holdings Limited Vedanta Resources Limited (formerly Vedanta Resources Plc)Welter Trading Limited Westglobe Limited
B) Fellow subsidiaries (with whom transactions have taken place)Konkola Copper Mines Plc *Sterlite Iron and Steel Company LimitedSterlite Power Transmission limitedSterlite Technologies LimitedSterlite Power Grid Ventures Limited
C) Post retirement benefit planBALCO Employees Provident Fund Trust�HZL Employee Group Gratuity Trust��HZL Superannuation Trust� �Hindustan Zinc Ltd Employees Contributory Provident Fund Trust�Sesa Group Employees Gratuity Fund and Sesa Group Executives Gratuity Fund�Sesa Group Employees Provident Fund� �Sesa Group Executives Superannuation Scheme Fund� �Sesa Mining Corporation Limited Employees Gratuity Fund� �
Sesa Mining Corporation Limited Employees Provident Fund Trust�Sesa Resources Limited Employees Gratuity Fund� �Sesa Resources Limited and Sesa Mining Corporation Limited Employees Superannuation Fund�Sesa Resources Limited Employees Provident Fund Trust�
D) Associates and Joint Ventures (Refer note 40) E) Others (with whom transactions have taken place)
Cairn FoundationFujairah Gold GhanaIndia Grid trust **Janhit Electoral TrustSesa Community Development FoundationRunaya Refinery LLPVedanta FoundationVedanta Medical Research Foundation
* Konkola Copper Mines Plc (KCM) ceased to be a related party w.e.f. May 21, 2019. In March, 2020, a provision of ` 207 crore was recognised in relation to monies advanced to KCM against future purchase of copper cathode/ anode. Refer note 33(e) for details.� � � � �
**Ceased to be related party during the year.
Ultimate Controlling partyVedanta Limited is a majority-owned and controlled subsidiary of Vedanta Resources Limited (‘VRL’). Volcan Investments Limited (‘Volcan’) and its wholly owned subsidiary together hold 100 % of the share capital and 100 % of the voting rights of VRL. Volcan is 100 % beneficially owned and controlled by the Anil Agarwal Discretionary Trust (‘Trust’). Volcan Investments Limited, Volcan Investments Cyprus Limited and other intermediate holding companies except VRL do not produce Group financial statements.�
F) The Group enters into transactions in the normal course of business with its related parties, including its parent Vedanta Resources Limited, and the companies over which it has significant influence. A summary of significant related party transactions for the year ended March 31, 2020 are noted below. � � �
Transactions and balances with own subsidiaries are eliminated on consolidation.� � � �
(` in Crore)
Particulars
Entities controlling the
company/ Fellow Subsidiaries
Associates/Joint ventures Others Total
Income:(i)� Revenue from operations 855 - 2 857 (ii)� Other Income� a)� Interest and guarantee commission 42 - - 42 � b)� Outsourcing service fees 3 - - 3 � c)� Dividend income 2 - 4 6 Expenditure and other transactions:(i)Purchase of goods/ Services 58 - 7 65 (ii) Stock options (recovery) (0) - (0) (0)(iii)Management fees and Brand fees charged 526 - - 526 (iv)Reimbursement for other expenses (net of recovery) 48 - 0 48 (v) Corporate Social Responsibility expenditure/ Donation - - 111 111 (vi)Contribution to Post retirement employee benefit trust/fund - - 112 112 (vii)Remuneration to relatives of key management personnel - - 17 17 (viii) Commission/Sitting Fees -To Independent directors - - 4 4 -To Key management personnel - - 4 4 -To relatives of key management personnel - - 0 0 (ix) Dividend paid. -To Holding companies 727 - - 727 -To Key management personnel - - 0 0 -To relatives of key management personnel - - 0 0 Other Transactions during the year: (i) Loans given / (repayment thereof) 0 (0) - (0)(ii) Financial Guarantees (taken)/given during the year - - 0 0(iii) Financial Guarantees relinquished during the year - - 25 25 (iv)Investments (redeemed) during the year * (4,485) - - (4,485)Balances as at year end:(i)Trade Receivables 3 - - 3 (ii)Loans given 80 4 - 84 (iii)Other receivables and advances 133 1 2 136 (iv)Trade Payables 114 - 7 121 (v)Other payables 60 - 68 128 (vi) Investments 101 - - 101 (vii) Financial guarantee given - - 26 26 (viii) � Banking guarantee given ** 115 - - 115 (ix)� Remuneration, Commission and consultancy fees payable to KMP
and their relatives - - 6 6
* Refer Note 38(H)
** Bank gaurantee given by Vedanta Limited on behalf of Volcan Investments Limited in favour of Income Tax department, India as collateral in respect of certain tax disputes of Volcan Investments Limited.
INTEGRATED REPORT MANAGEMENT REVIEW STATUTORY REPORTS FINANCIAL STATEMENTS
06-115 116-167 168-270 271-502

486 VEDANTA LIMITED INTEGRATED REPORT AND ANNUAL ACCOUNTS 2019-20 VEDANTA LIMITED INTEGRATED REPORT AND ANNUAL ACCOUNTS 2019-20 487
CONSOLIDATED NOTES FORMING PART OF THE FINANCIAL STATEMENTSas at and for the year ended March 31, 2020
CONSOLIDATED NOTES FORMING PART OF THE FINANCIAL STATEMENTSas at and for the year ended March 31, 2020
Remuneration of key management personnel (` in Crore)
ParticularsAs at
March 31, 2020
Short-term employee benefits* 40 Post employment benefits** 8 Share based payments 1
49
*This includes reimbursement to the parent company for remuneration paid to the CEO and Whole Time Director of the Company aggregating to ` 11 crore for the year ended March 31, 2020. The Company intends to seek approval of it’s shareholders for this payment at the ensuing annual general meeting. The said KMP has left the Company, subsequent to the Balance sheet date.
** Does not include the provision made for gratuity and leave benefits, as they are determined on an actuarial basis for all the employees together.
G) A summary of significant related party transactions for the year ended March 31, 2019 are noted below. �(` in Crore)
Particulars
Entities controlling the
company/ Fellow Subsidiaries
Associates/Joint ventures Others Total
Income:(i)� Revenue from operations 918 - - 918(ii)� Other Income� a)� Interest and guarantee commission 39 - - 39� b)� Outsourcing service fees 3 - - 3� c)� Dividend income 1 - 15 16Expenditure and other transactions:(i)� Purchase of goods/ Services 404 - 1 405(ii)� Stock options expenses 15 - - 15(iii)�Management fees and Brand fees charged 338 - - 338(iv)�Reimbursement for other expenses (net of recovery) (3) - - (3)(v) Corporate Social Responsibility expenditure/ Donation - - 134 134(vi)�Dividend paid � -To Holding companies 3,513 - - 3,513 � -To Key management personnel - - 0 0 � -To relatives of key management personnel - - 0 0(vii)�Contribution to Post retirement employee benefit trust/fund - - 122 122(viii)�Remuneration to relatives of key management personnel - - 15 15(ix)�Comission/Sitting fee � -To Holding companies - - 4 4 � -To Key management personnel - - 1 1 � -To relatives of key management personnel - - 0 0Other Transactions during the year: (i) � Loans given / (repayment thereof) 0 (1) - (1)(ii) �Financial Guarantees (taken)/given during the year (874) 0 69 (805)(iii)�Financial Guarantees relinquished during the year 874 0 52 926(iv)�Investments (redeemed) during the year (199) - - (199)(v) Investments purchased * 3,812 - - 3,812Balances as at year end:(i)� Trade Receivables 10 - - 10(ii)� Loans given 74 5 - 79(iii)�Other receivables and advances 605 - - 605
(` in Crore)
Particulars
Entities controlling the
company/ Fellow Subsidiaries
Associates/Joint ventures Others Total
(iv)�Trade Payables 25 - - 25(v)� Other payables 2,160 - 86 2,246(vi)� Investments 4,995 - 106 5,101(vii)� Financial guarantee given - - 51 51(viii) � Banking guarantee given ** 115 - - 115(ix)��Commission and consultancy fees payable to KMP and their relatives - - 5 5
* Refer Note 38(H)
** Bank gaurantee given by Vedanta Limited on behalf of Volcan Investments Limited in favour of Income Tax department, India as collateral in respect of certain tax disputes of Volcan Investments Limited.�
Remuneration of key management personnel(` in Crore)
ParticularsFor the Year ended
March 31, 2019
Short-term employee benefits 41 Post employment benefits* 1 Share based payments 5 Total 47
* Does not include the provision made for gratuity and leave benefits, as they are determined on an actuarial basis for all the employees together.
H) Structured investments purchased from Volcan Investments LimitedIn December 2018, as part of its cash management activities, Cairn India Holdings Limited (CIHL), a step-down subsidiary of the Company, entered into a tripartite agreement with Volcan and one of its subsidiaries. Under the agreement, CIHL purchased an economic interest in a structured investment for the equity shares of Anglo American Plc (AA Plc), a company listed on the London Stock Exchange, from Volcan for a total consideration of ` 3,812 Crore (GBP 428 million, USD 541 million) (of which ` 1,816 Crore (GBP 200 million, USD 254 million) and ` 435 Crore (GBP 49 million, USD 64 million) was paid upto March 31, 2019 and during the year ended March 31, 2020 respectively) determined based on an independent third-party valuation. The ownership of the underlying shares, and the associated voting interests, remained with Volcan and the investment were to mature in two tranches in April 2020 and October 2020. In addition, CIHL also received a put option from Volcan. In July, 2019 , the transaction was unwound and the investments were redeemed for a total consideration of ` 4,485 Crore (GBP 519 million, USD 639 million), representing the actual price Volcan realised from selling the shares of AA Plc to an unrelated third-party net of applicable costs, out of which ` 93 Crore (GBP 10 million, USD 12 million) is outstanding.
I) Cairn PSC and OALP guarantee to GovernmentVedanta Resources Limited as a parent company has provided financial and performance guarantee to Government of India for erstwhile Cairn India Group’s obligation under the Production Sharing Contract (‘PSC’). The guarantee provides for making available financial resources equivalent to Cairn India’s share for its obligation under PSC, personnel and technical services in accordance with industry practices and any other resources in case Cairn India is unable to fulfill its obligations under PSC. Vedanta Resources Limited has also provided parent company financial and performance guarantee to Government of India for Vedanta Limited’s obligation under the Revenue Sharing Contract (‘RSC’) in respect of 41 Blocks awarded under the Round 1 of Open Acreage Licensing Policy (OALP) by Government of India. The guarantee provides for making available financial resources equivalent to Vedanta’s share for its obligation under RSC, personnel and technical services in accordance with industry practices and any other resources in case Vedanta is unable to fulfill its obligations under RSC. No consideration is charged for the above services and this is subject to ongoing the review and study.
INTEGRATED REPORT MANAGEMENT REVIEW STATUTORY REPORTS FINANCIAL STATEMENTS
06-115 116-167 168-270 271-502

488 VEDANTA LIMITED INTEGRATED REPORT AND ANNUAL ACCOUNTS 2019-20 VEDANTA LIMITED INTEGRATED REPORT AND ANNUAL ACCOUNTS 2019-20 489
CONSOLIDATED NOTES FORMING PART OF THE FINANCIAL STATEMENTSas at and for the year ended March 31, 2020
CONSOLIDATED NOTES FORMING PART OF THE FINANCIAL STATEMENTSas at and for the year ended March 31, 2020
J) Cairn Investment in Vedanta Resources Limited BondsCairn India Holdings Limited had invested ` 228 Crore (US$ 30.5 million) and ` 211 Crore (US$ 30.5 million) as at March 31, 2020 and March 31, 2019 in bonds issued by Vedanta Resources Limited (formerly Vedanta Resources Plc), which have maturities ranging from June 2021 to May 2023 at coupon ranging from 7.13% to 8.25% p.a. The carrying value of these bonds (measured at FVTPL) are ` 101 Crore and ` 223 Crore as at March 31, 2020 and March 31, 2019 respectively.
K) Loans to holding companiesDuring the year ended March 31, 2016, Lisheen Milling Limited entered into a loan agreement with Twin Star Holding Limited for ` 67 crore (US $10 million) at an interest rate of 2.1% per annum. The loan is unsecured and the outstanding balance under the facility including interest accrued at March 31,2020 and March 31,2019 is ` 75 Crore and ` 69 Crore respectively.
L) Loans to fellow subsidiariesDuring the previous year ended March 31, 2019, the Group had renewed loan provided to Sterlite Iron and Steel Company Limited to finance project in earlier years. The loan balance as at March 31, 2020 was 5 Crore (March 31,2019: 5 Crore). The loan is unsecured in nature and carries an interest rate of 8.50% per annum. The loan was due in March 2020. The loan has been renewed for a further period of 12 months in March 2020 and is due in March 2021.
Terms and conditions of transactions with related partiesAll transactions with related parties are done in the ordinary course of business. Except as disclosed above, the Group has not recorded any impairment of receivables relating to amounts owed by related parties, for the year ended March 31, 2020. This assessment is undertaken each financial year through examining the financial position of the related party and the market in which the related party operates.
There are no outstanding debts or loans due from directors or other officers (as defined under Section 2(59) of the Companies Act, 2013) of the Company.
39. SUBSEQUENT EVENTS“The Company vide letter dated May 12, 2020 has informed the stock exchanges that it has received a letter dated May 12, 2020 from its Holding Company, Vedanta Resources Ltd. (“VRL”), wherein VRL has expressed its intention to, either individually or along with one or more subsidiaries, acquire all fully paid-up equity shares of the Company (“Equity Shares”) that are held by the public shareholders of the Company (as defined under the Delisting Regulations, to be referred to as “Public Shareholders”) and consequently voluntarily delist the Equity Shares from BSE Limited and National Stock Exchange of India Limited, the recognised stock exchanges where the Equity Shares are presently listed (“Stock Exchanges”), in accordance with the Delisting Regulations (“Delisting Proposal”) and if such delisting is successful, then to also delist the Company’s American Depositary Shares from the New York Stock Exchange (“NYSE”) and deregister the Company from the Securities and Exchange Commission (“SEC”), subject to the requirements of the NYSE and the SEC.
Further, the board of directors of the Company in their meeting held on May 18, 2020 have considered and granted their approval for the said Delisting Proposal and to seek shareholders’ approval for the said proposal.
There are no other material adjusting or non-adjusting subsequent events, except as already disclosed.
40. INTEREST IN OTHER ENTITIESa) SubsidiariesThe Group consists of a parent company, Vedanta Limited, incorporated in India and a number of subsidiaries held directly and indirectly by the Group which operate and are incorporated around the world. Following are the details of shareholdings in the subsidiaries.
S. No Subsidiaries Principal activities
Country of Incorporation
Immediate holding company
The Company s / Immediate holding company s percentage holding (in %)
As at March 31, 2020
As at March 31, 2019
1 Cairn Energy India Pty Limited
Oil and gas exploration, development and production
Australia Cairn India Holdings Limited
100.00 100.00
2 Copper Mines of Tasmania Pty Limited ( CMT )
Copper mining Australia Monte Cello BV 100.00 100.00
3 Thalanga Copper Mines Pty Limited ( TCM )
Copper mining Australia Monte Cello BV 100.00 100.00
4 Bharat Aluminium Company Limited ( BALCO )
Aluminium mining and smelting
India Vedanta Limited 51.00 51.00
5 Electrosteel Steels Limited2
Manufacturing of Steel & DI Pipe
India Vedanta Limited 95.49 90.00
6 Goa Sea Port Private Limited
Infrastructure India Sterlite Ports Limited 100.00 100.00
7 Hindustan Zinc Limited ( HZL )
Zinc mining and smeltingIndia Vedanta Limited 64.92 64.92
8 MALCO Energy Limited ( MEL )
Power generation India Vedanta Limited 100.00 100.00
9 Maritime Ventures Private Limited
Infrastructure India Sterlite Ports Limited 100.00 100.00
10 Paradip Multi Cargo Berth Private Limited
Infrastructure India Vedanta Limited 100.00 100.00
11 Sesa Mining Corporation Limited
Iron ore mining India Sesa Resources Limited
100.00 100.00
12 Sesa Resources Limited ( SRL )
Iron ore mining India Vedanta Limited 100.00 100.00
13 Sterlite Ports Limited Infrastructure India Vedanta Limited 100.00 100.00 14 Talwandi Sabo Power
Limited ( TSPL )Power generation India Vedanta Limited 100.00 100.00
15 Vedanta Star Limited2 Operating and holding Company
India Vedanta Limited - 100.00
16 Vizag General Cargo Berth Private Limited
Infrastructure India Vedanta Limited 100.00 100.00
17 Killoran Lisheen Finance Limited
Investment company Ireland Vedanta Lisheen Holdings Limited
100.00 100.00
18 Killoran Lisheen Mining Limited
Zinc and lead mining Ireland Vedanta Lisheen Holdings Limited
100.00 100.00
19 Lisheen Milling Limited Manufacturing Ireland Vedanta Lisheen Holdings Limited
100.00 100.00
20 Lisheen Mine Partnership Mining Partnership Firm Ireland 50% each held by Killoran Lisheen Mining Limited & Vedanta Lisheen Mining Limited
100.00 100.00
21 Vedanta Exploration Ireland Limited
Exploration company Ireland Vedanta Lisheen Holdings Limited
100.00 100.00
INTEGRATED REPORT MANAGEMENT REVIEW STATUTORY REPORTS FINANCIAL STATEMENTS
06-115 116-167 168-270 271-502

490 VEDANTA LIMITED INTEGRATED REPORT AND ANNUAL ACCOUNTS 2019-20 VEDANTA LIMITED INTEGRATED REPORT AND ANNUAL ACCOUNTS 2019-20 491
CONSOLIDATED NOTES FORMING PART OF THE FINANCIAL STATEMENTSas at and for the year ended March 31, 2020
CONSOLIDATED NOTES FORMING PART OF THE FINANCIAL STATEMENTSas at and for the year ended March 31, 2020
S. No Subsidiaries Principal activities
Country of Incorporation
Immediate holding company
The Company s / Immediate holding company s percentage holding (in %)
As at March 31, 2020
As at March 31, 2019
22 Vedanta Lisheen Holdings Limited
Investment company Ireland THL Zinc Holing BV 100.00 100.00
23 Vedanta Lisheen Mining Limited
Zinc and lead mining Ireland Vedanta Lisheen Holdings Limited
100.00 100.00
24 AvanStrate Inc. ('ASI') Operating & holding Company
Japan Cairn India Holdings Limited
51.63 51.63
25 Cairn India Holdings Limited
Investment company Jersey Vedanta Limited 100.00 100.00
26 Western Cluster Limited Iron ore mining Liberia Bloom Fountain Limited
100.00 100.00
27 Bloom Fountain Limited Operating (Iron ore) and Investment Company
Mauritius Vedanta Limited 100.00 100.00
28 CIG Mauritius Holdings Private Limited
Investment Company Mauritius Cairn Energy Hydrocarbons Limited
100.00 100.00
29 CIG Mauritius Private Limited
Investment Company Mauritius CIG Mauritius Holdings Private Limited
100.00 100.00
30 Sesa Sterlite Mauritius Holdings Limited **
Investment Company Mauritius Bloom Fountain Limited
- 100.00
31 THL Zinc Ltd Investment company Mauritius THL Zinc Ventures Ltd 100.00 100.0032 THL Zinc Ventures Limited Investment company Mauritius Vedanta Limited 100.00 100.0033 Twin Star Energy Holdings
Limited ( TEHL ) **Investment company Mauritius Bloom Fountain
Limited- 100.00
34 Twin Star Mauritius Holdings Limited ( TMHL ) **
Investment company Mauritius Twin Star Energy Holdings Limited
- 100.00
35 Amica Guesthouse (Proprietary) Limited
Accommodation and catering services
Namibia Skorpion Zinc (Proprietary) Limited
100.00 100.00
36 Namzinc (Proprietary) Limited
Owns and operates zinc refinery
Namibia Skorpion Zinc (Proprietary) Limited
100.00 100.00
37 Skorpion Mining Company (Proprietary) Limited ('NZ')
Exploration, development, production and sale of zinc ore
Namibia Skorpion Zinc (Proprietary) Limited
100.00 100.00
38 Skorpion Zinc (Proprietary) Limited ('SZPL')
Operating (Zinc) and Investment Company
Namibia THL Zinc Namibia Holdings (Proprietary) Limited
100.00 100.00
39 THL Zinc Namibia Holdings (Proprietary) Limited (“VNHL”)
Mining and Exploration and Investment company
Namibia THL Zinc Ltd 100.00 100.00
40 Lakomasko BV Investment company Netherlands THL Zinc Holding BV 100.00 100.0041 Monte Cello BV (“MCBV”) Investment company Netherlands Vedanta Limited 100.00 100.0042 THL Zinc Holding BV Investment company Netherlands Vedanta Limited 100.00 100.0043 Cairn Energy Discovery
Limited*Oil and gas exploration, development and production
Scotland Cairn India Holdings Limited
100.00 100.00
44 Cairn Energy Gujarat Block 1 Limited
Oil and gas exploration, development and production
Scotland Cairn India Holdings Limited
100.00 100.00
45 Cairn Energy Hydrocarbons Limited
Oil and gas exploration, development and production
Scotland*** Cairn India Holdings Limited
100.00 100.00
S. No Subsidiaries Principal activities
Country of Incorporation
Immediate holding company
The Company s / Immediate holding company s percentage holding (in %)
As at March 31, 2020
As at March 31, 2019
46 Cairn Exploration (No. 2) Limited*
Oil and gas exploration, development and production
Scotland Cairn India Holdings Limited
100.00 100.00
47 Black Mountain Mining (Proprietary) Limited
Exploration, development, production and sale of zinc, lead, copper and associated mineral concentrates
South Africa THL Zinc Ltd 74.00 74.00
48 Cairn South Africa Pty Limited*
Oil and gas exploration, development and production
South Africa Cairn Energy Hydrocarbons Limited
100.00 100.00
49 AvanStrate Korea Inc Manufacturer of LCD glass substrate
South Korea Avanstrate (Japan) Inc.
100.00 100.00
50 Cairn Lanka Private Limited
Oil and gas exploration, development and production
Sri Lanka CIG Mauritius Private Limited
100.00 100.00
51 AvanStrate Taiwan Inc Manufacturer of LCD glass substrate
Taiwan Avanstrate (Japan) Inc.
100.00 100.00
52 Fujairah Gold FZC Manufacturing of Copper Rod and Refining of Precious Metals (Gold & Silver)
United Arab Emirates
Malco Energy Limited 100.00 100.00
53 Sterlite (USA) Inc.* Investment company United States of America
Vedanta Limited 100.00 100.00
*Under liquidation **Liquidated during the year ***Principal place of business is in India1 The Group also has interest in certain trusts which are neither significant nor material to the Group.2 Vedanta star Limited has been merged with Electrosteels steel Limited w.e.f. March 25, 2020. (Refer note 4(c))
b) Joint operationsThe Company participates in several unincorporated joint operations which involve the joint control of assets used in oil and gas exploration and producing activities which are as follows:
Oil & Gas blocks/fields Area
Participating interest (%)
As at March 31, 2020
As at March 31, 2019
Operating BlocksRavva block-Exploration, Development and Production Krishna Godavari 22.50 22.50 CB-OS/2 – Exploration Cambay Offshore 60.00 60.00 CB-OS/2 - Development & production Cambay Offshore 40.00 40.00 RJ-ON-90/1 – Exploration Rajasthan Onshore 100.00 100.00 South Africa Block1 Exploration1 Orange Basin South Africa
Offshore - 60.00
RJ-ON-90/1 – Development & production Rajasthan Onshore 70.00 70.00 Non-Operating BlocksKG-ONN-2003/1 Krishna Godavari Onshore 49.00 49.00
(1) South Africa Block1-Exploration was relinquished on 10 September 2019.
INTEGRATED REPORT MANAGEMENT REVIEW STATUTORY REPORTS FINANCIAL STATEMENTS
06-115 116-167 168-270 271-502

492 VEDANTA LIMITED INTEGRATED REPORT AND ANNUAL ACCOUNTS 2019-20 VEDANTA LIMITED INTEGRATED REPORT AND ANNUAL ACCOUNTS 2019-20 493
CONSOLIDATED NOTES FORMING PART OF THE FINANCIAL STATEMENTSas at and for the year ended March 31, 2020
CONSOLIDATED NOTES FORMING PART OF THE FINANCIAL STATEMENTSas at and for the year ended March 31, 2020
c) Interest in associates and joint venturesSet out below are the associates and joint ventures of the Group as at March 31, 2020 which, in the opinion of the management, are not material to the Group. The country of incorporation or registration is also their principal place of business, and the proportion of ownership interest is the same as the proportion of voting rights held.
S. No. Associates Country of incorporation
% ownership interest
As at March 31, 2020
As at March 31, 2019
1 RoshSkor Township (Pty) Limited Namibia 50.00 50.002 Gaurav Overseas Private Limited India 50.00 50.00
S. No. Jointly controlled entities Country of incorporation
% ownership interest
As at March 31, 2020
As at March 31, 2019
1 Rampia Coal Mines and Energy Private Limited* India 17.39 17.39 2 Madanpur South Coal Company Limited India 17.62 17.62 3 Goa Maritime Private Limited India 50.00 50.00 4 Rosh Pinah Health Care (Proprietary) Limited Namibia 69.00 69.00
*action initiated for striking-off
41. OTHER NOTESa) The Scheme of Amalgamation and Arrangement amongst Sterlite Energy Limited (‘SEL’), Sterlite Industries (India) Limited (‘Sterlite’), Vedanta Aluminium Limited (‘VAL’), Ekaterina Limited (‘Ekaterina’), Madras Aluminium Company Limited (‘Malco’) and the Company (the “Scheme”) had been sanctioned by the Honourable High Court of Madras and the Honourable High Court of Judicature of Bombay at Goa and was given effect to in the year ended March 31, 2014.
Subsequently the above orders of the honourable High Court of Bombay and Madras have been challenged by Commissioner of Income Tax, Goa and Ministry of Corporate Affairs through a Special Leave Petition before the honourable Supreme Court and also by a creditor and a shareholder of the Company. The said petitions are currently pending for hearing.
b) i)� Pursuant to the Government of India’s policy of disinvestment, the Company in April 2002 acquired 26% equity interest in Hindustan Zinc Limited (HZL) from the Government of India. Under the terms of the Shareholder’s Agreement (‘SHA’),the Company had two call options to purchase all of the Government of India’s shares in HZL at fair market value. The Company exercised the first call option on August 29, 2003 and acquired an additional 18.9% of HZL’s issued share capital. The Company also acquired an additional 20% of the equity capital in HZL through an open offer, increasing its shareholding to 64.9%. The second call option provides the Company the right to acquire the Government of India’s remaining 29.5% share in HZL. This call option was subject to the right of the
Government of India to sell 3.5% of HZL shares to HZL employees.
The Company exercised the second call option on July 21, 2009.The Government of India disputed the validity of the call option and refused to act upon the second call option. Consequently the Company invoked arbitration which is in the early stages. The next date of hearing is to be notified. The Government of India without prejudice to the position on the Put / Call option issue has received approval from the Cabinet for divestment and the Government is looking to divest through the auction route. Meanwhile, the Supreme Court has, in January 2016, directed status quo pertaining to disinvestment of Government of India’s residual shareholding in a public interest petition filed which is currently pending and sub-judice.
ii)� Pursuant to the Government of India’s policy of divestment, the Company in March 2001 acquired 51% equity interest in BALCO from the Government of India. Under the terms of the SHA, the Company had a call option to purchase the Government of India’s remaining ownership interest in BALCO at any point from March 2, 2004. The Company exercised this option on March 19, 2004. However, the Government of India contested the valuation and validity of the option and contended that the clauses of the SHA violate the erstwhile Companies Act, 1956 by restricting the rights of the Government of India to transfer its shares and that as a result such provisions of the SHA were null and void. In the arbitration filed by the Company, the arbitral tribunal by a majority award rejected the claims of the Company on the ground that the clauses relating to the call option, the right of first refusal, the “tag along” rights
and the restriction on the transfer of shares violate the erstwhile Companies Act, 1956 and are not enforceable.
The Company has challenged the validity of the majority award before the Hon’ble High Court at Delhi and sought for setting aside the arbitration award to the extent that it holds these clauses ineffective and inoperative. The Government of India also filed an application before the High Court to partially set aside the arbitral award in respect of certain matters involving valuation. The matter is currently scheduled for hearing by the Delhi High Court on August 11, 2020. Meanwhile, the Government of India without prejudice to its position on the Put / Call option issue has received approval from the Cabinet for divestment and the Government is looking to divest through the auction route.
On January 9, 2012, the Company offered to acquire the Government of India’s interests in HZL and BALCO for ` 15,492 Crore and ` 1,782 Crore respectively. This offer was separate from the contested exercise of the call options, and Company proposed to withdraw the ongoing litigations in relation to the contested exercise of the options should the offer be accepted. To date, the offer has not been accepted by the Government of India and therefore, there is no certainty that the acquisition will proceed.
In view of the lack of resolution on the options, the non-response to the exercise and valuation request from the Government of India, the resultant uncertainty surrounding the potential transaction and the valuation of the consideration payable, the Company considers the strike price of the options to be at the fair value, which is effectively nil, and hence the call options have not been recognised in the financial statements.
c) Pursuant to Management Committee recommendation and minutes of Empowered Committee of Secretaries (ECS) filed by GoI, Vedanta Limited had considered cost recovery of ` 1,618 Crore (US$ 251 million) in FY 2017-18, being the cost incurred over the initially approved FDP of Pipeline Project. Vedanta Limited’s claim for the resultant profit petroleum of ` 322 Crore (US$ 43 million) as at March 31, 2020 (March 31, 2019:` 297 Crore (US$ 43 million)) (refer note 10), which had been previously paid, has been disputed by the GoI. The Group believes that it has a good case on merits to recover the amount and has therefore treated it as a non-current recoverable amount.
d) The Department of Mines and Geology (DMG) of the State of Rajasthan initiated the royalty assessment process from Jan 2008 to 2019 and issued a show cause notice vide an office order dated January 31, 2020 amounting to ` 1,925 Crore. The Group has challenged (the show cause notice or / and) computation mechanism of the royalty on the ground that the State has not complied with the previous orders of Rajasthan High Court where a similar computation mechanism was challenged and Court had directed DMG to reassess basis the judicial precedents and mining concession rules. Pending compliance of previous orders, High Court has granted a stay on the notice and directed DMG not to take any coercive action. Based on the opinion of external council, the Group believes that it has strong grounds of a successful appeal, and the chances of an outcome which is not if favour of the Group is remote.
e) In terms of various notifications issued by the Ministry of Environment, Forest and Climate Change (MoEF&CC), ash produced from thermal power plant is required to be disposed of by the Company in the manner specified in those notifications. However compliance with manner of disposal as specified in those notifications is not fully achieved due to lack of demand from user agencies. Consequently, the Company is storing some of the ash produced in ash dyke in accordance with conditions of the Environmental Clearance & Consent to Operate granted by the MOEF&CC & Odisha State Pollution Control Board (OSPCB) respectively while giving preference to supplying the same to user agencies. Management believes storage of ash in ash dykes/ ash pond in accordance with environmental clearances received by the Company are sufficient compliance with the applicable notifications issued by MoEF&CC which is supported by a legal opinion obtained.
The National Green Tribunal (NGT) has also taken cognizance of the matter and vide its order dated February 12, 2020 has ordered for levy of environmental compensation on generating companies on account of their failure to comply the aforesaid notifications. The Group has already filed an appeal against the said order with the Hon’ble Supreme Court of India (Apex Court) on the grounds that it is not in accordance with directions given by the Apex Court and methodology for determination of compensation is not reasonable. Management believes that the outcome of the appeal will not have any significant adverse financial impact on the Company which is supported by a legal opinion obtained.
INTEGRATED REPORT MANAGEMENT REVIEW STATUTORY REPORTS FINANCIAL STATEMENTS
06-115 116-167 168-270 271-502

494 VEDANTA LIMITED INTEGRATED REPORT AND ANNUAL ACCOUNTS 2019-20 VEDANTA LIMITED INTEGRATED REPORT AND ANNUAL ACCOUNTS 2019-20 495
CONSOLIDATED NOTES FORMING PART OF THE FINANCIAL STATEMENTSas at and for the year ended March 31, 2020
CONSOLIDATED NOTES FORMING PART OF THE FINANCIAL STATEMENTSas at and for the year ended March 31, 2020
42. OIL & GAS RESERVES AND RESOURCESThe Group’s gross reserve estimates are updated atleast annually based on the forecast of production profiles, determined on an asset-by-asset basis, using appropriate petroleum engineering techniques. The estimates of reserves and resources have been derived in accordance with the Society for Petroleum Engineers “Petroleum Resources Management System (2018)”. The changes to the reserves are generally on account of future development projects, application of technologies such as enhanced oil recovery techniques and true up of the estimates. The management’s internal estimates of hydrocarbon reserves and resources at the year end, are as follows:
Particulars Country
Gross proved and probable hydrocarbons initially in place
Gross proved and probable reserves and resources
Net working interest proved and probable reserves and
resources(mmboe) (mmboe) (mmboe)
As at March 31,
2020
As at March 31,
2019
As at March 31,
2020
As at March 31,
2019
As at March 31,
2020
As at March 31,
2019
Rajasthan MBA Fields India 2,288 2,288 317 362 222 253 Rajasthan MBA EOR India - - 317 293 222 205 Rajasthan Block Other Fields India 3,535 3,405 449 428 314 299 Ravva Fields India 692 724 28 39 6 9 CBOS/2 Fields India 292 254 40 33 16 13 Other fields India 348 335 43 40 25 22 Total 7,155 7,006 1,194 1,195 805 801
The Company’s net working interest proved and probable reserves is as follows:
Particulars
Proved and probable reserves
Proved and probable reserves (developed)
Oil Gas Oil Gas(mmstb) (bscf) (mmstb) (bscf)
Reserves as of April 01, 2018 98 52 71 28 Additions / revision during the year# 259 224 149 113 Production during the year (42) (12) (42) (12)Reserves as of March 31, 2019** 315 264 178 129 Additions / revision during the year 25 61 22 38 Production during the year (36) (24) (36) (24)Reserves as of March 31, 2020*** 304 301 164 143
* Includes probable oil reserves of 26.77 mmstb (of which 5.00 mmstb is developed) and probable gas reserves of 25.12 bscf (of which 4.17 bscf is developed)� � � � � �
** Includes probable oil reserves of 116.21 mmstb (of which 16.03 mmstb is developed) and probable gas reserves of 89.00 bscf (of which 24.19 bscf is developed)�� � � � �
*** Includes probable oil reserves of 132.23 mmstb (of which 21.94 mmstb is developed) and probable gas reserves of 114.73 bscf (of which 42.64 bscf is developed)� � � � � �
# The increase in reserve is on account of PSC extentsion for the Rajasthan and Ravva block. For more details, refer note 3(c)(A)(viii).
mmboe million barrels of oil equivalent
mmstb million stock tank barrels
bscf billion standard cubic feet
1 million metric tonnes 7.4 mmstb
1 standard cubic meter 35.315 standard cubic feet
MBA Mangala, Bhagyam & Aishwarya
EOR Enhanced Oil Recovery
43. F
INA
NC
IAL
INFO
RM
ATIO
N P
UR
SU
AN
T TO
SC
HED
ULE
III O
F C
OM
PAN
IES
AC
T, 2
013
S.
No
Nam
e of
the
ent
ity
Net
Ass
etsn
(To
tal a
sset
s le
ss
tota
l lia
bili
ties
)S
hare
in p
rofi
t an
d lo
ss
Sha
re in
oth
er c
ompr
ehen
sive
in
com
e (O
CI)
Sha
re in
tot
al c
ompr
ehen
sive
in
com
e (T
CI)
As
at M
arch
31,
202
0Ye
ar e
nded
Mar
ch 3
1, 2
020
Year
end
ed M
arch
31,
202
0Ye
ar e
nded
Mar
ch 3
1, 2
020
As
% o
f co
nsol
idat
ed n
et
asse
tsA
mou
nt
(` in
Cro
re)
As
% o
f co
nsol
idat
ed
profi
tA
mou
nt
(` in
Cro
re)
As %
of
cons
olid
ated
OCI
Am
ount
(`
in C
rore
)A
s %
of
cons
olid
ated
TC
IA
mou
nt
(` in
Cro
re)
Par
ent
Veda
nta
Lim
ited
12
7.93
%
69,
895
101.
02%
(6
,732
)45
.77%
3
84
108.
98%
(6
,348
)In
dian
Sub
sidi
arie
s1
Hin
dust
an Z
inc
Lim
ited
73.7
8%
40,
311
(102
.12%
) 6
,805
(1
1.92
%)
(100
)(1
15.1
1%)
6,7
05
2Bh
arat
Alu
min
ium
Com
pany
Li
mit
ed7.
23%
3
,948
1.
77%
(1
18)
0.44
%
4
1.96
%
(114
)
3M
ALC
O E
nerg
y Li
mit
ed0.
42%
2
30
3.47
%
(231
)0.
00%
0
3.
96%
(2
31)
4Ta
lwan
di S
abo
Pow
er L
imit
ed6.
01%
3
,285
(1
0.95
%)
730
(0
.05%
) (0
)(1
2.53
%)
730
5
Sesa
Res
ourc
es L
imit
ed0.
02%
1
0 0.
72%
(4
8)(0
.15%
) (1
)0.
85%
(4
9)6
Sesa
Min
ing
Cor
pora
tion
Lim
ited
(0.4
3%)
(233
)0.
57%
(3
8)(0
.41%
) (3
)0.
71%
(4
1)7
Ster
lite
Port
s Li
mit
ed(0
.01%
) (5
)0.
01%
(0
)0.
00%
-
0.
01%
(0
)8
Viza
g G
ener
al C
argo
Ber
th P
riva
te
Lim
ited
0.04
%
20
(0.4
8%)
32
(0.0
3%)
(0)
(0.5
4%)
32
9Pa
radi
p M
ulti
Car
go B
erth
Pri
vate
Li
mit
ed(0
.00%
) (2
)0.
00%
(0
)0.
00%
-
0.
00%
(0
)
10M
arit
ime
Vent
ures
Pri
vate
Lim
ited
0.01
%
8
(0.1
5%)
10
0.00
%
-
(0.1
7%)
10
11G
oa S
ea P
ort
Priv
ate
Lim
ited
(0.0
0%)
(1)
0.00
%
-
0.00
%
-
0.00
%
-
12Ve
dant
a Li
mit
ed E
SOS
Trus
t0.
09%
4
7 0.
00%
-
0.
00%
-
0.
00%
-
13
Elec
tros
teel
Ste
els
Lim
ited
6.39
%
3,4
93
0.33
%
(22)
(0.0
6%)
(1)
0.38
%
(22)
Fore
ign
Subs
idia
ries
1C
oppe
r M
ines
of
Tasm
ania
Pty
Li
mit
ed(0
.83%
) (4
56)
1.68
%
(112
)0.
00%
-
1.
92%
(1
12)
2Th
alan
ga c
oppe
r m
ines
Pty
Lim
ited
(0.0
3%)
(17)
0.06
%
(4)
0.00
%
-
0.07
%
(4)
3M
onte
Cel
lo B
V0.
35%
1
89
(0.0
3%)
2
0.00
%
-
(0.0
3%)
2
4Bl
oom
Fou
ntai
n Li
mit
ed(1
4.10
%)
(7,7
06)
3.06
%
(204
)0.
00%
-
3.
50%
(2
04)
5W
este
rn C
lust
er L
imit
ed(1
.62%
) (8
86)
0.35
%
(23)
0.00
%
-
0.39
%
(23)
6St
erlit
e (U
SA) I
nc. *
0.00
%
-
0.00
%
-
0.00
%
-
0.00
%
-
7Fu
jaira
h G
old
FZC
(0.3
1%)
(170
)3.
23%
(2
15)
0.00
%
-
3.69
%
(215
)8
THL
Zinc
Ven
ture
s Li
mit
ed2.
81%
1
,533
0.
00%
-
0.
00%
-
0.
00%
-
9
THL
Zinc
Lim
ited
6.68
%
3,6
49
0.06
%
(4)
0.00
%
-
0.07
%
(4)
10TH
L Zi
nc H
oldi
ng B
V3.
10%
1
,692
(0
.03%
) 2
0.
00%
-
(0
.03%
) 2
11
THL
Zinc
Nam
ibia
Hol
ding
s (P
ropr
ieta
ry) L
imit
ed0.
95%
5
20
0.00
%
-
0.00
%
-
0.00
%
-
12Sk
orpi
on Z
inc
(Pro
prie
tary
) Lim
ited
(0.0
0%)
(2)
0.00
%
-
0.00
%
-
0.00
%
-
13Sk
orpi
on M
inin
g C
ompa
ny
(Pro
prie
tary
) Lim
ited
(2.2
6%)
(1,2
36)
4.47
%
(298
)0.
00%
-
5.
12%
(2
98)
14N
amzi
nc (P
ropr
ieta
ry) L
imit
ed2.
00%
1
,094
0.
78%
(5
2)0.
00%
-
0.
89%
(5
2)15
Amic
a G
uest
hous
e (P
ropr
ieta
ry)
Lim
ited
0.00
%
1
(0.0
2%)
1
0.00
%
-
(0.0
2%)
1
16Bl
ack
Mou
ntai
n M
inin
g Pr
opri
etar
y Li
mit
ed2.
23%
1
,218
3.
23%
(2
15)
0.16
%
1
3.67
%
(214
)
17Ve
dant
a Li
shee
n H
oldi
ngs
Lim
ited
0.05
%
25
(0.2
6%)
17
0.00
%
-
(0.2
9%)
17
18Ve
dant
a Li
shee
n M
inin
g Li
mit
ed0.
12%
6
4 0.
06%
(4
)0.
00%
-
0.
07%
(4
)19
Killo
ran
Lish
een
Min
ing
Lim
ited
0.03
%
15
0.02
%
(1)
0.00
%
-
0.02
%
(1)
INTEGRATED REPORT MANAGEMENT REVIEW STATUTORY REPORTS FINANCIAL STATEMENTS
06-115 116-167 168-270 271-502

496 VEDANTA LIMITED INTEGRATED REPORT AND ANNUAL ACCOUNTS 2019-20 VEDANTA LIMITED INTEGRATED REPORT AND ANNUAL ACCOUNTS 2019-20 497
CONSOLIDATED NOTES FORMING PART OF THE FINANCIAL STATEMENTSas at and for the year ended March 31, 2020
CONSOLIDATED NOTES FORMING PART OF THE FINANCIAL STATEMENTSas at and for the year ended March 31, 2020
S.
No
Nam
e of
the
ent
ity
Net
Ass
etsn
(To
tal a
sset
s le
ss
tota
l lia
bili
ties
)S
hare
in p
rofi
t an
d lo
ss
Sha
re in
oth
er c
ompr
ehen
sive
in
com
e (O
CI)
Sha
re in
tot
al c
ompr
ehen
sive
in
com
e (T
CI)
As
at M
arch
31,
202
0Ye
ar e
nded
Mar
ch 3
1, 2
020
Year
end
ed M
arch
31,
202
0Ye
ar e
nded
Mar
ch 3
1, 2
020
As
% o
f co
nsol
idat
ed n
et
asse
tsA
mou
nt
(` in
Cro
re)
As
% o
f co
nsol
idat
ed
profi
tA
mou
nt
(` in
Cro
re)
As %
of
cons
olid
ated
OCI
Am
ount
(`
in C
rore
)A
s %
of
cons
olid
ated
TC
IA
mou
nt
(` in
Cro
re)
20Ki
llora
n Li
shee
n Fi
nanc
e Li
mit
ed0.
00%
-
0.
00%
-
0.
00%
-
0.
00%
-
21
Lish
een
Mill
ing
Lim
ited
0.27
%
148
0.
08%
(5
)0.
00%
-
0.
09%
(5
)22
Lish
een
Min
e Pa
rtne
rshi
p(0
.01%
) (8
)0.
09%
(6
)0.
00%
-
0.
10%
(6
)23
Lako
mas
ko B
V0.
00%
-
0.
00%
-
0.
00%
-
0.
00%
-
24
Veda
nta
Expl
orat
ion
Irel
and
Lim
ited
0.00
%
0
0.00
%
-
0.00
%
-
0.00
%
-
25C
airn
Indi
a H
oldi
ngs
Lim
ited
18.2
3%
9,9
61
(12.
58%
) 8
38
0.00
%
-
(14.
39%
) 8
38
26C
airn
Ene
rgy
Hyd
roca
rbon
s Li
mit
ed11
.53%
6
,297
(1
1.61
%)
774
0.
00%
-
(1
3.29
%)
774
27
Cai
rn L
anka
(Pri
vate
) Lim
ited
(0.9
0%)
(492
)0.
02%
(1
)0.
00%
-
0.
02%
(1
)28
Cai
rn S
outh
Afr
ica
(Pty
) Lim
ited
(0.0
0%)
(1)
0.00
%
-
0.00
%
-
0.00
%
-
29C
IG M
auri
tius
Hol
ding
Pri
vate
Ltd
.0.
00%
-
0.
02%
(1
)0.
00%
-
0.
02%
(1
)30
CIG
Mau
riti
us P
riva
te L
imit
ed0.
00%
1
0.
00%
-
0.
00%
-
0.
00%
-
31
Cai
rn E
nerg
y D
isco
very
Lim
ited
0.00
%
0
0.00
%
(0)
0.00
%
-
0.00
%
(0)
32C
airn
Exp
lora
tion
(No.
2) L
imit
ed0.
00%
-
0.
00%
-
0.
00%
-
0.
00%
-
33
Cai
rn E
nerg
y G
ujar
at B
lock
1
Lim
ited
0.00
%
2
0.00
%
-
0.00
%
-
0.00
%
-
34C
airn
Ene
rgy
Indi
a Pt
y Li
mit
ed0.
00%
-
0.
00%
-
0.
00%
-
0.
00%
-
35
Avan
Stra
te In
c(4
.09%
) (2
,235
)1.
05%
(7
0)0.
00%
-
1.
20%
(7
0)36
Avan
Stra
te K
orea
Inc
(3.5
3%)
(1,9
26)
(6.6
0%)
440
0.
00%
-
(7
.55%
) 4
40
37Av
anSt
rate
Tai
wan
Inc
6.08
%
3,3
21
5.19
%
(346
)0.
00%
-
5.
94%
(3
46)
Non
-con
trol
ling
inte
rest
s in
all
subs
idia
ries
(31.
32%
) (1
7,11
2)28
.81%
(1
,920
)14
.66%
1
23
30.8
5%
(1,7
97)
Ass
ocia
tes
(per
Equ
ity
met
hod)
Indi
an1
Gau
rav
Ove
rsea
s Pr
ivat
e Li
mit
ed0.
00%
0
0.
00%
(0
)0.
00%
-
0.
00%
(0
)Fo
reig
n1
Rosh
Skor
Tow
nshi
p (P
ty) L
td0.
00%
3
0.
00%
(0
)0.
00%
-
0.
00%
(0
)Jo
int
vent
ures
(per
Equ
ity
met
hod)
Indi
an1
Mad
anpu
r So
uth
Coa
l Com
pany
Li
mit
ed
0.00
%
1
0.00
%
(0)
(0.0
0%)
(0)
0.00
%
(0)
2G
oa M
arit
ime
Priv
ate
Lim
ited
(0.0
0%)
(0)
(0.0
0%)
0
0.00
%
-
(0.0
0%)
0
3R
ampi
a C
oal M
ines
& E
nerg
y Pr
ivat
e Li
mit
ed0.
00%
0
(0
.00%
) 0
0.
00%
-
(0
.00%
) 0
Fore
ign
4Ro
sh P
inah
Hea
lth
Car
e (P
ropr
ieta
ry) L
imit
ed0.
00%
1
(0
.01%
) 0
0.
00%
-
(0
.01%
) 0
Con
solid
atio
n Ad
just
men
ts/
Elim
inat
ions
a(1
16.8
8%)
(63,
859)
84.7
1%
(5,6
45)
51.6
1%
433
89
.48%
(5
,212
)
Tota
l10
0.00
% 5
4,63
5 10
0.00
% (
6,66
4)10
0.00
% 8
39
100.
00%
(5,
825)
*Und
er li
quid
atio
n �
��
��
�a
Con
solid
atio
n ad
just
men
ts/e
limin
atio
ns in
clud
e in
terc
ompa
ny e
limin
atio
ns, c
onso
lidat
ion
adju
stm
ents
and
GA
AP
diff
eren
ces.
Exc
hang
e R
ates
as
at M
arch
31,
202
0: 1
AU
D `
45.
9423
, 1 U
SD
`
74.
8109
, 1 A
ED
` 2
0.36
5, 1
NA
D
` 4
.181
2, 1
ZA
R
4
.181
2, 1
JPY
0.6
9197
2Av
erag
e E
xcha
nge
Rat
es f
or t
he y
ear
ende
d M
arch
31,
202
0: 1
AU
D
48.
3013
, 1 U
SD
70.
8601
, 1 A
ED
1
9.28
95, 1
NA
D
4
.793
1, 1
ZA
R
4
.793
1, 1
JP
Y
0.6
5199
8
S.
No
Nam
e of
the
ent
ity
Net
Ass
etsn
(To
tal a
sset
s le
ss
tota
l lia
bili
ties
)S
hare
in p
rofi
t an
d lo
ss
Sha
re in
oth
er c
ompr
ehen
sive
in
com
e (O
CI)
Sha
re in
tot
al c
ompr
ehen
sive
in
com
e (T
CI)
As
at M
arch
31,
201
9Ye
ar e
nded
Mar
ch 3
1, 2
019
Year
end
ed M
arch
31,
201
9Ye
ar e
nded
Mar
ch 3
1, 2
019
As
% o
f co
nsol
idat
ed n
et
asse
tsA
mou
nt
( in
Cro
re)
As
% o
f co
nsol
idat
ed
profi
tA
mou
nt
( in
Cro
re)
As %
of
cons
olid
ated
OCI
Am
ount
( in
Cro
re)
As
% o
f co
nsol
idat
ed T
CI
Am
ount
( in
Cro
re)
Par
ent
Veda
nta
Lim
ited
12
5.01
%
77,
880
71.8
3%
5,0
75
71.2
8%
417
71
.79%
5
,492
In
dian
Sub
sidi
arie
s1
Hin
dust
an Z
inc
Lim
ited
53.9
4%
33,
605
112.
61%
7
,956
(1
6.07
%)
(94)
102.
77%
7
,862
2
Bhar
at A
lum
iniu
m C
ompa
ny
Lim
ited
6.52
%
4,0
62
8.11
%
573
(6
.08%
) (3
6)7.
02%
5
37
3M
ALC
O E
nerg
y Li
mit
ed0.
74%
4
61
0.01
%
1
0.05
%
0
0.02
%
1
4Ta
lwan
di S
abo
Pow
er L
imit
ed4.
10%
2
,556
(0
.78%
) (5
5)(0
.05%
) (0
)(0
.72%
) (5
5)5
Sesa
Res
ourc
es L
imit
ed0.
09%
5
9 (0
.50%
) (3
5)0.
00%
0
(0
.46%
) (3
5)6
Sesa
Min
ing
Cor
pora
tion
Lim
ited
(0.3
0%)
(190
)(0
.48%
) (3
4)0.
00%
0
(0
.44%
) (3
4)7
Ster
lite
Port
s Li
mit
ed(0
.01%
) (4
)(0
.01%
) (0
)0.
00%
-
(0
.00%
) (0
)8
Viza
g G
ener
al C
argo
Ber
th P
riva
te
Lim
ited
(0.0
2%)
(11)
(0.4
7%)
(33)
(0.0
0%)
(0)
(0.4
3%)
(33)
9Pa
radi
p M
ulti
Car
go B
erth
Pri
vate
Li
mit
ed(0
.00%
) (1
)(0
.00%
) (0
)0.
00%
-
(0
.00%
) (0
)
10M
arit
ime
Vent
ures
Pri
vate
Lim
ited
(0.0
0%)
(3)
0.06
%
4
0.00
%
-
0.05
%
4
11G
oa S
ea P
ort
Priv
ate
Lim
ited
(0.0
0%)
(1)
(0.0
0%)
(0)
0.00
%
-
(0.0
0%)
(0)
12Ve
dant
a Li
mit
ed E
SOS
Trus
t0.
08%
4
7 0.
31%
2
2 0.
00%
-
0.
29%
2
2 13
Veda
nta
Star
Lim
ited
*2.
83%
1
,761
(0
.13%
) (9
)0.
00%
-
(0
.12%
) (9
)14
Elec
tros
teel
Ste
els
Lim
ited
**5.
85%
3
,646
16
.82%
1
,188
0.
14%
1
15
.54%
1
,189
Fo
reig
n Su
bsid
iari
es1
Cop
per
Min
es o
f Ta
sman
ia P
ty
Lim
ited
(0.6
0%)
(376
)(1
.23%
) (8
7)0.
00%
-
(1
.14%
) (8
7)
2Th
alan
ga c
oppe
r m
ines
Pty
Lim
ited
(0.0
2%)
(11)
0.11
%
8
0.00
%
-
0.10
%
8
3M
onte
Cel
lo B
V0.
28%
1
72
0.03
%
2
0.00
%
-
0.03
%
2
4Bl
oom
Fou
ntai
n Li
mit
ed(1
3.58
%)
(8,4
63)
(2.7
3%)
(193
)0.
00%
-
(2
.52%
) (1
93)
5W
este
rn C
lust
er L
imit
ed(1
.28%
) (7
97)
(0.3
1%)
(22)
0.00
%
-
(0.2
9%)
(22)
6St
erlit
e (U
SA) I
nc. *
**0.
00%
-
0.
00%
-
0.
00%
-
0.
00%
-
7
Fuja
irah
Gol
d FZ
C0.
08%
5
2 (0
.03%
) (2
)(2
.22%
) (1
3)(0
.20%
) (1
5)8
THL
Zinc
Ven
ture
s Li
mit
ed(5
.50%
) (3
,425
)(0
.00%
) (0
)0.
00%
-
(0
.00%
) (0
)9
THL
Zinc
Lim
ited
(4.5
3%)
(2,8
21)
(0.0
7%)
(5)
0.00
%
-
(0.0
7%)
(5)
10TH
L Zi
nc H
oldi
ng B
V(3
.56%
) (2
,218
)(0
.01%
) (1
)0.
00%
-
(0
.01%
) (1
)11
THL
Zinc
Nam
ibia
Hol
ding
s `(
Prop
riet
ary)
Lim
ited
0.95
%
594
0.
00%
-
0.
00%
-
0.
00%
-
12Sk
orpi
on Z
inc
(Pro
prie
tary
) Lim
ited
(0.0
0%)
(2)
0.00
%
0
0.00
%
-
0.00
%
0
13Sk
orpi
on M
inin
g C
ompa
ny
(Pro
prie
tary
) Lim
ited
(1.7
9%)
(1,1
15)
(4.6
9%)
(331
)0.
00%
-
(4
.33%
) (3
31)
14N
amzi
nc (P
ropr
ieta
ry) L
imit
ed2.
09%
1
,302
1.
08%
7
6 0.
00%
-
0.
99%
7
6 15
Amic
a G
uest
hous
e (P
ropr
ieta
ry)
Lim
ited
(0.0
0%)
(0)
0.01
%
1
0.00
%
-
0.01
%
1
INTEGRATED REPORT MANAGEMENT REVIEW STATUTORY REPORTS FINANCIAL STATEMENTS
06-115 116-167 168-270 271-502

498 VEDANTA LIMITED INTEGRATED REPORT AND ANNUAL ACCOUNTS 2019-20 VEDANTA LIMITED INTEGRATED REPORT AND ANNUAL ACCOUNTS 2019-20 499
CONSOLIDATED NOTES FORMING PART OF THE FINANCIAL STATEMENTSas at and for the year ended March 31, 2020
CONSOLIDATED NOTES FORMING PART OF THE FINANCIAL STATEMENTSas at and for the year ended March 31, 2020
S.
No
Nam
e of
the
ent
ity
Net
Ass
etsn
(To
tal a
sset
s le
ss
tota
l lia
bili
ties
)S
hare
in p
rofi
t an
d lo
ss
Sha
re in
oth
er c
ompr
ehen
sive
in
com
e (O
CI)
Sha
re in
tot
al c
ompr
ehen
sive
in
com
e (T
CI)
As
at M
arch
31,
201
9Ye
ar e
nded
Mar
ch 3
1, 2
019
Year
end
ed M
arch
31,
201
9Ye
ar e
nded
Mar
ch 3
1, 2
019
As
% o
f co
nsol
idat
ed n
et
asse
tsA
mou
nt
( in
Cro
re)
As
% o
f co
nsol
idat
ed
profi
tA
mou
nt
( in
Cro
re)
As %
of
cons
olid
ated
OCI
Am
ount
(
in C
rore
)A
s %
of
cons
olid
ated
TC
IA
mou
nt
( in
Cro
re)
16Bl
ack
Mou
ntai
n M
inin
g Pr
opri
etar
y Li
mit
ed2.
52%
1
,569
2.
49%
1
76
0.34
%
2
2.33
%
178
17Ve
dant
a Li
shee
n H
oldi
ngs
Lim
ited
0.01
%
7
0.00
%
-
0.00
%
-
0.00
%
-
18Ve
dant
a Li
shee
n M
inin
g Li
mit
ed0.
06%
4
0 (0
.17%
) (1
2)0.
00%
-
(0
.16%
) (1
2)19
Killo
ran
Lish
een
Min
ing
Lim
ited
0.02
%
14
0.20
%
14
0.00
%
-
0.18
%
14
20Ki
llora
n Li
shee
n Fi
nanc
e Li
mit
ed0.
00%
2
0.
00%
-
0.
00%
-
0.
00%
-
21
Lish
een
Mill
ing
Lim
ited
0.25
%
157
0.
01%
1
0.
00%
-
0.
01%
1
22
Lish
een
Min
e Pa
rtne
rshi
p0.
00%
-
(0
.33%
) (2
3)0.
00%
-
(0
.30%
) (2
3)23
Lako
mas
ko B
V0.
00%
0
(0
.00%
) (0
)0.
00%
-
(0
.00%
) (0
)24
Veda
nta
Expl
orat
ion
Irel
and
Lim
ited
0.00
%
0
0.00
%
-
0.00
%
-
0.00
%
-
25C
airn
Indi
a H
oldi
ngs
Lim
ited
16.8
0%
10,
469
28.3
2%
2,0
01
0.00
%
-
26.1
6%
2,0
01
26C
airn
Ene
rgy
Hyd
roca
rbon
s Li
mit
ed9.
88%
6
,154
14
.55%
1
,028
0.
00%
-
13
.44%
1
,028
27
Cai
rn L
anka
(Pri
vate
) Lim
ited
(0.7
3%)
(455
)(0
.01%
) (1
)0.
00%
-
(0
.01%
) (1
)28
Cai
rn S
outh
Afr
ica
(Pty
) Lim
ited
(0.0
3%)
(19)
(0.0
3%)
(2)
0.00
%
-
(0.0
3%)
(2)
29C
IG M
auri
tius
Hol
ding
Pri
vate
Li
mit
ed(0
.00%
) (0
)(0
.00%
) (0
)0.
00%
-
(0
.00%
) (0
)
30C
IG M
auri
tius
Pri
vate
Lim
ited
(0.0
0%)
(0)
(0.0
0%)
(0)
0.00
%
-
(0.0
0%)
(0)
31C
airn
Ene
rgy
Dis
cove
ry L
imit
ed(0
.00%
) (0
)(0
.00%
) (0
)0.
00%
-
(0
.00%
) (0
)32
Cai
rn E
xplo
rati
on (N
o. 2
) Lim
ited
0.00
%
-
0.00
%
-
0.00
%
-
0.00
%
-
33C
airn
Ene
rgy
Guj
arat
Blo
ck 1
Li
mit
ed0.
00%
2
0.
00%
0
0.
00%
-
0.
00%
0
34C
airn
Ene
rgy
Indi
a Pt
y Li
mit
ed0.
00%
-
0.
00%
-
0.
00%
-
0.
00%
-
35
Avan
Stra
te In
c(3
.13%
) (1
,952
)(0
.13%
) (9
)0.
00%
-
(0
.12%
) (9
)36
Avan
Stra
te K
orea
Inc
(2.3
4%)
(1,4
57)
(0.6
8%)
(48)
0.00
%
-
(0.6
3%)
(48)
37Av
anSt
rate
Tai
wan
Inc
4.88
%
3,0
43
(1.1
5%)
(81)
0.00
%
-
(1.0
6%)
(81)
Non
-con
trol
ling
inte
rest
s in
all
subs
idia
ries
(24.
44%
) (1
5,22
7)(3
7.27
%)
(2,6
33)
21.8
8%
128
(3
2.75
%)
(2,5
05)
Ass
ocia
tes
(per
Equ
ity
met
hod)
Indi
an1
Gau
rav
Ove
rsea
s Pr
ivat
e Li
mit
ed0.
00%
0
(0
.00%
) (0
)0.
00%
-
(0
.00%
) (0
)Fo
reig
n1
Rosh
Skor
Tow
nshi
p (P
ty) L
td0.
01%
4
0.
00%
0
0.
00%
-
0.
00%
0
Jo
int
vent
ures
(per
Equ
ity
met
hod)
Indi
an1
Mad
anpu
r So
uth
Coa
l Com
pany
Li
mit
ed
0.00
%
1
(0.0
0%)
(0)
0.01
%
0
0.00
%
0
2G
oa M
arit
ime
Priv
ate
Lim
ited
(0.0
0%)
(0)
0.00
%
0
0.00
%
-
0.00
%
0
S.
No
Nam
e of
the
ent
ity
Net
Ass
etsn
(To
tal a
sset
s le
ss
tota
l lia
bili
ties
)S
hare
in p
rofi
t an
d lo
ss
Sha
re in
oth
er c
ompr
ehen
sive
in
com
e (O
CI)
Sha
re in
tot
al c
ompr
ehen
sive
in
com
e (T
CI)
As
at M
arch
31,
201
9Ye
ar e
nded
Mar
ch 3
1, 2
019
Year
end
ed M
arch
31,
201
9Ye
ar e
nded
Mar
ch 3
1, 2
019
As
% o
f co
nsol
idat
ed n
et
asse
tsA
mou
nt
( in
Cro
re)
As
% o
f co
nsol
idat
ed
profi
tA
mou
nt
( in
Cro
re)
As %
of
cons
olid
ated
OCI
Am
ount
(
in C
rore
)A
s %
of
cons
olid
ated
TC
IA
mou
nt
( in
Cro
re)
3R
ampi
a C
oal M
ines
& E
nerg
y Pr
ivat
e Li
mit
ed0.
00%
0
0.
00%
0
0.
00%
-
0.
00%
0
Fore
ign
4Ro
sh P
inah
Hea
lth
Car
e (P
ropr
ieta
ry) L
imit
ed0.
00%
1
0.
00%
0
0.
00%
-
0.
00%
0
Con
solid
atio
n Ad
just
men
ts/
Elim
inat
ions
a(7
5.15
%)
(46,
815)
(105
.37%
) (7
,445
)30
.77%
1
80
(94.
97%
) (7
,265
)
Tota
l10
0.00
% 6
2,29
7 10
0.00
% 7
,065
10
0.00
% 5
85
100.
00%
7,6
50
*Inc
orpo
rate
d du
ring
the
cur
rent
yea
r **
Purc
hase
d du
ring
the
yea
r. It
ems
of P
rofi
t an
d lo
ss, O
CI a
nd T
CI a
re f
or t
he f
ull fi
nanc
ial y
ear
***U
nder
liqu
idat
ion
(a) C
onso
lidat
ion
adju
stm
ents
/elim
inat
ions
incl
ude
inte
rcom
pany
elim
inat
ions
, co
nsol
idat
ion
adju
stm
ents
and
GA
AP
diff
eren
ces.
Exc
hang
e R
ates
as
at M
arch
31,
201
9: 1
AU
D
49.
0217
, 1 U
SD
69.
1713
, 1 A
ED
1
8.82
98, 1
NA
D
4
.777
4, 1
ZA
R
4
.777
4, 1
JPY
62.
5200
Aver
age
Exc
hang
e R
ates
for
the
yea
r en
ded
Mar
ch 3
1, 2
019:
1 A
UD
5
0.75
80, 1
US
D
6
9.88
89, 1
AED
19.
0228
, 1 N
AD
5.0
802,
1 Z
AR
5.0
802,
1
JPY
6
3.03
96In
add
itio
n to
the
abo
ve, l
iqui
dati
on o
f th
ree
othe
r su
bsid
iari
es o
f th
e C
ompa
ny n
amel
y, T
win
Sta
r M
auri
tius
Hol
ding
s Li
mit
ed, T
win
Sta
r En
ergy
Hol
ding
s Li
mit
ed a
nd S
esa
Ste
rlit
e M
auri
tius
Hol
ding
s Li
mit
ed w
as a
ccep
ted
by t
he D
irec
tor
of In
solv
ency
Ser
vice
, Mau
riti
us d
urin
g th
e ye
ar e
nded
Mar
ch 3
1, 2
019.
See
acco
mpa
nyin
g no
tes
to t
he fi
nanc
ial s
tate
men
ts
As p
er o
ur r
epor
t of
eve
n da
teFo
r an
d on
beh
alf
of t
he B
oard
of
Dire
ctor
s
For
S.R
. Bat
liboi
& C
o. L
LPA
nil A
garw
alSu
nil D
ugga
lC
hart
ered
Acc
ount
ants
ICAI
Fir
m R
egis
trat
ion
No.
301
003E
/E30
0005
Non
-Exe
cuti
ve C
hair
man
D
IN: 0
0010
883
Inte
rim
Chi
ef E
xecu
tive
Offi
cer
PAN
AAM
PD11
09M
per
Sudh
ir S
oni
GR
Aru
n K
umar
Pre
rna
Hal
was
iya
Part
ner
Mem
bers
hip
No:
418
70W
hole
-Tim
e D
irect
or a
nd
Chi
ef F
inan
cial
Offi
cer
DIN
: 018
7476
9
Com
pany
Sec
reta
ry
ICSI
Mem
bers
hip
No.
A20
856
Plac
e: M
umba
i
Dat
e: J
une
06, 2
020
INTEGRATED REPORT MANAGEMENT REVIEW STATUTORY REPORTS FINANCIAL STATEMENTS
06-115 116-167 168-270 271-502

500 VEDANTA LIMITED INTEGRATED REPORT AND ANNUAL ACCOUNTS 2019-20 VEDANTA LIMITED INTEGRATED REPORT AND ANNUAL ACCOUNTS 2019-20 501
CONSOLIDATED NOTES FORMING PART OF THE FINANCIAL STATEMENTSas at and for the year ended March 31, 2020
CONSOLIDATED NOTES FORMING PART OF THE FINANCIAL STATEMENTSas at and for the year ended March 31, 2020
FOR
M A
OC
-IS
alie
nt f
eatu
res
of S
ubsi
diar
ies
purs
uant
to
firs
t pr
ovis
o to
sub
sec
tion
(3)
of
sect
ion
129
read
wit
h ru
le 5
of
Com
pani
es (
Acc
ount
s)
Rul
es, 2
014
(` in
Cro
re)
SI.
No.
Nam
e of
the
Sub
sidi
ary
Rep
orti
ng
Per
iod
Rep
orti
ng C
urre
ncy
Sha
re
Cap
ital
Res
erve
s &
Sur
plus
Tota
l A
sset
sTo
tal
Liab
iliti
es
Inve
st-
men
ts
(exc
ludi
ng
Inve
st-
men
t in
S
ubsi
diar
y)Tu
rnov
er
Pro
fit/
(Los
s)
Bef
ore
Taxa
tion
Pro
visi
on
for
Taxa
tion
ex
pens
e /
(cre
dit)
Pro
fit/
(Los
s)
Aft
er
Taxa
tion
Pro
pose
d D
ivid
end
% o
f sh
are-
hold
ing
1Bh
arat
Alu
min
ium
C
ompa
ny L
imit
edAp
ril t
o M
arch
INR
- IN
DIA
N R
UPE
E 2
21
3,7
27
14,
200
10,
252
250
8
,859
(2
06)
(88)
(118
)0.
0051
2C
oppe
r M
ines
of
Tasm
ania
Pty
Lim
ited
Apri
l to
Mar
chAU
D -
Aus
tral
ian
Dol
lar
0
(456
) 5
6 5
12
-
1
(112
) -
(1
12)
0.00
100
3Th
alan
ga C
oppe
r M
ines
Pt
y Li
mit
edAp
ril t
o M
arch
AUD
- A
ustr
alia
n D
olla
r 3
(2
0) 7
2
4 -
-
(4
) -
(4
)0.
0010
0
4M
onte
Cel
lo B
VAp
ril t
o M
arch
USD
- U
nite
d St
ates
D
olla
r 0
1
89
208
1
9 -
-
3
1
2
0.
0010
0
5H
indu
stan
Zin
c Li
mit
edAp
ril t
o M
arch
INR
- IN
DIA
N R
UPE
E 8
45
39,
465
46,
975
6,6
64
20,
329
18,
561
8,3
90
1,5
85
6,8
05
0.00
64.9
2
6M
ALC
O E
nerg
y Li
mit
edAp
ril t
o M
arch
INR
- IN
DIA
N R
UPE
E 5
2
25
286
5
6 1
48
(0)
(231
) -
(2
31)
0.00
100
7Fu
jaira
h G
old
FZC
Apri
l to
Mar
chAE
D -
Em
irati
Dir
ham
6,8
41
(7,0
11)
1,0
13
1,1
83
-
3,0
82
(215
) -
(2
15)
0.00
100
8Ta
lwan
di S
abo
Pow
er
Lim
ited
Ap
ril t
o M
arch
INR
- IN
DIA
N R
UPE
E 3
,207
7
9 1
2,65
2 9
,367
-
4
,817
3
23
(408
) 7
30
0.00
100
9St
erlit
e (U
SA) I
nc.*
Apri
l to
Mar
chU
SD -
Uni
ted
Stat
es
Dol
lar
0.00
0.00
0.00
0.00
0.00
0.00
0.00
0.00
0.00
0.00
100
10TH
L Zi
nc V
entu
res
Lim
ited
Apri
l to
Mar
chU
SD -
Uni
ted
Stat
es
Dol
lar
127
1
,405
1
,533
-
-
-
-
-
-
0.
0010
0
11TH
L Zi
nc L
td
Apri
l to
Mar
chU
SD -
Uni
ted
Stat
es
Dol
lar
134
3
,514
4
,080
4
31
-
-
(4)
-
(4)
0.00
100
12TH
L Zi
nc H
oldi
ng B
VAp
ril t
o M
arch
USD
- U
nite
d St
ates
D
olla
r 9
4 1
,598
2
,337
6
45
-
-
1
(1)
2
0.00
100
13TH
L Zi
nc N
amib
ia
Hol
ding
s (P
ropr
ieta
ry)
Ltd
Apri
l to
Mar
chN
AD -
Nam
ibia
n D
olla
r 0
5
20
526
6
-
-
-
-
-
0.
0010
0
14Sk
orpi
on Z
inc
(Pro
prie
tary
) Lim
ited
Apri
l to
Mar
chN
AD -
Nam
ibia
n D
olla
r 0
(2
) 4
09
411
4
-
-
-
-
0.
0010
0
15Sk
orpi
on M
inin
g C
ompa
ny
(Pro
prie
tary
) Lim
ited
Apri
l to
Mar
chN
AD -
Nam
ibia
n D
olla
r 0
(1
,235
) 1
,393
2
,629
-
1
97
(298
) -
(2
98)
0.00
100
16N
amzi
nc (P
ropr
ieta
ry)
Lim
ited
Apri
l to
Mar
chN
AD -
Nam
ibia
n D
olla
r 0
1
,094
2
,619
1
,525
-
1
,131
(5
2) -
(5
2)0.
0010
0
17Am
ica
Gue
stho
use
(Pro
prie
tary
) Lim
ited
Apri
l to
Mar
chN
AD -
Nam
ibia
n D
olla
r 0
1
2
1
-
3
1
-
1
0.
0010
0
18Bl
ack
Mou
ntai
n M
inin
g (P
ropr
ieta
ry) L
imit
edAp
ril t
o M
arch
ZAR
- S
outh
Afr
ican
R
and
0
1,2
18
3,7
39
2,5
21
-
1,9
94
(299
) (8
3) (2
15)
0.00
74
19Ve
dant
a Li
shee
n H
oldi
ngs
Lim
ited
Apri
l to
Mar
chU
SD -
Uni
ted
Stat
es
Dol
lar
0
25
26
1
-
-
17
-
17
0.00
100
20Ve
dant
a Li
shee
n M
inin
g Li
mit
edAp
ril t
o M
arch
USD
- U
nite
d St
ates
D
olla
r 0
6
4 6
5 0
-
-
(4
) (0
) (4
)0.
0010
0
21Ki
llora
n Li
shee
n M
inin
g Li
mit
edAp
ril t
o M
arch
USD
- U
nite
d St
ates
D
olla
r 0
1
5 1
5 0
-
-
(2
) (0
) (1
)0.
0010
0
22Ki
llora
n Li
shee
n Fi
nanc
e Li
mit
edAp
ril t
o M
arch
USD
- U
nite
d St
ates
D
olla
r 0
-
0
-
-
-
-
-
-
0.
0010
0
23Li
shee
n M
illin
g Li
mit
edAp
ril t
o M
arch
USD
- U
nite
d St
ates
D
olla
r 0
1
48
165
1
6 -
-
(4
) 1
(5
)0.
0010
0
24Li
shee
n M
ine
Part
ners
hipA
pril
to M
arch
USD
- U
nite
d St
ates
D
olla
r -
-
1
1 1
9 -
-
(6
) -
(6
)0.
0010
0
25St
erlit
e Po
rts
Lim
ited
Apri
l to
Mar
chIN
R -
IND
IAN
RU
PEE
0
(5)
0
5
-
-
(0)
-
(0)
0.00
100
26Vi
zag
Gen
eral
Car
go
Bert
h Pr
ivat
e Li
mit
edAp
ril t
o M
arch
INR
- IN
DIA
N R
UPE
E 3
2 (1
2) 6
28
608
5
0 1
71
(24)
(56)
32
0.00
100
(` in
Cro
re)
SI.
No.
Nam
e of
the
Sub
sidi
ary
Rep
orti
ng
Per
iod
Rep
orti
ng C
urre
ncy
Sha
re
Cap
ital
Res
erve
s &
Sur
plus
Tota
l A
sset
sTo
tal
Liab
iliti
es
Inve
st-
men
ts
(exc
ludi
ng
Inve
st-
men
t in
S
ubsi
diar
y)Tu
rnov
er
Pro
fit/
(Los
s)
Bef
ore
Taxa
tion
Pro
visi
on
for
Taxa
tion
ex
pens
e /
(cre
dit)
Pro
fit/
(Los
s)
Aft
er
Taxa
tion
Pro
pose
d D
ivid
end
% o
f sh
are-
hold
ing
27C
airn
Indi
a H
oldi
ngs
Lim
ited
Ap
ril t
o M
arch
USD
- U
nite
d St
ates
D
olla
r 5
,652
4
,308
1
3,95
6 3
,995
5
,818
-
8
44
6
838
0.
0010
0
28C
airn
Ene
rgy
Hyd
roca
rbon
s Li
mit
edAp
ril t
o M
arch
USD
- U
nite
d St
ates
D
olla
r 4
,306
1
,990
1
0,39
2 4
,095
1
,653
5
,904
1
,593
8
20
774
0.
0010
0
29C
airn
Lan
ka (P
riva
te)
Lim
ited
Ap
ril t
o M
arch
USD
- U
nite
d St
ates
D
olla
r 1
,275
(1
,767
) 1
0 5
02
1
-
(1)
-
(1)
0.00
100
30C
airn
Sou
th A
fric
a (P
ty)
Lim
ited
Apri
l to
Mar
chU
SD -
Uni
ted
Stat
es
Dol
lar
288
(2
89)
-
1
-
-
-
-
-
0.00
100
31C
IG M
auri
tius
Hol
ding
Pr
ivat
e Li
mit
ed
Apri
l to
Mar
chU
SD -
Uni
ted
Stat
es
Dol
lar
1,7
56
(1,7
56)
-
-
-
-
(1)
-
(1)
0.00
100
32C
IG M
auri
tius
Pri
vate
Li
mit
ed
Apri
l to
Mar
chU
SD -
Uni
ted
Stat
es
Dol
lar
1,7
53
(1,7
52)
1
-
-
-
-
-
-
0.00
100
33C
airn
Ene
rgy
Dis
cove
ry
Lim
ited
Apri
l to
Mar
chU
SD -
Uni
ted
Stat
es
Dol
lar
0
(0)
0
(0)
-
-
(0)
-
(0)
0.00
100
34C
airn
Exp
lora
tion
(No.
2)
Lim
ited
Apri
l to
Mar
chU
SD -
Uni
ted
Stat
es
Dol
lar
4
(4)
-
-
-
-
-
-
-
0.00
100
35C
airn
Ene
rgy
Guj
arat
Bl
ock
1 Li
mit
edAp
ril t
o M
arch
USD
- U
nite
d St
ates
D
olla
r 2
-
2
-
2
-
-
-
-
0.
0010
0
36C
airn
Ene
rgy
Indi
a Pt
y Li
mit
edJa
nuar
y to
D
ecem
ber
USD
- U
nite
d St
ates
D
olla
r (0
) (0
) (0
) 0
-
-
-
-
-
0.
0010
0
37Pa
radi
p M
ulti
Car
go
Bert
h Pr
ivat
e Li
mit
edAp
ril t
o M
arch
INR
- IN
DIA
N R
UPE
E 0
(1
) 4
6
-
-
(0
) -
(0
)0.
0010
0
38Bl
oom
Fou
ntai
n Li
mit
edAp
ril t
o M
arch
USD
- U
nite
d St
ates
D
olla
r 1
6,74
9 (2
4,45
5) -
7
,706
-
-
(2
04)
-
(204
)0.
0010
0
39W
este
rn C
lust
er L
imit
edAp
ril t
o M
arch
USD
- U
nite
d St
ates
D
olla
r -
(8
86)
1
887
-
-
(2
3) -
(2
3)0.
0010
0
40Se
sa R
esou
rces
Lim
ited
Apri
l to
Mar
chIN
R -
IND
IAN
RU
PEE
1
10
130
1
20
-
11
(48)
-
(48)
0.00
100
41Se
sa M
inin
g C
orpo
rati
on
Lim
ited
Apri
l to
Mar
chIN
R -
IND
IAN
RU
PEE
12
(243
) 1
30
363
-
3
(3
8) -
(3
8)0.
0010
0
42Ve
dant
a Ex
plor
atio
n Ir
elan
d Li
mit
edAp
ril t
o M
arch
USD
- U
nite
d St
ates
D
olla
r 0
-
0
-
-
-
-
-
-
0.
0010
0
43M
arit
ime
Vent
ures
Pr
ivat
e Li
mit
edAp
ril t
o M
arch
INR
- IN
DIA
N R
UPE
E 0
8
4
0 3
2 2
7 6
8 1
1 1
1
0 0.
0010
0
44La
kom
asko
BV
Apri
l to
Mar
chU
SD -
Uni
ted
Stat
es
Dol
lar
0
-
-
-
-
-
-
-
-
0.00
100
45G
oa S
ea P
ort
Priv
ate
Lim
ited
Apri
l to
Mar
chIN
R -
IND
IAN
RU
PEE
0
(1)
2
3
-
-
-
-
-
0.00
100
46Ve
dant
a Li
mit
ed E
SOS
Trus
tAp
ril t
o M
arch
INR
- IN
DIA
N R
UPE
E 0
4
7 3
81
334
0.
00 -
0
-
0
0.
0010
0
47Av
anSt
rate
Inc
Apri
l to
Mar
chJP
Y -
Japa
nese
Yen
7
(2,2
42)
3,1
48
5,3
83
-
-
(81)
(11)
(70)
0.00
51.6
3
48Av
anSt
rate
Kor
ea In
cAp
ril t
o M
arch
JPY
- Ja
pane
se Y
en 9
09
(2,8
35)
398
2
,324
-
1
9 4
40
-
440
0.
0010
0
49Av
anSt
rate
Tai
wan
Inc
Apri
l to
Mar
chJP
Y -
Japa
nese
Yen
396
2
,925
3
,857
5
36
-
291
(2
79)
67
(346
)0.
0010
0
50El
ectr
oste
el S
teel
s Li
mite
dAp
ril t
o M
arch
INR
- IN
DIA
N R
UPE
E 1
,849
1
,644
8
,400
4
,907
1
,100
4
,378
(2
2) (0
) (2
2)0.
0095
.74
a. E
xcha
nge
Rat
es a
s at
Mar
ch 3
1, 2
020:
1 A
UD
4
5.94
23, 1
US
D
7
4.81
09, 1
AED
20.
365,
1 N
AD
4.1
812,
1 Z
AR
4.1
812,
1 J
PY
0
.691
972
b. A
vera
ge E
xcha
nge
Rat
es f
or t
he y
ear
ende
d M
arch
31,
202
0: 1
AU
D
48.
3013
, 1 U
SD
70.
8601
, 1 A
ED
1
9.28
95, 1
NA
D
4
.793
1, 1
ZA
R
4
.793
1,
1 JP
Y
0.6
5199
8**
Pur
chas
ed d
urin
g th
e ye
ar. I
tem
s of
Pro
fit
and
Loss
are
for
the
ful
l fina
ncia
l yea
r.*U
nder
liqu
idat
ion
FOR
M A
OC
-IS
alie
nt f
eatu
res
of S
ubsi
diar
ies
purs
uant
to
firs
t pr
ovis
o to
sub
sec
tion
(3)
of
sect
ion
129
read
wit
h ru
le 5
of
Com
pani
es (
Acc
ount
s)
Rul
es, 2
014
INTEGRATED REPORT MANAGEMENT REVIEW STATUTORY REPORTS FINANCIAL STATEMENTS
06-115 116-167 168-270 271-502

502 VEDANTA LIMITED INTEGRATED REPORT AND ANNUAL ACCOUNTS 2019-20
CONSOLIDATED NOTES FORMING PART OF THE FINANCIAL STATEMENTSas at and for the year ended March 31, 2020
FOR
M A
OC
-ISa
lient
fea
ture
s of
Ass
ocia
te c
ompa
nies
and
Joi
nt V
entu
res
purs
uant
to
firs
t pr
ovis
o to
sub
sec
tion
(3) o
f se
ctio
n 12
9 re
ad w
ith
rule
5 o
f C
ompa
nies
(Acc
ount
s) R
ules
, 201
4
(` in
Cro
re)
S.
No
Nam
e of
Ass
ocia
tes/
Join
t V
entu
res
Ros
hSko
r To
wns
hip
(Pty
) Lt
dG
aura
v O
vers
eas
Pri
vate
Lim
ited
Mad
anpu
r S
outh
C
oal C
ompa
ny
Lim
ited
G
oa M
arit
ime
Pri
vate
Lim
ited
Ram
pia
Coa
l M
ines
& E
nerg
y P
riva
te L
imit
ed*
Ros
h P
inah
Hea
lth
Car
e (P
ropr
ieta
ry)
Lim
ited
1La
test
aud
ited
Bal
ance
she
et d
ate
June
30,
201
9 M
arch
31,
202
0 M
arch
31,
202
0 M
arch
31,
202
0 M
arch
31,
202
0 D
ecem
ber
31, 2
019
2Sh
ares
of
Asso
ciat
e/Jo
int
Vent
ures
hel
d by
the
Com
pany
at
the
year
end
- N
umbe
r 5
0 3
,23,
000
1,1
4,42
1 5
,000
2
,72,
29,5
39
69
- Am
ount
of
inve
stm
ent
( C
rore
) 4
0
2
0
3
0
-
% o
f ho
ldin
g50
.00%
50.0
0%17
.62%
50.0
0%17
.39%
69.0
0%3
Des
crip
tion
of
how
the
re is
sig
nific
ant
infl
uenc
eAs
soci
ate
Asso
ciat
e J
oint
Ven
ture
J
oint
Ven
ture
J
oint
Ven
ture
J
oint
Ven
ture
4Re
ason
why
the
Ass
ocia
te /
Joi
nt
Vent
ure
is n
ot c
onso
lidat
ed C
onso
lidat
ed
Con
solid
ated
C
onso
lidat
ed
Con
solid
ated
C
onso
lidat
ed
Con
solid
ated
5N
etw
orth
att
ribu
tabl
e to
sha
reho
ldin
g as
per
late
st a
udit
ed B
alan
ce s
heet
(
Cro
re)
3
0
1
(0)
0
0.97
6Pr
ofit/
(Los
s) f
or t
he y
ear
( C
rore
) (0
) (0
) (0
) 0
0
0.
34
*app
lied
for
stri
king
off
For
S.R
. Bat
liboi
& C
o. L
LPA
nil A
garw
alSu
nil D
ugga
lC
hart
ered
Acc
ount
ants
ICAI
Fir
m R
egis
trat
ion
No.
301
003E
/E30
0005
Non
-Exe
cuti
ve C
hair
man
D
IN: 0
0010
883
Inte
rim
Chi
ef E
xecu
tive
Offi
cer
PAN
AAM
PD11
09M
per
Sudh
ir S
oni
GR
Aru
n K
umar
Pre
rna
Hal
was
iya
Part
ner
Mem
bers
hip
No:
418
70W
hole
-Tim
e D
irect
or a
nd
Chi
ef F
inan
cial
Offi
cer
DIN
: 018
7476
9
Com
pany
Sec
reta
ry
ICSI
Mem
bers
hip
No.
A20
856
Plac
e: M
umba
i
Dat
e: J
une
06, 2
020
NOTES

noteS

VEDANTA LIMITED 1st Floor, ‘C’ wing, Unit 103, Corporate Avenue,
Atul Projects, Chakala, Andheri (East), Mumbai–400093, Maharashtra
CIN: L13209MH1965PLC291394 | www.vedantalimited.com
Designed by Synapse.co
ZIN
C-LE
AD-S
IVER
I
OIL & GAS I A
LUMINIUM & POWER I COPPER I IRON ORE & STEEL