Antecedents of green behavioral intentions: A cross-country study of Turkey, Finland and Pakistan
11
Antecedents of green behavioral intentions: a cross-country study of Turkey, Finland and Pakistan Faruk Anıl Konuk 1 , Saleem Ur Rahman 2 and Jari Salo 3 1 Faculty of Business Administration, Department of Business Administration, Sakarya University, Sakarya, Turkey 2 Faculty of Business, Department of Marketing, University of Vaasa, Finland 3 Department of Marketing, Oulu Business School, Finland Keywords Green trust, green satisfaction, green brand equity, behavioral intentions. Correspondence Faruk Anıl Konuk, Faculty of Business Administration, Department of Business Administration, Sakarya University, Esentepe Campus, 54187 Serdivan, Sakarya, Turkey. E-mail: [email protected] doi: 10.1111/ijcs.12209 Abstract Quality of life of the future generations depends on the efforts of current generations to protect environment. The purchase decisions based on their green behavioral intentions not only helps the society, but also helps companies to gain a green competitive advantage. In this study, the relationships between green satisfaction, green trust, green equity and behavioral intentions are examined. Data were collected from Turkey, Finland and Pakistan with self-administered questionnaires regarding with green white goods. The hypotheses were tested with structural equation modeling. Results of a structural model reveal positive relationships green satisfaction, green trust and green brand equity across three countries. In addition, green brand equity plays a remarkable role in behavioral intentions towards green white goods in general. Managers should consider green trust, green satisfaction, and green brand equity while implementing green marketing strategies in a global marketplace. Introduction Customers are becoming more aware of environmental issues as the environmental pollution from industrial manufacturing is increasing and in result they are shifting their consumption pat- terns (Laroche et al., 2001, p. 503; D’Souza et al., 2006, p. 148; Chen, 2011, p. 384). This trend indicates that despite all the barriers relating to sustainable consumption (Young et al., 2010) green consumers who “adopts environmentally friendly behaviors and/or who purchases green products over the stand- ard alternatives” (Shamdasani et al., 1993, p. 288) are increas- ingly starting to use and willing to pay more for green products (Vermillion and Perat, 2010, p. 68; Laroche et al., 2001, p. 503). Compare to other products the business of green products has been steadily increasing in the consumer market round the globe rapidly (Chan, 2013). At the same time, various citizen groups, media, government and other stakeholders’ pressure caused firms to take into account the environmental issues while implementing their activities (Kang and Hur, 2012, p. 312). With regards to this phenomenon, in order to keep in step with the environmental movement (Chen and Chai, 2010, p. 28), businesses started to adopt green marketing strategies (D’Souza et al., 2006, p. 144). Green marketing includes the marketing processes and activities of developing, differentiat- ing, pricing and promoting environmentally friendly products or services (Chen and Chang, 2012, p. 503). Environmental threats are disturbing people in many ways that created challenges for governments, companies and customers substan- tially (Lee, 2009). Some researchers have pointed out that com- panies started to implement environmental marketing strategies to respond to environmental pressures, achieve competitive advantage, improve brand or corporate image, enhance product value (Chen 2010, p. 307), penetrate into new markets (McDo- nald and Oates, 2006, p. 157) and increase profitability (Chen, 2010, p. 316). Moreover, firms can benefit from their green products or services as they can reduce the perceived risk of their customers regarding environmental issues (Chen and Chang, 2012, p. 503) and consequently firms can build green brand trust and green brand equity, in result, consumers can become loyal to those products (Ahmad et al., 2010). Manufacturers of white goods have been using new technolo- gies to save energy and promoting their products emphasizing the sustainable consumption. These goods are the household electrical appliances in the home (e.g., refrigerator, dishwasher, dryer, washing machine, and air conditioners etc.). Within this context, they started to place an eco – label which indicates a product is not harmful to the environment during its produc- tion, usage and disposable stage (Gallastegui, 2002, p. 316; Iba- nez and Grolleau 2008, p. 235; Kang and Hur, 2012, p. 397). Necessities and demands of consumers are now shifting from consuming conventional products to environmental and eco- friendly products. Companies realized that supplying environ- mental products or services will satisfy customers who have 586 International Journal of Consumer Studies 39 (2015) 586–596 V C 2015 John Wiley & Sons Ltd International Journal of Consumer Studies ISSN 1470-6423
Transcript of Antecedents of green behavioral intentions: A cross-country study of Turkey, Finland and Pakistan

Antecedents of green behavioral intentions: a cross-countrystudy of Turkey, Finland and PakistanFaruk Anıl Konuk1, Saleem Ur Rahman2 and Jari Salo3
1Faculty of Business Administration, Department of Business Administration, Sakarya University, Sakarya, Turkey2Faculty of Business, Department of Marketing, University of Vaasa, Finland3Department of Marketing, Oulu Business School, Finland
Keywords
Green trust, green satisfaction, green brand
equity, behavioral intentions.
Correspondence
Faruk Anıl Konuk, Faculty of Business
Administration, Department of Business
Administration, Sakarya University, Esentepe
Campus, 54187 Serdivan, Sakarya, Turkey.
E-mail: [email protected]
doi: 10.1111/ijcs.12209
Abstract
Quality of life of the future generations depends on the efforts of current generations to
protect environment. The purchase decisions based on their green behavioral intentions
not only helps the society, but also helps companies to gain a green competitive
advantage. In this study, the relationships between green satisfaction, green trust, green
equity and behavioral intentions are examined. Data were collected from Turkey, Finland
and Pakistan with self-administered questionnaires regarding with green white goods.
The hypotheses were tested with structural equation modeling. Results of a structural
model reveal positive relationships green satisfaction, green trust and green brand equity
across three countries. In addition, green brand equity plays a remarkable role in
behavioral intentions towards green white goods in general. Managers should consider
green trust, green satisfaction, and green brand equity while implementing green
marketing strategies in a global marketplace.
Introduction
Customers are becoming more aware of environmental issues
as the environmental pollution from industrial manufacturing is
increasing and in result they are shifting their consumption pat-
terns (Laroche et al., 2001, p. 503; D’Souza et al., 2006, p.
148; Chen, 2011, p. 384). This trend indicates that despite all
the barriers relating to sustainable consumption (Young et al.,2010) green consumers who “adopts environmentally friendly
behaviors and/or who purchases green products over the stand-
ard alternatives” (Shamdasani et al., 1993, p. 288) are increas-
ingly starting to use and willing to pay more for green products
(Vermillion and Perat, 2010, p. 68; Laroche et al., 2001, p.
503). Compare to other products the business of green products
has been steadily increasing in the consumer market round the
globe rapidly (Chan, 2013). At the same time, various citizen
groups, media, government and other stakeholders’ pressure
caused firms to take into account the environmental issues
while implementing their activities (Kang and Hur, 2012, p.
312).
With regards to this phenomenon, in order to keep in step
with the environmental movement (Chen and Chai, 2010, p.
28), businesses started to adopt green marketing strategies
(D’Souza et al., 2006, p. 144). Green marketing includes the
marketing processes and activities of developing, differentiat-
ing, pricing and promoting environmentally friendly products
or services (Chen and Chang, 2012, p. 503). Environmental
threats are disturbing people in many ways that created
challenges for governments, companies and customers substan-
tially (Lee, 2009). Some researchers have pointed out that com-
panies started to implement environmental marketing strategies
to respond to environmental pressures, achieve competitive
advantage, improve brand or corporate image, enhance product
value (Chen 2010, p. 307), penetrate into new markets (McDo-
nald and Oates, 2006, p. 157) and increase profitability (Chen,
2010, p. 316). Moreover, firms can benefit from their green
products or services as they can reduce the perceived risk of
their customers regarding environmental issues (Chen and
Chang, 2012, p. 503) and consequently firms can build green
brand trust and green brand equity, in result, consumers can
become loyal to those products (Ahmad et al., 2010).
Manufacturers of white goods have been using new technolo-
gies to save energy and promoting their products emphasizing
the sustainable consumption. These goods are the household
electrical appliances in the home (e.g., refrigerator, dishwasher,
dryer, washing machine, and air conditioners etc.). Within this
context, they started to place an eco – label which indicates a
product is not harmful to the environment during its produc-
tion, usage and disposable stage (Gallastegui, 2002, p. 316; Iba-
nez and Grolleau 2008, p. 235; Kang and Hur, 2012, p. 397).
Necessities and demands of consumers are now shifting from
consuming conventional products to environmental and eco-
friendly products. Companies realized that supplying environ-
mental products or services will satisfy customers who have
586 International Journal of Consumer Studies 39 (2015) 586–596
VC 2015 John Wiley & Sons Ltd
International Journal of Consumer Studies ISSN 1470-6423
bs_bs_banner
concerns about environmental issues and as a result favorable
attitudes will be achieved regarding their products or services
(Kang and Hur, 2012, p. 307). Understanding customers’ per-
ceptions about green products can provide companies an oppor-
tunity regarding with green marketing investments. Therefore,
it is imperative for companies to integrate greening across the
marketing mix elements to get a positive marketing edge and
advantage.
Although past research have broadly focused on the concepts
of satisfaction (e.g., Oliver, 1981; Genesan, 1994; Homburg
et al., 2005), trust (e.g., Morgan and Hunt, 1994), brand equity
(e.g., Keller, 1993; Yoo and Donthu, 2001) and behavioral
intentions (e.g., Zeithaml et al., 1996), relatively limited empir-
ical evidence can be found with respect to these constructs in
the context of sustainable consumption (Chen, 2010; Kang and
Hur, 2012; Hur et al., 2013; Chen and Chang, 2012). More
importantly, most of these studies on behavioral intentions are
conceptualized as one dimensional construct including purchase
intentions, word-of-mouth intentions. In here, behavioral inten-
tions are measured with three subdimensions, namely green
purchase intentions, word-of-mouth intentions and willingness
to pay premium in order to gain detailed results. Despite the
remarkable contributions of previous studies, there remains a
lack of country comparison studies regarding with the relation-
ships of these constructs in the context of green consumption.
On the basis of these considerations, this study aims to fill this
gap by examining the relationships between green trust, green
satisfaction, green brand equity and behavioral intentions. The
results will not only shed light on the relationships between the
relevant constructs in the context of green consumption, but
also determine whether these relationships are consistent across
different countries such as Turkey, Finland and Pakistan, which
are cathegorized by the World Bank as upper middle, high and
lower middle income country respectively (The World Bank,
2014).
Additionally, this study incorporates factors that are not only
important for consumers to make their intentions of purchasing
products from an environmental perspective, but also that how
brand related factors influence their satisfaction level which
make them loyal and indirectly help companies to strengthen
their brands.
The structure of this article is as follows. In the first section,
literature about green satisfaction, green trust, green brand
equity and behavioral intentions are defined and based on liter-
ature review hypotheses are proposed. In the second section,
the research methodology is described in terms of the sample,
data collection, and measurements of the constructs. In the third
section, analyses and results of this study are presented based
on the measurement and structural model. The final section
presents implications, limitations and suggestions for further
research.
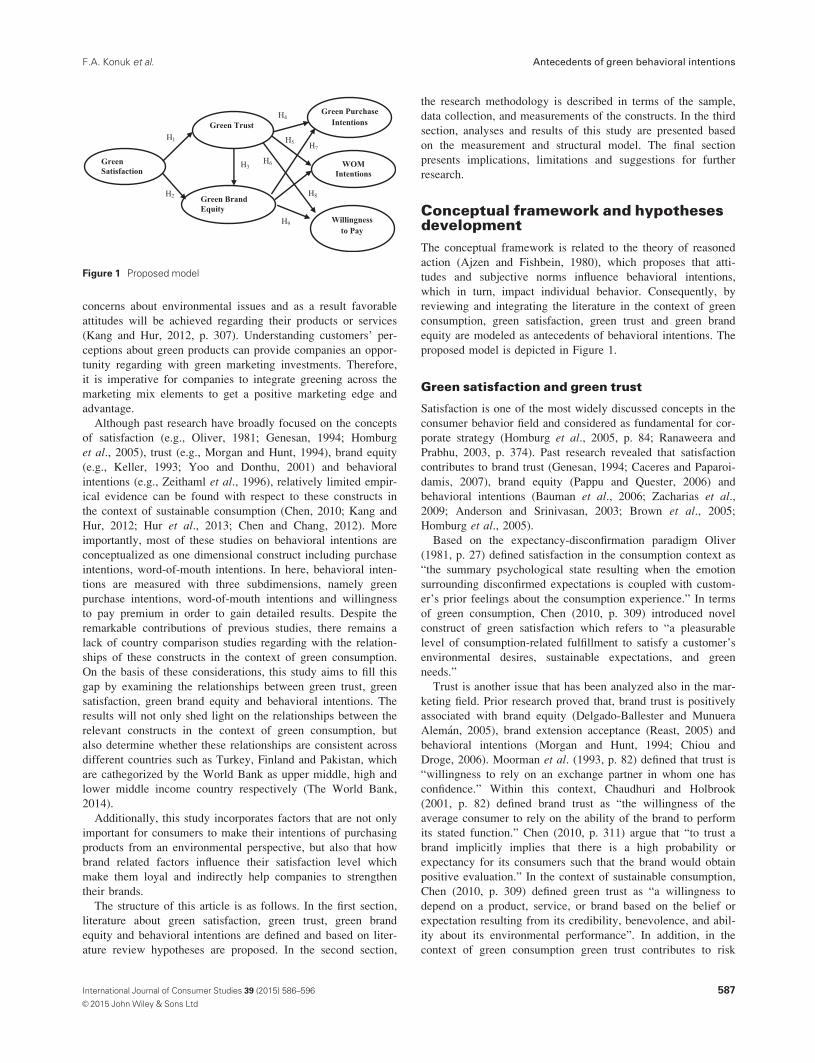
Conceptual framework and hypothesesdevelopment
The conceptual framework is related to the theory of reasoned
action (Ajzen and Fishbein, 1980), which proposes that atti-
tudes and subjective norms influence behavioral intentions,
which in turn, impact individual behavior. Consequently, by
reviewing and integrating the literature in the context of green
consumption, green satisfaction, green trust and green brand
equity are modeled as antecedents of behavioral intentions. The
proposed model is depicted in Figure 1.
Green satisfaction and green trust
Satisfaction is one of the most widely discussed concepts in the
consumer behavior field and considered as fundamental for cor-
porate strategy (Homburg et al., 2005, p. 84; Ranaweera and
Prabhu, 2003, p. 374). Past research revealed that satisfaction
contributes to brand trust (Genesan, 1994; Caceres and Paparoi-
damis, 2007), brand equity (Pappu and Quester, 2006) and
behavioral intentions (Bauman et al., 2006; Zacharias et al.,2009; Anderson and Srinivasan, 2003; Brown et al., 2005;
Homburg et al., 2005).
Based on the expectancy-disconfirmation paradigm Oliver
(1981, p. 27) defined satisfaction in the consumption context as
“the summary psychological state resulting when the emotion
surrounding disconfirmed expectations is coupled with custom-
er’s prior feelings about the consumption experience.” In terms
of green consumption, Chen (2010, p. 309) introduced novel
construct of green satisfaction which refers to “a pleasurable
level of consumption-related fulfillment to satisfy a customer’s
environmental desires, sustainable expectations, and green
needs.”
Trust is another issue that has been analyzed also in the mar-
keting field. Prior research proved that, brand trust is positively
associated with brand equity (Delgado-Ballester and Munuera
Alem�an, 2005), brand extension acceptance (Reast, 2005) and
behavioral intentions (Morgan and Hunt, 1994; Chiou and
Droge, 2006). Moorman et al. (1993, p. 82) defined that trust is
“willingness to rely on an exchange partner in whom one has
confidence.” Within this context, Chaudhuri and Holbrook
(2001, p. 82) defined brand trust as “the willingness of the
average consumer to rely on the ability of the brand to perform
its stated function.” Chen (2010, p. 311) argue that “to trust a
brand implicitly implies that there is a high probability or
expectancy for its consumers such that the brand would obtain
positive evaluation.” In the context of sustainable consumption,
Chen (2010, p. 309) defined green trust as “a willingness to
depend on a product, service, or brand based on the belief or
expectation resulting from its credibility, benevolence, and abil-
ity about its environmental performance”. In addition, in the
context of green consumption green trust contributes to risk
H1
H3H1
H2
H4
H5
H6
H7
H8
H9
Green Satisfaction
Green Trust
WOM Intentions
Willingness to Pay
Green Purchase Intentions
Green Brand Equity
Figure 1 Proposed model
F.A. Konuk et al. Antecedents of green behavioral intentions
587International Journal of Consumer Studies 39 (2015) 586–596
VC 2015 John Wiley & Sons Ltd

reduction and helps consumers to show positive green purchase
behavior (Rahbar and Wahid, 2011; Chen and Chang, 2013).
In green marketing literature, recent evidence suggested posi-
tive relationship between green satisfaction and green trust
(Kang and Hur, 2012; Chen and Chang, 2013). Using this
aforementioned literature, it is expected that increase in cus-
tomers’ green satisfaction towards white goods may enhance
green trust. Thus the following hypothesis is proposed:
H1: Green satisfaction is positively related to green trust.
Green satisfaction, green trust and green brandequity
Brands have been deemed as primary capital for many firms
(Kim et al. 2003, p. 335; Kim and Kim, 2005, p. 549). Brands
are critical for the success of the companies as they often pro-
vide opportunity to differentiate themselves in the mind of the
consumers (Wood, 2000, p. 38; Jung and Sung, 2008, p. 24;
Pappu et al., 2005, p. 143). For building and maintaining com-
petitive advantage (Kim and Kim, 2005, p. 549) the concept of
brand equity, which is a key strategic asset (Vogel et al., 2008,
p. 98) has gained considerable attention by academicians and
practitioners in the past decade. Brand equity refers to the
“incremental utility or value added to a product by its brand
name” (Yoo and Donthu 2001, p. 1). Brand equity has two
main perspectives namely financial perspective and customer-
based perspective (Keller, 1993). Financial brand equity aims
to estimate the value of a brand based on measures of financial,
accounting and store level scanner data including incremental
cash flows (Yoo and Donthu 2001, p. 1; Keller, 2003, p. 1;
Simon and Sullivan, 1993). Financial-based brand equity
ignores customers’ cognitive and behavioral aspects relating
with brands (Yoo and Donthu, 2001, p. 2).
From consumer or marketing perspective, brand equity is
referred as consumer-based brand equity (Pappu et al., 2005, p.
144). In one of the pioneering studies dealing with customer-
based brand equity Keller (1993, p. 8) defined this construct as
“the differential effect of brand knowledge on consumer
response to the marketing of the brand. In other words,
customer-based brand equity is defined as “consumers’ different
response between a focal brand and an unbranded product
when both have the same level of marketing stimuli and prod-
uct attributes” (Yoo and Donthu 2001, p. 1). Customer based
brand equity concerns “how product or service brands are per-
ceived by customers” (Kim et al., 2003, p. 336). Understanding
customer-based brand equity is vital for successful brand man-
agement (Wang et al., 2008, p. 263).
Positive customer-based brand equity can lead to increased
revenue, cost reduction, greater profits (Keller, 2003, p. 8),
incremental volume, revenue, price commanded and cash flow
(Ailawadi et al., 2003, p. 1). Past evidence revealed that
customer-based brand equity positively effects firms’ financial
performance (Kim and Kim, 2005; Kim and Kim 2004; Tolba
and Hassan 2009), satisfaction (Pappu and Quester, 2006), pur-
chase intentions (Wang et al., 2008), brand extensibility and
price flexibility (Wang et al., 2008).
Chen (2010, p. 310) conceptualized green brand equity as “a
set of brand assets and liabilities about green commitments and
environmental concerns linked to a brand, its name and symbol
that add to or subtract from the value provided by a product or
service.” Prior research has identified an empirical link between
green satisfaction and green brand equity (Chen, 2010). More-
over, it was also revealed that green trust is the precursor of
green brand equity (Chen, 2010). Hence, it is expected that the
more the green satisfaction, the higher level of green brand
equity relating with green product. Based on this discussion, it
is expected that green trust leads to green brand equity. There-
fore, the following hypotheses are proposed:
Hypothesis 2: Green satisfaction is positively related to green
brand equity.
Hypothesis 3: Green trust is positively related to green brand
equity.
Green trust, green brand equity and behavioralintentions
Behavioral intentions are conceptualized as three subdimen-
sions including, green purchase intentions, word-of-mouth
intentions and willingness to pay towards green products (Zei-
thaml et al., 1996). Following Oliver (1999, p. 34), green loy-
alty is defined as “a deeply held commitment to rebuy or
patronize a preferred environmental friendly product or service
consistently in the future.” Brand loyalty also prevents custom-
ers to switch to another brand. (et al., 2000, p. 197). In here,
purchase intention is used as an indicator of loyalty (Zeithaml
et al., 1996) which refers to “the likelihood that a consumer
would rebuy a particular product resulting from his or her envi-
ronmental needs” (Chen and Chang, 2002, p. 507).
Following (Netemeyer et al., 2004, p. 220) the willingness to
pay a premium for green products or services is defined as “the
amount a customer is willing to pay for his/her preferred green
product or brands over nongreen ones.” Referring to Harrison-
Walker (2001, p. 63) and Anderson & Gerbing (1988, p. 6)
green word-of-mouth intentions is defined as ‘customers will-
ingness to communicate about their preferred green products or
services with other persons informal, person-to-person commu-
nication between a perceived noncommercial communicator
and a receiver regarding a brand, a product, an organization or
a service.’
Vazquez et al. (2002) revealed positive relationship between
customer based brand equity and price premium and willing-
ness to recommend. In similar lines, Vogel et al. (2008)
revealed positive relationship between brand equity and recom-
mend intentions. Moreover, Kim and Kim (2004, p. 116)
pointed out that, gaining customers’ confidence will increase
loyalty and customers’ willingness to pay premium for the
brand. Furthermore, Mohanasundaram (2012) also argued that
consumers are willing to pay more to maintain a cleaner and
greener environment. Therefore, factors that influence consum-
ers’ purchase intention of environmental friendly products is
vital to encourage greener pattern of consumption (Devi et al.,2011).
In the context of green consumption, research has demon-
strated the role of green trust in developing behavioral inten-
tions including purchase intentions (Chen and Chang, 2013;
Kang and Hur, 2012) and word-of-mouth intentions (Kang and
Hur, 2012). Based on this, it is expected that increased green
trust towards white goods may cause to enhance green purchase
Antecedents of green behavioral intentions F.A. Konuk et al.
588 International Journal of Consumer Studies 39 (2015) 586–596
VC 2015 John Wiley & Sons Ltd
intentions, word-of-mouth intentions and willingness to pay
premium. Hence, the following hypotheses are suggested.
Hypothesis 4: Green trust is positively related to green pur-
chase intentions.
Hypothesis 5: Green trust is positively related to green word-
of-mouth intentions.
Hypothesis 6: Green trust is positively related to willingness
to pay.
Anselmsson & Persson (2007, p. 401) stated that ‘how cus-
tomers perceive brands and what motivate them to pay price
premium is an important theme in research on brand equity.’
Additionally, Yoo et al. (2000, p. 208) asserted that, ‘high
brand equity may allow a company to charge a higher price
because consumers are willing to pay premium prices.’ When
consumers are satisfied with prior familiarity of brand, they
repeat their purchases of those products, which in result influ-
ence their decision-making, which leads to them being brand
loyal (Rajagopal, 2007; Pickett-Baker and Ozaki, 2008). Keller
(1993) adopts loyalty in terms of repeat purchase based on
favorable beliefs and attitudes and views loyalty as a conse-
quence of customer-based brand equity. In line with this argu-
ment past research revealed positive relationships between
brand equity and loyalty including repurchase intentions (Cobb-
Walgren et al., 1995; Washburn and Plank, 2002; Taylor et al.2004; Tolba and Hassan, 2009; Vogel et al., 2008). Therefore,
it is expected that higher brand equity may lead to repurchase
intentions, word-of-mouth intentions and willingness to pay
premium toward green white goods. Thus, the following
hypotheses are suggested.
Hypothesis 7: Green brand equity is positively related to
green purchase intentions.
Hypothesis 8: Green brand equity is positively related to
green word-of-mouth intentions.
Hypothesis 9: Green brand equity is positively related to
green word-of-mouth intentions.
Methodology
Measurement instrument
To measure the relevant constructs, a cross-sectional survey
design was used in both three countries. The survey instrument
had two distinct parts. In the first part, items for measuring the
concepts of green satisfaction, green trust, green brand equity
and behavioral intentions were included. In the second part,
demographic questions were asked including gender, marital
status, education level and household income.
Originally the questionnaire was developed in English lan-
guage. However, for better understandings of the respondents
in these three countries, it was then translated into Turkish,
Urdu and Finnish languages, and then translated back to
English.
Scale items were adapted from prior studies validated scales.
Green satisfaction, green trust and green brand equity scales
were measured with four items respectively, and were adapted
from (Chen, 2010). Behavioral intentions were measured with
three subdimensions, including purchase intentions, word-of-
mouth intentions and willingness to pay premium with three
items. For example, purchase intentions were adapted from
Netemeyer et al. (2004), Chen and Chang (2012) and Lee et al.(2010) while word-of-mouth intentions are from Zeithaml et al.(1996) and Lee et al., (2010) and willingness to pay a premium
is from Lee et al. (2010) and Netemeyer et al. (2004).
To evaluate the face validity of the scales, three professio-
nals and four academicians were consulted (Edward et al.,2012). Then, prior to the main field study, a pretest was carried
out with 15 respondents. Based on the feedback from the
respondents few scale items were slightly reworded to increase
their understanding. All scale items were measured by 5-point
Likert-type scales and were anchored with ‘strongly disagree to
“strongly agree.’ In addition, before distributing questionnaires
to the respondents, the aim of the research was explained and a
prescreening question was asked, that whether they have pur-
chased and use green white goods. All the scale items for
measuring relevant constructs are depicted in Table 1.
Data collection and sample in Turkey
In order to test the proposed hypotheses a field study was con-
ducted based on self-administrated questionnaires in Sakarya
city. Due to the objective of this study green, white good users
are included in the sample. After this phase, by using a conven-
ience sampling technique, 500 customers who use green, white
goods were requested to return the completed questionnaires
within a frame of a week during May 2013. Out of 500 con-
sumers, 372 of them have completed and returned the question-
naires which yielded a response rate of 74%. After checking
the returned questionnaires, 58 questionnaires were not taken
into consideration due to their missing values. As a result, 314
completed questionnaires were analyzed.
The demographic characteristics of the sample in Turkey are
as follows. Approximately 58.2% of the 314 respondents were
female. In general, 53.1% were married; 30.6% were between
the ages of 19 and 25, 36.3% were between the ages of 26 and
35, 10.8% were between the ages of 36 and 40; 38.5% had
obtained at least a bachelor’s degree. With regard to income,
57.3% of the respondents had a monthly household income
between 550 and 1650 $and 19.1% between 1651 and 2750 $.
Data collection and sample in Finland
Two methods of data distribution were adopted, an online ques-
tionnaire, and printed field questionnaire. Using convenient
sampling technique total 500 questionnaires (250 numbers of
email and 250 numbers of printed) were distributed among the
users of green, white goods in two big cities of Finland in Hel-
sinki and Oulu, and one small city Vaasa, over a three month
period (September–November 2013). Out of the total question-
naires due to missing information and inadequate responses,
255 (50.5%) questionnaires were usable and selected for further
testing, analysis and interpretation.
Demographic results of the study show that respondents were
52.5% male, 42.4% were single and 57.6% were married. In
terms of age distribution, 31.8% were between 19 and 25 years,
40.4% were between 26 and 35 years, 16.1% were between 36
and 45 years. According to education distribution of the
respondents, 30.6% were graduates. In terms of income level
distribution, in total 19.2% respondents indicated that they have
income level $385 to $770, 22.4% have income level $771 to
F.A. Konuk et al. Antecedents of green behavioral intentions
589International Journal of Consumer Studies 39 (2015) 586–596
VC 2015 John Wiley & Sons Ltd

$2300, 17.6% have income level $2301 to $3850, 14.1% have
income level $3851 to $5400, 13.3% have income level $7001
to $9000.
Data collection and sample in Pakistan
To extract the opinions of Pakistani respondents, first we edu-
cated respondents about green goods in general and then specif-
ically about the usefulness of using green white goods. After
in-depth evaluation of their knowledge of those products, the
study questionnaire was circulated during the three month
period (i.e. June, July and August 2013) among 500 respond-
ents using the convenience sampling technique. Two methods,
an e-mail and field researcher, were used to distribute and col-
lect the data in the capital city Islamabad, and a big city
Lahore. Out of the total only 200 respondents, that comprises
40% of the survey, have completed the questionnaires which
were further analyzed.
Table 1 Scale items, factor loadings and measurement model fit indexes
Turkey Finland Pakistan Overall sample
Constructs
Green Satisfaction
S1. Overall, I am satisfied with this brand because of its environmental concern. 0.78 0.77 0.80 0.76
S2. I am happy about the decision to choose this brand because of its environmental
commitments.
0.88 0.78 0.49 0.80
S3. I believe that it is the right thing to purchase this brand because of its environmental
performance.
0.92 0.77 0.59 0.83
S4. Overall, I am glad to buy this brand because of it is environmental friendly. 0.76 0.85 0.78 0.81
Green Trust
T1. I feel that this brand’s environmental commitments are generally reliable. 0.85 0.71 0.71 0.78
T2: I feel that this brand’s environmental performance is generally dependable. 0.88 0.68 0.74 0.79
T3: I feel that this brand’s environmental argument is generally trustworthy. 0.84 0.81 0.74 0.82
T4. This brand keeps promises and commitments for environmental protection. 0.73 0.71 0.69 0.74
Green Brand Equity
BE1. It makes sense to buy this brand instead of other brands because of its environ-
mental commitments, even they are the same.
0.80 0.75 0.75 0.69
BE2. Even if another brand has the same environmental features as this brand, I would
prefer to buy this brand.
0.91 0.76 0.61 0.82
BE3. If there is another brand’s environmental performance as good as this brand’s I
would prefer to buy this brand.
0.92 0.83 0.59 0.85
BE4. If the environmental concern of another brand is not different from that of this
brand in any way, it seems smarter to purchase this brand.
0.88 0.69 0.58 0.79
Green Purchase Intention
PI1: I am willing to buy this white goods from this brand in the future because of its
environmental performance
0.90 0.90 0.79 0.88
PI2: I plan to purchase white goods from this brand because of its environmental
concern.
0.88 0.88 0.80 0.87
PI3. I will make effort to buy this white goods brand because of it is environmentally
friendly.
0.94 0.88 0.78 0.90
WOM Intentions
WOM1. I encourage my friends and relatives to buy this brand. 0.86 0.78 0.77 0.85
WOM2. If someone is looking for white goods I generally advise him/her to buy this
brand.
0.92 0.86 0.68 0.86
WOM3. I say positive things about this green brand. 0.90 0.78 0.73 0.81
Willingness to Pay Premium
WTP1. I am willing to spend extra in order to buy this environmental friendly white
goods brand.
0.86 0.83 0.78 0.85
WTP2. It is acceptable to pay premium to buy this white goods brand because of its
environmental performance.
0.93 0.90 0.72 0.86
WTP3. I am willing to pay more to buy this green brand because of its environmental
functions.
0.90 0.87 0.87 0.89
Measurement Model Fit _Indexes
Turkey: v2/df: 489.8/174 5 2.81 CFI 5 0.95 IFI 5 0.95 RMSEA 5 0.08
Finland: v2/df: 529.8/168 5 3.15 CFI 5 0.90 IFI 5 0.90 RMSEA 5 0.09
Pakistan: v2/df: 343.7/173 5 1.98 CFI 5 0.92 IFI:0.92 RMSEA 5 0.07
Overall: v2/df: 662.3/174 5 3.81 CFI 5 0.96 IFI 5 0.96 RMSEA 5 0.06
Notes: df, degrees of freedom; CFI: Comparative Fit Index; IFI: Incremental Fit Index; RMSEA: Root Mean Square Error of Approximation
Antecedents of green behavioral intentions F.A. Konuk et al.
590 International Journal of Consumer Studies 39 (2015) 586–596
VC 2015 John Wiley & Sons Ltd

According to demographic characteristics of Pakistani sample
about 58.5% were male. Overall, 56% were married, 19.5%
were between the ages 19 and 25, 44.5% were between the
ages 26 and 35, 14.5% were between the ages of 36 to 45.
According to education, 44% were graduates. Income level of
respondents varies, for example, 13.5% have income level $150
to $250, 27% have income level $251 to $350, 10% have
income level $351 to $390, and the majority of respondents,
39% have income level $391 and above.
Analysis and results
Measurement model
Data were analyzed with two-step approach suggested by
Anderson and Gerbing (1988). First, 21-item, 6-factor, covari-
ance structure measurement model with confirmatory factor
analysis, measurement model’s construct validity, and reliabil-
ity was evaluated by confirmatory factor analysis, and then
hypotheses were tested with structural equations modeling.
Goodness of fit indexes were evaluated to assess the measure-
ment model’s adjustments to the obtained data. Confirmatory
factor analysis results for overall fit for both three samples
(Turkey, Finland and Pakistan and overall sample) are pre-
sented in Table 1.
The confirmatory model’s fit indices were acceptable
(Arbuckle, 2006). For evaluating construct validity convergent
and discriminant validity of relevant constructs was analyzed.
To assess convergent validity standardized regression coeffi-
cients were evaluated for each of the relevant constructs. The
standardized regression coefficients for all constructs item val-
ues were all significant and most of them were above the sug-
gested level of 0.50 for both three samples providing evidence
of convergent validity (Edward et al., 2012, p. 160). In Table
2, the average variance extracted for the constructs regarding
with three samples is given. For Turkey, Finland and overall
sample, all of the constructs’ average variance extracted (AVE)
values are above the suggested level of 0.50 (Fornell and
Larcker, 1981). Support for convergent validity is also demon-
strated by the suggested AVE for all five constructs regarding
to these samples. Conversely, AVE values of Pakistan sample
two constructs namely green satisfaction and green trust were
slightly below 0.50. Due to significant standardized coefficients
for these two constructs we evaluate that these two constructs
have sufficient convergent validity.
To achieve discriminant validity, construct correlations
should be below 0.85 (Kline, 1998, p. 60). Correlations
between constructs for Turkey, Finland, Pakistan and overall
sample are presented in Tables (3–6) respectively. As a result
discriminant validity of the measurement model was proved.
For evaluating the reliability, Cronbach a and composite reli-
ability (CR) statistics were used regarding with three country
samples and overall sample (Fornell and Larckel, 1981). Reli-
ability values for each scale are depicted in Table 2. The values
for each of the constructs for three samples are above the sug-
gested level of 0.70 (Hair et al., 1998 p. 612), demonstrating
that all constructs are reliable.
Structural model
After evaluating the measurement model in terms fit indices,
validity and reliability, the proposed hypotheses were tested
with structural equations modeling using maximum-likelihood
estimation. The results of the structural model for the sample
in Turkey are presented in Figure 2. Fit statistics of this model
are acceptable (v2/df: 555.3/180 5 3.1, CFI 5 0.94, IFI 5 0.94,
Table 2 Average Variance Extracted, Composite Reliability and Cronbach a
CountriesTurkey Finland Pakistan Overall Sample
Constructs AVE CR a AVE CR a AVE CR a AVE CR a
Green Satisfaction 0.70 0.90 0.90 0.63 0.87 0.87 0.46 0.77 0.77 0.64 0.94 0.87
Green Trust 0.68 0.90 0.89 0.53 0.82 0.77 0.52 0.81 0.81 0.61 0.86 0.86
Green Brand Equity 0.77 0.93 0.93 0.58 0.77 0.82 0.41 0.73 0.78 0.87 0.62 0.86
Green Purchase Intention 0.82 0.93 0.93 0.78 0.91 0.91 0.62 0.90 0.83 0.91 0.78 0.91
WOM Intentions 0.80 0.92 0.92 0.65 0.85 0.81 0.53 0.77 0.80 0.71 0.88 0.88
Willingness to Pay Premium 0.80 0.92 0,92 0.77 0.90 0.89 0.63 0.84 0.83 0.75 0.89 0.90
Notes:CR: Composite Reliability, AVE: Average Variance Extracted, a: Cronbach a CR: (P
standardized loadings)2/(P
standardized loadings)21(P
indicator measurement error), AVE: (P
squared standardized loadings)/(P
squared standardized loadings)1(P
indicator measurement error).
Table 3 Construct intercorrelations (Turkey)
(1) (2) (3) (4) (5) (6)
1. Green satisfaction 1.00
2. Green trust 0.78 1.00
3. Green brand equity 0.72 0.68 1.00
4. Purchase intentions 0.79 0.72 0.79 1.00
5. WOM intentions 0.75 0.78 0.73 0.82 1.00
6. Willingness to pay 0.36 0.36 0.42 0.40 0.43 1.00
Table 4 Construct intercorrelations (Pakistan)
(1) (2) (3) (4) (5) (6)
1. Green satisfaction 1.00
2. Green trust 0.78 1.00
3. Green brand equity 0.77 0.83 1.00
4. Purchase intentions 0.68 0.82 0.76 1.00
5. WOM intentions 0.63 0.77 0.82 0.74 1.00
6. Willingness to pay 0.42 0.48 0.55 0.51 0.48 1.00
F.A. Konuk et al. Antecedents of green behavioral intentions
591International Journal of Consumer Studies 39 (2015) 586–596
VC 2015 John Wiley & Sons Ltd
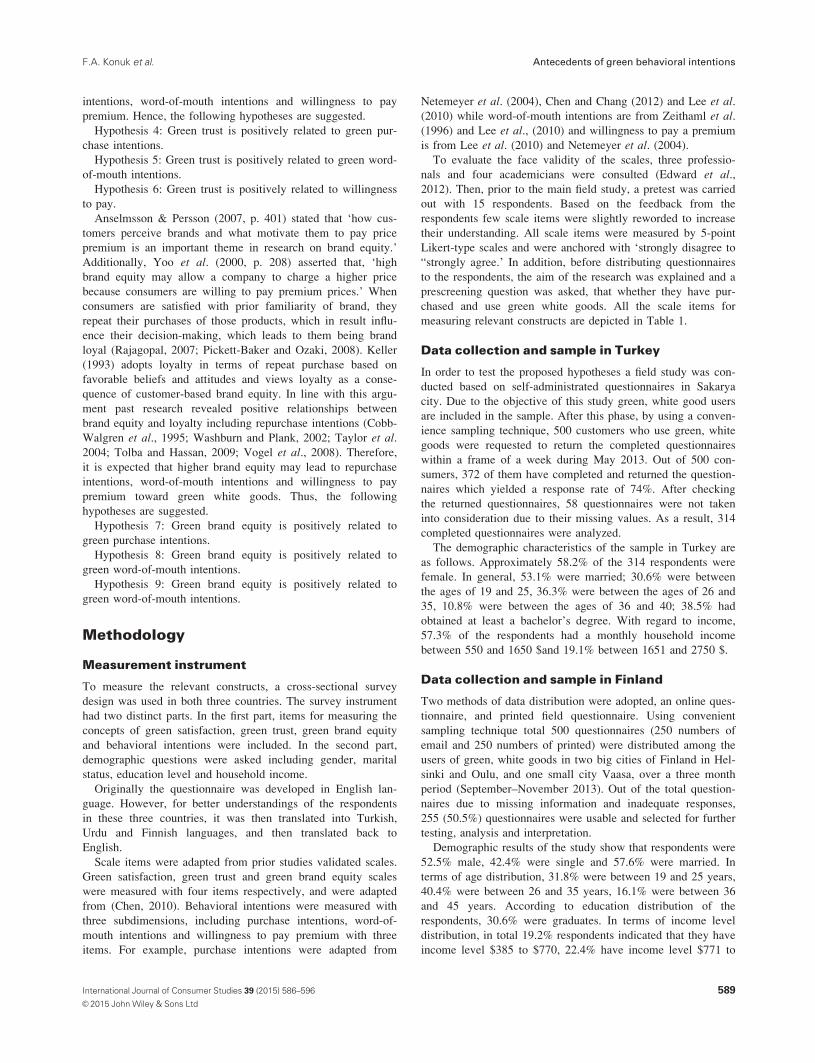
RMSEA 5 0.08). According to the squared multiple correla-
tions, the model explained 65% of the variance in green trust,
56% in green brand equity, 73% purchase intentions, 72% in
word-of-mouth intentions and 20% in willingness to pay pre-
mium. The results of the structural model for the sample in
Turkey are presented in Figure 2.
According to Figure 2, green satisfaction has a positive
effect on both green trust and green brand equity supporting
hypothesis 1 (c 5 0.81, P< 0.001) and hypothesis 2 (c 5 0.54,
P< 0.001). Consistent with hypothesis 3, green trust positively
affects green brand equity (b 5 0. 25, P< 0.001). In addition,
the results of the structural model revealed that green trust pos-
itively related to both purchase intentions (b 5 0.40,
P< 0.001), word-of-mouth intentions (b 5 0.55, P< 0.05) and
willingness to pay premium (b 5 0.16, P< 0.05) providing sup-
port to hypothesis 4, hypothesis 5 and hypothesis 6 respec-
tively. The results of the structural model also revealed that,
green brand equity positively affects both purchase intentions
(b 5 0.53, P< 0.001), word-of-mouth intentions (b 5 0.37,
P< 0.001) and willingness to pay premium (b 5 0.31,
P< 0.001). Thus, hypothesis 7, 8 and 9 were all accepted.
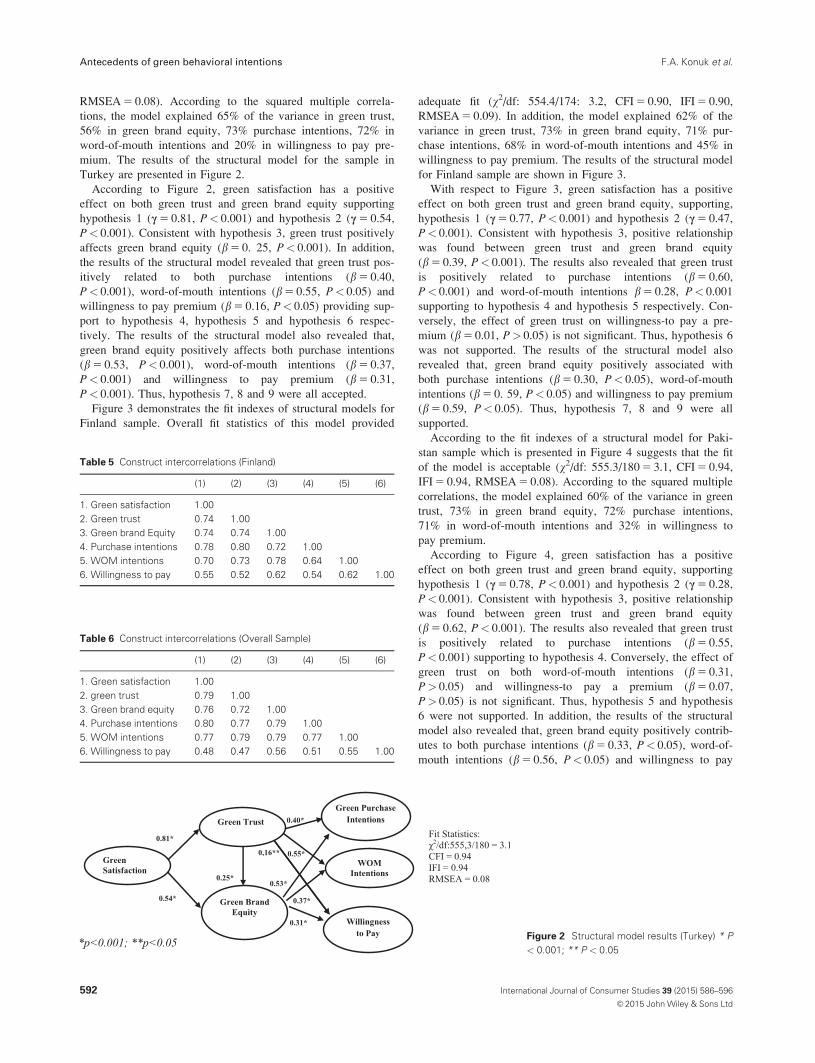
Figure 3 demonstrates the fit indexes of structural models for
Finland sample. Overall fit statistics of this model provided
adequate fit (v2/df: 554.4/174: 3.2, CFI 5 0.90, IFI 5 0.90,
RMSEA 5 0.09). In addition, the model explained 62% of the
variance in green trust, 73% in green brand equity, 71% pur-
chase intentions, 68% in word-of-mouth intentions and 45% in
willingness to pay premium. The results of the structural model
for Finland sample are shown in Figure 3.
With respect to Figure 3, green satisfaction has a positive
effect on both green trust and green brand equity, supporting,
hypothesis 1 (c 5 0.77, P< 0.001) and hypothesis 2 (c 5 0.47,
P< 0.001). Consistent with hypothesis 3, positive relationship
was found between green trust and green brand equity
(b 5 0.39, P< 0.001). The results also revealed that green trust
is positively related to purchase intentions (b 5 0.60,
P< 0.001) and word-of-mouth intentions b 5 0.28, P< 0.001
supporting to hypothesis 4 and hypothesis 5 respectively. Con-
versely, the effect of green trust on willingness-to pay a pre-
mium (b 5 0.01, P> 0.05) is not significant. Thus, hypothesis 6
was not supported. The results of the structural model also
revealed that, green brand equity positively associated with
both purchase intentions (b 5 0.30, P< 0.05), word-of-mouth
intentions (b 5 0. 59, P< 0.05) and willingness to pay premium
(b 5 0.59, P< 0.05). Thus, hypothesis 7, 8 and 9 were all
supported.
According to the fit indexes of a structural model for Paki-
stan sample which is presented in Figure 4 suggests that the fit
of the model is acceptable (v2/df: 555.3/180 5 3.1, CFI 5 0.94,
IFI 5 0.94, RMSEA 5 0.08). According to the squared multiple
correlations, the model explained 60% of the variance in green
trust, 73% in green brand equity, 72% purchase intentions,
71% in word-of-mouth intentions and 32% in willingness to
pay premium.
According to Figure 4, green satisfaction has a positive
effect on both green trust and green brand equity, supporting
hypothesis 1 (c 5 0.78, P< 0.001) and hypothesis 2 (c 5 0.28,
P< 0.001). Consistent with hypothesis 3, positive relationship
was found between green trust and green brand equity
(b 5 0.62, P< 0.001). The results also revealed that green trust
is positively related to purchase intentions (b 5 0.55,
P< 0.001) supporting to hypothesis 4. Conversely, the effect of
green trust on both word-of-mouth intentions (b 5 0.31,
P> 0.05) and willingness-to pay a premium (b 5 0.07,
P> 0.05) is not significant. Thus, hypothesis 5 and hypothesis
6 were not supported. In addition, the results of the structural
model also revealed that, green brand equity positively contrib-
utes to both purchase intentions (b 5 0.33, P< 0.05), word-of-
mouth intentions (b 5 0.56, P< 0.05) and willingness to pay
Table 5 Construct intercorrelations (Finland)
(1) (2) (3) (4) (5) (6)
1. Green satisfaction 1.00
2. Green trust 0.74 1.00
3. Green brand Equity 0.74 0.74 1.00
4. Purchase intentions 0.78 0.80 0.72 1.00
5. WOM intentions 0.70 0.73 0.78 0.64 1.00
6. Willingness to pay 0.55 0.52 0.62 0.54 0.62 1.00
Table 6 Construct intercorrelations (Overall Sample)
(1) (2) (3) (4) (5) (6)
1. Green satisfaction 1.00
2. green trust 0.79 1.00
3. Green brand equity 0.76 0.72 1.00
4. Purchase intentions 0.80 0.77 0.79 1.00
5. WOM intentions 0.77 0.79 0.79 0.77 1.00
6. Willingness to pay 0.48 0.47 0.56 0.51 0.55 1.00
Figure 2 Structural model results (Turkey) * P
< 0.001; ** P < 0.05
Antecedents of green behavioral intentions F.A. Konuk et al.
592 International Journal of Consumer Studies 39 (2015) 586–596
VC 2015 John Wiley & Sons Ltd
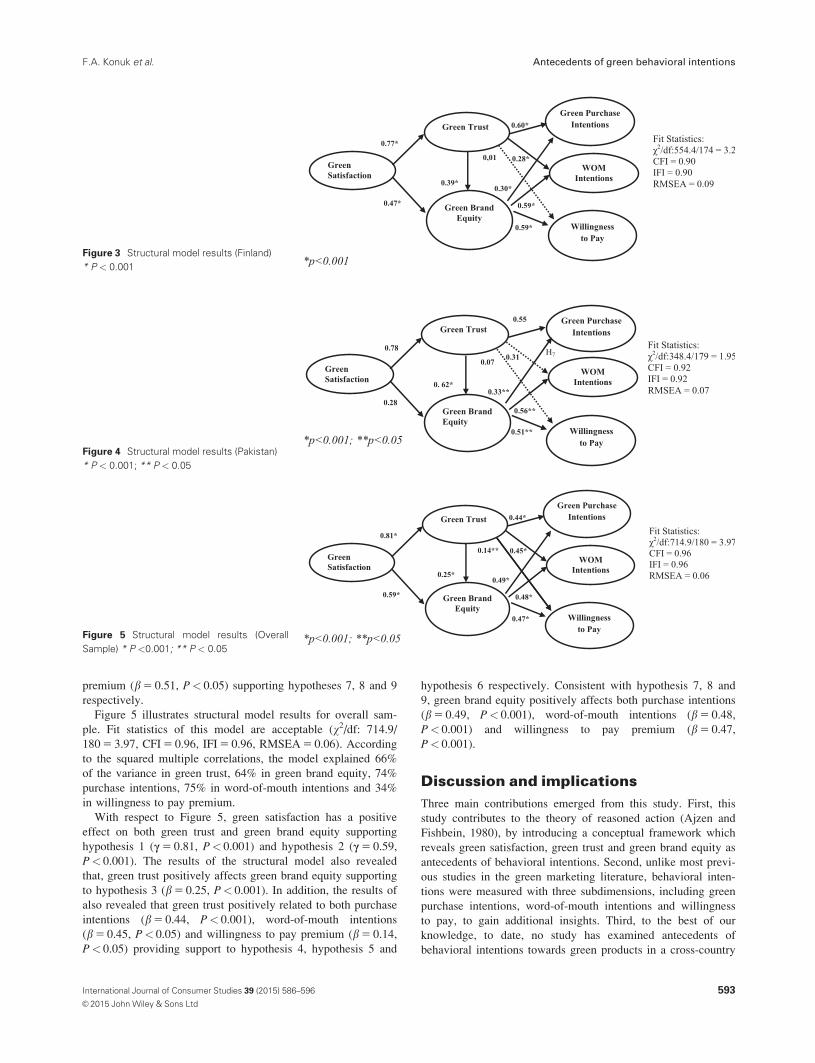
premium (b 5 0.51, P< 0.05) supporting hypotheses 7, 8 and 9
respectively.
Figure 5 illustrates structural model results for overall sam-
ple. Fit statistics of this model are acceptable (v2/df: 714.9/
180 5 3.97, CFI 5 0.96, IFI 5 0.96, RMSEA 5 0.06). According
to the squared multiple correlations, the model explained 66%
of the variance in green trust, 64% in green brand equity, 74%
purchase intentions, 75% in word-of-mouth intentions and 34%
in willingness to pay premium.
With respect to Figure 5, green satisfaction has a positive
effect on both green trust and green brand equity supporting
hypothesis 1 (c 5 0.81, P< 0.001) and hypothesis 2 (c 5 0.59,
P< 0.001). The results of the structural model also revealed
that, green trust positively affects green brand equity supporting
to hypothesis 3 (b 5 0.25, P< 0.001). In addition, the results of
also revealed that green trust positively related to both purchase
intentions (b 5 0.44, P< 0.001), word-of-mouth intentions
(b 5 0.45, P< 0.05) and willingness to pay premium (b 5 0.14,
P< 0.05) providing support to hypothesis 4, hypothesis 5 and
hypothesis 6 respectively. Consistent with hypothesis 7, 8 and
9, green brand equity positively affects both purchase intentions
(b 5 0.49, P< 0.001), word-of-mouth intentions (b 5 0.48,
P< 0.001) and willingness to pay premium (b 5 0.47,
P< 0.001).
Discussion and implications
Three main contributions emerged from this study. First, this
study contributes to the theory of reasoned action (Ajzen and
Fishbein, 1980), by introducing a conceptual framework which
reveals green satisfaction, green trust and green brand equity as
antecedents of behavioral intentions. Second, unlike most previ-
ous studies in the green marketing literature, behavioral inten-
tions were measured with three subdimensions, including green
purchase intentions, word-of-mouth intentions and willingness
to pay, to gain additional insights. Third, to the best of our
knowledge, to date, no study has examined antecedents of
behavioral intentions towards green products in a cross-country
Figure 3 Structural model results (Finland)
* P < 0.001
Figure 4 Structural model results (Pakistan)
* P < 0.001; ** P < 0.05
Figure 5 Structural model results (Overall
Sample) * P <0.001; ** P < 0.05
F.A. Konuk et al. Antecedents of green behavioral intentions
593International Journal of Consumer Studies 39 (2015) 586–596
VC 2015 John Wiley & Sons Ltd

context. Therefore, this study contributes to the green market-
ing literature by revealing similarities and differences between
Turkey, Finland and Pakistan.
The empirical results from three countries revealed a positive
relationship between green satisfaction and green trust support-
ing Kang and Hur (2012) and Chen and Chang (2012). In addi-
tion, the findings also revealed that green trust contributes to
green brand equity, which is consistent with Chen (2010). This
implies that past experience with green products may determine
brand trust and brand equity accordingly. It was also found that
the effects of green brand equity on behavioral intentions were
consistent for three countries.
Conversely, this study finds out and demonstrates a different
role of of green trust in behavioral intentions of consumers
across the selected countries. The empirical results reveal that
for Turkey sample, purchase, word-of-mouth intentions and
willingness to pay are influenced by green trust regarding with
green white goods. It means that with green brand equity, green
trust also plays an important role in enhancing behavioral inten-
tions towards green white goods. Results of Finland are rela-
tively different with respect to consumers’ willingness to pay
premium; however, their green purchase and word-of-mouth
intentions are positively affected by green brand equity and
their green trust. It shows that Finnish consumers do not com-
promise to pay more for green white goods. This implies that
green trust would not be sufficient for consumers willingness to
pay for green white goods. In other words, consumers in Fin-
land emphasize importance in green brand equity regarding
with willingness to pay for green white goods. In this context,
consumers may evaluate different competing brands and make
decision for giving higher prices if the brand provide high
brand equity.
Conversely, the behavioral intentions of consumers in Paki-
stan are different than both consumer in Turkey and Finland.
For example, data results figured out that, Pakistani consumers’
intention to purchase is effectively influenced by green trust
and green brand equity, but their word of mouth intentions and
willingness to pay more are not significantly influenced by
green trust. It means that for consumers in Pakistan, only green
trust would not be sufficient for consumers to communicate
about green white goods and willingness to pay more for these
products.
Considering overall sample, findings imply that green satis-
faction, green trust and green brand equity are all antecedents
of behavioral intentions regarding with green white goods.
Results of this study have direct implications for green white
goods manufacturers in these three countries. For example,
understanding the green purchase intentions, word of mouth
intentions, and willingness to pay intentions of consumers,
companies should focus on green satisfaction in order to foster
green brand trust in supporting of green brand equity. For
example, if customers expected performance (e.g., energy-
saving, environmental friendliness, durability) of the green
product not occurs they will probably switch another product
or the brand. Thus, company claims about green products
should be reasonable and real. In other words, green marketing
arguments should be communicated to customers in a coherent
and truthful way, to avoid customer skepticism or disbelief. In
addition, generating the well-being of society communicating
by the products of a company can be helpful in creating more
receptive societal response.
Some consumers may evaluate green products as less quality
among nongreen ones. Therefore, companies should provide
proofs about their green products that have the same quality
specifications of the nongreen ones and green products prices
should be reasonable in order them to be purchased more fre-
quently comparing with nongreen products. Companies should
also pay attention of the green product quality. In the product
development process, products’ ability to solve customers’ fun-
damental problems should not be ignored. Consequently this
may lead to increase in green satisfaction and green trust.
Commitment-trust theory (Morgan and Hunt, 1994) empha-
sizes that relationship commitment and trust is fundamental for
successful relationship marketing. Hence, investments on rela-
tionship marketing with monitoring satisfaction levels and man-
aging customer loyalty programs would help to enhance
consumers satisfaction levels and consequently increase green
trust and green brand equity. The findings also imply that to
sell their green products charging with higher prices and devel-
oping positive word-of-mouth intentions in the global market-
place, companies should primarily focus on building green
brand equity. The greater the ability of the company to project
and position its message about its concern for the environment
in the minds of consumers using advertisement, the greater will
be its success and corporate reputation. This may lead to
enhance green brand equity. Companies with high green brand
equity may benefit brand extensions with the increase in sale
profits and market shares (Keller, 2001, p. 15). In other words,
green consumers are more likely to purchase new green prod-
ucts of the high green brand equity brands. As a result, manu-
facturing environmental friendly products has become
opportunity for businesses in order to achieve competitive
advantage.
Compared to traditional goods, green white goods manufac-
turing and marketing increase costs. Consumers may not under-
stand how companies incur costs to manufacture green white
goods. To motivate consumers to pay premium, companies
should create consumers’ awarenss about the long term finan-
cial and environmental benefits of using green white goods.
In conclusion, if companies target to increase their profits
and market shares, they should consider green satisfaction,
green trust and green brand equity in implementing long-term
green marketing strategies.
Limitations and recommendations forfuture research
Despite theoretical and managerial contributions there are some
limitations in this study. First, to obtain data convenience sam-
pling was used. To remedy this effect probability sampling
methods can be used to collect data for more generable results.
Second, only three countries (Turkey, Finland and Pakistan)
were chosen for the field study. Thus, the results of this study
represent only the sample from these countries. To know green
behavioral intentions more in depth, more than three both
developed and developing countries should be studied in the
future studies. Third, White goods were chosen for the object
of this study. Further studies developed could benefit other
Antecedents of green behavioral intentions F.A. Konuk et al.
594 International Journal of Consumer Studies 39 (2015) 586–596
VC 2015 John Wiley & Sons Ltd

green product categories or services. Fourth, in this study, the
hypotheses were tested with cross-sectional survey data. Hence,
this study cannot determine the dynamic change of green satis-
faction, green trust, green brand equity, green purchase inten-
tions, word of mouth intentions, and willingness to pay in the
different stages through longitudinal data. Therefore, setting a
longitudinal study to test the data can give better results in
future studies on green white goods.
It is not enough to simply investigate the relationship
between most important determinants of green behavioral inten-
tions of consumers. The ever changing societal needs and wants
has changed consumers’ attitude and habits. Therefore, consid-
ering climate responsibility research from the direction of psy-
chological and social perspectives can elevate consumers’
intentions to behave proactively in purchasing and pay more
for climate friendly products.
The role of green brand equity in willingness to pay more for
green, white goods of customers in three countries has been
noticed in our research, which can bring a logical reasoning for
researchers to work on it in future. Equally important, in future
green brand quality variable must be incorporated in current
model between green trust, green brand equity and willingness to
pay, word of mouth, and green purchase intention relationships.
Acknowledgment
The co-authors are grateful to the Finnish Foundation for Eco-
nomics and Technology Sciences (KAUTE) for their financial
support for research in Finland and Pakistan.
REFERENCES
Ahmad, H., Shah, I.A., & Ahmad, K. (2010) Factors in Environmental
Advertising Influencing Consumer’s Purchase Intention. European
Journal of Scientific Research, 48, 217–226.
Ailawadi, K.L., Lehmann, D.R. & Neslin, S.A. (2003) Revenue premium
as an outcome measure of brand equity. Journal of Marketing, 67, 1–
17.
Ajzen, I. & Fishbein, M. (1980) Understanding Attitudes and Predicting
Social Behavior. Prentice-Hall, Englewood Cliffs, NJ.
Anderson, J.C. & Gerbing, D. (1988) Structural equation modeling in
practice: a review and recommended two-step approach. Psychologi-
cal Bulletin, 103, 411–423.
Anderson, R.E. & Srinivasan, S.S. (2003) E-satisfaction and e-loyalty: a
contingency framework. Psychology and Marketing, 20, 123–138.
Anselmsson, J.U. & Persson N. (2007) Understanding price premiums for
grocery products: a conceptual model of consumer-based brand equity.
Journal of Product and Brand Management, 16, 401–414.
Arbuckle, J.L. (2006) Amos 7.0 User’s Guide, Amos Development Corpo-
ration. Spring House, PA.
Baumann, C., Burton, S., Eliott, G. & Kehr, H.M. (2006) Prediction of
attitude and behavioral intentions in retail banking. International Jour-
nal of Bank Marketing, 25, 102–116.
Brown, T., Barry, T.E., Dacin, P.A. & Gunst, R.F. (2005) Spreading the
word: investigating antecedents of consumers’ positive word-of-mouth
intentions and behaviors in a retailing context. Journal of the Academyof Marketing Science, 33, 123–138.
Caceres, R.C. & Paparoidamis, N.G. (2007) Service quality, relationship
satisfaction, trust, commitment and business-to-business loyalty.
European Journal of Marketing, 41, 836–867.
Chaudhuri, A. & Holbrook, M.B. (2001) The chain of effects from brand
trust and brand affect to brand performance: the role of brand loyalty.
Journal of Marketing, 65, 81–93.
Chen, T.B. & Chai, L.T. (2010) Attitude towards environment and green
products: consumer perspective. Management Science and Engineer-
ing, 4, 27–39.
Chen, Y.-S. (2010) The drivers of green brand equity: green brand image,
green satisfaction, and green trust. Journal of Business Ethics, 93,
307–319.
Chen, Y.-S. (2011) Green organizational identity: sources and conse-
quence. Management Decision, 49, 384–404.
Chen, Y.-S. & Chang, C.-H. (2012) Enhance green purchase intentions:
the roles of green perceived value, green perceived risk, and green
trust. Management Decision, 50, 502–520.
Chen, Y.-S. & Chang, C.-H. (2013) Towards green trust: The influences
of green perceived quality, green perceived risk, and green satisfac-
tion. Management Decision, 51, 63–82.
Chiou, J. & Droge, C. (2006) Service quality, trust, specific asset invest-
ment, and expertise: direct and indirect effects in a satisfaction-loyalty
framework. Journal of the Academy of Marketing Science, 3, 613–627.
Cobb-Walgren, C.J., Ruble, C.A. & Donthu, N. (1995) Brand equity, brand
preference, and purchase intent. Journal of Advertising, 24, 25–40.
D’Souza, C., Taghian, M., Lamb, P.P. & Peretiaktos, R. (2006) Green
products and corporate strategy: an empirical investigation. Societyand Business Review, 2, 144–157.
Delgado-Ballester, E. & Munuera-Alem�an, J.L. (2005) Does brand trust
matter to brand equity. Journal of Product & Brand Management, 14,
187–196.
Devi, J.T., Pudaruth, S., & Awootar, D. (2011) Exploring employees’
views and engagement on green sustainability in the food and bever-
age sector of Mauritius. Asian Journal of Research in Business Eco-nomics and Management, 1, 305–319.
Edward, M., George, B.P. & Sarkar, S.K. (2012) The impact of switching
costs upon the service quality-perceived value-customer satisfaction-
service loyalty chain: a study in the context of cellular services in
India. Services Marketing Quarterly, 31, 151–173.
Fornell, C. & Larcker, D.F. (1981) Evaluating structural equation models
with unobservable variables and measurement errors. Journal of
Marketing Research, 18, 39–50.
Gallastegui, I.G. (2002) The use of eco-labels: a review of literature.
European Enviroment, 12, 316–331.
Genesan, S. (1994) Determinants of long-term orientation in buyer-seller
relationship. Journal of Marketing, 58, 1–9.
Hair, J.F., Anderson, R.E., Tahtam, R.L. & Black, W.J. (1998) Multivari-ate Data Analysis, 5th edn. Prentice Hall, NJ.
Harrison-Walker, L.J. (2001) The measurement of word-of-mouth commu-
nication and an investigation of service quality and customer commit-
ment as potential antecedents. Journal of Service Research, 4, 60–75.
Homburg, C., Koschate, N. & Hoyer, W.D. (2005) Do satisfied customers
really pay more? a study of the relationship between customer satisfac-
tion and willingness to pay. Journal of Marketing, 69, 84–96.
Ibanez, L. & Grolleau G. (2008) Can ecolabeling schemes preserve
the environment? Environmental and Resource Economics, 40,
233–249.
Lee, J.-S., Hsu, L.-T(J)., Han, H. & Kim, Y. (2010) Understanding how
consumers view green hotels: how a hotel’s green image can influ-
ence behavioural intentions. Journal of Sustainable Tourism, 18,
901–914.
Jung, J., & Sung, E. (2008) Consumer-based brand equity comparisons
among Americans and South Koreans in the USA and South Koreans
in Korea. Journal of Fashion Marketing and Management, 12,
24–35.
Kang, S. & Hur, W.-M. (2012) Investigating the antecedents of green
brand equity: a sustainable development perspective. Corporate SocialResponsibility and Environmental Management, 19, 306–316.
F.A. Konuk et al. Antecedents of green behavioral intentions
595International Journal of Consumer Studies 39 (2015) 586–596
VC 2015 John Wiley & Sons Ltd

Keller, K.L. (1993) Conceptualizing, measuring, and managing
customer-based brand equity. Journal of Marketing, 57, 1–22.
Keller, K.L. (2003) Conceptualizing, measuring, and managing
customer-based brand equity. Journal of Marketing, 57, 1–22.
Kim, H.-B., & Kim, W.G. (2005) The relationship between brand equity
and firms ‘performance in luxury hotels and chain restaurants. TourismManagement, 26, 549–560.
Kim, H.-B., Kim, W.G. & An, J.A. (2003) The effect of consumer-based
brand equity on firms’ financial performance. Journal of ConsumerMarketing, 20, 335–351.
Kim, W.G. & Kim, H.-B. (2004) Measuring customer-based restaurant
brand equity. Cornell Hotel and Restaurant Administration Quarterly,
45, 115–131.
Kline, R. B. (1998) Principles and Practice of Structural Equation Mod-eling. The Gilford Press, NJ.
Laroche, M., Bergeron, J. & Barbaro-Forleo, G. (2001) Targeting con-
sumers who are willing to pay more for environmentally friendly prod-
ucts. Journal of Consumer Marketing, 18, 503–520.
Lee, K. (2009) Gender differences in Hong Kong adolescent consumers’
green purchasing behavior. Journal of Consumer Marketing, 26, 87–96.
McDonald, S. & Oates, C.J. (2006) Sustainability: consumer perceptions
and marketing strategies. Business Strategy and the Environment, 15,
157–170.
Mohanasundaram, V. (2012) Green marketing – challenges and opportu-
nities. International Journal of Multidisciplinary Research, 2, 66–73.
Moorman, C., Deshpand�e, R., & Zaltman, G. (1993) Factors Affecting
Trust in Market Research Relationships, Journal of Marketing, 57, 81–
101.
Morgan, R.M. & Hunt, S.D. (1994) The commitment-trust theory of rela-
tionship marketing, Journal of Marketing, 58, 20–38.
Netemeyer, R.G., Krishnan, B. Pullig., C., Wang, G. Yagci, M., Dean, D. &
Wirth, F. (2004) Developing and validating measures of facets of
customer-based brand equity, Journal of Business Research, 57, 209–224.
Oliver, R. (1981) Measurement and evaluation of satisfaction process in
retail settings, Journal of Retailing, 57, 25–48.
Oliver, R.L. (1999) Whence consumer loyalty?, Journal of Marketing,
63, 33–44.
Pappu, R. & P. Quester. (2006) Does customer satisfaction lead to
improved brand equity? An empirical examination of two Categories
of retail brands, Journal of Product and Brand Management, 15, 4–14.
Pappu, R., Quester, P.G. & Cooksey, R.W. (2005) Consumer-based brand
equity: improving the measurement-empirical evidence, Journal ofProduct & Brand Management, 14, 143–154.
Pickett-Baker, J. & Ozaki, R. (2008) Pro-environmental products: mar-
keting influence on consumer purchase decision. Journal of ConsumerMarketing, 25, 281–293.
Rahbar, E. & Wahid, N.A. (2011) Investigation of green marketing tools’
effect on consumers’ purchase behavior, Business Strategy Series, 12,
73–83.
Rajagopal (2007), Buying decisions towards organic products: an analy-
sis of customer value and brand drivers. International Journal of
Emerging Markets, 2, 236–251.
Ranaweera, C. & Prabhu, J. (2003) The influence of satisfaction, trust
and switching barriers on customer retention in a continuous purchases
setting, International Journal of Service Industry Management, 14,
374–395.
Reast, J.D. (2005) Brand trust and brand extension acceptance: The rela-
tionship. Journal of Product & Brand Management, 14, 4–13.
Simon C.J. & Sullivain, M.W. (1993) The Measurement and Determi-
nants of Brand Equity: A Financial Approach, Marketing Science, 12,
28–52.
Shamdasani P., Chon-Lin, G.O. & Richmond, D. (1993) Exploring green
consumers in an oriental culture: Role of personal and marketing mix
factors, Advances in Consumer Research, 20, 488–493.
Taylor, S.A., Celuch, K. & Goodwin, S. (2004). The importance of brand
equity to customer loyalty. Journal of Product & Brand Management,
13, 217–227.
The World Bank, (2014). 2014 World Development Indicators, Washing-
ton DC., USA.
Tolba, A.H. & Hassan, S.S. (2009) Linking customer-based brand equity
with brand market performance: a managerial approach, Journal of
Product & Brand Management, 18, 356–366.
V�azquez , Rodolfo, Del R�ıo, A. B. & Iglesias, V. (2002) Consumer-
based Brand Equity: Development and Validation of a Measurement
Instrument, Journal of Marketing Management, 18, 27–48.
Vogel, V., Evanschitzky, H. & Ramaseshan, B. (2008) Customer equity
drivers and future Sales, Journal of Marketing, 72, 98–108.
Vermillion, L.J. & Perat, J. (2010) Green marketing: Making sense of the
situation, Proceedings of the Academy of Marketing Studies, 15, 68–
72.
Wang, H., Wei, Y. & Yu, C. (2008) Global brand equity model: combin-
ing customer-based with product-market outcome approaches, Journal
of Product & Brand Management, 17, 305–316.
Washburn, J.H. & Plank, R.E. (2002) Measuring brand equity: an evalua-
tion of a consumer-based brand equity scale, Journal of MarketingTheory and Practice, 10, 46–62.
Hur, W.-M., Kim, Y. & Kyungdo Park. (2013) Assessing the effects of
perceived value and satisfaction on customer loyalty: a ‘green’ per-
spective, Corporate Social Responsibility and Environmental Manage-
ment 20, 146–156.
Wood, L. (2000) Brands and brand equity: definition and management,
Management Decision, 38, 662–669.
Yoo, B., Donthu, N. & Lee, S. (2000) An Examination of Selected Mar-
keting Mix Elements and Brand Equity, Journal of the Academy ofMarketing Science, 28, 195–211.
Yoo, B. & Donthu, N. (2001) Developing and validating a multidimen-
sional consumer-based brand equity scale, Journal of Business
Research, 52, 1–14.
Young, W., Hwang, K., McDonald, S. & Caroline J. Oates, C.J. (2010)
Sustainable consumption: green consumer behaviour when purchasing
products, Sustainable Development, 18, 20–31.
Zacharias, M.L.B., Figueiredo, K.F. & Araujo, C.A.S. (2009) The influ-
ence of banking service customers’ satisfaction level on the perception
of switching costs and on behavioral loyalty, Journal of Operationsand Supply Chain Management, 2, 1–13.
Zeithaml, V.A., Berry, L. and Parasuraman, A. (1996), The behav-
ioral consequences of service quality, Journal of Marketing, 60,
31–46.
Antecedents of green behavioral intentions F.A. Konuk et al.
596 International Journal of Consumer Studies 39 (2015) 586–596
VC 2015 John Wiley & Sons Ltd