Correlational research of antecedents in Tourism Destination ...
56
1 Correlational research of antecedents in Tourism Destination Choice Birthe Bakker, 2019
-
Upload
khangminh22 -
Category
Documents
-
view
1 -
download
0
Transcript of Correlational research of antecedents in Tourism Destination ...

1
Correlational research of antecedents in Tourism Destination Choice
Birthe Bakker, 2019

2
Correlational research of antecedents in Tourism Destination Choice
Wageningen University and Research Department of Environmental Sciences Cultural Geography Chair Group Submission date: August 26, 2019 Name student: Birthe Bakker Registration number: 930507026020 Master Thesis: Leisure, Society and Environment Thesis code: GEO80436 Supervisor/examiner: Dr. Ir. M. H. Jacobs

3
Table of contents
Overview of tables and figures ........................................................................................................................ 5 List of Figures ............................................................................................................................................... 5 List of Tables ................................................................................................................................................ 5
Preface ............................................................................................................................................................ 6
Summary ......................................................................................................................................................... 7
1.0 Introduction ............................................................................................................................................... 8 1.1 Tourism and destinations ........................................................................................................................ 8 1.2 The importance of destination choice research ........................................................................................ 8 1.3 Research Aim and Question .................................................................................................................... 9 1.4 Report structure ..................................................................................................................................... 9
2.0 Literature and conceptual model ............................................................................................................. 10 2.1 Destination Choice in Tourism Research ................................................................................................ 10 2.2 Motives as antecedent in Destination Choice......................................................................................... 12 2.3 New contribution to knowledge ............................................................................................................ 13 2.4 Motivation, motives and travel motives ................................................................................................ 13 2.5 Personality traits .................................................................................................................................. 14 2.6 Conceptual Theoretical Model and Hypotheses ..................................................................................... 15
3.0 Methodology ........................................................................................................................................... 17 3.1 Questionnaire design ............................................................................................................................ 17 3.2 Measurement of Variables .................................................................................................................... 17
3.2.1 Measurement of Destination Choice .............................................................................................. 17 3.2.2 Measurement of Travel Motivation ............................................................................................... 18 3.2.3 Measurement of Personality Traits ................................................................................................ 18
3.3 Methods of Data Collection................................................................................................................... 20 3.4 Research Population and Sampling Techniques ..................................................................................... 20 3.5 Sample Size .......................................................................................................................................... 20 3.6 Socio-demographics.............................................................................................................................. 21 3.7 Validity & Reliability ............................................................................................................................. 21
3.7.1 Validity .......................................................................................................................................... 21 3.7.2 Reliability ...................................................................................................................................... 22
3.8 Cleaning and recoding of Data .............................................................................................................. 23 3.9 SPSS ..................................................................................................................................................... 23
3.9.1 Multiple Linear Regression Analysis ............................................................................................... 23 3.9.2 Binary Logistic Regression Analysis ................................................................................................ 23
4.0 Results and Analysis ................................................................................................................................. 25 4.1 Socio-Demographics ............................................................................................................................. 25 4.2 Reliability analysis of personality traits ................................................................................................. 27 4.3 Reliability analysis of travel motives ...................................................................................................... 28 4.4 Relation between Personality Traits and Travel Motives ........................................................................ 30
4.4.1 Checking assumptions ................................................................................................................... 30 4.4.2 Multiple Linear Regression Analysis ............................................................................................... 31
4.5 Relation between the travel motives and destination choice .................................................................. 32 4.5.1 Binary Logistic Regression Analysis ................................................................................................ 32 4.5.2 Checking assumptions ................................................................................................................... 34 4.5.3 Multiple Linear Regression Analysis ............................................................................................... 35

4
4.6 Relation between personality traits and destination choice ................................................................... 38 4.6.1 Binary Logistic Regression Analysis ................................................................................................ 38 4.6.2 Checking assumptions ................................................................................................................... 39 4.6.3 Multiple Linear Regression Analysis ............................................................................................... 39
5.0 Discussion ................................................................................................................................................ 42 5.1 Recommendations ................................................................................................................................ 42
5.1.1 Practical applicability ..................................................................................................................... 43 5.2 Limitations ........................................................................................................................................... 43
6.0 Conclusion ............................................................................................................................................... 45
Bibliography .................................................................................................................................................. 46
Appendix 1 Questionnaire ............................................................................................................................. 51

5
Overview of tables and figures
List of Figures
Figure 1 A Model of the Pleasure Travel Destination Choice Process (Um & Crompton, 1990) .......................... 11 Figure 2 Conceptual Model ............................................................................................................................. 16
List of Tables
Table 1 Description of the Five IPIP-BFM Scales (Topolewska, Skimina, Strus, & Rowinski, 2014) .................... 19 Table 2 Socio-Demographics .......................................................................................................................... 25 Table 3 Last holiday Characteristics ................................................................................................................ 26 Table 4 Reliability of Personality Traits ............................................................................................................ 27 Table 5 Reliability Travel Motives .................................................................................................................... 28 Table 6 Assessing the assumption of no multicollinearity for travel motivation (p < 0.05, N = 1000) ................... 30 Table 7 Results of binary logistic regression model for destination choice based on travel motives .................... 32 Table 8 Results of binary logistic regression model for destination choice based on ‘novelty’ ............................. 33 Table 9 Results of binary logistic regression model for destination choice based on ‘culture’ ............................. 34 Table 10 Multicollinearity testing for the travel motives ..................................................................................... 34 Table 11 Multiple Linear Regression Analysis for travel motives and destination variables ................................ 35 Table 12 Results of binary logistic regression model for destination choice based on personality traits .............. 38 Table 13 Multicollinearity testing for the personality traits ................................................................................. 39 Table 14 Multiple Linear Regression Analysis for personality traits and destination variables ............................. 39

6
Preface
This thesis is part of the Master of Science program ‘Tourism, Society and Environment’ at Wageningen University and Research. In this thesis research I will investigate whether a relationship exists between personality traits, travel motives and destination choice. While finishing the writing of this thesis, I cannot believe that I have obtained such a wonderful opportunity to graduate from Wageningen University & Research. A few years ago, this opportunity did not seem achievable and I could not even imagine that I would finish my master. However, it seems that everything is attainable if you are determent about your dream and hardworking. This thesis would not have been possible without the guidance and the help of several individuals who in one way or another contributed and extended their valuable assistance in the preparation and completion of this study. Therefore, before introducing the research in the first chapter, I would like to thank a few people who have made a valuable contribution to this research and who have supported me through the process: First and foremost, I would like to extend my gratitude to Dr. ir. Maarten Jacobs of Wageningen University who has supported me throughout my thesis with his knowledge and guidance. Who’s help and advice has helped me along during the process. As my supervisor he was always available to discuss my progress of writing this thesis. He has offered much advice, wisdom and insights in dealing with the realization of this thesis by elaborating on the concepts, questionnaire and analysis. Second, I would like to thank all the respondents to the questionnaire. Without their answers this study would not have been possible. And last, but definitely not least, I would like to thank my friends and family for all their support along the way. I would especially like to thank my partner, who kept me motivated and determined to finish this thesis. I am grateful for the support, feedback and encouragement I have received throughout the thesis process.
7
Summary
The objective of this research was to conceptualize and empirically test the role of personality traits and travel motives as antecedents of destination choice. This research examines the relationship between personality traits, travel motivation and destination choice. The main aim of this research was to provide a deeper understanding on the diverse factors underlying the decision-making process and to propose a methodological framework within which the impact of characteristics of a potential tourist on destination choice can be captured and analysed. Therefore, it was the purpose of this research to gain insight in the antecedents of destination choice. Many researchers have done research about personality traits and travel motivation, however there was a lack of research done on the combination of these two with the additional destination choice aspect. This research examined the relationship between personality traits, travel motivation and destination choice. Therefore, the main research question was ‘To what extent are personality traits influencing destination choice?’. The answer on this question will be built on the following two sub-questions:
● What relationship exists between personality traits and travel motives? ● What relationship exists between travel motives and destination choice?
This was achieved by a newly developed conceptual model based on the personality traits by McCrae & John (1992) and the travel motives as defined by Pearce & Lee (2005). This research focuses on the characteristics, personality traits, constraints and stimuli of potential tourists towards destinations. The data includes detailed information on:
● The characteristics of people who went on holiday (nationality, gender, age-group, educational status, occupational status and approximate annual household income)
● Diverse range of variables influencing destination choice. After a literature review, quantitative data was collected by handing out questionnaires. Participants were asked to complete an English web-based questionnaire. The online questionnaire ran from the 4th of April 2019 till the 27th of May 2019. After 7 weeks of collecting data, there were 1036 questionnaires returned. These were analysed by the use of SPSS. To be able to answer the questions as mentioned above, Multiple Linear Regression and Binary Logistic Regression were performed and a relationship between personality, travel motives and destination choice has been established in this research. The aim was to grasp the relation between these major concepts, by combining them into one model. There is a limited predictive relationship found between personality, travel motives and destination choice, therefor it is clear that these antecedents are not a dominant factor in predicting destination choice. To further understand and predict destination choice, there is a need for future research and a new conceptual model would have to be constructed that includes more than the personality traits and travel motives. A practical consequence is that it is not advisable for tourism stakeholders to put a lot of time, money and effort into motivational research, as it is not the dominant factor in destination choice. It remains however possible to apply the knowledge of this research if desired by tourism marketing managers. Tourism marketers could focus on people who have similar motives or a similar personality. When these groups can be identified, they can be specifically targeted for a campaign, which would yield higher than average returns. Identifying groups of tourists could be achieved, for example, by asking tourists about their travel motives and personality traits.

8
1.0 Introduction
1.1 Tourism and destinations
In recent years tourism has become one of the fastest growing sectors of the world economy and is widely recognised for its contribution to economic development (Ninemeier & Perdue, 2008) (Cooper & Hall, 2008) (Mowforth & Munt, 2003) (Seddighi & Theocharous, 2002). Tourism is defined by the World Tourism Organization of the United Nation (UNWTO) as: “The activities of persons traveling to and staying in places outside their normal environment for no longer than a (consecutive) year” (UNWTO, 2002). A person's ‘normal environment’ consists of the immediate vicinity of his or her home, place of work or study, and other locations that he or she regularly visits. What belongs to the ‘normal environment’ therefore depends on the tourist itself and varies from person to person. The definition does not use objectively measurable features, such as distance, frequency or duration, to define the normal environment. When we consider tourism, we see many different options and destinations to travel to. Each of these travel options invoke an image of the destination, which is a well-studied concept in tourism literature (Beerli & Martin, 2004) (Ritchie & Crouch, 2003) (Ahmed, 1991) (Haahti & Yavas, 1983) (Goodrich, 1977). Tourist destinations are accepted to be a key component of the tourism system. The development of towns, cities and their inhabitants can be positively contributed to by the tourism industry (Bahar & Kozak, 2007) (Ritchie & Crouch, 2003). Similar to other industries, destinations compete with each other for a greater proportion of international tourism (Bahar & Kozak, 2007). According to Ritchie and Crouch (2003, p. 2) “what makes a tourism destination truly competitive is: its ability to increase tourism expenditure, its ability to increasingly attract visitors while providing them with satisfying, memorable experiences, its ability to meet visitors’ expectations in a profitable way its ability to enhance the well-being of destination residents, and its ability to attract visitors while preserving the natural capital of the destination for future generations”. Tourists are confronted with a large amount of destinations and alternatives. Marketeers from competing destinations communicate with potential tourists, the main attractions and positive characteristics of their destination. This information mass is beyond a tourists’ capacity to process. Despite this, a tourist is able to decide and select a destination after much deliberation and competitiveness between destinations that can provide the tourists needs (Crompton J. , 1992). For the tourism industry to maintain or improve its current status it is dependent on tourists’ travel decisions (Van Vuuren & Slabbert, 2011). Undoubtedly, marketing decisions and strategic planning of tourism provisions require knowledge of factors affecting destination choice and type of trips and forecast of tourism flows in the short and long term. The purpose of the study of tourism demand is to improve the ability to estimate and/or forecast and understand travel behaviour (Witt & Witt, 1995).
1.2 The importance of destination choice research
Choosing a travel destination is a very complex process with many influencing factors. Understanding the underlying destination choice processes of tourists and its antecedents is a fundamental issue both from an academic and destination management point of view (Karl, Reintinger, & Schmude, 2015), due to the fact that the tourism industry is one of the fastest growing sectors of the world economy (Ninemeier & Perdue, 2008) (Cooper & Hall, 2008) (Mowforth & Munt, 2003) (Seddighi & Theocharous, 2002). It is considered an extremely interesting phenomenon for academics and practitioners. Successfully predicting tourism destination choice by potential travellers would be a valuable advantage to managers and marketers and could assist in marketing and product planning/development, which can increase the number of visitors to tourism destinations (Van Vuuren & Slabbert, 2011) (Oppermann, 1999). An important objective of tourism demand analysis is to improve the understanding of public

9
behaviour towards a particular destination. It is, therefore, of relevance to know how tourists select their holiday destinations and investigate which factors are antecedents in their choices. The output of this study will provide destination marketers with valuable information for more cost-effective target marketing, which could lead to a competitive advantage (Porter, 1980). For tourism destination managers it would allow for an improved knowledge on the expected total demand, thus provide some vital information regarding infrastructure requirements. This allows for a demand adjusted pricing and positioning strategy. For tourism marketers, it would help to channel financial resources toward those consumers who are most likely to purchase, while at the same time avoiding to spend money on those who either will definitely not visit the destination and/or who have decided on visiting it anyway (Oppermann, 1999).
1.3 Research Aim and Question
The main aim of this research is to provide a deeper understanding on the diverse factors underlying of the decision-making process and to propose a methodological framework within the impact of characteristics of a potential tourist on destination choice can be captured and analysed. Therefore, it is the purpose of this research to gain insight in the underlying antecedents (and/ or) push- and pull factors of destination choice, as well as to identify key motivational factors that have significant effects on destination choice. In this paper, we propose an empirical approach which is based on a web-based tourism questionnaire of tourists. This approach allows the examination of the characteristics, which may influence individual travel motivation and later destination choice. This provides a conceptual framework and methodological design that builds an understanding on the diverse antecedents of destination choice. This study will conceptualize and empirically test the role of personality traits and travel motives as antecedents in the travel destination choice process. Therefore, the main research question is ‘To what extent are personality traits influencing destination choice?’. The answer on this question will be built on the following sub-questions:
• What relationship exists between personality traits and travel motives? • What relationship exists between travel motives and destination choice?
1.4 Report structure
Chapter 2 discusses and describes the theoretical underpinning and the context of this study, namely destination choice, travel motives and personality traits. The chapter ends with the conceptual framework of the research. This framework displays the concepts out of the literature that are important in relation to the research questions of this study. In chapter 3, the methodology is explained. This chapter describes the methods that are used in order to measure the relations between the concepts. The methods used are justified and it is explained how these methods were executed. Chapter 4 highlights the results and analysis. In chapter 5 showcases a discussion on the implications and limitations of this research and a reflection that emerged along the process of this research with a description of the possibilities for future research. In chapter 6 we draw the main conclusions.

10
2.0 Literature and conceptual model
This chapter will lay out a theoretical framework about destination choice and the relationship between the concepts of personality traits and travel motivation. The conceptual model will indicate which concepts are important to examine in order to answer the research questions. These concepts will first be mentioned and reflected upon. Then follows an overview of different theories about these subjects, which already exist. This leads to a conceptual model and corresponding sub-questions.
2.1 Destination Choice in Tourism Research
Many factors lead tourists to choose a destination, and understanding them is a fundamental issue, both from an academic point of view and for the management of tourism enterprises (Crouch, 1994). Papatheodorou (2006) stated that destination choice has always been an important aspect in tourism literature. The way a destination is selected is very relevant to understand, due to the financial benefits that stem from consumption of local hospitality and other tourism services. Higher tourist spending means new opportunities in developing the local economy, which can increase employment. To benefit from tourism and develop a powerful economy, destinations have to compete with each other (Bahar & Kozak, 2007) (Heath & Wall, 1992). Because new destinations are emerging and existing destinations continue to develop, competitiveness between destinations is increasing. This increased international competitiveness only increases the importance of measuring and determining a destinations’ competitiveness (Kozak, 2004). The worldwide media and the presence of international tour operators means that travellers have more knowledge about the destinations they can visit. This increased the pressures on competition between tourist destinations (Kozak & Rimmington, 1999). During the 1990s, measuring competitiveness was based around price, being the only considered factor. Today’s complex economic structure leads us to consider a greater number of variables (Bahar & Kozak, 2007). Destination attractiveness contributes to destination competitiveness through two categories of attractions. These two categories are natural attractions and hand-made elements. Natural attractions are attractions such as climate, ecology, culture and traditional architecture. Hand-made elements are attractions such as hotels, catering, transport and entertainment (Bahar & Kozak, 2007) (Laws, 1995). As discussed above, there are many internationally competing destinations of which their attractiveness can be measured. This means that a traveller has a complicated choice to make, based on various attraction factors and a large offering of destinations. In the next paragraphs, this decision-making process will be discussed. Choosing a travel destination is a very complex process with many influencing factors. Understanding the underlying destination choice processes of tourists is a fundamental issue both from an academic and destination management point of view. A review of the existing destination choice literature is dominated by theoretical studies, which each consist of a few determinants that influence the destination choice (Karl, Reintinger, & Schmude, 2015). Saito & Strehlau (2018) divided these factors influencing destination choice into four groups, namely: “(1) internal variables (attitudes, values, lifestyle, image, motivation, life cycle, risk reduction, etc.), (2) external variables (pull factors of the destination, family, friends, culture, reference groups, etc.), (3) the nature of the intended trip (holiday, size, distance, duration of trip, etc.), and (4) travel experiences (mood and feelings during the trip, post-purchase evaluations, etc.)”. On the one hand, these determinants include variables related to the tourist, such as ‘personal needs’, ‘values’, and ‘motivations’. On the other hand, some variables are related to the destination and its image that is created by the tourist (Baloglu, 2001) (Klenosky, Gengler, & Mulvey, 1993). These consists of various situational and environmental factors, such as culture, finances, previous experiences, influencing travel decisions (Karl, Reintinger, & Schmude, 2015) (Venkatesh, 2006) (Ankomah, Crompton, & Baker, 1996) (Laws, 1995).

11
Research into qualitative generic variables has mostly been focused on customer satisfaction, image, and repeat intention (Enright & Newton, 2004) (Hsu, Wolfe, & Kang, 2004) (Kozak, 2002) (Yoon, 2002) (Driscoll, Lawson, & Niven, 1994). These variables are closely linked to destination image with its situational and environmental factors. Other research has been concerned with the introduction of quantitative variables such as tourist arrivals, tourism income and occupancy rates (Dwyer, Forsyth, & Rao, 2002) (Papatheodorou, 2002). Both these fields of research attempt to describe attraction factors of the destination, but do not take internal inputs of the tourist into account. The model by Um & Crompton (1990) however, describes that this is a vital part of the destination choice process. Figure 1 A Model of the Pleasure Travel Destination Choice Process (Um & Crompton, 1990)
The model of (Um & Crompton, 1990) identifies and integrates three stages and two elaborate phases of processes, namely: the awareness set, evoked set, and travel destination selection. The model is presented as follow: (Stage 1) the formation of subjective beliefs about destination attributes in the awareness set, through passive information catching or incidental learning; (Phase 1) the decision to undertake a pleasure trip (initiation of a destination choice process by internal input) which includes consideration of situational constraints; (Stage 2) evolution of an evoked set from the awareness set of destinations and the formation of subjective beliefs about the destination attributes of each alternative in the evoked set of destinations, through active solicitation of information by external inputs (Phase 2). (Stage 3) The selection of a specific travel destination. The Pleasure Travel Destination Choice Process Model explains that internal and external inputs influence certain cognitive constructs. On the one hand, there are the external inputs. These are forces that are exerted on a person by his or her surroundings; social stimuli, symbolic stimuli and significative stimuli. On the other hand, there are internal inputs. These are personal characteristics, motives, values and attitudes. Of these inputs, attitudes have been one of the most popular variables used in research to try and predict consumer choice behaviour. An example of an empirical study in tourism literature that incorporate this variable is that of Woodside & Lysonski (1989). It is found unlikely to accurately reflect consumers’ choice processes without the inclusion of this variable (Um & Crompton, 1990). The question however remains, whether this also applies to the other variables like personal characteristics, motives and values.

12
Most of the existing destination choice literature describe the process and are hardly empirical tested (Smallman & Moore, 2010) (Decrop, 2006). Because the existing theoretical models exclude some measures of travellers’ personal traits, perceptions towards a destination, constraints and destination factors, such as political instability and poverty, they are not sensitive to the wide range of strategies that can be designed to influence consumer travel behaviour (Koppelman, 1980). Understanding these factors is a fundamental issue, not only from an academic point of view, but also for the management of tourism businesses (Crouch, 1994). Following Sirgy and Su (2000), previous research efforts into this consumer decision making process have centred on finding answers to what, where, and how tourists buy, rather than why. Accordingly, there is a need for further analyses of the determinants or causes of these choices. Purchase behaviour is particularly relevant in tourism (Woodside, Caldwell, & Albers-Miller, 2004), where a variety of push and pull factors affect that process (Beerli, Meneses, & Gil, 2007) (Decrop, 1999) (Dann, 1977). As discussed above there is a lack of empirical research and the question remains whether consumers’ choice processes can be accurately reflected without the personal characteristics, values and motives. This research intends to empirically research the relevance of included the motives factor into the model.
2.2 Motives as antecedent in Destination Choice
According to Gartner as cited by Pike (2008) travel motivation initiates the decision-making process. When a certain need or want cannot be met at home, a motivation to travel occurs. This is considered a very important variable in the decision making process (Van Vuuren & Slabbert, 2011) (Chang, 2007) (Correia, Oom Do Valle, & Moço, 2006). As stated by Venkatesh (2006) in Van Vuuren & Slabbert (2011) “The need to see the unseen and know the unknown drives people to travel to new places and motivates them to visit new destinations”. The foundation of destination choice is formed by the motivation to travel (Mansfeld, 1992). In destination choice literature the term behavioural approach is often mentioned. It originates from general consumer behaviour models, such as the model presented by Engel, Kollat, and Blackwell (1973) and Howard and Sheth (1969). The models suggest that the tourist is motivated by various factors during the holiday decision-making process, which confirms the crucial role of motivation on the destination choice. Other conceptual models that showcases the relation of travel motivation and destination choice are the models developed by Mansfeld (1992) and Um & Crompton (1992). Mansfeld (1992) concludes that travel motivation is the stage that triggers the whole decision process. The influence of motivation on the perception of the destination is researched by Beerli & Martin (2004). The influence of motivation is often mentioned in theoretical and exploratory research (Saito & Strehlau, 2018) (Karl, Reintinger, & Schmude, 2015) (Decrop, 2010) (Klenosky, Gengler, & Mulvey, 1993) (Woodside & Sherrell, 1977). Travel motives are in tourism literature often described as the ‘push’ and ‘pull’ factors. Dwyer, Mellor, Livaic, Edwards, & Kim (2004) identified four push factors in the context of national parks, which were escape, novelty, social interaction, and prestige. These findings suggest a relationship between travel motives and destination choice. Klenosky (2002) concludes in his research towards pull factors of tourism destinations that the travel motives associated with these factors may differ per individual. March and Woodside (2005) and George (2004) also consider travel motivations as one of the most important psychological influences of tourist behaviour. It can be stated that travel motives form an integral part of destination choice and has widely been researched. There is however a lack of empirical studies combining the two concepts, while it is viewed as one of the biggest determinants of destination choice (Mansfeld, 1992). Therefor the concept is included in this research.
13
As earlier mentioned Klenosky (2002) concluded that the travel motives associated with pull-factors of a destination may differ per individual. According to Gee, Choy and Makens (1984) “Motivations or underlying reasons for travel are covert in that they reflect an individual’s needs and wants”, as cited in Pearce and Lee (2005), which suggests a relationship between the individual and travel motives. The inner state of a person is reflected in a persons’ motivations or certain needs, which drives them to behave in a specific way and thus sustaining human behaviour and energy levels of the human body (Decrop, 2006) (George, 2004). It is widely recognised that a person’s previous encounter or experience with destinations and/or products is an integral component of that person’s decision process. This has, however, not been sufficiently translated into the analysis, modelling and forecasting of tourism demand and travel patterns. In conclusion, there is an established relationship between personality traits and travel motives. Because travel motives are part of understanding destination choice, we need to include personality traits in our examination to build an understanding of the decision-making process. For this reason and reasons detailed in section 2.4, personality traits are investigated as an antecedent in travel motives and destination choice.
2.3 New contribution to knowledge
Despite the contribution and prominence of tourism research for destination choice and many attempts to understand the meaning of destination attractiveness, destination competitiveness and destination choice, it is still suffering from a serious lack of evidence and drawbacks since it ignores the multiple determinants influencing the destination choice. As Bahar & Kozak (2007) and Sirgy & Su (2000) state it is therefore necessary to go beyond the theoretical approaches, and examine empirically the role of determinants on destination choice. In this research the comprehensive concepts, personality traits and travel motives, are included to examine their relationship with each other and later destination choice. This empirical knowledge will provide tourism stakeholders, like travel organizations, regional economist and tourism destination policymakers, with new reliable factors to predict destination choice.
2.4 Motivation, motives and travel motives
There are many different definitions of motivation, which are used by different researchers. One of the most cited of these in literature is the following: “Motivation is “a complex of subjective meaning which seems to the actor himself and to the observer an adequate ground for the conduct in question.” (Weber, 1968) as cited in Dann, (1981, p. 200). Dann (1981) states that tourist motivation is “a meaningful state of mind which adequately disposes an actor or group of actors to travel, and which is subsequently interpretable by others as a valid explanation for such a decision”, which can be seen as a definition of a travel motive. Motivation, thus, refers to need that drives an individual to achieve the desired satisfaction. These motives may differ from person to person when one makes the choice to go on a holiday. Motivation has been a focus of tourism research since the beginning of tourism studies. Tourism researchers have done research to get a hold on the question ‘What makes tourists travel?’ (Dann, 1977). This question is often explained through the concept of travel motivation. While many papers deal with motivation, there however still seems to be a lack of commonly accepted theoretical approaches in researching travel motivation (Pearce, Fundamentals of Tourist Motivation. In D. Pearce, & R. Butler (Eds.), 1993). Besides this, the studies are often less empirically tested (Pearce & Lee, 2005). Like traveling, motivation is valued as an ongoing process. Motivation is hard to measure, because it evolves and changes. Instead, the concept of ‘motive’ is regularly used in research on tourism
14
motivation (Iso-Ahola, 1982). A travel motive can justly be viewed as the answer to the question “why people engage in the act of travelling”, since as Murray (1964) predicates a motive as ‘an internal factor that arouses, directs and integrates a person’s behaviour, as cited in Iso-Ahola (1982). Within this research the concept of travel motives is discussed and researched. According to March and Woodside (2005) as well as George (2004) travel motivations are considered as one of the most important psychological influences of tourist behaviour. Many researchers have done research on the topic of tourist motivation, being an important topic in leisure and tourism research (Pearce & Lee, 2005). As is mentioned by Crompton (1979), it’s much harder to answer the ‘why’ question, than the who, when, where and how of tourism. The why question is also very important for tourist attractions and developers. When you are able to know why people go, or don’t go on a tourist attraction, it is easier to consider the desires of tourists. A greater understanding of the desires of tourists could lead to more probable success of the tourist attraction (Fodness, 1994) (Iso-Ahola, 1982) (Crompton J. L., 1979) in Pearce & Lee (2005). Maslow's theory is one of the most frequent used to explain the premise of motivation. Maslow uses five sets of goals which are also referred to as basic needs: physiological needs, safety needs, social needs, self-esteem and self-actualisation (Tikkanen, 2007). These basic needs are reflected in the travel motives of Kozak & Rimmington (1999), who carried out empirical research to measure a diverse range of elements of destination performance, by the examination of 13 travel motives. Relaxing, enjoying good weather, having fun, forgetting day-to-day problems and increasing knowledge of new places were the most signifiant factors. These items rather well align with those of Pearce & Lee (2005), who identified a pool of 69 initial motive items. This amount was eventually lowered multiple times and eventually they found 14 motivation factors. These 14 factors are (1) novelty, (2) escape/relax, (3) relationship (strengthen), (4) autonomy, (5) nature, (6) self-development (host-site involvement), (7) stimulation, (8) self-development (personal development), (9) relationship (security), (10) self-actualize, (11) isolation, (12) nostalgia, (13) romance and (14) recognition. According to Jang and Cai (2002) a unified perspective on travel motives is not available and a future model that would effectively explain the travel motives should include push- and pull factors towards the destination. The internal and emotional elements that may influence and explain the destination choice, such as the novelty, adventure, relaxation and the broadening- and social aspects of a holiday are represented in the push motives. Pull motives comprehend the external aspects the destination had to offer, like the culture, historical allurement, local residents, gastronomical experiences and the natural environment (Saito & Strehlau, 2018). Mainly the push factors are considered within this research, due to the assumption these may rather be affected by the personality traits. Yet the pull factors, nature and culture, are included to attempt understanding the destination choice based on these items as well. Beerli & Martin (2004) demonstrated the influence of nationality on travel motives, which are also found by Andreu, Kozak, Avci & Cifter (2005), Jang & Cai (2002) and Pearce (1993). An example of the relation between nationality and travel motives is the study of Kozak (2002), who found significant differences in the importance of motives between British and German tourists. Therefore, this research will include the nationality of its respondents.
2.5 Personality traits
Personality traits have not been linked to motivational research (Naquin & Holton, 2002), but in order to predict travel behaviour it is important to start with building an understanding on how individual characteristics of a person interact with the characteristics of the situation. Therefore, understanding the positive and negative evaluative factors influencing destination choices of the tourists is desirable (Van Vuuren & Slabbert, 2011) (March & Woodside, 2005) (Holloway, 2004) (Laws, 1995). The researcher therefore believes in the importance of considering personality in order to build an understanding of destination choice in relation with travel motives.

15
Something as complex as personality traits are difficult to define (Buss & Larsen, 2010) (Carver, 2004). Murray (1938) was one of the first authors to write about personality traits. However, struggled with finding a definition for this concept. Many years later researchers still struggled with finding a definition. The difficulty of establishing a definition that includes aspects such as inner characteristics, social effects, qualities of the mind, qualities of the body, relationships with others and inner goals (Buss & Larsen, 2010). Because of these complexities, a formal definition is omitted in some works on personality. Colquitt et al. (2000, p. 679) defined personality traits as “relatively stable characteristics of individuals (other than ability) that influence their cognition and behaviour”. Buss and Larsen (2010) use the following definition: "Personality is the set of psychological traits and mechanisms within the individual that are organized and relatively enduring and that influence his or her interactions with, and adaptations to, the intrapsychic, physical, and social environments." (Buss & Larsen, 2010, p. 4) Personality traits have been measured by psychologists for years and recently by social science researchers as well. Personality traits are dimensions that describe human personality. Hence, by examining personality traits based on such a robust and universal theory of personality it is able to represent the differential and unique characteristics of the large research population of tourists. Often when personality traits are discussed in literature, the link towards the Big Five Personality Traits is being made. The Five Factor Model of McCrae & John (1992) is one of the most accepted, applied-, and over-time most consistent, models to describe human personality (Gosling, Rentfrow, & Swann, 2003) (Roberts & DelVecchio, 2000). The model is a hierarchical framework of personality characteristics that obtains five dimensions: Emotional Stability/Neuroticism, Extraversion, Intellect/Openness, Agreeableness and Conscientiousness (McCrae & John, 1992) that represent an individual's personality (Gosling, Rentfrow, & Swann, 2003) (McCrae & John, 1992). In the literature there is no consistency in terms to refer towards the various personality dimensions (Briggs, 1992) (McCrae & John, 1992). Therefor a combination of these various terms will also be used in this research. For example, for the item Neuroticism the name Emotional Stability is also used very often. The item Openness is often described as the term Intellect. Although the Big Five, also known as the Five-Factor Model has been subject to significant criticism over the years (Block, 2010) (Block, 1995), it is considered a more universal theory and better capable to capture the basic human traits compared to other existing theories of personality (Saucier & Goldberg, 1998) (Saucier & Goldberg, 1996). Over the decades, studies have shown significant empirical evidence that suggests that the components of the Big Five encompass history, culture, economy, social, and ideology (Gurven, Von Rueden, Massenkoff, Kaplan, & Lero Vie, 2013) (John & Srivastava, 1999) (Mount, Barrick, & Strauss, 1994). The system of the Big Five personality traits is scientifically reliable and is applied in various areas of research where one wants to explain or understand behaviour based on personality (Gosling, Rentfrow, & Swann, 2003) (Briggs, 1992) (McCrae & John, 1992). Although there are many researchers that have been conducted research about personality traits and travel motivation, there is a lack of research which combines them.
2.6 Conceptual Theoretical Model and Hypotheses
As discussed, the main aim of this study is to provide a deeper understanding on the diverse factors underlying of the decision-making process and to propose a methodological framework, within the impact of characteristics of a potential tourist on destination choice can be captured and analysed. This study will conceptualize and empirically test the role of personality traits and travel motives as

16
antecedents in the travel destination choice process. To research the antecedents of destination choice after in-depth literature review a conceptual model is developed. This framework was developed to provide a context for this study (Figure 2). This model consists of personality traits as the independent- and destination choice, as a dependent variable within this study. Especially the relation between the variables is being researched. Two sub-questions arisen from the conceptual model, namely:
● What relationship exists between personality traits and travel motives? ● What relationship exists between travel motives and destination choice?
Figure 2 shows the conceptual model of this study. Within this research the main question is whether or not the final destination choice is influenced by one's own personality traits and travel motives. Besides the final destination choice, the characteristics on which destinations may differ are examined. The characteristics considered within this research are: Atmosphere, Authenticity, Climate, Convenience, Distance, Environment, Price and Safety. The inclusion of personal traits and travel motives in tourism analysis will strongly contribute towards the better understanding of destination choice.
Figure 2 Conceptual Model

17
3.0 Methodology
This chapter will provide an overview of the selected research design, methods of data collection and data analysis by underpinning the research questions and objective of the research. The focus of this quantitative research is to empirically test the hypotheses of the conceptual model (Figure 2). The aim is to produce generalizable results and to discover the strength of the relationships that ultimately lead from personality traits towards destination choice.
3.1 Questionnaire design
This cross-sectional correlational study falls under positivism as the research questions were statistically analysed using quantitative data. A questionnaire was chosen, due to the advantages of this method. As Vaske (2008) describes “they can describe characteristics of a larger population, large sample sizes can be obtained in a short period of time, they facilitate comparison among groups, and numerous questions can be asked in a single instrument”. Especially the time advantage and the comparability were important, given the limited amount of time and the desire to compare existing research at various levels of specificity. The questionnaire was created in Google Forms and distributed in English (Appendix). The questions arose from the conceptual model that is developed after profound literature review. The questionnaire focuses on the destination choice, the travel motives and the personality traits of the tourist. The respondents were asked to base their answers on the last holiday of at least 3 days from home. The questionnaire consisted of 71 questions. The division of question is as follows:
● Destination Choice: 16 questions ● Travel Motives: 28 questions ● Personality Traits: 20 questions ● Demographics: 7 questions
Within the questionnaire four items are used for each personality trait and travel motive to make a reliability test possible. The items are measured using a five-point Likert scale ranging from ‘1 Disagree’ to ‘5 Agree’ and ‘1 Very unimportant’ to ‘5 Very Important’. The self-rating questionnaire was employed to obtain data from the respondents. Although self-rating has been criticized due to the effects of common method variance (Jarvis, MacKenzie, & Podsakoff, 2003), it is not as significantly problematic as commonly believed (Spector, 2006). Even though the participants are asked to fill out the questionnaire completely, not all questions are obligated to answer. The last holiday country and all questions regarding travel motives and personality traits however were obligated. Therefore, the number of responses differ within the response per question. The following paragraphs will outline the selection of questions to each variable. To be able to research the personality traits, travel motives, destination choice and personal information the questionnaire had to be separated into four parts. The first part consists of the destination choice, the second part of travel motives, the third of personality traits and the last part consists of demographic information.
3.2 Measurement of Variables
3.2.1 Measurement of Destination Choice
The UNWTO makes a distinction between short and long vacations and states that a short vacation lasts one, two or three nights and a long vacation lasts at least four nights, up to a year. In this research holiday is defined as a trip of at least 3 days from home with leisure purposes as an important component.

18
When measuring the destination, a country is indicated, by an open space to fill in the destination of choice. These countries are analysed by the categorisation per region according to the ISO-3166 (ISO, 2013), which consists of Africa, Arab States, Asia & Pacific, Europe, North America and South/Latin America. The region of the respondents last holiday is compared with the region of nationality, which creates a new variable (NEW_DC). 0 = travelling within the same region. 1 = travelling to another region. The destination choice is also operationalized by asking rating questions to figure out the type of destination. Think of city environments versus natural environments (e.g.: beaches, forests), the price-level, safety, distance, convenience, atmosphere and climate of the destination. These are combined on a five-point Likert scale to measure the dependent variable ‘destination’. To review the questions related to destination choice please consult the questionnaire in the appendix. After receiving the data confirmatory factor analysis was tested to verify the possibility of reducing the amount of destination variables. Two components were extracted, namely Environment-Price-Atmosphere and Safety-Convenience-Distance. However, when the reliability analysis was applied these components appeared to have a poor and unacceptable internal consistency. Therefor the decision was made to retain the 8 destination variables.
3.2.2 Measurement of Travel Motivation
The motives identified by Pearce & Lee (2005) are used as a base to understand the travel motives within this study. The motives of Pearce & Lee (2005) are applicable cross culturally and arose from literature and unstructured interviews. This aspect is quite important as the respondents of this study originate from a diverse range of countries. According to the researcher some of the items of Pearce & Lee (2005) do not cover the full domain of the concept. Others were somewhat ambiguous. Therefor a new model was created with the themes: Novelty, Escape, Perception of freedom, Relationship (strengthening), Self-development, Experiencing culture and Experiencing nature. The travel motives of this study will be tested through a questionnaire with the 7 travel motive factors consisting of 28 motive items. In the questionnaire a five-point Likert-scale is used, from which the respondents could choose the most suitable option. The travel motives were measured by 7 themes, each containing out of four items. The themes: (1) Novelty, (2) Escape, (3) Freedom, (4) Relationship (Strengthening), (5) Self-development, (6) Culture and (7) Nature. To understand and measure each theme, questions are formulated. To review the questions related to the Travel Motives please consult the Questionnaire in the Appendix. The questions on the travel motives are coded on a 5 point-Likert scale, ranging from -2 ‘Very Unimportant’ to 2 ‘Very unimportant’ with zero as a neutral point. For an overview of the factors and the corresponding reliabilities, please see Chapter 4, Table 4.
3.2.3 Measurement of Personality Traits
Within this research the internal variable ‘Personality Traits’ is being measured as an independent variable. The personality factors were adapted from The Five-Factor Model by McCrae & John (1992). The most frequently used measurement of personality consists of a large number of items. However, in recent years the short questionnaires became more popular. The advantages of shortened versions of questionnaires include low cost and the short time that it takes to fill them in (Herzberg & Brähler, 2006). Personality traits are usually measured by the use of more traditional- and longer instruments that measure based on quite a number of items per factor (Romero, Villar, Gómez-Fraquela, & López-Romero, 2012). Short versions of questionnaires allow studies with time restrictions, such as the studies conducted online, to include personality measurement (Gosling, Rentfrow, & Swann, 2003). Another advantage of shortened versions is the fact that they are much less tiresome

19
for respondents and therefore reduce the risk of errors resulting from accidental indication of answers (Romero, Villar, Gómez-Fraquela, & López-Romero, 2012) (Thalmayer, Saucier, & Eigenhuis, 2011) (Fischbach & Moosbrugger, 2007). For these reasons to measure personality, with a minimum of items per domain, this in a reliable and valid way the IPIP-BFM-20 questionnaire by Topolewska, Skimina, Strus, & Rowinski (2014) is adopted. It can be concluded that the IPIP-BFM-20 Questionnaire is a good alternative to longer measuring instruments (Romero, Villar, Gómez-Fraquela, & López-Romero, 2012) (Donnellan, Oswald, Baird, & Lucas, 2006) (Gosling, Rentfrow, & Swann, 2003) and will therefore be conducted within this research. This shortened version of the 50-item questionnaire from the resources of the International Personality Item Pool is recommended to researchers who need a short measuring instrument to evaluate the Big Five (Cooper, Corr, & Smillie, 2010) (Donnellan, Oswald, Baird, & Lucas, 2006). It has a very good convergent validity and the coherence of the different items with that of the IPIP-FFM is very strong (Laverdière, Morin, & St-Hilaire, 2013) For an overview of the factors and the corresponding reliabilities, please see chapter 4, table 3. In the following Table a description of the five dimensions is given. Table 1 Description of the Five IPIP-BFM Scales (Topolewska, Skimina, Strus, & Rowinski, 2014)
Scale Object of Measurement Individuals who score high may be described as:
Individuals who score low may be described as:
Extraversion The level of activity, energy, as well as sociability and social confidence (assertiveness).
active, energetic, extraverted, talkative, bold and assertive.
Introverted, reserved, quiet, and socially inhibited.
Agreeableness Positive (vs. negative) attitude towards people.
trustful, kind, considerate and warm as well as cooperative and helpful.
distrustful, selfish, unkind, rude, and emotionally cold towards other people.
Conscientiousness The level of organization, diligence in pursuing goals and performing tasks as well as proneness to order and dutifulness.
organized, diligent, thorough and efficient in what they do as well as systematic and dutiful.
unsystematic and inconsistent, unconcerned with order and planning, negligent, careless, and undependable.
Emotional Stability The level of reactivity and emotional stability, emotional resistance and tolerance to frustration.
imperturbable, calm relaxed, not prone to negative emotional states.
anxious, nervous,moody,prone to worry and oversensitive as well as envious, touchy,prone to anger and irritation.
Intellect Intellectual openness, creativity and imagination.
intellectually active and cognitively open, creative,introspective, having a vivid imagination and a wide range of interests.
unintellectual, noninquisitive, uninmaginative, simple, unsophisticated, unreflective and uncreative.
Conscientiousness is associated with the qualities of being goal-directed, persistent, dependable, and organized (Barrick, Mount, & Judge, 2001) (Barrick & Mount, 1991). Several studies have found the association between conscientiousness and motivation (Ilies, 2002). Emotional Stability is being linked towards anxiety, anger, depression, self-consciousness, immoderation and vulnerability. According to McCrae & John (1992) and Barrick et al. (1991), extraversion can be characterized as being ambitious, sociable, cheerful, assertive, sensation-seeking, and active. Agreeableness reflects the personality of being altruistic, sympathetic, and helpful (Major, Turner, & Fletcher, 2006) (McCrae & Costa, 1989). It is also associated with the characteristics of being courteous, flexible, trusting, good-natured, co-operative, forgiving, soft-hearted, and tolerant (Judge & Ilies, 2002) (Barrick & Mount, 1991). Intellect is associated with the qualities of having a vivid imagination, believing in the importance
20
of art, experiencing emotions intensely, liking complex problems and the preference towards the variety of routines To review the questions related to the personality traits please consult the questionnaire in the appendix.
3.3 Methods of Data Collection
The following paragraph will discuss how the data was collected. As mentioned before, the research was carried out by using a quantitative method in order to collect the necessary empirical data and get a deep insight into the understanding of the relation between personality traits, travel motives and destination choice. A conceptual model was established as a base to examine the relationship between personality traits, travel motivation and destination choice. The primary data for this research was collected by carrying out an online based questionnaire. The questionnaire was brought under the attention of people by asking the researcher’s private network to fill in the questionnaire and distribute it among friends/family, as this is a cost-effective way of data collection. A link to the questionnaire was posted multiple times on reddit.com and SurveySwap to increase the group of respondents. After 7 weeks (4 April 2019 - 27 May 2019) of collecting data, there were 1036 questionnaires returned.
3.4 Research Population and Sampling Techniques
The research population of this research is a random convenience sample, which is one of the least rigorous techniques that involves the most accessible subjects. For the researcher it is also the most cost-efficient in terms of time, effort and money (Marshall, 1996). The aim is to draw a representative sample from the population, which makes generalization of the results possible. Conducting the survey among a diverse range of people in terms of nationality, age, gender and level of education offers the expectations towards a broad insight in personalities, travel motivations and perspectives. A random convenience sample is used to prevent the selection that could interfere with certain personalities of people within the sample. A focus, on for example, mainly students could lead to a bias. The results could show a certain travel motive based on the lifestyle and perception of students. However, this could happen to a small extent as the concepts of personality traits and travel motives are broad and generalizable towards a bigger population and its sub-categories. A focus on a broad spectrum of age differences and educational levels will give insight in all different types of people and would thus improve reliability and validity.
3.5 Sample Size
Ideally the sample population reflects the population. Of course, due to the large size of the global-world population, not every individual in the population can be tested. Therefore, the researcher relies on sampling techniques. Due to the fact that a theory is tested it is not necessary to test the sample size of the total world population. However, it may be applicable and generalizable to the world population. Usually the number of respondents becomes a fixed number during the research process, as new input, categories and questions continuously arise from the data. The progression of data saturation is a flexible research design with a cyclical approach toward the sampling, collection and analysis of the data. As this is a quantitative study a more stepwise design is applied, where the process of editing and adjusting is done prior the online posting of the questionnaire. This makes the prediction of the sample size difficult (Marshall, 1996). Yet, a target is made. The sample size within this research is determined

21
by the optimum number necessary to enable valid inferences to be made about the population. The aim was to achieve a large sample to decrease the chance of a random sample error. The population in this research is every global individual aged over 18, who went on a trip of at least 3 days from home with leisure purposes as an important component. According to Field (2009) a sample size of 300 or more should be sufficient for factor analysis. This estimate is based on the work of MacCallum, Widaman, Zhang, & Hong (1999) and Tabachnick and Fidell (1996). When assuming a 95% confidence level, .5 standard deviation, and a margin of error of +/ - 5% a suitable sample size is 385 or more. For these reasons the minimum required sample size for this research was set at 385 respondents.
3.6 Socio-demographics
The questionnaire included demographic variables to measure gender, age, highest educational level, and occupational status. The socio-demographics were part of this study to enable a provision of a respondent profile. An overview of the socio-demographics of this study can be seen in chapter 4 Table 1.
3.7 Validity & Reliability
To be able to talk about a scientifically justified measurement, there must be reliability and validity of the measuring instrument. These terms are discussed in more detail below. Both validity and reliability are important in scientific research. Validity and reliability are not completely independent qualities of an instrument. In the first place, it is important to make a good distinction between validity and reliability. Validity refers to the extent to which the measuring instrument measures what it is intended to measure (Polit & Beck, 2010). Polit and Beck (2010) describe reliability as the consistency with which an instrument measures an attribute or characteristic. An important conclusion is that a measuring instrument that is not reliable cannot be valid as well (Polit & Beck, 2010). After all, an instrument cannot measure valid when it is inaccurate and irregular. However, an instrument can be reliable without being valid (Polit & Beck, 2010). Literature distinguishes various forms of validity and reliability, which are discussed below.
3.7.1 Validity
In this paragraph the validity of this study is being discussed. Validity is the degree to which a designed tool is actually measuring what it should measure (Field, 2009). In this study the items selected to measure the travel motives are based on the questionnaire items of Pearce & Lee (2005). According to the researcher some of the items of Pearce & Lee (2005) do not cover the full domain of the concept. An example of this is the factor ‘Novelty’ by Pearce & Lee (2005). The motive items ‘Having fun’, ‘Experiencing something different’, ‘Feeling the special atmosphere of the vacation destination’ and ‘Visiting places related to my personal interests’ do not relate or cover the concept ‘Novelty’. Therefor these motive items are adjusted into: ‘Exploring the unknown’, Meeting new people with similar values/interests’, ‘Having new experiences’ and ‘Gaining new perspectives on life’ to increase the validity. The extent to which the purpose of the questionnaire of Pearce & Lee (2005) corresponds to what the questionnaire measures was somewhat ambiguous. Therefor a new model was created with the items: Novelty, Escape, Freedom (perception of), Relationship (strengthening), Self-development, Culture and Nature, whereof Escape and Nature correspond with the items of Pearce & Lee (2005), Relationship (strengthening) is a combination of Pearce & Lee’s Relationship (Strengthen) and Relationship (Security) and Self-development uses one motive item of Pearce & Lee (2005), which is ‘Developing my skills and abilities. All motive items of Pearce & Lee (2005) were checked and selected by their Cronbach Alpha and Loadings. Besides

22
neglecting the factors ‘Autonomy’, ‘Stimulation’, ‘Self-actualize’, ‘Isolation’, ‘Nostalgia’, ‘Romance’ and ‘Recognition’ the motive items ‘Novelty’ and ‘Self-development’ were adjusted and the factors ‘Freedom’ and ‘Culture’ were added. One aims for a strong correlation between the scores and the scores of the factor. As mentioned in chapter 1 the aim is to try to establish a valid and reliable questionnaire, which investigates the relationship between personality traits, travel motives and destination choice. Having a five-point Likert-scale increases the validity of the questionnaire as well, due to the fact that respondents are able to finish the questionnaire more quickly.
3.7.2 Reliability
The following paragraph will outline the reliability of this research. Reliability is whether a measuring instrument can be used to interpret consistently across different situations. Reliability occurs when the measurement results remain consistent with variation in researchers when both the questionnaire and the data collection method remain the same or constant. The questionnaire is therefore reliable when the measurement results are repeatable, in particular when the measuring instrument gives the same value or outcome after a repeated decrease for a specific person (Field, 2009). As mentioned by Beaulieu and Schreyer (1985) different factors are considered when an actual decision is being made, instead of when making a hypothetical decision. This research deliberately asks about the last holiday the respondents have taken to increase the reliability of this research. The choice to go to that particular holiday destination has already been made, instead of it being a hypothetical decision to go there. A reliability analysis is conducted, in chapter 4 table 2 and 3, to determine whether the items asked measure the same construct. This improves internal consistency and consequently validity as it verifies if the questions where measuring what it should have measured. The reliability of the personality and travel motive factors are checked to validate the questionnaire. The questionnaire should consistently reflect the construct that it is measuring to be reliable (Field, 2009). An instrument is considered internally consistent, and therefore reliable, when the items measure the same property. The reliability is tested by using Cronbach’s alpha. An instrument is considered internally consistent, and therefore reliable, when the items measure the same property. Internal consistency is usually evaluated based on the calculation of the alpha coefficient, also known as the Cronbach’s alpha (α). The higher the reliability coefficient, the more accurate or the more internally consistent the measurement is. A measuring instrument with values higher than 0.70 (α ≥ 0.70) can be considered reliable and a negative item-total correlation or even a negative alpha indicates inconsistency within the scale (Polit & Beck, 2010). The higher the reliability coefficient, the more accurate or the more internally consistent the measurement is. The Cronbach’s alpha can vary between 0 and 1. The dataset will randomly be split into two halves and a large correlation is a sign of reliability. As Field (2009) concludes that a value of 0.7 to 0.8 is an acceptable value for Cronbach’s alpha; values substantially lower indicate an unreliable scale. However, Cortina (1993) notes that such general guidelines need to be used with caution because the value of alpha depends on the number of items on the scale. Within table 4 and 5 the Corrected Item-Total Correlation is shown, which are the correlations between the motive items and the total score. Below 0.3 will show a miss-correlation with the overall total. The overall alpha when excluded from the overall total is shown by Cronbach’s Alpha if item is Deleted. This

23
number should correspond with the overall Cronbach’s Alpha of the specific factor. Values greater than the overall Cronbach’s Alpha should be deleted from the scale to improve the reliability.
3.8 Cleaning and recoding of Data
The following paragraph will outline the preparation of the gathered data. The first step in analysing the data is to make sure that the gathered data is useful. As mentioned in chapter 3 ‘Methodology, 1036 questionnaires were filled out. 36 responses were deleted before analysis in SPSS. The deleted respondents did not fill out all parts of the questionnaire, filled all neutral responses on the Likert-scale or filled out to be 0 or 1 nights to be from home, while the definition of the last holiday according to this research is at least 3 days. therefore 2 nights, from home. A number of 1000 of questionnaires were used in the SPSS analysis. The country of residence is recoded into regions according to the ISO-list (ISO, 2013). Subsequently the nationality of the respondents is recoded into the same regions. What allows the creation of a new comparison variable: NEW_DC, where 0 stands for travelling within the same region and 1 for travelling out of the region. Each personality traits and travel motive is represented by 4 items. These 4 items are combined into variables by adding the values and dividing them by 4.
3.9 SPSS
This paragraph will showcase the data analysis for each hypothesis. These analyses are conducted in IBM SPSS Statistics 26.
3.9.1 Multiple Linear Regression Analysis
A Multiple Linear Regression Analysis is used to predict values of the personality traits. The model consists of one dependent variable, which is the outcome of the model and multiple exploratory variables. The data is fitted in linear regression to a model, which is conceptualized as a straight line. This straight line can be described by a general equation as:
- outcome = B0 + B1X1 + B2X2 + B3X3 + B4X4 + B5X5 This model of the equation consists of B0, the intercept, which is the point the line crosses the vertical axis and the gradient of the line B1X1 + B2X2 + B3X3 + B4X4 + B5X5, which are the regression coefficients. Also, an error is added to each of these coefficients to represent the difference between the predicted value and the obtained value. A line that has a positive gradient describes a positive relation, whereas a negative gradient describes a negative relation. The R Square represents the amount of variance in the outcome explained by the model, which shows us the percentage of travel motive that is explained by the personality trait. The t-statistic shows the significance of the model. When it is < 0.05. the hypothesis is true and the personality trait contributes significantly to estimate values.
3.9.2 Binary Logistic Regression Analysis
The Binary Logistic Regression Analysis can be viewed as an extension of regression analysis and is used to predict the categorical variable destination choice that consists of 2 categories, which in this study consists of: 0 = travelling within the same region or 1 = travelling without the same region.
24
This analysis is used to predict the relation between travel motives and destination choice, which is hypothesis 2. Later in this research the same analysis is used to examine the main relation between the personality traits and destination choice as well. The test the whether the model fits the data the observed and predicted values of the outcomes are compared, which is measured by log-likelihood. According to Tabachnick & Fidell (1996) the log-likelihood is based on the predicted and actual outcomes that are associated with the summing of probabilities. The lower the log-likelihood the better, as it is describing the unexplained observations in the statistical model. The R-statistic shows a variation between -1 and 1, where a positive value indicates an increase in the likelihood of the outcome occurring. When R is a small value it contributes with a small amount to the model. The Wald statistic with the chi-square distribution is used to measure the individual contribution of the variables towards the overall model. In case this statistic is zero the predictor, which is one of the personality traits or travel motives, can be removed from the model. An important side-notation to keep in mind is that in case the size of the regression coefficient is large, the corresponding error becomes inflated, which would result in an underestimated Wald statistic (Menard, 2000).

25
4.0 Results and Analysis
This chapter will show the results of the questionnaire. As mentioned in the introduction, the goal of this research is to examine the relationship between personality traits, travel motivation and destination choice. Therefor a questionnaire is designed and distributed online, as mentioned in chapter 3. The gathered data is analysed with IBM SPSS Statistics 26. First the socio-demographics of the sample of respondents will be described. Then the results of the multiple linear regression analysis and logistic regression are presented.
4.1 Socio-Demographics
Table 2 Socio-Demographics
Variable Category Frequency % Nationality African 11 1.1
Arabian 3 .3 Asian & Pacific 98 9.8 European 609 60.9 North American 216 21.6 South/Latin American 17 1.7 Total 954 95.4 Missing 46 4.6 Total 1000 100.0
Gender Female 614 61.4
Male 386 38.6 Total 1000 100.0
Age Group < 18 83 8.3
18 – 35 755 75.5 36 – 43 62 6.2 44 – 61 84 8.4 > 62 16 1.6 Total 1000 100.0
Education Elementary School 35 3.5
High School 197 19.7 College 123 12.3 Undergraduate (Bachelor) 387 38.7 Graduate (Masters) 226 22.6 Graduate (PhD, Advanced) 29 2.9 Total 997 99.7 Missing 3 .3 Total 1000 100
Occupational Status Employed 431 43.1
Student 495 49.5 Unemployed 52 5.2 Retired 16 1.6 Total 994 99.4 Missing 6 .6 Total 1000 100.0
Approximate Annual Household Income
< 20.000 EUR 341 34.1 20.001 – 40.000 EUR 235 23.5 40.001 – 60.000 EUR 154 15.4 60.001 – 80.000 EUR 83 8.3 80.001 – 100.000 EUR 61 6.1 > 100.000 EUR 86 8.6 Total 962 96.2

26
Missing 38 3.8 Total 1000 100.0
The following paragraph will show the characteristics of the sample group that voluntarily participated in this research. After cleaning the data, a total of 1000 valid questionnaires were accepted for the data analysis. Table 2 show the socio-demographics of the respondents, which has a diverse range of nationalities, genders, age groups and educational levels. This is not different than expected since the online-questionnaire is completed by people all over the world. Table 2 shows that the majority of the respondents is European (60.9%). Another 21.6% of the respondents are North American and 9.8% are Asian & Pacific Islanders. Most of the respondents are female (61.4%). Over three-quarters of the respondents (75.5%) is between 18 and 35 years old. Almost half of the respondents are students (49.5%), which are not representative numbers compared to the entire world population. Therefore, it is recommended to take these socio-demographic values in consideration when looking at the results. Besides these personal characteristics, questions were asked regarding the respondent’s last holiday. As shown in table 3 were Europe (56.8%) and North America (17.9%) popular regions for the last taken holidays. Most respondents (70.6%) take on average 1 to 3 foreign- and domestic trips per year during which they stayed at least 3 days. 33.7% of the respondents described their last holiday destination as ‘city’, 23.9% described their last holiday as a ‘natural environment’ and 16.9% as ‘relaxation’. The duration of their last holiday was 61.1% of the time between 2 and 7 nights and 39.0% of the respondents already visited their last holiday destination before. Popular main activities are ‘Visiting cities, monuments and museums’ (41.5%), ‘Walking and exploring the natural environment’ (23.6%) and ‘Relaxing’ (15.8%). Table 3 Last holiday Characteristics
Variable Category Frequency % Average number of separate trips per year (foreign and domestic) during which stayed at least 3 days
0 51 5.1 1 – 3 706 70.6 4 – 6 186 18.6 7 – 9 31 3.1 > 9 23 2.3 Total 997 99.7 Missing 3 .3 Total 1000 100.0
Destination description
Adventurous 138 13.8 City 337 33.7 Natural Environment 239 23.9 Relaxation 169 16.9 Social 115 11.5 Total 998 99.8 Missing 2 .2 Total 1000 100.0
Nights on destination 2 – 7 nights 611 61.1
8 – 14 nights 227 22.7 15 – 21 nights 81 8.1 22 – 28 nights 12 1.2 29 – 35 nights 23 2.3 36 – 42 nights 4 .4 43 days or more 18 1.8 Total 976 97.6 Missing 24 2.4 Total 1000 100.0
Already visited destination before
No 609 60.9 Yes 390 39.0

27
Total 999 99.9 999 1 .1 Total 1000 100.0
Main activities Being active (e.g.
exercise/playing sports)
83 8.3
Enjoying the sun/beach
107 10.7
Relaxing 158 15.8 Visiting cities,
monuments and museums
415 41.5
Walking and exploring the natural environment
236 23.6
Total 999 99.9 Missing 1 .1 Total 1000 100.0
Last holiday Region Africa 25 2.5
Arab States 24 2.4 Asia & Pacific 143 1.3 Europe 568 56.8 North America 179 17.9 South/Latin America 61 6.1 Total 1000 100.0
4.2 Reliability analysis of personality traits
In table 4 the results are shown for the reliability analysis of the personality traits for the sample which is used in this research. As mentioned in ‘3.7.2 Reliability’ is the reliability checked to validate the questionnaire. The questionnaire should consistently reflect the construct that it is measuring to be reliable (Field, 2009). An instrument is considered internally consistent, and therefore reliable, when the items measure the same property. The reliability is tested by using Cronbach’s alpha. Table 4 Reliability of Personality Traits
Factors Personality Trait Items
Mean Std. Deviation
Corrected Item-Total Correlation
Cronbach’s Alpha if item is Deleted
Extraversion (EX) Cronbach’s Alpha = .801 Mean = -1.07 Variance = 16.372 Std. Deviation = 4.046
Am the life of the party.
-.51 1.162 .605 .758
Talk to a lot of different people at parties.
-.25 1.270 .637 .741
Keep in the background.
-.08 1.269 .586 .765
Am quiet around strangers.
-.23 1.399 .639 .741
Agreeableness (AG) Cronbach’s Alpha = .582 Mean = 3.60 Variance = 7.532 Std. Deviation = 2.744
Feel little concern for others.
.76 1.168 .236 .626
Sympathize with others’ feelings.
1.06 .921 .472 .435
Take time out for others.
.74 .941 .363 .514
Am not interested in other people’s problems.
1.03 1.070 .422 .462

28
Conscientiousness (CN) Cronbach’s Alpha = .608 Mean = .54 Variance = 11.484 Std. Deviation = 3.389
Leave my belongings around.
.32 1.303 .406 .524
Get chores done right away.
-.26 1.184 .429 .508
Often forget to put things back in their proper place.
.30 1.361 .423 .510
Follow a schedule.
.18 1.139 .299 .598
Emotional Stability/Neuroticism (ES/N) Cronbach’s Alpha = .680 Mean = -.42 Variance = 12.308 Std. Deviation = 3.508
Am relaxed most of the time.
.19 1.110 .476 .608
Worry about things.
-.57 1.310 .497 .590
Seldom feel blue. -.32 1.135 .478 .606 Have frequent
mood swings. .29 1.341 .410 .653
Intellect/Openness (I/O) Cronbach’s Alpha = .375 Mean = 3.55 Variance = 5.607 Std. Deviation = 2.368
Have a rich vocabulary
.82 .958 .217 .295
Have difficulty understanding abstract ideas.
1.01 1.008 .201 .311
Do not have a good imagination.
.92 1.087 .196 .319
Am full of ideas. .80 .955 .194 .319 The Corrected Item-Total Correlation value of the Motive Items: ‘Feel little concern for others’, ‘Have a rich vocabulary’, ‘Have difficulty understanding abstract ideas’, ‘Do not have a good imagination’ and ‘Am full of ideas’ are below .30. This however, only results in a Cronbach’s Alpha if item is Deleted value higher than the overall Cronbach’s Alpha value for the Motive Item: ‘Feel little concern for others’. Extraversion, Emotional Stability/Neuroticism and Conscientiousness all had quite acceptable reliabilities for the number of items being measured, Cronbach’s Alpha = .801, .680 and .608. However, Agreeableness (.582) and Intellect/Openness (.375) had relatively low reliability. When the first item ‘Feel little concern for others’ of Agreeableness is removed Cronbach’s Alpha increases to .63, which is sufficient considering the number of items being measured. The reliability of Intellect/Openness however, is insufficient to include in the further analyses and will therefore be removed from the scale.
4.3 Reliability analysis of travel motives
In table 5 the reliability analysis for the travel motives is shown. All factors had high reliabilities, all Cronbach’s Alpha = > .706 even going up to .901. However, the factors: Freedom, Relationship Strengthening and Nature do have Cronbach’s Alpha if Item Deleted values higher than its overall Cronbach’s Alpha value. Therefor the motive items, ‘Being away from the crowds of people’, ‘Being near considerate people’ and ‘Viewing the natural scenery’ should be deleted from the scale in future research to improve the overall reliability. Table 5 Reliability Travel Motives
Factors Personality Trait Items
Mean Std. Deviation
Corrected Item-Total Correlation
Cronbach’s Alpha if item is Deleted

29
Novelty (NV) Cronbach’s Alpha = .706 Mean = -1.94 Variance = 10.759 Std. Deviation = 3.280
Exploring the unknown.
.81 1.113 .491 .643
Meeting new people with similar values/interests.
-.47 1.180 .424 .686
Having new experiences.
1.23 .925 .561 .615
Gaining new perspectives on life.
.38 1.255 .519 .627
Escape (ES) Cronbach’s Alpha = .861 Mean = 4.88 Variance = 10.806 Std. Deviation = 3.287
Getting away from everyday psychological stress/pressure.
1.25 .967 .730 .813
Getting away from the usual demands of life.
1.25 .920 .737 .812
Getting away from everyday physical stress/pressure.
1.09 1.104 .724 .819
Being away from daily routine.
1.29 .911 .651 .845
Freedom (FR) Cronbach’s Alpha = .861 Mean = 4.88 Variance = 10.806 Std. Deviation = 3.287
Experiencing the feeling of being free.
1.10 1.010 .598 .660
Being obligated to no one.
.63 1.209 .583 .660
Being independent and free.
.89 1.057 .666 .620
Being away from the crowds of people.
.06 1.308 .363 .798
Relationship Strengthening (RL) Cronbach’s Alpha = .861 Mean = 4.88 Variance = 10.806 Std. Deviation = 3.287
Doing something within my family/friend(s).
1.00 1.109 .672 .650
Strengthening relationships with my family/friend(s).
.68 1.144 .699 .632
Being near considerate people.
.30 1.130 .312 .835
Doing things with my companion(s).
.87 1.087 .611 .684
Self-Development (SD) Cronbach’s Alpha = .861 Mean = 4.88 Variance = 10.806 Std. Deviation = 3.287
Developing my skills and abilities.
-.39 1.220 .591 .793
Working on my personal/spiritual values.
-.45 1.266 .632 .775
Develop my personal interests.
.36 1.169 .623 .779
Understanding more about myself.
-.11 1.288 .713 .734

30
Culture (CT) Cronbach’s Alpha = .861 Mean = 4.88 Variance = 10.806 Std. Deviation = 3.287
Experiencing different cultures.
.79 1.135 .751 .865
Learning about customs and traditions of other cultures.
.46 1.209 .778 .854
Meeting new people of another culture.
.20 1.253 .788 .851
Meeting the locals.
.01 1.210 .732 .872
Nature (NT) Cronbach’s Alpha = .861 Mean = 4.88 Variance = 10.806 Std. Deviation = 3.287
Viewing the natural scenery.
1.01 .965 .679 .908
Being close to nature.
.42 1.207 .841 .849
Getting a better appreciation of nature.
.37 1.186 .799 .866
Being harmonious with nature.
.15 1.230 .816 .860
4.4 Relation between Personality Traits and Travel Motives
4.4.1 Checking assumptions
Table 6 Assessing the assumption of no multicollinearity for travel motivation (p < 0.05, N = 1000)
Dependent variable Independent variable ß p (1/VIF) VIF Novelty R Square = .033 Sig. = .000 Durbin-Watson = 1.927
Extraversion .167 .000 .898 1.114 Emotional stability/ Neuroticism -.082 .012 .913 1.096
Escape R Square = .037 Sig. = .000 Durbin-Watson = 1.995
Agreeableness .099 .002 .958 1.044 Emotional stability/ Neuroticism -.163 .000 .913 1.096
Relationship R Square = .077 Sig. = .000 Durbin-Watson = 1.966
Extraversion .104 .001 .898 1.114 Agreeableness .228 .000 .958 1.044 Conscientiousness .067 .030 .980 1.020
Self-development R Square = .025 Sig. = .000 Durbin-Watson = 1.907
Extraversion .117 .000 .898 1.114 Emotional stability/ Neuroticism -.138 .000 .913 1.096
Culture R Square = .027 Sig. = .000 Durbin-Watson = 1.880
Extraversion .130 .000 .898 1.114 Agreeableness .074 .020 .958 1.044 Emotional stability/ Neuroticism -.069 .034 .913 1.096
ß standardized coefficient Beta, p probability value, (1/VIF) tolerance statistic, VIF variance inflation factor. Multicollinearity exists when there is a strong relationship between two or more predictors in a regression model. Multicollinearity poses a problem only for multiple regression because simple regression requires only one predictor. Perfect collinearity exists when at least one predictor is a perfect linear combination of the others. The average VIF is close to 1 and this confirms that collinearity is not a problem for this model. The tolerance values are well above 0.2. Tolerance below 0.2 indicates potential problem (Menard, 1995).

31
The Durbin-Watson test statistic can very between 0 and 4, with a value of 2 meaning that the residuals are uncorrelated. A value greater than 2 indicates a negative correlation between adjacent residuals, whereas a value below 2 indicates a positive correlation. The size of the Durbin-Watson statistic depends upon the number of personality traits (4) in the model and the number of respondents (1000). Values less than 1 or greater than 3 would cause for concern, which is not the case within this study. As shown in table 7 all Durbin-Watson values are around 2.
4.4.2 Multiple Linear Regression Analysis
In order to determine any significant relationship (at 5% level of significance) between the personality traits and travel motives, a multiple linear regression will be used. Table 7 Results of linear regression model for travel motives
Dependent variable Independent variable ß t p Novelty R Square = .033 Sig. = .000
(Constant) 10.637 .000 Extraversion .167 5.068 .000 Agreeableness .034 1.072 .284 Conscientiousness .043 1.365 .172 Emotional stability/ Neuroticism -.082 -2.509 .012
Escape R Square = .037 Sig. = .000
(Constant) 24.844 .000 Extraversion .029 .896 .370 Agreeableness .099 3.111 .002 Conscientiousness .025 .785 .433 Emotional stability/ Neuroticism -.163 -4.994 .000
Freedom R Square = .006 Sig. = .232
(Constant) 15.076 .000 Extraversion .047 1.397 .163 Agreeableness -.040 -1.229 .219 Conscientiousness .021 .646 .518 Emotional stability/ Neuroticism -.064 -1.937 .053
Relationship R Square = .077 Sig. = .000
(Constant) 10.379 .000 Extraversion .104 3.242 .001 Agreeableness .228 7.331 .000 Conscientiousness .067 2.169 .030 Emotional stability/ Neuroticism -.026 -.825 .410
Self-development R Square = .025 Sig. = .000
(Constant) -1.871 .062 Extraversion .117 3.548 .000 Agreeableness -.031 -.957 .339 Conscientiousness .052 1.629 .104 Emotional stability/ Neuroticism -.138 -4.215 .000
Culture R Square = .027 Sig. = .000
(Constant) 5.053 .000 Extraversion .130 3.936 .000 Agreeableness .074 2.323 .020 Conscientiousness .019 .606 .545 Emotional stability/ Neuroticism -.069 -2.121 .034
Nature R Square = .008 Sig. = .098
(Constant) 8.077 .000 Extraversion .054 1.628 .104 Agreeableness .036 1.105 .269 Conscientiousness .048 1.508 .132 Emotional stability/ Neuroticism .004 .130 .897
ß standardized coefficient Beta, p probability value, t t-statistic.

32
In Table 6 the description of the overall model is shown. Some of the personality traits are successfully predicting the travel motives. ‘Novelty’, ‘escape’, ‘relationship’, ‘self-development’ and ‘culture’ are significant, p < 0.05. The values of ‘freedom’ and ‘nature’ are non-significant and therefore not shown in table 6. More details of this variable are listed in the appendix. The value of R Square measures how much of the travel motives is explained by the personality trait. Within this research attention is drawn only to the personality trait with the R Square value of .05, which means that the personality trait is able to explain over 5.0% of variation within the travel motive. In this case only the travel motive ‘relationship’ has a R Square > .05, namely .077, which means that the personality traits explain 7.7% of the variation in the travel motive ‘relationship’. The ß, which is the standardized coefficient Beta, shows the relationship between the personality traits and the travel motive item and the degree the personality trait affects the travel motive if the effects of all other traits are held constant. In case the value is positive it is a positive relationship, whereas a negative coefficient highlights a negative relationship. To draw a conclusion on the statistic values of table 6: Extraversion
- The personality traits ‘extraversion’ (B = .088, p = .001), ‘agreeableness’ (B = .285, p = .000) and ‘conscientiousness’ (B = .067, p = .030) significantly predict whether you tend to value relationship strengthening as an important travel motive during your last holiday. The positive values on the standardized coefficient beta tells us that as the respondent tend to score higher on the personality trait, the importance of the travel motive relationship increases.
4.5 Relation between the travel motives and destination choice
4.5.1 Binary Logistic Regression Analysis
Table 7 Results of binary logistic regression model for destination choice based on travel motives
Constant Classification Table Predicted Observed (Constant)
Same Other Percentage Correct
Same holiday region as nationality
657 0 100.0
Other holiday region as nationality
297 0 .0
Overall Percentage 68.9 Variables in the Equation B SE B Wald df p Exp(B) Constant -2LL = 1183.569
-.794 .070 128.932 1 .000 .452
Variables not in the Equation
Score df p
Novelty 45.466 1 .000 Escape .334 1 .564 Freedom .074 1 .785 Relationship 2.463 1 .117 Self-development 26.065 1 .000 Culture 94.180 1 .000 Nature 4.644 1 .031 Overall Statistics 103.712 7 .000
B unstandardized regression coefficient, df Degrees of Freedom, p probability value, Exp(B) Exponentiation of the B Coefficient, SE B Coefficients Std. Error, Wald Wald Chi-Square statistic.

33
Of 1000 respondents only 954 respondents are included in the New_DC variable, whereof 657 respondents travelled within the same region and 297 travelled out of the nationality region. Therefor it is better to predict that all respondents travel within the same holiday region, because this results in a greater number of correct predictions. The output shows the prediction that all respondents travel within their nationality region, which results in 100% accuracy for the group that travels within their region, and 0% accuracy for those observed to travel out of their nationality region. Overall the model therefor correctly classifies 68.9% of the respondents. As shown in the table ‘novelty’, ‘self-development’, ‘culture’ and ‘nature’ are significantly predicting the outcome of the destination choice to be within or out of the nationality region. The log-likelihood represents the fit of the basic model, which is 1183.569. The value of the constant B is equal to -.794. The residual chi-square statistic is 103.712, which is significant with p =.000. The conclusion can be made that one or more of these variables significantly contribute in predicting the outcome. Table 8 Results of binary logistic regression model for destination choice based on ‘novelty’
Novelty Omnibus Tests of Model Coefficients
Chi-square
df p
Novelty -2LL = 1135.032 Cox & Snell R Square = .049 Nagelkerke R Square = .069
Step 1 48.220 1 .000 Block 48.220 1 .000 Model 48.220 1 .000
Classification Table Predicted Observed (Constant / Novelty)
Same Other Percentage Correct
Same holiday region as nationality
657 / 644 0 / 13 100.0 / 98.0
Other holiday region as nationality
297 / 288 0 / 9 .0 / 3.0
Overall Percentage 68.9 / 68.4 Variables in the Equation B SE B Wald df p Exp(B) Novelty .634 .096 43.325 1 .000 1.886 Constant -1.152 .095 147.599 1 .000 .316 95% C.I. for EXP(B) Lower 1.561 95% C.I. for EXP(B) Upper 2.278 Model if Term Removed -2LL Change
in -2LL df p of
change
Novelty -591.626 48.220 1 .000 -2LL Log-likelihood, B unstandardized regression coefficient, df Degrees of Freedom, p probability value, Exp(B) Exponentiation of the B Coefficient, SE B Coefficients Std. Error, Wald Wald Chi-Square statistic. When we are looking at ‘novelty’ the model remains significant. However, the variable is not contributing towards a higher correct percentage in predicting of the model, which is seen in the decrease of 68.9% to 68.4%. It is therefore not advisable to include this variable in the model. The same goes for ‘self-development’ and ‘nature’. In these cases, the model is not making a new prediction based on the added variable at all. Therefor the correct predicted percentage remains the same as in the basic model. For this reason, the travel motive variables ‘novelty’, ‘self-development’ and ‘nature’ are neglected from the model.

34
Table 9 Results of binary logistic regression model for destination choice based on ‘culture’
Culture Omnibus Tests of Model Coefficients
Chi-square
df p
Culture -2LL = 1080.717 Cox & Snell R Square = .102 Nagelkerke R Square = .143
Step 1 102.535 1 .000 Block 102.535 1 .000 Model 102.535 1 .000
Classification Table Predicted Observed (Constant / Culture)
Same Other Percentage Correct
Same holiday region as nationality
657 / 607 0 / 50 100.0 / 92.4
Other holiday region as nationality
297 / 235 0 / 62 .0 / 20.9
Overall Percentage 68.9 / 70.1 Variables in the Equation B SE B Wald df p Exp(B) Culture .755 .082 85.498 1 .000 2.128 Constant -1.181 .091 167.911 1 .000 .307 95% C.I. for EXP(B) Lower 1.813 95% C.I. for EXP(B) Upper 2.497 Model if Term Removed -2LL Change
in -2LL df p of
change
Culture -591.626 102.535 1 .000 -2LL Log-likelihood, B unstandardized regression coefficient, df Degrees of Freedom, p probability value, Exp(B) Exponentiation of the B Coefficient, SE B Coefficients Std. Error, Wald Wald Chi-Square statistic. The variable ‘culture’ is however significantly adding to the basic model by 1.2%, which is shown by the increase of correct predicted cases in Table 8. As shown in Table 8 the value 1 of 95% c.i. for EXP(B) is not covered by the outcome values between ‘lower’ and ‘upper’ therefore there is a relation between ‘culture’ as a travel motive and destination choice. According to Field (2009) large values of the log-likelihood statistic (-2LL) indicate poorly fitting statistical models. The -2LL when only the constant is included is 1183.569. When ‘culture’ is added to the model this value is reduced to 1080.717.
4.5.2 Checking assumptions
Table 10 Multicollinearity testing for the travel motives
Model Collinearity Statistics Tolerance VIF
Novelty .381 2.626 Self-development .512 1.952 Culture .501 1.997 Nature .804 1.244
Tolerance tolerance statistic, VIF variance inflation factor.
Dimension Eigenvalue Condition Index
(Constant) Novelty Self-development
Culture Nature
1 2.715 1.000 .02 .03 .02 .04 .05 2 1.186 1.513 .20 .00 .20 .01 .02 3 .575 2.173 .02 .03 .02 .15 .79 4 .342. 2.816 .26 .05 .36 .56 .15 5 .182 3.861 .50 .89 .40 .23 .00
Multicollinearity can affect the parameters of the regression model. As shown in table 9 the travel motive culture is significantly contributing in predicting the model, therefor the tolerance and VIF is tested by a

35
linear regression analysis for this travel motive. The tolerance of ‘culture’ is .501, which is high above the tolerance value .1, which would suggest a problem according to Menard (1995). A VIF higher than 10 would be a cause for concern, according to Myers (1990). The VIF of ‘culture’ is 1.997. It seems from these values that there is no issue of collinearity between the personality traits. Table Collinearity Diagnostics shows the eigenvalues of the scaled. These are fairly similar, which indicates the model to be unlikely changed in case of small changes in the travel motive variables. The final dimension of the condition index is 3.861, which indicates a healthy model, due to the fact that the variance in the eigenvalues and variance in the condition index is fairly small. In terms of collinearity, we are looking for travel motives that have high proportions on the same small eigenvalue, because this would indicate that the variance of their regression coefficients is dependent. This is slightly the case for ‘novelty’ (.89) and ‘self-development’ (.40). They both have the highest value associated with dimension/eigenvalue 5. Therefore, these variables are slightly dependent on each other. This would be another reason to omit the travel motives ‘novelty’ and ‘self-development’ from the model.
4.5.3 Multiple Linear Regression Analysis
In order to determine any significant relationship (at 5% level of significance) between travel motives and destination choice a multiple linear regression will be used. For each destination choice variable, a multiple linear regression analysis is performed. The results are summarized in table 11. Table 11 Multiple Linear Regression Analysis for travel motives and destination variables
Dependent variable Independent variable
ß t p
Environment Rural - Urban R Square = .186 Sig. = .000
(Constant) 4.610 .000 Novelty .180 3.868 .000 Escape .088 2.329 .020 Freedom -.171 -4.262 .000 Relationship .066 2.196 .028 Self-development .066 1.599 .110 Culture .110 2.704 .007 Nature -.408 -11.991 .000
Price Inexpensive - Expensive R Square = .020 Sig. = .005
(Constant) -1.672 .095 Novelty .150 2.935 .003 Escape .020 .491 .624 Freedom -.015 -.341 .733 Relationship .074 2.243 .025 Self-development -.126 -2.780 .006 Culture .016 .362 .718 Nature -.061 -1.626 .104
Safety Unsafe - Safe R Square = .040 Sig. = .000
(Constant) 19.510 .000 Novelty -.075 -1.482 .139 Escape .117 2.867 .004 Freedom .050 1.157 .248 Relationship .072 2.213 .027 Self-development -.070 -1.571 .117 Culture .006 .135 .892 Nature .048 1.305 .192
Distance Close - Far R Square = .077 Sig. = .000
(Constant) .920 .358 Novelty .117 2.344 .019 Escape .008 .208 .835 Freedom -.162 -3.777 .000 Relationship -.033 -1.014 .311 Self-development .064 1.467 .143 Culture .113 2.606 .009 Nature .072 1.972 .049

36
Convenience Inconvenient - Convenient R Square = .023 Sig. = .002
(Constant) 11.715 .000 Novelty -.055 -1.075 .283 Escape .031 .751 .453 Freedom .083 .1883 .060 Relationship .07 2.945 .003 Self-development -.020 -.452 .652 Culture .050 1.124 .261 Nature .009 .252 .801
Atmosphere Relaxed - Exciting R Square = .124 Sig. = .000
(Constant) 1.088 .277 Novelty .341 7.046 .000 Escape -.129 -3.307 .001 Freedom -.050 -1.211 .226 Relationship -.013 -.427 .669 Self-development -.005 -.126 .900 Culture .035 .840 .401 Nature -.050 -1.415 .157
Authenticity Inauthentic - Authentic R Square = .052 Sig. = .000
(Constant) 13.978 .000 Novelty -.010 -.202 .840 Escape .031 .764 .445 Freedom -.020 -.466 .642 Relationship .012 .356 .722 Self-development .088 1.974 .049 Culture .052 1.197 .232 Nature .149 4.057 .000
Climate Cold - Warm R Square = .007 Sig. = .428
(Constant) 4.841 .000 Novelty -.009 -.177 .859 Escape .057 1.381 .168 Freedom .022 .503 .615 Relationship -.002 -.070 .944 Self-development .001 .022 .983 Culture .057 1.265 .206 Nature -.029 -.776 .438
ß standardized coefficient Beta, p probability value, t t-statistic. In table 11 the description of the overall model is shown. Some of the travel motives are successfully predicting the aspects of the destination. ‘environment’, ‘distance’ and ‘atmosphere’ are significant, p < 0.05. and have a R Square value of > .05, which means that the travel motive explains over 5.0% of the variation in the destination variable. The R Square of ‘authenticity’ is .052, which means that the travel motives explain 5.2% of the variation in this destination variable. The second significant destination variable is ‘distance’ is .077, which means that the travel motives explain 7.7% of the variation in this destination variable. The third significant destination variable with an explained variable higher than .07 is ‘atmosphere’ and has a R Square value of .124, which is 12.4%. The last destination variable which is significantly explained by the model is; ‘environment’ with a R Square value of .186, which is 18.6%. This destination variable is best described by the travel motives. The destination choice variables with R Square < .05 are: ‘convenience’ .023, which is 2.3%, ‘price’ has a R Square value of .020, which is 2.0% and ‘safety’ has a R Square value of .040, which is 4.0%, The last destination variable was not significant, which was ‘climate’ with a R Square value of .007, which is almost 1.0% The ß, which is the standardized coefficient beta, shows the relationship between the travel motives and the destination choice variable and the degree the travel motive affects the destination variable if the effects of all other traits are held constant. In case the value is positive it is a positive relationship, whereas a negative coefficient highlights a negative relationship.

37
To draw a conclusion on the statistic values of table 12: Novelty
- The travel motive ‘novelty’ significantly predicts whether the respondent tend to go to a rural or urban environment during your last holiday, B = .298, p = .000. The standardized coefficient beta tells us that as ‘novelty’ tends to become an important travel motive the respondent tend to go to a more urban environment, rather than a rural environment.
- Another prediction this travel motive can make is whether you tend to go/value your last holiday as close or far, B = .172, p = .019. The standardized coefficient beta tells us that in case ‘novelty’ tends to increase as an important travel motive, the last holiday destination is valued as farther away.
- ‘Novelty’ also significantly predicts whether you tend to value the atmosphere on the last holiday as relaxed or exciting, B = .517, p = .000. The standardized coefficient beta tells us that as you value Novelty as a travel motive you tend to value the last holiday as exciting.
Escape
- The travel motive ‘escape’ significantly predicts whether you go to a rural or urban environment during your last holiday, B = .145, p = .020. The standardized coefficient beta tells us that as ‘escape’ tends to become an important travel motive the respondent tend to go to a more urban environment, rather than a rural environment.
- ‘Escape’ as a travel motive also significantly predicts whether you tend to value the atmosphere of the destination of your last holiday as relaxed or exciting, B = -.195, p = .001 The standardized coefficient beta tells us that you tend to value the destination as more relaxed when ‘escape’ as a travel motive is increasing in importance.
Freedom
- The travel motive ‘freedom’ significantly predicts whether you go to a rural or urban environment during your last holiday, B = -.268, p = .000. The standardized coefficient beta tells us that as ‘freedom’ tends to become an important travel motive the respondent tend to go to a more rural environment, rather than an urban environment.
- Another prediction this travel motive can make is whether you tend to go/value your last holiday as close or far, B = -.226, p = .000. The standardized coefficient beta tells us that in case ‘freedom’ tends to increase as an important travel motive, the last holiday destination is valued as being closer to home.
Relationship
- The travel motive ‘relationship’ significantly predicts whether you go to a rural or urban environment during your last holiday, B = .105, p = .028. The standardized coefficient beta tells us that as strengthening relationships tends to become an important travel motive the respondent tend to go to a more urban environment, rather than a rural environment.
Self-development
- The travel motive ‘self-development’ significantly predicts whether you tend to value your last holiday as inauthentic or authentic, B = .083, p = .049. The standardized coefficient beta tells us that as the respondent tend to value ‘self-development’ as an important travel motive, the respondent tends to value the last holiday as more authentic.
Culture
- The travel motive ‘culture’ significantly predicts whether you go to a rural or urban environment during your last holiday, B = .142, p = .007. The standardized coefficient beta tells us that as ‘culture’ tends to become an important travel motive the respondent tend to go to a more urban environment, rather than a rural environment.
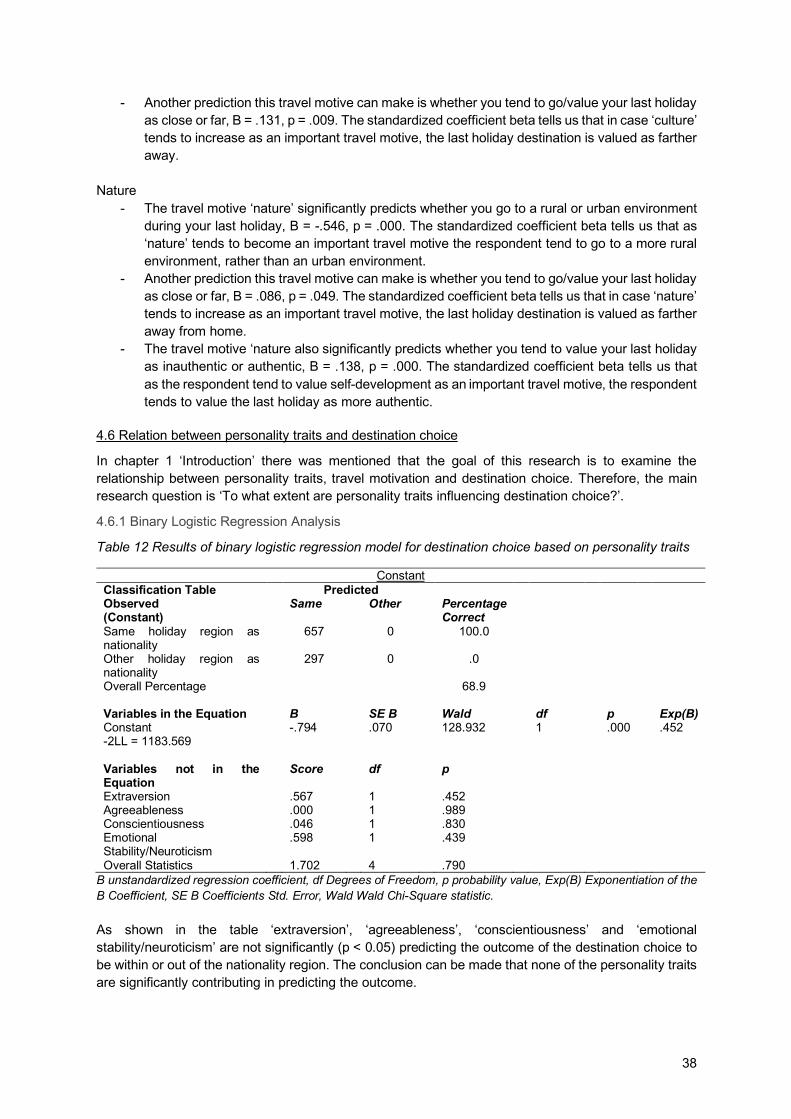
38
- Another prediction this travel motive can make is whether you tend to go/value your last holiday as close or far, B = .131, p = .009. The standardized coefficient beta tells us that in case ‘culture’ tends to increase as an important travel motive, the last holiday destination is valued as farther away.
Nature
- The travel motive ‘nature’ significantly predicts whether you go to a rural or urban environment during your last holiday, B = -.546, p = .000. The standardized coefficient beta tells us that as ‘nature’ tends to become an important travel motive the respondent tend to go to a more rural environment, rather than an urban environment.
- Another prediction this travel motive can make is whether you tend to go/value your last holiday as close or far, B = .086, p = .049. The standardized coefficient beta tells us that in case ‘nature’ tends to increase as an important travel motive, the last holiday destination is valued as farther away from home.
- The travel motive ‘nature also significantly predicts whether you tend to value your last holiday as inauthentic or authentic, B = .138, p = .000. The standardized coefficient beta tells us that as the respondent tend to value self-development as an important travel motive, the respondent tends to value the last holiday as more authentic.
4.6 Relation between personality traits and destination choice
In chapter 1 ‘Introduction’ there was mentioned that the goal of this research is to examine the relationship between personality traits, travel motivation and destination choice. Therefore, the main research question is ‘To what extent are personality traits influencing destination choice?’.
4.6.1 Binary Logistic Regression Analysis
Table 12 Results of binary logistic regression model for destination choice based on personality traits
Constant Classification Table Predicted Observed (Constant)
Same Other Percentage Correct
Same holiday region as nationality
657 0 100.0
Other holiday region as nationality
297 0 .0
Overall Percentage 68.9 Variables in the Equation B SE B Wald df p Exp(B) Constant -2LL = 1183.569
-.794 .070 128.932 1 .000 .452
Variables not in the Equation
Score df p
Extraversion .567 1 .452 Agreeableness .000 1 .989 Conscientiousness .046 1 .830 Emotional Stability/Neuroticism
.598 1 .439
Overall Statistics 1.702 4 .790 B unstandardized regression coefficient, df Degrees of Freedom, p probability value, Exp(B) Exponentiation of the B Coefficient, SE B Coefficients Std. Error, Wald Wald Chi-Square statistic. As shown in the table ‘extraversion’, ‘agreeableness’, ‘conscientiousness’ and ‘emotional stability/neuroticism’ are not significantly (p < 0.05) predicting the outcome of the destination choice to be within or out of the nationality region. The conclusion can be made that none of the personality traits are significantly contributing in predicting the outcome.

39
4.6.2 Checking assumptions
Table 13 Multicollinearity testing for the personality traits
Model Collinearity Statistics Tolerance VIF
Extraversion .898 1.113 Agreeableness .955 1.047 Conscientiousness .979 1.021 Emotional Stability/Neuroticism
.917 1.091
Tolerance tolerance statistic, VIF variance inflation factor.
Dimension Eigenvalue Condition Index
(Constant) Extraversion Agreeableness Conscientiousness Emotional Stability/Neuroticism
1 1.966 1.000 .07 .04 .07 .02 .02 2 1.249 1.255 .00 .17 .01 .21 .30 3 .978 1.495 .01 .24 .04 .65 .01 4 .720 1.653 .01 .42 .00 .12 .66 5 .185 3.258 .91 .12 .88 .00 .01
4.6.3 Multiple Linear Regression Analysis
In order to determine any significant relationship (at 5.0% level of significance) between the determinants; personality traits and destination choice a multiple linear regression will be used. For each destination choice variable, a multiple linear regression analysis is performed. The results are summarized in Table 15. Table 14 Multiple Linear Regression Analysis for personality traits and destination variables
Dependent variable Independent variable
ß t p
Environment Rural - Urban R Square = .012 Sig. = .018
(Constant) 2.727 .006 Extraversion -.086 -2.589 .010 Agreeableness .074 2.309 .021 Conscientiousness -.014 -.445 .656 Emotional
Stability/Neuroticism -.015 -.466 .642
Price Inexpensive - Expensive R Square = .005 Sig. = .284
(Constant) .496 .620 Extraversion .004 .109 .913 Agreeableness .014 .429 .668 Conscientiousness .066 2.078 .038 Emotional
Stability/Neuroticism .011 .332 .740
Safety Unsafe - Safe R Square = .009 Sig. = .069
(Constant) 26.473 .000 Extraversion -.059 -1.764 .078 Agreeableness .063 1.941 .053 Conscientiousness -.018 -.558 .577 Emotional
Stability/Neuroticism .072 2.166 .031
Distance Close - Far R Square = .001 Sig. =.967
(Constant) 1.457 .145 Extraversion .016 .467 .641 Agreeableness -.018 -.562 .574 Conscientiousness .004 .110 .912 Emotional
Stability/Neuroticism .006 .168 .867
Convenience Inconvenient - Convenient R Square = .017 Sig. = .002
(Constant) 15.488 .000 Extraversion .024 .720 .472 Agreeableness .085 2.633 .009 Conscientiousness .070 2.204 .028

40
Emotional Stability/Neuroticism
.048 1.468 .142
Atmosphere Relaxed - Exciting R Square = .007 Sig. =.159
(Constant) 1.334 .182 Extraversion .081 2.440 .015 Agreeableness -.031 -.953 .341 Conscientiousness .020 .623 .533 Emotional
Stability/Neuroticism -.022 -.662 .508
Authenticity Inauthentic - Authentic R Square = .010 Sig. = .050
(Constant) 18.031 .000 Extraversion .010 .292 .770 Agreeableness .010 .319 .749 Conscientiousness .057 1.794 .073 Emotional
Stability/Neuroticism -.087 -2.638 .008
Climate Cold - Warm R Square =.009 Sig. =.072
(Constant) 8.241 .000 Extraversion .096 2.879 .004 Agreeableness -.005 -.153 .878 Conscientiousness .006 .190 .849 Emotional
Stability/Neuroticism -.036 -1.075 .283
ß standardized coefficient Beta, p probability value, t t-statistic. The p-values of the destination choice variables ‘authenticity’ (.050), ‘convenience’ (.002) and ‘environment’ (.018) are significant; p < .05, which indicates that the model is able to predict the effect of personality traits on these variables. The R Square value of ‘authenticity’ is .010, which means that the personality traits explain exactly 1.0% of the variation in this destination variable. The R Square of the second significant destination variable ‘convenience’ is .017, which means that the personality traits almost explain 2% of the variation in this destination variable. The last significant destination variable is ‘environment’ with a R Square value of .012, which is 1.2%. The ß, which is the standardized coefficient Beta, shows the relationship between the personality traits and the destination choice variable and the degree the personality traits affect the destination variable if the effects of all other traits are held constant. In case the value is positive it is a positive relationship, whereas a negative coefficient highlights a negative relationship. To draw a conclusion on the statistic values of table 15: Extraversion
- The personality trait ‘extraversion’ significantly predicts whether you went to a rural or urban environment during your last holiday, B = -.115, p = .010. The standardized coefficient beta tells us that a tendency to be more extraverted leads one to go to a more rural environment, rather than an urban environment.
Agreeableness
- The personality trait ‘agreeableness’ significantly predicts whether you tend to go to a rural or urban environment during your last holiday, B = .147, p = .021. The standardized coefficient beta tells us that as the respondent tend to be more agreeable the respondent tends to go to a more urban environment, rather than a rural environment.
- ‘agreeableness’ as a personality trait also significantly predicts whether you tend to value the destination of your last holiday as inconvenient or convenient, B = .116, p = .009 The standardized coefficient beta tells us that you tend to value the destination as more convenient when you tend to be more agreeable.

41
Conscientiousness
- ‘Conscientiousness’ as a personality trait significantly predicts whether you tend to value the destination of your last holiday as inconvenient or convenient, B = .078, p = .028 The standardized coefficient beta tells us that you tend to value the destination as more convenient when you tend to be more conscientious.
Emotional Stability/Neuroticism
- The prediction this personality trait can make is the level in which you tend to value your last holiday destination as inauthentic or authentic, B = -.093, p = .008. The standardized coefficient beta tells us that in case you tend to be more emotional stable, the last holiday destination is valued as less authentic.

42
5.0 Discussion
As previously established Bahar & Kozak (2007) and Sirgy & Su (2000) stated it was necessary to go beyond the theoretical approaches because this has been lacking in this field of study. Examining empirically the influence of personality traits and travel motives on destination choice has helped to better understand the destination choice process. This research has examined the relationship between personality traits, travel motives and destination choice. The main research question was to what extent destination choice is influenced by the personality traits. The answer on this question is built on the relationship between personality traits and tourism motives, and the relationship between travel motives and destination choice. To understand the positive and negative evaluative factors which influence travel motives and destination choices of tourists it was necessary to understand how individual characteristics of a person interact with characteristics of the situation (Van Vuuren & Slabbert, 2011) (March & Woodside, 2005) (Holloway, 2004) (Laws, 1995). For this reason, personality traits were included in this research as an antecedent in travel motives and destination choice, which led to a discovering of the relationship between personality traits and travel motives. The discovered relationships between personality and motives, has contributed to closing the void of research related to the connection between these aspects (Naquin and Holton, 2002). The aim was to grasp the relation between these major concepts, by combining them into one model, according to the demand for fundamental empirical research. By constructing this model, we are able to predict travel motives based on personality. This model has also explored the supposed important role of the knowledge of people’s travel motives in relation to their destination selection as mentioned by Jang & Cai (2002). Furthermore, through the identification of push factors by Dwyer, Mellor, Livaic, Edwards, & Kim (2004), a relationship between travel motives and destination choice was suggested. The results of this research are consistent with this suggestion. When having a look into the concepts that each consists of multiple variables within this study the expected- and in this case shown relations are small, due to the size and abstraction of these three concepts. The model shows that 5% of the variation in destination choices are explained by the travel motives measured in this research. Um & Crompton (1990) described that internal inputs, which include travel motives, are a part of the destination choice process. The results of this study are consistent with that assertion, in that travel motives influence the destination choice. In research on travel motives by Klenosky (2002) it was asserted that travel motives may differ per individual. This research finds empirical evidence to support a relationship between personality traits and travel motives. This study provides evidence to substantiate the suggestion by Klenosky. Mansfield (1992) states that travel motivation is the trigger and holds a crucial role in the decision-making process. The most compelling lesson that this study has taught is, however, that while these personality traits and travel motives are relevant factors, we must establish that these are not the dominant factors in destination choice. Therefor its recommended to pursue further research into a more elaborate selection of travel motives. Based on this research however, it is expected that a different variable has a more profound effect. This study does not support labelling travel motives as critical in understanding destination choice.
5.1 Recommendations
Based on the finding that two of the five relationships between personality traits and destination choice are explained by the addition of the travel motives to the conceptual model, I would recommend adding different conceptual steps between the personality traits and destination choice to further understand the relationship between personality and destination choice. By adding a new conceptual step, the significance of the relationship between a personality trait and a destination choice can be further

43
explored and explained. An example of a new conceptual step can be the addition of behaviour/ habits. The habituation of travelling could be of influence on the destination choice. The travel motives of travel companions could be another interesting addition to the conceptual model, which may influence the destination choice and could give additional information about the formation of the destination choice. Decision-making is not a process one takes on its own. Therefore, the inclusion of travel motives of travel companions is a recommendation for future research. As concluded in this research there is a need for empirical research that includes the internal inputs of Um & Crompton (1990). Woodside & Lysonski (1989) incorporated attitudes in their research. Within this research motives are included in the examination of destination choice. For future research it is recommended to include the two remaining internal inputs, personal characteristics and values, in the travel destination selection process as mentioned in the theoretical model of Um & Crompton (1990).
5.1.1 Practical applicability
A relationship between personality, travel motives and destination choice has been established in this research. Crouch (1994) states that understanding the factors influencing destination choice is crucial for management of tourism businesses. A practical consequence however is that it is not advisable for tourism stakeholders to put a lot of time, money and effort into motivational research, as it is not the dominant factor in destination choice. It remains however possible to apply the knowledge of this research if desired by tourism marketing managers. Tourism marketers could focus on people who have similar motives or a similar personality. When these groups can be identified, they can be specifically targeted for a campaign, which would yield higher than average returns. Identifying groups of tourists could be achieved, for example, by asking tourists about their travel motives and personality traits.
5.2 Limitations
The personality trait ‘intellect/openness’ appeared to be unreliable within this study and show an uneven distribution on the Likert-scale. This personality trait is therefore subtracted from the analysis. The socio-demographics may be the explanation for this, as nearly half of the respondents are Bachelor, Master and PhD-students. It is recommended to take this into account and aim for an even distribution in the sample size in future research. This research uses a shortened version of the personality trait questionnaire by McCrae & John (1992), to increase respondents by reducing the effort required to fill out the survey. Certain risks are involved in the use of short versions of questionnaires. The reduction of the number of items can result in a reliability of scales (McCrae & Costa, 2007). The risk of error in conclusions related to relationships between personality traits and other constructs measured might also be increased. The relationships between these traits and other variables might be difficult to discover, due to the fact that the items selected in the shortened version of the questionnaire, (IPIP-BFM-20), represent these traits only to a limited extent (Credé, Harms, Niehorster, & Gaye-Valentine, 2012). Another limitation of this research is the usage of a five-point scale, and the assumption that guests can evaluate their visit accurately in the questionnaire. Validity might be reduced in the sense that nuance is lacking, which a seven-point or ten-point might be able to reveal. A seven-point scale could diversify the answers of the questions and ultimately improve the quality of the answers. Therefore, in a future research a seven or more-point scale should be tested. However, having a five-point Likert-scale also increases the validity of the questionnaire, due to the fact that respondents are able to finish the questionnaire more quickly. improves the speed in which respondents can answer which leads to more respondents. Nationality is not necessarily the same as country of residence. The survey used in this research asked respondents about their nationality instead of their country of residence. Because this is used to

44
determine whether or not someone is traveling in- or outside of their country region, it may provide incorrect results for those who have relocated to a different part of the world. This effect was unforeseen in the design of the study. For future research, it would be recommended to gather both nationality and country of residence from a respondent. The timing of the survey period was limited by the time planned for writing this thesis. This research and the conducting of the survey took place in the first half of 2019. The survey inquired about the last trip a respondent took. Because many people in the northern hemisphere make a short trip in the winter or spring and shorter trips can result in trips closer to home, this means that there may be an underrepresentation of respondents going on holiday outside of their country region. It would be recommended to further explore this effect by gathering respondents throughout the year.

45
6.0 Conclusion
The results indicate that there is a relationship between personality and destination choice. The personality traits explain 1% of the variation in the destination variables ‘Environment’, ‘Convenience’ and ‘Authenticity’, by five significantly predicted relations. The prediction whether the respondents tend to go to a rural or urban environment can be made based on the level of extraversion and agreeableness of the respondent. A tendency to be more extraverted leads one to go to a more rural environment, rather than an urban environment. The tendency to be more agreeable leads one to go to a more urban environment, rather than a rural environment. The level of convenience of the destination can be significantly predicted by the level of agreeableness and conscientiousness. The destination is valued as more convenient when the respondent tends to be more agreeable or conscientious. The authenticity ratio is significantly predicted by the level of emotional stability. The tendency to be more emotional stable leads to a destination valued as less authentic.
The two relations between the personality traits, extraversion and agreeableness, and environment can be traced by the significantly predicted relations between personality traits and travel motives and travel motives and destination choice. Namely, a significant relation with 5% explained variation in the travel motives is found. The data does not support the hypothesis that a link between a personality trait to a travel motive and a travel motive and a destination choice can be deduced between personality traits and destination choice. In the conceptual model, it was hypothesised that travel motives would be a conceptual stepping stone to predict a destination choice, based on personality traits. The results indicate that this is only the case in two of the five found relationships between personality traits and destination choice. In the other cases, this link is not substantiated by the data. Because the findings show a limited predictive relationship between personality traits and destination choice it is clear that this is not a dominant factor. This was expected, because studies show that there are many determinants that influence destination choice. To further understand and predict destination choice, there is a need for future research and a new conceptual model would have to be constructed that includes more than the personality traits and travel motives.

46
Bibliography
Ahmed, Z. U. (1991). Marketing your community: Correcting a negative image. The Cornell H.R.A. Andreu, L., Kozak, M., Avci, N., & Cifter, N. (2005). Market Segmentation by Motivations to Travel.
Journal of Travel & Tourism Marketing. Ankomah, P. K., Crompton, J. L., & Baker, D. (1996). Influence of Cognitive Distance in Vacation
Choice. Bahar, O., & Kozak, M. (2007). Advancing Destination Competitiveness Research. Journal of Travel &
Tourism Marketing. Baloglu, S. (2001). Image variations of Turkey by familiarity index: Informational and experiential
dimensions. Tourism Management. Barrick, M. R., & Mount, M. K. (1991). The Big Five personality dimensions and job performance: A
meta-analysis. Personnel Psychology. Barrick, M. R., Mount, M. K., & Judge, T. (2001). Personality and performance at the beginning of the
new millennium: What do we know and where do we go next? International Journal of Selection and Assessment.
Beaulieu, J. T., & Schreyer, R. (1985). Choices of wilderness environments-differences between real and hypothetical choice situations. In G. H. Stankey & S. F. McCool (Com- pilers), Proceedings-symposium on recreation choice behavior (General Technical Report INT- 184, pp. 38-45). Ogden, UT: USDA Forest Service. lntermountain Research Station.
Beerli, A., & Martin, J. D. (2004). Tourists’ characteristics and the perceived image of tourist destinations: a quantitative analysis—a case study of Lanzarote, Spain. Tourism Management.
Beerli, A., Meneses, G. D., & Gil, S. M. (2007). Self-congruity and Destination Choice. Annals of Tourism Research.
Berry, W. D., & Feldman, S. (1985). Multiple regression in practice.Sage University Paper series on Quantitative Applications in Social Sciences. Beverly Hills, CA: Sagee.
Block, J. (1995). A contrarian view of the five-factor approach to personality description. Psychological Bulletin.
Block, J. (2010). The five factor framing of personality and beyond: some ruminations. Psychological Inquiry.
Briggs, S. R. (1992). Assessing the Five-Factor Model of Personality Description. Journal of Personality. Buss, D. M., & Larsen, R. J. (2010). Personality Psychology: Domains of Knowledge about Human
Nature. New York: McGraw-Hill. Carver, C. (2004). Self-regulation of action and affect. In R. Baumeister & K. Vohs (Eds.), Handbook of
self-regulation: Research, theory and applications. New York: Guilford Press. Chang, J. C. (2007). Travel Motivation of Package Tour Travelers. Original Scientific Paper. Colquitt, J., LePine, J., & Noe, R. (2000). Toward an integrative theory of training motivation: A meta-
analytic path analysis of 20 years of re- search. Journal of Applied Psychology. Cooper, A., Corr, P. J., & Smillie, L. D. (2010). A confirmatory factor analysis of the MiniIPIP five factor
model of personality. Personality and Individual Differences. Cooper, C., & Hall, M. (2008). Contemporary Tourism: An International Approach. London: Butterworth-
Heinemann. Correia, A., Oom Do Valle, P., & Moço, C. (2006). Why People Travel to Exotic Places. Tourism and
Hospitality. International Journal of Culture. Cortina, J. M. (1993). What is coefficient alpha? An examination of theory and applications. Journal of
Applied Psychology. Credé, M., Harms, P. D., Niehorster, S., & Gaye-Valentine, A. (2012). An evaluation of the
consequences of using short mea- sures of the Big Five personality traits. Journal of Personality and Social Psychology.
Crompton, J. (1992). Structure of Vacation Destination Choice Sets. Annals of Tourism Research. Crompton, J. L. (1979). Motivations for pleasure vacation. Ann Tourism Res. Crouch, G. (1994). The Study of International Tourism Demand: A Survey of Practice. Journal of Travel
Research.

47
Dann, G. M. (1977). Anomie, Ego-Enhancement and Tourism. Annals of Tourism Research. Dann, G. M. (1981). Tourist Motivation: An Appraisal. Annals of Tourism Research. Decrop, A. (1999). Personal Aspects of Vacationers' Decision Making Process: An Interpretivist
Approach. Journal of Travel and Tourism Marketing. Decrop, A. (2006). Vacation Decision-Making. Wallingford: CABI Publishing. Decrop, A. (2010). Destination choice sets: an inductive longitudinal approach. Annals of Tourism
Research. Donnellan, M. B., Oswald, F. L., Baird, B. M., & Lucas, R. E. (2006). The mini-IPIP scales: Tiny-yet-
effective measures of the Big Five factors of personality. Psychological Assessment. Driscoll, A., Lawson, R., & Niven, B. (1994). Measuring tourists' destination perceptions. Annals of
Tourism Research, 21, 499-510. Dwyer, L., Forsyth, P., & Rao, P. (2002). Destination price competitiveness: Exchange rate changes
versus domestic inflation. Journal of Travel Research, 40, 328-336. Dwyer, L., Mellor, R., Livaic, Z., Edwards, D., & Kim, C. (2004). Attributes of destination copetitiveness:
a factor analysis. Tourism Analysis. Engel, J. F., Kollat, D. T., & Blackwell, R. D. (1973). Consumer behavior. New York: Holt, Rinehart and
Winston. Enright, M. J., & Newton, J. (2004). Tourism destination competitiveness: A quantitative approach.
Tourism Management, 25, 777-778. Field, A. P. (2009). Discovering statistics with SPSS. London: Sage. Fischbach, A., & Moosbrugger, H. (2007). The German EPP-D: How to shorten and improve the
reliability and validity of Eysenck’s Personality Profiler (EPP). European Journal of Psychological Assessment.
Fodness, D. (1994). Measuring tourist motivation. Ann Tourism Res. Gee, C. Y., Choy, D. L., & Makens, J. C. (1984). The Travel Industry. Westport: AVI. George, R. (2004). Marketing South African Tourism and Hospitality. Oxford: Oxford University Press. Goodrich, J. N. (1977). Differences in perceived similarity of tourismregions: A spatial analysis. Journal
of Travel Research. Gosling, S. D., Rentfrow, P. J., & Swann, W. B. (2003). A very brief measure of the Big-Five personality
domains. Journal of Research in Personality. Gurven, M., Von Rueden, C., Massenkoff, M., Kaplan, H., & Lero Vie, M. (2013). How universal is the
Big Five? Testing the Five-Factor Model of personality variation among forager–farmers in the Bolivian Amazon. Journal of Personality and Social Psychology.
Haahti, A., & Yavas, U. (1983). Tourists Perceptions of Finland and Selected European Countries as Travel Destinations. European Journal of Marketing.
Heath, E., & Wall, G. .. (1992). Marketing tourism destinations: A strategic planning approach. Canada: Wiley.
Herzberg, P. Y., & Brähler, E. (2006). Assessing the Big-Five Personality Domains via Short Forms: A Cautionary Note and a Proposal. European Journal of Psychological Assessment.
Holloway, J. C. (2004). Marketing for Tourism. New York: Prentice Hall. Howard, J. A., & Sheth, J. N. (1969). The Theory of Buyer Behavior. New York: Wiley. Hsu, C. H., Wolfe, K. C., & Kang, S. K. (2004). Image assessment for a destination with limited
comparative advantages. Tourism Management, 25 , 121-126. Ilies, R. (2002). Relationship of Personality to Performance Motivation: A Meta-Analytic Review. Journal
of Applied Psychology. ISO. (2013). International Standard ISO3166-1. Geneva, Switzerland: ISO. Retrieved from
https://meta.wikimedia.org/wiki/List_of_countries_by_regional_classification Iso-Ahola, S. E. (1982). Toward a social psychological theory of tourism motivation: a rejoinder. Ann
Tourism Res. Jang, S., & Cai, L. A. (2002). Travel motivations and destination choice: A study of British outbound
market. Journal of Travel & Tourism Marketing.

48
Jarvis, C. B., MacKenzie, S. B., & Podsakoff, P. M. (2003). A critical review of construct indicators and measurement model misspecification in marketing and consumer research. Journal of Consumer Research.
John, O. P., & Srivastava, S. (1999). The big five trait taxonomy: History, measurement, and theoretical perspectives. In L. A. Pervin, & O. P. John (Eds.), Handbook of personality: Theory and research. New York: Guilford Press.
Judge, T. A., & Ilies, R. (2002). Relationship of personality to performance motivation: A meta-analytic review. Journal of Applied Psychology.
Karl, M., Reintinger, C., & Schmude, J. (2015). Reject or select: Mapping destination choice. University of Munich, Department of Geography. Munich, Germany: Annals of Tourism Research.
Klenosky, D. B. (2002). The "Pull" of Tourism Destinations: A Means-End Investigation. Journal of travel research.
Klenosky, D., Gengler, C. E., & Mulvey, M. S. (1993). Understanding the Factors Influencing Ski Destination Choice: A Means-End Analytic Approach. Journal of Leisure Research.
Koppelman, F. S. (1980). Consumer Analysis of Travel Choice Behavior. Journal of Advanced Transportation.
Kozak, M. (2002). Comparative analysis of tourist motivations by nationality and destinations. Tourism Management.
Kozak, M. (2004). Destination benchmarking: Concepts, practices and operations. Wallingford: CABI. Kozak, M., & Rimmington, M. (1999). Measuring tourist destination competitiveness: coneptual
considerations and empirical findings. Hospitality Management. Lang, F. R., John, D., Lüdtke, O., Schupp, J., & Wagner, G. G. (2011). Short assessment of the Big
Five: robust across survey methods except telephone interviewing. Springer-Verlag. Laverdière, O., Morin, A. J., & St-Hilaire, F. (2013). Factor structure and measurement invariance of a
short measure of the Big Five personality traits. Personality and Individual Differences. Laws, E. (1995). Tourist Destination Management: Issues, Analysis and Policies. London: Routledge. MacCallum, R. C., Widaman, K. F., Zhang, S., & Hong, S. (1999). Sample size in factor analysis.
Psychological Methods. Major, D. A., Turner, J. E., & Fletcher, T. D. (2006). Linking proactive personality and the Big Five to
motivation to learn and development activity. Journal of Applied Psychology. Mansfeld, Y. (1992). From motivation to actual travel. Annals of Tourism Research. March, R. G., & Woodside, A. G. (2005). Tourism Behavior: Travelers' Decision and Actions.
Cambridge: CABI Publishing. Marshall, M. (1996). Sampling for qualitative research. Family Practice. McCrae, R. R., & Costa, P. T. (1989). The structure of interpersonal traits: Wiggin's circumplex and the
five-factor model. Journal of Personality & Social Psychology. McCrae, R. R., & Costa, P. T. (2007). Brief versions of the NEO–PI–3. Journal of Individual Differences. McCrae, R. R., & John, O. P. (1992). An introduction to the five-factor model and its applications. Journal
of Personality. Menard, S. (2000). Coefficients of determination for multiple logistic regression analysis. The American
Statistician. Mount, M. K., Barrick, M. R., & Strauss, J. P. (1994). Validity of observer ratings of the Big Five
personality factors. Journal of Applied Psychology. Mowforth, M., & Munt, I. (2003). Tourism and Sustainability: New Tourism in the Third World. Routledge. Murray, E. J. (1964). Motivation and Emotion. Englewood Cliffs: Prentice Hal. Murray, H. A. (1938). Explorations in personality. Oxford, Engeland: Oxford Univ. Press. Naquin, S. S., & Holton, E. F. (2002). The effects of personality, affectivity, and work commitment on
motivation to improve work through learning. Human Resource Development Quarterly. Ninemeier, J. D., & Perdue, J. (2008). Discovering Hospitality and Tourism: The World's Greatest
Industry. Pearson. Oppermann, M. (1999). Predicting destinations choice - a discussion of destination loyalty. Journal of
Vacation Marketing.

49
Papatheodorou, A. (2002). Exploring competitiveness in Mediterranean resorts. Tourism Economics, 8, 133-150.
Papatheodorou, A. (2006). Managing Tourism Destinations. Northampton: Edward Elgar Publishers. Pearce, P. L. (1993). Fundamentals of Tourist Motivation. In D. Pearce, & R. Butler (Eds.). Tourism
Research: Critiques and Challenges. London: Routledge and Kegan Paul. Pearce, P. L., & Lee, U. (2005). Developing the Travel Career Approach to Tourist Motivation. Journal
of Travel Research. Pike, S. (2008). Destination Marketing: An Integral MArketing Communication Approach. Amsterdam:
Butterworth-Heinemann. Polit, D., & Beck, T. B. (2010). Generalization in quantitative and qualitative research: Myths and
strategies. International Journal of Nursing Studies. Porter, M. (1980). Competitive Strategy: Techniques for Analysing Industries and Competitors. New
York: Free Press. Prayag, G., & Ryan, C. (2011). The relationship between the 'push' and 'pull' factors of a tourist
destination: the role of nationality - an analytical qualitative research approach. : Taylor & Francis.
Ritchie, J. R., & Crouch, G. I. (2003). The Competitive Destination: A Sustainable Tourism Perspective. Oxon, UK: CABI Publishing.
Roberts, B., & DelVecchio, W. (2000). The Rank-Order Consistency of Personality Traits from Childhood to Old Age: A Quantitative Review of Longitudinal Studies. Psychological bulletin.
Romero, E., Villar, P., Gómez-Fraquela, J. A., & López-Romero, L. (2012). Measuring personality traïts with ultra-short scales: A study of the Ten Item-Personality Inventory (TIPI) in a Spanish sample. Personality and Individual Differences.
Saito, C. S., & Strehlau, V. I. (2018). Tourist destination choice: A bibliometric study. Internext. Saucier, G., & Goldberg, L. (1996). The language of personality: lexical perspectives on the five-factor
model. In: Wiggins, J.S. (Ed.), The Five-Factor Model of Personality. Theoretical Perspectives. New York, London: The Guilford Press.
Saucier, G., & Goldberg, L. R. (1998). What is beyond the Big Five? Journal of Personality. Seddighi, H. R., & Theocharous, A. L. (2002). A model of tourism destination choice: a theoretical and
empirical analysis. Tourism Management. Sirgy, J., & Su, C. (2000). Destination Image,Self-Congruity, and Travel Behavior:Toward an Integrative
Model. Journal of Travel Research. Smallman, C., & Moore, K. (2010). Process Studies of Tourists’ Decision-Making. Annals of Tourism
Research. Spector, P. E. (2006). Method variance in organizational research: truth or urban legend? Organ. Res.
Methods. Tabachnick, B. G., & Fidell, L. S. (1996). Chapter 13: Principal Components and Factor Analysis. In C.
Woods (Ed.) Using Multivariate Statistics. New York: Harper Collins College Publishers. Thalmayer, A. G., Saucier, G., & Eigenhuis, A. (2011). Comparative validity of brief to medium-length
Big Five and Big Six personality questionnaires. Psychological Assessment. Tikkanen, I. (2007). Maslow's Hierarchy and Food Tourism in Finland: Five Cases. British Food Journal. Topolewska, E., Skimina, E., Strus, W., & Rowinski, T. (2014). The Short IPIP-BFM-20 Questionnaire
for measuring the Big Five. Annals of Psychology. Um, S., & Crompton, J. L. (1990). Attitude determinants in tourism destination choice. Annals of Tourism
Research, 432-448. Um, S., & Crompton, J. L. (1992). The Roles of Perceived Inhibitors and Facilitators in Pleasure Travel
Destination Decisions. Journal of Travel Research. UNWTO, U. N. (2002). Recommendations on tourism statistics. New York: United Nations. Van Vuuren, C., & Slabbert, E. (2011). Travel Motivations and Behaviour of Tourists to a South African
Resort. Algarve: International Conference on Tourism& Management Studies. Vaske, J. (2008). Survey Research and Analysis: Applications in Parks, Recreation and Human
Dimensions. State College, Pennsylvania: Venture Publishing.

50
Venkatesh, U. (2006). Leisure: Meaning and Impact On Leisure Travel Behavior. Journal of Services Research.
Vermeir, D. A. (2014). Het betrouwbaar en valide meten van persoonlijkheid bij sociaal epidemiologisch onderzoek. Gent: Universiteit Gent.
Weber, M. (1968). Basic Sociological Terms. Economy and Society. University of California Press. Witt, S. F., & Witt, C. A. (1995). Forecasting tourism demand: A review of empirical research.
International Journal of Forecasting. Woodside, A. G., & Lysonski, S. (1989). A General Model of Traveler Destination Choice. Journal of
Travel Research, 8-14. Woodside, A. G., & Sherrell, D. (1977). Traveler Evoked, Inept, and Inert Sets of Vacation Destinations.
Journal of Travel Research. Woodside, A., Caldwell, N., & Albers-Miller, D. (2004). Broadening the Study of Tourism: Introduction
to the Special Issue on the Consumer Psychology of Travel/Tourism Behvaior. Journal of Travel and Tourism Marketing.
Yoon, Y. (2002). Development of a structural model for tourism destination competitiveness from stakeholders' perspectives. The Virginia Polytechnic Institute and State University, Virginia: Unpublished doctoral dissertation.

51
Appendix 1 Questionnaire
Destination Choice
Questions about your last holiday are listed below. In this research holiday is defined as a trip of at least 3 days from home with leisure purposes as an important component.
What was the country of your last holiday?
Environment (EN) How would you qualify the destination of your last holiday on the following scale? Please tick the answer that best applies to your perception. (5-point Likert-Scale)
Rural Urban
Price (PR) How would you qualify the destination of your last holiday on the following scale? Please tick the answer that best applies to your perception. (5-point Likert-Scale)
Inexpensive Expensive
Safety (SF) How would you qualify the destination of your last holiday on the following scale? Please tick the answer that best applies to your perception. (5-point Likert-Scale)
Unsafe Safe
Distance (DS) How would you qualify the destination of your last holiday on the following scale? Please tick the answer that best applies to your perception. (5-point Likert-Scale)
Close Far
Convenience (CV) How would you qualify the destination of your last holiday on the following scale? Please tick the answer that best applies to your perception. (5-point Likert-Scale)
Inconvenient Convenient
Atmosphere (AT) How would you qualify the destination of your last holiday on the following scale? Please tick the answer that best applies to your perception. (5-point Likert-Scale)
Relaxed Exciting
Authenticity (AU) How would you qualify the destination of your last holiday on the following scale? Please tick the answer that best applies to your perception. (5-point Likert-Scale)
Inauthentic Authentic
Climate (CL) How would you qualify the destination of your last holiday on the following scale? Please tick the answer that best applies to your perception. (5-point Likert-Scale)
Cold Warm
What were your main activities during your last holiday? Please tick the answer that best applies to your perception.
❏ Walking and exploring the natural environment ❏ Visiting cities, monuments and museums ❏ Enjoying the sun/beach
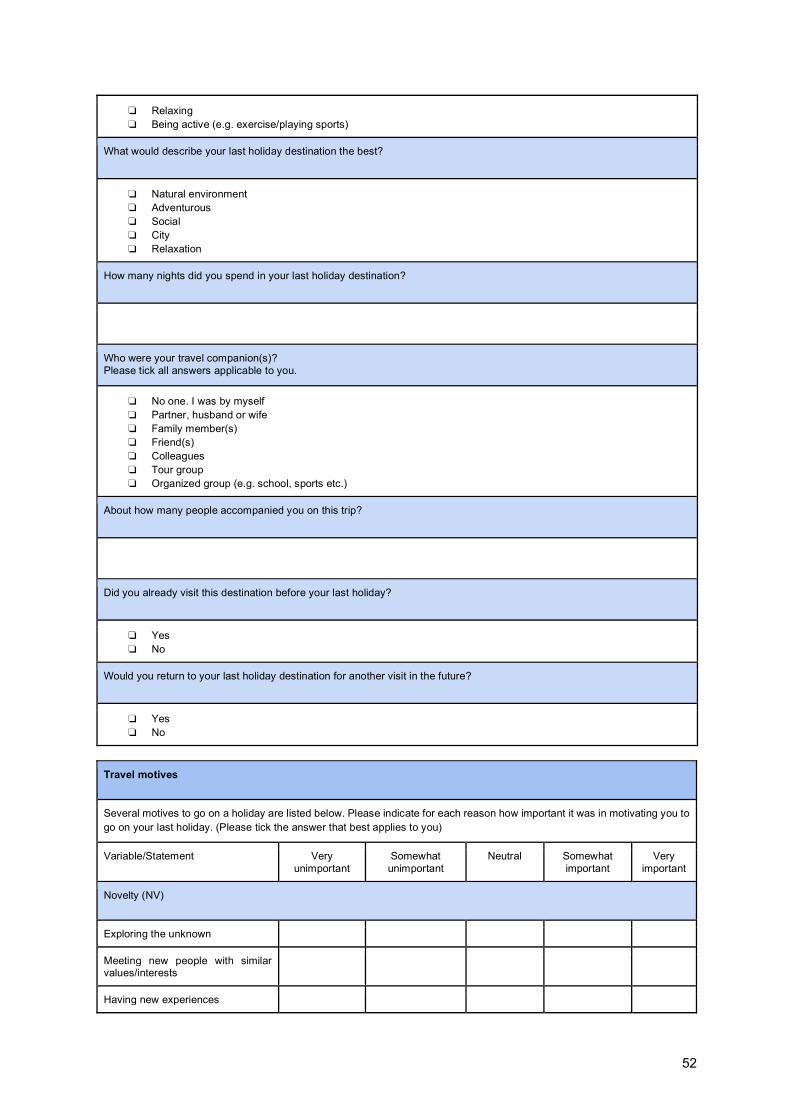
52
❏ Relaxing ❏ Being active (e.g. exercise/playing sports)
What would describe your last holiday destination the best?
❏ Natural environment ❏ Adventurous ❏ Social ❏ City ❏ Relaxation
How many nights did you spend in your last holiday destination?
Who were your travel companion(s)? Please tick all answers applicable to you.
❏ No one. I was by myself ❏ Partner, husband or wife ❏ Family member(s) ❏ Friend(s) ❏ Colleagues ❏ Tour group ❏ Organized group (e.g. school, sports etc.)
About how many people accompanied you on this trip?
Did you already visit this destination before your last holiday?
❏ Yes ❏ No
Would you return to your last holiday destination for another visit in the future?
❏ Yes ❏ No
Travel motives
Several motives to go on a holiday are listed below. Please indicate for each reason how important it was in motivating you to go on your last holiday. (Please tick the answer that best applies to you)
Variable/Statement Very unimportant
Somewhat unimportant
Neutral Somewhat important
Very important
Novelty (NV)
Exploring the unknown
Meeting new people with similar values/interests
Having new experiences

53
Gaining new perspectives on life
Escape (ES)
Getting away from everyday psychological stress/pressure
Getting away from the usual demands of life
Getting away from everyday physical stress/pressure
Being away from daily routine
Freedom (FR)
Experiencing the feeling of being free
Being obligated to no one
Being independent and free
Being away from the crowds of people
Relationship Strengthening (RL)
Doing something with my family/friend(s)
Strengthening relationships with my family/friend(s)
Being near considerate people
Doing things with my companion(s)
Self Development (SD)
Developing my skills and abilities
Working on my personal/spiritual values
Develop my personal interests
Understanding more about myself
Culture (CT)
Experiencing different cultures
Learning about customs and traditions of other cultures
Meeting new people of another culture
Meeting the locals
Nature (NT)

54
Viewing the natural scenery
Being close to nature
Getting a better appreciation of nature
Being harmonious with nature
Personality Traits
Below are statements that reflect different characteristics of people. Please indicate to what extent you agree for each characteristic. Please tick the answer that best applies to you.
Variable/Statement Disagree Slightly Disagree Neutral Slightly Agree Agree
Extraversion (EX)
Am the life of the party.
Keep in the background.
Talk to a lot of different people at parties.
Am quiet around strangers.
Agreeableness (AG)
Feel little concern for others.
Sympathize with others’ feelings.
Am not interested in other people’s problems.
Take time out for others.
Conscientiousness (CN)
Leave my belongings around.
Get chores done right away.
Often forget to put things back in their proper place.
Follow a schedule.
Emotional Stability/Neuroticism (ES/N)
Am relaxed most of the time.
Worry about things.
Seldom feel blue.
Have frequent mood swings.
Intellect/Openness (I/O)
Have a rich vocabulary.

55
Have difficulty understanding abstract ideas.
Do not have a good imagination.
Am full of ideas.
About You
Several questions are listed below. Please tick the answer that best applies to you.
What is your nationality?
What is your gender?
❏ Male ❏ Female
What is your age group?
❏ < 18 ❏ 18 - 35 ❏ 36 - 43 ❏ 44 - 61 ❏ > 62
What is your highest completed education? Please tick the answer that best applies to you.
❏ Elementary School ❏ High School ❏ College ❏ Undergraduate (Bachelor) ❏ Graduate (Masters) ❏ Graduate (PhD, Advanced)
What is your occupational status? Please tick the answer that best applies to you.
❏ Employed ❏ Student ❏ Unemployed ❏ Retired
What is your approximate annual household income in (EUR) currency? Please tick the answer that best applies to you.
❏ < 20.000 EUR ❏ 20.001 - 40.000 EUR ❏ 40.001 - 60.000 EUR ❏ 60.001 - 80.000 EUR ❏ 80.001 - 100.000 EUR ❏ > 100.000 EUR
What is the average number of separate trips per year (foreign and domestic) during which you stayed at least 3 days?
❏ 0 ❏ 1 - 3 ❏ 4 - 6 ❏ 7 - 9 ❏ > 9
Many thanks for filling out this survey!

56