GWAS3D: detecting human regulatory variants by integrative analysis of genome-wide associations,...
9
GWAS3D: detecting human regulatory variants by integrative analysis of genome-wide associations, chromosome interactions and histone modifications Mulin Jun Li 1,2 , Lily Yan Wang 1,2 , Zhengyuan Xia 2,3 , Pak Chung Sham 2,4,5,6 and Junwen Wang 1,2,4, * 1 Department of Biochemistry, LKS Faculty of Medicine, The University of Hong Kong, Hong Kong SAR, China, 2 Shenzhen Institute of Research and Innovation, The University of Hong Kong, Shenzhen, Guangdong 518057, China, 3 Department of Anaesthesiology, LKS Faculty of Medicine, The University of Hong Kong, Hong Kong SAR, China, 4 Centre for Genomic Sciences, LKS Faculty of Medicine, The University of Hong Kong, Hong Kong SAR, China, 5 Department of Psychiatry LKS Faculty of Medicine, The University of Hong Kong, Hong Kong SAR, China and 6 State Key Laboratory in Cognitive and Brain Sciences, The University of Hong Kong, Hong Kong SAR, China Received February 14, 2013; Revised April 15, 2013; Accepted May 6, 2013 ABSTRACT Interpreting the genetic variants located in the regulatory regions, such as enhancers and promoters, is an indispensable step to understand molecular mechanism of complex traits. Recent studies show that genetic variants detected by genome-wide association study (GWAS) are signifi- cantly enriched in the regulatory regions. Therefore, detecting, annotating and prioritizing of genetic variants affecting gene regulation are critical to our understanding of genotype–phenotype relation- ships. Here, we developed a web server GWAS3D to systematically analyze the genetic variants that could affect regulatory elements, by integrating annotations from cell type-specific chromatin states, epigenetic modifications, sequence motifs and cross-species conservation. The regulatory elements are inferred from the genome-wide chromosome interaction data, chromatin marks in 16 different cell types and 73 regulatory factors motifs from the Encyclopedia of DNA Element project. Furthermore, we used these function elements, as well as risk haplotype, binding affinity, conservation and P-values reported from the original GWAS to reprioritize the genetic variants. Using studies from low-density lipoprotein cholesterol, we demonstrated that our reprioritizing approach was effective and cell type specific. In conclusion, GWAS3D provides a comprehensive annotation and visualization tool to help users interpreting their results. The web server is freely available at http:// jjwanglab.org/gwas3d. INTRODUCTION Recent studies on human genetics, such as The International HapMap Project (1) and 1000 Genomes Project (2), have identified a large number of genetics variants in the human genome. Furthermore, genome- wide association studies (GWAS) (3) and exome sequencing (4,5) are extensively used to globally investi- gate the relationship between genetic variants and human diseases/traits. By looking at the genomic location of the associated variants detected in GWAS, a large portion (88%) of them fall outside of coding regions, which are harder to interpret than the protein-coding variants (6). Therefore, elucidating the molecular function of genetic variants locating in the non-coding regions is critical to our full understanding of genetic disorders. However, there are many difficulties and computational challenges in achieving this goal (7). One of the major difficulties comes from the unclear role of non-coding genetic variants in the relevant processes underlying disease/trait association. These variants could affect many biological activities including transcription, splicing, post-transcriptional regulation, translation initi- ation/elongation and post-translational modification (8). Previously, conservation information was frequently used to prioritize the functional importance of non- coding genetic variation (9,10). At the transcription regu- lation level, mutations in the promoter regions may impact the recruitment of RNA polymerase and other regulators, especially the binding of transcriptional *To whom correspondence should be addressed. Tel:+852 2831 5075; Fax: +852 2855 1254; Email: [email protected] or [email protected] W150–W158 Nucleic Acids Research, 2013, Vol. 41, Web Server issue Published online 30 May 2013 doi:10.1093/nar/gkt456 ß The Author(s) 2013. Published by Oxford University Press. This is an Open Access article distributed under the terms of the Creative Commons Attribution License (http://creativecommons.org/licenses/by/3.0/), which permits unrestricted reuse, distribution, and reproduction in any medium, provided the original work is properly cited. by guest on June 22, 2013 http://nar.oxfordjournals.org/ Downloaded from
Transcript of GWAS3D: detecting human regulatory variants by integrative analysis of genome-wide associations,...

GWAS3D: detecting human regulatory variants byintegrative analysis of genome-wide associations,chromosome interactions and histone modificationsMulin Jun Li1,2, Lily Yan Wang1,2, Zhengyuan Xia2,3, Pak Chung Sham2,4,5,6 and
Junwen Wang1,2,4,*
1Department of Biochemistry, LKS Faculty of Medicine, The University of Hong Kong, Hong Kong SAR, China,2Shenzhen Institute of Research and Innovation, The University of Hong Kong, Shenzhen, Guangdong 518057,China, 3Department of Anaesthesiology, LKS Faculty of Medicine, The University of Hong Kong, Hong KongSAR, China, 4Centre for Genomic Sciences, LKS Faculty of Medicine, The University of Hong Kong, HongKong SAR, China, 5Department of Psychiatry LKS Faculty of Medicine, The University of Hong Kong, HongKong SAR, China and 6State Key Laboratory in Cognitive and Brain Sciences, The University of Hong Kong,Hong Kong SAR, China
Received February 14, 2013; Revised April 15, 2013; Accepted May 6, 2013
ABSTRACT
Interpreting the genetic variants located in theregulatory regions, such as enhancers andpromoters, is an indispensable step to understandmolecular mechanism of complex traits. Recentstudies show that genetic variants detected bygenome-wide association study (GWAS) are signifi-cantly enriched in the regulatory regions. Therefore,detecting, annotating and prioritizing of geneticvariants affecting gene regulation are critical to ourunderstanding of genotype–phenotype relation-ships. Here, we developed a web server GWAS3Dto systematically analyze the genetic variants thatcould affect regulatory elements, by integratingannotations from cell type-specific chromatinstates, epigenetic modifications, sequence motifsand cross-species conservation. The regulatoryelements are inferred from the genome-widechromosome interaction data, chromatin marks in16 different cell types and 73 regulatory factorsmotifs from the Encyclopedia of DNA Elementproject. Furthermore, we used these functionelements, as well as risk haplotype, binding affinity,conservation and P-values reported from the originalGWAS to reprioritize the genetic variants. Usingstudies from low-density lipoprotein cholesterol,we demonstrated that our reprioritizing approachwas effective and cell type specific. In conclusion,GWAS3D provides a comprehensive annotation andvisualization tool to help users interpreting their
results. The web server is freely available at http://jjwanglab.org/gwas3d.
INTRODUCTION
Recent studies on human genetics, such as TheInternational HapMap Project (1) and 1000 GenomesProject (2), have identified a large number of geneticsvariants in the human genome. Furthermore, genome-wide association studies (GWAS) (3) and exomesequencing (4,5) are extensively used to globally investi-gate the relationship between genetic variants and humandiseases/traits. By looking at the genomic location of theassociated variants detected in GWAS, a large portion(�88%) of them fall outside of coding regions, whichare harder to interpret than the protein-coding variants(6). Therefore, elucidating the molecular function ofgenetic variants locating in the non-coding regions iscritical to our full understanding of genetic disorders.
However, there are many difficulties and computationalchallenges in achieving this goal (7). One of the majordifficulties comes from the unclear role of non-codinggenetic variants in the relevant processes underlyingdisease/trait association. These variants could affectmany biological activities including transcription,splicing, post-transcriptional regulation, translation initi-ation/elongation and post-translational modification (8).Previously, conservation information was frequentlyused to prioritize the functional importance of non-coding genetic variation (9,10). At the transcription regu-lation level, mutations in the promoter regions mayimpact the recruitment of RNA polymerase and otherregulators, especially the binding of transcriptional
*To whom correspondence should be addressed. Tel: +852 2831 5075; Fax: +852 2855 1254; Email: [email protected] or [email protected]
W150–W158 Nucleic Acids Research, 2013, Vol. 41, Web Server issue Published online 30 May 2013doi:10.1093/nar/gkt456
� The Author(s) 2013. Published by Oxford University Press.This is an Open Access article distributed under the terms of the Creative Commons Attribution License (http://creativecommons.org/licenses/by/3.0/), whichpermits unrestricted reuse, distribution, and reproduction in any medium, provided the original work is properly cited.
by guest on June 22, 2013http://nar.oxfordjournals.org/
Dow
nloaded from

factors (TFs) to the promoter region to initiate gene tran-scription. Tools such as is-rSNP (11), sTRAP (12) andregSNPs (13) have been successfully developed toevaluate the binding affinity affected by genetic variation.However, although algorithms that solely used TF motifsare effective in finding regulatory elements in the immedi-ate promoter regions but may inevitably introduce a largenumber of false positives in the distal promoter/enhancerregions where the searching space becomes substantiallylarger. More and more studies showed that mutationswithin the distal regulatory elements, such as enhancer,insulator and silencer, could also disrupt or change thebinding of TFs, nucleosome positioning signals and chro-matin states. Furthermore, the locally changed chromo-some conformation can block or create loopinginteraction between distal elements and promoter regions(14) and subsequently influence gene regulation.Unfortunately, few tools or resources have used such in-formation to study genetic variants.
The Encyclopedia of DNA Elements (ENCODE)project has identified a comprehensive map of functionalelements and active chromatin marks by advanced tech-niques such as ChIP-seq, DNase-seq, bisulfate sequencing,chromosome conformation capture and so forth. (15,16).Recent studies showed that disease-associated single-nucleotide polymorphisms (SNPs) detected by GWASare significantly enriched in the regions that harbor func-tional elements, such as transcriptional factor binding sites(TFBSs), histone modification marked regions, DNase Ihypersensitive sites (DHSs) and expression quantitativetrait loci (16–19). Two recently published databases,HaploReg (20) and RegulomeDB (21), have used theseregulatory signals and marks to annotate the geneticvariants, which offer comprehensive resources on regula-tory variation. On the other hand, different functionalelements have been reported to function in a tissue/celltype-specific manner. SNPs associated with the sametrait are likely to locate in active chromatin marks in thesame/relevant cell type (22), implying the possibility ofdetecting regulatory signals using the chromatin marksof phenotypically relevant cell type. Computational algo-rithms including ChromHMM (23) and Seaway (24) havebeen successfully applied to scan different functionalelements in the genome. Therefore, combinatory analysisof GWAS data and functional elements in a specific celltype to capture regulatory variants for a particulardisease/trait are needed.
Here, we develop a web server GWAS3D (http://jjwanglab.org/gwas3d) to systematically analyze the prob-ability of genetic variants affecting regulatory pathwaysand underlying disease/trait associations by integratingchromatin state, functional genomics, sequence motifsand cross-species conservation for a set of GWAS dataor variant list. We first collected and curated genome-wide chromosome interaction (5C, Hi-C, ChIA-PET)data, enhancer/insulator/promoter marks [H3K4me1,H3K27ac, p300, CCCTC-binding factor (CTCF), DHS]and ChromHMM predicted functional elements in 16 dif-ferent cell types. Using those regulatory regions, wemapped genetic variants to the reference genome andevaluated the binding affinity changes of regulatory
factors by scanning 73 ENCODE motifs. Finally, wecombined original GWAS signal, risk haplotype, bindingaffinity significance and conservation information to pri-oritize the genetic variants. In addition, the systemprovides comprehensive annotation and visualization tohelp users to interpret the results. Comparing withexisting software and databases, GWAS3D uses thelatest information to build a one-stop web-based tool forclinicians and biologists to evaluate the deleteriousness ofdisease/trait-associated variants that affect transcriptionregulation on a broader spectrum, especially on non-coding genetic variation.
METHOD AND PIPELINE
Data collection and processing
GWAS3D integrates multiple genome-wide experimentaldata to connect genetic variants with underlying generegulation mechanism through high-dimensional regula-tory interactions. We first collected and curated the experi-mental results of long-range interactions, for 16 differentcell types, measured by high-throughput chromosomeconformation capture technologies (5C, ChIA-PET andHi-C) from the ENCODE project, Gene ExpressionOmnibus (GEO) database and published resources(Supplementary Table S1). We directly used 5C andChIA-PET interactions in the database and processedthe Hi-C interactions by the iterative correction andeigenvector decomposition (ICE) algorithm (25), whichcan largely reduce the false positives and biases. Somechromatin marks have been reported and validated asthe active signals of enhancers, including histone modifi-cations of H3K4me1 and H3K27ac, DHSs and E1A-binding protein p300 (26,27), we therefore extracted therelated ChIP-Seq peaks for the above 16 cell types fromENCODE. We also collected ChIP-Seq data of CTCF-binding sites, which imply transcription repression andchromatin insulation. For predicted elements, we down-loaded the ChromHMM genome-wide maps of chromatinstate annotations for supported cell types and extractedthe promoter, enhancer and insulator elements whosesignals are predicted as ‘Strong’. We also merged thegenomic profiles of three ENCODE tier 1 cell lines(GM12878, K562, H1 human embryonic stem cells) tosupport the ‘no cell type restriction’ option.Genetic variants data sets were collected from
dbSNP137 (28) and 1000 Genomes Project phase 1release version 2 (29), which comprise 52 054 804 and26 152 995 SNPs and Indels, respectively. We assigned ref-erence allele and all alternative alleles to dbSNP137 vari-ants and used biallelic variants for 1000 Genomes Project.The allele information was used to calculate the bindingaffinity of TFs. Linkage disequilibrium (LD) data for 11populations were retrieved from the merged data ofHapMap phases I+II+III. LD data for four 1000Genomes Project super populations were computed andretrieved from MACH (30). Genomic coordinate of eachlocus was converted to GRCh37 hg19 by UCSC liftovertool. Variants with dbSNP ID were mapped to dbSNP137using dbSNP merge file. In addition, annotations for genes
Nucleic Acids Research, 2013, Vol. 41, Web Server issue W151
by guest on June 22, 2013http://nar.oxfordjournals.org/
Dow
nloaded from

and other DNA elements were downloaded from theUCSC Genome Browser. Furthermore, GWAS3D usedposition frequency matrices of 73 transcription factorsmotifs grouped by family (ENCODE motifs) fromENCODE web site, which provides a comprehensiveresource of 245 known motifs curated fromTRANSFAC, Jaspar and protein-binding microarray ex-periments, and 293 novel motifs discovered by motiffinding tools (including MEME, MDscan, Weeder,AlignACE) using large numbers of ChIP-Seq data. Toconsider the regions with evolutionary constraint, wealso used the conservative elements by genomic evolution-ary rate profiling (31) and used these signals to prioritizethe suspected deleterious variants.
Pipeline
Given a set of GWAS data or a SNP list, GWAS3D candetect the variants’ regulatory effects such as the assignedpopulation haplotype, the experimentally derived genetic/epigenetic signals, the predicted change of transcriptionfactor binding affinity on different alleles and sequenceconservation in a particular cell type. The server furthercalculates the combined effect of each variant and priori-tizes them based on the probability of affecting gene regu-lation. The overall workflow of GWAS3D is shown inFigure 1.
Preliminary data filteringThe system accepts inputs either from an association studyor a SNP list. Many formats are supported, including thePlink-like (32) format, VCF-like format, single dbSNP IDand variant chromosome position. The input of associ-ation P-value is compulsory when the GWAS effect sizeis considered for prioritization. A user-defined P-value cutoff is applied to filter out the less significant SNPs and toreduce data volume. SNPs or Indels will be checked andmapped to dbSNP137 or 1000 Genomes Project variants.Variants not using VCF-like format will be assigned re-spective alleles according to dbSNP137 then 1000
Genomes Project. The web server will filter the variantnot mapped onto either dbSNP137 or 1000 GenomesProject unless VCF-like format is used. Then, it wouldfetch all variants in LD of each aforementioned leadingvariants by user-defined LD standard (HapMap or 1000Genomes Project), population and r-square (r2) cut off.
Identifying GWAS3D regulatory signalsCell-type specific marks, including genome-wide long-range interactions, active promoter/enhancer/insulatormarks, predicted ChromHMM maps, as well as auser-defined promoter region, are then used to identifythe potential regulatory effects of the variants. Wedefined a variant mapped onto any of these regions as a‘GWAS3D signal’, which implies a relevant regulatoryfunction such as affecting distal interaction in high dimen-sion or direct promoter activity of a target gene. Thevariants that are not mapped to any regulatory regionsare filtered out at this stage.
Computing the binding affinity effect by ENCODE-motifsTo quantitatively measure the difference on the bindingaffinity caused by different alleles of candidate variantswith GWAS3D signals and its significance, we used a com-prehensive TF motif set to evaluate the possible reducedor enhanced binding. We first computed the positionweight matrices (PWMs) from position frequencymatrices of all ENCODE motifs by converting normalizedfrequency value to log-scale value using the methoddescribed previously (33,34). Given a variant (V) withGWAS3D signal, we took 30 bp of surroundingsequence and constructed the mutated sequencesbetween the reference alleles (Ar) and the alternativealleles (Aa1, . . .Aan). For user-selected motifs of TFs, wescanned these sequences using PWMSCAN (35) andfetched P-values represent the significance of eachputative TF-binding site. We set a PWMSCAN P-valuethreshold (1E-3) to reduce the number of false positivebindings. We then measured the score of binding affinity
Figure 1. The workflow of GWAS3D (see the description of pipeline for details).
W152 Nucleic Acids Research, 2013, Vol. 41, Web Server issue
by guest on June 22, 2013http://nar.oxfordjournals.org/
Dow
nloaded from

change by calculating the log-odds (LOD) of probabilitiesof paired binding sites for each motif (m):
LODm VArAan
� �¼ log10
Pm VAr
� �
Pm VAn
� �
To estimate the statistical significance of binding affinitychange, we performed permutations of on 52 054 804SNPs in dbSNP137 and computed respective LOD of allENCODE motifs to form the null distribution of bindingaffinity difference. We then used FastPval (36) to computethe P-value of each LOD from aformentioned empiricaldistribution.
Prioritization of regulatory variantsWe combined the original GWAS signal, risk haplotype,binding affinity significance and conservation informationto prioritize the leading variants (L) detected by GWAS.For each L, we first find all variants (V) with GWAS3Dsignal and in LD with L (r2> user selected cutoff). Wethen calculated V’s phenotypically associated effect(PGWAS) by dividing the GWAS P-value of L with the r2
between V and L in the user-specified populations. Wethen selected the most significant P-value of the LODrelated to a specific TF motif (PBDA) to represent thebinding affinity effect of the variant. We further mappedthe variant to genomic evolutionary rate profiling++(37)constrained elements and calculated the correspondingconservation P-value (PCONS). Using the P-values ofaforementioned three independent measurements(GWAS, binding affinity, conservation), we performedFisher’s combined probability test to calculate acombined P-value, CP, for each V. We then assigned themost significant CP from all the variants Vs to the corres-ponding leading variant L. All the Ls are then re-rankedaccording to their new CP values, with special focus ontheir regulatory effects.
Plotting the GWAS3D regulatory variantsTo visualize global chromosome interactions amongputative regulatory variants and their associated loci,GWAS3D also provide informative circle plots of high-dimensional chromosome interactions. We selected topsignificant variants (defined by the user) detected byGWAS3D and mapped them to RefGene for genenames or Cytoband for chromosome locations. Wegenerated an intuitive circle graph using VIZ-GRAIL(38) with some modifications.
WEB SERVER DESCRIPTION
Usage and interface
The system accepts four formats for variants includingeither GWAS format such as Plink-like format andsingle dbSNP ID, or NGS format such as VCF-likeformat and single variant chromosome position resultingfrom high-throughput sequencing. LD information of dif-ferent populations for both HapMap and 1000 GenomesProject is well supported by GWAS3D, which also allowsusers to define the cutoffs of association P-value and LD.
More stringent settings will reduce the running time butsome truely associated variants with moderate effect sizemight be lost. Also, GWAS3D provides information for16 different cell types, which have been extensivelyinvestigated on chromatin states by recent ENCODEproject, especially for long-range chromosome inter-actions. We recommend users to select the cell type thatis relevant to the observed disease/trait in their GWAS/NGS study. Furthermore, GWAS3D allows users tochoose relevant TF families and related known/novelmotifs, which benefit capturing the binding affinitychanges for a set of specific TFs. User can define aspecific P-value cut off for putative TF-binding sitescanning. Other settings, such as user-defined genomicregions and visualization options, including promoter def-inition, allowed number of variants and distal intentionsfor plotting, are also adjustable by the users.GWAS3D uses a series of user-friendly interfaces to
display the results, which summarize the potential regula-tory effects of these variants and facilitate the identifica-tion and selection of casual variants for follow-upexperimental validation. The detected regulatory variantsand their associated loci/interactions can be globallyviewed from a circle plot in the left panel of ‘GWAS3DPLOT’ page (Figure 2). User can also check the overviewof current GWAS3D run and download related informa-tion from right panel (Supplementary Figure S1). Toquery the detailed information of each variant withGWAS3D signals, we designed a variant prioritizationtable as well as comprehensive tab viewers in the‘GWAS3D INFO’ page. In the prioritization table, themost significant regulatory variant in the LD of eachleading variant is ranked by the significance of combinedP-value. Also, variants with different type of GWAS3Dsignals are marked in different colors. For example,variants with significant TF-binding affinity change willbe marked by purple stamp, and variants with activeenhancer signal will be marked by green stamp. In theright tabs, user can identify the deleteriousness ofselected variants by analyzing many annotations of itsregulatory features in a dynamic manner (Figure 3).
Annotation
For each variant detected by GWAS3D, we provided sixannotations, including variant summary, binding affinity,GWAS3D signals, genomic elements, LD signals andexternal annotation. Users can systematically analyze theregulatory properties of variants based on these annota-tions. First tab is about variant summary, showing theimportant attributes related to the selected variant andreports the information of previous GWAS resultrecorded in GWASdb (39) for this variant. In the tab ofbinding affinity, we listed top five significant affinity dif-ferences of TF motifs with detailed binding sites informa-tion. For the GWAS3D signals information, we offered atab to show all of mapped functional elements used inGWAS3D and related marks information. To help useridentify all putative regulatory variants in the LD ofobserved leading variant, we used one additional tab tolist related information. Lastly, three useful external
Nucleic Acids Research, 2013, Vol. 41, Web Server issue W153
by guest on June 22, 2013http://nar.oxfordjournals.org/
Dow
nloaded from
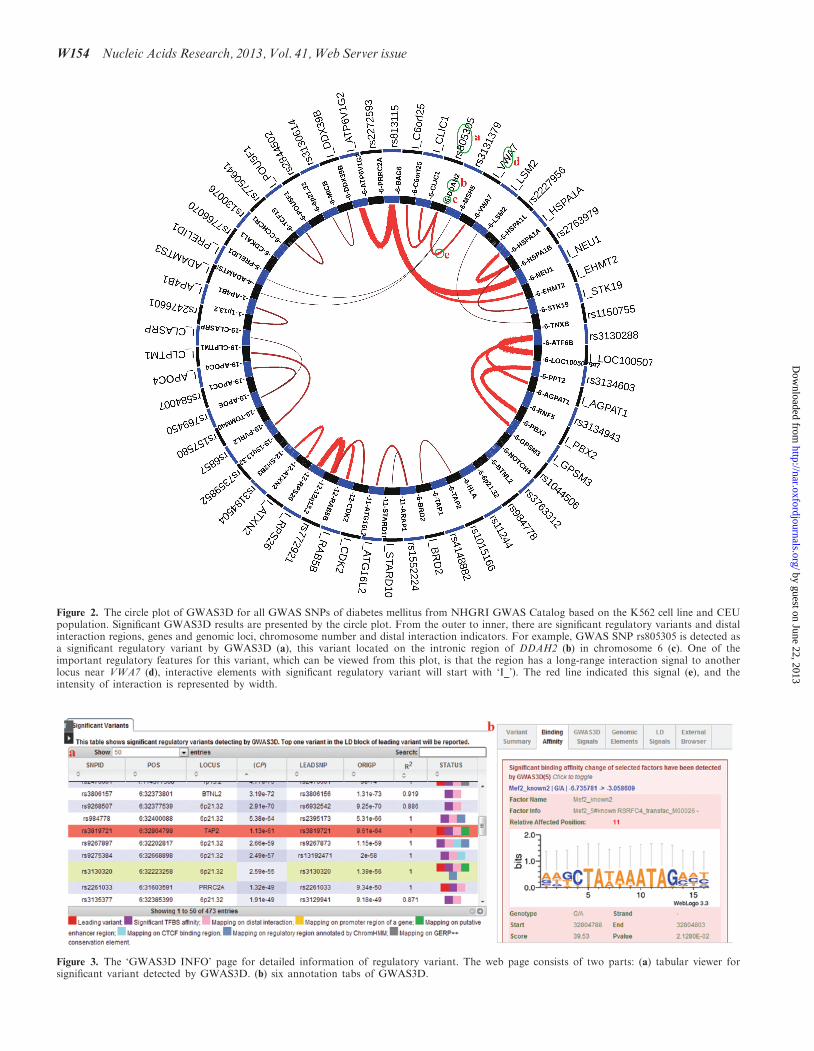
Figure 2. The circle plot of GWAS3D for all GWAS SNPs of diabetes mellitus from NHGRI GWAS Catalog based on the K562 cell line and CEUpopulation. Significant GWAS3D results are presented by the circle plot. From the outer to inner, there are significant regulatory variants and distalinteraction regions, genes and genomic loci, chromosome number and distal interaction indicators. For example, GWAS SNP rs805305 is detected asa significant regulatory variant by GWAS3D (a), this variant located on the intronic region of DDAH2 (b) in chromosome 6 (c). One of theimportant regulatory features for this variant, which can be viewed from this plot, is that the region has a long-range interaction signal to anotherlocus near VWA7 (d), interactive elements with significant regulatory variant will start with ‘I_’). The red line indicated this signal (e), and theintensity of interaction is represented by width.
Figure 3. The ‘GWAS3D INFO’ page for detailed information of regulatory variant. The web page consists of two parts: (a) tabular viewer forsignificant variant detected by GWAS3D. (b) six annotation tabs of GWAS3D.
W154 Nucleic Acids Research, 2013, Vol. 41, Web Server issue
by guest on June 22, 2013http://nar.oxfordjournals.org/
Dow
nloaded from

browsers were encapsulated into the system to give broadannotations and predictions including GWASrap (40),RegulomeDB and UCSC ENCODE genome browser.User can directly fetch the information in an internalwindow.
Evaluation
We first tested the web server using a well-studied locusknown to be associated with plasma low-density lipopro-tein cholesterol (LDL-C). We collected 17 associatedSNPs in 1p13 region (Supplementary Table S2) genotypedin �20 000 individuals of European descent and �9000African American individuals with LDL-C (41) and per-formed GWAS3D pipeline on those variants underHapMap CEU population and HepG2 cell type. Weobtained five significant regulatory variants with distin-guished GWAS3D signals and identified a leadingvariant rs12740374, as the top one in the prioritizationtable. The variant locates between genes CELSR2 andPSRC1, and was scored a more significant CP (7.89E-46) than the original GWAS P-value (1.8E-42).GWAS3D reported that rs12740374 directly connectedwith two active enhancer marks (H3K27ac and DHS)and located in the conserved region. Importantly,binding affinity between allele G and risk allele Tshowed substantial difference for C/EBP transcriptionfactors (Supplementary Figure S2). Those results wereconsistent with previous finding about the role ofrs12740374 in the lipoprotein regulatory pathway (41).We also applied same associated SNPs set on YRI andCHB populations, besides the most significant leadingSNP rs12740374, we further detected rs629301 thatpossibly disrupting the binding of transcription factorYY1, and other GWAS3D signals (SupplementaryFigures S3 and S4). Another speculation is that thisvariant may influence the recognition and targeting ofmiR-199 in the 30UTR of CELSR2. This variant was fre-quently reported as a highly associated signal in 1p13region with LDL-C (42,43). Interestingly, we did notobserve strong enhanced signals (active enhancer orpromoter) at those GWAS-associated variants when weused non-liver cell type such as K562, H1-hESC andHeLa-S3. In contrast, CTCF-binding sites were observedaround some of those associated variants, which mayreflect the phenotypically cell type-specific association(Supplementary Figure S5) (22).
To further evaluate the ability of GWAS3D for detect-ing and prioritizing regulatory variants in a genome-widemanner, we collected 1370 associated SNPs with prostatecancer from NHGRI GWAS Catalog (6) and GWASdb(39). We detected 195 variants, which have GWAS3Dregulatory signals (active promoter/enhancer/insulatormarks, TFBS affinity changes, conserved elements), afterapplying the CEU population and RWPE1 cell type.Seven variants obtained more significant CP than the ori-ginals when analyzing top 20 putative regulatory variantsin the prioritization table (Supplementary Table S3). Mostof these significant variants exert the regulatory functionof their associated loci by high linked LD variants otherthan leading SNPs. However, a noticeable result is a
leading SNP rs6983267 that harbors many GWAS3Dsignals has been successfully validated by many functionalstudies for affecting enhancer activity (44,45).We then quantitatively evaluated the performance of
our method. We first collected 118 known regulatoryvariants from OregAnno database (46). We randomlyselected three data sets from dbSNP with same numberof genetic variants in each of the regulatory regions(promoter, intergenic and genome-wide). For each ofaformentioned four SNVs list, we performed GWAS3Dpipeline without considering GWAS P-value, cell type re-striction and population LD. Wilcoxon rank-sum testshowed significant differences between OregAnno andeach random sets, with P-values of 0.0344, 0.0011 and0.0052 for promoter, intergenic and genome-wide dataset, respectively, whereas there are no differences amongthe three random data sets. The experiment demonstratedthat GWAS3D pipeline gives higher scores to regulatoryvariants and thus differentiates them from randomvariants.The SNVs detected by GWAS are associated with the
disease/trait, but may not be the one with function impli-cations. GWAS3D can find functional SNVs from GWASSNVs through LD and other information. To assess thiscapability, we used GWAS3D pipeline to find functionalSNV for each of the selected GWAS SNVs (118 topGWAS significant variants in intergenic and promoterregions from GWAS Catalog database). We found therewere no significant differences between the GWAS SNVsand any of the three random data sets (all P> 0.05,Wilcoxon rank-sum test). However, the functional SNVsfound by GWAS3D are significantly highly scored withP-values of 2.966E-05, 9.591E-08 and 3.034E-07compared with the three random sets (Wilcoxon rank-sum test), respectively. Those results further confirmedthe capability of GWAS3D in identifying functional regu-latory variants (Supplementary Figure S6).
Server design
We implemented the GWAS3D web server with a Perl-based web framework ‘Catalyst’, which provides a flexibleprogramming interface on web development. Annotationinformation is stored in a back-end MySql database. Weused Oracle Grid Engine as job management system forsubmitting tasks and offered three ways for users toretrieve their jobs: encrypted links, browser cookies andemail notifications. jQuery and related UI components areused to construct dynamic web pages. GWAS3D is a one-stop framework with high usability and is freely availablefor academic use.
DISCUSSION
We have designed a web-based tool to detect, prioritizeand annotate the regulatory genetic variations in combin-ation with experimental data and computational predic-tions. Particularly, this tool takes advantage of recentlygenerated ENCODE data, especially the experimentallong-range interactions as well as the active marks of func-tional elements, to predict variants in the putative TFBSs
Nucleic Acids Research, 2013, Vol. 41, Web Server issue W155
by guest on June 22, 2013http://nar.oxfordjournals.org/
Dow
nloaded from

in distal and proximal promoter regions. GWAS3D is atool dedicated to detect true functional variants thatcontrol gene regulation for genetic studies. Comparedwith recent software and databases such as VAAST,HaploReg and RegulomeDB, GWAS3D integrates morefeatures and can be used in many scenarios. User canidentify the most probable functional variant associatedwith interesting trait in one risk locus or prioritize theleading variants when given a full list of GWAS resultor evaluate the deleteriousness of genetic variants affectingthe gene regulation without any prior effect. GWAS3Dalso provides flexible configurations, such as human popu-lation, cell type specificity and TF family classification, forusers to deal with different aspects of complex disease/trait. For example, user may select a matched cell type/tissue satisfying with a specific phenotype or manuallydefine motifs of interested TFs used in followingscanning when considering the tissue specificity of TFs.Recently, researchers found that the disease/trait-associated variants are highly related to active chromatinmarks in relevant cell types (22). Therefore, these distinctfeatures will greatly facilitate the discovery of regulatoryvariants under particular condition.There are unbalanced genomic data of multiple
domains for different cell types/tissues. For example, alot of data were provided by ENCODE tier 1 cell lines(GM12878, K562, H1 human embryonic stem cells),whereas the data were few on tier 3 cell lines. It may po-tentially affect the quality of our annotation whenapplying GWAS3D pipeline to the cell lines havingfewer data available. We therefore specially selected the16 cell types, which included enough chromosomallooping data (5C or ChIA-PET or Hi-C) and importanttranscriptional markers data (H3K4me1, H3K27ac,DHSs, EP300 and CTCF). To cope with tissue/cell typelimitation, we added a ‘without tissue/cell type restriction’item in cell type selection option by merging the genomicprofiles of three ENCODE tier 1 cell lines. Because theaforementioned three cell lines contain dynamic transcrip-tion signals from human normal adult cells, cancer cellsand embryonic stem cells. In the future, we will continu-ously update the number of tissue/cell type when enoughdata are available for that cell line.It was reported that many active chromatin marks are
located in the intronic and exonic region of genes (47).Enhancers can also reside in intronic region of a gene tocoordinate the looping with active promoter of anothergene (48). Even for validated human fragments withenhancer activity (49), we found 30.42% of these frag-ments overlapped with coding region of genes. Thus,genetic variants not belonging to non-coding RNAs mayalso be associated with gene regulation. On the otherhand, an exonic variant can associate with particular regu-latory process by linking variants in the LD proxy.GWAS3D not only provides an efficient solution to inter-pret the regulatory role of genetic variation in thenoncoding regions but also in other genic regions.The computational process of our system is real-time,
which is different from databases such as HaploReg andRegulomeDB, where the function annotations are pre-computed and stored in the database in advance.
Therefore, it can dynamically deal with the geneticvariants input by users with maximum flexibility.Despite large computational burden in the backgroundwhen LD is considered, our system can finish the job ofa meta GWAS data set (thousands of variants withmoderate GWAS significance, P< 1.0� 10�5) within afew hours even with LD from the 1000 GenomesProject. It will be much quicker when using HapMapLD. To exploit the regulatory properties of personalgenomics data, GWAS3D accepts VCF-like format andcan evaluate the deleteriousness of rare/novel variationaltering gene regulation associated with personalized trait.
Furthermore, our system provides visualization andinstant annotation for detected variants. Using the circleplotting, important regulatory variants and its affectedregions, as well as the intra/interchromosomal interactionsrelated to variants, can be intuitively displayed. Althoughmany tools, such as SeattleSeq, ANNOVAR (50) andENSEMBL VEP (51), can help users retrieve sufficientvariant annotations, the integrative function annotationof GWAS3D will benefit users for instant query andbroader range of information. Therefore, besides thegenomic mapping information of variant (such as infor-mation of gene and other genomic elements), we offeredseveral direct links to the servers of GWASrap (40),RegulomeDB and UCSC ENCODE genome browser inthe internal windows of GWAS3D.
SUPPLEMENTARY DATA
Supplementary Data are available at NAR Online:Supplementary Tables 1–3 and Supplementary Figures1–6.
ACKNOWLEDGEMENTS
The authors thank Dr Xiang Lv and Prof. Depei Liu ofPeking University Medical College, China for criticalcomments.
FUNDING
Research Grants Council [781511M] of Hong Kong andNational Science Foundation [91229105] of China.Funding for open access charge: Outstanding YoungResearcher Award (OYRA) of The University of HongKong (2011–2012).
Conflict of interest statement. None declared.
REFERENCES
1. International HapMap 3 Consortium, Altshuler,D.M.,Gibbs,R.A., Peltonen,L., Dermitzakis,E., Schaffner,S.F., Yu,F.L.,Bonnen,P.E., de Bakker,P.I., Deloukas,P. et al. (2010) Integratingcommon and rare genetic variation in diverse human populations.Nature, 467, 52–58.
2. Abecasis,G.R., Auton,A., Brooks,L.D., DePristo,M.A.,Durbin,R.M., Handsaker,R.E., Kang,H.M., Marth,G.T. andMcVean,G.A. (2012) An integrated map of genetic variation from1,092 human genomes. Nature, 491, 56–65.
3. McCarthy,M.I., Abecasis,G.R., Cardon,L.R., Goldstein,D.B.,Little,J., Ioannidis,J.P. and Hirschhorn,J.N. (2008) Genome-wide
W156 Nucleic Acids Research, 2013, Vol. 41, Web Server issue
by guest on June 22, 2013http://nar.oxfordjournals.org/
Dow
nloaded from

association studies for complex traits: consensus, uncertainty andchallenges. Nat. Rev. Genet., 9, 356–369.
4. Bamshad,M.J., Ng,S.B., Bigham,A.W., Tabor,H.K., Emond,M.J.,Nickerson,D.A. and Shendure,J. (2011) Exome sequencing as atool for Mendelian disease gene discovery. Nat. Rev. Genet., 12,745–755.
5. Do,R., Kathiresan,S. and Abecasis,G.R. (2012) Exome sequencingand complex disease: practical aspects of rare variant associationstudies. Hum. Mol. Genet., 21, R1–R9.
6. Hindorff,L.A., Sethupathy,P., Junkins,H.A., Ramos,E.M.,Mehta,J.P., Collins,F.S. and Manolio,T.A. (2009) Potentialetiologic and functional implications of genome-wide associationloci for human diseases and traits. Proc. Natl Acad. Sci. USA,106, 9362–9367.
7. Ward,L.D. and Kellis,M. (2012) Interpreting noncoding geneticvariation in complex traits and human disease. Nat. Biotechnol.,30, 1095–1106.
8. Sauna,Z.E. and Kimchi-Sarfaty,C. (2011) Understanding thecontribution of synonymous mutations to human disease.Nat. Rev. Genet., 12, 683–691.
9. Yandell,M., Huff,C., Hu,H., Singleton,M., Moore,B., Xing,J.,Jorde,L.B. and Reese,M.G. (2011) A probabilistic disease-genefinder for personal genomes. Genome Res., 21, 1529–1542.
10. Lehmann,K.V. and Chen,T. (2013) Exploring functional variantdiscovery in non-coding regions with SInBaD. Nucleic Acids Res.,41, e7.
11. Macintyre,G., Bailey,J., Haviv,I. and Kowalczyk,A. (2010) Is-rSNP: a novel technique for in silico regulatory SNP detection.Bioinformatics, 26, i524–i530.
12. Manke,T., Heinig,M. and Vingron,M. (2010) Quantifying theeffect of sequence variation on regulatory interactions. Hum.Mutat., 31, 477–483.
13. Teng,M., Ichikawa,S., Padgett,L.R., Wang,Y., Mort,M.,Cooper,D.N., Koller,D.L., Foroud,T., Edenberg,H.J., Econs,M.J.et al. (2012) RegSNPs: a strategy for prioritizing regulatory singlenucleotide substitutions. Bioinformatics, 28, 1879–1886.
14. Sakabe,N.J., Savic,D. and Nobrega,M.A. (2012) Transcriptionalenhancers in development and disease. Genome Biol., 13, 238.
15. Sanyal,A., Lajoie,B.R., Jain,G. and Dekker,J. (2012) Thelong-range interaction landscape of gene promoters. Nature, 489,109–113.
16. Dunham,I., Kundaje,A., Aldred,S.F., Collins,P.J., Davis,C.A.,Doyle,F., Epstein,C.B., Frietze,S., Harrow,J., Kaul,R. et al.(2012) An integrated encyclopedia of DNA elements in thehuman genome. Nature, 489, 57–74.
17. Schaub,M.A., Boyle,A.P., Kundaje,A., Batzoglou,S. andSnyder,M. (2012) Linking disease associations with regulatoryinformation in the human genome. Genome Res., 22, 1748–1759.
18. Hoffman,M.M., Ernst,J., Wilder,S.P., Kundaje,A., Harris,R.S.,Libbrecht,M., Giardine,B., Ellenbogen,P.M., Bilmes,J.A.,Birney,E. et al. (2013) Integrative annotation of chromatinelements from ENCODE data. Nucleic Acids Res., 41, 827–841.
19. Hardison,R.C. (2012) Genome-wide epigenetic data facilitateunderstanding of disease susceptibility association studies. J. Biol.Chem., 287, 30932–30940.
20. Ward,L.D. and Kellis,M. (2012) HaploReg: a resource forexploring chromatin states, conservation, and regulatory motifalterations within sets of genetically linked variants. Nucleic AcidsRes., 40, D930–D934.
21. Boyle,A.P., Hong,E.L., Hariharan,M., Cheng,Y., Schaub,M.A.,Kasowski,M., Karczewski,K.J., Park,J., Hitz,B.C., Weng,S. et al.(2012) Annotation of functional variation in personal genomesusing RegulomeDB. Genome Res., 22, 1790–1797.
22. Trynka,G., Sandor,C., Han,B., Xu,H., Stranger,B.E., Liu,X.S.and Raychaudhuri,S. (2013) Chromatin marks identify critical celltypes for fine mapping complex trait variants. Nat. Genet., 45,124–130.
23. Ernst,J. and Kellis,M. (2012) ChromHMM: automatingchromatin-state discovery and characterization. Nat. Methods, 9,215–216.
24. Hoffman,M.M., Buske,O.J., Wang,J., Weng,Z.P., Bilmes,J.A. andNoble,W.S. (2012) Unsupervised pattern discovery in humanchromatin structure through genomic segmentation. Nat. Methods,9, 473–476.
25. Imakaev,M., Fudenberg,G., McCord,R.P., Naumova,N.,Goloborodko,A., Lajoie,B.R., Dekker,J. and Mirny,L.A. (2012)Iterative correction of Hi-C data reveals hallmarks ofchromosome organization. Nat. Methods, 9, 999–1003.
26. Boyle,A.P., Davis,S., Shulha,H.P., Meltzer,P., Margulies,E.H.,Weng,Z., Furey,T.S. and Crawford,G.E. (2008) High-resolutionmapping and characterization of open chromatin across thegenome. Cell, 132, 311–322.
27. Barski,A., Cuddapah,S., Cui,K., Roh,T.Y., Schones,D.E.,Wang,Z., Wei,G., Chepelev,I. and Zhao,K. (2007) High-resolutionprofiling of histone methylations in the human genome. Cell, 129,823–837.
28. Sherry,S.T., Ward,M.H., Kholodov,M., Baker,J., Phan,L.,Smigielski,E.M. and Sirotkin,K. (2001) dbSNP: the NCBIdatabase of genetic variation. Nucleic Acids Res., 29, 308–311.
29. Buchanan,C.C., Torstenson,E.S., Bush,W.S. and Ritchie,M.D.(2012) A comparison of cataloged variation between InternationalHapMap Consortium and 1000 Genomes Project data.J. Am. Med. Inform. Assoc., 19, 289–294.
30. Li,Y., Willer,C.J., Ding,J., Scheet,P. and Abecasis,G.R. (2010)MaCH: using sequence and genotype data to estimate haplotypesand unobserved genotypes. Genet Epidemiol, 34, 816–834.
31. Cooper,G.M., Stone,E.A., Asimenos,G., Green,E.D., Batzoglou,S.and Sidow,A. (2005) Distribution and intensity of constraint inmammalian genomic sequence. Genome Res., 15, 901–913.
32. Purcell,S., Neale,B., Todd-Brown,K., Thomas,L., Ferreira,M.A.,Bender,D., Maller,J., Sklar,P., de Bakker,P.I., Daly,M.J. et al.(2007) PLINK: a tool set for whole-genome association andpopulation-based linkage analyses. Am. J. Hum. Genet., 81,559–575.
33. Zhang,G.L., Chen,X.C., Chan,L., Zhang,M.X., Zhu,B.H.,Wang,L.T., Zhu,X.Y., Zhang,J.Y., Zhou,B.P. and Wang,J.W.(2011) An SNP selection strategy identified IL-22 associating withsusceptibility to tuberculosis in Chinese. Sci. Rep., 1, 20.
34. Wasserman,W.W. and Sandelin,A. (2004) Applied bioinformaticsfor the identification of regulatory elements. Nat. Rev. Genet., 5,276–287.
35. Levy,S. and Hannenhalli,S. (2002) Identification of transcriptionfactor binding sites in the human genome sequence. Mamm.Genome, 13, 510–514.
36. Li,M.J., Sham,P.C. and Wang,J.W. (2010) FastPval: a fast andmemory efficient program to calculate very low P-values fromempirical distribution. Bioinformatics, 26, 2897–2899.
37. Davydov,E.V., Goode,D.L., Sirota,M., Cooper,G.M., Sidow,A.and Batzoglou,S. (2010) Identifying a high fraction of the humangenome to be under selective constraint using GERP plus. PLoSComput. Biol., 6, e1001025.
38. Raychaudhuri,S. (2011) VIZ-GRAIL: visualizing functionalconnections across disease loci. Bioinformatics, 27, 1589–1590.
39. Li,M.J., Wang,P., Liu,X., Lim,E.L., Wang,Z., Yeager,M.,Wong,M.P., Sham,P.C., Chanock,S.J. and Wang,J. (2012)GWASdb: a database for human genetic variants identified bygenome-wide association studies. Nucleic Acids Res., 40,D1047–D1054.
40. Li,M.J., Sham,P.C. and Wang,J. (2012) Genetic variantrepresentation, annotation and prioritization in the post-GWASera. Cell Res., 22, 1505–1508.
41. Musunuru,K., Strong,A., Frank-Kamenetsky,M., Lee,N.E.,Ahfeldt,T., Sachs,K.V., Li,X.Y., Li,H., Kuperwasser,N.,Ruda,V.M. et al. (2010) From noncoding variant to phenotypevia SORT1 at the 1p13 cholesterol locus. Nature, 466, 714–719.
42. Teslovich,T.M., Musunuru,K., Smith,A.V., Edmondson,A.C.,Stylianou,I.M., Koseki,M., Pirruccello,J.P., Ripatti,S.,Chasman,D.I., Willer,C.J. et al. (2010) Biological, clinical andpopulation relevance of 95 loci for blood lipids. Nature, 466,707–713.
43. Aulchenko,Y.S., Ripatti,S., Lindqvist,I., Boomsma,D., Heid,I.M.,Pramstaller,P.P., Penninx,B.W., Janssens,A.C., Wilson,J.F.,Spector,T. et al. (2009) Loci influencing lipid levels and coronaryheart disease risk in 16 European population cohorts. Nat.Genet., 41, 47–55.
44. Pomerantz,M.M., Ahmadiyeh,N., Jia,L., Herman,P., Verzi,M.P.,Doddapaneni,H., Beckwith,C.A., Chan,J.A., Hills,A., Davis,M.et al. (2009) The 8q24 cancer risk variant rs6983267 shows long-
Nucleic Acids Research, 2013, Vol. 41, Web Server issue W157
by guest on June 22, 2013http://nar.oxfordjournals.org/
Dow
nloaded from

range interaction with MYC in colorectal cancer. Nat. Genet., 41,882–884.
45. Tuupanen,S., Turunen,M., Lehtonen,R., Hallikas,O.,Vanharanta,S., Kivioja,T., Bjorklund,M., Wei,G., Yan,J.,Niittymaki,I. et al. (2009) The common colorectal cancerpredisposition SNP rs6983267 at chromosome 8q24 conferspotential to enhanced Wnt signaling. Nat. Genet., 41, 885–890.
46. Griffith,O.L., Montgomery,S.B., Bernier,B., Chu,B., Kasaian,K.,Aerts,S., Mahony,S., Sleumer,M.C., Bilenky,M., Haeussler,M.et al. (2008) ORegAnno: an open-access community-drivenresource for regulatory annotation. Nucleic Acids Res., 36,D107–D113.
47. Huff,J.T., Plocik,A.M., Guthrie,C. and Yamamoto,K.R. (2010)Reciprocal intronic and exonic histone modification regions inhumans. Nat. Struct. Mol. Biol., 17, 1495–1499.
48. Ott,C.J., Blackledge,N.P., Kerschner,J.L., Leir,S.H.,Crawford,G.E., Cotton,C.U. and Harris,A. (2009) Intronicenhancers coordinate epithelial-specific looping of the activeCFTR locus. Proc. Natl Acad. Sci. USA, 106, 19934–19939.
49. Visel,A., Minovitsky,S., Dubchak,I. and Pennacchio,L.A. (2007)VISTA Enhancer Browser-a database of tissue-specific humanenhancers. Nucleic Acids Res., 35, D88–D92.
50. Wang,K., Li,M.Y. and Hakonarson,H. (2010) ANNOVAR:functional annotation of genetic variants from high-throughputsequencing data. Nucleic Acids Res, 38, e164.
51. McLaren,W., Pritchard,B., Rios,D., Chen,Y.A., Flicek,P. andCunningham,F. (2010) Deriving the consequences of genomicvariants with the Ensembl API and SNP Effect Predictor.Bioinformatics, 26, 2069–2070.
W158 Nucleic Acids Research, 2013, Vol. 41, Web Server issue
by guest on June 22, 2013http://nar.oxfordjournals.org/
Dow
nloaded from