Growth dynamics in a mixed-species plantation of< i> Eucalyptus globulus and< i> Acacia mearnsii
15
Growth dynamics in a mixed-species plantation of Eucalyptus globulus and Acacia mearnsii David I. Forrester a,b,* , Ju ¨rgen Bauhus a,b , Partap K. Khanna c,1 a School of Resources, Environment and Society, The Australian National University, Canberra, ACT 0200, Australia b Cooperative Research Centre for Greenhouse Accounting, GPO Box 475, Canberra, ACT 2601, Australia c CSIRO Forestry and Forest Products, P.O. Box E4008, Kingston, ACT 2611, Australia Abstract Previous work has shown greater productivity in mixed than in mono-specific stands of Eucalyptus globulus and Acacia mearnsii at age 3 and 6.5 years. To assess how long the synergistic effects of acacias on eucalypts in mixed stands would last, and what future trajectory growth might take, we investigated the growth dynamics of mixed and mono-specific plantations over the first 11 years since establishment. Monocultures of E. globulus (E) and A. mearnsii (A) and mixtures (75E:25A, 50E:50A, 25E:75A) of these species were planted following a species replacement series. At the tree level, eucalypt and acacia heights, diameters, volumes and above- ground biomass were higher in mixtures than in monocultures 3–4 years after planting. Similarly, at the stand level, volumes and above-ground biomass were significantly greater in mixtures than monocultures after 3–4 years. The difference in productivity between mixed plots and mono-specific eucalypt stands increased with time from 3 to 11 years after establishment. Litterfall was higher in the mixed stands than the monocultures, and this led to an increase in N and P cycling through litterfall in stands containing A. mearnsii. The study indicated that above-ground biomass accumulation in E. globulus plantations can be increased by acacia admixture. This can partially be explained by canopy stratification and improved nutrition of eucalypts. Although the biomass production in acacias peaked early, the synergistic effect of the acacias appears to be long lasting as was indicated by the increasing differences between mixed and pure stands. # 2004 Elsevier B.V. All rights reserved. Keywords: Acacia mearnsii; Competition; Eucalyptus globulus; Mixed-species plantations 1. Introduction Mixed-species plantations have the potential to improve nutrient cycling (Binkley et al., 1992), soil fertility (Montagnini, 2000), biomass production (DeBell et al., 1985; Parrotta, 1999; van Winden, 2001) and carbon sequestration (Kaye et al., 2000; Resh et al., 2002) while providing other benefits through a diversification of products (Montagnini et al., 1995; Khanna, 1997; Montagnini, 2000), improved risk management and protection from pests and diseases (Ewel, 1986; FAO, 1995; Montagnini, 2000). In addition, they can function as a silvicultural system for growing high value timber (Ewel, 1986; Keenan et al., 1995; Montagnini et al., 1995; DeBell et al., 1997). Forest Ecology and Management 193 (2004) 81–95 * Corresponding author. Tel.: þ61-2-6125-2623; fax: þ61-2-6249-0746. E-mail address: [email protected] (D.I. Forrester). 1 Present address: Institute of Soil Science and Forest Nutrition, Go ¨ttingen University, Bu ¨sgenweg 2, 37077 Go ¨ttingen, Germany. 0378-1127/$ – see front matter # 2004 Elsevier B.V. All rights reserved. doi:10.1016/j.foreco.2004.01.024
-
Upload
uni-freiburg -
Category
Documents
-
view
0 -
download
0
Transcript of Growth dynamics in a mixed-species plantation of< i> Eucalyptus globulus and< i> Acacia mearnsii
Growth dynamics in a mixed-species plantation ofEucalyptus globulus and Acacia mearnsii
David I. Forrestera,b,*, Jurgen Bauhusa,b, Partap K. Khannac,1
aSchool of Resources, Environment and Society, The Australian National University, Canberra, ACT 0200, AustraliabCooperative Research Centre for Greenhouse Accounting, GPO Box 475, Canberra, ACT 2601, Australia
cCSIRO Forestry and Forest Products, P.O. Box E4008, Kingston, ACT 2611, Australia
Abstract
Previous work has shown greater productivity in mixed than in mono-specific stands of Eucalyptus globulus and Acacia
mearnsii at age 3 and 6.5 years. To assess how long the synergistic effects of acacias on eucalypts in mixed stands would last, and
what future trajectory growth might take, we investigated the growth dynamics of mixed and mono-specific plantations over the
first 11 years since establishment.
Monocultures of E. globulus (E) and A. mearnsii (A) and mixtures (75E:25A, 50E:50A, 25E:75A) of these species were
planted following a species replacement series. At the tree level, eucalypt and acacia heights, diameters, volumes and above-
ground biomass were higher in mixtures than in monocultures 3–4 years after planting. Similarly, at the stand level, volumes and
above-ground biomass were significantly greater in mixtures than monocultures after 3–4 years. The difference in productivity
between mixed plots and mono-specific eucalypt stands increased with time from 3 to 11 years after establishment. Litterfall was
higher in the mixed stands than the monocultures, and this led to an increase in N and P cycling through litterfall in stands
containing A. mearnsii.
The study indicated that above-ground biomass accumulation in E. globulus plantations can be increased by acacia admixture.
This can partially be explained by canopy stratification and improved nutrition of eucalypts. Although the biomass production in
acacias peaked early, the synergistic effect of the acacias appears to be long lasting as was indicated by the increasing differences
between mixed and pure stands.
# 2004 Elsevier B.V. All rights reserved.
Keywords: Acacia mearnsii; Competition; Eucalyptus globulus; Mixed-species plantations
1. Introduction
Mixed-species plantations have the potential to
improve nutrient cycling (Binkley et al., 1992), soil
fertility (Montagnini, 2000), biomass production
(DeBell et al., 1985; Parrotta, 1999; van Winden,
2001) and carbon sequestration (Kaye et al., 2000;
Resh et al., 2002) while providing other benefits
through a diversification of products (Montagnini
et al., 1995; Khanna, 1997; Montagnini, 2000),
improved risk management and protection from pests
and diseases (Ewel, 1986; FAO, 1995; Montagnini,
2000). In addition, they can function as a silvicultural
system for growing high value timber (Ewel, 1986;
Keenan et al., 1995; Montagnini et al., 1995; DeBell
et al., 1997).
Forest Ecology and Management 193 (2004) 81–95
* Corresponding author. Tel.: þ61-2-6125-2623;
fax: þ61-2-6249-0746.
E-mail address: [email protected] (D.I. Forrester).1 Present address: Institute of Soil Science and Forest Nutrition,
Gottingen University, Busgenweg 2, 37077 Gottingen, Germany.
0378-1127/$ – see front matter # 2004 Elsevier B.V. All rights reserved.
doi:10.1016/j.foreco.2004.01.024
Several authors have demonstrated the growth
advantages of mixed-species plantations containing
Eucalyptus and discussed the interactions that may be
responsible for these to occur (Binkley et al., 1992;
DeBell et al., 1997; Khanna, 1997, 1998; Bauhus et al.,
2000; Binkley et al., 2000). However, there are also
examples where there has been little or no growth
advantage (DeBell et al., 1987) or where one species
has suppressed the growth of another (Turvey et al.,
1984; Binkley and Gardina, 1997; Hunt et al., 1999;
Parrotta, 1999). To understand why some species
combinations have yielded less than mono-specific
stands, it is necessary to examine the ecological
interactions in mixed species plantations more closely.
Theoretically there are three types of interactions in
mixed stands of trees: competition, competitive reduc-
tion and facilitation (Vandermeer, 1989; Kelty, 1992).
Competition occurs when two or more plants or
populations interact so that at least one exerts a
negative effect on the other (growth or mortality)
(Vandermeer, 1989). Competitive reduction in a mix-
ture, also known as complementarity or the competi-
tive production principle, occurs when the inter-
specific competition for a limiting resource is less
than that in the monocultures (Kelty and Cameron,
1995). This often occurs when there is a partitioning of
either above-ground (light) or below-ground resources
(water or nutrients) (Kelty and Cameron, 1995) that
leads to niche separation and ultimately a more effi-
cient use of site resources. Facilitation occurs when
one species has a positive effect on another (Vanderm-
eer, 1989), for example, when a nitrogen-fixing spe-
cies increases the growth of the other by increasing
nitrogen (N) availability.
When positive interactions are dominant (facilita-
tion or competitive reduction), mixed stands should be
more productive than monocultures. However, if the
inter-specific competition is greater than these positive
interactions, mixtures will be less productive. It is
difficult to forecast the outcome of the various inter-
actions in mixed stands, and the nature of these
interactions may change as the stands develop. This
makes predictions of potentially successful species
combinations, optimal proportions and suitable sites
for the combinations difficult until a rotation has been
completed. Few studies have examined the growth
dynamics of mixed-species plantations of Eucalyptus
with a N-fixing species and these have been in
the tropics (DeBell et al., 1997; Parrotta, 1999;
Wichiennopparat et al., 1998). The aim of this
paper is to examine the growth dynamics and inter-
actions within a mixed stand of Eucalyptus globulus
ssp. pseudoglobulus (Naudin ex Maiden) Kirkpatr. and
Acacia mearnsii De Wild. in temperate Australia to
identify which processes may lead to an increase in
productivity, and how the ecological interactions
between the two species may change over time. Earlier
studies have shown that the mixtures in this trial were
more productive than the monocultures at age 3 years
(Khanna, 1997) and 6.5 years (Bauhus et al., 2000).
This paper provides the combined results of the trial at
age 11 years. Litterfall data from age 9 to 10 years are
also included.
2. Materials and methods
2.1. Site characteristics
The experimental trial is located 5 km south-east of
Cann River in East Gippsland, Vic., Australia. Prior
to establishment the vegetation on the site was dry
sclerophyll forest dominated by Eucalyptus sieberi
(L. Johnson). The site is about 100–120 m above sea
level on undulating terrain with slopes of 10–32%. The
soil is a yellow podzolic with a high content of coarse
sand (Stace et al., 1968). Initial soil (0–5 cm depth)
N concentration was 1.10 g kg�1 and Bray I-P (Bray
and Kurtz, 1945) concentration was 1.6 mg kg�1. The
average annual rainfall at Cann River (1951–1973) is
1009 mm and evenly distributed throughout the year
(Bureau of Meteorology, 2002). The mean daily mini-
mum and maximum temperatures are 7.8 and 20.5 8C,
respectively (Bureau of Meteorology, 2002).
2.2. Experimental design
Eucalyptus globulus ssp. pseudoglobulus and
Acacia mearnsii were planted at five species propor-
tions: 100% E. globulus (100E), 75% E. globulus þ25% A. mearnsii (75E:25A), 50% E. globulus þ 50%
A. mearnsii (50E:50A), 25% E. globulus þ 75%
A. mearnsii (25E:75A) and 100% A. mearnsii
(100A). This replacement series was planted at two
densities (2 m � 3:3 m and 3 m � 3:3 m). Plots were
arranged in a randomised block design with four
82 D.I. Forrester et al. / Forest Ecology and Management 193 (2004) 81–95
replicate blocks. Plot size was 23 m � 28 m including
a surrounding row of buffer trees. Excluding buffer
trees there were 60 trees per plot at the 2 m � 3:3 m
spacing and 35 trees per plot at the 3 m � 3:3 m
spacing. In the mixed-species plots trees were mixed
within rows, resulting in a checkerboard arrangement.
E. globulus seedlings were planted in early July 1992
and A. mearnsii in early October 1992. The stands
were fertilised with 25 kg P ha�1 in the form of super-
phosphate in November 1992. More detail about the
site and plantation establishment is provided by
Khanna (1997) and Bauhus et al. (2000).
It is important to note that by using a replacement
series design it is not possible to separate the inter- and
intra-specific interactions (Sackville Hamilton, 1994).
However, it is possible to determine whether inter- and
intra-specific competition are equal or unequal (Sack-
ville Hamilton, 1994), which is the more important
question in this study.
2.3. Growth measurements
To assess the effect of mixture and density treatments
on growth, height, diameter at breast height (1.3 m)
over bark (D), volume, biomass and survival were
compared at about 3–5, 6.5, 9 and 11 years of age.
Tree heights (H) were measured for a subset of trees and
allometric equations were constructed to estimate the
height of the remaining trees (van Winden, 2001).
Similarly, allometric equations were used to estimate
total stem volume (under bark) and above-ground
biomass. The allometric equations for A. mearnsii were
derived from a sample of eight trees (D from 3.9 to
20.6 cm) harvested at age 10 years. Additional destruc-
tive sampling would have compromised the integrity of
the trial before it reached maturity.
The regression equations relating total A. mearnsii
stem volume under bark (m3) and total A. mearnsii
above-ground biomass (kg) to diameter at breast
height over bark (D; cm) were:
lnðtotal above-ground biomassÞ¼ �1:29 þ 2:168 lnðDÞ ðAdj r2 ¼ 0:978;P < 0:001Þ
(1)
lnðstem volume underbarkÞ¼ �8:359 þ 2:265 lnðDÞ ðAdj r2 ¼ 0:992;P < 0:001Þ
(2)
Total stem volume and above-ground biomass of E.
globulus was estimated from allometric equations
developed by Bennett et al. (1997) for E. globulus
ssp. pseudoglobulus of age 6 years in East Gippsland
that spanned the same size range. Bennett et al. (1997)
found no significant effect of site or fertiliser on these
equations. DeBell et al. (1997) found that biomass
equations for Eucalyptus saligna and Albizia falca-
taria could be applied to older but similar sized
mixtures or monocultures. Thus it was assumed that
these equations could be applied across treatments and
to the older but similar sized trees in this trial. Growth
rates were calculated as the mean annual increment
(MAI) for a given variable, for example, biomass, as
follows:
MAI ¼ Biomass at n years
n(3)
2.4. Litter collection and nutrient content
Litterfall, including leaves, flowers, fruits, bark and
twigs (<10 mm diameter), was collected in circular
mesh traps (<1 mm) with a circumference of 2.5 m
(0.5 m2, and 30 cm deep). Traps were suspended 1 m
above the ground and litter was collected every 1–2
months for 1 year from 9.25 years (September 2001) to
10.25 years of age (September 2002). The litter traps
were placed systematically within the plots so that the
proportion of E. globulus and A. mearnsii surrounding
the traps corresponded to the proportion of E. globulus
and A. mearnsii in the plot. Three traps were used per
plot (12 per treatment) and these were bulked for
analysis (four per treatment).
Litter samples were sorted into the various litter
components; E. globulus leaves, E. globulus twigs, E.
globulus bark, A. mearnsii twigs and A. mearnsii other
(leaves, seed/seedpods and flowers). The components
of ‘A. mearnsii other’ were not separated due to the
small size of the leaflets, flowers and seed. Samples
were weighed after drying to constant weight at 50 8Cfor 1 week.
To determine N and P concentrations, ground
and dried litter components were digested in digestion
acid (potassium sulphate dissolved in concentrated
sulphuric acid) and hydrogen peroxide (modified
from Heffernan, 1985). Total N and P were deter-
mined simultaneously in a continuous flow system
D.I. Forrester et al. / Forest Ecology and Management 193 (2004) 81–95 83
(Technicon1 TRAACS 800TM). N and P concentra-
tions were determined for bulked samples (of a given
litter component) consisting of sub-samples collected
at different times of the year.
2.5. Statistical techniques
Differences between treatments in tree and stand
characteristics were tested using ANOVA and Resi-
dual Maximum Likelihood (REML) in GenstatTM
(Genstat 5 Committee, 1997). REML was used to
analyse A. mearnsii data because the 100A treatment
at both the 2 m � 3:3 m and 3 m � 3:3 m spacings
were missing from one block, making the design
unbalanced. Treatment effects in the REML analysis
were assessed by Wald statistics, which are distributed
as chi-squared. The nature of the response to increas-
ing proportions of E. globulus or A. mearnsii was
examined by subdividing the treatment sums of
squares into linear and quadratic terms. The standard
errors of difference (S.E.D.s) for comparison of treat-
ment means are provided.
3. Results
3.1. Mortality
At age 8 months, survival ranged from 97 to 99%
for E. globulus and 95 to 100% for A. mearnsii
(3 m � 3:3 m spacing). Tree survival at age 11 years
was very high in all treatments averaging 93% (for
the 3 m � 3:3 m spacing survival was 92–94% for E.
globulus and 94 to 97% for A. mearnsii). The change
in species proportions was not more than 2% in any
plot and so the original species proportions have
been kept in the following sections. Survival was
not significantly different between the 3 m � 3:3 m
and 2 m � 3:3 m spacing for either species (P >0:05). Survival appeared to be higher in mixtures
than in monocultures although this difference was
significant for A. mearnsii (P ¼ 0:004) but not for E.
globulus (P ¼ 0:745). This effect of mixtures was
most pronounced for A. mearnsii at the 3 m � 3:3 m
spacing where A. mearnsii survival increased with
the percentage of E. globulus. There was no signifi-
cant interaction between spacing and mixture treat-
ments.
3.2. Height growth
The variability of stand characteristics in monocul-
tures at age 11 years of A. mearnsii was considerably
less than E. globulus as shown by the standard devia-
tions (Table 1). Acacia mearnsii admixture signifi-
cantly increased E. globulus height growth after only 2
years (P ¼ 0:045) (Fig. 1). Eucalyptus globulus height
tended to increase with the percentage of A. mearnsii;
the tallest E. globulus trees were in treatments
50E:50A and 25E:75A. The mean annual E. globulus
height increment peaked at 33 months, when it ranged
from 1.6 m year�1 in 100E to 2.2 m year�1 in
50E:50A. Eucalyptus globulus at the 3 m � 3:3 m
spacing were significantly taller (0.94 m; P ¼0:044) than those at the 2 m � 3:3 m spacing
(0.82 m) from age 0.7 years. The effects of density
and mixture were maintained to age 11 years but
there was no density � mixture interaction so only
data from the 2 m � 3:3 m spacing are provided
(Fig. 1).
Acacia mearnsii also benefited from growing in
mixture. Its height growth increased with the propor-
tion of E. globulus (Fig. 1) and these differences were
significant from age 2 years onwards (w2 ¼ 30:9 with
3 d.f.). This relative height difference between the
mixtures and A. mearnsii monoculture was maintained
to age 11 years. Mean annual A. mearnsii height
increment peaked at age 1.7 years, when it was
between 2.3 in 100A and 2.5 m year�1 in 75E:25A.
Acacia mearnsii trees at the 3 m � 3:3 m spacing were
significantly taller (3.2 m; w2 ¼ 4 with 1 d.f.) than
those at the 2 m � 3:3 m spacing (2.7 m) from age 1.7
years and this difference was maintained to age 11
years. There was no density � mixture interaction.
Table 1
Stand characteristics for E. globulus and A. mearnsii monocultures
after 11 years of growth
Parameter E. globulus A. mearnsii
Height (m) 14.1 (3.4) 10.5 (1.1)
Diameter (cm) 10.0 (3.9) 11.2 (2.9)
Stand basal area (m2 ha�1) 11.9 (3.4) 14.1 (0.1)
Stand volume (m3 ha�1) 71.3 (22.2) 76.3 (1.1)
Stand above-ground biomass
(Mg ha�1)
47.1 (14.5) 75.4 (0.5)
Data from 2 m � 3:3 m spacing. Standard deviations of means in
parentheses.
84 D.I. Forrester et al. / Forest Ecology and Management 193 (2004) 81–95
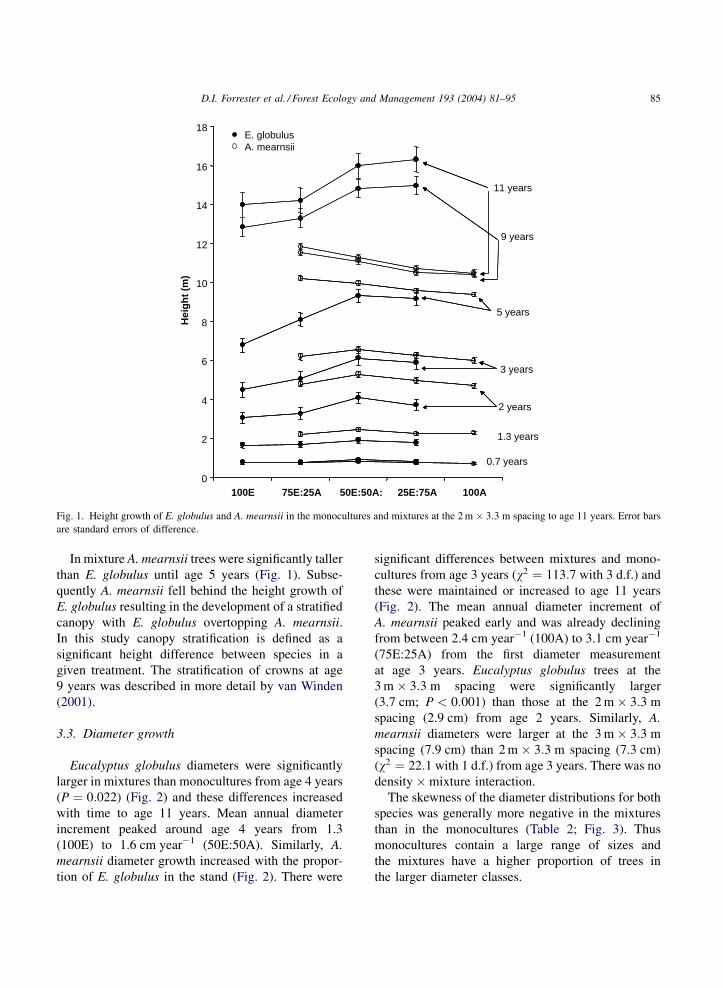
In mixture A. mearnsii trees were significantly taller
than E. globulus until age 5 years (Fig. 1). Subse-
quently A. mearnsii fell behind the height growth of
E. globulus resulting in the development of a stratified
canopy with E. globulus overtopping A. mearnsii.
In this study canopy stratification is defined as a
significant height difference between species in a
given treatment. The stratification of crowns at age
9 years was described in more detail by van Winden
(2001).
3.3. Diameter growth
Eucalyptus globulus diameters were significantly
larger in mixtures than monocultures from age 4 years
(P ¼ 0:022) (Fig. 2) and these differences increased
with time to age 11 years. Mean annual diameter
increment peaked around age 4 years from 1.3
(100E) to 1.6 cm year�1 (50E:50A). Similarly, A.
mearnsii diameter growth increased with the propor-
tion of E. globulus in the stand (Fig. 2). There were
significant differences between mixtures and mono-
cultures from age 3 years (w2 ¼ 113:7 with 3 d.f.) and
these were maintained or increased to age 11 years
(Fig. 2). The mean annual diameter increment of
A. mearnsii peaked early and was already declining
from between 2.4 cm year�1 (100A) to 3.1 cm year�1
(75E:25A) from the first diameter measurement
at age 3 years. Eucalyptus globulus trees at the
3 m � 3:3 m spacing were significantly larger
(3.7 cm; P < 0:001) than those at the 2 m � 3:3 m
spacing (2.9 cm) from age 2 years. Similarly, A.
mearnsii diameters were larger at the 3 m � 3:3 m
spacing (7.9 cm) than 2 m � 3:3 m spacing (7.3 cm)
(w2 ¼ 22:1 with 1 d.f.) from age 3 years. There was no
density � mixture interaction.
The skewness of the diameter distributions for both
species was generally more negative in the mixtures
than in the monocultures (Table 2; Fig. 3). Thus
monocultures contain a large range of sizes and
the mixtures have a higher proportion of trees in
the larger diameter classes.
0
2
4
6
8
10
12
14
16
18
100E 75E:25A 50E:50A: 25E:75A 100A
Hei
gh
t (m
)
2 years
1.3 years
3 years
5 years
9 years
11 years
E. globulusA. mearnsii
0.7 years
Fig. 1. Height growth of E. globulus and A. mearnsii in the monocultures and mixtures at the 2 m � 3:3 m spacing to age 11 years. Error bars
are standard errors of difference.
D.I. Forrester et al. / Forest Ecology and Management 193 (2004) 81–95 85
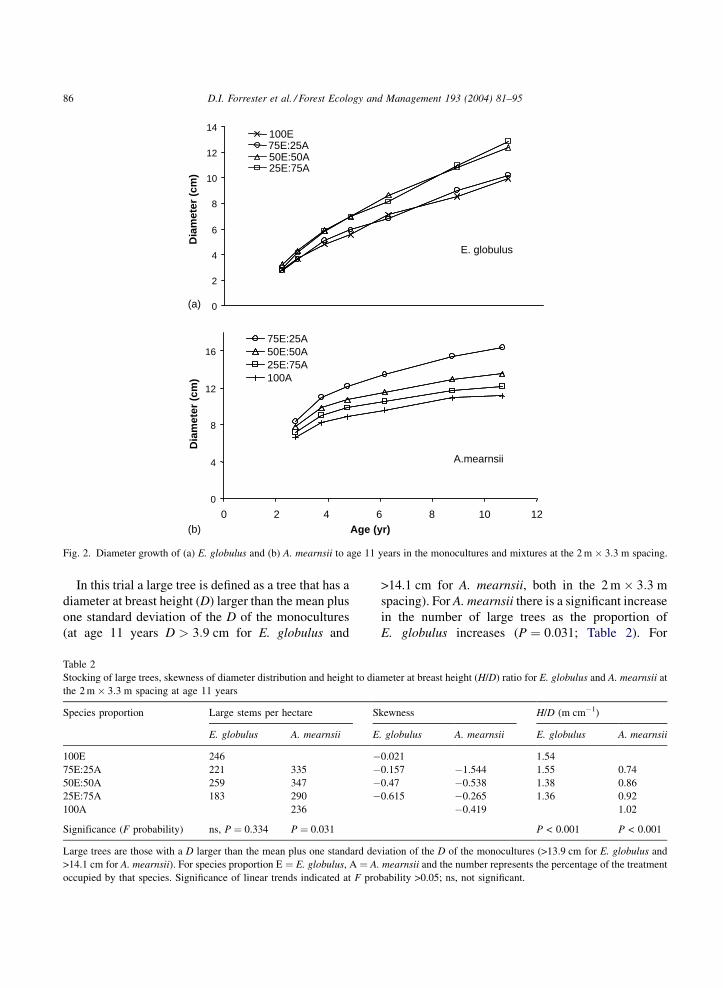
In this trial a large tree is defined as a tree that has a
diameter at breast height (D) larger than the mean plus
one standard deviation of the D of the monocultures
(at age 11 years D > 3:9 cm for E. globulus and
>14.1 cm for A. mearnsii, both in the 2 m � 3:3 m
spacing). For A. mearnsii there is a significant increase
in the number of large trees as the proportion of
E. globulus increases (P ¼ 0:031; Table 2). For
0
4
8
12
16
0 2 4 6 8 10 12Age (yr)
Dia
met
er (
cm)
75E:25A50E:50A25E:75A100A
A.mearnsii
0
2
4
6
8
10
12
14
Dia
met
er (
cm)
100E
50E:50A25E:75A
75E:25A
E. globulus
(a)
(b)
Fig. 2. Diameter growth of (a) E. globulus and (b) A. mearnsii to age 11 years in the monocultures and mixtures at the 2 m � 3:3 m spacing.
Table 2
Stocking of large trees, skewness of diameter distribution and height to diameter at breast height (H/D) ratio for E. globulus and A. mearnsii at
the 2 m � 3:3 m spacing at age 11 years
Species proportion Large stems per hectare Skewness H/D (m cm�1)
E. globulus A. mearnsii E. globulus A. mearnsii E. globulus A. mearnsii
100E 246 �0.021 1.54
75E:25A 221 335 �0.157 �1.544 1.55 0.74
50E:50A 259 347 �0.47 �0.538 1.38 0.86
25E:75A 183 290 �0.615 �0.265 1.36 0.92
100A 236 �0.419 1.02
Significance (F probability) ns, P ¼ 0.334 P ¼ 0.031 P < 0.001 P < 0.001
Large trees are those with a D larger than the mean plus one standard deviation of the D of the monocultures (>13.9 cm for E. globulus and
>14.1 cm for A. mearnsii). For species proportion E ¼ E. globulus, A ¼ A. mearnsii and the number represents the percentage of the treatment
occupied by that species. Significance of linear trends indicated at F probability >0.05; ns, not significant.
86 D.I. Forrester et al. / Forest Ecology and Management 193 (2004) 81–95

E. globulus there was no significant trend in the
number of large trees (P ¼ 0:334; Table 2).
At age 11 years the height/diameter ratio (H/D,
in m cm�1) of E. globulus decreased as the proportion
of A. mearnsii increased (P < 0:001) (Table 2). The
H/D was also higher at the 2 m � 3:3 m spacing
(1.49 m cm�1) than at the 3 m � 3:3 m spacing
(1.37 m cm�1) (P < 0:001). Similarly the H/D of
A. mearnsii decreased as the proportion of E. globulus
increased (P < 0:001) and the H/D was also higher
at the 2 m � 3:3 m spacing (0.92 m cm�1) than at
the 3 m � 3:3 m spacing (0.82 m cm�1) (w2 ¼ 29:9
with 1 d.f.) (Table 2). There was no density � mixture
interaction for either species.
3.4. Above-ground biomass and stem volume
The above-ground biomass and stem volume cal-
culated on a single tree basis were greater in mixtures
than monocultures from about age 3 years for
A. mearnsii and 4 years for E. globulus (P < 0:05;
data not shown). Acacia mearnsii trees in the 75E:25A
were 119 and 120% larger in terms of above-ground
biomass and stem volume, respectively, than those in
0
100
200
300
400
500
1.5 4.5 7.5 10.5 13.5 16.5
Diameter class (cm)
Ste
ms
ha-
1
100E
75E25A
50E50A
25E75A
13.9
0
100
200
300
400
500
600
700
1.5 4.5 7.5 10.5 13.5 16.5 >18
Diameter class (cm)
Ste
ms
ha-
1
14.1
(a)
(b)
E. globulus
A. mearnsii75E25A
50E50A25E75A
100A
Fig. 3. Diameter distributions of (a) E. globulus and (b) A. mearnsii at age 11 years in the monocultures and mixtures at the 2 m � 3:3 m
spacing.
D.I. Forrester et al. / Forest Ecology and Management 193 (2004) 81–95 87

the A. mearnsii monoculture at age 11 years. Tree
volume and biomass tended to increase with the
proportion of associated species.
At stand level, above-ground biomass (Fig. 4;
Table 3) was higher in mixtures than either mono-
culture at age 11 years. If there had been no overall
positive or negative interaction in mixture, then E.
globulus trees in the 50E:50A treatment would pro-
duce 50% of the volume produced in the 100E, how-
ever they produced about 80%. The growth advantages
in mixture increased with age; at age 3 years E.
globulus in 50E:50A produced 67% of the stand
above-ground biomass than in 100E and by age 11
years this increased to 79%. Despite the accelerated
growth rates, the total biomass production of a reduced
number of trees for a given species in mixture did not
reach the level achieved in monoculture after 11 years
of growth.
The MAI in A. mearnsii stem volume and biomass
started to decrease after about age 4 years when
expressed at the tree or the stand level (data for stand
biomass are shown in Fig. 5). In contrast, E. globulus
did not exhibit such a rapid, early culmination of
growth and the MAI of volume and biomass was still
increasing at age 11 years. At the stand level the MAI
of stand biomass was declining prior to age 4 years
0
20
40
60
80
100
120
100E 75E:25A 50E:50A: 25E:75A 100A
To
tal s
tan
d b
iom
ass
(Mg
ha-1
)
3 years4 years5 years6 years9 years11 years
Fig. 4. Development of above-ground stand biomass to age 11 years in the monocultures and mixtures of E. globulus and A. mearnsii at the
2 m � 3:3 m spacing.
Table 3
Above-ground stand biomass (Mg ha�1) at age 11 years in the monoculture and mixtures of E. globulus and A. mearnsii
Stand component Density Species proportion S.E.D.
100E 75E:25A 50E:50A 25E:75A 100A
E. globulus 2 m � 3.3 m 47.1x 39.6x 37.2x 20.6x 5.4
3 m � 3.3 m 47.0x 46.1x 38.9x 19.8x 5.4
A. mearnsii 2 m � 3.3 m 45.5x 61.4x 73.8x 75.8x 3.5
3 m � 3.3 m 38.0y 54.2y 63.2y 76.7x 3.5
Total 2 m � 3.3 m 47.1a,x 85.1b,c,x 98.5d,x 94.4c,d,x 75.5b,x 5.2
3 m � 3.3 m 47.0a,x 84.1b,c,x 93.1c,x 88.0c,x 76.7b,x 5.2
For species proportion E ¼ E. globulus, A ¼ A. mearnsii and the number represents the percentage of the treatment occupied by that species.
S.E.D., standard error of difference. Means sharing the same letters (a, b, c or d) are not significantly different at P < 0:05 across a given row.
Means sharing the same letters (x or y) are not significantly different at P < 0:05 for a given species proportion and stand component.
88 D.I. Forrester et al. / Forest Ecology and Management 193 (2004) 81–95

when there was 50% or more A. mearnsii (Fig. 5), and
the decline was more rapid when there was a higher
proportion of A. mearnsii in the stand.
After 11 years of growth and at the level of the
stand, there was no significant difference in E. glo-
bulus above-ground biomass between the 2 and 3 m
spacings for a given mixture (P ¼ 0:844); the larger
trees in the wider spacing compensated for the lower
number of stems (Table 3). However, while A.
mearnsii trees were larger in the wider spacing this
did not compensate for the higher number of stems at
the closer spacing that produced significantly higher
above-ground biomass in all mixtures than the wider
spacing at age 11 years (w2 ¼ 8:4 with 1 d.f.)
(Table 3). With both species combined the total stand
above-ground biomass was not significantly different
between the 2 m � 3:3 m or 3 m � 3:3 m spacing at
age 11 years (P ¼ 0:662). There was no density �mixture interaction for E. globulus, A. mearnsii or
total stand above-ground biomass at age 11 years.
0
2
4
6
8
10
12
0 2 4 6 8 10 12
Age (yr)
Ab
ove
-gro
un
d b
iom
ass
incr
emen
t (M
g h
a-1 yr
-1) 100E
75E:25A50E:50A25E:75A100A
Fig. 5. Mean annual increment of stand above-ground biomass (Mg ha�1 year�1) to age 11 years in the monocultures and mixtures of E.
globulus and A. mearnsii at the 2 m � 3:3 m spacing.
Fig. 6. Annual litterfall (kg ha�1 year�1) in the monocultures and mixtures of E. globulus and A. mearnsii from age 10.25 to 11.25 years, at
the 2 m � 3:3 m spacing. Means sharing the same letters are not significantly different at P < 0:05.
D.I. Forrester et al. / Forest Ecology and Management 193 (2004) 81–95 89
The trends observed for stand above-ground biomass
were also observed for stand volume (data not
shown).
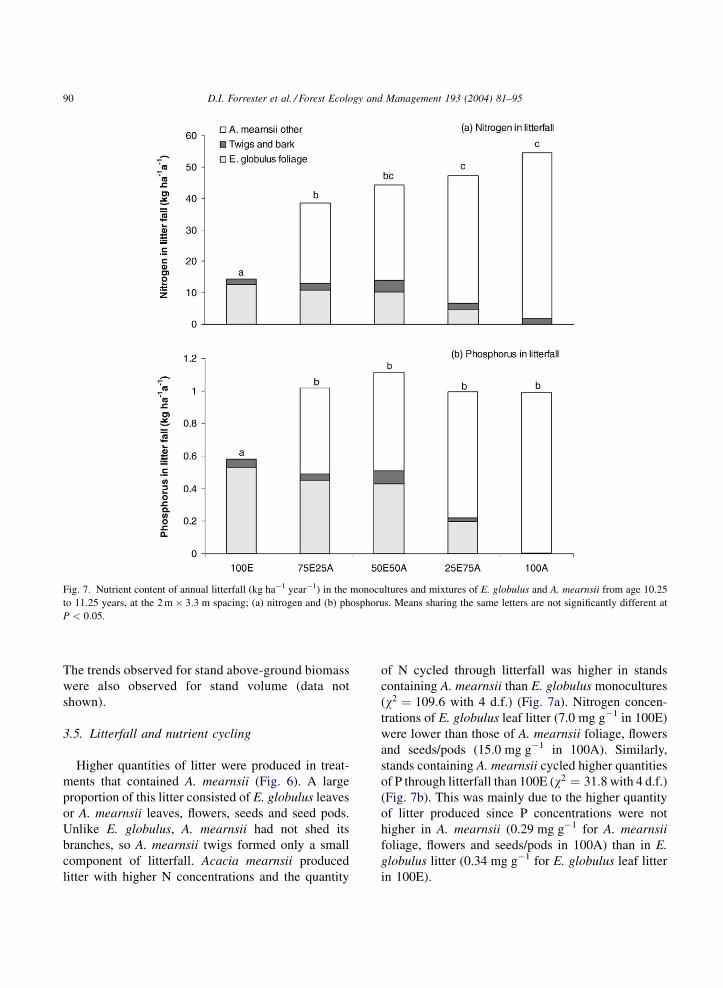
3.5. Litterfall and nutrient cycling
Higher quantities of litter were produced in treat-
ments that contained A. mearnsii (Fig. 6). A large
proportion of this litter consisted of E. globulus leaves
or A. mearnsii leaves, flowers, seeds and seed pods.
Unlike E. globulus, A. mearnsii had not shed its
branches, so A. mearnsii twigs formed only a small
component of litterfall. Acacia mearnsii produced
litter with higher N concentrations and the quantity
of N cycled through litterfall was higher in stands
containing A. mearnsii than E. globulus monocultures
(w2 ¼ 109:6 with 4 d.f.) (Fig. 7a). Nitrogen concen-
trations of E. globulus leaf litter (7.0 mg g�1 in 100E)
were lower than those of A. mearnsii foliage, flowers
and seeds/pods (15.0 mg g�1 in 100A). Similarly,
stands containing A. mearnsii cycled higher quantities
of P through litterfall than 100E (w2 ¼ 31:8 with 4 d.f.)
(Fig. 7b). This was mainly due to the higher quantity
of litter produced since P concentrations were not
higher in A. mearnsii (0.29 mg g�1 for A. mearnsii
foliage, flowers and seeds/pods in 100A) than in E.
globulus litter (0.34 mg g�1 for E. globulus leaf litter
in 100E).
Fig. 7. Nutrient content of annual litterfall (kg ha�1 year�1) in the monocultures and mixtures of E. globulus and A. mearnsii from age 10.25
to 11.25 years, at the 2 m � 3:3 m spacing; (a) nitrogen and (b) phosphorus. Means sharing the same letters are not significantly different at
P < 0:05.
90 D.I. Forrester et al. / Forest Ecology and Management 193 (2004) 81–95
4. Discussion
4.1. Ecological interactions
The net result of species interactions on growth
indicated the dominance of positive interactions (facil-
itation and competitive reduction), as evidenced by
increased productivity in mixtures, over negative
(competitive) interactions. While these interactions
rarely occur in isolation, it is important to know
how these interactions affected tree growth and how
their influence changed as the stands developed. The
interactions and their contributions to the growth
dynamics of E. globulus and A. mearnsii are discussed
below.
4.1.1. Competition and competitive reduction
The fact that survival of both species in mixtures,
despite the larger tree sizes, was as high if not higher
than in monocultures indicates that the inter-specific
competition in mixture was less than that in monocul-
tures. This has led to higher growth of trees of both
species in mixture and indicates that facilitation or
competitive reduction must have dominated species
interactions. Similarly, the survival and growth of
E. saligna increased when mixed with A. falcataria
in Hawaii (DeBell et al., 1997). This was explained by
the corresponding increase in spacing between E. sal-
igna trees, reducing intra-specific competition, and
enhancing tree nutrient status (DeBell et al., 1997).
Differences in carbon (C) allocation in trees can be
used to indicate the main source of growth limitation
(Waring, 1987). Increases in resource availability
(such as nutrients) can lead to a reduction in C
allocation to roots (Keith et al., 1997; Giardina and
Ryan, 2002) and increase stem taper (Waring, 1987),
while shading tends to reduce root growth and stem
taper (Waring, 1987). The height to diameter ratio (H/
D), which is a measure of tree shape, may be used to
indicate the level of competition in even-aged tree
populations (Abetz, 1976). As competition for light
increases relative to competition for below-ground
resources, trees will allocate more C to height than
to diameter or root growth to maintain their position
in the canopy, and the H/D will increase (Bauhus
et al., 2000). In this stand, below-ground competition
appeared to be similar between species and treatments
since fine-root biomass and fine-root length density in
the top 30 cm of soil were similar for all species
combinations, and fine root architecture and vertical
stratification were also similar for A. mearnsii and
E. globulus at age 6.5 years (Bauhus et al., 2000). Thus
it was assumed that the H/D was influenced more by
changes in competition for light than below-ground
resources.
The H/D was higher among E. globulus than
A. mearnsii (Table 2). Eucalyptus globulus appears
to be less shade tolerant than A. mearnsii since it did
not maintain foliage less than 9 m above ground while
the A. mearnsii canopies extended to 2–5 m above-
ground in the 9-year-old stands. Light levels beneath
the canopies of the E. globulus and A. mearnsii
monocultures were 44 and 18% of photosynthetically
active radiation in the open, respectively (van Winden,
2001). Thus the higher H/D in E. globulus may be
explained by stronger effects of light competition
on this species than A. mearnsii. For both species,
the H/D declined as the proportion of the associated
species increased, suggesting that the competition for
light declined for both species when planted with the
other. This trend was also reported for A. mearnsii by
Bauhus et al. (2000) at age 6.5 years. Given the greater
shade tolerance of A. mearnsii, it is not surprising that
an individual A. mearnsii tree will grow better next to a
E. globulus tree than another A. mearnsii.
For a shade intolerant genus such as Eucalyptus
(Florence, 1996) this competitive reduction interac-
tion could be important for their continued vigour in
mixed stands. Thus it will be important to ensure that
the height growth of E. globulus or other shade-intol-
erant species can match that of the N-fixing species
and eventually overtop it. Selecting species with
compatible height growth at a given site is important
so that both can establish and develop into a stand
where facilitative or competitive reduction interac-
tions are maximised and competitive interactions
minimised.
The competitive reduction for light for E. globulus
was probably influenced by canopy stratification at
later stages of stand development (by age 9 years
E. globulus was taller than A. mearnsii). Canopy
stratification also developed in mixtures of E. saligna
and A. falcataria in Hawaii. In these stands, the growth
of E. saligna increased with the proportion of
A. falcataria. Acacia falcataria, even though it is
considered to be a shade intolerant species, survived
D.I. Forrester et al. / Forest Ecology and Management 193 (2004) 81–95 91
well under the E. saligna canopy for several years
(DeBell et al., 1997).
Stem form can change for mechanical reasons.
When exposed to high winds, stems can become more
tapered (decreased H/D) to enhance stability by
increasing diameter growth, decreasing height growth
or both (Larson, 1963). Smaller H/D may have devel-
oped in mixtures where there was a rougher, two-
storied canopy. However, since both diameter and
height increased in mixtures, mechanical strengthen-
ing alone does not explain the change in the H/D.
4.1.2. Facilitation
Often the primary objective of using N-fixing spe-
cies such as A. mearnsii and A. falcataria in mixed
species plantations is to increase the N available to the
main crop or companion species. The total N in the
plant-soil system can be increased by atmospheric N
fixation (Kelty, 1992; Kelty and Cameron, 1995;
Fisher and Binkley, 2000). In addition, N availability
can increase by accelerating the rate of N cycling
without an increase in total N levels in the plant-soil
system (Kelty, 1992; Kelty and Cameron, 1995).
Either way, N is transferred between the A. mearnsii
and E. globulus via the decomposition of litter (such as
foliage and fine roots, including root exudates) and the
subsequent release of N.
The quantity of litter produced annually in 100E
(2.8 Mg ha�1) and the N (14 kg ha�1) and P (0.58
kg ha�1) that it contained was low in comparison to
other Eucalyptus plantations (3.6–11.6 Mg litter ha�1;
31–85 kg N ha�1; 1.0–4.6 kg P ha�1) (Binkley et al.,
1992; Toky and Singh, 1993; Guo and Sims, 1999;
Turner and Lambert, 2002) and native eucalypt forests
(Ashton, 1975; Attiwill et al., 1978; Turner and Lam-
bert, 2002). This reflects the low above-ground biomass
produced at the site (47.1 Mg ha�1 at age 11 years)
compared with the Eucalyptus plantations mentioned
above (100–145 Mg ha�1 at 6–8 years). Higher quan-
tities of litter were produced in treatments that con-
tained A. mearnsii (2.8 Mg ha�1 in 100E compared to
4.7 Mg ha�1 in 50E:50A) (Fig. 6). The quantity of N
cycled annually through litter fall was about three- and
four-times higher in the 50E:50A (44 kg ha�1) and
100A (54 kg ha�1) treatments, respectively, than in
100E (14 kg ha�1) (Fig. 7a). Similarly, stands contain-
ing A. mearnsii cycled higher quantities of P through
litterfall than the 100E treatment (Fig. 7b). Consistent
with these observations, E. saligna stands containing
N-fixing A. falcataria cycled more N and P in litter than
pure E. saligna stands (Binkley et al., 1992). However,
while soil N availability increased with the proportion
of A. falcataria, soil P availability declined with
increasing proportions of A. falcataria (Binkley et al.,
2000; Kaye et al., 2000). The higher P uptake by
A. falcataria may have been due to a higher absorbing
area of the roots due to associations with mycorrhizae
(Binkley and Ryan, 1998; Binkley et al., 2000) and a
higher allocation of C below-ground (Binkley and
Ryan, 1998). The high demand of N-fixing species
for P (Marschner, 1986) may increase competition
for P for Eucalyptus in mixtures. Alternatively, Binkley
et al. (2000) suggested that A. falcataria might use P
unavailable to E. saligna. This may then be cycled and
become available to the Eucalyptus. To maintain or
maximise the benefits of N fixation in mixtures it may
be necessary to add P fertilisers (Khanna, 1997, 1998).
No data was available for a comparison of fine root
turnover in these plantations. However, Khanna
(1997) showed that plants in mixture were larger in
terms of height growth from as early as age 25 months,
and E. globulus in mixture had higher N concentra-
tions in fine roots and senescent foliage when com-
pared to monocultures at age 31 and 25 months,
respectively. Since leaf litterfall had not yet com-
menced, increased growth and N concentrations must
have been due to nutrient cycling through fine roots
(Khanna, 1997).
Improved N nutrition was maintained as the stands
developed with increased E. globulus fine-root N
concentrations in mixtures evident at age 6.5 years
(Bauhus et al., 2000) and elevated E. globulus foliar
N concentrations in mixtures evident at age 9 years
(van Winden, 2001). Despite an increase in P cycled
through litterfall, its concentration in E. globulus
foliage was lower in the 50E:50A than the 100E
treatment (van Winden, 2001). However, this may
have been a dilution effect in the larger trees in
mixture. Since E. globulus grew larger in mixture,
the positive effect of increased N must have out-
weighed any negative effect of reduced P availability.
4.2. Silvicultural implications
By age 9 years, E. globulus was significantly taller
than A. mearnsii in a given mixture. In the 50E:50A
92 D.I. Forrester et al. / Forest Ecology and Management 193 (2004) 81–95

and 25E:75A all the first order neighbours of the
E. globulus are A. mearnsii so the majority of the
E. globulus in these treatments are dominant trees.
This was demonstrated by the more negatively skewed
diameter distributions in the mixtures (Table 2;
Fig. 3), showing that they do not contain the small,
suppressed trees that are found in the monocultures,
and thus growth is focused on larger trees. Further-
more, trees in mixtures had lower H/D (Table 2),
which is characteristic of a more dominant tree
(Larson, 1963).
While the diameter distributions were more nega-
tively skewed in mixture, the number of large
E. globulus trees in the 50E:50A mixture (259 stems
ha�1) was only slightly greater than that in mono-
culture (246 stems ha�1) at age 11 years. However, the
mixtures may be an attractive alternative to mono-
cultures when the desired product is large logs as the
E. globulus in the 50E:50A mixture produced about
80% of the volume produced in 100E on only half the
number of trees. Furthermore if only the largest
200 stems ha�1 are considered, the growth at both
tree and stand level follows the trends described
above, with higher growth in mixtures than mono-
cultures (data not shown). This trend is likely to
continue since E. globulus in mixtures has overtopped
A. mearnsii and thus should experience less competi-
tion for light. While A. mearnsii remains healthy it
may continue to fix N and the advantages of mixtures
could increase. If the goal was more than about 40 cm
in diameter at breast height, then the mixtures would
easily contain enough large trees to fully stock a
mature plantation. Thus the volume of the final pro-
duct at the end of the rotation may be the same as in the
monocultures, but produced over a shorter period of
time. The larger and more homogenous piece size
of eucalypts in mixture will also increase harvesting
and processing efficiency. In contrast, the yields of
E. saligna in mixtures with A. falcataria in Hawaii
were greater than those of monocultures even though
they contained only one third the number E. saligna
trees. In this stand both tree size and the number
of large E. saligna trees increased when growing in
treatments with high proportions of A. falcataria
(DeBell et al., 1997).
The slow growth (MAI 6.5 m3 ha�1) when com-
pared to other E. globulus plantations in Australia
(MAI from 8 to 45 m3 ha�1 from stands aged between
5 and 9 years) (Bennett et al., 1997; Hingston and
Galbraith, 1998) reflects the poor soil fertility. The
values of total N (1.10 g kg�1) and Bray I-available P
(1.6 mg kg�1) (Khanna, 1997) were very low. Foliar N
(10.9 mg g�1) and P (0.51 mg g�1) concentrations at
age 9 years in the E. globulus monoculture (van
Winden, 2001) were below the range for adequate
nutrition for this species (Dell et al., 2001). It is
important to remember that if soil moisture or P
availability limit tree growth, the competition by
A. mearnsii may outweigh any facilitative effects
through N-fixation for E. globulus. The failure of
some mixed-species trials, which was probably the
result of the strong influence of negative interactions,
shows the importance of careful site selection and
early silviculture.
Mixed species plantations with A. mearnsii and
E. globulus may be used in a number of silvicultural
systems such as:
(1) A. mearnsii may be thinned out to release
E. globulus and sold as an early source of income
or left to decay. As the retained A. mearnsii debris
decayed it would release more N to sustain N
cyclic at a higher level.
(2) Where thinning is not economically viable,
A. mearnsii could be retained while enough well
formed E. globulus dominants in the stand would
produce a final crop. In this case A. mearnsii may
continue to fix N.
(3) Alternatively both species could be thinned so
that the best E. globulus are retained with some
A. mearnsii. This may be advantageous where
there is a market for large A. mearnsii logs.
5. Conclusions
Acacia mearnsii admixture increased E. globulus
height and diameter growth by increasing N avail-
ability through increased N cycling. The dynamics of
diameter and height growth combined to increase stem
volume and above-ground biomass production in
mixtures compared to monocultures. This shows the
benefit of selecting a species capable of fixing sig-
nificant quantities of N and with readily decomposable
litter. Acacia mearnsii also grew larger in mixture
and this appears to result from a reduction in light
D.I. Forrester et al. / Forest Ecology and Management 193 (2004) 81–95 93
competition as indicated by the H/D. Light competi-
tion for E. globulus was reduced by canopy stratifica-
tion, illustrating the importance of selecting species
with compatible height growth patterns.
The results showed that appropriate site and species
selection and management practice (P fertiliser appli-
cation on P deficient sites) can lead to increased
growth in mixed stands. The most productive stand
in this trial was the 50E:50A mixture, which produced
1.68 times the volume and 2.09 times the above-
ground biomass of the E. globulus monoculture after
11 years. The 50E:50A mixture produced 80% of the
eucalypt stem volume in the 100E but this wood was
grown on half the number of stems.
Several important questions remain. We do not
know for how long A. mearnsii fixes N in these
mixtures. The dynamics of N-fixation with stand
age may have an important influence on silvicultural
interventions such as thinning and fertilising. It is
also not known if increases in productivity resulted
from increases in total productivity (above- and
below-ground) or a change in C allocation, or both,
a question that has implications for carbon account-
ing.
Acknowledgements
Forest and Wood Products Research and Develop-
ment Corporation provided funding for this project.
David Forrester received a scholarship from the Coop-
erative Research Centre for Greenhouse Accounting.
The experiment was established by CSIRO. DNRE
provided the site and ACIAR some financial support.
Thanks to Wenhua Xang, Dr. Marcus Schortemeyer,
Professor William Stock, Julia Dordel, Matt Forrester,
Wanda Pienkowski, Mike Connell, John Smith, Kris
Jacobsen and Mauro Davanzo for professional advice
and technical support with field and lab work. Help
with the statistical design and data analysis of parts of
this study from Robert Forrester is gratefully acknowl-
edged.
References
Abetz, P., 1976. Beitrage zum Baumwachstum. Der h/d-Wert—
Mehr als ein Schlankheitsgrad. Forst Holzwirt 31, 389–393.
Ashton, D.H., 1975. Studies of litter in Eucalyptus regnans forests.
Aust. J. Bot. 237, 413–433.
Attiwill, P.M., Guthrie, H.B., Leuning, R., 1978. Nutrient cycling
in a Eucalyptus obliqua (L’Herit) forest. 1. Litter production
and nutrient return. Aust. J. Bot. 26, 79–91.
Bauhus, J., Khanna, P.K., Menden, N., 2000. Aboveground and
belowground interactions in mixed plantations of Eucalyptus
globulus and Acacia mearnsii. Can. J. For. Res. 30, 1886–1894.
Bennett, L.T., Weston, C.J., Attiwill, P.M., 1997. Biomass, nutrient
content and growth response to fertilisers of six-year-old
Eucalyptus globulus plantations at three contrasting sites in
Gippsland, Victoria. Aust. J. Bot. 45, 103–121.
Binkley, D., Gardina, C., 1997. Nitrogen fixation in tropical forest
plantations. In: Nambiar, E.K.S., Brown, A.G. (Eds.), Manage-
ment of Soil, Nutrients and Water in Tropical Plantation
Forests. CSIRO/ACIAR, Canberra, pp. 297–337.
Binkley, D., Ryan, M.G., 1998. Net primary production and
nutrient cycling in replicated stands of Eucalyptus saligna and
Albizia facaltaria. For. Ecol. Manage. 112, 79–85.
Binkley, D., Dunkin, K.A., DeBell, D., Ryan, M.G., 1992.
Production and nutrient cycling in mixed plantations of
Eucalyptus and Albizia in Hawaii. For. Sci. 38, 393–408.
Binkley, D., Gardina, C., Bashkin, M.A., 2000. Soil phosphorus
pools and supply under the influence of Eucalyptus saligna and
nitrogen-fixing Albizia falcataria. For. Ecol. Manage. 128,
241–247.
Bray, R.H., Kurtz, L.T., 1945. Determination of total, organic and
available forms of phosphorus in soils. Soil Sci. 59, 39–45.
Bureau of Meteorology, 2002. Averages for Cann River Forestry.
Bureau of Meteorology, http://www.bom.gov.au/climate/
averages/tables/cw_084027.shtml.
DeBell, D.S., Whitesell, C.D., Schubert, T.H., 1985. Mixed
plantations of Eucalyptus and leguminous trees enhance
biomass production. USDA For. Serv. Res. Paper PSW-175, 6.
DeBell, D.S., Whitesell, C.D., Crabb, T.B., 1987. Benefits of
Eucalyptus–Albizia mixtures vary by site on Hawaii Island.
USDA For. Serv. Res. Paper PSW-187, 6.
DeBell, D.S., Cole, T.C., Whitesell, C.D., 1997. Growth, develop-
ment and yield of pure and mixed stands of Eucalyptus and
Albizia. For. Sci. 43, 286–298.
Dell, B., Malajczuk, N., Xu, D., Grove, T.S., 2001. Nutrient
Disorders in Plantation Eucalypts, 2nd ed. The Australian
Center for International Agricultural Research, Canberra,
188 pp.
Ewel, J.J., 1986. Designing agricultural ecosystems for the humid
tropics. Ann. Rev. Ecol. Syst. 17, 245–271.
FAO, 1995. Plantations in Tropical and Subtropical Regions—
Mixed and Pure. FAO of the UN, Rome, Italy, 27 pp.
Fisher, R.F., Binkley, D., 2000. Ecology and Management of Forest
Soils. Wiley, New York.
Florence, R.G., 1996. Ecology and Silviculture of Eucalypt Forests.
CSIRO, Collingwood, 400 pp.
Genstat 5 Committee, 1997. Genstat 5 Release 4.1 Command
Language Manual. Numerical Algorithms Group, Oxford.
Giardina, C.P., Ryan, M.G., 2002. Total belowground carbon
allocation in a fast-growing Eucalyptus plantation estimated
using a carbon balance approach. Ecosystems 5, 487–499.
94 D.I. Forrester et al. / Forest Ecology and Management 193 (2004) 81–95
Guo, L.B., Sims, R.E.H., 1999. Litter production and nutrient
return in New Zealand eucalypt short-rotation forests: implica-
tions for land management. Agric. Ecosys. Environ. 73,
93–100.
Heffernan, B., 1985. A Handbook of Methods of Inorganic
Chemical Analysis for Forest Soils, Foliage and Water. CSIRO
Division of Forest Research, Canberra, 281 pp.
Hingston, F.J., Galbraith, J.H., 1998. Application of the process-
based model BIOMASS to Eucalyptus globulus ssp. globulus
plantations on ex-farmland in south western Australia. II.
Stemwood production and seasonal growth. For. Ecol. Manage.
106, 157–168.
Hunt, M.A., Unwin, G.L., Beadle, C.L., 1999. Effects of naturally
regenerated Acacia dealbata on the productivity of a Eu-
calyptus nitens plantation in Tasmania, Australia. For. Ecol.
Manage. 117, 75–85.
Kaye, J.P., Resh, S.C., Kaye, M.W., Chimmer, R.A., 2000. Nutrient
and carbon dynamics in a replacement series of Eucalyptus and
Albizia trees. Ecology 81, 3267–3273.
Keenan, R., Lamb, D., Sexton, G., 1995. Experience with mixed
species rainforest plantations in North Queensland. Comm. For.
Rev. 74, 315–321.
Keith, H., Raison, R.J., Jacobsen, K.L., 1997. Allocation of carbon
in a mature eucalypt forest and some effects of soil phosphorus
availability. Plant Soil 196, 81–99.
Kelty, M.J., 1992. Comparative productivity of monocultures and
mixed-species stands. In: Kelty, M.J., Larson, B.C., Oliver,
C.D. (Eds.), The Ecology and Silviculture of Mixed-Species
Forests. Kluwer Academic Publishers, Dordrecht, pp.
125–141.
Kelty, M.J., Cameron, I.R., 1995. Plot designs for the analysis
of species interactions in mixed stands. Comm. For. Rev. 74,
322–332.
Khanna, P.K., 1997. Comparison of growth and nutrition of young
monocultures and mixed stands of Eucalyptus globulus and
Acacia mearnsii. For. Ecol. Manage. 94, 105–113.
Khanna, P.K., 1998. Nutrient cycling under mixed-species tree
systems in southeast Asia. Agrof. Syst. 38, 99–120.
Larson, P.R., 1963. Stem form development of forest trees. For. Sci.
Monogr. 5, 42.
Marschner, H., 1986. Mineral Nutrition of Higher Plants.
Academic Press, London.
Montagnini, F., 2000. Accumulation in above-ground biomass and
soil storage of mineral nutrients in pure and mixed plantations
in a humid tropical lowland. For. Ecol. Manage. 134, 257–270.
Montagnini, F., Gonzales, E., Porras, C., 1995. Mixed and pure
forest plantations in the humid neotropics: a comparison of
early growth, pest damage and establishment costs. Comm. For.
Rev. 74, 306–314.
Parrotta, J.A., 1999. Productivity, nutrient cycling, and succession
in single- and mixed-species plantations of Casuarina equise-
tifolia, Eucalyptus robusta, and Leucaena leucocephala in
Puerto Rico. For. Ecol. Manage. 124, 45–77.
Resh, S.C., Binkley, D., Parrotta, J.A., 2002. Greater soil carbon
sequestration under nitrogen-fixing trees compared with
Eucalyptus species. Ecosystems 5, 217–231.
Sackville Hamilton, N.R., 1994. Replacement and additive designs
for plant competition studies. J. Appl. Ecol. 31, 599–603.
Stace, H.C.T., Hubble, G.D., Brewer, R., Northcote, K.H.,
Sleeman, J.R., Mulcahy, M.J., Hallsworth, E.G., 1968. A
Handbook of Australian Soils. Rellim, Glenside, SA.
Toky, O.P., Singh, V., 1993. Litter dynamics in short-rotation high-
density tree plantations in an arid region of India. Agric.
Ecosys. Environ. 45, 129–145.
Turner, J., Lambert, M.J., 2002. Litterfall and forest floor dynamics
in Eucalyptus pilularis forests. Aust. Ecol. 27, 192–199.
Turvey, N.D., Attiwill, P.M., Cameron, J.N., Smethurst, P.J., 1984.
Growth of planted pine trees in response to variation in the
densities of naturally regenerated acacias. For. Ecol. Manage. 7,
103–117.
van Winden, A.P., 2001. Above-ground Interactions and Produc-
tivity in Mixed-species Plantations of Acacia mearnsii and
Eucalyptus globulus. The Australian National University,
Canberra, 59 pp.
Vandermeer, J., 1989. The Ecology of Intercropping. Cambridge
University Press, New York, 237 pp.
Waring, R.H., 1987. Characteristics of trees predisposed to die.
BioScience 37, 569–573.
Wichiennopparat, W., Khanna, P.K., Snowdon, P., 1998. Contribution
of acacia to the growth and nutrient status of eucalypts in mixed-
species stands at Ratchaburi, Thailand. In: Turnbull, J.W.,
Crompton, H.R., Pinyopusarerk, K. (Eds.), Recent Developments
in Acacia Planting. Proceedings of the International Workshop,
Hanoi, Vietnam, October 27–30, 1997, pp. 281–287.
D.I. Forrester et al. / Forest Ecology and Management 193 (2004) 81–95 95