Growth dynamics in a mixed-species plantation of< i> Eucalyptus globulus and< i> Acacia mearnsii
i
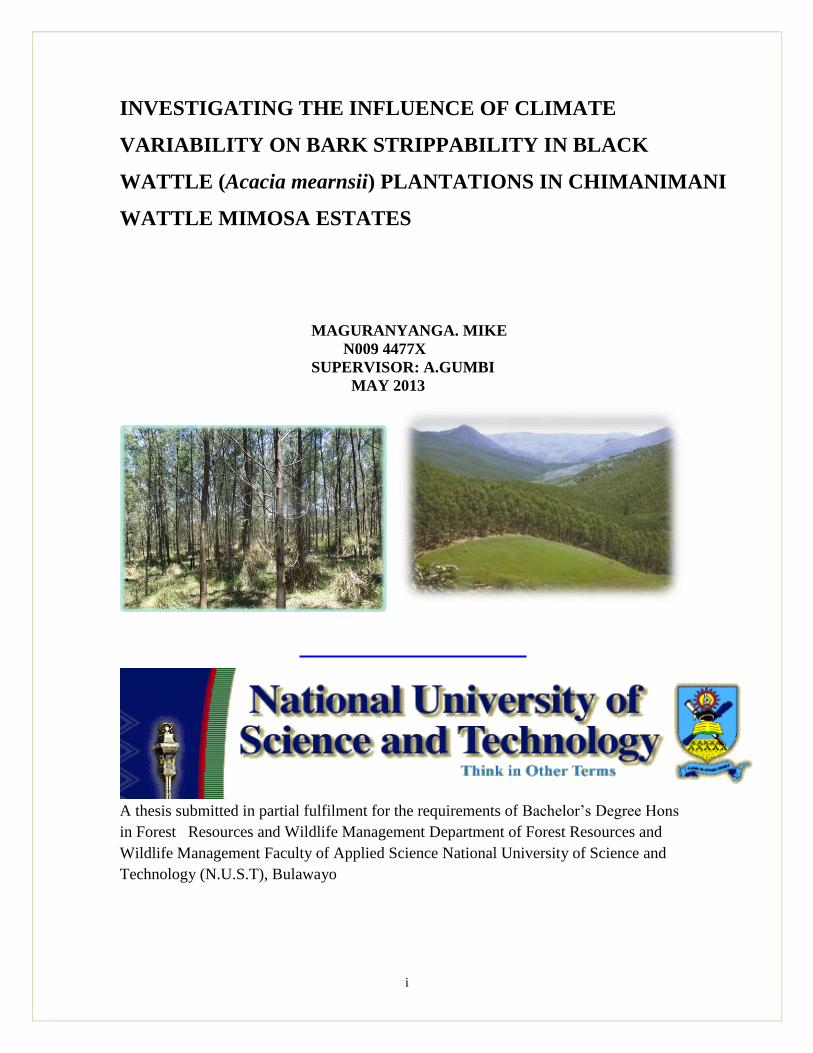
INVESTIGATING THE INFLUENCE OF CLIMATE
VARIABILITY ON BARK STRIPPABILITY IN BLACK
WATTLE (Acacia mearnsii) PLANTATIONS IN CHIMANIMANI
WATTLE MIMOSA ESTATES
MAGURANYANGA. MIKE
N009 4477X
SUPERVISOR: A.GUMBI
MAY 2013
A thesis submitted in partial fulfilment for the requirements of Bachelor’s Degree Hons
in Forest Resources and Wildlife Management Department of Forest Resources and
Wildlife Management Faculty of Applied Science National University of Science and
Technology (N.U.S.T), Bulawayo

i
APPENDIX II
RELEASE FORM SAMPLE
NATIONAL UNIVERSITY OF SCIENCE AND TECHNOLOGY
RELEASE FORM
NAME OF AUTHOR: ……………………………………………………………………
TITLE OF PROJECT:
………………………………………………………………………………………………
………………………………………………………………………………………………
………………………………………………………………………………………………
DEGREE FOR WHICH THESIS WAS PRESENTED:
Forest Resources and Wildlife Management
YEAR THIS DEGREE GRANTED:
Permission is hereby granted to the National University of Science and Technology
Library to produce single copies of this dissertation and lend or sell such copies for
private, scholarly or scientific research purposes only. The author does not reserve other
publication rights and the dissertation nor may extensive extracts from it be printed or
otherwise reproduced without the author’s written permission
SIGNED………………………………
PERMANENT ADDRESS:
18 Catherine berry drive
Ilanda
Bulawayo
DATE ……………………..
ii
APPENDIX III
APPROVAL FORM SAMPLE
NATIONAL UNIVERSITY OF SCIENCE AND TECHNOLOGY
APPROVAL FORM
The undersigned certify that they have read and recommended to the National University
of Science and Technology for acceptance: a dissertation entitled “Investigating the
influence of climate variability on bark strippability in black wattle (Acacia mearnsii)
plantations of Chimanimani Wattle Mimosa Estates”, submitted by in partial fulfilment of
the requirements for the Degree of Bachelor of Environmental Science Honors in Forest
Resources and Wildlife Management
……………………………………….
SUPERVISOR (S)
………………………………………….
DATE…
iii
ABSTRACT
There has been some fluctuations in the climatic (precipitation, temperature and rain
days) and a decrease in bark strippability. Secondary data from 1999 – 2012 (Nov – Mar)
obtained from Wattle Planning Department was used for analysis. Incomplete
randomized block design was used for data collection (see experimental design). Changes
in climatic variables and strippability variables were analyzed using one way Anova
while bivariate correlation was used to test for the relationship between the variables and
strippability using SPSS version 21. Precipitation and rain days did not significantly
change (P>0.05) but had a significant positive correlation of 71.5% and 42.9%
respectively with strippability. Temperature had significant increases (P<0.01) while
strippability had significantly decreased (P<0.01). Temperature is significantly negatively
correlated with strippability (27.7%). Results show that climatic variables have
significantly changed over the 13 harvesting seasons with rainfall showing a greater
influence on bark strippability while temperature has the least effect. It can be concluded
that climate variability is the major factor that has resulted in the decline in yields and
strippability. Therefore it can be suggested that drought and temperature resistant seeds
be used for establishment, a tree breeding program be initiated to reduce establishment
cost, to allocate more labor units to stripping during harvesting period to meet targets
while the rains are still available. Also more studies in other estates covering long periods
can be done to ascertain the new trends so as to enable informed decisions on either
shifting the season in accordance to the new trends.

iv
ACKNOWLEDGEMENTS
I would like to extend my sincere appreciation to the Wattle Company for allowing me to
carry out my research and all the resources they supported me with during the execution
of this project. I would also want to thank Mr.J.Chamanwa, Mr.W.Chikukwa and
Mr.W.Zengeya from the Wattle Mimosa Planning Department in Chimanimani. They put
tremendous efforts in helping me to acquire the data and records for bark strippability,
temperature and rainfall for my study area. All their technical expertise and insightful
comments are greatly appreciated.
My appreciation further extends to my supervisor Mrs.A.Chichinye for her guidance
throughout the whole project. I thank would also like to thank Mr.H.G.T. Ndagurwa,
Mr.A.Magwizi, Mr. Mwase and Mr.T.Nzuma for their comments and contributions in
shaping up this piece of work.
Many thanks to my family members for their support and encouragement. Special
mention goes to my father Mr.E.Maguranyanga for his financial support in paying my
fees. My aunt Ms.E.F.Maguranyanga for her shared views and opinions about my
research and my fellow friend Mr.O.Sonono for his assistance in structuring my project.
Above it all l would like to thank God Almighty for his undying love towards me.
”Ebenezer”

v
DEDICATION
I dedicate this art of master piece to my mentor my father Mr.E.Maguranyanga who has
been financially supporting me. Blessed be his fortunes.
vi
Contents TITLE PAGE
Release form i
Approval form ii
Abstract iii
Acknowledgements iv
Dedication v
Contents vi
List of figures vii
List of tables viii
List of appendices ix
CHAPTER ONE ................................................................................................................. 1
INTRODUCTION .......................................................................................................... 1
1.1 Introduction ...................................................................................................... 1
1.1.1 Background to the study ............................................................................... 3
1.2 Problem statement ............................................................................................ 6
1.3 Broad objective ................................................................................................. 7
1.4 Specific objectives ............................................................................................ 7
1.5 Research questions ........................................................................................... 7
1.6 Research hypothesis ......................................................................................... 8
1.7 Limitation ......................................................................................................... 8
1.8 Justification ....................................................................................................... 8
1.9 Assumptions ..................................................................................................... 9
1.10 Scope (delimitation) of the study .................................................................... 10
1.11 Definition of terms ...................................................................................... 10
1.12 Project layout .............................................................................................. 10
CHAPTER TWO .............................................................................................................. 12
LITERATURE REVIEW ............................................................................................. 12
2.1 Introduction .................................................................................................... 12
2.2 Documented researches .................................................................................. 12
2.3 The felt impacts of climate variability ............................................................ 13
2.4 Climate variability and forest ecosystems ...................................................... 14
2.5 Influence of climate variation impacts on forest productivity ........................ 16
2.6 Summary ......................................................................................................... 20
CHAPTER III ................................................................................................................... 22
METHODOLOGY ....................................................................................................... 22
3.1 Introduction. ................................................................................................... 22
3.2 Study Area ...................................................................................................... 22
3.2.1 Location ...................................................................................................... 22
3.2.2 Vegetation ................................................................................................... 23
3.2.3 Geology and soils ........................................................................................ 24
3.2.4 Climate ........................................................................................................ 24
3.2.5 Relief ........................................................................................................... 25
3.3 Materials and methods .................................................................................... 26
vii
3.3.1 Experimental design.................................................................................... 26
3.3.2 Data collection ................................................................................................ 27
3.3.3 Precipitation ................................................................................................ 27
3.3.4 Bark strippability ........................................................................................ 28
3.3.5 Temperature .................................................................................................... 28
3.3.6 Data analysis ................................................................................................... 29
CHAPTER IV ................................................................................................................... 30
RESULTS ..................................................................................................................... 30
4.1 Introduction .................................................................................................... 30
4.2 Precipitation trends ......................................................................................... 31
4.3 Temperature trends ......................................................................................... 32
4.4 Bark strippability trends. ................................................................................... 33
4.5 Rain days ..................................................................................................... 34
4.6 Changes in the mean monthly rainfalls. ...................................................... 35
4.7 Correlation between climatic variables and bark strippability. .................. 36
4.8 The correlation between mean seasonal rainfall and bark strippability. ..... 37
4.9 Correlation between mean seasonal temperature and bark strippability .... 38
4.10 Correlation between mean seasonal rain days and bark strippability. ........ 39
CHAPTER 5 ..................................................................................................................... 40
DISCUSSION ............................................................................................................... 40
5.1 Trends in climatic variables ............................................................................ 40
5.1.2 Temperature ................................................................................................ 40
5.1.3 Rainfall. ....................................................................................................... 42
5.1.4 Rainfall days ............................................................................................... 43
5.1.5 Strippability................................................................................................. 44
CHAPTER 6 ..................................................................................................................... 45
CONCLUSSIONS AND RECOMMENDATIONS ................................................. 45
6.1 Conclusions .................................................................................................... 45
6.2 Recommendations ........................................................................................... 46
6.3 Suggestions ..................................................................................................... 46
REFERENCES ................................................................................................................. 47
APPENDICES …………………………………………………………………….…… 55
Appendix 1; Research data collected ………………………………………………55
Appendix 2; Anova table for differences in climatic variables and strippability…..57
Appendix 3; Pearson's correlation table of climatic variables and bark strippability57
Appendix 4; Mean (SE) of climatic variables and bark strippability …………….. 58
viii
LIST OF FIGURES
Figure 1; Location of the study area in Zimbabwe ………………………………...…. 23
Figure 2; Location of the study area in Chimanimani (Silverstreams) …………...……24
Figure 3; Changes in mean seasonal monthly rainfall (1999 – 2012) ……………...…. 26
Figure 4; Experimental design used for the 2011/2012 study period …...…………….. 27
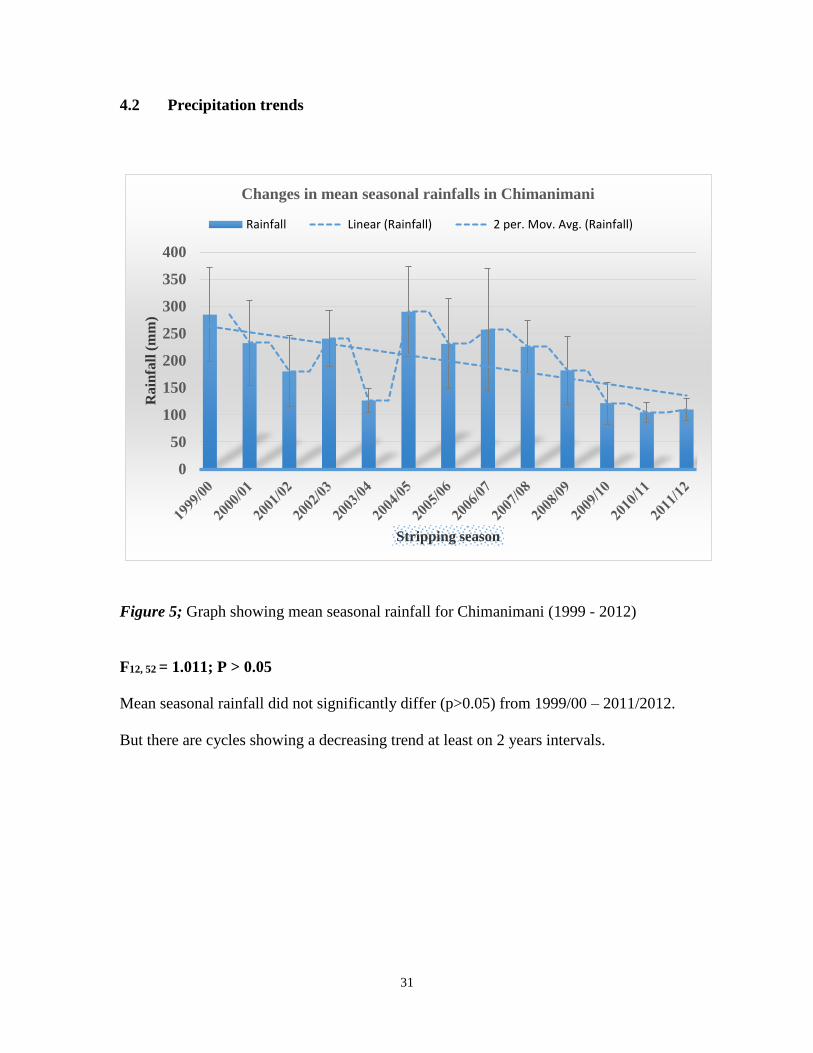
Figure 5; Graph showing mean seasonal rainfall for Chimanimani (1999 – 2012) ...…. 32
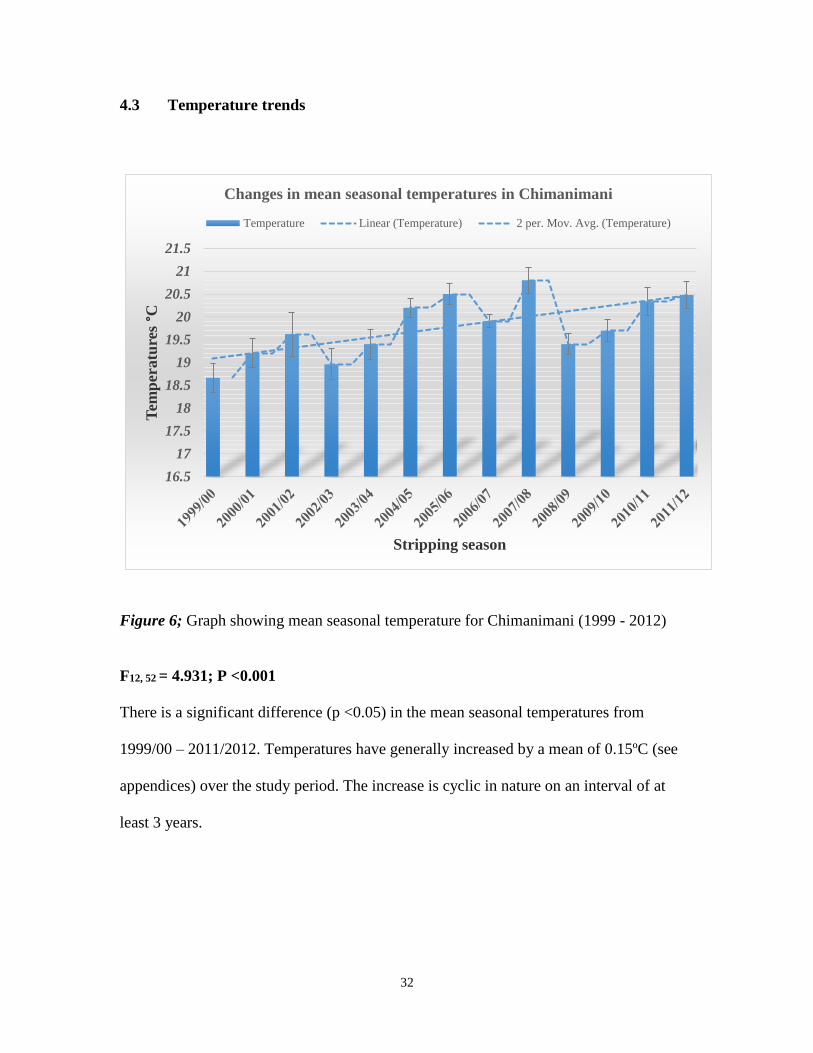
Figure 6; Graph showing mean seasonal temperature for Chimanimani (1999 – 2012)..33
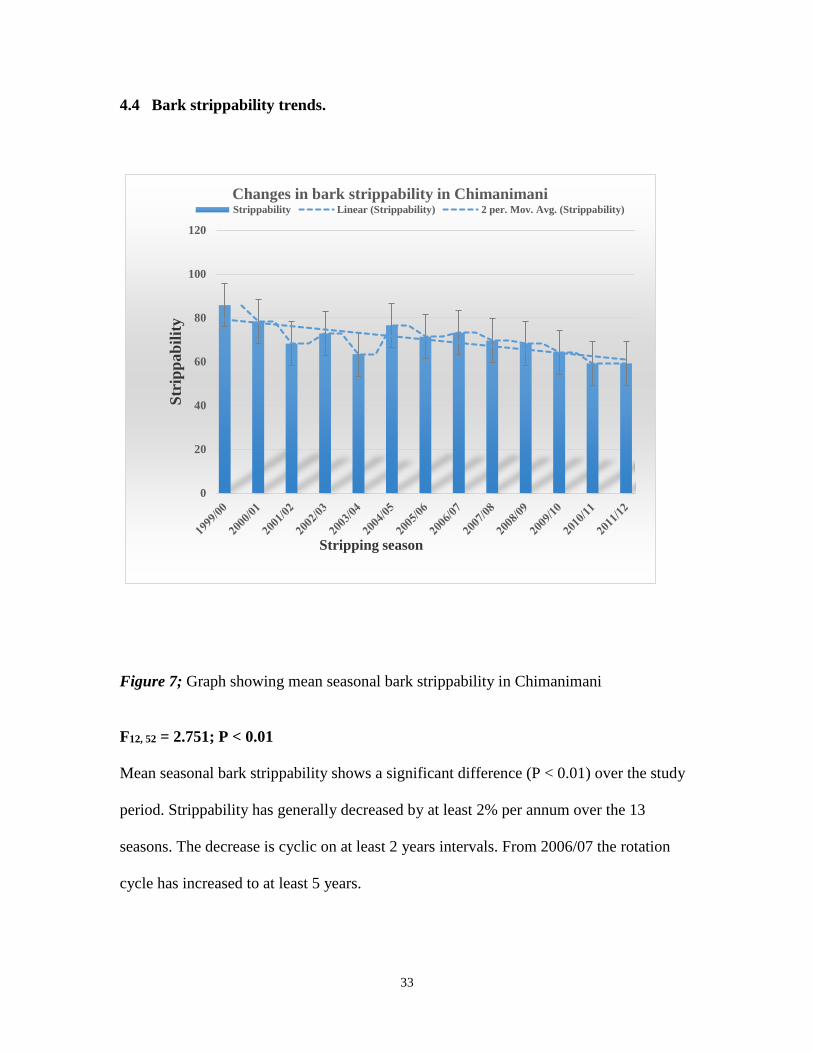
Figure 7; Graph showing mean seasonal bark strippability in Chimanimani ...……….. 34
Figure 8; Graph showing mean seasonal rain days in Chimanimani (1999 – 2012)…... 35
Figure 9; Graph showing correlation between rainfall and bark strippability ...………. 38
Figure 10; Graph showing correlation between temperature and bark strippability ...… 39
Figure 11; Graph showing correlation between rain days and bark strippability ...…… 40

ix
LIST OF TABLES
Table 1; Mean seasonal monthly rainfall in Chimanimani Wattle Mimosa Plantations...35
Table 2; Anova correlation table of climatic variable and strippability ………………...36
x
LIST OF APPENDICES
Appendix 1; Research data collected ……………………………………………55
Appendix 2; Anova table for differences in climatic variables and strippability .57
Appendix 3; Pearson’s correlation table of climatic variables and strippability ..57
Appendix 4; Mean (SE) of climatic variables and bark strippability ………….. 58
1
CHAPTER I
INTRODUCTION
1.1 Introduction
The tree plantation industry is vulnerable to climate variability since it is a plant- based
industry and generally these plants respond sensitively to climate and atmospheric
conditions. Area climatically suitable for exotic tree plantations in Zimbabwe is
extremely limited and subject to other land and water pressures and increase in climatic
variation effects have posed a further threat. Tree cropping has a long planning horizon
(± 9years - ± 25 years), a long period between the commitment of investment and the
realization of profits and high sensitivity to transport cost. Therefore the decreases in
yields and forest productivity as a result of erratic rainfall patterns, increase in
temperatures and dry spell have exacerbated to the rate of loses incurred in the timber
industry. Therefore there is need to understand how climatic patterns particularly in
Zimbabwe have changed so as to understood how it has influenced various sectors of
production in the country.
Forest plantations account for at least 110 000ha of the total forest area in Zimbabwe
grown under the exotic species such as the Pinus, Acacias and Eucalypts (Melillo et al.,
1990). This area is threatened by the impacts of climate change as vegetation has shifted,
boundaries reduced and land productive capacity negative impacted by variations in

2
temperature and rainfall. These two have been noted to be the important factors
influencing the metabolic processes and growth in plants (Jensen, 2000).
In Zimbabwe, Wattle Mimosa is the only company in involved in the production of
tannin extract from Acacia mearnsii (Sherry, 1971). The plantations of these exotic are
found in the Eastern Highlands where there is sufficient rainfall received evenly across
the rain season thus making it suitable for forestry practices (Gwaze, 1986). Within the
period of climate change speculations, the rainfall has become unpredictable and reduced
while temperatures and dry spell increased. This is thought to have negatively impacted
on productivity as there has been a notable decline in bark yields and strippability.
A number of sectors contribute to the country’s GDP through export of products and
Forestry timber industry is part of the list in Zimbabwe. The exports list includes raw
materials, unprocessed and finished timber products which are taken to neighboring
SADC countries and across the seas (Shumba, 2006). Transformation to local livelihoods
has been marked as one of the major contributions by forests to communities through
provision of timber and non-timber products as well as forest services. In India the
popularity and earnings from forestry plantations have made this sub-sector an area of
interest to policy makers (UCL, 2009).
Globally, there is a rise in concern over the felt effects of climate change and their
impacts on a number of sectors including agriculture, forestry, health, wildlife and
environment. Forests are an essential component in the ecosystem as a result of their
roles and services in conserving biodiversity and acting as carbon sinks in carbon
sequestration. Climate change has resulted in erratic rainfall patterns, increased
3
temperatures and dry spell duration. IPCC (2007) reported 0.6ºC ± 0.2º C increase in
global temperatures while Hulme et al. (2000) predicted a 5% decrease in precipitation
and 15% of the Southern Africa becoming drier. This would affect forests and their
productivity as they are sensitive to slight changes in the climatic variables in particular
precipitation and temperatures (Jensen, 2000). Over the past century these climatic
factors have tremendously been fluctuating thus resulting in changes in the forest
structure and health.
IPCC (2007) defined climate variability as any change in weather patterns over time (<30
years) due to natural variability or human activity. These activities include industrial
activities, power generation, agriculture, waste emissions, deforestation, veld fires and
urbanization. Such activities result in increased greenhouse gases (CO2, CH4, O3 and
NOx) which give rise to global warming (IPCC, 1996). The changes observed over the
last several decades are due to human activities, but it cannot be ruled out that some
significant part of these changes is also a reflection of natural variability. (NRC, 2001).
1.1.1 Background to the study
Indigenous forests and exotic plantations have become common in the country as they act
as the carbon sinks of Zimbabwe and the ability of creating employment opportunities to
the local communities (Unganai, 2009). It is estimated that 70 percent of the adults in
these areas are all employed in the plantations therefore the need to maintain forest
productivity for forest sustainability (Melillo et al., 1990). This would secure the source
of their livelihoods thus reducing poaching and illegal activities and conflicts of interest.
4
Forest product exports accounts for at least 1% of the country’s economic output and this
explains why regionally and locally the forestry sector has be given priority. Although the
size of forestry sector has dwindled together with the manufacturing sector due to climate
and financial constraints respectively, they remain the key sectors of economic growth
(Shumba, 2006).
Forests and plantations offer several products and services to livelihood (Clarke and
Katerere, 1994) but this report considered only the marketed products. Wattle Mimosa
concentrate on A.mearnsii bark production for tannin extraction. The wood from the
stripped stem is then used to produce charcoal which is also sold locally as bulk charcoal.
Quality vista charcoal is exported to South Africa, Mozambique and Zambia. Black
wattle species is of importance in the tannin industry as it is a natural source of high
tannin concentration (Adeleke and Goh, 1980). It was introduced from Australia by CJ
Rhodes in 1902 (Sherry, 1971). The first trials were done near Matobo but they gained
prominence rapidly in the Eastern Highlands by 1934 making Zimbabwe part of the
countries that owned large area of black wattle plantations (Sherry, 1971). Other
stakeholders in the industry majors on other species such as Pinus species for timber and
Eucalypts species for poles.
The major threat that has a cause of concern to the foresters are the fluctuations and
variations in the climatic variables which are being experienced on short cycles (IPCC,
2007). Matarira and Mwamuka, 1995 reported an increase in temperatures by 0.4°C and
drop in rainfall by at least 10% in Zimbabwe has already posed a threat to productivity in
various sectors thus the need for researches to understand the phenomenon better. In
other areas rainfall has further reduced to as little as 30 percent of the annual total rainfall
5
(Orlove and Tosteson, 1999) and drier areas have increased by 15 percent (Mugandani et
al., 2012)
Bazzaz (1990) reported the sensitivity of forests to slight changes in climatic variables so
it has been thought that the decrease in the bark yields and productivity in Chimanimani
could be a true reflection of climate variability. Increases in temperatures and low
standard rainfall periods leads to reduced soil moisture content thus lowering bark
strippability. Due to erratic rainfalls, trees have been noted to attain thin diameters and if
these thin diameter trees increase per unit area, they will definitely reduce total yield
(Gunduz et al., 2011). Kadonhera (2011) unpublished, reports that productivity have
dropped from 16 tons/ha to 13tons/ha. The decline is a result of multi-factors with
climate variability being listed as the major factor (Gunduz et al., 2011).
The Afromontane typical vegetation of the Eastern Highlands is feared to be reduced to
bush lands as the impacts of climate change and variability are projected to have
significantly increased by 2030 (IPCC, 2007). The region will lose its vegetation
structure and there might be need for reclassification of the agro-ecological regions
(Mugandani et al., 2012). Phenological changes have been reported such as early timing
of spring events such as leaf unfolding, leaf flowering, species migration and range shifts
(Leith, 1974). This is because quite small changes in climatic variables have detrimentous
effects on the viability of plants (Jensen, 2000).
To produce a standard product on expiration of the rotation time, it requires forest
processes and resources which can be natural or man-made (Geldenhuys, 1981). Essential
natural resources for black wattle production include land, precipitation, sunshine, air and
6
temperature. Man-made resources includes labour, capital, management and
entrepreneurs (Ziervogel et al., 2008). Climate has been identified as the predominant
factor that influences land productive capacity including bark yields (UCL, 2009).
Although studies have shown that forests have adapted to temperature increases (2-3ºC)
in the past, these changes occurred over thousands of years. Current climate predictions
suggest that average global mean temperatures could rise by (1.5-5.8°C) over this century
alone. Such rapid changes in a relatively short period of time could affect forests
significantly (Jensen, 2000).
The on-going trends in climate variability with speculations of further increase in the
negative impacts of climate change by 2050 therefore pose a threat to the forest
productivity and health (Gunduz et al., 2011). Zhakata (2010) acknowledges the fact that
yields have been reduced in crops as a result of this phenomenon of climate variability. It
has led to increased frequency of droughts, floods, prolonged dry spell duration and
unpredicted rainfall patterns (Mugandani et al., 2012)). However studies on climate
change have generally been focusing on climate variability on agriculture and how this
would impact on livelihoods. There is paucity of literature on specific forest products and
how they have been influenced by this variability. This work seeks to investigate the
influence of climate variability on A.mearnsii bark strippability in Chimanimani black
wattle plantations.
1.2 Problem statement
There was a notable decrease in bark strippability and fluctuations in the climatic
variables from the data available for 1999 – 2012. Bark yields have been noted to have
7
declined from 16tons/ha to 13tons/ha while bark strippability have reduced from (85% -
59%) in Chimanimani (Kadonhera 2011, unpublished). No studies have been carried out
to ascertain how fluctuations in climatic variables have affected the growth of A.mearnsii.
1.3 Broad objective
To establish the changes in climatic variables and how they have been influencing
A.mearnsii bark strippability in Chimanimani Wattle Estates over the 1999/00 – 2011/12
stripping seasons.
1.4 Specific objectives
To determine if there are any significant changes in climatic variables
(temperature, rainfall and rain days).
To establish if there are any significant changes in bark strippability over the
1999/00 – 2011/12 stripping seasons.
To determine if there is any correlation between climatic variables and bark
strippability over the 1999/00 – 2011/12 stripping seasons.
1.5 Research questions
Are there any significant changes in the climatic variables (rainfall, temperatures
and rain days) over the 1999/00 – 2011/12 stripping season in Chimanimani?
Is there any significant change in bark strippability over the 1999/00 – 2011/12
stripping seasons in Chimanimani?
Is there any correlation between climatic variables and bark strippability?
The above research questions are to provide answers for the mentioned objectives.
8
1.6 Research hypothesis
H0 - there are no significant changes in climatic variables (rainfall, temperature
and rain days) over the 1999/00 – 2011/12 stripping season stud in Chimanimani.
H0– there is no significant change in the bark strippability over the 1999/00 –
2011/12 stripping season in Chimanimani
H0 - there is no correlation between climatic variables and bark strippability over
the 1999/00 – 2011/12 stripping season stud in Chimanimani.
1.7 Limitation
Some of the data records were in tatters thus information recorded was not vivid
and eligible.
Some records could not be accessed thus this shortened the study period confining
it to 1999/00 – 2011/12.
1.8 Justification
As this phenomenon of climate change is still poorly understood, few studies have been
done to ascertain the extent to which productivity has been influenced by climate
variability in forests and timber plantations. Greater population of the surrounding locales
in Chimanimani depend on the plantations for a living (employment). So a study of this
nature will depict a clear picture of how much production have been negatively
influenced by climate variability thereby helping to predict the future. This then allows
short term and long term planning for mitigation measures by the management for
sustainability. It reduces poverty levels in that area through continuity of employment as
well as other forest services provided by the forests.
9
The extent to which woodlands and plantations are being influenced by climate
variability is poorly understood in Zimbabwe. Most studies have concentrated on
agricultural crops and impacts on livelihood, so this research aims to provide information
on how climatic variables have been fluctuating and impacting on bark strippability. The
results of this project can be useful to the Timber Producers Federation and all the
stakeholders. This will enable the management to strategize and make informed decisions
to ensure sustainability.
The research is also presumed to immensely contribute towards enrichment of baseline
information on how climatic variables have been fluctuating. It also aims to assess the
strength of relationship between bark strippability and climatic variables in Chimanimani.
The results, where applicable, would help the forestry stakeholders to choose the most
appropriate silvicultural methods in trying to combat the effects of climate change. It can
be achieved by devising new strategies that optimize productivity in the present
circumstances surrounding the forestry industry. Such as shifting of the planting season
in relation to new rainfall trends, using better nursery techniques for better seedlings or
genetically improved seeds and make tactical and strategic plans in trying to improve
yields.
1.9 Assumptions
The information provided from the Planning department was valid and adequate
to make reasonable inferences.
All other factors were constant and not limiting to the maximum productivity of
the bark.
10
1.10 Scope (delimitation) of the study
The research will be focusing on identifying the influence of climate variability on
Acacia mearnsii bark strippability in Chimanimani Wattle Mimosa plantations. The
research will use 1999 – 2012 mean seasonal climatic variable data obtained from the
Wattle Mimosa planning department. The climatic elements consider were the mean
rainfall, temperatures and rain days for the harvesting season (November – March). The
other parameter considered was the bark strippability for each harvesting season
1.11 Definition of terms
Climate change – any change in weather patterns over a period of at least 30years.
Climate variability – any fluctuation in climatic elements over a short period (less than 30
years)
Climatic variables – these are elements that constitute of precipitation, temperatures and
rain days
Stripping season – the period during which harvesting of bark is done (November –
March).
Strippability – the ease to separate the bark and the stem and this is in form of a
percentage score issued by a stripper during a pre-stripping inventory.
1.12 Project layout
Chapter two discusses an overview of documented researches on the influence of climate
variability of bark strippability and yields. Chapter three presents the methodology of
analyzing the data. Chapter four consists of results while chapter five gives detailed

11
analysis of the results. Chapter six summaries the research findings and gives the
recommendations from the study.
12
CHAPTER II
LITERATURE REVIEW
2.1 Introduction
This chapter discusses some documented researches on the impacts of climate variability
on climatic variables (rainfall, temperature and rain days). It also discusses other studies
on the influence of these effects on forests and productivity and they affect strippability.
2.2 Documented researches
There is paucity of literature on the impacts of climate variability on forest productivity,
particularly with reference to specific timber products. A lot of the studies done relating
to climate have greatly focused on agricultural crops with few researches being done in
forestry.
Climate change refers to any change in climate over time (at least 30 years) whether due
to natural variability or as a result of human activity (IPCC, 2007). The variation in
climate on a shorter period is influenced by these activities and is referred to as climate
variability (IPCC, 1996). Temperature and rainfall are the major drivers of a number of
biological processes such as photosynthesis, respiration and decomposition of organic
matter. Therefore such factors can be influencing bark strippability and productivity.
According to IPCC (1996), observations have conclusively demonstrated that the
atmospheric abundance of greenhouse gases has risen dramatically since the onset of the
Industrial Age 1750. The increase was as a result of increased human activities including
industrial events, power generation, agriculture, waste emissions, deforestation, veld fires
and urbanization. These activities released exorbitant levels of greenhouse gases (CO2,
13
CH4, O3 and NOx) emissions which result in global warming and climate change (IPCC
1996). The natural greenhouse effect warms the surface of the planet to temperatures that
are hospitable for life.
Hulme et al. (2000) agrees to the fact that Africa is now warmer than it was 100 years
ago; with warming through the twentieth century having been at the rate of about 0.5°C
per century. Warming up on the land is recorded to have been higher than in the oceans
(IPCC 2001). NRC (2001) report noted that the changes observed over the last several
decades are likely mostly due to human activities, but it cannot be ruled out that some
significant parts of these changes is also a true reflection of natural variability.
2.3 The felt impacts of climate variability
Zimbabwe lies in a semi-arid region with limited and unreliable rainfall patterns and
temperature variations (Unganai, 1996). Rainfall exhibits considerable spatial and
temporal variability characterised by shifts in the onset of rains, increases in the
frequency and intensity of heavy rainfall events. Increase in the proportion of low rainfall
years as well as increase in the frequency and intensity of mid-season dry-spells have also
been noted (Unganai, 2009). Decreases in low intensity rainfall events have also been
recorded. Extreme weather events according to Mutasa (2008) have been noted to have
increased in intensity and frequency. These include tropical cyclones.
According to the Zimbabwe Meteorological Service, daily minimum temperatures have
risen by approximately 2.6°C over the last century while daily maximum temperatures
have risen by 2°C during the same period (Brown et al., 2012). Rising temperatures and
increasing rainfall variability, notably drought, are also expected to worsen declining
14
timber outputs, further compromising economic growth and stability, employment levels,
demand for other goods, and poverty reduction.
In particular, climate variation is expected to lead to the expansion of marginal lands
(IPCC, 2007), which is already beginning to occur in Zimbabwe. If changing climatic
conditions continue to expand in these regions, traditional forest systems will become
increasingly unsustainable. Tadross et al. (2009) alludes the fact that climate variability
poses a major threat to natural processes in semi- arid areas as well for moisture
depended processes in plants and bark strippability in tannin production industry.
Forestry and crop production in the absence of appropriate management practices are at
risk of frequent failure with predicted future rainfall expected to be reduced or punctuated
by concentrated heavy events separated by prolonged dry spells (Brown et al., 2012). All
these changes in the climatic variables are feared to be negatively impacting on the black
wattle in Chimanimani.
2.4 Climate variability and forest ecosystems
It has been world widely agreed upon that climate change has strongly impacted on
forestry and agriculture (Gunduz et al., 2011). Climate is a vital component that has a
critical role in the operating of forest ecosystems as it influence the status of biological,
physical and chemical processes active in the ecosystems (Sedjo and Solomon, 1989). As
a result of the close link between climate and forest health, it is assumed that noted
changes in climatic variables could be influencing strippability.
The frequency and intensity of extreme events such as droughts and the El Nino effect
have been observed to be on the increase in the recent decades in many parts of Africa
(IPCC, 2001). The swings of the ENSO cycle typically occur on a time scale of a few
15
years and disrupt vegetation through drought, heat stress, spread of parasites and disease,
and more frequent fire (Diaz and Markgraf, 1992).
Apart from climatic variations, other stresses which also increase the vulnerability of the
terrestrial ecosystems and productivity are veld or forest fires, pests, diseases and
surpassing the allowable cut (IPCC, 2007). Terrestrial ecosystems are highly dependent
on climatic factors for their growth, productivity and survival. So increase in temperature,
fire frequency, erratic rainfall patterns and the species migration as a result of climate
change has led to reduced productivity in timber and bark plantations (Bazzaz, 1990).
FAO 2003, reports that a recorded global warming averaging 0.6˚C since 1900 has
already produced devastating results in the death of trees in boreal forests and causing
major shifts in the geographic distribution of the vegetation. Fluctuations on climatic
variables such as temperature, precipitation, humidity make foresters conduct their forest
activities under the risky environment thus resulting in losses of income. (Gunduz et al.,
2011)
Climate change alters the spatial and temporal patterns of temperature and precipitation.
These are the most fundamental factors in determining distribution, productivity of
vegetation and geographical shifts in the ranges of individual tree species (Bazzaz, 1990).
Jensen (2000) concluded that a slight change in the climatic variables negatively affects
the forest structure and health. A study carried by Chenje et al in 1998 relates changes in
climate to quite a number of shifts in the drivers of the environment. These changes
include the frequency of droughts which has increased since 1990 (90/91, 91/92, 92/93,
16
93/94, 94/95, 97/98, 01/02, 02/03, 04/05 and /07) and this has caused massive drops in
crop yields in Zimbabwe. (Zhakata, 2010) This negatively impacts on the capability of
the remaining forests and woodlands to sequester carbon dioxide and also provide the
needed ecosystem goods and services (Kwesha, 1997).
2.5 Influence of climate variation impacts on forest productivity
The warming trend observed in southern Africa over the last few decades is consistent
with the global trend of temperature rise in the 1970s, 1980s and particularly in the
1990s. According to Roper (2001), it is predicted that atmospheric temperatures will rise
while rainfalls becomes erratic. Changes in the availability of water and the doubling of
carbon dioxide would cause about third of the forests worldwide to experience changes in
species composition, phenology and extent (Gunduz et al., 2011). Such predictions
therefore assumes that bark strippability will further decrease thus reducing yields.
The available soil moisture can be reduced as a result of increased evaporation rates from
high temperatures and reduced precipitation. Shifts in optimum tree growing areas and
growing seasons could affect or reduce forest productivity (Bazzaz, 1990).
Government of Namibia, (2002) reports that it has experienced warming at a rate of
0.023° C per year. Indian Ocean has also warmed with more than 1°C since 1950, a
period that has also witnessed a downward trend in rainfall (NCAR, 2005). Below-
normal rainfall years are becoming more and more frequent and the departure of these
years from the long-term normal is becoming more severe (USAID, 1992). Such changes
at that rate could not be doubted that they have negatively affected yields in forests and
these might as well had a role to play in reduction in bark strippability.
17
Numerous studies from many different ecosystems (Myers et al., 1996, Hingston and
Galbraith, 1998; Almeida et al., 2004) have demonstrated that total precipitation and its
distribution during the year have a strong influence on exotic plantation growth. And
Chimanimani black wattle are such an example. These and other studies have shown
water to be arguably the factor most limiting forest production, though site factors and
management will modify the relationship between rainfall and wood production.
Therefore a study on climatic variables becomes of necessity in the area as they also tend
to influence bark yields through reduced strippability.
Maintenance of high rates in tree growth in the main production areas of Southern Africa
may be hindered by the erratic nature of rainfall. A.mearnsii trees for example are well
adapted to short periods of water stress punctuated by rainfall events, but are vulnerable
to prolonged periods of water stress (White et al., 2000). Water stress influences the
development of A.mearnsii plantations in a number of ways. Battaglia et al., (1997) noted
that low to moderate levels of soil moisture impedes the development of leaf area and
reduces stomatal conductance. It also change patterns of biomass allocation (White et al.
1998) leading in the end to reduced stem wood production (Mendham et al., 2007). It has
been noted that these effects may continue for a period of time after water stress is
removed (White et al. 1999) and this has generally lead to reduced strippability and bark
yields. Xylem embolism occurs as the soil further dries, reducing the capacity for water
transport to leaves and inner cambium moisture thus reducing strippability. Under severe
levels of water stress leaf shedding may be induced, acclimatization of bark to wood and
finally drought death may occur (Dutkowski, 1995; Mendham et al., 2007).
18
The relationship between rainfall and growth varies from site to site but time averaged
vapour pressure deficit is a key determinant of this relationship. However, according to
Conway (2009), in the next century, northern and southern Africa is projected to become
drier with precipitation falling by 10% or more. Moderate drying of 5 to 15% per century
has already been noted along the Mediterranean coast and over large parts of Botswana
and Zimbabwe and the Transvaal in southeast South Africa (Hulme et al., 2000). Thus,
the A.mearnsii habitat in South Tropical Africa particularly in South Africa and
Zimbabwe will be affected, leading to possible population decline or even extinction.
In Zimbabwe, understanding the potential effects of changes in climate on the forest
ecosystems is critical. This is because they play an important role in the global carbon
sequestration of large amounts of CO2 from the atmosphere hence reducing the impacts
of global warming. Changes in meteorological elements (temperatures and rainfall) due
to climate change further acts as a catalyst to the changes in forests and drop in yields.
Forests also provide quite a number of goods and services (timber, wild fruits, and habitat
for animals, aesthetic value and construction poles) and they also provide a livelihood for
the rural communities. It is therefore important to understand forest dynamics through
time and space and the factors driving these changes.
Current rapidly changing climate and other associated impacts can severely impact on
the growing forests (Bazzaz, 1990). The extent to which forests and plantations are being
affected and responding to climate variability is not well understood hence the need to
study the possible impacts of global warming and climate change on the Zimbabwean
forests and how they influence productivity.
19
More than a third of the earth’s surface area is forests, accounting for an average of 85%
of plants and 35% of soil carbon (Melillo et al., 1990). Zimbabwe has an estimated total
area of 39.6 million hectares with forests occupying approximately 950 400 hectares
(Clarke and Katerere, 2003). Of this total area, 110 000 hectares are exotic plantations
and Chimanimani black wattle plantations are such an example (Shumba, 2006).
Therefore there is great need to conserve the resources and devise mitigation measures as
the changes in climate might result not only in reduced yields but also in loss of forest
areas due to increase in fire incidences and rapid shift in vegetation structures (Magadza,
1992).
Earlier greening of vegetation in spring is linked to the longer thermal growing season
due to warming. This is because forest ecosystems are highly dependent on climatic
factors (temperature and precipitation) for growth, productivity and survival. Biome
sensitivity assessments in Africa show that deciduous and semi deciduous forests may be
very sensitive to small decreases in precipitation as compared to grasslands (Jensen,
2000).
The projected rapid rise in temperature combined with other stresses such as destruction
of habitats from changes in land-use, pollution and overexploitation of resources would
affect forest structure. Other factors such as fires, pests and diseases and extreme events
can easily disrupt the interrelationships among species, transforming existing
communities and can lead to localized extinctions (Warburton and Schulze, 2006).
A study of A. mearnsii in Southern Africa, found that 47% of the standing stems which
had less than 10 cm diameter at breast height (d.b.h) were dead due to increasing aridity
in the Southern Cape region (Geldenhuys, 1981). Thin diameters at breast height are
20
usually associated with low bark strippability thus if more stems have thin diameters
(8cm>) then this would result in low yields. In the eastern and parts of central Africa,
including the Horn of Africa average rainfall is likely to increase by 15% in some parts
while decreasing by the same amount in some parts of the Sub-Savanna (Ziervogel et al.
2008; Conway, 2009). Such a scenario may or may not affect A.mearnsii survival.
Across the country, there is a shift on the onset of the rainy season from October to
November and this has disturbed the synchronous of the plantation activities. The dry
spell duration is seen to extend and prolong while the rainfall trends are seen to be
deviating from the normal as well as increase in mean seasonal temperatures thus
affecting the stripping season duration and bark strippability percentage. Therefore it can
be concluded that there is a strong need to have more researches of this nature to try and
understand the relationship on factors affecting yields and strippability.
2.6 Summary
Observations have conclusively demonstrated that Africa is now warmer than it was
100years ago by 0.5ºC (IPCC, 2007). The increase has been noted since the onset of the
Industrial Age and it has led to increase in greenhouse gases such as CO2, CH4, 03 and
NOx. Rainfall now exhibits spatial and temporal variability which is characterized by
shifts in the onset of rains, increase in frequency and intensity of heavy rains. This have
negatively impacted on the forests yields and health (Jensen, 2000) as these ecosystems
are sensitive to slight changes in climatic variables. Unganai (2009) reports that there is
increase in the ratio of low rainfall years to high rainfall and there are increases in the
frequency and intensity of mid-season dry spell. A study done by Mutasa (2008) also
noted increase in the frequency of droughts and cyclones and these directly reduce
21
productivity of the land and therefore results in reduced bark strippability. Decline in the
forests services and products has also been attributed to the increases in temperatures.
Temperatures have increased by at least 0.6ºC ± 0.2ºC (FAO, 2003). According to
Tadross et al. (2009) these increases poses a threat to plant metabolic processes thus
increasing water loss due to evapotranspiration. This had resulted to reduced soil
moisture content thus negatively influencing bark strippability. Gunduz et al. (2011)
emphasizes the fact that climate is a vital component of ecosystems processes therefore it
suggests a strong relationship between strippability and climatic variables. Several
studies suggests that precipitation received during the rainy season has a greater influence
of plantation growth (Almeida et al., 2004). A.mearnsii are adapted to short period of
water stress but vulnerable to prolonged periods of water stress (White et al., 2000). So
with the predictions of a further increase in the climatic variations, it cannot be argued
that strippability and bark yields will continue to drop if no mitigation measures are put
in place. Dutkowski (1995) also emphasizes the fact that under severe water stress
conditions, shedding of leaves maybe induced reducing photosynthesis and
acclimatization of bark to stem wood occurs lowering bark strippability. Other effects of
stress noted are thinning of diameters at breast height and if more stems per hectare have
thin diameters this would probably reduce bark yields (Geldenhuys, 1981). As a result of
these changes, they have affected the synchronous activities of the plantations thus there
is urgent need to make informed decisions based on the findings of researches that have
be done or being done.
22
CHAPTER III
METHODOLOGY
3.1 Introduction.
A total of 13 harvesting seasons were analyzed in terms of mean seasonal rainfall
patterns, mean seasonal temperatures, mean seasonal rain days and the mean seasonal
bark strippability. The available secondary data was for the study period from 1999 –
2012. The stripping season commences in November and ends in March and only means
for this period were used for the study.
3.2 Study Area
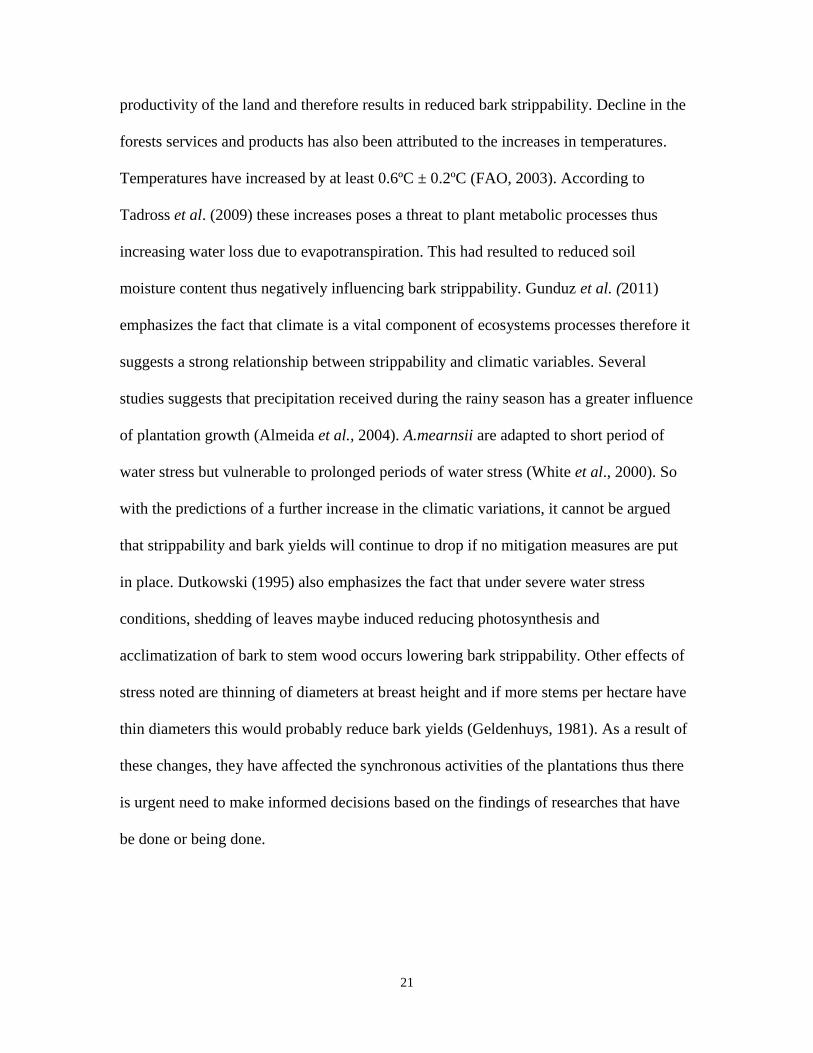
3.2.1 Location
Figure 1; Location of the study area in Zimbabwe Figure 1; Location of the study area in Zimbabwe
23
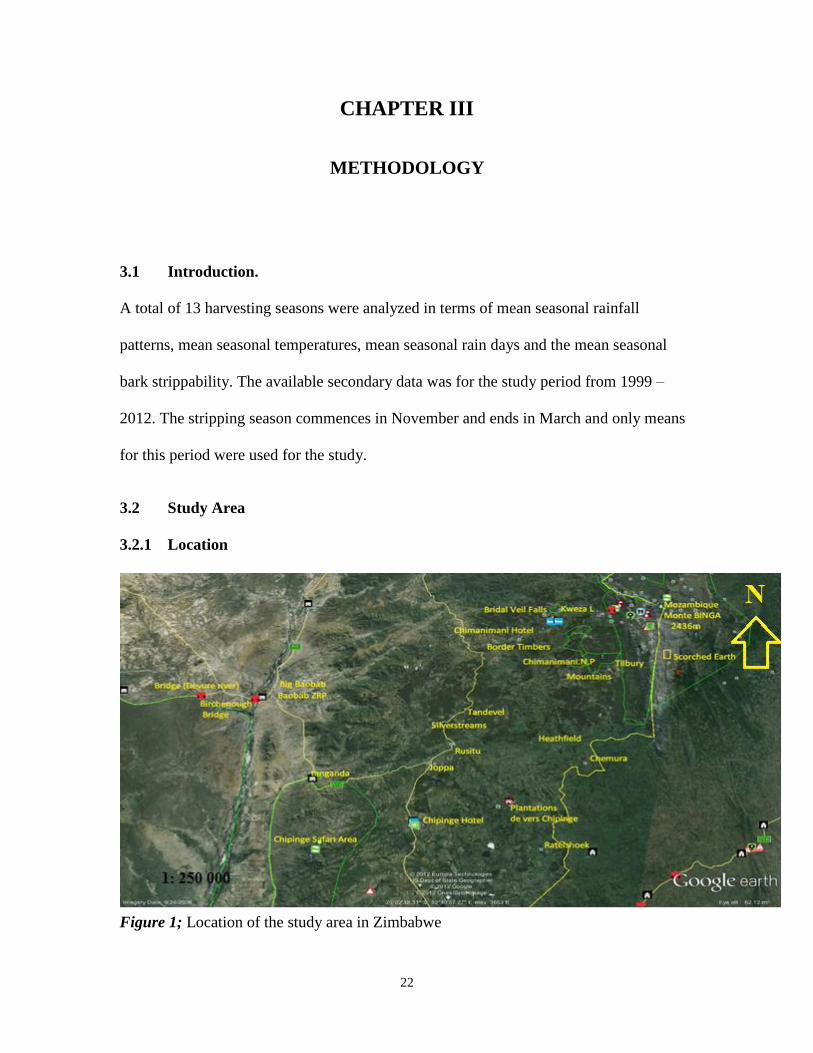
Legend
Non target area
Non target area
Compartment 37
Boundary
River
Compartment road
Minor road
Main road
Water point
The study was done in Silverstreams which is the Central Deport of Chimanimani Wattle
Mimosa. It extends from 19° 48' 0" South, 32° 52' 0" East. Silverstreams is the third
largest estate (958 ha) and it shares its boundaries (northern, southern, eastern and
western) with Tandevel, Highlands, Heathfield and Cecilton respectively.
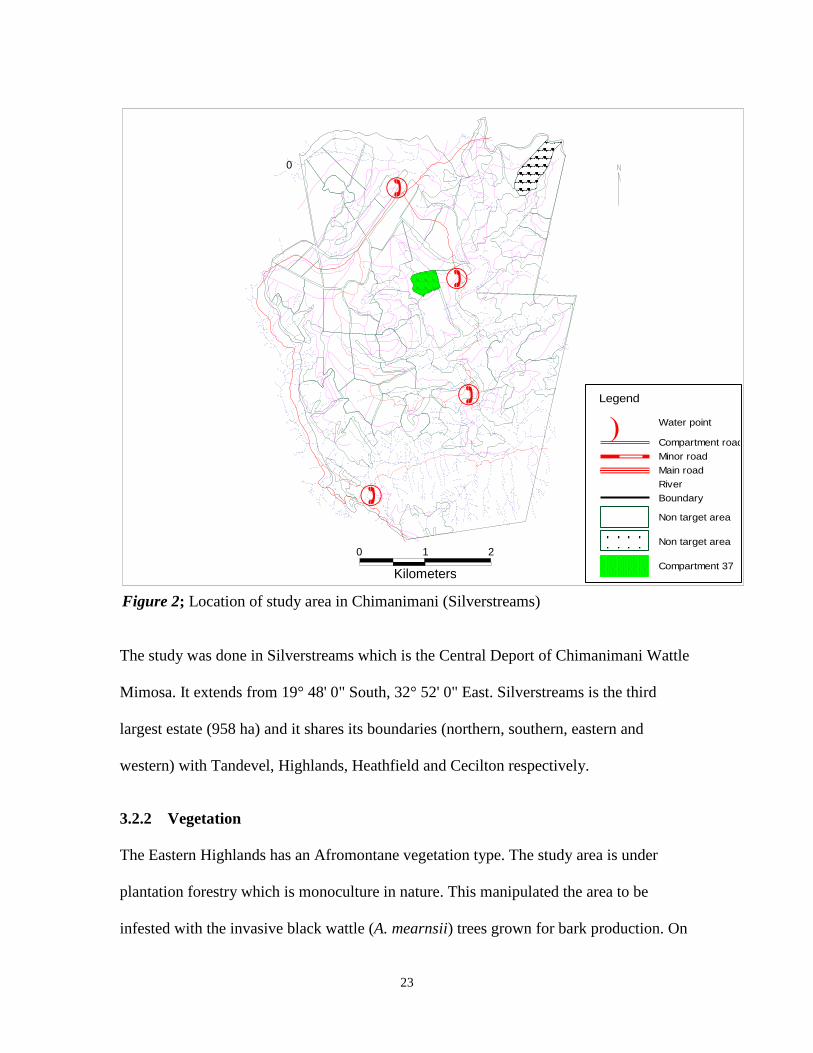
3.2.2 Vegetation
The Eastern Highlands has an Afromontane vegetation type. The study area is under
plantation forestry which is monoculture in nature. This manipulated the area to be
infested with the invasive black wattle (A. mearnsii) trees grown for bark production. On
0 1 2
Kilometers
0
Figure 2; Location of study area in Chimanimani (Silverstreams)
24
the outskirts and boundaries of the plantations, patches of Pinus patula, P elliotti, and
Eucalyptus grandis species are found growing in association with the A. mearnsii. The
gaps or patches seen between some compartments in both estates on the map were a
result of unplanted area, infertile areas and the temporarily unplanted area after
harvesting. A.mearnsii trees are grown on 9 years rotation and only trees with diameter
greater than 8cm are harvested for bark and their wood is used for charcoal production.
Common animals species found are the Chacma baboon (Papio ursinus), kudu
(Tragelapus strepsiceros) and the common bug mired (Lygidolon laevigatum).
3.2.3 Geology and soils
Soils are derived mainly from granite and igneous rocks. They are predominantly sandy,
with heavier loamy and clay soils occurring in relatively small local areas. The soils of
the main wattle-growing areas are derived mainly from granite, quartzite, and dolerite,
with textures varying from sand to clay loam. The highest yields of wattle bark are
obtained from deep, well-drained sites irrespective of the parent rock.
3.2.4 Climate
Chimanimani falls in Zimbabwe’s agro-ecological region 1. This area is suited for
intensive farming, livestock production and horticulture. The climate varies from sub-
tropical to near temperate. It is characterized by mean annual rainfall of at least 1000mm
and mean monthly temperature of 13ºC between June to July to 25ºC in December and
January. Much of the rain falls between the month of November and March (Mugandani
et al., 2012). The rainfall pattern is generally long and reliable but of recent, it has been
seen shifting to short and erratic with prolonged dry spells (Gwaze, 1986; Mugandani et
al., 2012).
25
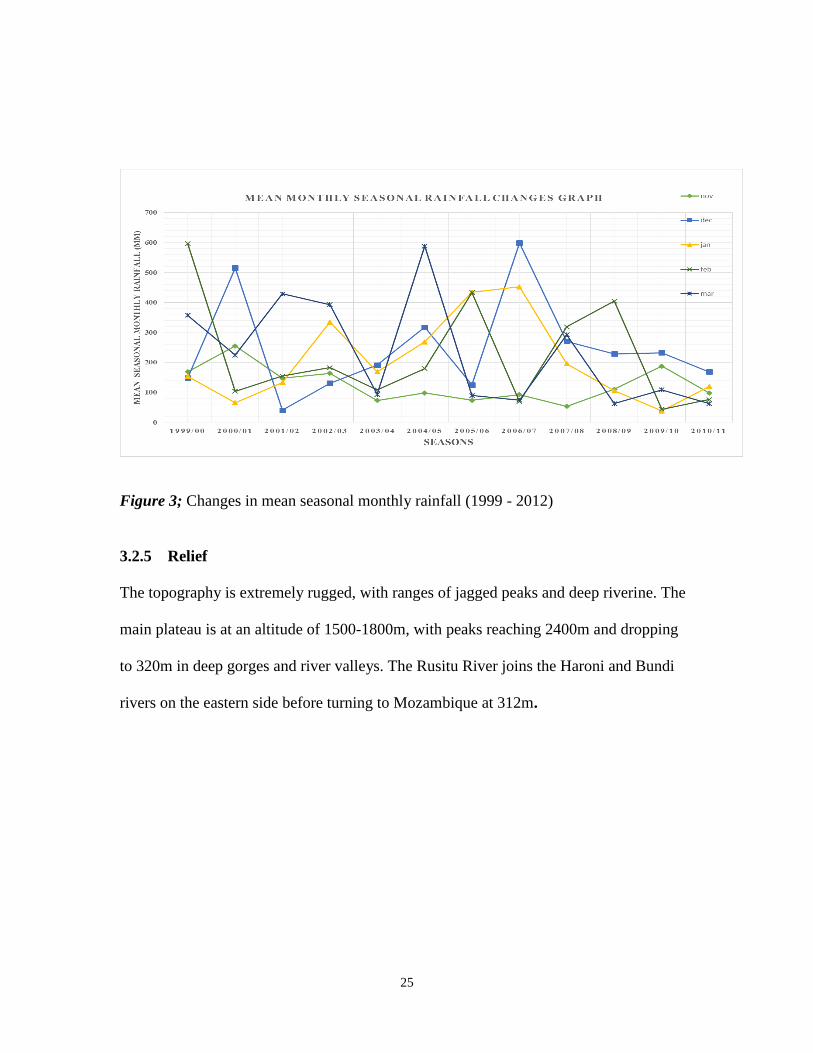
Figure 3; Changes in mean seasonal monthly rainfall (1999 - 2012)
3.2.5 Relief
The topography is extremely rugged, with ranges of jagged peaks and deep riverine. The
main plateau is at an altitude of 1500-1800m, with peaks reaching 2400m and dropping
to 320m in deep gorges and river valleys. The Rusitu River joins the Haroni and Bundi
rivers on the eastern side before turning to Mozambique at 312m.
26
3.3 Materials and methods
3.3.1 Experimental design
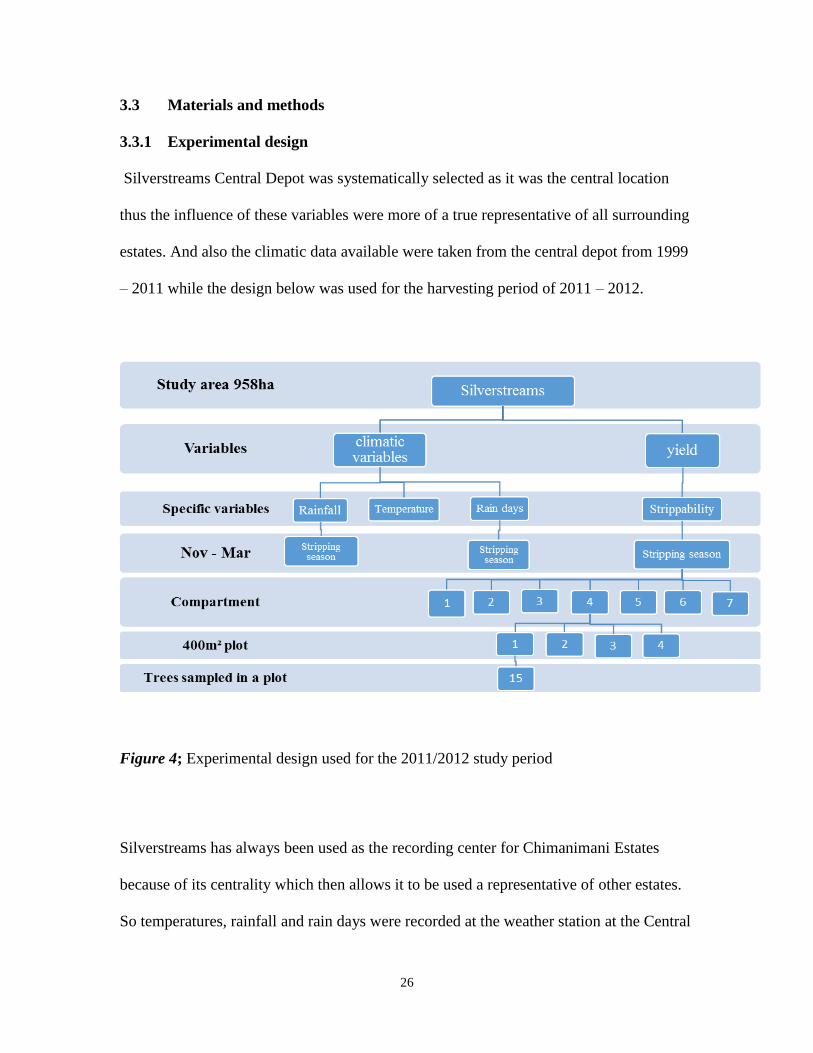
Silverstreams Central Depot was systematically selected as it was the central location
thus the influence of these variables were more of a true representative of all surrounding
estates. And also the climatic data available were taken from the central depot from 1999
– 2011 while the design below was used for the harvesting period of 2011 – 2012.
Figure 4; Experimental design used for the 2011/2012 study period
Silverstreams has always been used as the recording center for Chimanimani Estates
because of its centrality which then allows it to be used a representative of other estates.
So temperatures, rainfall and rain days were recorded at the weather station at the Central
27
depot. Strippability was calculated from the complete enumeration of all the seven
harvesting compartments. This was systematically done for the harvesting season which
extends from November to March. A total number of 4 square plots measuring 20×20m
(400m²) were randomly selected in each compartment. In that plot at least 15 trees were
randomly selected and tested for strippability by an expert stripper using an axe or
machete. A score in percentage was recorded based on the stripper’s opinion and
recorded against each tree. After that a mean strippability for each compartment was
calculated by adding all the tree strippabilities (n=60) and divide by 60. The total sample
size would be (N= 60 × 7) 540.The stripping inventory was done before harvesting of
each compartment and the compartments were distributed across the harvesting season.
3.3.2 Data collection
It has been a daily routine to record rainfall and temperature at the Wattle Company from
as early as 1998 as the records used for the study can support. Also total bark harvested
per season have been documented for production analysis back dating the same period.
3.3.3 Precipitation
Secondary data from the period 1999 – 2011 were obtained from the planning department
records while for the 2011 – 2012 data was collected from the weather station each
morning at 8am. Daily precipitation were recorded from the rain gauge at the weather
station and the mean monthly precipitation was calculated. This was done for the
stripping season (November – March) which is a 5 month period and the mean monthly
values were used for the study. The total sample of 65 months were used for analysis and
it was analysed using One way Anova from SPSS version 21.
28
3.3.4 Bark strippability
Data on strippability for the period of 1999 -2011 were obtained from the yearly returns
records in planning department. For the 2011 – 2012 harvesting season, data was
collected during the pre-stripping tests done atleast a month before the actual harvesting.
A tape measure was used to demarcate plots measuring 20m×20m (400m²) in a
compartment. At least 3 plots were randomly selected in a compartment and 15 trees
were randomly selected and tested for strippability in that plot. Each compartment had a
sample size of N=60. An expert stripper carried the stripping exercise and issued a score
for each tree. Strippability is measured as a percentage thus it was recorded in
percentages. The compartments were harvested in different months thus each
compartment was recorded against the time of harvesting. The mean strippability for that
compartment would be recorded as the mean monthly strippability. These mean monthly
strippabilities were used to see if there were any significant changes over the study
period.
3.3.5 Temperature
Secondary data was obtained from the planning department of Wattle Mimosa for the
period of 1999 to 2011. From the month of September 2011 to April 2012 daily
temperatures were recorded from the readings of the thermometers from the Stevenson’s
screen. The recording was done twice a day in the morning (8am) and in the afternoon
(2pm) and the average of the two was used as the daily mean temperature. Daily mean
temperatures were used to calculate the monthly mean temperatures and these were used
for the study. Data collected was for the harvesting season only and One Way Anova was
used to analyse the changes over the study period.

29
3.3.6 Data analysis
One Way Anova was used to analyse for changes in the climatic variables and bark
strippability while Pearson’s correlation was used to ascertain the strength of the
relationship between the climatic variables and bark strippability.
30
CHAPTER IV
RESULTS
4.1 Introduction
This chapter will show the results obtained from the data that was analysed. Results
would be were presented in the order of research objectives that is One Way Anova
results for the rainfalls, temperatures , rain days and strippability for the 1999 – 2012
harvesting / stripping season. Correlation of these variables and bark strippability were
also done and results are shown on the correlation section. SPSS version 21 was used to
analyse the data and the results were used to make conclusions and recommendations.
31
4.2 Precipitation trends
0
50
100
150
200
250
300
350
400
Rain
fall
(m
m)
Stripping season
Changes in mean seasonal rainfalls in Chimanimani
Rainfall Linear (Rainfall) 2 per. Mov. Avg. (Rainfall)
Figure 5; Graph showing mean seasonal rainfall for Chimanimani (1999 - 2012)
F12, 52 = 1.011; P > 0.05
Mean seasonal rainfall did not significantly differ (p>0.05) from 1999/00 – 2011/2012.
But there are cycles showing a decreasing trend at least on 2 years intervals.
32
4.3 Temperature trends
16.5
17
17.5
18
18.5
19
19.5
20
20.5
21
21.5
Tem
per
atu
res °C
Stripping season
Changes in mean seasonal temperatures in Chimanimani
Temperature Linear (Temperature) 2 per. Mov. Avg. (Temperature)
Figure 6; Graph showing mean seasonal temperature for Chimanimani (1999 - 2012)
F12, 52 = 4.931; P <0.001
There is a significant difference (p <0.05) in the mean seasonal temperatures from
1999/00 – 2011/2012. Temperatures have generally increased by a mean of 0.15ºC (see
appendices) over the study period. The increase is cyclic in nature on an interval of at
least 3 years.
33
4.4 Bark strippability trends.
0
20
40
60
80
100
120
Str
ipp
ab
ilit
y
Stripping season
Changes in bark strippability in Chimanimani Strippability Linear (Strippability) 2 per. Mov. Avg. (Strippability)
Figure 7; Graph showing mean seasonal bark strippability in Chimanimani
F12, 52 = 2.751; P < 0.01
Mean seasonal bark strippability shows a significant difference (P < 0.01) over the study
period. Strippability has generally decreased by at least 2% per annum over the 13
seasons. The decrease is cyclic on at least 2 years intervals. From 2006/07 the rotation
cycle has increased to at least 5 years.
34
4.5 Rain days
0
2
4
6
8
10
12
14
16
18
20
Ra
in d
ay
s
Stripping season
Changes in mean seasonal rain days in Chimanimani
Rain days Linear (Rain days) 2 per. Mov. Avg. (Rain days)
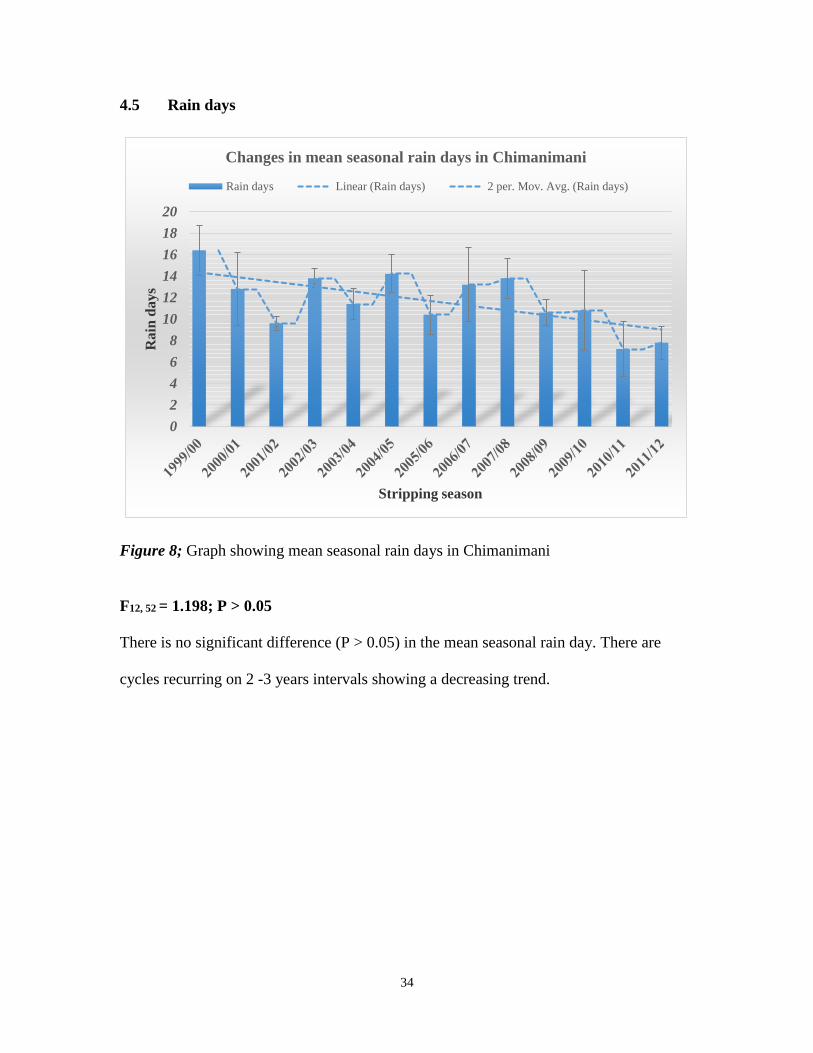
Figure 8; Graph showing mean seasonal rain days in Chimanimani
F12, 52 = 1.198; P > 0.05
There is no significant difference (P > 0.05) in the mean seasonal rain day. There are
cycles recurring on 2 -3 years intervals showing a decreasing trend.
35
4.6 Changes in the mean monthly rainfalls.
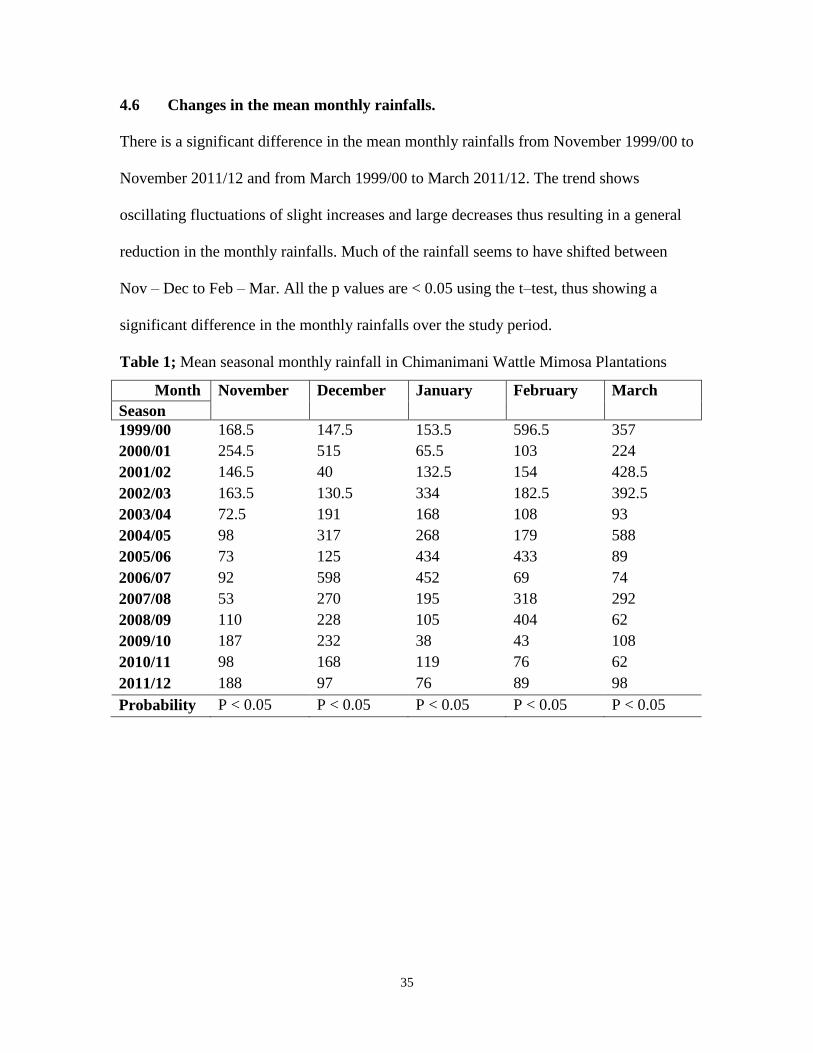
There is a significant difference in the mean monthly rainfalls from November 1999/00 to
November 2011/12 and from March 1999/00 to March 2011/12. The trend shows
oscillating fluctuations of slight increases and large decreases thus resulting in a general
reduction in the monthly rainfalls. Much of the rainfall seems to have shifted between
Nov – Dec to Feb – Mar. All the p values are < 0.05 using the t–test, thus showing a
significant difference in the monthly rainfalls over the study period.
Table 1; Mean seasonal monthly rainfall in Chimanimani Wattle Mimosa Plantations
Month November December January February March
Season
1999/00 168.5 147.5 153.5 596.5 357
2000/01 254.5 515 65.5 103 224
2001/02 146.5 40 132.5 154 428.5
2002/03 163.5 130.5 334 182.5 392.5
2003/04 72.5 191 168 108 93
2004/05 98 317 268 179 588
2005/06 73 125 434 433 89
2006/07 92 598 452 69 74
2007/08 53 270 195 318 292
2008/09 110 228 105 404 62
2009/10 187 232 38 43 108
2010/11
2011/12
98
188
168
97
119
76
76
89
62
98
Probability P < 0.05 P < 0.05 P < 0.05 P < 0.05 P < 0.05
36
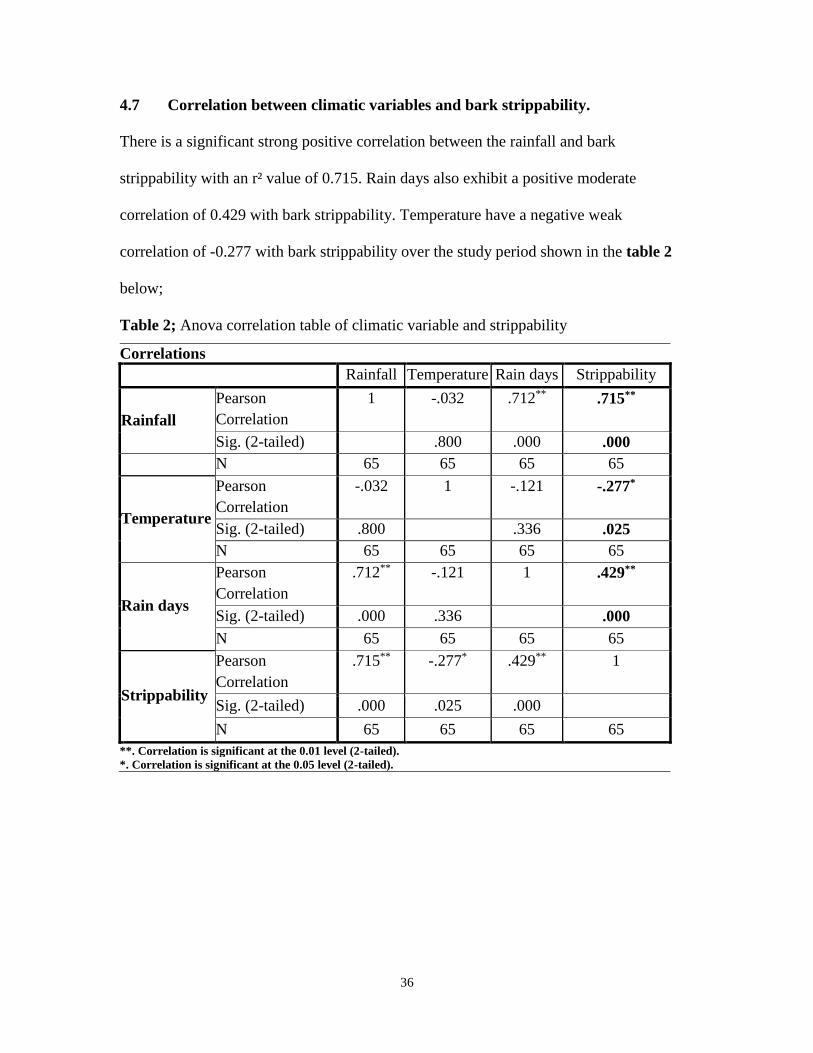
4.7 Correlation between climatic variables and bark strippability.
There is a significant strong positive correlation between the rainfall and bark
strippability with an r² value of 0.715. Rain days also exhibit a positive moderate
correlation of 0.429 with bark strippability. Temperature have a negative weak
correlation of -0.277 with bark strippability over the study period shown in the table 2
below;
Table 2; Anova correlation table of climatic variable and strippability
Correlations
Rainfall Temperature Rain days Strippability
Rainfall
Pearson
Correlation
1 -.032 .712** .715**
Sig. (2-tailed) .800 .000 .000
N 65 65 65 65
Temperature
Pearson
Correlation
-.032 1 -.121 -.277*
Sig. (2-tailed) .800 .336 .025
N 65 65 65 65
Rain days
Pearson
Correlation
.712** -.121 1 .429**
Sig. (2-tailed) .000 .336 .000
N 65 65 65 65
Strippability
Pearson
Correlation
.715** -.277* .429** 1
Sig. (2-tailed) .000 .025 .000
N 65 65 65 65
**. Correlation is significant at the 0.01 level (2-tailed).
*. Correlation is significant at the 0.05 level (2-tailed).

37
4.8 The correlation between mean seasonal rainfall and bark strippability.
0
10
20
30
40
50
60
70
80
90
0
50
100
150
200
250
300
Str
ipp
ab
ilit
y (
%)
Ra
infa
ll
(mm
)
Time (season)
Correlation between rainfall and strippability
rainfall
strippability
Figure 9; Graph showing correlation between rainfall and bark strippability
R² = 0.715; P < 0.001
There is a significant strong positive correlation between the mean seasonal rainfall and
bark strippability over the study period. This is explained by the r² of 0.715. So 71.5% of
variation in bark strippability is being explained by rainfall.
38
4.8 The correlation between mean seasonal temperature and bark strippability.
17.5
18
18.5
19
19.5
20
20.5
21
0
10
20
30
40
50
60
70
80
90
Tem
per
atu
re
C
Str
ipp
ab
ilit
y (
%)
Time (season)
Correlation between temperatures and bark strippability
temperature
strippability
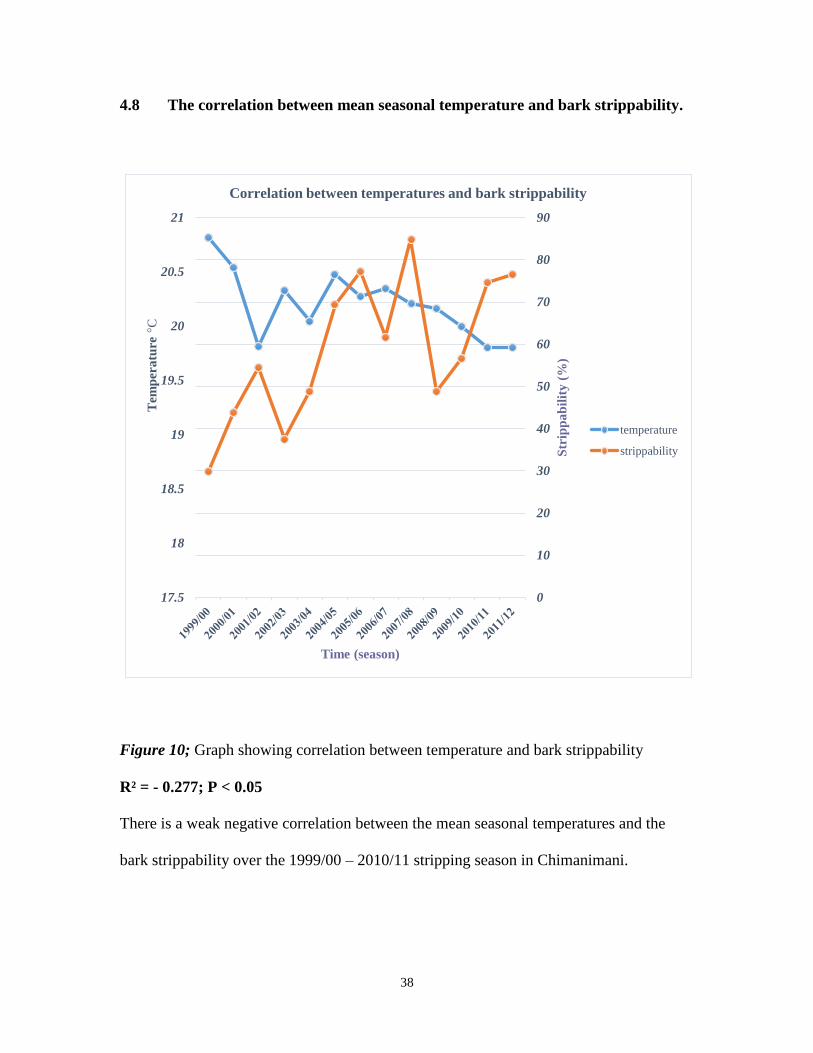
Figure 10; Graph showing correlation between temperature and bark strippability
R² = - 0.277; P < 0.05
There is a weak negative correlation between the mean seasonal temperatures and the
bark strippability over the 1999/00 – 2010/11 stripping season in Chimanimani.
39
4.9 Correlation between mean seasonal rain days and bark strippability.
0
10
20
30
40
50
60
70
80
90
0
2
4
6
8
10
12
14
16
18
Str
ipp
ab
ilit
y (
%)
Rain
days
Time (season)
Correlation between rain days and strippability
rain days
strippability
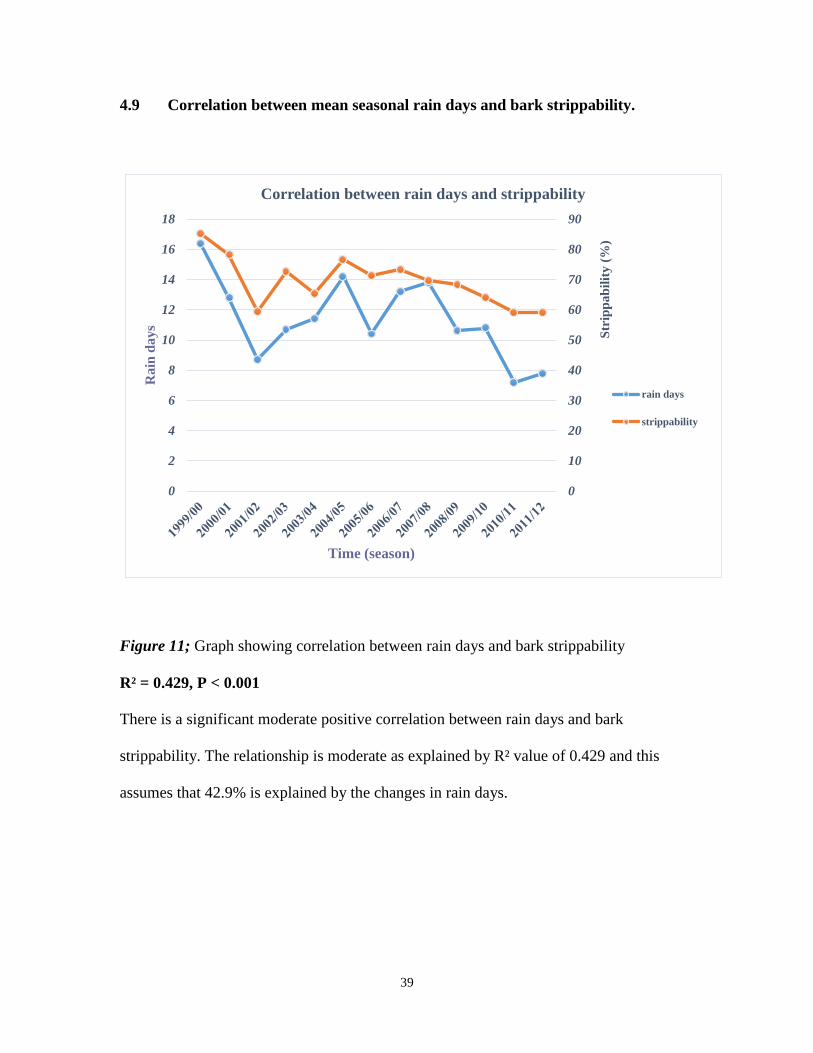
Figure 11; Graph showing correlation between rain days and bark strippability
R² = 0.429, P < 0.001
There is a significant moderate positive correlation between rain days and bark
strippability. The relationship is moderate as explained by R² value of 0.429 and this
assumes that 42.9% is explained by the changes in rain days.
40
CHAPTER 5
DISCUSSION
5.1 Trends in climatic variables
5.1.2 Temperature
Temperature had a significant increase from the available data of 1999 – 2012. The
increase in the temperature were in a cyclic manner at an interval of at least 3 years.
According to Tyson (1986), he also noted that temperatures were exhibiting a cyclic trend
which had an increasing trend. A mean increase of 0.15°C was recorded over the study
period of 13 years. The trend of an increase in temperatures conforms to other studies that
have been done in Zimbabwe which showed a mean increase of 0.4°C (Unganai, 2009;
Matarira and Mwamuka, 1995; Mugandani et al., 2012). Global predictions estimated a
mean global increase of 0.6 °C ± 0.2°C (IPCC, 2007). The differences in the mean
increases to my obtained value of 0.15°C and 0.4°C of other studies could be attributed to
the shorter study period of 13 years used compared to the 100 years that has been used by
other studies.
The increases in temperature are influenced by global warming (IPCC, 2007) which is a
result of increase in greenhouse gases such as CO2, CH4, 03 and NOX in the atmosphere.
Unganai (2009) also noted that the highest temperatures recorded in Zimbabwe so far
were in 2005, 2007 and 2008. This conforms to the highest peaks recorded from my
temperature graph showing synchronous and validity of my results which are in line with
what other researchers have obtained and concluded.
41
Temperature showed a negative correlation with bark strippability over the study period
of the available data. Although the link is weak (27.7%), it suggests that as temperatures
increases bark strippability decrease and vice versa. This can be seen from the graph (see
figure 10) and the weak relationship could be attributed to the short study period used.
Jensen (2000) only concludes on the sensitivity of plants to slight changes in climatic
variables particularly rainfall and temperature while Hulme et al. (2000) reported on the
shifts in vegetation structure and composition. But there is paucity of literature on the
influence of climatic variables on specific timber products including bark strippability.
Speculations and assumptions which have not be tested and proved only suggests that
there a close link thus a research of this nature was carried out although it is not being
conclusive but providing a baseline to other studies.
According to FAO (2003), it was reported that a warming trend in the global average
surface temperature of 0.6ºC since 1900 is already resulting in the death of trees in the
boreal forests and shifts in the geographic distribution of forest vegetation. So this also
led to speculations in the Chimanimani that temperature increases could be affecting bark
strippability by reducing soil moisture content resulting to acclimatization of the bark to
the stem. It then results in the decline of bark strippability as seen from 85% to 59% over
a period of 13 seasons.
Conway (2009) also reported that increase in temperatures indicate that Afromontane
ecosystems which are habitat to A.mearnsii are not going to be spared. This could be due
to increase in aridity however it is predicted that many regions of Africa will suffer from
temperature increases and droughts caused by range shifts along altitudinal and moisture
gradients (Hulme et al., 2000; Hannah et al., 2008; Conway, 2009).
42
5.1.3 Rainfall.
Rainfall did not significantly change over the study period (P>0.05). It showed a cyclic
trend which exhibited a decrease in the rainfall although not yet statistically identifiable.
Similar results were concluded by Tyson (1986) that southern African rainfall showed a
cyclic behaviour. This behaviour could be a result of linkages between rainfall and El
Nino events (Nash and Endfield, 2008) which are considered to explain partly the
occurrence of droughts. What is uncertain is whether the general perception about the
progressive desiccation in Zimbabwe is valid.
Makarau (1995) also made similar observations that rainfall had generally decreased by
10% although statistically it was not identifiable within the available rainfall time series.
Other studies (New et al., 2006, Conway et al., 2008 and Aguilar et al., 2009) concluded
that this does not imply that global warming will not cause changes of rainfall in
Zimbabwe, but the effects are not yet statistically significant within the available
historical rainfall record. Effects of climate change on annual rainfall may not be
statistically detectable due to the low signal to noise ratio arising from the high inter-
annual variability of rainfall in Zimbabwe (Makarau, 1995). The differences in the 7%
obtained from my results and the predicted 10% - 15% could be attributed to the shorter
study period that l used and the analyzing without a model as in other studies models
were used. The above mentioned researchers have attributed that rain gauge exposure and
observational procedures used may be influencing the results.
The results show increase in years of low rainfall which conforms to (Unganai, 2009)
study. It has been noted that rainfalls have shifted their onsets across the season (see
table 1) and this relates to conclusions made by Mugandani et al., 2012) in Zimbabwe.
43
Strippability directly depends on the rainfall received particularly during the stripping
season which is from November – March (UCL, 2009) thus the study only used the data
for that period as it determines the soil moisture content (Meagan et al., 1998).
There is a strong positive (71.5%) relationship between rainfall and bark strippability.
This is because as rainfall increase, the soil moisture content also rise and this increases
the moisture in the inner cambium thus bark strippability increases as well (UCL, 2009).
But if rainfall decreases, then the strippability would likely decrease as well. In 2005/06,
rainfall increased but strippability decreased and this could be as a result of decrease in
rain days. With projections of a further decrease in precipitation by IPCC, bark
strippability faces a potential threat of further decrease as rainfall continues to decrease in
Zimbabwe (Mugandani et al., 2012, Matarira and Mwamuka, 1995, Unganai, 2009).
5.1.4 Rainfall days
There is no significant difference (P>0.05) in the mean seasonal rain days over the
1999/00 – 2010/11 stripping season. From the results, a general decrease is noted in form
of 2 years cycles following the rainfall trends. This is from 1999/00 – 2001/02, 2002/03 –
2003/04, 2004/05 – 2005/06 and 2007/08 – 2010/11 while there is an increase from
2006/07 – 2007/08. The decreases in the rain days also coincides with the drought
periods (Chenje et al., 1998).
If rainfall is not evenly distributed over the rain season even when huge amounts are
received this tends to affect bark strippability (UCL, 2009). Uneven distribution of
precipitation results in prolonged dry spell duration and low soil moisture (Matarira and
Mwamuka, 1995). But if rainfall is received in small amounts but frequently distributed,
44
this leads to improved strippability concluding that both amount and distribution are of
vital role in determining the strippability.
5.1.5 Strippability
Results show a significant decrease (P<0.001) in the bark strippability from 1999/00 –
2011/12 stripping seasons. Generally there is a decrease in the bark strippability by 26%
and this is occurring in cycles which are closely linked to the rainfall patterns. As rain
days decrease, strippability is also seen to follow the same pattern resulting in a decrease
in the strippability. Bark strippability is influenced by climatic elements and these pose a
threat to productivity (UCL, 2009).
45
CHAPTER 6
CONCLUSSIONS AND RECOMMENDATIONS
6.1 Conclusions
It can be concluded that climate variability have got a negative influence on climatic
variables which include rainfall, temperature and rain days. Over the study period it can
noted that temperature have significantly increased and it has got a negative influence on
bark strippability although it showed a weak relationship. This can be attributed to the
length of the study period and available data which can either be to exhibit significant
inferences in the data and make conclusive conclusions.
Rainfall and rain days have generally decreased over the study period although rainfall
was not statistically showing the significance. It be concluded that these two have a
strong influence on bark strippability with rainfall having a stronger link compared to
rain days and to temperatures. As rainfall and rain days increase, bark strippability is seen
to increase as well while a decrease of these two or one of them have a negative impact
on bark strippability.
Strippability can be concluded that it has decreased from the analysis done of the
available data. It also shows a close link with the climatic variables thereby a need to
devise mitigation measures as predictions suggests that there would be a further increase
in these felt impacts if no mitigation measures are implemented.
46
Overall it can be concluded that climatic variables shown a variation which has got a
close link with bark strippability and from the data available, these climatic elements
have been concluded to be negatively influencing bark strippability.
6.2 Recommendations
From the results l obtained l therefore recommend that a standard way of measuring bark
strippability be improvised which is not based on the stripper’s opinion. For example a
length of one meter be tested for strippability and the length that would strip over the
total length could be expressed as a fraction in percentage.
I also recommend that a similar study be done in another area like Chipinge for
comparison purposes so that conclusions can be made based on more studies and if
possible a longer period can be considered if the secondary data is available.
It could be recommended that localized models be used to predict rainfall patterns and
temperatures for the country. This could also be able to exhibit inferences within the
available time series data which has not be statistically identifiable.
6.3 Suggestions
I also suggest that drought and temperature resistant seeds be used to improve yields as
well as more labour being channeled towards the stripping activity during the harvesting
to as to finish while rains are still available. Also seasonal or contract workers can be
employed to copy with the rains.
Breeding programs can be made available to reduce establishment costs and have
seedlings which are suitably adapted to the adverse impacts of variability and the
environment.
47
REFERENCES
Adeleke.B.O and Goh.C.L. (1980) Certificate physical and human geography.
Ibadan: University Press Limited.
Aguilar, E., Aziz Barry, E., Brunet, M., Ekang, L., Fernandes, A., Massoukina,
M., Mbah, J., Mhanda, A., do Nascimento, D. J., Peterson, T. C., Thamba Umba,
O., Tomou, M., and Zhang, X.: (2009). Changes in temperature and precipitation
extremes in wester, central Africa, Guinea Conakry, and Zimbabwe, J. Geophys.
Res., 114(11p), 1955– 2006, doi:10.1029/2008JDO11010, also available:
http://www. agu.org/journals/ABS/2009/2008JD011010.shtml, 2010
Almeida AC, Landsberg JJ, Sands PJ, Ambrogi MS, Fonseca S, Barddal SM,
Bertolucci FL (2004) Needs and opportunities for using a process-based
productivity model as a practical tool in Eucalyptus plantations. Forest Ecology
and Management 193, 167-177
Battaglia.M, Bruce.C, Brack.C and Baker.T. (1997). Climate Change and
Australia’s plantation estate: Analysis of vulnerability and preliminary
investigation of adaptation options. Forest and Wood Products Australia Limited,
Australia.
Bazzaz, F.A. (1990). The response of natural ecosystems to the rising global
carbon dioxide levels. Annual review of Ecology and Systematics.
Brown.Y, Emilio. C, Thuiller.W, Maiorano.L, Guisan.A and Araujo.B. (2012).
Potential Impacts of Climate Change on Ecosystem Services in Europe: The Case
of Pest Control by Vertebrates. Europe.
48
Chenje, M, Sola, L and Paleczny, D. (eds). (1998). The state of Zimbabwe’s
environment. Government of the republic of Zimbabwe, Ministry of Mines,
Environment and Tourism, Harare.
Clarke, J and Katerere, Y. (1994). Building on indigenous natural resource
management: Forestry practices in Zimbabwe’s communal lands. Forestry
Commission, Harare.
Clarke.C and Katerere.M (2003). Climate change impacts on African Forests and
people – IUFRO. Pp 45- 78
Conway, D., Persechino, A., Ardoin-Bardin, S., Hamandawana, H., Deulin, C.,
and Mahe, G. (2008). Rainfall and water resources variability in sub-Saharan
Africa during the 20th century. Working Papaer 119, Tyndall Centre for Climate
Change Research, University of East Anglia, UK.
Conway.G. (2009). The science of climate change in Africa: impacts and
adaptation. Grantham Institute for Climate Change. Discussion paper No1.
London
Diaz.H.F. and Markgraf.V. (1992). Historical El Nino/ Southern Oscillation
variability in the Australiansian region. Pp 156 - 167
Dutkowski GW (1995) Genetic variation in drought susceptibility of Eucalyptus
globulus spp. globulus in plantations in Western Australia. In 'Eucalypt
Plantations: Improving Fibre Yield and Quality Proc. CRCTHF - IUFRO Conf.
Hobart, 19-24 Feb (1995). (Eds BM Potts, NMG Borralho, JB Reid, WN Tibbits
and CA Raymond) pp. 199-203. (CRC for Temperate Hardwood Forestry:Hobart)
49
Esprey LJ, Sands PJ, Smith CW (2004) Understanding 3-PG using a sensitivity
analysis. Forest Ecology and Management 193, 235-250..
FAO, (2003). State of the world’s forest 2003. FAO. Rome.
Fischlin. A, Midgley. G.F, Price. J.T, Leemans. R, Gopal. G, Turley. C,
Raunsevell.M.D.A, Dube. O.P, Tarazona.J and Velichko.A.A. (2007).
Ecosystems their properties, goods and services. In Parry.M.L, Canziani.O.F,
Palutikot.J.P, Van der Linden.P.J and Hanson.C.E (Eds). Climate change 2007:
Impacts, adaptation and vulnerability. Contribution of working group II to the
fourth assessment report of the IPCC. Cambridge University Press. Pp 211 – 272.
Geldenhuys. C.J. (1981). Sustainable Forest Management in Africa. Pp 98 – 117
Government of Namibia (2002) The potential change in yield and distribution of
the earth’s crops under a warmed climate. Climate Research 3:79-96.
Gunduz.G. Deniz.A, Murat.S.O and Akgun.K. (2011). The influence of climate
variability and change on the forest ecosystems.
Gwaze.R. (1986). Effects of site preparation subsoiling and prescribed burning
On survival and growth of shortleaf pine in the mark twain National forest: results
after 20 growing seasons. Forest research station. 195 – 199.
Hannah.L, Dave.R, Porter. L and Sandy.A. (2008). Climate change adaptation for
conservation in Madagascar. Cross Mark publishers, Australia. Vol 4 no 5 pp 98 -
123
Hingston, FJ and Galbraith, JH, (998) pplication of the process-based model
BIOMASS to Eucalyptus globulus subsp. globulus plantations on ex-farmland in
50
south Western Australia. II. Stemwood production and seasonal growth. Forest
Ecology and Management 106, 157-168.
Hulme .M. (2000). (Eds). Climate change and Southern Africa. An exploratory of
some potential impacts and implications in the SADC region. A report
commissioned by WWF International and coordinated by the climate research
unit. UEA Norwich. Pp 49 – 55.
Hulme, M. and Sheard, N. 1999. Climate change scenarios for Zimbabwe,
Climatic Research Unit, Norwich, 6pp.
IPCC (1996). Climate change 1995: Impacts, adaptation and mitigation of
climate change. In Watson.R.T, Zinwoyera.M and Moss.R.H. (Eds). Contribution
of working group II to the second assessment report of the IPCC. Cambridge
University Press.
IPCC (2001). Climate change. Synthesis report. Contribution of work group I, II
and III to the third assessment report of the IPCC. (Eds) Watson.R.T. Cambridge
University Press.
IPCC (2007). Summary for policy makers. In Parry. In Parry.M.L, Canziani.O.F,
Palutikot.J.P, Van der Linden.P.J and Hanson.C.E (Eds). Climate change 2007:
Impacts, adaptation and vulnerability. Contribution of working group II to the
fourth assessment report of the IPCC. Cambridge University Press.
Jensen.M.N (2000). More large forest fires linked to climate change. U.A
communications.
Kadonhera (2011), unpublished. BSc Thesis. The impacts of fires on the Wattle
Mimosa Plantations.
51
Kwesha.D. (1997). Global Forest Resources Assessment. Vol 6; pp 87 - 95
Leith .H. (1974). Phenology and seasonality in modelling. Springer. pp. 3 -19
Magadza.C.H.D. (1992). Climate change. Some likely change in Zimbabwe. Lake
Kariba research station. University of Zimbabwe, Harare.
Makarau.A. (1995). Intra-seasonal oscillatory modes of the southern Africa
summer circulation. PhD. Thesis, University of Cape Town, South Africa.
Malcolm, J.R., and L.F. Pitelka. 2000. Ecosystems and Global Climate Change: A
Review of Potential Impacts on U.S. Terrestrial Ecosystems and Biodiversity.
Pew Center on Global Climate Change, Arlington, VA.
Matarira.C.H and Mwamuka.F.C (1995). Zimbabwe: Climate Chang. Impacts on
Maize Production and Adaptive Measures for Agricultural activities. ISRIC
World Information. Harare, Zimbabwe.
Megan.C, Jenny .C. Stanton, Michael. J. Pilling, Shelley. N. Pressley, Brian. L,
and Anne Louise Sumner (1998) Quantifying the seasonal and interannual
variability of North American isoprene emissions using satellite observations of
the formaldehyde column.
Melillo .J.M, Gallaghan.T.V, Woodward.F.I, Salati.E and Sihna, S.K. (1990).
Effects on ecosystems. In Houghton. J.T, Jenkins.G.T and Ephraums. J.J. (Eds).
Climate change. The IPCC scientific assessment. Cambridge University Press.
Mendham D, White DA, Battaglia M, Kinal J, Walker S, Rance S, McGrath J,
Abou Arra S.(2007). Managing the trade-off between productivity and risk in the
bluegum plantations of south-western Australia. Final Report. CSIRO Client
Report 1554
52
Mugandani.R, Wuta.M, Makarau.A and Chipindu.B. (2012). Re-classification of
agro-ecological regions of Zimbabwe in conformity with climate variability and
change. African crop science society, Uganda
Mutasa.M (2008). Climate change vulnerability and adaptation in failing states:
Zimbabwe’s drought struggle. ICARUS -2 , University of Michgan.
Myers BJ, Theiveynathan S, O'Brien ND, Bond W J, (1996) Growth and water
use of Eucalyptus grandis and Pinus radiata plantations irrigated with effluent.
Tree Physiology 16, 211-219.
Nash, D. J. and Endfield, G. H. (2008). Splendid rains have fallen: links between
El Nino and rainfall variability in the Kalahari, 1849– 1900. Climatic Change, 86,
257 290.
National Center for Atmospheric Research (2005). Global Warming surpasses
Natural Cycles in Fuelling 2005 Hurricane Season. Boulder Inc, USA.
National Research on Conservation (2001). Simulated changes in vegetation
distribution under global warming. Annex C, pp. 439-456 IN Watson, R. T., M.
C. Zinyowera, R. H. Moss and D. J. Dokken, eds., The Regional Impacts of
Climate Change. Cambridge Univ. Press, NY.
New, M., Hewitson, B.C., Stephenson, D.B., Tsiga, A., Kruger, A., Manhique, A.,
Gomez, B., Coelho, C.A. S., Masisi, D.N., Kululanga, E., Mbambalala, E.,
Adesina, F., Saleh, H., Kanyanga, J., Adosi, J., Bulane, L., Fortunata, L., Mdoka,
M. L. and Lajoie, R. (2006). Evidence of trends in daily climate extremes over
Southern and West Africa. Journal of Geophysical Research – Atmospheres.
Submitted
53
Orlove and Tosteson (1999). The Application of Seasonal to Interannual Climate
Forecasts Based on El Niño - Southern Oscillation (ENSO) Events: Australia,
Brazil, Ethiopia, Peru, and Zimbabwe, Institute of International Studies: Berkeley
Workshop on Environmental Politics. Paper WP99-3-Orlove.
Roper.R.(2001). Climate response Plan. State of Oregon; Impacts , Adaptation,
and Vulnerability.
Sedjo, R. A. and A. M. Solomon. (1989). Climate and forests. pp. 105-119 IN
Rosenberg, N. J., W. E. Easterling, P. R. Crosson, and J. Darmstadter, Eds.,
Greenhouse Warming: Abatement and Adaptation. Resources for the Future,
Washington, D.C.
Sherry.S.P. (1971) The Black Wattle (Acacia mearnsii De Wild). University of
Natal Press: Pietermaritzburg.
Shumba.D. (2006) Impacts of climate variability and forecasting on agriculture
(Zimbabwe experience). Workshop in reducing Climate-related vulnerability in
southern Africa, 1-4 October 2010, Victoria falls, Zimbabwe.
Tadross.M (2009) Growing-season rainfall and scenarios of future change in
southeast Africa: implications for cultivating maize. Climate Research, 40: 147-
161.
Tyson P.D. (1986) Climate change and variability in southern Africa. Oxford
Univ Press, Oxford, p 220
UCL (2009). Advanced to extract. Midlands Pines Products (Pty) Limited. South
Africa.
54
Unganai.L. (2009). Historic and future climatic change in Zimbabwe. Climate
Change 6: 137-145.
USAID (1992). Impacts of climate change and variability in the Sub Saharan
Africa. Vol 34; pp5 - 9
Warburton.M and Schulze.R.E (2006). Historical Precipitation Trends over
Southern Africa: A Hydrology Perspective. In: Schulze, R.E. (Ed) Climate
Change and Water Resources in Southern Africa: Studies on Scenarios, Impacts,
Vulnerabilities and Adaptation. Water Research Commission, Pretoria, RSA,
WRC Report 1430/1/05. Chapter 19, 325-338.
White DA, Beadle CL, Worledge D (2000) Control of transpiration in an irrigated
E.globulus Labill. plantation. Plant Cell and Environment 23, 123-134.
White, D.A., C.L. Beadle, D. Worledge, J.L. Honeysett and M.L. Cherry. 1998.
The influence of drought on the relationship between leaf and conducting
sapwood area in Eucalyptus globulus and Eucalyptus nitens. Trees Struct. Funct.
12:406–414.
White.D.A (1996). Physiological responses to drought of Eucalyptus globulus and
E. nitens in plantations. PhD Thesis. Hobart, University of Tasmania.
Zhakata.W. (2010) Climate Change Vulnerability and Adaptation Preparedness in
Southern Africa. Zimbabwe Country Report. Harare, Zimbabwe.
Ziervogel (2008) Ziervogel G, Cartwright A, Tas A, Adejuwon J, Zermoglio F,
Shale M, Snith B. (2008). Climate change and adaptation in African agriculture.
Prepared for Rockefeller Foundation by Stockholm Environment Institute.
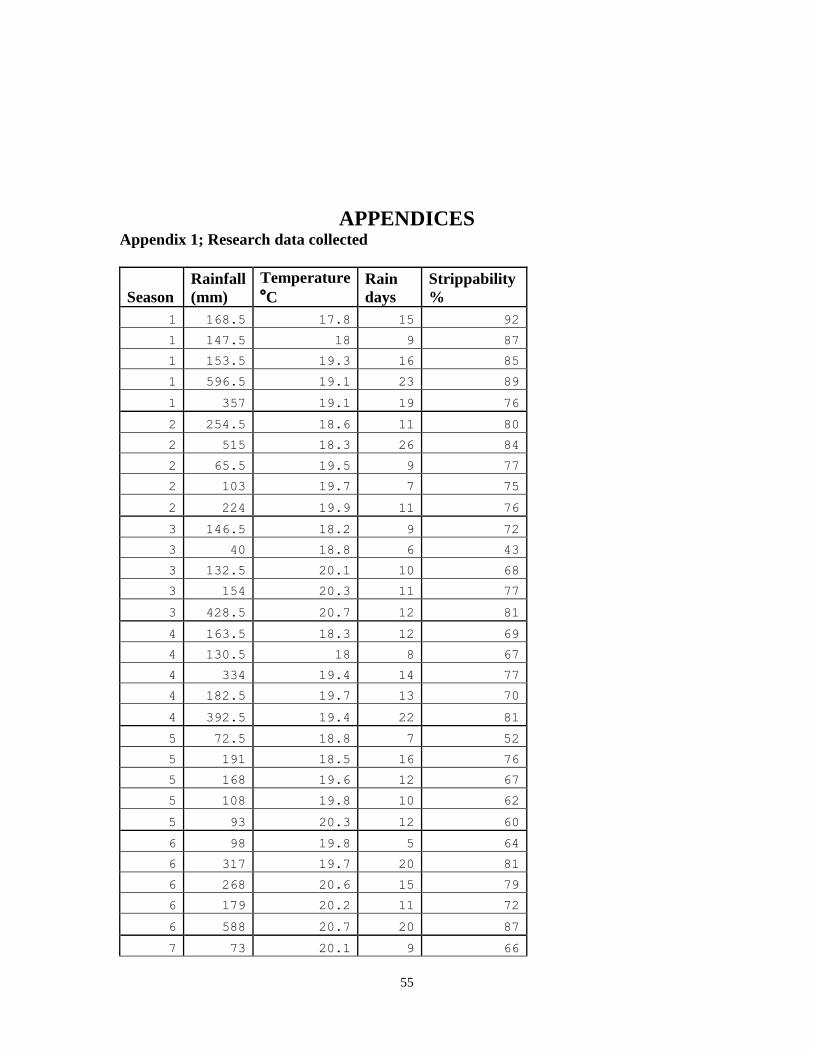
55
APPENDICES Appendix 1; Research data collected
Season
Rainfall
(mm)
Temperature
°C
Rain
days
Strippability
%
1 168.5 17.8 15 92
1 147.5 18 9 87
1 153.5 19.3 16 85
1 596.5 19.1 23 89
1 357 19.1 19 76
2 254.5 18.6 11 80
2 515 18.3 26 84
2 65.5 19.5 9 77
2 103 19.7 7 75
2 224 19.9 11 76
3 146.5 18.2 9 72
3 40 18.8 6 43
3 132.5 20.1 10 68
3 154 20.3 11 77
3 428.5 20.7 12 81
4 163.5 18.3 12 69
4 130.5 18 8 67
4 334 19.4 14 77
4 182.5 19.7 13 70
4 392.5 19.4 22 81
5 72.5 18.8 7 52
5 191 18.5 16 76
5 168 19.6 12 67
5 108 19.8 10 62
5 93 20.3 12 60
6 98 19.8 5 64
6 317 19.7 20 81
6 268 20.6 15 79
6 179 20.2 11 72
6 588 20.7 20 87
7 73 20.1 9 66
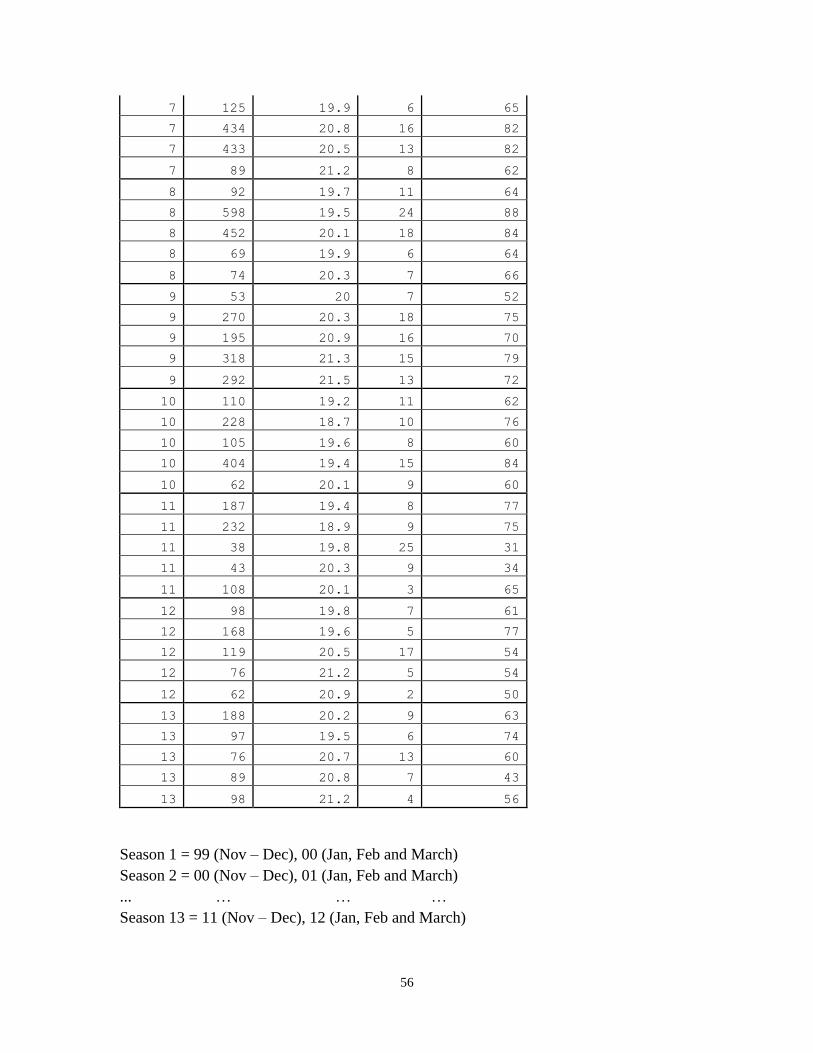
56
7 125 19.9 6 65
7 434 20.8 16 82
7 433 20.5 13 82
7 89 21.2 8 62
8 92 19.7 11 64
8 598 19.5 24 88
8 452 20.1 18 84
8 69 19.9 6 64
8 74 20.3 7 66
9 53 20 7 52
9 270 20.3 18 75
9 195 20.9 16 70
9 318 21.3 15 79
9 292 21.5 13 72
10 110 19.2 11 62
10 228 18.7 10 76
10 105 19.6 8 60
10 404 19.4 15 84
10 62 20.1 9 60
11 187 19.4 8 77
11 232 18.9 9 75
11 38 19.8 25 31
11 43 20.3 9 34
11 108 20.1 3 65
12 98 19.8 7 61
12 168 19.6 5 77
12 119 20.5 17 54
12 76 21.2 5 54
12 62 20.9 2 50
13 188 20.2 9 63
13 97 19.5 6 74
13 76 20.7 13 60
13 89 20.8 7 43
13 98 21.2 4 56
Season 1 = 99 (Nov – Dec), 00 (Jan, Feb and March)
Season 2 = 00 (Nov – Dec), 01 (Jan, Feb and March)
... … … …
Season 13 = 11 (Nov – Dec), 12 (Jan, Feb and March)

57
Appendix 2; Anova table for differences in climatic variables and strippability
Appendix 3; Pearson‘s correlation table of climatic variables and strippability
Correlations
Rainf
all
Temperatu
re
Rain
days
Strippabi
lity
Rainfall Pearson
Correlati
on
1 -.032 .712**
.715**
Sig. (1-
tailed)
.400 .000 .000
N 65 65 65 65
Temperatu Pearson -.032 1 - -.277*
ANOVA
Sum of
Squares
df Mean
Square
F Sig.
Rainfall Between
Groups
261666.7
15
12 21805.56
0
1.011 .452
Within
Groups
1121130.
800
52 21560.20
8
Total 1382797.
515
64
Temperatu
re
Between
Groups
26.038 12 2.170 4.931 .000
Within
Groups
22.880 52 .440
Total 48.918 64
Rain days Between
Groups
421.446 12 35.121 1.198 .310
Within
Groups
1524.400 52 29.315
Total 1945.846 64
Strippabi
lity
Between
Groups
4236.738 12 353.062 2.751 .006
Within
Groups
6673.200 52 128.331
Total 10909.93
8
64
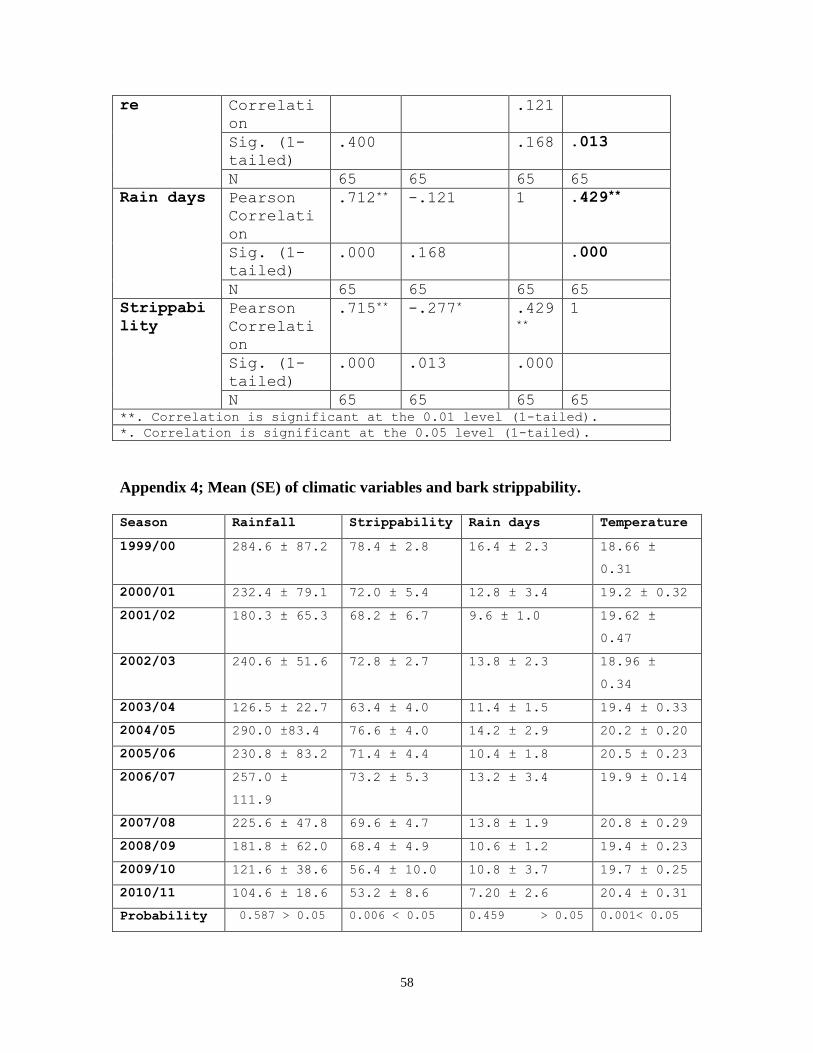
58
re Correlati
on
.121
Sig. (1-
tailed)
.400 .168 .013
N 65 65 65 65
Rain days Pearson
Correlati
on
.712** -.121 1 .429**
Sig. (1-
tailed)
.000 .168 .000
N 65 65 65 65
Strippabi
lity
Pearson
Correlati
on
.715** -.277* .429**
1
Sig. (1-
tailed)
.000 .013 .000
N 65 65 65 65
**. Correlation is significant at the 0.01 level (1-tailed).
*. Correlation is significant at the 0.05 level (1-tailed).
Appendix 4; Mean (SE) of climatic variables and bark strippability.
Season Rainfall Strippability Rain days Temperature
1999/00 284.6 ± 87.2 78.4 ± 2.8 16.4 ± 2.3 18.66 ±
0.31
2000/01 232.4 ± 79.1 72.0 ± 5.4 12.8 ± 3.4 19.2 ± 0.32
2001/02 180.3 ± 65.3 68.2 ± 6.7 9.6 ± 1.0 19.62 ±
0.47
2002/03 240.6 ± 51.6 72.8 ± 2.7 13.8 ± 2.3 18.96 ±
0.34
2003/04 126.5 ± 22.7 63.4 ± 4.0 11.4 ± 1.5 19.4 ± 0.33
2004/05 290.0 ±83.4 76.6 ± 4.0 14.2 ± 2.9 20.2 ± 0.20
2005/06 230.8 ± 83.2 71.4 ± 4.4 10.4 ± 1.8 20.5 ± 0.23
2006/07 257.0 ±
111.9
73.2 ± 5.3 13.2 ± 3.4 19.9 ± 0.14
2007/08 225.6 ± 47.8 69.6 ± 4.7 13.8 ± 1.9 20.8 ± 0.29
2008/09 181.8 ± 62.0 68.4 ± 4.9 10.6 ± 1.2 19.4 ± 0.23
2009/10 121.6 ± 38.6 56.4 ± 10.0 10.8 ± 3.7 19.7 ± 0.25
2010/11 104.6 ± 18.6 53.2 ± 8.6 7.20 ± 2.6 20.4 ± 0.31
Probability 0.587 ˃ 0.05 0.006 < 0.05 0.459 ˃ 0.05 0.001˂ 0.05

59
Appendix 5;
Copyright © 2022 FDOKUMEN