Household survey of HIV-prevalence and behaviour in Chimanimani District, Zimbabwe, 2005
152
Household survey of HIV-prevalence and behaviour in Chimanimani District, Zimbabwe, 2005 A baseline study Exnevia Gomo, Simba Rusakaniko, Wilson Mashange, Junior Mutsvangwa, Brian Chandiwana & Shungu Munyati Edited by Exnevia Gomo & Shungu Munyati W.K. KELLOGG FOUNDATION FROM VISION TO INNOVATIVE IMPACT NATIONAL INSTITUTE OF HEALTH RESEARCH, MINISTRY OF HEALTH AND CHILD WELFARE BIOMEDICAL RESEARCH & TRAINING INSTITUTE Free download from www.hsrcpress.ac.za
-
Upload
independent -
Category
Documents
-
view
3 -
download
0
Transcript of Household survey of HIV-prevalence and behaviour in Chimanimani District, Zimbabwe, 2005

Household survey of HIV-prevalence and behaviour
in Chimanimani District, Zimbabwe, 2005
A baseline study
Exnevia Gomo, Simba Rusakaniko, Wilson Mashange, Junior Mutsvangwa, Brian Chandiwana & Shungu Munyati
Edited by Exnevia Gomo & Shungu Munyati
W.K. KELLOGG FOUNDATIONFROM VISION TO INNOVATIVE IMPACT
NATIONAL INSTITUTE
OF HEALTH RESEARCH, MINISTRY OF
HEALTH AND CHILD WELFARE
BIOMEDICAL RESEARCH & TRAINING INSTITUTE
Free
dow
nloa
d fr
om w
ww
.hsr
cpre
ss.a
c.za

Prepared by the Biomedical Research and Training Institute (BRTI) andthe National Institute of Health Research (NIHR) of the Ministry of Health and ChildWelfare, Harare, Zimbabwe.
Published by HSRC PressPrivate Bag X9182, Cape Town, 8000, South Africawww.hsrcpress.ac.za
© 2006 HSRC, BRTI, NIHR & FACT
First published 2006
All rights reserved. No part of this book may be reprinted or reproduced or utilised in any form or by any electronic, mechanical, or other means, including photocopying and recording, or in any information storage or retrieval system, without permission in writing from the publishers.
ISBN 0-7969-2149-0
Print management by comPress
Distributed in Africa by Blue Weaver PO Box 30370, Tokai, Cape Town, 7966, South AfricaTel: +27 (0) 21 701 4477Fax: +27 (0) 21 701 7302email: [email protected]
Distributed in Europe and the United Kingdom by Eurospan Distribution Services (EDS)3 Henrietta Street, Covent Garden, London, WC2E 8LU, United KingdomTel: +44 (0) 20 7240 0856Fax: +44 (0) 20 7379 0609email: [email protected]
Distributed in North America by Independent Publishers Group (IPG)Order Department, 814 North Franklin Street, Chicago, IL 60610, USACall toll-free: (800) 888 4741All other enquiries: +1 (312) 337 0747Fax: +1 (312) 337 5985email: [email protected]
Free
dow
nloa
d fr
om w
ww
.hsr
cpre
ss.a
c.za

CONTENTS
Authors vi
Other contributors vii
Acknowledgements viii
List of Tables ix
List of Figures xii
Acronyms and abbreviations xiii
Executive summary xv
1 Chapter 1 Introduction 1
1.1 HIV and AIDS in Sub-Saharan Africa 1
1.2. The Orphans and Vulnerable Children Project Incorporating the Behavioural Surveillance and Serostatus (BSS) survey 3
1.3. Aims of the OVC Project 4
2 Chapter 5 Methodology 5
2.1. Study Design 5
2.2. Study Area 5
2.3. Study Population 6
2.4. Sampling of Households 7
2.5. Informed Consent 8
2.6. Confidentiality 8
2.7. Instruments for Data Collection 8
2.8. Data Collection 10
3 Chapter 15 Results for the Age Group 2–11 Years 15
3.1. Introduction 15
3.2. Objectives 15
3.3. Methodology 15
3.4. Results 17
3.5. Conclusions 30
3.6. Recommendations 32
Free
dow
nloa
d fr
om w
ww
.hsr
cpre
ss.a
c.za

4 Chapter 33 Results for Age Group 12–14 Years 33
4.1. Introduction 33
4.2. Objectives 34
4.3. Methodology 34
4.4. Results 35
4.5. Conclusions 59
4.6. Recommendations 60
5 Chapter 61 Results for Age Group 15–24 Years 61
5.1. Introduction 61
5.2. Objectives 61
5.3. Methodology 61
5.4. Results 62
5.5. Conclusions 93
5.6. Recommendations 94
6 Chapter 95 Results for Age Group 25+ Years 95
6.1. Introduction 95
6.2. Objectives 96
6.3. Methodology 96
6.4. Results 97
6.5. Conclusions 123
6.6. Recommendations 123
Free
dow
nloa
d fr
om w
ww
.hsr
cpre
ss.a
c.za

7 General Conclusions And Recomendations 125 7.1. Introduction 125
7.2. Demographic details 125
7.3. HIV prevalence by age 126
7.4. HIV prevalence by locality 127
7.5. Rites of passage 127
7.6. HIV and AIDS-related knowledge 127
7.7. Awareness of AIDS services across age groups 128
7.8. Strengths and Weaknesses of the study 128
7.9. Future research 129
7.10. Recommendations 129
References 130
Free
dow
nloa
d fr
om w
ww
.hsr
cpre
ss.a
c.za
vi
Consolidation and Final Editing of Report- Professor Exnevia Gomo: PhD, Associate Professor and Immunologist, College of Health Sciences, University of Zimbabwe, and Shungu Munyati: MSc, PhD (Cand); OVC Research Project Director and Acting Director, National Institute of Health Research (NIHR), Ministry of Health & Child Welfare (Zimbabwe)Professor Simba Rusakaniko: PhD, Biostatistician, College of Health Sciences, University of Zimbabwe
Brian Chandiwana: BCS Econs & MBA, OVC Research Project Manager; Health Economist, Biomedical Research & Training Institute, Harare (Zimbabwe)
Junior Mutsvangwa: MPhil, Medical Technologist; Laboratory Manager, Biomedical Research & Training Institute, Harare (Zimbabwe)
Wilson Mashange: Dip Med Lab Tech, Medical Laboratory Technologist, National Institute of Health Research (NIHR), Ministry of Health & Child Welfare, Harare (Zimbabwe)
AUTHORS
Free
dow
nloa
d fr
om w
ww
.hsr
cpre
ss.a
c.za
vii
Freddie Pakuromunhu Mupambireyi: MSc Demography BSc (Hons) Econs Statistician, Deputy Dean, Faculty of Commerce University of Zimbabwe
Stanford T. Mahati: MPhil, BSc (Hons) Sociology & Anthropology, Social Scientist, National Institute of Health Research (NIHR), Ministry of Health & Child Welfare, Harare (Zimbabwe)
Natsayi Chimbindi: BSc HEP, (Health Education), Biomedical Research & Training Institute Harare (Zimbabwe)
Stephen Buzuzi: MSc & BSc (Hons) Sociology and Anthropology, Biomedical Research & Training Institute, Harare (Zimbabwe)
Stella Gwini: BSc (Hons) Statistics, Biomedical Research & Training Institute, Harare (Zimbabwe)
Maxwell Chirehwa: BSc (Hons) Applied Maths (Cand), University of Science and Technology, Bulawayo (Zimbabwe)
Timothy Mutsvari: BSc Applied Maths, Biomedical Research & Training Institute, Harare (Zimbabwe)
Teramai A. Moyana: BSc (Hons) Sociology and Anthropology, Biomedical Research & Training Institute, Harare (Zimbabwe)
Chenjerai K. Mutambanengwe: BSc (Hons) Applied Maths (Cand), University of Science and Technology, Bulawayo (Zimbabwe)
Peter P. Chibatamoto: MBA, MSc Infectious Diseases, Biological Sciences, HIV/AIDS (Mainstreaming) Technical Advisor, UNDP, Windhoek (Namibia)
Mr Alfred Chingono: Clinical Psychologist, College of Health Sciences, University of Zimbabwe (Zimbabwe)
George Chitiyo: MSc & BSc Econs, Catholic Relief Services, Harare (Zimbabwe)
OTHER CONTRIBUTORS
Free
dow
nloa
d fr
om w
ww
.hsr
cpre
ss.a
c.za

viii
The authors would like to thank the Biomedical Research and Training Institute (BRTI) together with the National Institute of Health Research (NIHR), formerly the Blair Research Institute, of the Ministry of Health and Child Welfare for all the support it received from staff through contribution of their time, skills, expertise and resources during the survey.
Special thanks go to the new President and Chief Executive Officer of HSRC, Principal Consultant and Project Champion of the OVC Project, Dr Olive Shisana for her leadership and strategic direction concerning the project; the Principal Investigator of the Research Component of the Project Prof Leickness Simbayi; and the Overall Project Manager, Dr Donald Skinner, who together with other team members from the Human Sciences Research Council (HSRC) gave both technical and logistical support for this BSS component of the OVC research project.
The funding received for the OVC project, including this BSS Survey is from the WK Kellogg Foundation (WKKF), and to them we are indeed grateful.
Additionally, the research team would like to thank Rogers Sango and Tichaona Chirimanyemba – from the Zimbabwe Central Statistics Office – for their valuable technical input during the development of the instruments, the mapping, the training of fieldworkers and fieldwork.
The District Administrator for Chimanimani, Edgar Nyagwaya, the Rural District Council Chairman of Chimanimani, Joseph Harahwa, Traditional Chiefs and Councillors are saluted for their facilitatory role in ensuring the successful implementation of the field data collection exercise.
The research team appreciates the support they received from the Chimanimani OVC Local Liaison Team: J. Jaibesi; B. Muchinapo; P. Sibanda; Sr Sifovo, the late Sr M. Ndhlovu, Ms Ndima; and Mr Sigauke during the whole exercise. Our thanks are extended to the headmasters, teachers and nurses in Chimanimani who readily assisted the research team with free training venues and provided supervisors and interviewers with accommodation and logistical support.
The field supervisors are highly commended for the sterling work they did in directing the study on the ground. We also greatly thank the interviewers who collected data industriously.
Sincere gratitude is also extended to implementing partners, in particular the Grant Maker FACT-Mutare under the directorship of Jephias Mundondo.
The authors would like further to acknowledge the work undertaken by the data entry clerks under the supervision of Tendai Madiro and Lowence Gomo.
Last, but not least, this work would have been impossible without the support and the participation of the community of Chimanimani district. We thank them.
Shungu Munyati Brian ChandiwanaProject Director Project Manager
ACKNOWLEDGEMENTS
Free
dow
nloa
d fr
om w
ww
.hsr
cpre
ss.a
c.za
ix
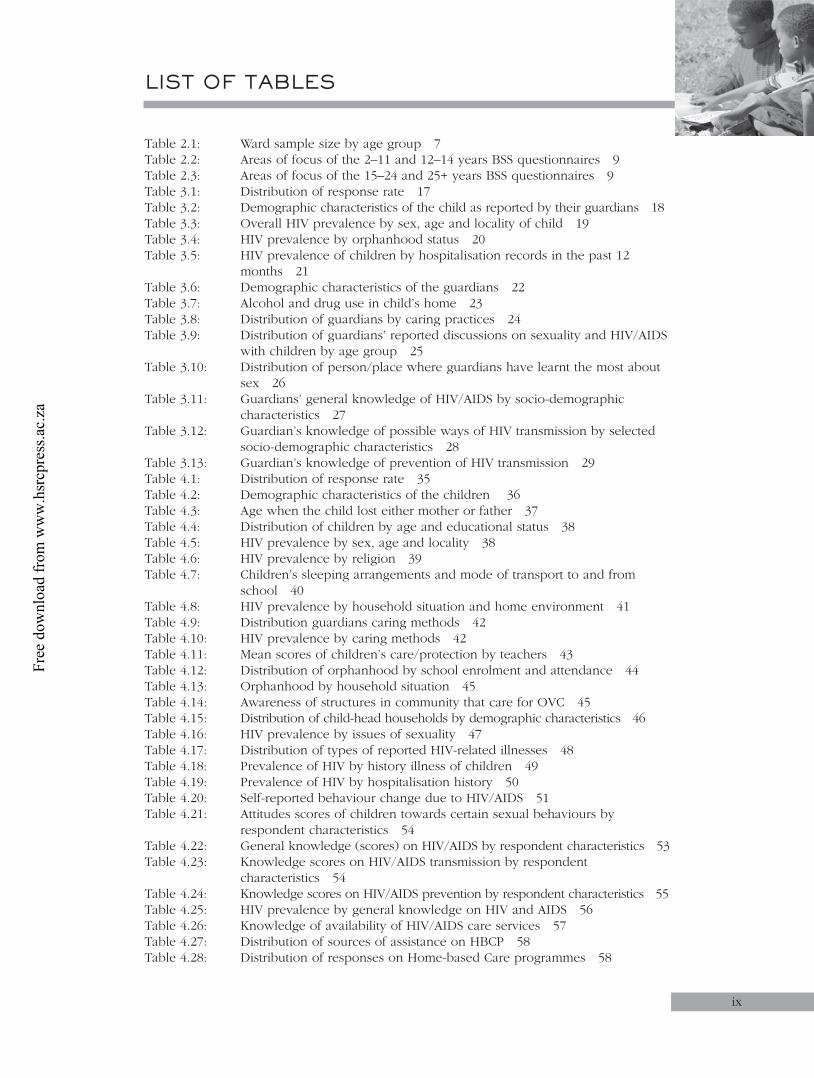
Table 2.1: Ward sample size by age group 7Table 2.2: Areas of focus of the 2–11 and 12–14 years BSS questionnaires 9Table 2.3: Areas of focus of the 15–24 and 25+ years BSS questionnaires 9Table 3.1: Distribution of response rate 17Table 3.2: Demographic characteristics of the child as reported by their guardians 18Table 3.3: Overall HIV prevalence by sex, age and locality of child 19Table 3.4: HIV prevalence by orphanhood status 20Table 3.5: HIV prevalence of children by hospitalisation records in the past 12
months 21Table 3.6: Demographic characteristics of the guardians 22Table 3.7: Alcohol and drug use in child’s home 23Table 3.8: Distribution of guardians by caring practices 24Table 3.9: Distribution of guardians’ reported discussions on sexuality and HIV/AIDS
with children by age group 25Table 3.10: Distribution of person/place where guardians have learnt the most about
sex 26Table 3.11: Guardians’ general knowledge of HIV/AIDS by socio-demographic
characteristics 27Table 3.12: Guardian’s knowledge of possible ways of HIV transmission by selected
socio-demographic characteristics 28Table 3.13: Guardian’s knowledge of prevention of HIV transmission 29Table 4.1: Distribution of response rate 35Table 4.2: Demographic characteristics of the children 36Table 4.3: Age when the child lost either mother or father 37Table 4.4: Distribution of children by age and educational status 38Table 4.5: HIV prevalence by sex, age and locality 38Table 4.6: HIV prevalence by religion 39Table 4.7: Children’s sleeping arrangements and mode of transport to and from
school 40Table 4.8: HIV prevalence by household situation and home environment 41Table 4.9: Distribution guardians caring methods 42Table 4.10: HIV prevalence by caring methods 42Table 4.11: Mean scores of children’s care/protection by teachers 43Table 4.12: Distribution of orphanhood by school enrolment and attendance 44Table 4.13: Orphanhood by household situation 45Table 4.14: Awareness of structures in community that care for OVC 45Table 4.15: Distribution of child-head households by demographic characteristics 46Table 4.16: HIV prevalence by issues of sexuality 47Table 4.17: Distribution of types of reported HIV-related illnesses 48Table 4.18: Prevalence of HIV by history illness of children 49Table 4.19: Prevalence of HIV by hospitalisation history 50Table 4.20: Self-reported behaviour change due to HIV/AIDS 51Table 4.21: Attitudes scores of children towards certain sexual behaviours by
respondent characteristics 54Table 4.22: General knowledge (scores) on HIV/AIDS by respondent characteristics 53Table 4.23: Knowledge scores on HIV/AIDS transmission by respondent
characteristics 54Table 4.24: Knowledge scores on HIV/AIDS prevention by respondent characteristics 55Table 4.25: HIV prevalence by general knowledge on HIV and AIDS 56Table 4.26: Knowledge of availability of HIV/AIDS care services 57Table 4.27: Distribution of sources of assistance on HBCP 58Table 4.28: Distribution of responses on Home-based Care programmes 58
LIST OF TABLES
Free
dow
nloa
d fr
om w
ww
.hsr
cpre
ss.a
c.za
xx
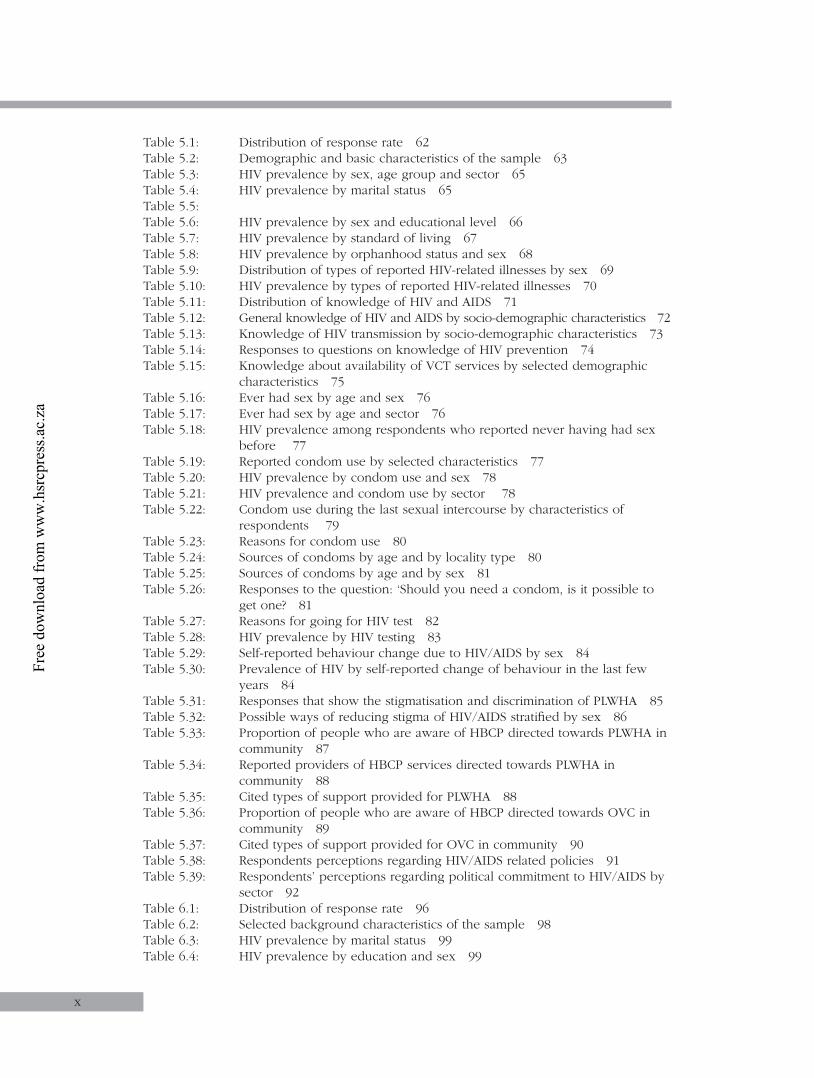
Table 5.1: Distribution of response rate 62Table 5.2: Demographic and basic characteristics of the sample 63Table 5.3: HIV prevalence by sex, age group and sector 65Table 5.4: HIV prevalence by marital status 65Table 5.5: Table 5.6: HIV prevalence by sex and educational level 66Table 5.7: HIV prevalence by standard of living 67Table 5.8: HIV prevalence by orphanhood status and sex 68Table 5.9: Distribution of types of reported HIV-related illnesses by sex 69Table 5.10: HIV prevalence by types of reported HIV-related illnesses 70Table 5.11: Distribution of knowledge of HIV and AIDS 71Table 5.12: General knowledge of HIV and AIDS by socio-demographic characteristics 72Table 5.13: Knowledge of HIV transmission by socio-demographic characteristics 73Table 5.14: Responses to questions on knowledge of HIV prevention 74Table 5.15: Knowledge about availability of VCT services by selected demographic
characteristics 75Table 5.16: Ever had sex by age and sex 76Table 5.17: Ever had sex by age and sector 76Table 5.18: HIV prevalence among respondents who reported never having had sex
before 77Table 5.19: Reported condom use by selected characteristics 77Table 5.20: HIV prevalence by condom use and sex 78Table 5.21: HIV prevalence and condom use by sector 78Table 5.22: Condom use during the last sexual intercourse by characteristics of
respondents 79Table 5.23: Reasons for condom use 80Table 5.24: Sources of condoms by age and by locality type 80Table 5.25: Sources of condoms by age and by sex 81Table 5.26: Responses to the question: ‘Should you need a condom, is it possible to
get one? 81Table 5.27: Reasons for going for HIV test 82Table 5.28: HIV prevalence by HIV testing 83Table 5.29: Self-reported behaviour change due to HIV/AIDS by sex 84Table 5.30: Prevalence of HIV by self-reported change of behaviour in the last few
years 84Table 5.31: Responses that show the stigmatisation and discrimination of PLWHA 85Table 5.32: Possible ways of reducing stigma of HIV/AIDS stratified by sex 86Table 5.33: Proportion of people who are aware of HBCP directed towards PLWHA in
community 87Table 5.34: Reported providers of HBCP services directed towards PLWHA in
community 88Table 5.35: Cited types of support provided for PLWHA 88Table 5.36: Proportion of people who are aware of HBCP directed towards OVC in
community 89Table 5.37: Cited types of support provided for OVC in community 90Table 5.38: Respondents perceptions regarding HIV/AIDS related policies 91Table 5.39: Respondents’ perceptions regarding political commitment to HIV/AIDS by
sector 92Table 6.1: Distribution of response rate 96Table 6.2: Selected background characteristics of the sample 98Table 6.3: HIV prevalence by marital status 99Table 6.4: HIV prevalence by education and sex 99
Free
dow
nloa
d fr
om w
ww
.hsr
cpre
ss.a
c.za
xi
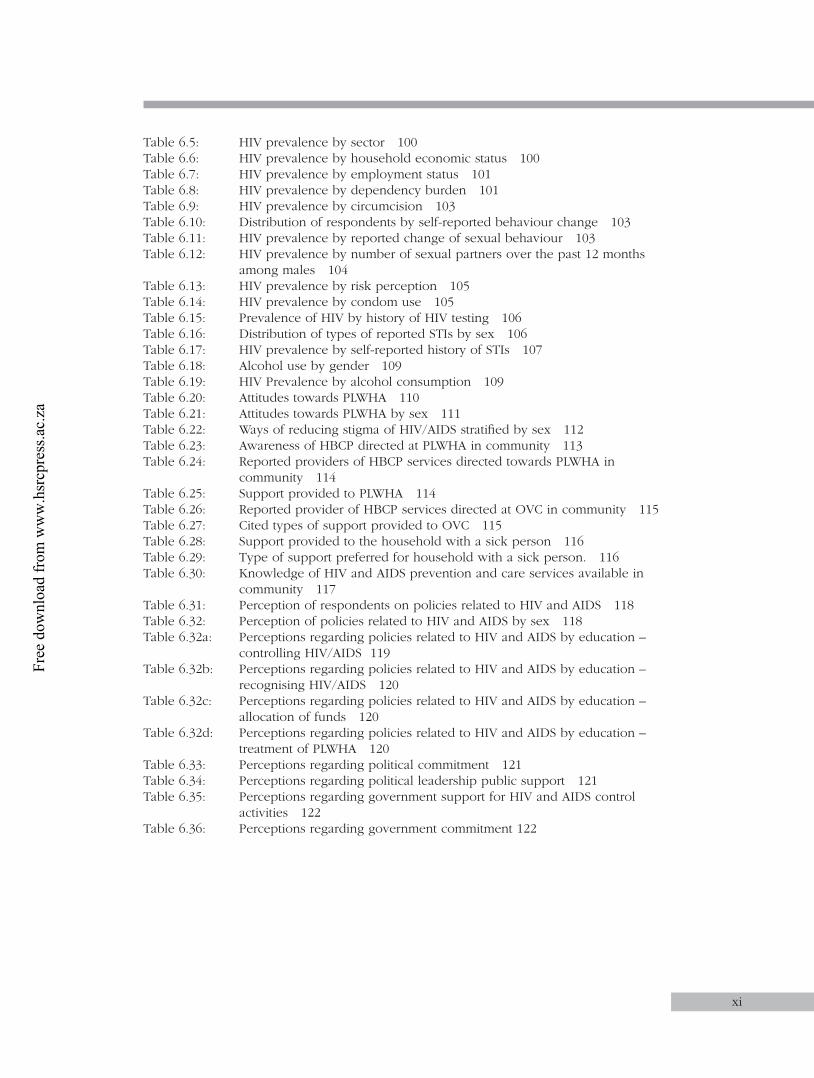
Table 6.5: HIV prevalence by sector 100Table 6.6: HIV prevalence by household economic status 100Table 6.7: HIV prevalence by employment status 101Table 6.8: HIV prevalence by dependency burden 101Table 6.9: HIV prevalence by circumcision 103Table 6.10: Distribution of respondents by self-reported behaviour change 103Table 6.11: HIV prevalence by reported change of sexual behaviour 103Table 6.12: HIV prevalence by number of sexual partners over the past 12 months
among males 104Table 6.13: HIV prevalence by risk perception 105Table 6.14: HIV prevalence by condom use 105Table 6.15: Prevalence of HIV by history of HIV testing 106Table 6.16: Distribution of types of reported STIs by sex 106Table 6.17: HIV prevalence by self-reported history of STIs 107Table 6.18: Alcohol use by gender 109Table 6.19: HIV Prevalence by alcohol consumption 109Table 6.20: Attitudes towards PLWHA 110Table 6.21: Attitudes towards PLWHA by sex 111Table 6.22: Ways of reducing stigma of HIV/AIDS stratified by sex 112Table 6.23: Awareness of HBCP directed at PLWHA in community 113Table 6.24: Reported providers of HBCP services directed towards PLWHA in
community 114Table 6.25: Support provided to PLWHA 114Table 6.26: Reported provider of HBCP services directed at OVC in community 115Table 6.27: Cited types of support provided to OVC 115Table 6.28: Support provided to the household with a sick person 116Table 6.29: Type of support preferred for household with a sick person. 116Table 6.30: Knowledge of HIV and AIDS prevention and care services available in
community 117Table 6.31: Perception of respondents on policies related to HIV and AIDS 118Table 6.32: Perception of policies related to HIV and AIDS by sex 118Table 6.32a: Perceptions regarding policies related to HIV and AIDS by education –
controlling HIV/AIDS 119Table 6.32b: Perceptions regarding policies related to HIV and AIDS by education –
recognising HIV/AIDS 120Table 6.32c: Perceptions regarding policies related to HIV and AIDS by education –
allocation of funds 120Table 6.32d: Perceptions regarding policies related to HIV and AIDS by education –
treatment of PLWHA 120Table 6.33: Perceptions regarding political commitment 121Table 6.34: Perceptions regarding political leadership public support 121Table 6.35: Perceptions regarding government support for HIV and AIDS control
activities 122Table 6.36: Perceptions regarding government commitment 122
Free
dow
nloa
d fr
om w
ww
.hsr
cpre
ss.a
c.za
xii
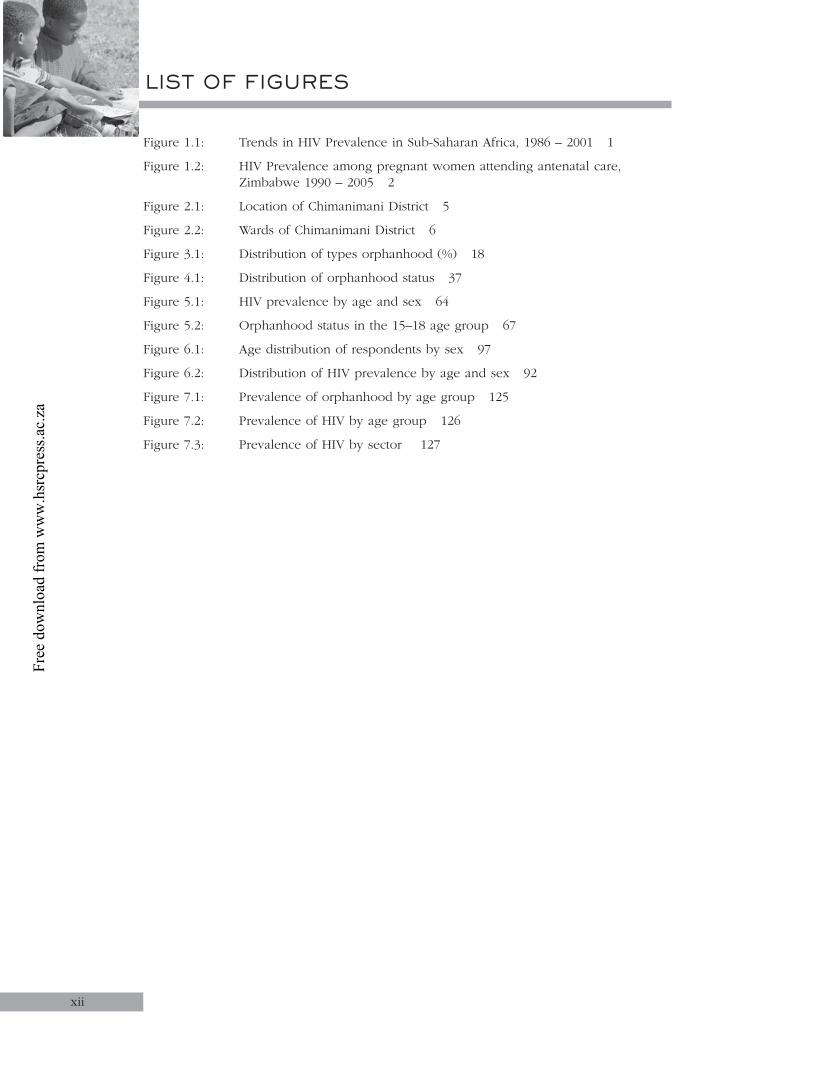
Figure 1.1: Trends in HIV Prevalence in Sub-Saharan Africa, 1986 – 2001 1
Figure 1.2: HIV Prevalence among pregnant women attending antenatal care, Zimbabwe 1990 – 2005 2
Figure 2.1: Location of Chimanimani District 5
Figure 2.2: Wards of Chimanimani District 6
Figure 3.1: Distribution of types orphanhood (%) 18
Figure 4.1: Distribution of orphanhood status 37
Figure 5.1: HIV prevalence by age and sex 64
Figure 5.2: Orphanhood status in the 15–18 age group 67
Figure 6.1: Age distribution of respondents by sex 97
Figure 6.2: Distribution of HIV prevalence by age and sex 92
Figure 7.1: Prevalence of orphanhood by age group 125
Figure 7.2: Prevalence of HIV by age group 126
Figure 7.3: Prevalence of HIV by sector 127
LIST OF FIGURES
Free
dow
nloa
d fr
om w
ww
.hsr
cpre
ss.a
c.za
xiii
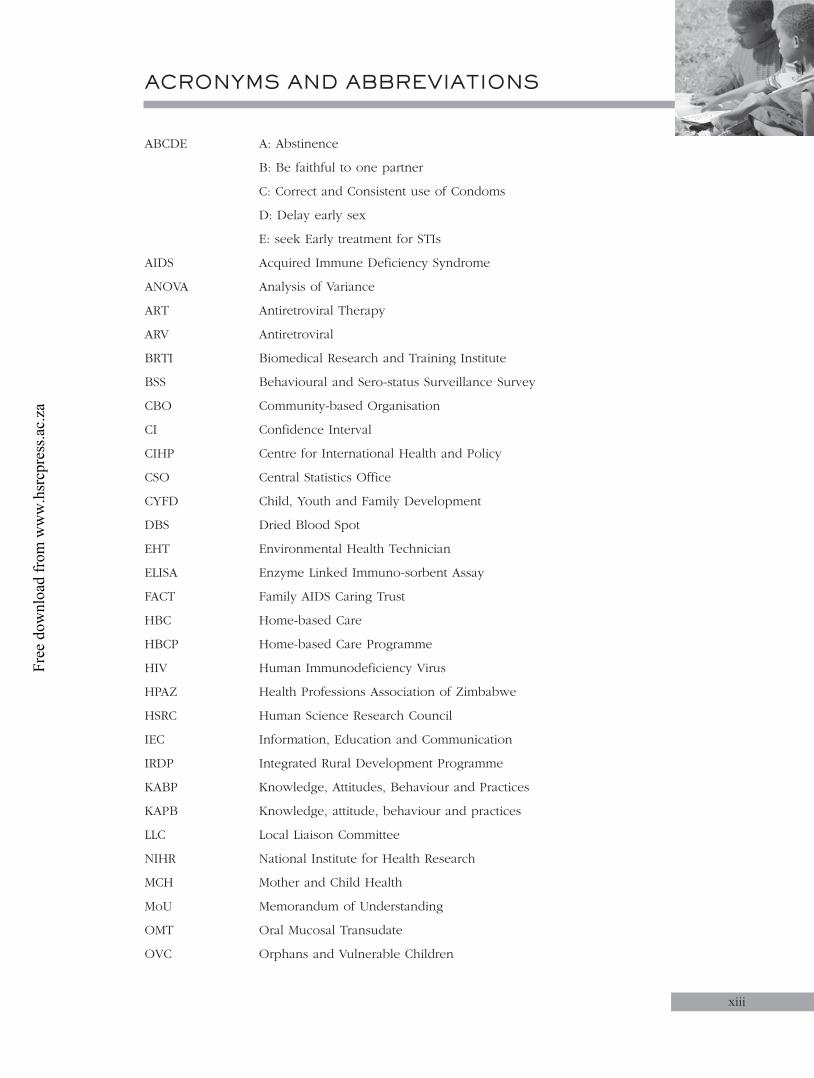
ABCDE A: Abstinence
B: Be faithful to one partner
C: Correct and Consistent use of Condoms
D: Delay early sex
E: seek Early treatment for STIs
AIDS Acquired Immune Deficiency Syndrome
ANOVA Analysis of Variance
ART Antiretroviral Therapy
ARV Antiretroviral
BRTI Biomedical Research and Training Institute
BSS Behavioural and Sero-status Surveillance Survey
CBO Community-based Organisation
CI Confidence Interval
CIHP Centre for International Health and Policy
CSO Central Statistics Office
CYFD Child, Youth and Family Development
DBS Dried Blood Spot
EHT Environmental Health Technician
ELISA Enzyme Linked Immuno-sorbent Assay
FACT Family AIDS Caring Trust
HBC Home-based Care
HBCP Home-based Care Programme
HIV Human Immunodeficiency Virus
HPAZ Health Professions Association of Zimbabwe
HSRC Human Science Research Council
IEC Information, Education and Communication
IRDP Integrated Rural Development Programme
KABP Knowledge, Attitudes, Behaviour and Practices
KAPB Knowledge, attitude, behaviour and practices
LLC Local Liaison Committee
NIHR National Institute for Health Research
MCH Mother and Child Health
MoU Memorandum of Understanding
OMT Oral Mucosal Transudate
OVC Orphans and Vulnerable Children
ACRONYMS AND ABBREVIATIONS
Free
dow
nloa
d fr
om w
ww
.hsr
cpre
ss.a
c.za
xiv
PLWHA People Living with HIV and AIDS
PMTCT Prevention of mother-to-child transmission
RA Research Assistant
RH Reproductive Health
SAfAIDS Southern Africa HIV/AIDS Information Dissemination Service
SADC Southern Africa Development Community
SAHARA Social Aspects of HIV/AIDS Research Alliance
SI Sampling Interval
SOP Standard Operational Procedures
STI Sexually Transmitted Infection
UNAIDS Joint United Nations Programme on HIV/AIDS
UNICEF United Nations International Childern's Fund
VCT Voluntary Counselling and Testing
WKKF WK Kellogg Foundation
Free
dow
nloa
d fr
om w
ww
.hsr
cpre
ss.a
c.za

xv
1. The Behavioural Risks and HIV Serostatus (BSS) Survey forms part of a project on The Development, Implementation, and Evaluation of Interventions for the Care of Orphans and Vulnerable Children in Chimanimani district, Manicaland Province, Zimbabwe. This report presents information on HIV prevalence and risk factors thereof, knowledge of HIV and AIDS, and awareness about HIV and AIDS services among children and adults in the district in the community.
2. A total of 2 934 individuals were randomly selected to participate in the survey. Of these, 752 were guardians of 2–11 year olds, 634 were 12–14, 756 were 15–24 and the remaining 792 were 25+ years old. Specific questionnaires were designed for each group. Guardians of children 2–11 years of age answered questions on the child’s behalf. The response rate was 97.3%. Blood specimens for HIV testing were collected as spots on filter paper, dried and stored until tested, using commercial HIV-1/2 enzyme immunoassay (EIA) kits. The study population derived from urban, communal, resettlement, small scale commercial and large scale commercial sectors. Bivariate association between HIV prevalence and potential risk factors were assessed.
3. Overall, HIV prevalence was 9.7%, and generally increased with age. The levels and trend were expected and similar to national statistics. Prevalence was highest in the urban sector (14.6%) followed by large-scale commercial (LSC) at 12.2% and was lowest in communal and small-scale (SSC) commercial sectors both at 8%.
4. Among the 2–11year olds: • Prevalence of orphanhood was 15.7% with 63.9% of orphanhood being paternal.
The majority of orphans were younger than 6 years old when they lost one or both parents.
• HIV prevalence was 3.3% with highest rates (5.8%) among children aged 6–8 years.
• HIV prevalence was more than twice as high in urban than all other sectors. • HIV prevalence was higher among orphans (5.6%) than non-orphans (2.9%).
Prevalence was highest among maternal orphans indicating that most infections were from mother-to-child transmissions.
• HIV prevalence was significantly higher among children with a history of hospitalisation. Thus, HIV is a major cause of morbidity among children in this district.
• Few guardians ever discussed sexuality with the children. Similarly, only 3.2% of guardians reported circumcision of boys, while 6.3% of girls were reportedly tested for virginity. These practices may therefore not be important risk factors for HIV transmission in the district.
• Guardians’ general knowledge of HIV/AIDS was about 70% and differed significantly with age and level of education. Younger guardians were more knowledgeable, while knowledge increased with education. The age difference may be a reflection of differences in access to education among the younger and older guardians along the years.
5. Among the 12–14 year olds: • Prevalence of orphanhood was 28% with paternal orphanhood being four times
higher than maternal orphanhood. Eight per cent of the children had lost both parents. Two thirds of the children were 6–14 years of age when they lost their parents.
EXECUTIVE SUMMARY
Free
dow
nloa
d fr
om w
ww
.hsr
cpre
ss.a
c.za
xvi
• HIV prevalence was 3% and twice as high among females than males. Although the difference was not statistically significant, it suggests earlier sexual initiation among girls, for various reasons.
• HIV prevalence was highest in the urban (10.2%) and lowest in the small scale commercial (0%) sector.
• There were no differences in HIV prevalence by orphanhood status, religion or education. HIV prevalence was also not associated with the child’s home environment, and care and protection practices.
• Overall, 2.5% of the children reported ever having sex. No associations were observed between HIV prevalence and sexual history.
• General knowledge of HIV/AIDS was above 75% with significant sectoral but not educational differences.
• HIV prevalence was significantly higher among those who had heard about HIV/AIDS, suggesting a temporal but not necessarily a causative relationship.
• One percent of the boys reported being circumcised while 14.7% of girls reported being tested for virginity. There were no associations between HIV prevalence and the two practices.
• Generally the majority of households in the district did not have money for basic things but with higher proportions among orphaned (82.7%) than non-orphaned (65.7%) households. This suggests that, either HIV/AIDS worsened existing poverty or poverty is a risk factor for HIV infection.
• Child-headed households were 4%. Most of these were from the communal and resettlement areas.
• Overall, awareness of OVC care and support services in the community was similar between orphans and non-orphans (28.6% versus 25.4%, respectively). Awareness was highest in the communal sector suggesting that OVC services were more available in this sector. Awareness was also highest among children with primary school education, possibly because OVC services target mainly the more vulnerable and younger age groups.
• Only 23.2% of respondents were aware of HIV prevention services with highest awareness levels in small scale commercial (48.5%) and urban sectors (35.6%). There were differences in awareness by level of education.
6. Among the 15–24 year olds: • HIV prevalence was 9.3% and increased with increases in age. Prevalence showed
a rapid rise between 19 and 24 years of age. Prevalence was 5.6% among the 15–18 and 12.1% among the 19–24 year old.
• HIV prevalence was twice as high among females (12.3%) than males (5.6%) suggesting earlier initial sexual activity among the former. Alternatively, the results emphasise the role of intergenerational sex in the transmission of HIV among young girls and women.
• HIV prevalence was highest in the SSC and urban sectors. • Married males and females were more likely to be HIV infected than their single
counterparts. However, the divorced, cohabiting, widowed together constituted the group with the highest prevalence. Similar findings have been reported in Zimbabwe and elsewhere.
• Among the 15–18, prevalence of orphanhood was 36.9% with paternal orphanhood being predominant. HIV infection was not associated with orphanhood.
• Just over half of the respondents (50.9%) reported ever having sex. Mean age of sexual initiation was 17.9 years and was similar for males and females.
Free
dow
nloa
d fr
om w
ww
.hsr
cpre
ss.a
c.za
xvii
• Overall, 31.1% reported ever having used a condom. Frequency of condom use differed by age and sector, suggesting differences in access to condoms or awareness of services. No associations were found between HIV infection and condom use.
• Reported HIV testing was low at 8.6%. The most commonly cited reason for seeking HIV testing services was wish to know HIV status. HIV prevalence was not associated with history of HIV testing.
• General knowledge of HIV/AIDS was above 85% and significantly differed with sector and level of education. Awareness was lowest in the SSC and highest in the communal sector, suggesting lack of services in the SSC sector. Awareness increased with increases in levels of education. Similar trends were observed with regards specific knowledge of HIV transmission.
• Awareness of home-based care (HBC) services directed at people living with HIV/AIDS (PLWHA) was low (26.5%) and did not differ by sex, education, religion and sector. This suggests that the services are generally not available in the district.
• Fifty-six per cent of respondents were aware of OVC care services. There were significant sectoral and educational differences in awareness among females but not among males.
• Generally the majority (over 60%) of respondents thought that there was political commitment to the fight against HIV/AIDS, but government was not putting enough resources into the responses.
7. Among the 25+ year olds: • Mean age was 39.9 years, ranging from 25 to 89 years. There were more female
(54.7%) than male respondents, while the majority of respondents (79.6%) were married.
• HIV prevalence was 21.1% and was slightly higher among females (22.3%) than males (19.7%). There was no defined age trend but prevalence was higher among younger females than males, further emphasising the vulnerability of women.
• HIV prevalence was one and a half times higher among the single and never married, more than twice as high than among the cohabiting/divorced/widowed than among the married. The differences were magnified and significant among females.
• There were no significant sectoral differences in HIV prevalence, although the urban sector recorded the highest prevalence (25.9%) and the SSC sector the lowest at 12.5%.
• Few males (7.5%) reported having been circumcised. Mean age of circumcision was 11.2 years. Circumcision was not associated with HIV infection.
• HIV prevalence was higher among respondents who thought that they could get infected compared to those who did not. The result showed that people were aware of their risky behaviours.
• Condom use was reported by 44.9% of the respondents with more males (55.9%) than females (35.8%) reporting use. HIV prevalence was significantly higher among those reporting condom use (25.4%) compared to those reporting not using (17.7%). This suggests that condoms were used inconsistently or that use started after the respondents were already infected. Indeed, prevalence was one and a half times higher among those reporting selective use of condoms with multiple partners.
• Around one tenth (10.2%) of respondents reported having been tested for HIV, and HIV prevalence was one and a half times higher among those reporting HIV
Free
dow
nloa
d fr
om w
ww
.hsr
cpre
ss.a
c.za

xviii
testing (21.2%) compared to those who were not previously tested (20.1%). This suggests that those seeking voluntary counselling and testing (VCT) may be those aware of their risky behaviour.
• Generally most respondents expressed positive attitudes towards PLWHA, although nearly one-third thought that infected children should be isolated and two-thirds thought that infected women could not be trusted as babysitters.
• Only about 40% of respondents were aware of HBC programmes in the district, with no significant sectoral differences.
• The most commonly cited HBC providers were community-based organisations (CBOs), followed by non-governmental organisations (NGOs) and faith-bases organisations (FBOs). None mentioned the government as a provider of HBC. The most common form of support was food, although significant proportions mentioned home visits.
• Awareness of VCT, prevention of mother-to-child-transmission (PMTCT) and sexually transmitted infections (STI) services was very low (below 10%) indicating that these services were either not available or not accessible to the community.
• While the majority thought the government was committed, they also agreed that the resources allocated to the fight against HIV/AIDS were not adequate.
8. Pending more detailed data analysis the following general recommendations can be made:
• There is a need for interventions to address the orphan problem. The interventions should range from direct food and material support to OVC, to improving the sustainable livelihoods of widows and OVC.
• There is a need to address the issue of infected children. While the government is moving as quickly as possible in making antiretrovirals (ARVs) available to the vulnerable, generally there has been lack of emphasis on children. HIV and AIDS service organisations should mobilise and prepare communities for antiretroviral therapy (ART). The mobilisation should be supported by strong advocacy for immediate introduction of ART for children as well as adults. The association between HIV and morbidity was observed in this study, albeit not significant at this stage of the analysis.
• Appropriate and properly targeted preventive interventions are called for to address HIV transmission dynamics for the various age groups, cognisant of the sectoral differences observed in the present study. The one size fits all approach to prevention, using standard ABCDE approaches alone are unlikely to yield the desired results. Thus, each sector requires an indepth analysis that would lead to directing interventions with regard the fundamental determinants of transmission.
• Despite the long-standing awareness campaigns, general and specific knowledge about HIV and AIDS remains disconcertingly low at about 70%. There is thus a need to ensure that the general and specific population groups access information on HIV and AIDS. This calls for multi-media approaches that bring the information to the doorstep of the people.
• Awareness about HIV and AIDS services depends on the availability and accessibility of the services. The study suggests that these services are limited in the surveyed area. There is therefore a need to increase the services, including HBC, OVC and prevention services. Existing services as well as other health-related services should strengthen and scale up the HIV-related activities. In particular, reproductive and maternal and child health services need to mainstream HIV and AIDS into their services.
Free
dow
nloa
d fr
om w
ww
.hsr
cpre
ss.a
c.za
xix
9. Limitations of the study include: • Bias could have been introduced during data collection. Firstly, randomisation
was effected through counting households based on a given interval. It is possible that research assistants could have made errors in the counting since there was no systematic way of counting, especially in communal areas where households are randomly placed. Also possible, considering the terrain of the study area, is that some research assistants may not have conducted adequate follow-up visits. Whether the respondents found at home have similar characteristics to those not found cannot be verified.
• The study was conducted during school term, hence the school-going ages were not easily assessable.
• This report is based on bivariate analysis. Therefore, the interpretation on associations between HIV and the various variables is very limited, since there was no control for confounding. Similarly, no interactions were assessed. Thus the discussion, conclusions and recommendations made at this stage are not definitive.
Free
dow
nloa
d fr
om w
ww
.hsr
cpre
ss.a
c.za

xx
Free
dow
nloa
d fr
om w
ww
.hsr
cpre
ss.a
c.za

1
CHAPTER 1
1. Introduction1.1. HIV and AIDS in sub-Saharan Africa
The HIV and AIDS burden has continued to increase globally, and more so in Africa. The latest Joint United Nations Programme on HIV/AIDS (UNAIDS) report (2004) still reflects the disproportionate distribution of HIV and AIDS in the world. Africa harbours nearly 70% of all infections and yet has a small proportion of the world’s population (UNAIDS 2004). At the same time, the epidemic is beginning to take grip in Asia, with increasing numbers of new infections. Sub-Saharan Africa, and in particular the Southern Africa region, is particularly affected by HIV and AIDS, with infection rates ranging above 20% in most SADC countries. The evolution of the HIV and AIDS epidemics in Africa is shown in Figure 1.1.
Figure 1.1: Trends in HIV prevalence in sub-Saharan Africa, 1986 – 2001
Source: UNAIDS/WHO 2002
Unfortunately, Southern Africa offers only faint hints of impending declines in HIV prevalence. With the exception of Angola (where the epidemic’s progression may have been retarded during the country’s long civil war with the result that national HIV prevalence has not exceeded 5%), each country in this sub-region is experiencing national HIV prevalence of at least 10% (Gisselquist et al., 2004). Thus, an estimated 10.5 to 12.6 million people are living with HIV in these nine countries – almost 30% of the global number of people living with HIV in an area where only 2% of the world’s total population resides.
Sexual abuse and violence, most of it directed against females and children, are serious problems that transcend economic, social, ethnic and geographical lines. Adolescents, children and young women and girls, in particular, experience abuse in the form of domestic violence, rape, sexual assault and sexual exploitation, or undergo female genital mutilation. For some young women, their first sexual encounter occurs under coercion or force, which can be associated with an increase in HIV transmission.
Free
dow
nloa
d fr
om w
ww
.hsr
cpre
ss.a
c.za
2
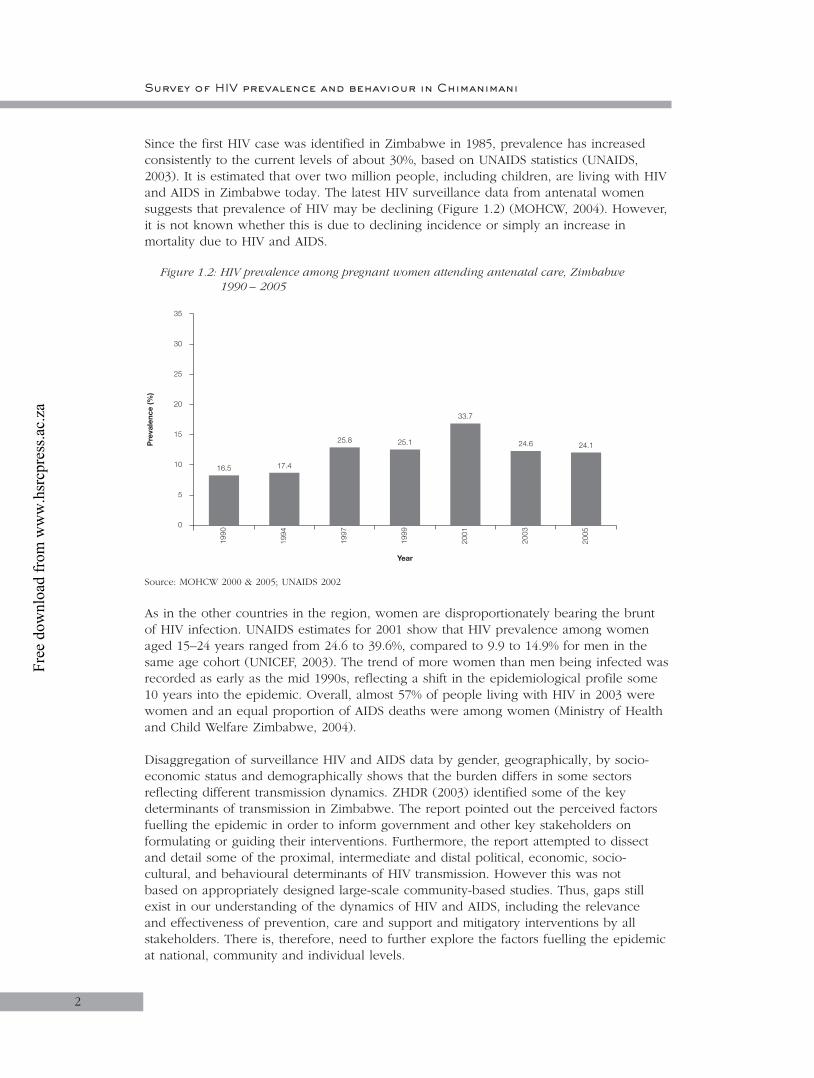
Since the first HIV case was identified in Zimbabwe in 1985, prevalence has increased consistently to the current levels of about 30%, based on UNAIDS statistics (UNAIDS, 2003). It is estimated that over two million people, including children, are living with HIV and AIDS in Zimbabwe today. The latest HIV surveillance data from antenatal women suggests that prevalence of HIV may be declining (Figure 1.2) (MOHCW, 2004). However, it is not known whether this is due to declining incidence or simply an increase in mortality due to HIV and AIDS.
Figure 1.2: HIV prevalence among pregnant women attending antenatal care, Zimbabwe 1990 – 2005
1990
Year
Pre
vale
nce
(%)
16.5 17.4
25.8 25.1
33.7
24.6 24.1
1994
1997
1999
2001
2003
2005
5
0
10
15
20
25
30
35
Source: MOHCW 2000 & 2005; UNAIDS 2002
As in the other countries in the region, women are disproportionately bearing the brunt of HIV infection. UNAIDS estimates for 2001 show that HIV prevalence among women aged 15–24 years ranged from 24.6 to 39.6%, compared to 9.9 to 14.9% for men in the same age cohort (UNICEF, 2003). The trend of more women than men being infected was recorded as early as the mid 1990s, reflecting a shift in the epidemiological profile some 10 years into the epidemic. Overall, almost 57% of people living with HIV in 2003 were women and an equal proportion of AIDS deaths were among women (Ministry of Health and Child Welfare Zimbabwe, 2004).
Disaggregation of surveillance HIV and AIDS data by gender, geographically, by socio-economic status and demographically shows that the burden differs in some sectors reflecting different transmission dynamics. ZHDR (2003) identified some of the key determinants of transmission in Zimbabwe. The report pointed out the perceived factors fuelling the epidemic in order to inform government and other key stakeholders on formulating or guiding their interventions. Furthermore, the report attempted to dissect and detail some of the proximal, intermediate and distal political, economic, socio-cultural, and behavioural determinants of HIV transmission. However this was not based on appropriately designed large-scale community-based studies. Thus, gaps still exist in our understanding of the dynamics of HIV and AIDS, including the relevance and effectiveness of prevention, care and support and mitigatory interventions by all stakeholders. There is, therefore, need to further explore the factors fuelling the epidemic at national, community and individual levels.
Survey of HIV prevalence and behaviour in Chimanimani
Free
dow
nloa
d fr
om w
ww
.hsr
cpre
ss.a
c.za

Chapter 1
3
1.2. The Orphans and Vulnerable Children Project Incorporating the Behavioural Risk and HIV Serostatus Survey (BSS)
During 2001, the WK Kellogg Foundation (WKKF) funded the Human Sciences Research Council’s (HSRC) Social Aspects of AIDS and Health (SAHA) Programme through the Social Aspects of HIV/AIDS Research Alliance (SAHARA) to prepare a policy document reviewing social and economic problems linked directly or indirectly to the HIV/AIDS problem in Southern Africa. The brief for the work required that an analysis of problems related to orphans and vulnerable children (OVC) be prepared, together with recommendations on potential interventions in rural development programming. The report (HSRC, 2001) was completed and submitted to WKKF who accepted it. WKKF then asked the HSRC to produce a draft strategy for the care of OVC in Botswana, South Africa and Zimbabwe, a task that was undertaken jointly by SAHA and the Child, Youth and Family Development (CYFD) programme of the HSRC. This was accepted by WKKF and led to the signing of a Memorandum of Understanding (MoU) between them and the HSRC which required that the latter prepare an Operational Framework for Research-Driven Interventions for Orphans and Vulnerable Children (OVC), including performance targets and indicators. The framework was submitted to WKKF and also approved. The MoU also required the HSRC to develop systems to implement and monitor the HIV/AIDS OVC Operational Framework and provide research to support innovative and sustainable models that target OVC, as well as families and households coping with an increased burden of care for affected children. Hence, the project ‘The Development, Implementation, And Evaluation of Interventions for the Care of Orphans and Vulnerable Children in Botswana, South Africa and Zimbabwe’, commonly known as the OVC Project, was designed. As part of the OVC project, a Behavioral Risk and HIV Sero-status Survey (BSS) was conducted in Zimbabwe to assess the magnitude of the HIV and AIDS problem, as well as the socioeconomic, cultural and behavioural aspects of transmission, care and support. The BSS Survey has proven to be a powerful tool in gathering evidence in understanding the underlying dynamics of the HIV epidemic. Employed as a second-generation behavioural surveillance model that involves combining both biological (HIV testing) and behavioral surveillance surveys in the same study, the BSS is useful in monitoring trends in HIV risk behaviour, informing effective programme design/direction and evaluation and explaining HIV transmission dynamics and variations in prevalence.
1.2.1. Structure of BSS Report
This report presents the findings of the BSS component of the OVC project. The report has five chapters. The first chapter includes the above literature review, highlighting the burden of HIV and AIDS in Zimbabwe, with pointers to some of the key issues related to transmission, impact and the response to the epidemic. The second chapter presents the detailed methodology used in carrying out the BSS Survey. Chapter 3 presents the key findings for the age group 2–11 years. Chapters 4, 5 and 6 present the key findings for the age groups 12–14, 15–24 and 25+ years. Within each chapter brief discussions are provided for specific sections to put the results into perspective and context and avoid a lengthy discussion at the end. The final chapter (Chapter 7) attempts to present a global view of the findings by highlighting similarities and differences between the four age groups (where possible) with regards HIV prevalence and related factors.
Free
dow
nloa
d fr
om w
ww
.hsr
cpre
ss.a
c.za

Survey of HIV prevalence and behaviour in Chimanimani
4
1.3. Aims of the OVC Project
The overall aims of the OVC Project are to: • Improve the social conditions, health, development and quality of life of vulnerable
children and orphans;• Support families and households coping with an increased burden of care for
affected and vulnerable children;• Strengthen community-based support systems as an indirect means to assist
vulnerable children; and• Build capacity in community-based systems for sustaining care and support to
vulnerable children and households over the long term.
1.3.1. Specific objectives of the BSS
• To quantify the magnitude of HIV and AIDS problem in the district, especially among children.
• To determine the HIV and AIDS knowledge, attitudes, behaviour and practices (KABP) of the general population.
• To identify prevention and care programmes and human rights issues concerning HIV and AIDS among the general public.
• To provide evidence-based information to policy makers on HIV and AIDS preventive mitigatory needs.
Free
dow
nloa
d fr
om w
ww
.hsr
cpre
ss.a
c.za
55
2. Methodology2.1. Study design
The BSS Survey employed the second-generation behavioural surveillance model that involves combining both biological (i.e. HIV testing) and behavioural surveillance surveys in the same study in order to determine the link between the two (Shisana & Simbayi, 2002). In this cross sectional survey, 13 wards were randomly selected from the total of 23 wards of Chimanimani district, located in the Manicaland Province of Zimbabwe. In each of the 13 wards, individuals in four age strata of 2–11, 12–14, 15–24 and 25+ years were randomly selected based on proportional sampling using the total populations of each age group in each ward. Age specific questionnaires on demographic, socioeconomic and child care practices and HIV-related behavioural aspects were administered and blood samples collected for HIV testing.
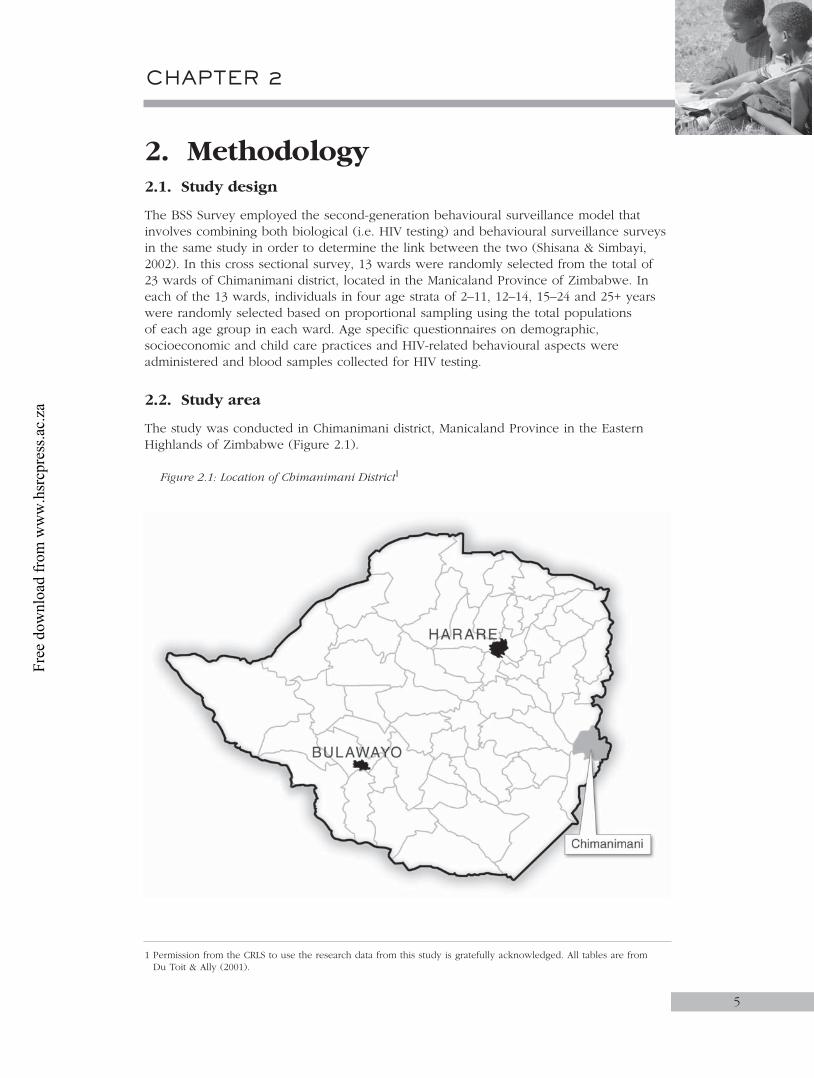
2.2. Study area
The study was conducted in Chimanimani district, Manicaland Province in the Eastern Highlands of Zimbabwe (Figure 2.1).
Figure 2.1: Location of Chimanimani District1
1 Permission from the CRLS to use the research data from this study is gratefully acknowledged. All tables are from Du Toit & Ally (2001).
CHAPTER 2
Free
dow
nloa
d fr
om w
ww
.hsr
cpre
ss.a
c.za

Survey of HIV prevalence and behaviour in Chimanimani
The district, which is predominantly rural, is 155km south-east of the provincial capital Mutare and borders Mozambique to the east, Buhera district to the west, Chipinge district to the south and Mutare district to the north. The district is divided into 23 wards. The total population of Chimanimani district is 107 120, with 51.9% being female (BRTI OVC Census, 2003). The average household size in the district is 4.4 and the population is predominantly Ndau, a Shona sub-ethnic group. The district represents all five agro-ecological zones found in Zimbabwe. The high and rugged terrain in the eastern side at 6 000m above sea level experiences high rainfall, while the low lying flat lands in the western part at 1 600m above sea level is characterised by a very erratic rainfall pattern. The main economic activity in the district is agriculture. The district has five hospitals (two mission hospitals and three government hospitals). One of the mission hospitals acts as the district hospital. Primary health care centres include five rural health centres, thirteen clinics and two aid posts.
2.3. Study population
The study population comprised children aged 2–11 and 12–14, youths aged 15–24 and adults of 25 years and older who were identified in randomly selected households in the 13 wards.
2.3.1. Sample size determination
The 23 wards of Chimanimani were numbered 1 to 23 and 13 wards were randomly selected for the BSS study using EPI TABLE calculator in EPI INFO version 6. Households within each ward were systematically selected using the calculated sampling interval. The selection of households from each ward was based on the 2003 BRTI OVC census data (BRTI, 2003). To make sure that all households in the ward were covered, two scenarios for the selection of households were employed. In both scenarios, the sample size was calculated proportional to the size of the ward (weighted by population size of each ward).
Assuming a 50% response rate and target of 1 000 participants in each age group, the target group sample size was increased to 1 500 and the ward sample size was calculated as follows: Sample size = Number of households in the ward _________________________________ Total number of households in the 13 wards 1500 (targeted sample size)
For example Ward 1: sample size = 995 1 500
_________ 13 982 = 106 The sampling interval (SI) was calculated using the number of households divided by the sample size per ward, i.e:
SI = Number of households in the ward __________________________ Ward sample size
For example Ward 1: SI = 995
___ 106
= 9
6
Free
dow
nloa
d fr
om w
ww
.hsr
cpre
ss.a
c.za
Chapter 2
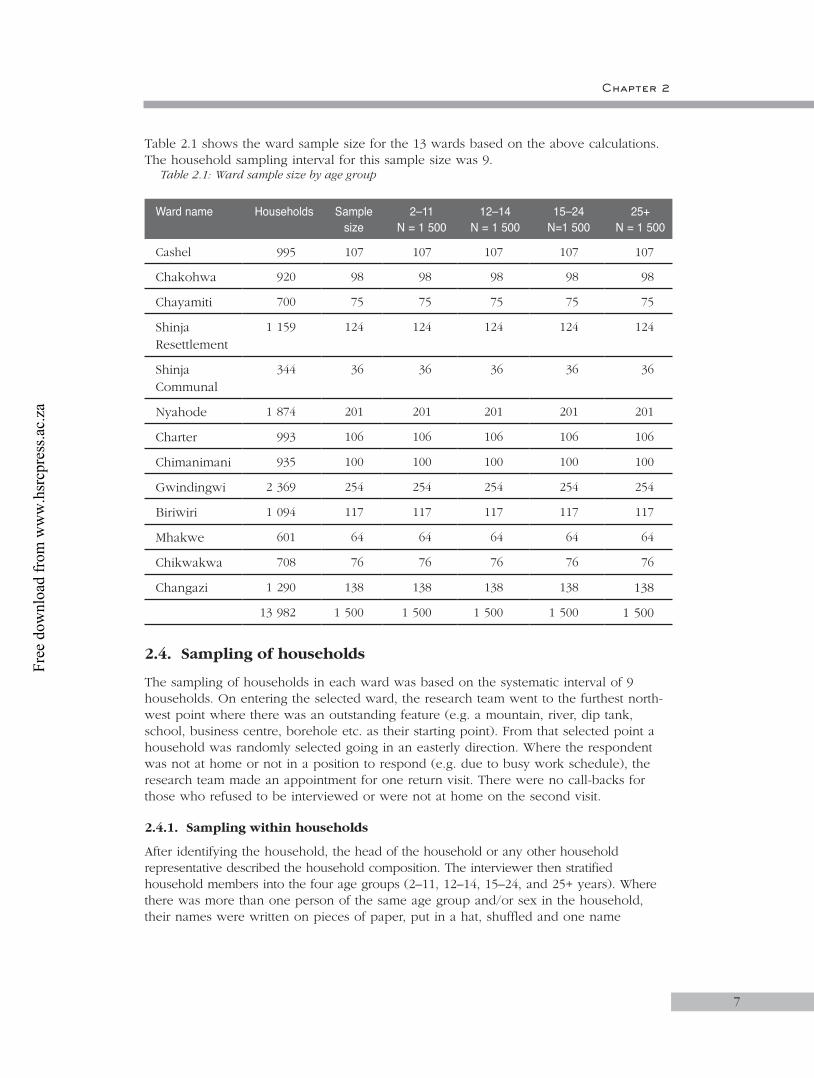
Table 2.1 shows the ward sample size for the 13 wards based on the above calculations. The household sampling interval for this sample size was 9.
Table 2.1: Ward sample size by age group
Ward name Households Sample size
2–11N = 1 500
12–14N = 1 500
15–24N=1 500
25+N = 1 500
Cashel 995 107 107 107 107 107
Chakohwa 920 98 98 98 98 98
Chayamiti 700 75 75 75 75 75
Shinja Resettlement
1 159 124 124 124 124 124
Shinja Communal
344 36 36 36 36 36
Nyahode 1 874 201 201 201 201 201
Charter 993 106 106 106 106 106
Chimanimani 935 100 100 100 100 100
Gwindingwi 2 369 254 254 254 254 254
Biriwiri 1 094 117 117 117 117 117
Mhakwe 601 64 64 64 64 64
Chikwakwa 708 76 76 76 76 76
Changazi 1 290 138 138 138 138 138
13 982 1 500 1 500 1 500 1 500 1 500
2.4. Sampling of households
The sampling of households in each ward was based on the systematic interval of 9 households. On entering the selected ward, the research team went to the furthest north-west point where there was an outstanding feature (e.g. a mountain, river, dip tank, school, business centre, borehole etc. as their starting point). From that selected point a household was randomly selected going in an easterly direction. Where the respondent was not at home or not in a position to respond (e.g. due to busy work schedule), the research team made an appointment for one return visit. There were no call-backs for those who refused to be interviewed or were not at home on the second visit.
2.4.1. Sampling within households
After identifying the household, the head of the household or any other household representative described the household composition. The interviewer then stratified household members into the four age groups (2–11, 12–14, 15–24, and 25+ years). Where there was more than one person of the same age group and/or sex in the household, their names were written on pieces of paper, put in a hat, shuffled and one name
7
Free
dow
nloa
d fr
om w
ww
.hsr
cpre
ss.a
c.za

Survey of HIV prevalence and behaviour in Chimanimani
randomly picked by the supervisor. However, in order to have an equal number of male and female respondents in each age group, an interviewer alternated in choosing a male or a female respondent from one household to the other. If the interviewer’s last respondent was a female in a particular age group then his/her next interviewee in that age group ideally should have been a male. If consecutively the respondents chosen were of the same sex then the numbers were balanced in the subsequent households.
2.5. Informed consent
The research team obtained two written consent forms (assent for those below 18 years), from each respondent for both the interview and the specimen. For the 2–11 years age group, the parent/guardian signed the consent form on behalf of their children. One of the forms remained with the respondent and the research team took the other one. Where the guardian consented to the interview (for those children below 12 years) but the child refused to give assent/consent, the interviewer did not proceed with the interview. Similarly, the 12–14 years age group was only interviewed after informed consent supported by parental permission.
2.6. Confidentiality
After informed consent was obtained, the interview was conducted in a ‘secluded’ place to avoid distraction and maintain confidentiality and privacy during the interview. The blood and OMT samples, questionnaire and laboratory forms belonging to one respondent were labelled with bar codes bearing the same identification number.
2.7. Instruments for data collection
Four questionnaires each specific for an age group were developed. The questionnaires were adapted from the recently completed Nelson Mandela/HSRC Study of HIV/AIDS (2002a; 2002b) with the adaptation informed by an initial situational analysis in the study area. The content of the questionnaires remained basically the same but some responses were changed to suit the local situation; for example, educational level was changed from standards to grades. The questionnaires aimed to assess behavioural risks for HIV/AIDS, HIV prevention, OVC care programmes, and human rights issues. The major areas of focus of each age group specific questionnaire are shown in Tables 2.2 & 2.3 below.
8
Free
dow
nloa
d fr
om w
ww
.hsr
cpre
ss.a
c.za

Chapter 2
Table 2.2: Areas of focus of the 2–11 and 12–14 years BSS questionnaires
Measures Parents/guardians of children aged 2–11 years old
Children 12–14 years
1. Demographic - age, sex, race, geotype (urban/rural), province, marital status*, education, language, religion, employment*, source of income* and adequacy of such income*, relationship to child*, number of dependants* X X
2. Orphanhood status X X
3. Child’s home environment X X
4. Care and protection of the child X X
5. Hospitalisation history and health status X X
6. Knowledge and communication about HIV/AIDS X X
7. Sexual experience and behaviour X
8. Circumcision X X
9. OVC care issues X X
10. PLWHA – human rights issues X X
* This was only asked of the guardian/parent
Table 2.3: Areas of focus of the 15–24 and 25+ years BSS questionnaires
Measures Youth Adult
1. Demographic – age, sex, race, education, province, language, religion, employ-ment, source of income and adequacy of such income, geotype (urban/rural) X X
2. Orphanhood status X
3. Rites of passage X X
4. Marital status X X
5. Initiating intimate relationships and sexual experience X X
6. Sexual practices, including HIV/AIDS-related behaviour and condom use X X
7. Perceived risk of HIV X X
8. Voluntary counselling and testing X X
9. Sexual violence and coercion X X
10. Alcohol X X
11. Knowledge, attitudes and perceptions of HIV/AIDS X X
12. OVC care issues X X
11. PLWHA – human rights issues X X
14. Health status, including history of hospitalisation X X
9
Free
dow
nloa
d fr
om w
ww
.hsr
cpre
ss.a
c.za

Survey of HIV prevalence and behaviour in Chimanimani
An independent body was mandated to translate the questions from English into the local language (Shona). The team comprised people who were familiar with the local dialects. A Local Liaison Committee (LLC), established for the OVC project, was also involved in the translation as it was well-versed in the local dialects. The translation process took three months and incorporation of changes was carried out for a month. The questionnaires were not translated back, but to ensure accuracy in translation, the translated versions were each reviewed by an independent group of experts to compare them with the original English texts.
The questionnaires were pre-tested among the relevant age groups. A total of 26 questionnaires were administered; 7 for the 2–11 guardians, 4 for the 12–14 age group, 8 for 15–24 and 7 for the 25+ age groups. The instruments were revised and piloted in the study area. The pilot study was done for one week and involved working through the entire research procedure and logistics. The pilot identified a number of problems, and the questionnaires, procedures and logistics were revised accordingly.
2.8. Data collection
2.8.1. Training of research assistants
Research assistants were identified from among health professionals within and outside the study area. Most of the research assistants were nurses or Environmental Health Technicians (EHTs) and selection was based on success in interviews conducted by the principal investigators. Preference during selection was given to those who had research backgrounds and to local people as a way of empowering local research communities.
The research assistants were trained for five days in Chimanimani. The training employed lectures, demonstrations, group work and role-plays. The training focused on how to:• Gain entry into the study area;• Read ward maps and ward boundaries;• Conduct interviews;• Administer questionnaires and complete the laboratory forms;• Observe research ethics;• Collect DBS and OMT from the respondents;• Keep records of forms and questionnaires;• Package samples for transportation to coordinating centre; and• Store samples in the field.
All research assistants participated in mock interviews and research nurses practiced taking both the DBS and OMT. Team supervisors were identified during the training process and were further trained on:• Checking and collecting interviewers’ work;• Editing all completed questionnaires;• Registering DBS and OMT samples in the laboratory register;• Problem solving in the field; and• Sampling procedures and calculation of sample intervals.
10
Free
dow
nloa
d fr
om w
ww
.hsr
cpre
ss.a
c.za
Chapter 2
2.8.2. Administration of questionnaires
Household and participant sampling have been described above. The questionnaire for the 2–11 group was administered to the guardian, while the child provided both the blood and OMT samples. Those 12 years and above responded directly to the questionnaire.
2.8.3. Biological sample collection
Standard operational procedures (SOPs) for collection, processing and laboratory analysis of the blood and OMT samples were developed and piloted. The SOPs also included guidelines on quality control and assurance during collection, transport, receipting, storage and laboratory assays.
2.8.3.1. Dried Blood Spots (DBS)DBS samples were collected on Whatman No.3 filter paper from participants in all age groups. Rectangular pieces of filter paper were cut to form three strips or fingers on a base that was left for labeling. A lancet was used to prick the middle finger after swabbing with cotton wool soaked in methylated spirit. Gently squeezing the finger, blood was dropped onto labeled filter paper strips until they were soaked. The spots were air-dried for at least 15 minutes and placed in paper envelopes.
2.8.3.2. Oral Mucosal Transudate (OMT)OMT was collected from children 2–14 years only. The OMT was collected using the Orasure device, following the manufacturer’s instructions (Organon Technika, Holland). In brief, the Orasure device, which comes individually sealed in plastic containers, was opened and placed between the cheek and the gum. The device was left for a few minutes and then gently rubbed against the wall of the cheek and the gums. On removal, it was placed in the plastic vial containing preservative fluid. The vial was labeled with the same study number (bar code) as the DBS and placed in the same envelope.
2.8.3.3. Sample processing and storageThe samples were transported to the command centre in Chimanimani ward every evening. Quality and quantity of samples was checked before they were stored at room temperature until transported to the laboratory. All samples were transferred to the laboratory within 14 days of collection. Transit duration was approximately 5 hours. Three dispatches of samples were done during the data collection phase of the study.
2.8.3.4. Quality Control of field activitiesSample collection from the participants was done by registered nurses. In odd situations where the RA was not a trained nurse, the supervisor who in all cases was a registered nurse, took the samples. On a daily basis, the supervisor checked the quality of the specimen together with the information on the question. Quality checks included verification of labeling, quantity and quality of sample. If satisfied, the supervisor registered the samples in a register and packed them, ready for handing over to the research team leaders. Storage of these samples prior to collection by the monitoring team was supposed to be in a cool place away from direct sunlight and wind. It was also mandatory that the monitoring team sampled 10% of the specimens to confirm quality, quantity and completeness of the clerical details on the laboratory form, the specimen and the questionnaire.
11
Free
dow
nloa
d fr
om w
ww
.hsr
cpre
ss.a
c.za

Survey of HIV prevalence and behaviour in Chimanimani
2.8.4. Laboratory Procedures
2.8.4.1. Sample receipt and recordingOn receiving the samples, the laboratory team checked and documented the date and time of arrival, state of the boxes in which the samples were packed, state of the individual samples, quality and quantity of samples and information on the form and on the specimen. Registration of samples included giving a laboratory code, registering all the pertinent information into the registration book and filing the samples in a manner that would be easy to retrieve during processing.
2.8.4.2. StorageAfter registration all samples were kept in specific order in a freezer at –200C until tested for HIV using ELISA. DBS samples have been shown to remain viable at sub-zero temperatures for long periods (extending to years). However, OMT samples are generally considered to be viable for periods not exceeding six weeks after collection.
2.8.4.3. HIV testingFour senior medical laboratory scientists under the supervision of the Laboratory Manager of the Biomedical Research and Training Institute performed the laboratory testing. The entire process took six weeks. The Vironostika Uniform II commercial ELISA kits were used (Biomuriex, Netherlands). The manufacturer optimised the kits used to test OMT samples. Briefly, DBS were eluted and assayed on the following day. An algorithm for determining the result was available from the manufacturer.
2.8.4.4. Quality control of laboratory proceduresThe DBS were assessed for sufficiency based on whether they were soaked, as well as the size of the spot. Samples considered insufficient were excluded from analysis. Before performing the initial ELISA, the eluted DBS were visually inspected to ensure complete elution. In the case of incomplete elution, incubation was continued for a maximum of 24 hours after which the specimen was discontinued whether elution was complete or not. Several factors, such as specimen age and heat exposure, affect the elution of dried blood spots.
Positive and negative control specimens were available from the manufacturer, and these were used in all assays in order to assess intra-run and inter-run variation. In addition, in-house controls were also used. These were used to construct the Levy-Jennings chart. Any analytical run (ELISA plate) that violated the standards were rejected, regardless of results obtained for other control materials. The controls were also sent to an external laboratory for further quality control.
2.9. Data management
2.9.1. Training of data entry clerks
Ten data entry clerks were recruited and trained for one week. The selection of data entry clerks was based on their performance during the OVC census data entry. The training of the data entry clerks involved the following:• Familiarisation with the four BSS questionnaires;• Familiarisation with the template;• Development of the codes for open-ended questions;• Statistical package (EPI Info 6);• Development of a data entry template using EPI6;
12
Free
dow
nloa
d fr
om w
ww
.hsr
cpre
ss.a
c.za

Chapter 2
• Trial runs (mock runs) to check whether the template was complete and user-friendly for data entry;
• Double entry (what it involved, how to do it and why it should be done); and• Pre-primary data cleaning (checking whether denominators are tallying) of the data
entry template was done.
2.9.2. Questionnaire data entry
Questionnaires were sorted by age group. Questionnaires belonging to one age group were sequentially numbered. These questionnaires were then divided among the ten data entry clerks. Each one of the data entry clerks had a unique identifier for quality control purposes. The data was entered into ten separate files using the statistical package EPI Info version 6.0. The data entry clerks inter-changed their files for validation of accuracy of data entry. Preliminary data cleaning was done for each of the ten files. The ten files were then merged into a single file for each age group. The merged file was then transferred to STATA Version 6.0 using Stat Transfer version 5.0 and further cleaned.
2.9.3. Data Entry for laboratory data questionnaires
Four data entry clerks were selected from the ten who were involved in the main BSS questionnaire data entry. A data entry template for the laboratory form was designed in EPI Info version 6.0 and used by the four data entry clerks. Each data entry clerk was allocated a specific age group for data entry. The data entry clerks inter-changed their files for validation of accuracy of data entry. Data cleaning, merging and further cleaning was conducted as described for questionnaires.
2.9.4. Data analysis
For this report data analysis was limited to simple descriptive summary statistics such as means and frequency distributions. Bivariate analysis was also done to assess associations between HIV prevalence and selected demographic, socio-cultural, economic and behavioural factors. Chi-square tests were used to assess relationships between variables and analysis of variance (ANOVA) was also used on continuous variables where comparisons across more than two groups were done. In situations where the normality assumptions were not met, the non-parametric equivalents of the above tests were used. A 95% CI was used as a measure of precision on the estimated population parameters (e.g. HIV prevalence). No attempts were made to use advanced statistics to further delineate the predictors of HIV infection.
Response Rates
The response Rate was calculated at three levels.
13
Household Response Rate (HRR) = Number of households that agreed to participate in the study
______________________________________________ Number of households approached
HIV test Response Rate (HIVRR) = Number of respondents who provided samples for HIV
___________________________________________________ Total number of respondents who were requested to provide samples
Interview response Rate (IRR) = Number of respondents who agreed to be interviewed
_________________________________________ Total number of interviewees approached
study response rate (srr) = hrr x irr x hivrr
Free
dow
nloa
d fr
om w
ww
.hsr
cpre
ss.a
c.za
14
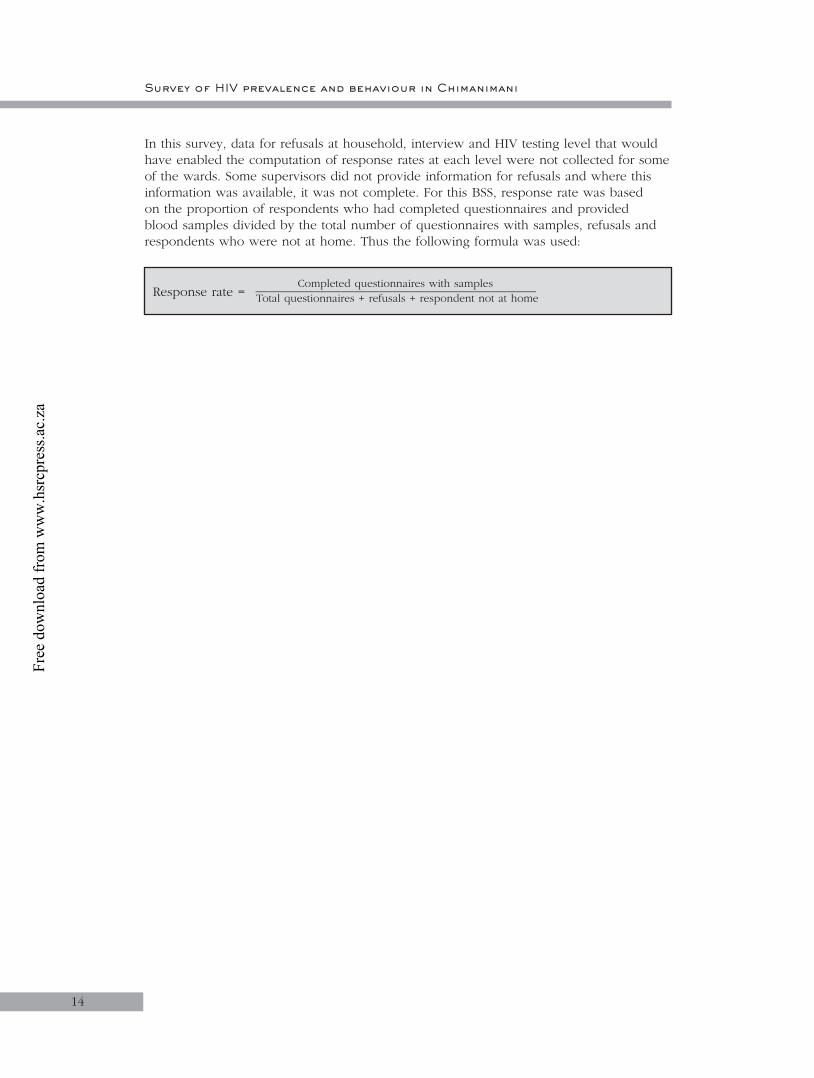
In this survey, data for refusals at household, interview and HIV testing level that would have enabled the computation of response rates at each level were not collected for some of the wards. Some supervisors did not provide information for refusals and where this information was available, it was not complete. For this BSS, response rate was based on the proportion of respondents who had completed questionnaires and provided blood samples divided by the total number of questionnaires with samples, refusals and respondents who were not at home. Thus the following formula was used:
Survey of HIV prevalence and behaviour in Chimanimani
Response rate = Completed questionnaires with samples
___________________________________________ Total questionnaires + refusals + respondent not at home
Free
dow
nloa
d fr
om w
ww
.hsr
cpre
ss.a
c.za

15
3. Results for age group 2–11 years3.1. Introduction
This chapter presents socioeconomic and HIV prevalence data on 689 children aged 2–11 years as well as socio-behavioural data on the guardians of the children. There is a paucity of information on HIV infection rates in children, especially those from 2–11 years old. Most data available in Zimbabwe and other countries are on children younger than two years. It has always been assumed that most infected children die before their second birthday and there are few studies following up on children beyond two years. HIV infections in older children, some of school-going age, have been reported in Zimbabwe. While it is conceded that these infections are most probably due to vertical transmission, there is a need to confirm this and explore whether there are other sources of infection in appropriately designed studies. This is particularly true in the wake of the South Africa national BSS (Shisana & Simbayi, 2002) that showed relatively high levels (6.2%) of HIV infection in children 2–9 years. Equally important is the need to also understand the environment in which infected children live, especially orphans. The latter are particularly vulnerable to infection and the impact of HIV and AIDS. The environment denotes the protection practices of the parents or guardians, as well as the economic status of the households. In this context, the parents/guardians’ level of awareness and knowledge about HIV/AIDS becomes important in appreciating both vertical and possible horizontal transmission of HIV to children.
An understanding of the extent and magnitude of HIV infection among children from 2–11 years old is important in the prioritisation, design, implementation and evaluation of programmes to support HIV-infected children, other vulnerable children and those caring for children. It is equally important to understand the extent and depth of knowledge about HIV and AIDS among children's caregivers in order to design appropriate interventions that ensure improved care and protection of children in general and more specifically for vulnerable and HIV-infected children.
3.2. Objectives
The main objectives of the study were: • To describe the extent and magnitude of HIV infection among children 2–11 years
old and relate the prevalence to selected characteristics such as sex, age and orphanhood status;
• To determine the childcare and protection practices, and knowledge about HIV and AIDS of parents/guardians; and
• To describe cultural practices related to communication about sexuality, HIV/AIDS and child abuse between parents/guardians and children.
3.3. Methodology
The general methodology is presented in Chapter 2. The targeted sample size was 1 500 children. A structured questionnaire was administered to the guardians of children aged 2–11 years old. Blood and Oral Mucosal Transudate (OMT) specimens were collected from the children only.
CHAPTER 3
Free
dow
nloa
d fr
om w
ww
.hsr
cpre
ss.a
c.za
16
3.3.1. Assessment of guardians’ knowledge of HIV transmission
To analyse the relationships between guardians’ knowledge of HIV transmission routes and selected demographic characteristics, a composite scale of knowledge was developed in each case, based on the generic questionnaire developed by FHI, which has been tested for reliability and validity. A score of 1 was assigned to respondents who disagreed or strongly disagreed with the statements ‘HIV can be passed on by kissing’; ‘HIV can be transmitted by sharing a cigarette’; and ‘HIV can be passed on by touching a person who has HIV/AIDS’. A score of 0 was assigned to those who were unsure/neutral, who agreed or strongly agreed. Similarly, a score of 1 was assigned to those who agreed or strongly agreed that ‘Unprotected vaginal sex transmits HIV’; ‘Unprotected anal sex transmits HIV’; and ‘Receiving contaminated blood transmits HIV’. Again a score of 0 was assigned to those who were unsure/neutral, disagreed or strongly disagreed. A higher score reflects a better level of knowledge of HIV transmission. The maximum possible score was 14.
3.3.2. Assessment of guardians’ general knowledge, perceptions and attitudes with regards HIV and AIDS
To analyse the relationships between the various demographic variables and knowledge and perceptions regarding HIV/AIDS, a composite scale of knowledge was developed. A score of 1 was assigned to guardians who disagreed or strongly disagreed with the statements ‘HIV can be passed on by kissing’; ‘AIDS can be caused by witchcraft’ and ‘HIV can be passed on by touching a person who is HIV positive’. A score of 0 was assigned to those who were unsure/neutral, who agreed or strongly agreed. In the same way, a score of 1 was assigned to those who agreed or strongly agreed that ‘HIV causes AIDS’ and 0 assigned to those who were unsure/neutral, disagreed or strongly disagreed. Every respondent obtained a score of knowledge on a scale from 0 to 7. The higher the score the better the level of knowledge and correctness of perceptions of HIV/AIDS issues. The maximum possible score was 7.
3.3.3. Assessment of guardians’ knowledge of preventive measures
The guardians’ knowledge of preventive measures/methods was assessed and scores were developed. A score of 1 was assigned to guardians who indicated that they could protect themselves from getting HIV if they: use a condom correctly and consistently; do not have penetrative sex; have sex with only one uninfected partner; are faithful to one partner; do not touch other people’s blood; and do not share needles/razor blades. A score of 0 was assigned to guardians who indicated that they could protect themselves from getting HIV if they: only have sex with someone they really love; take certain medicines, have sex with a virgin; and wash well after having sex. The maximum possible score was 10.
The findings presented below are based on HIV tests conducted on DBS only. OMT data are presented in a separate report.
3.3.4. Assessment of children’s HIV status
DBS and OMT specimens were collected and processed as described in Chapter 2. HIV status was determined from tests on DBS only.
Survey of HIV prevalence and behaviour in Chimanimani
Free
dow
nloa
d fr
om w
ww
.hsr
cpre
ss.a
c.za
17
3.4. Results
3.4.1 Study sample
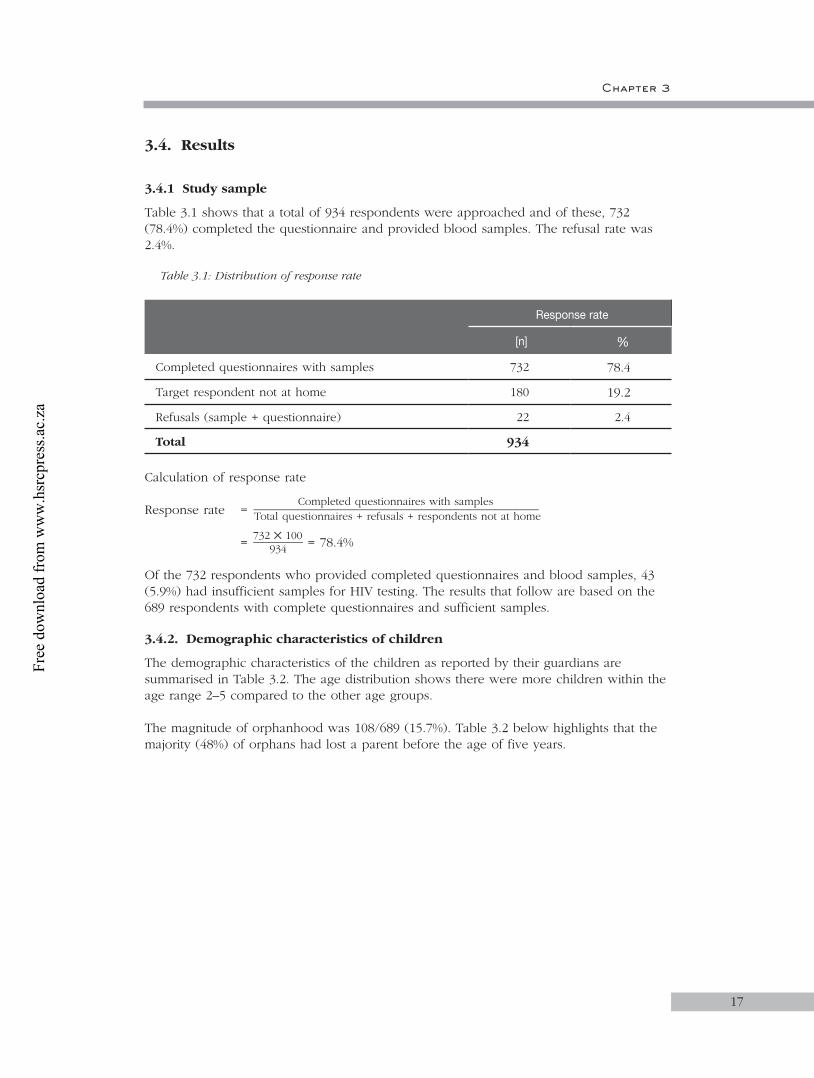
Table 3.1 shows that a total of 934 respondents were approached and of these, 732 (78.4%) completed the questionnaire and provided blood samples. The refusal rate was 2.4%.
Table 3.1: Distribution of response rate
Response rate
[n] %
Completed questionnaires with samples 732 78.4
Target respondent not at home 180 19.2
Refusals (sample + questionnaire) 22 2.4
Total 934
Calculation of response rate
Response rate = Completed questionnaires with samples
___________________________________________ Total questionnaires + refusals + respondents not at home
= 732 100
________ 934 = 78.4%
Of the 732 respondents who provided completed questionnaires and blood samples, 43 (5.9%) had insufficient samples for HIV testing. The results that follow are based on the 689 respondents with complete questionnaires and sufficient samples.
3.4.2. Demographic characteristics of children
The demographic characteristics of the children as reported by their guardians are summarised in Table 3.2. The age distribution shows there were more children within the age range 2–5 compared to the other age groups.
The magnitude of orphanhood was 108/689 (15.7%). Table 3.2 below highlights that the majority (48%) of orphans had lost a parent before the age of five years.
Chapter 3
Free
dow
nloa
d fr
om w
ww
.hsr
cpre
ss.a
c.za
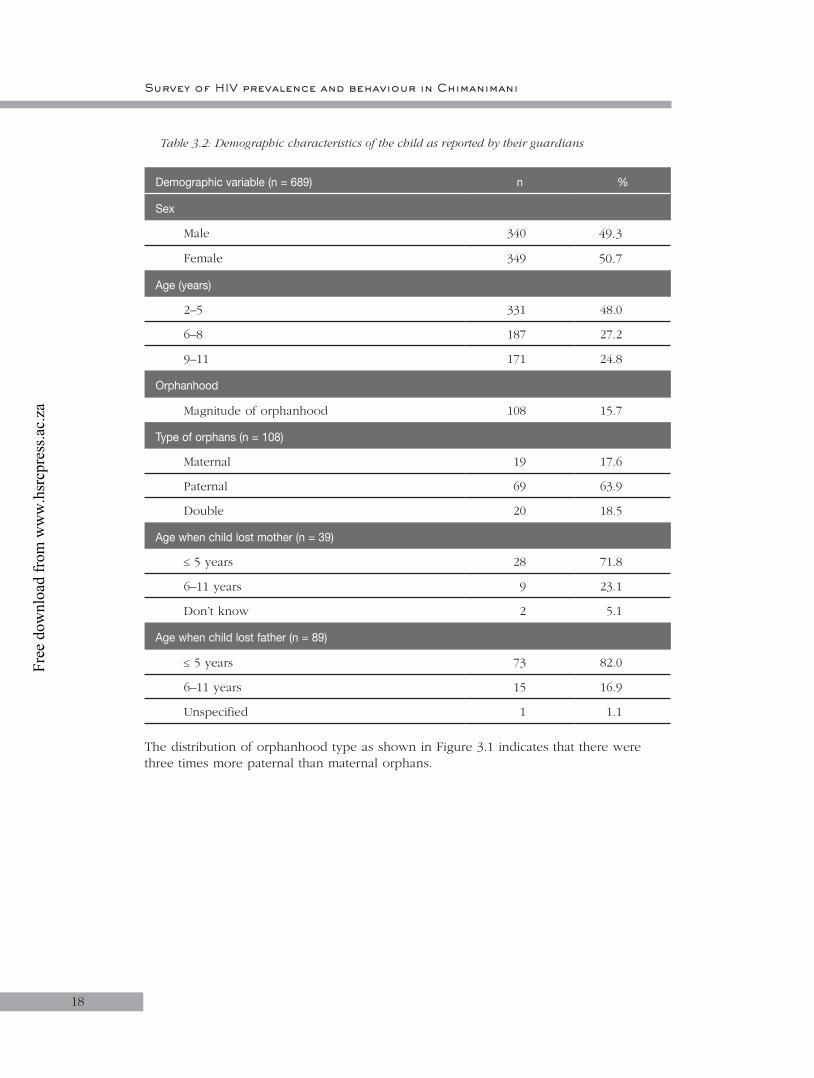
18
Table 3.2: Demographic characteristics of the child as reported by their guardians
Demographic variable (n = 689) n %
Sex
Male 340 49.3
Female 349 50.7
Age (years)
2–5 331 48.0
6–8 187 27.2
9–11 171 24.8
Orphanhood
Magnitude of orphanhood 108 15.7
Type of orphans (n = 108)
Maternal 19 17.6
Paternal 69 63.9
Double 20 18.5
Age when child lost mother (n = 39)
5 years 28 71.8
6–11 years 9 23.1
Don’t know 2 5.1
Age when child lost father (n = 89)
5 years 73 82.0
6–11 years 15 16.9
Unspecified 1 1.1
The distribution of orphanhood type as shown in Figure 3.1 indicates that there were three times more paternal than maternal orphans.
Survey of HIV prevalence and behaviour in Chimanimani
Free
dow
nloa
d fr
om w
ww
.hsr
cpre
ss.a
c.za

19
Figure 3.1: Distribution of orphanhood types (%)
A total of 292 children (42.4%) were of school-going age. Overall, 6.5% were not attending school with slightly more girls than boys (8.2% versus 5.1%, respectively: p>0.10).
3.4.2.1. Discussion: Children’s demographic characteristicsThe majority of children about whom guardians responded were below five years, most likely because these were at home during the visits by research assistants, while the older children were in school or carrying out other household chores. Evidently, orphanhood is a major concern in the district. That the majority of orphans had lost a father suggests that men are dying earlier than their spouses. Furthermore, most children lost their parents (mother or father or both) at an early age, further increasing their vulnerability. That 6.5% of children of school-going age (7–11years) were not in school is of concern and should be noted and addressed in designing and implementing interventions for OVC. There were no significant differences in educational enrolment between orphans and non-orphans in this age group. However, anecdotal evidence in the country suggests that the numbers of school drop outs are increasing, partly attributed to the impact of HIV and AIDS where the child drops out of school to care for sick parents or to head an orphaned household (ZHDR, 2003).
3.4.3. HIV prevalence among children
The overall HIV prevalence among the 689 children was 3.3% (95% Confidence Interval (CI): 2.1–5.0). HIV prevalence by selected characteristics is presented below.
3.4.3.1. HIV prevalence by selected socio-demographic characteristics of childrenTable 3.3 shows prevalence by sex, age and sector. HIV prevalence was slightly lower among males than females. Prevalence was highest among 6–8 and lowest among 9–11 year olds. Prevalence was nearly twice as high among children in urban areas than in other sectors. None of the differences were statistically significant.
Chapter 3
Maternal17.618.5
63.9
Paternal
Double
Free
dow
nloa
d fr
om w
ww
.hsr
cpre
ss.a
c.za
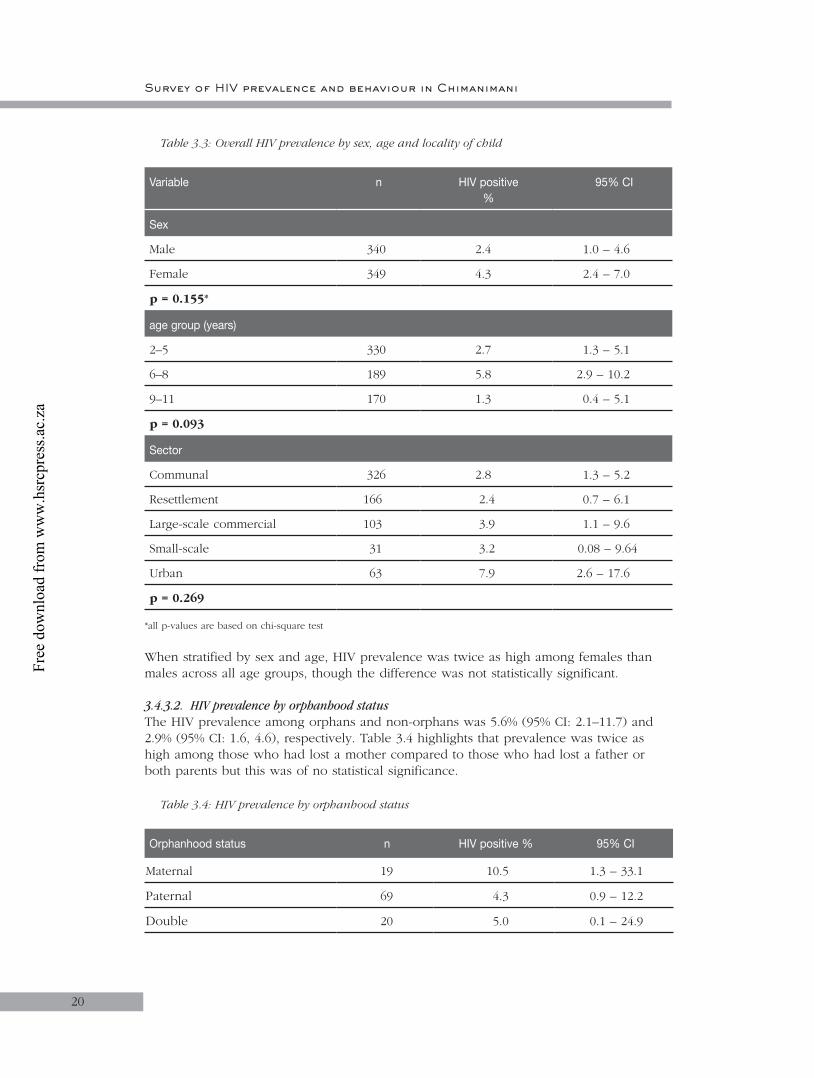
20
Table 3.3: Overall HIV prevalence by sex, age and locality of child
Variable n HIV positive%
95% CI
Sex
Male 340 2.4 1.0 – 4.6
Female 349 4.3 2.4 – 7.0
p = 0.155*
age group (years)
2–5 330 2.7 1.3 – 5.1
6–8 189 5.8 2.9 – 10.2
9–11 170 1.3 0.4 – 5.1
p = 0.093
Sector
Communal 326 2.8 1.3 – 5.2
Resettlement 166 2.4 0.7 – 6.1
Large-scale commercial 103 3.9 1.1 – 9.6
Small-scale 31 3.2 0.08 – 9.64
Urban 63 7.9 2.6 – 17.6
p = 0.269
*all p-values are based on chi-square test
When stratified by sex and age, HIV prevalence was twice as high among females than males across all age groups, though the difference was not statistically significant.
3.4.3.2. HIV prevalence by orphanhood statusThe HIV prevalence among orphans and non-orphans was 5.6% (95% CI: 2.1–11.7) and 2.9% (95% CI: 1.6, 4.6), respectively. Table 3.4 highlights that prevalence was twice as high among those who had lost a mother compared to those who had lost a father or both parents but this was of no statistical significance.
Table 3.4: HIV prevalence by orphanhood status
Orphanhood status n HIV positive % 95% CI
Maternal 19 10.5 1.3 – 33.1
Paternal 69 4.3 0.9 – 12.2
Double 20 5.0 0.1 – 24.9
Survey of HIV prevalence and behaviour in Chimanimani
Free
dow
nloa
d fr
om w
ww
.hsr
cpre
ss.a
c.za

21
Both parents alive 559 2.9 1.6 – 4.6
Not known 22 4.5 0.1 – 22.8
p-value = 0.224
3.4.3.3. HIV prevalence and hospitalisation recordsNearly a tenth (7.7%) of the children had a history of hospitalisation in the past 12 months. HIV prevalence was more than twice as high among children who were hospitalised compared to those who were not (Table 3.5), with more frequent hospitalisation being associated with prevalence that was nearly ten times higher than a single hospitalisation (p = 0.016; Table 3.5). However, the numbers were too small to make any conclusions about this finding.
Table 3.5: HIV prevalence of children by hospitalisation records in the past 12 months
Hospitalisation n HIV positive%
95% CI
Hospitalised 53 7.7 2.1 – 18.2
Not hospitalised 636 3.0 1.8 – 4.6
p-value= 0.092
Frequency of hospitalisation N=52*
Once (in the past 12 months) 39 2.6
More than once (in the past 12 months) 13 23.1
p-value = 0.016
* one did not indicate the frequency of hospitalisation
3.4.3.4. Discussion: HIV prevalenceThis is the first study in Zimbabwe to provide HIV prevalence data for this age group using a significantly large sample. The overall prevalence of 3.3% among children aged 2–11 years is less than that reported for the age group 2–9 year (6.2%) in South Africa (Nelson Mandela/HSRC study of HIV/AIDS, 2002). The most affected are the 6–8 year olds where prevalence was more than twice as high as the age groups 2–5 and 9–11 years. However, the sub-sample sizes were too small for meaningful statistical comparisons. While there is no obvious explanation, the data suggest that a significant proportion of HIV-infected children are living beyond five years of age but not much further than 8 years. The difference in prevalence between orphans and non-orphans is expected considering that the majority of orphans are children orphaned due to HIV/AIDS. Morbidity was closely associated with HIV infection, suggesting that HIV contributes significantly to the morbidity profile in this community.
3.4.4. Demographic characteristics of guardians
The demographic characteristics of guardians of children aged 2–11 years are summarised in Table 3.6. Of note, most guardians were married females who were relatively young (75% were <40 years old). The major language was Ndau (92.5%), while 6.4% spoke Shona and the rest (1.1%) Kalanga, Shangani, Sena or Barwe. Most guardians had undergone primary or secondary education and most were from communal areas.
Chapter 3
Free
dow
nloa
d fr
om w
ww
.hsr
cpre
ss.a
c.za

22
Table 3.6: Demographic characteristics of the guardians
Demographic variable (n=689) n %
Sex
Male 52 7.5
Female 637 92.5
Age (years)
Median (Q1; Q3) 32.5 (27.5; 40)
Marital status
Married 558 81.0
Cohabiting 8 1.2
Single (Never Married) 18 2.6
Widowed 70 10.2
Divorced/Separated 33 4.8
Religious grouping
Apostolic sects 290 45.7
Protestant 139 21.9
Pentecostal 134 21.1
Catholic 60 9.5
Traditional African 8 1.3
Other 2 0.3
Moslem 1 0.2
Educational status
No schooling 87 12.6
Primary school 311 45.2
Secondary school 274 39.8
Tertiary non-degreed 14 2.0
Tertiary degreed 3 0.4
Sector
Communal 326 47.3
Resettlement 166 24.1
Large-scale commercial 103 15.0
Small-scale commercial 31 4.5
Urban 63 9.1
Survey of HIV prevalence and behaviour in Chimanimani
Free
dow
nloa
d fr
om w
ww
.hsr
cpre
ss.a
c.za

23
3.4.4.1. Discussion: Demographic profile of guardians and childrenIn our study community, almost all guardians were females and one possible reason for this is that women are usually at home and culturally expected to fulfil the role of housewives. This is in line with what obtains in the country, as a number of studies have shown that there are more women caregivers than males (Gregson et al., 2002). Of note however, is the fact that almost all guardians were married implying that the marriage institution may offer stability that augurs well for the care of children.
The guardians in Chimanimani were mostly young to middle-aged married women, a group that is also at high risk of HIV infection yet is caring for their parents and children, hence the possibility of increased burden of care.
3.4.5. Child’s home environment, care and protection
The prevalence and frequency of alcohol and drug use was explored among guardians and the findings are presented in Table 3.7. Overall, nearly a third of the guardians reported alcohol use, mostly once a month or less while 10% reported using recreational drugs.
Table 3.7: Alcohol and drug use in child’s home
Alcohol and drug use (N = 689) n %
Household member who gets drunk at least once a month 197 28.6
Presence of any household member who uses recreational drugs at least once a month
69 10.0
Presence of guardians/parents who consume alcohol 43 6.2
Frequency of alcohol consumption (N = 43)
Once a month or less 22 53.7
Once a week 12 29.3
Two to three times a week 6 14.6
Every day 1 2.4
Table 3.8 highlights that by and large the majority of guardians reported never having exposed their children to practices that increase vulnerability to abuse.
Chapter 3
Free
dow
nloa
d fr
om w
ww
.hsr
cpre
ss.a
c.za

24
Table 3.8: Distribution of guardians by caring practices
Care practices and the extent of care a week before the study
N = 689
Often
Some-times
Never
Un-specified
n % n % n % n %
Sent out of the home yard
44 6.4 236 34.3 406 58.9 3 0.4
Left at home alone 31 4.5 172 25.0 484 70.3 2 0.3
Left at home in the care of a person 15 years old or younger
40 5.8 281 40.8 366 53.1 2 0.3
Left in the care of male family member
41 6.0 221 32.1 425 61.7 2 0.3
Left in the care of a male non-family member
5 0.7 25 3.6 656 95.2 3 0.4
Left in the care of a female non-family member
11 1.6 75 10.9 601 87.2 2 0.3
Out of the home yard without adult supervision
17 2.5 96 13.9 572 83.0 4 0.6
3.4.5.1. Orphan care and protectionReferring back to Table 3.2 one sees that 15.7% of the children were orphans and that the majority of orphans had lost a father, while 18.5% had lost both parents. Furthermore, most orphans had lost either their father or mother when they were five years old or below. There were no differences in household economic situation of orphans and non-orphans with 96.3% and 95.3% of households, respectively, reporting having little or no money for basics such as food and clothes. Similarly other child protection practices such as: always present when the child was at home; always near enough for the child when they need help; always require children to tell where they will be going, and sleeping arrangements, were similar between guardians of orphaned and non-orphaned children. The majority of orphans either shared a room or shared a bed with someone (data not shown).
3.4.5.2. Discussion: Child’s home environment, care and protection
GeneralThe questions on use of alcohol aimed at establishing potential exposure of children to a culture of drinking alcohol and recreational drug use within the household, as well as potential risk of neglect and abuse of children. Nearly a third of respondents indicated infrequent alcohol use by a member of the household although few guardians reported
Survey of HIV prevalence and behaviour in Chimanimani
Free
dow
nloa
d fr
om w
ww
.hsr
cpre
ss.a
c.za

25
alcohol use themselves. Nevertheless, this remains an area of concern especially in a climate where economic stress is increasing in the population. Of note is the reported use of recreational drugs. Also significant is the finding that although expected to be stringent on alcohol use, about a fifth of the Apostolic households surveyed had someone who used alcohol.
OrphansThis BSS has shown that in the Chimanimani community orphans are equally cared for and protected by their guardians, as are those children whose parents are alive. This was further supported by the finding that similar proportions of orphans and non-orphans were attending school. However, it is equally obvious that the household economic situation was generally very poor, such that the majority of non-orphan children could be considered vulnerable. Organisations involved in orphan care need to carefully consider implementing their interventions in communities where vulnerability is generalised.
3.4.6. Education of children on sexuality and HIV/AIDS
Guardians were asked whether they ever discussed issues of sexuality and HIV/AIDS with their children. A minority (6.2%) reported ever discussing sex and 10.7% sexual abuse with their children. Furthermore, whereas 18.9% reported that their child had heard about HIV/AIDS, less than 10% reported having ever discussed HIV prevention (9.7%) or transmission (8.4%) with the child. Frequency of discussions about sexuality with children increased with the age of the children (Table 3.9).
Table 3.9: Distribution of guardians’ reported discussions on sexuality and HIV/AIDS with children by age group
Variable Age group (years)
2–5N = 330
6–8N = 189
9–11N = 170
n % n % n %
Ever discussed sex with child 6 1.8 11 5.8 26 15.3
Ever discussed sexual abuse with child
17 5.2 24 12.7 33 19.4
Child ever heard of HIV and AIDS
11 3.3 40 21.2 79 46.5
Ever discussed HIV prevention with child
15 4.5 17 9.0 35 20.6
Ever discussed HIV transmission with child
7 2.1 14 7.4 37 21.8
3.4.6.1. Rites of passage of childrenAccording to guardians, 11 (3.2%) of the 340 boys had been circumcised while 22 (6.3%) of the 349 girls reportedly underwent virginity testing.
Chapter 3
Free
dow
nloa
d fr
om w
ww
.hsr
cpre
ss.a
c.za

26
3.4.6.2. Guardians’ sources of information about sexA summary of the guardians’ reported sources of information about sex is given in Table 3.10. The most frequently cited sources of information were uncles/aunts and followed by health services.
Table 3.10: Distribution of person/place where guardians have learnt the most about sex
Source of Information about sex (N=689) n %
Parents 77 11.2
Spouse 128 18.6
Grandparents 124 18.0
Aunt/uncle 259 37.6
Friend 79 11.5
Initiation school/tradition 15 2.2
Formal school 60 8.7
Media 42 6.1
Hospital/clinic 166 24.1
Church 110 16.0
Other 59 8.6
3.4.6.3. Discussion: Sexuality, HIV and AIDSAlthough the frequency of reports by guardians that they discussed issues of sexuality with the children increased with the age of children, this does not reach 50% – even at ages between 9–11 years. Of note is the observation that more children had heard about HIV/AIDS elsewhere than from their guardians, most likely at school or through the radio and television. Cultural practices of sexual initiation appear to be low in this community probably due to religion or modernisation. Virginity testing (chastity test) has received a lot of attention in Zimbabwe after a traditional chief in Manicaland Province initiated the practice as a prevention strategy. Advantages and disadvantages of the practice were highlighted in national discussions but no consensus has been reached to date.
3.4.7. Guardians’ general knowledge of HIV/AIDS
A summary of guardians’ HIV/AIDS general knowledge by various demographic characteristics is given in Table 3.11. The overall general knowledge mean score was 4.7 (SD = 1.2). The level of knowledge was just above the 50th percentile (and decreased with increasing age of respondents) was lowest among guardians from smallscale commercial and highest among those from urban areas. Similarly, the level of knowledge was higher among guardians with tertiary education. Knowledge levels did not differ by sector, sex, employment and household economic situation.
Survey of HIV prevalence and behaviour in Chimanimani
Free
dow
nloa
d fr
om w
ww
.hsr
cpre
ss.a
c.za

27
Table 3.11: Guardians’ general knowledge of HIV/AIDS by socio-demographic characteristics
Variable n Score* SD P-VALUE**
Sex of respondent
Male 52 4.69 1.00 0.802
Female 637 4.65 1.18
Age group
15–24 97 4.92 1.01
0.00225–49 472 4.67 1.17
50+ 79 4.25 1.28
Unspecified 41 4.56 1.05
Locality type
Communal 326 4.70 2.47
0.033
Resettlement 166 4.67 2.69
Large-scale commercial 103 4.64 2.62
Small-scale commercial 31 4.00 1.84
Urban 63 4.71 3.74
Level of education reached
No schooling 87 4.10 1.53
<0.001
Primary school 311 4.53 1.13
Secondary School 274 4.93 1.00
Tertiary non-degreed 14 5.29 0.91
Tertiary degreed 3 5.00 0.00
Employment
Yes 86 4.83 1.00 0.146
No 600 4.63 1.19
Household economic situation
Not enough 556 4.63 1.18
0.307
Just enough 103 4.74 1.11
Most things 20 5.15 0.81
Extra money 1 4.00 0.00
None of the above 7 4.57 1.13
* Possible range of scores = 0 – 7 ** Oneway Anova test
Chapter 3
Free
dow
nloa
d fr
om w
ww
.hsr
cpre
ss.a
c.za

28
3.4.8. Guardians’ knowledge about HIV transmission
The overall mean score of the guardians’ knowledge with regards HIV transmission was 9.3 (SD = 2.7). Knowledge levels, regardless of sex and age, were just above the 50th percentile of the range of scores (Table 3.12). Of note is that while the knowledge level of guardians in communal areas was very low, knowledge was significantly higher among guardians with tertiary education. Similarly, levels were higher among guardians who were employed and also those with a better household economic situation.
Table 3.12: Guardian’s knowledge, of possible ways of HIV transmission by selected socio-demographic characteristics
Variable n Score* SD P-VALUE**
Sex of respondent
Male 52 8.89 2.96 0.204
Female 637 9.38 2.66
Age group
15–24 97 9.56 2.77
0.15625–49 472 9.37 2.74
50+ 79 8.73 2.35
Unspecified 41 9.63 2.21
Locality type
Communal 326 4.70 1.14
0.003
Resettlement 166 8.79 2.69
Large-scale commercial 103 8.93 2.62
Small-scale commercial 31 9.45 1.84
Urban 63 9.51 3.74
Level of education reached
No schooling 87 8.60 2.86
<0.001
Primary school 311 8.84 2.53
Secondary school 274 9.99 2.62
Tertiary non-degreed 14 12.14 0.95
Tertiary degreed 3 11.00 2.65
Employment
Survey of HIV prevalence and behaviour in Chimanimani
➔
Free
dow
nloa
d fr
om w
ww
.hsr
cpre
ss.a
c.za

29
Yes 86 10.06 0.27 0.007
No 600 9.23 0.11
Household economic situation
Not enough 556 9.20 2.69
0.004
Just enough 103 10.05 2.52
Most things 20 10.25 2.02
Extra money 1 12.00 0.00
None of the above 7 7.43 4.08
* Possible range of scores = 0–14 ** Oneway Anova test
3.4.9. Guardians’ knowledge on prevention of HIV transmission
The overall mean of the knowledge score was 7.3 (SD = 1.6). Generally, the levels of knowledge on prevention were high and did not differ by sex, age, locality, education and household economic situation (Table 3.13).
Table 3.13: Guardian’s knowledge of prevention of HIV transmission
Variable n Score* SD P-VALUE
Sex of respondent
Male 52 7.23 1.53 0.630
Female 637 7.34 1.56
Age group
15–24 97 7.35 1.68
0.66225–49 472 7.35 1.51
50+ 79 7.13 1.60
Unspecified 41 7.41 1.75
Locality type
Communal 326 7.33 1.50
0.482
Resettlement 166 7.20 1.55
Large-scale commercial 103 7.56 1.57
Small-scale commercial 31 7.32 1.78
Urban 63 7.32 1.74
Level of education reached
Chapter 3
➔
Free
dow
nloa
d fr
om w
ww
.hsr
cpre
ss.a
c.za

30
No schooling 87 6.86 1.56
0.058
Primary school 311 7.39 1.53
Secondary school 274 7.41 1.60
Tertiary non-degreed 14 7.29 1.20
Tertiary degreed 3 7.33 0.58
Employment
Yes 86 7.35 1.62 0.953
No 600 7.34 1.55
Household situation
Not enough 556 7.35 1.54
0.744
Just enough 103 7.43 1.64
Most things 20 6.95 1.70
Extra money 1 7.0 0.00
None of the above 7 7.0 1.63
* Possible range of scores = 0 – 10 ** Oneway Anova test
3.4.9.1. Discussion: Knowledge about HIV transmission and preventionKnowledge of HIV transmission had a positive but not necessarily linear relationship with behaviour and positive attitudes towards people living with HIV and AIDS. This BSS assessed the knowledge of guardians about HIV and AIDS since guardians are expected to build prevention and care competence amongst themselves, as well as in the children they look after either as parents or guardians. The level of knowledge of HIV transmission was disturbingly low among guardians, especially those from rural areas. One possible reason for the generally low levels is lack of access to information. The much lower knowledge levels in rural areas is most likely due to lack of structures and systems for information dissemination and access by rural communities. That knowledge increased with education and employment is expected.
Improving knowledge of the means of protection from HIV is the immediate objective of prevention campaigns. In this study, knowledge about protection methods was generally high. These high levels of knowledge can be credited to the IEC (Information Education and Communication) strategy that has been put in place, which emphasises the ABC method (Abstinence, Being faithful to one uninfected partner and Correct, consistent use of condoms) as a means of prevention.
3.5. Conclusions
This part of the study aimed to determine HIV prevalence among children aged 2–11 years and relate prevalence to various socio-demographic variables in order to contribute to the understanding of the epidemic in Zimbabwe. It was further aimed that the BSS would inform implementers in developing and/or strengthening strategies and interventions to prevent transmission; care for the sick and orphans; and to mitigate the impact of the epidemic at individual and community level.
Survey of HIV prevalence and behaviour in Chimanimani
Free
dow
nloa
d fr
om w
ww
.hsr
cpre
ss.a
c.za

31
The findings are based on a random sample of households in the district, thus providing a sample representative of children 2–11 years old in Chimanimani district. The study focused on children aged 2–11 years from whom blood samples were collected for HIV testing, while guardians provided information about themselves and the children. Several conclusions can be drawn from the findings of this part of the overall study.
Socio-demographic profile of children
• The sex distribution of the children closely resembled that determined by the BRTI OVC census (2003), as well as the national profile (CSO, 2002). The majority of children sampled were aged 2–5 years, mainly because these were more likely to be at home than the 6–11 years old who are of school-going age.
• A significant proportion of the children of school-going age were not attending school for reasons not elucidated. Possible reasons include poverty, access and religious affiliation.
• There was no difference in school attendance between orphans and non-orphans. This suggests that orphans are being cared for either by the remaining parent or by relatives.
• There is a significant orphan problem in the district. The higher proportion of paternal orphanhood implies that more men than women are dying.
• Levels of protection practices are similar for orphans and non-orphans.
HIV prevalence among children
• This study is the first to report HIV prevalence in this age group based on a significantly large sample size. The HIV prevalence of 3.3% is lower than that recorded in South Africa. Indeed, assuming that 30% of the mothers of the children were HIV infected (MOHCW, 2002), and that a further 30%, in the absence of intervention (Bryson, 1996), transmitted the infection to their children, then it would be expected that about 9% of the children would be HIV infected if they lived beyond two years of age. Thus, the low prevalence may be due to prevention-of-mother-to-child transmission, (PMTCT) interventions or that most of the infected children die early in infancy. The latter may explain why prevalence is higher among the 6–8 year olds than 2–5 year olds. Furthermore, the much lower prevalence among the 9–11 olds suggests that most infected children are not living beyond the age of 9 years or, albeit highly unlikely, that they resolve the infection and lose seropositivity.
• Most HIV infections in children are a result of transmission from mother to child. The other possible routes of transmission are through needle sticks/injections in hospital, transfusion, invasive traditional practices and sexual abuse. While there was no evidence of the latter in the present study, of note is that, though not significant, HIV prevalence was higher among female children. Whether preferential MTCT to female children occurs is not known.
• HIV prevalence was higher among children from the urban sector reflecting the higher prevalence recorded among pregnant women (MOHCW, 2002) as well as among the 15+ year olds from urban Chimanimani (see tables 5.3 and 6.2 in this report).
• Similarly, the higher prevalence among orphans simply demonstrates that HIV/AIDS is a major cause of orphanhood in the district.
• HIV and AIDS are major causes of morbidity and, hence, hospitalisation among the children.
Chapter 3
Free
dow
nloa
d fr
om w
ww
.hsr
cpre
ss.a
c.za
32
Guardians’ socio-demographic profile and knowledge about HIV and AIDS
• The median age of guardians/parents was 34 years and most were married women. This is further evidence that women are more likely to be at home, unemployed and also bear the burden of care at home.
• The majority of respondents were of the Apostolic religious sect. Thus, HIV/AIDS programmes need to be cognisant of the role of religion in shaping the perceptions, attitudes and practices with regards to education about HIV and AIDS.
• The level of literacy is relatively low, with 60% of respondents having reached primary school or had no education at all. This is an important factor to consider in developing communication strategies for HIV/AIDS programmes.
• Most households reported that they were unable to provide for the basic needs of their families. Thus, poverty is a major problem in the community. The impact of poverty, in particular the gendered aspects, on access and acceptance of interventions should be considered.
• Guardians’ general knowledge about HIV and AIDS was relatively high but specific knowledge about transmission was low. In contrast to the latter, knowledge of ways of protecting self was relatively high. These specific intervention areas need to be strengthened.
• Education was a major determinant of knowledge about HIV and AIDS. Knowledge increased with education, suggesting increased access to information and prevention intervention programmes as levels of education increased. Education may thus improve the person’s ability to act on prevention and awareness messages.
3.6. Recommendations
• Medical management of HIV and AIDS in children should be considered urgently in view of the fact that ARVs are not currently available, in particular child formulations.
• Psychosocial support systems for OVC in general and HIV infected children in particular should be established and/or strengthened.
• Prevention of MTCT should be strengthened through various strategies, including meaningful involvement of men and ensuring that ARVs for prevention are available and used.
• Interventions to enhance awareness and knowledge about HIV/AIDS among the adult population should be strengthened, particularly in both urban and rural areas of the district.
Survey of HIV prevalence and behaviour in Chimanimani
Free
dow
nloa
d fr
om w
ww
.hsr
cpre
ss.a
c.za

33
CHAPTER 4
4. Results for age group 12–14 years4.1. Introduction
It is estimated that, in Zimbabwe, about 240 000 children aged 0–14 were living with HIV and AIDS by the end of 2001 (UNAIDS 2002) and by that 2010, 34% of children under 15 years will be orphaned by HIV/AIDS (SAfAIDS, 2002). The previous chapter presented data on HIV prevalence among children 2–11 years of age. This chapter focuses on 618 children 12–14 years of age. This age group represents a highly vulnerable group because of the transitional stage in sexual development. The age 12–14 heralds the onset of puberty (sexual maturity), with girls maturing earlier than boys. During this early adolescence period, young boys and girls begin to experiment with sex. This stage therefore is critical in shaping sexual behaviour during adulthood. Vulnerability stems from the naivety of the children, which can be exploited by the older generation of the same or opposite gender. Young people today begin engaging in sexual intercourse at an early age, make little use of contraceptives, and have multiple sex partners and poor sexual negotiation skills. Peer pressure and coercion (for girls) limits young people’s ability to abstain from sex (SAfAIDS, 2002).
By and large, mother-to-child transmission (MTCT) accounts for almost all childhood HIV infections. Up to 40% of HIV infected mothers may pass on the infection to their children. Transmission occurs in-utero (17%), during labour and delivery (50%) and through breastfeeding (33%) (Kuhn & Stein, 1995; Bryson, 1996). The introduction of ARVs has made it possible for mothers to prevent the transmission of the virus to their children. However, the drugs have generally been unavailable, including the cheaper ARVs such as Nevirapine, in most developing countries including Zimbabwe, due to lack of not only the funds to purchase the drugs, but the basic infrastructure essential for prevention of MTCT (PMTCT) programmes.
While MTCT accounts for most childhood HIV infections, there is a growing concern, particularly in Africa, about horizontal transmission of HIV to children through injections in routine health practice, cultural practices and sexual abuse. Some scientists have suggested that transmission of HIV through medical injections may have contributed significantly to growth of the epidemic in Africa (Gisselquist et al., 2002; 2003). While this has been challenged by others (Kallestrup et al., 2003), it remains a pertinent issue, especially with the severe resource limitations experienced in the health sector. This may lead to unsafe practices such as multiple use of equipment or materials such as needles and cloth.
A growing concern is sexual abuse of children in Zimbabwe. The number of cases reported in the media has increased frighteningly in recent years. While some of the culprits are tested, a larger number go untested, and neither are the abused children tested. Furthermore, it is very likely that child sexual abuse is more prevalent than is realised but goes unreported. Traditional beliefs, such as that having sex with a virgin will cleanse and cure a man of STIs, including HIV and AIDS, has led to the increase in child sexual abuse including babies. In this context, it is essential to understand the level and relevance of HIV/AIDS knowledge of parents/guardians and the community in general in relation to protection of children against abuse. Such knowledge should be translated into improved protection of children.
Free
dow
nloa
d fr
om w
ww
.hsr
cpre
ss.a
c.za

Survey of HIV prevalence and behaviour in Chimanimani
34
Some culturally-based beliefs and behavioural practices, such as rites of passage (circumcision and virginity testing), sex games between adolescent boys and girls, actual penetrative vaginal sex, scarification either as decoration or for traditional medical care practices, among others, may have played a pivotal role in facilitating transmission of HIV in children (Kamwendo & Kamowa, 1999). While male circumcision, done under clinical conditions as provided for by modern medical environments, is considered safe, those carried out among African cultural groups have been noted to occur in unsterile conditions, and may also include repeated use of the same instrument on different initiates. However, research has shown that there is a reduction in the transmission of STIs and HIV among circumcised males, suggesting an association between male circumcision and risk of infection (Krantz & Ahlberg 1995; O’Farrell & Egger, 2000; Van Howe, 1999), indicating that it is not the practice itself but the environment/conditions under which the practice occurs that is risky.
There has been no empirical evidence to suggest that cultural practices are facilitating transmission. Thus, there remains a dire need to explain the prevalence among children between 12–14 years who are not sexually active and whose infection rates are not explained by sexual abuse alone. More children than previously estimated are also living with HIV infection beyond the age of 5 years in Southern Africa. There is, therefore, a need for studies to clearly describe the epidemic among children in the 12–14 years age group in order to provide information for policy and programming to reduce infection rates and mitigate the impact of HIV and AIDS on children.
Poverty is a key factor in leading to behaviours that expose people to risk of HIV infections. Existing evidence from Zimbabwe and elsewhere is that transactional sex is common in Zimbabwe, especially among young women who date older men for economic reasons (ZHDR, 2003).
This chapter presents and describes the demographic, socio-cultural, behavioural and economic characteristics of children 12–14 years. The chapter further attempts to establish associations between HIV prevalence and the factors mentioned above.
4.2. Objectives
• To quantify the magnitude of HIV and AIDS in the district among children aged 12–14 years;
• To determine the knowledge, attitudes, behaviour and practices (KABP) of the 12–14 age group;
• To determine prevention and care programmes and human rights issues concerning HIV and AIDS among 12–14 year old children; and
• To provide evidence-based information to policy makers on HIV and AIDS preventive and mitigatory needs among the 12–14 year olds and their families.
4.3. Methodology
The general methodology is described in Chapter 2. In brief, besides the sections that were common to the other questionnaires in the study (questionnaires for parent/guardians of children aged 2–11 years, youths and adults), the questionnaire for 12–14 year old children was specific with regards to risk of sexual abuse, sexual initiation and pregnancy. While there is little information available to guide the selection of indicators of infection in children aged 12–14 years, existing literature suggests that the above
Free
dow
nloa
d fr
om w
ww
.hsr
cpre
ss.a
c.za
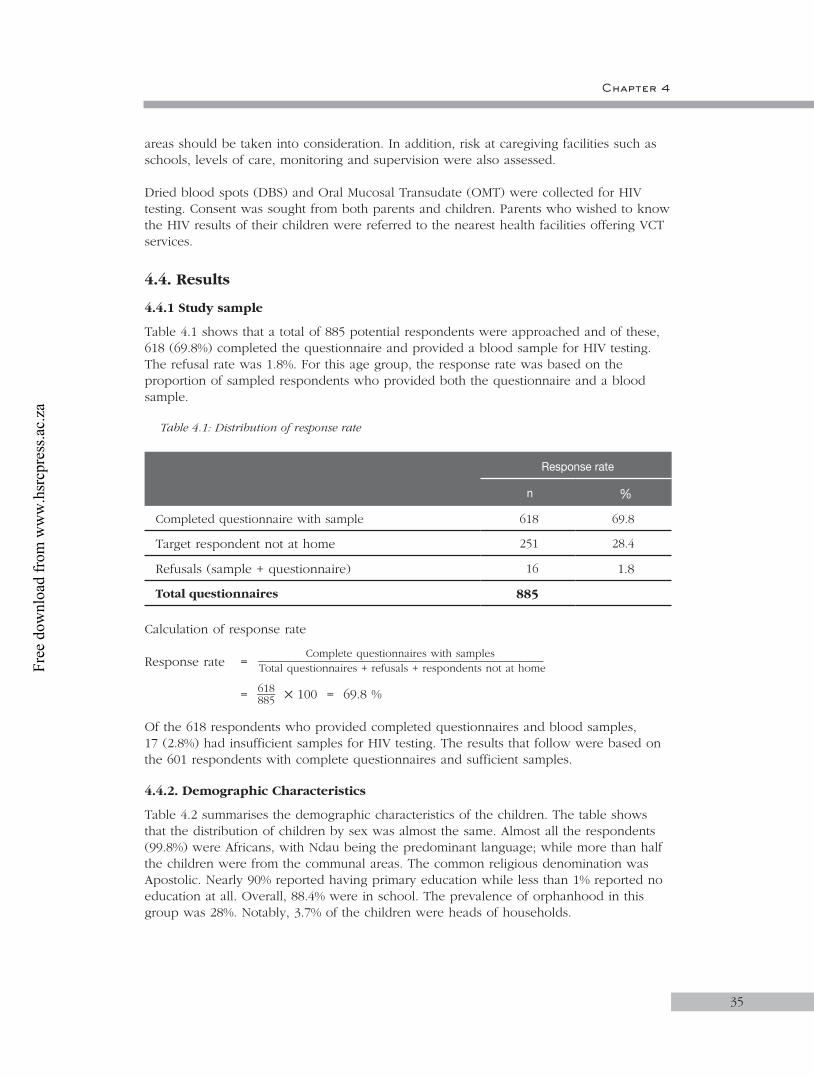
Chapter 4
35
areas should be taken into consideration. In addition, risk at caregiving facilities such as schools, levels of care, monitoring and supervision were also assessed.
Dried blood spots (DBS) and Oral Mucosal Transudate (OMT) were collected for HIV testing. Consent was sought from both parents and children. Parents who wished to know the HIV results of their children were referred to the nearest health facilities offering VCT services.
4.4. Results
4.4.1 Study sample
Table 4.1 shows that a total of 885 potential respondents were approached and of these, 618 (69.8%) completed the questionnaire and provided a blood sample for HIV testing. The refusal rate was 1.8%. For this age group, the response rate was based on the proportion of sampled respondents who provided both the questionnaire and a blood sample.
Table 4.1: Distribution of response rate
Response rate
n %
Completed questionnaire with sample 618 69.8
Target respondent not at home 251 28.4
Refusals (sample + questionnaire) 16 1.8
Total questionnaires 885
Calculation of response rate
Response rate = Complete questionnaires with samples
___________________________________________ Total questionnaires + refusals + respondents not at home = 618 ___ 885 100 = 69.8 %
Of the 618 respondents who provided completed questionnaires and blood samples, 17 (2.8%) had insufficient samples for HIV testing. The results that follow were based on the 601 respondents with complete questionnaires and sufficient samples.
4.4.2. Demographic Characteristics
Table 4.2 summarises the demographic characteristics of the children. The table shows that the distribution of children by sex was almost the same. Almost all the respondents (99.8%) were Africans, with Ndau being the predominant language; while more than half the children were from the communal areas. The common religious denomination was Apostolic. Nearly 90% reported having primary education while less than 1% reported no education at all. Overall, 88.4% were in school. The prevalence of orphanhood in this group was 28%. Notably, 3.7% of the children were heads of households.
Free
dow
nloa
d fr
om w
ww
.hsr
cpre
ss.a
c.za

Survey of HIV prevalence and behaviour in Chimanimani
36
Table 4.2: Demographic characteristics of the children
N = 601
Demographic variable n %
Age 12 years13 years14 years
229177195
38.129.532.4
Sex MaleFemale
295306
49.150.9
Nationality ZimbabweanNon-Zimbabwean
5983
Main Home Language ShonaKalangaNdauOther African
224
5741
Sector Communal areaResettlementLarge-scale commercial areaSmall-scale commercial areaUrban area
311149493359
Education No schoolPrimarySecondaryNot mentioned
4526701
Children attending school
531
Prevalence of orphanhood
168
Heads of households 22
N = 543
Religious grouping CatholicProtestantPentecostalApostolic SectTraditional AfricanMoslem
39138131224101
7.225.424.141.31.80.2
Free
dow
nloa
d fr
om w
ww
.hsr
cpre
ss.a
c.za

Chapter 4
37
As observed in the 2–11 age group (Chapter 3), frequency of paternal orphanhood was higher than maternal orphanhood (Figure 4.1). Over two-thirds of the children lost either parent when they were more than 5 years of age (Table 4.3).
Figure 4.1: Distribution of orphanhood status
Table 4.3: Age when the child lost either mother or father
Age when child lost mother (N = 74) n
≤ 5 years 16
6–14 years 49
Unspecified 9
Age when child lost father (N = 143) n
≤ 5 years 40
6–14 years 88
Unspecified 15
Table 4.4 shows the educational level of the children at the time of the study. Overall, most children interviewed were in primary school. Of note, 11.8% of the respondents were not school attending and this proportion increased with age (Table 4.4). Of those who were not school attending 45.7% were orphans and there were no significant difference (p=0.311).
��������
�����
������������
����
����
�����
����������
����������������������
�����������������
��������������������������
Free
dow
nloa
d fr
om w
ww
.hsr
cpre
ss.a
c.za

Survey of HIV prevalence and behaviour in Chimanimani
38
Table 4.4: Distribution of children by age and educational status
Age group
Educational status Total
Not school attending
In primary school
In secondary
school
n % n % n % n %
Total 70 11.8 369 62.1 155 26.1 594 100.0
12 9 3.9 212 92.6 8 3.5 229 38.5
13 20 11.6 106 61.2 47 27.2 173 29.2
14 41 21.4 51 26.5 100 52.1 192 32.3
4.4.3. HIV prevalence
4.4.3.1. Prevalence by sex, age and sectorOverall, HIV prevalence was 3.0% with a 95% CI of 1.8–4.7. Prevalence was twice as high among females than males but this was not significantly different (Table 4.5). Prevalence tended to decrease with increasing age and was more than three times higher in urban than in all other sectors.
Table 4.5: HIV prevalence by sex, age and locality
Demographic characteristics n HIV positive (%) 95% CI
Overall 601 3.0 1.8–4.7
Sex
Male 306 2.0 0.7–4.2
Female 295 4.1 2.1–7.0
p=0.130*
Age (Years)
12 229 3.9 1.8–7.3
13 177 3.4 1.3–7.2
14 195 1.5 0.3–4.4
p=0.332*
Sector
Communal area 311 2.9 1.3–5.4
Resettlement area 149 1.3 0.2–4.8
Large-scale commercial area 49 2.0 0.1–10.9
Small-scale commercial area 33 0.0
Urban area 59 10.2 3.8–20.8
p=0.011*
* Chi square test
Free
dow
nloa
d fr
om w
ww
.hsr
cpre
ss.a
c.za

Chapter 4
39
4.4.3.2. HIV prevalence by religionHIV prevalence was not significantly associated with religion although prevalence was nearly four times higher among those reporting that they belonged to Christian compared to Apostolic religion (Table 4.6). The highest prevalence was noted among Catholics.
Table 4.6: HIV prevalence by religion
N HIV positive (%) 95% CI
Belong to a faith/religion
Yes 543 3.1 1.8–5.0
No 58 1.7 0.0–9.2
p=1.000*
Type of religious grouping (N=543)
Catholic 39 10.3 2.7–24.2
Protestant 138 4.4 1.6–9.2
Pentecostal 131 2.3 0.5–6.5
Apostolic sects 224 1.8 0.5–4.5
Traditional African 10 0.0
Moslem 1 0.0
p=0.115*
* Chi square test
4.4.3.3. HIV prevalence among orphans HIV prevalence among orphans was 2.4% and was not significantly different from that of non-orphans (3.3%) (p=0.84). Prevalence was 3.2% and 2.0% among paternal and double orphans, respectively, while none of the maternal orphans were infected.
4.4.3.4. Discussion: HIV prevalence and demographic characteristicsThe sex distribution of children reflects that of the national profile (CSO Census Report, 2002) as well as that reflected in the results of the BRTI OVC Census (Munyati, Rusakaniko, Mupambireyi et al., 2003). More than a quarter of the children in Chimanimani were orphans, indicating that these children were prematurely deprived of parental love, care and protection. The proportion of 4:1 for paternal to maternal orphans reflects that male parental mortality in Chimanimani is higher than that of females. As a result, most of the households are left with no breadwinner since in this rural setup it is predominantly males who take up this responsibility.
That almost four per cent of children between 12 years and 14 years were heading a household is worth noting. Such responsibilities increase the children’s risk of HIV infection, as they are prone to early transactional sex and sexual abuse.
The prevalence of HIV in the 12–14 years age group of 3% suggests that either some children who were infected perinatally are surviving to this age, or that these children are
Free
dow
nloa
d fr
om w
ww
.hsr
cpre
ss.a
c.za
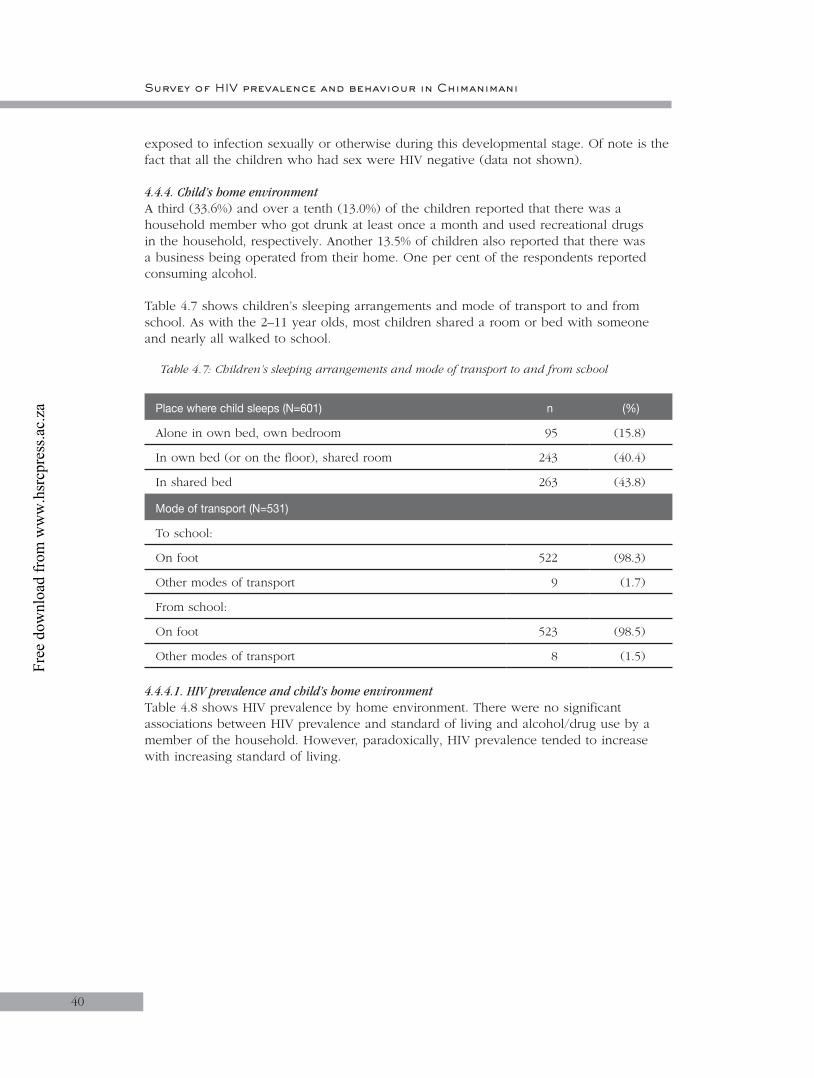
Survey of HIV prevalence and behaviour in Chimanimani
40
exposed to infection sexually or otherwise during this developmental stage. Of note is the fact that all the children who had sex were HIV negative (data not shown).
4.4.4. Child’s home environmentA third (33.6%) and over a tenth (13.0%) of the children reported that there was a household member who got drunk at least once a month and used recreational drugs in the household, respectively. Another 13.5% of children also reported that there was a business being operated from their home. One per cent of the respondents reported consuming alcohol.
Table 4.7 shows children’s sleeping arrangements and mode of transport to and from school. As with the 2–11 year olds, most children shared a room or bed with someone and nearly all walked to school.
Table 4.7: Children’s sleeping arrangements and mode of transport to and from school
Place where child sleeps (N=601) n (%)
Alone in own bed, own bedroom 95 (15.8)
In own bed (or on the floor), shared room 243 (40.4)
In shared bed 263 (43.8)
Mode of transport (N=531)
To school:
On foot 522 (98.3)
Other modes of transport 9 (1.7)
From school:
On foot 523 (98.5)
Other modes of transport 8 (1.5)
4.4.4.1. HIV prevalence and child’s home environment Table 4.8 shows HIV prevalence by home environment. There were no significant associations between HIV prevalence and standard of living and alcohol/drug use by a member of the household. However, paradoxically, HIV prevalence tended to increase with increasing standard of living.
Free
dow
nloa
d fr
om w
ww
.hsr
cpre
ss.a
c.za
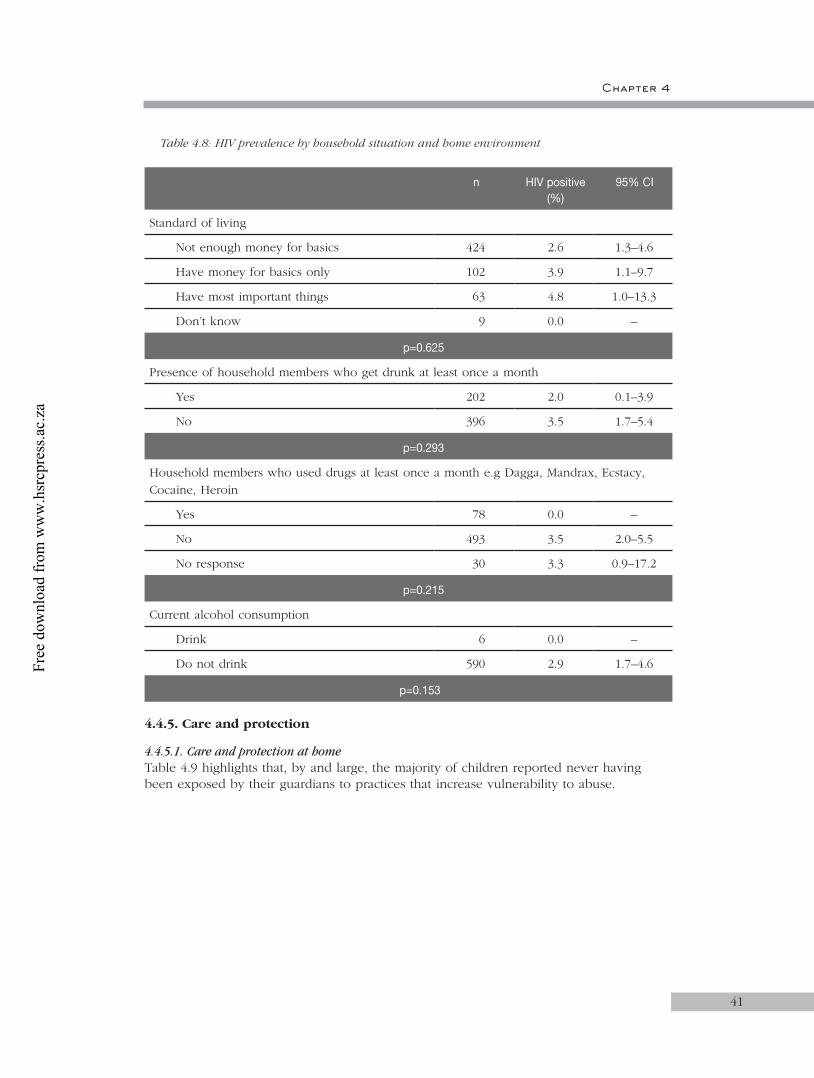
Chapter 4
41
Table 4.8: HIV prevalence by household situation and home environment
n HIV positive (%)
95% CI
Standard of living
Not enough money for basics 424 2.6 1.3–4.6
Have money for basics only 102 3.9 1.1–9.7
Have most important things 63 4.8 1.0–13.3
Don’t know 9 0.0 –
p=0.625
Presence of household members who get drunk at least once a month
Yes 202 2.0 0.1–3.9
No 396 3.5 1.7–5.4
p=0.293
Household members who used drugs at least once a month e.g Dagga, Mandrax, Ecstacy, Cocaine, Heroin
Yes 78 0.0 –
No 493 3.5 2.0–5.5
No response 30 3.3 0.9–17.2
p=0.215
Current alcohol consumption
Drink 6 0.0 –
Do not drink 590 2.9 1.7–4.6
p=0.153
4.4.5. Care and protection
4.4.5.1. Care and protection at homeTable 4.9 highlights that, by and large, the majority of children reported never having been exposed by their guardians to practices that increase vulnerability to abuse.
Free
dow
nloa
d fr
om w
ww
.hsr
cpre
ss.a
c.za
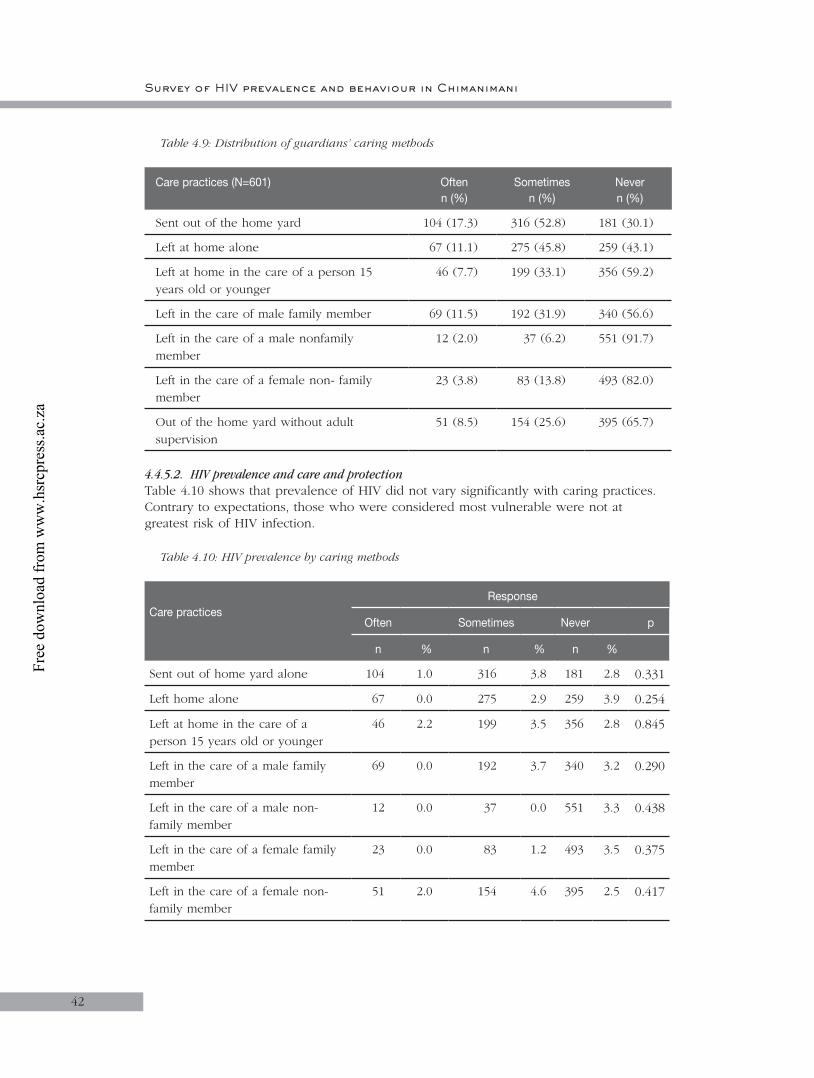
Survey of HIV prevalence and behaviour in Chimanimani
42
Table 4.9: Distribution of guardians’ caring methods
Care practices (N=601) Oftenn (%)
Sometimesn (%)
Nevern (%)
Sent out of the home yard 104 (17.3) 316 (52.8) 181 (30.1)
Left at home alone 67 (11.1) 275 (45.8) 259 (43.1)
Left at home in the care of a person 15 years old or younger
46 (7.7) 199 (33.1) 356 (59.2)
Left in the care of male family member 69 (11.5) 192 (31.9) 340 (56.6)
Left in the care of a male nonfamily member
12 (2.0) 37 (6.2) 551 (91.7)
Left in the care of a female non- family member
23 (3.8) 83 (13.8) 493 (82.0)
Out of the home yard without adult supervision
51 (8.5) 154 (25.6) 395 (65.7)
4.4.5.2. HIV prevalence and care and protectionTable 4.10 shows that prevalence of HIV did not vary significantly with caring practices. Contrary to expectations, those who were considered most vulnerable were not at greatest risk of HIV infection.
Table 4.10: HIV prevalence by caring methods
Care practices
Response
Often Sometimes Never p
n % n % n %
Sent out of home yard alone 104 1.0 316 3.8 181 2.8 0.331
Left home alone 67 0.0 275 2.9 259 3.9 0.254
Left at home in the care of a person 15 years old or younger
46 2.2 199 3.5 356 2.8 0.845
Left in the care of a male family member
69 0.0 192 3.7 340 3.2 0.290
Left in the care of a male non-family member
12 0.0 37 0.0 551 3.3 0.438
Left in the care of a female family member
23 0.0 83 1.2 493 3.5 0.375
Left in the care of a female non-family member
51 2.0 154 4.6 395 2.5 0.417
Free
dow
nloa
d fr
om w
ww
.hsr
cpre
ss.a
c.za

Chapter 4
43
4.4.5.3. Care and protection by teachersAs a way of establishing how much protection teachers were giving to children, school-going children were asked questions such as: How often did your teachers attend classes at your school? How often did your teachers watch children at break time at your school? How often did your teachers monitor the toilets at your school? The possible responses to these questions were always, often, sometimes and never. A total of eight questions were asked and these were scored according to how much they reflected good care practices, with the best practice (indicated by always) scoring the highest (score of 3) and the worst care practice scoring the least (indicated by never) which was a zero. Total scores were calculated for each respondent from the eight statements and the mean scores are summarised in Table 4.11. The maximum possible score was 24.
Table 4.11: Mean scores of children’s care/protection by teachers
Variable n Score* SD
Overall 531 15.3 4.1
Sex of respondent
Male 279 15.0 4.0
Female 252 15.6 4.1
P = 0.094
Sector
Communal 288 15.0 4.1
Resettlement 118 15.2 3.8
Large-scale commercial 44 14.4 3.4
Small-scale commercial 29 14.0 4.2
Urban 52 18.4 3.5
P < 0.001
Current level of education
Primary School 369 15.2 4.0
Secondary School 155 15.5 4.2
P = 0.404
* maximum score is 24
The overall mean score (SD) was 15.3 (4.1). Care and protection levels, regardless of sex, sector and educational level, were just above the 50th percentile of the range of scores. The mean score in the urban areas was higher compared to the other sectors.
4.4.5.4. Discussion: HIV prevalence and child’s home environmentThe environment in which a child grows is important in child development and is shaped by their parents’ and caregivers’ activities within the home. This study has shown that at least a third of the households had someone who occasionally drank alcohol.
Free
dow
nloa
d fr
om w
ww
.hsr
cpre
ss.a
c.za

Survey of HIV prevalence and behaviour in Chimanimani
44
This may be linked to the observation that some of the children reported consuming alcohol themselves. The lack of association between care practices and HIV prevalence suggests that abuse may not contribute significantly to risk of HIV infection among the respondents. This needs to be interpreted with caution in this bivariate analysis.
Care and protection at home
Inadequate care and protection and outright abuse exist to some extent in all communities. In the present study, most children reported never having been exposed by their guardians to practices that increase vulnerability to abuse. This suggests that, overall, the reported quality of care for children aged 12 to 14 years in Chimanimani is acceptable. However, the less than 10% who may be at increased risk need to be considered in designing interventions for this highly sensitive area.
Care and protection at school
Generally, the quality of care and protection from teachers was just above average, although teachers in urban areas tended to fare better. This is possibly because parents in urban areas are more enlightened regarding their children’s rights in schools. As a result, teachers are more careful in the manner they handle children. Most schools in urban areas have welldeveloped infrastructure, hence it is easier for teachers to monitor the flow of people in and out of school, as there are designated entrance and exit points.
4.4.6. Orphanhood
Overall, prevalence of orphanhood was 28%. Further details on orphanhood were described in Sections 4.4.2 and 4.4.3, and illustrated in Table 4.2 and Figure 4.1.
4.4.6.1. Orphanhood by school attendanceTable 4.12 shows that a significantly higher proportion of orphans were not in school compared to non-orphans. Similarly, a higher proportion of orphans than non-orphans reported having missed school but this was not statistically significant.
Table 4.12: Distribution of orphanhood by school enrolment and attendance
Demographic variableOrphanhood status (%)
Orphans (N=168)
Non-orphan(N=425)
Not known(N=8)
Overall (N=601)
Overall 28.0 70.7 1.3
Enrolled into a school
Yes 136 (81.0)
387 (91.1) 8 (100.0) 531 (88.3)
No 32 (19.0) 38 (8.9) 0.0 70 (11.7)
p-value=0.003
School attendance (N=136)
Missed school in the last month 64 (47.1) 143 (37.1) 3 (37.5) 210 (39.7)
Never missed school 72 (52.9) 242 (62.9) 5 (62.5) 319 (60.3)
p-value=0.220
NB. P-value indicates comparison across orphanhood status
Free
dow
nloa
d fr
om w
ww
.hsr
cpre
ss.a
c.za

Chapter 4
45
4.4.6.2. Orphanhood by household situationTable 4.13 summarises household conditions in the children’s households. Although the majority of orphans and non-orphans reported that they did not have enough money for basic things, the proportion was higher in the former.
Table 4.13: Orphanhood by household situation
Household situation OrphansN = 168
Non-orphansN = 425
Not enough money for basics things 139 (82.7) 279 (65.7)
Have money for food and clothes, but short of many other things 14 (8.3) 87 (20.47)
Have most important things, but few luxury goods 11 (6.6) 52 (12.2)
Don’t know 2 (1.2) 6 (1.4)
No response 2 (1.2) 1 (0.2)
4.4.6.3. Orphanhood by awareness of OVC structuresAwareness levels of structures in the community that care for OVC are shown in Table 4.14. The table shows that the awareness was similar between orphans and non-orphans but with slightly more males than females in both groups being aware. Respondents from the communal areas and those who were in primary school were more aware of structures that care for OVC in their community.
Table 4.14: Awareness of structures in community that care for OVC
Variable OrphanN=168n (%)
Non-orphanN=425n (%)
Overall 48 (28.6) 108 (25.4)
Sex of respondent N = 48 N = 108
Male 26 (54.1) 60 (55.5)
Female 22 (45.9) 48 (44.5)
Sector
Communal 33 (68.8) 49 (45.4)
Resettlement 7 (14.6) 31 (28.7)
Large-scale commercial 3 (6.3) 6 (5.6)
Small-scale commercial 0 (0.0) 10 (9.3)
Urban 5 (10.4) 12 (11.1)
Level of education
No schooling 8 (16.6) 6 (7.4)
Primary school 27 (56.3) 66 (61.1)
Secondary school 13 (27.1) 36 (33.3)
Free
dow
nloa
d fr
om w
ww
.hsr
cpre
ss.a
c.za

Survey of HIV prevalence and behaviour in Chimanimani
46
4.4.6.4. Discussion: Orphanhood
Orphanhood and school attendance:Loss of one or both parents has an impact on school attendance as some children will either drop out of school or miss school more often. In other cases, especially in the case of the death of a mother, the child is left to do all the household chores, and take care of the younger siblings or a remaining sick parent.
Orphanhood and household situation:Household situations of orphans usually differ from those of non-orphans. This study has shown that orphans were more likely not to have enough money for basic things. This is not surprising considering that the breadwinners were no longer there to support them.
Orphanhood and awareness of OVC structures:This study has shown that there were some support systems/services for OVC and that awareness levels of OVC services were similar among orphans and non-orphans. There were more OVC services in communal areas compared to others.
4.4.6.5. Child-headed householdsTable 4.15 shows that there were more male than female child-headed households (15 and 7, respectively). Most of these households did not have enough money for basic things and were from communal areas. Most child-headed households were from communal and resettlement areas.
Table 4.15: Distribution of child-headed households by demographic characteristics
Variable n
Total (N=601) 22
Sex of respondent (N=22)
Male 15
Female 7
Sector (N=22)
Communal 7
Resettlement 6
Large-scale commercial 3
Small-scale commercial 3
Urban 3
Household situation (N=22)
Not enough money for basic things 17
Just enough money for food and clothes 3
Money for most things 1
Not known 1
Free
dow
nloa
d fr
om w
ww
.hsr
cpre
ss.a
c.za
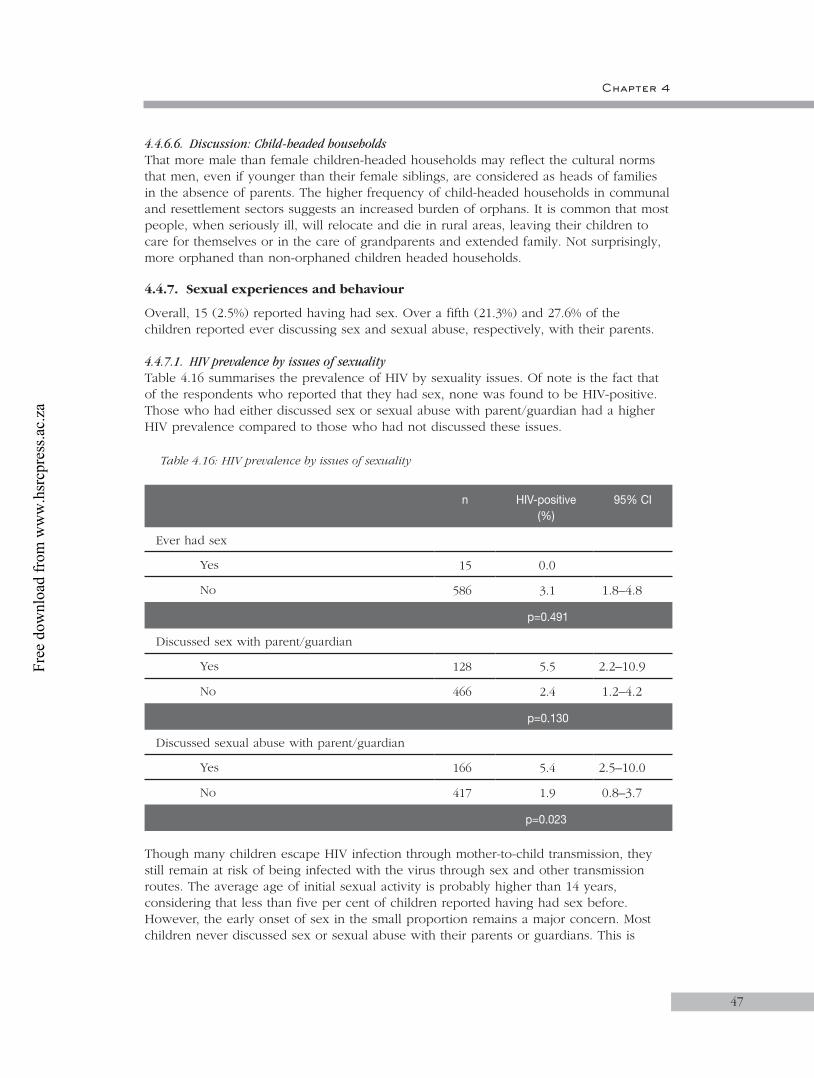
Chapter 4
47
4.4.6.6. Discussion: Child-headed householdsThat more male than female children-headed households may reflect the cultural norms that men, even if younger than their female siblings, are considered as heads of families in the absence of parents. The higher frequency of child-headed households in communal and resettlement sectors suggests an increased burden of orphans. It is common that most people, when seriously ill, will relocate and die in rural areas, leaving their children to care for themselves or in the care of grandparents and extended family. Not surprisingly, more orphaned than non-orphaned children headed households.
4.4.7. Sexual experiences and behaviour
Overall, 15 (2.5%) reported having had sex. Over a fifth (21.3%) and 27.6% of the children reported ever discussing sex and sexual abuse, respectively, with their parents.
4.4.7.1. HIV prevalence by issues of sexuality Table 4.16 summarises the prevalence of HIV by sexuality issues. Of note is the fact that of the respondents who reported that they had sex, none was found to be HIV-positive. Those who had either discussed sex or sexual abuse with parent/guardian had a higher HIV prevalence compared to those who had not discussed these issues.
Table 4.16: HIV prevalence by issues of sexuality
n HIV-positive (%)
95% CI
Ever had sex
Yes 15 0.0
No 586 3.1 1.8–4.8
p=0.491
Discussed sex with parent/guardian
Yes 128 5.5 2.2–10.9
No 466 2.4 1.2–4.2
p=0.130
Discussed sexual abuse with parent/guardian
Yes 166 5.4 2.5–10.0
No 417 1.9 0.8–3.7
p=0.023
Though many children escape HIV infection through mother-to-child transmission, they still remain at risk of being infected with the virus through sex and other transmission routes. The average age of initial sexual activity is probably higher than 14 years, considering that less than five per cent of children reported having had sex before. However, the early onset of sex in the small proportion remains a major concern. Most children never discussed sex or sexual abuse with their parents or guardians. This is
Free
dow
nloa
d fr
om w
ww
.hsr
cpre
ss.a
c.za
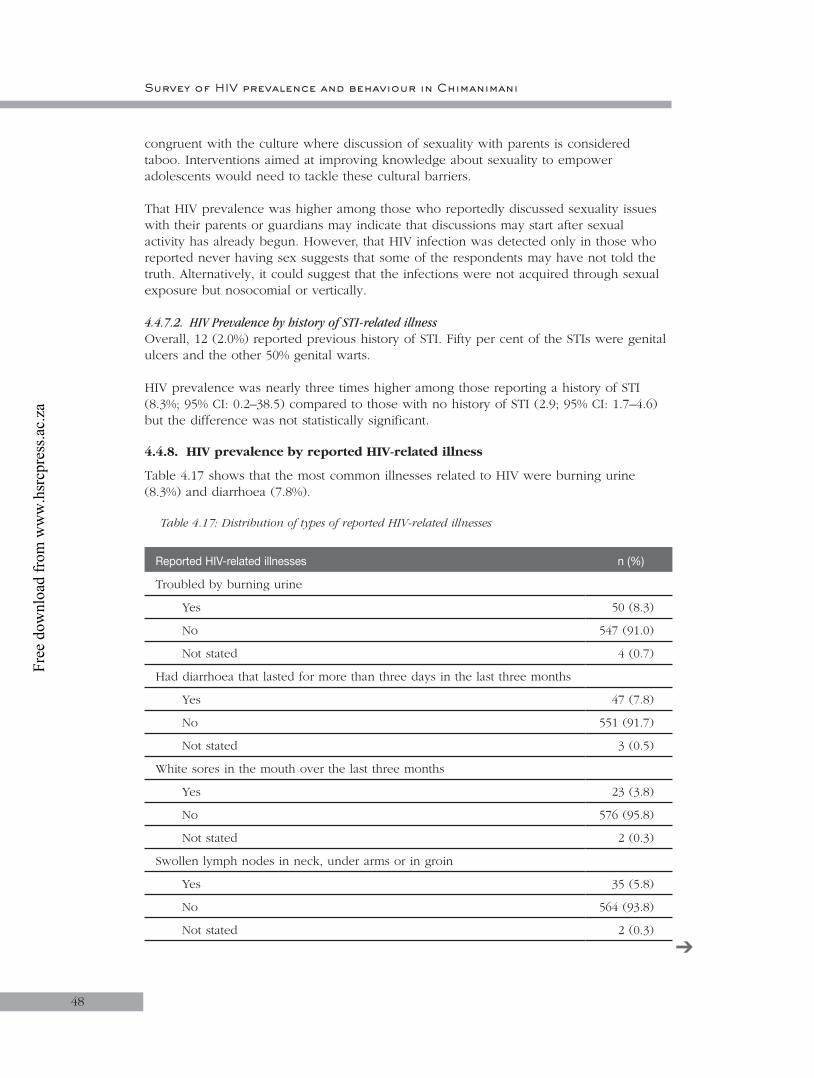
Survey of HIV prevalence and behaviour in Chimanimani
48
congruent with the culture where discussion of sexuality with parents is considered taboo. Interventions aimed at improving knowledge about sexuality to empower adolescents would need to tackle these cultural barriers.
That HIV prevalence was higher among those who reportedly discussed sexuality issues with their parents or guardians may indicate that discussions may start after sexual activity has already begun. However, that HIV infection was detected only in those who reported never having sex suggests that some of the respondents may have not told the truth. Alternatively, it could suggest that the infections were not acquired through sexual exposure but nosocomial or vertically.
4.4.7.2. HIV Prevalence by history of STI-related illnessOverall, 12 (2.0%) reported previous history of STI. Fifty per cent of the STIs were genital ulcers and the other 50% genital warts.
HIV prevalence was nearly three times higher among those reporting a history of STI (8.3%; 95% CI: 0.2–38.5) compared to those with no history of STI (2.9; 95% CI: 1.7–4.6) but the difference was not statistically significant.
4.4.8. HIV prevalence by reported HIV-related illness
Table 4.17 shows that the most common illnesses related to HIV were burning urine (8.3%) and diarrhoea (7.8%).
Table 4.17: Distribution of types of reported HIV-related illnesses
Reported HIV-related illnesses n (%)
Troubled by burning urine
Yes 50 (8.3)
No 547 (91.0)
Not stated 4 (0.7)
Had diarrhoea that lasted for more than three days in the last three months
Yes 47 (7.8)
No 551 (91.7)
Not stated 3 (0.5)
White sores in the mouth over the last three months
Yes 23 (3.8)
No 576 (95.8)
Not stated 2 (0.3)
Swollen lymph nodes in neck, under arms or in groin
Yes 35 (5.8)
No 564 (93.8)
Not stated 2 (0.3)
➔
Free
dow
nloa
d fr
om w
ww
.hsr
cpre
ss.a
c.za
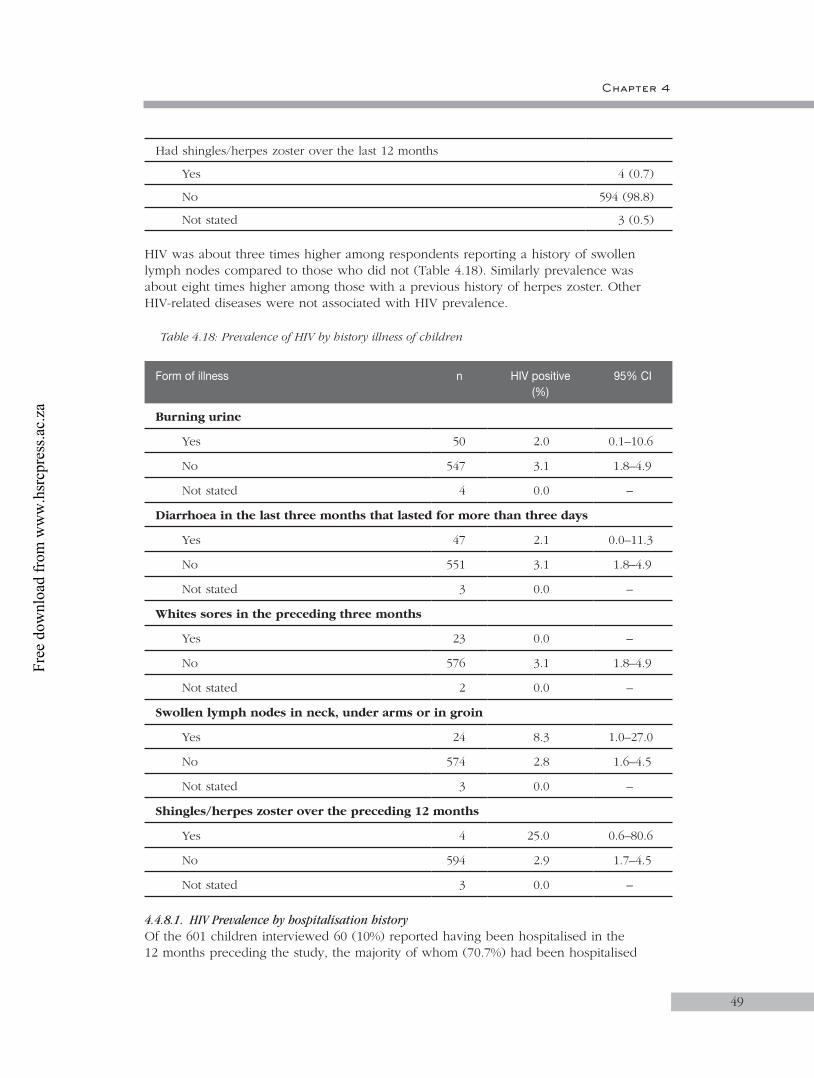
Chapter 4
49
Had shingles/herpes zoster over the last 12 months
Yes 4 (0.7)
No 594 (98.8)
Not stated 3 (0.5)
HIV was about three times higher among respondents reporting a history of swollen lymph nodes compared to those who did not (Table 4.18). Similarly prevalence was about eight times higher among those with a previous history of herpes zoster. Other HIV-related diseases were not associated with HIV prevalence.
Table 4.18: Prevalence of HIV by history illness of children
Form of illness n HIV positive(%)
95% CI
Burning urine
Yes 50 2.0 0.1–10.6
No 547 3.1 1.8–4.9
Not stated 4 0.0 –
Diarrhoea in the last three months that lasted for more than three days
Yes 47 2.1 0.0–11.3
No 551 3.1 1.8–4.9
Not stated 3 0.0 –
Whites sores in the preceding three months
Yes 23 0.0 –
No 576 3.1 1.8–4.9
Not stated 2 0.0 –
Swollen lymph nodes in neck, under arms or in groin
Yes 24 8.3 1.0–27.0
No 574 2.8 1.6–4.5
Not stated 3 0.0 –
Shingles/herpes zoster over the preceding 12 months
Yes 4 25.0 0.6–80.6
No 594 2.9 1.7–4.5
Not stated 3 0.0 –
4.4.8.1. HIV Prevalence by hospitalisation history Of the 601 children interviewed 60 (10%) reported having been hospitalised in the 12 months preceding the study, the majority of whom (70.7%) had been hospitalised
Free
dow
nloa
d fr
om w
ww
.hsr
cpre
ss.a
c.za

Survey of HIV prevalence and behaviour in Chimanimani
50
only once. Table 4.19 shows that there was no significant difference in HIV prevalence between children who had been hospitalised and those who had not. Furthermore, HIV prevalence was not associated with frequency of hospitalisation.
Table 4.19: Prevalence of HIV by hospitalisation history
n HIV-positive(%)
95% CI
Hospitalised in the 12 months preceding the study
Yes 60 3.3 0.4–11.5
No 538 3.0 1.7–4.8
p=0.700
Frequency of hospitalisation over the 12 months preceding study
Once 43 4.7 0.6–15.8
More than once 16 0.0
p=1.000
4.4.8.2. Discussion: HIV and STIsIt has been clearly demonstrated that STIs facilitate HIV transmission. Our data is in agreement with other studies (Grosskurth et al., 2000) although the numbers were too small to allow definitive conclusions to be made.
4.4.8.3. Discussion: HIV Prevalence and MorbidityContrary to the observation among the 2–11 year olds, prevalence of reported hospitalisation was not significantly associated with HIV infection among the 12–14 year olds. However, as expected, some HIV-related illnesses (lymphadenopathy and herpes zoster) showed some association with HIV prevalence, albeit not statistically significant. The lack of association between hospitalisation and HIV infection may suggest that the infections were fairly recent and hence in the asymptomatic stage. In the same vein, this could point to recent sexual encounter as the major transmission route in this age group. Further analysis is required in this regard.
4.4.9. Self-reported behaviour change
Overall, 14.0% of the children reported having changed sexual behaviour in the last few years. The most commonly reported behaviour was abstention from sex while six respondents (7.1%) reported that they now used condoms consistently (Table 4.20).
Free
dow
nloa
d fr
om w
ww
.hsr
cpre
ss.a
c.za

Chapter 4
51
Table 4.20: Self-reported behaviour change due to HIV/AIDS
Behaviour change n Yes (%)
Have changed sexual behaviour in the last few years (N=601)
84 14.0
Self-reported behaviour change (N=84)
Abstain from sex 62 73.8
Have only one partner/being faithful 7 8.3
Always use condoms 6 7.1
Partner and respondent had HIV test before they had sex
1 1.2
Healthier dietary habits 1 1.2
Choose only healthy looking partners 1 1.2
Don’t share needles/razor blades 21 25.0
Going to church 7 8.3
Other 6 7.1
4.4.9.1. Attitudes of children towards certain sexual behaviourThe respondents were asked questions to determine their attitudes towards certain sexual behaviours. Some of the statements were: ‘I think it is possible for a boy/girl to have many girlfriends. If a boy wants sex, he has the right to get it. Boys should make decisions about whether to use a condom or not’. The children were to strongly agree, agree, disagree, strongly disagree with the statements or remain neutral if they were not sure of the given statements. Scores were developed where a score of 0 represented a negative attitude which was either defined by responding with agree + strongly agree or by disagree + strongly disagree (all depending on the statement) and a score of 1 represented positive attitudes. Those who were not sure were classified with the negative attitudes. Total scores for each respondent were developed and the mean scores were then calculated and summarised in Table 4.21. The maximum possible score was 7.
Table 4.21: Attitudes scores of children towards certain sexual behaviours by respondent characteristics
Variable n *Score SD
Overall 601 3.6 2.0
Sex of respondent
Male 306 3.4 2.0
Female 295 3.9 1.9
p=0.003
➔
Free
dow
nloa
d fr
om w
ww
.hsr
cpre
ss.a
c.za
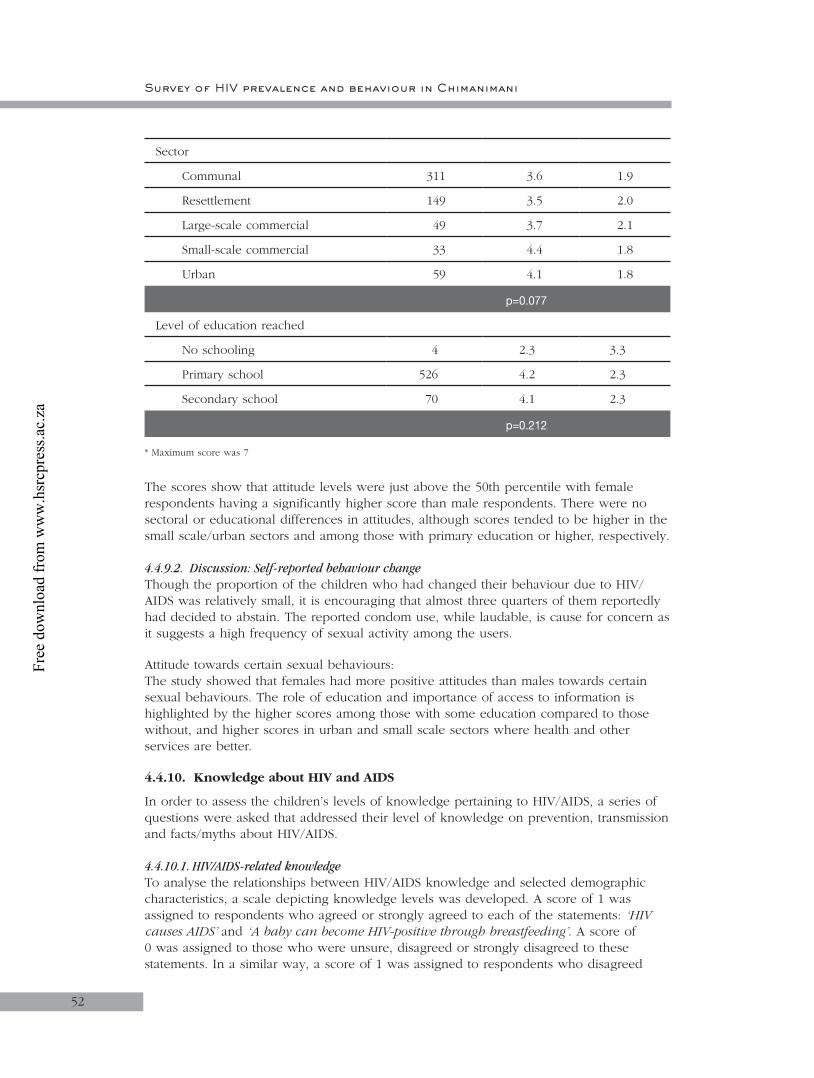
Survey of HIV prevalence and behaviour in Chimanimani
52
Sector
Communal 311 3.6 1.9
Resettlement 149 3.5 2.0
Large-scale commercial 49 3.7 2.1
Small-scale commercial 33 4.4 1.8
Urban 59 4.1 1.8
p=0.077
Level of education reached
No schooling 4 2.3 3.3
Primary school 526 4.2 2.3
Secondary school 70 4.1 2.3
p=0.212
* Maximum score was 7
The scores show that attitude levels were just above the 50th percentile with female respondents having a significantly higher score than male respondents. There were no sectoral or educational differences in attitudes, although scores tended to be higher in the small scale/urban sectors and among those with primary education or higher, respectively.
4.4.9.2. Discussion: Self-reported behaviour changeThough the proportion of the children who had changed their behaviour due to HIV/AIDS was relatively small, it is encouraging that almost three quarters of them reportedly had decided to abstain. The reported condom use, while laudable, is cause for concern as it suggests a high frequency of sexual activity among the users.
Attitude towards certain sexual behaviours:The study showed that females had more positive attitudes than males towards certain sexual behaviours. The role of education and importance of access to information is highlighted by the higher scores among those with some education compared to those without, and higher scores in urban and small scale sectors where health and other services are better.
4.4.10. Knowledge about HIV and AIDS
In order to assess the children’s levels of knowledge pertaining to HIV/AIDS, a series of questions were asked that addressed their level of knowledge on prevention, transmission and facts/myths about HIV/AIDS.
4.4.10.1. HIV/AIDS-related knowledgeTo analyse the relationships between HIV/AIDS knowledge and selected demographic characteristics, a scale depicting knowledge levels was developed. A score of 1 was assigned to respondents who agreed or strongly agreed to each of the statements: ‘HIV causes AIDS’ and ‘A baby can become HIV-positive through breastfeeding’. A score of 0 was assigned to those who were unsure, disagreed or strongly disagreed to these statements. In a similar way, a score of 1 was assigned to respondents who disagreed
Free
dow
nloa
d fr
om w
ww
.hsr
cpre
ss.a
c.za

Chapter 4
53
or strongly disagreed to the statements that, ‘There is a cure for HIV/AIDS’; ‘AIDS can be caused by witchcraft’; and ‘AIDS can be cured by having sex with a virgin’ and 0 to those who respond with agree or strongly agree or neutral. The higher the knowledge score, the better the knowledge. The findings are summarised in Table 4.22.
Table 4.22: General knowledge (scores) on HIV/AIDS by respondent characteristics
Variable n *Score SD
Overall 601 5.5 2.2
Sex of respondent
Male 306 5.7 2.2
Female 295 5.3 2.2
p=0.570
Sector
Communal 311 5.8 2.2
Resettlement 149 5.2 2.4
Large-scale commercial 49 5.4 2.3
Small-scale commercial 33 4.2 2.1
Urban 59 5.9 1.3
p < 0.001
Level of education reached
No schooling 4 3.3 3.6
Primary school 526 5.5 2.2
Secondary school 70 5.9 2.0
p=0.087
* Maximum score was 8
Overall, mean knowledge score (SD) was 5.5 (2.2). Significant differences in knowledge were observed between sectors, with urban and communal having the highest scores (Table 4.22). The mean knowledge scores increased with increasing levels of education.
4.4.10.2. Knowledge on HIV transmissionRegarding HIV transmission methods, scores were developed on a number of statements. Neutral responses reflected uncertainty. Incorrect responses were scored 0 for those who had agreed + strongly agreed or disagreed + strongly disagreed depending on the statement whereas correct responses were scored 1. There was a total of 14 statements giving a maximum possible score of 14. Table 4.23 summarises the knowledge scores on transmission.
Free
dow
nloa
d fr
om w
ww
.hsr
cpre
ss.a
c.za
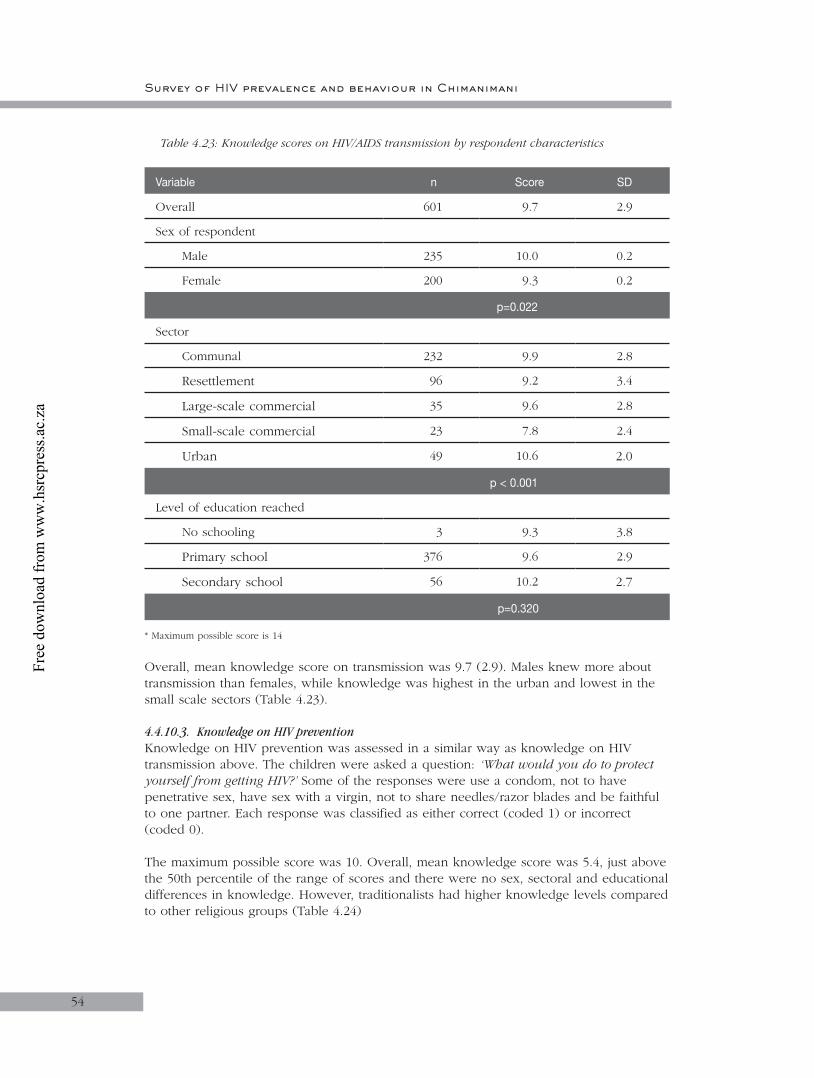
Survey of HIV prevalence and behaviour in Chimanimani
54
Table 4.23: Knowledge scores on HIV/AIDS transmission by respondent characteristics
Variable n Score SD
Overall 601 9.7 2.9
Sex of respondent
Male 235 10.0 0.2
Female 200 9.3 0.2
p=0.022
Sector
Communal 232 9.9 2.8
Resettlement 96 9.2 3.4
Large-scale commercial 35 9.6 2.8
Small-scale commercial 23 7.8 2.4
Urban 49 10.6 2.0
p < 0.001
Level of education reached
No schooling 3 9.3 3.8
Primary school 376 9.6 2.9
Secondary school 56 10.2 2.7
p=0.320
* Maximum possible score is 14
Overall, mean knowledge score on transmission was 9.7 (2.9). Males knew more about transmission than females, while knowledge was highest in the urban and lowest in the small scale sectors (Table 4.23).
4.4.10.3. Knowledge on HIV prevention Knowledge on HIV prevention was assessed in a similar way as knowledge on HIV transmission above. The children were asked a question: ‘What would you do to protect yourself from getting HIV?’ Some of the responses were use a condom, not to have penetrative sex, have sex with a virgin, not to share needles/razor blades and be faithful to one partner. Each response was classified as either correct (coded 1) or incorrect (coded 0).
The maximum possible score was 10. Overall, mean knowledge score was 5.4, just above the 50th percentile of the range of scores and there were no sex, sectoral and educational differences in knowledge. However, traditionalists had higher knowledge levels compared to other religious groups (Table 4.24)
Free
dow
nloa
d fr
om w
ww
.hsr
cpre
ss.a
c.za
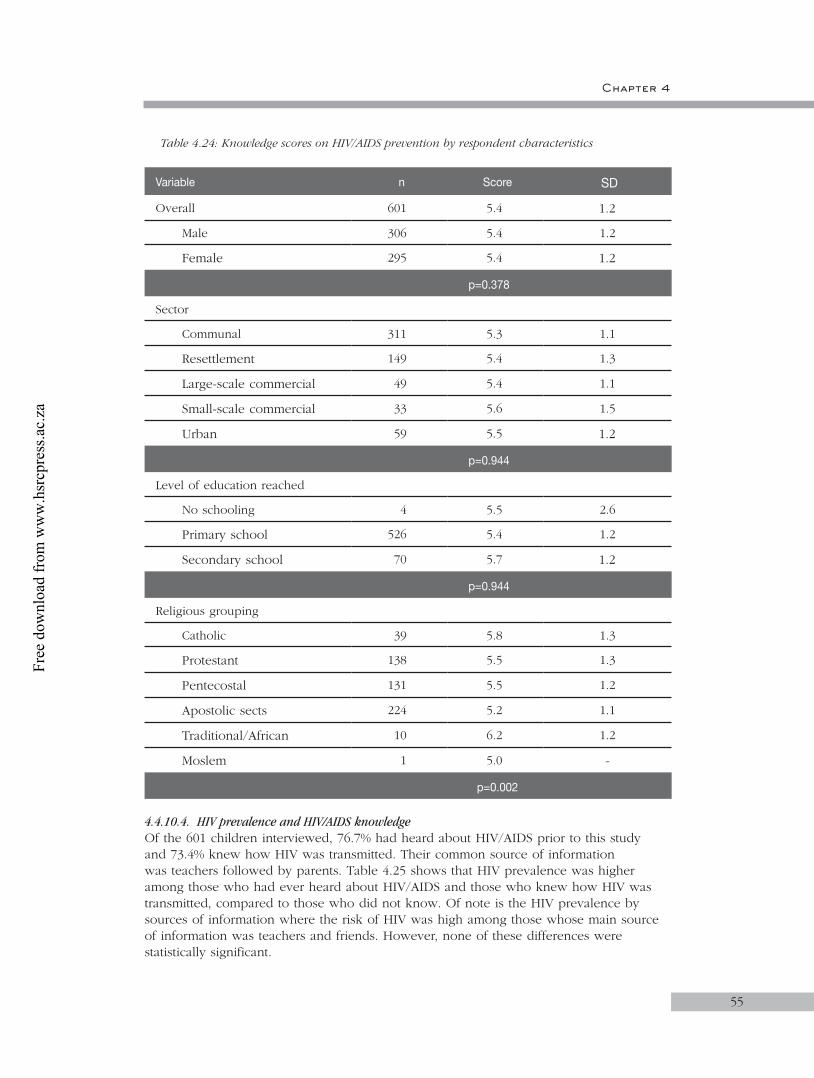
Chapter 4
55
Table 4.24: Knowledge scores on HIV/AIDS prevention by respondent characteristics
Variable n Score SD
Overall 601 5.4 1.2
Male 306 5.4 1.2
Female 295 5.4 1.2
p=0.378
Sector
Communal 311 5.3 1.1
Resettlement 149 5.4 1.3
Large-scale commercial 49 5.4 1.1
Small-scale commercial 33 5.6 1.5
Urban 59 5.5 1.2
p=0.944
Level of education reached
No schooling 4 5.5 2.6
Primary school 526 5.4 1.2
Secondary school 70 5.7 1.2
p=0.944
Religious grouping
Catholic 39 5.8 1.3
Protestant 138 5.5 1.3
Pentecostal 131 5.5 1.2
Apostolic sects 224 5.2 1.1
Traditional/African 10 6.2 1.2
Moslem 1 5.0 -
p=0.002
4.4.10.4. HIV prevalence and HIV/AIDS knowledgeOf the 601 children interviewed, 76.7% had heard about HIV/AIDS prior to this study and 73.4% knew how HIV was transmitted. Their common source of information was teachers followed by parents. Table 4.25 shows that HIV prevalence was higher among those who had ever heard about HIV/AIDS and those who knew how HIV was transmitted, compared to those who did not know. Of note is the HIV prevalence by sources of information where the risk of HIV was high among those whose main source of information was teachers and friends. However, none of these differences were statistically significant.
Free
dow
nloa
d fr
om w
ww
.hsr
cpre
ss.a
c.za
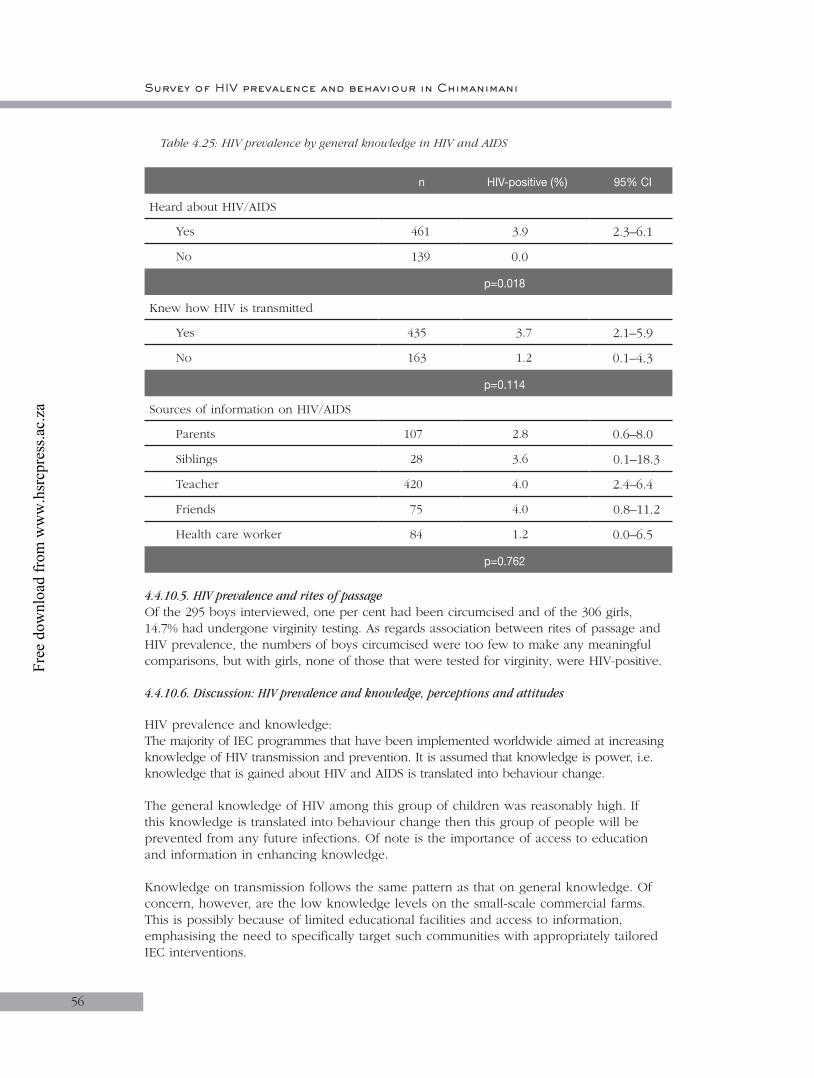
Survey of HIV prevalence and behaviour in Chimanimani
56
Table 4.25: HIV prevalence by general knowledge in HIV and AIDS
n HIV-positive (%) 95% CI
Heard about HIV/AIDS
Yes 461 3.9 2.3–6.1
No 139 0.0
p=0.018
Knew how HIV is transmitted
Yes 435 3.7 2.1–5.9
No 163 1.2 0.1–4.3
p=0.114
Sources of information on HIV/AIDS
Parents 107 2.8 0.6–8.0
Siblings 28 3.6 0.1–18.3
Teacher 420 4.0 2.4–6.4
Friends 75 4.0 0.8–11.2
Health care worker 84 1.2 0.0–6.5
p=0.762
4.4.10.5. HIV prevalence and rites of passageOf the 295 boys interviewed, one per cent had been circumcised and of the 306 girls, 14.7% had undergone virginity testing. As regards association between rites of passage and HIV prevalence, the numbers of boys circumcised were too few to make any meaningful comparisons, but with girls, none of those that were tested for virginity, were HIV-positive.
4.4.10.6. Discussion: HIV prevalence and knowledge, perceptions and attitudes
HIV prevalence and knowledge:The majority of IEC programmes that have been implemented worldwide aimed at increasing knowledge of HIV transmission and prevention. It is assumed that knowledge is power, i.e. knowledge that is gained about HIV and AIDS is translated into behaviour change.
The general knowledge of HIV among this group of children was reasonably high. If this knowledge is translated into behaviour change then this group of people will be prevented from any future infections. Of note is the importance of access to education and information in enhancing knowledge.
Knowledge on transmission follows the same pattern as that on general knowledge. Of concern, however, are the low knowledge levels on the small-scale commercial farms. This is possibly because of limited educational facilities and access to information, emphasising the need to specifically target such communities with appropriately tailored IEC interventions.
Free
dow
nloa
d fr
om w
ww
.hsr
cpre
ss.a
c.za

Chapter 4
57
The findings of this study suggest that awareness about HIV and AIDS is not necessarily related to risk perception and self-protection behaviour. Alternatively, the knowledge of HIV and AIDS is preceded by risky sexual activity. Teachers have been mandated to teach health education in schools, on the assumption that they have adequate and correct information in this area. The tendency for higher prevalence among those whose sources of information are teachers and friends needs further analysis. It is possible that sexually active pupils may more freely associate with teachers than those pupils who are sexually naïve. On the other hand, the existence of sexual networks between teachers and students has been highlighted as one of the major factors fuelling the epidemic among young girls in Zimbabwe (ZHDR 2003).
4.4.11. Awareness of HIV/AIDS services
4.4.11.1. PreventionChildren were asked if they knew of any HIV/AIDS care services in their community. Table 4.26 shows that 23.2% of the children knew about HIV/AIDS care services in their community, and there were no significant knowledge differences by sex and education. However, knowledge of services was significantly higher in urban and small-scale than other sectors.
Table 4.26: Knowledge of availability of HIV/AIDS care services
Variable n Yes %
Overall 601 23.2
Sex of respondent
Male 306 23.5
Female 295 22.7
p=0.795
Sector
Communal 310 19.4
Resettlement 149 19.5
Large-scale commercial 49 26.5
Small-scale commercial 33 48.5
Urban 59 35.6
p < 0.001
Level of education
No schooling 4 25.0
Primary school 526 23.6
Secondary school 70 20.0
p=0.794
Free
dow
nloa
d fr
om w
ww
.hsr
cpre
ss.a
c.za
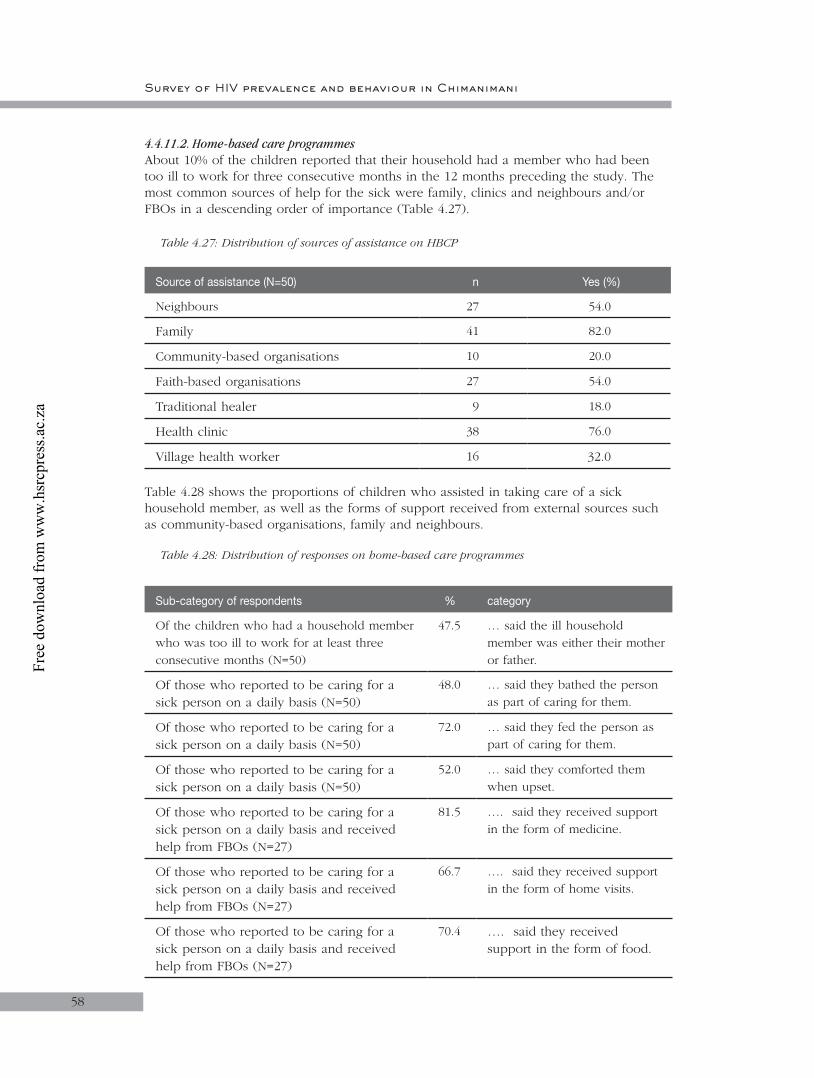
Survey of HIV prevalence and behaviour in Chimanimani
58
4.4.11.2. Home-based care programmesAbout 10% of the children reported that their household had a member who had been too ill to work for three consecutive months in the 12 months preceding the study. The most common sources of help for the sick were family, clinics and neighbours and/or FBOs in a descending order of importance (Table 4.27).
Table 4.27: Distribution of sources of assistance on HBCP
Source of assistance (N=50) n Yes (%)
Neighbours 27 54.0
Family 41 82.0
Community-based organisations 10 20.0
Faith-based organisations 27 54.0
Traditional healer 9 18.0
Health clinic 38 76.0
Village health worker 16 32.0
Table 4.28 shows the proportions of children who assisted in taking care of a sick household member, as well as the forms of support received from external sources such as community-based organisations, family and neighbours.
Table 4.28: Distribution of responses on home-based care programmes
Sub-category of respondents % category
Of the children who had a household member who was too ill to work for at least three consecutive months (N=50)
47.5 … said the ill household member was either their mother or father.
Of those who reported to be caring for a sick person on a daily basis (N=50)
48.0 … said they bathed the person as part of caring for them.
Of those who reported to be caring for a sick person on a daily basis (N=50)
72.0 … said they fed the person as part of caring for them.
Of those who reported to be caring for a sick person on a daily basis (N=50)
52.0 … said they comforted them when upset.
Of those who reported to be caring for a sick person on a daily basis and received help from FBOs (N=27)
81.5 …. said they received support in the form of medicine.
Of those who reported to be caring for a sick person on a daily basis and received help from FBOs (N=27)
66.7 …. said they received support in the form of home visits.
Of those who reported to be caring for a sick person on a daily basis and received help from FBOs (N=27)
70.4 …. said they received support in the form of food.
Free
dow
nloa
d fr
om w
ww
.hsr
cpre
ss.a
c.za
Chapter 4
59
4.4.11.3. Discussion: Awareness of HIV and AIDS servicesThat only a fifth of the children who needed help were supported by CBOs is a cause for concern. Having a small proportion receiving support from the community means that the community has not managed to adopt HBCP as its programme and there is need for community sensitisation on HBCP. Though the CBOs have not contributed much to the HBCP, other members of the community such as families, neighbours, village health workers and health clinics have played a vital role in the HBCP.
4.5. Conclusions
The study sought to determine the magnitude of HIV infection among children aged 12–14 years and relate the prevalence to various demographic, socio-cultural, economic and behavioural variables in order to understand the dynamics of the epidemic. The BSS further aimed at informing implementers in developing and/or strengthening strategies and interventions to prevent transmission, care for the sick and orphans and to mitigate the impact of the epidemic at community and individual levels.
The households considered for the study were randomly selected in the whole district, thus providing a sample representative of the whole community in Chimanimani district. Several conclusions can be drawn from the findings of this part of the overall study.
Socio-demographic profile of children
• The demographic profile of the children closely resembles that determined by the BRTI/NIHR OVC Census (2003) as well as the national profile (CSO, 2002).
• The majority of respondents were of the Apostolic sect. Thus, HIV/AIDS programmes need to be cognisant of the religions’ beliefs and myths in shaping perceptions, attitudes and practices with regards to education on HIV and AIDS.
• A significant proportion of children were not attending school for reasons not elucidated. Possible reasons include poverty, access and religious affiliation.
• More orphans had missed school compared to non-orphans. This suggests that orphanhood has an impact on school attendance.
• There is a significant orphan problem in the district. The higher proportion of paternal orphanhood implies that more men than women are dying.
• Most households reported that they did not have enough money for basic needs, thus poverty is a major problem in the community. The impact of poverty, in particular the gendered aspects, on access and acceptance of interventions should be considered.
Knowledge about HIV and AIDS
• Sectors and religious groupings were major determinants of knowledge.
Risk factors for children
• Despite the less than desirable economic status of most households, and the fact that some family members reportedly consumed alcohol, guardians/parents appear to be providing adequate protection to their children.
• Furthermore, a significant proportion, albeit low, of the guardians reportedly discussed issues of sexuality with their children. Important to note is that these discussions were reinforced by external sources.
Free
dow
nloa
d fr
om w
ww
.hsr
cpre
ss.a
c.za
60
HIV prevalence among children
• Though most children infected perinatally die before they celebrate their fifth birthday, infections in this age group can still be attributed to mother-to-child-transmission. The other possible routes of transmission are through needle sticks/injections in hospital, transfusion and sexual abuse. While there was no evidence of sexual abuse in the present study, of note is that though not significant, HIV prevalence was higher among female children. Whether selective MTCT occurs is not known.
• HIV prevalence was higher among children from the urban sector, reflecting the higher prevalence recorded among pregnant women (MOHCW, 2002) as well as among the 15+ year olds from urban Chimanimani (see Chapter 5).
• Similarly, the higher prevalence among non-orphans simply suggests that from birth children can live for a long time with the virus and a large number of parents are living with HIV/AIDS in the district.
• HIV and AIDS are major causes of morbidity among children.
4.6. Recommendations
• Medical management of HIV and AIDS in children should be considered urgently, in view of the fact that ARVs are not currently available, in particular child formulations.
• Psychosocial support systems for OVC in general, and HIV infected children in particular, should be established and/or strengthened.
• Prevention of MTCT should be strengthened through various strategies, including meaningful involvement of men and ensuring that ARVs are available and used.
• Interventions to enhance awareness and knowledge about HIV/AIDS among the adult population should be strengthened, particularly in the urban and rural areas of the district.
• HIV/AIDS messages should include child caring practices, as these can be predisposing factors to HIV/AIDS.
Survey of HIV prevalence and behaviour in Chimanimani
Free
dow
nloa
d fr
om w
ww
.hsr
cpre
ss.a
c.za

61
CHAPTER 5
5. Results for age group 15–24 years
5.1. Introduction
This chapter focuses on the age group 15–24, describing general characteristics and associations with HIV prevalence in an attempt to forge a better understanding of the transmission dynamics of the epidemic in Chimanimani district. This age group represents youth and thus a pool of sexually maturing yet inexperienced young men and women. Vulnerability of this group, especially among females, is evident from previous observations in Zimbabwe that HIV prevalence among women aged 15–24 years ranged from 24.6 to 39.6%, compared to 9.9 to 14.9% for men in the same age cohort (UNICEF, 2003). The trend of more women than men being infected was recorded as early as the mid 1990s, reflecting a shift in the epidemiological profile some 10 years into the epidemic. A 2001 Zimbabwe Young Adult Survey found a prevalence of 22% and 10% among young female and male adults, aged 15–29 years respectively.
Several factors are attributed to transmission dynamics amongst youth. The higher prevalence among female youth has been explained by intergenerational sex, where young girls date older men for various reasons, chief among them being economic. However, reports of older women dating young boys for similar reasons have also been reported (ZHDR 2003). It is important that these be considered in the context of the socioeconomic and cultural environment in which people live. The ZHDR (2003) has attempted to dissect some of the fundamental determinants in Zimbabwe by describing how sexual networks evolve and become complex webs, exposing different people of different social classes and ages to transactional sexual liaisons.
5.2. Objectives
The objective of the report is to present the findings of a BSS conducted among youth 15–24 years of age in Chimanimani district, Zimbabwe. The findings are predominantly a characterisation of the age group with regards demographic, social, economic and behavioural factors. Bivariate associations of these factors with HIV prevalence are presented where applicable.
5.3. Methodology
The methodology applied is discussed in Chapter 3. In brief, the generic questionnaire was adapted for the 15–24 age group. The questionnaire was administered after informed consent from the respondent. Blood was collected as spots of filter paper (DBS). Details of HIV testing are described in Chapter 2.
5.3.1. Data analysis
Simple descriptive statistics were employed to characterise the study population. The Chi-square test was used to assess the relationship between HIV prevalence and various factors. The main variables assessed were: demographic characteristics; household economic situation; knowledge and perceptions of HIV/AIDS; practice of circumcision among males and chastity/virginity testing among females; the initiation of intimate relationships; the sexual experiences and practices of the youth; the sexual partners of the
Free
dow
nloa
d fr
om w
ww
.hsr
cpre
ss.a
c.za

Survey of HIV prevalence and behaviour in Chimanimani
6262
youth; the perceptions of risk and vulnerability of youth to HIV infection; drug use and alcohol consumption; and awareness of services, among others.
5.3 Study sample
Table 5.1 shows that a total of 966 potential respondents were approached and of these, 730 (75.6%) completed the questionnaire and provided a blood sample for HIV testing. The refusal rate was 2.8%. For this age group, the response rate was based on the proportion of sampled respondents who provided both the questionnaire and a blood sample.
Table 5.1: Distribution of response rate
Response rate
n %
Completed questionnaire with sample 730 75.6
Target respondent not at home 209 21.6
Refusals (sample + questionnaire) 27 2.8
Total questionnaires 966
Calculation of response rate
Response rate = Complete questionnaires with a sample
___________________________________________ Total questionnaires + refusals + respondents not at home
= 730 ____
966 100 = 75.6%
Of the 730 respondents who provided completed questionnaires and blood samples, 17 (2.3%) had insufficient samples for HIV testing. The results that follow were based on the 713 respondents with complete questionnaires and sufficient samples.
5.4. Results
5.4.1. Socio-demographic characteristics
The demographic characteristics of respondents are summarised in Table 5.2. The table shows that all the respondents were Africans and just over half of them (54.8%) were females. Mean age was 19.5 (SD = 3.0) years and 57.8% of the respondents were in the 19–24 age group. Almost two thirds of respondents were single/never married. The most common religion was the Apostolic Sect.
Free
dow
nloa
d fr
om w
ww
.hsr
cpre
ss.a
c.za

Chapter 5
63
Table 5.2: Demographic and basic characteristics of the sample
Demographic variable n %
Sex N=713
Male 322 45.2
Female 391 54.8
Nationality
Zimbabwean 706 99.0
Non-Zimbabwean 7 1.0
Age (years)
15–18 301 42.2
19–24 412 57.8
Marital Status N=706
Married 207 29.3
Single/never married 466 66.0
Living together/cohabiting 9 1.3
Divorced/separated 20 2.8
Widowed 4 0.6
Religion/denomination N=635
Catholic 34 5.4
Protestant 142 22.4
Pentecostal 182 28.7
Apostolic sects 254 40.0
Moslem 4 0.6
Traditional/African 18 2.8
Other 1 0.2
Highest educational qualifications
No schooling 8 1.1
Primary school 200 28.0
Secondary school 496 69.6
Tertiary non-degreed 9 1.3
➔
Free
dow
nloa
d fr
om w
ww
.hsr
cpre
ss.a
c.za
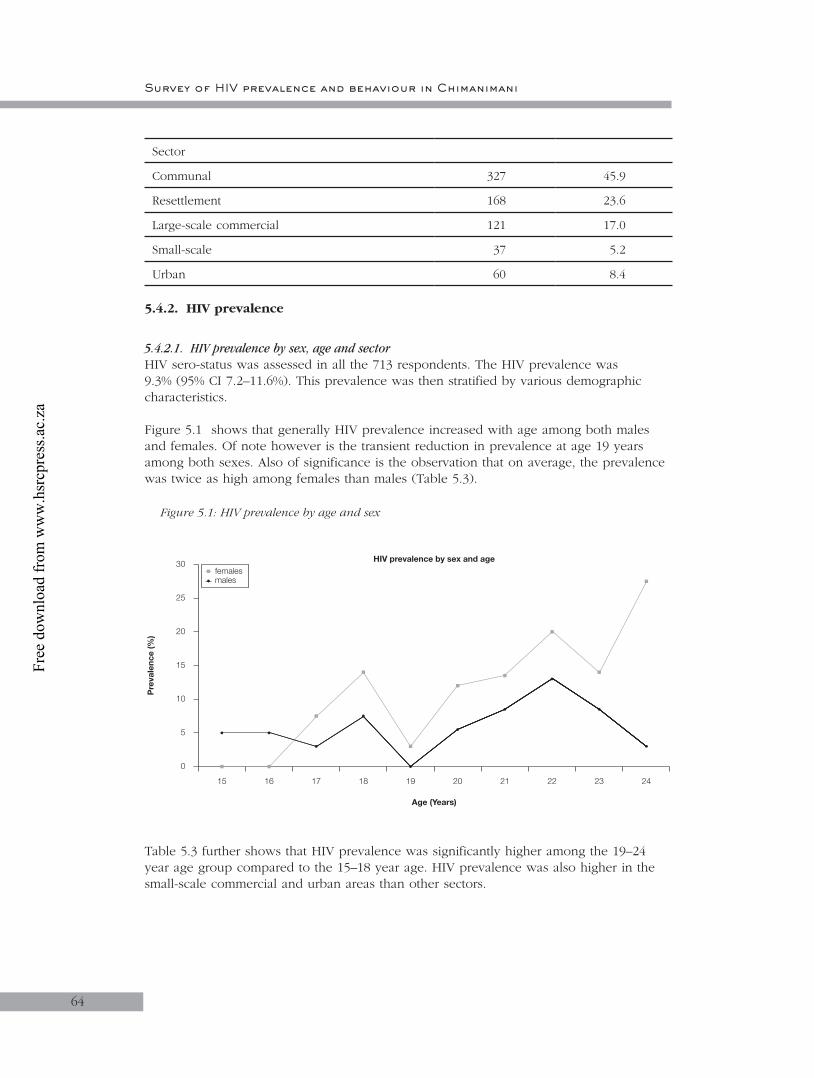
Survey of HIV prevalence and behaviour in Chimanimani
64
Sector
Communal 327 45.9
Resettlement 168 23.6
Large-scale commercial 121 17.0
Small-scale 37 5.2
Urban 60 8.4
5.4.2. HIV prevalence
5.4.2.1. HIV prevalence by sex, age and sectorHIV sero-status was assessed in all the 713 respondents. The HIV prevalence was 9.3% (95% CI 7.2–11.6%). This prevalence was then stratified by various demographic characteristics.
Figure 5.1 shows that generally HIV prevalence increased with age among both males and females. Of note however is the transient reduction in prevalence at age 19 years among both sexes. Also of significance is the observation that on average, the prevalence was twice as high among females than males (Table 5.3).
Figure 5.1: HIV prevalence by age and sex
15
Age (Years)
Pre
vale
nce
(%)
0
5
10
15
20
25
30
16 17 18 19 20 21 22 23 24
femalesmales
HIV prevalence by sex and age
Table 5.3 further shows that HIV prevalence was significantly higher among the 19–24 year age group compared to the 15–18 year age. HIV prevalence was also higher in the small-scale commercial and urban areas than other sectors.
Free
dow
nloa
d fr
om w
ww
.hsr
cpre
ss.a
c.za

Chapter 5
6565
Table 5.3: HIV prevalence by sex, age group and sector
N HIV-positive 95% CI
n (%)
Total 713 66 9.3 7.2–11.6
Sex
Male 322 18 5.6 3.3–8.7
Female 391 48 12.3 9.2–15.9
Age Group
15–18 301 16 5.3 3.1–8.5
19–24 412 50 12.1 9.1–15.7
Sector
Communal 327 27 8.3 5.5–11.8
Resettlement 168 14 8.3 4.6–13.6
Large-scale commercial 121 10 8.3 4.0–14.7
Small-scale commercial 37 6 16.2 6.2–32.0
Urban 60 9 15.0 7.1–26.6
HIV prevalence did not differ among males and females in the 15–18 age group but was more than twice as high among females (16.1%; 95% CI: 11.8–21.3) compared to males (5.6%; 95% CI:2.4–10.7) in the 19–24 age group. HIV prevalence was highest in the small-scale commercial farming and urban areas in the 19–24 years age group.
5.4.2.2. HIV prevalence by marital statusAlthough sub-sample sizes were too small for some categories of marital status to allow statistical comparision, HIV prevalence was higher among females who were widowed and those cohabiting. Prevalence was lowest among those who were single/never married. A similar trend was observed among males (Table 5.4).
Table 5.4: HIV prevalence by marital status
Marital Status MALES FEMALES
N n (%) N n (%)
Married 35 4 (11.4) 172 32 (18.6)
Single/never married 279 13 (4.7) 187 7 (3.7)
Living together, cohabiting – – 9 3 (33.3)
Divorced/separated 3 1 (33.3) 17 3 (17.7)
Widowed – – 4 3 (75.0)
Free
dow
nloa
d fr
om w
ww
.hsr
cpre
ss.a
c.za
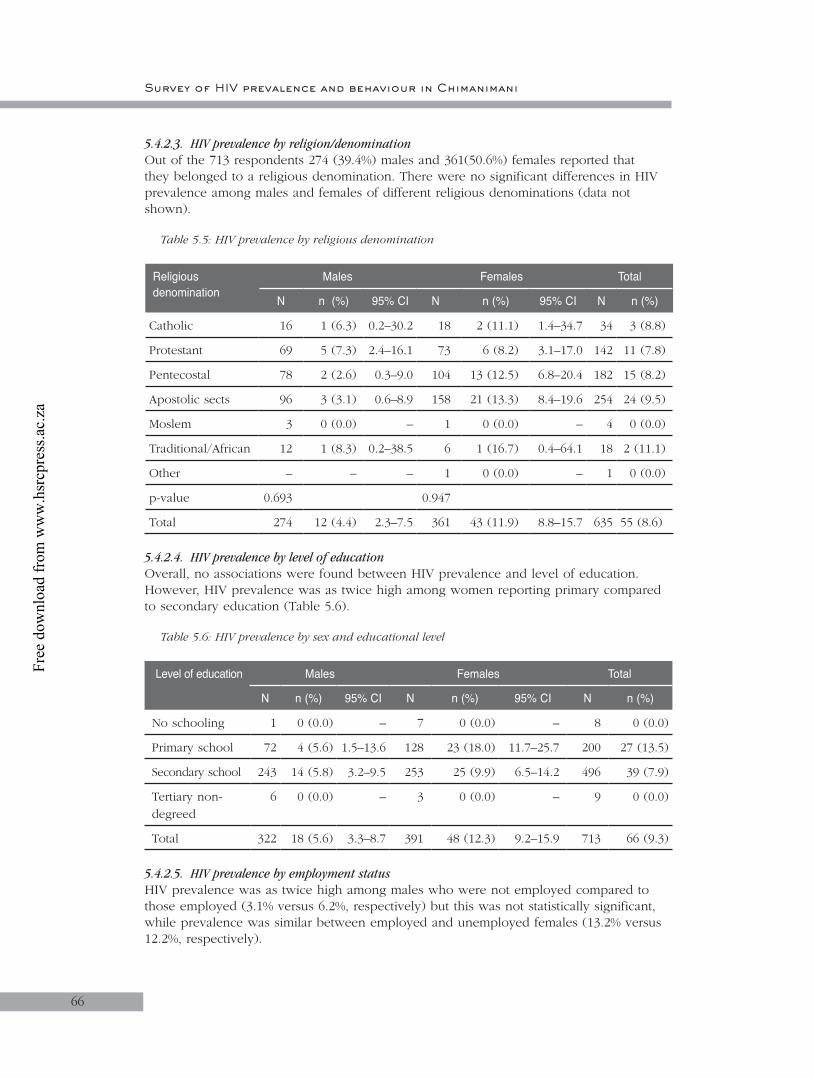
Survey of HIV prevalence and behaviour in Chimanimani
5.4.2.3. HIV prevalence by religion/denominationOut of the 713 respondents 274 (39.4%) males and 361(50.6%) females reported that they belonged to a religious denomination. There were no significant differences in HIV prevalence among males and females of different religious denominations (data not shown).
Table 5.5: HIV prevalence by religious denomination
Religious denomination
Males Females Total
N n (%) 95% CI N n (%) 95% CI N n (%)
Catholic 16 1 (6.3) 0.2–30.2 18 2 (11.1) 1.4–34.7 34 3 (8.8)
Protestant 69 5 (7.3) 2.4–16.1 73 6 (8.2) 3.1–17.0 142 11 (7.8)
Pentecostal 78 2 (2.6) 0.3–9.0 104 13 (12.5) 6.8–20.4 182 15 (8.2)
Apostolic sects 96 3 (3.1) 0.6–8.9 158 21 (13.3) 8.4–19.6 254 24 (9.5)
Moslem 3 0 (0.0) – 1 0 (0.0) – 4 0 (0.0)
Traditional/African 12 1 (8.3) 0.2–38.5 6 1 (16.7) 0.4–64.1 18 2 (11.1)
Other – – – 1 0 (0.0) – 1 0 (0.0)
p-value 0.693 0.947
Total 274 12 (4.4) 2.3–7.5 361 43 (11.9) 8.8–15.7 635 55 (8.6)
5.4.2.4. HIV prevalence by level of educationOverall, no associations were found between HIV prevalence and level of education. However, HIV prevalence was as twice high among women reporting primary compared to secondary education (Table 5.6).
Table 5.6: HIV prevalence by sex and educational level
Level of education Males Females Total
N n (%) 95% CI N n (%) 95% CI N n (%)
No schooling 1 0 (0.0) – 7 0 (0.0) – 8 0 (0.0)
Primary school 72 4 (5.6) 1.5–13.6 128 23 (18.0) 11.7–25.7 200 27 (13.5)
Secondary school 243 14 (5.8) 3.2–9.5 253 25 (9.9) 6.5–14.2 496 39 (7.9)
Tertiary non-degreed
6 0 (0.0) – 3 0 (0.0) – 9 0 (0.0)
Total 322 18 (5.6) 3.3–8.7 391 48 (12.3) 9.2–15.9 713 66 (9.3)
5.4.2.5. HIV prevalence by employment statusHIV prevalence was as twice high among males who were not employed compared to those employed (3.1% versus 6.2%, respectively) but this was not statistically significant, while prevalence was similar between employed and unemployed females (13.2% versus 12.2%, respectively).
66
Free
dow
nloa
d fr
om w
ww
.hsr
cpre
ss.a
c.za

Chapter 5
5.4.2.6. HIV prevalence by standard of livingThe majority (60.9%) of respondents reported that they did not have enough money for basics such as food and clothes and only 37.3% could afford a few luxuries. There was no association between household economic situation and HIV prevalence among males and females. However, there was a trend, albeit insignificant, towards decreasing prevalence with improvement in household economic situation among males (Table 5.7)
Table 5.7: HIV prevalence by standard of living
Standard of living Males Females
N n (%) p N n (%) p
Not enough money for basics 206 13 (6.3) 228 28 (12.3)
Have basics, short of other things 60 3 (5.0) 94 13 (13.8) 0.811
Money for holidays and luxury goods 54 2 (3.7) 0.867 62 7 (11.3)
None of the above 2 0 (0.0) 5 0 (0.0)
5.4.2.7. Orphanhood and HIV prevalenceOrphanhood status was defined and assessed in the 15–18 age group. The prevalence of orphanhood was 36.9%. The distribution of these adolescents by orphanhood status is shown in Figure 5.2. As observed among the 2–11 and 12–14 age groups, most orphans had lost a father.
Figure 5.2: Orphanhood status in the 15–18 age group
1% 4%
24%
9%62%
Maternal orphansPaternal orphansDoubleorphansBoth parents aliveNot known
Table 5.8 shows HIV prevalence by orphanhood status. Overall prevalence was slightly higher among orphans than non-orphans.
67
Free
dow
nloa
d fr
om w
ww
.hsr
cpre
ss.a
c.za

Survey of HIV prevalence and behaviour in Chimanimani
Table 5.8: HIV prevalence by orphanhood status and sex
Parental status Males Females Total
N n (%) N n (%) N n (%)
Mother alive 271 13 (4.8) 334 605 52 (8.6)
Mother not alive 48 4 (8.3) 56 8 (14.3) 104 12 (11.5)
p=0.315 p=0.579 p=0.333
Father alive 207 10 (4.8) 264 471 40 (8.5)
Father not alive 110 7 (6.4) 125 18 (14.4) 235 25 (10.6)
p=0.564 p=0.395 p=0.353
Mother dead 11 1 (9.1) 28 4 (14.3) 39 5 (12.8)
Father dead 73 4 (5.5) 97 14 (14.4) 170 18 (10.6)
Both parents dead 37 3 (8.1) 28 4 (14.3) 65 7 (10.8)
Both parents alive 197 9 (4.6) 238 26 (10.9) 435 35 (8.0)
Not known 4 1 (25.0) – – 4 1 (25.0)
p=0.238 p=0.691 p=0.547
5.4.2.8. HIV prevalence by dependency burdenAlmost a third (31.7%) of the respondents had dependants under the age of 18 years in their households. The mean number of children dependent on youth was 2.3. No associations were found between having dependants and HIV prevalence (data not shown).
5.4.2.9. Discussion
HIV prevalence by age and sex:Males and females of the same age are exposed to different levels of risk of HIV infection. This study has shown that risk of HIV infection was higher among females (12.3%) than males (5.6%), confirming findings from other studies done in Zimbabwe. UNAIDS estimates for 2001 show that HIV prevalence among women aged 15–24 years ranged from 24.6 to 39.6%, compared to 9.9 to 14.9% for men in the same age cohort (UNICEF, 2003).
HIV prevalence by sector:In this study, HIV prevalence was found to be high in the small-scale commercial and urban areas. Urban areas and small-scale commercial farms are usually characterised by the clustering of households, but also experience high mobility. A study in Manicaland showed that prevalence was highest in small towns (Gregson et al., 2002). These results are consistent with the current results where the prevalence among those in the 15–18 year age group was highest in urban areas followed by large-scale commercial and small-scale commercial areas. However, there is no obvious explanation for the low HIV prevalence in resettlement, large scale and communal areas.
68
Free
dow
nloa
d fr
om w
ww
.hsr
cpre
ss.a
c.za
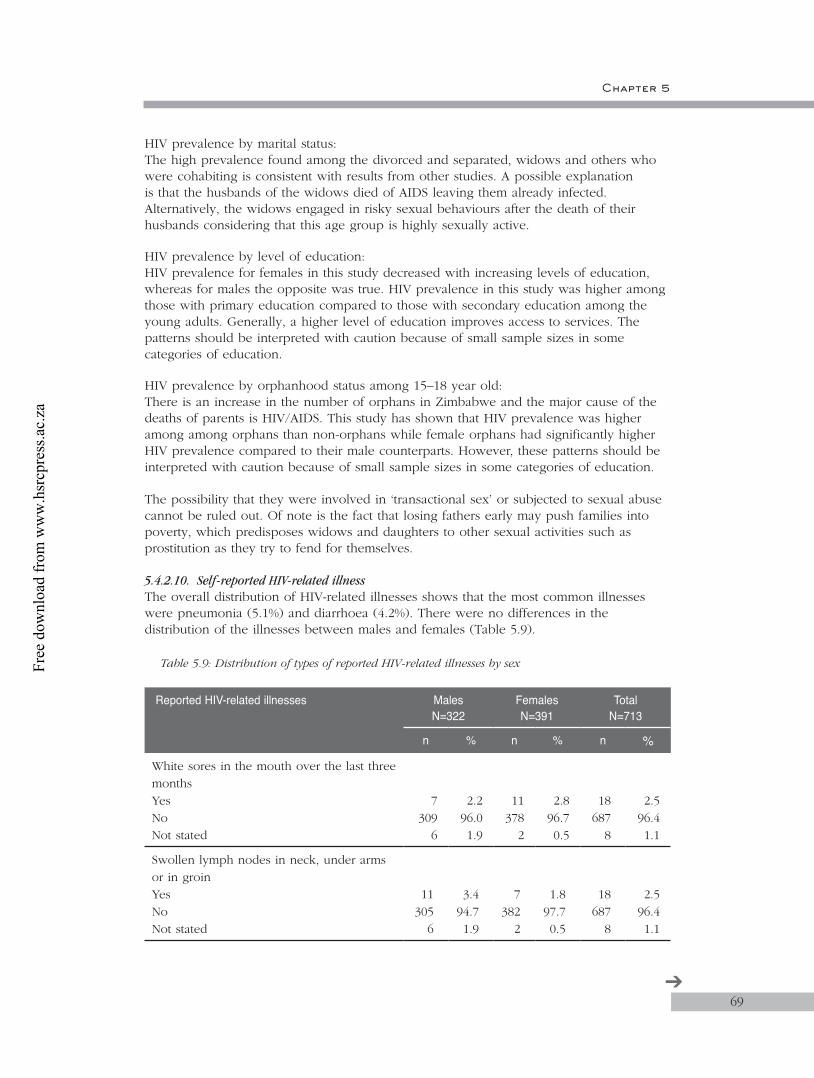
Chapter 5
HIV prevalence by marital status:The high prevalence found among the divorced and separated, widows and others who were cohabiting is consistent with results from other studies. A possible explanation is that the husbands of the widows died of AIDS leaving them already infected. Alternatively, the widows engaged in risky sexual behaviours after the death of their husbands considering that this age group is highly sexually active.
HIV prevalence by level of education:HIV prevalence for females in this study decreased with increasing levels of education, whereas for males the opposite was true. HIV prevalence in this study was higher among those with primary education compared to those with secondary education among the young adults. Generally, a higher level of education improves access to services. The patterns should be interpreted with caution because of small sample sizes in some categories of education.
HIV prevalence by orphanhood status among 15–18 year old:There is an increase in the number of orphans in Zimbabwe and the major cause of the deaths of parents is HIV/AIDS. This study has shown that HIV prevalence was higher among among orphans than non-orphans while female orphans had significantly higher HIV prevalence compared to their male counterparts. However, these patterns should be interpreted with caution because of small sample sizes in some categories of education.
The possibility that they were involved in ‘transactional sex’ or subjected to sexual abuse cannot be ruled out. Of note is the fact that losing fathers early may push families into poverty, which predisposes widows and daughters to other sexual activities such as prostitution as they try to fend for themselves.
5.4.2.10. Self-reported HIV-related illnessThe overall distribution of HIV-related illnesses shows that the most common illnesses were pneumonia (5.1%) and diarrhoea (4.2%). There were no differences in the distribution of the illnesses between males and females (Table 5.9).
Table 5.9: Distribution of types of reported HIV-related illnesses by sex
Reported HIV-related illnesses MalesN=322
FemalesN=391
TotalN=713
n % n % n %
White sores in the mouth over the last three months YesNoNot stated
7309
6
2.296.01.9
11378
2
2.896.70.5
18687
8
2.596.41.1
Swollen lymph nodes in neck, under arms or in groin YesNoNot stated
11305
6
3.494.71.9
7382
2
1.897.70.5
18687
8
2.596.41.1
69➔
Free
dow
nloa
d fr
om w
ww
.hsr
cpre
ss.a
c.za

Survey of HIV prevalence and behaviour in Chimanimani
Treated for pneumonia more than once in the last year YesNoNot stated
14302
6
4.493.81.9
22367
2
5.693.90.5
36669
8
5.193.81.1
Had shingles/herpes zoster over the last 12 months YesNoNot stated
2314
6
0.697.51.9
3386
2
0.898.70.5
5700
8
0.798.21.1
Had diarrhoea that lasted for more than three days in the last three monthsYesNo Not stated
16300
6
5.093.21.9
14375
2
3.695.90.5
30675
8
4.294.71.1
As shown in Table 5.10, the prevalence of HIV was more than three times higher among respondents reporting history of herpes zoster compared to those who did not (p=0.056) Similarly, HIV prevalence was nearly twice as high among those reporting history of oral sores compared to those not reporting, but the difference was not statistically significant.
Table 5.10: HIV prevalence by types of reported HIV-related illnesses
Reported HIV-related illnessesHIV prevalence
N n (%) 95% CI
White sores in the mouth over the last three months YesNoNot stated
18687
8
3 (16.7)62 (9.0)1 (12.5)
3.6–41.47.0–11.40.3–52.7
Swollen lymph nodes in neck, under arms or in groin YesNoNot stated
18687
8
0 (0.0)65 (9.5)1 (12.5)
–7.4–11.90.3–52.7
Treated for pneumonia more than once in the last year YesNoNot stated
36669
8
4 (11.1)61 (9.1)1 (12.5)
3.1–26.17.0–11.60.3–52.7
Had shingles/herpes zoster over the last 12 months YesNoNot stated
5700
8
2 (40.0)63 (9.0)1 (12.5)
5.3–85.37.0–11.40.3–52.7
Had diarrhoea that lasted for more than three days in the last three monthsYesNo Not stated
30675
8
2 (6.7)63 (9.3)1 (12.5)
0.8–22.17.2–11.80.3–52.7
70
Free
dow
nloa
d fr
om w
ww
.hsr
cpre
ss.a
c.za
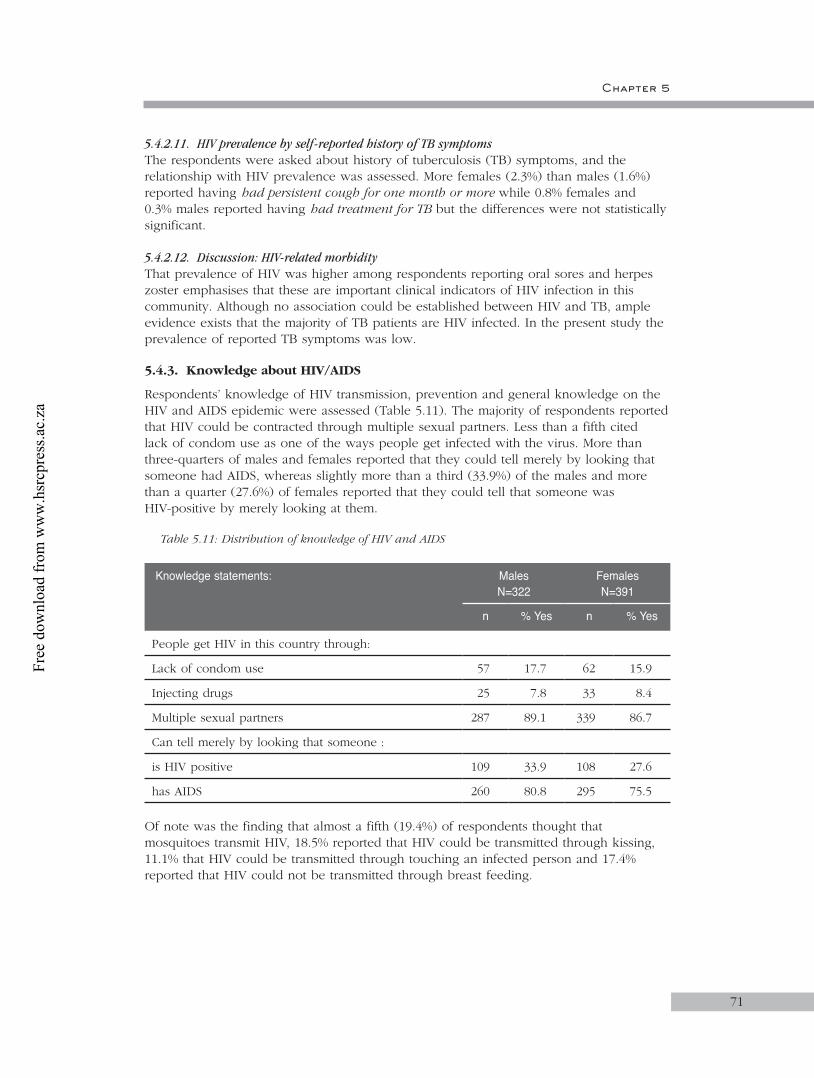
Chapter 5
5.4.2.11. HIV prevalence by self-reported history of TB symptomsThe respondents were asked about history of tuberculosis (TB) symptoms, and the relationship with HIV prevalence was assessed. More females (2.3%) than males (1.6%) reported having had persistent cough for one month or more while 0.8% females and 0.3% males reported having had treatment for TB but the differences were not statistically significant.
5.4.2.12. Discussion: HIV-related morbidityThat prevalence of HIV was higher among respondents reporting oral sores and herpes zoster emphasises that these are important clinical indicators of HIV infection in this community. Although no association could be established between HIV and TB, ample evidence exists that the majority of TB patients are HIV infected. In the present study the prevalence of reported TB symptoms was low.
5.4.3. Knowledge about HIV/AIDS
Respondents’ knowledge of HIV transmission, prevention and general knowledge on the HIV and AIDS epidemic were assessed (Table 5.11). The majority of respondents reported that HIV could be contracted through multiple sexual partners. Less than a fifth cited lack of condom use as one of the ways people get infected with the virus. More than three-quarters of males and females reported that they could tell merely by looking that someone had AIDS, whereas slightly more than a third (33.9%) of the males and more than a quarter (27.6%) of females reported that they could tell that someone was HIV-positive by merely looking at them.
Table 5.11: Distribution of knowledge of HIV and AIDS
Knowledge statements: Males N=322
FemalesN=391
n % Yes n % Yes
People get HIV in this country through:
Lack of condom use 57 17.7 62 15.9
Injecting drugs 25 7.8 33 8.4
Multiple sexual partners 287 89.1 339 86.7
Can tell merely by looking that someone :
is HIV positive 109 33.9 108 27.6
has AIDS 260 80.8 295 75.5
Of note was the finding that almost a fifth (19.4%) of respondents thought that mosquitoes transmit HIV, 18.5% reported that HIV could be transmitted through kissing, 11.1% that HIV could be transmitted through touching an infected person and 17.4% reported that HIV could not be transmitted through breast feeding.
71
Free
dow
nloa
d fr
om w
ww
.hsr
cpre
ss.a
c.za
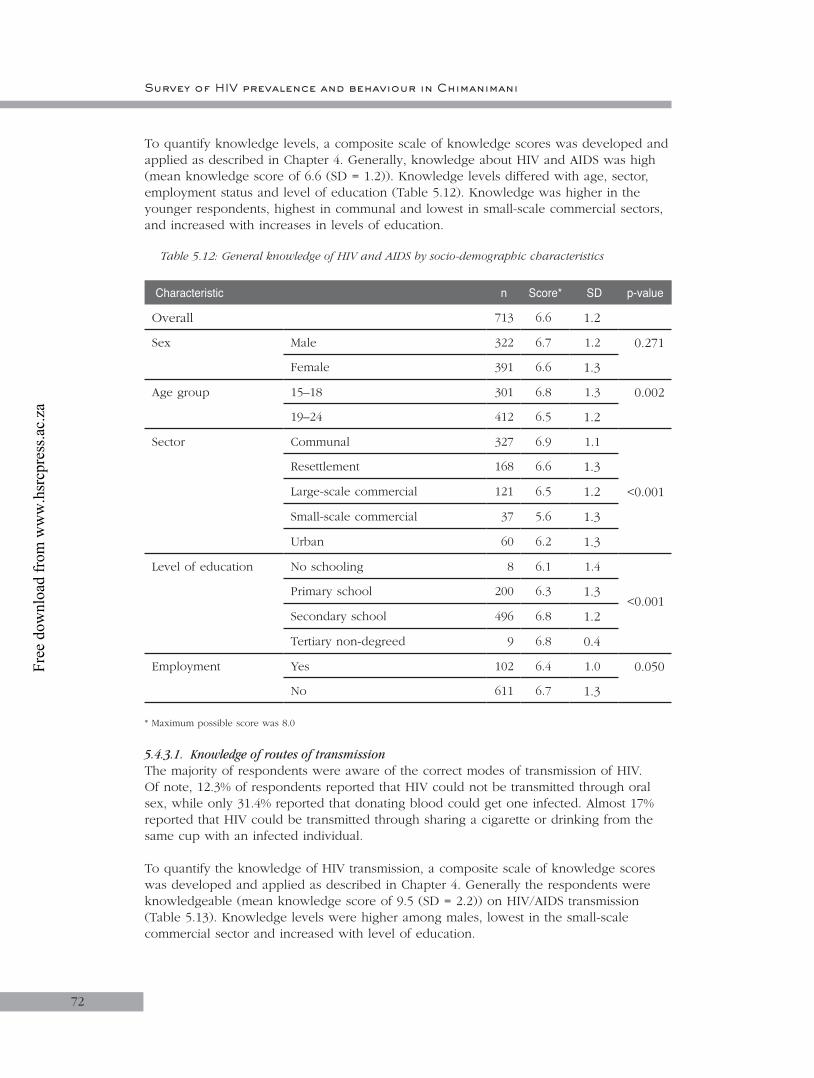
72
To quantify knowledge levels, a composite scale of knowledge scores was developed and applied as described in Chapter 4. Generally, knowledge about HIV and AIDS was high (mean knowledge score of 6.6 (SD = 1.2)). Knowledge levels differed with age, sector, employment status and level of education (Table 5.12). Knowledge was higher in the younger respondents, highest in communal and lowest in small-scale commercial sectors, and increased with increases in levels of education.
Table 5.12: General knowledge of HIV and AIDS by socio-demographic characteristics
Characteristic n Score* SD p-value
Overall 713 6.6 1.2
Sex Male 322 6.7 1.2 0.271
Female 391 6.6 1.3
Age group 15–18 301 6.8 1.3 0.002
19–24 412 6.5 1.2
Sector Communal 327 6.9 1.1
<0.001
Resettlement 168 6.6 1.3
Large-scale commercial 121 6.5 1.2
Small-scale commercial 37 5.6 1.3
Urban 60 6.2 1.3
Level of education No schooling 8 6.1 1.4
<0.001Primary school 200 6.3 1.3
Secondary school 496 6.8 1.2
Tertiary non-degreed 9 6.8 0.4
Employment Yes 102 6.4 1.0 0.050
No 611 6.7 1.3
* Maximum possible score was 8.0
5.4.3.1. Knowledge of routes of transmissionThe majority of respondents were aware of the correct modes of transmission of HIV. Of note, 12.3% of respondents reported that HIV could not be transmitted through oral sex, while only 31.4% reported that donating blood could get one infected. Almost 17% reported that HIV could be transmitted through sharing a cigarette or drinking from the same cup with an infected individual.
To quantify the knowledge of HIV transmission, a composite scale of knowledge scores was developed and applied as described in Chapter 4. Generally the respondents were knowledgeable (mean knowledge score of 9.5 (SD = 2.2)) on HIV/AIDS transmission (Table 5.13). Knowledge levels were higher among males, lowest in the small-scale commercial sector and increased with level of education.
72
Survey of HIV prevalence and behaviour in Chimanimani
Free
dow
nloa
d fr
om w
ww
.hsr
cpre
ss.a
c.za
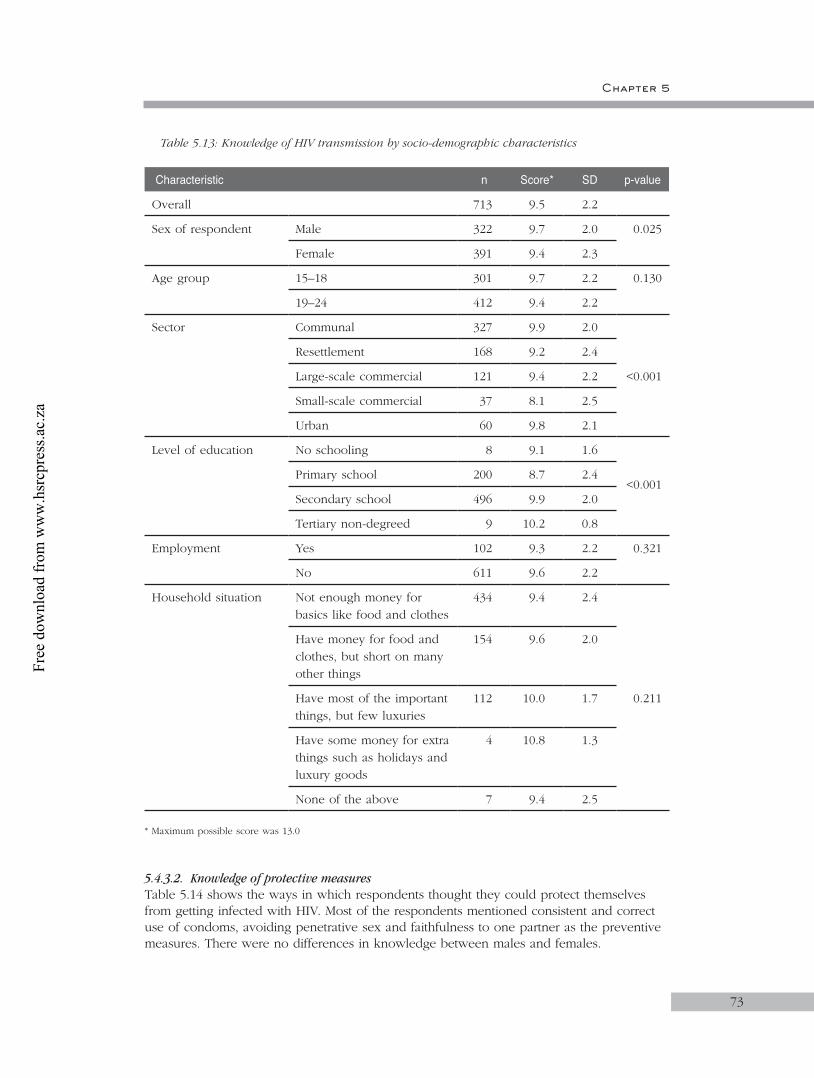
Chapter 5
Table 5.13: Knowledge of HIV transmission by socio-demographic characteristics
Characteristic n Score* SD p-value
Overall 713 9.5 2.2
Sex of respondent Male 322 9.7 2.0 0.025
Female 391 9.4 2.3
Age group 15–18 301 9.7 2.2 0.130
19–24 412 9.4 2.2
Sector Communal 327 9.9 2.0
<0.001
Resettlement 168 9.2 2.4
Large-scale commercial 121 9.4 2.2
Small-scale commercial 37 8.1 2.5
Urban 60 9.8 2.1
Level of education No schooling 8 9.1 1.6
<0.001Primary school 200 8.7 2.4
Secondary school 496 9.9 2.0
Tertiary non-degreed 9 10.2 0.8
Employment Yes 102 9.3 2.2 0.321
No 611 9.6 2.2
Household situation Not enough money for basics like food and clothes
434 9.4 2.4
0.211
Have money for food and clothes, but short on many other things
154 9.6 2.0
Have most of the important things, but few luxuries
112 10.0 1.7
Have some money for extra things such as holidays and luxury goods
4 10.8 1.3
None of the above 7 9.4 2.5
* Maximum possible score was 13.0
5.4.3.2. Knowledge of protective measuresTable 5.14 shows the ways in which respondents thought they could protect themselves from getting infected with HIV. Most of the respondents mentioned consistent and correct use of condoms, avoiding penetrative sex and faithfulness to one partner as the preventive measures. There were no differences in knowledge between males and females.
73
Free
dow
nloa
d fr
om w
ww
.hsr
cpre
ss.a
c.za
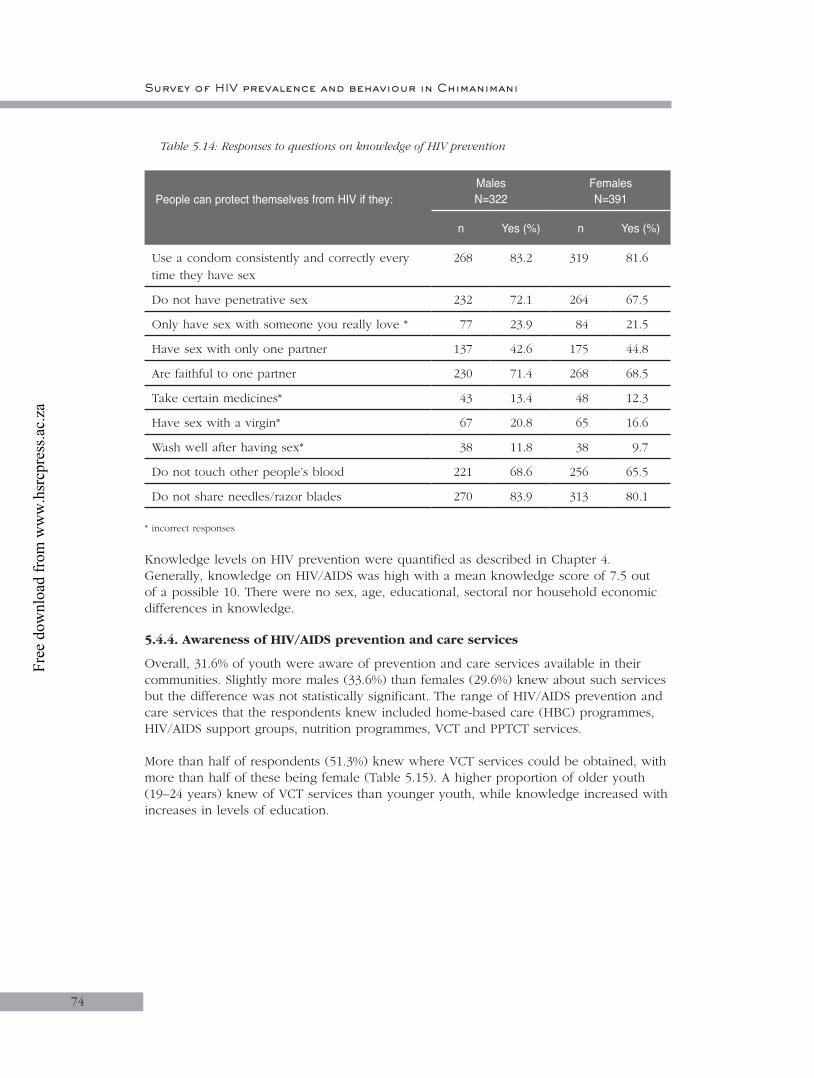
74
Table 5.14: Responses to questions on knowledge of HIV prevention
People can protect themselves from HIV if they: MalesN=322
FemalesN=391
n Yes (%) n Yes (%)
Use a condom consistently and correctly every time they have sex
268 83.2 319 81.6
Do not have penetrative sex 232 72.1 264 67.5
Only have sex with someone you really love * 77 23.9 84 21.5
Have sex with only one partner 137 42.6 175 44.8
Are faithful to one partner 230 71.4 268 68.5
Take certain medicines* 43 13.4 48 12.3
Have sex with a virgin* 67 20.8 65 16.6
Wash well after having sex* 38 11.8 38 9.7
Do not touch other people’s blood 221 68.6 256 65.5
Do not share needles/razor blades 270 83.9 313 80.1
* incorrect responses
Knowledge levels on HIV prevention were quantified as described in Chapter 4. Generally, knowledge on HIV/AIDS was high with a mean knowledge score of 7.5 out of a possible 10. There were no sex, age, educational, sectoral nor household economic differences in knowledge.
5.4.4. Awareness of HIV/AIDS prevention and care services
Overall, 31.6% of youth were aware of prevention and care services available in their communities. Slightly more males (33.6%) than females (29.6%) knew about such services but the difference was not statistically significant. The range of HIV/AIDS prevention and care services that the respondents knew included home-based care (HBC) programmes, HIV/AIDS support groups, nutrition programmes, VCT and PPTCT services.
More than half of respondents (51.3%) knew where VCT services could be obtained, with more than half of these being female (Table 5.15). A higher proportion of older youth (19–24 years) knew of VCT services than younger youth, while knowledge increased with increases in levels of education.
Survey of HIV prevalence and behaviour in Chimanimani
Free
dow
nloa
d fr
om w
ww
.hsr
cpre
ss.a
c.za

Chapter 5
75
Table 5.15: Knowledge about availability of VCT services by selected demographic characteristics
Variable N Yes n (%) p-value
Total 713 366 (51.3)
Sex of respondent
Male 322 160 (49.7)0.426
Female 391 206 (52.7)
Age groups
15–18 301 127 (42.2)<0.001
19–24 412 239 (58.0)
Sector
Communal 327 162 (49.5)
0.485
Resettlement 168 84 (50.0)
Large-scale commercial 121 62 (51.2)
Small-scale commercial 37 23 (62.2)
Urban 60 35 (58.3)
Level of education
No schooling 8 2 (25.0)
0.043Primary school 200 89 (44.5)
Secondary school 496 270 (54.4)
Tertiary non-degreed 9 5 (55.6)
5.4.5. Sexual behaviour
To assess sexual behaviour and practices respondents were asked about sexual intercourse, condom use, type and number of partners, among others. Half of the 713 respondents (50.9%) reported ever having had sex. Overall, the mean (SD) age at first sexual encounter was 17.9 (2.4) years. The mean age of first sexual encounter was 18.0 (2.0) years among females and 17.6 (3.0) years among males (p<0.001).
Table 5.16 shows that a higher proportion of females compared to males reported ever having had sex (p< 0.001). The table also shows that reports of ever having had sex were higher among both males and females in the 19–24 years compared to 15–18 years age group. Furthermore, the history of sexual encounter was similar among males and females aged 15–18 years. In contrast, among those aged 19–24 years, a significantly higher proportion of females compared to males reported ever having sex (p<0.001).
Free
dow
nloa
d fr
om w
ww
.hsr
cpre
ss.a
c.za
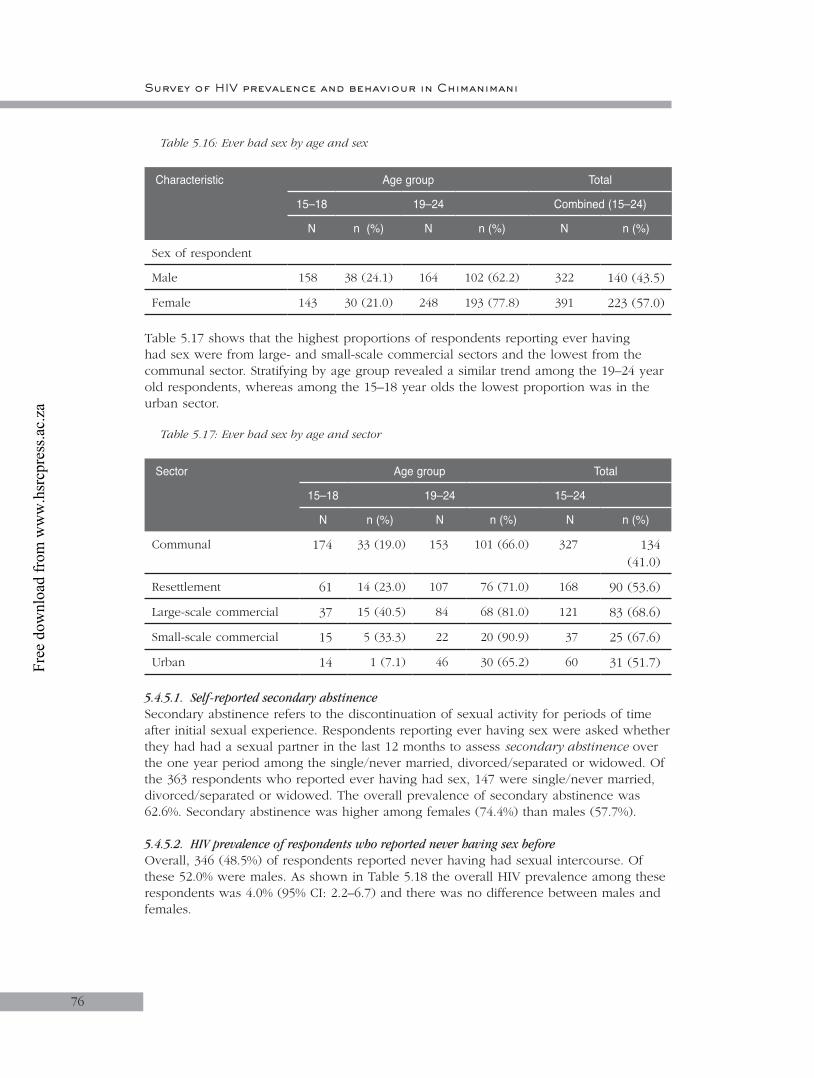
76
Table 5.16: Ever had sex by age and sex
Characteristic Age group Total
15–18 19–24 Combined (15–24)
N n (%) N n (%) N n (%)
Sex of respondent
Male 158 38 (24.1) 164 102 (62.2) 322 140 (43.5)
Female 143 30 (21.0) 248 193 (77.8) 391 223 (57.0)
Table 5.17 shows that the highest proportions of respondents reporting ever having had sex were from large- and small-scale commercial sectors and the lowest from the communal sector. Stratifying by age group revealed a similar trend among the 19–24 year old respondents, whereas among the 15–18 year olds the lowest proportion was in the urban sector.
Table 5.17: Ever had sex by age and sector
Sector Age group Total
15–18 19–24 15–24
N n (%) N n (%) N n (%)
Communal 174 33 (19.0) 153 101 (66.0) 327 134 (41.0)
Resettlement 61 14 (23.0) 107 76 (71.0) 168 90 (53.6)
Large-scale commercial 37 15 (40.5) 84 68 (81.0) 121 83 (68.6)
Small-scale commercial 15 5 (33.3) 22 20 (90.9) 37 25 (67.6)
Urban 14 1 (7.1) 46 30 (65.2) 60 31 (51.7)
5.4.5.1. Self-reported secondary abstinenceSecondary abstinence refers to the discontinuation of sexual activity for periods of time after initial sexual experience. Respondents reporting ever having sex were asked whether they had had a sexual partner in the last 12 months to assess secondary abstinence over the one year period among the single/never married, divorced/separated or widowed. Of the 363 respondents who reported ever having had sex, 147 were single/never married, divorced/separated or widowed. The overall prevalence of secondary abstinence was 62.6%. Secondary abstinence was higher among females (74.4%) than males (57.7%).
5.4.5.2. HIV prevalence of respondents who reported never having sex beforeOverall, 346 (48.5%) of respondents reported never having had sexual intercourse. Of these 52.0% were males. As shown in Table 5.18 the overall HIV prevalence among these respondents was 4.0% (95% CI: 2.2–6.7) and there was no difference between males and females.
Survey of HIV prevalence and behaviour in Chimanimani
Free
dow
nloa
d fr
om w
ww
.hsr
cpre
ss.a
c.za
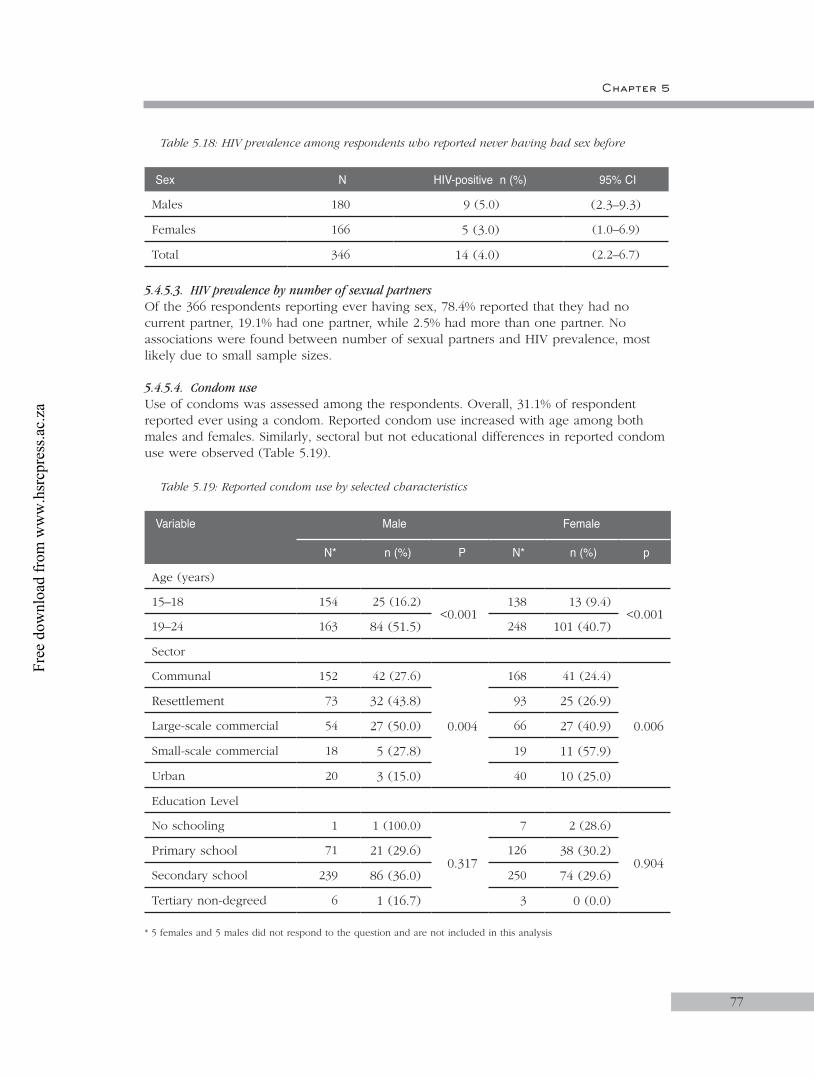
77
Table 5.18: HIV prevalence among respondents who reported never having had sex before
Sex N HIV-positive n (%) 95% CI
Males 180 9 (5.0) (2.3–9.3)
Females 166 5 (3.0) (1.0–6.9)
Total 346 14 (4.0) (2.2–6.7)
5.4.5.3. HIV prevalence by number of sexual partnersOf the 366 respondents reporting ever having sex, 78.4% reported that they had no current partner, 19.1% had one partner, while 2.5% had more than one partner. No associations were found between number of sexual partners and HIV prevalence, most likely due to small sample sizes.
5.4.5.4. Condom useUse of condoms was assessed among the respondents. Overall, 31.1% of respondent reported ever using a condom. Reported condom use increased with age among both males and females. Similarly, sectoral but not educational differences in reported condom use were observed (Table 5.19).
Table 5.19: Reported condom use by selected characteristics
Variable Male Female
N* n (%) P N* n (%) p
Age (years)
15–18 154 25 (16.2)<0.001
138 13 (9.4)<0.001
19–24 163 84 (51.5) 248 101 (40.7)
Sector
Communal 152 42 (27.6)
0.004
168 41 (24.4)
0.006
Resettlement 73 32 (43.8) 93 25 (26.9)
Large-scale commercial 54 27 (50.0) 66 27 (40.9)
Small-scale commercial 18 5 (27.8) 19 11 (57.9)
Urban 20 3 (15.0) 40 10 (25.0)
Education Level
No schooling 1 1 (100.0)
0.317
7 2 (28.6)
0.904Primary school 71 21 (29.6) 126 38 (30.2)
Secondary school 239 86 (36.0) 250 74 (29.6)
Tertiary non-degreed 6 1 (16.7) 3 0 (0.0)
* 5 females and 5 males did not respond to the question and are not included in this analysis
Chapter 5
Free
dow
nloa
d fr
om w
ww
.hsr
cpre
ss.a
c.za

Survey of HIV prevalence and behaviour in Chimanimani
78
5.4.5.5. HIV prevalence by condom useOverall 222 (31.1%) of respondents reported ever using a condom. HIV prevalence was similar between respondents reporting ever using a condom (9.9%) and those who had never used a condom (9.1%). None of the ten who did not respond were infected. Table 5.20 shows prevalence of HIV by condom use among males and females. There was no difference in HIV prevalence among males and females who reported ever using or not ever using a condom.
Table 5.20: HIV prevalence by condom use and sex
Used condoms Male Female Total
N n (%) 95% CI N n (%) 95% CI N n (%)
Yes 108 6 (5.6) 2.1–11.7 114 16 (14.0) 8.2–21.8 222 22 (9.9)
No 209 12 (5.7) 3.0–9.8 272 32 (11.8) 8.2–16.2 481 44 (9.1)
Not stated 5 – – 5 – – 10 –
Table 5.21 shows that the proportion of respondents who reported ever using a condom by sector in relation to HIV prevalence. Sectors recording higher rates of condom use were associated with higher HIV prevalence rates, but the differences were not significant.
Table 5.21: HIV prevalence and condom use by sector
Sector N Ever used a condom N HIV prevalence*
n (%) p n (%) p
Communal 320 82 (25.6)
<0.001
82 6 (7.3)
0.830
Resettlement 166 57 (34.3) 57 7 (12.3)
Large-scale commercial 120 54 (45.0) 54 6 (11.1)
Small-scale commercial 37 16 (43.2) 16 2 (12.5)
Urban 60 13 (21.7) 13 1 (7.7)
* HIV prevalence was only among those who used condoms
5.4.5.6. Selective use of condomsOf the 222 respondents who reported ever using a condom, 13.1% selectively used condoms with some sexual partners and not with others. Most of the respondents who selectively used condoms were living in the communal areas. There was no association between reported selective use of condoms and level of education.
5.4.5.7. Condom use during the last sexual encounterOf the 222 who had ever used condoms 53.2% reported that they had used condoms the last time they had sex. Table 5.22 shows that the majority of males and around one third of the females in both age groups had used condoms during their last sexual encounter. Condom use did not vary by sector and educational level for both males and females. When condom use was assessed among the respondents reporting ever having discussed
Free
dow
nloa
d fr
om w
ww
.hsr
cpre
ss.a
c.za
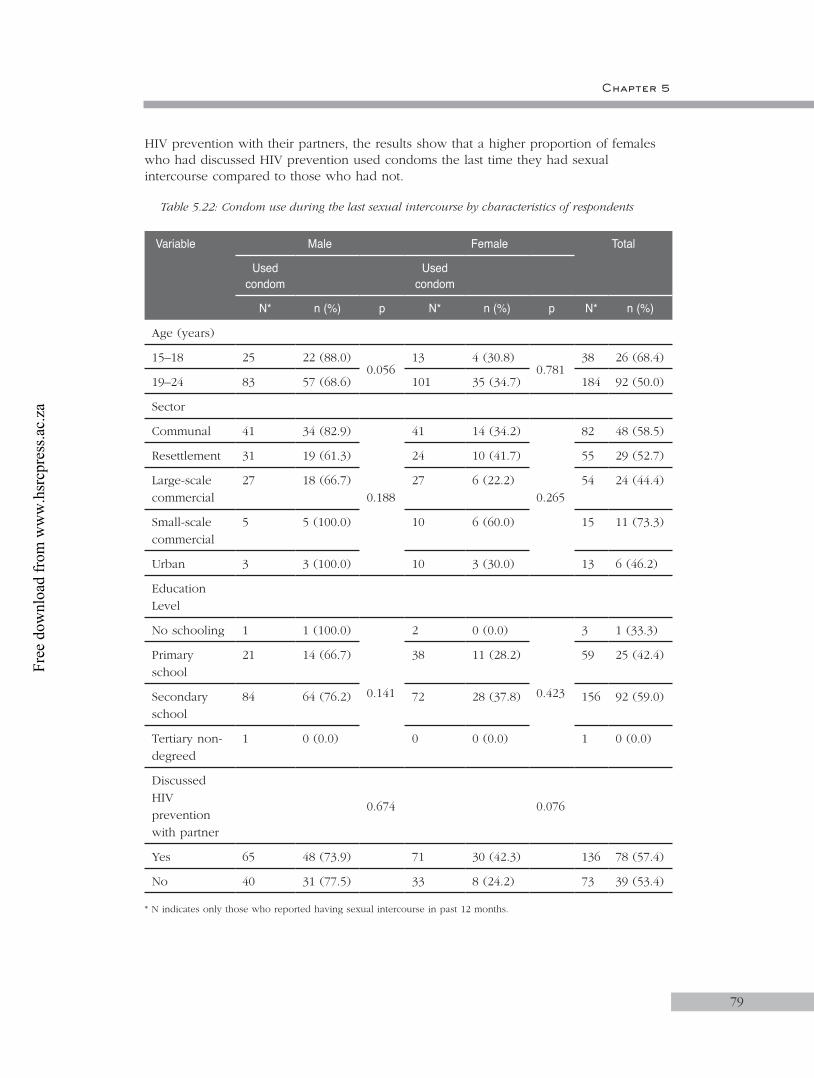
Chapter 5
79
HIV prevention with their partners, the results show that a higher proportion of females who had discussed HIV prevention used condoms the last time they had sexual intercourse compared to those who had not.
Table 5.22: Condom use during the last sexual intercourse by characteristics of respondents
Variable Male Female Total
Used condom
Used condom
N* n (%) p N* n (%) p N* n (%)
Age (years)
15–18 25 22 (88.0)0.056
13 4 (30.8)0.781
38 26 (68.4)
19–24 83 57 (68.6) 101 35 (34.7) 184 92 (50.0)
Sector
Communal 41 34 (82.9)
0.188
41 14 (34.2)
0.265
82 48 (58.5)
Resettlement 31 19 (61.3) 24 10 (41.7) 55 29 (52.7)
Large-scale commercial
27 18 (66.7) 27 6 (22.2) 54 24 (44.4)
Small-scale commercial
5 5 (100.0) 10 6 (60.0) 15 11 (73.3)
Urban 3 3 (100.0) 10 3 (30.0) 13 6 (46.2)
Education Level
No schooling 1 1 (100.0)
0.141
2 0 (0.0)
0.423
3 1 (33.3)
Primary school
21 14 (66.7) 38 11 (28.2) 59 25 (42.4)
Secondary school
84 64 (76.2) 72 28 (37.8) 156 92 (59.0)
Tertiary non-degreed
1 0 (0.0) 0 0 (0.0) 1 0 (0.0)
Discussed HIV prevention with partner
0.674 0.076
Yes 65 48 (73.9) 71 30 (42.3) 136 78 (57.4)
No 40 31 (77.5) 33 8 (24.2) 73 39 (53.4)
* N indicates only those who reported having sexual intercourse in past 12 months.
Free
dow
nloa
d fr
om w
ww
.hsr
cpre
ss.a
c.za

Survey of HIV prevalence and behaviour in Chimanimani
80
5.4.5.8. Reasons for reported condom useRespondents who reported that they had used condoms the last time they had sex were asked to state the main reasons why they used the condoms. The majority (69.5%) of respondents indicated prevention of pregnancy as the main reason. However, 44.9% and 37.3% of the respondents reported that they used condoms because they wanted to prevent STIs and that they did not know the HIV status of their partners, respectively (Table 5.23).
Table 5.23: Reasons for condom use
Main reasons for condom useMaleN=79
FemaleN=39
TotalN=118
n % n % n %
Didn’t know HIV status of partner 32 40.5 12 30.8 44 37.3
Didn’t know sexual history of partner 7 8.9 2 5.1 9 7.6
Saw/heard messages urging people to use condoms
7 8.9 2 5.1 9 7.6
Wanted to prevent STIs 39 49.4 14 35.9 53 44.9
Wanted to prevent pregnancy 55 69.6 27 69.2 82 69.5
Other reasons 3 3.8 0 0.0 3 2.5
* Multiple responses were possible
Table 5.24 shows the distribution of various sources of condoms by age group and sector. The table shows that public clinics and hospitals were the most common source of condoms for both 15–18 (55.3%) and 19–24 years old youths (66.9%). Only respondents who were living in the large-scale commercial areas cited the workplace as source of condoms. More females than males mention public health centres as the most common source of condoms (Table 5.24).
Table 5.24: Sources of condoms by age and by locality type
Sources of condoms
CommunalN=82
ResettlementN=57
Large-scale
commercialN=54
Small-scale commercial
N=16
UrbanN=13
Total N=222
n (%) n (%) n (%) n (%) n (%) n (%)
Public clinic/ hospital
48 (58.5) 39 (68.4) 39 (72.2) 8 (50.0) 10 (76.9) 144 (64.9)
Private clinic/ hospital
13 (15.9) 5 (8.8) 8 (14.8) 7 (43.8) 0 (0.0) 33 (14.9)
Pharmacy 5 (6.1) 3 (5.3) 0 (0.0) 1 (6.3) 1 (7.7) 10 (4.5)
Shops 27 (32.9) 18 (31.6) 16 (29.6) 5 (31.3) 8 (61.5) 74 (33.3)
Tuck shops 5 (6.1) 6 (10.5) 2 (3.7) 0 (0.0) 2 (15.4) 15 (6.8)
Free
dow
nloa
d fr
om w
ww
.hsr
cpre
ss.a
c.za
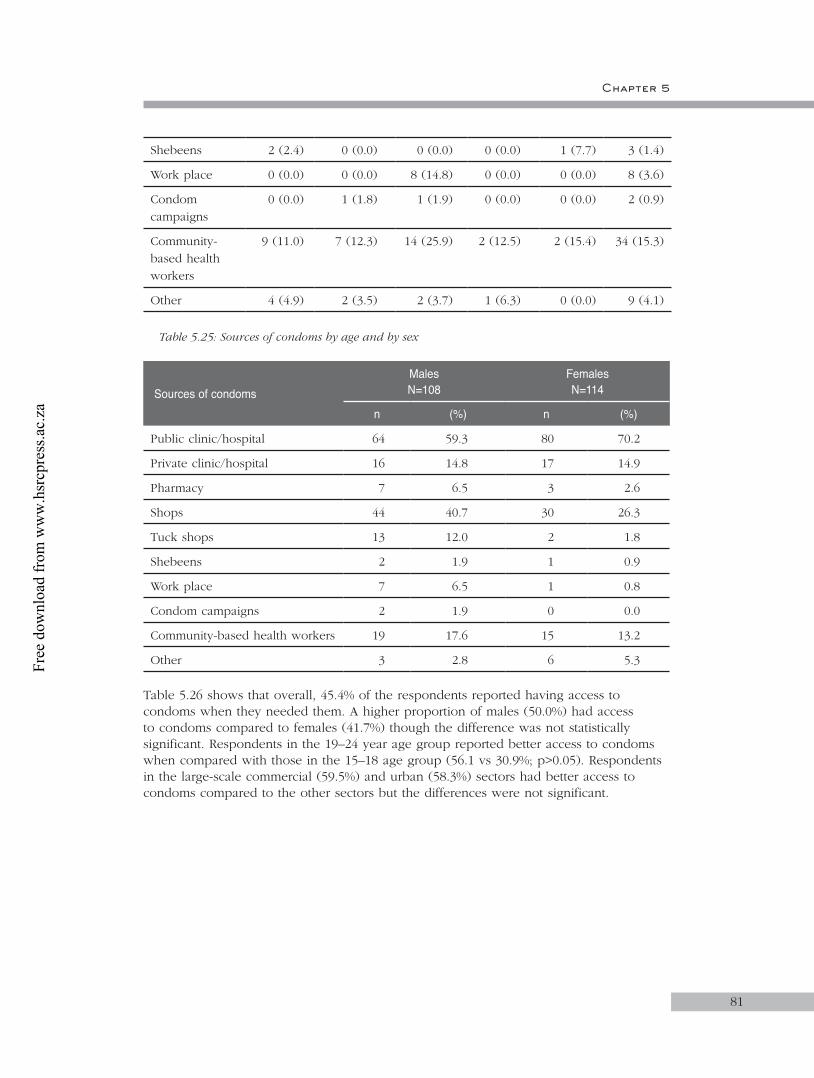
81
Shebeens 2 (2.4) 0 (0.0) 0 (0.0) 0 (0.0) 1 (7.7) 3 (1.4)
Work place 0 (0.0) 0 (0.0) 8 (14.8) 0 (0.0) 0 (0.0) 8 (3.6)
Condom campaigns
0 (0.0) 1 (1.8) 1 (1.9) 0 (0.0) 0 (0.0) 2 (0.9)
Community- based health workers
9 (11.0) 7 (12.3) 14 (25.9) 2 (12.5) 2 (15.4) 34 (15.3)
Other 4 (4.9) 2 (3.5) 2 (3.7) 1 (6.3) 0 (0.0) 9 (4.1)
Table 5.25: Sources of condoms by age and by sex
Sources of condomsMalesN=108
Females N=114
n (%) n (%)
Public clinic/hospital 64 59.3 80 70.2
Private clinic/hospital 16 14.8 17 14.9
Pharmacy 7 6.5 3 2.6
Shops 44 40.7 30 26.3
Tuck shops 13 12.0 2 1.8
Shebeens 2 1.9 1 0.9
Work place 7 6.5 1 0.8
Condom campaigns 2 1.9 0 0.0
Community-based health workers 19 17.6 15 13.2
Other 3 2.8 6 5.3
Table 5.26 shows that overall, 45.4% of the respondents reported having access to condoms when they needed them. A higher proportion of males (50.0%) had access to condoms compared to females (41.7%) though the difference was not statistically significant. Respondents in the 19–24 year age group reported better access to condoms when compared with those in the 15–18 age group (56.1 vs 30.9%; p>0.05). Respondents in the large-scale commercial (59.5%) and urban (58.3%) sectors had better access to condoms compared to the other sectors but the differences were not significant.
Chapter 5
Free
dow
nloa
d fr
om w
ww
.hsr
cpre
ss.a
c.za

Survey of HIV prevalence and behaviour in Chimanimani
82
Table 5.26: Responses to the question: ‘Should you need a condom, is it possible to get one?’
Demographic variable N Yes to access to condoms 95% CI
Sector
Communal 327 123 (37.6) 32.3–43.1
Resettlement 168 76 (45.2) 37.6–53.1
Large-scale commercial 121 72 (59.5) 50.2–68.3
Small-scale commercial 37 18 (48.7) 32.0–65.6
Urban 60 35 (58.3) 44.9–70.9
5.4.5.9. HIV prevalence by self-reported history STIs and other HIV-related illnessesA very small minority (4.1%) of respondents reported that they had at least one STI in the past three months. The prevalence of reported STIs was similar between males (4.0%) and females (4.1%). The most commonly reported STI among both males and females was abnormal genital discharge accounting for more than half the reported STIs.
The overall HIV prevalence among those reporting a history of STI was 13.8% compared to 9.1% among those not reporting but the difference was not statistically significant . None of the males reporting a history of STI were HIV-positive while 5.8% of those not reporting a STI were infected. In contrast, HIV prevalence was twice as high (25.0%) among females who reported a history of STI compared to those who did not (11.7%).
5.4.5.10. HIV prevalence by risk perceptionThe respondents were asked to rate their chances of becoming HIV-infected, i.e. perceived level of risk. More than a third (39.0%) thought that they were definitely going to be infected with HIV and 30.3% indicated that they were probably going to be infected. Close to half (49.6%) of the respondents believed that they were at low risk of infection because they never had sex before and 13.8% indicated they were now abstaining from sex. HIV prevalence was significantly higher (p=0.034) among respondents who acceded to a possibility of being infected (13.0%) compared to those who believed they would not get infected (7.9%).
5.4.5.11. Self-reported HIV testingOverall, 61 of the respondents reported that they had had an HIV test before and of these 22 were males. Of those reporting having been tested, 47 were informed of their HIV status. A higher proportion of males (19/22) than females (28/39) reported having been informed about their HIV status.
The most commonly cited reasons for going for an HIV test were just wanted to know their status (31.2%) and that respondent became pregnant (19.7%). Other reasons cited are shown in Table 5.27.
Free
dow
nloa
d fr
om w
ww
.hsr
cpre
ss.a
c.za
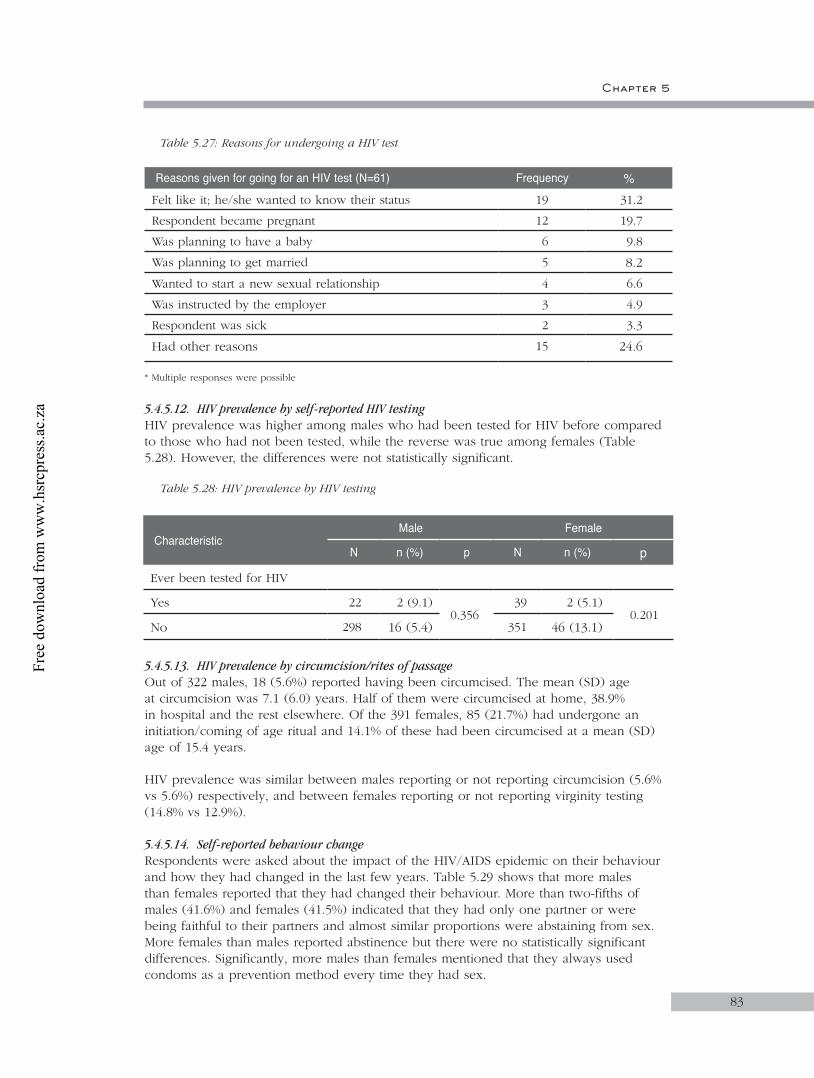
Chapter 5
83
Table 5.27: Reasons for undergoing a HIV test
Reasons given for going for an HIV test (N=61) Frequency %Felt like it; he/she wanted to know their status 19 31.2
Respondent became pregnant 12 19.7
Was planning to have a baby 6 9.8
Was planning to get married 5 8.2
Wanted to start a new sexual relationship 4 6.6
Was instructed by the employer 3 4.9
Respondent was sick 2 3.3
Had other reasons 15 24.6
* Multiple responses were possible
5.4.5.12. HIV prevalence by self-reported HIV testingHIV prevalence was higher among males who had been tested for HIV before compared to those who had not been tested, while the reverse was true among females (Table 5.28). However, the differences were not statistically significant.
Table 5.28: HIV prevalence by HIV testing
5.4.5.13. HIV prevalence by circumcision/rites of passageOut of 322 males, 18 (5.6%) reported having been circumcised. The mean (SD) age at circumcision was 7.1 (6.0) years. Half of them were circumcised at home, 38.9% in hospital and the rest elsewhere. Of the 391 females, 85 (21.7%) had undergone an initiation/coming of age ritual and 14.1% of these had been circumcised at a mean (SD) age of 15.4 years.
HIV prevalence was similar between males reporting or not reporting circumcision (5.6% vs 5.6%) respectively, and between females reporting or not reporting virginity testing (14.8% vs 12.9%).
5.4.5.14. Self-reported behaviour changeRespondents were asked about the impact of the HIV/AIDS epidemic on their behaviour and how they had changed in the last few years. Table 5.29 shows that more males than females reported that they had changed their behaviour. More than two-fifths of males (41.6%) and females (41.5%) indicated that they had only one partner or were being faithful to their partners and almost similar proportions were abstaining from sex. More females than males reported abstinence but there were no statistically significant differences. Significantly, more males than females mentioned that they always used condoms as a prevention method every time they had sex.
CharacteristicMale Female
N n (%) p N n (%) p
Ever been tested for HIV
Yes 22 2 (9.1)0.356
39 2 (5.1)0.201
No 298 16 (5.4) 351 46 (13.1)
Free
dow
nloa
d fr
om w
ww
.hsr
cpre
ss.a
c.za
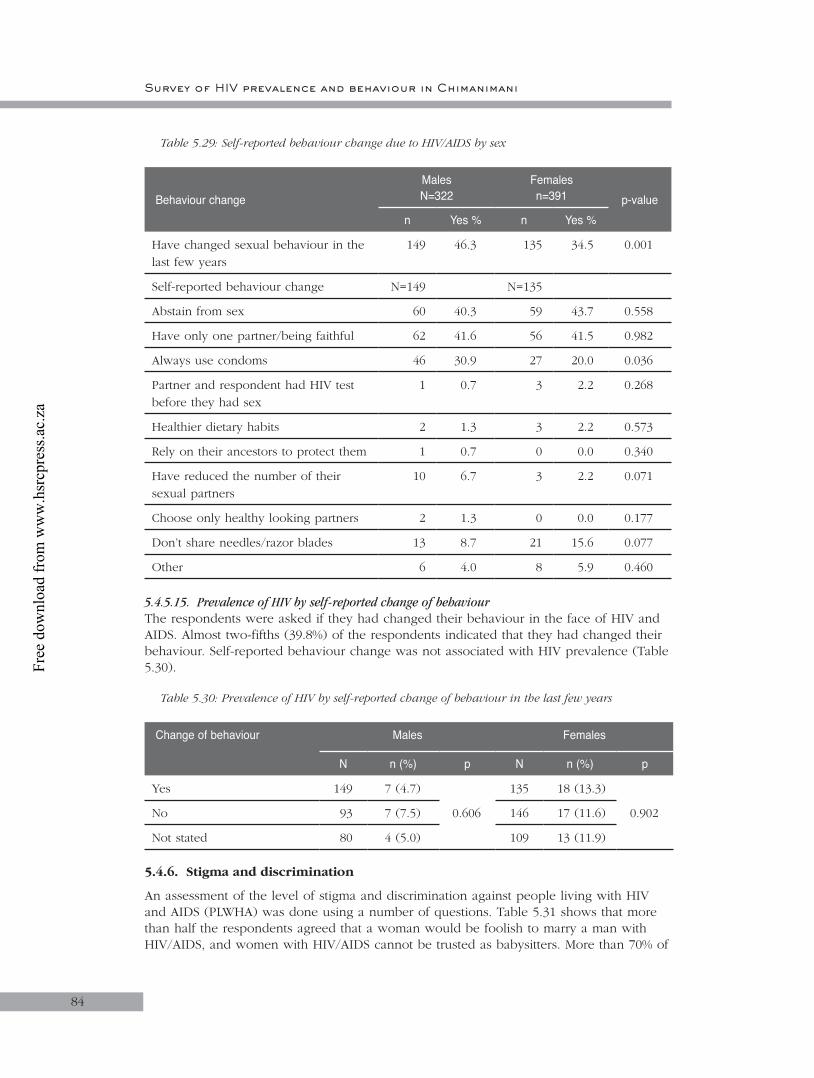
Survey of HIV prevalence and behaviour in Chimanimani
84
Table 5.29: Self-reported behaviour change due to HIV/AIDS by sex
Behaviour changeMalesN=322
Females n=391 p-value
n Yes % n Yes %
Have changed sexual behaviour in the last few years
149 46.3 135 34.5 0.001
Self-reported behaviour change N=149 N=135
Abstain from sex 60 40.3 59 43.7 0.558
Have only one partner/being faithful 62 41.6 56 41.5 0.982
Always use condoms 46 30.9 27 20.0 0.036
Partner and respondent had HIV test before they had sex
1 0.7 3 2.2 0.268
Healthier dietary habits 2 1.3 3 2.2 0.573
Rely on their ancestors to protect them 1 0.7 0 0.0 0.340
Have reduced the number of their sexual partners
10 6.7 3 2.2 0.071
Choose only healthy looking partners 2 1.3 0 0.0 0.177
Don’t share needles/razor blades 13 8.7 21 15.6 0.077
Other 6 4.0 8 5.9 0.460
5.4.5.15. Prevalence of HIV by self-reported change of behaviourThe respondents were asked if they had changed their behaviour in the face of HIV and AIDS. Almost two-fifths (39.8%) of the respondents indicated that they had changed their behaviour. Self-reported behaviour change was not associated with HIV prevalence (Table 5.30).
Table 5.30: Prevalence of HIV by self-reported change of behaviour in the last few years
Change of behaviour Males Females
N n (%) p N n (%) p
Yes 149 7 (4.7)
0.606
135 18 (13.3)
0.902No 93 7 (7.5) 146 17 (11.6)
Not stated 80 4 (5.0) 109 13 (11.9)
5.4.6. Stigma and discrimination
An assessment of the level of stigma and discrimination against people living with HIV and AIDS (PLWHA) was done using a number of questions. Table 5.31 shows that more than half the respondents agreed that a woman would be foolish to marry a man with HIV/AIDS, and women with HIV/AIDS cannot be trusted as babysitters. More than 70% of
Free
dow
nloa
d fr
om w
ww
.hsr
cpre
ss.a
c.za
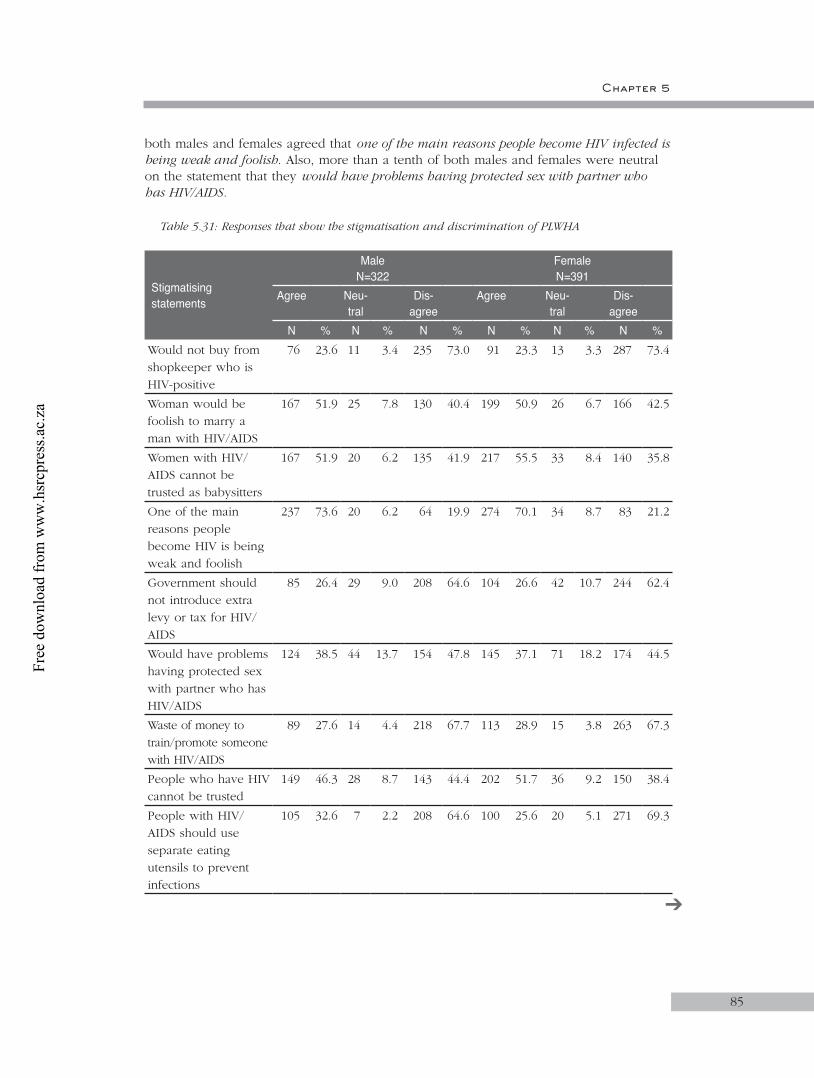
Chapter 5
85
both males and females agreed that one of the main reasons people become HIV infected is being weak and foolish. Also, more than a tenth of both males and females were neutral on the statement that they would have problems having protected sex with partner who has HIV/AIDS.
Table 5.31: Responses that show the stigmatisation and discrimination of PLWHA
Stigmatising statements
MaleN=322
FemaleN=391
Agree Neu-tral
Dis-agree
Agree Neu-tral
Dis-agree
N % N % N % N % N % N %Would not buy from shopkeeper who is HIV-positive
76 23.6 11 3.4 235 73.0 91 23.3 13 3.3 287 73.4
Woman would be foolish to marry a man with HIV/AIDS
167 51.9 25 7.8 130 40.4 199 50.9 26 6.7 166 42.5
Women with HIV/AIDS cannot be trusted as babysitters
167 51.9 20 6.2 135 41.9 217 55.5 33 8.4 140 35.8
One of the main reasons people become HIV is being weak and foolish
237 73.6 20 6.2 64 19.9 274 70.1 34 8.7 83 21.2
Government should not introduce extra levy or tax for HIV/AIDS
85 26.4 29 9.0 208 64.6 104 26.6 42 10.7 244 62.4
Would have problems having protected sex with partner who has HIV/AIDS
124 38.5 44 13.7 154 47.8 145 37.1 71 18.2 174 44.5
Waste of money to train/promote someone with HIV/AIDS
89 27.6 14 4.4 218 67.7 113 28.9 15 3.8 263 67.3
People who have HIV cannot be trusted
149 46.3 28 8.7 143 44.4 202 51.7 36 9.2 150 38.4
People with HIV/AIDS should use separate eating utensils to prevent infections
105 32.6 7 2.2 208 64.6 100 25.6 20 5.1 271 69.3
➔
Free
dow
nloa
d fr
om w
ww
.hsr
cpre
ss.a
c.za
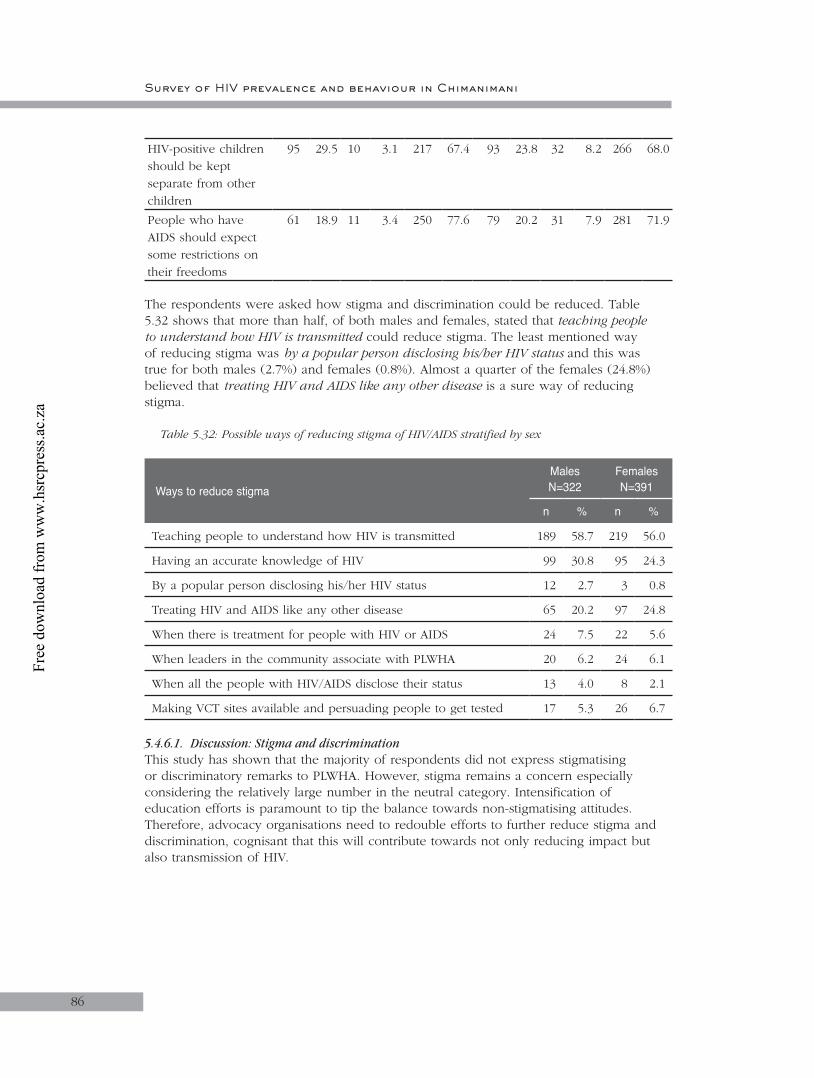
Survey of HIV prevalence and behaviour in Chimanimani
86
HIV-positive children should be kept separate from other children
95 29.5 10 3.1 217 67.4 93 23.8 32 8.2 266 68.0
People who have AIDS should expect some restrictions on their freedoms
61 18.9 11 3.4 250 77.6 79 20.2 31 7.9 281 71.9
The respondents were asked how stigma and discrimination could be reduced. Table 5.32 shows that more than half, of both males and females, stated that teaching people to understand how HIV is transmitted could reduce stigma. The least mentioned way of reducing stigma was by a popular person disclosing his/her HIV status and this was true for both males (2.7%) and females (0.8%). Almost a quarter of the females (24.8%) believed that treating HIV and AIDS like any other disease is a sure way of reducing stigma.
Table 5.32: Possible ways of reducing stigma of HIV/AIDS stratified by sex
Ways to reduce stigmaMalesN=322
FemalesN=391
n % n %
Teaching people to understand how HIV is transmitted 189 58.7 219 56.0
Having an accurate knowledge of HIV 99 30.8 95 24.3
By a popular person disclosing his/her HIV status 12 2.7 3 0.8
Treating HIV and AIDS like any other disease 65 20.2 97 24.8
When there is treatment for people with HIV or AIDS 24 7.5 22 5.6
When leaders in the community associate with PLWHA 20 6.2 24 6.1
When all the people with HIV/AIDS disclose their status 13 4.0 8 2.1
Making VCT sites available and persuading people to get tested 17 5.3 26 6.7
5.4.6.1. Discussion: Stigma and discriminationThis study has shown that the majority of respondents did not express stigmatising or discriminatory remarks to PLWHA. However, stigma remains a concern especially considering the relatively large number in the neutral category. Intensification of education efforts is paramount to tip the balance towards non-stigmatising attitudes. Therefore, advocacy organisations need to redouble efforts to further reduce stigma and discrimination, cognisant that this will contribute towards not only reducing impact but also transmission of HIV.
Free
dow
nloa
d fr
om w
ww
.hsr
cpre
ss.a
c.za

Chapter 5
87
5.4.7. Awareness of HIV and AIDS services
5.4.7.1. Home-based careAwareness about home-based care (HBC) services directed at PLWHA and OVC in their communities was assessed.
5.4.7.2. HBC directed at PLWHAOverall, 26.5% of respondents were aware of HBC services in their communities. Table 5.33 shows that more males than females knew about HBC services. There were no sectoral differences in awareness among both males and females, though males from urban and communal sectors and females from SSC tended to have better awareness. Awareness tended to increase with increases in levels of education in both sexes.
Table 5.33: Proportion of people who are aware of HBCP directed towards PLWHA in community
Variable Male Female Total
n Yes (%) p n Yes (%) p n Yes (%)
Total 321 92 (28.7) 390 97 (24.9) 713 189 (26.5)
Age
15–18 158 52 (32.9)0.097
143 28 (19.6)0.066
301 80 (26.6)
19–24 163 40 (24.5) 247 69 (27.9) 412 109 (26.5)
Sector
Communal 154 49 (31.8)
0.650
171 46 (26.9)
0.083
327 95 (29.1)
Resettlement 75 19 (25.3) 93 18 (19.4) 168 37 (22.0)
Large-scale commercial
54 13 (24.1) 67 13 (19.4) 121 26 (21.5)
Small-scale commercial
18 4 (22.2) 19 9 (47.4) 37 13 (35.1)
Urban 20 7 (35.0) 40 11 (27.5) 60 18 (30.0)
Education level
No schooling 1 0 (0.0)
0.092
7 2 (28.6)
0.166
8 2 (25.0)
Primary school
72 14 (19.4) 127 26 (20.5) 200 40 (20.0)
Secondary school
242 75 (31.0) 253 67 (26.5) 496 142 (28.6)
Tertiary non-degreed
6 3 (50.0) 3 2 (66.7) 9 5 (55.6)
➔
Free
dow
nloa
d fr
om w
ww
.hsr
cpre
ss.a
c.za
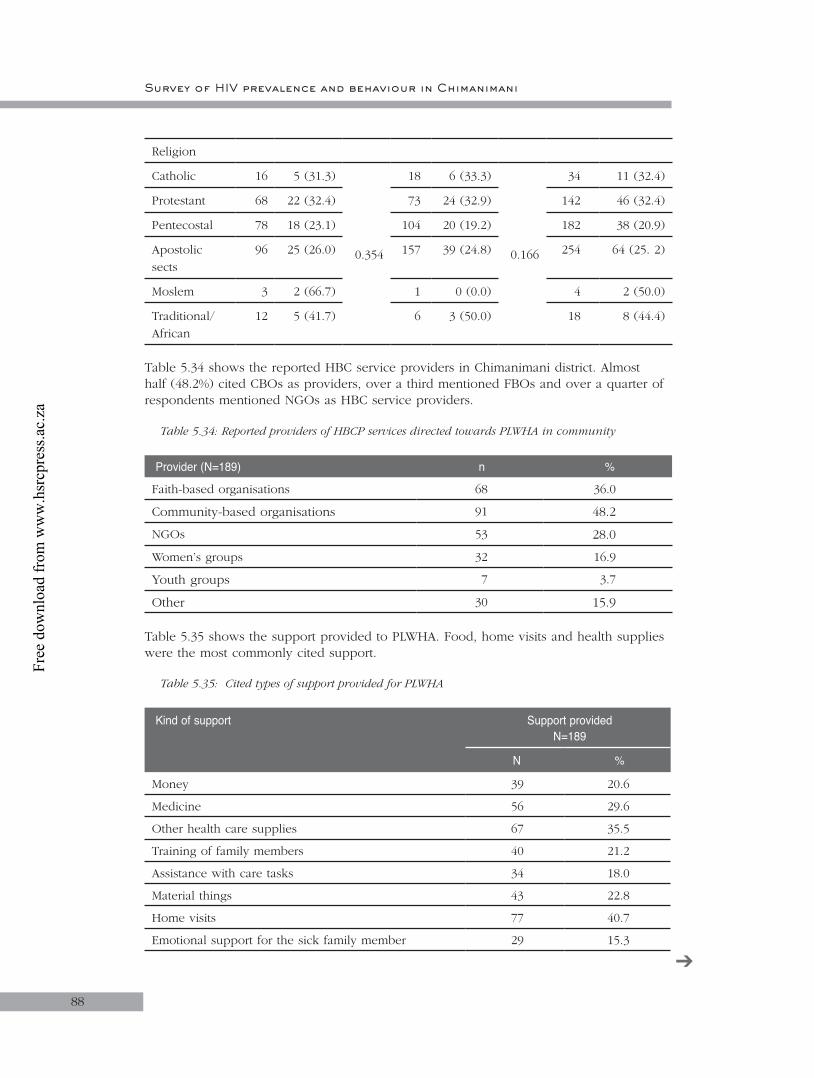
Survey of HIV prevalence and behaviour in Chimanimani
88
Religion
Catholic 16 5 (31.3)
0.354
18 6 (33.3)
0.166
34 11 (32.4)
Protestant 68 22 (32.4) 73 24 (32.9) 142 46 (32.4)
Pentecostal 78 18 (23.1) 104 20 (19.2) 182 38 (20.9)
Apostolic sects
96 25 (26.0) 157 39 (24.8) 254 64 (25. 2)
Moslem 3 2 (66.7) 1 0 (0.0) 4 2 (50.0)
Traditional/African
12 5 (41.7) 6 3 (50.0) 18 8 (44.4)
Table 5.34 shows the reported HBC service providers in Chimanimani district. Almost half (48.2%) cited CBOs as providers, over a third mentioned FBOs and over a quarter of respondents mentioned NGOs as HBC service providers.
Table 5.34: Reported providers of HBCP services directed towards PLWHA in community
Provider (N=189) n %
Faith-based organisations 68 36.0
Community-based organisations 91 48.2
NGOs 53 28.0
Women’s groups 32 16.9
Youth groups 7 3.7
Other 30 15.9
Table 5.35 shows the support provided to PLWHA. Food, home visits and health supplies were the most commonly cited support.
Table 5.35: Cited types of support provided for PLWHA
Kind of support Support providedN=189
N %
Money 39 20.6
Medicine 56 29.6
Other health care supplies 67 35.5
Training of family members 40 21.2
Assistance with care tasks 34 18.0
Material things 43 22.8
Home visits 77 40.7
Emotional support for the sick family member 29 15.3
➔
Free
dow
nloa
d fr
om w
ww
.hsr
cpre
ss.a
c.za
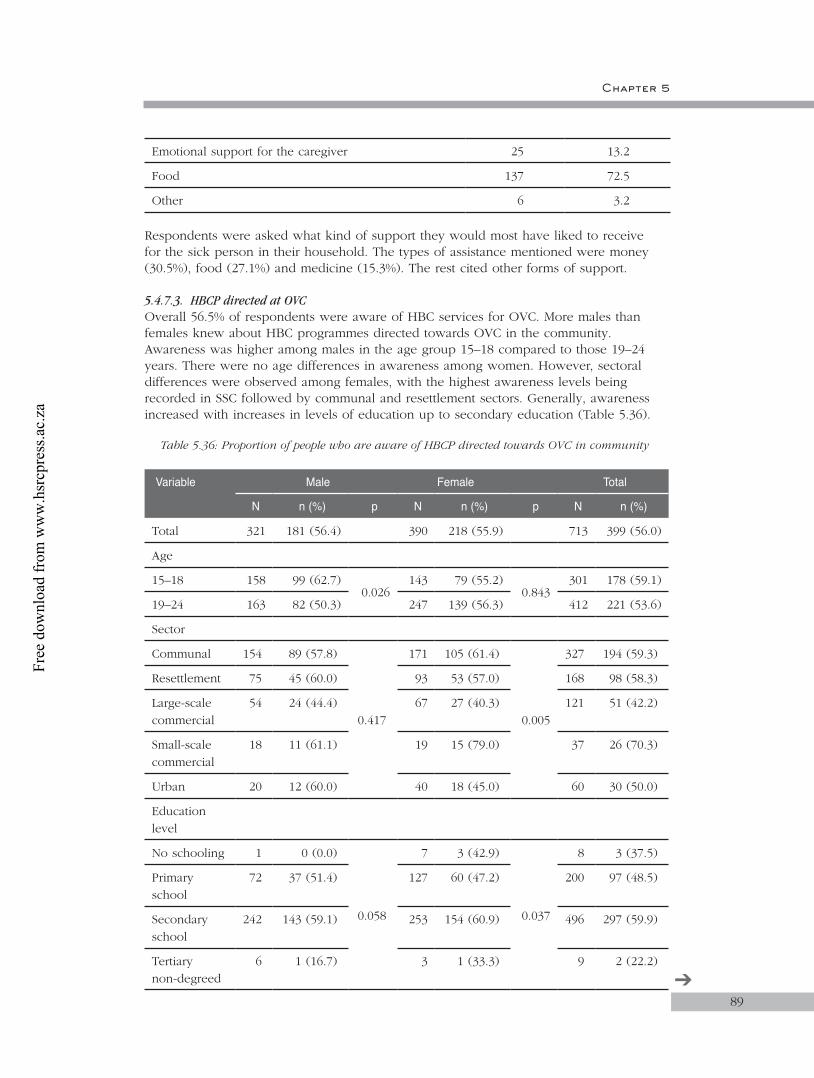
Chapter 5
89
Emotional support for the caregiver 25 13.2
Food 137 72.5
Other 6 3.2
Respondents were asked what kind of support they would most have liked to receive for the sick person in their household. The types of assistance mentioned were money (30.5%), food (27.1%) and medicine (15.3%). The rest cited other forms of support.
5.4.7.3. HBCP directed at OVCOverall 56.5% of respondents were aware of HBC services for OVC. More males than females knew about HBC programmes directed towards OVC in the community. Awareness was higher among males in the age group 15–18 compared to those 19–24 years. There were no age differences in awareness among women. However, sectoral differences were observed among females, with the highest awareness levels being recorded in SSC followed by communal and resettlement sectors. Generally, awareness increased with increases in levels of education up to secondary education (Table 5.36).
Table 5.36: Proportion of people who are aware of HBCP directed towards OVC in community
Variable Male Female Total
N n (%) p N n (%) p N n (%)
Total 321 181 (56.4) 390 218 (55.9) 713 399 (56.0)
Age
15–18 158 99 (62.7)0.026
143 79 (55.2)0.843
301 178 (59.1)
19–24 163 82 (50.3) 247 139 (56.3) 412 221 (53.6)
Sector
Communal 154 89 (57.8)
0.417
171 105 (61.4)
0.005
327 194 (59.3)
Resettlement 75 45 (60.0) 93 53 (57.0) 168 98 (58.3)
Large-scale commercial
54 24 (44.4) 67 27 (40.3) 121 51 (42.2)
Small-scale commercial
18 11 (61.1) 19 15 (79.0) 37 26 (70.3)
Urban 20 12 (60.0) 40 18 (45.0) 60 30 (50.0)
Education level
No schooling 1 0 (0.0)
0.058
7 3 (42.9)
0.037
8 3 (37.5)
Primary school
72 37 (51.4) 127 60 (47.2) 200 97 (48.5)
Secondary school
242 143 (59.1) 253 154 (60.9) 496 297 (59.9)
Tertiary non-degreed
6 1 (16.7) 3 1 (33.3) 9 2 (22.2)
➔
Free
dow
nloa
d fr
om w
ww
.hsr
cpre
ss.a
c.za

Survey of HIV prevalence and behaviour in Chimanimani
90
Religion
Catholic 16 8 (50.0)
0.204
18 11 (61.1)
0.227
34 19 (55.9)
Protestant 68 46 (67.7) 73 49 (67.1) 142 95 (66.9)
Pentecostal 78 42 (53.9) 104 55 (52.9) 182 97 (53.3)
Apostolic sects
96 50 (52.1) 157 82 (52.2) 254 132 (52.)
Moslem 3 3 (100.0) 1 0 (0.0) 4 3 (75.0)
Traditional/African
12 8 (66.7) 6 3 (50.0) 18 11 (61.1)
The integrated HBC service providers cited were NGOs (41.3%), FBOs (41.1%), CBOs (24.7%), women’s groups (6.3%) and others. The major forms of support for OVC were reported as food and material things (Table 5.37)
Table 5.37: Cited types of support provided for OVC in community
Kind of support Support providedN=396
n %
Food 350 88.4
Material things 199 50.3
Money 161 40.7
Home visits 60 15.2
Medicine 24 6.1
Other health care supplies 23 5.8
Training of family members 22 5.6
Emotional support for the caregiver 17 4.3
Assistance with care tasks 13 3.3
Emotional support for the sick family member 10 2.5
Other 46 11.6
5.4.7.4. Discussion: Awareness of HIV and AIDS servicesThe study has shown that there were no differences in awareness of the availability of HBC services for PLWHA and OVC in the community by age, sector, education level and religion. This implies that HBC as a concept was being accepted as an alternative to formal health care. The fact that almost half the respondents indicated that HBCP service providers in their communities were community-based organisations (48.2% for PLWHA) and faith-based organisations (41.1% for OVC) further supports this observation.
Free
dow
nloa
d fr
om w
ww
.hsr
cpre
ss.a
c.za
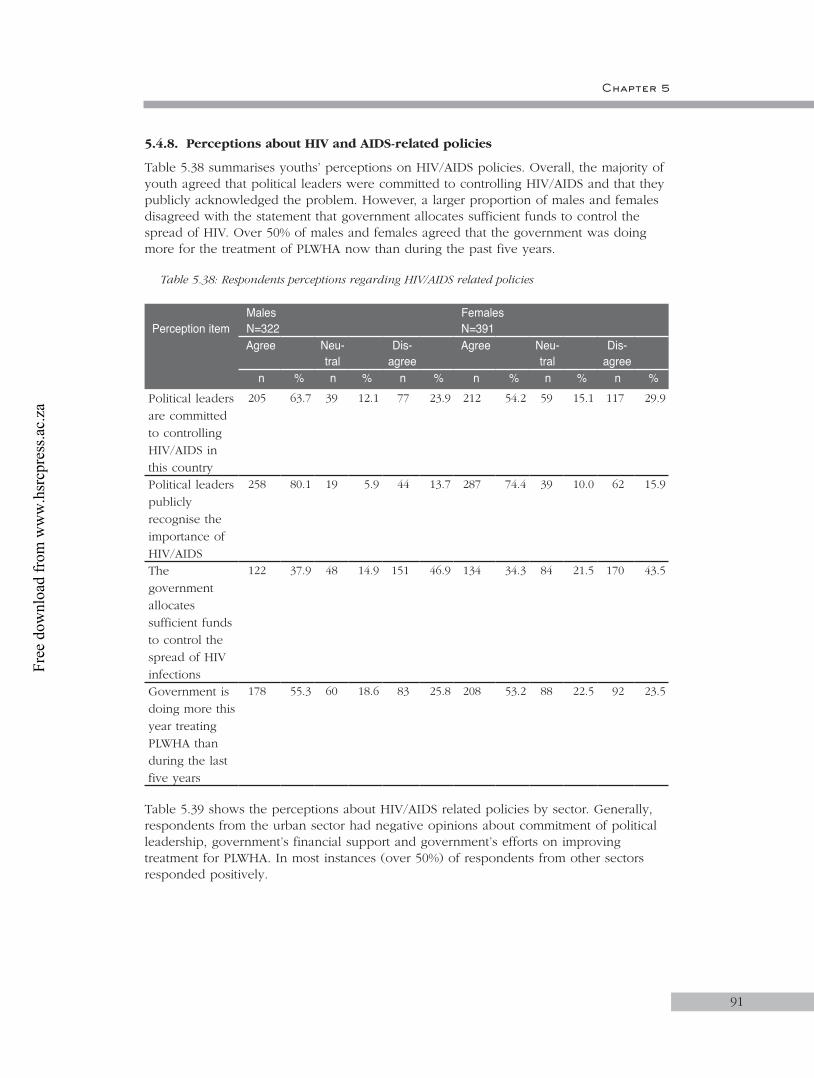
Chapter 5
91
5.4.8. Perceptions about HIV and AIDS-related policies
Table 5.38 summarises youths’ perceptions on HIV/AIDS policies. Overall, the majority of youth agreed that political leaders were committed to controlling HIV/AIDS and that they publicly acknowledged the problem. However, a larger proportion of males and females disagreed with the statement that government allocates sufficient funds to control the spread of HIV. Over 50% of males and females agreed that the government was doing more for the treatment of PLWHA now than during the past five years.
Table 5.38: Respondents perceptions regarding HIV/AIDS related policies
Perception itemMalesN=322
FemalesN=391
Agree Neu-tral
Dis-agree
Agree Neu-tral
Dis-agree
n % n % n % n % n % n %Political leaders are committed to controlling HIV/AIDS in this country
205 63.7 39 12.1 77 23.9 212 54.2 59 15.1 117 29.9
Political leaders publicly recognise the importance of HIV/AIDS
258 80.1 19 5.9 44 13.7 287 74.4 39 10.0 62 15.9
The government allocates sufficient funds to control the spread of HIV infections
122 37.9 48 14.9 151 46.9 134 34.3 84 21.5 170 43.5
Government is doing more this year treating PLWHA than during the last five years
178 55.3 60 18.6 83 25.8 208 53.2 88 22.5 92 23.5
Table 5.39 shows the perceptions about HIV/AIDS related policies by sector. Generally, respondents from the urban sector had negative opinions about commitment of political leadership, government’s financial support and government’s efforts on improving treatment for PLWHA. In most instances (over 50%) of respondents from other sectors responded positively.
Free
dow
nloa
d fr
om w
ww
.hsr
cpre
ss.a
c.za

Survey of HIV prevalence and behaviour in Chimanimani
92
Table 5.39: Respondents’ perceptions regarding political commitment to HIV/AIDS by sector
CommitmentSector Total
Communal(N=327)
n (%)
Resettlement (N=168)
n (%)
Small-scale commercial
(N=121)n (%)
Large-scale commercial
(N=37)n (%)
Urban (N=60)
n (%)
N=713
n (%)
Political leaders are committed to controlling HIV/AIDS
182 (55.7) 98 (58.3) 79 (65.3) 30 (81.1) 28 (46.7) 417 (58.5)
Political leaders publicly recognise the importance of HIV/AIDS
252 (77.1) 127 (75.6) 95 (78.5) 29 (78.4) 42 (70.0) 545 (76.4)
The government allocates sufficient funds to control the spread of HIV infections
101 (30.9) 69 (41.1) 52 (43.0) 17 (46.0) 17 (28.3) 256 (35.9)
The government is doing more this year treating PLWHA than during the last five years
166 (50.8) 102 (60.7) 73 (60.3) 28 (75.7) 17 (28.3) 386 (54.1)
5.4.8.1. Discussion: Perception about HIV and AIDS policiesThe role of leadership in efforts to curb the spread of HIV and AIDS is emphasised strongly in contemporary public health discourse. Opinions regarding the extent to which leaders in Zimbabwe were considered to be politically committed to combat the epidemic, recognised the problem and allocated resources were assessed. The results show that political leaders were committed to controlling HIV/AIDS and that they publicly recognised the problem of HIV and AIDS. However, the allocation of funds to the health sector has been noted to fall far too short of the requirements. These opinions can be taken as proxies for measures that reflect the practical reality but caution should be taken as spurious variables, such as political affiliation, might have influenced the responses. Leaders (in political circles and civil society) have a role to create and/or encourage supportive attitudes and responses to the pandemic. In particular, leaders can publicly acknowledge that they are personally affected by the epidemic or disclose their status. According to SAfAIDS (2002), experiences the world over show that leaders make a difference by discussing HIV and AIDS openly and sensitively and then taking action.
Free
dow
nloa
d fr
om w
ww
.hsr
cpre
ss.a
c.za

Chapter 5
93
5.5. Conclusions
The aim of this part of the study was to relate HIV prevalence to KABP among youth aged 15–24 years. KABP and HIV prevalence were also related to various socio-demographic variables, in a bid to find explanations and build knowledge in the contextual understanding of the epidemic in Zimbabwe. In addition, the results of the BSS would serve as a basis for policy decision-making and implementation of interventions that are intended to mitigate problems associated with HIV and AIDS.
The results in this study are based on random sampling of wards and households in the whole district. The employment of this method makes the sample representative of the whole district and therefore can be generalised across the population in Chimanimani. Thus, generalised conclusions can be made from the results of this study:
• Most households reported that they did not have enough money for basic needs, signifying that poverty is a major problem in the community. Coupled with poverty is the fact that most of the respondents mentioned ‘food’ as the main need for OVC.
• The level of literacy is relatively high with 70% of respondents having reached secondary school and above. This is an important factor to consider in developing communication strategies for HIV/AIDS programmes.
• There is a problem of orphans in the district. The higher proportion of paternal orphanhood implies that more men than women are dying.
• Most of the respondents in the 15–24 age group were single and never married and this is indicative of the decrease in early marriages, especially among females.
• The dominant religion was the Apostolic sect. Thus, HIV/AIDS programmes need to be cognisant of the role of religion in the socialisation process (in shaping the perceptions, attitudes, beliefs, sexual practices, responses to external support and their general life-worlds around HIV and AIDS).
• Traditional rites of passage were practised more among teenage girls than boys and this signifies the resilience of cultural concerns about maintaining chastity in unmarried girls in the community.
• The dependency burden (under the age of 18 years) reported by the respondents is quite significant (31.7% with mean number of dependants of 2.3). Most of the respondents who carry this burden were females, thus confirming findings from other studies that women are the primary caregivers of OVC.
• Alcohol abuse was not reported as a problem in the district. • HIV prevalence differed amongst males and females and sectors, and was also significantly
high among those who were married compared to those who were single/never married.• The findings provide important insights into understanding behaviour and practices that
predispose people to the risk of HIV infection and so will assist in informing intervention and policy formulation in relation to prevention, care, and support.
• The findings also provide a basis for forecasting of estimates of HIV prevalence and the possible impacts. Thus, the findings can be used in the planning of mitigatory initiatives and other strategies for prevention of new infections, behavioural change, care and treatment for people living with HIV/AIDS and for reducing the impact of HIV and AIDS.
• This study demonstrated the gender differences in the impact of the epidemic, with higher HIV prevalence among females compared to males. The differences may also be attributable to the economic situation of women who are by and large dependent on men, and due to engendered power differences cannot decide on prevention methods.
• A much lower proportion of females reported ever using a condom compared to males. Some social explanations of the differences centre on gender inequality, especially around condom use within and outside marriage.
Free
dow
nloa
d fr
om w
ww
.hsr
cpre
ss.a
c.za

Survey of HIV prevalence and behaviour in Chimanimani
94
• The levels of knowledge and awareness of the important aspects of HIV/AIDS were quite high in the surveyed population.
• General knowledge about HIV and AIDS was relatively high but specific knowledge about transmission was low. In contrast to the latter, knowledge of ways of protecting self was relatively high. These specific intervention areas need to be strengthened.
• There are however, some aspects of knowledge that need to be addressed, especially those that demonstrate the resilience of culture. Issues include the following incorrect knowledge and perceptions: HIV transmission and kissing; the witchcraft myth; that HIV can be prevented by taking certain medicines; that HIV can be cured by having sex with a virgin; and protection by only having sex with someone you really love, amongst others.
• Education was a determinant of knowledge. Knowledge increased with education, suggesting increased access to information and prevention intervention programmes as levels of education increased. Education may thus improve the person’s ability to act on prevention and awareness messages.
• VCT services are not widely used and it is evident that these services are mainly used by females seeking antenatal care.
• Most youth had sex for the first time when they were in their teens and males were generally sexually active at an earlier age than females.
• Sexual activity was also determined by place of residence, with most of the sexually active youth living in the large and small-scale commercial sectors. The clustering of populations in these sectors increases exposure of youth to the risk of HIV infection.
5.6. Recommendations
• Early childhood education on HIV/AIDS and reproductive health should be supported in the district.
• Interventions to enhance awareness and knowledge about HIV/AIDS among youth should be strengthened, particularly in urban and communal sectors.
• Intervention initiatives should educate people on the predisposing factors of HIV infection.• Multi-sectoral HIV prevention and care efforts in the community need to be
supported and strengthened.• Gender mainstreaming should be considered when designing intervention
programmes because the gendered differences noted in this study are important.• More has to be done to address HIV/AIDS information needs correctly and directly
and these strategies should ideally use interactive communication methods. Research should be geared toward revealing the underlying factors in existing myths and misconceptions around HIV/AIDS and addressing them through cultural agents working at community level.
• Interventions for poverty alleviation should be considered. Income generating projects will go a long way towards reducing risk behaviour and risk of infection – economic and social empowerment of women should be emphasised.
• VCT services should be expanded and should promote wide usage and these should be extended to males, services should continue to encourage people to get tested even if they think their behaviour is not risky, and the promotion of personal motivation for VCT should be emphasised.
• The use of condoms should be promoted, emphasising correct and consistent use, and should target those individuals who are, due to their circumstances, likely to spread HIV e.g. divorcees, those on separation, widows and commercial sex workers.
• Funds should be committed towards employing more health personnel and medical care, ensuring capacity building for community structures and activities in key response areas like home-based care.
Free
dow
nloa
d fr
om w
ww
.hsr
cpre
ss.a
c.za
CHAPTER 6
95
6. Results for age group 25+ years6.1. Introduction
The impact of HIV and AIDS on people’s lives has been amply demonstrated. Similarly social systems and economies have not been spared. Yet, despite massive efforts, the epidemic continues to grow, suggesting that interventions may not be as effective due to lack of a detailed understanding of the transmission and response dynamics at individual, community and national levels. This calls for a clear articulation of the transmission dynamics for specific population groups, delineating the fundamental determinants. The list of determinants is broad and includes:• Income and the economic environment, for example, employment, education,
as well as absolute and, more importantly, relative poverty;• The physical environment, for example, dual homes, housing adequacy and
neighbourhood safety;• Early childhood experiences, for example, education, nourishment, sexual and
physical or emotional abuse;• Cultural or community factors, including personal health and sexual practices,
gender inequality, community pressures and behaviours; and • Health services, for example, access to cultural and gender-appropriate services, and
equitable access to prevention, care, treatment and support services.
The adult HIV prevalence of 25% means that one in four Zimbabwean adults is living with HIV and AIDS. This translates into a huge number of infected people, who are in fact the reproductive and economically productive.
An understanding of the extent and magnitude of HIV infection among adults above 25 years is important in the prioritisation, design, implementation and evaluation of programmes to support HIV-infected people. It is equally important to understand the extent and depth of knowledge about HIV and AIDS among adults, in order to design appropriate interventions that ensure improved care and protection of HIV infected adults. Such information is essential to inform policy makers and service providers at both a national and local level in designing and/or strengthening prevention, care and support and mitigatory programmes.
Only a few large-scale population-based national studies have been carried out in Zimbabwe to explore behavioural, social and other determinants of HIV and AIDS. The present BSS aimed to generate information that would enhance our understanding of the spread of the epidemic.
Free
dow
nloa
d fr
om w
ww
.hsr
cpre
ss.a
c.za

Survey of HIV prevalence and behaviour in Chimanimani
9696
6.2. Objectives
The general objective of the behavioural risks baseline survey was to determine HIV prevalence, KABP with regards prevention, care and support, and human rights among adults 25+ years old in Chimanimani district.
6.3. Methodology
The detailed methodology is presented in Chapter 2. In brief, the cross sectional study was carried out in 13 randomly selected wards of Chimanimani district, Manicaland province, Zimbabwe. The study area was stratified into urban, rural, resettlement, and small and large scale commercial sectors. Out of the 13 wards, 763 households with adults above 25 years of age were randomly selected and questionnaires were administered to them. Dried blood spot (DBS) samples were collected from the adult respondents. The samples were tested for HIV using commercial HIV EIA kits. Ethical approval was sought from relevant authorities in Zimbabwe and South Africa (for HSRC). Data was entered using EPI6 and analysed using Stata statistical package.
6.4. Results
Table 9.1 shows that a total of 1 013 potential respondents were approached and of these, 792 (78.1%) completed the questionnaire and provided a blood samples for HIV testing. The refusal rate was 3.5%. For this age group, response rate was based on the proportion of sampled respondents who provided both the questionnaire and a blood sample.
Table 6.1: Distribution of response rate
Response rate
n %
Completed questionnaire with sample 792 78.1
Target respondent not at home 186 18.4
Refusals (sample + questionnaire) 35 3.5
Total questionnaires 1 013
Calculation of response rate
Response rate = Complete questionnaires with a sample
___________________________________________ Total questionnaires + refusals + respondents not at home
= 792 _____ 1 013 100 = 78.1%
Of the 792 respondents who provided completed questionnaires and blood samples, 29 (3.7%) had insufficient samples for HIV testing. The results that follow were based on the 763 respondents with complete questionnaires and sufficient samples.
Free
dow
nloa
d fr
om w
ww
.hsr
cpre
ss.a
c.za
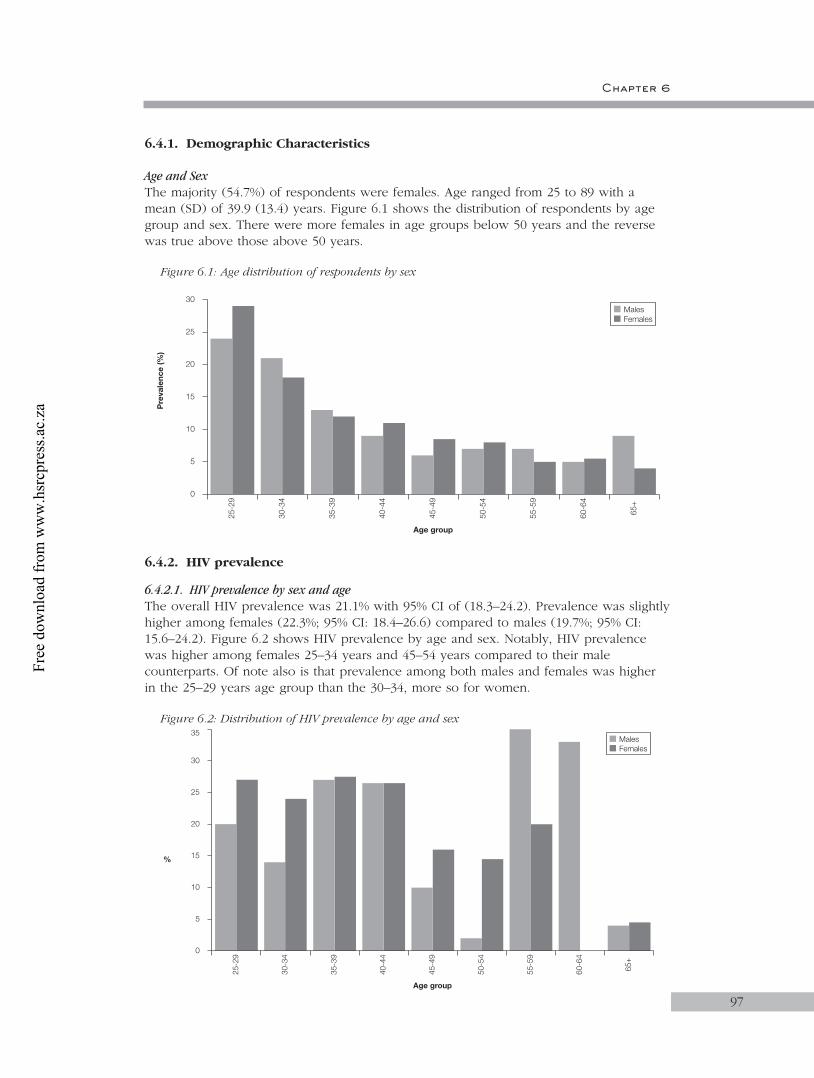
Chapter 6
9797
6.4.1. Demographic Characteristics
Age and SexThe majority (54.7%) of respondents were females. Age ranged from 25 to 89 with a mean (SD) of 39.9 (13.4) years. Figure 6.1 shows the distribution of respondents by age group and sex. There were more females in age groups below 50 years and the reverse was true above those above 50 years.
Figure 6.1: Age distribution of respondents by sex
6.4.2. HIV prevalence
6.4.2.1. HIV prevalence by sex and ageThe overall HIV prevalence was 21.1% with 95% CI of (18.3–24.2). Prevalence was slightly higher among females (22.3%; 95% CI: 18.4–26.6) compared to males (19.7%; 95% CI: 15.6–24.2). Figure 6.2 shows HIV prevalence by age and sex. Notably, HIV prevalence was higher among females 25–34 years and 45–54 years compared to their male counterparts. Of note also is that prevalence among both males and females was higher in the 25–29 years age group than the 30–34, more so for women.
Figure 6.2: Distribution of HIV prevalence by age and sex
5
25-2
9
Age group
Pre
vale
nce
(%)
30-3
4
35-3
9
40-4
4
45-4
9
50-5
4
55-5
9
0
10
15
20
25
30
60-6
4
65+
FemalesMales
5
25-2
9
Age group
%
30-3
4
35-3
9
40-4
4
45-4
9
50-5
4
55-5
9
0
10
15
20
25
30
60-6
4
65+
35
FemalesMales
Free
dow
nloa
d fr
om w
ww
.hsr
cpre
ss.a
c.za

Survey of HIV prevalence and behaviour in Chimanimani
9898
6.4.2.2. Marital status, religion, education and localityAlmost 80% of respondents were married (Table 6.2) while the majority of the adults had either primary school or secondary school education. Most respondents were from communal (43.3%) and resettlement areas (26.6%).
Table 6.2: Selected background characteristics of the sample
Demographic variable n %
Marital status (N=761)
Married 605 79.6
Cohabiting 45 5.9
Single/never married 46 6.0
Widowed 4 0.5
Divorced/separated 61 8.0
Religious grouping (N=654)
Apostolic sects 254 38.8
Pentecostal 158 24.2
Protestant 131 20.0
Catholic 66 10.1
Traditional/African 31 4.7
Other 14 2.2
Highest educational qualifications (N=763)
No schooling 67 8.8
Primary school 325 42.6
Secondary school 339 44.4
Tertiary 32 4.2
Sector (N=763)
Communal lands 330 43.3
Resettlement areas 198 26.0
Large-scale farming 153 20.1
Small-scale farming 24 3.2
Urban 58 7.6
Free
dow
nloa
d fr
om w
ww
.hsr
cpre
ss.a
c.za

Chapter 6
9999
6.4.2.3. HIV prevalence by marital status Overall, HIV prevalence was higher among the separated/divorced (34.8%), widowed (39.3%) and cohabiting (50%) than the married (17.7%) and single (24.4%). Stratification by sex shows similar trends but with significant differences among females only (Table 6.3). Furthermore, prevalence among single/never married females was more than twice as high as among single males.
Table 6.3: HIV prevalence by marital status
Marital status Males Females Total
N n (%) N n (%) N n (%) 95% (CI)
Married 300 57 (19.0) 305 50 (16.4) 605 107 (17.7) 14.7–21.0
Single/never married 30 5 (16.7) 15 6 (40.0) 45 11 (24.4) 12.9–39.5
Living together, cohabiting
– – 4 2 (50.0) 4 2 (50.0) 6.8–93.2
Divorced/separated 10 4 (40.0) 36 12 (33.3) 46 16 (34.8) 21.4–50.2
Widowed 4 1 (25.0) 57 23 (40.4) 61 24 (39.3) 27.1–52.7
Total 344 67 (19.5) 417 93 (22.3) 761 160 (21.0) 18.2–24.1
p=0.391 p <0.001 p <0.001
6.4.2.4. HIV prevalence by educationPrevalence was highest among respondents with secondary school education and lowest among those with no education at all (Table 6.4). These differences persisted after stratification by sex but were not statistically significant.
Table 6.4: HIV prevalence by education and sex
Educational level Males Females Total
N n (%) N n (%) N n (%)
No schooling 16 2 (12.5) 51 9 (17.7) 67 11 (16.4)
Primary school 130 25 (19.2) 195 44 (22.6) 325 69 (21.2)
Secondary school 178 36 (20.2) 161 39 (24.2) 339 75 (22.1)
Tertiary 22 5 (22.7) 10 1 (10.0) 32 6 (18.8)
Total 346 68 (19.7) 417 93 (22.3) 763 161 (21.1)
Free
dow
nloa
d fr
om w
ww
.hsr
cpre
ss.a
c.za

Survey of HIV prevalence and behaviour in Chimanimani
100
6.4.2.5. HIV prevalence by sector Overall, prevalence was highest in the urban and lowest in the SSC sector (Table 6.5). A similar but statistically insignificant trend was observed among males but not females. Among the latter, prevalence tended to be lower in communal lands and SSC, and equally high in urban and LSC sectors (Table 6.7). The pattern was different among men, with the lowest prevalence being recorded in the SSC and the highest in the resettlement sector.
Table 6.5: HIV prevalence by sector
Locality Type Males Females Total
N n (%) N n (%) N n (%) 95% (CI)
Communal lands 140 22 (15.7) 190 36 (19.0) 330 58 (17.6) 13.6–22.1
Resettlement areas 89 23 (25.8) 109 25 (22.9) 198 48 (24.2) 18.4–30.8
Large scale farming 82 17 (20.7) 71 20 (28.2) 153 37 (24.2) 17.6–31.8
Small scale farming 14 1 (7.1) 10 2 (20.0) 24 3 (12.5) 2.7–32.4
Urban 21 5 (23.8) 37 10 (27.0) 58 15 (25.9) 15.3–39.0
Total 346 68 417 93 763 161 (21.1) 18.3–24.2
p=0.266 p=0.529 p=0.173
6.4.2.6. HIV prevalence by household economic statusOverall, HIV prevalence tended to increase with improving household economic status. The same trend was observed among males and females with no significant differences between the sexes (Table 6.6).
Table 6.6: HIV prevalence by household economic status
Standard of living Males Females Total
N n (%) N n (%) N n (%) 95% (CI)
Not enough money for basics
242 45 (18.6) 338 73 (21.6) 580 118 (20.3) 17.1–23.9
Have basics, short of other things
66 11 (16.7) 51 12 (23.5) 117 23 (19.7) 12.9–28.0
Few luxuries 33 10 (30.3) 27 8 (29.6) 60 18 (30.0) 18.8–43.2
Money for holidays and luxury goods
1 0 (0.0) – – 1 0 (0.0) –
None of the above 4 2 (50.0) 1 0 (0.0) 5 2 (40.0) 5.3–85.3
Total 346 68 (19.7) 417 93 (22.3) 763 161 (21.1) 18.3–24.2
p=0.240 p=0.738 p=0.338
100
Free
dow
nloa
d fr
om w
ww
.hsr
cpre
ss.a
c.za

Chapter 6
101
6.4.2.7. HIV prevalence by employment statusPrevalence was slightly higher among the employed than the unemployed. The difference was more pronounced among females than males but was not statistically significant (Table 6.9).
Table 6.7: HIV prevalence by employment status
Employed Males Females Total
N n (%) N n (%) N n (%) 95% (CI)
Yes 144 31 (21.5) 50 16 (32.0) 194 47 (24.2) 18.4–30.9
No 202 37 (18.3) 365 77 (21.1) 567 114 (20.1) 16.9–23.6
Total 346 68 (19.7) 415 93 (22.4) 761 161 (21.2) 18.2–24.1
p=0.459 p=0.309 p=0.570
6.4.2.8. Dependency burdenOverall, 86.8% of respondents reported that they had at least one dependant aged 18 years or below. Dependency burden was higher among females (90.2%) than males (86.8%) but the difference was not statistically significant.
Table 6.8 shows that there were no differences in HIV prevalence between those with dependants, and those who did not have.
Table 6.8: HIV prevalence by dependency burden
Has dependants Males Females Total
N n (%) N n (%) N n (%) 95% CI
Yes 286 56 (19.6) 376 82 (21.8) 662 138 (20.8) (17.8–24.1)
No 60 12 (20.0) 41 11 (26.8) 101 23 (22.8) (15.0–32.2)
Total 346 68 (19.7) 417 93 (22.3) 763 161 (21.1) 18.3–24.2
p=0.941 p=0.463 p=0.659
6.4.2.9. Discussion: HIV prevalence by demographics characteristics
HIV prevalence by age and sex:The overall HIV prevalence of 21.1% was lower than the national overage of 24.6% but falls within the confidence interval, suggesting no significant difference. That prevalence was higher among females is not surprising. Women are at greater risk of HIV infection for various reasons, including cultural and economic reasons. Prevalence was consistently high among women 25–44 while it peaked between 35–44 years among men, reflecting that women are getting infected earlier than men.
101
Free
dow
nloa
d fr
om w
ww
.hsr
cpre
ss.a
c.za
Survey of HIV prevalence and behaviour in Chimanimani
102
HIV prevalence by marital status:Although no significant associations were observed, the tendency towards higher HIV prevalence among the widowed, separated and divorced has been reported in other studies. Similarly the cohabiting are at increased risk. Contrary to observations in earlier studies in Zimbabwe and elsewhere, the married were at lowest risk. This may suggest that married couples are heeding prevention messages and protecting themselves by either sticking to their married partners or using condoms with extra-marital partners.
HIV prevalence by sector:Although not significant, the sectoral differences in HIV prevalence may suggest differences in access to information about HIV and AIDS. The relatively high prevalence in the urban sector and lower prevalence in communal areas may reflect what has been observed in the early stages of the epidemic – that prevalence is highest in urban centres and spreads to rural areas. Similarly, the relatively higher prevalence in the large-scale commercial sector has been reported in other studies (ZHDR, 2003).
HIV prevalence by education:There has always been an assumption that education improves knowledge about HIV and AIDS and hence leads to behaviour change. The present study shows no obvious association but a tendency towards lower prevalence among those with no education at all.
HIV prevalence by employment status and dependency:The findings show that there is high HIV prevalence among employed females. Most of the females who were employed and HIV-positive were widows. The most probable reason for the death of their husbands could be HIV. It is important to note that a considerable proportion of employed married women (37.5%) were HIV-positive. This possibly suggests that there is high rate of unprotected sex with multiple partners in both sexes (employed women and their husbands). It is important to note that females were at higher risk of HIV infection compared to males, irrespective of their employment status.
6.4.3. HIV prevalence and risk behaviour/practices
6.4.3.1. Circumcision among malesOf the 346 males, 26 (7.5%) reported having been circumcised. The mean (SD) age at circumcision was 11.2 (7.4) years. More than half of the circumcised male adults were circumcised at home. Four did not know where they were circumcised.
HIV prevalence by circumcision:Table 6.9 shows that the prevalence of HIV was slightly higher among the those reporting circumcision compared to those who did not.
102
Free
dow
nloa
d fr
om w
ww
.hsr
cpre
ss.a
c.za

Chapter 6
103
Table 6.9: HIV prevalence by circumcision
Circumcision Males
N n (%) 95% CI
Yes 26 6 (23.1) (9.0 – 43.6)
No 319 62 (19.4) (15.2 – 24.2)
Total 345 68 (19.7) (15.6–24.3)
p=0.800
6.4.3.2. Self-reported behaviour changeThe respondents’ HIV induced behaviour change was assessed. Nearly half of the respondents (48.0%) reported having changed their behaviour in the face of HIV and AIDS. More males than females reported changing their behaviour (Table 6.10).
Table 6.10: Distribution of respondents by self-reported behaviour change
Change of sexual behaviour MalesN=346
FemalesN=417
TotalN=763
n % n % n %
Yes 215 62.1 151 36.2 366 48.0
No 131 37.9 265 63.6 396 51.9
Not stated 0 0.0 1 0.2 1 0.1
6.4.3.3. HIV prevalence by reported change of sexual behaviourHIV prevalence was significantly higher among females than males reporting behaviour change while the reverse, albeit not significant, was true among those not reporting behaviour change (Table 6.11). Furthermore, prevalence was significantly higher among females reporting behaviour change compared to those who did not (32.5% vs 17.4%; p=0.002) while no differences were observed among males (20.4% vs 20.0%; p=0.855, respectively).
Table 6.11: HIV prevalence by reported change of sexual behaviour
Change of sexual behaviour Changed Did not change
N n (%) N n (%)
Males 215 45 (20.4) 90 18 (20.0)
Females 151 49 (32.5) 161 28 (17.4)
Total 366 94 (25.7) 251 46 (18.3)
(95% CI) (21.3–30.5) (13.7–23.8)
p=0.013 p=0.608
103
Free
dow
nloa
d fr
om w
ww
.hsr
cpre
ss.a
c.za
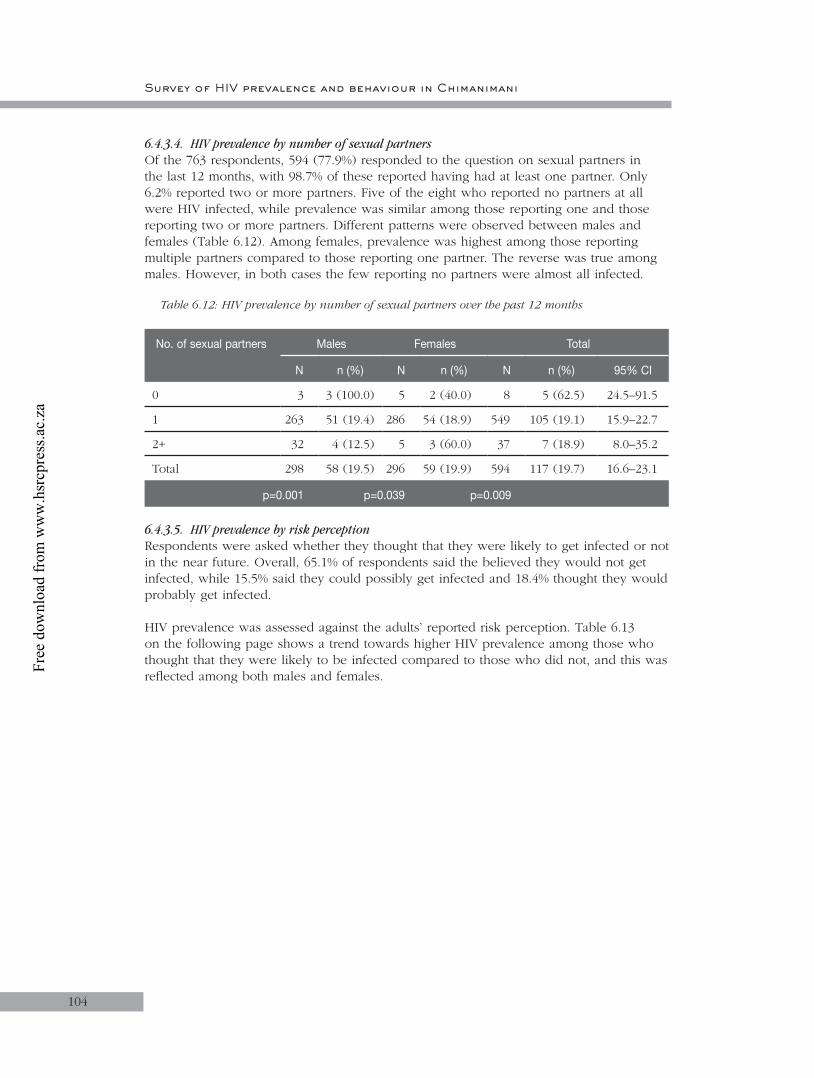
Survey of HIV prevalence and behaviour in Chimanimani
104
6.4.3.4. HIV prevalence by number of sexual partnersOf the 763 respondents, 594 (77.9%) responded to the question on sexual partners in the last 12 months, with 98.7% of these reported having had at least one partner. Only 6.2% reported two or more partners. Five of the eight who reported no partners at all were HIV infected, while prevalence was similar among those reporting one and those reporting two or more partners. Different patterns were observed between males and females (Table 6.12). Among females, prevalence was highest among those reporting multiple partners compared to those reporting one partner. The reverse was true among males. However, in both cases the few reporting no partners were almost all infected.
Table 6.12: HIV prevalence by number of sexual partners over the past 12 months
No. of sexual partners Males Females Total
N n (%) N n (%) N n (%) 95% CI
0 3 3 (100.0) 5 2 (40.0) 8 5 (62.5) 24.5–91.5
1 263 51 (19.4) 286 54 (18.9) 549 105 (19.1) 15.9–22.7
2+ 32 4 (12.5) 5 3 (60.0) 37 7 (18.9) 8.0–35.2
Total 298 58 (19.5) 296 59 (19.9) 594 117 (19.7) 16.6–23.1
p=0.001 p=0.039 p=0.009
6.4.3.5. HIV prevalence by risk perceptionRespondents were asked whether they thought that they were likely to get infected or not in the near future. Overall, 65.1% of respondents said the believed they would not get infected, while 15.5% said they could possibly get infected and 18.4% thought they would probably get infected.
HIV prevalence was assessed against the adults’ reported risk perception. Table 6.13 on the following page shows a trend towards higher HIV prevalence among those who thought that they were likely to be infected compared to those who did not, and this was reflected among both males and females.
104
Free
dow
nloa
d fr
om w
ww
.hsr
cpre
ss.a
c.za
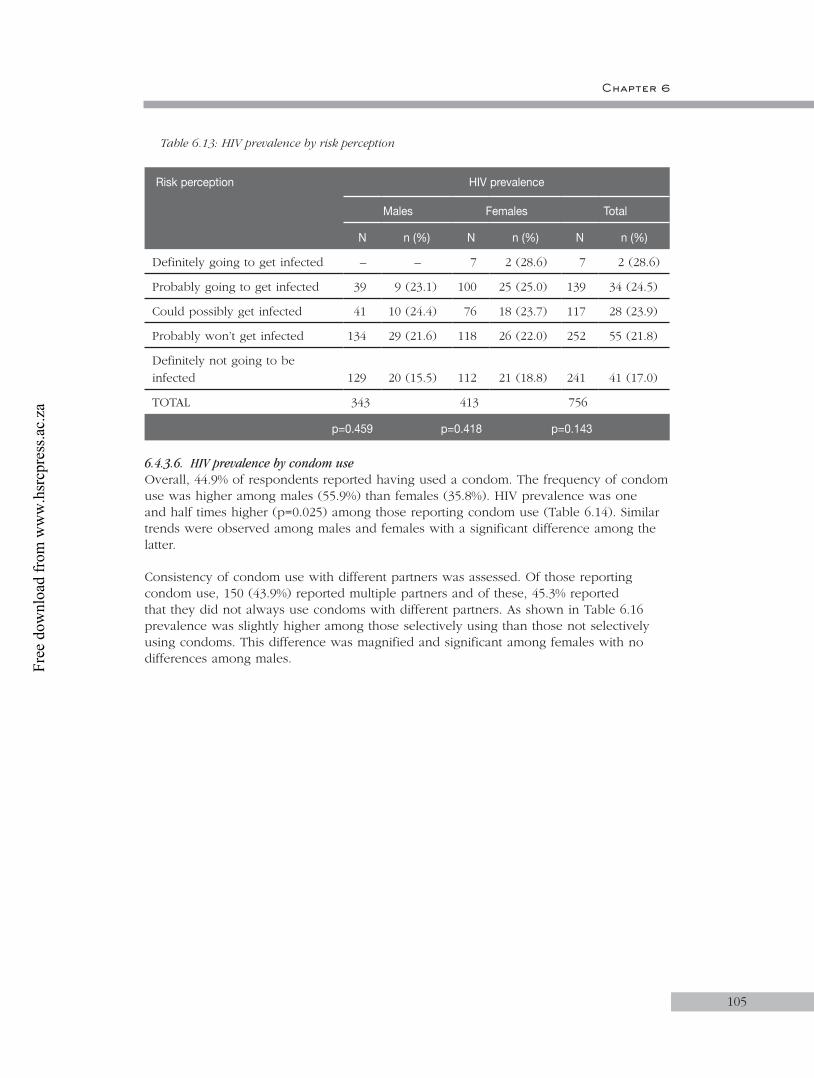
Chapter 6
105
Table 6.13: HIV prevalence by risk perception
Risk perception HIV prevalence
Males Females Total
N n (%) N n (%) N n (%)
Definitely going to get infected – – 7 2 (28.6) 7 2 (28.6)
Probably going to get infected 39 9 (23.1) 100 25 (25.0) 139 34 (24.5)
Could possibly get infected 41 10 (24.4) 76 18 (23.7) 117 28 (23.9)
Probably won’t get infected 134 29 (21.6) 118 26 (22.0) 252 55 (21.8)
Definitely not going to be infected 129 20 (15.5) 112 21 (18.8) 241 41 (17.0)
TOTAL 343 413 756
p=0.459 p=0.418 p=0.143
6.4.3.6. HIV prevalence by condom useOverall, 44.9% of respondents reported having used a condom. The frequency of condom use was higher among males (55.9%) than females (35.8%). HIV prevalence was one and half times higher (p=0.025) among those reporting condom use (Table 6.14). Similar trends were observed among males and females with a significant difference among the latter.
Consistency of condom use with different partners was assessed. Of those reporting condom use, 150 (43.9%) reported multiple partners and of these, 45.3% reported that they did not always use condoms with different partners. As shown in Table 6.16 prevalence was slightly higher among those selectively using than those not selectively using condoms. This difference was magnified and significant among females with no differences among males.
105
Free
dow
nloa
d fr
om w
ww
.hsr
cpre
ss.a
c.za

Survey of HIV prevalence and behaviour in Chimanimani
106
Table 6.14: HIV prevalence by condom use
Use condoms HIV prevalence
Males Females Total
N n (%) N n (%) N n(%)
Yes 193 43 (22.3) 149 44 (29.5) 342 87 (25.4)
No 152 25 (16.5) 267 49 (18.4) 419 74 (17.7)
TOTAL 345 416 761
p=0.176 p=0.009 p=0.025
Use condoms with some partners and not with others
Yes 53 11 (20.8) 15 10 (66.7) 68 21 (30.9)
No 51 10 (19.8) 30 7 (23.3) 81 17 (21.0)
N/A (only one partner) 89 22 (24.7) 103 26 (25.2) 192 48 (25.0)
TOTAL 193 148 341*
p=0.746 p=0.003 p=0.182
* NB: Of those who used condoms, one female respondent did not answer the question on selective use of condoms.
Overall, 10.2% of respondents reported having ever been tested for HIV. Slightly more males (11.3%) than females (9.2%) reported ever being tested for HIV. HIV prevalence was higher among those reporting ever being tested but this was significant only among males (Table 6.15).
Table 6.15: Prevalence of HIV by history of HIV testing
Ever been tested for HIV HIV prevalence
Males Females Total
N n (%) N n (%) N n (%)
Yes 39 13 (33.3) 38 11 (29.0) 77 24 (31.2)
No 306 55 (18.0) 375 82 (21.9) 681 137 (20.1)
TOTAL 345 413 758
p=0.010 p=0.319 p=0.040
6.4.3.7. Reported STIs by sexOverall, 7.5% of respondents reported having had an STI in the last 12 months with no difference between males and females (6.7% versus 8.2%; (p<0.05)). The distribution of types of reported STIs is shown in Table 6.16.
106
Free
dow
nloa
d fr
om w
ww
.hsr
cpre
ss.a
c.za

Chapter 6
107
Table 6.16: Distribution of types of reported STIs by sex
Signs and symptoms of STI Males N=346
Females N=417
TotalN=763
n (%) n (%) n (%)
Sores/ulcers on genitals in the last 3 months
YesNo Not stated
10 (2.9)335 (96.8)
1 (0.3)
8 (1.9)408 (97.8)
1 (0.2)
18 (2.4)743 (97.4)
2 (0.3)
Abnormal genital discharge in the last 3 months
YesNoNot stated
12 (3.5)333 (96.2)
1 (0.3)
25 (6.0)391 (93.8)
1 (0.2)
37 (4.8)724 (94.9)
2 (0.3)
Genital warts YesNoNot stated
8 (2.3)337 (97.4)
1 (0.3)
8 (1.9)408 (97.8)
1 (0.2)
16 (2.1)745 (97.6)
2 (0.3)
6.4.3.8. HIV prevalence by self-reported history of STIsHIV prevalence was twice as high among those reporting an STI than those with no history of STI in the previous 12 months (Table 6.17). The difference was more evident among females than males.
Table 6.17: HIV prevalence by self-reported history of STIs
Reported history of STI
Males Females Totals
N n (%) 95% CI N n (%) 95% CI N n (%)
YesNo
23322
5 (21.7)63 (19.6)
7.4–43.715.4–24.3
34382
17 (50.0)76 (19.9)
32.4–67.616.0–24.3
57704
22 (38.6)139 (19.7)
TOTAL 345 68 (19.7) 15.6–24.3 416 93 (22.4) 18.4–26.7 761 161 (21.2)
6.4.3.9. Discussion: HIV, sexuality and sexual behaviour
HIV prevalence by circumcision:This study has shown no association between circumcision and HIV prevalence, that being contrary to other studies. While being circumcised may reduce likelihood of infection during unprotected sex, the practice of circumcision itself can be risky if appropriate protective measures are not observed.
107
Free
dow
nloa
d fr
om w
ww
.hsr
cpre
ss.a
c.za

Survey of HIV prevalence and behaviour in Chimanimani
108
HIV prevalence by change of sexual behaviour:A significant proportion of respondents reportedly changed their behaviour as a result of HIV and AIDS, suggesting that either their personal and community observations or interventions were influencing the change. Behaviour is influenced by a number of socio-cultural and environmental factors. Hence, the lack of association between perceived behaviour change and HIV needs to be viewed cautiously and further analysed in relation to various other factors that may confound or interact with each other.
HIV prevalence by risk perception:The results of the assessment of prevalence against the adults’ self-reported risk perception showed higher HIV prevalence among females who stated that they were either definitely or probably going to be infected. No males were courageous enough to report that they were already infected. What the respondents believed themselves to be may not translate to be what they really were. The results also showed a high proportion of infected adults who reported that they were probably going to get infected and could possibly get infected. These reports reflect a crisis in behavioural change in the face of the widespread pandemic.
Prevalence by ever being tested for HIV:Prevalence was higher for males who had been tested for HIV compared to those who had not been tested.
Prevalence by condom use:The results showed higher HIV infection in females and males who used condoms than in those who did not use condoms. This may be because condoms do not reduce risk if they are not correctly and consistently used or possibly because of positive effects of VCT programmes in the community, which encourage people to use condoms despite their positive sero-status. The majority of females who reported that they used condoms with some sexual partners and not with others were HIV-infected. Intervention programmes need to emphasise consistent and proper use of condoms among both males and females.
HIV prevalence by morbidity:The results show that HIV prevalence was high among adults who reported none of the mentioned signs and symptoms of STIs, HIV and AIDS. The probable reasons could be that participants lied or they do not know the signs and symptoms of STI, HIV or AIDS.
Tuberculosis is a disease that is associated with HIV and has been identified as the leading cause of death in HIV/AIDS patients in sub-Saharan Africa (Jackson, 2002). In Zimbabwe, Malawi, Uganda and Zambia, 45–65% of TB patients are HIV-positive and the disease is on the increase for the first time in many years. Almost half of the females who reported that they had coughed for more than a month were positive. Three quarters of the males who reported that they had treatment of TB were HIV-positive. The results obtained from both males and females established/confirmed the association between prevalence of HIV and TB.
6.4.4. Substance abuse
Overall, nearly a quarter of respondents reported taking alcohol, with six times as many males as females reporting alcohol use (Table 6.18). Of those who reported drinking alcohol, 41.4% did so once a month or less, while the remainder drank at most three times a week or more (Table 6.19).
Free
dow
nloa
d fr
om w
ww
.hsr
cpre
ss.a
c.za

Chapter 6
109
Table 6.18: Alcohol use by gender
Substance abuseDo you drink alcohol
MalesN=346
FemalesN= 417
TotalN=763
n (%) n (%) n (%)
YesNo
152193
43.955.8
29386
7.092.6
181579
23.775.8
6.4.4.1. HIV prevalence by alcohol abuseHIV prevalence was higher among both males and females who reported alcohol use (Table 6.19). Among females, HIV prevalence increased with increasing frequency of alcohol use.
Table 6.19: HIV prevalence by alcohol consumption
Type of substance Males Females Total
N n (%) N n (%) N n (%)
Drink alcoholYesNo
346152 (43.9)193 (55.8)
41729 (7.0)
386 (92.6)
763181 (23.7)579 (75.8)
FrequencyOnce a month or lessOnce a weekTwo-three times a weekEveryday
15264 (42.1)49 (32.2)33 (21.7)
5 (3.3)
2911 (37.9)6 (20.7)6 (20.7)1 (3.5)
18175 (41.4)55 (30.4)39 (21.5)
6 (3.3)
6.4.4.2. Discussion: HIV and alcohol useSeveral studies have linked alcohol use and increased risk of HIV infection (Jackson, 2002). The observation that prevalence was higher among men who used alcohol in the present study is in agreement with these studies. That more males were taking alcohol as compared to females may reflect a cultural influence where women are generally discouraged from taking alcohol. Although fewer women used alcohol, they were at greater risk of HIV infection than men who used alcohol, suggesting a possible link between reported alcohol use and transactional and casual sex among women. This is further reflected by the observation that HIV prevalence increased with increasing frequency of alcohol use.
6.4.5. Stigma
6.4.5.1. Attitudes towards PLWHASeveral questions were used to assess attitudes towards PLWHA and HIV-related issues. Responses to the questions are shown in Table 6.20 and Table 6.21. Generally, the majority of respondents expressed positive attitudes towards PLWHA, and there were no differences between males and females. However, of note, over a third of both males and females thought that infected children should be isolated and about two thirds thought that HIV-infected women should not be trusted as babysitters.
Free
dow
nloa
d fr
om w
ww
.hsr
cpre
ss.a
c.za

Survey of HIV prevalence and behaviour in Chimanimani
110
Table 6.20: Attitudes towards PLWHA
Stigmatising statements Totals(N=763)
Agree Neutral Disagree
n % n % n %
Would not buy from shopkeeper who is HIV-positive
217 28.4 28 3.7 518 67.9
Woman would be foolish to marry a man with HIV/AIDS
479 62.8 49 6.4 235 30.8
Women with HIV/AIDS cannot be trusted as babysitters
460 60.3 59 7.7 244 32.0
One of the main reasons people become HIV is being weak and foolish
587 76.9 49 6.4 127 16.4
Government should not introduce extra levy or tax for HIV/AIDS
266 34.9 100 13.1 397 52.0
Would have problems having protected sex with partner who has HIV/AIDS
284 37.2 111 14.6 368 48.2
Waste of money to train/promote someone with HIV/AIDS
289 37.9 41 5.4 433 56.8
People who have HIV cannot be trusted 434 56.9 88 11.5 241 31.6
People with HIV/AIDS should use separate eating utensils to prevent infections
259 33.9 38 5.0 466 61.1
HIV-positive children should be kept separate from other children
221 29.0 46 6.0 496 65.0
People who have AIDS should expect some restrictions on their freedoms
175 22.9 49 6.4 539 70.6
Free
dow
nloa
d fr
om w
ww
.hsr
cpre
ss.a
c.za

Chapter 6
111
Table 6.21: Attitudes towards PLWHA by sex
Stigmatising statements
Males N=346
FemalesN=417
Agreen (%)
Neutraln (%)
Disagreen (%)
Agreen (%)
Neutraln (%)
Disagreen (%)
Would not buy from shopkeeper who is HIV-positive
92 (26.6) 12 (3.5) 242 (69.9) 125 (30.0) 16 (3.8) 276 (66.2)
Woman would be foolish to marry a man with HIV and AIDS
220 (63.6) 21 (6.1) 105 (30.4) 259 (62.1) 28 (6.7) 130 (31.2)
Women with HIV and AIDS cannot be trusted as babysitters
213 (61.6) 26 (7.5) 107 (30.9) 247 (59.2) 33 (7.9) 137 (32.9)
One of the main reasons people become HIV is being weak and foolish
280 (80.9) 19 (5.5) 47 (13.6) 307 (73.6) 30 (7.2) 80 (19.2)
Government should not introduce extra levy or tax for HIV and AIDS
123 (35.6) 32 (9.3) 191 (55.2) 143 (34.3) 68 (16.3) 206 (49.4)
Would have problems having protected sex with partner who has HIV and AIDS
122 (35.3) 41 (11.9) 183 (52.9) 162 (38.9) 70 (16.8) 185 (44.4)
Waste of money to train/promote someone with HIV and AIDS
135 (39.0) 17 (4.9) 194 (56.1) 154 (36.9) 24 (5.8) 239 (57.3)
People who have HIV cannot be trusted
197 (56.9) 33 (9.5) 116 (33.5) 237 (56.8) 55 (13.2) 125 (30.0)
➔
Free
dow
nloa
d fr
om w
ww
.hsr
cpre
ss.a
c.za
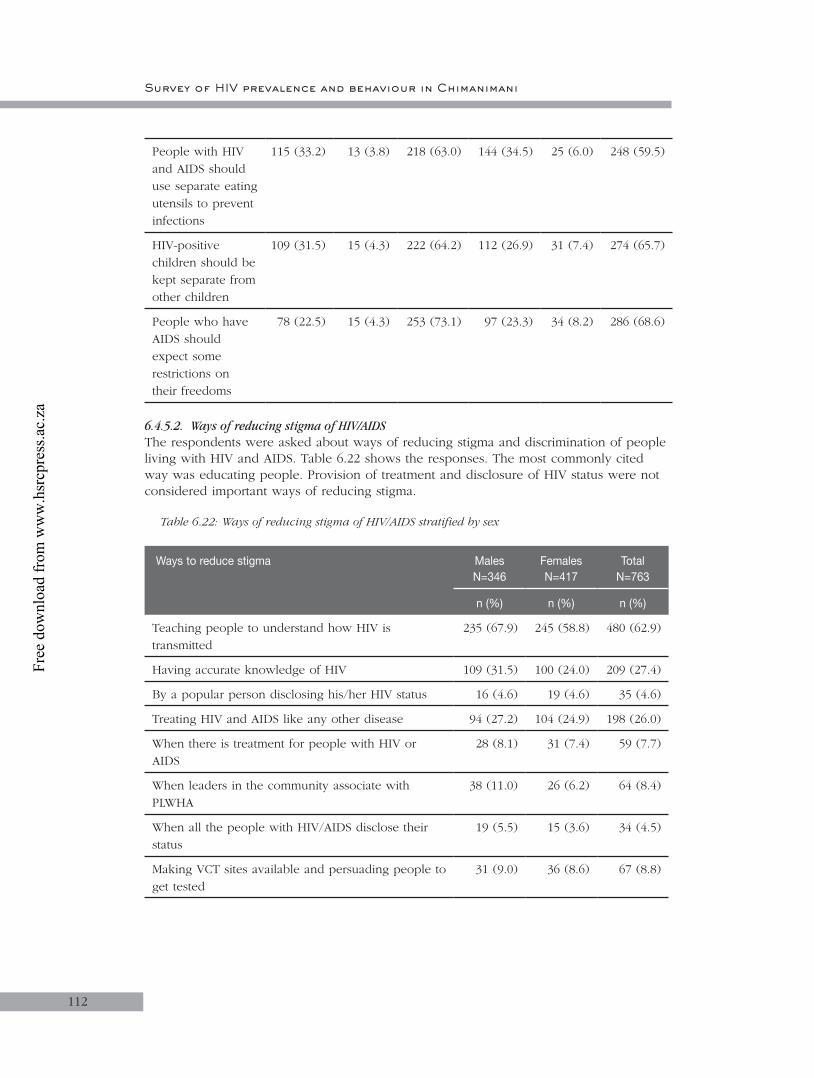
Survey of HIV prevalence and behaviour in Chimanimani
112
People with HIV and AIDS should use separate eating utensils to prevent infections
115 (33.2) 13 (3.8) 218 (63.0) 144 (34.5) 25 (6.0) 248 (59.5)
HIV-positive children should be kept separate from other children
109 (31.5) 15 (4.3) 222 (64.2) 112 (26.9) 31 (7.4) 274 (65.7)
People who have AIDS should expect some restrictions on their freedoms
78 (22.5) 15 (4.3) 253 (73.1) 97 (23.3) 34 (8.2) 286 (68.6)
6.4.5.2. Ways of reducing stigma of HIV/AIDSThe respondents were asked about ways of reducing stigma and discrimination of people living with HIV and AIDS. Table 6.22 shows the responses. The most commonly cited way was educating people. Provision of treatment and disclosure of HIV status were not considered important ways of reducing stigma.
Table 6.22: Ways of reducing stigma of HIV/AIDS stratified by sex
Ways to reduce stigma MalesN=346
Females N=417
TotalN=763
n (%) n (%) n (%)
Teaching people to understand how HIV is transmitted
235 (67.9) 245 (58.8) 480 (62.9)
Having accurate knowledge of HIV 109 (31.5) 100 (24.0) 209 (27.4)
By a popular person disclosing his/her HIV status 16 (4.6) 19 (4.6) 35 (4.6)
Treating HIV and AIDS like any other disease 94 (27.2) 104 (24.9) 198 (26.0)
When there is treatment for people with HIV or AIDS
28 (8.1) 31 (7.4) 59 (7.7)
When leaders in the community associate with PLWHA
38 (11.0) 26 (6.2) 64 (8.4)
When all the people with HIV/AIDS disclose their status
19 (5.5) 15 (3.6) 34 (4.5)
Making VCT sites available and persuading people to get tested
31 (9.0) 36 (8.6) 67 (8.8)
Free
dow
nloa
d fr
om w
ww
.hsr
cpre
ss.a
c.za

Chapter 6
113
6.4.5.3. Discussion: Stigma and discriminationThe survey showed that the majority of the population expressed attitudes of acceptance of PLWHA. Stigma and discrimination remain critical problems in Zimbabwe affecting HIV prevention and care, and contributing to denial and inaction (Zimbabwe Human Development Report, 2003). Of concern is the near one third of respondents who thought that infected children should be isolated and the nearly two thirds who could not trust their children with HIV-infected babysitters. This calls for more education about HIV and AIDS in the community.
6.4.6. Awareness on HIV and AIDS services
6.4.6.1. Awareness of HBCP directed at PLWHA in community Overall, about 40% of respondents were aware of HBCP in the community. The awareness did not differ between males and females. Similarly, there were no sectoral differences in awareness although respondents from communal lands tended to be more aware than in other sectors (Table 6.23).
Table 6.23: Awareness of HBCP directed at PLWHA in community
Variable Males Females Total
N n (%) N n (%) N n (%)
Age
25–49 252 90 (35.7) 329 129 (39.2) 581 219 (37.7)
50 and above 94 38 (40.4) 88 34 (38.6) 182 72 (39.6)
Total 346 417 763
p=0.419 p=0.922 p=0.663
Locality type
Communal lands 140 60 (42.9) 190 74 (39.0) 330 134 (40.6)
Resettlement areas 89 28 (31.5) 109 44 (40.4) 198 72 (36.4)
Large scale farming 82 27 (32.9) 71 31 (43.7) 153 58 (37.9)
Small scale farming 14 5 (35.7) 10 4 (40.0) 24 9 (37.5)
Urban 21 8 (38.1) 37 10 (27.0) 58 18 (31.0)
TOTAL 346 417 763
p=0.983 p=0.564 p=0.518
6.4.6.2. Providers of HBCP services directed towards PLWHA in communityTable 6.24 shows the reported HBCP service providers in the community. Over half the respondents (53.6%) cited CBOs, while about a third mentioned FBOs and NGOs as the main providers of home-based care. There also were small organisations (women’s groups and youth groups) providing HBC services in the community.
Free
dow
nloa
d fr
om w
ww
.hsr
cpre
ss.a
c.za
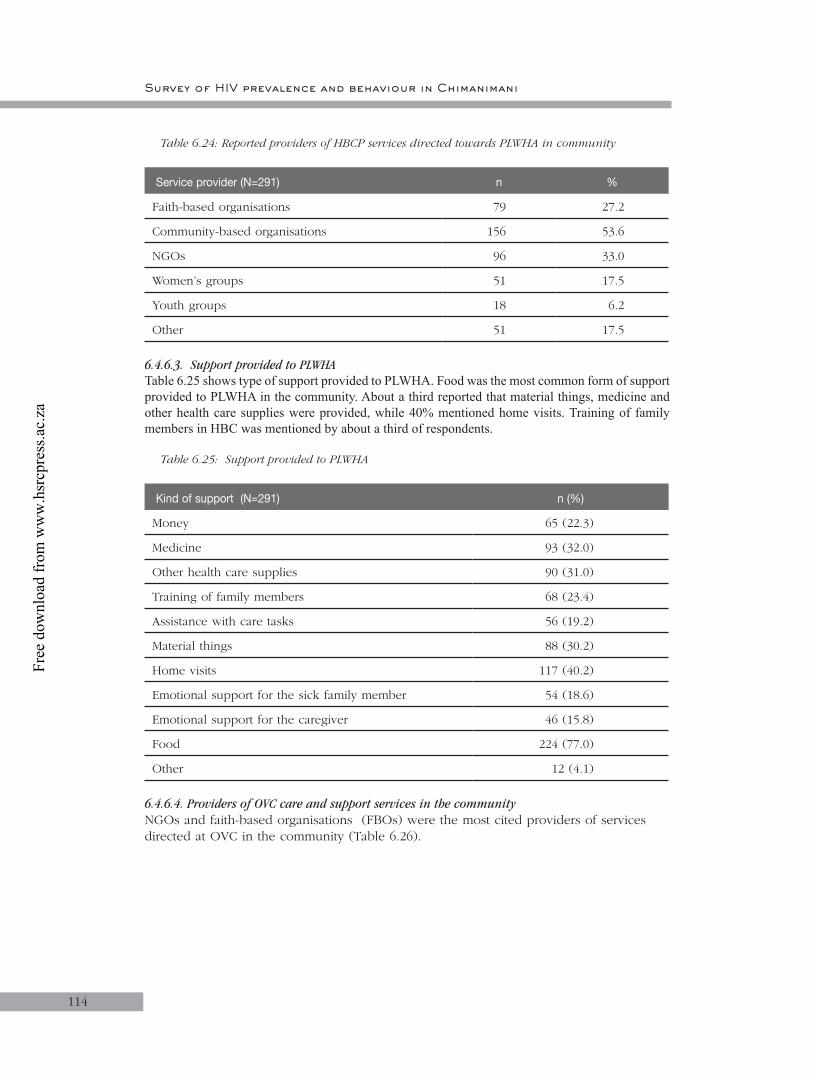
Survey of HIV prevalence and behaviour in Chimanimani
114
Table 6.24: Reported providers of HBCP services directed towards PLWHA in community
Service provider (N=291) n %
Faith-based organisations 79 27.2
Community-based organisations 156 53.6
NGOs 96 33.0
Women’s groups 51 17.5
Youth groups 18 6.2
Other 51 17.5
6.4.6.3. Support provided to PLWHATable 6.25 shows type of support provided to PLWHA. Food was the most common form of support provided to PLWHA in the community. About a third reported that material things, medicine and other health care supplies were provided, while 40% mentioned home visits. Training of family members in HBC was mentioned by about a third of respondents.
Table 6.25: Support provided to PLWHA
Kind of support (N=291) n (%)
Money 65 (22.3)
Medicine 93 (32.0)
Other health care supplies 90 (31.0)
Training of family members 68 (23.4)
Assistance with care tasks 56 (19.2)
Material things 88 (30.2)
Home visits 117 (40.2)
Emotional support for the sick family member 54 (18.6)
Emotional support for the caregiver 46 (15.8)
Food 224 (77.0)
Other 12 (4.1)
6.4.6.4. Providers of OVC care and support services in the communityNGOs and faith-based organisations (FBOs) were the most cited providers of services directed at OVC in the community (Table 6.26).
Free
dow
nloa
d fr
om w
ww
.hsr
cpre
ss.a
c.za

Chapter 6
115
Table 6.26: Reported providers of HBCP services directed at OVC in community
Provider (N=485) Rank (n) %
NGOs 224 46.2
Faith-based organisations 192 39.6
Community-based organisations 142 29.3
Other 127 26.2
Women’s groups 43 8.9
Youth groups 18 3.7
6.4.6.5. Types of support provided to OVCFood was reportedly the major form of support provided to the OVC (Table 6.27). Community-based organisations were commonly mentioned as the main providers of food, money and material things.
Table 6.27: Cited types of support provided to OVC
Kind of support (N=485) n (%)
Food 434 (89.5)
Material things 209 (43.1)
Money 180 (37.1)
Home visits 87 (17.9)
Medicine 37 (7.6)
Other health care supplies 37 (7.6)
Emotional support for the caregiver 37 (7.6)
Training of family members 33 (6.8)
Assistance with care tasks 28 (5.8)
Emotional support for the sick family member 24 (5.0)
Other 57 (11.8)
6.4.6.6. Illness in the household during the last 12 monthsAlthough respondents were not asked what type of diseases they were suffering from, 93 (12.2%) reported that they had a sick person in the household in the last 12 months.
6.4.6.7. Support provided to the household with a sick personOf the 93 respondents who reported having a sick person at home, the majority (81.9 %) mentioned that they received medicine from HBC providers. Nearly 50% of households with a sick member were visited by HBC providers, while a similar proportion mentioned that the sick received emotional support. Nearly 40% received food (Table 6.28).
Free
dow
nloa
d fr
om w
ww
.hsr
cpre
ss.a
c.za
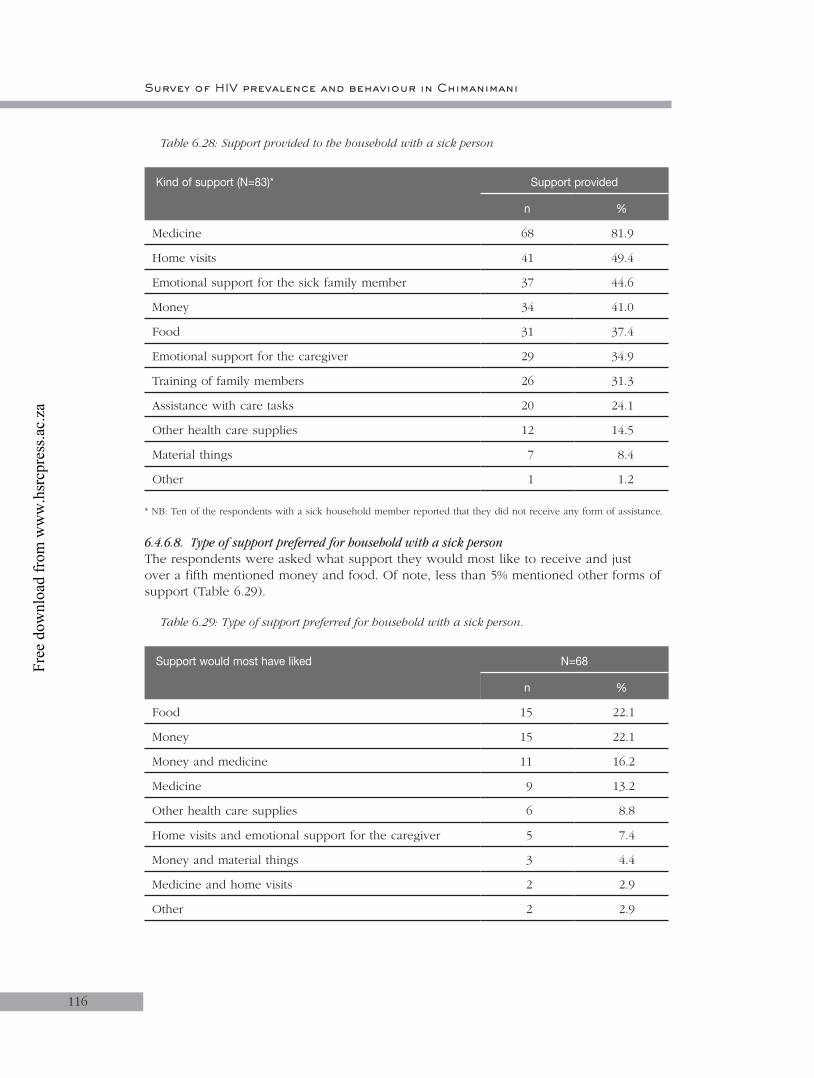
Survey of HIV prevalence and behaviour in Chimanimani
116
Table 6.28: Support provided to the household with a sick person
Kind of support (N=83)* Support provided
n %
Medicine 68 81.9
Home visits 41 49.4
Emotional support for the sick family member 37 44.6
Money 34 41.0
Food 31 37.4
Emotional support for the caregiver 29 34.9
Training of family members 26 31.3
Assistance with care tasks 20 24.1
Other health care supplies 12 14.5
Material things 7 8.4
Other 1 1.2
* NB: Ten of the respondents with a sick household member reported that they did not receive any form of assistance.
6.4.6.8. Type of support preferred for household with a sick personThe respondents were asked what support they would most like to receive and just over a fifth mentioned money and food. Of note, less than 5% mentioned other forms of support (Table 6.29).
Table 6.29: Type of support preferred for household with a sick person.
Support would most have liked N=68
n %
Food 15 22.1
Money 15 22.1
Money and medicine 11 16.2
Medicine 9 13.2
Other health care supplies 6 8.8
Home visits and emotional support for the caregiver 5 7.4
Money and material things 3 4.4
Medicine and home visits 2 2.9
Other 2 2.9
Free
dow
nloa
d fr
om w
ww
.hsr
cpre
ss.a
c.za

Chapter 6
117
6.4.6.9. Discussion Awareness on HBC directed at OVC and PLWHA in the community and services provided:
The study has shown that the majority of respondents were not aware of HBC services directed at PLWHA and OVC in their communities. There are two possible reasons for this observation. Firstly, the HBC service may be limited to few sites in the district, which may also explain why awareness was higher in communal lands than other sectors; or secondly stigma and denial may still be a major problem limiting participation in care and support of PLWHA and OVC. It is therefore important that this area be looked into in greater detail so as to come up with new strategies to raise awareness and hence increase use of HBCP and associated services in the community.
Apparently the major form of support provided is food while material things and medicines are a distant second. It is important to understand whether this is by demand or because providers perceive nutrition as a critical intervention for PLWHA. This is particularly relevant considering that the majority of those responding to the question on most desired support mentioned money. However, it is noteworthy that almost a third of respondents recognised that HBC were providing emotional support to the sick at home.
OVC care and support services are very limited in the community, and the most common form of support is food. Again it is critical that an assessment of the needs of OVC be done before providers introduce interventions.
6.4.6.10. HIV and AIDS prevention and care servicesThe respondents’ awareness about HIV and AIDS prevention and care services available in their communities was assessed. Table 6.30 shows the awareness levels about a number of services. The majority of respondents knew about HBC, while less than 10% knew about PMTCT, VCT, STI and welfare grant services. Of note, awareness about PMTCT was very low and there was no difference in awareness between males and females.
Table 6.30: Knowledge of HIV and AIDS prevention and care services available in community
Service Males(N=166)
Females (N=186)
Total(N=352)
n (%) n (%) n (%)
PMTCT 17 (10.2) 18 (9.7) 35 (9.9)
HIV and AIDS support groups 48 (28.9) 61 (32.8) 109 (31.0)
STI services 14 (8.4) 6 (3.2) 20 (5.9)
VCT 12 (7.2) 14 (7.5) 26 (7.4)
Home-based care 85 (51.2) 111 (59.7) 196 (55.7)
Nutrition programmes 45 (27.1) 58 (31.2) 103 (29.3)
Welfare grants 13 (7.8) 22 (11.8) 35 (9.9)
Other 30 (18.1) 22 (11.8) 52 (14.8)
Free
dow
nloa
d fr
om w
ww
.hsr
cpre
ss.a
c.za
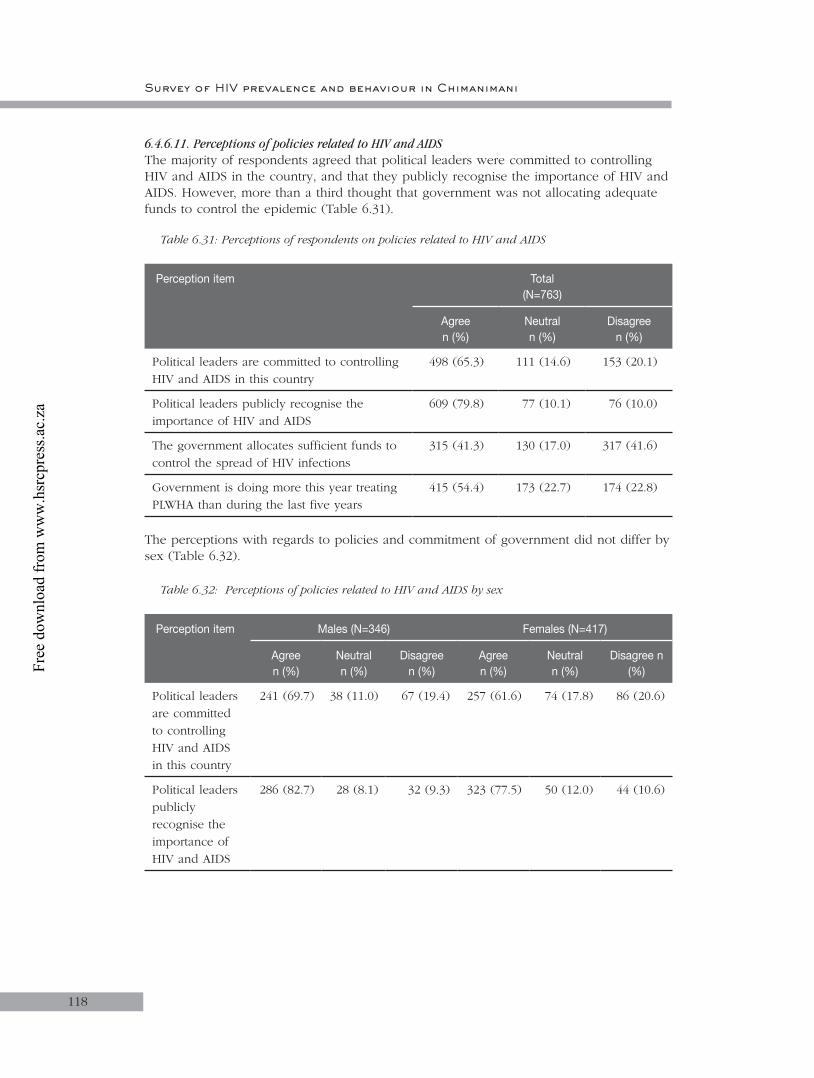
Survey of HIV prevalence and behaviour in Chimanimani
118
6.4.6.11. Perceptions of policies related to HIV and AIDSThe majority of respondents agreed that political leaders were committed to controlling HIV and AIDS in the country, and that they publicly recognise the importance of HIV and AIDS. However, more than a third thought that government was not allocating adequate funds to control the epidemic (Table 6.31).
Table 6.31: Perceptions of respondents on policies related to HIV and AIDS
Perception item Total(N=763)
Agree n (%)
Neutraln (%)
Disagreen (%)
Political leaders are committed to controlling HIV and AIDS in this country
498 (65.3) 111 (14.6) 153 (20.1)
Political leaders publicly recognise the importance of HIV and AIDS
609 (79.8) 77 (10.1) 76 (10.0)
The government allocates sufficient funds to control the spread of HIV infections
315 (41.3) 130 (17.0) 317 (41.6)
Government is doing more this year treating PLWHA than during the last five years
415 (54.4) 173 (22.7) 174 (22.8)
The perceptions with regards to policies and commitment of government did not differ by sex (Table 6.32).
Table 6.32: Perceptions of policies related to HIV and AIDS by sex
Perception item Males (N=346) Females (N=417)
Agree n (%)
Neutral n (%)
Disagree n (%)
Agreen (%)
Neutraln (%)
Disagree n (%)
Political leaders are committed to controlling HIV and AIDS in this country
241 (69.7) 38 (11.0) 67 (19.4) 257 (61.6) 74 (17.8) 86 (20.6)
Political leaders publicly recognise the importance of HIV and AIDS
286 (82.7) 28 (8.1) 32 (9.3) 323 (77.5) 50 (12.0) 44 (10.6)
Free
dow
nloa
d fr
om w
ww
.hsr
cpre
ss.a
c.za
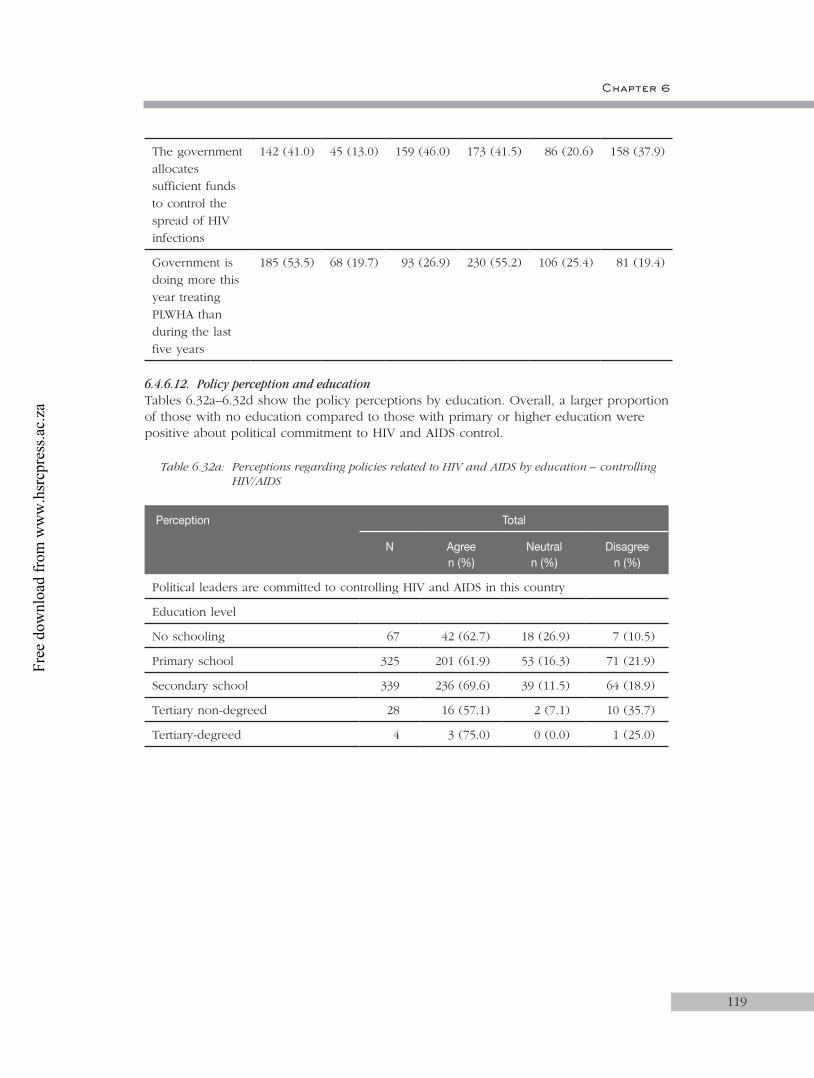
Chapter 6
119
The government allocates sufficient funds to control the spread of HIV infections
142 (41.0) 45 (13.0) 159 (46.0) 173 (41.5) 86 (20.6) 158 (37.9)
Government is doing more this year treating PLWHA than during the last five years
185 (53.5) 68 (19.7) 93 (26.9) 230 (55.2) 106 (25.4) 81 (19.4)
6.4.6.12. Policy perception and educationTables 6.32a–6.32d show the policy perceptions by education. Overall, a larger proportion of those with no education compared to those with primary or higher education were positive about political commitment to HIV and AIDS control.
Table 6.32a: Perceptions regarding policies related to HIV and AIDS by education – controlling HIV/AIDS
Perception Total
N Agreen (%)
Neutral n (%)
Disagreen (%)
Political leaders are committed to controlling HIV and AIDS in this country
Education level
No schooling 67 42 (62.7) 18 (26.9) 7 (10.5)
Primary school 325 201 (61.9) 53 (16.3) 71 (21.9)
Secondary school 339 236 (69.6) 39 (11.5) 64 (18.9)
Tertiary non-degreed 28 16 (57.1) 2 (7.1) 10 (35.7)
Tertiary-degreed 4 3 (75.0) 0 (0.0) 1 (25.0)
Free
dow
nloa
d fr
om w
ww
.hsr
cpre
ss.a
c.za

Survey of HIV prevalence and behaviour in Chimanimani
120
Table 6.32b: Perceptions regarding policies related to HIV/AIDS by education – recognising HIV/AIDS
Perception Total
N Agreen (%)
Neutral n (%)
Disagree n (%)
Political leaders publicly recognise the importance of HIV and AIDS
Education level
No schooling 67 50 (74.6) 12 (17.9) 5 (7.5)
Primary school 325 253 (77.9) 39 (12.0) 33 (10.2)
Secondary school 339 278 (82.0) 25 (7.4) 36 (10.6)
Tertiary non-degreed 28 25 (89.3) 1 (3.6) 2 (7.1)
Tertiary-degreed 4 3 (75.0) 1 (25.0) 0 (0.0)
Table 6.32c: Perceptions regarding policies related to HIV/AIDS by education – allocation of funds
Perception Total
N Agreen (%)
Neutral n (%)
Disagree n (%)
The government allocates sufficient funds to control the spread of HIV infections
Education level
No schooling 67 26 (38.8) 15 (22.4) 26 (38.8)
Primary school 325 143 (44.0) 64 (19.7) 118 (36.3)
Secondary school 339 135 (39.8) 48 (14.2) 156 (46.0)
Tertiary non-degreed 28 10 (35.7) 4 (14.3) 14 (50.0)
Tertiary-degreed 4 1 (25.0) 0 (0.0) 3 (75.0)
Table 6.32d: Perceptions regarding policies related to HIV/AIDS by education – treatment of PLWHA
Perception Total
N Agreen (%)
Neutral n (%)
Disagree n (%)
The government is doing more this year treating PLWHA than during the last five years
Education level
No schooling 67 31 (46.3) 19 (28.4) 17 (25.4)
Primary school 325 180 (55.4) 84 (25.9) 61 (18.8)
Secondary school 339 186 (54.9) 65 (19.2) 88 (26.0)
Tertiary non-degreed 28 18 (64.3) 5 (17.9) 5 (17.9)
Tertiary-degreed 4 0 (0.0) 1 (25.0) 3 (75.0)
Free
dow
nloa
d fr
om w
ww
.hsr
cpre
ss.a
c.za
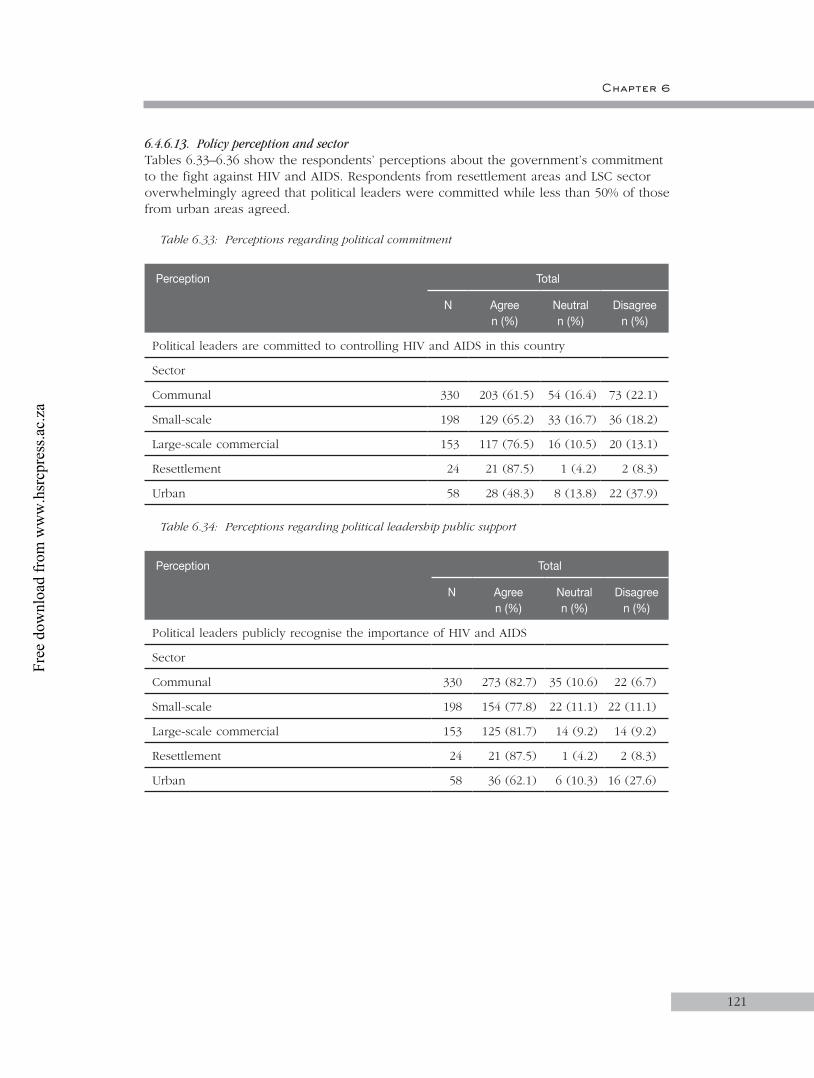
Chapter 6
121
6.4.6.13. Policy perception and sectorTables 6.33–6.36 show the respondents’ perceptions about the government’s commitment to the fight against HIV and AIDS. Respondents from resettlement areas and LSC sector overwhelmingly agreed that political leaders were committed while less than 50% of those from urban areas agreed.
Table 6.33: Perceptions regarding political commitment
Perception Total
N Agreen (%)
Neutral n (%)
Disagree n (%)
Political leaders are committed to controlling HIV and AIDS in this country
Sector
Communal 330 203 (61.5) 54 (16.4) 73 (22.1)
Small-scale 198 129 (65.2) 33 (16.7) 36 (18.2)
Large-scale commercial 153 117 (76.5) 16 (10.5) 20 (13.1)
Resettlement 24 21 (87.5) 1 (4.2) 2 (8.3)
Urban 58 28 (48.3) 8 (13.8) 22 (37.9)
Table 6.34: Perceptions regarding political leadership public support
Perception Total
N Agreen (%)
Neutral n (%)
Disagree n (%)
Political leaders publicly recognise the importance of HIV and AIDS
Sector
Communal 330 273 (82.7) 35 (10.6) 22 (6.7)
Small-scale 198 154 (77.8) 22 (11.1) 22 (11.1)
Large-scale commercial 153 125 (81.7) 14 (9.2) 14 (9.2)
Resettlement 24 21 (87.5) 1 (4.2) 2 (8.3)
Urban 58 36 (62.1) 6 (10.3) 16 (27.6)
Free
dow
nloa
d fr
om w
ww
.hsr
cpre
ss.a
c.za
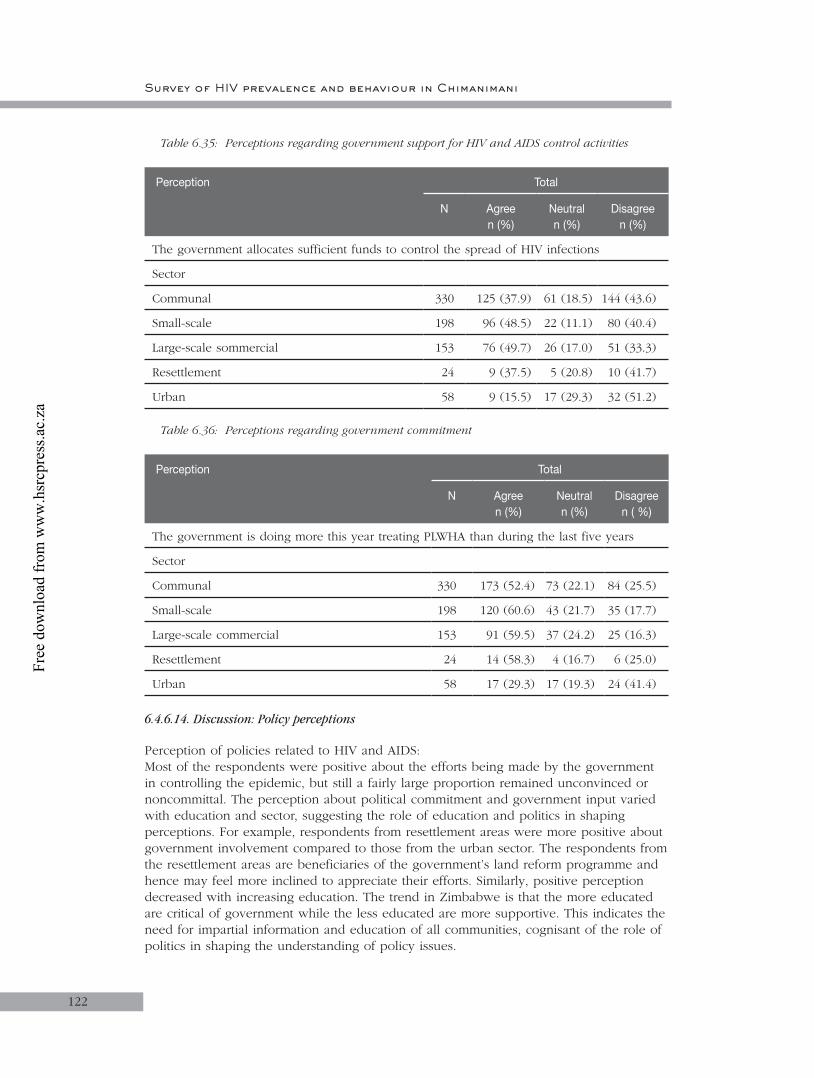
Survey of HIV prevalence and behaviour in Chimanimani
122
Table 6.35: Perceptions regarding government support for HIV and AIDS control activities
Perception Total
N Agreen (%)
Neutral n (%)
Disagree n (%)
The government allocates sufficient funds to control the spread of HIV infections
Sector
Communal 330 125 (37.9) 61 (18.5) 144 (43.6)
Small-scale 198 96 (48.5) 22 (11.1) 80 (40.4)
Large-scale sommercial 153 76 (49.7) 26 (17.0) 51 (33.3)
Resettlement 24 9 (37.5) 5 (20.8) 10 (41.7)
Urban 58 9 (15.5) 17 (29.3) 32 (51.2)
Table 6.36: Perceptions regarding government commitment
Perception Total
N Agreen (%)
Neutral n (%)
Disagree n ( %)
The government is doing more this year treating PLWHA than during the last five years
Sector
Communalt l330t 173 (52.4)t 73 (22.1)t l84 (25.5)
Small-scalet 198t 120 (60.6)t 43 (21.7)t 35 (17.7)
Large-scale commercialt 153t 91 (59.5)t 37 (24.2)t 25 (16.3)
Resettlementt 24t 14 (58.3)t 4 (16.7)t 6 (25.0)
Urbant 58t 17 (29.3)t 17 (19.3)t 24 (41.4)
6.4.6.14. Discussion: Policy perceptions
Perception of policies related to HIV and AIDS:Most of the respondents were positive about the efforts being made by the government in controlling the epidemic, but still a fairly large proportion remained unconvinced or noncommittal. The perception about political commitment and government input varied with education and sector, suggesting the role of education and politics in shaping perceptions. For example, respondents from resettlement areas were more positive about government involvement compared to those from the urban sector. The respondents from the resettlement areas are beneficiaries of the government’s land reform programme and hence may feel more inclined to appreciate their efforts. Similarly, positive perception decreased with increasing education. The trend in Zimbabwe is that the more educated are critical of government while the less educated are more supportive. This indicates the need for impartial information and education of all communities, cognisant of the role of politics in shaping the understanding of policy issues.
Free
dow
nloa
d fr
om w
ww
.hsr
cpre
ss.a
c.za

Chapter 6
123
6.5. Conclusions
The prevalence of HIV is high but similar to the estimated national HIV prevalence based on ANC surveillance of pregnant women. The age prevalence is expected and so is the higher prevalence among women, especially in the younger age groups of 25–35 years. This study is the first to report HIV prevalence in this age group based on a randomised community study and a relatively large sample size. The majority of respondents were of the Apostolic religious sect. Thus, HIV/AIDS programmes need to be cognisant of the role of religion in shaping the perceptions, attitudes and practices with regards to education about HIV and AIDS. The level of literacy among the respondents was relatively low, with 42.6% of respondents having reached primary school. This is an important factor to consider in developing communication strategies for HIV/AIDS programmes.
Most households reported that they did not have enough for the basic needs of their families. Thus, poverty is a major problem in the community. The impact of poverty, in particular the gendered aspects, on access and acceptance of interventions should be considered. The respondents’ general knowledge about HIV and AIDS was relatively high but specific knowledge about transmission was low. These specific intervention areas need to be strengthened.
Education was a major determinant of knowledge. Knowledge increased with education, suggesting increased access to information and prevention intervention programmes as levels of education increased. Similarly education, and possibly the related political awareness, influenced perceptions about policy. These need to be addressed in appropriately designed programmes to ensure the adequate participation despite political affiliation of community members.
6.6. Recommendations
• To reverse the current trends in HIV and AIDS, it is critical that the relationship between the epidemic and human development be acknowledged at all levels and that the principles of sustainable human development be a major focus and priority of the country’s policies and programme.
• IEC on sexuality, responsible sexual behaviour, family planning, unsafe abortions, gender roles, STIs and HIV and AIDS should be strengthened and coverage improved.
• There is a need to encourage and promote adult communication and interaction regarding issues about HIV and AIDS. Activities that address social pressures on sexual behaviour should be considered.
• Use a behaviour change framework to define and evaluate activities by employing a variety of teaching methods designed to involve adults and have them personalising the information.
• Make HIV and AIDS issues adult-friendly by ensuring confidentiality, privacy, respect and the high quality information necessary for informed consent, and by including them in programme design.
• Increase opportunities for women’s education and employment to empower them to be independent and self-sustaining.
Free
dow
nloa
d fr
om w
ww
.hsr
cpre
ss.a
c.za
Survey of HIV prevalence and behaviour in Chimanimani
124
Free
dow
nloa
d fr
om w
ww
.hsr
cpre
ss.a
c.za

CHAPTER 7
125
7. General conclusions and recomendations
7.1. Introduction
The previous chapters presented BSS data by age group, and several conclusions were drawn from the specific findings of each age group. This chapter attempts to provide a global view of the findings by making comparisons between the age groups with regards to some of the key variables investigated, with the overall objective of highlighting similarities and differences between the age groups. The general conclusions are then used to draw up some general recommendations where possible.
7.2. Demographic details
The demographic profile of the whole study population mirrors that of the general population as described in the OVC census report. This suggests that the sample was representative of the general population.
Orphanhood
Orphanhood was defined for age groups 2–11, 12–14 and 15–18 as per the Zimbabwean definition of orphan (Skinner, Tsheko, Mtero-Munyati, et.al., 2004). The prevalence of orphanhood in these age groups is shown in Figure 7.1 below. The data show that orphanhood is a major problem in the study area, and increasing with age. Of note is the fact that prevalence of paternal orphanhood is more than three times higher than maternal orphanhood across all age groups. This suggests that more men than women are dying and that they are dying earlier than women. Considering that in general men are the breadwinners, this observation suggests that the majority of households with orphans are deprived of the breadwinner, thereby worsening already existing poverty. This is likely to impact negatively on livelihood strategies of widows and children who may engage in transactional sex for survival, or in drug use. That prevalence of double orphanhood is constant across age groups suggests the existence of safety nets that absorb orphans into extended families. Nonetheless, the presence of double orphans suggests that a proportion of orphans may be heading households.
Figure 7.1: Prevalence of orphanhood by age group
5
2 to 11 12 to 14
Age (years)
Pre
vale
nce
(%)
0
10
15
20
25
15 to 18
Paternal Maternal Double
Free
dow
nloa
d fr
om w
ww
.hsr
cpre
ss.a
c.za
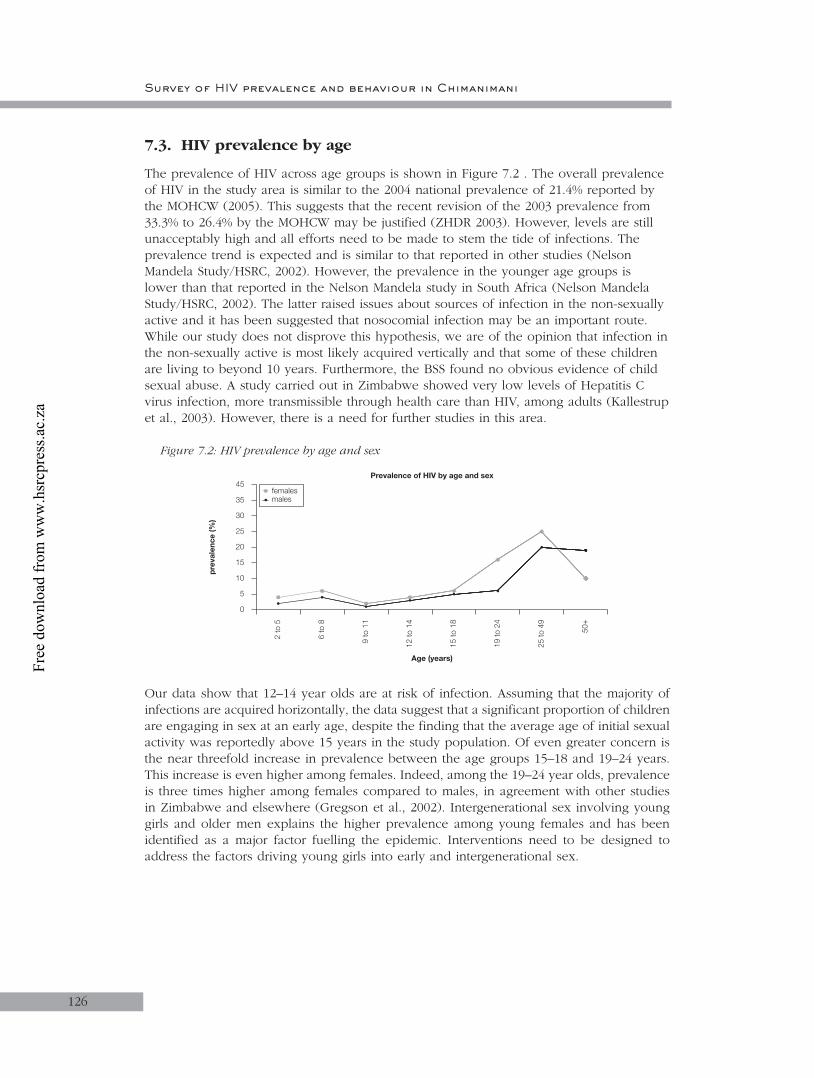
Survey of HIV prevalence and behaviour in Chimanimani
126
7.3. HIV prevalence by age
The prevalence of HIV across age groups is shown in Figure 7.2 . The overall prevalence of HIV in the study area is similar to the 2004 national prevalence of 21.4% reported by the MOHCW (2005). This suggests that the recent revision of the 2003 prevalence from 33.3% to 26.4% by the MOHCW may be justified (ZHDR 2003). However, levels are still unacceptably high and all efforts need to be made to stem the tide of infections. The prevalence trend is expected and is similar to that reported in other studies (Nelson Mandela Study/HSRC, 2002). However, the prevalence in the younger age groups is lower than that reported in the Nelson Mandela study in South Africa (Nelson Mandela Study/HSRC, 2002). The latter raised issues about sources of infection in the non-sexually active and it has been suggested that nosocomial infection may be an important route. While our study does not disprove this hypothesis, we are of the opinion that infection in the non-sexually active is most likely acquired vertically and that some of these children are living to beyond 10 years. Furthermore, the BSS found no obvious evidence of child sexual abuse. A study carried out in Zimbabwe showed very low levels of Hepatitis C virus infection, more transmissible through health care than HIV, among adults (Kallestrup et al., 2003). However, there is a need for further studies in this area.
Figure 7.2: HIV prevalence by age and sex
Our data show that 12–14 year olds are at risk of infection. Assuming that the majority of infections are acquired horizontally, the data suggest that a significant proportion of children are engaging in sex at an early age, despite the finding that the average age of initial sexual activity was reportedly above 15 years in the study population. Of even greater concern is the near threefold increase in prevalence between the age groups 15–18 and 19–24 years. This increase is even higher among females. Indeed, among the 19–24 year olds, prevalence is three times higher among females compared to males, in agreement with other studies in Zimbabwe and elsewhere (Gregson et al., 2002). Intergenerational sex involving young girls and older men explains the higher prevalence among young females and has been identified as a major factor fuelling the epidemic. Interventions need to be designed to address the factors driving young girls into early and intergenerational sex.
2 to
5
Age (years)
pre
vale
nce
(%)
0
6 to
8
9 to
11
12 to
14
15 to
18
19 to
24
25 to
49
50+
5
10
15
20
25
30
35
45femalesmales
Prevalence of HIV by age and sex
Free
dow
nloa
d fr
om w
ww
.hsr
cpre
ss.a
c.za
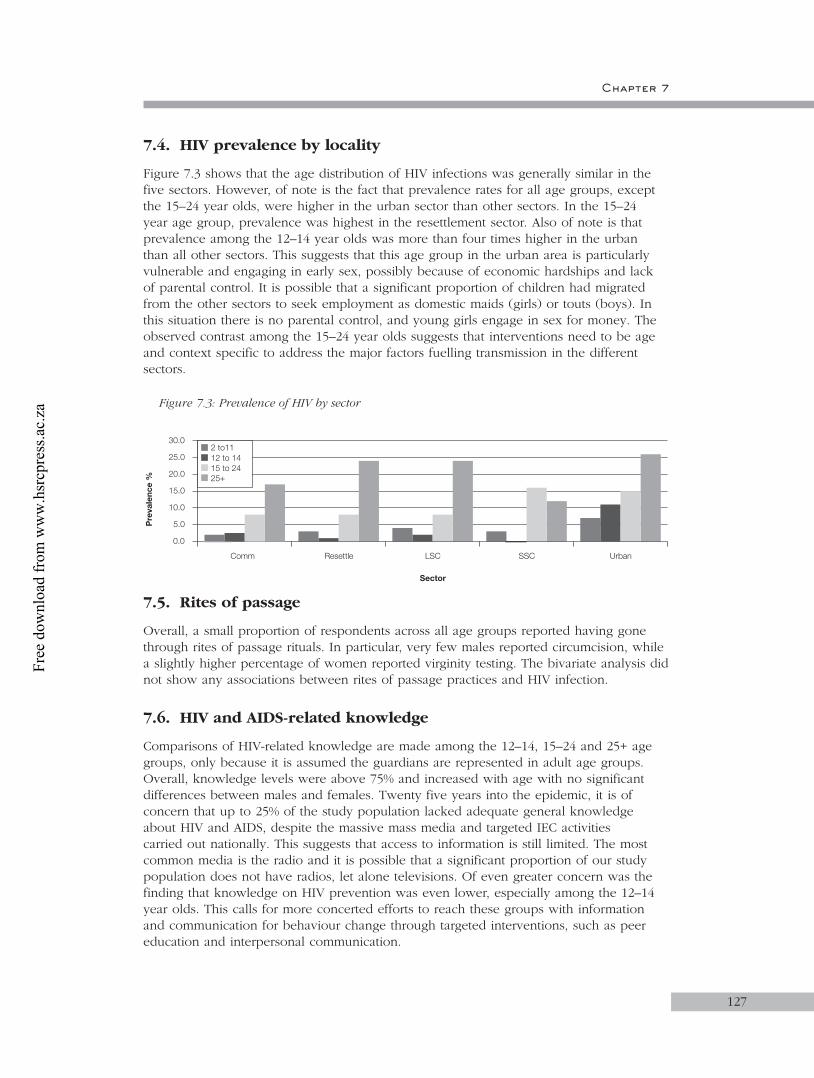
Chapter 7
127
7.4. HIV prevalence by locality
Figure 7.3 shows that the age distribution of HIV infections was generally similar in the five sectors. However, of note is the fact that prevalence rates for all age groups, except the 15–24 year olds, were higher in the urban sector than other sectors. In the 15–24 year age group, prevalence was highest in the resettlement sector. Also of note is that prevalence among the 12–14 year olds was more than four times higher in the urban than all other sectors. This suggests that this age group in the urban area is particularly vulnerable and engaging in early sex, possibly because of economic hardships and lack of parental control. It is possible that a significant proportion of children had migrated from the other sectors to seek employment as domestic maids (girls) or touts (boys). In this situation there is no parental control, and young girls engage in sex for money. The observed contrast among the 15–24 year olds suggests that interventions need to be age and context specific to address the major factors fuelling transmission in the different sectors.
Figure 7.3: Prevalence of HIV by sector
7.5. Rites of passage
Overall, a small proportion of respondents across all age groups reported having gone through rites of passage rituals. In particular, very few males reported circumcision, while a slightly higher percentage of women reported virginity testing. The bivariate analysis did not show any associations between rites of passage practices and HIV infection.
7.6. HIV and AIDS-related knowledge
Comparisons of HIV-related knowledge are made among the 12–14, 15–24 and 25+ age groups, only because it is assumed the guardians are represented in adult age groups. Overall, knowledge levels were above 75% and increased with age with no significant differences between males and females. Twenty five years into the epidemic, it is of concern that up to 25% of the study population lacked adequate general knowledge about HIV and AIDS, despite the massive mass media and targeted IEC activities carried out nationally. This suggests that access to information is still limited. The most common media is the radio and it is possible that a significant proportion of our study population does not have radios, let alone televisions. Of even greater concern was the finding that knowledge on HIV prevention was even lower, especially among the 12–14 year olds. This calls for more concerted efforts to reach these groups with information and communication for behaviour change through targeted interventions, such as peer education and interpersonal communication.
Comm
Sector
Pre
vale
nce
%
0.0
10.0
20.0
30.0
Resettle LSC SSC
5.0
15.0
25.0
Urban
2 to1112 to 1415 to 2425+
Free
dow
nloa
d fr
om w
ww
.hsr
cpre
ss.a
c.za
Survey of HIV prevalence and behaviour in Chimanimani
128
7.7. Awareness of AIDS services across age groups
Overall, less than 40% of respondents were aware of HIV and AIDS services in their communities and the awareness increased with age with no significant differences between males and females. However, some sectoral differences were evident. The services included HBC and OVC care and prevention. Awareness on prevention services was even lower suggesting that these services (VCT, RH, PPTCT) may be very limited in the study area. HBC was the most commonly cited service, most likely because the NGO, Family AIDS Caring Trust (FACT), has provided HBC services in the province for a long time. Nonetheless, our findings indicate that whatever services are available are not well known and hence not being accessed by the general population. There is a need to increase the visibility of care and support as well as preventive services in the district as a whole. That there was no significant difference in awareness on preventive services between males and females suggests that ideal fora for information dissemination to women are MCH services. Similarly, there is a need to identify ideal fora for information dissemination to men.
7.8. Strengths and Weaknesses of the study
Strengths
This was a population-based survey based on a random sample. Thus, the findings are considered representative of the general population. This is the first study of this magnitude and therefore provides accurate statistics at community level. The study also attempted to dissect the demographic, socio-cultural and economic factors influencing transmission. An appreciation of HIV and AIDS services was also assessed, giving an indication of availability and access to the services, and a proxy for acceptance of the services.
Weaknesses
While the assumption of randomness is strength, it is possible that bias could have been introduced during data collection. There are three possible sources of bias. Firstly, randomisation was effected through counting households based on a given interval. It is possible that research assistants could have made errors in the counting since there was no systematic way of counting, especially in communal areas where households are also randomly placed.
Secondly, the selection of a respondent at the household level was based on not only availability but also the need to balance sexes. However, as is the case with most communities in Zimbabwe, women are more likely to be at home than males. Whether the men found at home have similar characteristics to those not found can not be verified.
Thirdly, the study was conducted during school term, hence school-going age children were not easily accessible. This reduced the sample size for the school-going age and may have introduced bias in that those found at home may not be representative of the children in this area.
Finally, this report is based on bivariate analysis. Therefore the interpretation of associations between HIV and the various variables is very limited, since there was no control for confounding. Similarly, no interactions were assessed. Thus the discussion, conclusions and recommendations made at this stage are not conclusive.
Free
dow
nloa
d fr
om w
ww
.hsr
cpre
ss.a
c.za

Chapter 7
129
There is a need therefore to carry out more detailed analysis, including multivariable analysis to control for confounding and assess for interactions. In addition there is an equally urgent need to address the orphan problem as well as the issue of awareness of services. Similarly, emphasis needs to be placed on strengthening and/or designing interventions aimed at reducing the rate of HIV transmission and to provide care (including treatment) and support of the infected and affected.
7.9 Future Research
This study has provided a benchmark for evaluation of interventions that will be implemented in the district. Thus, follow-up BSS surveys should be conducted to determine the trends in HIV prevalence, care and support. Such studies will enable crude incidence rates to be assessed in the district. The present study has also identified areas that need further exploration in order to delineate the determinants of transmission and the care and support needs of communities. For example, the subtle sectoral differences in HIV prevalence need further research to identify and describe the factors that influence transmission in each of the sectors. Such data is essential for appropriately designed and targeted interventions.
7.10. Recommendations
Pending more detailed data analysis some recommendations can be made:• There is need for interventions to address the orphan problem. The interventions
should range from direct food and material support to OVC, to improving sustainable livelihoods of widows and OVC.
• There is a need to address the issue of infected children. While the government is moving as quickly as possible in making ARVs available to the vulnerable, generally there has been a lack of emphasis on children. HIV and AIDS service organisations should mobilise and prepare communities for ART. The mobilisation should be supported by strong advocacy for immediate introduction of ART for children as well as adults. The association between HIV and morbidity was observed in this study, albeit not significant at this stage of the analysis.
• Appropriate and properly targeted preventive interventions are called for to address the HIV transmission dynamics for the various age groups, cognisant of the sectoral differences observed in the present study. The one-size-fits-all approach to prevention using standard ABCDE approaches alone are unlikely to yield the desired results. Thus, each sector requires an in-depth analysis to direct interventions with regard the fundamental determinants of transmission.
• Despite the long-standing awareness campaigns, general and specific knowledge about HIV and AIDS remains disconcertingly low at about 70%. There is thus a need to ensure that the general and specific population groups access information on HIV and AIDS. This calls for multi-media approaches that bring the information to people's doorsteps.
• Awareness about HIV and AIDS services depends on the availability and accessibility of the services. The study suggests that these services are limited in the study area. There is therefore a need to increase the services, including HBC, OVC and prevention services.
• Following up on the above, existing services as well as other health services should strengthen and scale up their HIV-related activities. In particular, reproductive and maternal and child health services need to mainstream HIV and AIDS into their services.
Free
dow
nloa
d fr
om w
ww
.hsr
cpre
ss.a
c.za

1. Bryson, YJ. (1996) Perinatal HIV-1 Transmission: Recent advances and therapeutic interventions, AIDS 10 (suppl 3): S33–42.
2. Central Statistical Office (Zimbabwe) and Institute for Resource Development/Macro Systems Inc. (1989). Zimbabwe Demographic and Health Survey 1988. Columbia, Maryland.
3. Central Statistical Office (Zimbabwe) and Macro International Inc. (2000). Zimbabwe Demographic and Health Survey 1999. Calverton, Maryland.
4. Central Statistical Office (Zimbabwe) and Macro International Inc. (1995). Zimbabwe Demographic and Health Survey 1994. Calverton, Maryland.
5. Gisselquist, D, Potterat, JJ, Brody, S. (2004) Running on empty: Sexual co-factors are insufficient to fuel Africa’s turbocharged HIV epidemic. Int J STD AIDS; 15(7): 442–52.
6. Gisselquist, D, Potterat, JJ, Brody, S, Vachon, F. (2003) Let it be sexual: How health care transmission of AIDS in Africa was ignored. Int J STD AIDS; 14(3): 148–61.
7. Gisselquist, D, Rothenberg, R, Potterat, J, & Drucker, E. (2002) HIV infections in sub–Saharan Africa not explained by sexual or vertical transmission. Int J STD AIDS; 13(10): 657–66.
8. Gregson, et al. (2002) Sexual mixing patterns and sex differential in teenage exposure to HIV infection in rural Zimbabwe. Lancet; 359: 1896–1903.
9. Grosskurth, H, et al. (2000) Control of sexually transmitted diseases for HIV prevention: Understanding the implications of the Mwanza and Rakai trials. Lancet; 355: 1981–7.
10. Jackson, H, (2002) AIDS Africa: Continent in crisis. SAfAIDS, Harare.
11. Kallestrup, P, Zinyama, R, Gomo, E, Gerstoft, J, Ullum, H. (2004) HIV in Africa - still a major matter of unsafe sex. Int J STD AIDS; 15(10): 709–10.
12. Kuhn, L, & Stein, ZA. (1995) Mother infant HIV transmission: Timing, risk factors and prevention. Paediatric and Perinatal Epidemiology; 9: 1–29.
13. Ministry of Health and Child Welfare Zimbabwe Report 2002, 2004.
14. Munyati, S, Rusakaniko, S, Mupambireyi, F, Mahati, S, Chibatamoto, P & Chandiwana, B. (2003) Population Census Report of OVC in Bulilimamangwe and Chimanimani Districts in Zimbabwe. BRTI-NIHR OVC Project Report, Harare.
15. Orphans and Vulnerable Children Project – Zimbabwe. TARIRO; July-December (2004). BRTI-NIHR OVC Project, Harare.
16. Poverty Reduction Forum and IDS (2002). The Humanitarian Situation in Zimbabwe: Private Sector and Civil Society Perspective; Harare.
REFERENCES
Free
dow
nloa
d fr
om w
ww
.hsr
cpre
ss.a
c.za

131
17. SAfAIDS (2002). HIV/AIDS Action: Responding to stigma and discrimination; 53, Harare.
18. SAfAIDS; September (2000), Harare.
19. Shisana, O & Simbayi, L. (2002) Nelson Mandela/HSRC Study of HIV/AIDS: South African First National HIV Prevalence, Behavioral Risks and Mass Media. HSRC Press: Cape Town.
20. Skinner, D, Tsheko, N, Mtero-Munyati, S, Segwabe, M, Chibatamoto, P, Mfecane, S, Chandiwana, Nkomo, N, Tlou, S & Chitiyo, G. (2004) Defining orphaned and vulnerable children. Human Sciences Research Council Press: Cape Town.
21. UNAIDS Report 2003.
22. UNAIDS Report, 2004.
23. UNICEF (2003). Situational Assessment and Analysis of Children in Zimbabwe; Cited in Zimbabwe Human Development Report 2003: Redirecting our responses to HIV and AIDS; Poverty Reduction Forum and IDS, Harare.
24. Zimbabwe Human Development Report (2003). Redirecting our responses to HIV and AIDS. Poverty Reduction Forum and IDS, Harare.
REFERENCES
Free
dow
nloa
d fr
om w
ww
.hsr
cpre
ss.a
c.za

Survey of HIV prevalence and behaviour in Chimanimani
132
Free
dow
nloa
d fr
om w
ww
.hsr
cpre
ss.a
c.za