Genetic Diversity and Population Structure of Acacia senegal (L) Willd. in Kenya
Upload
independentCategory
view
2download
0
Forest Ecology and Management 259 (2010) 1761–1770
Enhanced water use efficiency in a mixed Eucalyptus globulus andAcacia mearnsii plantation
David I. Forrester a,b,*, Swaminathan Theiveyanathan c, John J. Collopy a, Nico E. Marcar c
a Department of Forest and Ecosystem Science, The University of Melbourne, 500 Yarra Boulevard, Richmond, VIC 3121, Australiab Cooperative Research Centre for Forestry, Private Bag 12, Hobart, Tasmania 7001, Australiac CSIRO Sustainable Ecosystems, G.P.O. Box 284, Canberra, ACT 2601, Australia
A R T I C L E I N F O
Article history:
Received 24 April 2009
Received in revised form 14 July 2009
Accepted 16 July 2009
Keywords:
Mixed-species
Nitrogen fixation
Transpiration
Forest management
Heat pulse technique
Water use efficiency
A B S T R A C T
Significant increases in aboveground biomass production have been observed when Eucalyptus is
planted with a nitrogen-fixing species due to increased nutrient availability and more efficient use of
light. Eucalyptus and Acacia are among the most popular globally planted genera with the area of
Eucalyptus plantations alone expanding to over 19 Mha over the past two decades. Despite this, little is
known about how nutrition and light availability in mixed-species tree plantations influence water use
and water use efficiency (WUE). This study examined to what extent water use and WUE have been
influenced by increased resource availability and growth in mixed-species plantations. Monocultures of
Eucalyptus globulus Labill. and Acacia mearnsii de Wildeman and 1:1 mixtures of these species were
planted. Growth and transpiration were measured between ages 14 and 15 years. Aboveground biomass
increment (Mg ha�1) was significantly higher in mixtures (E. globulus; 4.8 + A. mearnsii; 0.9) than E.
globulus (3.3) or A. mearnsii monocultures (1.6). Annual transpiration (mm) measured using the heat
pulse technique was also higher in mixtures (E. globulus; 285 + A. mearnsii; 134) than in E. globulus (358)
and A. mearnsii (217) monocultures. Mixtures exhibited higher WUE than monocultures due to
significant increases in the WUE of E. globulus in mixtures (1.69 kg aboveground biomass per cubic metre
water transpired) compared to monocultures (0.94). The differences in WUE appear to result from
increases in canopy photosynthetic capacity and above- to belowground carbon allocation in mixtures
compared to monocultures. Although further studies are required and operational issues need to be
resolved, the results of this study suggest that mixed eucalypt–acacia plantations may be used in water-
limited environments to produce a given amount of wood with less water than eucalypt monocultures.
Alternatively, because mixtures can be more productive and use more water per unit land area (but use it
more efficiently), they could be utilized in recharge zones where rising water tables and salinity result
from the replacement of vegetation (fast growing trees) that uses higher quantities of water with
vegetation (shallow rooted annual crops) that use lower quantities of water.
� 2009 Elsevier B.V. All rights reserved.
Contents lists available at ScienceDirect
Forest Ecology and Management
journa l homepage: www.e lsevier .com/ locate / foreco
1. Introduction
The area of Eucalyptus plantations worldwide has increasedrapidly during the last two decades, currently covering over19 M ha (Iglesias and Wilstermann, 2008). This is largely inresponse to economic, social and environmental drivers such asincreasing demand for wood, favourable wood properties andgrowth rates, so as to reduce pressure on harvesting of nativeforests and to sequester carbon. However, the potentially highwater use by Eucalyptus plantations can cause conflict, and raises
* Corresponding author at: Institute of Silviculture, Freiburg University,
Tennenbacherstr. 4, 79108 Freiburg, Germany. Tel.: +49 761 203 8623;
fax: +49 761 203 3781.
E-mail address: [email protected] (D.I. Forrester).
0378-1127/$ – see front matter � 2009 Elsevier B.V. All rights reserved.
doi:10.1016/j.foreco.2009.07.036
concerns about local and regional water supply when theseprocesses are not properly understood (Morris et al., 2004;Whitehead and Beadle, 2004). Developing optimum managementtechniques and understanding the role of plantations in local andglobal water and carbon cycling requires a good understanding ofthe effects of climate and management on the growth and wateruse of these plantations (Hubbard et al., 2004).
The focus of forest productivity is often on total biomass or itsharvestable component. The calculation of WUE in alternativesilvicultural strategies can illustrate how efficient the productionprocess has been and what scope remains for improvement.Mixed-species plantations containing Eucalyptus sp. (non-nitrogen(N2)-fixing) and N2-fixing species (such as Acacias sp.) are apotentially valuable management technique for increasing pro-ductivity while lowering N fertiliser costs. The total productivity ofmixed-species is often higher than Eucalyptus monocultures due to
D.I. Forrester et al. / Forest Ecology and Management 259 (2010) 1761–17701762
the increased supply of nutrients, resulting from N2-fixation andaccelerated rates of nutrient cycling, and more efficient use of light(Forrester et al., 2006b). However, this enhanced productivity islikely associated with increased water use and it is unclearwhether this is proportional to the productivity increases orwhether there are changes in water use efficiency (WUE).Improved WUE would enable the production of more wood perlitre of water transpired. An ability to make the most efficient useof resources (water and nutrients) is highly desirable due to theglobal demand of other water users and the economic andenvironmental expense (in terms of CO2 or non-CO2 greenhousegas emissions) in producing and applying fertiliser.
Water use efficiency can be increased when different specieshave contrasting water uptake strategies. This is because they mayobtain water from different parts of the soil profile due to astratification of roots, thereby increasing water uptake and totalbiomass production with the same annual precipitation. This isoften referred to as niche separation and competitive reduction(Vandermeer, 1989; Kelty, 1992; Jose et al., 2006). Few studieshave linked differences in fine root distribution to higherproductivity either due to reductions in inter-specific competitionor increased use of resources (Jose et al., 2006). Nevertheless,competition may be reduced by temporal differences in wateruptake, such as when deciduous trees are growing with evergreentrees (Kelty, 1992; Catovsky et al., 2002; Legare et al., 2005).
Changes in WUE can also occur if species interactions lead tochanges in WUE in terms of wood or carbon gain per unit watertranspired. For example, increased N and P availability can increaseinstantaneous leaf-level WUE due to increased photosyntheticcapacity without proportional increases in stomatal conductanceor transpiration (Sheriff et al., 1986; Green and Mitchell, 1992;Hobbie and Colpaert, 2004). Similarly increased resource useefficiencies have been observed with increasing Eucalyptus
plantation productivity along rainfall, nitrogen and light avail-ability gradients in Brazil (Stape et al., 2004a). However, there arealso examples of no changes in WUE or growth efficiency (biomassincrement per unit leaf area) after monospecific plantations havebeen fertilised, at both the leaf (Pereira et al., 1992) and standlevels (Hubbard et al., 2004; du Toit and Dovey, 2005).
The objective of this study was to test the hypothesis that mixinga eucalypt and acacia species increases water use and WUEcompared with a pure eucalypt plantation. It was conducted in a14-year old trial in which mixtures of Eucalyptus globulus and Acacia
mearnsii had previously been shown to produce twice as muchaboveground biomass as Eucalyptus monocultures (Forrester et al.,2005b). Low soil fertility, especially phosphorus and nitrogen, isconsidered to be the major growth limiting factor at this site,including during the study period. In addition, whilst the long-termannual precipitation at this site is 1009 mm, the annual precipitationduring the study year was only 730 mm. Several processes andinteractions have already been measured in this trial including N2-fixation (Forrester et al., 2007), nutrient cycling (Forrester et al.,2005a), growth dynamics (Forrester et al., 2004), carbon allocation(Forrester et al., 2006a), light capture (Bauhus et al., 2004), fine rootdistribution and fine root architecture (Khanna, 1997; Bauhus et al.,2000). Differences in WUE are considered a potentially importantbut so far unexamined factor influencing the observed increases inthe productivity of mixtures. This well-established, mature trialprovided a good opportunity to test our hypothesis.
2. Materials and methods
2.1. Study area and experimental design
The study site is located 5 km southeast of Cann River, EastGippsland, Australia (378350S, 1498100E). The climate is temperate
with a mean daily maximum temperature of 26 8C in January and amean daily minimum temperature of 2 8C in July. Long-termannual precipitation is about 1009 mm, distributed evenlythroughout the year. Dry sclerophyll forest dominated byEucalyptus sieberi was cleared in 1991 prior to the trial establish-ment in 1992. The soils are Mottled, Dystrophic, Brown Kurosol(Dy5.21) or Mottled, Mesotrophic, Brown Dermosol (Gn4.31)(Stace et al., 1968; Isbell, 1998). These have a sandy loam A, AB orA2 horizon, a sandy clay loam B1 and B21 horizon above a light tomedium clay B22 horizon. The profile is mildly acidic (mean pH(H2O) around 5.2), non-saline and the water table is below 4 m.Initial soil N concentration was 1.10 g kg�1 (0–5 cm depth) andBray I-P concentration was 1.6 mg kg�1 (0–5 cm depth). E. globulus
and A. mearnsii were planted in monocultures and 1:1 mixtures(100E, 100A and 50E:50A, respectively) at a spacing of 2 � 3.3 m(1515 stems ha�1). In the mixtures trees were mixed within rows,resulting in a checkerboard arrangement of eucalypts and acacias.E. globulus seedlings were planted in early July 1992 and A. mearnsii
in early October 1992. Plots (23 m � 28 m) were arranged in arandomised block design in four replicate blocks (Forrester et al.,2004). The stands were fertilised with 25 kg P ha�1 in the form ofsuperphosphate in November 1992, and received no additionalfertiliser thereafter.
2.2. Meteorological data
Rainfall, air temperature, solar radiation, relative humidity andwind speed were recorded by a Tain Micropower data logger every30 min for the duration of the study. These were measured using a0.1 mm dipping-bucket gauge, a PTAT temperature sensor, SCIpyranometer, Vaisala humidity sensor and cup anemometer (TainInstruments, Box Hill, Australia), respectively, mounted 7.5 mabove ground level in a clear area next to the experimental plots.Daily mean vapour pressure deficit (VPD; kPa), also referred tolater as ‘saturation deficit’ (Dq; kg kg�1), was calculated from30 min humidity and temperature data. Potential (wet canopy)daily transpiration (EP; mm day�1) was calculated based on thePenman–Monteith equation (Jarvis and McNaughton, 1986):
lEP ¼eRn þ lrDqga
eþ 1þ ðga=gcpÞ(1)
where Rn is net radiation, e the dimensionless slope of the relationbetween saturated specific humidity and temperature, l the latentheatofvapourisation(2450 kJ kg�1),r thedensityofair (1.2 kg m�3),and Dq thesaturation deficitof the aircalculated asQsat(T) � Q, whereQsat(T) is the saturated specific humidityat temperature T and Q is thespecific humidity (D = Qsat(T) � Q = (1� H) � Qsat(T), where H isrelative humidity). gcp and ga (m s�1) are the canopy andaerodynamic conductances to water vapour transport. The aero-dynamic conductance ga was calculated as the inverse of aero-dynamic resistance (ra) using a general windspeed function (Garrattand Hicks, 1973; Thom, 1975; Raupach, 1991) as follows:
ra ¼ðlnððz� dÞ=z0ÞÞðlnððz� dÞ=z0HEÞÞ
k2u(2)
where u is the average wind speed in m s�1 measured at z m, d thezero plane displacement, k the von Karman constant (0.4) and z0
(1.4) and z0HE (0.28) the roughness lengths (m) of the surface formomentum transfer and heat and water vapour transfer. Potentialcanopy conductance gcp was estimated as the inverse of canopyresistance (rcp), which is a function of stomatal resistance and leafarea index (LAI). This is the most sensitive parameter in Eq. (1) andit depends on leaf area index, soil water availability and otherenvironmental conditions that influence stomatal behaviour suchas incoming solar radiation and relative humidity. Canopy

D.I. Forrester et al. / Forest Ecology and Management 259 (2010) 1761–1770 1763
resistance or conductance is calculated using the followingempirical equation (Shuttleworth, 1989; Raupach, 1991)
rcp ¼rcpðminÞ
ƒRðRSÞ � ƒDðDaÞ � ƒW ðWÞ(3)
where rcp(min) is the minimum value of the canopy resistance (38.7,28.7 and 84.8 s m�1 in 100E, 50E:50A and 100A, respectively)under optimal growth conditions, and fR(RS), fD(Da) and fW(W) thedimensionless environmental functions, which vary linearlybetween 0 and 1, and describe the response of rcp to changingconditions of solar radiation, saturation deficit and soil waterdeficit, respectively. For the environmental functions to equal 1,threshold values for solar radiation (350 W m�2; Leuning et al.,1991), saturation deficit (35 g kg�1; Hookey et al., 1987) and LAI(3.0–3.5; Dunnin and Aston, 1984; Persson, 1995) were obtainedfrom the literature and rcp(min) was calculated from canopyconductance (gc; m s�1), which was estimated as described below.Under potential (wet canopy) conditions the trees are assumed tobe growing in non-water-limited conditions with an adequatesupply of soil water, and hence potential canopy resistance iscalculated by assuming fW(W) be equal to 1. The lowest 30estimates of canopy resistance for each treatment were chosen onthe assumption that during these measurement periods theincoming solar radiation was above the threshold limit(>350 W m�2). The variable that affected the canopy resistancefor these 30 measurement periods is the saturation deficit (orvapour pressure deficit). The chosen 30 canopy resistance valueswere regressed against mean daytime VPD and an estimate ofminimum canopy resistance (rcp(min)) at the lowest VPD wasobtained from the regression equation, y = ax + c, where y is thecanopy resistance, x the mean daytime VPD, and c the minimumcanopy resistance (at VPD equals 0).
2.3. Soil water balance
Soil moisture depletion to 3 m depth was estimated bymeasuring soil volumetric water content every four weeks usinga neutron moisture meter (503 Hydroprobe, Campbell Pacific,Pachero, CA). Four access tubes per plot were positioned at (i) themidpoint between two trees in a row (trees were planted onmounds), (ii) on the mound and 40 cm from the base of a tree and(iii) midway between two rows (centre of four trees). An additionalneutron probe access tube was installed to about 4 m depth in eachplot in position (iii) to estimate deep drainage below the root zone.Thus, there were a total of 12 tubes per treatment.
Total evapotranspiration (ET) is defined as the amount of waterlost to the atmosphere via evaporation from the soil surface andtranspiration from canopies of overstorey and understorey. Thisincludes water use of all components of the plot: trees, shrubs,grass, and soil evaporation. ET is estimated from monthlymeasurements of soil moisture to 3 m depth of the soil profileusing the water balance equation:
ET ¼ SWi�1 � SWi � Rnet (4)
where SWi is the soil water storage on day i, SWi�1 the soil waterstorage on day i � 1 and Rnet the net rainfall for that period. Netrainfall was estimated as:
Rnet ¼ Rg � Rl � Rr � Rd (5)
where Rg is gross rainfall, Rl the interception loss, Rr the surface andsub-surface runoff loss, and Rd the deep drainage below root zonedepth. Interception losses were estimated using a model devel-oped by Myers et al. (1996). All plots were located in a flatlandscape and surface runoff and sub-surface lateral flow wereassumed negligible. Hence the only mechanism for water loss
other than evapotranspiration and interception loss was deepdrainage. In this study, deep drainage was estimated in thefollowing manner.
Water balance was calculated on monthly cycles. Since the soilprofile to 3 m depth was consistently moist, it was assumed that, ina monthly cycle, when there was less than 70 mm of rainfall,drainage below 3 m, the arbitrarily-defined depth of the active rootzone, would not be significant. Such a period was defined as a drycycle. Any monthly cycle which received more than 70 mm ofrainfall was assumed to be a wet cycle. A crop factor was calculatedfor each of the adjacent (preceding and subsequent) dry cycles asthe ratio between the calculated water use and measured panevaporation. To calculate the water use of a wet cycle when morethan 70 mm of rainfall (and hence drainage) occurred, a crop factorfor the cycle was calculated as the mean of the crop factors of thepreceding and subsequent dry cycles. This was applied to themeasured pan evaporation for the cycle. In this way, the water useand hence deep drainage of every wet cycle was estimated.
2.4. Tree growth, sapwood area and leaf area
Aboveground biomass and underbark stem volume wasestimated using allometric equations developed for E. globulus
(Bennett et al., 1997) and for A. mearnsii (Forrester et al., 2004).Stem diameter overbark at 1.3 m (D; cm) was measured in June2006 and June 2007. Sapwood area was calculated from D, barkthickness and sapwood width using increment cores taken fromthree or four points around the stem of 63 A. mearnsii and 54 E.
globulus trees (including those selected for water use measure-ments). The sapwood–heartwood boundary was identified bycolour difference, light transmission or with the assistance of 0.1%aqueous methyl orange stain. A linear regression of sapwood area(AS; cm2) against D was derived to estimate the sapwood area of alltrees in each plot and hence plot sapwood area (E. globulus AS =�28.25 + 6.986 D; R2 = 0.91, P < 0.001, A. mearnsii AS = �35.28 +6.986 D; R2 = 0.91, P < 0.001).
Canopy leaf area index was estimated using hemisphericalphotography. A Nikon Coolpix 900 camera with fisheye adapter ona self levelling mount (SLM6; Delta-T devices Ltd., Cambridge) wasused to take four photos in each plot (at access probe locations)during overcast conditions on April 26th, 2007. The LAI wasdetermined using HemiView 2.1 (Delta-T devices Ltd., Cambridge).To avoid including leaf area from neighbouring plots only skymapdivisions with zenith angles between 08 and 368 were used. Thismaximum angle was based on tree height and plot size.
2.5. Sap flow measurements and stand water use
Water use was monitored from June 2006 to June 2007 usingthe heat pulse method described by Edwards and Warwick (1984)and modified by Olbrich (1991). Eighteen trees per species pertreatment were selected for sap flow measurements, matching thediameter distribution within the plots. In total sap flow wasmeasured on 36 E. globulus (D range 8.9–22.3 cm) and 36 A.
mearnsii (D range 6.7–15.5 cm). However, logger failures reducedthese numbers to 34 and 32, respectively. For periods of twomonths, two to four of these trees per plot were implanted withTeflon thermistor probes and stainless steel heaters for heat pulsemonitoring with HeatPulser instruments (Edwards Industries,Otaki, New Zealand) and CR10X data loggers (Campbell Scientific,Logan, UT). Heat pulse velocity was recorded every 30 min withfour pairs of thermistor probes per tree, inserted to four differentdepths into the sapwood. The four depths were determined bydividing the sapwood area into four rings of equal sapwood areaand inserting the probes into the centre of each ring (see Hattonet al., 1990). Sap flux density (SFD; cm3 cm�2 h�1) was calculated

D.I. Forrester et al. / Forest Ecology and Management 259 (2010) 1761–17701764
after correcting for the effects of wound diameter, probe separationand volume fractions of water and woody matrix in the sapwood.Whole tree SFD estimates were derived from each set of four pointestimates, as well as an additional data point with zero SFD at thesapwood–heartwood boundary, by calculating a second-degreepolynomial regression against implantation depth below thecambium. The regression for most trees had a negative coefficienton the second-order term, such that the peak SFD occurred at somedepth into the xylem. Nevertheless, the zero SFD was used to avoidthe possibility of erroneous SFD estimates arising from regressionlines that curve steeply upward within the sapwood (see Hattonet al., 1990). An integrated average was calculated from thisfunction. In trees where probe failures reduced the number ofpoint measurements to less than four, a weighted mean calculationwas used (Hatton et al., 1990). Tree size was not related to SFD foreither species (P > 0.2). Thus, daily mean SFD values for individualtrees were assumed to be unbiased estimates of the average plotSFD. Furthermore, differences in SFD between trees measuredsimultaneously or sequentially were usually small compared todaily variation within a tree. Daily plot water use (E) was thereforeestimated as the product of plot sapwood area and mean daily SFD.
2.6. Canopy conductance and canopy decoupling coefficient
From rough canopies canopy conductance (gc; m s�1) can beestimated from observations of daily transpiration and daytimevapour pressure deficit as
gc ¼glE
rCpV(6)
where E is the measured mean rate (kg m�2 s�1) of daily plot wateruse, and V (kPa) the mean daily daytime vapour pressure deficit(Monteith and Unsworth, 1990). This equation may not beappropriate on days with high-energy environments, low windspeeds or large-leaved plants (Landsberg, 1986). Thus, it wasapplied on days where the vapour deficit term of Eq. (1) was atleast five times larger than the radiation term (Morris et al., 2004),and aerodynamic conductance was large compared to canopyconductance (Landsberg, 1986). The psychrometric constant (g),latent heat of evaporation of water (l), density of air (r) andspecific heat of air at constant pressure (Cp) were estimated as66 Pa K�1, 2450 kJ kg�1, 1.2 kg m�3, and 1010 J kg�1 K�1, respec-tively. E was estimated as daily stand water use divided by daylength, which was calculated from latitude and date (Sellers, 1965).
The dimensionless canopy decoupling coefficient (V; Jarvis andMcNaughton, 1986) was calculated to quantify the decoupling ofconditions at the leaf surfaces from those in the atmosphere as
V ¼ 1þ e1þ eþ ga=gc
: (7)
2.7. Statistical analysis
Treatment effects were tested using analysis of variance(ANOVA) in GenstatTM (VSN International Ltd., Hemel Hemestead,U.K.). Linear and non-linear regressions were also performed inGenstatTM. The standard errors of difference (SED) are presentedfor comparison of treatment means.
3. Results
3.1. Climate
Total precipitation between July 2006 and June 2007 was730 mm, which was lower than the long-term annual average of
1009 mm and the annual average of the previous five years(845 mm; 2001–2005). Rainfall was higher in the winter months(Fig. 1). The high rainfall in February 2007 was due to a 77 mmevent on the 27th, which would have also caused deep drainagebelow the root zone. All other weather variables measured werehighest in summer and lowest in winter. Annual pan evaporationwas 1240 mm.
3.2. Soil moisture
Profile average soil moisture varied with season (Fig. 1),declining in summer and increasing again in winter. Soil moistureunder 100A was consistently higher than under 50E:50A and 100Ethroughout the study (Figs. 1 and 2). Soil moisture within theupper 50 cm of soil was substantially depleted in all treatments,and was lowest in 50E:50A (or 100E at 10 cm during the wettestmonths) and highest in 100A (Fig. 2). From 50 to 300 cm soilmoisture during the driest month was lower in 100E and 50E:50Aplots. Similarly, during both the driest and wettest months, soilmoisture was lowest in 100E, highest in 100A and intermediate in50E:50A.
Mounds were generally drier than soil between the mounds andshowed the treatment effects more strongly (data not shown)indicating the importance of sampling location. There was norelationship between average daily transpiration of a tree during agiven monitoring period and the soil moisture measured in itsimmediate vicinity.
3.3. Tree growth
Volume and aboveground biomass increment of E. globulus wasat least as high in mixtures as in monocultures during the studyperiod despite having only half the number of trees ha�1 (Table 1).A. mearnsii increments were lower in the mixtures than in themonocultures, reflecting the different densities. However, A.
mearnsii stand volume, aboveground biomass and sapwood areasof mixtures were 84%, 83% and 78% of that in monoculturesreflecting the facilitative growth response of trees in mixtures thatcontained only 50% of the number of trees in monocultures. LAIwas highest in mixtures and lowest in A. mearnsii monoculturescorresponding to differences in stand volume, biomass andsapwood area.
3.4. Tree transpiration and water use efficiency
Transpiration was highest in mixtures and lowest in A. mearnsii
monocultures (Fig. 1 and Table 1). For E. globulus monoculturesmonthly transpiration was highest in spring, while for A. mearnsii
transpiration was highest in late summer or early autumn. Sapvelocity of both species was related to maximum daily tempera-ture, mean daytime vapour pressure deficit and solar radiation;however the strength of these relationships and the importance ofeach weather variable varied with season (data not shown). Therewas no relationship between sap velocity and average monthly soilmoisture (at any depth; data not shown). The variable ranking oftreatments in terms of transpiration or sap velocity betweenseasons shows the importance of measuring sap flow for an entireyear rather than shorter periods (two months or less) that couldshow significantly different trends than the annual or seasonalaverage (such as between October and November 2006). There wasno evidence that relationships between sap velocity and climaticvariables varied with treatment suggesting that trees were notsignificantly more water stressed in mixtures than in mono-cultures (where soil moisture was higher).
Sap velocity also varied along the radial axis of the stems suchthat it was generally higher in the middle sapwood and lower

Fig. 1. Weather conditions including average daily windspeed, maximum temperature, minimum temperature, solar radiation and daytime vapour pressure deficit (a),
monthly precipitation, pan evaporation and average soil moisture (0–50 cm depth) (b), and monthly transpiration (c).
D.I. Forrester et al. / Forest Ecology and Management 259 (2010) 1761–1770 1765
towards the inner or outer edges of the sapwood. This variabilitywas higher between trees than treatments and shows theimportance of measuring sap velocity at different depths (Fioraand Cescatti, 2006).
Annual transpiration (E) was 419, 358 and 217 mm in themixtures and monocultures of E. globulus and A. mearnsii,respectively (Table 1). Trees from 50E:50A used a higherproportion (57%) of the total annual precipitation than mono-cultures (100E: 49% and 100A: 30%, Table 1). Total evapotranspira-tion (ET) followed the same trend (Table 1 and Fig. 3). Thedifference between ET and E showed that understorey evapotran-spiration (transpiration and soil evaporation) in 100E and 100Awas higher (211 and 287 mm, respectively) than in the 50E:50A(181 mm), thus the surface soil profile (0–100 cm depth) of 100Eand 100A was wetter than that of 50E:50A. These data match withabove- and belowground measurements of water use.
The higher transpiration of E. globulus reflects higher averagesap velocity of E. globulus (100E; 5.9 and 50E:50A; 6.2 cm h�1) thanA. mearnsii (100A; 4.0 and 50E:50A; 3.9 cm h�1). E. globulus wassignificantly more water use efficient in 50E:50A than in 100E(Table 1). This was due to large increases in growth rates relative tochanges in transpiration. In contrast A. mearnsii trees were lesswater use efficient in 50E:50A than in 100A, although notsignificantly so. Similar trends in WUE were found when WUE
was expressed as biomass (or volume) increment per unit ET
(rather than E; 100E; 5.7, 50E:50A; 9.4, 100A; 3.3 kg abovegroundbiomass per cubic metre ET).
3.5. Potential transpiration, canopy conductance and decoupling
coefficients
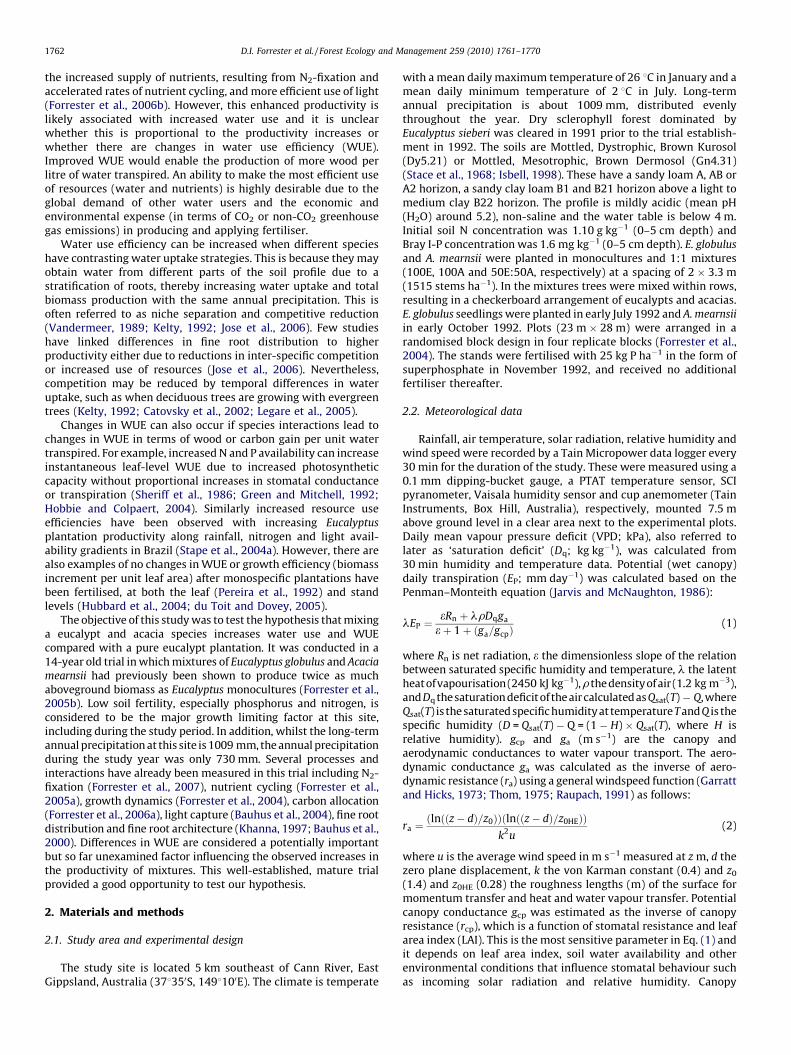
Potential annual transpiration calculated using Eq. (1) rangedfrom 882 mm (100A) to 1074 mm (50E:50A) with 100E in between(989 mm)(Fig. 3). These differences are mainly due to differencesin canopy conductance and leaf area index. Canopy conductancedeclined with increasing vapour pressure deficit (V) towardssimilar minimum values for each species and treatment (Fig. 4). Atlower V (<2 kPa) gc was highest in mixtures and E. globulus
monocultures and lowest in A. mearnsii monocultures, consistentwith the trends for tree transpiration. There was strong seasonalvariability of the decoupling coefficient (V) such that canopies ofall treatments were more strongly coupled with the atmosphereduring the warmer and windier months (V about 0.1). However,canopies in each treatment were generally well coupled to theatmosphere through out the study period with an average V ofabout 0.25 in each treatment (Table 1). A sensitivity analysisshowed that a 10% increase in ga and gc resulted in only a 5–6%reduction or increase in V, respectively, for all treatments.

Fig. 2. Comparison of soil moisture during its wettest (August) and driest months
(February) in the mixtures (50E:50A) and monocultures of E. globulus (100E) and A.
mearnsii (100A). Points are averages of four access tubes per plot. Error bars are
standard errors of difference. * indicates significant difference (P < 0.05) between
treatments.
D.I. Forrester et al. / Forest Ecology and Management 259 (2010) 1761–17701766
4. Discussion
4.1. Increased growth and transpiration in mixtures
Mixed-species plots used 17% and 93% more water than E.
globulus or A. mearnsii monocultures, respectively. This increasedwater use was driven by dramatic increases in growth of bothspecies, but particularly the eucalypts that out yielded mono-cultures between ages 14–15 years despite having only half thenumber of trees. The increased growth of the individual species inmixtures has been associated with annual rates of N2-fixation ofabout 38 kg ha�1 year�1 (Forrester et al., 2007), accelerated rates ofnitrogen and phosphorus cycling (Forrester et al., 2005a) andreduced competition for light due to canopy stratification in themixtures (Forrester et al., 2004). Annual transpiration was 419, 358
Table 1Stand parameters at age 15 years and increments between age 14 and 15 years. For a give
(P > 0.05). For comparisons between total mixture (both species combined) and mon
(P > 0.05).
Parameter 100E
Number of trees ha�1 1263x
Aboveground biomass (Mg ha�1) 66.6ax
Aboveground biomass increment (Mg ha�1) 3.28ax
Sapwood area (m2 ha�1) 6.88ax
Sapwood area increment (m2 ha�1) 0.187ax
Volume (m3 ha�1) 100.2ax
Volume increment (m3 ha�1) 6.04ax
Average diameter (cm) at 1.3 m of largest 300 crop trees ha�1 17.7a
Average diameter (cm) at 1.3 m of all trees 11.8a
LAI 1.39x
Potential (wet canopy) annual transpiration (EP; mm) 989
Total annual evapotranspiration (ET; mm) 569x
Annual tree transpiration (E; mm) 358ax
Percentage of annual precipitation transpired 49
Annual understorey transpiration and evaporation (mm) 211
Mean sap velocity (cm h�1) 5.89a
WUE (kg biomass per m3water transpired) 0.94axy
WUE (dm3 wood per m3water transpired) 1.71ax
Canopy decoupling coefficient (V) 0.26x
and 217 mm in the mixtures and monocultures of E. globulus and A.
mearnsii, respectively. These values are in the lower end of therange of values for other E. globulus plantations in south-easternAustralia (274–816 mm; Benyon et al., 2006). Average sap flowrates of E. globulus (100E; 5.8 and 50E:50A; 6.3 cm h�1) and A.
mearnsii (100A; 4.0 and 50E:50A; 3.9 cm h�1) were low incomparison to other Eucalyptus (5.3–13.5 cm h�1; Vertessy et al.,1995; Medhurst et al., 2002; Forrester et al., 2010) or Acacia
stands (6.4 cm h�1; Vertessy et al., 1995) in south-easternAustralia.
Growth rates were very low at this site. For example, meanannual volume increments at age 10 years (MAI10) were only7 m3 ha�1 year�1 in E. globulus monocultures, while the MAI10 of E.
globulus plantations in Victoria, typically increases from about 10–30 m3 ha�1 year�1 as mean annual rainfall increases from about600–1200 mm (Duncan et al., 2000). The low growth rates andwater use at this site are most likely mainly due to low soilphosphorus, however, soil water limitations would also restrictgrowth during the late spring–summer–early autumn period(Fig. 1), with possible fertility–water interactions as well. Moreintensive nutrient management, such as applying additionalphosphorus fertiliser, would have likely led to significant increasesin growth rates (and WUE) as well as higher relative differencesbetween the mixtures and monocultures.
Increased growth and transpiration may be a typical responseby Eucalyptus monocultures to improved nutrition. For example,fertiliser increased water use in five-year-old E. saligna stands byabout 14% (Hubbard et al., 2004). Four-year-old, effluent irrigatedEucalyptus grandis plantations used 10% more water than irrigatedcontrols (Myers et al., 1996). N fertilisation also increased leaf area,sapwood area and photosynthetic capacity of E. grandis treesindicating increased water use (Clearwater and Meinzer, 2001).Increased resource availability also increased individual tree wateruse in thinned Eucalyptus nitens stands (Medhurst et al., 2002).However, total productivity or water use was not changed in an E.
nitens plantation invaded by Acacia dealbata weeds (1000–20 000 stems ha�1). In this case A. dealbata weeds reduced wateruse of an E. nitens plantation in proportion to their basal area (Huntet al., 1998). Changes in nutrition (due to N2-fixation or litternutrient cycling) were not quantified and A. dealbata weedssignificantly increased stand density and competition for light andwater resources.
n species, mean values sharing the same letter (a or b) are not significantly different
ocultures means sharing the same letter (x, y or z) are not significantly different
50E:50A 100A
E. globulus A. mearnsii Total
669 751 1420y 1319x
58.3a 64.9a 123.2y 78ax
4.81a 0.85a 5.66y 1.65ax
5.13a 4.77a 9.90y 6.13bx
0.247a 0.045a 0.292y 0.102ax
88.3a 70.0a 158.3y 83.0ax
7.00a 0.96a 7.96x 1.85ay
19.3b 16.6a 15.5b
15.0b 14.1a 11.7b
2.07y 1.35x
1074 882
600y 504z
285a 134 419x 217by
39 18 57 30
181 287
6.15a 3.91a – 4.01a
1.69b 0.61a 1.34y 0.76ax
2.47a 0.69a 1.89x 0.85ay
0.25x 0.24x
Fig. 3. Cumulative total evapotranspiration (ET; error bars are standard errors of difference), modelled potential transpiration (EP) using the Penman–Monteith Eq. (1),
precipitation and pan evaporation from July 2006 to June 2007. Potential evaporation from bare wet soil is also modelled as a comparison. Minimum surface resistance values
(rcp(min)) used for EP calculations for the three treatments were 38.7, 28.7 and 84.8 s m�1 in 100E, 50E:50A and 100A, respectively. Surface resistance for a wet soil is taken as
100 s m�1 (Wallace, 1994).
D.I. Forrester et al. / Forest Ecology and Management 259 (2010) 1761–1770 1767
Trees in mixtures transpired a higher proportion of annualprecipitation (59%) than monocultures of E. globulus (49%) or A.
mearnsii (30%). This is similar to other Eucalyptus plantations thatalso do not have access to shallow groundwater (Benyon et al.,2006). Eucalyptus plantations that have access to ground water insouth-eastern Australia can transpire more than 200% of annualrainfall (Benyon et al., 2006). The understorey biomass (ortranspiration) was not measured but appeared similar in eachtreatment. The higher understorey evapotranspiration estimates in100E and 100A, are also likely to reflect their lower overstorey LAIcompared to 50E:50A, which could result in higher soil tempera-tures and soil evaporation in monocultures. Nevertheless, the
Fig. 4. Canopy conductance (gc) by mean daytime vapour pressure deficit (kPa) in
mixtures (50E:50A) and monocultures of E. globulus (100E) and A. mearnsii (100A).
higher LAI of the mixtures could also increase interception lossesand thus reduce water availability (Myers and Talsma, 1992). Thus,the increased LAI may increase water use but reduce wateravailability.
4.2. Water use efficiency
For every 1 m3 of water transpired E. globulus trees in mixturesproduced 51% and 87% more wood and aboveground biomass thanthose in monocultures, respectively, and mixtures produced 8%,38% and 50% more wood, biomass and leaf area than E. globulus
monocultures, respectively. To produce every 1 m3 wood, E.
globulus required 404 and 585 m3 water in mixtures andmonocultures, respectively. These figures are similar to those ofEucalyptus urophylla or E. grandis � urophylla plantations in Braziland China which used 200–600 m3 water per cubic metre wood(Morris et al., 2004; Stape et al., 2004a). The higher WUE inmixtures suggests physiological adjustments as well as structuraldifferences in terms of increased biomass, leaf area, sapwood areaand root stratification.
Changes in nutrition can lead to variable responses in terms ofWUE in Eucalyptus stands depending on water availability. Forexample, among a range of Eucalyptus plantations and nativestands in water-limited environments across Australia, standwater use was linearly related to leaf area without changes in WUE(Hatton et al., 1998; Benyon et al., 2006). In contrast, other studies,often on more productive sites, have shown that resource useefficiency increases with productivity and resource availability(Morris et al., 2004; Stape et al., 2004a,b). Stoneman et al. (1996)found that growth per LAI increased after fertilising Eucalyptus

D.I. Forrester et al. / Forest Ecology and Management 259 (2010) 1761–17701768
marginata native forest but only in thinned stands wherecompetition was probably reduced. Increases in WUE as observedin this study may be even greater in mixtures on sites with highergrowth rates. In contrast, on a very wet site in Hawaii with a meanannual precipitation of 4000 mm, short term (four months afterfertilising) increases in WUE were observed in fertilised E. saligna
stands, but long term (14–16 months after fertilising) increaseswere not significant (Hubbard et al., 2004). Similarly Pinus taeda
fertiliser trials have shown increases (Albaugh et al., 1998) whilePicea abies or E. grandis have shown no changes or reductions inWUE or growth efficiency (Phillips et al., 2001; du Toit and Dovey,2005). Thus, the influence of changed nutrition and its interactionswith other factors influencing liquid and vapour phase transport inplantations are probably species and site specific (Hubbard et al.,2004).
4.3. Differences in canopy physiology
The physiological adjustments observed in this study mayresult from improved photosynthetic capacity. Fertiliser has beenfound to increase maximum rates of photosynthesis, carboxylationand electron transport without proportional changes in stomatalconductance or transpiration, leading to increases in WUE (Sheriffet al., 1986; Green and Mitchell, 1992; Grassi et al., 2002; Hobbieand Colpaert, 2004). In the current experiment foliar nutrientconcentrations were higher in the canopies of both species inmixtures compared to monocultures (Forrester et al., 2007) andmaximum rates of photosynthesis (Amax) of leaves on the northernside of the upper canopy of E. globulus trees were significantlyhigher in mixtures than in monocultures at age 16 years (14.5 and11.8 mmol CO2 m�2 s�1, respectively; Forrester and Collopy,unpublished data). Maximum rates of electron transport (Jmax;125 or 102 mmol CO2 m�2 s�1 in 50E:50A or 100E, respectively)and carboxylation (Vcmax; 41 or 35 mmol CO2 m�2 s�1 in 50E:50Aor 100E, respectively; Forrester and Collopy, unpublished data)were also higher in mixtures than in monocultures. However, WUE(Amax/mmol H2O m�2 s�1 transpiration) were not significantlydifferent. Nevertheless short term (seconds) leaf-level values ofWUE often differ from longer term (yearly) stand level values ofWUE due to longer term adjustments in biomass allocation andrelationships between resource availability and efficiency of usefor different resources (Binkley et al., 2004).
4.4. Changes in carbon partitioning and root stratification
The increased N and P availability and light interception inmixtures could influence water use and WUE by changing theallocation between transpiring and absorbing tissues. For example,increased nutrition and site quality can shift the allocation ofbiomass from below to above ground in Eucalyptus stands (Stapeet al., 2004a). The ratio of aboveground net primary production tototal belowground carbon allocation was higher in mixtures (0.41)compared to E. globulus (0.31) and A. mearnsii (0.28) monocultures(Forrester et al., 2006a) and may have contributed to the higherWUE of mixtures.
Furthermore, fine root biomass at age six years (0–30 cm depth)and total belowground carbon allocation at age 11 years weresimilar (Bauhus et al., 2000; Forrester et al., 2006a) in eachtreatment despite higher rates of transpiration in the mixtures.While soil moisture profiles were similar for each species in theupper soil profile (0–50 cm), soil moisture was considerably higherat lower depths (300–400 cm) under A. mearnsii than when E.
globulus was present in mixtures or monoculture. Thus, competi-tion for water in the mixtures may have been reduced deeperwithin the soil profile due to root stratification. This is consistentwith leaf water potentials in mixtures and monocultures that were
similar for a given species and season (Forrester and Collopy,unpublished) despite the higher water use in the mixtures. Fewother studies have linked reduced belowground competition toincreased resource use and tree growth (Jose et al., 2006). Neaveand Florence (1994) also found vertical differentiation in rootingstructures in Corymbia maculata, Eucalyptus pilularis and Acacia
mabellae forests such that C. maculata had a greater fine rootbiomass in the deeper soil layers leading to a greater competitiveability during times when surface soils dry out, enablingcoexistence (as opposed to increased growth).
4.5. Canopy stratification and coupling with the atmosphere
The mixed-species stands had distinctly stratified canopies(Bauhus et al., 2004; Forrester et al., 2004) and a greater spacingbetween tall E. globulus crowns. We hypothesised that theserougher canopies in mixtures would reduce windspeed and be lesswell coupled with the atmosphere, leading to reductions in vapourpressure deficit and hence transpiration. However, this stratifica-tion did not result in differences in coupling. All treatments werewell coupled to the atmosphere (V averaged about 0.25 in alltreatments) as has been found in other Eucalyptus or Acacia
plantations (V of 0.08–0.65; Morris et al., 1998; Mielke et al., 1999;Mahmood et al., 2001).
4.6. Management implications
We have provided evidence that on a nutrient-stressed,medium–high rainfall, low forest productivity site, mixturescontaining E. globulus had better growth and water use efficiencythan E. globulus grown in monoculture. Within the context of thelimitations imposed by this site, and notwithstanding the need tofurther consider appropriate designs to allow for operationalimperatives, mixtures might provide an alternative to mono-cultures for growing Eucalyptus wood due to higher productivityand more efficient use of available water and nutrient resources.Where water is limiting due to low precipitation the belowgroundstratification of mixtures may enable more efficient use ofavailable soil moisture. Alternatively, because mixtures can bemore productive and use more water per unit land area (but moreefficiently), they could be used to maximise water use wherevegetation is used to mitigate rising water tables or to transpireeffluent irrigation water. In our example, E. globulus crop treediameters (1.3 m) were greater in mixtures, and Acacia treesshaded the lower canopies of the Eucalyptus thereby reducingbranch size and accelerating rates of branch shedding of Eucalyptus
(Bauhus et al., 2004), possibly reducing the need to thin andlowering pruning costs. The A. mearnsii in mixtures could be left tofix more nitrogen, thinned to waste or harvested (Forrester et al.,2004). However, for forest managers to consider uptake ofmixtures technologies, benefits would need to demonstrated onother sites and using various design options.
Acknowledgments
Funding for this project came from a University of Melbourne –CSIRO Collaborative Research Program grant, an Institute ofForesters of Australia Maxwell Ralph Jacobs Fund grant, theCooperative Research Centre for Forestry Program 4 and theVictorian Department of Sustainability and Environment.The experiment was established by the Commonwealth Scientificand Industrial Research Organisation, Division of Forestry, withthe Department of Natural Resources and Environment, Victoria,providing the site and the Australian Centre for InternationalAgricultural Research providing some financial support. Thanks toGlenn Dooley, Vijay Koul and John Larmour for professional advice

D.I. Forrester et al. / Forest Ecology and Management 259 (2010) 1761–1770 1769
and technical support with field and laboratory work. Help withthe data analysis of parts of this study from Robert Forrester isgratefully acknowledged. Thank you also to Joe Landsberg andthree anonymous reviewers who provided useful comments thatimproved the manuscript. We would like to dedicate this paper tothe memory of Dr Jim Morris.
References
Albaugh, T.J., Allen, H.L., Dougherty, P.M., Kress, L.W., King, J.S., 1998. Leaf area andabove- and belowground growth responses of Loblolly Pine to nutrient andwater additions. For. Sci. 44, 317–328.
Bauhus, J., Khanna, P.K., Menden, N., 2000. Aboveground and belowground inter-actions in mixed plantations of Eucalyptus globulus and Acacia mearnsii. Can. J.For. Res. 30, 1886–1894.
Bauhus, J., van Winden, A.P., Nicotra, A.B., 2004. Above-ground interactions andproductivity in mixed-species plantations of Acacia mearnsii and Eucalyptusglobulus. Can. J. For. Res. 34, 686–694.
Bennett, L.T., Weston, C.J., Attiwill, P.M., 1997. Biomass, nutrient content andgrowth response to fertilisers of six-year-old Eucalyptus globulus plantationsat three contrasting sites in Gippsland, Victoria. Aust. J. Bot. 45, 103–121.
Benyon, R.G., Theiveyanathan, S., Doody, T.M., 2006. Impacts of tree plantations ongroundwater in south-eastern Australia. Aust. J. Bot. 54, 181–192.
Binkley, D., Stape, J.L., Ryan, M.G., 2004. Thinking about efficiency of resource use inforests. For. Ecol. Manage. 193, 5–16.
Catovsky, S., Holbrook, N.M., Bazzaz, F.A., 2002. Coupling whole-tree transpirationand canopy photosynthesis in coniferous and broad-leaved tree species. Can. J.For. Res. 32, 295–309.
Clearwater, M.J., Meinzer, F.C., 2001. Relationships between hydraulic architectureand leaf photosynthetic capacity in nitrogen-fertilized Eucalyptus grandis trees.Tree Physiol. 21, 683–690.
du Toit, B., Dovey, S.B., 2005. Effect of site management on leaf area, early biomassdevelopment, and stand growth efficiency of a Eucalyptus grandis plantation inSouth Africa. Can. J. For. Res. 35, 891–900.
Duncan, M.J., Baker, T.G., Appleton, R., Stokes, R.C., 2000. Growth of EucalyptPlantation Species Across Twelve Sites in Gippsland, Victoria. Report No 99/056, Centre for Forest Tree Technology, Department of Natural Resources andEnvironment. Melbourne, Australia. 50 p.
Dunnin, F.X., Aston, A.R., 1984. The development and proving of models of large-scale evapotranspiration: an Australian study. Agric. Water Manage. 8, 305–323.
Edwards, W.R.N., Warwick, N.W.M., 1984. Transpiration from a kiwi fruit vine asestimated by the heat pulse technique and the Penman–Monteith equation. N.Z. J. Agric. Res. 27, 537–543.
Fiora, A., Cescatti, A., 2006. Diurnal and seasonal variability in radial distribution ofsap flux density: implications for estimating stand transpiration. Tree Physiol.26, 1217–1225.
Forrester, D.I., Bauhus, J., Cowie, A.L., 2005a. Nutrient cycling in a mixed-speciesplantation of Eucalyptus globulus and Acacia mearnsii. Can. J. For. Res. 35, 2942–2950.
Forrester, D.I., Bauhus, J., Cowie, A.L., 2005b. On the success and failure of mixed-species tree plantations: lessons learned from a model system of Eucalyptusglobulus and Acacia mearnsii. For. Ecol. Manage. 209, 147–155.
Forrester, D.I., Bauhus, J., Cowie, A.L., 2006a. Carbon allocation in a mixed-speciesplantation of Eucalyptus globulus and Acacia mearnsii. For. Ecol. Manage. 233,275–284.
Forrester, D.I., Bauhus, J., Cowie, A.L., Vanclay, J.K., 2006b. Mixed-species plantationsof Eucalyptus with nitrogen fixing trees: a review. For. Ecol. Manage. 233, 211–230.
Forrester, D.I., Bauhus, J., Khanna, P.K., 2004. Growth dynamics in a mixed-speciesplantation of Eucalyptus globulus and Acacia mearnsii. For. Ecol. Manage. 193,81–95.
Forrester, D.I., Collopy, J.J., Morris, J.D., 2010. Transpiration along an age series ofEucalyptus globulus plantations in southeastern Australia. For. Ecol. Manage.259, 1754–1760.
Forrester, D.I., Schortemeyer, M., Stock, W.D., Bauhus, J., Khanna, P.K., Cowie, A.L.,2007. Assessing nitrogen fixation in mixed- and single-species plantations ofEucalyptus globulus and Acacia mearnsii. Tree Physiol. 27, 1319–1328.
Garratt, J.R., Hicks, B.B., 1973. Momentum, heat and water vapour transfer to andfrom natural and artificial surfaces. Q. J. R. Meteorol. Soc. 99, 680–687.
Grassi, G., Meir, P., Cromer, R., Tompkins, D., Jarvis, P.G., 2002. Photosyntheticparameters in seedlings of Eucalyptus grandis as affected by rate of nitrogensupply. Plant Cell Environ. 25, 1677–1688.
Green, T.H., Mitchell, R.J., 1992. Effects of nitrogen on the response of Loblolly Pineto water stress. I. Photosynthesis and stomatal conductance. New Phytol. 122,627–633.
Hatton, T., Reece, P., Taylor, P., McEwan, K., 1998. Does leaf water efficiency varyamong eucalypts in water-limited environments? Tree Physiol. 18, 529–536.
Hatton, T.J., Catchpole, E.A., Vertessy, R.A., 1990. Integration of sap flow velocity toestimate plant water use. Tree Physiol. 6, 201–209.
Hobbie, E.A., Colpaert, J.V., 2004. Nitrogen availability and mycorrhizal colonizationinfluence water use efficiency and carbon isotope patterns in Pinus sylvestris.New Phytol. 164, 515–525.
Hookey, G.R., Bartle, J.R., Loh, I.C., 1987. Water use of eucalypts above salinegroundwater. Final Report. Australian Water Resources Council Research Pro-ject 84/166, Water Authority of Western Australia, 40 p.
Hubbard, R.M., Ryan, M.G., Giardina, C.P., Barnard, H., 2004. The effect of fertilizationon sap flux and canopy conductance in a Eucalyptus saligna experimental forest.Global Change Biol. 10, 427–436.
Hunt, M.A., Beadle, C.L., Dye, P.J., 1998. Whole-tree transpiration and water-usepartitioning between Eucalyptus nitens and Acacia dealbata weeds in a short-rotation plantation in northeastern Tasmania. Tree Physiol. 18, 557–563.
Iglesias, G., Wilstermann, D., 2008. Eucalyptus universalis. Global cultivated eucalyptforests map 2008. Version 1.0.1 In GIT Forestry Consulting’s Eucalyptologic-s:Information resources on Eucalyptus cultivation worldwide. Retrieved fromhttp://www.git-forestry.com/ (March 29, 2009).
Isbell, R.F., 1998. The Australian Soil Classification. CSIRO Publishing, Collingwood.Jarvis, P.G., McNaughton, K.G., 1986. Stomatal control of transpiration: scaling up
from leaf to region. Adv. Ecol. Res. 15, 1–49.Jose, S., Williams, R., Zamora, D., 2006. Belowground ecological interactions in
mixed-species forest plantations. For. Ecol. Manage. 233, 231–239.Kelty, M.J., 1992. Comparative productivity of monocultures and mixed-species
stands. In: Kelty, M.J., Larson, B.C., Oliver, C.D. (Eds.), The Ecology and Silvi-culture of Mixed-Species Forests. Kluwer Academic Publishers, Dordrecht, pp.125–141.
Khanna, P.K., 1997. Comparison of growth and nutrition of young monocultures andmixed stands of Eucalyptus globulus and Acacia mearnsii. For. Ecol. Manage. 94,105–113.
Landsberg, J.J., 1986. Physiological Ecology of Forest Production. Academic Press,London.
Legare, S., Bergeron, Y., Pare, D., 2005. Effect of aspen as a companion species on thegrowth of black spruce in the southwestern forest of Quebec. For. Ecol. Manage.208, 211–222.
Leuning, R., Cromer, R.N., Rance, S., 1991. Spatial distributions of foliar nitrogen andphosphorus in crowns of Eucalyptus grandis. Oecologia 88, 504–510.
Mahmood, K., Morris, J., Collopy, J., Slavich, P., 2001. Groundwater uptake andsustainability of farm plantations on saline sites in Punjab province, Pakistan.Agric. Water Manage. 48, 1–20.
Medhurst, J.L., Battaglia, M., Beadle, C.L., 2002. Measured and predicted changes intree and stand water use following high-intensity thinning of an 8-year-oldEucalyptus nitens plantation. Tree Physiol. 22, 775–784.
Mielke, M.S., Oliva, M.A., de Barros, N.F., Penchel, R.M., Martinez, C.A., de Almeida,A.C., 1999. Stomatal control of transpiration in the canopy of a clonal Eucalyptusgrandis plantation. Trees 13, 152–160.
Monteith, J.L., Unsworth, M.H., 1990. Principles of Environmental Physics. EdwardArnold, London.
Morris, J., Mann, L., Collopy, J., 1998. Transpiration and canopy conductance in aeucalypt plantation using shallow saline groundwater. Tree Physiol. 18, 547–555.
Morris, J., Zhang, N.N., Yang, Z.J., Collopy, J., Xu, D.P., 2004. Water use by fast-growing Eucalyptus urophylla plantations in southern China. Tree Physiol. 24,1035–1044.
Myers, B.J., Talsma, T., 1992. Site water balance and tree water status in irrigatedand fertilised stands of Pinus radiata. For. Ecol. Manage. 52, 17–42.
Myers, B.J., Theiveyanathan, S., O’Brien, N.D., Bond, W.J., 1996. Growth and wateruse of Eucalyptus grandis and Pinus radiata plantations irrigated with effluent.Tree Physiol. 16, 211–219.
Neave, I.A., Florence, R.G., 1994. The effect of root configuration on the relativecompetitive ability of Eucalyptus maculata Hook. regrowth following clearfel-ling. Aust. For. 57, 49–58.
Olbrich, B.W., 1991. The verification of the heat pulse velocity technique forestimating sap flow in Eucalyptus grandis. Can. J. For. Res. 21, 836–841.
Pereira, J.S., Chaves, M.M., Fonseca, F., Araujo, M.C., Torres, F., 1992. Photosyntheticcapacity of leaves of Eucalyptus globulus (Labill.) growing in the field withdifferent nutrient and water supplies. Tree Physiol. 11, 381–389.
Persson, G., 1995. Willow stand evapotranspiration simulated for Swedish soils.Agric. Water Manage. 28, 271–293.
Phillips, N., Bergh, J., Oren, R., Linder, S., 2001. Effects of nutrition and soil wateravailability on water use in a Norway spruce stand. Tree Physiol. 21, 851–860.
Raupach, M.R., 1991. Vegetation-atmosphere interaction in homogeneous andheterogeneous terrain: some implications of mixed-layer dynamics. Vegetatio91, 105–120.
Sellers, W.D., 1965. Physical Climatology. University of Chicago Press, Chicago.Sheriff, D.W., Nambiar, E.K.S., Fife, D.N., 1986. Relationships between nutrient
status, carbon assimilation and water use efficiency in Pinus radiata (D. Don)needles. Tree Physiol. 2, 73–88.
Shuttleworth, W.J., 1989. Micrometeorology of temperate and tropical forest.Philos. Trans. R. Soc. Lond. 324, 299–334.
Stace, H.C.T., Hubble, G.D., Brewer, R., Northcote, K.H., Sleeman, J.R., Mulcahy, M.J.,Hallsworth, E.G., 1968. A Handbook of Australian Soils. Rellim, Glenside, S.A.,Australia.
Stape, J.L., Binkley, D., Ryan, M.G., 2004a. Eucalyptus production and the supply, useand efficiency of use of water, light and nitrogen across a geographic gradient inBrazil. For. Ecol. Manage. 193, 17–31.
Stape, J.L., Binkley, D., Ryan, M.G., Gomes, A.D.N., 2004b. Water use, water limita-tion, and water use efficiency in a Eucalyptus plantation; irrigation. Bosque 25,35–41.
Stoneman, G.L., Crombie, D.S., Whitford, K., Hingston, F.J., Giles, R., Portlock, C.C.,Galbraith, J.H., Dimmock, G.M., 1996. Growth and water relations of Eucalyptus

D.I. Forrester et al. / Forest Ecology and Management 259 (2010) 1761–17701770
marginata (jarrah) stands in response to thinning and fertilization. Tree Physiol.17, 267–274.
Thom, A.S., 1975. Momentum, mass and heat exchange of plat communities. In:Monteith, J.L. (Ed.), Vegetation and the Atmosphere, vol. 1. Academic Press,London, pp. 57–109.
Vandermeer, J., 1989. The Ecology of Intercropping. Cambridge University Press,New York.
Vertessy, R.A., Benyon, R.G., O’Sullivan, S.K., Gribben, P.R., 1995. Relationshipsbetween stem diameter, sapwood area, leaf area and transpiration in a youngMountain Ash forest. Tree Physiol. 15, 559–567.
Wallace, J.S., 1994. Calculating evaporation: resistance to factors. Agric. For.Meteorol. 73, 353–366.
Whitehead, D., Beadle, C.L., 2004. Physiological regulation of productivity and wateruse in Eucalyptus: a review. For. Ecol. Manage. 193, 113–140.
Copyright © 2022 FDOKUMEN