Second-generation ethanol in Chile: optimisation of the autohydrolysis of Eucalyptus globulus
13
1 23 !"# $% % &' %()**++, !
Transcript of Second-generation ethanol in Chile: optimisation of the autohydrolysis of Eucalyptus globulus

1 23
�������� �������������������������� ������� ������������������ ���������������������� �!"�#����������$%������%&'��� %� ()�**��� �+� ��+�,
��������� ������� ������������������ ����������� ���������������������� ������
���������� �������������������� ��������� ������������������������������������������ ���������!�������������

1 23
Your article is protected by copyright andall rights are held exclusively by Springer-Verlag Berlin Heidelberg. This e-offprint isfor personal use only and shall not be self-archived in electronic repositories. If you wishto self-archive your article, please use theaccepted manuscript version for posting onyour own website. You may further depositthe accepted manuscript version in anyrepository, provided it is only made publiclyavailable 12 months after official publicationor later and provided acknowledgement isgiven to the original source of publicationand a link is inserted to the published articleon Springer's website. The link must beaccompanied by the following text: "The finalpublication is available at link.springer.com”.

ORIGINAL ARTICLE
Second-generation ethanol in Chile: optimisationof the autohydrolysis of Eucalyptus globulus
Teresita Marzialetti & Juan Pablo Salazar &
Constanza Ocampos & Richard Chandra & Pablo Chung &
Jack Saddler & Carolina Parra
Received: 26 August 2013 /Revised: 30 December 2013 /Accepted: 6 January 2014# Springer-Verlag Berlin Heidelberg 2014
Abstract A highly efficient pretreatment process to breakdown the recalcitrant structure of Eucalyptus globulus rawmaterial to produce ethanol was investigated. A responsesurface methodology was used to optimise the pretreatmentparameters. The inlet parameters were temperature and time,and the response parameters were the total glucose plus xyloseyields and the glucose yield as a quantification of the suscep-tibility to enzymatic hydrolysis of the solid material. It wasdetermined that the central point conditions (175 °C, 43 min)produced close to the optimum of the total glucose plus xyloseyields, achieving 57 % (dry matter) xylose yield and 63 %glucose yield. However, the optimum of the glucose yield,95 % (dry matter), in which almost all xylose was degraded,was achieved at 194 °C and 51 min, a condition close to a starpoint (N6). In addition, the maximum ethanol produced in thisstudy was 262 L/ton of dry rawmaterial at 194 °C and 51min.The characterisation of the pretreated material enabled thecorrelation of glucose yield with physical, chemical and mor-phological properties of pretreated material. Enzymatic hy-drolysis and the modified Simons’ stain technique indicated asimilar increasing linear dependency with moderate severityfactors. However, with high-severity factors, these findingsindicated an inverse effect, suggesting that there is no dyeretention in the modified material when no fibre-like structure
remains. This behaviour was consistent with the physical andmorphological appearances of the pretreated material, as dem-onstrated by scanning electronmicroscopy images, kink indexand coarseness.
Keywords Autohydrolysis . Bioethanol . Eucalyptusglobulus . SSF . Biorefinery
1 Introduction
The increasing price of oil and the ongoing environmentalconcerns have increased worldwide interest in renewable ener-gy. In Chile, gross domestic energy consumption consists ofapproximately 9 % hydroelectricity, 12 % natural gas, 16 %coal, 20 % firewood and 43 % crude oil. According to a WorldBank report published in 2012 [1], Chile consumed1,826.32 kg of oil equivalent per capita in 2010, importingover 72 % of that energy. Specifically, Chile imports 98 % ofthe oil it uses, 96% of the coal and 75% of the natural gas. Thisstrong dependency on foreign energy places Chile in a difficultposition, making it particularly interested in renewable energy.Renewable energy from lignocellulosic biomass is an attractiveoption for Chile. Consequently, the Chilean government hasbegun turning its attention to biofuels over the last decade.Accordingly, in 2007, the government established that biofuelsare tax-free, and in 2008, it approved a blend of up to 5 % v/vofbioethanol in gasoline (E5) (voluntary).
Chile is a narrow, small country with huge forest planta-tions. Forty-five percent (35 million hectares) of Chile’s totalsurface has forest generation capacity, of which 13.7 millionhectares contain native forest species, 2.3 million hectarescontain planted forest (mainly Eucalyptus sp., Pinus radiata)and 19 million hectares are protected areas [2]. Eucalyptusglobulus (E. globulus) has a high growth rate, short rotationlength (10 years) and favourable pulpwood properties [3]. It
T. Marzialetti (*)Chemical Engineering Department, Edificio Gustavo Pizarro Castro,2do Piso, Universidad de Concepción, Barrio Universitario s/no.Correo 3, Casilla 160-C, Concepción, VIII Región, Chilee-mail: [email protected]
J. P. Salazar : C. Ocampos :C. ParraCentro de Biotecnología, Universidad de Concepción, BarrioUniversitario s/no., Concepción, VIII Región, Chile
R. Chandra : P. Chung : J. SaddlerDepartment of Wood Science, Faculty of Forestry, University ofBritish Columbia, Vancouver, Canada
Biomass Conv. Bioref.DOI 10.1007/s13399-014-0114-x
Author's personal copy

also grows more than twice as fast in Chile as in their nativelands of Australia.
Considering Chile’s vast forest plantations and the enor-mous amounts of woody waste generated by its forestry indus-try, Chile may have the needed rawmaterial available to supplynational fuel demand and to become a role model of biorefineryby converting lignocellulosic biomass (virgin or waste), whichis a low-cost biomass, into renewable biofuels as well as value-added products such as biomaterials and chemicals. In thiscontext, a feasible strategy would be to transform cellulose-rich material, such as pulp and paper industry waste, forestwaste and dendroenergetic plantations, into (1) biofuels such asethanol, butanol and 2,5-dimethylfuran (DMF); (2) power andheat to fulfil the biorefinery needs and (3) value-addedchemicals, such as furfural and 5-hydroxymethylfurfural(HMF), among others.
Lignocellulosic material is composed of carbohydratepolymers (cellulose, hemicellulose) and an aromatic polymer(lignin). Carbohydrate polymers are tightly bound to lignin.Cellulose is a linear homopolysaccharide of glucose(D-glucopiranose) units linked together by !-(1-4) glycosidicbonds. Hemicelluloses, on the other hand, are made of a widevariety of building blocks, including pentoses (e.g. xylose,rhamnose and arabinose), hexoses (e.g. glucose, mannose andgalactose) and uronic acids (e.g. 4-O-methyl-glucuronic andgalacturonic acids). Lignin is a racemic, heteropolymerconsisting of three hydroxycinnamyl alcohol monomers dif-fering in their degree of methoxylation: p-coumaryl, coniferyland sinapyl alcohols. The proportion of these monomersvaries among species similar to the composition of hemicel-luloses [4].
Lignocellulosic biomass can be directly or indirectly usedfor the production of biomolecules and commodity chemicals.However, some applications are limited because of the stronginteraction of the three main components of the plant cell wall,cellulose hemicelluloses and lignin.
The bioconversion processes of lignocellulosic materials tobioethanol typically involve three main steps: pretreatment,hydrolysis and fermentation. These steps may be conductedseparately or in combination. Although all three steps areimportant, pretreatment greatly influences the other twodownstream processes [5]. Furthermore, the pretreatment oflignocellulosic materials for the production of ethanol hasbeen a major limitation in the commercialisation of lignocel-lulosic ethanol [6]. A number of different pretreatments in-volving biological, chemical, physical and thermal ap-proaches have been investigated over the years, but only thosethat employ chemicals currently offer the high yields and lowcosts vital to economic success. Chemical hydrolysis usesagents such as acid or base to effect the solubilisation ofsaccharides [7]. Of the types of chemical hydrolysis men-tioned, dilute sulphuric acid is the most popular catalyst testedfor producing glucose from cellulosic materials. The first
detailed study of the kinetics of dilute acid hydrolysis of woodat elevated temperatures has been attributed to Saeman in1945 [8]. Acid pretreatment is a process in which hydroniumions break down or attack intermolecular and intramolecularbonds among cellulose, hemicellulose and lignin. This pre-treatment increases the porosity of the substrate and accessibilityof cellulose to enzymes for subsequent hydrolysis. Dependingon the selected biomass for the process, hydronium ions mayalso be formed without adding acid in what is often calledautohydrolysis [9], obtaining hemicellulose sugar primarily inoligomeric form, reducing the degradation and consequentlyloss of valuable monosaccharides [10]. In autohydrolysis pre-treatment, hydronium ions are generated from both water andnascent organic acids, predominantly formic and acetic acids.Accordingly, extent literature can be found about theautohydrolysis of E. globulus as a pretreatment of raw materialfor the production of ethanol [10, 15, 19, 22–27] or as apretreatment before kraft pulping [28–32].
The primary objective of this study was to develop anefficient process to break down recalcitrant lignocellulosicmaterial, thus obtaining high-quality fermentable sugars forethanol production. Consequently, this paper focuses onautohydrolysis of E. globulus to produce high concentrationsof ethanol, preventing degradation of carbohydrates fromhemicelluloses. This study was based on previous work andan extensive literature review of a variety of reaction condi-tions. An important aspect of this study was a comprehensivecharacterisation of pretreated and raw material with the inten-tion of correlating physical, chemical and morphological in-formation with the enzymatic hydrolysis behaviour of thepretreated materials.
2 Materials and methods
2.1 Raw material
Empresas CMPC S.A., Chile, generously provided chips ofE. globulus. Raw material was screened to ensure homoge-neous 2.5-cm ! 2.5-cm ! 0.5-cm chips, air-dried and stored ina dry and dark place until use.
2.2 Chemical characterisation
Wood chips (or pretreated material) were milled and sieved topass through a 0.4-mm ! 0.25-mm (45/60 mesh) screen. Forextractives removal, 1.5 g of milled wood was sequentiallyextracted with 90 % acetone and 95 % ethanol in a Soxhletapparatus for 40 cycles with each solvent. Hydrolysis of theextracted sample, as well as carbohydrate and lignin character-isation, were conducted according toMonrroy et al. [12]. Sugarsand organic acids were determined by high-performance liquidchromatography (HPLC) as described by Araque et al. [11],
Biomass Conv. Bioref.
Author's personal copy
using a Merck HPLC (Lachrom) equipped with an IR detectorand a Biorad HPX 87-H column. Furfural and HMF weredetermined according to Saha and Cotter [13], using a MerckHPLC (Lachrom) equipped with UV detector, a Biorad HPX87-H column and a mixture of 5 mm H2SO4 and 18 %v/vacetonitrile as eluent. Ash content was determined by theTAPPI method (T 211 om-12) [14]. Experiments were per-formed in triplicate.
2.3 Autohydrolysis pretreatment
All reactions were performed in a 1-gal semi-batch reactor,Model 4451 (Parr Instrument Company, USA), supplied witha mechanical stirring device. The reactor was loaded with200 g of air-dried chips ofE. globulus (!8%moisture content)and 200 mL of water (L/W = 6). The mixture was stirred at150 rpm and heated at 11 °C/min up to each reaction temper-ature (160–196 °C), maintained at the corresponding reactiontime. After the reaction, the reactor was cooled down andslowly depressurised. The pretreated material was separatedfrom the liquor by vacuum filtration. The solid fraction waswashed and weighed. Liquors and pretreated materials werestored at 4 °C until use. The liquid fraction was characterisedimmediately after the reaction.
Xylose and solid yields (%) were calculated as follows:
Solid yield %; drymatter! " # recovered solidraw material
! "$100 !1"
Xylose yield %; dry matter! " #Xylliquor
Xylraw material
! "x100 !2"
where the recovered solid is the mass of solid recovered afterpretreatment, Xylliquor represents the mass of xylose dissolvedin the liquid phase after pretreatment and Xylraw material is themass of xylose initially present in the raw material.
2.4 Severity factor
The severity factor is an expression that combines the inde-pendent variables of temperature and time into a single inde-pendent variable [19].
R0 #Z
0
t
expT r‐T b
14:75
! "dt !3"
where Tr = reaction temperature, °C; Tb = reference tempera-ture = 100 °C; t = residence time of pretreatment, minutes.
In this study, a global R0 value was calculated, whichincluded heating and cooling stages for each reaction. Forpractical reasons, the severity factor is calculated and
presented using a log scale. Accordingly, the ln(R0) had beenelsewhere defined as S0 [19].
2.5 Experimental design and data analysis
A response surface methodology (RSM) was used to optimisethe pretreatment parameters. The inlet parameters were tem-perature and time, and the response parameters were xyloseyields in the liquor and the glucose yield as a quantification ofthe susceptibility to enzymatic hydrolysis of the pretreatedmaterial. Two strategies were used in this study to optimisethe response variables: (1) maximisation of the glucose yieldand the xylose yield as the total glucose plus xylose yields or(2) the maximisation of the glucose yield, minimising thexylose yield. In strategy 1, the focus was on producing mod-erate concentrations of glucose by enzymatic hydrolysis (EH)to produce ethanol and producing a high concentration ofxylose to produce value-added products at the same time.The second strategy was a central composite circumscribeddesign (CCC) composed of a full factorial design, augmentedby an additional block of experiments (star points), and wasused to maximise the potential to assess these trials. The starpoints were at some distance n1/2 from the central point (n isthe number of variables), establishing new extremes for thelow and high settings for all factors [16].
The input parameters were coded and normalised in unitaryvalues, where centre points were assigned a value of 0. Thesmallest values (160 °C and 15 min) were assigned a value of"1 and the largest values (190 °C and 70 min) were assigned avalue of +1, and star points were coded "1.414 and 1.414, asappropriate. The centre point conditions (N5, N6, N7 and N8)were selected based on preliminary experiments (data notshown). They were assayed in triplicate. The ranges of theconditions were as follows: temperature, 154–196 °C andtime, 4–81 min.
A second-order function that describes the system behav-iour was determined by a multiple linear regression method(MLR). The statistical validation was performed via a one-way ANOVA test with a 90 % confidence. The optimalcondition values were determined over the response surfacevia the SIMPLEX method. Experimental data were analysedusing MODDE 7.0.0.1 (Umetrics).
2.6 Enzymatic hydrolysis and simultaneous saccharificationand fermentation
The glucose yield from enzymatic hydrolysis of the washedpretreated material was an output parameter used in the ex-perimental design. However, simultaneous saccharificationand fermentation was performed with a few selected samples.
EH and simultaneous saccharification and fermentation(SSF) were conducted at 10.0 % (w/v) substrate consistencyin a 250-mLErlenmeyer flask. The washed pretreatedmaterial
Biomass Conv. Bioref.
Author's personal copy

and the sodium citrate buffer (50 mM and 4.8 pH) were mixedwith 20 FPU cellulase (Celluclast; Novozymes, USA) and 20CBU !-glucosidase (Novozym 188; Novozymes, USA) pergram of the washed pretreated material (dry matter). In thecase of SSF, the medium was supplemented with 5 g/L pep-tone, 5 g/L yeast extract, 1 g/L NH4Cl, 0.5 g/L MgSO4·7H2O,1 g/L KH2PO4 and 6 g/L Saccharomyces cerevisiae IR2-9a.This yeast strain was previously acclimated in our laboratoryto perform at 40 °C [17]. The reaction mixtures were heated at50 °C (EH) or 40 °C (SSF), with stirring at 150 rpm. Samplesof the liquid fraction of EH and of SSF reactions were takenperiodically for 72 h. The ethanol concentration of liquidsamples was determined by a gas chromatography in aPerkin-Elmer Autosystem XL Headspace, using an FID de-tector and a HPSMS 30 m column. All dissolved sugars werequantified as described in section 2.2. Both the ethanol yield(from SSF) and glucose yield (from EH) were calculatedaccording to Eq. 4.
Product yield dry matter;%! " # AP#Yw
Bw!4"
where A is the ethanol or glucose produced [grams], P is themass of pretreated material used [grams], Yw is the solid yieldfrom 100 g of pretreated material and Bw is the theoreticalmass of ethanol or glucose produced from the initial woodcomposition [grams].
2.7 Simons’ stain method
The Simons’ stain method estimates the pore distribution of asubstrate in its wet state, which is especially important in thecase of lignocellulosic materials that undergo significantchanges to their structure upon drying.
It was originally developed as a lignocellulosic fibre stain-ing method to be used in the microscopic evaluation of themechanical damage of pulp fibres during beating.
The modified Simons’ stain technique developed byChandra et al. [18] significantly reduces the processing timeand uses the adsorption isotherm, calculating the maximumdye adsorbed on the substrate. Accordingly, 10mg (ODwt) offibre samples were weighed into six 15-mL centrifuge tubes tomeasure the amount of adsorbed dye on the fibre. A total of0.1 mL of phosphate-buffered saline solution (PBS; pH 6.0,3 M PO4, 1.4 mM NaCl) was added to each tube. Directorange 15 (DO) solution (10 mg/mL) was then added in aseries of increasing volumes (0.025, 0.050, 0.075, 0.1, 0.150and 0.2 mL) to a series of six tubes, each containing a solidsample and PBS. Distilled water was added to bring the finalvolume in the centrifuge tubes to 1.0 mL. These tubes wereincubated at the specified time and temperature with shakingat 200 rpm, 60 °C and 8–10 h. After the incubation period, thetubes were centrifuged at 10,000 rpm for 5 min and a sample
of the supernatant was placed in a cuvette, and the absorbancewas read on a Shimadzu 1650 UV–PC spectrophotometer at624 and 455 nm. The amount of dye adsorbed onto the fibrewas determined using the difference in the concentration ofthe initial added dye and the concentration of the dye in thesupernatant.
2.8 Physical characterisation
2.8.1 Water retention value
Water retention value (WRV) indicates the ability of fibres totake up water and swell. The tests were run by placing a pad ofnever-dried fibres in a centrifuge tube with a fine wire screen,which is placed at the bottom of the tube. Following TAPPI-UM 256, the centrifuge was accelerated at 900 g to removewater from the outside surfaces and lumens of the fibre. Theremaining water is believed to be associated with submicro-scopic pores within the cell wall. The centrifuged fibre padwas weighed, dried at 105 °C and then reweighed.
2.8.2 Scanning electron microscopy
The external morphology and orientation of the fibres wereanalysed using a scanning electron microscope (JEOL, JSM638 LV). Selected samples were coated with 500 Å of goldprior to examination.
2.8.3 Fibre quality analyser
The fibre quality analyser (FQA; Lorentzen & Wettre,Sweden) allowed the determination of fibre length, coarsenessand fibre kink index for a variety of autohydrolysis pretreatedmaterial. The FQA rapidly measured the length and shape ofcellulose fibres in suspension. All FQA measurements werethe average of 100,000 fibres.
3 Results and discussion
The chemical composition of E. globulus and pretreated ma-terials by autohydrolysis is summarised in Table 1. The solidyields ranged from 70 to 92 % (dry matter), depending on theseverity of the pretreatment, expressed as S0. As expected, theconcentration of furfural in the liquor increased with increas-ing S0. Consequently, 8 g/L of furfural was quantified at194 °C and 51 min S0 = 4.63) and was the maximum valuedmeasured in this study (data not shown).
3.1 Experimental design
A set of 11 experiments at selected reaction times and reactiontemperatures were conducted according to the RSM. The
Biomass Conv. Bioref.
Author's personal copy
effects of pretreatment conditions on the two process re-sponses, xylose yields in the liquid phase and the glucoseyield as a quantification of the susceptibility to enzymatichydrolysis of the pretreated material were qualitativelydiscussed above. Each process response was fitted to asecond-order polynomial equation using MODDE 7.0.0.1software (Umetrics), as shown in Eqs. 5 and 6, validated bya one-way ANOVA test and experimental data.
y1 # 2:02 %0:23! " & 1:02 T %0:14! " & 0:38 t %0:14! "
& 0:18 T2 %0:17! " & 0:25 t2 %0:17! "
!5"
y2 # 2:80 %0:46! " & 0:05 T %0:28! " & 0:19 t %0:28! "
& 1:01 T2 %0:34! " & 0:30 t2 %0:34! "
& 0:91 T t %0:40! "
!6"
where y1 is glucose yield, % (dry mater); y2 is xylose yield, %(dry mater); T = temperature, °C; t = time, minutes. Thecoefficients were normalised to compare the relative
importance of the model variables. The value of the errorscorresponds to the 90 % confidence level. The interactionbetween time and temperature for the glucose yield (Eq. 6)was not significant at the 10 level, removing it from theequation. However, this interaction (time–temperature) wassignificant for xylose yield. Hemicelluloses are more suscep-tible to hydrolysis and degradation than cellulose, which mayexplain the influence of the time–temperature interaction.
The Eqs. 5 and 6 are useful tools to predict the responses toall combinations of variables within the investigated range.
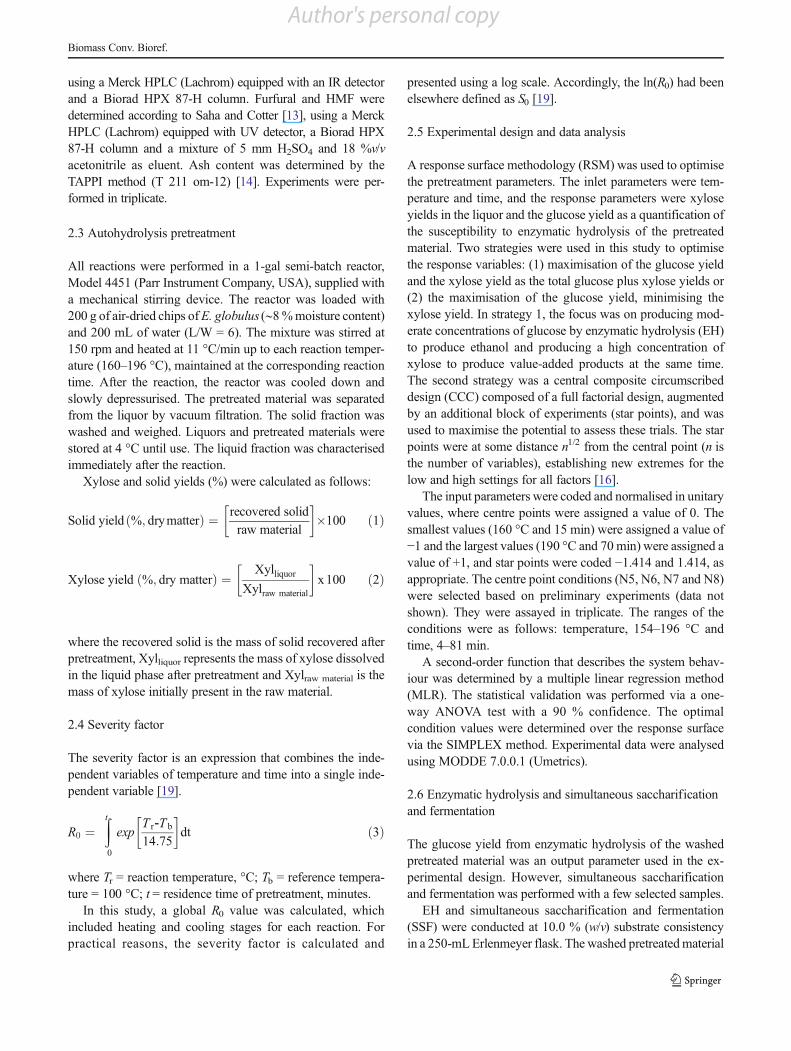
The correlation coefficients for both responses were close to1, 0.980 for glucose yield and 0.92 for xylose yield, indicating astrong linear relationship between predicted and experimentaldata. The experimental data, as well as the ANOVA test, statis-tically validated the model. Figure 1 shows the second-orderpolynomial response surfaces for each response parameter.
The model predicted that the reaction condition to achievemaximum values for the total glucose plus xylose yields(strategy 1) was at 177 °C for 47 min. The xylose plus glucoseyields predicted by the model at this reaction condition were 55± 4 and 64 ± 6 %, respectively. According to the experimental
Table 1 Reaction conditions of the autohydrolysis of chips of E. globulus, yield of xylose and glucose of all tests of the experimental design andchemical composition of E. globulus and pretreated materials
Ega N1 N2 N3 N4 N5 N6 N7 N8 N9b OX+Gc OG
d
Pretreatment conditions
Temperature, °C 160 190 160 190 154 196 175 175 175 177 194
Time, min 15 15 70 70 43 43 4 81 43 47 51
ln(R0)e 3.29 4.21 3.72 4.60 3.29 4.62 3.54 4.21 4.00±0.0 4.02 4.63
Solid yield (%, dry matter) 89.3 72.2 76.4 72.0 91.8 71.8 90.0 75.0 74.5±1.9 77.3 70.6
Composition of raw and pretreated material (%, dry matterf)
Glucan 47.8 46.5 41.9 40.3 47.8 46.1 48.1 46.3 48.3 46.2±2.3 48.2 47.8
Xylan, galactan, mannan 16.7 14.3 2.4 6.1 1.7 13.8 0.0 10.1 2.5 4.0±0.0 5.2 1.2
Arabinan 00.2 00.0 00.0 00.0 00.0 00.0 00.0 00.0 00.0 0.0±0.0 0.0 00.0
Lignin 23.4 23.0 23.9 22.8 16.4 22.5 20.6 23.9 22.1 23.4±1.1 22.9 20.7
Furfural 10.3 00.0 00.2 00.4 00.1 00.9 00.1 00.6 00.2 0.3±0.0 0.2 00.1
HMF 00.3 00.0 00.3 00.3 00.3 00.4 00.4 00.4 00.4 0.3±0.0 0.4 00.4
Xylose yieldg
(%, dry matter)(liquid phase)
10.4 49.5 52.0 19.6 12.9 12.6 33.6 45.6 55.2±4.5 56.9 18.7
Glucose yieldh (%, dry matter) 90.5 72.0 24.9 84.0 60.8 87.5 22.4 64.8 60.0±0.6 63.1 94.5
Glucose concentration after 72 h EH (g/L) 50.7 53.0 17.3 62.0 40.0 64.8 13.2 45.9 42.5 44.0 71.9
a Eg: chips of Eucalyptus globulusb N9 represents the average of triplicate experiments at the centre pointc OX+G: optimised reaction conditions maximising overall glucose plus xylose yields, i.e. the quantification of xylose from the liquid phase, and thequantification of glucose from the enzymatic hydrolysis of pretreated materialsd OG: optimised reaction conditions maximising glucose yield by enzymatic hydrolysis, but minimising xylose yield from the liquid phasee ln(R0): natural logarithm of severity factor (R0)f Dry matter: based on matter dried at 105 °CgXylose yield: xylose recovered in liquid phase/xylose in raw materialx100hGlucose yield: glucose produced by enzymatic hydrolysis/glucose in raw material ! 100 (EH at 20 FPU/g substrate)
Biomass Conv. Bioref.
Author's personal copy

data, the xylose yield was 57 ± 2.5% (drymatter, Eq. 2), and theyield of glucose was 63 ± 1 % (dry matter, Eq. 4) (see Table 1,OX+G). These values were within the range of the valuespredicted by the statistical model, which validates the model.These data indicate that over 50 % (dry matter) of the xylose inthe raw material may be potentially recovered after the pretreat-ment to be used as an intermediate of a value-added product.
On the other hand, the model predicted that 90 ± 8 and 18 ±5 % (dry matter) of glucose and xylose yields, respectively,should be achieved at 194 °C for 51 min, when the glucoseyield was maximised and the xylose yield was minimised at thesame time (strategy 2). The experimental values for glucoseyield and for xylose yield were 95 ± 0.6% (drymatter) and 19 ±4 % (dry matter), respectively (Table 1, OG). Expectedly, a lowamount of xylose was measured in the reaction liquor becauseof high xylose degradation during pretreatment.
3.2 The autohydrolysis of chips of E. globulus
Three centre points were evaluated by independent experi-ments under the same reaction conditions, and statistical
analysis indicated that the results were reproducible. Thecentre-point conditions (175 °C and 43 min, S0 = 3.99) wereselected based on preliminary experiments (data not shown).The centre-point conditions were close to the optimum forstrategy 1, which is when the total glucose plus xylose yieldswere maximised simultaneously (OX+G).
All the data shown in Table 1 validates that chips ofE. globulus as they were received from the pulp, and paperindustry, without further milling, can be successfully used forthe production of ethanol. As mentioned above, the materialtreated at S0 = 4.63, " strategy 2 (OG") displayed the highestsusceptibility to enzymatic hydrolysis, achieving 95 ± 0.6 %(dry matter) of glucose yield or 71.9 g/L of glucose, whereas thematerial treated under the reaction conditions of OX*G (strategy1) presented 44 g/L of glucose (63 ± 1 %, dry matter).
Extensive work on the autohydrolysis of sawdust ofE. globulus has been reported in the last decade [19, 22–28].For example, Romaní et al. [19, 22] reported the autohydrolysisofE. globulus, milled to pass an 8-mm screen, in a wide range ofS0 (3.64 to 4.67) and high temperatures (195 to 230 °C).Enzymatic hydrolysis of these pretreated materials using a
Glucose
yield,%
Xylo se
yiel d, %
Time, min Temperature, ºC Time, min Temperature, ºC
Time, min
Temperature, ºCTime, min
Temperature, ºC
Xyl
ose
yiel
d,%
Glu
cose
yiel
d,%
20 30 40 50 60 70 190 180 170 16020 30 40 50 60 70 190 180 170 160
190180
170160 20
3040
5060 70190
180170
160
90
80
70
60
50
40
30
20
10
90
80
70
60
50
40
30
20
10
60
50
40
30
20
10
60
50
40
30
20
10
2030
4050
60 70
Fig. 1 Second-order polynomialsurface of the responseparameters
Table 2 Glucose concentration after 96 h of enzymatic hydrolysis (G96, in g/L) and cellulose-to-glucose conversion after 96 h (CGC96, in %) ofenzymatic hydrolysis of spend solids from autohydrolysed E. globulus. Data extracted from Romaní et al. [19]
Exp. conditions Tmax=195 ° C, S0=3.64 Tmax=230 ° C, S0=4.67
LRS (g/g) ESR (FPT/g) G96 CGC96 G96 CGC96
1 6 8 22.8 22.9 51.5 49.1
2 6 18 37.1 37.3 72.5 69.1
3 6 28 43.8 44.0 82.3 78.4
4 13 8 15.3 31.6 39.3 76.8
5 13 18 28.4 58.7 48.5 94.8
6 13 18 26.8 55.3 47.9 93.6
7 13 18 27.5 56.8 46.6 90.9
8 13 28 35.4 73.0 51.3 100.0
9 20 8 12.4 38.7 27.2 80.2
10 20 18 19.8 61.8 34.2 101.0
11 20 28 23.3 72.8 33.9 100.0
Biomass Conv. Bioref.
Author's personal copy
variety of enzyme loadings and liquid-to-solid ratios displayed awide range of glucose yield values. Two assays reported therehad severity conditions S0 = 3.94 and 4.67 close to the experi-ments reported in the present study, Ox+G and OG, respectively,but the temperatures were higher. Precisely, Romaní et al. [19]reported glucose yields, after 96 h of enzymatic hydrolysis and28 FPU/g of 44.0 g/100 g and 78.4 g/100 g, potential glucose inraw material at S0 = 3.94 and 4.67, respectively (see Table 2).These values of glucose yields were lower than the glucose
yield values reported in Table 1 (experiments Ox+G and OG),even though higher enzyme loading were used. However, thecorresponding glucose concentrations of Romaní’s, 43.8 and82.3 g/L, were higher than the values reported in Table 1because Romaní et al. used a liquid-to-solid ratio (see Table 2)lower than the ratio used in the present study.
Another set of assays reported by Romaní et al. [19] indicat-ed glucose concentrations of 27.5 g/L (or 56.8 g/100 g potentialglucose in raw material) and 46.6 g/L (or 90.9 g/100 g potential
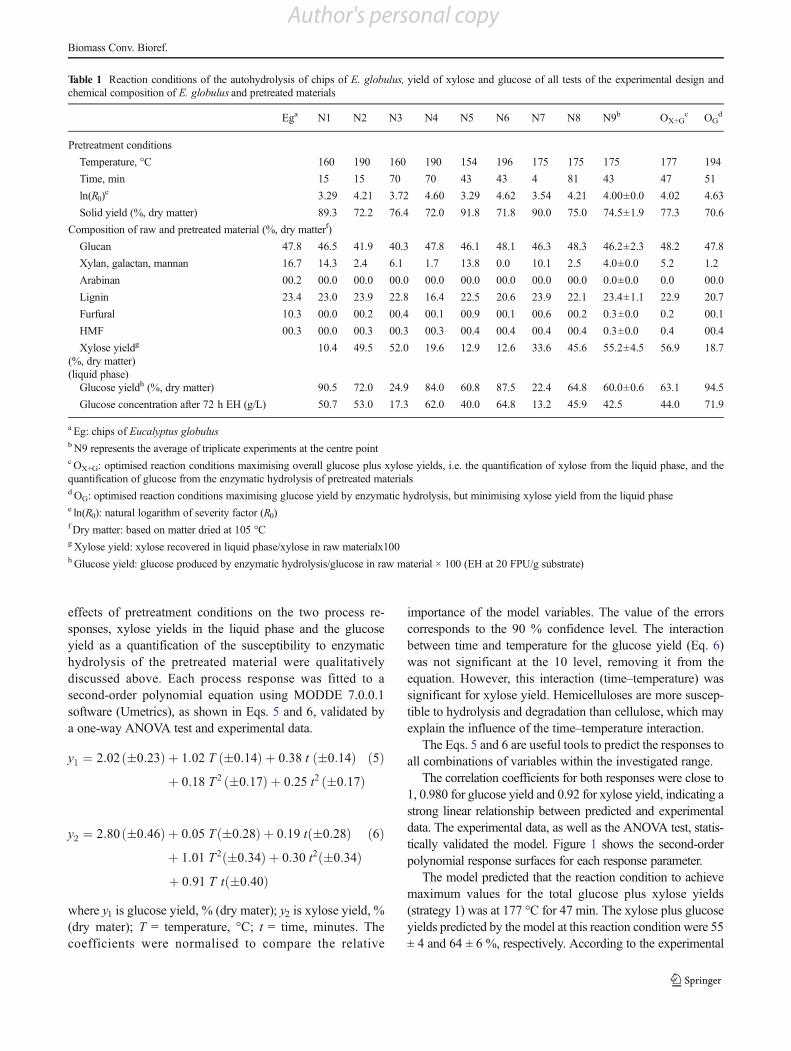
Fig. 2 Actual pictures (leftcolumn) and SEM images(right column) of rawmaterial andstar-point samples: a, bE. globulus; c, d sample N5; e, fsample N7; g, h sample N8; i, jsample N6
Biomass Conv. Bioref.
Author's personal copy

glucose in raw material) at S0 of 3.94 and 4.67, respectively,using similar EH conditions than the conditions used in thepresent work. However, these values were slightly lower thanthe values obtained in current investigation.
3.3 Physical characterisation
3.3.1 Scanning electron microscopy
Star points (N5, N6, N7 and N8), as well as the raw material,were selected for physical characterisation because of theirextreme reaction conditions (see Table 1).
Scanning electron microscopy (SEM) images revealed howthe compact and well-organised structure of the raw materialchanged as the severity of the reactions increased (Fig. 2).Accordingly, splits, cracks and changes in the fibre curvatureof the structure are easily visible with those reactions.
3.3.2 Fibre quality analyser
The fibre quality of star points (N5, N6, N7 and N8), the rawmaterial and the optimised conditions, Ox+G and OG wereanalysed. High-fibre coarseness values, defined as weightper fibre length, which depends on fibre diameter, cell wallthickness, cell wall density and fibre cross section, indicatehow thick a fibre wall is, providing stiff fibres unable tocollapse, whereas thin-walled fibres with low coarsenessvalues give flexible fibres. As evident in Fig. 3, the coarsenessvalues decreased linearly with increasing S0 up to 4.2. Beyondthat point, the coarseness values appear to stay steady. Thereduction of the coarseness suggests that fibres were losingtheir strength, boosting the probability of fibre collapse.According to the definition, the reduction of the coarsenessshould be a consequence of the reduction of weight as fibrelength appears to be steady along all S0 evaluated (Fig. 3). Onthe other hand, at S0 higher than 4.2, fibre walls become
thinner and the fibres break. Consequently, weight and lengthchange simultaneously.
In addition, the kink index was also evaluated among thesesamples. The kink index refers to an abrupt change in fibrecurvature, which is correlated with a modification of the fibre.As we expected observing SEM images, the kink index in-creased as the severity of the autohydrolysis pretreatmentincreased up to S0 = 4.2. At a higher level, the kink indexstayed study, suggesting that both the kink angle and fibrelength become similar in values. Duarte et al. [20] observed asimilar trendwith pre-extraction time, evaluating kraft pulpingof hot water pre-extracted sugar maple wood chips.
3.3.3 Simons’stain method
In 1950, Simons described a two-colour differential stain forthe fibrillation and mechanical damage of beaten fibres [29].Unbeaten fibres stained blue, but after beating, the damagedspots on the fibres stained orange blue dye has smaller mo-lecular size than orange dye. Later, Yu et al. [29] demonstratedthat the high molecular weight fraction of the orange dyeprovided differential results, and the dye adsorption by fibreswas much stronger for the high molecular weight orange dyethan for the blue dye. Thus, the orange dye displaced the bluedye in regions of the fibre accessible to the orange dye.
Chandra et al. [18, 20] reported that the modified Simons’stain (SS) test (described in section 2.7), using orange dye,correlates dye absorption capacity of the pretreated wood withits accessibility and hydrolysability to enzyme hydrolysis.Consequently, this study intends to correlate dye absorption(orange dye) in pretreated E. globulus with its EH. Figure 4shows the behaviour of glucose yield by EH and the absorp-tion of dye determined by the modified SS technique atincreasing severity factor values. As expected, glucose yieldsby EH and dye adsorption have similar increasing lineardependencies, as S0 values increase up to 4.2. However, the
0
100
200
300
400
500
600
0
0.5
1
1.5
2
2.5
3 3.2 3.4 3.6 3.8 4 4.2 4.4 4.6 4.8
coar
sene
ss(m
g/m
)
Kin
kin
dex
(1/m
m)
fibe
rlen
gth
(mm
)
S0 = Ln(R0)
Fiber length Kink index CoarsenessFig. 3 The effect of fibre length,kink index and coarseness onpretreated materials as a functionof the severity of theautohydrolysis of chips ofE. globulus
Biomass Conv. Bioref.
Author's personal copy

adsorption of the dye sharply falls at S0 values higher than 4.2.This behaviour is consistent with the physical and morpho-logical appearance of the pretreated E. globulus. As shown inFig. 2, the pretreated material became a dark powder, losingsome of its fibre-like characteristics (no pore or channels in itsstructure) at high S0 values. Observations suggest that there isno dye retention in the material. Enzymes, on the other hand,had no steric obstacles in this opened structure, achievingglucose yields over 90 % (dry matter).
3.3.4 Water retention value
It has been reported that swelling plays a major role in asubstrate’s susceptibility to hydrolysis by cellulases whendelignification pretreatments were applied [20, 21].Delignification had a very low impact in this study, as duringautohydrolysis, pretreatment less than 12 % (dry matter) of alllignin of the raw material was dissolved. Unsurprisingly, waterretention values displayed no significant changes among any ofthe samples tested. However, water retention values slightlydecreased at high-severity factor values. This finding indicatesthat the pretreated material was losing its fibre-like characteris-tics, indicating that no water could be retained in this modified,disaggregated structure. This was demonstrated in the SS tests.
3.3.5 Simultaneous saccharification and fermentation
The SSF of the washed pretreated material was also tested toquantify ethanol yield at specified autohydrolysis conditions.Optimised conditions OX+G and OG at 10 % of solid loadingand 20 FPU cellulose/g solid produced an ethanol concentra-tion of 27.3 and 29.0 g/L, corresponding to an ethanol yield of72 and 75 % (dry matter), respectively. Random experiments,not shown here, demonstrated that both concentration and yieldof ethanol might be improved by changing the solid-to-liquid
ratio in SSF. Comparatively, Romaní et al. [22] reported amaximum ethanol conversion of 86.0 g ethanol/100 g potentialethanol (or 64.4 g/L) at a slightly higher S0 (4.08) compared toOX+G but a lower solid-to-liquid ratio (LSR = 4). WhenRomaní et al. increased the solid-to-liquid ratio to 16, theethanol concentration sharply fell to 16.8 g/L, although themaximum ethanol conversion slightly decreased to 79.8 %. Inaddition, Romaní et al. [22] reported an ethanol conversion of91.1 g ethanol/100 g potential ethanol (or 67.4 g/L) at a slightlyhigher S0 used in OG but a lower solid-to-liquid ratio (LSR = 4).When the authors increased the solid-to-liquid ratio to 16, theethanol concentration sharply falls to 18.7 g/L, although themaximum ethanol conversion did not significantly change.However, it is important to highlight that Romaní et al. [22]used sawdust as their raw material rather than wood chips andhigh pretreatment temperatures. These differences are mean-ingful, as the data reported in this study display promisingresults when using the raw material directly from the pulpand paper plants without further mechanical treatment.
4 Conclusions
A suitable experimental design was designed, using the re-sponse surface methodology, resulting in two strategies topretreat E. globulus chips, without milling, with hot water toachieve high hemicellulose recovery, high cellulose yield byEH and a moderate ethanol yield for an economically feasiblescaling up plant.
Optimised conditions had a xylose yield in the reaction liquorof 57 % (dry matter) and a glucose yield of 95 % (dry matter)reached by enzymatic hydrolysis of pretreated material. Thesevalues are high when compared with data reported elsewhere inliterature, at similar severity conditions of autohydrolysis.
0
20
40
60
80
100
3 3.2 3.4 3.6 3.8 4 4.2 4.4 4.6 4.8 gl
ucos
eyi
eld
byE
H,%
(dry
mat
ter)
Max
.abs
orba
nce
(mg/
g)S0 = ln(R0)
glucose yield
modified SS
Fig. 4 Correlation betweencharacterization techniques:glucose yields by enzymatichydrolysis (EH1) and dyeadsorption determined bymodified Simons’ stain technique(SS). 1EH conditions: 50 °C,150 rpm, 10 % w/w, 20 FPU ofcellulase Trichoderma reesei/g,20CBU of ß-glucosidase/gpretreated material, 50 mM citratebuffer, pH 4.8
Biomass Conv. Bioref.
Author's personal copy

Characterisation of the pretreated material allowed a corre-lation of glucose yield by EH with physical, chemical andmorphological properties. Accordingly, EH and dye absorp-tion determined by a modified SS technique displayed similarincreasing linear dependency as the severity factor increases.However, at high severity factor values, dye absorptiondisplayed an inverse effect suggesting that there is no dyeretained in this modified material. This behaviour was consis-tent with the morphological appearance of the pretreatedmaterial as shown in SEM images. The kink index andcoarseness values were also evaluated. The coarseness de-creased as the severity of pretreatments increases, suggestingthat fibres were losing their strength, boosting the probabilityof fibre collapse. WRV did not contribute to the characterisa-tion of pretreated material as all samples retained similaramount of water.
Finally, SSF of the washed pretreated material enabledsimultaneously moderate ethanol concentration (27.3 g/L)and high ethanol yield (72 %, dry matter) at moderate pre-treatment conditions (S0 = 4.02 and 177 °C). However, themaximum ethanol produced was 262 L/ton of dry raw mate-rial at S0 = 4.63 and 194 °C. Future work should considerreducing the solid-to-liquid ratio in the autohydrolysis andmodifying the enzyme-to-solid ratio in SSF to improve theconcentration and yield of ethanol.
Acknowledgments The financial support of this work was provided byConsorcio Bioenercel S.A. and by project Innova Chile Corfo 208-7302.The authors want to thank Laboratorio de Recursos Renovables (LRR)for letting us characterise our samples in its labs and Consorcio GenomicaForestal for allowing us to use its Fibre Quality Analyser.
References
1. Trading economics. http://www.tradingeconomics.com/chile/energy-production-kt-of-oil-equivalent-wb-data.html. Accessed June 2013
2. INFOR. http://www.infor.cl/en/iym.html. Accessed April 20133. Ugalde L, Pérez O (2001) Forest Plantations Thematic Papers. Mean
annual volume increment of selected industrial forest plantation spe-cies. FAO. http://www.fao.org/forestry. Accessed 30 October 2013
4. Ramos LP (2003) The chemical involved in steam treatment oflignocellulosic materials. Quim Nova 26(6):863–871
5. Ewanick SM, Bura R, Saddler JN (2007) Acid-catalyzed steamp’retreatment of Lodgepole pine and subsequent enzymatic hydroly-sis and fermentation to ethanol. Biotechnol Bioeng 96(4):737–746
6. Yang B, Wyman CE (2008) Pretreatment: the key to unlocking low-cost cellulosic ethanol. Biofuels Bioprod Bioref 2:26–40
7. Wyman CE, Dale BE, Elander RT, Holtzapple M, Ladisch MR, LeeYY (2005) Coordinated development of leading biomass pretreat-ment technologies. Bioresour Technol 96(18):1959–1966
8. Saeman JF (1945) Kinetics of wood saccharification—hydrolysis ofcellulose and decomposition of sugars in dilute acid at high temper-ature. Ind Eng Chem 37(1):43–52
9. Heitz M, Capek-Menard E, Korberle PG, Gange J, Chornet E, OverendRP, Taylor JD, Yu E (1991) Fractionation of populus tremuloides at thepilot plant scale: optimization of steam pretreatment conditions usingthe STAKE II technology. Bioresour Technol 25:23–32
10. Parajo JC, Garrote G, Cruz JM, Dominguez H (2004) Production ofxylooligosaccharides by autohydrolysis of lignocellulosic materials.Trends Food Sci Technol 15(3–4):115–120
11. Araque E, Parra C, Freer J, Contreras D, Rodríguez J, Mendonça R,Baeza J (2008) Evaluation of organosolv pretreatment for the con-version of Pinus radiataD. Don to ethanol. Enzyme Microb Technol43:214
12. Monrroy M, Ibañez J, Melin V, Baeza J, Mendonça RT, Contreras D,Freer J (2010) Bioorganosolv pretreatments of P. radiata by a brownrot fungus (Gloephyllum trabeum) and ethanolysis. Enzyme MicrobTechnol 47:11
13. Saha BC, Cotta MA (2006) Ethanol production from alkaline perox-ide pretreated enzymatically saccharified wheat straw. BiotechnolProg 22:449
14. TAPPI Standard Test Methods; TAPPI: Peachtree Corners, GA,(2002) Ash in wood, pulp, paper and paperboard: combustion at525 °C, Test Method T 211 om-12
15. Garrote G, Dominguez H, Parajo JC (1999) Hydrothermal processingof lignocellulosic materials. Holz Roh Werkst 57:191–202. doi:10.1007/s001070050039
16. Cavazzuti M (2013) Optimization methods: from theory to design,Springer-Verlag Berlin Heidelberg
17. Araque E, Parra C, RodríguezM, Freer J, JaimeB (2008) Selection ofthermotolerant yeast strains Saccharomyces cerevisiae for bioethanolproduction. Enzyme Microb Technol 43:120
18. Chandra R, Ewanick S, Hsieh C, Saddler JN (2008) The character-ization of pretreated lignocellulosic substrates prior to enzymatichydrolysis, Part 1: a modified Simons’ staining technique.Biotechnol Prog 24:1178–1185
19. Romani A, Garrote G, Alonso JL, Parajo JC (2010) Experimentalassessment on the enzymatic hydrolysis of hydrothermally pretreatedEucalyptus globulus wood. Ind Eng Chem Res 49(10):4653–4663.doi:10.1021/Ie100154m
20. Chandra RP, Esteghalilan AR, Saddler JN (2007) Assessing substrateaccessibility to enzymatic accessibility of enzymatic hydrolysis bycelulases -Book Chapter in American Chemical Society Book.
21. Luo X, Zhu JY (2011) Effects of drying-induced fiber hornificationon enzymatic saccharification of lignocelluloses. Enzym MicrobTechnol 48:92–99
22. Romani A, Garrote G, Parajo JC (2012) Bioethanol production fromautohydrolyzed Eucalyptus globulus by simultaneous saccharifica-tion and fermentation operating at high solids loading. Fuel 94(1):305–312
23. Garrote G, Kabel MA, Schols HA, Falque E, Dominguez H, ParajoJC (2007) Effects of Eucalyptus globuluswood autohydrolysis con-ditions on the reaction products. J Agric Food Chem 55(22):9006–9013. doi:10.1021/Jf0719510
24. Gonzalez-Munoz MJ, Parajo JC (2010) Diafiltration of Eucalyptuswood autohydrolysis liquors: mathematical modeling. J Membr Sci346(1):98–104. doi:10.1016/J.Memsci.2009.09.023
25. Romani A, Garrote G, Alonso JL, Parajo JC (2010) Bioethanolproduction from hydrothermally pretreated Eucalyptus globuluswood. Bioresour Technol 101(22):8706–8712. doi:10.1016/J.Biortech.2010.06.093
26. Romani A, Garrote G, Lopez F, Parajo JC (2011)Eucalyptus globuluswood fractionation by autohydrolysis and organosolv delignification.Bioresour Technol 102(10):5896–5904. doi:10.1016/J.Biortech.2011.02.070
27. Romani A, Garrote G, Parajo JC (2012) Bioethanol production fromautohydrolyzed Eucalyptus globulus by simultaneous saccharifica-tion and fermentation operating at high solids loading. Fuel 94(1):305–312. doi:10.1016/J.Fuel.2011.12.013
28. Gütsch JS, Nousiainen T, Sixta H (2012) Comparative evaluation ofautohydrolysis and acid-catalyzed hydrolysis of Eucalyptus globuluswood. Bioresour Technol 109:77–85. doi:10.1016/j.biortech.2012.01.018
Biomass Conv. Bioref.
Author's personal copy

29. Yu X, Minor JL, Atalla RH (1995) Mechanism of action of Simons’stain. TAPPI J 78(6):175–179
30. Leschinsky M, Sixta H, Patt R (2009) Detailed mass balances of theautohydrolysis of Eucalyptus globulus at 170 degrees C. Bioresources4(2):687–703
31. Leschinsky M, Zuckerstatter G, Weber HK, Patt R, Sixta H (2008)Effect of autohydrolysis of Eucalyptus globulus wood on lignin
structure. Part 1: comparison of different lignin fractions formedduring water prehydrolysis. Holzforschung 62(6):645–652. doi:10.1515/Hf.2008.117
32. Leschinsky M, Zuckerstatter G, Weber HK, Patt R, Sixta H (2008)Effect of autohydrolysis of Eucalyptus globuluswood on lignin struc-ture. Part 2: influence of autohydrolysis intensity. Holzforschung62(6):653–658. doi:10.1515/Hf.2008.133
Biomass Conv. Bioref.
Author's personal copy